UNITED STATES
SECURITIES AND EXCHANGE
COMMISSION
Washington, D.C. 20549
FORM N-CSR
CERTIFIED SHAREHOLDER REPORT OF
REGISTERED
MANAGEMENT INVESTMENT COMPANIES
Investment
Company Act file
number:
811-24019
(Exact name of
registrant as specified in charter)
15935 La Cantera Parkway Building Two, San Antonio, Texas 78256
(Address of principal executive offices) (Zip
code)
Christopher J. Kelley, Victory
Capital Management Inc. 60 State Street, Boston, MA 02109
(Name and address of
agent for service)
Registrant’s telephone number, including area code: 800-539-3863
Date of fiscal year end:
March 31
Date of reporting period:
March 31, 2026
Item 1. Reports to
Stockholders.
(a)
0002042316falseN-CSRVictory Portfolios IVN-1A2026-03-310002042316vcm:C000256497Member2025-04-012026-03-3100020423162025-04-012026-03-310002042316vcm:C000256497Member2016-04-012026-03-310002042316vcm:SP500TotalReturnIndex27729BroadBasedIndexMember2016-04-012026-03-310002042316vcm:Russell1000Growth27729AdditionalIndexMember2016-04-012026-03-310002042316vcm:C000256497Member2016-03-312016-03-310002042316vcm:SP500TotalReturnIndex27729BroadBasedIndexMember2016-03-312016-03-310002042316vcm:Russell1000Growth27729AdditionalIndexMember2016-03-312016-03-310002042316vcm:C000256497Member2016-04-012017-03-310002042316vcm:SP500TotalReturnIndex27729BroadBasedIndexMember2016-04-012017-03-310002042316vcm:Russell1000Growth27729AdditionalIndexMember2016-04-012017-03-310002042316vcm:C000256497Member2016-04-012018-03-310002042316vcm:SP500TotalReturnIndex27729BroadBasedIndexMember2016-04-012018-03-310002042316vcm:Russell1000Growth27729AdditionalIndexMember2016-04-012018-03-310002042316vcm:C000256497Member2016-04-012019-03-310002042316vcm:SP500TotalReturnIndex27729BroadBasedIndexMember2016-04-012019-03-310002042316vcm:Russell1000Growth27729AdditionalIndexMember2016-04-012019-03-310002042316vcm:C000256497Member2016-04-012020-03-310002042316vcm:SP500TotalReturnIndex27729BroadBasedIndexMember2016-04-012020-03-310002042316vcm:Russell1000Growth27729AdditionalIndexMember2016-04-012020-03-310002042316vcm:C000256497Member2016-04-012021-03-310002042316vcm:SP500TotalReturnIndex27729BroadBasedIndexMember2016-04-012021-03-310002042316vcm:Russell1000Growth27729AdditionalIndexMember2016-04-012021-03-310002042316vcm:C000256497Member2016-04-012022-03-310002042316vcm:SP500TotalReturnIndex27729BroadBasedIndexMember2016-04-012022-03-310002042316vcm:Russell1000Growth27729AdditionalIndexMember2016-04-012022-03-310002042316vcm:C000256497Member2016-04-012023-03-310002042316vcm:SP500TotalReturnIndex27729BroadBasedIndexMember2016-04-012023-03-310002042316vcm:Russell1000Growth27729AdditionalIndexMember2016-04-012023-03-310002042316vcm:C000256497Member2016-04-012024-03-310002042316vcm:SP500TotalReturnIndex27729BroadBasedIndexMember2016-04-012024-03-310002042316vcm:Russell1000Growth27729AdditionalIndexMember2016-04-012024-03-310002042316vcm:C000256497Member2016-04-012025-03-310002042316vcm:SP500TotalReturnIndex27729BroadBasedIndexMember2016-04-012025-03-310002042316vcm:Russell1000Growth27729AdditionalIndexMember2016-04-012025-03-310002042316vcm:C000256497Memberoef:WithoutSalesLoadMember2025-04-012026-03-310002042316vcm:C000256497Memberoef:WithoutSalesLoadMember2021-04-012026-03-310002042316vcm:C000256497Memberoef:WithoutSalesLoadMember2016-04-012026-03-310002042316vcm:C000256497Member2021-04-012026-03-310002042316vcm:SP500TotalReturnIndex27729BroadBasedIndexMember2025-04-012026-03-310002042316vcm:SP500TotalReturnIndex27729BroadBasedIndexMember2021-04-012026-03-310002042316vcm:Russell1000Growth27729AdditionalIndexMember2025-04-012026-03-310002042316vcm:Russell1000Growth27729AdditionalIndexMember2021-04-012026-03-310002042316vcm:C000256497Member2026-03-310002042316vcm:C000256497Memberoef:MaterialsSectorMember2026-03-310002042316vcm:C000256497Membervcm:IndustrialsSectorMember2026-03-310002042316vcm:C000256497Membervcm:FinancialsSectorMember2026-03-310002042316vcm:C000256497Membervcm:CommunicationServicesSectorMember2026-03-310002042316vcm:C000256497Memberus-gaap:HealthcareSectorMember2026-03-310002042316vcm:C000256497Memberoef:ConsumerDiscretionarySectorMember2026-03-310002042316vcm:C000256497Memberoef:InformationTechnologySectorMember2026-03-310002042316vcm:C000256497Membervcm:AppleIncCTIMember2026-03-310002042316vcm:C000256497Membervcm:AmazoncomIncCTIMember2026-03-310002042316vcm:C000256497Membervcm:MicrosoftCorpCTIMember2026-03-310002042316vcm:C000256497Membervcm:EliLillyCoCTIMember2026-03-310002042316vcm:C000256497Membervcm:AmphenolCorpClassACTIMember2026-03-310002042316vcm:C000256497Membervcm:ASMLHoldingNVClassNYCTIMember2026-03-310002042316vcm:C000256497Membervcm:VisaIncClassACTIMember2026-03-310002042316vcm:C000256497Membervcm:SynopsysIncCTIMember2026-03-310002042316vcm:C000256497Membervcm:UberTechnologiesIncCTIMember2026-03-310002042316vcm:C000256497Membervcm:AdvancedMicroDevicesIncCTIMember2026-03-310002042316vcm:C000256499Member2025-04-012026-03-310002042316vcm:C000256499Member2016-04-012026-03-310002042316vcm:SP500TotalReturnIndex27730BroadBasedIndexMember2016-04-012026-03-310002042316vcm:Russell1000Growth27730AdditionalIndexMember2016-04-012026-03-310002042316vcm:C000256499Member2016-03-312016-03-310002042316vcm:SP500TotalReturnIndex27730BroadBasedIndexMember2016-03-312016-03-310002042316vcm:Russell1000Growth27730AdditionalIndexMember2016-03-312016-03-310002042316vcm:C000256499Member2016-04-012017-03-310002042316vcm:SP500TotalReturnIndex27730BroadBasedIndexMember2016-04-012017-03-310002042316vcm:Russell1000Growth27730AdditionalIndexMember2016-04-012017-03-310002042316vcm:C000256499Member2016-04-012018-03-310002042316vcm:SP500TotalReturnIndex27730BroadBasedIndexMember2016-04-012018-03-310002042316vcm:Russell1000Growth27730AdditionalIndexMember2016-04-012018-03-310002042316vcm:C000256499Member2016-04-012019-03-310002042316vcm:SP500TotalReturnIndex27730BroadBasedIndexMember2016-04-012019-03-310002042316vcm:Russell1000Growth27730AdditionalIndexMember2016-04-012019-03-310002042316vcm:C000256499Member2016-04-012020-03-310002042316vcm:SP500TotalReturnIndex27730BroadBasedIndexMember2016-04-012020-03-310002042316vcm:Russell1000Growth27730AdditionalIndexMember2016-04-012020-03-310002042316vcm:C000256499Member2016-04-012021-03-310002042316vcm:SP500TotalReturnIndex27730BroadBasedIndexMember2016-04-012021-03-310002042316vcm:Russell1000Growth27730AdditionalIndexMember2016-04-012021-03-310002042316vcm:C000256499Member2016-04-012022-03-310002042316vcm:SP500TotalReturnIndex27730BroadBasedIndexMember2016-04-012022-03-310002042316vcm:Russell1000Growth27730AdditionalIndexMember2016-04-012022-03-310002042316vcm:C000256499Member2016-04-012023-03-310002042316vcm:SP500TotalReturnIndex27730BroadBasedIndexMember2016-04-012023-03-310002042316vcm:Russell1000Growth27730AdditionalIndexMember2016-04-012023-03-310002042316vcm:C000256499Member2016-04-012024-03-310002042316vcm:SP500TotalReturnIndex27730BroadBasedIndexMember2016-04-012024-03-310002042316vcm:Russell1000Growth27730AdditionalIndexMember2016-04-012024-03-310002042316vcm:C000256499Member2016-04-012025-03-310002042316vcm:SP500TotalReturnIndex27730BroadBasedIndexMember2016-04-012025-03-310002042316vcm:Russell1000Growth27730AdditionalIndexMember2016-04-012025-03-310002042316vcm:C000256499Memberoef:WithoutSalesLoadMember2025-04-012026-03-310002042316vcm:C000256499Memberoef:WithoutSalesLoadMember2021-04-012026-03-310002042316vcm:C000256499Memberoef:WithoutSalesLoadMember2016-04-012026-03-310002042316vcm:C000256499Member2021-04-012026-03-310002042316vcm:SP500TotalReturnIndex27730BroadBasedIndexMember2025-04-012026-03-310002042316vcm:SP500TotalReturnIndex27730BroadBasedIndexMember2021-04-012026-03-310002042316vcm:Russell1000Growth27730AdditionalIndexMember2025-04-012026-03-310002042316vcm:Russell1000Growth27730AdditionalIndexMember2021-04-012026-03-310002042316vcm:C000256499Member2026-03-310002042316vcm:C000256499Memberoef:MaterialsSectorMember2026-03-310002042316vcm:C000256499Membervcm:IndustrialsSectorMember2026-03-310002042316vcm:C000256499Membervcm:FinancialsSectorMember2026-03-310002042316vcm:C000256499Membervcm:CommunicationServicesSectorMember2026-03-310002042316vcm:C000256499Memberus-gaap:HealthcareSectorMember2026-03-310002042316vcm:C000256499Memberoef:ConsumerDiscretionarySectorMember2026-03-310002042316vcm:C000256499Memberoef:InformationTechnologySectorMember2026-03-310002042316vcm:C000256499Membervcm:AppleIncCTIMember2026-03-310002042316vcm:C000256499Membervcm:AmazoncomIncCTIMember2026-03-310002042316vcm:C000256499Membervcm:MicrosoftCorpCTIMember2026-03-310002042316vcm:C000256499Membervcm:EliLillyCoCTIMember2026-03-310002042316vcm:C000256499Membervcm:AmphenolCorpClassACTIMember2026-03-310002042316vcm:C000256499Membervcm:ASMLHoldingNVClassNYCTIMember2026-03-310002042316vcm:C000256499Membervcm:VisaIncClassACTIMember2026-03-310002042316vcm:C000256499Membervcm:SynopsysIncCTIMember2026-03-310002042316vcm:C000256499Membervcm:UberTechnologiesIncCTIMember2026-03-310002042316vcm:C000256499Membervcm:AdvancedMicroDevicesIncCTIMember2026-03-310002042316vcm:C000256495Member2025-04-012026-03-310002042316vcm:C000256495Member2016-04-012026-03-310002042316vcm:SP500TotalReturnIndex27732BroadBasedIndexMember2016-04-012026-03-310002042316vcm:Russell1000Growth27732AdditionalIndexMember2016-04-012026-03-310002042316vcm:C000256495Member2016-03-312016-03-310002042316vcm:SP500TotalReturnIndex27732BroadBasedIndexMember2016-03-312016-03-310002042316vcm:Russell1000Growth27732AdditionalIndexMember2016-03-312016-03-310002042316vcm:C000256495Member2016-04-012017-03-310002042316vcm:SP500TotalReturnIndex27732BroadBasedIndexMember2016-04-012017-03-310002042316vcm:Russell1000Growth27732AdditionalIndexMember2016-04-012017-03-310002042316vcm:C000256495Member2016-04-012018-03-310002042316vcm:SP500TotalReturnIndex27732BroadBasedIndexMember2016-04-012018-03-310002042316vcm:Russell1000Growth27732AdditionalIndexMember2016-04-012018-03-310002042316vcm:C000256495Member2016-04-012019-03-310002042316vcm:SP500TotalReturnIndex27732BroadBasedIndexMember2016-04-012019-03-310002042316vcm:Russell1000Growth27732AdditionalIndexMember2016-04-012019-03-310002042316vcm:C000256495Member2016-04-012020-03-310002042316vcm:SP500TotalReturnIndex27732BroadBasedIndexMember2016-04-012020-03-310002042316vcm:Russell1000Growth27732AdditionalIndexMember2016-04-012020-03-310002042316vcm:C000256495Member2016-04-012021-03-310002042316vcm:SP500TotalReturnIndex27732BroadBasedIndexMember2016-04-012021-03-310002042316vcm:Russell1000Growth27732AdditionalIndexMember2016-04-012021-03-310002042316vcm:C000256495Member2016-04-012022-03-310002042316vcm:SP500TotalReturnIndex27732BroadBasedIndexMember2016-04-012022-03-310002042316vcm:Russell1000Growth27732AdditionalIndexMember2016-04-012022-03-310002042316vcm:C000256495Member2016-04-012023-03-310002042316vcm:SP500TotalReturnIndex27732BroadBasedIndexMember2016-04-012023-03-310002042316vcm:Russell1000Growth27732AdditionalIndexMember2016-04-012023-03-310002042316vcm:C000256495Member2016-04-012024-03-310002042316vcm:SP500TotalReturnIndex27732BroadBasedIndexMember2016-04-012024-03-310002042316vcm:Russell1000Growth27732AdditionalIndexMember2016-04-012024-03-310002042316vcm:C000256495Member2016-04-012025-03-310002042316vcm:SP500TotalReturnIndex27732BroadBasedIndexMember2016-04-012025-03-310002042316vcm:Russell1000Growth27732AdditionalIndexMember2016-04-012025-03-310002042316vcm:C000256495Memberoef:WithoutSalesLoadMember2025-04-012026-03-310002042316vcm:C000256495Memberoef:WithoutSalesLoadMember2021-04-012026-03-310002042316vcm:C000256495Memberoef:WithoutSalesLoadMember2016-04-012026-03-310002042316vcm:SP500TotalReturnIndex27732BroadBasedIndexMember2025-04-012026-03-310002042316vcm:SP500TotalReturnIndex27732BroadBasedIndexMember2021-04-012026-03-310002042316vcm:Russell1000Growth27732AdditionalIndexMember2025-04-012026-03-310002042316vcm:Russell1000Growth27732AdditionalIndexMember2021-04-012026-03-310002042316vcm:C000256495Member2026-03-310002042316vcm:C000256495Memberoef:MaterialsSectorMember2026-03-310002042316vcm:C000256495Membervcm:IndustrialsSectorMember2026-03-310002042316vcm:C000256495Membervcm:FinancialsSectorMember2026-03-310002042316vcm:C000256495Membervcm:CommunicationServicesSectorMember2026-03-310002042316vcm:C000256495Memberus-gaap:HealthcareSectorMember2026-03-310002042316vcm:C000256495Memberoef:ConsumerDiscretionarySectorMember2026-03-310002042316vcm:C000256495Memberoef:InformationTechnologySectorMember2026-03-310002042316vcm:C000256495Membervcm:AppleIncCTIMember2026-03-310002042316vcm:C000256495Membervcm:AmazoncomIncCTIMember2026-03-310002042316vcm:C000256495Membervcm:MicrosoftCorpCTIMember2026-03-310002042316vcm:C000256495Membervcm:EliLillyCoCTIMember2026-03-310002042316vcm:C000256495Membervcm:AmphenolCorpClassACTIMember2026-03-310002042316vcm:C000256495Membervcm:ASMLHoldingNVClassNYCTIMember2026-03-310002042316vcm:C000256495Membervcm:VisaIncClassACTIMember2026-03-310002042316vcm:C000256495Membervcm:SynopsysIncCTIMember2026-03-310002042316vcm:C000256495Membervcm:UberTechnologiesIncCTIMember2026-03-310002042316vcm:C000256495Membervcm:AdvancedMicroDevicesIncCTIMember2026-03-310002042316vcm:C000256496Member2025-04-012026-03-310002042316vcm:C000256496Member2016-04-012026-03-310002042316vcm:SP500TotalReturnIndex27731BroadBasedIndexMember2016-04-012026-03-310002042316vcm:Russell1000Growth27731AdditionalIndexMember2016-04-012026-03-310002042316vcm:C000256496Member2016-03-312016-03-310002042316vcm:SP500TotalReturnIndex27731BroadBasedIndexMember2016-03-312016-03-310002042316vcm:Russell1000Growth27731AdditionalIndexMember2016-03-312016-03-310002042316vcm:C000256496Member2016-04-012017-03-310002042316vcm:SP500TotalReturnIndex27731BroadBasedIndexMember2016-04-012017-03-310002042316vcm:Russell1000Growth27731AdditionalIndexMember2016-04-012017-03-310002042316vcm:C000256496Member2016-04-012018-03-310002042316vcm:SP500TotalReturnIndex27731BroadBasedIndexMember2016-04-012018-03-310002042316vcm:Russell1000Growth27731AdditionalIndexMember2016-04-012018-03-310002042316vcm:C000256496Member2016-04-012019-03-310002042316vcm:SP500TotalReturnIndex27731BroadBasedIndexMember2016-04-012019-03-310002042316vcm:Russell1000Growth27731AdditionalIndexMember2016-04-012019-03-310002042316vcm:C000256496Member2016-04-012020-03-310002042316vcm:SP500TotalReturnIndex27731BroadBasedIndexMember2016-04-012020-03-310002042316vcm:Russell1000Growth27731AdditionalIndexMember2016-04-012020-03-310002042316vcm:C000256496Member2016-04-012021-03-310002042316vcm:SP500TotalReturnIndex27731BroadBasedIndexMember2016-04-012021-03-310002042316vcm:Russell1000Growth27731AdditionalIndexMember2016-04-012021-03-310002042316vcm:C000256496Member2016-04-012022-03-310002042316vcm:SP500TotalReturnIndex27731BroadBasedIndexMember2016-04-012022-03-310002042316vcm:Russell1000Growth27731AdditionalIndexMember2016-04-012022-03-310002042316vcm:C000256496Member2016-04-012023-03-310002042316vcm:SP500TotalReturnIndex27731BroadBasedIndexMember2016-04-012023-03-310002042316vcm:Russell1000Growth27731AdditionalIndexMember2016-04-012023-03-310002042316vcm:C000256496Member2016-04-012024-03-310002042316vcm:SP500TotalReturnIndex27731BroadBasedIndexMember2016-04-012024-03-310002042316vcm:Russell1000Growth27731AdditionalIndexMember2016-04-012024-03-310002042316vcm:C000256496Member2016-04-012025-03-310002042316vcm:SP500TotalReturnIndex27731BroadBasedIndexMember2016-04-012025-03-310002042316vcm:Russell1000Growth27731AdditionalIndexMember2016-04-012025-03-310002042316vcm:C000256496Memberoef:WithoutSalesLoadMember2025-04-012026-03-310002042316vcm:C000256496Memberoef:WithoutSalesLoadMember2021-04-012026-03-310002042316vcm:C000256496Memberoef:WithoutSalesLoadMember2016-04-012026-03-310002042316vcm:SP500TotalReturnIndex27731BroadBasedIndexMember2025-04-012026-03-310002042316vcm:SP500TotalReturnIndex27731BroadBasedIndexMember2021-04-012026-03-310002042316vcm:Russell1000Growth27731AdditionalIndexMember2025-04-012026-03-310002042316vcm:Russell1000Growth27731AdditionalIndexMember2021-04-012026-03-310002042316vcm:C000256496Member2026-03-310002042316vcm:C000256496Memberoef:MaterialsSectorMember2026-03-310002042316vcm:C000256496Membervcm:IndustrialsSectorMember2026-03-310002042316vcm:C000256496Membervcm:FinancialsSectorMember2026-03-310002042316vcm:C000256496Membervcm:CommunicationServicesSectorMember2026-03-310002042316vcm:C000256496Memberus-gaap:HealthcareSectorMember2026-03-310002042316vcm:C000256496Memberoef:ConsumerDiscretionarySectorMember2026-03-310002042316vcm:C000256496Memberoef:InformationTechnologySectorMember2026-03-310002042316vcm:C000256496Membervcm:AppleIncCTIMember2026-03-310002042316vcm:C000256496Membervcm:AmazoncomIncCTIMember2026-03-310002042316vcm:C000256496Membervcm:MicrosoftCorpCTIMember2026-03-310002042316vcm:C000256496Membervcm:EliLillyCoCTIMember2026-03-310002042316vcm:C000256496Membervcm:AmphenolCorpClassACTIMember2026-03-310002042316vcm:C000256496Membervcm:ASMLHoldingNVClassNYCTIMember2026-03-310002042316vcm:C000256496Membervcm:VisaIncClassACTIMember2026-03-310002042316vcm:C000256496Membervcm:SynopsysIncCTIMember2026-03-310002042316vcm:C000256496Membervcm:UberTechnologiesIncCTIMember2026-03-310002042316vcm:C000256496Membervcm:AdvancedMicroDevicesIncCTIMember2026-03-310002042316vcm:C000256498Member2025-04-012026-03-310002042316vcm:SP500TotalReturnIndex27733BroadBasedIndexMember2016-04-012026-03-310002042316vcm:Russell1000Growth27733AdditionalIndexMember2016-04-012026-03-310002042316vcm:C000256498Member2016-03-312016-03-310002042316vcm:SP500TotalReturnIndex27733BroadBasedIndexMember2016-03-312016-03-310002042316vcm:Russell1000Growth27733AdditionalIndexMember2016-03-312016-03-310002042316vcm:C000256498Member2016-04-012017-03-310002042316vcm:SP500TotalReturnIndex27733BroadBasedIndexMember2016-04-012017-03-310002042316vcm:Russell1000Growth27733AdditionalIndexMember2016-04-012017-03-310002042316vcm:C000256498Member2016-04-012018-03-310002042316vcm:SP500TotalReturnIndex27733BroadBasedIndexMember2016-04-012018-03-310002042316vcm:Russell1000Growth27733AdditionalIndexMember2016-04-012018-03-310002042316vcm:C000256498Member2016-04-012019-03-310002042316vcm:SP500TotalReturnIndex27733BroadBasedIndexMember2016-04-012019-03-310002042316vcm:Russell1000Growth27733AdditionalIndexMember2016-04-012019-03-310002042316vcm:C000256498Member2016-04-012020-03-310002042316vcm:SP500TotalReturnIndex27733BroadBasedIndexMember2016-04-012020-03-310002042316vcm:Russell1000Growth27733AdditionalIndexMember2016-04-012020-03-310002042316vcm:C000256498Member2016-04-012021-03-310002042316vcm:SP500TotalReturnIndex27733BroadBasedIndexMember2016-04-012021-03-310002042316vcm:Russell1000Growth27733AdditionalIndexMember2016-04-012021-03-310002042316vcm:C000256498Member2016-04-012022-03-310002042316vcm:SP500TotalReturnIndex27733BroadBasedIndexMember2016-04-012022-03-310002042316vcm:Russell1000Growth27733AdditionalIndexMember2016-04-012022-03-310002042316vcm:C000256498Member2016-04-012023-03-310002042316vcm:SP500TotalReturnIndex27733BroadBasedIndexMember2016-04-012023-03-310002042316vcm:Russell1000Growth27733AdditionalIndexMember2016-04-012023-03-310002042316vcm:C000256498Member2016-04-012024-03-310002042316vcm:SP500TotalReturnIndex27733BroadBasedIndexMember2016-04-012024-03-310002042316vcm:Russell1000Growth27733AdditionalIndexMember2016-04-012024-03-310002042316vcm:C000256498Member2016-04-012025-03-310002042316vcm:SP500TotalReturnIndex27733BroadBasedIndexMember2016-04-012025-03-310002042316vcm:Russell1000Growth27733AdditionalIndexMember2016-04-012025-03-310002042316vcm:C000256498Member2016-04-012026-03-310002042316vcm:C000256498Memberoef:WithoutSalesLoadMember2025-04-012026-03-310002042316vcm:C000256498Memberoef:WithoutSalesLoadMember2021-04-012026-03-310002042316vcm:C000256498Memberoef:WithoutSalesLoadMember2016-04-012026-03-310002042316vcm:SP500TotalReturnIndex27733BroadBasedIndexMember2025-04-012026-03-310002042316vcm:SP500TotalReturnIndex27733BroadBasedIndexMember2021-04-012026-03-310002042316vcm:Russell1000Growth27733AdditionalIndexMember2025-04-012026-03-310002042316vcm:Russell1000Growth27733AdditionalIndexMember2021-04-012026-03-310002042316vcm:C000256498Member2026-03-310002042316vcm:C000256498Memberoef:MaterialsSectorMember2026-03-310002042316vcm:C000256498Membervcm:IndustrialsSectorMember2026-03-310002042316vcm:C000256498Membervcm:FinancialsSectorMember2026-03-310002042316vcm:C000256498Membervcm:CommunicationServicesSectorMember2026-03-310002042316vcm:C000256498Memberus-gaap:HealthcareSectorMember2026-03-310002042316vcm:C000256498Memberoef:ConsumerDiscretionarySectorMember2026-03-310002042316vcm:C000256498Memberoef:InformationTechnologySectorMember2026-03-310002042316vcm:C000256498Membervcm:AppleIncCTIMember2026-03-310002042316vcm:C000256498Membervcm:AmazoncomIncCTIMember2026-03-310002042316vcm:C000256498Membervcm:MicrosoftCorpCTIMember2026-03-310002042316vcm:C000256498Membervcm:EliLillyCoCTIMember2026-03-310002042316vcm:C000256498Membervcm:AmphenolCorpClassACTIMember2026-03-310002042316vcm:C000256498Membervcm:ASMLHoldingNVClassNYCTIMember2026-03-310002042316vcm:C000256498Membervcm:VisaIncClassACTIMember2026-03-310002042316vcm:C000256498Membervcm:SynopsysIncCTIMember2026-03-310002042316vcm:C000256498Membervcm:UberTechnologiesIncCTIMember2026-03-310002042316vcm:C000256498Membervcm:AdvancedMicroDevicesIncCTIMember2026-03-310002042316vcm:C000256539Member2025-04-012026-03-310002042316vcm:BloombergUSAggregateBondIndex27756BroadBasedIndexMember2025-04-012026-03-310002042316vcm:BloombergUSAggregateBondIndex27756BroadBasedIndexMember2016-04-012026-03-310002042316vcm:ICEBofAUS3MinusMonthTreasuryBillIndex27756AdditionalIndexMember2025-04-012026-03-310002042316vcm:ICEBofAUS3MinusMonthTreasuryBillIndex27756AdditionalIndexMember2016-04-012026-03-310002042316vcm:BloombergUSAggregateBondIndex27756BroadBasedIndexMember2016-03-312016-03-310002042316vcm:ICEBofAUS3MinusMonthTreasuryBillIndex27756AdditionalIndexMember2016-03-312016-03-310002042316vcm:BloombergUSAggregateBondIndex27756BroadBasedIndexMember2016-04-012017-03-310002042316vcm:ICEBofAUS3MinusMonthTreasuryBillIndex27756AdditionalIndexMember2016-04-012017-03-310002042316vcm:BloombergUSAggregateBondIndex27756BroadBasedIndexMember2016-04-012018-03-310002042316vcm:ICEBofAUS3MinusMonthTreasuryBillIndex27756AdditionalIndexMember2016-04-012018-03-310002042316vcm:BloombergUSAggregateBondIndex27756BroadBasedIndexMember2016-04-012019-03-310002042316vcm:ICEBofAUS3MinusMonthTreasuryBillIndex27756AdditionalIndexMember2016-04-012019-03-310002042316vcm:BloombergUSAggregateBondIndex27756BroadBasedIndexMember2016-04-012020-03-310002042316vcm:ICEBofAUS3MinusMonthTreasuryBillIndex27756AdditionalIndexMember2016-04-012020-03-310002042316vcm:BloombergUSAggregateBondIndex27756BroadBasedIndexMember2016-04-012021-03-310002042316vcm:ICEBofAUS3MinusMonthTreasuryBillIndex27756AdditionalIndexMember2016-04-012021-03-310002042316vcm:BloombergUSAggregateBondIndex27756BroadBasedIndexMember2016-04-012022-03-310002042316vcm:ICEBofAUS3MinusMonthTreasuryBillIndex27756AdditionalIndexMember2016-04-012022-03-310002042316vcm:BloombergUSAggregateBondIndex27756BroadBasedIndexMember2016-04-012023-03-310002042316vcm:ICEBofAUS3MinusMonthTreasuryBillIndex27756AdditionalIndexMember2016-04-012023-03-310002042316vcm:BloombergUSAggregateBondIndex27756BroadBasedIndexMember2016-04-012024-03-310002042316vcm:ICEBofAUS3MinusMonthTreasuryBillIndex27756AdditionalIndexMember2016-04-012024-03-310002042316vcm:BloombergUSAggregateBondIndex27756BroadBasedIndexMember2016-04-012025-03-310002042316vcm:ICEBofAUS3MinusMonthTreasuryBillIndex27756AdditionalIndexMember2016-04-012025-03-310002042316vcm:C000256539Memberoef:WithoutSalesLoadMember2025-04-012026-03-310002042316vcm:C000256539Memberoef:WithoutSalesLoadMember2021-04-012026-03-310002042316vcm:C000256539Memberoef:WithoutSalesLoadMember2016-04-012026-03-310002042316vcm:BloombergUSAggregateBondIndex27756BroadBasedIndexMember2021-04-012026-03-310002042316vcm:ICEBofAUS3MinusMonthTreasuryBillIndex27756AdditionalIndexMember2021-04-012026-03-310002042316vcm:C000256539Member2026-03-310002042316vcm:C000256539Membervcm:CorporateBondsCTIMember2026-03-310002042316vcm:C000256539Membervcm:AssetMinusBackedSecuritiesCTIMember2026-03-310002042316vcm:C000256539Membervcm:CollateralizedLoanObligationsCTIMember2026-03-310002042316vcm:C000256539Memberus-gaap:CollateralizedMortgageObligationsMember2026-03-310002042316vcm:C000256539Membervcm:YankeeDollarsCTIMember2026-03-310002042316vcm:C000256539Membervcm:CommercialPaperCTIMember2026-03-310002042316vcm:C000256539Membervcm:RepurchaseAgreementCTIMember2026-03-310002042316vcm:C000256539Membervcm:USGovernmentAgencyMortgagesCTIMember2026-03-310002042316vcm:C000256539Membervcm:SectorOtherCTIMember2026-03-310002042316vcm:C000256540Member2025-04-012026-03-310002042316vcm:C000256540Member2016-04-012026-03-310002042316vcm:BloombergUSAggregateBondIndex27757BroadBasedIndexMember2025-04-012026-03-310002042316vcm:BloombergUSAggregateBondIndex27757BroadBasedIndexMember2016-04-012026-03-310002042316vcm:ICEBofAUS3MinusMonthTreasuryBillIndex27757AdditionalIndexMember2025-04-012026-03-310002042316vcm:ICEBofAUS3MinusMonthTreasuryBillIndex27757AdditionalIndexMember2016-04-012026-03-310002042316vcm:C000256540Member2016-03-312016-03-310002042316vcm:BloombergUSAggregateBondIndex27757BroadBasedIndexMember2016-03-312016-03-310002042316vcm:ICEBofAUS3MinusMonthTreasuryBillIndex27757AdditionalIndexMember2016-03-312016-03-310002042316vcm:C000256540Member2016-04-012017-03-310002042316vcm:BloombergUSAggregateBondIndex27757BroadBasedIndexMember2016-04-012017-03-310002042316vcm:ICEBofAUS3MinusMonthTreasuryBillIndex27757AdditionalIndexMember2016-04-012017-03-310002042316vcm:C000256540Member2016-04-012018-03-310002042316vcm:BloombergUSAggregateBondIndex27757BroadBasedIndexMember2016-04-012018-03-310002042316vcm:ICEBofAUS3MinusMonthTreasuryBillIndex27757AdditionalIndexMember2016-04-012018-03-310002042316vcm:C000256540Member2016-04-012019-03-310002042316vcm:BloombergUSAggregateBondIndex27757BroadBasedIndexMember2016-04-012019-03-310002042316vcm:ICEBofAUS3MinusMonthTreasuryBillIndex27757AdditionalIndexMember2016-04-012019-03-310002042316vcm:C000256540Member2016-04-012020-03-310002042316vcm:BloombergUSAggregateBondIndex27757BroadBasedIndexMember2016-04-012020-03-310002042316vcm:ICEBofAUS3MinusMonthTreasuryBillIndex27757AdditionalIndexMember2016-04-012020-03-310002042316vcm:C000256540Member2016-04-012021-03-310002042316vcm:BloombergUSAggregateBondIndex27757BroadBasedIndexMember2016-04-012021-03-310002042316vcm:ICEBofAUS3MinusMonthTreasuryBillIndex27757AdditionalIndexMember2016-04-012021-03-310002042316vcm:C000256540Member2016-04-012022-03-310002042316vcm:BloombergUSAggregateBondIndex27757BroadBasedIndexMember2016-04-012022-03-310002042316vcm:ICEBofAUS3MinusMonthTreasuryBillIndex27757AdditionalIndexMember2016-04-012022-03-310002042316vcm:C000256540Member2016-04-012023-03-310002042316vcm:BloombergUSAggregateBondIndex27757BroadBasedIndexMember2016-04-012023-03-310002042316vcm:ICEBofAUS3MinusMonthTreasuryBillIndex27757AdditionalIndexMember2016-04-012023-03-310002042316vcm:C000256540Member2016-04-012024-03-310002042316vcm:BloombergUSAggregateBondIndex27757BroadBasedIndexMember2016-04-012024-03-310002042316vcm:ICEBofAUS3MinusMonthTreasuryBillIndex27757AdditionalIndexMember2016-04-012024-03-310002042316vcm:C000256540Member2016-04-012025-03-310002042316vcm:BloombergUSAggregateBondIndex27757BroadBasedIndexMember2016-04-012025-03-310002042316vcm:ICEBofAUS3MinusMonthTreasuryBillIndex27757AdditionalIndexMember2016-04-012025-03-310002042316vcm:C000256540Memberoef:WithoutSalesLoadMember2025-04-012026-03-310002042316vcm:C000256540Memberoef:WithoutSalesLoadMember2021-04-012026-03-310002042316vcm:C000256540Memberoef:WithoutSalesLoadMember2016-04-012026-03-310002042316vcm:C000256540Member2021-04-012026-03-310002042316vcm:BloombergUSAggregateBondIndex27757BroadBasedIndexMember2021-04-012026-03-310002042316vcm:ICEBofAUS3MinusMonthTreasuryBillIndex27757AdditionalIndexMember2021-04-012026-03-310002042316vcm:C000256540Member2026-03-310002042316vcm:C000256540Membervcm:CorporateBondsCTIMember2026-03-310002042316vcm:C000256540Membervcm:AssetMinusBackedSecuritiesCTIMember2026-03-310002042316vcm:C000256540Membervcm:CollateralizedLoanObligationsCTIMember2026-03-310002042316vcm:C000256540Memberus-gaap:CollateralizedMortgageObligationsMember2026-03-310002042316vcm:C000256540Membervcm:YankeeDollarsCTIMember2026-03-310002042316vcm:C000256540Membervcm:CommercialPaperCTIMember2026-03-310002042316vcm:C000256540Membervcm:RepurchaseAgreementCTIMember2026-03-310002042316vcm:C000256540Membervcm:USGovernmentAgencyMortgagesCTIMember2026-03-310002042316vcm:C000256540Membervcm:SectorOtherCTIMember2026-03-310002042316vcm:C000256541Member2025-04-012026-03-310002042316vcm:C000256541Member2016-04-012026-03-310002042316vcm:BloombergUSAggregateBondIndex27758BroadBasedIndexMember2025-04-012026-03-310002042316vcm:BloombergUSAggregateBondIndex27758BroadBasedIndexMember2016-04-012026-03-310002042316vcm:ICEBofAUS3MinusMonthTreasuryBillIndex27758AdditionalIndexMember2025-04-012026-03-310002042316vcm:ICEBofAUS3MinusMonthTreasuryBillIndex27758AdditionalIndexMember2016-04-012026-03-310002042316vcm:C000256541Member2016-03-312016-03-310002042316vcm:BloombergUSAggregateBondIndex27758BroadBasedIndexMember2016-03-312016-03-310002042316vcm:ICEBofAUS3MinusMonthTreasuryBillIndex27758AdditionalIndexMember2016-03-312016-03-310002042316vcm:C000256541Member2016-04-012017-03-310002042316vcm:BloombergUSAggregateBondIndex27758BroadBasedIndexMember2016-04-012017-03-310002042316vcm:ICEBofAUS3MinusMonthTreasuryBillIndex27758AdditionalIndexMember2016-04-012017-03-310002042316vcm:C000256541Member2016-04-012018-03-310002042316vcm:BloombergUSAggregateBondIndex27758BroadBasedIndexMember2016-04-012018-03-310002042316vcm:ICEBofAUS3MinusMonthTreasuryBillIndex27758AdditionalIndexMember2016-04-012018-03-310002042316vcm:C000256541Member2016-04-012019-03-310002042316vcm:BloombergUSAggregateBondIndex27758BroadBasedIndexMember2016-04-012019-03-310002042316vcm:ICEBofAUS3MinusMonthTreasuryBillIndex27758AdditionalIndexMember2016-04-012019-03-310002042316vcm:C000256541Member2016-04-012020-03-310002042316vcm:BloombergUSAggregateBondIndex27758BroadBasedIndexMember2016-04-012020-03-310002042316vcm:ICEBofAUS3MinusMonthTreasuryBillIndex27758AdditionalIndexMember2016-04-012020-03-310002042316vcm:C000256541Member2016-04-012021-03-310002042316vcm:BloombergUSAggregateBondIndex27758BroadBasedIndexMember2016-04-012021-03-310002042316vcm:ICEBofAUS3MinusMonthTreasuryBillIndex27758AdditionalIndexMember2016-04-012021-03-310002042316vcm:C000256541Member2016-04-012022-03-310002042316vcm:BloombergUSAggregateBondIndex27758BroadBasedIndexMember2016-04-012022-03-310002042316vcm:ICEBofAUS3MinusMonthTreasuryBillIndex27758AdditionalIndexMember2016-04-012022-03-310002042316vcm:C000256541Member2016-04-012023-03-310002042316vcm:BloombergUSAggregateBondIndex27758BroadBasedIndexMember2016-04-012023-03-310002042316vcm:ICEBofAUS3MinusMonthTreasuryBillIndex27758AdditionalIndexMember2016-04-012023-03-310002042316vcm:C000256541Member2016-04-012024-03-310002042316vcm:BloombergUSAggregateBondIndex27758BroadBasedIndexMember2016-04-012024-03-310002042316vcm:ICEBofAUS3MinusMonthTreasuryBillIndex27758AdditionalIndexMember2016-04-012024-03-310002042316vcm:C000256541Member2016-04-012025-03-310002042316vcm:BloombergUSAggregateBondIndex27758BroadBasedIndexMember2016-04-012025-03-310002042316vcm:ICEBofAUS3MinusMonthTreasuryBillIndex27758AdditionalIndexMember2016-04-012025-03-310002042316vcm:C000256541Memberoef:WithoutSalesLoadMember2025-04-012026-03-310002042316vcm:C000256541Memberoef:WithoutSalesLoadMember2021-04-012026-03-310002042316vcm:C000256541Memberoef:WithoutSalesLoadMember2016-04-012026-03-310002042316vcm:BloombergUSAggregateBondIndex27758BroadBasedIndexMember2021-04-012026-03-310002042316vcm:ICEBofAUS3MinusMonthTreasuryBillIndex27758AdditionalIndexMember2021-04-012026-03-310002042316vcm:C000256541Member2026-03-310002042316vcm:C000256541Membervcm:CorporateBondsCTIMember2026-03-310002042316vcm:C000256541Membervcm:AssetMinusBackedSecuritiesCTIMember2026-03-310002042316vcm:C000256541Membervcm:CollateralizedLoanObligationsCTIMember2026-03-310002042316vcm:C000256541Memberus-gaap:CollateralizedMortgageObligationsMember2026-03-310002042316vcm:C000256541Membervcm:YankeeDollarsCTIMember2026-03-310002042316vcm:C000256541Membervcm:CommercialPaperCTIMember2026-03-310002042316vcm:C000256541Membervcm:RepurchaseAgreementCTIMember2026-03-310002042316vcm:C000256541Membervcm:USGovernmentAgencyMortgagesCTIMember2026-03-310002042316vcm:C000256541Membervcm:SectorOtherCTIMember2026-03-310002042316vcm:C000256538Member2025-04-012026-03-310002042316vcm:BloombergUSAggregateBondIndex27759BroadBasedIndexMember2025-04-012026-03-310002042316vcm:BloombergUSAggregateBondIndex27759BroadBasedIndexMember2016-04-012026-03-310002042316vcm:ICEBofAUS3MinusMonthTreasuryBillIndex27759AdditionalIndexMember2025-04-012026-03-310002042316vcm:ICEBofAUS3MinusMonthTreasuryBillIndex27759AdditionalIndexMember2016-04-012026-03-310002042316vcm:C000256538Member2016-03-312016-03-310002042316vcm:BloombergUSAggregateBondIndex27759BroadBasedIndexMember2016-03-312016-03-310002042316vcm:ICEBofAUS3MinusMonthTreasuryBillIndex27759AdditionalIndexMember2016-03-312016-03-310002042316vcm:C000256538Member2016-04-012017-03-310002042316vcm:BloombergUSAggregateBondIndex27759BroadBasedIndexMember2016-04-012017-03-310002042316vcm:ICEBofAUS3MinusMonthTreasuryBillIndex27759AdditionalIndexMember2016-04-012017-03-310002042316vcm:C000256538Member2016-04-012018-03-310002042316vcm:BloombergUSAggregateBondIndex27759BroadBasedIndexMember2016-04-012018-03-310002042316vcm:ICEBofAUS3MinusMonthTreasuryBillIndex27759AdditionalIndexMember2016-04-012018-03-310002042316vcm:C000256538Member2016-04-012019-03-310002042316vcm:BloombergUSAggregateBondIndex27759BroadBasedIndexMember2016-04-012019-03-310002042316vcm:ICEBofAUS3MinusMonthTreasuryBillIndex27759AdditionalIndexMember2016-04-012019-03-310002042316vcm:C000256538Member2016-04-012020-03-310002042316vcm:BloombergUSAggregateBondIndex27759BroadBasedIndexMember2016-04-012020-03-310002042316vcm:ICEBofAUS3MinusMonthTreasuryBillIndex27759AdditionalIndexMember2016-04-012020-03-310002042316vcm:C000256538Member2016-04-012021-03-310002042316vcm:BloombergUSAggregateBondIndex27759BroadBasedIndexMember2016-04-012021-03-310002042316vcm:ICEBofAUS3MinusMonthTreasuryBillIndex27759AdditionalIndexMember2016-04-012021-03-310002042316vcm:C000256538Member2016-04-012022-03-310002042316vcm:BloombergUSAggregateBondIndex27759BroadBasedIndexMember2016-04-012022-03-310002042316vcm:ICEBofAUS3MinusMonthTreasuryBillIndex27759AdditionalIndexMember2016-04-012022-03-310002042316vcm:C000256538Member2016-04-012023-03-310002042316vcm:BloombergUSAggregateBondIndex27759BroadBasedIndexMember2016-04-012023-03-310002042316vcm:ICEBofAUS3MinusMonthTreasuryBillIndex27759AdditionalIndexMember2016-04-012023-03-310002042316vcm:C000256538Member2016-04-012024-03-310002042316vcm:BloombergUSAggregateBondIndex27759BroadBasedIndexMember2016-04-012024-03-310002042316vcm:ICEBofAUS3MinusMonthTreasuryBillIndex27759AdditionalIndexMember2016-04-012024-03-310002042316vcm:C000256538Member2016-04-012025-03-310002042316vcm:BloombergUSAggregateBondIndex27759BroadBasedIndexMember2016-04-012025-03-310002042316vcm:ICEBofAUS3MinusMonthTreasuryBillIndex27759AdditionalIndexMember2016-04-012025-03-310002042316vcm:C000256538Member2016-04-012026-03-310002042316vcm:C000256538Memberoef:WithoutSalesLoadMember2025-04-012026-03-310002042316vcm:C000256538Memberoef:WithoutSalesLoadMember2021-04-012026-03-310002042316vcm:C000256538Memberoef:WithoutSalesLoadMember2016-04-012026-03-310002042316vcm:BloombergUSAggregateBondIndex27759BroadBasedIndexMember2021-04-012026-03-310002042316vcm:ICEBofAUS3MinusMonthTreasuryBillIndex27759AdditionalIndexMember2021-04-012026-03-310002042316vcm:C000256538Member2026-03-310002042316vcm:C000256538Membervcm:CorporateBondsCTIMember2026-03-310002042316vcm:C000256538Membervcm:AssetMinusBackedSecuritiesCTIMember2026-03-310002042316vcm:C000256538Membervcm:CollateralizedLoanObligationsCTIMember2026-03-310002042316vcm:C000256538Memberus-gaap:CollateralizedMortgageObligationsMember2026-03-310002042316vcm:C000256538Membervcm:YankeeDollarsCTIMember2026-03-310002042316vcm:C000256538Membervcm:CommercialPaperCTIMember2026-03-310002042316vcm:C000256538Membervcm:RepurchaseAgreementCTIMember2026-03-310002042316vcm:C000256538Membervcm:USGovernmentAgencyMortgagesCTIMember2026-03-310002042316vcm:C000256538Membervcm:SectorOtherCTIMember2026-03-31iso4217:USDxbrli:sharesiso4217:USDxbrli:sharesxbrli:pureutr:Dvcm:Holding
Victory Pioneer Fundamental Growth Fund
Annual Shareholder Report — March 31, 2026
The annual shareholder report contains important information about Victory Pioneer Fundamental Growth Fund (the "Fund") for the period of April 1, 2025 to March 31, 2026. You can find additional information about the Fund at advisor.vcm.com/literature/mutual-fund-prospectuses. You may also request more information by calling 800-539-3863 or visiting vcm.com/contact-us.
What were the Fund's costs for the last year?
(based on a hypothetical $10,000 investment)
Table SummaryClass Name | Costs of a $10,000 Investment | Costs paid as a percentage of a $10,000 Investment |
|---|
Class A | $104 | 0.99% |
|---|
| | |
|---|
What affected the Fund’s performance during the last year?
Top contributors to performance:
Consumer staples was the largest sector contributor to relative performance as compared to the Russell 1000® Growth Index (the “Index”), and the portfolio benefited from its lack of exposure to the declining real estate sector.
At the individual security level, overweight positions in Amphenol Corp., Class A and ASML Holding NV, Class NY were the top contributors to relative performance, as both positions significantly outperformed the Index on the strength of robust revenue growth and expanding AI-driven demand.
Top detractors from performance:
Stock selection in industrials and communication services were the largest detractors to performance relative to the Index.
At the individual security level, NVIDIA Corp. and Broadcom, Inc., were the largest detractors, as the portfolio's underweight positions in both names proved costly given their substantial outperformance during the period.
Holdings are subject to change. There is no guarantee that securities mentioned remain in or out of the Fund.
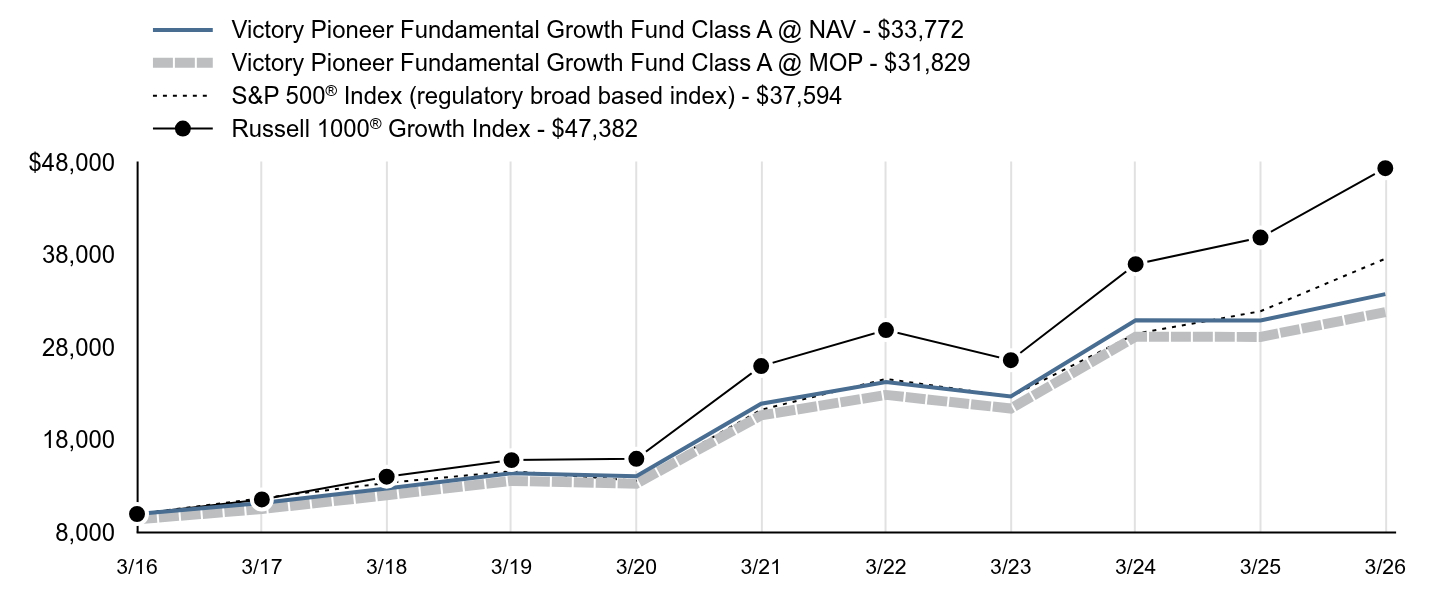
The graph reflects investment growth of a hypothetical investment of $10,000 in the Fund. The graph and table total returns do not reflect the deduction of taxes that a shareholder would pay on Fund distributions, or redemption of shares. The total return figures include all waivers of fees. Without such fee waivers, the total returns would have been lower. The maximum offering price (“MOP”) figures reflect a maximum sales charge of 5.75% for Class A. The Net Asset Value ("NAV") figures do not reflect sales charges.
Growth of $10,000 Investment
Table Summary | Victory Pioneer Fundamental Growth Fund Class A @ NAV - $33,772 | Victory Pioneer Fundamental Growth Fund Class A @ MOP - $31,829 | S&P 500® Index (regulatory broad based index) - $37,594 | Russell 1000® Growth Index - $47,382 |
|---|
3/16 | $10,000 | $9,425 | $10,000 | $10,000 |
|---|
3/17 | $11,178 | $10,535 | $11,717 | $11,576 |
|---|
3/18 | $12,760 | $12,026 | $13,357 | $14,036 |
|---|
3/19 | $14,406 | $13,578 | $14,625 | $15,825 |
|---|
3/20 | $14,094 | $13,283 | $13,605 | $15,969 |
|---|
3/21 | $21,924 | $20,663 | $21,271 | $25,989 |
|---|
3/22 | $24,270 | $22,873 | $24,599 | $29,882 |
|---|
3/23 | $22,706 | $21,400 | $22,698 | $26,624 |
|---|
3/24 | $30,946 | $29,165 | $29,480 | $37,007 |
|---|
3/25 | $30,921 | $29,142 | $31,913 | $39,879 |
|---|
3/26 | $33,772 | $31,829 | $37,594 | $47,382 |
|---|
AVERAGE ANNUAL TOTAL RETURNS
(as of March 31, 2026)
Table Summary | 1 Year | 5 Year | 10 Year |
|---|
Class A @ NAV | 9.22% | 9.03% | 12.94% |
|---|
Class A @ MOP | 2.96% | 7.74% | 12.27% |
|---|
S&P 500® Index | 17.80% | 12.06% | 14.16% |
|---|
Russell 1000® Growth Index | 18.81% | 12.76% | 16.83% |
|---|
FUND STATISTICS
($ amounts in 000s)
(as of March 31, 2026)
Table SummaryNet Assets | $5,786,549 |
|---|
Number of Holdings | 37 |
|---|
Investment Advisory Fees | $42,644 |
|---|
Portfolio Turnover | 24% |
|---|
The investment return and principal value will fluctuate so that an investor's shares, when redeemed, may be worth more or less than the original cost. Past performance is not a good predictor of the Fund's future performance. For current performance, please visit https://advisor.vcm.com/products-fa/mutual-funds or call 800-539-3863.
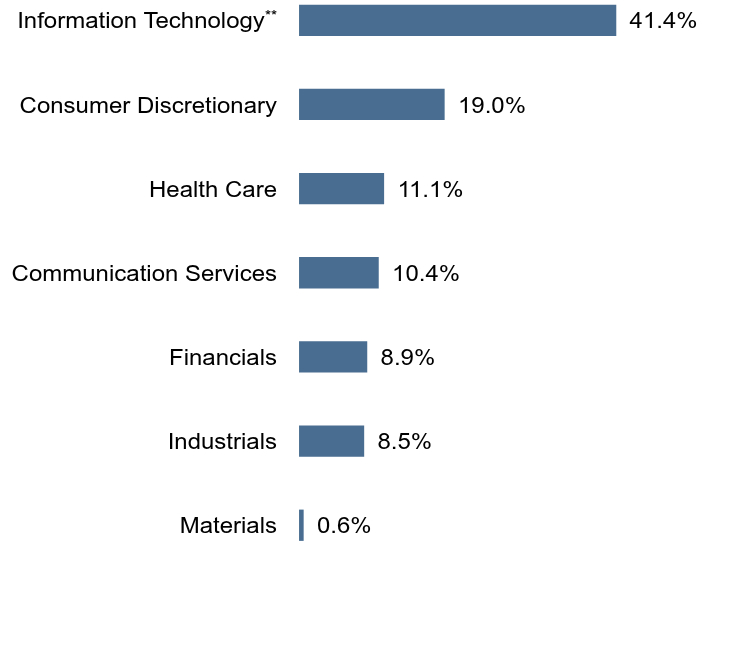
Top SectorsFootnote Reference* (% of Net Assets)Footnote Reference
(as of March 31, 2026)
Table SummaryValue | Value |
|---|
Materials | 0.6% |
Industrials | 8.5% |
Financials | 8.9% |
Communication Services | 10.4% |
Health Care | 11.1% |
Consumer Discretionary | 19.0% |
Information TechnologyFootnote Reference** | 41.4% |
Top 10 HoldingsFootnote Reference* (% of Net Assets)Footnote Reference
(as of March 31, 2026)
Table SummaryApple, Inc. | 7.9% |
|---|
Amazon.com, Inc. | 7.3% |
|---|
Microsoft Corp. | 4.4% |
|---|
Eli Lilly & Co. | 4.4% |
|---|
Amphenol Corp., Class A | 4.3% |
|---|
ASML Holding NV, Class NY | 4.2% |
|---|
Visa, Inc., Class A | 3.8% |
|---|
Synopsys, Inc. | 3.5% |
|---|
Uber Technologies, Inc. | 3.5% |
|---|
Advanced Micro Devices, Inc. | 3.2% |
|---|
Table Summary* | Does not include futures contracts, money market instruments, short-term investments purchased with cash collateral from securities loaned, or other assets in excess of liabilities. |
|---|
** | In the Schedule of Portfolio Investments, if a sector comprises more than 25% of the net assets of the Fund, the securities in that sector are displayed at the industry classification level. |
|---|
| Utilize the Full Financials link below to refer to the Schedule of Portfolio Investments for a complete list of securities. |
|---|
Additional Shareholder Information
Additional information about the Fund is available on vcm.com and the adjacent QR code including:
Full Financials
Prospectus
Fund Holdings
Proxy Voting
Contact us at 800-539-3863 or visit vcm.com/contact-us.
Victory Pioneer Fundamental Growth Fund
Annual Shareholder Report — March 31, 2026
The annual shareholder report contains important information about Victory Pioneer Fundamental Growth Fund (the "Fund") for the period of April 1, 2025 to March 31, 2026. You can find additional information about the Fund at advisor.vcm.com/literature/mutual-fund-prospectuses. You may also request more information by calling 800-539-3863 or visiting vcm.com/contact-us.
What were the Fund's costs for the last year?
(based on a hypothetical $10,000 investment)
Table SummaryClass Name | Costs of a $10,000 Investment | Costs paid as a percentage of a $10,000 Investment |
|---|
Class C | $179 | 1.72% |
|---|
| | |
|---|
What affected the Fund’s performance during the last year?
Top contributors to performance:
Consumer staples was the largest sector contributor to relative performance as compared to the Russell 1000® Growth Index (the “Index”), and the portfolio benefited from its lack of exposure to the declining real estate sector.
At the individual security level, overweight positions in Amphenol Corp., Class A and ASML Holding NV, Class NY were the top contributors to relative performance, as both positions significantly outperformed the Index on the strength of robust revenue growth and expanding AI-driven demand.
Top detractors from performance:
Stock selection in industrials and communication services were the largest detractors to performance relative to the Index.
At the individual security level, NVIDIA Corp. and Broadcom, Inc., were the largest detractors, as the portfolio's underweight positions in both names proved costly given their substantial outperformance during the period.
Holdings are subject to change. There is no guarantee that securities mentioned remain in or out of the Fund.
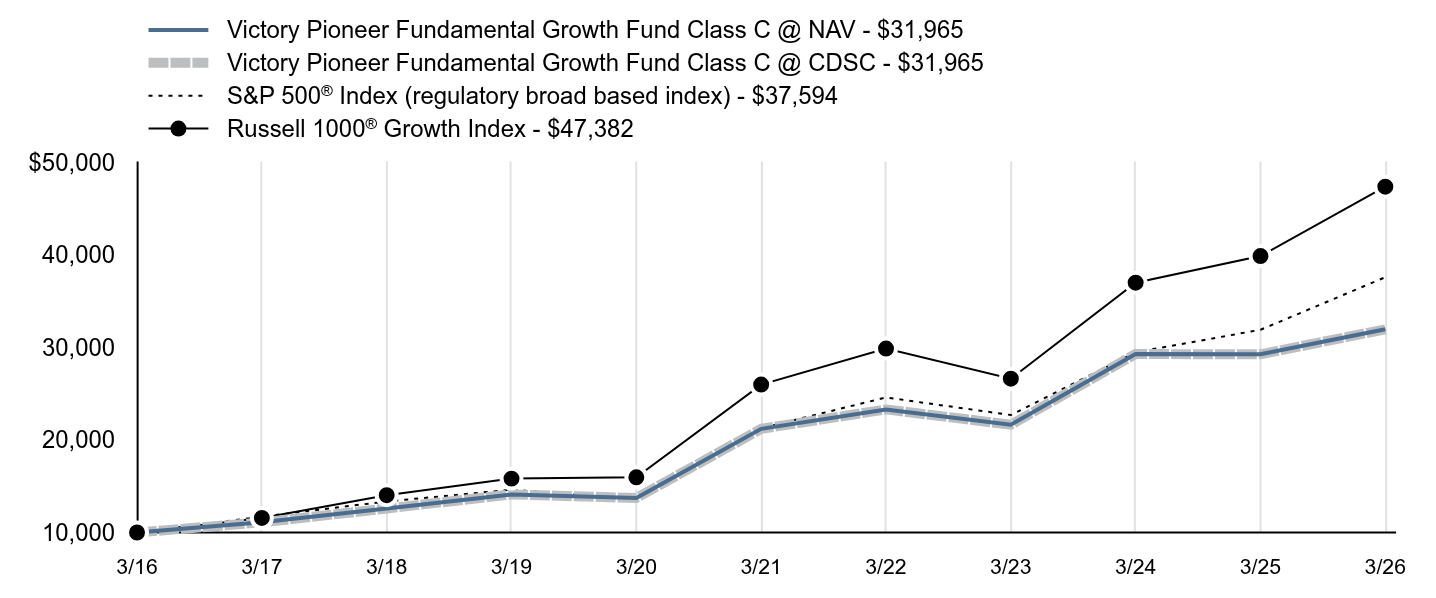
The graph reflects investment growth of a hypothetical investment of $10,000 in the Fund. The graph and table total returns do not reflect the deduction of taxes that a shareholder would pay on Fund distributions, or redemption of shares. The total return figures include all waivers of fees. Without such fee waivers, the total returns would have been lower. Class C is not subject to an initial sales charge, but is subject to Contingent Deferred Sales Charge (“CDSC”) of 1.00% on shares redeemed within one year of purchase. The Net Asset Value ("NAV") figures do not reflect sales charges.
Growth of $10,000 Investment
Table Summary | Victory Pioneer Fundamental Growth Fund Class C @ NAV - $31,965 | Victory Pioneer Fundamental Growth Fund Class C @ CDSC - $31,965 | S&P 500® Index (regulatory broad based index) - $37,594 | Russell 1000® Growth Index - $47,382 |
|---|
3/16 | $10,000 | $10,000 | $10,000 | $10,000 |
|---|
3/17 | $11,098 | $11,098 | $11,717 | $11,576 |
|---|
3/18 | $12,592 | $12,592 | $13,357 | $14,036 |
|---|
3/19 | $14,118 | $14,118 | $14,625 | $15,825 |
|---|
3/20 | $13,729 | $13,729 | $13,605 | $15,969 |
|---|
3/21 | $21,204 | $21,204 | $21,271 | $25,989 |
|---|
3/22 | $23,305 | $23,305 | $24,599 | $29,882 |
|---|
3/23 | $21,652 | $21,652 | $22,698 | $26,624 |
|---|
3/24 | $29,290 | $29,290 | $29,480 | $37,007 |
|---|
3/25 | $29,266 | $29,266 | $31,913 | $39,879 |
|---|
3/26 | $31,965 | $31,965 | $37,594 | $47,382 |
|---|
AVERAGE ANNUAL TOTAL RETURNS
(as of March 31, 2026)
Table Summary | 1 Year | 5 Year | 10 Year |
|---|
Class C @ NAV | 8.43% | 8.24% | 12.32% |
|---|
Class C @ CDSC | 7.56% | 8.24% | 12.32% |
|---|
S&P 500® Index | 17.80% | 12.06% | 14.16% |
|---|
Russell 1000® Growth Index | 18.81% | 12.76% | 16.83% |
|---|
FUND STATISTICS
($ amounts in 000s)
(as of March 31, 2026)
Table SummaryNet Assets | $5,786,549 |
|---|
Number of Holdings | 37 |
|---|
Investment Advisory Fees | $42,644 |
|---|
Portfolio Turnover | 24% |
|---|
The investment return and principal value will fluctuate so that an investor's shares, when redeemed, may be worth more or less than the original cost. Past performance is not a good predictor of the Fund's future performance. For current performance, please visit https://advisor.vcm.com/products-fa/mutual-funds or call 800-539-3863.
Top SectorsFootnote Reference* (% of Net Assets)Footnote Reference
(as of March 31, 2026)
Table SummaryValue | Value |
|---|
Materials | 0.6% |
Industrials | 8.5% |
Financials | 8.9% |
Communication Services | 10.4% |
Health Care | 11.1% |
Consumer Discretionary | 19.0% |
Information TechnologyFootnote Reference** | 41.4% |
Top 10 HoldingsFootnote Reference* (% of Net Assets)Footnote Reference
(as of March 31, 2026)
Table SummaryApple, Inc. | 7.9% |
|---|
Amazon.com, Inc. | 7.3% |
|---|
Microsoft Corp. | 4.4% |
|---|
Eli Lilly & Co. | 4.4% |
|---|
Amphenol Corp., Class A | 4.3% |
|---|
ASML Holding NV, Class NY | 4.2% |
|---|
Visa, Inc., Class A | 3.8% |
|---|
Synopsys, Inc. | 3.5% |
|---|
Uber Technologies, Inc. | 3.5% |
|---|
Advanced Micro Devices, Inc. | 3.2% |
|---|
Table Summary* | Does not include futures contracts, money market instruments, short-term investments purchased with cash collateral from securities loaned, or other assets in excess of liabilities. |
|---|
** | In the Schedule of Portfolio Investments, if a sector comprises more than 25% of the net assets of the Fund, the securities in that sector are displayed at the industry classification level. |
|---|
| Utilize the Full Financials link below to refer to the Schedule of Portfolio Investments for a complete list of securities. |
|---|
Additional Shareholder Information
Additional information about the Fund is available on vcm.com and the adjacent QR code including:
Full Financials
Prospectus
Fund Holdings
Proxy Voting
Contact us at 800-539-3863 or visit vcm.com/contact-us.
Victory Pioneer Fundamental Growth Fund
Annual Shareholder Report — March 31, 2026
The annual shareholder report contains important information about Victory Pioneer Fundamental Growth Fund (the "Fund") for the period of April 1, 2025 to March 31, 2026. You can find additional information about the Fund at advisor.vcm.com/literature/mutual-fund-prospectuses. You may also request more information by calling 800-539-3863 or visiting vcm.com/contact-us.
What were the Fund's costs for the last year?
(based on a hypothetical $10,000 investment)
Table SummaryClass Name | Costs of a $10,000 Investment | Costs paid as a percentage of a $10,000 Investment |
|---|
Class R | $142 | 1.36% |
|---|
| | |
|---|
What affected the Fund’s performance during the last year?
Top contributors to performance:
Consumer staples was the largest sector contributor to relative performance as compared to the Russell 1000® Growth Index (the “Index”), and the portfolio benefited from its lack of exposure to the declining real estate sector.
At the individual security level, overweight positions in Amphenol Corp., Class A and ASML Holding NV, Class NY were the top contributors to relative performance, as both positions significantly outperformed the Index on the strength of robust revenue growth and expanding AI-driven demand.
Top detractors from performance:
Stock selection in industrials and communication services were the largest detractors to performance relative to the Index.
At the individual security level, NVIDIA Corp. and Broadcom, Inc., were the largest detractors, as the portfolio's underweight positions in both names proved costly given their substantial outperformance during the period.
Holdings are subject to change. There is no guarantee that securities mentioned remain in or out of the Fund.
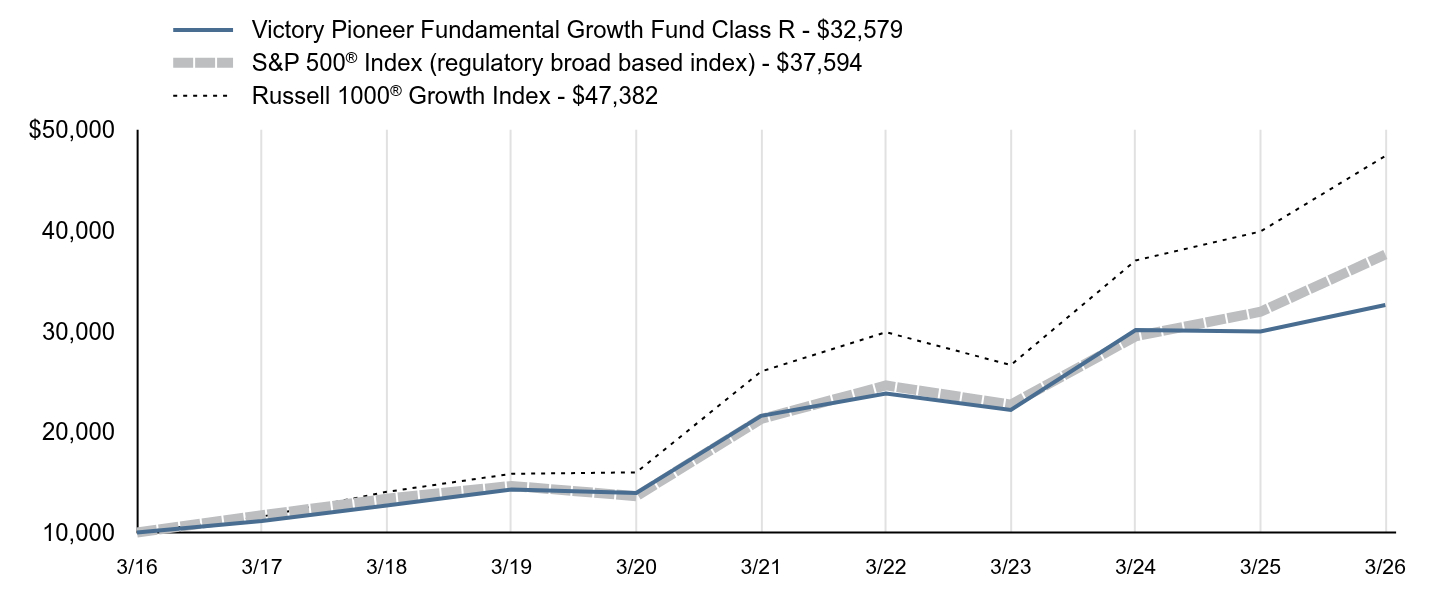
The graph reflects investment growth of a hypothetical investment of $10,000 in the Fund. The graph and table total returns do not reflect the deduction of taxes that a shareholder would pay on Fund distributions, or redemption of shares. The total return figures include all waivers of fees. Without such fee waivers, the total returns would have been lower.
Growth of $10,000 Investment
Table Summary | Victory Pioneer Fundamental Growth Fund Class R - $32,579 | S&P 500® Index (regulatory broad based index) - $37,594 | Russell 1000® Growth Index - $47,382 |
|---|
3/16 | $10,000 | $10,000 | $10,000 |
|---|
3/17 | $11,141 | $11,717 | $11,576 |
|---|
3/18 | $12,680 | $13,357 | $14,036 |
|---|
3/19 | $14,274 | $14,625 | $15,825 |
|---|
3/20 | $13,924 | $13,605 | $15,969 |
|---|
3/21 | $21,582 | $21,271 | $25,989 |
|---|
3/22 | $23,788 | $24,599 | $29,882 |
|---|
3/23 | $22,170 | $22,698 | $26,624 |
|---|
3/24 | $30,101 | $29,480 | $37,007 |
|---|
3/25 | $29,954 | $31,913 | $39,879 |
|---|
3/26 | $32,579 | $37,594 | $47,382 |
|---|
AVERAGE ANNUAL TOTAL RETURNS
(as of March 31, 2026)
Table Summary | 1 Year | 5 Year | 10 Year |
|---|
Class R | 8.76% | 8.58% | 12.54% |
|---|
S&P 500® Index | 17.80% | 12.06% | 14.16% |
|---|
Russell 1000® Growth Index | 18.81% | 12.76% | 16.83% |
|---|
FUND STATISTICS
($ amounts in 000s)
(as of March 31, 2026)
Table SummaryNet Assets | $5,786,549 |
|---|
Number of Holdings | 37 |
|---|
Investment Advisory Fees | $42,644 |
|---|
Portfolio Turnover | 24% |
|---|
The investment return and principal value will fluctuate so that an investor's shares, when redeemed, may be worth more or less than the original cost. Past performance is not a good predictor of the Fund's future performance. For current performance, please visit https://advisor.vcm.com/products-fa/mutual-funds or call 800-539-3863.
Top SectorsFootnote Reference* (% of Net Assets)Footnote Reference
(as of March 31, 2026)
Table SummaryValue | Value |
|---|
Materials | 0.6% |
Industrials | 8.5% |
Financials | 8.9% |
Communication Services | 10.4% |
Health Care | 11.1% |
Consumer Discretionary | 19.0% |
Information TechnologyFootnote Reference** | 41.4% |
Top 10 HoldingsFootnote Reference* (% of Net Assets)Footnote Reference
(as of March 31, 2026)
Table SummaryApple, Inc. | 7.9% |
|---|
Amazon.com, Inc. | 7.3% |
|---|
Microsoft Corp. | 4.4% |
|---|
Eli Lilly & Co. | 4.4% |
|---|
Amphenol Corp., Class A | 4.3% |
|---|
ASML Holding NV, Class NY | 4.2% |
|---|
Visa, Inc., Class A | 3.8% |
|---|
Synopsys, Inc. | 3.5% |
|---|
Uber Technologies, Inc. | 3.5% |
|---|
Advanced Micro Devices, Inc. | 3.2% |
|---|
Table Summary* | Does not include futures contracts, money market instruments, short-term investments purchased with cash collateral from securities loaned, or other assets in excess of liabilities. |
|---|
** | In the Schedule of Portfolio Investments, if a sector comprises more than 25% of the net assets of the Fund, the securities in that sector are displayed at the industry classification level. |
|---|
| Utilize the Full Financials link below to refer to the Schedule of Portfolio Investments for a complete list of securities. |
|---|
Additional Shareholder Information
Additional information about the Fund is available on vcm.com and the adjacent QR code including:
Full Financials
Prospectus
Fund Holdings
Proxy Voting
Contact us at 800-539-3863 or visit vcm.com/contact-us.
Victory Pioneer Fundamental Growth Fund
Annual Shareholder Report — March 31, 2026
The annual shareholder report contains important information about Victory Pioneer Fundamental Growth Fund (the "Fund") for the period of April 1, 2025 to March 31, 2026. You can find additional information about the Fund at advisor.vcm.com/literature/mutual-fund-prospectuses. You may also request more information by calling 800-539-3863 or visiting vcm.com/contact-us.
What were the Fund's costs for the last year?
(based on a hypothetical $10,000 investment)
Table SummaryClass Name | Costs of a $10,000 Investment | Costs paid as a percentage of a $10,000 Investment |
|---|
Class R6 | $68 | 0.65% |
|---|
| | |
|---|
What affected the Fund’s performance during the last year?
Top contributors to performance:
Consumer staples was the largest sector contributor to relative performance as compared to the Russell 1000® Growth Index (the “Index”), and the portfolio benefited from its lack of exposure to the declining real estate sector.
At the individual security level, overweight positions in Amphenol Corp., Class A and ASML Holding NV, Class NY were the top contributors to relative performance, as both positions significantly outperformed the Index on the strength of robust revenue growth and expanding AI-driven demand.
Top detractors from performance:
Stock selection in industrials and communication services were the largest detractors to performance relative to the Index.
At the individual security level, NVIDIA Corp. and Broadcom, Inc., were the largest detractors, as the portfolio's underweight positions in both names proved costly given their substantial outperformance during the period.
Holdings are subject to change. There is no guarantee that securities mentioned remain in or out of the Fund.
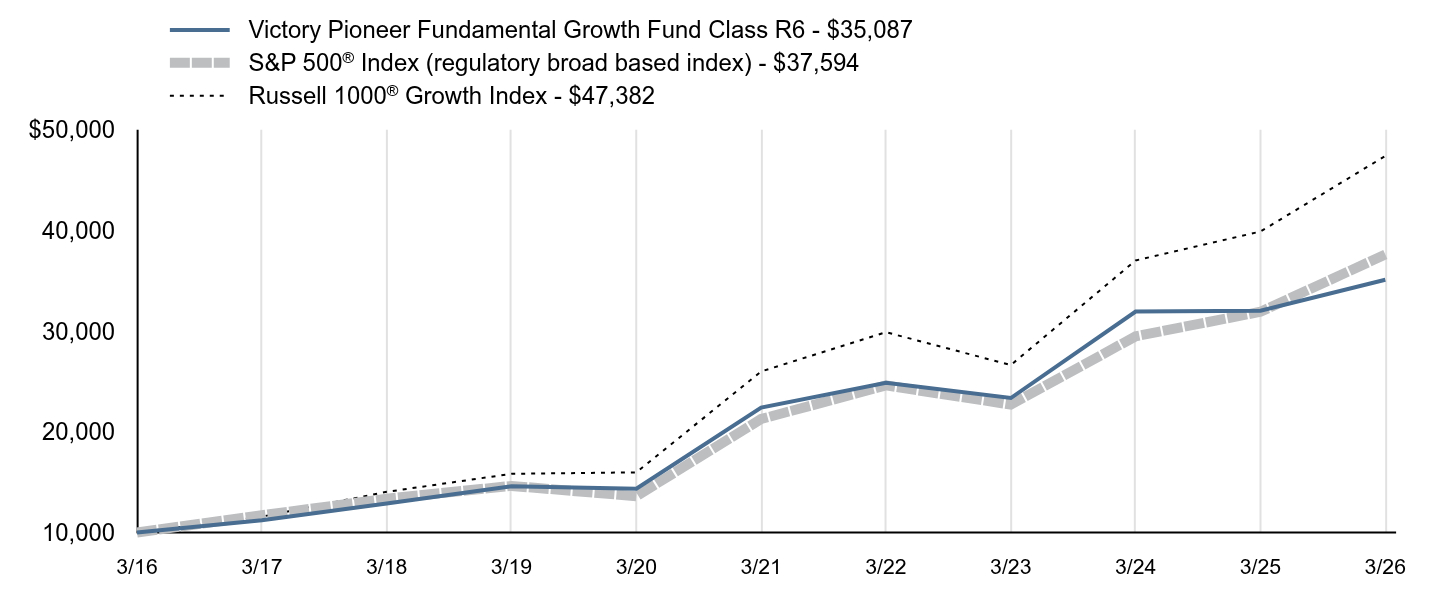
The graph reflects investment growth of a hypothetical investment of $10,000 in the Fund. The graph and table total returns do not reflect the deduction of taxes that a shareholder would pay on Fund distributions, or redemption of shares. The total return figures include all waivers of fees. Without such fee waivers, the total returns would have been lower.
Growth of $10,000 Investment
Table Summary | Victory Pioneer Fundamental Growth Fund Class R6 - $35,087 | S&P 500® Index (regulatory broad based index) - $37,594 | Russell 1000® Growth Index - $47,382 |
|---|
3/16 | $10,000 | $10,000 | $10,000 |
|---|
3/17 | $11,224 | $11,717 | $11,576 |
|---|
3/18 | $12,872 | $13,357 | $14,036 |
|---|
3/19 | $14,594 | $14,625 | $15,825 |
|---|
3/20 | $14,341 | $13,605 | $15,969 |
|---|
3/21 | $22,393 | $21,271 | $25,989 |
|---|
3/22 | $24,874 | $24,599 | $29,882 |
|---|
3/23 | $23,348 | $22,698 | $26,624 |
|---|
3/24 | $31,932 | $29,480 | $37,007 |
|---|
3/25 | $32,019 | $31,913 | $39,879 |
|---|
3/26 | $35,087 | $37,594 | $47,382 |
|---|
AVERAGE ANNUAL TOTAL RETURNS
(as of March 31, 2026)
Table Summary | 1 Year | 5 Year | 10 Year |
|---|
Class R6 | 9.58% | 9.40% | 13.37% |
|---|
S&P 500® Index | 17.80% | 12.06% | 14.16% |
|---|
Russell 1000® Growth Index | 18.81% | 12.76% | 16.83% |
|---|
FUND STATISTICS
($ amounts in 000s)
(as of March 31, 2026)
Table SummaryNet Assets | $5,786,549 |
|---|
Number of Holdings | 37 |
|---|
Investment Advisory Fees | $42,644 |
|---|
Portfolio Turnover | 24% |
|---|
The investment return and principal value will fluctuate so that an investor's shares, when redeemed, may be worth more or less than the original cost. Past performance is not a good predictor of the Fund's future performance. For current performance, please visit https://advisor.vcm.com/products-fa/mutual-funds or call 800-539-3863.
Top SectorsFootnote Reference* (% of Net Assets)Footnote Reference
(as of March 31, 2026)
Table SummaryValue | Value |
|---|
Materials | 0.6% |
Industrials | 8.5% |
Financials | 8.9% |
Communication Services | 10.4% |
Health Care | 11.1% |
Consumer Discretionary | 19.0% |
Information TechnologyFootnote Reference** | 41.4% |
Top 10 HoldingsFootnote Reference* (% of Net Assets)Footnote Reference
(as of March 31, 2026)
Table SummaryApple, Inc. | 7.9% |
|---|
Amazon.com, Inc. | 7.3% |
|---|
Microsoft Corp. | 4.4% |
|---|
Eli Lilly & Co. | 4.4% |
|---|
Amphenol Corp., Class A | 4.3% |
|---|
ASML Holding NV, Class NY | 4.2% |
|---|
Visa, Inc., Class A | 3.8% |
|---|
Synopsys, Inc. | 3.5% |
|---|
Uber Technologies, Inc. | 3.5% |
|---|
Advanced Micro Devices, Inc. | 3.2% |
|---|
Table Summary* | Does not include futures contracts, money market instruments, short-term investments purchased with cash collateral from securities loaned, or other assets in excess of liabilities. |
|---|
** | In the Schedule of Portfolio Investments, if a sector comprises more than 25% of the net assets of the Fund, the securities in that sector are displayed at the industry classification level. |
|---|
| Utilize the Full Financials link below to refer to the Schedule of Portfolio Investments for a complete list of securities. |
|---|
Additional Shareholder Information
Additional information about the Fund is available on vcm.com and the adjacent QR code including:
Full Financials
Prospectus
Fund Holdings
Proxy Voting
Contact us at 800-539-3863 or visit vcm.com/contact-us.
Victory Pioneer Fundamental Growth Fund
Annual Shareholder Report — March 31, 2026
The annual shareholder report contains important information about Victory Pioneer Fundamental Growth Fund (the "Fund") for the period of April 1, 2025 to March 31, 2026. You can find additional information about the Fund at advisor.vcm.com/literature/mutual-fund-prospectuses. You may also request more information by calling 800-539-3863 or visiting vcm.com/contact-us.
What were the Fund's costs for the last year?
(based on a hypothetical $10,000 investment)
Table SummaryClass Name | Costs of a $10,000 Investment | Costs paid as a percentage of a $10,000 Investment |
|---|
Class Y | $80 | 0.76% |
|---|
| | |
|---|
What affected the Fund’s performance during the last year?
Top contributors to performance:
Consumer staples was the largest sector contributor to relative performance as compared to the Russell 1000® Growth Index (the “Index”), and the portfolio benefited from its lack of exposure to the declining real estate sector.
At the individual security level, overweight positions in Amphenol Corp., Class A and ASML Holding NV, Class NY were the top contributors to relative performance, as both positions significantly outperformed the Index on the strength of robust revenue growth and expanding AI-driven demand.
Top detractors from performance:
Stock selection in industrials and communication services were the largest detractors to performance relative to the Index.
At the individual security level, NVIDIA Corp. and Broadcom, Inc., were the largest detractors, as the portfolio's underweight positions in both names proved costly given their substantial outperformance during the period.
Holdings are subject to change. There is no guarantee that securities mentioned remain in or out of the Fund.
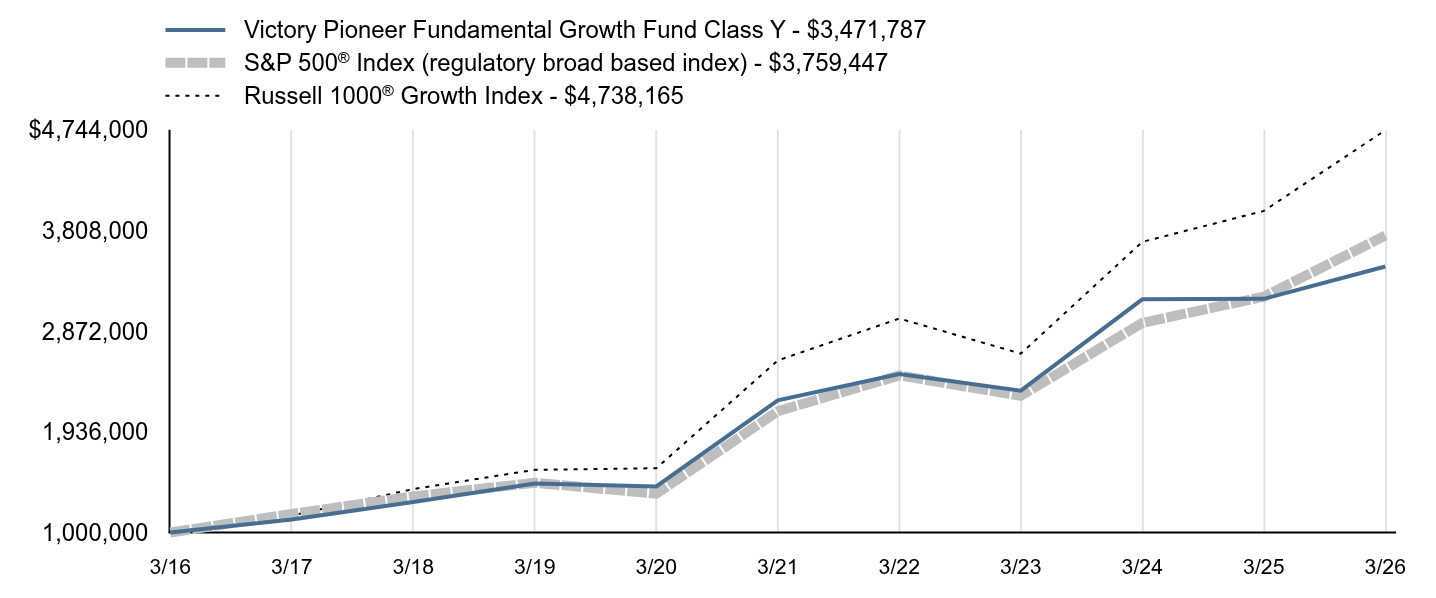
The graph reflects investment growth of a hypothetical investment of $1,000,000 in the Fund. The graph and table total returns do not reflect the deduction of taxes that a shareholder would pay on Fund distributions, or redemption of shares. The total return figures include all waivers of fees. Without such fee waivers, the total returns would have been lower.
Growth of $1,000,000 Investment
Table Summary | Victory Pioneer Fundamental Growth Fund Class Y - $3,471,787 | S&P 500® Index (regulatory broad based index) - $3,759,447 | Russell 1000® Growth Index - $4,738,165 |
|---|
3/16 | $1,000,000 | $1,000,000 | $1,000,000 |
|---|
3/17 | $1,121,131 | $1,171,722 | $1,157,562 |
|---|
3/18 | $1,284,137 | $1,335,668 | $1,403,589 |
|---|
3/19 | $1,454,655 | $1,462,509 | $1,582,515 |
|---|
3/20 | $1,427,850 | $1,360,457 | $1,596,942 |
|---|
3/21 | $2,227,279 | $2,127,097 | $2,598,918 |
|---|
3/22 | $2,471,504 | $2,459,899 | $2,988,165 |
|---|
3/23 | $2,318,294 | $2,269,786 | $2,662,407 |
|---|
3/24 | $3,166,512 | $2,948,026 | $3,700,652 |
|---|
3/25 | $3,171,347 | $3,191,288 | $3,987,942 |
|---|
3/26 | $3,471,787 | $3,759,447 | $4,738,165 |
|---|
AVERAGE ANNUAL TOTAL RETURNS
(as of March 31, 2026)
Table Summary | 1 Year | 5 Year | 10 Year |
|---|
Class Y | 9.47% | 9.28% | 13.25% |
|---|
S&P 500® Index | 17.80% | 12.06% | 14.16% |
|---|
Russell 1000® Growth Index | 18.81% | 12.76% | 16.83% |
|---|
FUND STATISTICS
($ amounts in 000s)
(as of March 31, 2026)
Table SummaryNet Assets | $5,786,549 |
|---|
Number of Holdings | 37 |
|---|
Investment Advisory Fees | $42,644 |
|---|
Portfolio Turnover | 24% |
|---|
The investment return and principal value will fluctuate so that an investor's shares, when redeemed, may be worth more or less than the original cost. Past performance is not a good predictor of the Fund's future performance. For current performance, please visit https://advisor.vcm.com/products-fa/mutual-funds or call 800-539-3863.
Top SectorsFootnote Reference* (% of Net Assets)Footnote Reference
(as of March 31, 2026)
Table SummaryValue | Value |
|---|
Materials | 0.6% |
Industrials | 8.5% |
Financials | 8.9% |
Communication Services | 10.4% |
Health Care | 11.1% |
Consumer Discretionary | 19.0% |
Information TechnologyFootnote Reference** | 41.4% |
Top 10 HoldingsFootnote Reference* (% of Net Assets)Footnote Reference
(as of March 31, 2026)
Table SummaryApple, Inc. | 7.9% |
|---|
Amazon.com, Inc. | 7.3% |
|---|
Microsoft Corp. | 4.4% |
|---|
Eli Lilly & Co. | 4.4% |
|---|
Amphenol Corp., Class A | 4.3% |
|---|
ASML Holding NV, Class NY | 4.2% |
|---|
Visa, Inc., Class A | 3.8% |
|---|
Synopsys, Inc. | 3.5% |
|---|
Uber Technologies, Inc. | 3.5% |
|---|
Advanced Micro Devices, Inc. | 3.2% |
|---|
Table Summary* | Does not include futures contracts, money market instruments, short-term investments purchased with cash collateral from securities loaned, or other assets in excess of liabilities. |
|---|
** | In the Schedule of Portfolio Investments, if a sector comprises more than 25% of the net assets of the Fund, the securities in that sector are displayed at the industry classification level. |
|---|
| Utilize the Full Financials link below to refer to the Schedule of Portfolio Investments for a complete list of securities. |
|---|
Additional Shareholder Information
Additional information about the Fund is available on vcm.com and the adjacent QR code including:
Full Financials
Prospectus
Fund Holdings
Proxy Voting
Contact us at 800-539-3863 or visit vcm.com/contact-us.
Victory Pioneer Multi-Asset Ultrashort Income Fund
Annual Shareholder Report — March 31, 2026
The annual shareholder report contains important information about Victory Pioneer Multi-Asset Ultrashort Income Fund (the "Fund") for the period of April 1, 2025 to March 31, 2026. You can find additional information about the Fund at advisor.vcm.com/literature/ mutual-fund-prospectuses. You may also request more information by calling 800-539-3863 or visiting vcm.com/contact-us.
What were the Fund's costs for the last year?
(based on a hypothetical $10,000 investment)
Table SummaryClass Name | Costs of a $10,000 Investment | Costs paid as a percentage of a $10,000 Investment |
|---|
Class A | $59 | 0.58% |
|---|
| | |
|---|
What affected the Fund’s performance during the last year?
Top contributors to performance:
The Fund’s exposures to collateralized loan obligations, industrials and agency mortgage-backed securities contributed to performance relative to the ICE BofA 3-Month US Treasury Bill Index (the “Index”).
The Fund’s long average U.S. duration position relative to the Index of 0.1 years contributed to performance as yields moved lower in the middle part of the period.
The Fund benefited from out of Index allocations to non-agency mortgage-backed securities, commercial mortgage-backed securities, and the financial sector.
Top detractors from performance:
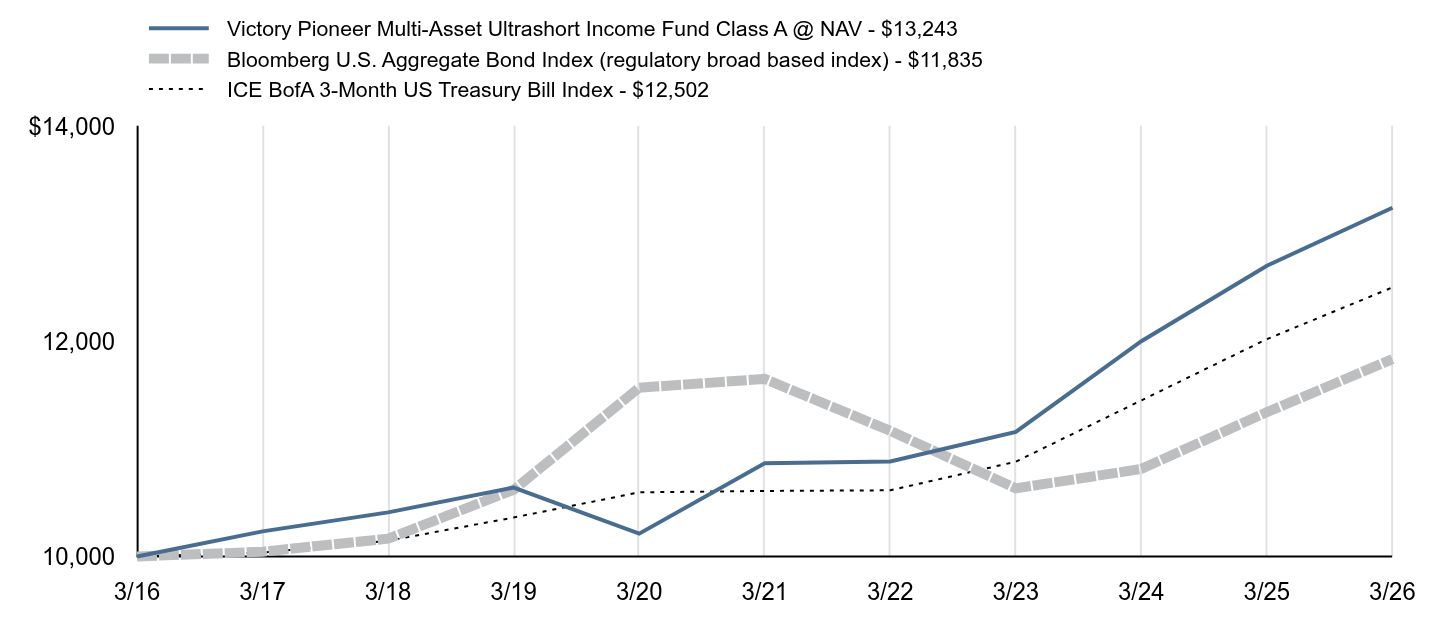
The graph reflects investment growth of a hypothetical investment of $10,000 in the Fund. The graph and table total returns do not reflect the deduction of taxes that a shareholder would pay on Fund distributions, or redemption of shares. The total return figures include all waivers of fees. Without such fee waivers, the total returns would have been lower.
Growth of $10,000 Investment
Table Summary | Victory Pioneer Multi-Asset Ultrashort Income Fund Class A @ NAV - $13,243 | Bloomberg U.S. Aggregate Bond Index (regulatory broad based index) - $11,835 | ICE BofA 3-Month US Treasury Bill Index - $12,502 |
|---|
3/16 | $10,000 | $10,000 | $10,000 |
|---|
3/17 | $10,233 | $10,044 | $10,036 |
|---|
3/18 | $10,410 | $10,165 | $10,146 |
|---|
3/19 | $10,641 | $10,620 | $10,362 |
|---|
3/20 | $10,212 | $11,569 | $10,596 |
|---|
3/21 | $10,867 | $11,651 | $10,609 |
|---|
3/22 | $10,884 | $11,168 | $10,615 |
|---|
3/23 | $11,158 | $10,633 | $10,881 |
|---|
3/24 | $12,002 | $10,814 | $11,451 |
|---|
3/25 | $12,703 | $11,342 | $12,021 |
|---|
3/26 | $13,243 | $11,835 | $12,502 |
|---|
AVERAGE ANNUAL TOTAL RETURNS
(as of March 31, 2026)
Table Summary | 1 Year | 5 Year | 10 Year |
|---|
Class A @ NAV | 4.25% | 4.03% | 2.85% |
|---|
Bloomberg U.S. Aggregate Bond Index | 4.35% | 0.31% | 1.70% |
|---|
ICE BofA 3-Month US Treasury Bill Index | 4.00% | 3.34% | 2.26% |
|---|
FUND STATISTICS
($ amounts in 000s)
(as of March 31, 2026)
Table SummaryNet Assets | $8,082,066 |
|---|
Number of Holdings | 1,175 |
|---|
Investment Advisory Fees | $22,643 |
|---|
Portfolio Turnover | 54% |
|---|
The investment return and principal value will fluctuate so that an investor's shares, when redeemed, may be worth more or less than the original cost. Past performance is not a good predictor of the Fund's future performance. For current performance, please visit https://advisor.vcm.com/products-fa/mutual-funds or call 800-539-3863.
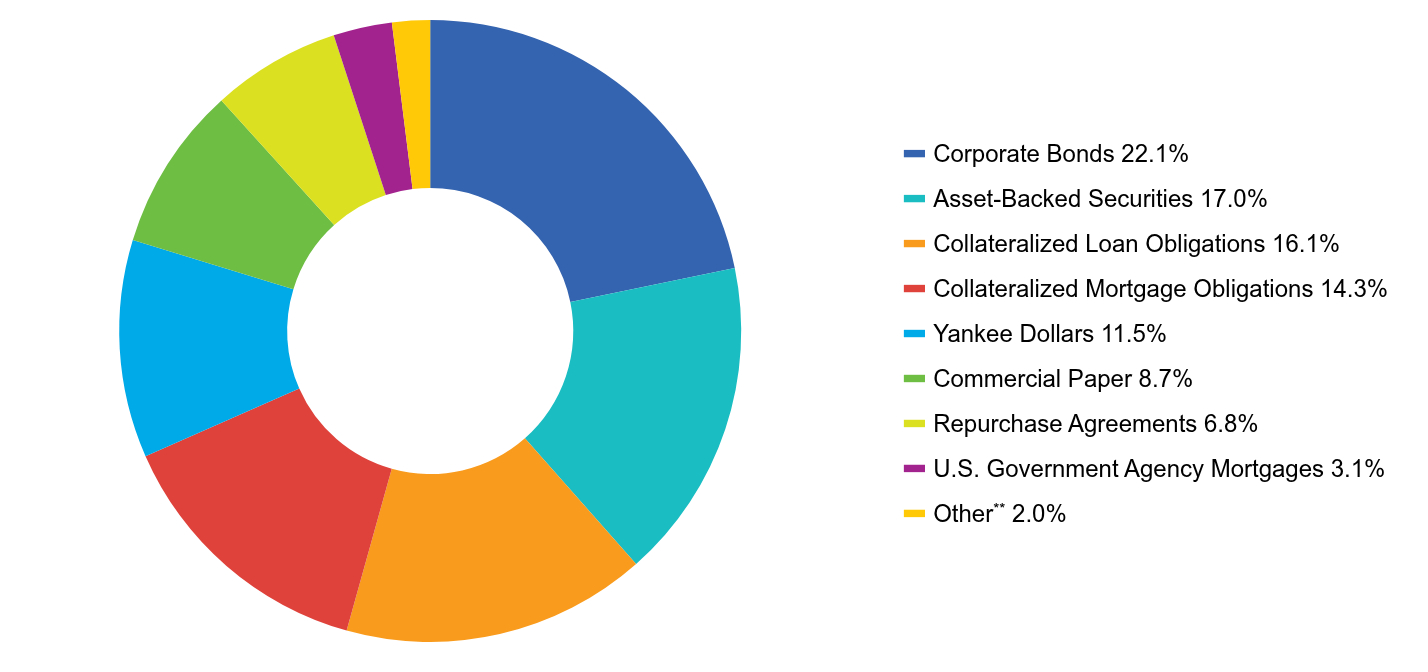
Asset AllocationFootnote Reference* ^ (% of Net Assets)
(as of March 31, 2026)
Table SummaryValue | Value |
|---|
Corporate Bonds | 22.1% |
Asset-Backed Securities | 17.0% |
Collateralized Loan Obligations | 16.1% |
Collateralized Mortgage Obligations | 14.3% |
Yankee Dollars | 11.5% |
Commercial Paper | 8.7% |
Repurchase Agreements | 6.8% |
U.S. Government Agency Mortgages | 3.1% |
OtherFootnote Reference** | 2.0% |
Table Summary^ | Percentages are of the net assets of the Fund and may not equal 100%. |
|---|
* | Does not include derivative contracts except for options purchased, or other assets in excess of liabilities. |
|---|
** | Other includes the remaining asset classes which are each under 2% of the net assets of the Fund. |
|---|
| Utilize the Full Financials link below to refer to the Schedule of Portfolio Investments for a complete list of securities. |
|---|
Additional Shareholder Information
Additional information about the Fund is available on vcm.com and the adjacent QR code including:
Full Financials
Prospectus
Fund Holdings
Proxy Voting
Contact us at 800-539-3863 or visit vcm.com/contact-us.
Victory Pioneer Multi-Asset Ultrashort Income Fund
Annual Shareholder Report — March 31, 2026
The annual shareholder report contains important information about Victory Pioneer Multi-Asset Ultrashort Income Fund (the "Fund") for the period of April 1, 2025 to March 31, 2026. You can find additional information about the Fund at advisor.vcm.com/literature/ mutual-fund-prospectuses. You may also request more information by calling 800-539-3863 or visiting vcm.com/contact-us.
What were the Fund's costs for the last year?
(based on a hypothetical $10,000 investment)
Table SummaryClass Name | Costs of a $10,000 Investment | Costs paid as a percentage of a $10,000 Investment |
|---|
Class C | $90 | 0.88% |
|---|
| | |
|---|
What affected the Fund’s performance during the last year?
Top contributors to performance:
The Fund’s exposures to collateralized loan obligations, industrials and agency mortgage-backed securities contributed to performance relative to the ICE BofA 3-Month US Treasury Bill Index (the “Index”).
The Fund’s long average U.S. duration position relative to the Index of 0.1 years contributed to performance as yields moved lower in the middle part of the period.
The Fund benefited from out of Index allocations to non-agency mortgage-backed securities, commercial mortgage-backed securities, and the financial sector.
Top detractors from performance:
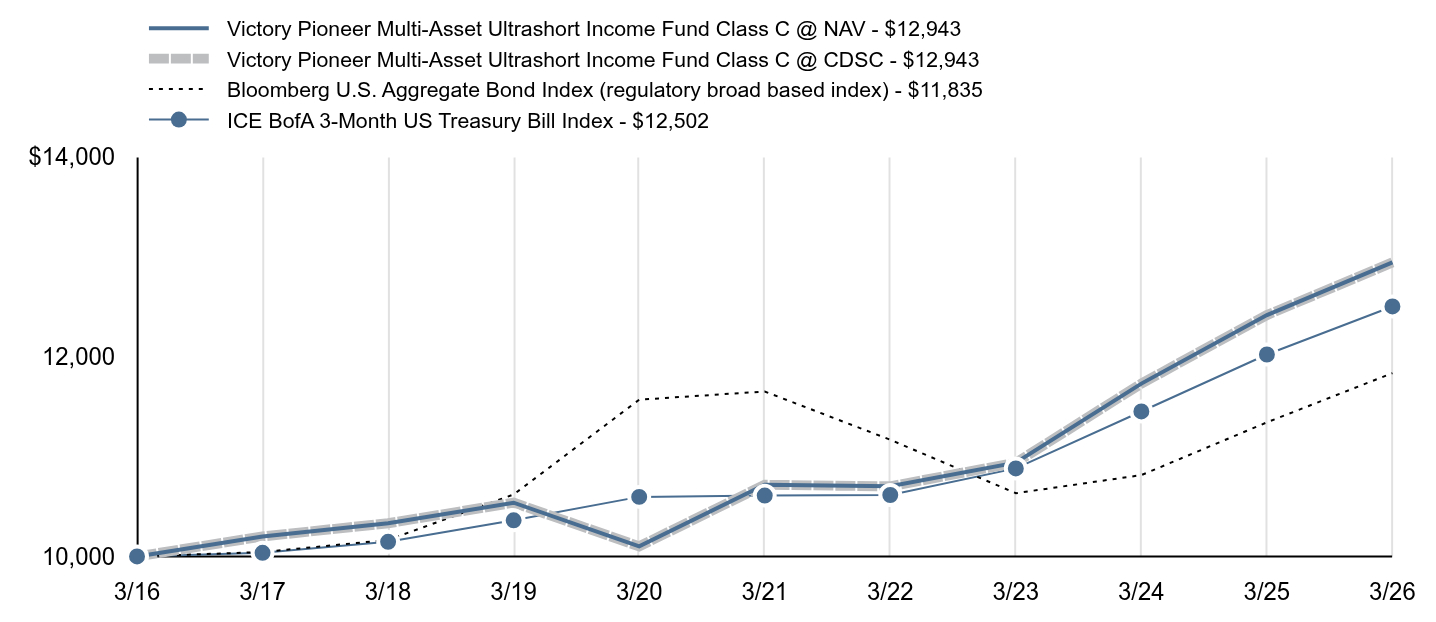
The graph reflects investment growth of a hypothetical investment of $10,000 in the Fund. The graph and table total returns do not reflect the deduction of taxes that a shareholder would pay on Fund distributions, or redemption of shares. The total return figures include all waivers of fees. Without such fee waivers, the total returns would have been lower. Class C is not subject to an initial sales charge, but is subject to Contingent Deferred Sales Charge (“CDSC”) of 1.00% on shares redeemed within one year of purchase. The Net Asset Value ("NAV") figures do not reflect sales charges.
Growth of $10,000 Investment
Table Summary | Victory Pioneer Multi-Asset Ultrashort Income Fund Class C @ NAV - $12,943 | Victory Pioneer Multi-Asset Ultrashort Income Fund Class C @ CDSC - $12,943 | Bloomberg U.S. Aggregate Bond Index (regulatory broad based index) - $11,835 | ICE BofA 3-Month US Treasury Bill Index - $12,502 |
|---|
3/16 | $10,000 | $10,000 | $10,000 | $10,000 |
|---|
3/17 | $10,200 | $10,200 | $10,044 | $10,036 |
|---|
3/18 | $10,332 | $10,332 | $10,165 | $10,146 |
|---|
3/19 | $10,538 | $10,538 | $10,620 | $10,362 |
|---|
3/20 | $10,101 | $10,101 | $11,569 | $10,596 |
|---|
3/21 | $10,717 | $10,717 | $11,651 | $10,609 |
|---|
3/22 | $10,702 | $10,702 | $11,168 | $10,615 |
|---|
3/23 | $10,938 | $10,938 | $10,633 | $10,881 |
|---|
3/24 | $11,730 | $11,730 | $10,814 | $11,451 |
|---|
3/25 | $12,416 | $12,416 | $11,342 | $12,021 |
|---|
3/26 | $12,943 | $12,943 | $11,835 | $12,502 |
|---|
AVERAGE ANNUAL TOTAL RETURNS
(as of March 31, 2026)
Table Summary | 1 Year | 5 Year | 10 Year |
|---|
Class C @ NAV | 3.93% | 3.72% | 2.61% |
|---|
Class C @ CDSC | 2.94% | 3.72% | 2.61% |
|---|
Bloomberg U.S. Aggregate Bond Index | 4.35% | 0.31% | 1.70% |
|---|
ICE BofA 3-Month US Treasury Bill Index | 4.00% | 3.34% | 2.26% |
|---|
FUND STATISTICS
($ amounts in 000s)
(as of March 31, 2026)
Table SummaryNet Assets | $8,082,066 |
|---|
Number of Holdings | 1,175 |
|---|
Investment Advisory Fees | $22,643 |
|---|
Portfolio Turnover | 54% |
|---|
The investment return and principal value will fluctuate so that an investor's shares, when redeemed, may be worth more or less than the original cost. Past performance is not a good predictor of the Fund's future performance. For current performance, please visit https://advisor.vcm.com/products-fa/mutual-funds or call 800-539-3863.
Asset AllocationFootnote Reference* ^ (% of Net Assets)
(as of March 31, 2026)
Table SummaryValue | Value |
|---|
Corporate Bonds | 22.1% |
Asset-Backed Securities | 17.0% |
Collateralized Loan Obligations | 16.1% |
Collateralized Mortgage Obligations | 14.3% |
Yankee Dollars | 11.5% |
Commercial Paper | 8.7% |
Repurchase Agreements | 6.8% |
U.S. Government Agency Mortgages | 3.1% |
OtherFootnote Reference** | 2.0% |
Table Summary^ | Percentages are of the net assets of the Fund and may not equal 100%. |
|---|
* | Does not include derivative contracts except for options purchased, or other assets in excess of liabilities. |
|---|
** | Other includes the remaining asset classes which are each under 2% of the net assets of the Fund. |
|---|
| Utilize the Full Financials link below to refer to the Schedule of Portfolio Investments for a complete list of securities. |
|---|
Additional Shareholder Information
Additional information about the Fund is available on vcm.com and the adjacent QR code including:
Full Financials
Prospectus
Fund Holdings
Proxy Voting
Contact us at 800-539-3863 or visit vcm.com/contact-us.
Victory Pioneer Multi-Asset Ultrashort Income Fund
Annual Shareholder Report — March 31, 2026
The annual shareholder report contains important information about Victory Pioneer Multi-Asset Ultrashort Income Fund (the "Fund") for the period of April 1, 2025 to March 31, 2026. You can find additional information about the Fund at advisor.vcm.com/literature/ mutual-fund-prospectuses. You may also request more information by calling 800-539-3863 or visiting vcm.com/contact-us.
What were the Fund's costs for the last year?
(based on a hypothetical $10,000 investment)
Table SummaryClass Name | Costs of a $10,000 Investment | Costs paid as a percentage of a $10,000 Investment |
|---|
Class R6 | $36 | 0.35% |
|---|
| | |
|---|
What affected the Fund’s performance during the last year?
Top contributors to performance:
The Fund’s exposures to collateralized loan obligations, industrials and agency mortgage-backed securities contributed to performance relative to the ICE BofA 3-Month US Treasury Bill Index (the “Index”).
The Fund’s long average U.S. duration position relative to the Index of 0.1 years contributed to performance as yields moved lower in the middle part of the period.
The Fund benefited from out of Index allocations to non-agency mortgage-backed securities, commercial mortgage-backed securities, and the financial sector.
Top detractors from performance:
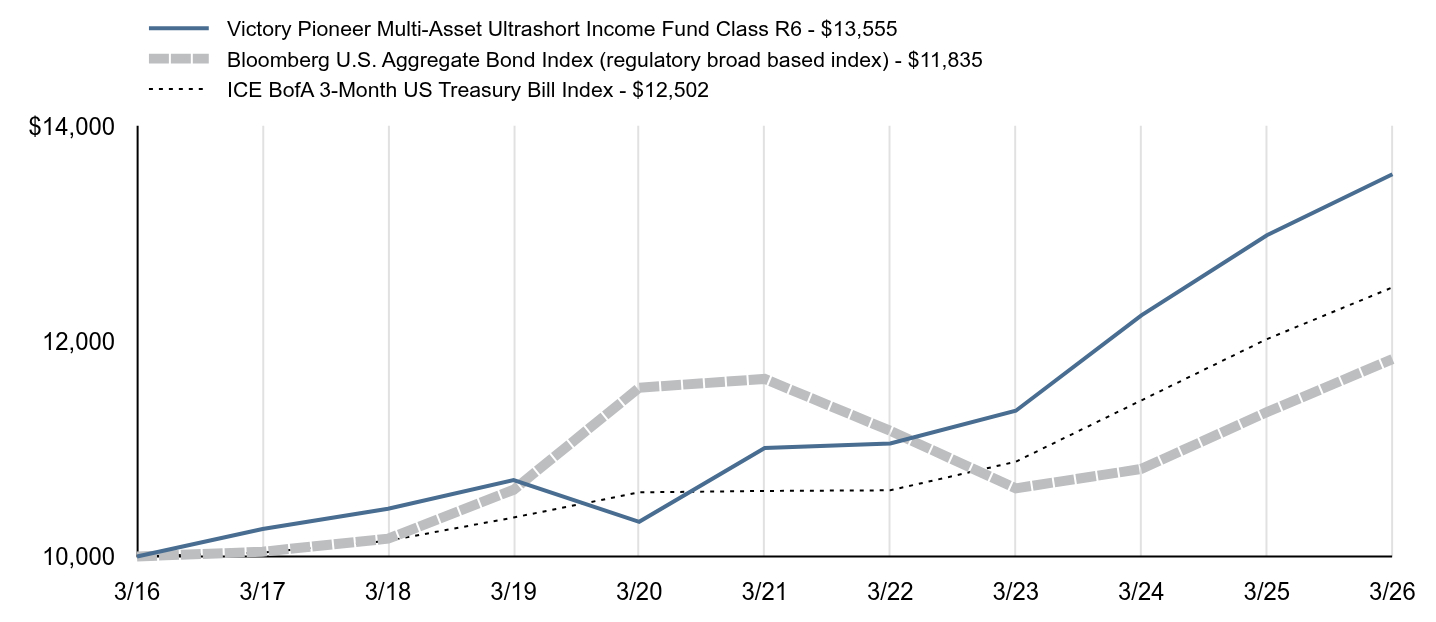
The graph reflects investment growth of a hypothetical investment of $10,000 in the Fund. The graph and table total returns do not reflect the deduction of taxes that a shareholder would pay on Fund distributions, or redemption of shares. The total return figures include all waivers of fees. Without such fee waivers, the total returns would have been lower.
Growth of $10,000 Investment
Table Summary | Victory Pioneer Multi-Asset Ultrashort Income Fund Class R6 - $13,555 | Bloomberg U.S. Aggregate Bond Index (regulatory broad based index) - $11,835 | ICE BofA 3-Month US Treasury Bill Index - $12,502 |
|---|
3/16 | $10,000 | $10,000 | $10,000 |
|---|
3/17 | $10,255 | $10,044 | $10,036 |
|---|
3/18 | $10,444 | $10,165 | $10,146 |
|---|
3/19 | $10,710 | $10,620 | $10,362 |
|---|
3/20 | $10,322 | $11,569 | $10,596 |
|---|
3/21 | $11,008 | $11,651 | $10,609 |
|---|
3/22 | $11,051 | $11,168 | $10,615 |
|---|
3/23 | $11,355 | $10,633 | $10,881 |
|---|
3/24 | $12,242 | $10,814 | $11,451 |
|---|
3/25 | $12,987 | $11,342 | $12,021 |
|---|
3/26 | $13,555 | $11,835 | $12,502 |
|---|
AVERAGE ANNUAL TOTAL RETURNS
(as of March 31, 2026)
Table Summary | 1 Year | 5 Year | 10 Year |
|---|
Class R6 | 4.38% | 4.25% | 3.09% |
|---|
Bloomberg U.S. Aggregate Bond Index | 4.35% | 0.31% | 1.70% |
|---|
ICE BofA 3-Month US Treasury Bill Index | 4.00% | 3.34% | 2.26% |
|---|
FUND STATISTICS
($ amounts in 000s)
(as of March 31, 2026)
Table SummaryNet Assets | $8,082,066 |
|---|
Number of Holdings | 1,175 |
|---|
Investment Advisory Fees | $22,643 |
|---|
Portfolio Turnover | 54% |
|---|
The investment return and principal value will fluctuate so that an investor's shares, when redeemed, may be worth more or less than the original cost. Past performance is not a good predictor of the Fund's future performance. For current performance, please visit https://advisor.vcm.com/products-fa/mutual-funds or call 800-539-3863.
Asset AllocationFootnote Reference* ^ (% of Net Assets)
(as of March 31, 2026)
Table SummaryValue | Value |
|---|
Corporate Bonds | 22.1% |
Asset-Backed Securities | 17.0% |
Collateralized Loan Obligations | 16.1% |
Collateralized Mortgage Obligations | 14.3% |
Yankee Dollars | 11.5% |
Commercial Paper | 8.7% |
Repurchase Agreements | 6.8% |
U.S. Government Agency Mortgages | 3.1% |
OtherFootnote Reference** | 2.0% |
Table Summary^ | Percentages are of the net assets of the Fund and may not equal 100%. |
|---|
* | Does not include derivative contracts except for options purchased, or other assets in excess of liabilities. |
|---|
** | Other includes the remaining asset classes which are each under 2% of the net assets of the Fund. |
|---|
| Utilize the Full Financials link below to refer to the Schedule of Portfolio Investments for a complete list of securities. |
|---|
Additional Shareholder Information
Additional information about the Fund is available on vcm.com and the adjacent QR code including:
Full Financials
Prospectus
Fund Holdings
Proxy Voting
Contact us at 800-539-3863 or visit vcm.com/contact-us.
Victory Pioneer Multi-Asset Ultrashort Income Fund
Annual Shareholder Report — March 31, 2026
The annual shareholder report contains important information about Victory Pioneer Multi-Asset Ultrashort Income Fund (the "Fund") for the period of April 1, 2025 to March 31, 2026. You can find additional information about the Fund at advisor.vcm.com/literature/ mutual-fund-prospectuses. You may also request more information by calling 800-539-3863 or visiting vcm.com/contact-us.
What were the Fund's costs for the last year?
(based on a hypothetical $10,000 investment)
Table SummaryClass Name | Costs of a $10,000 Investment | Costs paid as a percentage of a $10,000 Investment |
|---|
Class Y | $45 | 0.44% |
|---|
| | |
|---|
What affected the Fund’s performance during the last year?
Top contributors to performance:
The Fund’s exposures to collateralized loan obligations, industrials and agency mortgage-backed securities contributed to performance relative to the ICE BofA 3-Month US Treasury Bill Index (the “Index”).
The Fund’s long average U.S. duration position relative to the Index of 0.1 years contributed to performance as yields moved lower in the middle part of the period.
The Fund benefited from out of Index allocations to non-agency mortgage-backed securities, commercial mortgage-backed securities, and the financial sector.
Top detractors from performance:
The graph reflects investment growth of a hypothetical investment of $1,000,000 in the Fund. The graph and table total returns do not reflect the deduction of taxes that a shareholder would pay on Fund distributions, or redemption of shares. The total return figures include all waivers of fees. Without such fee waivers, the total returns would have been lower.
Growth of $1,000,000 Investment
Table Summary | Victory Pioneer Multi-Asset Ultrashort Income Fund Class Y - $1,343,450 | Bloomberg U.S. Aggregate Bond Index (regulatory broad based index) - $1,183,479 | ICE BofA 3-Month US Treasury Bill Index - $1,250,159 |
|---|
3/16 | $1,000,000 | $1,000,000 | $1,000,000 |
|---|
3/17 | $1,024,544 | $1,004,406 | $1,003,570 |
|---|
3/18 | $1,042,665 | $1,016,489 | $1,014,649 |
|---|
3/19 | $1,068,461 | $1,062,033 | $1,036,166 |
|---|
3/20 | $1,028,009 | $1,156,913 | $1,059,616 |
|---|
3/21 | $1,095,410 | $1,165,130 | $1,060,857 |
|---|
3/22 | $1,098,751 | $1,116,752 | $1,061,528 |
|---|
3/23 | $1,128,148 | $1,063,334 | $1,088,113 |
|---|
3/24 | $1,215,293 | $1,081,390 | $1,145,147 |
|---|
3/25 | $1,288,250 | $1,134,159 | $1,202,095 |
|---|
3/26 | $1,343,450 | $1,183,479 | $1,250,159 |
|---|
AVERAGE ANNUAL TOTAL RETURNS
(as of March 31, 2026)
Table Summary | 1 Year | 5 Year | 10 Year |
|---|
Class Y | 4.28% | 4.17% | 3.00% |
|---|
Bloomberg U.S. Aggregate Bond Index | 4.35% | 0.31% | 1.70% |
|---|
ICE BofA 3-Month US Treasury Bill Index | 4.00% | 3.34% | 2.26% |
|---|
FUND STATISTICS
($ amounts in 000s)
(as of March 31, 2026)
Table SummaryNet Assets | $8,082,066 |
|---|
Number of Holdings | 1,175 |
|---|
Investment Advisory Fees | $22,643 |
|---|
Portfolio Turnover | 54% |
|---|
The investment return and principal value will fluctuate so that an investor's shares, when redeemed, may be worth more or less than the original cost. Past performance is not a good predictor of the Fund's future performance. For current performance, please visit https://advisor.vcm.com/products-fa/mutual-funds or call 800-539-3863.
Asset AllocationFootnote Reference* ^ (% of Net Assets)
(as of March 31, 2026)
Table SummaryValue | Value |
|---|
Corporate Bonds | 22.1% |
Asset-Backed Securities | 17.0% |
Collateralized Loan Obligations | 16.1% |
Collateralized Mortgage Obligations | 14.3% |
Yankee Dollars | 11.5% |
Commercial Paper | 8.7% |
Repurchase Agreements | 6.8% |
U.S. Government Agency Mortgages | 3.1% |
OtherFootnote Reference** | 2.0% |
Table Summary^ | Percentages are of the net assets of the Fund and may not equal 100%. |
|---|
* | Does not include derivative contracts except for options purchased, or other assets in excess of liabilities. |
|---|
** | Other includes the remaining asset classes which are each under 2% of the net assets of the Fund. |
|---|
| Utilize the Full Financials link below to refer to the Schedule of Portfolio Investments for a complete list of securities. |
|---|
Additional Shareholder Information
Additional information about the Fund is available on vcm.com and the adjacent QR code including:
Full Financials
Prospectus
Fund Holdings
Proxy Voting
Contact us at 800-539-3863 or visit vcm.com/contact-us.
(b) Not applicable.
Item 2. Code of
Ethics.
As of the end of the period covered by this report, the
Registrant has adopted a code of ethics that applies to the Registrant’s
principal executive officer, principal financial officer, principal accounting
officer or controller, or persons performing similar functions, regardless of
whether these individuals are employed by the Registrant or a third party (the
“Code of Ethics”). During the period covered by this report, there were no
amendments, nor did the Registrant grant any waivers, including any implicit
waivers, from any provision of the Code of Ethics. The Code of Ethics is
attached hereto as Exhibit 19(a)(1) of this Form.
Item 3. Audit
Committee Financial Expert.
The Registrant’s Board of Trustees
has determined that the Registrant has at least one “audit committee financial
expert” (as defined in Item 3 of Form N-CSR) serving on its audit committee. Mr.
Fred J. Ricciardi is an “audit committee financial expert” and is
“independent” (as each term is defined in Item 3 of Form N-CSR).
Item 4. Principal
Accountant Fees and Services.
(a)
Audit Fees. Fees for audit services provided to the
Registrant were $94,400 and $104,850 for the fiscal years ended March 31, 2026
and 2025, respectively.
(b) Audit-Related Fees. The aggregate fees billed in each of the last
two fiscal years for audit-related services by the principal accountant that
are reasonably related to the performance of the audit of the Registrant’s
financial statements and are not reported under paragraph (a) of this item were
$0 and $0 for the fiscal years ended March 31, 2026 and 2025, respectively.
(c) Tax Fees. Fees for tax services, which consisted of
foreign tax compliance and tax consulting services, were $20,710 and $26,550 for the fiscal years
ended March 31, 2026 and 2025, respectively.
(d) All Other Fees. Fees for other services totaled $2,700 and $0 for the fiscal years ended March 31, 2026 and 2025,
respectively.
(e) (1) The Registrant’s Audit Committee has adopted Pre-Approval
Policies and Procedures. The Audit Committee must pre-approve all audit
services and non-audit services that the principal accountant provides to the
Registrant. The Audit Committee must also pre-approve any engagement of the
principal accountant to provide non-audit services to the Registrant’s
investment adviser, or any affiliate of the adviser that provides ongoing
services to the Registrant, if such non-audit services directly impact the
Registrant’s operations and financial reporting.
(2) 100% of services described in items (b) were pre-approved by
the Audit Committee pursuant to Rule 2 01(c)(7)(i)(c) of Regulation S-X.
(f) All of the work in connection with the audit of the Registrant
during the years ended March 31, 2026 and 2025 was performed by full-time
employees of the Registrant’s principal accountant.
(g) The aggregate fees billed by the principal accountant for non-audit
services to the Registrant, the Registrant’s investment adviser and any entity
controlling, controlled by, or under common control with the adviser that
provides ongoing services to the Registrant were $23,410 and $0 for the years
ended March 31, 2026 and 2025, respectively.
(h) The Registrant’s Audit Committee has considered whether the
provision of non-audit services that were rendered to the Registrant’s
investment adviser, and any entity controlling, controlled by, or under common
control with the adviser that provides ongoing services to the Registrant that
were not pre-approved pursuant to paragraph (c)(7)(ii) of Rule 2-01 of
Regulation S-X is compatible with maintaining the principal auditor’s
independence.
(i) Not applicable.
(j) Not applicable.
Item 5. Audit Committee of Listed Registrants.
Not applicable.
Item 6. Investments.
(a) Not applicable.
(b) Not applicable.
Item 7. Financial
Statements and Financial Highlights for Open-End Management Investment
Companies.
(a)
Victory
Pioneer
Fundamental
Growth
Fund
vcm.com
News,
Information
And
Education
24
Hours
A
Day,
7
Days
A
Week
The
Victory
Capital
website
gives
fund
shareholders,
prospective
shareholders,
and
investment
professionals
a
convenient
way
to
access
fund
information,
get
guidance,
and
track
fund
performance
anywhere
they
can
access
the
Internet.
The
site
includes:
Detailed
performance
records
Daily
share
prices
The
latest
fund
news
Investment
resources
to
help
you
become
a
better
investor
A
section
dedicated
to
investment
professionals
Whether
you’re
a
potential
investor
searching
for
the
fund
that
matches
your
investment
philosophy,
a
seasoned
investor
interest-
ed
in
planning
tools,
or
an
investment
professional,
vcm.com
has
what
you
seek.
Visit
us
anytime.
We’re
always
open.
This
report
is
for
the
information
of
the
shareholders
and
others
who
have
received
a
copy
of
the
currently
effective
prospectus
of
the
Fund,
managed
by
Victory
Capital
Management
Inc.
It
may
be
used
as
sales
literature
only
when
preceded
or
accompanied
by
a
current
prospectus,
which
provides
further
details
about
the
Fund.
IRA
DISTRIBUTION
WITHHOLDING
DISCLOSURE
We
generally
must
withhold
federal
income
tax
at
a
rate
of
10%
of
the
taxable
portion
of
your
distribution
and,
if
you
live
in
a
state
that
requires
state
income
tax
withholding,
at
your
state’s
tax
rate.
However,
you
may
elect
not
to
have
withholding
apply
or
to
have
income
tax
withheld
at
a
higher
rate.
Any
withholding
election
that
you
make
will
apply
to
any
subsequent
distribution
unless
and
until
you
change
or
revoke
the
election.
If
you
wish
to
make
a
withholding
election,
or
change
or
revoke
a
prior
withholding
election,
call
(800)
539-3863,
and
Form
W-4P
(OMB
No.
1545-0074
withholding
certificate
for
pension
or
annuity
payments)
will
be
electronically
sent.
If
you
do
not
have
a
withholding
election
in
place
by
the
date
of
a
distribution,
federal
income
tax
will
be
withheld
from
the
taxable
portion
of
your
distribution
at
a
rate
of
10%.
If
you
must
pay
estimated
taxes,
you
may
be
subject
to
estimated
tax
penalties
if
your
estimated
tax
payments
are
not
sufficient
and
sufficient
tax
is
not
withheld
from
your
distribution.
For
more
specific
information,
please
consult
your
tax
adviser.
•
NOT
FDIC
INSURED
•
NO
BANK
GUARANTEE
•
MAY
LOSE
VALUE
Schedule
of
Portfolio
Investments
(Form
N-CSR
Item
6)
2
Financial
Statements
(Form
N-CSR
Item
7)
Statement
of
Assets
and
Liabilities
4
Statement
of
Operations
5
Statements
of
Changes
in
Net
Assets
6
Financial
Highlights
8
Notes
to
Financial
Statements
(Form
N-CSR
Item
7)
13
Report
of
Independent
Registered
Public
Accounting
Firm
(Form
N-CSR
Item
7)
20
Supplemental
Information
(Unaudited)
Additional
Federal
Income
Tax
Information
21
Schedule
of
Portfolio
Investments
March
31,
2026
Victory
Portfolios
IV
Victory
Pioneer
Fundamental
Growth
Fund
See
notes
to
financial
statements.
Security
Description
Shares
a
Value
(000)
Common
Stocks
(99.9%)
Communication
Services
(10.4%):
Alphabet,
Inc.
,
Class
C
...................................................
543,816
$
155,999
Netflix,
Inc.
(a)
.........................................................
1,525,544
146,681
Pinterest,
Inc.
,
Class
A
(a)
.................................................
7,876,571
144,456
Spotify
Technology
SA
(a)
.................................................
155,556
75,431
The
Walt
Disney
Co.
....................................................
829,658
79,962
602,529
Communications
Equipment
(1.7%):
Motorola
Solutions,
Inc.
..................................................
226,536
98,310
Consumer
Discretionary
(19.0%):
Amazon.com,
Inc.
(a)
....................................................
2,023,068
421,344
Booking
Holdings,
Inc.
...................................................
29,110
122,562
O'Reilly
Automotive,
Inc.
(a)
...............................................
1,353,182
124,912
Ross
Stores,
Inc.
.......................................................
739,992
160,305
The
Home
Depot,
Inc.
...................................................
276,366
90,894
The
TJX
Cos.,
Inc.
......................................................
1,127,156
180,007
1,100,024
Electronic
Equipment,
Instruments
&
Components
(4.3%):
Amphenol
Corp.
,
Class
A
.................................................
1,967,832
248,636
Financials
(8.9%):
Intercontinental
Exchange,
Inc.
.............................................
1,092,425
171,816
Mastercard,
Inc.
,
Class
A
.................................................
237,869
118,854
Visa,
Inc.
,
Class
A
......................................................
735,583
222,323
512,993
Health
Care
(11.1%):
Eli
Lilly
&
Co.
.........................................................
277,715
255,434
Intuitive
Surgical,
Inc.
(a)
.................................................
320,805
147,888
Thermo
Fisher
Scientific,
Inc.
..............................................
179,316
88,139
Vertex
Pharmaceuticals,
Inc.
(a)
.............................................
336,298
150,171
641,632
Industrials
(8.5%):
Copart,
Inc.
(a)
.........................................................
1,299,401
43,140
Eaton
Corp.
PLC
.......................................................
279,558
99,990
Rockwell
Automation,
Inc.
................................................
203,434
73,008
The
Boeing
Co.
(a)
......................................................
380,429
75,717
Uber
Technologies,
Inc.
(a)
................................................
2,817,613
202,671
494,526
IT
Services
(1.4%):
Shopify,
Inc.
,
Class
A
(a)
..................................................
677,637
80,381
Materials
(0.6%):
Linde
PLC
............................................................
75,523
37,441
Semiconductors
&
Semiconductor
Equipment
(13.9%):
Advanced
Micro
Devices,
Inc.
(a)
............................................
898,178
182,716
Analog
Devices,
Inc.
....................................................
221,675
70,524
ASML
Holding
NV
,
Class
NY
..............................................
185,297
244,746
Microchip
Technology,
Inc.
................................................
2,187,067
141,307
NVIDIA
Corp.
.........................................................
932,255
162,585
801,878
Software
(12.2%):
Intuit,
Inc.
............................................................
247,177
106,874
Microsoft
Corp.
........................................................
690,757
255,698
ServiceNow,
Inc.
(a)
.....................................................
1,320,143
138,021
Synopsys,
Inc.
(a)
.......................................................
516,219
204,670
705,263
Victory
Portfolios
IV
Victory
Pioneer
Fundamental
Growth
Fund
Schedule
of
Portfolio
Investments
—
continued
March
31,
2026
See
notes
to
financial
statements.
Security
Description
Shares
a
Value
(000)
Technology
Hardware,
Storage
&
Peripherals
(7.9%):
Apple,
Inc.
...........................................................
1,806,817
$
458,552
Total
Common
Stocks
(Cost
$3,134,973)
a
a
a
5,782,165
Total
Investments
(Cost
$3,134,973)
—
99.9%
5,782,165
Other
assets
in
excess
of
liabilities
— 0.1%
4,384
NET
ASSETS
-
100.00%
$
5,786,549
At
March
31,
2026,
the
Fund's
investments
in
foreign
securities
were
8.7%
of
net
assets.
(a)
Non-income
producing
security.
PLC
—
Public
Limited
Company
Statement
of
Assets
and
Liabilities
March
31,
2026
See
notes
to
financial
statements.
(Amounts
in
Thousands,
Except
Per
Share
Amounts)
Victory
Pioneer
Fundamental
Growth
Fund
Assets:
Investments,
at
value
(Cost
$3,134,973)
$
5,782,165
Cash
3,932
Receivables:
Dividends
and
interest
898
Capital
shares
issued
4,358
Investments
sold
9,377
Prepaid
expenses
80
Total
Assets
5,800,810
Liabilities:
Payables:
Capital
shares
redeemed
9,313
Accrued
expenses
and
other
payables:
Investment
advisory
fees
3,154
Administration
fees
227
Custodian
fees
22
Transfer
agent
fees
43
Sub-Transfer
agent
fees
1,208
12b-1
fees
201
Other
accrued
expenses
93
Total
Liabilities
14,261
Commitments
and
contingencies
(Note
5
)
Net
Assets:
Capital
2,570,944
Total
accumulated
earnings
(loss)
3,215,605
Net
Assets
$
5,786,549
Net
Assets:
Class
A
$
1,223,040
Class
C
119,073
Class
R
57,975
Class
R6
825,518
Class
Y
3,560,943
Total
$
5,786,549
Shares
(unlimited
number
of
shares
authorized
with
a
par
value
of
$0.001
per
share):
Class
A
40,908
Class
C
5,232
Class
R
2,082
Class
R6
27,014
Class
Y
115,201
Total
190,437
Net
asset
value,
offering
and
redemption
price
per
share:(a)
Class
A
$
29.90
Class
C(b)
22.76
Class
R
27.84
Class
R6
30.56
Class
Y
30.91
Maximum
Sales
Charge
—
Class
A
5.75%
Maximum
offering
price
(100%/(100%-maximum
sales
charge)
of
net
asset
value
adjusted
to
the
nearest
cent)
per
share
—
Class
A
$
31.72
(a)
Per
share
amount
may
not
recalculate
due
to
rounding
of
net
assets
and/or
shares
outstanding.
(b)
Redemption
price
per
share
varies
by
length
of
time
shares
are
held.
Statement
of
Operations
For
the
Year
Ended
March
31,
2026
See
notes
to
financial
statements.
Victory
Pioneer
Fundamental
Growth
Fund
Investment
Income:
Dividends
$
42,645
Interest
37
Foreign
tax
withholding
(
247
)
Total
Income
42,435
Expenses:
Investment
advisory
fees
42,644
Administration
fees
3,086
Sub-Administration
fees
2
12b-1
fees
—
Class
A
3,572
12b-1
fees
—
Class
C
387
12b-1
fees
—
Class
R
596
Custodian
fees
77
Transfer
agent
fees
—
Class
A
90
Transfer
agent
fees
—
Class
C
13
Transfer
agent
fees
—
Class
R
4
Transfer
agent
fees
—
Class
R6
15
Transfer
agent
fees
—
Class
Y
139
Sub-Transfer
agent
fees
—
Class
A
1,254
Sub-Transfer
agent
fees
—
Class
C
1,261
Sub-Transfer
agent
fees
—
Class
R
248
Sub-Transfer
agent
fees
—
Class
Y
4,409
Trustees'
fees
289
Legal
and
audit
fees
238
State
registration
and
filing
fees
162
Other
expenses
234
Total
Expenses
58,720
Less
fees
paid
indirectly
(
62
)
Expenses
waived/reimbursed
by
Adviser
(
1,105
)
Net
Expenses
57,553
Net
Investment
Income
(Loss)
(
15,118
)
Realized/Unrealized
Gains
(Losses)
from
Investments:
Net
realized
gains
(losses)
from
investment
securities
1,075,633
Net
realized
gains
(losses)
from
in-kind
redemptions
198,622
Net
change
in
unrealized
appreciation/depreciation
on
investment
securities
(
551,163
)
Net
realized/unrealized
gains
(losses)
on
investments
723,092
Change
in
net
assets
resulting
from
operations
$
707,974
Statements
of
Changes
in
Net
Assets
See
notes
to
financial
statements.
Victory
Pioneer
Fundamental
Growth
Fund
Year
Ended
March
31,
2026
Year
Ended
March
31,
2025*
From
Investment
Activities:
Operations:
Net
Investment
Income
(Loss)
$
(
15,118
)
$
(
4,463
)
Net
realized
gains
(losses)
1,274,255
1,151,411
Net
change
in
unrealized
appreciation/depreciation
(
551,163
)
(
1,094,045
)
Change
in
net
assets
resulting
from
operations
707,974
52,903
Distributions
to
Shareholders:
Class
A
(
239,852
)
(
80,333
)
Class
C
(
31,384
)
(
12,812
)
Class
R
(
22,481
)
(
7,599
)
Class
R6
(
183,492
)
(
60,033
)
Class
Y
(
688,775
)
(
248,029
)
Change
in
net
assets
resulting
from
distributions
to
shareholders
(
1,165,984
)
(
408,806
)
Change
in
net
assets
resulting
from
capital
transactions
(
484,351
)
(
399,431
)
Change
in
net
assets
(
942,361
)
(
755,334
)
Net
Assets:
Beginning
of
period
6,728,910
7,484,244
End
of
period
$
5,786,549
$
6,728,910
*
Pioneer
Fundamental
Growth
Fund
(the
“Predecessor
Fund”)
reorganized
with
the
Fund
effective
May
2,
2025
(the
“Reorganization”).
The
Predecessor
Fund
is
the
accounting
survivor
of
the
Reorganization
and
shareholders
holding
Class
A,
Class
C,
Class
K,
Class
R,
and
Class
Y
shares
of
the
Predecessor
Fund
received
Class
A,
Class
C,
Class
R6,
Class
R,
and
Class
Y
shares
of
the
Fund,
respectively.
Statements
of
Changes
in
Net
Assets
See
notes
to
financial
statements.
Victory
Pioneer
Fundamental
Growth
Fund
Year
Ended
March
31,
2026
Year
Ended
March
31,
2025*
Capital
Transactions:
Class
A
Proceeds
from
shares
issued
$
138,579
$
168,485
Distributions
reinvested
212,505
71,349
Cost
of
shares
redeemed
(
364,817
)
(
262,778
)
Total
Class
A
$
(
13,733
)
$
(
22,944
)
Class
C
Proceeds
from
shares
issued
$
9,546
$
24,343
Distributions
reinvested
30,018
12,203
Cost
of
shares
redeemed
(
68,536
)
(
88,173
)
Total
Class
C
$
(
28,972
)
$
(
51,627
)
Class
R
Proceeds
from
shares
issued
$
9,659
$
17,844
Distributions
reinvested
22,263
7,533
Cost
of
shares
redeemed
(
86,548
)
(
26,486
)
Total
Class
R
$
(
54,626
)
$
(
1,109
)
Class
R6
Proceeds
from
shares
issued
$
132,668
$
186,254
Distributions
reinvested
175,404
56,741
Cost
of
shares
redeemed
(
440,693
)
(
240,899
)
Total
Class
R6
$
(
132,621
)
$
2,096
Class
Y
Proceeds
from
shares
issued
$
933,306
$
1,064,730
Distributions
reinvested
614,420
219,992
Cost
of
shares
redeemed
(
1,802,125
)
(
1,610,569
)
Total
Class
Y
$
(
254,399
)
$
(
325,847
)
Change
in
net
assets
resulting
from
capital
transactions
$
(
484,351
)
$
(
399,431
)
Share
Transactions:
Class
A
Issued
4,068
4,795
Reinvested
6,541
1,992
Redeemed
(
10,639
)
(
7,456
)
Total
Class
A
(
30
)
(
669
)
Class
C
Issued
353
850
Reinvested
1,210
422
Redeemed
(
2,519
)
(
3,080
)
Total
Class
C
(
956
)
(
1,808
)
Class
R
Issued
293
535
Reinvested
734
222
Redeemed
(
2,836
)
(
793
)
Total
Class
R
(
1,809
)
(
36
)
Class
R6
Issued
3,723
5,219
Reinvested
5,288
1,562
Redeemed
(
12,970
)
(
6,747
)
Total
Class
R6
(
3,959
)
34
Class
Y
Issued
25,589
29,519
Reinvested
18,303
5,991
Redeemed
(
50,242
)
(
44,531
)
Total
Class
Y
(
6,350
)
(
9,021
)
Change
in
Shares
(
13,104
)
(
11,500
)
*
Pioneer
Fundamental
Growth
Fund
(the
“Predecessor
Fund”)
reorganized
with
the
Fund
effective
May
2,
2025
(the
“Reorganization”).
The
Predecessor
Fund
is
the
accounting
survivor
of
the
Reorganization
and
shareholders
holding
Class
A,
Class
C,
Class
K,
Class
R,
and
Class
Y
shares
of
the
Predecessor
Fund
received
Class
A,
Class
C,
Class
R6,
Class
R,
and
Class
Y
shares
of
the
Fund,
respectively.
For
a
Share
Outstanding
Throughout
Each
Period
See
notes
to
financial
statements.
Victory
Pioneer
Fundamental
Growth
Fund
Class
A*
Year
Ended
March
31,
2026
Year
Ended
March
31,
2025
Year
Ended
March
31,
2024
Year
Ended
March
31,
2023
Year
Ended
March
31,
2022
Net
Asset
Value,
Beginning
of
Period
$32.70
$34.54
$26.24
$29.25
$31.88
Investment
Activities:
Net
investment
income
(loss)(a)
(0.14)
(0.08)
(0.05)(b)
(0.03)
(0.09)
Net
realized
and
unrealized
gains
(losses)
3.66
0.23
9.41
(1.92)
3.87
Total
from
Investment
Activities
3.52
0.15
9.36
(1.95)
3.78
Distributions
to
Shareholders
from:
Net
realized
gains
(6.32)
(1.99)
(1.06)
(1.06)
(6.41)
Total
Distributions
(6.32)
(1.99)
(1.06)
(1.06)
(6.41)
Net
Asset
Value,
End
of
Period
$29.90
$32.70
$34.54
$26.24
$29.25
Total
Return(c)
9.22%
(0.08)%
36.29%
(6.44)%
10.70%
Ratios
to
Average
Net
Assets:
Net
Expenses(d)
0.99%(e)
0.99%
1.01%
1.02%
1.00%
Net
Investment
Income
(Loss)
(0.39)%
(0.23)%
(0.16)%
(0.13)%
(0.26)%
Gross
Expenses(d)
1.01%(e)
0.99%
1.01%
1.02%
1.00%
Supplemental
Data:
Net
Assets
at
end
of
period
(000's)
$1,223,040
$1,338,690
$1,437,055
$1,006,630
$1,159,356
Portfolio
Turnover(f)
24%(g)
26%(g)
15%
12%
18%(g)
*
Pioneer
Fundamental
Growth
Fund
(the
“Predecessor
Fund”)
reorganized
with
the
Fund
effective
May
2,
2025
(the
“Reorganization”).
The
Predecessor
Fund
is
the
accounting
survivor
of
the
Reorganization
and
shareholders
holding
Class
A,
Class
C,
Class
K,
Class
R
and
Class
Y
shares
of
the
Predecessor
Fund
received
Class
A,
Class
C,
Class
R6,
Class
R
and
Class
Y
shares
of
the
Fund,
respectively.
(a)
Per
share
net
investment
income
(loss)
has
been
calculated
using
the
average
daily
shares
method.
(b)
The
amount
shown
for
a
share
outstanding
does
not
correspond
with
net
investment
income
on
the
Statement
of
Operations
for
the
period
due
to
timing
of
the
sales
and
repurchase
of
shares.
(c)
Assumes
reinvestment
of
all
net
investment
income
and
realized
capital
gain
distributions,
if
any,
during
the
period.
Includes
adjustments
in
accordance
with
U.S.
Generally
Accepted
Accounting
Principles
and
could
differ
from
the
reported
return.
Excludes
any
applicable
sales
charges,
including
contingent
deferred
sales
charges.
Total
return
would
be
reduced
if
sales
charges
were
taken
into
account.
(d)
Does
not
include
acquired
fund
fees
and
expenses,
if
any.
(e)
Reflects
total
annual
operating
expenses
before
reductions
of
any
expenses
paid
indirectly.
The
Fund's
expenses
paid
indirectly
decreased
the
expense
ratios
by
less
than
0.01%.
(f)
Portfolio
turnover
is
calculated
on
the
basis
of
the
Fund
as
a
whole
without
distinguishing
between
the
classes
of
shares.
(g)
Excludes
impact
of
in-kind
transactions.
For
a
Share
Outstanding
Throughout
Each
Period
Financial
Highlights
—
continued
See
notes
to
financial
statements.
Victory
Pioneer
Fundamental
Growth
Fund
Class
C*
Year
Ended
March
31,
2026
Year
Ended
March
31,
2025
Year
Ended
March
31,
2024
Year
Ended
March
31,
2023
Year
Ended
March
31,
2022
Net
Asset
Value,
Beginning
of
Period
$26.34
$28.38
$21.88
$24.76
$28.01
Investment
Activities:
Net
investment
income
(loss)(a)
(0.31)
(0.28)
(0.22)(b)
(0.18)
(0.28)
Net
realized
and
unrealized
gains
(losses)
3.05
0.23
7.78
(1.64)
3.44
Total
from
Investment
Activities
2.74
(0.05)
7.56
(1.82)
3.16
Distributions
to
Shareholders
from:
Net
realized
gains
(6.32)
(1.99)
(1.06)
(1.06)
(6.41)
Total
Distributions
(6.32)
(1.99)
(1.06)
(1.06)
(6.41)
Net
Asset
Value,
End
of
Period
$22.76
$26.34
$28.38
$21.88
$24.76
Total
Return(c)
8.43%
(0.82)%
35.28%
(7.10)%
9.91%
Ratios
to
Average
Net
Assets:
Net
Expenses(d)
1.72%(e)
1.72%
1.74%
1.74%
1.71%
Net
Investment
Income
(Loss)
(1.12)%
(0.96)%
(0.89)%
(0.86)%
(0.98)%
Gross
Expenses(d)
1.74%(e)
1.72%
1.74%
1.74%
1.71%
Supplemental
Data:
Net
Assets
at
end
of
period
(000's)
$119,073
$163,008
$226,890
$224,126
$356,963
Portfolio
Turnover(f)
24%(g)
26%(g)
15%
12%
18%(g)
*
Pioneer
Fundamental
Growth
Fund
(the
“Predecessor
Fund”)
reorganized
with
the
Fund
effective
May
2,
2025
(the
“Reorganization”).
The
Predecessor
Fund
is
the
accounting
survivor
of
the
Reorganization
and
shareholders
holding
Class
A,
Class
C,
Class
K,
Class
R
and
Class
Y
shares
of
the
Predecessor
Fund
received
Class
A,
Class
C,
Class
R6,
Class
R
and
Class
Y
shares
of
the
Fund,
respectively.
(a)
Per
share
net
investment
income
(loss)
has
been
calculated
using
the
average
daily
shares
method.
(b)
The
amount
shown
for
a
share
outstanding
does
not
correspond
with
net
investment
income
on
the
Statement
of
Operations
for
the
period
due
to
timing
of
the
sales
and
repurchase
of
shares.
(c)
Assumes
reinvestment
of
all
net
investment
income
and
realized
capital
gain
distributions,
if
any,
during
the
period.
Includes
adjustments
in
accordance
with
U.S.
Generally
Accepted
Accounting
Principles
and
could
differ
from
the
reported
return.
Excludes
any
applicable
sales
charges,
including
contingent
deferred
sales
charges.
Total
return
would
be
reduced
if
sales
charges
were
taken
into
account.
(d)
Does
not
include
acquired
fund
fees
and
expenses,
if
any.
(e)
Reflects
total
annual
operating
expenses
before
reductions
of
any
expenses
paid
indirectly.
The
Fund's
expenses
paid
indirectly
decreased
the
expense
ratios
by
less
than
0.01%.
(f)
Portfolio
turnover
is
calculated
on
the
basis
of
the
Fund
as
a
whole
without
distinguishing
between
the
classes
of
shares.
(g)
Excludes
impact
of
in-kind
transactions.
Financial
Highlights
—
continued
For
a
Share
Outstanding
Throughout
Each
Period
See
notes
to
financial
statements.
Victory
Pioneer
Fundamental
Growth
Fund
Class
R*
Year
Ended
March
31,
2026
Year
Ended
March
31,
2025
Year
Ended
March
31,
2024
Year
Ended
March
31,
2023
Year
Ended
March
31,
2022
Net
Asset
Value,
Beginning
of
Period
$30.93
$32.90
$25.13
$28.17
$31.03
Investment
Activities:
Net
investment
income
(loss)(a)
(0.26)
(0.21)
(0.15)(b)
(0.13)
(0.21)
Net
realized
and
unrealized
gains
(losses)
3.49
0.23
8.98
(1.85)
3.76
Total
from
Investment
Activities
3.23
0.02
8.83
(1.98)
3.55
Distributions
to
Shareholders
from:
Net
realized
gains
(6.32)
(1.99)
(1.06)
(1.06)
(6.41)
Total
Distributions
(6.32)
(1.99)
(1.06)
(1.06)
(6.41)
Net
Asset
Value,
End
of
Period
$27.84
$30.93
$32.90
$25.13
$28.17
Total
Return(c)
8.76%
(0.49)%
35.77%
(6.80)%
10.22%
Ratios
to
Average
Net
Assets:
Net
Expenses(d)
1.36%(e)
1.39%
1.39%
1.40%
1.40%
Net
Investment
Income
(Loss)
(0.78)%
(0.63)%
(0.53)%
(0.51)%
(0.66)%
Gross
Expenses(d)
1.38%(e)
1.39%
1.39%
1.43%
1.40%
Supplemental
Data:
Net
Assets
at
end
of
period
(000's)
$57,975
$120,377
$129,216
$96,175
$111,781
Portfolio
Turnover(f)
24%(g)
26%(g)
15%
12%
18%(g)
*
Pioneer
Fundamental
Growth
Fund
(the
“Predecessor
Fund”)
reorganized
with
the
Fund
effective
May
2,
2025
(the
“Reorganization”).
The
Predecessor
Fund
is
the
accounting
survivor
of
the
Reorganization
and
shareholders
holding
Class
A,
Class
C,
Class
K,
Class
R
and
Class
Y
shares
of
the
Predecessor
Fund
received
Class
A,
Class
C,
Class
R6,
Class
R
and
Class
Y
shares
of
the
Fund,
respectively.
(a)
Per
share
net
investment
income
(loss)
has
been
calculated
using
the
average
daily
shares
method.
(b)
The
amount
shown
for
a
share
outstanding
does
not
correspond
with
net
investment
income
on
the
Statement
of
Operations
for
the
period
due
to
timing
of
the
sales
and
repurchase
of
shares.
(c)
Assumes
reinvestment
of
all
net
investment
income
and
realized
capital
gain
distributions,
if
any,
during
the
period.
Includes
adjustments
in
accordance
with
U.S.
Generally
Accepted
Accounting
Principles
and
could
differ
from
the
reported
return.
(d)
Does
not
include
acquired
fund
fees
and
expenses,
if
any.
(e)
Reflects
total
annual
operating
expenses
before
reductions
of
any
expenses
paid
indirectly.
The
Fund's
expenses
paid
indirectly
decreased
the
expense
ratios
by
less
than
0.01%.
(f)
Portfolio
turnover
is
calculated
on
the
basis
of
the
Fund
as
a
whole
without
distinguishing
between
the
classes
of
shares.
(g)
Excludes
impact
of
in-kind
transactions.
For
a
Share
Outstanding
Throughout
Each
Period
Financial
Highlights
—
continued
See
notes
to
financial
statements.
Victory
Pioneer
Fundamental
Growth
Fund
Class
R6*
Year
Ended
March
31,
2026
Year
Ended
March
31,
2025
Year
Ended
March
31,
2024
Year
Ended
March
31,
2023
Year
Ended
March
31,
2022
Net
Asset
Value,
Beginning
of
Period
$33.20
$34.92
$26.46
$29.39
$31.94
Investment
Activities:
Net
investment
income
(loss)(a)
(0.02)
0.04
0.06
0.06
0.03(b)
Net
realized
and
unrealized
gains
(losses)
3.70
0.23
9.50
(1.93)
3.87
Total
from
Investment
Activities
3.68
0.27
9.56
(1.87)
3.90
Distributions
to
Shareholders
from:
Net
investment
income
—
—
(0.04)
—
(0.04)
Net
realized
gains
(6.32)
(1.99)
(1.06)
(1.06)
(6.41)
Total
Distributions
(6.32)
(1.99)
(1.10)
(1.06)
(6.45)
Net
Asset
Value,
End
of
Period
$30.56
$33.20
$34.92
$26.46
$29.39
Total
Return(c)
9.58%
0.27%
36.77%
(6.14)%
11.08%
Ratios
to
Average
Net
Assets:
Net
Expenses(d)
0.65%(e)
0.65%
0.66%
0.67%
0.66%
Net
Investment
Income
(Loss)
(0.05)%
0.11%
0.19%
0.22%
0.09%
Gross
Expenses(d)
0.67%(e)
0.65%
0.66%
0.67%
0.66%
Supplemental
Data:
Net
Assets
at
end
of
period
(000's)
$825,518
$1,028,274
$1,080,400
$731,131
$844,949
Portfolio
Turnover(f)
24%(g)
26%(g)
15%
12%
18%(g)
*
Pioneer
Fundamental
Growth
Fund
(the
“Predecessor
Fund”)
reorganized
with
the
Fund
effective
May
2,
2025
(the
“Reorganization”).
The
Predecessor
Fund
is
the
accounting
survivor
of
the
Reorganization
and
shareholders
holding
Class
A,
Class
C,
Class
K,
Class
R
and
Class
Y
shares
of
the
Predecessor
Fund
received
Class
A,
Class
C,
Class
R6,
Class
R
and
Class
Y
shares
of
the
Fund,
respectively.
(a)
Per
share
net
investment
income
(loss)
has
been
calculated
using
the
average
daily
shares
method.
(b)
The
amount
shown
for
a
share
outstanding
does
not
correspond
with
net
investment
income
on
the
Statement
of
Operations
for
the
period
due
to
timing
of
the
sales
and
repurchase
of
shares.
(c)
Assumes
reinvestment
of
all
net
investment
income
and
realized
capital
gain
distributions,
if
any,
during
the
period.
Includes
adjustments
in
accordance
with
U.S.
Generally
Accepted
Accounting
Principles
and
could
differ
from
the
reported
return.
(d)
Does
not
include
acquired
fund
fees
and
expenses,
if
any.
(e)
Reflects
total
annual
operating
expenses
before
reductions
of
any
expenses
paid
indirectly.
The
Fund's
expenses
paid
indirectly
decreased
the
expense
ratios
by
less
than
0.01%.
(f)
Portfolio
turnover
is
calculated
on
the
basis
of
the
Fund
as
a
whole
without
distinguishing
between
the
classes
of
shares.
(g)
Excludes
impact
of
in-kind
transactions.
Financial
Highlights
—
continued
For
a
Share
Outstanding
Throughout
Each
Period
See
notes
to
financial
statements.
Victory
Pioneer
Fundamental
Growth
Fund
Class
Y*
Year
Ended
March
31,
2026
Year
Ended
March
31,
2025
Year
Ended
March
31,
2024
Year
Ended
March
31,
2023
Year
Ended
March
31,
2022
Net
Asset
Value,
Beginning
of
Period
$33.55
$35.31
$26.76
$29.73
$32.25
Investment
Activities:
Net
investment
income
(loss)(a)
(0.05)
—(b)
0.03
0.03
(0.01)
Net
realized
and
unrealized
gains
(losses)
3.73
0.23
9.60
(1.94)
3.91
Total
from
Investment
Activities
3.68
0.23
9.63
(1.91)
3.90
Distributions
to
Shareholders
from:
Net
investment
income
—
—
(0.02)
—
(0.01)
Net
realized
gains
(6.32)
(1.99)
(1.06)
(1.06)
(6.41)
Total
Distributions
(6.32)
(1.99)
(1.08)
(1.06)
(6.42)
Net
Asset
Value,
End
of
Period
$30.91
$33.55
$35.31
$26.76
$29.73
Total
Return(c)
9.47%
0.15%
36.59%
(6.20)%
10.97%
Ratios
to
Average
Net
Assets:
Net
Expenses(d)
0.76%(e)
0.76%
0.76%
0.76%
0.76%
Net
Investment
Income
(Loss)
(0.15)%
0.01%
0.09%
0.13%
(0.03)%
Gross
Expenses(d)
0.77%(e)
0.76%
0.76%
0.76%
0.76%
Supplemental
Data:
Net
Assets
at
end
of
period
(000's)
$3,560,943
$4,078,562
$4,610,683
$3,410,508
$3,798,296
Portfolio
Turnover(f)
24%(g)
26%(g)
15%
12%
18%(g)
*
Pioneer
Fundamental
Growth
Fund
(the
“Predecessor
Fund”)
reorganized
with
the
Fund
effective
May
2,
2025
(the
“Reorganization”).
The
Predecessor
Fund
is
the
accounting
survivor
of
the
Reorganization
and
shareholders
holding
Class
A,
Class
C,
Class
K,
Class
R
and
Class
Y
shares
of
the
Predecessor
Fund
received
Class
A,
Class
C,
Class
R6,
Class
R
and
Class
Y
shares
of
the
Fund,
respectively.
(a)
Per
share
net
investment
income
(loss)
has
been
calculated
using
the
average
daily
shares
method.
(b)
Amount
is
less
than
$0.005
per
share.
(c)
Assumes
reinvestment
of
all
net
investment
income
and
realized
capital
gain
distributions,
if
any,
during
the
period.
Includes
adjustments
in
accordance
with
U.S.
Generally
Accepted
Accounting
Principles
and
could
differ
from
the
reported
return.
(d)
Does
not
include
acquired
fund
fees
and
expenses,
if
any.
(e)
Reflects
total
annual
operating
expenses
before
reductions
of
any
expenses
paid
indirectly.
The
Fund's
expenses
paid
indirectly
decreased
the
expense
ratios
by
less
than
0.01%.
(f)
Portfolio
turnover
is
calculated
on
the
basis
of
the
Fund
as
a
whole
without
distinguishing
between
the
classes
of
shares.
(g)
Excludes
impact
of
in-kind
transactions.
Notes
to
Financial
Statements
March
31,
2026
1.
Organization:
Victory
Portfolios
IV
(the
“Trust”)
is
organized as
a
Delaware
statutory
trust and is
registered
under
the
Investment
Company
Act
of
1940,
as
amended
(the
“1940
Act”),
as
an
open-end
investment
company.
The
Trust
is
comprised
of
26
funds, and
is
authorized
to
issue
an
unlimited
number
of
shares,
which
are
units
of
beneficial
interest
with
no
par
value.
The
accompanying
financial
statements
are
those
of
the
following
fund
(the
“Fund”). The
Fund
is
classified
as
diversified
under
the
1940
Act.
Each
class
of
shares
of the
Fund
has
substantially
identical
rights
and
privileges
except
with
respect
to
sales
charges,
fees
paid
under
distribution
plans,
expenses
allocable
exclusively
to
each
class
of
shares,
voting
rights
on
matters
solely
affecting
a
single
class
of
shares,
and
the
exchange
privilege
of
each
class
of
shares.
Victory
Capital
Management
Inc.
(“VCM”
or
the
“Adviser”)
is
an
indirect
wholly
owned
subsidiary
of
Victory
Capital
Holdings,
Inc.,
a
publicly
traded
Delaware
corporation,
and
a
wholly
owned
direct
subsidiary
of
Victory
Capital
Operating,
LLC.
Under
the
Trust’s
organizational
documents,
its
officers
and
trustees
are
indemnified
against
certain
liabilities
arising
out
of
the
performance
of
their
duties
to
the
Fund.
In
addition,
in
the
normal
course
of
business,
the
Fund
enters
into
contracts
with
its
vendors
and
others
that
provide
for
general
indemnifications.
The
Fund’s
maximum
exposure
under
these
arrangements
is
unknown,
as
this
would
involve
future
claims
that
may
be
made
against
the
Fund.
However,
based
on
experience,
the
Fund
expects
that
risk
of
loss
to
be
remote.
The
Fund,
which
commenced
operations
on
May
2,
2025,
is
the
successor
to
the
Pioneer
Fundamental
Growth
Fund
(the
“Predecessor
Fund”).
The
Predecessor
Fund
transferred
all
of
the
net
assets
of
Class
A,
Class
C,
Class
K,
Class
R,
and
Class
Y
shares
in
exchange
for
the
Fund’s
Class
A,
Class
C,
Class
R6,
Class
R,
and
Class
Y
shares,
respectively,
on
May
2,
2025,
pursuant
to
an
agreement
and
plan
of
reorganization
(the
“Reorganization”)
which
was
approved
by
the
shareholders
of
the
Predecessor
Fund
on April
29,
2025.
The
Reorganization
was
structured
so
that
the
transfer
of
assets
and
liabilities
did
not
result
in any
federal
tax
liability
to
the
Predecessor
Fund
or
its
shareholders.
Shareholders
holding
Class
A,
Class
C,
Class
K,
Class
R,
and
Class
Y
shares
of
the
Predecessor
Fund
received
Class
A,
Class
C,
Class
R6,
Class
R,
and
Class
Y
shares
of
the
Fund,
respectively,
in
the
Reorganization.
The
Predecessor
Fund
was
the
accounting
survivor
of
the
Reorganization.
Accordingly,
the
Predecessor
Fund’s
performance
and
financial
history
have
become
the
performance
and
financial
history
of
the
Fund.
The
Fund’s
investment
objective
is
to
seek
long-term
capital
growth.
Effective
May
2,
2025,
VCM
serves
as
the
Fund’s
investment
adviser,
succeeding
Amundi
Asset
Management
US,
Inc.
(“Amundi
US”).
On
the
same
date,
Victory
Capital
Services,
Inc.
(the
“Distributor”),
an
affiliate
of
the
Adviser,
became
the
Distributor
for
the
Fund's
shares,
succeeding
Amundi
Distributor
US,
Inc.
The
Distributor
receives
no
fee
or
other
compensation
for
these
services
(See
Note
4).
On
September
30,
2025,
the
Trust’s
Board
of
Trustees
(the
“Board”),
upon
the
recommendation
of
the
Adviser,
approved
a
change
in
the
Fund's
custodian,
sub-administrator,
sub-fund
accountant,
and
transfer
agent.
Effective
as
of
February
9,
2026, Citibank,
N.A.
serves
as
the
custodian
of
the
Fund,
Citi
Fund
Services
Ohio,
Inc.
serves
as
sub-administrator
and
sub-fund
accountant
of
the
Fund
and
FIS
Investor
Services
LLC
serves
as
transfer
agent
of
the
Fund.
2.
Significant
Accounting
Policies:
The
following
is
a
summary
of
significant
accounting
policies
followed
by
the Fund
in
the
preparation
of
its
financial
statements.
The
policies
are
in
conformity
with
U.S.
Generally
Accepted
Accounting
Principles
(“GAAP”).
The
preparation
of
financial
statements
in
accordance
with
GAAP
requires
the
Adviser
to
make
estimates
and
assumptions
that
affect
the
reported
amounts
of
assets
and
liabilities
and
disclosure
of
contingent
assets
and
liabilities
at
the
date
of
the
financial
statements
and
the
reported
amounts
of
income
and
expenses
for
the
period.
Actual
results
could
differ
from
those
estimates.
The
Fund
follows
the
specialized
accounting
and
reporting
requirements
under
GAAP
that
are
applicable
to
investment
companies
under
Accounting
Standards
Codification
Topic 946.
Investment
Valuation:
The
Fund
records
investments
at
fair
value.
Fair
value
is
defined
as
the
price
that
would
be
received
to sell
an asset
or
paid
to
transfer
a
liability
in
an
orderly
transaction
between
market
participants
at
the
measurement
date.
The
valuation
techniques
described
below
maximize
the
use
of
observable
inputs
and
minimize
the
use
of
unobservable
inputs
in
determining
fair
value.
The
inputs
used
for
valuing
the
Fund’s
investments
are
summarized
in
the
three
broad
levels
listed
below:
Level
1
—
quoted
prices
(unadjusted)
in
active
markets
for
identical
securities
Level
2
—
other
significant
observable
inputs
(including
quoted
prices
for
similar
securities,
interest
rates,
or
credit
spreads,
applicable
to
those
securities,
etc.)
Level
3
—
significant
unobservable
inputs
(including
the
Adviser’s
assumptions
in
determining
the
fair
value
of
investments)
Changes
in
valuation
techniques
may
result
in
transfers
in
or
out
of
an
assigned
level
within
the
disclosure
hierarchy.
The
inputs
or
methodologies
used
for
valuation
techniques
are
not
necessarily
an
indication
of
the
risks
associated
with
entering
into
those
investments.
The Adviser,
appointed
as
the
valuation
designee
by the
Board, has
established
the
Pricing
Committee
(the
“Committee”),
and
subject
to
Board
oversight,
the
Committee
administers
and
oversees
the
Fund’s
valuation
policies
and
procedures,
which
are
approved
by
the
Board.
Fund
(Legal
Name)
Fund
(Short
Name)
Investment
Share
Classes
Offered
Victory
Pioneer
Fundamental
Growth
Fund
Fundamental
Growth
Fund
Class
A,
Class
C,
Class
R,
Class
R6,
and
Class
Y
Notes
to
Financial
Statements
—
continued
March
31,
2026
Portfolio
securities
listed
or
traded
on
securities
exchanges,
including
Exchange-Traded
Funds
(“ETFs”),
are
valued
at
the
last
sale
price
on
the
exchange
or
system
where
the
security
is
principally
traded,
if
available,
or
at
the
Nasdaq
Official
Closing
Price.
If
there
have
been
no
sales
for
that
day
on
the
exchange
or
system,
then
a
security
is
valued
at
the
closing mean
if
available,
otherwise
the
bid
quotation
on
the
exchange
or
system
where
the
security
is
principally
traded.
In
each
of
these
situations,
valuations
are
typically
categorized
as
Level
1
in
the
fair
value
hierarchy.
Investments
in
open-end
investment
companies,
other
than
ETFs, are
valued
at their
net
asset
value
(“NAV”).
These
valuations
are
typically
categorized
as
Level
1 in
the
fair
value
hierarchy.
In
the
event
that
price
quotations
or
valuations
are
not
readily
available,
investments
are
valued
at
fair
value
in
accordance
with
procedures
established
by
and
under
the
general
supervision
and
responsibility
of
the
Board.
These
valuations
are
typically
categorized
as
Level
2
or
Level
3
in
the
fair
value
hierarchy,
based
on
the
observability
of
inputs
used
to
determine
the
fair
value.
The
effect
of
fair
value
pricing
is
that
securities
may
not
be
priced
on
the
basis
of
quotations
from
the
primary
market
in
which
they
are
traded
and
the
actual
price
realized
from
the
sale
of
a
security
may
differ
materially
from
the
fair
value
price.
Valuing
these
securities
at
fair
value
is
intended
to
cause
the
Fund’s
net
asset
value to
be
more
reliable
than
it
otherwise
would
be.
The
principal
exchanges
and
markets
for
non-U.S.
equity
securities
have
closing
times
prior
to
the
close
of
the
New
York
Stock
Exchange.
However,
the
value
of
these
securities
may
be
influenced
by
changes
in
global
markets
occurring
after
the
closing
times
of
the
local
exchanges
and
markets
up
to
the
time
the
Fund
determines
its
net
asset
value.
Consequently,
the
Fund
uses
a
fair
value
model
developed
by
an
independent
pricing
service
to
value
non-U.S.
equity
securities.
On
a
daily
basis,
the
pricing
service
recommends
changes,
based
on
a
proprietary
model,
to
the
closing
market
prices
of
each
non-U.S.
security
held
by
the
Fund
to
reflect
the
security’s
fair
value
at
the
time
the
Fund
determines
its
net
asset
value.
These
recommendations
are
applied
in
accordance
with
the
Adviser’s
(the
valuation
designee’s)
valuation
procedures.
These
valuations
are
typically
categorized
as
Level
2
in
the
fair
value
hierarchy.
A
summary
of
the
valuations
as
of
March
31,
2026, based
upon
the
three
levels
defined
above,
is
included
in
the
table
below
while
the
breakdown,
by
category,
of
investments
is
disclosed
on
the
Schedule
of
Portfolio
Investments
(amounts
in
thousands):
As
of March
31,
2026,
there
were
no
significant transfers
into/out
of
Level
3.
Real
Estate
Investment
Trusts
(“REITs”):
The
Fund
may
invest
in
REITs,
which
report
information
on
the
source
of
their
distributions
annually.
REITs
are
pooled
investment
vehicles
that
invest
primarily
in
income-producing
real
estate
or
real
estate
related
loans
or
interests
(such
as
mortgages).
Certain
distributions
received
from
REITs
will
be
reclassified
to
realized
gains
or
return
of
capital
as
estimated
by
the
Fund
based
on
calendar
year-end
information
as
it
becomes
known
or
available.
Investment
Companies:
Open-End
Funds:
The
Fund
may
invest
in
portfolios
of
open-end
investment
companies.
These
investment
companies
value
securities
in
their
portfolios
for
which
market
quotations
are
readily
available
at
their
market
values
(generally
the
last
reported
sale
price)
and
all
other
securities
and
assets
at
their
fair
value
by
the
methods
established
by
the
board
of
directors
of
the
underlying
funds.
Investment
Transactions
and
Related
Income:
Changes
in
holdings
of
investments
are
accounted
for
no
later
than
one
business
day
following
the
trade
date.
For
financial
reporting
purposes,
however,
investment
transactions
are
accounted
for
on
trade
date
or
the
last
business
day
of
the
reporting
period.
Interest
income
is
determined
on
the
basis
of
coupon
interest
accrued
and recorded
daily
using
the
effective
interest
method
which
adjusts,
where
applicable,
the
amortization
of
premiums
or
accretion
of
discounts. Dividend
income
is
recorded
on
the
ex-dividend
date.
Non-cash
dividends
included
in
income,
if
any,
are
recorded
at
the
fair
value
of
the
securities
received. Interest
income
is
recorded
daily
on
the
accrual
basis. Gains
or
losses
realized
on
sales
of
securities
are
recorded
on
the
identified
cost
basis.
Withholding
taxes
on
interest,
dividends,
and
gains
as
a
result
of
certain
investments
by
the
Fund
have
been
provided
for
in
accordance
with
each
investment’s
applicable
country’s
tax
rules
and
rates.
Federal
Income
Taxes:
The
Fund
intends
to
continue
to
qualify
as
a
regulated
investment
company
by
complying
with
the
provisions
available
to
certain
investment
companies,
as
defined
in
applicable
sections
of
the
Internal
Revenue
Code,
and
to
make
distributions
of
net
investment
income
and
net
realized
gains
sufficient
to
relieve
it
from
all,
or
substantially
all,
federal
income
taxes.
Accordingly,
no
provision
for
federal
income
taxes
is
required
in
the
financial
statements.
The
Fund
has
a
tax
year
end
of March
31.
Level
1
Level
2
Level
3
Total
Fundamental
Growth
Fund
Common
Stocks
...............................................
$
5,782,165
$
—
$
—
$
5,782,165
Total
.......................................................
$
5,782,165
$
—
$
—
$
5,782,165
Notes
to
Financial
Statements
—
continued
March
31,
2026
For
the
year
ended
March
31,
2026,
the
Fund
did
not
incur
any
income
tax,
interest,
or
penalties,
and
has
recorded
no
liability
for
net
unrecognized
tax
benefits
relating
to
uncertain
tax
positions.
Management
of
the
Fund
has
reviewed
tax
positions
taken
in
tax
years
that
remain
subject
to
examination
by
all
major
tax
jurisdictions,
including
federal
(i.e.,
the
last
four
tax
years,
which
includes
the
current
fiscal
tax
year
end).
Management
believes
that
there
is
no
tax
liability
resulting
from
unrecognized
tax
benefits
related
to
uncertain
tax
positions
taken.
Allocations:
Expenses
directly
attributable
to the
Fund
are
charged
to the
Fund,
while
expenses
that
are
attributable
to
more
than
one
fund
in
the
Trust,
or
jointly
with
an
affiliated
trust,
are
allocated
among
the
respective
funds
in
the
Trust
and/or
an
affiliated
trust
based
upon
net
assets
or
another
appropriate
basis.
Income,
expenses
(other
than
class-specific
expenses
such
as
transfer
agent
fees,
state
registration
fees,
printing
fees,
and
12b-1
fees),
and
realized
and
unrealized
gains
or
losses
on
investments
are
allocated
to
each
class
of
shares
based
on
its
relative
net
assets
on
the
date
income
is
earned
or
expenses
and
realized
and
unrealized
gains
and
losses
are
incurred.
Fees
Paid
Indirectly:
Expense
offsets
to
custody
fees
that
arise
from
credits
on
cash
balances
maintained
on
deposit
are
reflected
on
the
Statement
of
Operations,
as
applicable,
as
Fees
paid
indirectly.
3.
Purchases
and
Sales:
Purchases
and
sales
of
securities
(excluding
securities
maturing
less
than
one
year
from
acquisition)
and
purchases
and
sales
associated
with
in-
kind
transactions
for
the
year
ended
March
31,
2026,
are
included
in
the
table
below
(amounts
in
thousands).
Any
realized
gains
or
losses
from
in-kind
redemptions
are
reflected
on
the
Statement
of
Operations
as
net
realized
gains
(losses)
from
in-kind
redemptions.
4.
Affiliated
Fund
Ownership:
The
Fund
offers
shares
for
investment
by
other
funds
including
VCM
affiliated
fund-of-funds.
The
affiliated fund-of-funds
do
not
invest
in
the
underlying
funds
for
the
purpose
of
exercising
management
or
control;
however,
investments
by
affiliated fund-of-funds
within
its
principal
investment
strategies
may
represent
a
significant
portion
of
an
underlying
fund’s
assets,
and
together
with
the
investments
of
the
other
affiliated
funds-of-funds,
may
represent
a
substantial
portion
or
even
all
of
an
underlying
fund’s
net
assets.
The
affiliated
fund-of-funds’
annual
and
semi-
annual
reports
may
be
viewed
at
vcm.com.
As
of
March
31,
2026,
certain
affiliated
fund-of-funds
owned
total
outstanding
shares
of
the
Fund
as
follows:
5.
Fees
and
Transactions
with
Affiliates
and
Related
Parties:
Investment
Advisory
Fees:
Investment
advisory
services
are
provided
to
the
Fund
by
the
Adviser,
which
is
a
New
York
corporation
registered
as
an
investment
adviser
with
the
Securities
and
Exchange
Commission
(“SEC”).
Under
the
terms
of
the
Investment
Advisory
Agreement,
the
Adviser
is
entitled
to
receive
fees
accrued
daily
and
paid
monthly
at
an
annualized
rate
based
on
a
percentage
of
the
average
daily
net
assets
of the
Fund. The
rates
at
which
the
Adviser
is
paid
by the
Fund
are
included
in
the
table
below.
Amounts
incurred
and
paid
to
VCM
for
the
year ended
March
31,
2026,
are
reflected
on
the
Statement
of
Operations
as
Investment
advisory
fees.
Administration
and
Servicing
Fees:
VCM
also
serves
as
the
Fund’s
administrator
and
fund
accountant.
Under
the Administration
and
Fund
Accounting
Agreement,
VCM
is
paid
an
administration
fee
based
on
a
percentage
of
the
average
daily
net
assets
of
all
Companies
and
Funds
(as
defined
in
the
Administration
and
Fund
Excluding
U.S.
Government
Securities
and
In-Kind
Transactions
Associated
with
In-Kind
Transactions
Purchases
Sales
Purchases
Sales
Fundamental
Growth
Fund
..................................
$
1,682,993
$
3,244,029
$
—
$
323,707
Fundamental
Growth
Fund
Ownership
%
Victory
Pioneer
Solutions-Balanced
Fund
.
.
.
.
.
.
.
.
.
.
.
.
.
.
.
.
.
.
.
.
.
.
.
.
.
.
.
.
.
.
.
.
.
.
.
.
.
.
.
.
.
.
.
.
.
.
.
.
.
.
.
.
.
0.1%
Adviser
Fee
Tier
Rates
Up
to
$1
billion
Over
$1
billion
-
$7.5
billion
Over
$7.5
billion
Fundamental
Growth
Fund
.
.
.
.
.
.
.
.
.
.
.
.
.
.
.
.
.
.
.
.
.
.
.
.
.
.
.
.
.
.
.
.
.
.
.
.
.
.
.
.
.
.
.
.
0.65%,
plus
0.60%,
plus
0.55%
Notes
to
Financial
Statements
—
continued
March
31,
2026
Accounting
Agreement)
together
with
all
other
registered
investment
companies
for
which
VCM
acts
as
administrator,
and
allocating
to the
Fund
on
a
pro
rata
basis
calculated
based
on
the
Fund’s
average
daily
net
assets.
The
tiered
rates
at
which
VCM
is
paid
by
the
Fund
are
shown
in
the
table
below:
Amounts
incurred
for
the
year
ended
March
31,
2026,
are
reflected
on
the
Statement
of
Operations
as
Administration
fees.
Effective
February
9,
2026,
Citi
Fund
Services
Ohio,
Inc.
(“Citi”),
an
affiliate
of
Citibank,
acts
as
sub-administrator
and
sub-fund
accountant
to
the
Fund
pursuant
to
a
Sub-Administration
and
Sub-Fund
Accounting
Services
Agreement
between
VCM
and
Citi.
VCM
pays
Citi
a
fee
for
providing
these
services.
The
Fund
reimburses
VCM
and
Citi
for
out-of-pocket
expenses
incurred
in
providing
these
services,
including
costs
associated
with
the
Chief
Compliance
Officer,
and
implementing
new
reports
required
by
new
rules
adopted
by
the
SEC
under
the
1940
Act.
Prior
to
February
9,
2026,
BNY
Mellon
served
as
sub-administrator
and
sub-fund
accountant
for
the
Fund.
The
total
amounts
incurred
and
paid
for
through
the year
ended March
31,
2026
are
reflected
within
the
Sub-Administration
fees
on
the
Statement
of
Operations.
Transfer
Agency
Fees:
Effective February
9,
2026,
FIS
Investor
Services
LLC,
serves
as
the
Fund’s
transfer
agent.
Under
the
Transfer
Agent
Agreement,
the
Trust
pays
FIS
a
fee
for
its
services
and
reimburses
FIS
for
all
of
their
reasonable
out-of-pocket
expenses
incurred
in
providing
these
services.
Prior
to February
9,
2026,
BNY
Mellon
Investment
Servicing
(US)
Inc.
served
as
the
transfer
agent
to
the
Fund at
negotiated
rates
where
transfer
agent
fees
included
sub-transfer
agent
expenses
incurred
through
the
Fund's
omnibus
relationship
contracts.
In
addition,
the
Fund
would
reimburse
out-of-pocket
expenses
incurred
by
the
former
transfer
agent
related
to
shareholder
communications
activities
such
as
proxy
and
statement
mailings,
and
outgoing
phone
calls.
Total
transfer
agent
fees
incurred
for
the
year
ended
March
31,
2026,
are
reflected
on
the
Statement
of
Operations
as
Transfer
agent
fees.
Sub-Transfer
Agency
Fees:
Effective
February
9,
2026,
the
Fund
has
entered
into
Sub-Transfer
Agency
Agreements
with
financial
intermediaries
that
provide
recordkeeping,
processing,
shareholder
communications
and
other
services
to
customers
of
the
intermediaries
that
hold
positions
in
the
Fund
and
have
agreed
to
compensate
the
intermediaries
for
providing
those
services.
Intermediaries
transact
with
the
Fund
primarily
through
the
use
of
omnibus
accounts
on
behalf
of
their
customers
who
hold
positions
in
the
Fund.
These
services
would
have
been
provided
by
the
Fund’s
transfer
agent
and
other
service
providers
if
the
shareholders'
accounts
were
maintained
directly
at
the
Fund's
transfer
agent.
Prior
to
February
9,
2026,
BNY
Mellon
served
as
sub-transfer
agent.
Total
sub-transfer
agent
fees
incurred
for
the year
ended
March
31,
2026,
are
reflected
on
the
Statement
of
Operations
as
Sub-Transfer
agent
fees.
Distributor/Underwriting
Services:
Victory
Capital
Services, Inc.
(the
“Distributor”),
an
affiliate
of
the
Adviser,
serves
as
Distributor
for
the
continuous
offering
of
the
shares
of
the
Fund
pursuant
to
a
Distribution
Agreement
between
the
Distributor
and
the
Trust.
Pursuant
to
the
Distribution
and
Services
Plan
adopted
in
accordance
with
Rule
12b-1
under
the
1940
Act,
the
Distributor
may
receive
a
monthly
distribution
and
service
fee
for
Class
A,
Class
C
and
Class
R,
at
an
annual
rate
of
up
to
0.25%,
1.00%,
and
0.50%,
respectively,
of
the
average
daily
net
assets. Amounts
incurred
and
paid
to
the
Distributor
for
the year
ended
March
31,
2026, are
reflected
on
the
Statement
of
Operations
as
12b-1
fees.
In
addition,
the
Distributor
is
entitled
to
receive
commissions
in
connection
with
sales
of
Class
A
and
Class
C.
For
the
year
ended
March
31,
2026,
the
Distributor
received
$42
thousand
from
commissions
earned
in
connection
with
sales
of
Class
A.
Other
Fees:
Effective
February
9,
2026,
Citibank
serves
as
the
Fund's
custodian.
The
Fund
pays
Citibank
a
fee
for
providing
these
services.
Prior
to
February
9,
2026,
BNY
Mellon
served
as
the
Fund's
custodian. Total
custodian
fees
incurred
for
the
year ended
March
31,
2026, are
reflected
on
the
Statement
of
Operations
as
Custodian
fees.
Sidley
Austin
LLP
provides
legal
services
to
the
Trust.
The
Adviser
has
entered
into
an
expense
limitation
agreement
with the Fund.
Under
the
terms
of
the
agreement,
the
Adviser
has
agreed
to
waive
fees
or
reimburse
certain
expenses
to
the
extent
that
ordinary
operating
expenses
incurred
by
certain
classes
of
the
Fund
in
any
fiscal
year
exceed
the
expense limits
for
such
classes
of the
Fund.
Such
excess
amounts
will
be
the
liability
of
the
Adviser. Acquired
fund
fees
and
expenses,
interest,
taxes,
brokerage
commissions,
other
expenditures which
are
capitalized
in
accordance
with
GAAP,
and
other
extraordinary
expenses
not
incurred
in
the
ordinary
course
of the
Fund’s
business
are
excluded
from
the
expense
limits.
As
of
March
31,
2026,
the
expense
limits
(excluding
voluntary
waivers) were
as
follows:
Annual
Charge
Up
to
$15
billion
Over
$15
billion
-
$30
billion
Over
$30
billion
-
$85
billion
Over
$85
billion
Fundamental
Growth
Fund
.
.
.
.
.
.
.
.
.
.
.
.
.
.
.
.
.
.
.
.
.
.
.
.
.
.
.
.
.
.
.
0.08%,
plus
0.05%,
plus
0.04%,
plus
0.03%
Notes
to
Financial
Statements
—
continued
March
31,
2026
Under
the
terms
of
the
expense
limitation
agreement,
the
Fund
has
agreed
to
repay
fees
and
expenses
that
were
waived
or
reimbursed
by
the
Adviser
for
a
period
of
up
to two
years
(twenty-four
(24)
months)
after
the
waiver
or
reimbursement
took
place,
subject
to
the
lesser
of
any
operating
expense limits
in
effect
at
the
time
of:
(a)
the
original
waiver
or
expense
reimbursement;
or
(b)
the
recoupment,
after
giving
effect
to
the
recoupment
amount.
The
Fund
has
not
recorded
any
amounts
available
to
be
repaid
to
the
Adviser
as
a
commitment
and
contingency
liability
due
to
an
assessment
that
such
repayments
are
not
probable
at
March
31,
2026.
As
of March
31,
2026,
the
following amounts
in
the
table
below
represent
the
fiscal
year-end
in
which
the 24-month recoupment
period
expires.
These
amounts
are
available
to
be
repaid
to
the
Adviser
(amounts
in
thousands):
The
Adviser
may
voluntarily
waive
or
reimburse
additional
fees
and
expenses
or
make
other
payments to
assist
the
Fund
in
maintaining
competitive
expense
ratios.
Except
as
noted
above,
voluntary
waivers
and
reimbursements
applicable
to
the
Fund are
not
available
to
be
recouped
at
a
future
time.
There
were
no
voluntary
waivers
or
reimbursements
for
the year
ended
March
31,
2026.
Certain
officers
and/or
interested
trustees
of
the
Fund
are
also
officers
and/or
employees
of
the
Adviser,
administrator,
fund
accountant,
legal
counsel,
and
Distributor.
6.
Risks:
The
following
describes
principal
risks
that
you
may
assume
as
an
investor
in
the
Fund.
The
Fund’s
prospectus
contains
unaudited
information
regarding
the
Fund’s
principal
risks.
Please
refer
to
that
document
when
considering
the
Fund’s
principal
risks.
The
Fund
may
be
subject
to
other
risks
in
addition
to
these
identified
risks.
Market
Risk
—
The
market
prices
of
securities
or
other
assets
held
by
the
Fund
may
go
up
or
down,
sometimes
rapidly
or
unpredictably,
due
to
general
market
conditions,
such
as
real
or
perceived
adverse
economic,
political,
or
regulatory
conditions,
political
instability,
recessions,
inflation,
changes
in
interest
or
currency
rates,
lack
of
liquidity
in
the
markets,
the
spread
of
infectious
illness
or
other
public
health
issues,
weather
or
climate
events,
armed
conflict,
market
disruptions
caused
by
tariffs,
trade
disputes,
sanctions
or
other
government
actions,
or
other
factors
or
adverse
investor
sentiment.
If
the
market
prices
of
the
Fund’s
securities
and
assets
fall,
the
value
of
your
investment
will
go
down.
A
change
in
financial
condition
or
other
event
affecting
a
single
issuer
or
market
may
adversely
impact
securities
markets
as
a
whole.
Growth Style Risk
— The
Fund’s
investments
may
not
have
the
growth
potential
originally
expected.
Growth
stocks
may
fall
out
of
favor
with
investors
and
underperform
the
overall
equity
market.
Growth
securities
may
also
be
more
volatile
than
other
investments
because
they
often
do
not
pay
dividends.
The
values
of
growth
securities
tend
to
go
down
when
interest
rates
rise
because
the
rise
in
interest
rates
reduces
the
current
value
of
future
cash
flows.
Portfolio
Selection Risk
—
The
Adviser’s
judgment
about
a
particular
security
or
issuer,
or
about
the
economy
or
a
particular
sector,
region,
market
segment
or
industry,
or
about
an
investment
strategy,
may
prove
to
be
incorrect
or
may
not
produce
the
desired
results,
or
there
may
be
imperfections,
errors
or
limitations
in
the
models,
tools
and
information
used
by
the
Adviser.
Issuer Focus
Risk
—
The
Fund
may
invest
in
fewer
than
40
securities,
and
as
a
result,
the
Fund’s
performance
may
be
more
volatile
than
the
performance
of
funds
holding
more
securities.
Market
Segment Risk
—
To
the
extent
the
Fund
emphasizes,
from
time
to
time,
investments
in
a
market
segment,
the
Fund
will
be
subject
to
a
greater
degree
to
the
risks
particular
to
that
segment,
and
may
experience
greater
market
fluctuation
than
a
fund
without
the
same
focus.
Industries
in
the
technology
segment,
such
as
information
technology,
communications
equipment,
computer
hardware
and
software,
and
office
and
scientific
equipment,
are
generally
subject
to
risks
of
rapidly
evolving
technology,
short
product
lives,
rates
of
corporate
expenditures,
falling
prices
and
profits,
competition
from
new
market
entrants,
and
general
economic
conditions.
They
are
also
heavily
dependent
on
intellectual
property
rights
and
may
be
adversely
affected
by
the
loss
or
impairment
of,
or
inability
to
enforce,
those
rights.
7.
Borrowing
and
Interfund
Lending:
Line
of
Credit:
The Trust
participates
in
a
short-term
demand
note
“Line
of
Credit”
agreement
with
Citibank.
Under
the
agreement
with
Citibank
the
Trust
may
borrow
up
to
$250
million.
The
purpose
of
the
Line
of
Credit
is
to
meet
temporary
or
emergency
cash
needs.
For
the
period
from
September
1,
2025,
through
January
27,
2026,
Citibank
received
an
annual
commitment
fee
of
0.20%
for
providing
the
Line
of
Credit.
Effective
January
28,
2026,
the
agreement
was
renewed
with
a
termination
date
of
June
22,
2026,
and
the
annual
commitment
fee
changed
to
0.275%.
Each
fund
In
effect
until
May
2,
2028
Class
A
Class
C
Class
R
Class
R6
Class
Y
Fundamental
Growth
Fund
.
.
.
.
.
.
.
.
.
.
.
.
.
.
.
.
.
.
.
.
.
.
.
0.99%
1.72%
1.39%
0.65%
0.76%
March
31,
2028
Total
Fundamental
Growth
Fund
......................................................................
$
1,105
$
1,105
Notes
to
Financial
Statements
—
continued
March
31,
2026
in
the
Trust
paid
a
pro-rata
portion
of
the
commitment
fees
plus
an
interest
on
amounts
borrowed.
Interest
is
based
on
the
one-month
Secured
Overnight
Financing
Rate
plus
1.00
percent.
Interest
charged
to
the
Fund
during
the
period,
if
applicable,
is
reflected
on
the
Statement
of
Operations
under
Line
of
credit
fees.
The
Fund
had
no
borrowings
under the
Line
of
Credit
agreement
during
the
year
ended
March
31,
2026.
Interfund
Lending:
The
Trust
and
the
Adviser
rely
on
an
exemptive
order
granted
by
the
SEC
in
March
2017
(the
“Order”),
permitting
the
establishment
and
operation
of
an
Interfund
Lending
Facility
(the
“Facility”).
The
Facility
allows
the
Fund
to
directly
lend
and
borrow
money
to
or
from
any
other
fund
in
the
Victory
Funds
Complex
that
is
permitted
to
participate
in
the
Facility,
relying
upon
the
Order
at
rates
beneficial
to
both
the
borrowing
and
lending
funds.
Advances
under
the
Facility
are
allowed
for
temporary
or
emergency
purposes,
including
the
meeting
of
redemption
requests
that
otherwise
might
require
the
untimely
disposition
of
securities,
and
are
subject
to
each
Fund’s
borrowing
restrictions.
The
interfund
loan
rate
is
determined,
as
specified
in
the
Order,
by
averaging
the
current
repurchase
agreement
rate
and
the
current
bank
loan
rate.
As
a
Borrower
(as
defined
in
the
Order),
interest
charged
to
the
Fund,
if
any,
during
the
period,
is
reflected
on
the
Statement
of
Operations
under
Interfund
lending
fees.
As
a
Lender
(as
defined
in
the
Order),
interest
earned
by
the
Fund,
if
any,
during
the
period,
is
reflected
on
the
Statement
of
Operations
under
Interfund
lending.
The
Fund
did
not
utilize
or
participate
in
the
Facility
during
the
year
ended
March
31,
2026.
8.
Federal
Income
Tax
Information:
The
Fund
intends
to
distribute
any
net
investment
income
annually.
Distributable
net
realized
gains,
if
any,
are
declared
and
paid
at
least
annually.
The
amounts
of
dividends
from
net
investment
income
and
distributions
from
net
realized
gains
(collectively,
distributions
to
shareholders)
are
determined
in
accordance
with
federal
income
tax
regulations,
which
may
differ
from
GAAP.
To
the
extent
these
“book/tax”
differences
are
permanent
in
nature
(e.g.,
net
operating
loss
and
distribution
reclassification),
such
amounts
are
reclassified
within
the
components
of
net
assets
based
on
their
federal
tax-basis
treatment;
temporary
differences
(e.g.,
wash
sales)
do
not
require
reclassification.
To
the
extent
dividends
and
distributions
exceed
net
investment
income
and
net
realized
gains
for
tax
purposes,
they
are
reported
as
distributions
of
capital.
Net
investment
losses
incurred
by
the
Fund
may
be
reclassified
as
an
offset
to
capital
on
the
accompanying
Statement
of
Assets
and
Liabilities.
As
of
March
31,
2026,
on
the
Statement
of
Assets
and
Liabilities,
as
a
result
of
permanent
book-to-tax
differences,
reclassification
adjustments
were
as
follows
(amounts
in
thousands):
The
tax
character
of
distributions
paid
during
the
tax
years
ended,
as
noted
below,
were
as
follows
(total
distributions
paid
may
differ
from
the
Statements
of
Changes
in
Net
Assets
because,
for
tax
purposes,
dividends
are
recognized
when
actually
paid)
(amounts
in
thousands):
As
of
March
31,
2026,
the
components
of
accumulated
earnings
(loss)
on
a
tax
basis
were
as
follows
(amounts
in
thousands):
*
The
difference
between
the
book-basis
and
tax-basis
unrealized
appreciation
(depreciation)
is
attributable
primarily
to
tax
deferral
of
losses
on
wash
sales.
Total
Accumulated
Earnings
(Loss)
Capital
Fundamental
Growth
Fund
....................................................................
$
(198,622)
$
198,622
Year
Ended
March
31,
2026
Distributions
Paid
From:
Ordinary
Income
Net
Long-Term
Capital
Gains
Total
Distributions
Paid
Fundamental
Growth
Fund
...................................................
$
22,234
$
1,143,750
$
1,165,984
Year
Ended
March
31,
2025
Distributions
Paid
From:
Ordinary
Income
Net
Long-Term
Capital
Gains
Total
Distributions
Paid
Fundamental
Growth
Fund
...................................................
$
8,175
$
400,631
$
408,806
Undistributed
Ordinary
Income
Undistributed
Long-Term
Capital
Gains
Accumulated
Earnings
(Loss)
Unrealized
Appreciation
(Depreciation)*
Total
Accumulated
Earnings
(Loss)
Fundamental
Growth
Fund
...........................
$
20,777
$
576,145
$
596,922
$
2,618,683
$
3,215,605
Notes
to
Financial
Statements
—
continued
March
31,
2026
As
of March
31,
2026,
the
Fund
had
no
capital
loss
carryforward
for
federal
income
tax
purposes.
As
of March
31,
2026,
the
cost
basis
for
federal
income
tax
purposes,
gross
unrealized
appreciation,
gross
unrealized
depreciation,
and
net
unrealized
appreciation
(depreciation)
for
investments were
as
follows
(amounts
in
thousands):
9.
Segment
Reporting:
The
Adviser’s
Management
Committee
acts
as
the
Fund’s
Chief
Operating
Decision
Maker
(“CODM”).
The
Fund
represents
a
single
operating
segment,
as
the
CODM
monitors
the
operating
results
of
the
Fund
as
a
whole
and
the
Fund’s
long-term
strategic
asset
allocation
is
predetermined
in
accordance
with
the
Fund's
single
investment
objective.
The
financial
information
in
the
form
of
the
Fund’s
portfolio
composition,
total
returns,
expense
ratios,
and
changes
in
net
assets,
which
are
used
by
the
CODM
to
assess
the
segment’s
performance
versus
the
Fund’s
comparative
benchmarks
and
to
make
resource
allocation
decisions
for
the
Fund’s
single
segment,
is
consistent
with
that
presented
within
the
Fund’s
financial
statements.
Segment
assets
are
reflected
on
the
accompanying
Statement
of
Assets
and
Liabilities
as
“total
assets”
and
significant
segment
expenses
are
listed
on
the
accompanying
Statement
of
Operations.
Cost
of
Investments
for
Federal
Tax
Purposes
Gross
Unrealized
Appreciation
Gross
Unrealized
Depreciation
Net
Unrealized
Appreciation
(Depreciation)
Fundamental
Growth
Fund
.............................
$
3,163,482
$
2,887,119
$
(268,436)
$
2,618,683
Report
of
Independent
Registered
Public
Accounting
Firm
To
the
Board
of
Trustees
of
Victory
Portfolios
IV
and
the
Shareholders
of
Victory
Pioneer
Fundamental
Growth
Fund:
Opinion
on
the
Financial
Statements
and
Financial
Highlights
We
have
audited
the
accompanying
statement
of
assets
and
liabilities
of
Victory
Pioneer
Fundamental
Growth
Fund
(the
“Fund”)
(one
of
the
funds
constituting
Victory
Portfolios
IV),
including
the
schedule
of
investments,
as
of
March
31,
2026,
the
related
statement
of
operations
for
the
year
then
ended,
statements
of
changes
in
net
assets
for
each
of
the
two
years
in
the
period
then
ended
and
financial
highlights
for
each
of
the
three
years
in
the
period
then
ended,
and
the
related
notes
(collectively
referred
to
as
the
"financial
statements
and
financial
highlights").
In
our
opinion,
the
financial
statements
and
financial
highlights
present
fairly,
in
all
material
respects,
the
financial
position
of
the
Fund
as
of
March
31,
2026,
and
the
results
of
its
operations
for
the
year
then
ended,
the
changes
in
its
net
assets
for
each
of
the
two
years
in
the
period
then
ended
and
the
financial
highlights
for
each
of
the
three
years
in
the
period
then
ended
in
conformity
with
accounting
principles
generally
accepted
in
the
United
States
of
America.
The
financial
highlights
for
the
years
ended
March
31,
2023
and
2022
were
audited
by
other
auditors.
Those
auditors
expressed
an
unqualified
opinion
on
those
financial
statements
and
financial
highlights
in
their
report
dated
May
25,
2023.
Basis
for
Opinion
These
financial
statements
and
financial
highlights
are
the
responsibility
of
the
Fund’s
management.
Our
responsibility
is
to
express
an
opinion
on
the
Fund’s
financial
statements
and
financial
highlights
based
on
our
audits.
We
are
a
public
accounting
firm
registered
with
the
Public
Company
Accounting
Oversight
Board
(United
States)
(PCAOB)
and
are
required
to
be
independent
with
respect
to
the
Fund
in
accordance
with
the
U.S.
federal
securities
laws
and
the
applicable
rules
and
regulations
of
the
Securities
and
Exchange
Commission
and
the
PCAOB.
We
conducted
our
audits
in
accordance
with
the
standards
of
the
PCAOB.
Those
standards
require
that
we
plan
and
perform
the
audit
to
obtain
reasonable
assurance
about
whether
the
financial
statements
and
financial
highlights
are
free
of
material
misstatement,
whether
due
to
error
or
fraud.
The
Fund
is
not
required
to
have,
nor
were
we
engaged
to
perform,
an
audit
of
its
internal
control
over
financial
reporting.
As
part
of
our
audits,
we
are
required
to
obtain
an
understanding
of
internal
control
over
financial
reporting
but
not
for
the
purpose
of
expressing
an
opinion
on
the
effectiveness
of
the
Fund’s
internal
control
over
financial
reporting.
Accordingly,
we
express
no
such
opinion.
Our
audits
included
performing
procedures
to
assess
the
risks
of
material
misstatement
of
the
financial
statements
and
financial
highlights,
whether
due
to
error
or
fraud,
and
performing
procedures
that
respond
to
those
risks.
Such
procedures
included
examining,
on
a
test
basis,
evidence
regarding
the
amounts
and
disclosures
in
the
financial
statements
and
financial
highlights.
Our
audits
also
included
evaluating
the
accounting
principles
used
and
significant
estimates
made
by
management,
as
well
as
evaluating
the
overall
presentation
of
the
financial
statements
and
financial
highlights.
Our
procedures
included
confirmation
of
securities
owned
as
of
March
31,
2026,
by
correspondence
with
the
custodian
and
brokers;
when
replies
were
not
received
from
brokers,
we
performed
other
auditing
procedures.
We
believe
that
our
audits
provide
a
reasonable
basis
for
our
opinion.
DELOITTE
&
TOUCHE
LLP
Boston,
Massachusetts
May
27,
2026
We
have
served
as
the
auditor
of
one
or
more
of
the
Victory
Pioneer
investment
companies
since
2024.
Supplemental
Information
March
31,
2026
Additional
Federal
Income
Tax
Information
For
the
fiscal
year
ended
March
31,
2026,
the
Fund
hereby
designates
the
maximum
amount
allowable
of
its
net
taxable
income
as
qualified
dividends
taxed
at
individual
net
capital
gain
rates.
Shareholders
will
be
notified
via
IRS
Form
1099
of
the
amounts
for
use
in
preparing
their
income
tax
return.
Dividends
qualified
for
corporate
dividends
received
deductions
of
70%.
For
the
year
ended
March
31,
2026,
the
Fund
designated
short-term
capital
gain
distributions
in
the
amount
of
$22,234 thousands.
For
the
year
ended
March
31,
2026,
the Fund
designated
long-term
capital
gain
distributions
in
the
amount
of
$1,143,750 thousands.
Victory
Funds
P.O.
Box
182593
Columbus,
Ohio
43218-2593
Visit
our
website
at:
vcm.com
Call
Victory
at:
(800)
539-3863
Victory
Pioneer
Multi-Asset
Ultrashort
Income
Fund
vcm.com
News,
Information
And
Education
24
Hours
A
Day,
7
Days
A
Week
The
Victory
Capital
website
gives
fund
shareholders,
prospective
shareholders,
and
investment
professionals
a
convenient
way
to
access
fund
information,
get
guidance,
and
track
fund
performance
anywhere
they
can
access
the
Internet.
The
site
includes:
Detailed
performance
records
Daily
share
prices
The
latest
fund
news
Investment
resources
to
help
you
become
a
better
investor
A
section
dedicated
to
investment
professionals
Whether
you’re
a
potential
investor
searching
for
the
fund
that
matches
your
investment
philosophy,
a
seasoned
investor
interest-
ed
in
planning
tools,
or
an
investment
professional,
vcm.com
has
what
you
seek.
Visit
us
anytime.
We’re
always
open.
This
report
is
for
the
information
of
the
shareholders
and
others
who
have
received
a
copy
of
the
currently
effective
prospectus
of
the
Fund,
managed
by
Victory
Capital
Management
Inc.
It
may
be
used
as
sales
literature
only
when
preceded
or
accompanied
by
a
current
prospectus,
which
provides
further
details
about
the
Fund.
IRA
DISTRIBUTION
WITHHOLDING
DISCLOSURE
We
generally
must
withhold
federal
income
tax
at
a
rate
of
10%
of
the
taxable
portion
of
your
distribution
and,
if
you
live
in
a
state
that
requires
state
income
tax
withholding,
at
your
state’s
tax
rate.
However,
you
may
elect
not
to
have
withholding
apply
or
to
have
income
tax
withheld
at
a
higher
rate.
Any
withholding
election
that
you
make
will
apply
to
any
subsequent
distribution
unless
and
until
you
change
or
revoke
the
election.
If
you
wish
to
make
a
withholding
election,
or
change
or
revoke
a
prior
withholding
election,
call
(800)
539-3863,
and
Form
W-4P
(OMB
No.
1545-0074
withholding
certificate
for
pension
or
annuity
payments)
will
be
electronically
sent.
If
you
do
not
have
a
withholding
election
in
place
by
the
date
of
a
distribution,
federal
income
tax
will
be
withheld
from
the
taxable
portion
of
your
distribution
at
a
rate
of
10%.
If
you
must
pay
estimated
taxes,
you
may
be
subject
to
estimated
tax
penalties
if
your
estimated
tax
payments
are
not
sufficient
and
sufficient
tax
is
not
withheld
from
your
distribution.
For
more
specific
information,
please
consult
your
tax
adviser.
•
NOT
FDIC
INSURED
•
NO
BANK
GUARANTEE
•
MAY
LOSE
VALUE
Schedule
of
Portfolio
Investments
(Form
N-CSR
Item
6)
2
Financial
Statements
(Form
N-CSR
Item
7)
Statement
of
Assets
and
Liabilities
35
Statement
of
Operations
36
Statements
of
Changes
in
Net
Assets
37
Financial
Highlights
39
Notes
to
Financial
Statements
(Form
N-CSR
Item
7)
43
Report
of
Independent
Registered
Public
Accounting
Firm
(Form
N-CSR
Item
7)
53
Supplemental
Information
(Unaudited)
Additional
Federal
Income
Tax
Information
54
Schedule
of
Portfolio
Investments
March
31,
2026
Victory
Portfolios
IV
Victory
Pioneer
Multi-Asset
Ultrashort
Income
Fund
See
notes
to
financial
statements.
Security
Description
Principal
Amount
(000)
a
Value
(000)
Asset-Backed
Securities
(17.0%)
ABS
Auto
(3.6%):
ACM
Auto
Trust
.......................................................
Series
2024-2A,
Class
A,
6.06%,
2/20/29,
Callable
8/20/26
@
100(a)
..............
$
84
$
84
Series
2025-1A,
Class
A,
5.38%,
6/20/29,
Callable
10/20/26
@
100(a)
.............
2,671
2,671
Alloya
Auto
Receivables
Trust,
Series
2025-1A,
Class
A2,
4.78%,
10/25/27(a)
...........
3,075
3,078
Ally
Bank
Auto
Credit-Linked
Notes,
Series
2025-B,
Class
E,
6.16%,
9/15/33,
Callable
10/15/28
@
100(a)
..................................................
3,113
3,122
American
Credit
Acceptance
Receivables
Trust
.................................
Series
2023-3,
Class
D,
6.82%,
10/12/29,
Callable
4/12/27
@
100(a)
..............
13,080
13,332
Series
2023-4,
Class
C,
6.99%,
9/12/30,
Callable
6/12/27
@
100(a)
...............
2,113
2,125
Series
2026-1,
Class
A,
4.16%,
7/12/29,
Callable
6/12/29
@
100(a)
...............
12,799
12,790
American
Heritage
Auto
Receivables
Trust,
Series
2024-1A,
Class
A2,
4.83%,
3/15/28(a)
...
637
638
Arivo
Acceptance
Auto
Loan
Receivables
Trust
.................................
Series
2024-1A,
Class
A,
6.46%,
4/17/28(a)
................................
1,407
1,412
Series
2025-1A,
Class
A2,
4.92%,
5/15/29(a)
...............................
5,402
5,418
AutoNation
Finance
Trust,
Series
2026-1A,
Class
A1,
3.93%,
2/11/27(a)
...............
12,053
12,052
Avid
Automobile
Receivables
Trust,
Series
2021-1,
Class
F,
5.16%,
10/16/28,
Callable
4/15/26
@
100(a)
.........................................................
1,600
1,485
Avis
Budget
Rental
Car
Funding
AESOP
LLC
..................................
Series
2021-2A,
Class
D,
4.08%,
2/20/28,
Callable
2/20/27
@
100(a)
..............
3,285
3,248
Series
2023-2A,
Class
D,
7.26%,
10/20/27(a)
...............................
5,750
5,771
Series
2023-3A,
Class
D,
7.32%,
2/20/28(a)
................................
2,720
2,741
Series
2023-4A,
Class
D,
7.31%,
6/20/29(a)
................................
6,240
6,329
Bayview
Opportunity
Master
Fund
Trust,
Series
2024-CAR1F,
Class
A,
6.97%,
7/29/32,
Callable
8/28/26
@
100(a)
............................................
1,763
1,765
Bayview
Opportunity
Master
Fund
VII
LLC
....................................
Series
2024-CAR1,
Class
A,
4.76%
(SOFR30A+110bps),
12/26/31,
Callable
6/25/27
@
100(a)(b)
.........................................................
2,801
2,809
Series
2024-CAR1,
Class
C,
5.16%
(SOFR30A+150bps),
12/26/31,
Callable
6/25/27
@
100(a)(b)
.........................................................
659
661
BOF
URSA
VI
Funding
Trust
I
.............................................
Series
2023-CAR1,
Class
A2,
5.54%,
10/27/31,
Callable
3/25/27
@
100(a)
..........
701
706
Series
2023-CAR2,
Class
A2,
5.54%,
10/27/31,
Callable
4/25/27
@
100(a)
..........
161
162
BOF
VII
Al
Funding
Trust
I,
Series
2023-CAR3,
Class
A2,
6.29%,
7/26/32,
Callable
9/25/27
@
100(a)
.........................................................
2,904
2,947
Carvana
Auto
Receivables
Trust,
Series
2022-N1,
Class
D,
4.13%,
12/11/28,
Callable
1/10/28
@
100(a)
.........................................................
861
854
Chesapeake
Funding
II
LLC
...............................................
Series
2023-1A,
Class
A2,
4.92%
(SOFR30A+125bps),
5/15/35,
Callable
5/15/26
@
100(a)(b)
.........................................................
802
803
Series
2023-2A,
Class
A1,
6.16%,
10/15/35,
Callable
10/15/26
@
100(a)
...........
1,238
1,246
Series
2023-2A,
Class
A2,
4.77%
(SOFR30A+110bps),
10/15/35,
Callable
10/15/26
@
100(a)(b)
.........................................................
1,871
1,873
Series
2024-1A,
Class
A2,
4.44%
(SOFR30A+77bps),
5/15/36,
Callable
8/15/27
@
100(a)(b)
.........................................................
1,235
1,236
Drive
Auto
Receivables
Trust,
Series
2025-1,
Class
A2,
4.87%,
8/15/28
................
2,790
2,792
Exeter
Automobile
Receivables
Trust
.........................................
Series
2022-1A,
Class
E,
5.02%,
10/15/29,
Callable
7/15/27
@
100(a)
.............
21,440
21,205
Series
2022-6A,
Class
D,
8.03%,
4/6/29,
Callable
12/15/27
@
100
................
1,382
1,410
Series
2025-3A,
Class
A2,
4.83%,
1/18/28
.................................
2,993
2,995
FCCU
Auto
Receivables
Trust,
Series
2025-1A,
Class
A3,
4.85%,
6/17/30,
Callable
4/15/29
@
100(a)
...........................................................
10,000
10,067
FHF
Issuer
Trust
.......................................................
Series
2023-2A,
Class
A2,
6.79%,
10/15/29,
Callable
11/15/27
@
100(a)
...........
1,264
1,275
Series
2024-3A,
Class
B,
5.04%,
2/17/31,
Callable
2/15/28
@
100(a)
..............
2,250
2,192
FHF
Trust,
Series
2023-1A,
Class
A2,
6.57%,
6/15/28,
Callable
10/15/26
@
100(a)
........
595
597
Flagship
Credit
Auto
Trust,
Series
2024-1,
Class
A2,
5.64%,
3/15/28(a)
................
284
284
GLS
Auto
Receivables
Issuer
Trust
..........................................
Series
2022-3A,
Class
D,
6.42%,
6/15/28,
Callable
10/15/27
@
100(a)
.............
3,134
3,160
Series
2023-1A,
Class
E,
11.42%,
3/15/30,
Callable
3/15/28
@
100(a)
.............
5,540
5,951
Series
2023-2A,
Class
A2,
6.37%,
6/15/28(a)
...............................
351
351
Series
2023-4A,
Class
C,
6.65%,
8/15/29,
Callable
6/15/28
@
100(a)
..............
3,190
3,219
Victory
Portfolios
IV
Victory
Pioneer
Multi-Asset
Ultrashort
Income
Fund
Schedule
of
Portfolio
Investments
—
continued
March
31,
2026
See
notes
to
financial
statements.
Security
Description
Principal
Amount
(000)
a
Value
(000)
Series
2024-1A,
Class
D,
6.43%,
1/15/31,
Callable
9/15/28
@
100(a)
..............
$
1,935
$
1,991
Series
2025-1A,
Class
A2,
4.68%,
12/15/27(a)
..............................
1,560
1,561
GLS
Auto
Select
Receivables
Trust,
Series
2025-1A,
Class
A2,
4.71%,
4/15/30,
Callable
4/15/29
@
100(a)
...................................................
5,683
5,705
Huntington
Bank
Auto
Credit-Linked
Notes
....................................
Series
2024-2,
Class
C,
6.27%
(SOFR30A+260bps),
10/20/32,
Callable
6/20/28
@
100(a)
(b)
.............................................................
3,122
3,131
Series
2025-1,
Class
B,
4.96%,
3/21/33,
Callable
1/20/29
@
100(a)
...............
7,158
7,183
LAD
Auto
Receivables
Trust,
Series
2025-1A,
Class
A2,
4.60%,
12/15/27(a)
............
854
854
Lendbuzz
Securitization
Trust
..............................................
Series
2023-3A,
Class
A2,
7.50%,
12/15/28,
Callable
4/15/28
@
100(a)
............
3,300
3,354
Series
2024-1A,
Class
A2,
6.19%,
8/15/29,
Callable
5/15/28
@
100(a)
.............
3,160
3,174
Series
2024-2A,
Class
A2,
5.99%,
5/15/29,
Callable
7/15/28
@
100(a)
.............
3,600
3,621
Series
2025-1A,
Class
A2,
5.10%,
10/15/30,
Callable
7/15/28
@
100(a)
............
6,616
6,631
Lobel
Automobile
Receivables
Trust,
Series
2025-1,
Class
A,
5.06%,
11/15/27,
Callable
9/15/27
@
100(a)
...................................................
1,986
1,988
Merchants
Fleet
Funding
LLC
..............................................
Series
2023-1A,
Class
A,
7.21%,
5/20/36,
Callable
6/20/26
@
100(a)
..............
2,709
2,715
Series
2025-1A,
Class
A,
4.49%,
1/20/39,
Callable
6/20/29
@
100(a)
..............
4,200
4,206
NextGear
Floorplan
Master
Owner
Trust,
Series
2024-2A,
Class
A1,
4.55%
(SOFR30A+88bps),
9/15/29(a)(b)
.......................................
9,280
9,332
Oscar
US
Funding
XVII
LLC,
Series
2024-2A,
Class
A2,
4.63%,
12/10/27(a)
............
235
235
Prestige
Auto
Receivables
Trust,
Series
2021-1A,
Class
E,
3.47%,
3/15/29,
Callable
8/15/26
@
100(a)
...........................................................
3,240
3,203
SAFCO
Auto
Receivables
Trust
............................................
Series
2024-1A,
Class
B,
6.31%,
11/20/28,
Callable
3/18/27
@
100(a)
.............
449
450
Series
2025-1A,
Class
A,
5.46%,
9/10/29,
Callable
3/10/28
@
100(a)
..............
3,879
3,874
Series
2025-1A,
Class
B,
5.63%,
10/10/30,
Callable
3/10/28
@
100(a)
.............
2,000
1,984
Santander
Bank
Auto
Credit-Linked
Notes,
Series
2024-B,
Class
E,
6.80%,
1/18/33,
Callable
3/15/29
@
100(a)
...................................................
4,174
4,213
Santander
Consumer
Auto
Receivables
Trust,
Series
2021-CA,
Class
C,
2.97%,
6/15/28,
Callable
4/15/26
@
100(a)
............................................
8
8
Santander
Drive
Auto
Receivables
Trust,
Series
2023-2,
Class
B,
5.24%,
5/15/28,
Callable
8/15/27
@
100
.....................................................
151
151
SCCU
Auto
Receivables
Trust,
Series
2025-1A,
Class
A2,
4.67%,
11/15/28(a)
...........
8,312
8,326
Securitized
Term
Auto
Receivables
Trust,
Series
2025-A,
Class
B,
5.04%,
7/25/31,
Callable
5/25/28
@
100(a)
...................................................
1,639
1,650
Tidewater
Auto
Receivables
Trust,
Series
2020-AA,
Class
E,
3.35%,
7/17/28,
Callable
4/15/26
@
100(a)
.........................................................
919
918
Tricolor
Auto
Securitization
Trust
...........................................
Series
2022-1A,
Class
E,
7.79%,
8/16/27,
Callable
4/15/26
@
100(a)(c)
............
987
936
Series
2023-1A,
Class
D,
8.56%,
7/15/27,
Callable
5/15/26
@
100(a)(c)
............
1,552
1,448
Series
2024-1A,
Class
A,
6.61%,
10/15/27,
Callable
11/15/26
@
100(a)(c)
..........
1,449
1,433
Series
2024-1A,
Class
B,
6.53%,
12/15/27,
Callable
11/15/26
@
100(a)(c)
..........
3,750
3,039
Series
2024-2A,
Class
A,
6.36%,
12/15/27(a)(c)
.............................
2,219
2,049
Series
2024-3A,
Class
A,
5.22%,
6/15/28,
Callable
10/15/27
@
100(a)(c)
...........
4,745
4,058
Series
2025-1A,
Class
A,
4.94%,
2/15/29,
Callable
5/15/28
@
100(a)(c)
............
21,577
13,235
Series
2025-1A,
Class
C,
5.72%,
10/15/29,
Callable
5/15/28
@
100(a)(c)
...........
5,320
1,132
Series
2025-2A,
Class
A,
5.12%,
1/16/29(a)(c)
..............................
18,218
11,193
U.S.
Bank
NA,
Series
2023-1,
Class
B,
6.79%,
8/25/32,
Callable
11/25/26
@
100(a)
.......
276
279
United
Auto
Credit
Securitization
Trust,
Series
2024-1,
Class
D,
8.30%,
11/12/29,
Callable
7/10/27
@
100(a)
...................................................
3,150
3,193
USAA
Auto
Owner
Trust,
Series
2023-A,
Class
A3,
5.58%,
5/15/28,
Callable
12/15/26
@
100(a)
...........................................................
281
283
Veridian
Auto
Receivables
Trust,
Series
2023-1A,
Class
A3,
5.56%,
3/15/28,
Callable
10/15/27
@
100(a)
.........................................................
841
842
Veros
Auto
Receivables
Trust
..............................................
Series
2023-1,
Class
C,
8.32%,
11/15/28,
Callable
10/15/26
@
100(a)
.............
3,000
3,044
Series
2024-1,
Class
A,
6.28%,
11/15/27,
Callable
8/15/27
@
100(a)
..............
227
228
Series
2025-1,
Class
A,
5.31%,
9/15/28,
Callable
2/15/28
@
100(a)
...............
4,521
4,536
Series
2026-1,
Class
B,
4.84%,
5/15/29(a)
.................................
1,580
1,579
Westlake
Automobile
Receivables
Trust
.......................................
Series
2024-3A,
Class
A2A,
4.82%,
9/15/27(a)
..............................
720
721
Victory
Portfolios
IV
Victory
Pioneer
Multi-Asset
Ultrashort
Income
Fund
Schedule
of
Portfolio
Investments
—
continued
March
31,
2026
See
notes
to
financial
statements.
Security
Description
Principal
Amount
(000)
a
Value
(000)
Series
2025-P1,
Class
A2,
4.65%,
2/15/28(a)
...............................
$
4,360
$
4,366
Wheels
Fleet
Lease
Funding
1
LLC
..........................................
Series
2024-1A,
Class
A2,
4.51%
(TSFR1M+83bps),
2/18/39(a)(b)
...............
2,365
2,369
Series
2025-3A,
Class
A1,
4.08%,
9/18/40(a)
...............................
7,000
6,962
294,239
ABS
Card
(0.5%):
Continental
Finance
Credit
Card
ABS
Master
Trust
...............................
Series
2022-A,
Class
A,
6.19%,
10/15/30(a)
................................
440
441
Series
2024-A,
Class
A,
5.78%,
12/15/32(a)
................................
3,543
3,556
Mercury
Financial
Credit
Card
Master
Trust
....................................
Series
2024-2A,
Class
A,
6.56%,
7/20/29,
Callable
4/20/26
@
100(a)
..............
10,660
10,677
Series
2024-2A,
Class
C,
10.42%,
7/20/29,
Callable
4/20/26
@
100(a)
.............
9,680
9,714
Mission
Lane
Credit
Card
Master
Trust
.......................................
Series
2024-B,
Class
A,
5.88%,
1/15/30(a)
.................................
5,300
5,309
Series
2025-A,
Class
A,
5.80%,
5/15/30,
Callable
2/15/27
@
100(a)
...............
8,580
8,628
Newday
Funding
Master
Flt,
Series
2023-1,
Class
A2,
6.08%,
11/17/31(d)
..............
5,700
5,727
44,052
ABS
Home
(1.3%):
Delta
Funding
Home
Equity
Loan
Trust,
Series
1997-2,
Class
A6,
7.04%,
6/25/27,
Callable
4/25/26
@
100
.....................................................
—(e)
—(e)
GS
Mortgage-Backed
Securities
Trust,
Series
2025-CES1,
Class
A1A,
5.57%,
5/25/55,
Callable
3/25/28
@
100(a)(d)
..........................................
4,426
4,437
NovaStar
Mortgage
Funding
Trust,
Series
2003-1,
Class
A2,
4.57%
(TSFR1M+89bps),
5/25/33,
Callable
4/25/26
@
100(b)
......................................
11
10
RCKT
Mortgage
Trust,
Series
2024-CES7,
Class
A1A,
5.16%,
10/25/44,
Callable
9/25/27
@
100(a)(d)
.........................................................
306
306
SAIF
Securitization
Trust,
Series
2026-CESI,
Class
A1A,
5.40%,
2/25/56,
Callable
3/25/29
@
100(a)(d)
.........................................................
19,450
19,429
Saluda
Grade
Alternative
Mortgage
Trust,
Series
2024-CES1,
Class
A1,
6.31%,
3/25/54,
Callable
11/25/29
@
100(a)(d)
.........................................
4,022
4,065
Towd
Point
Mortgage
Trust
................................................
Series
2024-CES1,
Class
A1A,
5.85%,
1/25/64,
Callable
1/25/27
@
100(a)(d)
.......
11,642
11,661
Series
2024-CES2,
Class
A1A,
6.13%,
2/25/64,
Callable
2/25/27
@
100(a)(d)
.......
5,292
5,314
Series
2024-CES4,
Class
A1,
5.12%,
9/25/64,
Callable
9/25/27
@
100(a)(d)
.........
9,486
9,462
Vista
Point
Securitization
Trust
.............................................
Series
2024-CES1,
Class
A1,
6.68%,
5/25/54,
Callable
5/25/27
@
100(a)(d)
.........
2,240
2,264
Series
2025-CES3,
Class
A1,
5.30%,
11/25/55,
Callable
10/25/28
@
100(a)(d)
.......
21,301
21,226
Series
2026-CES1,
Class
A1,
5.04%,
2/25/56,
Callable
2/25/29
@
100(a)(d)
.........
30,468
30,175
108,349
ABS
Other
(11.5%):
321
Henderson
Receivables
I
LLC
...........................................
Series
2005-1A,
Class
A1,
4.02%
(TSFR1M+34bps),
11/15/40,
Callable
4/15/26
@
100(a)(b)
.........................................................
305
299
Series
2006-2A,
Class
A1,
3.99%
(TSFR1M+31bps),
6/15/41,
Callable
4/15/30
@
100(a)
(b)
.............................................................
55
55
Series
2006-3A,
Class
A1,
3.99%
(TSFR1M+31bps),
9/15/41,
Callable
1/15/31
@
100(a)
(b)
.............................................................
183
182
Accelerated
Assets
LLC,
Series
2024-HE2,
Class
A,
5.35%,
10/25/39,
Callable
2/25/30
@
100(a)
...........................................................
3,717
3,723
ACHM
Mortgage
Trust,
Series
2024-HE1,
Class
A,
6.55%,
5/25/39,
Callable
4/25/30
@
100(a)
4,871
4,973
ACHV
ABS
Trust,
Series
2024-2PL,
Class
A,
5.07%,
10/27/31,
Callable
4/25/27
@
100(a)
..
1,857
1,864
Affirm
Asset
Securitization
Trust
............................................
Series
2025-X1,
Class
A,
5.08%,
4/15/30,
Callable
10/15/26
@
100(a)
.............
2,723
2,724
Series
2025-X2,
Class
A,
4.45%,
10/15/30,
Callable
5/15/27
@
100(a)
.............
24,156
24,174
Alterna
Funding
III
LLC,
Series
2024-1A,
Class
A,
6.26%,
5/16/39(a)
.................
11,673
11,683
Amur
Equipment
Finance
Receivables
XIV
LLC,
Series
2024-2A,
Class
A2,
5.19%,
7/21/31,
Callable
8/20/28
@
100(a)
............................................
4,699
4,743
Angel
Oak
Mortgage
Trust
................................................
Series
2025-HB1,
Class
A1,
5.46%
(SOFR30A+180bps),
2/25/55,
Callable
4/25/28
@
100(a)(b)
.........................................................
6,379
6,403
Series
2025-HB2,
Class
A1,
5.26%
(SOFR30A+160bps),
12/25/55,
Callable
11/25/28
@
100(a)(b)
.........................................................
15,500
15,532
Victory
Portfolios
IV
Victory
Pioneer
Multi-Asset
Ultrashort
Income
Fund
Schedule
of
Portfolio
Investments
—
continued
March
31,
2026
See
notes
to
financial
statements.
Security
Description
Principal
Amount
(000)
a
Value
(000)
Aqua
Finance
Trust
.....................................................
Series
2019-A,
Class
A,
3.14%,
7/16/40,
Callable
5/15/26
@
100(a)
...............
$
955
$
930
Series
2020-AA,
Class
A,
1.90%,
7/17/46,
Callable
6/17/26
@
100(a)
.............
1,072
1,012
Series
2021-A,
Class
A,
1.54%,
7/17/46,
Callable
5/17/28
@
100(a)
...............
1,638
1,503
Ascent
Career
Funding
Trust,
Series
2024-1A,
Class
A,
6.77%,
10/25/32(a)
.............
3,995
4,017
Auxilior
Term
Funding
LLC,
Series
2023-1A,
Class
A2,
6.18%,
12/15/28,
Callable
1/15/28
@
100(a)
...........................................................
278
279
Avtech
Equipment
Receivables
Funding
LLC,
Series
2026-1A,
Class
A,
4.55%,
2/15/33,
Callable
1/15/29
@
100(a)
............................................
4,348
4,341
Bayview
Opportunity
Master
Fund
VII
LLC,
Series
2024-EDU1,
Class
A,
5.11%
(SOFR30A+145bps),
6/25/47(a)(b)
......................................
2,892
2,908
BHG
Securitization
Trust
.................................................
Series
2023-B,
Class
A,
6.92%,
12/17/36,
Callable
12/17/29
@
100(a)
.............
1,488
1,546
Series
2024-1CON,
Class
A,
5.81%,
4/17/35,
Callable
5/17/29
@
100(a)
...........
2,448
2,489
Blackbird
Capital
II
Aircraft
Lease
Ltd.,
Series
2021-1A,
Class
A,
2.44%,
7/15/46,
Callable
7/15/28
@
100(a)
...................................................
2,457
2,329
Blue
Bridge
Funding
LLC,
Series
2023-1A,
Class
A,
7.37%,
11/15/30,
Callable
2/15/27
@
100(a)
...........................................................
1,958
1,970
BRAVO
Residential
Funding
Trust,
Series
2025-HE1,
Class
A1,
5.01%
(SOFR30A+135bps),
9/25/72,
Callable
9/25/28
@
100(a)(b)
....................................
16,850
16,857
BXG
Receivables
Note
Trust,
Series
2020-A,
Class
B,
2.49%,
2/28/36,
Callable
4/28/27
@
100(a)
...........................................................
124
121
Centerstone
SBA
Trust,
Series
2023-1,
Class
A,
7.60%
(PRIME+85bps),
12/27/50,
Callable
5/25/27
@
100(a)(b)
.................................................
3,334
3,329
CFMT
LLC,
Series
2024-HB13,
Class
A,
3.00%,
5/25/34,
Callable
12/25/26
@
100(a)(d)
...
3,307
3,273
College
Ave
Student
Loans
LLC,
Series
2019-A,
Class
A1,
5.19%
(TSFR1M+151bps),
12/28/48,
Callable
2/25/32
@
100(a)(b)
...................................
2,821
2,829
Commercial
Equipment
Finance
LLC,
Series
2024-1A,
Class
A,
5.97%,
7/16/29,
Callable
6/15/27
@
100(a)
...................................................
1,342
1,350
Commonbond
Student
Loan
Trust
...........................................
Series
2016-B,
Class
A1,
2.73%,
10/25/40,
Callable
4/25/26
@
100(a)
.............
66
65
Series
2016-B,
Class
A2,
5.24%
(TSFR1M+156bps),
10/25/40,
Callable
4/25/26
@
100(a)(b)
.........................................................
21
21
Series
2017-AGS,
Class
A2,
4.64%
(TSFR1M+96bps),
5/25/41,
Callable
4/25/26
@
100(a)(b)
.........................................................
317
314
Series
2017-BGS,
Class
A2,
4.44%
(TSFR1M+76bps),
9/25/42,
Callable
4/25/26
@
100(a)(b)
.........................................................
283
280
Series
2017-BGS,
Class
C,
4.44%,
9/25/42,
Callable
4/25/26
@
100(a)
............
71
60
Series
2018-AGS,
Class
A2,
4.29%
(TSFR1M+61bps),
2/25/44,
Callable
6/25/26
@
100(a)(b)
.........................................................
259
256
Series
2018-BGS,
Class
A2,
4.36%
(TSFR1M+68bps),
9/25/45,
Callable
4/25/26
@
100(a)(b)
.........................................................
525
519
Series
2018-CGS,
Class
A2,
4.59%
(TSFR1M+91bps),
2/25/46(a)(b)
..............
197
195
Series
2019-AGS,
Class
A2,
4.69%
(TSFR1M+101bps),
1/25/47,
Callable
3/25/28
@
100(a)(b)
.........................................................
486
480
CP
EF
Asset
Securitization
II
LLC,
Series
2023-1A,
Class
A,
7.48%,
3/15/32,
Callable
7/15/27
@
100(a)
.........................................................
929
934
Crossroads
Asset
Trust,
Series
2024-A,
Class
A2,
5.90%,
8/20/30,
Callable
1/20/28
@
100(a)
8,540
8,610
DailyPay
Securitization
Trust,
Series
2025-1A,
Class
A,
5.63%,
6/26/28,
Callable
3/25/27
@
100(a)
...........................................................
4,740
4,752
Dext
ABS
LLC
........................................................
Series
2023-1,
Class
A2,
5.99%,
3/15/32,
Callable
4/15/27
@
100(a)
..............
224
224
Series
2023-2,
Class
A2,
6.56%,
5/15/34,
Callable
2/15/28
@
100(a)
..............
771
773
Equify
ABS
LLC,
Series
2024-1A,
Class
A,
5.43%,
4/18/33,
Callable
3/15/28
@
100(a)
....
2,993
3,001
FIGRE
Trust
..........................................................
Series
2024-HE2,
Class
A,
6.38%,
5/25/54,
Callable
1/25/29
@
100(a)(d)
...........
5,701
5,815
Series
2024-HE3,
Class
A,
5.94%,
7/25/54,
Callable
7/25/29
@
100(a)(d)
...........
3,457
3,504
Series
2025-HE3,
Class
A,
5.56%,
5/25/55,
Callable
9/25/29
@
100(a)(d)
...........
3,340
3,351
Series
2025-HE4,
Class
A,
5.41%,
7/25/55,
Callable
7/25/30
@
100(a)(d)
...........
3,146
3,149
Series
2025-HE6,
Class
A,
5.04%,
9/25/55,
Callable
3/25/31
@
100(a)(d)
...........
11,540
11,431
Series
2025-PF2,
Class
A,
5.02%,
10/25/55(a)(d)
............................
4,218
4,176
Series
2026-HF3,
Class
A1A,
5.07%
(SOFR30A+140bps),
3/25/56,
Callable
12/25/31
@
100(a)(b)
.........................................................
6,610
6,610
Victory
Portfolios
IV
Victory
Pioneer
Multi-Asset
Ultrashort
Income
Fund
Schedule
of
Portfolio
Investments
—
continued
March
31,
2026
See
notes
to
financial
statements.
Security
Description
Principal
Amount
(000)
a
Value
(000)
Ford
Credit
Floorplan
Master
Owner
Trust
A,
Series
2023-1,
Class
B,
5.31%,
5/15/28(a)
....
$
1,000
$
1,001
Foundation
Finance
Trust
.................................................
Series
2021-1A,
Class
A,
1.27%,
5/15/41,
Callable
4/15/28
@
100(a)
..............
2,002
1,910
Series
2021-2A,
Class
A,
2.19%,
1/15/42,
Callable
6/15/29
@
100(a)
..............
1,122
1,069
Gracie
Point
International
Funding
LLC,
Series
2025-1A,
Class
A,
5.17%
(SOFR30A+150bps),
8/15/28,
Callable
8/15/27
@
100(a)(b)
....................................
12,500
12,514
GreenSky
Home
Improvement
Issuer
Trust
....................................
Series
2025-2A,
Class
A2,
4.93%,
6/25/60(a)
...............................
1,195
1,199
Series
2025-2A,
Class
D,
5.56%,
6/25/60(a)
................................
1,450
1,445
GS
Mortgage-Backed
Securities
Trust
........................................
Series
2024-HE1,
Class
A1,
5.26%
(SOFR30A+160bps),
8/25/54,
Callable
6/25/27
@
100(a)(b)
.........................................................
16,329
16,356
Series
2024-HE2,
Class
A1,
5.16%
(SOFR30A+150bps),
1/25/55,
Callable
10/25/27
@
100(a)(b)
.........................................................
10,463
10,467
Series
2025-HE1,
Class
A1,
5.21%
(SOFR30A+155bps),
10/25/55,
Callable
7/25/28
@
100(a)(b)
.........................................................
2,968
2,972
Series
2025-HE2,
Class
A1,
5.21%
(SOFR30A+155bps),
12/25/65,
Callable
10/25/28
@
100(a)(b)
.........................................................
21,543
21,529
Series
2025-SL1,
Class
A1,
5.85%,
11/25/67,
Callable
3/25/28
@
100(a)(d)
.........
8,448
8,494
Harvest
SBA
Loan
Trust
..................................................
Series
2023-1,
Class
A,
7.04%
(SOFR30A+325bps),
10/25/50,
Callable
11/25/30
@
100(a)(b)
.........................................................
4,035
4,169
Series
2024-1,
Class
A,
6.00%
(SOFR30A+225bps),
12/25/51,
Callable
6/25/34
@
100(a)
(b)
.............................................................
6,353
6,414
J.P.
Morgan
Mortgage
Trust
...............................................
Series
2023-HE1,
Class
A1,
5.42%
(SOFR30A+175bps),
11/25/53,
Callable
7/20/26
@
100(a)(b)
.........................................................
3,465
3,468
Series
2023-HE2,
Class
A1,
5.37%
(SOFR30A+170bps),
3/20/54,
Callable
10/20/26
@
100(a)(b)
.........................................................
6,768
6,780
Series
2023-HE3,
Class
A1,
5.27%
(SOFR30A+160bps),
5/20/54,
Callable
12/20/26
@
100(a)(b)
.........................................................
4,537
4,543
Series
2024-HE2,
Class
A1,
4.87%
(SOFR30A+120bps),
10/20/54,
Callable
5/20/27
@
100(a)(b)
.........................................................
6,432
6,431
Series
2024-HE3,
Class
A1,
4.87%
(SOFR30A+120bps),
2/25/55,
Callable
9/20/27
@
100(a)(b)
.........................................................
8,948
8,950
Series
2025-HE1,
Class
A1,
4.82%
(SOFR30A+115bps),
7/20/55,
Callable
2/20/28
@
100(a)(b)
.........................................................
18,059
18,051
Series
2025-HE2,
Class
A1,
4.92%
(SOFR30A+125bps),
11/20/55,
Callable
7/20/28
@
100(a)(b)
.........................................................
20,860
20,866
Series
2025-HE3,
Class
A1,
5.02%
(SOFR30A+135bps),
3/20/56,
Callable
11/20/28
@
100(a)(b)
.........................................................
20,450
20,493
Kinetic
Advantage
Master
Owner
Trust,
Series
2025-1A,
Class
A,
5.87%
(SOFR30A+220bps),
10/15/29,
Callable
10/15/27
@
100(a)(b)
..................................
7,610
7,640
Libra
Solutions
LLC,
Series
2025-1A,
Class
A,
6.36%,
8/15/39(a)
....................
3,770
3,773
Lunar
Structured
Aircraft
Portfolio
Notes,
Series
2021-1,
Class
A,
2.64%,
10/15/46(a)
......
1,085
1,030
Marlette
Funding
Trust,
Series
2025-1A,
Class
A,
4.75%,
7/16/35,
Callable
4/15/29
@
100(a)
2,971
2,973
MMP
Capital
LLC,
Series
2025-A,
Class
A,
5.36%,
12/15/31,
Callable
12/15/28
@
100(a)
..
3,760
3,787
MVW
LLC,
Series
2021-1WA,
Class
A,
1.14%,
1/22/41,
Callable
4/20/27
@
100(a)
.......
630
609
Navient
Private
Education
Refi
Loan
Trust,
Series
2021-CA,
Class
A,
1.06%,
10/15/69,
Callable
4/15/30
@
100(a)
............................................
439
399
Nelnet
Student
Loan
Trust
................................................
Series
2021-A,
Class
APT2,
1.36%,
4/20/62,
Callable
1/20/29
@
100(a)
............
423
403
Series
2021-DA,
Class
AFL,
4.48%
(TSFR1M+80bps),
4/20/62,
Callable
4/20/32
@
100(a)(b)
.........................................................
2,169
2,160
Newtek
Small
Business
Loan
Trust
..........................................
Series
2021-1,
Class
A,
6.50%
(PRIME-25bps),
12/25/48,
Callable
4/25/26
@
100(a)(b)
842
842
Series
2023-1,
Class
A,
6.25%
(PRIME-50bps),
7/25/50,
Callable
9/25/28
@
100(a)(b)
.
2,293
2,315
NMEF
Funding
LLC,
Series
2023-A,
Class
A2,
6.57%,
6/17/30,
Callable
5/15/27
@
100(a)
..
664
666
NYCTL
Trust,
Series
2025-A,
Class
A,
4.84%,
11/10/38(a)
.........................
7,315
7,258
Oaktree
ABF
Equipment
ST
LLC,
Series
2026-1A,
Class
A2,
4.50%,
10/17/33,
Callable
10/15/28
@
100(a)
..................................................
8,000
8,000
Victory
Portfolios
IV
Victory
Pioneer
Multi-Asset
Ultrashort
Income
Fund
Schedule
of
Portfolio
Investments
—
continued
March
31,
2026
See
notes
to
financial
statements.
Security
Description
Principal
Amount
(000)
a
Value
(000)
OBX
Trust
............................................................
Series
2025-HE1,
Class
A1,
5.26%
(SOFR30A+160bps),
2/25/55,
Callable
3/25/28
@
100(a)(b)
.........................................................
$
9,573
$
9,592
Series
2025-HE2,
Class
A1,
5.11%
(SOFR30A+145bps),
8/25/55,
Callable
8/25/28
@
100(a)(b)
.........................................................
10,161
10,174
Series
2026-HE1,
Class
A1A,
5.01%
(SOFR30A+135bps),
2/25/56,
Callable
2/25/29
@
100(a)(b)
.........................................................
26,778
26,712
Octane
Receivables
Trust,
Series
2023-3A,
Class
A2,
6.44%,
3/20/29,
Callable
11/20/27
@
100(a)
...........................................................
540
541
Oportun
Funding
Trust,
Series
2025-1,
Class
A,
4.96%,
8/16/32,
Callable
11/15/26
@
100(a)
.
967
967
Oportun
Issuance
Trust
...................................................
Series
2021-C,
Class
A,
2.18%,
10/8/31,
Callable
4/8/26
@
100(a)
................
2,560
2,525
Series
2024-2,
Class
B,
5.83%,
2/9/32,
Callable
10/8/26
@
100(a)
................
1,590
1,591
Series
2025-B,
Class
A,
4.88%,
5/9/33,
Callable
6/8/27
@
100(a)
.................
8,000
8,014
Series
2025-B,
Class
B,
5.28%,
5/9/33,
Callable
6/8/27
@
100(a)
.................
8,000
8,011
Series
2026-A,
Class
A,
4.32%,
1/9/34,
Callable
2/8/28
@
100(a)
................
3,000
2,984
Series
2026-A,
Class
B,
5.06%,
1/9/34,
Callable
2/8/28
@
100(a)
................
5,000
4,988
Oxford
Finance
Credit
Fund
III
LP,
Series
2024-A,
Class
A2,
6.68%,
1/14/32(a)
..........
8,133
8,171
Oxford
Finance
Funding
LLC,
Series
2022-1A,
Class
B,
4.10%,
2/15/30(a)
.............
3,426
3,345
Pagaya
AI
Debt
Grantor
Trust
..............................................
Series
2024-10,
Class
A,
5.18%,
6/15/32,
Callable
11/15/26
@
100(a)
.............
1,857
1,862
Series
2024-10,
Class
B,
5.75%,
6/15/32,
Callable
11/15/26
@
100(a)
.............
3,631
3,646
Series
2024-11,
Class
A,
5.09%,
7/15/32,
Callable
12/15/26
@
100(a)
.............
3,032
3,042
Series
2024-11,
Class
AB,
5.39%,
7/15/32,
Callable
12/15/26
@
100(a)(d)
..........
3,008
3,017
Series
2024-5,
Class
A,
6.28%,
10/15/31,
Callable
5/15/26
@
100(a)
..............
1,219
1,221
Series
2024-9,
Class
A,
5.07%,
3/15/32,
Callable
10/15/26
@
100(a)
..............
405
406
Series
2025-1,
Class
A,
5.16%,
7/15/32,
Callable
2/15/27
@
100(a)(d)
.............
1,733
1,742
Series
2025-1,
Class
A2,
5.16%,
7/15/32,
Callable
2/15/27
@
100(a)
..............
1,031
1,032
Series
2025-1,
Class
B,
5.63%,
7/15/32,
Callable
2/15/27
@
100(a)
...............
2,224
2,228
Series
2025-6,
Class
A2,
4.50%,
4/15/33,
Callable
9/15/27
@
100(a)
..............
7,999
7,971
Series
2025-7,
Class
A2,
4.53%,
5/15/33,
Callable
10/15/27
@
100(a)
.............
9,748
9,700
Series
2025-R3,
Class
A,
4.84%,
1/18/33,
Callable
12/15/27
@
100(a)
.............
13,096
13,085
Pagaya
AI
Debt
Trust
....................................................
Series
2024-2,
Class
A,
6.32%,
8/15/31,
Callable
4/15/26
@
100(a)
...............
1,965
1,966
Series
2024-2,
Class
AB,
6.46%,
8/15/31,
Callable
4/15/26
@
100(a)(d)
............
647
647
Series
2024-2,
Class
B,
6.61%,
8/15/31,
Callable
4/15/26
@
100(a)
...............
4,138
4,139
Series
2024-3,
Class
A,
6.26%,
10/15/31,
Callable
4/15/26
@
100(a)
..............
2,926
2,927
Series
2024-3,
Class
B,
6.57%,
10/15/31,
Callable
4/15/26
@
100(a)
..............
6,283
6,287
Series
2025-R1,
Class
B,
5.71%,
6/15/32,
Callable
12/15/27
@
100(a)
.............
5,152
5,168
Series
2025-REV1,
Class
A,
5.01%,
8/15/35,
Callable
12/15/27
@
100(a)
...........
8,000
7,955
PEAR
LLC
...........................................................
Series
2021-1,
Class
A,
2.60%,
1/15/34,
Callable
4/15/26
@
100(a)
...............
123
123
Series
2021-1,
Class
B,
1/15/34(a)(f)(g)
...................................
3,000
2,812
Series
2022-1,
Class
A2,
7.25%,
10/15/34(a)
...............................
2,312
2,342
Series
2023-1,
Class
A,
7.42%,
7/15/35,
Callable
9/15/27
@
100(a)
...............
9,084
9,266
Series
2024-1,
Class
A,
6.95%,
2/15/36,
Callable
3/15/28
@
100(a)
...............
4,521
4,555
PFS
Financing
Corp.,
Series
2025-A,
Class
A,
4.32%
(SOFR30A+65bps),
1/15/29(a)(b)
....
15,250
15,268
Post
Road
Equipment
Finance
LLC
..........................................
Series
2024-1A,
Class
A2,
5.59%,
11/15/29,
Callable
12/15/26
@
100(a)
...........
838
840
Series
2025-1A,
Class
A2,
4.90%,
5/15/31,
Callable
8/15/28
@
100(a)
.............
2,862
2,881
Prodigy
Finance
DAC,
Series
2021-1A,
Class
A,
5.04%
(TSFR1M+136bps),
7/25/51,
Callable
11/25/26
@
100(a)(b)
................................................
1,287
1,284
Progress
Residential
Trust,
Series
2021-SFR3,
Class
B,
1.89%,
5/17/26(a)(h)
............
5,000
4,980
Purchasing
Power
Funding
LLC
............................................
Series
2026-A,
Class
A,
4.37%,
8/15/30,
Callable
2/15/28
@
100(a)
...............
5,500
5,468
Series
2026-A,
Class
D,
5.40%,
8/15/30,
Callable
2/15/28
@
100(a)
...............
4,840
4,804
RCKT
Trust,
Series
2025-1A,
Class
A,
4.90%,
7/25/34,
Callable
4/25/28
@
100(a)
........
2,850
2,856
RCKTL,
Series
2025-2A,
Class
A,
4.48%,
11/27/34,
Callable
11/25/28
@
100(a)
.........
4,662
4,662
Reach
ABS
Trust
.......................................................
Series
2024-1A,
Class
B,
6.29%,
2/18/31,
Callable
12/15/27
@
100(a)
.............
7,528
7,571
Series
2024-2A,
Class
A,
5.88%,
7/15/31,
Callable
10/15/28
@
100(a)
.............
777
779
Series
2025-1A,
Class
A,
4.96%,
8/16/32,
Callable
6/15/29
@
100(a)
..............
6,192
6,201
Series
2025-2A,
Class
A,
4.93%,
8/18/32,
Callable
12/15/29
@
100(a)
.............
3,831
3,847
Victory
Portfolios
IV
Victory
Pioneer
Multi-Asset
Ultrashort
Income
Fund
Schedule
of
Portfolio
Investments
—
continued
March
31,
2026
See
notes
to
financial
statements.
Security
Description
Principal
Amount
(000)
a
Value
(000)
Series
2025-2A,
Class
C,
5.69%,
8/18/32,
Callable
12/15/29
@
100(a)
.............
$
11,500
$
11,519
Series
2026-1A,
Class
D,
5.16%,
2/15/33,
Callable
6/15/30
@
100(a)
..............
17,160
16,962
ReadyCap
Lending
Small
Business
Loan
Trust
..................................
Series
2019-2,
Class
A,
6.25%
(PRIME-50bps),
12/27/44,
Callable
4/25/26
@
100(a)(b)
701
700
Series
2023-3,
Class
A,
6.82%
(PRIME+7bps),
4/25/48,
Callable
3/25/29
@
100(a)(b)
.
5,674
5,758
Regional
Management
Issuance
Trust,
Series
2024-2,
Class
A,
5.11%,
12/15/33,
Callable
12/15/26
@
100(a)
..................................................
6,240
6,264
Rosy
Blue
Carat
SCS,
Series
2018-1,
Class
A2R,
7.79%
(TSFR1M+411bps),
3/15/30(a)(b)(f)
5,156
5,183
Saluda
Grade
Alternative
Mortgage
Trust
......................................
Series
2025-LOC4,
Class
A1A,
5.41%
(SOFR30A+175bps),
6/25/55,
Callable
6/25/28
@
100(a)(b)
.........................................................
19,743
19,811
Series
2025-LOC5,
Class
A1A,
5.28%
(TSFR1M+160bps),
10/25/55,
Callable
9/25/28
@
100(a)(b)
.........................................................
11,542
11,581
Series
2026-HB1,
Class
A1A,
5.08%
(TSFR1M+140bps),
4/25/56,
Callable
1/25/29
@
100(a)(b)
.........................................................
35,683
35,643
Series
2026-HB1,
Class
M1,
5.38%
(TSFR1M+170bps),
4/25/56,
Callable
1/25/29
@
100(a)(b)
.........................................................
5,200
5,182
SCF
Equipment
Leasing
LLC,
Series
2025-1A,
Class
A2,
4.82%,
7/22/30(a)
.............
2,126
2,131
SLM
Private
Credit
Student
Loan
Trust,
Series
2007-A,
Class
A4A,
4.18%
(TSFR3M+50bps),
12/16/41,
Callable
9/15/28
@
100(b)
.....................................
1,767
1,744
SMB
Private
Education
Loan
Trust
..........................................
Series
2018-B,
Class
A2B,
4.51%
(TSFR1M+83bps),
1/15/37(a)(b)
...............
583
583
Series
2023-B,
Class
A1B,
5.47%
(SOFR30A+180bps),
10/16/56(a)(b)
............
3,354
3,420
Series
2023-C,
Class
A1B,
5.22%
(SOFR30A+155bps),
11/15/52(a)(b)
............
4,226
4,267
SoFi
Consumer
Loan
Program
Trust
.........................................
Series
2025-2,
Class
A,
4.82%,
6/25/34,
Callable
6/25/28
@
100(a)
...............
4,930
4,946
Series
2026-1,
Class
A,
4.06%,
12/26/35,
Callable
8/25/29
@
100(a)
..............
5,856
5,849
SpringCastle
America
Funding
LLC,
Series
2020-AA,
Class
A,
1.97%,
9/25/37,
Callable
4/25/26
@
100(a)
...................................................
842
793
STAR
Trust
...........................................................
Series
2022-SFR3,
Class
A,
5.32%
(TSFR1M+165bps),
5/17/39(a)(b)(h)
...........
992
990
Series
2025-SFR6,
Class
A,
5.07%
(TSFR1M+140bps),
8/17/42,
Callable
8/17/27
@
100(a)(b)(h)
.......................................................
23,400
23,400
Stonepeak
ABS,
Series
2021-1A,
Class
AA,
2.30%,
2/28/33(a)
......................
958
938
Stream
Innovations
Issuer
Trust,
Series
2024-1A,
Class
A,
6.27%,
7/15/44,
Callable
3/15/31
@
100(a)
...........................................................
1,821
1,875
The
National
Collegiate
Trust,
Series
2007-A,
Class
A,
4.08%
(US0001M+30bps),
5/25/31,
Callable
4/25/26
@
100(a)(b)
..........................................
564
553
Towd
Point
Asset
Trust,
Series
2018-SL1,
Class
B,
4.84%
(TSFR1M+116bps),
1/25/46(a)(b)
.
1,251
1,251
Towd
Point
Mortgage
Trust
................................................
Series
2025-HE1,
Class
A1A,
5.01%
(SOFR30A+135bps),
7/25/65,
Callable
7/25/28
@
100(a)(b)
.........................................................
9,117
9,115
Series
2025-HE2,
Class
A1A,
5.01%
(SOFR30A+135bps),
9/25/65,
Callable
9/25/28
@
100(a)(b)
.........................................................
—(e)
—(e)
Trafigura
Securitisation
Finance
PLC,
Series
2024-1A,
Class
A1,
5.05%
(SOFR+140bps),
11/15/27(a)(b)
.....................................................
9,950
9,929
Tricon
American
Homes
Trust,
Series
2020-SFR1,
Class
F,
4.88%,
7/17/38(a)(h)
.........
16,369
16,307
U.S.
Bank
NA
.........................................................
Series
2025-SUP1,
Class
B,
5.58%,
2/25/32,
Callable
2/25/29
@
100(a)(h)
..........
3,001
3,015
Series
2026-RVM1,
Class
B1,
4.96%,
12/25/46,
Callable
3/25/34
@
100(a)
.........
5,500
5,474
Upgrade
Master
Pass-Thru
Trust,
Series
2025-ST2,
Class
A,
6.11%,
6/15/32,
Callable
3/15/28
@
100(a)
.........................................................
3,264
3,289
Upstart
Securitization
Trust
................................................
Series
2024-1,
Class
A,
5.33%,
11/20/34,
Callable
9/20/28
@
100(a)
..............
1,738
1,743
Series
2025-2,
Class
A2,
5.22%,
6/20/35,
Callable
3/20/29
@
100(a)
..............
3,287
3,297
Series
2025-3,
Class
A2,
4.60%,
9/20/35,
Callable
3/20/29
@
100(a)
..............
4,590
4,590
Series
2025-4,
Class
A1,
4.34%,
11/20/26(a)
...............................
2,634
2,634
Series
2025-4,
Class
A2,
4.56%,
11/20/35,
Callable
10/20/29
@
100(a)
............
15,000
15,003
US
Bank
C&I
Credit-Linked
Notes
..........................................
Series
2025-SUP2,
Class
B2,
5.01%
(SOFR30A+135bps),
9/25/32,
Callable
1/25/30
@
100(a)(b)(h)
.......................................................
5,758
5,760
Series
2025-SUP2,
Class
D,
5.86%
(SOFR30A+220bps),
9/25/32,
Callable
1/25/30
@
100(a)(b)(h)
.......................................................
2,056
2,066
Victory
Portfolios
IV
Victory
Pioneer
Multi-Asset
Ultrashort
Income
Fund
Schedule
of
Portfolio
Investments
—
continued
March
31,
2026
See
notes
to
financial
statements.
Security
Description
Principal
Amount
(000)
a
Value
(000)
Verdant
Receivables
LLC,
Series
2023-1A,
Class
A2,
6.24%,
1/13/31,
Callable
8/12/27
@
100(a)
...........................................................
$
1,864
$
1,890
Westgate
Resorts
LLC
...................................................
Series
2023-1A,
Class
C,
7.49%,
12/20/37,
Callable
4/20/27
@
100(a)
.............
2,229
2,266
Series
2024-1A,
Class
C,
7.06%,
1/20/38,
Callable
11/20/27
@
100(a)
.............
4,826
4,887
Series
2026-1A,
Class
C,
6.08%,
10/20/39,
Callable
9/20/29
@
100(a)
.............
4,930
4,935
Willis
Engine
Structured
Trust
VI,
Series
2021-A,
Class
B,
5.44%,
5/15/46,
Callable
5/15/29
@
100(a)
...........................................................
5,809
5,737
Wilshire
Mortgage
Loan
Trust,
Series
1997-2,
Class
A6,
4.07%
(TSFR1M+39bps),
5/25/28,
Callable
4/25/26
@
100(b)
............................................
4
4
926,413
Agency
ABS
Other
(0.1%):
Navient
Student
Loan
Trust,
Series
2021-1A,
Class
A1B,
4.38%
(SOFR30A+71bps),
12/26/69,
Callable
12/25/32
@
100(a)(b)
.........................................
2,205
2,171
Nelnet
Student
Loan
Trust,
Series
2005-2,
Class
A5,
4.05%
(SOFR90A+36bps),
3/23/37,
Callable
6/22/26
@
100(b)
............................................
1,594
1,581
3,752
Total
Asset-Backed
Securities
(Cost
$1,397,199)
a
a
a
1,376,805
Collateralized
Loan
Obligations
(16.1%)
Cash
Flow
CLO
(16.1%):
ABPCI
Direct
Lending
Fund
CLO
LLC,
Series
2025-21A,
Class
A1,
5.20%
(TSFR3M+153bps),
7/20/37,
Callable
10/20/27
@
100(a)(b)
....................
4,850
4,837
ABPCI
Direct
Lending
Fund
CLO
V
Ltd.
......................................
Series
2019-5A,
Class
CRR,
9.42%
(TSFR3M+575bps),
1/20/36,
Callable
4/20/26
@
100(a)(b)
.........................................................
4,000
3,941
Series
2019-6A,
Class
A2RR,
5.27%
(TSFR3M+160bps),
1/27/37(a)(b)
............
4,250
4,216
ACREC
LLC
..........................................................
Series
2025-FL3,
Class
A,
4.99%
(TSFR1M+131bps),
8/18/42,
Callable
1/18/27
@
100(a)(b)
.........................................................
12,460
12,460
Series
2026-FL4,
Class
A,
5.13%
(TSFR1M+145bps),
1/18/43,
Callable
1/18/28
@
100(a)(b)
.........................................................
2,060
2,059
Series
2026-FL4,
Class
AS,
5.28%
(TSFR1M+160bps),
1/18/43,
Callable
1/18/28
@
100(a)(b)
.........................................................
5,840
5,827
ACREC
Ltd.,
Series
2021-FL1,
Class
AS,
5.29%
(TSFR1M+161bps),
10/16/36,
Callable
4/16/26
@
100(a)(b)
.................................................
3,388
3,387
ACRES
Commercial
Realty
Issuer
LLC
.......................................
Series
2026-FL4,
Class
A,
5.11%
(TSFR1M+145bps),
8/18/44,
Callable
8/18/28
@
100(a)(b)(h)
.......................................................
21,790
21,806
Series
2026-FL4,
Class
AS,
5.36%
(TSFR1M+170bps),
8/18/44,
Callable
8/18/28
@
100(a)(b)(h)
.......................................................
10,890
10,919
ACRES
LLC,
Series
2025-FL3,
Class
A,
5.30%
(TSFR1M+162bps),
8/18/40,
Callable
8/18/27
@
100(a)(b)(h)
....................................................
11,750
11,765
AGL
CLO
Ltd.
........................................................
Series
2020-3A,
Class
XR,
4.62%
(TSFR3M+95bps),
4/15/38,
Callable
4/15/27
@
100(a)
(b)
.............................................................
2,982
2,979
Series
2021-14A,
Class
AR,
4.80%
(TSFR3M+113bps),
12/2/34,
Callable
4/21/26
@
100(a)(b)
.........................................................
6,820
6,814
AGL
Core
CLO
Ltd.,
Series
2023-27A,
Class
XR,
4.47%
(TSFR3M+80bps),
1/21/39,
Callable
1/21/28
@
100(a)(b)
.................................................
2,888
2,879
Anchorage
Capital
CLO
Ltd.,
Series
2019-11A,
Class
XR2,
4.77%
(TSFR3M+110bps),
7/22/37,
Callable
7/22/26
@
100(a)(b)
....................................
2,286
2,284
Arbor
Realty
Collateralized
Loan
Obligation
Ltd.
................................
Series
2025-BTR1,
Class
A,
5.60%
(TSFR1M+193bps),
1/20/41,
Callable
5/20/27
@
100(a)(b)
.........................................................
8,070
8,073
Series
2025-BTR1,
Class
AS,
6.31%
(TSFR1M+264bps),
1/20/41,
Callable
5/20/27
@
100(a)(b)
.........................................................
15,475
15,567
Arbor
Realty
Commercial
Real
Estate
Notes
LLC
................................
Series
2025-FL1,
Class
A,
5.03%
(TSFR1M+135bps),
1/20/43,
Callable
1/20/28
@
100(a)(b)
.........................................................
8,990
8,989
Victory
Portfolios
IV
Victory
Pioneer
Multi-Asset
Ultrashort
Income
Fund
Schedule
of
Portfolio
Investments
—
continued
March
31,
2026
See
notes
to
financial
statements.
Security
Description
Principal
Amount
(000)
a
Value
(000)
Series
2025-FL1,
Class
B,
5.97%
(TSFR1M+229bps),
1/20/43,
Callable
1/20/28
@
100(a)(b)
.........................................................
$
6,980
$
6,974
Arbor
Realty
Commercial
Real
Estate
Notes
Ltd.
................................
Series
2021-FL4,
Class
A,
5.14%
(TSFR1M+146bps),
11/15/36,
Callable
4/15/26
@
100(a)(b)
.........................................................
18,796
18,796
Series
2022-FL1,
Class
A,
5.12%
(SOFR30A+145bps),
1/15/37,
Callable
4/15/26
@
100(a)(b)
.........................................................
6,247
6,247
AREIT
Ltd.
...........................................................
Series
2024-CRE9,
Class
A,
5.36%
(TSFR1M+169bps),
5/17/41(a)(b)(h)
...........
2,730
2,730
Series
2025-CRE10,
Class
A,
5.07%
(TSFR1M+139bps),
12/17/29,
Callable
7/17/27
@
100(a)(b)
.........................................................
35,350
35,357
Series
2025-CRE11,
Class
A,
5.23%
(TSFR1M+155bps),
7/25/43,
Callable
7/18/28
@
100(a)(b)(h)
.......................................................
13,130
13,154
ASP
PIF
CLO
I
LLC,
Series
2025-1A,
Class
A1,
5.14%
(TSFR3M+148bps),
1/15/38(a)(b)
..
15,000
14,954
Bain
Capital
Credit
CLO
Ltd.
..............................................
Series
2021-7A,
Class
A2R,
4.92%
(TSFR3M+125bps),
1/22/35,
Callable
4/22/26
@
100(a)(b)
.........................................................
6,500
6,456
Series
2022-4A,
Class
XR,
4.77%
(TSFR3M+110bps),
10/16/37,
Callable
10/16/26
@
100(a)(b)
.........................................................
3,750
3,750
Series
2022-6A,
Class
XR,
4.82%
(TSFR3M+115bps),
1/22/38,
Callable
1/22/27
@
100(a)(b)
.........................................................
4,000
4,000
BAR
Issuer
LLC,
Series
2026-FL1,
Class
A,
5.30%
(TSFR1M+160bps),
8/20/43,
Callable
9/20/28
@
100(a)(b)(h)
...............................................
16,400
16,390
Bardot
CLO
Ltd.,
Series
2019-2A,
Class
ARR,
4.65%
(TSFR3M+98bps),
10/22/32,
Callable
4/22/26
@
100(a)(b)
.................................................
10,940
10,937
Battery
Park
CLO
Ltd.,
Series
2019-1A,
Class
XR,
4.62%
(TSFR3M+95bps),
7/15/36,
Callable
4/15/26
@
100(a)(b)
.................................................
2,175
2,175
BCRED
BSL
Static
CLO
Ltd.,
Series
2025-1A,
Class
AR,
4.92%
(TSFR3M+125bps),
7/24/35,
Callable
4/24/26
@
100(a)(b)
..........................................
4,912
4,913
BDS
LLC
............................................................
Series
2024-FL13,
Class
A,
5.25%
(TSFR1M+158bps),
9/19/39,
Callable
8/19/28
@
100(a)(b)(h)
.......................................................
4,530
4,533
Series
2025-FL14,
Class
A,
4.96%
(TSFR1M+128bps),
10/17/42,
Callable
9/21/27
@
100(a)(b)(h)
.......................................................
10,910
10,910
Benefit
Street
Partners
CLO
XVII
Ltd.,
Series
2019-17A,
Class
XR2,
4.82%
(TSFR3M+115bps),
10/15/37,
Callable
10/15/26
@
100(a)(b)
...................
6,667
6,667
Blackrock
Rainier
CLO
VI
Ltd.,
Series
2021-6A,
Class
XR,
4.92%
(TSFR3M+125bps),
4/20/37,
Callable
7/20/27
@
100(a)(b)
....................................
14,887
14,847
BlueMountain
CLO
XXII
Ltd.,
Series
2018-22A,
Class
A1,
5.01%
(TSFR3M+134bps),
7/15/31,
Callable
4/15/26
@
100(a)(b)
....................................
1,216
1,216
BlueMountain
CLO
XXXIII
Ltd.,
Series
2021-33A,
Class
X,
4.67%
(TSFR3M+100bps),
10/20/38,
Callable
10/20/27
@
100(a)(b)
..................................
2,200
2,200
Brightwood
Capital
MM
CLO
Ltd.
..........................................
Series
2019-1A,
Class
A1R,
5.35%
(TSFR3M+168bps),
10/15/34,
Callable
4/15/26
@
100(a)(b)
.........................................................
18,500
18,490
Series
2023-1A,
Class
XR,
4.80%
(TSFR3M+105bps),
10/15/35,
Callable
10/15/26
@
100(a)(b)
.........................................................
2,850
2,850
Series
2025-1A,
Class
D,
8.58%
(TSFR3M+491bps),
4/15/36,
Callable
7/15/27
@
100(a)
(b)
.............................................................
3,000
2,942
Brsp
Ltd.
.............................................................
Series
2026-FL3,
Class
AS,
5.38%
(TSFR1M+170bps),
8/19/43,
Callable
9/19/28
@
100(a)(b)(h)
.......................................................
3,242
3,245
Series
2026-FL3,
Class
B,
5.63%
(TSFR1M+195bps),
8/19/43,
Callable
9/19/28
@
100(a)(b)(h)
.......................................................
10,381
10,390
BSPDF
Issuer
LLC,
Series
2026-FL3,
Class
A,
5.10%
(TSFR1M+145bps),
9/18/43,
Callable
9/18/28
@
100(a)(b)(h)
...............................................
12,330
12,328
BSPRT
Issuer
LLC
......................................................
Series
2024-FL11,
Class
A,
5.31%
(TSFR1M+164bps),
7/15/39,
Callable
9/15/27
@
100(a)(b)
.........................................................
9,920
9,958
Series
2025-FL12,
Class
A,
5.06%
(TSFR1M+139bps),
1/17/43,
Callable
4/17/28
@
100(a)(b)
.........................................................
9,660
9,649
BSPRT
Issuer
Ltd.,
Series
2022-FL8,
Class
A,
5.17%
(SOFR30A+150bps),
2/15/37,
Callable
4/15/26
@
100(a)(b)
.................................................
77
77
Victory
Portfolios
IV
Victory
Pioneer
Multi-Asset
Ultrashort
Income
Fund
Schedule
of
Portfolio
Investments
—
continued
March
31,
2026
See
notes
to
financial
statements.
Security
Description
Principal
Amount
(000)
a
Value
(000)
BXDL
Static
CLO
LLC,
Series
2025-1A,
Class
A1,
4.97%
(TSFR3M+130bps),
7/20/35,
Callable
7/20/26
@
100(a)(b)
..........................................
$
6,074
$
6,067
BXMT
Ltd.,
Series
2020-FL2,
Class
A,
4.94%
(TSFR1M+126bps),
2/15/38,
Callable
1/15/27
@
100(a)(b)(h)
....................................................
1,603
1,602
CarVal
CLO
IV
Ltd.,
Series
2021-1A,
Class
X,
4.52%
(TSFR3M+85bps),
3/31/38,
Callable
10/20/27
@
100(a)(b)
................................................
3,500
3,493
Cayuga
Park
CLO
Ltd.,
Series
2020-1A,
Class
XR2,
4.57%
(TSFR3M+90bps),
10/17/38,
Callable
1/17/28
@
100(a)(b)
..........................................
4,000
4,000
Cedar
Funding
XIV
CLO
Ltd.,
Series
2021-14A,
Class
X,
4.72%
(TSFR3M+105bps),
10/15/37,
Callable
10/15/26
@
100(a)(b)
..................................
729
728
Cedar
Funding
XV
CLO
Ltd.,
Series
2022-15A,
Class
XR,
4.59%
(TSFR3M+95bps),
1/20/39,
Callable
1/20/28
@
100(a)(b)
..........................................
3,500
3,500
Cerberus
Loan
Funding
XLIX
LLC
..........................................
Series
2024-5A,
Class
A,
5.02%
(TSFR3M+135bps),
1/15/34,
Callable
4/15/26
@
100(a)
(b)
.............................................................
4,750
4,745
Series
2024-5A,
Class
B,
5.42%
(TSFR3M+175bps),
1/15/34,
Callable
4/15/26
@
100(a)
(b)
.............................................................
6,000
5,996
Series
2024-5A,
Class
C,
5.77%
(TSFR3M+210bps),
1/15/34,
Callable
4/15/26
@
100(a)
(b)
.............................................................
3,000
2,997
Cerberus
Loan
Funding
XXXVII
LP,
Series
2022-1A,
Class
A2,
4.02%,
4/15/34,
Callable
4/15/26
@
100(a)
...................................................
4,000
3,948
Crown
Point
CLO
IV
Ltd.,
Series
2018-4A,
Class
C,
5.83%
(TSFR3M+216bps),
4/20/31,
Callable
4/20/26
@
100(a)(b)
..........................................
1,440
1,438
Deerpath
Capital
CLO
Ltd.,
Series
2021-1A,
Class
A1R,
5.47%
(TSFR3M+180bps),
7/15/36,
Callable
7/15/26
@
100(a)(b)
..........................................
10,675
10,677
Dwight
Issuer
LLC
......................................................
Series
2025-FL1,
Class
A,
5.34%
(TSFR1M+166bps),
6/18/42,
Callable
7/18/27
@
100(a)(b)
.........................................................
11,800
11,836
Series
2025-FL1,
Class
B,
6.47%
(TSFR1M+279bps),
6/18/42,
Callable
7/18/27
@
100(a)(b)
.........................................................
15,550
15,617
Elevation
CLO
Ltd.,
Series
2021-12A,
Class
XR,
4.77%
(TSFR3M+110bps),
4/20/37,
Callable
4/20/26
@
100(a)(b)
.................................................
2,874
2,873
Ellington
CLO
III
Ltd.,
Series
2018-3A,
Class
C,
6.18%
(TSFR3M+251bps),
7/20/30,
Callable
4/20/26
@
100(a)(b)
.................................................
3,600
3,595
Flatiron
CLO
Ltd.,
Series
2021-1A,
Class
XR,
4.77%
(TSFR3M+110bps),
10/19/37,
Callable
10/19/26
@
100(a)(b)
................................................
2,700
2,695
Fortress
Credit
Opportunities
IX
CLO
Ltd.,
Series
2017-9A,
Class
A1TR,
5.48%
(TSFR3M+181bps),
10/15/33(a)(b)
......................................
11,297
11,295
Fortress
Credit
Opportunities
XXIX
CLO
Ltd.
..................................
Series
2025-29A,
Class
A1,
4.92%
(TSFR3M+125bps),
4/20/33,
Callable
4/20/26
@
100(a)(b)
.........................................................
12,215
12,212
Series
2025-29A,
Class
B,
5.32%
(TSFR3M+165bps),
4/20/33,
Callable
4/20/26
@
100(a)(b)
.........................................................
8,180
8,180
Fortress
Credit
Opportunities
XXXI
CLO
Ltd.,
Series
2025-31A,
Class
A1,
5.17%
(TSFR3M+150bps),
7/20/33,
Callable
7/20/26
@
100(a)(b)
.....................
8,222
8,214
Fortress
Credit
Opportunities
XXXV
CLO
Ltd.
.................................
Series
2025-35A,
Class
A1,
5.07%
(TSFR3M+140bps),
7/20/33,
Callable
7/20/26
@
100(a)(b)
.........................................................
11,674
11,674
Series
2025-35A,
Class
B1,
5.52%
(TSFR3M+185bps),
7/20/33,
Callable
7/20/26
@
100(a)(b)
.........................................................
3,980
3,974
Series
2025-35A,
Class
C1,
6.17%
(TSFR3M+250bps),
7/20/33,
Callable
7/20/26
@
100(a)(b)
.........................................................
3,960
3,961
FS
Rialto
Issuer
LLC
....................................................
Series
2021-FL3,
Class
A,
5.04%
(TSFR1M+136bps),
11/16/36,
Callable
4/16/26
@
100(a)(b)
.........................................................
9,540
9,538
Series
2024-FL9,
Class
A,
5.31%
(TSFR1M+163bps),
10/19/39,
Callable
10/19/27
@
100(a)(b)
.........................................................
23,030
23,108
Series
2025-FL10,
Class
A,
5.06%
(TSFR1M+139bps),
8/19/42,
Callable
8/19/27
@
100(a)(b)(h)
.......................................................
13,250
13,244
Series
2026-FL11,
Class
A,
5.12%
(TSFR1M+145bps),
1/19/44,
Callable
3/19/29
@
100(a)(b)(h)
.......................................................
21,820
21,822
Funding
CLO
Ltd.,
Series
2020-6A,
Class
XR,
4.62%
(TSFR3M+95bps),
10/23/34,
Callable
10/23/26
@
100(a)(b)
................................................
950
950
Victory
Portfolios
IV
Victory
Pioneer
Multi-Asset
Ultrashort
Income
Fund
Schedule
of
Portfolio
Investments
—
continued
March
31,
2026
See
notes
to
financial
statements.
Security
Description
Principal
Amount
(000)
a
Value
(000)
GCRED
BSL
CLO
1,
Series
2025-BSL1A,
Class
A2,
4.96%
(TSFR3M+130bps),
1/20/34,
Callable
1/20/27
@
100(a)(b)
..........................................
$
8,000
$
7,989
Goldentree
Loan
Management
US
CLO
10
Ltd.,
Series
2021-10A,
Class
XR,
4.72%
(TSFR3M+105bps),
10/20/37,
Callable
10/20/26
@
100(a)(b)
...................
1,838
1,837
Golub
Capital
Partners
CLO
51M
LP,
Series
2021-51A,
Class
AR,
4.86%
(TSFR3M+120bps),
5/5/36,
Callable
5/5/26
@
100(a)(b)
......................................
6,000
5,977
Golub
Capital
Partners
CLO
61M,
Series
2022-61A,
Class
A1AR,
4.90%
(TSFR3M+123bps),
7/25/35,
Callable
7/25/26
@
100(a)(b)
....................................
20,460
20,426
Golub
Capital
Partners
Short
Duration
........................................
Series
2022-1A,
Class
A1R,
5.12%
(TSFR3M+145bps),
7/25/33,
Callable
4/25/26
@
100(a)(b)
.........................................................
4,953
4,936
Series
2022-1A,
Class
BR,
5.67%
(TSFR3M+200bps),
7/25/33,
Callable
4/25/26
@
100(a)(b)
.........................................................
9,377
9,358
Series
2022-1A,
Class
CR,
6.42%
(TSFR3M+275bps),
7/25/33,
Callable
4/25/26
@
100(a)(b)
.........................................................
11,990
11,965
Great
Lakes
CLO
Ltd.,
Series
2019-1A,
Class
X,
4.72%
(TSFR3M+105bps),
4/15/37,
Callable
4/15/27
@
100(a)(b)
.................................................
3,404
3,404
Great
Lakes
CLO
VI
LLC,
Series
2021-6A,
Class
XR,
4.77%
(TSFR3M+110bps),
7/15/37,
Callable
7/15/27
@
100(a)(b)
..........................................
4,842
4,850
Greystone
CRE
Notes
LLC
................................................
Series
2025-FL4,
Class
A,
5.15%
(TSFR1M+148bps),
1/15/43,
Callable
5/15/28
@
100(a)(b)(h)
.......................................................
17,710
17,710
Series
2025-FL4,
Class
AS,
5.81%
(TSFR1M+214bps),
1/15/43,
Callable
5/15/28
@
100(a)(b)(h)
.......................................................
4,030
4,032
Greywolf
CLO
IV
Ltd.,
Series
2019-1A,
Class
X,
4.78%
(TSFR3M+111bps),
4/17/34,
Callable
4/17/26
@
100(a)(b)
.................................................
150
150
GS
REFT,
Series
2026-FL1,
Class
A,
5.17%
(TSFR1M+150bps),
4/19/43,
Callable
9/19/28
@
100(a)(b)(h)
.......................................................
7,750
7,757
HPS
Loan
Management
Ltd.,
Series
10A-16,
Class
XR3,
4.62%
(TSFR3M+95bps),
4/20/34,
Callable
4/20/26
@
100(a)(b)
..........................................
429
429
KREF
Ltd.
............................................................
Series
2021-FL2,
Class
AS,
5.09%
(TSFR1M+141bps),
2/15/39,
Callable
4/15/26
@
100(a)(b)
.........................................................
10,000
9,992
Series
2022-FL3,
Class
A,
5.13%
(TSFR1M+145bps),
2/17/39,
Callable
4/17/26
@
100(a)(b)
.........................................................
12,043
12,043
Lake
Shore
MM
CLO
IV
Ltd.,
Series
2021-1A,
Class
XR,
4.97%
(TSFR3M+130bps),
1/15/37(a)(b)
......................................................
1,086
1,085
LCM
Ltd.,
Series
35A,
Class
BR,
5.32%
(TSFR3M+165bps),
10/15/34,
Callable
4/15/26
@
100(a)(b)
.........................................................
3,450
3,445
LMNT
CRE
LLC
.......................................................
Series
2025-FL3,
Class
A,
5.22%
(TSFR1M+155bps),
7/21/43,
Callable
5/21/28
@
100(a)(b)(h)
.......................................................
20,160
20,214
Series
2025-FL3,
Class
AS,
5.57%
(TSFR1M+190bps),
7/21/43,
Callable
5/21/28
@
100(a)(b)(h)
.......................................................
20,110
20,181
LoanCore
Issuer
LLC
....................................................
Series
2025-CRE8,
Class
A,
5.06%
(TSFR1M+139bps),
8/17/42,
Callable
8/17/27
@
100(a)(b)(h)
.......................................................
6,740
6,741
Series
2025-CRE9,
Class
A,
5.13%
(TSFR1M+145bps),
8/18/42,
Callable
5/15/28
@
100(a)(b)
.........................................................
11,250
11,250
LoanCore
Issuer
Ltd.
....................................................
Series
2021-CRE6,
Class
A,
5.09%
(TSFR1M+141bps),
11/15/38,
Callable
4/15/26
@
100(a)(b)
.........................................................
395
395
Series
2021-CRE6,
Class
AS,
5.44%
(TSFR1M+176bps),
11/15/38,
Callable
4/15/26
@
100(a)(b)
.........................................................
5,000
4,997
Series
2022-CRE7,
Class
A,
5.22%
(SOFR30A+155bps),
1/17/37,
Callable
4/17/26
@
100(a)(b)
.........................................................
11,330
11,324
Magnetite
XXII
Ltd.,
Series
2019-22A,
Class
X,
4.67%
(TSFR3M+100bps),
7/15/36,
Callable
4/15/26
@
100(a)(b)
.................................................
3,500
3,500
MCF
CLO
10
Ltd.,
Series
2023-1A,
Class
XR,
4.67%
(TSFR3M+100bps),
4/15/37,
Callable
4/15/27
@
100(a)(b)
.................................................
3,266
3,269
MCF
CLO
VII
LLC
.....................................................
Series
2017-3A,
Class
ER2,
10.67%
(TSFR3M+700bps),
7/20/37,
Callable
7/20/27
@
100(a)(b)
.........................................................
4,500
4,415
Victory
Portfolios
IV
Victory
Pioneer
Multi-Asset
Ultrashort
Income
Fund
Schedule
of
Portfolio
Investments
—
continued
March
31,
2026
See
notes
to
financial
statements.
Security
Description
Principal
Amount
(000)
a
Value
(000)
Series
2017-3A,
Class
XR2,
4.87%
(TSFR3M+120bps),
7/20/37,
Callable
7/20/27
@
100(a)(b)
.........................................................
$
3,529
$
3,529
MF1
LLC
............................................................
Series
2024-FL14,
Class
A,
5.41%
(TSFR1M+174bps),
3/19/39,
Callable
4/19/26
@
100(a)(b)
.........................................................
13,801
13,813
Series
2024-FL15,
Class
A,
5.37%
(TSFR1M+169bps),
8/18/41,
Callable
7/18/26
@
100(a)(b)
.........................................................
13,870
13,896
Series
2024-FL16,
Class
A,
5.22%
(TSFR1M+154bps),
11/18/39,
Callable
10/18/26
@
100(a)(b)
.........................................................
18,850
18,880
Series
2025-FL19,
Class
A,
5.17%
(TSFR1M+149bps),
5/18/42,
Callable
11/18/26
@
100(a)(b)
.........................................................
19,300
19,328
Series
2025-FL20,
Class
A,
5.13%
(TSFR1M+145bps),
2/18/43,
Callable
2/18/28
@
100(a)(b)
.........................................................
6,900
6,910
Series
2026-FL21,
Class
A,
5.03%
(TSFR1M+135bps),
2/18/41,
Callable
7/18/28
@
100(a)(b)(h)
.......................................................
12,290
12,265
Series
2026-FL21,
Class
AS,
5.23%
(TSFR1M+155bps),
2/18/41,
Callable
7/18/28
@
100(a)(b)(h)
.......................................................
9,704
9,709
MF1
Ltd.
.............................................................
Series
2021-FL7,
Class
A,
4.87%
(TSFR1M+119bps),
10/16/36,
Callable
4/16/26
@
100(a)(b)
.........................................................
3,559
3,558
Series
2021-FL7,
Class
AS,
5.24%
(TSFR1M+156bps),
10/16/36,
Callable
4/16/26
@
100(a)(b)
.........................................................
6,379
6,372
Series
2022-FL8,
Class
A,
5.03%
(TSFR1M+135bps),
2/19/37,
Callable
4/17/26
@
100(a)(b)
.........................................................
10,951
10,951
MidOcean
Credit
CLO
XI
Ltd.,
Series
2022-11A,
Class
A1R2,
4.88%
(TSFR3M+121bps),
1/18/36,
Callable
4/18/26
@
100(a)(b)
....................................
8,290
8,273
Monroe
Capital
MML
CLO
XII
Ltd.,
Series
2021-2A,
Class
A1,
5.44%
(TSFR3M+176bps),
9/14/33,
Callable
6/14/26
@
100(a)(b)
....................................
7,680
7,677
Monroe
Capital
MML
CLO
XIII
Ltd.
.........................................
Series
2022-1A,
Class
A1N,
5.34%
(TSFR3M+168bps),
2/24/34,
Callable
5/24/26
@
100(a)(b)
.........................................................
5,000
5,000
Series
2022-1A,
Class
B,
5.71%
(TSFR3M+205bps),
2/24/34,
Callable
5/24/26
@
100(a)
(b)
.............................................................
3,000
2,986
Monroe
Capital
MML
CLO
XV
LLC,
Series
2023-1A,
Class
AR,
4.94%
(TSFR3M+127bps),
9/23/35,
Callable
10/23/26
@
100(a)(b)
...................................
8,460
8,436
Morgan
Stanley
Eaton
Vance
CLO
Ltd.,
Series
2021-1A,
Class
X,
4.67%
(TSFR3M+100bps),
10/23/37,
Callable
10/23/27
@
100(a)(b)
..................................
4,000
4,000
Mountain
View
CLO
XVII
Ltd.,
Series
2023-1A,
Class
XR,
4.67%
(TSFR3M+100bps),
10/15/38,
Callable
10/15/27
@
100(a)(b)
..................................
1,313
1,313
New
Mountain
CLO
1
Ltd.,
Series
1A,
Class
X,
4.62%
(TSFR3M+95bps),
1/15/38,
Callable
1/15/27
@
100(a)(b)
.................................................
1,333
1,333
Northwoods
Capital
XI-B
Ltd.,
Series
2018-11BA,
Class
XR,
4.87%
(TSFR3M+120bps),
7/19/37,
Callable
7/19/26
@
100(a)(b)
....................................
2,211
2,210
OCP
CLO
Ltd.,
Series
2017-14A,
Class
XR,
4.77%
(TSFR3M+110bps),
7/20/37,
Callable
7/20/26
@
100(a)(b)
.................................................
1,750
1,750
Octagon
Investment
Partners
Ltd.,
Series
2020-5A,
Class
XRR,
4.57%
(TSFR3M+90bps),
4/15/37,
Callable
4/15/27
@
100(a)(b)
....................................
3,216
3,216
Octagon
Ltd.,
Series
2023-1A,
Class
XR,
4.52%
(TSFR3M+85bps),
10/20/38,
Callable
1/20/28
@
100(a)(b)
.......................................................
8,000
7,971
Owl
Rock
CLO
IV
Ltd.
..................................................
Series
2020-4A,
Class
A1R,
5.52%
(TSFR3M+186bps),
8/20/33,
Callable
5/20/26
@
100(a)(b)
.........................................................
2,001
2,000
Series
2020-4A,
Class
A2R,
5.82%
(TSFR3M+216bps),
8/20/33,
Callable
5/20/26
@
100(a)(b)
.........................................................
192
192
Owl
Rock
CLO
XXI
LLC
.................................................
Series
2025-21A,
Class
A,
5.07%
(TSFR3M+140bps),
7/24/34,
Callable
7/24/26
@
100(a)(b)
.........................................................
5,198
5,189
Series
2025-21A,
Class
B,
5.57%
(TSFR3M+190bps),
7/24/34,
Callable
7/24/26
@
100(a)(b)
.........................................................
3,290
3,275
Palmer
Square
CLO
Ltd.,
Series
2020-3A,
Class
X,
4.85%
(TSFR3M+120bps),
11/15/36,
Callable
11/15/26
@
100(a)(b)
.........................................
1,158
1,160
Victory
Portfolios
IV
Victory
Pioneer
Multi-Asset
Ultrashort
Income
Fund
Schedule
of
Portfolio
Investments
—
continued
March
31,
2026
See
notes
to
financial
statements.
Security
Description
Principal
Amount
(000)
a
Value
(000)
Pennantpark
CLO
IX
LLC
................................................
Series
2024-9A,
Class
A1RN,
5.02%
(TSFR3M+135bps),
4/20/34,
Callable
4/20/26
@
100(a)(b)
.........................................................
$
4,890
$
4,885
Series
2024-9A,
Class
A2R,
5.12%
(TSFR3M+145bps),
4/20/34,
Callable
4/20/26
@
100(a)(b)
.........................................................
4,400
4,392
PFP
Ltd.
.............................................................
Series
2024-11,
Class
A,
5.50%
(TSFR1M+183bps),
9/17/39,
Callable
9/17/27
@
100(a)
(b)(h)
...........................................................
1,233
1,235
Series
2026-13,
Class
A,
5.18%
(TSFR1M+150bps),
8/18/43,
Callable
7/18/28
@
100(a)
(b)
.............................................................
7,650
7,656
Series
2026-13,
Class
AS,
5.33%
(TSFR1M+165bps),
8/18/43,
Callable
7/18/28
@
100(a)(b)
.........................................................
10,950
10,957
Pikes
Peak
CLO
6,
Series
2020-6A,
Class
ARR,
4.60%
(TSFR3M+94bps),
5/18/34,
Callable
5/18/26
@
100(a)(b)
.................................................
14,300
14,286
Post
CLO
Ltd.,
Series
2021-1A,
Class
AR,
4.75%
(TSFR3M+108bps),
10/15/34,
Callable
4/15/26
@
100(a)(b)
.................................................
13,000
12,968
PRPM
Issuer
LLC,
Series
2026-CRE1,
Class
A,
5.35%
(TSFR1M+167bps),
3/19/43,
Callable
4/19/28
@
100(a)(b)(h)
...............................................
13,210
13,211
Rad
CLO
3
Ltd.,
Series
2019-3A,
Class
XR2,
4.72%
(TSFR3M+105bps),
7/15/37,
Callable
7/15/26
@
100(a)(b)
.................................................
2,644
2,644
Recette
CLO
Ltd.,
Series
2015-1A,
Class
AR3,
4.70%
(TSFR3M+103bps),
4/20/34,
Callable
7/20/26
@
100(a)(b)
.................................................
10,000
9,989
Regatta
IX
Funding
Ltd.,
Series
2017-1A,
Class
XR,
4.72%
(TSFR3M+105bps),
4/17/37,
Callable
4/17/26
@
100(a)(b)
..........................................
557
557
Regatta
VII
Funding
Ltd.,
Series
2016-1A,
Class
X,
4.80%
(TSFR3M+111bps),
6/20/34,
Callable
6/20/26
@
100(a)(b)
..........................................
265
264
Regatta
X
Funding
Ltd.,
Series
2017-3A,
Class
X,
4.67%
(TSFR3M+100bps),
7/17/37,
Callable
7/17/26
@
100(a)(b)
..........................................
3,092
3,087
Sculptor
CLO
XXX
Ltd.,
Series
30A,
Class
XR,
4.72%
(TSFR3M+105bps),
7/20/38,
Callable
7/20/27
@
100(a)(b)
.................................................
2,571
2,573
Signal
Peak
CLO
4
Ltd.
..................................................
Series
2017-4A,
Class
AR2,
4.79%
(TSFR3M+112bps),
10/26/34,
Callable
7/26/26
@
100(a)(b)
.........................................................
8,000
7,993
Series
2017-4A,
Class
XR2,
4.52%
(TSFR3M+85bps),
10/26/34,
Callable
7/26/26
@
100(a)(b)
.........................................................
1,000
1,000
Silver
Rock
CLO
II
Ltd.,
Series
2021-2A,
Class
X,
4.98%
(TSFR3M+131bps),
1/20/35,
Callable
4/20/26
@
100(a)(b)
..........................................
400
400
Silver
Rock
CLO
III,
Series
2023-3A,
Class
XR,
4.62%
(TSFR3M+95bps),
1/20/38,
Callable
1/20/28
@
100(a)(b)
.................................................
2,125
2,125
Silver
Rock
CLO
IV
Ltd.,
Series
2024-4A,
Class
X,
4.87%
(TSFR3M+120bps),
10/20/37,
Callable
10/20/26
@
100(a)(b)
.........................................
3,333
3,333
Sixth
Street
CLO
IX
Ltd.,
Series
2017-9A,
Class
X,
4.62%
(TSFR3M+95bps),
7/21/37,
Callable
7/21/26
@
100(a)(b)
..........................................
2,000
2,000
Sixth
Street
CLO
XII
Ltd.,
Series
2018-12A,
Class
XR2,
4.47%
(TSFR3M+80bps),
1/17/39,
Callable
1/17/28
@
100(a)(b)
..........................................
1,550
1,550
Sound
Point
CLO
V-R
Ltd.,
Series
2014-1RA,
Class
A,
5.08%
(TSFR3M+141bps),
7/18/31,
Callable
4/18/26
@
100(a)(b)
..........................................
3,292
3,292
Sound
Point
CLO
XVI
Ltd.,
Series
2017-2A,
Class
D,
7.53%
(TSFR3M+386bps),
7/25/30,
Callable
4/25/26
@
100(a)(b)
..........................................
3,000
2,999
Sound
Point
CLO
XX
Ltd.,
Series
2018-2A,
Class
A,
5.03%
(TSFR3M+136bps),
7/26/31,
Callable
4/26/26
@
100(a)(b)
..........................................
851
850
Sound
Point
CLO
XXXIII
Ltd.,
Series
2022-1A,
Class
AR,
4.77%
(TSFR3M+110bps),
4/20/35(a)(b)
......................................................
10,000
10,000
Starwood
LLC
.........................................................
Series
2024-SIF4A,
Class
A,
5.37%
(TSFR3M+170bps),
10/17/36,
Callable
4/17/26
@
100(a)(b)
.........................................................
14,000
14,006
Series
2024-SIF4A,
Class
C,
6.17%
(TSFR3M+250bps),
10/17/36,
Callable
4/17/26
@
100(a)(b)
.........................................................
2,390
2,391
Series
2025-SIF5A,
Class
A,
5.22%
(TSFR3M+155bps),
4/15/37,
Callable
10/15/26
@
100(a)(b)
.........................................................
10,110
10,110
Series
2025-SIF5A,
Class
D,
7.27%
(TSFR3M+360bps),
4/15/37,
Callable
10/15/26
@
100(a)(b)
.........................................................
2,130
2,134
Victory
Portfolios
IV
Victory
Pioneer
Multi-Asset
Ultrashort
Income
Fund
Schedule
of
Portfolio
Investments
—
continued
March
31,
2026
See
notes
to
financial
statements.
Security
Description
Principal
Amount
(000)
a
Value
(000)
STWD
Ltd.
...........................................................
Series
2021-FL2,
Class
A,
4.99%
(TSFR1M+131bps),
4/18/38,
Callable
4/16/26
@
100(a)(b)
.........................................................
$
933
$
933
Series
2022-FL3,
Class
A,
5.02%
(SOFR30A+135bps),
11/15/38,
Callable
4/15/26
@
100(a)(b)
.........................................................
660
660
Symphony
CLO
36
Ltd.,
Series
2025-52A,
Class
XR,
4.57%
(TSFR3M+90bps),
1/20/36,
Callable
1/16/27
@
100(a)(b)
..........................................
5,500
5,499
Symphony
CLO
XIX
Ltd.,
Series
2018-19A,
Class
A,
4.89%
(TSFR3M+122bps),
4/16/31,
Callable
4/16/26
@
100(a)(b)
..........................................
311
311
Trestles
CLO
IV
Ltd.,
Series
2021-4A,
Class
X,
4.69%
(TSFR3M+90bps),
10/30/38,
Callable
1/30/28
@
100(a)(b)
.................................................
4,000
4,000
Trimaran
CAVU
Ltd.,
Series
2022-2A,
Class
XR,
4.62%
(TSFR3M+95bps),
3/27/38,
Callable
4/20/27
@
100(a)(b)
.................................................
250
250
Trinitas
CLO
VII
Ltd.,
Series
2017-7A,
Class
A1R2,
4.73%
(TSFR3M+106bps),
1/25/35,
Callable
7/25/26
@
100(a)(b)
..........................................
12,000
11,965
Trinitas
CLO
XI
Ltd.,
Series
2019-11A,
Class
X,
4.86%
(TSFR3M+119bps),
7/15/34,
Callable
4/15/26
@
100(a)(b)
.................................................
690
690
TRTX
Issuer
Ltd.
.......................................................
Series
2022-FL5,
Class
A,
5.33%
(TSFR1M+165bps),
2/15/39,
Callable
4/15/26
@
100(a)(b)
.........................................................
12,964
12,964
Series
2022-FL5,
Class
AS,
5.83%
(TSFR1M+215bps),
2/15/39,
Callable
4/15/26
@
100(a)(b)
.........................................................
13,500
13,515
Series
2025-FL6,
Class
A,
5.22%
(TSFR1M+154bps),
9/18/42,
Callable
9/18/27
@
100(a)(b)(h)
.......................................................
18,650
18,680
Twin
Brook
CLO
LLC,
Series
2024-2A,
Class
CR,
1.99%
(TSFR3M+195bps),
10/20/35,
Callable
10/20/26
@
100(a)(b)
.........................................
13,000
12,935
Venture
CLO
Ltd.,
Series
2021-41A,
Class
A1RR,
4.80%
(TSFR3M+113bps),
1/20/34,
Callable
4/20/26
@
100(a)(b)
..........................................
10,680
10,681
Voya
CLO
Ltd.
........................................................
Series
2019-1A,
Class
X,
4.87%
(TSFR3M+120bps),
10/15/37,
Callable
10/15/26
@
100(a)(b)
.........................................................
3,333
3,334
Series
2024-6A,
Class
X,
4.77%
(TSFR3M+110bps),
1/20/38,
Callable
1/20/27
@
100(a)
(b)
.............................................................
3,143
3,143
Wellfleet
CLO
Ltd.,
Series
2022-1A,
Class
XR,
4.87%
(TSFR3M+120bps),
7/15/37,
Callable
7/15/26
@
100(a)(b)
.................................................
3,684
3,686
Wind
River
CLO
Ltd.,
Series
2023-1A,
Class
XR,
4.82%
(TSFR3M+115bps),
7/25/38,
Callable
7/25/27
@
100(a)(b)
..........................................
1,400
1,400
Woodmont
Trust,
Series
2023-12A,
Class
A1R,
5.07%
(TSFR3M+140bps),
10/25/32,
Callable
4/25/26
@
100(a)(b)
.................................................
12,330
12,330
Z
Capital
Credit
Partners
CLO
Ltd.
..........................................
Series
2019-1A,
Class
BR,
5.93%
(TSFR3M+226bps),
7/16/31,
Callable
4/16/26
@
100(a)(b)
.........................................................
6,500
6,498
Series
2019-1A,
Class
DR,
8.93%
(TSFR3M+526bps),
7/16/31,
Callable
4/16/26
@
100(a)(b)
.........................................................
6,000
5,994
Series
2021-1A,
Class
A2AR,
5.47%
(TSFR3M+180bps),
7/15/33,
Callable
4/15/26
@
100(a)(b)
.........................................................
12,010
12,010
Zais
CLO
Ltd.
.........................................................
Series
2019-13A,
Class
A1AR,
4.97%
(TSFR3M+130bps),
7/15/32,
Callable
4/15/26
@
100(a)(b)
.........................................................
483
483
Series
2020-16A,
Class
A1R2,
4.80%
(TSFR3M+113bps),
10/20/34,
Callable
4/20/26
@
100(a)(b)
.........................................................
8,000
7,965
1,301,592
Total
Collateralized
Loan
Obligations
(Cost
$1,300,967)
a
a
a
1,301,592
Collateralized
Mortgage
Obligations
(14.3%)
Agency
CMO
Floating
(2.7%):
Fannie
Mae
Trust,
Series
2003-W6,
Class
F,
4.13%
(SOFR30A+46bps),
9/25/42,
Callable
4/25/26
@
100(b)
...................................................
640
638
Federal
Home
Loan
Mortgage
Corporation
.....................................
Series
2003-107,
Class
FD,
4.28%
(SOFR30A+61bps),
11/25/33(b)
...............
60
60
Series
2004-54,
Class
FN,
4.23%
(SOFR30A+56bps),
7/25/34(b)
................
16
16
Series
2006-104,
Class
GF,
4.10%
(SOFR30A+43bps),
11/25/36(b)
...............
40
40
Victory
Portfolios
IV
Victory
Pioneer
Multi-Asset
Ultrashort
Income
Fund
Schedule
of
Portfolio
Investments
—
continued
March
31,
2026
See
notes
to
financial
statements.
Security
Description
Principal
Amount
(000)
a
Value
(000)
Series
2006-11,
Class
FB,
4.08%
(SOFR30A+41bps),
3/25/36(b)
.................
$
9
$
9
Series
2006-115,
Class
BF,
4.02%
(SOFR30A+35bps),
12/25/36(b)
...............
20
20
Series
2006-34,
Class
FA,
4.09%
(SOFR30A+42bps),
5/25/36(b)
.................
52
52
Series
2006-56,
Class
FC,
4.07%
(SOFR30A+40bps),
7/25/36(b)
.................
26
26
Series
2006-70,
Class
BF,
4.33%
(SOFR30A+66bps),
8/25/36(b)
.................
6
6
Series
2007-58,
Class
FA,
4.03%
(SOFR30A+36bps),
6/25/37(b)
.................
30
29
Series
2025-85,
Class
FH,
4.56%
(SOFR30A+90bps),
10/25/55(b)
................
29,953
30,104
Series
2106,
Class
F,
4.24%
(SOFR30A+56bps),
12/15/28(b)
...................
25
24
Series
2122,
Class
FD,
4.14%
(SOFR30A+46bps),
2/15/29(b)
...................
14
14
Series
2186,
Class
FY,
4.39%
(SOFR30A+71bps),
4/15/28(b)
...................
5
5
Series
2368,
Class
AF,
4.74%
(SOFR30A+106bps),
10/15/31(b)
.................
12
12
Series
2411,
Class
FR,
4.39%
(SOFR30A+71bps),
6/15/31(b)
...................
25
25
Series
2432,
Class
FH,
4.49%
(SOFR30A+81bps),
3/15/32(b)
...................
32
32
Series
2471,
Class
FD,
4.79%
(SOFR30A+111bps),
3/15/32(b)
..................
52
53
Series
2498,
Class
FQ,
4.39%
(SOFR30A+71bps),
9/15/32(b)
...................
21
21
Series
2543,
Class
EF,
4.14%
(SOFR30A+46bps),
12/15/32(b)
..................
15
15
Series
2551,
Class
FD,
4.19%
(SOFR30A+51bps),
1/15/33(b)
...................
98
98
Series
2567,
Class
FJ,
4.19%
(SOFR30A+51bps),
2/15/33(b)
...................
68
68
Series
2577,
Class
FA,
4.34%
(SOFR30A+66bps),
2/15/33(b)
...................
28
28
Series
2585,
Class
FD,
4.29%
(SOFR30A+61bps),
12/15/32(b)
..................
2
2
Series
2614,
Class
FV,
5.28%
(SOFR30A+161bps),
5/15/33(b)
..................
37
38
Series
2631,
Class
FC,
4.19%
(SOFR30A+51bps),
6/15/33(b)
...................
46
46
Series
2711,
Class
FA,
4.79%
(SOFR30A+111bps),
11/15/33(b)
.................
24
25
Series
2976,
Class
LF,
4.13%
(SOFR30A+45bps),
5/15/35(b)
...................
117
116
Series
3012,
Class
FE,
4.04%
(SOFR30A+36bps),
8/15/35(b)
...................
3
3
Series
3067,
Class
FA,
4.14%
(SOFR30A+46bps),
11/15/35(b)
..................
23
23
Series
3117,
Class
EF,
4.14%
(SOFR30A+46bps),
2/15/36(b)
...................
48
48
Series
3122,
Class
FP,
4.09%
(SOFR30A+41bps),
3/15/36(b)
...................
32
32
Series
3147,
Class
PF,
4.09%
(SOFR30A+41bps),
4/15/36(b)
...................
20
20
Series
3175,
Class
FE,
4.10%
(SOFR30A+42bps),
6/15/36(b)
...................
155
153
Series
3191,
Class
FE,
4.19%
(SOFR30A+51bps),
7/15/36(b)
...................
9
9
Series
3221,
Class
FW,
4.21%
(SOFR30A+53bps),
9/15/36(b)
...................
87
87
Series
3222,
Class
FN,
4.19%
(SOFR30A+51bps),
9/15/36(b)
...................
25
24
Series
3247,
Class
FA,
4.04%
(SOFR30A+36bps),
8/15/36(b)
...................
79
78
Series
3266,
Class
F,
4.09%
(SOFR30A+41bps),
1/15/37(b)
....................
146
145
Series
3307,
Class
FT,
4.03%
(SOFR30A+35bps),
7/15/34(b)
...................
59
58
Series
3315,
Class
F,
4.13%
(SOFR30A+45bps),
5/15/37(b)
....................
4
4
Series
3376,
Class
FM,
4.41%
(SOFR30A+73bps),
10/15/37(b)
..................
19
19
Series
3560,
Class
FA,
5.04%
(SOFR30A+136bps),
5/15/37(b)
..................
79
81
Series
3708,
Class
PF,
4.14%
(SOFR30A+46bps),
7/15/40(b)
...................
19
19
Series
3867,
Class
FD,
4.14%
(SOFR30A+46bps),
5/15/41(b)
...................
9
9
Series
4056,
Class
QF,
4.14%
(SOFR30A+46bps),
12/15/41(b)
..................
13
12
Series
5563,
Class
FB,
4.61%
(SOFR30A+95bps),
6/25/55(b)
...................
11,592
11,670
Series
5574,
Class
F,
4.56%
(SOFR30A+90bps),
9/25/55(b)
....................
30,002
30,135
Series
5576,
Class
FD,
4.51%
(SOFR30A+85bps),
9/25/55(b)
...................
6,612
6,632
Series
5592,
Class
PF,
4.56%
(SOFR30A+90bps),
5/25/55(b)
...................
23,847
23,965
Series
5594,
Class
FA,
4.56%
(SOFR30A+90bps),
11/25/53(b)
..................
25,726
25,852
Federal
Home
Loan
Mortgage
Corporation,
REMICS
.............................
Series
2377,
Class
FE,
4.39%
(SOFR30A+71bps),
11/15/31,
Callable
4/15/26
@
100(b)
11
11
Series
2439,
Class
F,
4.79%
(SOFR30A+111bps),
3/15/32(b)
....................
62
63
Series
2470,
Class
AF,
4.79%
(SOFR30A+111bps),
3/15/32(b)
..................
78
79
Series
2916,
Class
NF,
4.04%
(SOFR30A+36bps),
1/15/35(b)
...................
18
18
Series
3042,
Class
PF,
4.04%
(SOFR30A+36bps),
8/15/35(b)
...................
18
18
Series
3102,
Class
FG,
4.09%
(SOFR30A+41bps),
1/15/36(b)
...................
10
10
Series
3117,
Class
FE,
4.09%
(SOFR30A+41bps),
2/15/36(b)
...................
92
91
Series
3173,
Class
FC,
4.21%
(SOFR30A+53bps),
6/15/36(b)
...................
73
73
Series
3181,
Class
HF,
4.29%
(SOFR30A+61bps),
7/15/36(b)
...................
119
118
Series
3239,
Class
EF,
4.14%
(SOFR30A+46bps),
11/15/36(b)
..................
91
90
Series
3239,
Class
FB,
4.14%
(SOFR30A+46bps),
11/15/36(b)
..................
46
45
Series
3373,
Class
FB,
4.37%
(SOFR30A+69bps),
10/15/37(b)
..................
200
199
Series
3610,
Class
FA,
4.49%
(SOFR30A+81bps),
12/15/39(b)
..................
119
119
Federal
Home
Loan
Mortgage
Corporation,
STRIPS
..............................
Series
237,
Class
F14,
4.19%
(SOFR30A+51bps),
5/15/36(b)
...................
45
45
Victory
Portfolios
IV
Victory
Pioneer
Multi-Asset
Ultrashort
Income
Fund
Schedule
of
Portfolio
Investments
—
continued
March
31,
2026
See
notes
to
financial
statements.
Security
Description
Principal
Amount
(000)
a
Value
(000)
Series
239,
Class
F30,
4.09%
(SOFR30A+41bps),
8/15/36(b)
...................
$
189
$
187
Series
244,
Class
F22,
4.14%
(SOFR30A+46bps),
12/15/36(b)
..................
52
52
Federal
National
Mortgage
Association
.......................................
Series
1997-46,
Class
FA,
4.29%
(SOFR30A+61bps),
7/18/27(b)
.................
—(e)
—(e)
Series
2000-47,
Class
FD,
4.33%
(SOFR30A+66bps),
12/25/30(b)
................
9
9
Series
2001-35,
Class
F,
4.38%
(SOFR30A+71bps),
7/25/31(b)
..................
41
41
Series
2001-37,
Class
F,
4.28%
(SOFR30A+61bps),
8/25/31(b)
..................
9
9
Series
2001-50,
Class
FQ,
4.38%
(SOFR30A+71bps),
11/25/31(b)
................
85
85
Series
2001-65,
Class
F,
4.38%
(SOFR30A+71bps),
11/25/31(b)
.................
37
37
Series
2001-69,
Class
FA,
4.38%
(SOFR30A+71bps),
7/25/31(b)
.................
26
26
Series
2002-1,
Class
FC,
4.48%
(SOFR30A+81bps),
1/25/32(b)
.................
31
31
Series
2002-13,
Class
FD,
4.68%
(SOFR30A+101bps),
3/25/32(b)
................
48
48
Series
2002-34,
Class
FA,
4.29%
(SOFR30A+61bps),
5/18/32(b)
.................
23
23
Series
2002-56,
Class
FN,
4.78%
(SOFR30A+111bps),
7/25/32(b)
................
46
46
Series
2002-58,
Class
FD,
4.38%
(SOFR30A+71bps),
8/25/32(b)
................
18
18
Series
2002-77,
Class
F,
4.38%
(SOFR30A+71bps),
12/25/32(b)
.................
34
34
Series
2002-82,
Class
FB,
4.28%
(SOFR30A+61bps),
12/25/32(b)
................
24
24
Series
2002-90,
Class
FH,
4.28%
(SOFR30A+61bps),
9/25/32(b)
................
33
33
Series
2002-92,
Class
FB,
4.43%
(SOFR30A+76bps),
4/25/30(b)
.................
14
14
Series
2003-31,
Class
FM,
4.28%
(SOFR30A+61bps),
4/25/33(b)
................
84
84
Series
2003-7,
Class
FA,
4.53%
(SOFR30A+86bps),
2/25/33(b)
..................
27
27
Series
2005-W3,
Class
2AF,
4.00%
(SOFR30A+33bps),
3/25/45,
Callable
4/25/26
@
100(b)
...........................................................
182
181
Series
2007-100,
Class
YF,
4.33%
(SOFR30A+66bps),
10/25/37(b)
...............
16
16
Series
2007-103,
Class
AF,
4.78%
(SOFR30A+111bps),
3/25/37(b)
...............
24
25
Series
2007-57,
Class
FA,
4.01%
(SOFR30A+34bps),
6/25/37(b)
.................
7
7
Series
2007-66,
Class
FB,
4.18%
(SOFR30A+51bps),
7/25/37(b)
.................
8
8
Series
2007-85,
Class
FG,
4.28%
(SOFR30A+61bps),
9/25/37(b)
................
86
85
Series
2007-91,
Class
FB,
4.38%
(SOFR30A+71bps),
10/25/37(b)
................
119
119
Series
2007-93,
Class
FD,
4.33%
(SOFR30A+66bps),
9/25/37(b)
................
22
22
Series
2007-98,
Class
FD,
4.23%
(SOFR30A+56bps),
6/25/37(b)
................
11
11
Series
2007-W1,
Class
1AF1,
4.04%
(SOFR30A+37bps),
11/25/46,
Callable
4/25/27
@
100(b)
...........................................................
165
163
Series
2008-6,
Class
FA,
4.48%
(SOFR30A+81bps),
2/25/38(b)
..................
14
14
Series
2009-113,
Class
FB,
4.33%
(SOFR30A+66bps),
1/25/40(b)
................
41
41
Series
2010-43,
Class
FD,
4.38%
(SOFR30A+71bps),
5/25/40(b)
................
17
17
Series
2010-43,
Class
IF,
4.28%
(SOFR30A+61bps),
5/25/40(b)
.................
70
70
Series
2012-40,
Class
PF,
4.28%
(SOFR30A+61bps),
4/25/42(b)
.................
63
62
Series
2024-98,
Class
F,
4.56%
(SOFR30A+90bps),
1/25/55(b)
..................
18,273
18,346
Series
2025-15,
Class
FE,
4.56%
(SOFR30A+90bps),
4/25/55(b)
.................
18,349
18,435
Series
2025-43,
Class
FH,
4.51%
(SOFR30A+85bps),
1/25/55(b)
................
25,878
25,952
Series
2025-77,
Class
FC,
4.51%
(SOFR30A+85bps),
5/25/55(b)
.................
15,774
15,823
Series
2025-78,
Class
PF,
4.56%
(SOFR30A+90bps),
9/25/55(b)
.................
7,757
7,792
Federal
National
Mortgage
Association,
REMICS
................................
Series
2001-72,
Class
FB,
4.68%
(SOFR30A+101bps),
12/25/31(b)
...............
38
38
Series
2001-81,
Class
FL,
4.44%
(SOFR30A+76bps),
1/18/32(b)
.................
11
11
Series
2002-93,
Class
FH,
4.28%
(SOFR30A+61bps),
1/25/33(b)
................
34
33
Series
2003-42,
Class
JF,
4.28%
(SOFR30A+61bps),
5/25/33(b)
.................
35
35
Series
2003-8,
Class
FJ,
4.13%
(SOFR30A+46bps),
2/25/33(b)
..................
12
12
Series
2004-52,
Class
FW,
4.18%
(SOFR30A+51bps),
7/25/34(b)
................
66
66
Series
2005-83,
Class
KT,
4.08%
(SOFR30A+41bps),
10/25/35(b)
................
58
58
Series
2005-83,
Class
LF,
4.09%
(SOFR30A+42bps),
2/25/35(b)
.................
45
45
Series
2006-42,
Class
CF,
4.23%
(SOFR30A+56bps),
6/25/36(b)
.................
74
74
Series
2006-82,
Class
F,
4.35%
(SOFR30A+68bps),
9/25/36(b)
..................
18
18
Series
2007-110,
Class
FA,
4.40%
(SOFR30A+73bps),
12/25/37(b)
...............
22
22
Series
2007-13,
Class
FA,
4.03%
(SOFR30A+36bps),
3/25/37(b)
.................
35
35
Series
2007-2,
Class
FT,
4.03%
(SOFR30A+36bps),
2/25/37(b)
..................
145
143
Series
2007-41,
Class
FA,
4.18%
(SOFR30A+51bps),
5/25/37(b)
.................
22
22
Series
2007-50,
Class
FN,
4.02%
(SOFR30A+35bps),
6/25/37(b)
................
91
90
Series
2007-7,
Class
FJ,
3.98%
(SOFR30A+31bps),
2/25/37(b)
..................
58
57
Series
2007-92,
Class
OF,
4.35%
(SOFR30A+68bps),
9/25/37(b)
.................
36
36
Series
2008-88,
Class
FA,
5.00%
(SOFR30A+133bps),
10/25/38(b)
...............
61
63
Freddie
Mac
Strips,
Series
239,
Class
F29,
4.04%
(SOFR30A+36bps),
8/15/36(b)
.........
44
43
Victory
Portfolios
IV
Victory
Pioneer
Multi-Asset
Ultrashort
Income
Fund
Schedule
of
Portfolio
Investments
—
continued
March
31,
2026
See
notes
to
financial
statements.
Security
Description
Principal
Amount
(000)
a
Value
(000)
Government
National
Mortgage
Association
....................................
Series
2003-7,
Class
FB,
3.99%
(TSFR1M+31bps),
1/16/33(b)
..................
$
1
$
1
Series
2005-16,
Class
FA,
4.04%
(TSFR1M+36bps),
2/20/35(b)
.................
132
130
Series
2005-3,
Class
FC,
4.04%
(TSFR1M+36bps),
1/16/35(b)
..................
133
132
Series
2008-69,
Class
FA,
4.29%
(TSFR1M+61bps),
8/20/38(b)
.................
52
52
Series
2009-66,
Class
UF,
4.79%
(TSFR1M+111bps),
8/16/39(b)
.................
51
52
Series
2009-92,
Class
FJ,
4.47%
(TSFR1M+79bps),
10/16/39(b)
.................
36
36
221,000
Agency
CMO
Other
(0.0%):(i)
Federal
National
Mortgage
Association
.......................................
Series
2005-W3,
Class
3A,
4.84%,
4/25/45,
Callable
4/25/26
@
100(d)
............
18
18
Series
2005-W4,
Class
3A,
5.62%,
6/25/45,
Callable
9/25/27
@
100(d)
............
19
19
37
Commercial
MBS
(3.7%):
BLP
Commercial
Mortgage
Trust,
Series
2024-IND2,
Class
A,
5.01%
(TSFR1M+134bps),
3/15/41(a)(b)(h)
....................................................
23,370
23,375
BX
Commercial
Mortgage
Trust
............................................
Series
2021-21M,
Class
A,
4.52%
(TSFR1M+84bps),
10/15/36(a)(b)(h)
............
1,458
1,457
Series
2021-CIP,
Class
B,
5.06%
(TSFR1M+139bps),
12/15/38(a)(b)(h)
............
10,162
10,152
Series
2024-AIRC,
Class
A,
5.36%
(TSFR1M+169bps),
8/15/41(a)(b)(h)
...........
11,795
11,806
Series
2024-SLCT,
Class
A,
5.00%
(TSFR1M+132bps),
1/15/42(a)(b)(h)
...........
12,960
12,911
Series
2024-SLCT,
Class
E,
7.06%
(TSFR1M+339bps),
1/15/42(a)(b)(h)
...........
5,080
5,070
BX
Trust,
Series
2021-RISE,
Class
A,
4.53%
(TSFR1M+86bps),
11/15/36(a)(b)(h)
........
8,433
8,428
BXP
Trust,
Series
2017-CQHP,
Class
B,
4.82%
(TSFR1M+115bps),
11/15/34(a)(b)(h)
.....
8,000
7,475
CG-CCRE
Commercial
Mortgage
Trust,
Series
2014-FL1,
Class
B,
4.94%
(TSFR1M+126bps),
6/15/31,
Callable
6/15/26
@
100(a)(b)(h)
..................................
2,171
2,144
CLNY
Trust,
Series
2019-IKPR,
Class
B,
5.51%
(TSFR1M+184bps),
11/15/38(a)(b)(h)
....
7,500
7,387
COMM
Mortgage
Trust,
Series
2024-WCL1,
Class
A,
5.51%
(TSFR1M+184bps),
6/15/41(a)
(b)(h)
...........................................................
14,000
13,952
EQUS
Mortgage
Trust,
Series
2021-EQAZ,
Class
A,
4.69%
(TSFR1M+102bps),
10/15/38,
Callable
10/15/26
@
100(a)(b)(h)
.......................................
9,141
9,135
GS
Mortgage
Securities
Corp.
Trust
..........................................
Series
2018-TWR,
Class
A,
4.87%
(TSFR1M+120bps),
7/15/31(a)(b)(h)
...........
8,720
6,649
Series
2020-DUNE,
Class
A,
5.04%
(TSFR1M+136bps),
12/15/36(a)(b)(h)
.........
9,093
9,081
Series
2020-DUNE,
Class
E,
6.44%
(TSFR1M+276bps),
12/15/36(a)(b)(h)
.........
4,078
3,893
HIH
Trust,
Series
2024-61P,
Class
A,
5.51%
(TSFR1M+184bps),
10/15/41(a)(b)(h)
........
9,435
9,435
Hilt
Commercial
Mortgage
Trust
............................................
Series
2024-ORL,
Class
A,
5.21%
(TSFR1M+154bps),
5/15/37(a)(b)(h)
............
3,980
3,977
Series
2024-ORL,
Class
B,
5.61%
(TSFR1M+194bps),
5/15/37(a)(b)(h)
............
5,470
5,467
HTL
Commercial
Mortgage
Trust
...........................................
Series
2024-T53,
Class
C,
7.09%,
5/10/39(a)(d)(h)
...........................
1,000
1,009
Series
2024-T53,
Class
D,
8.20%,
5/10/39(a)(d)(h)
...........................
4,515
4,573
HYT
Commercial
Mortgage
Trust,
Series
2024-RGCY,
Class
A,
5.51%
(TSFR1M+184bps),
9/15/41(a)(b)(h)
....................................................
7,255
7,255
J.P.
Morgan
Chase
Commercial
Mortgage
Securities
Trust
..........................
Series
2018-WPT,
Class
CFL,
5.56%
(TSFR1M+189bps),
7/5/33(a)(b)(h)
..........
4,000
2,840
Series
2019-BKWD,
Class
C,
5.89%
(TSFR1M+221bps),
9/15/29(a)(b)(h)
..........
3,600
3,078
Series
2019-MFP,
Class
E,
5.88%
(TSFR1M+221bps),
7/15/36(a)(b)(h)
............
4,226
2,916
Series
2024-OMNI,
Class
B,
5.80%,
10/5/39(a)(d)(h)
.........................
2,200
2,202
KIND
Trust,
Series
2021-KIND,
Class
A,
4.74%
(TSFR1M+106bps),
8/15/38(a)(b)(h)
.....
9,917
9,868
MCR
Mortgage
Trust
....................................................
Series
2024-HF1,
Class
A,
5.47%
(TSFR1M+179bps),
12/15/41(a)(b)(h)
...........
3,682
3,682
Series
2024-HTL,
Class
B,
6.08%
(TSFR1M+241bps),
2/15/37(a)(b)(h)
............
5,582
5,575
Series
2024-TWA,
Class
A,
5.92%,
6/12/39(a)(h)
............................
4,330
4,361
MHP
Commercial
Mortgage
Trust,
Series
2025-MHIL2,
Class
A,
5.17%
(TSFR1M+150bps),
9/15/40(a)(b)(h)
....................................................
11,480
11,429
Morgan
Stanley
Capital
I
Trust,
Series
2018-BOP,
Class
B,
4.97%
(TSFR1M+130bps),
8/15/33(a)(b)(h)
....................................................
7,980
5,246
Natixis
Commercial
Mortgage
Securities
Trust,
Series
2019-MILE,
Class
B,
5.55%
(TSFR1M+188bps),
7/15/36(a)(b)(h)
.....................................
3,490
3,304
PRM
Trust,
Series
2025-PRM6,
Class
E,
6.58%,
7/5/33(a)(d)(h)
.....................
4,350
4,330
SHR
Trust,
Series
2024-LXRY,
Class
A,
5.62%
(TSFR1M+195bps),
10/15/41(a)(b)(h)
.....
18,840
18,816
Victory
Portfolios
IV
Victory
Pioneer
Multi-Asset
Ultrashort
Income
Fund
Schedule
of
Portfolio
Investments
—
continued
March
31,
2026
See
notes
to
financial
statements.
Security
Description
Principal
Amount
(000)
a
Value
(000)
SKY
Trust,
Series
2025-LINE,
Class
A,
6.26%
(TSFR1M+259bps),
4/15/42(a)(b)
.........
$
8,111
$
8,141
SREIT
Trust,
Series
2021-MFP2,
Class
A,
4.61%
(TSFR1M+94bps),
11/15/36(a)(b)(h)
.....
15,900
15,890
THPT
Mortgage
Trust
...................................................
Series
2023-THL,
Class
A,
7.00%,
12/10/34(a)(d)(h)
.........................
5,431
5,470
Series
2023-THL,
Class
B,
7.67%,
12/10/34(a)(d)(h)
.........................
4,150
4,179
TX
Trust,
Series
2024-HOU,
Class
A,
5.26%
(TSFR1M+159bps),
6/15/39(a)(b)(h)
........
6,000
5,992
Velocity
Commercial
Capital
Loan
Trust
......................................
Series
2023-1,
Class
A,
6.47%,
1/25/53,
Callable
12/25/27
@
100(a)(d)
............
1,388
1,394
Series
2024-1,
Class
A,
6.55%,
1/25/54,
Callable
5/25/28
@
100(a)(d)
.............
3,017
3,050
Series
2024-2,
Class
A,
6.58%,
4/25/54,
Callable
12/25/33
@
100(a)(d)
............
2,638
2,668
Series
2026-1,
Class
A,
5.10%,
2/25/56,
Callable
2/25/29
@
100(a)(d)
.............
5,492
5,415
Wells
Fargo
Commercial
Mortgage
Trust,
Series
2026-1250B,
Class
A,
4.83%,
3/10/41(a)(d)(h)
3,740
3,704
XCAL
Mortgage
Trust,
Series
2019-1,
Class
A,
7.53%
(TSFR1M+386bps),
11/6/23(a)(b)(c)(f)
(h)
.............................................................
8,715
610
XCALI
Mortgage
Trust,
Series
2020-5,
Class
A,
7.05%
(TSFR1M+337bps),
5/15/26(a)(b)(h)
826
823
299,614
Private
CMO
Floating
(6.5%):
Bellemeade
Re
Ltd.,
Series
2025-1,
Class
M1A,
5.21%
(SOFR30A+155bps),
10/25/35,
Callable
8/25/28
@
100(a)(b)
..........................................
2,069
2,069
Chase
Mortgage
Finance
Corp.
.............................................
Series
2021-CL1,
Class
M1,
4.86%
(SOFR30A+120bps),
2/25/50,
Callable
6/25/39
@
100(a)(b)
.........................................................
6,012
5,869
Series
2021-CL1,
Class
M2,
5.01%
(SOFR30A+135bps),
2/25/50,
Callable
6/25/39
@
100(a)(b)
.........................................................
1,556
1,509
Series
2021-CL1,
Class
M3,
5.21%
(SOFR30A+155bps),
2/25/50,
Callable
6/25/39
@
100(a)(b)
.........................................................
896
868
Connecticut
Avenue
Securities
Trust
.........................................
Series
2022-R01,
Class
1M1,
4.66%
(SOFR30A+100bps),
12/25/41,
Callable
12/25/26
@
100(a)(b)
.........................................................
1,134
1,133
Series
2022-R02,
Class
2M2,
6.66%
(SOFR30A+300bps),
1/25/42,
Callable
1/25/27
@
100(a)(b)
.........................................................
13,512
13,654
Series
2022-R09,
Class
2M1,
6.16%
(SOFR30A+250bps),
9/25/42,
Callable
9/25/27
@
100(a)(b)
.........................................................
1,047
1,057
Series
2023-R03,
Class
2M1,
6.16%
(SOFR30A+250bps),
4/25/43,
Callable
4/25/28
@
100(a)(b)
.........................................................
1,137
1,147
Series
2023-R06,
Class
1M1,
5.36%
(SOFR30A+170bps),
7/25/43,
Callable
7/25/28
@
100(a)(b)
.........................................................
1,721
1,723
Series
2023-R07,
Class
2M1,
5.61%
(SOFR30A+195bps),
9/25/43,
Callable
9/25/28
@
100(a)(b)
.........................................................
450
451
Series
2024-R01,
Class
1M1,
4.71%
(SOFR30A+105bps),
1/25/44,
Callable
1/25/29
@
100(a)(b)
.........................................................
1,680
1,679
Series
2024-R02,
Class
1M1,
4.76%
(SOFR30A+110bps),
2/25/44,
Callable
2/25/29
@
100(a)(b)
.........................................................
1,363
1,362
Series
2024-R03,
Class
2M1,
4.81%
(SOFR30A+115bps),
3/25/44,
Callable
3/25/29
@
100(a)(b)
.........................................................
4,245
4,241
Series
2024-R03,
Class
2M2,
5.61%
(SOFR30A+195bps),
3/25/44,
Callable
3/25/29
@
100(a)(b)
.........................................................
10,370
10,386
Series
2024-R04,
Class
1A1,
4.66%
(SOFR30A+100bps),
5/25/44,
Callable
5/25/29
@
100(a)(b)
.........................................................
20,977
20,970
Series
2024-R04,
Class
1M1,
4.76%
(SOFR30A+110bps),
5/25/44,
Callable
5/25/29
@
100(a)(b)
.........................................................
802
802
Series
2024-R05,
Class
2A1,
4.66%
(SOFR30A+100bps),
7/25/44,
Callable
7/25/29
@
100(a)(b)
.........................................................
16,400
16,359
Series
2024-R06,
Class
1A1,
4.81%
(SOFR30A+115bps),
9/25/44,
Callable
9/25/29
@
100(a)(b)
.........................................................
7,648
7,645
Series
2025-R01,
Class
1A1,
4.61%
(SOFR30A+95bps),
1/25/45,
Callable
1/25/30
@
100(a)(b)
.........................................................
11,120
11,092
Series
2025-R01,
Class
1M1,
4.76%
(SOFR30A+110bps),
1/25/45,
Callable
1/25/30
@
100(a)(b)
.........................................................
7,920
7,905
Series
2025-R02,
Class
1A1,
4.66%
(SOFR30A+100bps),
2/25/45,
Callable
2/25/30
@
100(a)(b)
.........................................................
45
45
Victory
Portfolios
IV
Victory
Pioneer
Multi-Asset
Ultrashort
Income
Fund
Schedule
of
Portfolio
Investments
—
continued
March
31,
2026
See
notes
to
financial
statements.
Security
Description
Principal
Amount
(000)
a
Value
(000)
Series
2025-R02,
Class
1M1,
4.81%
(SOFR30A+115bps),
2/25/45,
Callable
2/25/30
@
100(a)(b)
.........................................................
$
3,323
$
3,321
Series
2025-R03,
Class
2A1,
5.11%
(SOFR30A+145bps),
3/25/45,
Callable
3/25/30
@
100(a)(b)
.........................................................
4,107
4,115
Series
2025-R04,
Class
1M1,
4.86%
(SOFR30A+120bps),
5/25/45,
Callable
5/25/30
@
100(a)(b)
.........................................................
3,354
3,355
Series
2025-R05,
Class
2A1,
4.66%
(SOFR30A+100bps),
7/25/45,
Callable
7/25/30
@
100(a)(b)
.........................................................
7,027
7,020
Series
2025-R05,
Class
2M1,
4.86%
(SOFR30A+120bps),
7/25/45,
Callable
7/25/30
@
100(a)(b)
.........................................................
11,428
11,417
Series
2025-R06,
Class
1A1,
4.56%
(SOFR30A+90bps),
9/25/45,
Callable
9/25/30
@
100(a)(b)
.........................................................
6,449
6,434
Series
2025-R06,
Class
1M1,
4.61%
(SOFR30A+95bps),
9/25/45,
Callable
9/25/30
@
100(a)(b)
.........................................................
8,010
7,998
Eagle
RE
Ltd.
.........................................................
Series
2021-2,
Class
M1C,
7.11%
(SOFR30A+345bps),
4/25/34,
Callable
3/25/27
@
100(a)(b)
.........................................................
592
593
Series
2023-1,
Class
M1A,
5.66%
(SOFR30A+200bps),
9/26/33,
Callable
9/25/28
@
100(a)(b)
.........................................................
676
677
Series
2023-1,
Class
M1B,
7.61%
(SOFR30A+395bps),
9/26/33,
Callable
9/25/28
@
100(a)(b)
.........................................................
6,770
6,925
Fannie
Mae
Connecticut
Avenue
Securities,
Series
2017-C04,
Class
2M2C,
6.63%
(SOFR30A+296bps),
11/25/29,
Callable
5/25/27
@
100(b)
.....................
7,265
7,411
Federal
Home
Loan
Mortgage
Corporation
.....................................
Series
2021-MN1,
Class
M1,
5.66%
(SOFR30A+200bps),
1/25/51,
Callable
1/25/29
@
100(a)(b)
.........................................................
219
218
Series
2023-HQA3,
Class
M1,
5.51%
(SOFR30A+185bps),
11/25/43,
Callable
11/25/28
@
100(a)(b)
.......................................................
5,526
5,552
Series
2024-DNA1,
Class
A1,
5.01%
(SOFR30A+135bps),
2/25/44,
Callable
2/25/29
@
100(a)(b)
.........................................................
1,329
1,329
Series
2026-DNA2,
Class
M1,
4.87%
(SOFR30A+120bps),
3/25/46,
Callable
3/25/31
@
100(a)(b)
.........................................................
28,215
28,173
Federal
Home
Loan
Mortgage
Corporation,
REMICS
.............................
Series
2021-DNA5,
Class
M2,
5.31%
(SOFR30A+165bps),
1/25/34(a)(b)
..........
1,585
1,585
Series
2021-DNA6,
Class
M2,
5.16%
(SOFR30A+150bps),
10/25/41,
Callable
10/25/26
@
100(a)(b)
.......................................................
2,437
2,439
Series
2021-DNA7,
Class
M1,
4.51%
(SOFR30A+85bps),
11/25/41,
Callable
11/25/26
@
100(a)(b)
.........................................................
976
975
Series
2022-DNA1,
Class
M2,
6.16%
(SOFR30A+250bps),
1/25/42,
Callable
1/25/27
@
100(a)(b)
.........................................................
13,000
13,097
Series
2022-DNA6,
Class
M1A,
5.81%
(SOFR30A+215bps),
9/25/42,
Callable
9/25/27
@
100(a)(b)
.......................................................
402
403
Series
2023-HQA1,
Class
M1A,
5.66%
(SOFR30A+200bps),
5/25/43,
Callable
5/25/28
@
100(a)(b)
.......................................................
1,033
1,038
Series
2023-HQA2,
Class
M1A,
5.66%
(SOFR30A+200bps),
6/25/43,
Callable
6/25/28
@
100(a)(b)
.......................................................
792
792
Series
2024-DNA1,
Class
M1,
5.01%
(SOFR30A+135bps),
2/25/44,
Callable
2/25/29
@
100(a)(b)
.........................................................
1,344
1,343
Series
2024-DNA3,
Class
A1,
4.71%
(SOFR30A+105bps),
10/25/44,
Callable
10/25/29
@
100(a)(b)
.......................................................
12,196
12,200
Series
2024-HQA2,
Class
A1,
4.91%
(SOFR30A+125bps),
8/25/44,
Callable
8/25/29
@
100(a)(b)
.........................................................
20,045
20,064
Series
2024-HQA2,
Class
M1,
4.86%
(SOFR30A+120bps),
8/25/44,
Callable
8/25/29
@
100(a)(b)
.........................................................
8,459
8,463
Series
2025-DNA1,
Class
A1,
4.61%
(SOFR30A+95bps),
1/25/45,
Callable
1/25/30
@
100(a)(b)
.........................................................
14,916
14,888
Series
2025-DNA1,
Class
M1,
4.71%
(SOFR30A+105bps),
1/25/45,
Callable
1/25/30
@
100(a)(b)
.........................................................
6,975
6,960
Series
2025-DNA4,
Class
A1,
4.56%
(SOFR30A+90bps),
10/25/45,
Callable
10/25/30
@
100(a)(b)
.........................................................
19,321
19,272
Series
2025-DNA4,
Class
M1,
4.76%
(SOFR30A+110bps),
10/25/45,
Callable
10/25/30
@
100(a)(b)
.......................................................
17,005
17,004
Victory
Portfolios
IV
Victory
Pioneer
Multi-Asset
Ultrashort
Income
Fund
Schedule
of
Portfolio
Investments
—
continued
March
31,
2026
See
notes
to
financial
statements.
Security
Description
Principal
Amount
(000)
a
Value
(000)
Series
2025-HQA1,
Class
A1,
4.61%
(SOFR30A+95bps),
2/25/45,
Callable
2/25/30
@
100(a)(b)
.........................................................
$
7,895
$
7,895
Series
2025-HQA1,
Class
M1,
4.81%
(SOFR30A+115bps),
2/25/45,
Callable
2/25/30
@
100(a)(b)
.........................................................
17,703
17,711
Federal
National
Mortgage
Association
.......................................
Series
2026-R01,
Class
2A1,
4.51%
(SOFR30A+85bps),
1/25/46,
Callable
1/25/31
@
100(a)(b)
.........................................................
11,198
11,128
Series
2026-R01,
Class
2M1,
4.66%
(SOFR30A+100bps),
1/25/46,
Callable
1/25/31
@
100(a)(b)
.........................................................
27,305
27,300
Series
2026-R02,
Class
1A1,
4.61%
(SOFR30A+95bps),
2/25/46,
Callable
2/25/31
@
100(a)(b)
.........................................................
12,639
12,644
Freddie
Mac
STACR
Debt
Notes
............................................
Series
2017-HQA2,
Class
M2B,
6.43%
(SOFR30A+276bps),
12/25/29,
Callable
6/25/27
@
100(b)
.........................................................
4,014
4,086
Series
2017-HRP1,
Class
M2,
6.23%
(SOFR30A+256bps),
12/25/42,
Callable
5/25/30
@
100(b)
...........................................................
843
849
Freddie
Mac
STACR
REMIC
Trust
..........................................
Series
2022-HQA1,
Class
M1A,
5.76%
(SOFR30A+210bps),
3/25/42,
Callable
3/25/27
@
100(a)(b)
.......................................................
466
466
Series
2023-DNA1,
Class
M1A,
5.76%
(SOFR30A+210bps),
3/25/43,
Callable
3/25/28
@
100(a)(b)
.......................................................
4,789
4,833
Series
2023-HQA3,
Class
A1,
5.51%
(SOFR30A+185bps),
11/25/43,
Callable
11/25/28
@
100(a)(b)
.......................................................
16,295
16,409
Series
2024-DNA2,
Class
A1,
4.91%
(SOFR30A+125bps),
5/25/44,
Callable
5/25/29
@
100(a)(b)
.........................................................
12,685
12,689
Series
2024-DNA2,
Class
M1,
4.86%
(SOFR30A+120bps),
5/25/44,
Callable
5/25/29
@
100(a)(b)
.........................................................
7,894
7,890
Series
2024-HQA1,
Class
A1,
4.91%
(SOFR30A+125bps),
3/25/44,
Callable
3/25/29
@
100(a)(b)
.........................................................
26,117
26,151
Home
Re
Ltd.
.........................................................
Series
2026-1,
Class
M1A,
4.86%
(SOFR30A+120bps),
1/25/36,
Callable
8/25/29
@
100(a)(b)
.........................................................
5,366
5,365
Series
2026-1,
Class
M1B,
5.81%
(SOFR30A+215bps),
1/25/36,
Callable
8/25/29
@
100(a)(b)
.........................................................
5,710
5,718
JP
Morgan
Mortgage
Trust
................................................
Series
2018-7FRB,
Class
A2,
4.54%
(TSFR1M+86bps),
4/25/46,
Callable
12/25/29
@
100(a)(b)
.........................................................
4,586
4,523
Series
2018-7FRB,
Class
A3,
4.54%
(TSFR1M+86bps),
4/25/46,
Callable
12/25/29
@
100(a)(b)
.........................................................
752
728
JP
Morgan
Seasoned
Mortgage
Trust,
Series
2014-1,
Class
AM,
4.29%
(TSFR1M+61bps),
5/25/33,
Callable
4/25/26
@
100(a)(b)
....................................
419
414
JPMorgan
Chase
Bank
NA
................................................
Series
2019-CL1,
Class
M1,
5.14%
(TSFR1M+146bps),
4/25/47,
Callable
11/25/31
@
100(a)(b)
.........................................................
2,547
2,538
Series
2021-CL1,
Class
M1,
4.96%
(SOFR30A+130bps),
3/25/51,
Callable
11/25/36
@
100(a)(b)
.........................................................
5,597
5,586
Merrill
Lynch
Mortgage
Investors
Trust
.......................................
Series
2003-H,
Class
A1,
4.43%
(TSFR1M+75bps),
1/25/29,
Callable
4/25/26
@
100(b)
152
133
Series
2004-B,
Class
A2,
4.74%
(TSFR6M+97bps),
5/25/29,
Callable
4/25/26
@
100(b)
63
62
Series
2004-C,
Class
A2B,
5.03%
(TSFR6M+143bps),
7/25/29,
Callable
4/25/26
@
100(b)
...........................................................
4
4
New
Residential
Mortgage
Loan
Trust,
Series
2017-5A,
Class
A1,
5.29%
(TSFR1M+161bps),
6/25/57,
Callable
5/25/30
@
100(a)(b)
....................................
4,157
4,207
Oaktown
Re
VII
Ltd.,
Series
2021-2,
Class
M1B,
6.56%
(SOFR30A+290bps),
4/25/34,
Callable
10/25/26
@
100(a)(b)
.........................................
1,304
1,313
Radnor
RE
Ltd.
........................................................
Series
2021-1,
Class
M2,
6.81%
(SOFR30A+315bps),
12/27/33,
Callable
5/25/26
@
100(a)(b)
.........................................................
729
731
Series
2021-2,
Class
M1B,
7.36%
(SOFR30A+370bps),
11/25/31,
Callable
9/25/27
@
100(a)(b)
.........................................................
2,236
2,252
Series
2023-1,
Class
M1A,
6.36%
(SOFR30A+270bps),
7/25/33,
Callable
7/25/28
@
100(a)(b)
.........................................................
1,352
1,356
Victory
Portfolios
IV
Victory
Pioneer
Multi-Asset
Ultrashort
Income
Fund
Schedule
of
Portfolio
Investments
—
continued
March
31,
2026
See
notes
to
financial
statements.
Security
Description
Principal
Amount
(000)
a
Value
(000)
RESI
Finance
LP,
Series
2003-CB1,
Class
B3,
5.23%
(TSFR1M+156bps),
6/10/35,
Callable
4/10/26
@
102(a)(b)
.................................................
$
628
$
532
STACR
Trust,
Series
2018-HRP1,
Class
B1,
7.53%
(SOFR30A+386bps),
4/25/43,
Callable
5/25/28
@
100(a)(b)
.................................................
3,807
3,927
Towd
Point
Mortgage
Trust,
Series
2019-HY1,
Class
A1,
4.79%
(TSFR1M+111bps),
10/25/48,
Callable
10/25/28
@
100(a)(b)
.........................................
567
567
Triangle
RE
Ltd.,
Series
2023-1,
Class
M1A,
7.06%
(SOFR30A+340bps),
11/25/33,
Callable
10/25/28
@
100(a)(b)
................................................
4,170
4,198
521,232
Private
CMO
Other
(1.4%):
Bear
Stearns
Mortgage
Securities,
Inc.,
Series
1997-6,
Class
3B1,
4.95%,
6/25/30,
Callable
4/25/26
@
100(d)
...................................................
3
2
Cascade
Funding
Mortgage
Trust
...........................................
Series
2025-HB16,
Class
A,
3.00%,
3/25/35(a)(d)
............................
6,164
6,062
Series
2025-HB16,
Class
M3,
3.00%,
3/25/35,
Callable
9/25/27
@
100(a)(d)
........
2,900
2,771
CFMT
LLC
...........................................................
Series
2024-HB14,
Class
A,
3.00%,
6/25/34,
Callable
6/25/27
@
100(a)(d)
..........
9,588
9,474
Series
2024-HB15,
Class
A,
4.00%,
8/25/34(a)(d)
............................
3,377
3,366
Federal
Home
Loan
Mortgage
Corporation
.....................................
Series
2018-1,
Class
M,
4.75%,
5/25/57,
Callable
7/25/43
@
100(d)
...............
2,251
2,225
Series
2019-3,
Class
M,
4.75%,
10/25/58,
Callable
2/25/47
@
100(d)
..............
1,960
1,933
Series
2026-DNA1,
Class
A1,
4.51%
(SOFR30A+85bps),
2/25/46,
Callable
2/25/31
@
100(a)(b)
.........................................................
25,468
25,419
Series
2026-DNA1,
Class
M1,
4.66%
(SOFR30A+100bps),
2/25/46,
Callable
2/25/31
@
100(a)(b)
.........................................................
24,747
24,654
IMS
Ecuadorian
Mortgage
Trust,
Series
2021-1,
Class
GA,
3.40%,
8/18/43(a)
...........
2,326
2,239
JP
Morgan
Mortgage
Trust
................................................
Series
2014-IVR3,
Class
B4,
5.78%,
9/25/44,
Callable
4/25/26
@
100(a)(d)
.........
823
819
Series
2018-7FRB,
Class
B1,
5.11%,
4/25/46,
Callable
12/25/29
@
100(a)(d)
........
5,503
5,467
Series
2018-7FRB,
Class
B2,
5.11%,
4/25/46,
Callable
12/25/29
@
100(a)(d)
........
5,204
5,150
JP
Morgan
Seasoned
Mortgage
Trust
.........................................
Series
2014-1,
Class
B1,
4.30%,
5/25/33,
Callable
4/25/26
@
100(a)(d)
............
424
422
Series
2014-1,
Class
B2,
4.30%,
5/25/33,
Callable
4/25/26
@
100(a)(d)
............
395
393
Series
2014-1,
Class
B3,
4.30%,
5/25/33,
Callable
4/25/26
@
100(a)(d)
............
305
302
JP
Morgan
Trust,
Series
2015-1,
Class
1A14,
5.09%,
12/25/44,
Callable
4/25/26
@
100(a)(d)
70
69
LHOME
Mortgage
Trust,
Series
2024-RTL2,
Class
A1,
7.13%,
3/25/29,
Callable
10/25/26
@
100(a)(d)(h)
.......................................................
4,490
4,494
Merrill
Lynch
Mortgage
Investors
Trust
.......................................
Series
2003-G,
Class
A3,
6.00%,
1/25/29,
Callable
4/25/26
@
100(d)
..............
2
2
Series
2004-D,
Class
A3,
5.73%,
9/25/29,
Callable
4/25/26
@
100(d)
..............
12
12
Morgan
Stanley
Residential
Mortgage
Loan
Trust,
Series
2014-1A,
Class
B4,
5.88%,
6/25/44,
Callable
4/25/26
@
100(a)(d)
..........................................
2,564
2,520
Ocwen
Loan
Investment
Trust
..............................................
Series
2024-HB1,
Class
A,
3.00%,
2/25/37,
Callable
4/25/26
@
100(a)
.............
1,213
1,196
Series
2024-HB1,
Class
M1,
3.00%,
2/25/37,
Callable
4/25/26
@
100(a)
...........
2,300
2,245
Series
2024-HB1,
Class
M2,
3.00%,
2/25/37,
Callable
4/25/26
@
100(a)
...........
1,020
996
Onity
Loan
Investment
Trust
...............................................
Series
2024-HB2,
Class
A,
5.00%,
8/25/37(a)(d)
.............................
2,934
2,928
Series
2026-HB1,
Class
A,
3.00%,
3/25/39,
Callable
3/25/29
@
100(a)(d)
..........
10,000
9,681
Towd
Point
Mortgage
Trust,
Series
2020-4,
Class
XA,
3.25%,
10/25/60,
Callable
8/25/31
@
100(a)
...........................................................
98
98
114,939
Total
Collateralized
Mortgage
Obligations
(Cost
$1,172,908)
a
a
a
1,156,822
Senior
Secured
Loans
(1.9%)
Communication
Services
(0.0%):(i)
Dotdash
Meredith,
Inc.,
Term
B-2
Loan,
7.17%
(SOFR01M+350bps),
6/16/32(b)
.........
$
543
515
Level
3
Financing,
Inc.,
Term
B-4
Refinancing
Loan,
6.92%
(SOFR01M+325bps),
3/29/32(b)
1,139
1,141
Windstream
Services
LLC,
2025
Term
Loan,
First
Lien,
7.67%
(SOFR01M+400bps),
10/6/32(b)
........................................................
948
951
2,607
Victory
Portfolios
IV
Victory
Pioneer
Multi-Asset
Ultrashort
Income
Fund
Schedule
of
Portfolio
Investments
—
continued
March
31,
2026
See
notes
to
financial
statements.
Security
Description
Principal
Amount
(000)
a
Value
(000)
Consumer
Discretionary
(0.3%):
American
Axle
&
Manufacturing,
Inc.,
Tranche
C
Term
Loan,
First
Lien,
6.91%
(SOFR03M+325bps),
2/3/33(b)
.........................................
$
2,327
$
2,315
Caesars
Entertainment,
Inc.,
Incremental
Term
B-1
Loan,
5.92%
(SOFR01M+225bps),
2/6/31(b)
.........................................................
2,494
2,427
Charter
Communications
Operating
LLC,
Term
Loan
B-5,
First
Lien,
5.91%
(SOFR03M+225bps),
12/15/31(b)
.......................................
2,857
2,862
Churchill
Downs,
Inc.,
2021
Incremental
Term
B
Loan,
First
Lien,
5.42%
(SOFR01M+175bps),
3/17/28(b)
........................................
475
476
Clear
Channel
Outdoor
Holdings,
Inc.,
2024
Refinancing
Term
Loan,
7.79%
(SOFR01M+400bps),
8/23/28(b)
........................................
245
247
DK
Crown
Holdings,
Inc.,
Term
B
Loans,
First
Lien,
5.42%
(SOFR01M+175bps),
3/4/32(b)
.
3,328
3,329
Fitness
International
LLC,
Term
B
Loan,
First
Lien,
8.17%
(SOFR01M+450bps),
2/12/29(b)
.
2,176
2,188
Flutter
Financing
BV,
2024
Refinancing
Term
B
Loan,
First
Lien,
5.42%
(SOFR03M+175bps),
11/29/30(b)
.......................................................
1,344
1,332
Flutter
Financing
BV,
Third
Incremental
Term
B
Loans,
First
Lien,
5.67%
(SOFR03M+200bps),
6/4/32(b)
.........................................
570
565
Great
Outdoors
Group
LLC,
Term
Loan
B,
First
Lien,
6.92%
(SOFR01M+325bps),
1/23/32(b)
2,063
2,062
Hilton
Grand
Vacations
Borrower
LLC,
Amendment
No.
4
Term
Loan,
First
Lien,
5.67%
(SOFR01M+200bps),
1/17/31(b)
........................................
983
981
Houghton
Mifflin
Harcourt
Co.,
Term
B
Loan,
First
Lien,
9.02%
(SOFR01M+525bps),
4/9/29(b)
.........................................................
965
820
Inspired
Educational
US
Holdings,
Inc.,
6.42%
(SOFR03M+275bps),
2/28/31(b)
.........
1,083
1,082
Live
Nation
Entertainment,
Inc.,
Initial
Term
B
Loan,
5.67%
(SOFR01M+200bps),
10/21/32(b)
963
965
Marriott
Ownership
Resorts,
Inc.,
2024
Incremental
Term
Loan,
First
Lien,
5.92%
(SOFR01M+225bps),
4/1/31(b)
.........................................
983
982
OEP
Glass
Purchaser
LLC,
7.67%
(SOFR03M+400bps),
2/26/33(b)
...................
1,382
1,363
Petco
Health
and
Wellness
Co.,
Inc.,
2026
Term
Loan,
First
Lien,
7.92%
(SOFR03M+425bps),
2/3/31(b)
.........................................................
904
885
PetSmart,
Inc.,
Initial
Term
Loan,
First
Lien,
7.67%
(SOFR01M+400bps),
8/18/32(b)
......
1,720
1,712
Valvoline,
Inc.,
Term
B
Loan,
5.67%
(SOFR01M+200bps),
12/1/32(b)
.................
998
1,002
27,595
Consumer
Staples
(0.1%):
Energizer
Holdings,
Inc.,
Initial
Term
Loan,
5.67%
(SOFR01M+200bps),
3/19/32(b)
.......
1,750
1,750
Froneri
US,
Inc.,
Facility
B6,
First
Lien,
5.88%
(SOFR06M+225bps),
9/30/32(b)
.........
1,746
1,715
Jupiter
Buyer,
Inc.,
Initial
Term
Loan,
7.67%
(SOFR03M+400bps),
11/3/31(b)
...........
507
508
Primo
Brands
Corp.,
3/31/31(j)
.............................................
980
983
4,956
Energy
(0.1%):
Bayonne
Energy
Center
LLC,
Term
B
Advance,
6.67%
(SOFR03M+300bps),
10/1/32(b)
....
1,990
1,997
Buckeye
Partners
LP,
2025
Tranche
B-7
Term
Loan,
5.42%
(SOFR01M+175bps),
11/22/32(b)
2,062
2,072
Hilcorp
Energy
I
LP,
Initial
Loan,
First
Lien,
5.43%
(SOFR01M+175bps),
2/11/30(b)
......
2,007
2,008
6,077
Financials
(0.7%):
Allspring
Buyer
LLC,
2024
Specified
Refinancing
Term
Loan,
First
Lien,
6.69%
(SOFR03M+300bps),
11/1/30(b)
........................................
744
745
Asurion
LLC,
New
B-12
Term
Loan,
First
Lien,
7.92%
(SOFR01M+425bps),
9/19/30(b)
...
1,138
1,127
Asurion
LLC,
New
Term
B-14
Term
Loan,
First
Lien,
7.43%
(SOFR01M+375bps),
2/23/33(b)
2,576
2,493
AthenaHealth
Group,
Inc.,
Initial
Term
Loan,
6.42%
(SOFR01M+275bps),
2/15/29(b)
......
645
635
Avolon
TLB
Borrower
1
US
LLC,
Term
B-6
Loan,
5.43%
(SOFR01M+175bps),
6/24/30(b)
.
1,195
1,199
Carriage
Purchaser,
Inc.,
Term
B
Loan,
7.17%
(SOFR01M+350bps),
9/29/28(b)
..........
1,433
1,429
Citadel
Securities
LP,
2024-1
Term
Loan,
5.67%
(SOFR03M+200bps),
10/31/31(b)
.......
1,418
1,420
Directv
Financing
LLC,
2024
Refinancing
Term
B
Loan,
First
Lien,
9.18%
(SOFR03M+525bps),
8/2/29(b)
.........................................
634
637
Eastern
Power
LLC,
Term
loan,
8.42%
(SOFR01M+475bps),
4/3/29(b)
................
807
810
First
Advantage
Holdings
LLC,
Term
B-3
Loan,
First
Lien,
6.42%
(SOFR03M+275bps),
10/31/31(b)
.......................................................
2,681
2,616
Gloves
Buyer,
Inc.,
Term
Loan,
First
Lien,
7.67%
(SOFR01M+400bps),
5/24/32(b)
.......
2,131
2,127
HIG
Finance
2
Limited,
2025-2
Dollar
Refinancing
Term
Loan,
6.42%
(SOFR01M+275bps),
2/18/31(b)
........................................................
2,377
2,305
Hudson
River
Trading
LLC,
Term
B-2
Loan,
6.18%
(SOFR01M+250bps),
3/18/30(b)
......
1,888
1,882
Ineos
US
Finance
LLC,
2031
Dollar
Term
Loan,
6.67%
(SOFR01M+300bps),
2/7/31(b)
....
1,719
1,488
Victory
Portfolios
IV
Victory
Pioneer
Multi-Asset
Ultrashort
Income
Fund
Schedule
of
Portfolio
Investments
—
continued
March
31,
2026
See
notes
to
financial
statements.
Security
Description
Principal
Amount
(000)
a
Value
(000)
Innio
North
America
Holding,
Inc.,
5.66%
(SOFR03M+200bps),
11/28/31(b)
............
$
2,005
$
1,991
ION
Platform
Finance
US,
Inc.,
Initial
Dollar
Term
Loan,
First
Lien,
7.42%
(SOFR03M+375bps),
9/30/32(b)
........................................
1,940
1,568
Iron
Mountain
Information
Management
LLC,
Amendment
No.1
Incremental
Term
B
Loan,
5.67%
(SOFR01M+200bps),
1/31/31(b)
...................................
1,011
1,008
Jane
Street
Group
LLC,
Seventh
Amendment
Extended
Term
Loan,
5.67%
(SOFR03M+200bps),
12/15/31(b)
.......................................
3,950
3,880
Jefferies
Finance
LLC,
Initial
Term
Loan,
First
Lien,
6.43%
(SOFR01M+275bps),
10/21/31(b)
1,706
1,685
Knight
Health
Holdings
LLC,
Term
B
Loan,
First
Lien,
9.04%
(SOFR01M+525bps),
12/26/28(b)
.......................................................
956
679
LC
Ahab
US
Bidco
LLC,
Second
Amendment
Incremental
Term
Loan,
First
Lien,
6.17%
(SOFR01M+250bps),
5/1/31(b)
.........................................
1,728
1,714
Lightning
Power
LLC,
Initial
Term
B
Loan,
5.92%
(SOFR01M+225bps),
8/18/31(b)
.......
2,962
2,972
Long
Ridge
Energy
LLC,
Term
B
Advance
Loan,
8.17%
(SOFR03M+450bps),
2/19/32(b)
...
1,120
1,113
Medline
Borrower
LP,
2030
Refinancing
Term
Loan,
First
Lien,
5.42%
(SOFR01M+175bps),
10/23/30(b)
.......................................................
875
877
NorthRiver
Midstream
Finance
LP,
Initial
Term
B
Loan,
First
Lien,
5.91%
(SOFR03M+225bps),
8/16/30(b)
........................................
750
752
OAK-Eagle
Acquireco,
Inc.,
3/24/33(j)
.......................................
1,079
1,073
Olympus
Water
US
Holding
Corp.,
Term
B-6
Dollar
Loan,
First
Lien,
6.67%
(SOFR03M+300bps),
6/23/31(b)
........................................
627
604
Outfront
Media
Capital
LLC,
Term
Loan,
5.68%
(SOFR01M+200bps),
9/16/32(b)
........
1,161
1,164
Padagis
LLC,
Term
B
Loans,
First
Lien,
8.66%
(SOFR03M+475bps),
7/6/28(b)
..........
791
731
Phoenix
Guarantor,
Inc.,
Tranche
B-5
Term
Loan,
First
Lien,
6.17%
(SOFR01M+250bps),
2/21/31(b)
........................................................
2,923
2,927
RVR
Dealership
Holdings
LLC,
Term
Loan,
First
Lien,
8.18%
(SOFR01M+450bps),
2/28/33(b)
........................................................
621
601
Sedgwick
Claims
Management
Services,
Inc.,
2024
Term
Loan,
First
Lien,
6.17%
(SOFR01M+250bps),
7/31/31(b)
........................................
990
973
The
Edelman
Financial
Engines
Center
LLC,
2024-2
Refinancing
Term
Loan,
6.67%
(SOFR01M+300bps),
4/7/28(b)
.........................................
958
958
Trans
Union
LLC,
2024
Refinancing
Term
B-8
Loan,
5.42%
(SOFR03M+175bps),
6/24/31(b)
2,694
2,683
Virgin
Media
Bristol
LLC,
7.04%
(SOFR01M+325bps),
1/31/29(b)
...................
1,025
991
WhiteWater
DBR
Holdco
LLC,
Term
B-1
Loan,
5.94%
(SOFR03M+225bps),
3/3/31(b)
....
1,218
1,222
Windsor
Holdings
III
LLC,
2025
Dollar
Refinancing
Term
B
Loan,
6.42%
(SOFR01M+275bps),
8/1/30(b)
.........................................
1,794
1,775
54,854
Health
Care
(0.1%):
EyeCare
Partners
LLC,
Tranche
B
Term
Loan,
4.73%
(SOFR06M+100bps),
11/30/28(b)
....
951
396
Hologic,
Inc.,
1/14/33(j)
..................................................
1,417
1,401
Lumexa
Imaging,
Inc., Amendment
No.
5
Replacement
Term
Loan,
6.70%
(SOFR03M+300bps),
12/17/32(b)
.......................................
610
612
Organon
&
Co.,
2024
Refinancing
Dollar
Term
Loan
Facility,
First
Lien,
5.92%
(SOFR01M+225bps),
5/19/31(b)
........................................
1,973
1,884
Perrigo
Investments
LLC,
2024
Refinancing
Term
B
Loan,
First
Lien,
5.67%
(SOFR01M+200bps),
4/20/29(b)
........................................
1,224
1,219
Scil
USA
Holdings
LLC,
7.79%
(SOFR06M+400bps),
10/29/32(b)
...................
2,418
2,406
Sotera
Health
Holdings
LLC,
2025
Refinancing
Term
Loan,
6.17%
(SOFR01M+250bps),
5/30/31(b)
........................................................
844
846
8,764
Industrials
(0.3%):
AAdvantage
Loyality
IP
Ltd.
(American
Airlines,
Inc.),
2025
Replacement
Term
Loan,
First
Lien,
5.92%
(SOFR03M+225bps),
4/20/28(b)
..............................
1,021
1,012
Allied
Universal
Holdco
LLC,
Amendment
No.
7
Replacement
U.S.
Dollar
Term
Loan,
6.92%
(SOFR01M+325bps),
8/20/32(b)
........................................
1,147
1,148
Arcosa,
Inc.,
2025
Refinancing
Term
Loan,
First
Lien,
5.67%
(SOFR01M+200bps),
10/1/31(b)
1,340
1,341
Cengage
Learning,
Inc.,
Existing
Term
Loan,
First
Lien,
6.68%
(SOFR03M+300bps),
3/24/31(b)
........................................................
1,496
1,470
Coors
Tek,
Inc.,
Initial
Term
B
Loan,
First
Lien,
6.67%
(SOFR03M+300bps),
10/28/32(b)
...
589
592
Garda
World
Security
Corp.,
Fifteenth
Additional
Term
Loan,
6.42%
(SOFR03M+275bps),
2/1/29(b)
.........................................................
1,470
1,463
Victory
Portfolios
IV
Victory
Pioneer
Multi-Asset
Ultrashort
Income
Fund
Schedule
of
Portfolio
Investments
—
continued
March
31,
2026
See
notes
to
financial
statements.
Security
Description
Principal
Amount
(000)
a
Value
(000)
Knife
River
Corp.,
Initial
Tranche
B
Term
Loans,
First
Lien,
5.67%
(SOFR03M+200bps),
3/8/32(b)
.........................................................
$
1,481
$
1,490
Novae
LLC,
Tranche
B
Term
Loan,
8.82%
(SOFR03M+500bps),
12/22/28(b)
............
1,440
1,295
OneSky
Flight
LLC,
Initial
Term
Loans,
6.43%
(SOFR01M+275bps),
2/17/33(b)
.........
1,355
1,353
Pitney
Bowes,
Inc.,
Tranche
B
Term
Loan
2,
7.42%
(SOFR03M+375bps),
3/19/32(b)
......
2,328
2,313
Prime
Security
Services
Borrower
LLC,
2024-1
Refinancing
Term
B-1
Loan
,
First
Lien,
5.66%
(SOFR01M+200bps),
10/15/30(b)
..................................
1,553
1,548
Prime
Security
Services
Borrower
LLC,
2025
Incremental
Term
B-2
Loan,
First
Lien,
5.41%
(SOFR01M+175bps),
3/8/32(b)
.........................................
675
666
Quikrete
Holdings,
Inc.,
Tranche
B-3
Term
Loan
,
First
Lien,
5.92%
(SOFR01M+225bps),
2/10/32(b)
........................................................
1,980
1,978
TransDigm,
Inc.,
New
Tranche
K
Term
Loan,
First
Lien,
5.92%
(SOFR01M+225bps),
3/22/30(b)
........................................................
1,493
1,494
U.S.
Anesthesia
Partners,
Inc.,
Initial
Term
Loan
,
First
Lien,
7.78%
(SOFR01M+400bps),
10/2/28(b)
........................................................
1,289
1,291
Veritiv
Operating
Co.,
Initial
Term
Loan,
First
Lien,
7.67%
(SOFR03M+400bps),
11/29/30(b)
2,799
2,726
Vestis
Corp.,
Term
B-1
Loan,
First
Lien,
5.92%
(SOFR03M+225bps),
2/24/31(b)
.........
620
600
WEX,
Inc.,
Term
B-3
Loan,
5.42%
(SOFR01M+175bps),
3/5/32(b)
...................
2,672
2,656
26,436
Information
Technology
(0.2%):
Ahead
DB
Holdings
LLC,
Term
B-5
Loan,
First
Lien,
6.17%
(SOFR03M+250bps),
2/3/31(b)
1,720
1,695
CACI
International,
Inc.,
Tranche
B
Term
Loan,
5.42%
(SOFR01M+175bps),
10/30/31(b)
...
1,975
1,980
Clearwater
Analytics
LLC,
Initial
Term
Loan,
5.67%
(SOFR01M+200bps),
4/21/32(b)
.....
995
995
Coherent
Corp.,
Term
B-3
Loan,
5.42%
(SOFR01M+175bps),
7/2/29(b)
................
1,000
1,003
Gen
Digital,
Inc.,
Second
Amendment
Incremental
Term
B
Loan,
5.42%
(SOFR01M+175bps),
4/16/32(b)
........................................................
1,485
1,465
Gen
Digital,
Inc.,
Tranche
B-1
Term
Loan,
5.42%
(SOFR01M+175bps),
9/12/29(b)
.......
634
629
Qnity
Electronics,
Inc.,
Initial
Term
Loan,
5.70%
(SOFR01M+200bps),
11/1/32(b)
........
1,892
1,892
Smartronix
LLC,
Term
Loan,
8.17%
(SOFR01M+450bps),
2/9/32(b)
..................
1,357
1,340
SS&C
Technologies,
Inc.,
Term
B-8
Loan,
5.67%
(SOFR01M+200bps),
5/9/31(b)
........
803
801
11,800
Materials
(0.1%):
Koppers,
Inc.,
Term
B-2
Loan,
6.18%
(SOFR01M+250bps),
4/10/30(b)
................
486
486
Mativ
Holdings,
Inc.
Term
B
Loan,
7.54%
(SOFR01M+375bps),
4/20/28(b)
.............
1,793
1,793
Minerals
Technologies
Inc.,
Term
B
Loan,
5.67%
(SOFR01M+200bps),
11/26/31(b)
.......
1,077
1,082
Novelis
Holdings,
Inc.,
Initial
Term
Loan,
5.42%
(SOFR03M+175bps),
3/11/32(b)
........
2,910
2,914
Owens
Brockway
Glass
Container,
Inc.,
Tranche
B-1
Term
Loan
B
Facility,
First
Lien,
6.67%
(SOFR01M+300bps),
9/30/32(b)
........................................
1,686
1,670
Solstice
Advanced
Materials,
Inc.,
Term
Loan
B,
First
Lien,
5.42%
(SOFR03M+175bps),
10/29/32(b)
.......................................................
1,100
1,107
9,052
Utilities
(0.0%):(i)
Alpha
Generation
LLC,
Initial
Term
B
Loan,
5.42%
(SOFR01M+175bps),
9/30/31(b)
......
1,363
1,361
MH
SUB
I
LLC,
Term
Loan,
First
Lien,
7.92%
(SOFR01M+425bps),
12/31/31(b)
........
818
549
Talen
Energy
Supply
LLC,
2025-1
Incremental
Term
B
Loan,
5.67%
(SOFR01M+200bps),
11/26/32(b)
.......................................................
748
750
Vistra
Operations
Co.
LLC,
2018
Incremental
Term
Loans,
First
Lien,
5.42%
(SOFR01M+175bps),
12/20/30(b)
.......................................
535
535
3,195
Total
Senior
Secured
Loans
(Cost
$157,520)
a
a
a
155,336
Corporate
Bonds
(22.1%)
Communication
Services
(0.3%):
Take-Two
Interactive
Software,
Inc.,
3.70%,
4/14/27,
Callable
3/14/27
@
100
............
11,600
11,496
T-Mobile
US,
Inc.,
3.75%,
4/15/27,
Callable
2/15/27
@
100
........................
13,223
13,141
24,637
Consumer
Discretionary
(1.1%):
Amazon.com,
Inc.,
4.10%
(SOFR+44bps),
3/13/28(b)
.............................
24,600
24,588
Victory
Portfolios
IV
Victory
Pioneer
Multi-Asset
Ultrashort
Income
Fund
Schedule
of
Portfolio
Investments
—
continued
March
31,
2026
See
notes
to
financial
statements.
Security
Description
Principal
Amount
(000)
a
Value
(000)
Daimler
Truck
Finance
North
America
LLC
4.62%
(SOFR+96bps),
9/25/27(a)(b)
.....................................
$
6,400
$
6,415
4.51%
(SOFR+84bps),
1/13/28(a)(b)
.....................................
10,000
10,006
General
Motors
Financial
Co.,
Inc.
5.02%
(SOFRINDX+135bps),
5/8/27(b)
..................................
10,200
10,259
4.72%
(SOFRINDX+105bps),
7/15/27(b)
.................................
14,060
14,074
4.84%
(SOFRINDX+117bps),
4/4/28(b)
..................................
15,400
15,454
HOA
RoyaltyCo
LLC,
4.72%,
11/22/55,
Callable
5/2/26
@
100(a)(c)(f)
................
5,165
1,086
Volkswagen
Group
of
America
Finance
LLC,
4.73%
(SOFR+106bps),
8/14/26(a)(b)
.......
4,550
4,562
86,444
Consumer
Staples
(0.7%):
BAT
Capital
Corp.
3.22%,
9/6/26,
Callable
7/6/26
@
100
....................................
14,036
13,963
3.56%,
8/15/27,
Callable
5/15/27
@
100
..................................
11,209
11,086
Cargill,
Inc.,
4.28%
(SOFR+61bps),
2/11/28(a)(b)
...............................
15,080
15,093
Philip
Morris
International,
Inc.,
4.33%
(SOFR+66bps),
10/27/28(b)
..................
18,350
18,336
58,478
Energy
(1.2%):
Chevron
USA,
Inc.,
4.24%
(SOFR+57bps),
8/13/28(b)
............................
16,740
16,774
Energy
Transfer
LP
3.90%,
7/15/26,
Callable
5/2/26
@
100
...................................
10,339
10,327
6.05%,
12/1/26,
Callable
11/1/26
@
100
..................................
14,006
14,135
5.55%,
2/15/28,
Callable
1/15/28
@
100
..................................
8,041
8,195
MPLX
LP,
4.13%,
3/1/27,
Callable
12/1/26
@
100
...............................
4,719
4,707
ONEOK,
Inc.,
5.55%,
11/1/26,
Callable
10/1/26
@
100
............................
4,210
4,235
Sabine
Pass
Liquefaction
LLC,
5.00%,
3/15/27,
Callable
9/15/26
@
100
...............
10,329
10,348
The
Williams
Cos.,
Inc.,
3.75%,
6/15/27,
Callable
3/15/27
@
100
....................
8,200
8,138
Western
Midstream
Operating
LP,
4.65%,
7/1/26
................................
16,080
16,080
92,939
Financials
(14.4%):
Ally
Financial,
Inc.,
7.10%,
11/15/27,
Callable
10/15/27
@
100
......................
13,700
14,216
American
Express
Co.
4.60%
(SOFR+93bps),
7/26/28,
Callable
7/26/27
@
100(b)
.....................
8,500
8,516
5.04%
(SOFR+93bps),
7/26/28,
Callable
7/26/27
@
100(b)
.....................
10,100
10,187
4.48%
(SOFR+81bps),
7/20/29,
Callable
7/20/28
@
100(b)
.....................
24,090
24,075
American
Honda
Finance
Corp.
4.22%
(SOFR+55bps),
5/11/26(b)
.......................................
16,000
15,999
4.43%
(SOFR+77bps),
3/12/27(b)
.......................................
15,670
15,659
4.57%
(SOFR+90bps),
9/1/28(b)
........................................
12,450
12,415
Athene
Global
Funding
4.52%
(SOFRINDX+85bps),
5/8/26(a)(b)
.................................
6,000
6,003
4.50%
(SOFRINDX+83bps),
1/7/27(a)(b)
.................................
18,270
18,267
4.88%
(SOFRINDX+121bps),
3/25/27(a)(b)
...............................
4,000
4,004
Bank
of
America
Corp.
5.01%
(SOFR+135bps),
9/15/27,
Callable
9/15/26
@
100(b)
....................
14,980
15,036
5.93%
(SOFR+134bps),
9/15/27,
Callable
9/15/26
@
100(b)
....................
12,000
12,083
4.72%
(SOFR+105bps),
2/4/28,
Callable
2/4/27
@
100(b)
......................
8,300
8,328
4.50%
(SOFR+83bps),
1/24/29,
Callable
1/24/28
@
100(b)
.....................
14,080
14,074
Bank
of
America
NA,
4.69%
(SOFR+102bps),
8/18/26,
Callable
7/17/26
@
100(b)
........
15,450
15,479
BMW
US
Capital
LLC
4.44%
(SOFRINDX+78bps),
3/19/27(a)(b)
................................
7,900
7,919
4.59%
(SOFRINDX+92bps),
8/13/27(a)(b)
................................
11,890
11,908
Brown
&
Brown,
Inc.,
4.60%,
12/23/26
.......................................
10,450
10,481
Capital
One
Financial
Corp.
3.75%,
7/28/26,
Callable
6/28/26
@
100
..................................
6,072
6,058
3.75%,
3/9/27,
Callable
2/9/27
@
100
....................................
1,590
1,581
4.93%
(SOFR+206bps),
5/10/28,
Callable
5/10/27
@
100(b)
....................
11,700
11,731
Caterpillar
Financial
Services
Corp.
4.19%
(SOFR+52bps),
3/3/28(b)
........................................
13,000
13,022
4.31%
(SOFR+64bps),
8/15/28(b)
.......................................
15,840
15,855
Citibank
NA,
4.73%
(SOFRINDX+106bps),
12/4/26,
Callable
11/4/26
@
100(b)
.........
12,450
12,505
Victory
Portfolios
IV
Victory
Pioneer
Multi-Asset
Ultrashort
Income
Fund
Schedule
of
Portfolio
Investments
—
continued
March
31,
2026
See
notes
to
financial
statements.
Security
Description
Principal
Amount
(000)
a
Value
(000)
Citigroup,
Inc.
4.43%
(SOFR+77bps),
6/9/27,
Callable
6/9/26
@
100(b)
.......................
$
3,760
$
3,762
4.95%
(SOFR+128bps),
2/24/28,
Callable
2/24/27
@
100(b)
....................
4,005
4,023
4.81%
(SOFR+114bps),
5/7/28,
Callable
5/7/27
@
100(b)
......................
15,270
15,336
4.53%
(SOFR+87bps),
3/4/29,
Callable
3/4/28
@
100(b)
.......................
21,300
21,300
CNO
Global
Funding,
5.88%,
6/4/27(a)
.......................................
11,455
11,612
Equitable
America
Global
Funding,
4.37%
(SOFR+71bps),
9/15/27(a)(b)
...............
14,460
14,485
Fidelity
National
Information
Services,
Inc.,
4.87%
(SOFR+121bps),
3/10/29(b)
..........
25,000
24,904
Fiserv,
Inc.
3.20%,
7/1/26,
Callable
5/1/26
@
100
....................................
1,528
1,523
5.15%,
3/15/27,
Callable
2/15/27
@
100
..................................
10,000
10,048
Goldman
Sachs
Bank
USA,
4.42%
(SOFR+75bps),
5/21/27,
Callable
5/21/26
@
100(b)
....
7,480
7,482
HOA
Funding
LLC
8/20/51(f)
........................................................
2,050
—
8/20/51(f)
........................................................
2,050
—
HOA
NewCo
LLC,
7.43%,
11/22/55,
Callable
5/2/26
@
100(a)(c)(f)
..................
2,067
51
Hyundai
Capital
America,
Inc.
5.17%
(SOFR+150bps),
1/8/27(a)(b)
.....................................
8,090
8,145
4.78%
(SOFR+112bps),
6/23/27(a)(b)
....................................
21,960
22,035
4.70%
(SOFR+104bps),
6/24/27(a)(b)
....................................
5,650
5,664
4.69%
(SOFR+103bps),
9/24/27(a)(b)
....................................
12,570
12,601
Jefferies
Financial
Group,
Inc.
4.85%,
1/15/27
....................................................
8,800
8,808
4.30%,
2/11/27,
Callable
8/11/26
@
100,
MTN
..............................
25,040
25,031
John
Deere
Capital
Corp.,
4.35%
(SOFR+68bps),
7/15/27(b)
........................
7,000
7,025
JPMorgan
Chase
&
Co.
4.43%
(SOFR+77bps),
9/22/27,
Callable
9/22/26
@
100(b)
.....................
14,055
14,062
4.87%
(SOFR+120bps),
1/23/28,
Callable
1/23/27
@
100(b)
....................
4,980
5,001
4.59%
(SOFR+92bps),
4/22/28,
Callable
4/22/27
@
100(b)
.....................
7,780
7,804
4.98%
(SOFR+93bps),
7/22/28,
Callable
7/22/27
@
100(b)
.....................
7,015
7,062
4.47%
(SOFR+80bps),
1/24/29,
Callable
1/24/28
@
100(b)
.....................
17,580
17,590
JPMorgan
Chase
Bank
NA,
4.66%
(SOFR+100bps),
12/8/26,
Callable
11/8/26
@
100(b)
....
10,000
10,042
MassMutual
Global
Funding
II
4.44%
(SOFR+77bps),
1/29/27(a)(b)
.....................................
3,000
3,008
4.41%
(SOFR+74bps),
4/9/27(a)(b)
......................................
11,972
12,011
4.33%
(SOFR+66bps),
1/22/29(a)(b)
.....................................
13,720
13,709
Metropolitan
Life
Global
Funding
I
3.45%,
12/18/26(a)
..................................................
10,102
10,042
4.36%
(SOFRINDX+70bps),
6/11/27(a)(b)
................................
9,900
9,915
4.37%
(SOFR+70bps),
8/25/28(a)(b)
.....................................
8,900
8,921
Mizuho
Markets
Cayman
LP,
4.19%
(SOFR+52bps),
11/16/26,
Callable
10/16/26
@
100,
MTN(a)(b)
.......................................................
11,430
11,437
Morgan
Stanley,
4.69%
(SOFR+102bps),
4/13/28,
Callable
4/13/27
@
100(b)
............
13,480
13,528
Morgan
Stanley
Bank
NA
4.84%
(SOFR+117bps),
10/30/26,
Callable
9/30/26
@
100(b)
...................
12,500
12,554
4.75%
(SOFR+108bps),
1/14/28,
Callable
1/14/27
@
100(b)
....................
10,240
10,283
4.53%
(SOFR+87bps),
5/26/28,
Callable
5/26/27
@
100(b)
.....................
19,000
19,005
4.97%
(SOFR+93bps),
7/14/28,
Callable
7/14/27
@
100(b)
.....................
6,320
6,358
4.57%
(SOFR+90bps),
1/12/29,
Callable
1/12/28
@
100(b)
.....................
6,300
6,317
Morgan
Stanley
Private
Bank
NA,
4.44%
(SOFR+77bps),
7/6/28,
Callable
7/6/27
@
100(b)
.
19,230
19,202
National
Rural
Utilities
Cooperative
Finance
Corp.,
4.10%
(SOFRINDX+43bps),
8/9/27(b)
..
11,570
11,562
National
Securities
Clearing
Corp.,
4.24%
(SOFR+57bps),
5/20/27(a)(b)
...............
15,300
15,322
New
York
Life
Global
Funding,
4.33%
(SOFR+66bps),
7/25/28(a)(b)
.................
28,290
28,340
Northwestern
Mutual
Global
Funding,
4.33%
(SOFR+66bps),
8/25/28(a)(b)
.............
13,420
13,408
Pacific
Life
Global
Funding
II
4.52%
(SOFR+85bps),
2/5/27(a)(b)
......................................
16,200
16,272
4.24%
(SOFR+58bps),
12/20/27(a)(b)
....................................
13,600
13,599
PNC
Bank
NA
4.54%
(SOFR+63bps),
5/13/27,
Callable
5/13/26
@
100(b)
.....................
16,360
16,361
4.40%
(SOFR+73bps),
7/21/28,
Callable
7/21/27
@
100(b)
.....................
6,550
6,561
Principal
Life
Global
Funding
II,
4.48%
(SOFR+81bps),
8/18/28(a)(b)
.................
10,590
10,571
Victory
Portfolios
IV
Victory
Pioneer
Multi-Asset
Ultrashort
Income
Fund
Schedule
of
Portfolio
Investments
—
continued
March
31,
2026
See
notes
to
financial
statements.
Security
Description
Principal
Amount
(000)
a
Value
(000)
Protective
Life
Global
Funding
4.37%
(SOFR+70bps),
4/10/26(a)(b)
.....................................
$
19,300
$
19,302
5.21%,
4/14/26(a)
..................................................
5,050
5,052
Santander
Holdings
USA,
Inc.,
6.12%
(SOFR+123bps),
5/31/27,
Callable
5/31/26
@
100(b)
.
4,000
4,008
State
Street
Corp.
4.31%
(SOFR+64bps),
10/22/27,
Callable
9/22/27
@
100(b)
....................
5,380
5,393
4.62%
(SOFR+95bps),
4/24/28,
Callable
4/24/27
@
100(b)
.....................
10,995
11,031
The
Bank
of
New
York
Mellon
Corp.
4.34%
(SOFRINDX+68bps),
6/9/28,
Callable
6/9/27
@
100(b)
..................
7,080
7,093
4.50%
(SOFRINDX+83bps),
7/21/28,
Callable
7/21/27
@
100(b)
................
17,665
17,683
The
Charles
Schwab
Corp.,
4.72%
(SOFRINDX+105bps),
3/3/27,
Callable
2/3/27
@
100(b)
.
18,000
18,074
The
Goldman
Sachs
Group,
Inc.
4.48%
(SOFR+82bps),
9/10/27,
Callable
9/10/26
@
100(b)
.....................
4,100
4,101
4.59%
(SOFR+92bps),
10/21/27,
Callable
10/21/26
@
100(b)
...................
3,174
3,181
5.68%
(TSFR3M+201bps),
10/28/27,
Callable
10/28/26
@
100(b)
................
10,500
10,578
4.79%
(SOFR+112bps),
2/24/28,
Callable
2/24/27
@
100(b)
....................
3,369
3,383
The
PNC
Financial
Services
Group,
Inc.
5.10%
(SOFR+80bps),
7/23/27,
Callable
7/23/26
@
100(b)
.....................
14,600
14,627
4.29%
(SOFR+62bps),
1/26/29,
Callable
1/26/28
@
100(b)
.....................
7,160
7,153
Toyota
Motor
Credit
Corp.
4.12%
(SOFRINDX+45bps),
4/10/26,
MTN(b)
.............................
13,710
13,711
4.12%
(SOFR+45bps),
5/15/26(b)
.......................................
10,850
10,850
4.31%
(SOFR+65bps),
3/19/27,
MTN(b)
..................................
10,500
10,519
4.31%
(SOFRINDX+65bps),
3/13/29(b)
..................................
20,300
20,260
Truist
Bank
3.30%,
5/15/26,
Callable
4/17/26
@
100
..................................
10,000
9,984
4.67%
(SOFR+59bps),
5/20/27,
Callable
5/20/26
@
100(b)
.....................
19,350
19,350
4.44%
(SOFR+77bps),
7/24/28,
Callable
7/24/27
@
100(b)
.....................
17,630
17,639
Truist
Financial
Corp.,
6.05%
(SOFR+205bps),
6/8/27,
Callable
6/8/26
@
100,
MTN(b)
....
12,000
12,030
U.S.
Bank
NA,
4.36%
(SOFR+69bps),
10/22/27,
Callable
10/22/26
@
100(b)
............
20,930
20,940
Wells
Fargo
&
Co.
4.45%
(SOFR+78bps),
1/24/28,
Callable
1/24/27
@
100(b)
.....................
8,575
8,571
4.74%
(SOFR+107bps),
4/22/28,
Callable
4/22/27
@
100(b)
....................
23,010
23,094
4.54%
(SOFR+88bps),
9/15/29,
Callable
9/15/28
@
100(b)
.....................
13,700
13,634
Wells
Fargo
Bank
NA,
4.73%
(SOFR+106bps),
8/7/26,
Callable
7/7/26
@
100(b)
.........
12,760
12,784
1,163,108
Health
Care
(1.4%):
Augusta
SpinCo
Corp.,
4.32%,
9/23/27
.......................................
26,355
26,326
Elevance
Health,
Inc.,
4.50%,
10/30/26
.......................................
12,335
12,352
Eli
Lilly
&
Co.,
4.20%
(SOFR+53bps),
10/15/28(b)
..............................
20,140
20,168
GE
HealthCare
Technologies,
Inc.,
5.65%,
11/15/27,
Callable
10/15/27
@
100
...........
8,000
8,159
HCA,
Inc.,
4.54%
(SOFR+87bps),
3/1/28,
Callable
2/1/28
@
100(b)
..................
16,000
16,020
Merck
&
Co.,
Inc.,
4.12%
(SOFR+46bps),
9/15/27(b)
.............................
14,115
14,145
Pfizer,
Inc.,
4.17%
(SOFR+50bps),
11/15/27(b)
.................................
6,280
6,280
U.S.
Bank
NA,
4.58%
(SOFR+91bps),
5/15/28,
Callable
5/14/27
@
100(b)
.............
12,000
12,047
115,497
Industrials
(1.1%):
Air
Lease
Corp.,
5.30%,
6/25/26
............................................
6,320
6,331
General
Electric
Co.,
4.30%
(TSFR3M+64bps),
5/5/26,
MTN(b)
.....................
8,431
8,430
Honeywell
Aerospace,
Inc.,
3.90%,
3/16/28(a)
..................................
20,000
19,853
L3Harris
Technologies,
Inc.,
5.40%,
1/15/27
...................................
18,126
18,268
Penske
Truck
Leasing
Co.
LP/PTL
Finance
Corp.
5.75%,
5/24/26,
Callable
5/2/26
@
100(a)
.................................
5,645
5,649
3.40%,
11/15/26,
Callable
8/15/26
@
100(a)
................................
4,460
4,427
5.35%,
1/12/27,
Callable
12/12/26
@
100(a)
...............................
4,474
4,498
RTX
Corp.,
3.50%,
3/15/27,
Callable
12/15/26
@
100
.............................
20,126
19,983
87,439
Information
Technology
(0.6%):
Amphenol
Corp.,
4.20%
(SOFR+53bps),
11/15/27(b)
.............................
15,060
15,063
ESC
Gab,
8/20/51(f)(g)
..................................................
5,300
—
Jabil,
Inc.,
4.25%,
5/15/27,
Callable
4/15/27
@
100
..............................
6,600
6,583
Victory
Portfolios
IV
Victory
Pioneer
Multi-Asset
Ultrashort
Income
Fund
Schedule
of
Portfolio
Investments
—
continued
March
31,
2026
See
notes
to
financial
statements.
Security
Description
Principal
Amount
(000)
a
Value
(000)
Oracle
Corp.
4.43%
(SOFR+76bps),
8/3/28(b)
........................................
$
12,000
$
11,822
4.78%
(SOFRINDX+111bps),
2/4/29(b)
...................................
17,920
17,757
51,225
Materials
(0.2%):
Amrize
Finance
US
LLC,
3.50%,
9/22/26,
Callable
6/22/26
@
100
...................
19,600
19,425
Utilities
(1.1%):
Constellation
Energy
Generation
LLC
3.90%,
1/8/28
.....................................................
10,000
9,920
4.27%
(SOFR+60bps),
1/8/28(b)
........................................
6,680
6,668
Exelon
Corp.,
3.40%,
4/15/26
..............................................
20,000
19,990
KeySpan
Gas
East
Corp.,
2.74%,
8/15/26,
Callable
5/15/26
@
100(a)
..................
15,408
15,301
NextEra
Energy
Capital
Holdings,
Inc.,
4.47%
(SOFRINDX+80bps),
2/4/28(b)
..........
6,645
6,653
PPL
Capital
Funding,
Inc.,
3.10%,
5/15/26,
Callable
4/13/26
@
100
...................
1,778
1,775
Vistra
Operations
Co.
LLC
5.05%,
12/30/26(a)
..................................................
8,500
8,526
3.70%,
1/30/27,
Callable
11/30/26
@
100(a)
................................
16,400
16,250
85,083
Total
Corporate
Bonds
(Cost
$1,783,097)
a
a
a
1,784,275
Insurance-Linked
Securities
(0.1%)
Event
Linked
Bonds
(0.1%):
Earthquake
-
California
-
(0.0%):(i)
Torrey
Pines
Re
9.59%,
(JMMMUSTF+604bps),
6/7/27(a)(b)(k)
............................
500
516
10.66%,
(JMMMUSTF+711bps),
6/7/27,
Callable
6/7/26
@
102.25(a)(b)(k)
........
250
259
Multiperil
-
U.S.
-
(0.0%):(i)
Sanders
Re
III,
6.89%
(BRMMUSDF+334bps),
4/7/26(a)(b)(k)
......................
3,000
3,000
Multiperil
-
U.S.
Regional
-
(0.1%):
Long
Point
Re
IV,
7.81%
(BRMMUSDF+425bps),
6/1/26,
Callable
5/2/26
@
101.5(a)(b)(k)
.
3,500
3,504
Wind
Storm
-
Florida
-
(0.0%):(i)
Integrity
Re,
4.01%
(FHMMUSTF+50bps),
6/6/30(a)(b)(k)
.........................
1,238
619
7,898
Reinsurance
Sidecars
(0.0%):(i)
Multiperil
-
Worldwide
-
(0.0%):(i)
Alturas
Re
7/31/26(f)(k)(l)(m)
..................................................
4,000
112
12/31/27(f)(k)(l)(m)
.................................................
421
5
Gleneagles
Re,
2022,
12/31/27(f)(k)(l)(n)
......................................
3,000
106
Thopas
Re,
2022,
12/31/27(f)(k)(l)(m)
........................................
3,500
18
Viribus
Re
12/31/26(f)(k)(l)(m)
.................................................
2,500
—
12/31/26(f)(k)(l)(m)
.................................................
750
—
241
Total
Insurance-Linked
Securities
(Cost
$9,984)
a
a
a
8,139
Yankee
Dollars
(11.5%)
Energy
(0.4%):
Enbridge,
Inc.,
5.25%,
4/5/27,
Callable
3/5/27
@
100
.............................
8,435
8,506
Korea
National
Oil
Corp.,
4.34%
(SOFR+67bps),
9/29/28(a)(b)
......................
25,280
25,311
33,817
Financials
(10.3%):
ABN
AMRO
Bank
NV,
5.44%
(SOFRINDX+178bps),
9/18/27,
Callable
9/18/26
@
100(a)(b)
23,300
23,423
AerCap
Ireland
Capital
DAC/AerCap
Global
Aviation
Trust
6.10%,
1/15/27,
Callable
12/15/26
@
100
.................................
11,000
11,120
6.45%,
4/15/27,
Callable
3/15/27
@
100
..................................
15,500
15,792
Victory
Portfolios
IV
Victory
Pioneer
Multi-Asset
Ultrashort
Income
Fund
Schedule
of
Portfolio
Investments
—
continued
March
31,
2026
See
notes
to
financial
statements.
Security
Description
Principal
Amount
(000)
a
Value
(000)
Australia
&
New
Zealand
Banking
Group
Ltd.
4.28%
(SOFR+62bps),
6/18/28(a)(b)
.....................................
$
8,607
$
8,631
4.28%
(SOFR+61bps),
1/22/29(a)(b)
.....................................
4,740
4,734
Avolon
Holdings
Funding
Ltd.,
4.38%,
5/1/26,
Callable
4/20/26
@
100(a)
..............
17,000
16,999
Banco
Santander
SA
5.04%
(SOFR+138bps),
3/14/28,
Callable
3/14/27
@
100(b)
....................
12,000
12,074
4.79%
(SOFR+112bps),
7/15/28,
Callable
7/15/27
@
100(b)
....................
16,400
16,467
Bank
of
Montreal
5.00%
(SOFRINDX+133bps),
6/5/26(b)
..................................
7,500
7,515
4.28%
(SOFRINDX+62bps),
9/15/26,
MTN(b)
.............................
8,100
8,108
4.29%
(SOFR+62bps),
1/13/28,
MTN(b)
..................................
12,400
12,389
4.41%
(SOFRINDX+75bps),
9/22/28,
Callable
9/22/27
@
100(b)
................
14,790
14,791
4.53%
(SOFR+86bps),
1/27/29,
Callable
1/27/28
@
100(b)
.....................
16,723
16,694
Banque
Federative
du
Credit
Mutuel
SA
5.07%
(SOFRINDX+140bps),
7/13/26(a)(b)
...............................
7,000
7,021
4.80%
(SOFR+113bps),
1/23/27(a)(b)
....................................
3,220
3,235
4.74%
(SOFRINDX+107bps),
2/16/28(a)(b)
...............................
5,700
5,720
Barclays
PLC
5.54%
(SOFR+188bps),
9/13/27,
Callable
9/13/26
@
100(b)
....................
12,316
12,364
5.15%
(SOFR+149bps),
3/12/28,
Callable
3/12/27
@
100(b)
....................
12,500
12,587
4.75%
(SOFR+108bps),
11/11/29,
Callable
11/11/28
@
100(b)
..................
7,030
7,037
BPCE
SA,
5.65%
(SOFRINDX+198bps),
10/19/27,
Callable
10/19/26
@
100(a)(b)
.......
16,060
16,167
Canadian
Imperial
Bank
of
Commerce
4.61%
(SOFR+94bps),
6/28/27(b)
.......................................
17,160
17,249
4.59%
(SOFRINDX+93bps),
9/11/27,
Callable
9/11/26
@
100(b)
................
6,900
6,906
4.39%
(SOFR+72bps),
1/13/28,
Callable
1/13/27
@
100(b)
.....................
17,830
17,836
Cooperatieve
Rabobank
UA
4.57%
(SOFRINDX+90bps),
10/5/26(b)
..................................
8,000
8,018
4.26%
(SOFR+59bps),
10/17/28(b)
......................................
16,170
16,186
Credit
Agricole
SA,
4.87%
(SOFR+121bps),
9/11/28,
Callable
9/11/27
@
100(a)(b)
.......
12,000
12,053
Federation
des
Caisses
Desjardins
du
Quebec
4.30%
(SOFR+63bps),
1/27/27(a)(b)
.....................................
23,280
23,305
4.55%,
8/23/27(a)
..................................................
12,036
12,081
HSBC
Holdings
PLC,
5.24%
(SOFR+157bps),
8/14/27,
Callable
8/14/26
@
100(b)
........
8,700
8,725
ING
Groep
NV
4.64%
(SOFRINDX+101bps),
4/1/27(b)
..................................
8,309
8,309
5.22%
(SOFRINDX+156bps),
9/11/27,
Callable
9/11/26
@
100(b)
................
20,100
20,189
Lloyds
Banking
Group
PLC
5.23%
(SOFRINDX+156bps),
8/7/27,
Callable
8/7/26
@
100(b)
.................
10,000
10,031
5.25%
(SOFRINDX+158bps),
1/5/28,
Callable
1/5/27
@
100(b)
.................
13,841
13,949
4.73%
(SOFRINDX+106bps),
11/26/28,
Callable
11/26/27
@
100(b)
..............
10,245
10,289
Macquarie
Bank
Ltd.,
4.40%
(SOFR+74bps),
6/12/28(a)(b)
.........................
11,450
11,441
National
Australia
Bank
Ltd.
4.27%
(SOFR+60bps),
10/26/27(a)(b)
....................................
7,430
7,450
4.31%
(SOFR+65bps),
6/13/28(a)(b)
.....................................
17,061
17,107
4.19%
(SOFR+53bps),
12/13/28(a)(b)
....................................
5,770
5,770
National
Bank
of
Canada
4.70%
(SOFRINDX+103bps),
7/2/27,
Callable
7/2/26
@
100(b)
.................
8,190
8,201
4.44%
(SOFR+77bps),
1/20/29,
Callable
1/20/28
@
100(b)
.....................
13,440
13,452
NatWest
Group
PLC,
4.92%
(SOFR+125bps),
3/1/28,
Callable
3/1/27
@
100(b)
..........
6,000
6,025
NatWest
Markets
PLC
4.57%
(SOFR+90bps),
5/17/27(a)(b)
.....................................
13,580
13,625
4.61%
(SOFR+95bps),
3/21/28(a)(b)
.....................................
15,400
15,459
Nomura
Holdings,
Inc.,
4.92%
(SOFR+125bps),
7/2/27(b)
.........................
20,260
20,383
Nordea
Bank
Abp,
5.38%,
9/22/27(a)
.........................................
12,625
12,815
NTT
Finance
Corp.,
4.57%,
7/16/27(a)
.......................................
12,180
12,208
Royal
Bank
of
Canada
4.24%
(SOFRINDX+57bps),
4/27/26(b)
..................................
4,620
4,621
4.26%
(SOFRINDX+59bps),
11/2/26,
MTN(b)
..............................
4,800
4,803
4.62%
(SOFRINDX+95bps),
1/19/27,
MTN(b)
.............................
15,280
15,341
4.39%
(SOFRINDX+72bps),
10/18/27,
Callable
10/18/26
@
100(b)
..............
6,956
6,957
4.49%
(SOFRINDX+82bps),
3/27/28,
Callable
3/27/27
@
100(b)
................
20,320
20,342
4.50%
(SOFRINDX+83bps),
1/24/29,
Callable
1/24/28
@
100(b)
................
4,621
4,628
Victory
Portfolios
IV
Victory
Pioneer
Multi-Asset
Ultrashort
Income
Fund
Schedule
of
Portfolio
Investments
—
continued
March
31,
2026
See
notes
to
financial
statements.
Security
Description
Principal
Amount
(000)
a
Value
(000)
Santander
UK
Group
Holdings
PLC,
4.73%
(SOFRINDX+107bps),
9/22/29,
Callable
9/22/28
@
100(b)
.........................................................
$
7,100
$
7,104
Skandinaviska
Enskilda
Banken
AB,
4.34%
(SOFRINDX+68bps),
3/12/29(a)(b)
..........
12,730
12,719
Societe
Generale
SA,
5.08%
(SOFR+141bps),
4/13/29,
Callable
4/13/28
@
100(a)(b)
......
17,440
17,528
Standard
Chartered
PLC
5.60%
(SOFR+193bps),
7/6/27,
Callable
7/6/26
@
100(a)(b)
....................
8,600
8,632
4.91%
(SOFR+124bps),
1/21/29,
Callable
1/21/28
@
100(a)(b)
..................
17,580
17,650
Sumitomo
Mitsui
Financial
Group,
Inc.,
4.43%
(SOFR+76bps),
1/15/29(b)
..............
16,755
16,697
Sumitomo
Mitsui
Trust
Bank
Ltd.
4.81%
(SOFR+115bps),
9/14/26(a)(b)
....................................
3,835
3,845
4.41%
(SOFR+75bps),
9/11/28(a)(b)
.....................................
14,400
14,422
Swedbank
AB,
5.04%
(SOFRINDX+138bps),
6/15/26(a)(b)
........................
8,840
8,855
The
Bank
of
Nova
Scotia
4.45%
(SOFRINDX+78bps),
6/4/27,
MTN(b)
..............................
11,130
11,165
4.42%
(SOFR+76bps),
9/15/28,
Callable
9/15/27
@
100(b)
.....................
28,520
28,519
4.56%
(SOFR+89bps),
2/14/29,
Callable
2/14/28
@
100(b)
.....................
14,460
14,485
The
Toronto-Dominion
Bank
4.75%
(SOFR+108bps),
7/17/26,
MTN(b)
.................................
4,000
4,008
4.25%
(SOFR+59bps),
9/10/26(b)
.......................................
11,667
11,681
4.25%
(SOFR+58bps),
1/13/28(b)
.......................................
12,430
12,456
4.49%
(SOFR+82bps),
1/31/28(b)
.......................................
5,985
6,007
4.58%
(SOFR+91bps),
6/2/28,
MTN(b)
...................................
11,850
11,890
4.42%
(SOFR+75bps),
10/13/28(b)
......................................
8,070
8,084
834,369
Industrials
(0.4%):
Element
Fleet
Management
Corp.
6.27%,
6/26/26,
Callable
5/26/26
@
100(a)
................................
25,088
25,153
5.64%,
3/13/27,
Callable
2/13/27
@
100(a)
................................
5,703
5,750
30,903
Materials
(0.2%):
Rio
Tinto
Finance
USA
PLC,
4.50%
(SOFRINDX+84bps),
3/14/28(b)
.................
12,350
12,423
Utilities
(0.2%):
Algonquin
Power
&
Utilities
Corp.,
5.37%,
6/15/26(o)
............................
17,018
17,032
Total
Yankee
Dollars
(Cost
$926,620)
a
a
a
928,544
U.S.
Government
Agency
Mortgages
(3.1%)
Federal
Home
Loan
Mortgage
Corporation
6.00%,
8/1/53
-
9/1/54
...............................................
13,009
13,358
6.50%,
4/1/54
-
10/1/54
..............................................
41,188
42,964
56,322
Federal
National
Mortgage
Association
6.24%
(H15T1Y+212bps),
9/1/32(b)
.....................................
1
1
3.00%,
3/1/47
.....................................................
1,624
1,481
6.03%
(RFUCCT1Y+167bps),
1/1/48(b)
..................................
3
3
6.00%,
5/1/53
-
10/1/54
..............................................
15,429
15,759
6.50%,
12/1/53
-
6/1/54
..............................................
35,121
36,424
5.50%,
10/1/54
....................................................
5,107
5,150
58,818
Federal
National
Mortgage
Association,
TBA
5.50%,
4/25/41
-
4/25/56
.............................................
43,000
43,435
3.50%,
4/25/49
....................................................
19,000
17,416
3.00%,
4/25/52
....................................................
18,000
15,807
5.00%,
4/25/56
....................................................
26,000
25,639
102,297
Government
National
Mortgage
Association
6.00%,
4/20/56
....................................................
16,000
16,269
Victory
Portfolios
IV
Victory
Pioneer
Multi-Asset
Ultrashort
Income
Fund
Schedule
of
Portfolio
Investments
—
continued
March
31,
2026
See
notes
to
financial
statements.
Security
Description
Principal
Amount
(000)
a
Value
(000)
Government
National
Mortgage
Association,
TBA
6.50%,
4/20/56
....................................................
$
15,000
$
15,589
Total
U.S.
Government
Agency
Mortgages
(Cost
$248,674)
a
a
a
249,295
Commercial
Paper
(8.7%)
Consumer
Discretionary
(1.4%):
Alimentation
Couche-Tard,
Inc.
4.03%,
4/1/26(a)(p)
.................................................
17,700
17,698
4.08%,
4/13/26(a)(p)
................................................
20,000
19,971
AutoZone,
Inc.
3.91%,
4/2/26(a)(p)
.................................................
19,200
19,196
3.92%,
4/6/26(a)(p)
.................................................
18,000
17,988
O'Reilly
Automotive,
Inc.,
4.00%,
4/8/26(a)(p)
..................................
35,000
34,969
109,822
Energy
(1.1%):
Enterprise
Products
Operating
LLC,
3.95%,
4/1/26(a)(p)
...........................
38,000
37,996
Kinder
Morgan,
Inc.,
4.15%,
4/1/26(a)(p)
......................................
15,548
15,546
Plains
All
American
Pipeline
LP,
3.96%,
4/2/26(a)(p)
.............................
38,000
37,992
91,534
Financials
(2.0%):
Amphenol
Corp.,
1.85%,
4/2/26(a)(p)
........................................
38,000
37,996
Aon
Corp.,
3.92%,
4/8/26(a)(p)
.............................................
30,000
29,974
Eaton
Capital
ULC,
4.01%,
4/13/26(a)(p)
......................................
38,000
37,945
Marsh
&
McLennan
Cos.,
Inc.,
3.97%,
4/6/26(a)(p)
..............................
15,400
15,390
Prudential
Funding
LLC,
3.67%,
4/1/26(a)(p)
...................................
40,000
39,996
161,301
Health
Care
(0.3%):
Elevance
Health,
Inc.,
4.02%,
4/7/26(a)(p)
.....................................
25,000
24,980
Industrials
(0.4%):
Fiserv,
Inc.,
3.98%,
4/1/26(a)(p)
............................................
17,000
16,998
Hubbell,
Inc.,
3.80%,
4/1/26(a)(p)
...........................................
18,400
18,398
35,396
Information
Technology
(0.3%):
Jabil,
Inc.,
4.14%,
4/1/26(a)(p)
.............................................
25,000
24,997
Real
Estate
(0.9%):
ERP
Operating
LP,
3.97%,
4/7/26(a)(p)
.......................................
38,000
37,971
Healthpeak
OP
LLC,
4.01%,
4/8/26(a)(p)
......................................
38,000
37,966
75,937
Utilities
(2.3%):
American
Electric
Power
Co.,
Inc.,
4.00%,
4/13/26(a)(p)
...........................
38,000
37,945
Consolidated
Edison,
Inc.,
3.92%,
4/1/26(a)(p)
..................................
38,000
37,996
NGPL
PipeCo
LLC,
4.18%,
4/1/26(a)(p)
......................................
14,000
13,998
Puget
Sound
Energy,
Inc.,
3.96%,
4/2/26(a)(p)
..................................
15,400
15,396
WEC
Energy
Group,
Inc.,
3.97%,
4/7/26(a)(p)
..................................
38,000
37,971
Xcel
Energy,
Inc.,
3.97%,
4/7/26(a)(p)
........................................
38,000
37,971
181,277
Total
Commercial
Paper
(Cost
$705,312)
a
a
a
705,244
Repurchase
Agreements
(6.8%)
Bank
of
America
Corp.,
3.66%,
purchased
on
3/31/26,
with
a
maturity
date
of
4/1/26,
with
a
repurchase
value
of
$110,011
(collateralized
by
U.S.
Treasury
Bonds,
0.00%,
due
2/15/38
-
11/15/55,
with
an
aggregate
value
of
$112,200)
.................................
$
110,000
110,000
Bank
of
America
Corp.,
3.67%,
purchased
on
3/31/26,
with
a
maturity
date
of
4/1/26,
with
a
repurchase
value
of
$106,011
(collateralized
by
Agency
Mortgage-Backed
Securities,
2.29%-
7.00%,
due
6/1/33
-
1/20/66,
with
an
aggregate
value
of
$108,120)
....................
106,000
106,000
Victory
Portfolios
IV
Victory
Pioneer
Multi-Asset
Ultrashort
Income
Fund
Schedule
of
Portfolio
Investments
—
continued
March
31,
2026
See
notes
to
financial
statements.
Alturas
Re,
2021-3
...........................................
Alturas
Re,
2022-2
...........................................
Gleneagles
Re,
2022
..........................................
Integrity
Re
................................................
Long
Point
Re
IV
............................................
Sanders
Re
III
..............................................
Thopas
Re,
2022
............................................
Torrey
Pines
Re
.............................................
Torrey
Pines
Re
.............................................
Viribus
Re,
2018
............................................
Viribus
Re,
2019
............................................
Total
(0.1%
of
net
assets)
Security
Description
Principal
Amount
(000)
a
Value
(000)
Bank
of
Nova
Scotia,
3.67%,
purchased
on
3/31/26,
with
a
maturity
date
of
4/1/26,
with
a
repurchase
value
of
$55,286
(collateralized
by
Agency
Mortgage-Backed
Securities,
2.00%-
2.25%,
due
5/15/41
-
1/1/52,
with
an
aggregate
value
of
$56,391)
....................
$
55,280
$
55,280
RBC
Dominion
Securities,
Inc.,
3.68%,
purchased
on
3/31/26,
with
a
maturity
date
of
4/1/26,
with
a
repurchase
value
of
$151,295
(collateralized
by
Agency
Mortgage-Backed
Securities,
2.25%-6.38%,
due
4/30/27
-
5/15/52,
with
an
aggregate
value
of
$154,321)
.............
151,280
151,280
Toronto
Dominion
Bank,
3.67%,
purchased
on
3/31/26,
with
a
maturity
date
of
4/1/26,
with
a
repurchase
value
of
$87,649
(collateralized
by
Agency
Mortgage-Backed
Securities,
3.50%-
7.13%,
due
3/15/28
-
9/15/65,
with
an
aggregate
value
of
$89,394)
....................
87,640
87,640
Toronto
Dominion
Bank,
3.66%,
purchased
on
3/31/26,
with
a
maturity
date
of
4/1/26,
with
a
repurchase
value
of
$37,644
(collateralized
by
U.S.
Treasury
Bonds,
0.88%-1.50%,
due
9/30/26
-
2/15/30,
with
an
aggregate
value
of
$38,393)
............................
37,640
37,640
Total
Repurchase
Agreements
(Cost
$547,840)
a
a
a
547,840
Total
Investments
(Cost
$8,250,121)
—
101.6%
8,213,892
Liabilities
in
excess
of
other
assets
— (1.6)%
(131,826)
NET
ASSETS
-
100.00%
$
8,082,066
At
March
31,
2026,
the
Fund's
investments
in
foreign
securities
were
22.1%
of
net
assets.
(a)
Rule
144A
security
or
other
security
that
is
restricted
as
to
resale
to
institutional
investors.
As
of
March
31,
2026,
the
fair
value
of
these
securities
was
$5,088,569
(thousands)
and
amounted
to
63.0%
of
net
assets.
(b)
Variable
or
Floating-Rate
Security.
Rate
disclosed
is
as
of
March
31,
2026.
(c)
Currently
the
issuer
is
in
default
with
respect
to
interest
and/or
principal
payments.
(d)
The
rate
for
certain
asset-backed
and
mortgage-backed
securities
may
vary
based
on
factors
relating
to
the
pool
of
assets
underlying
the
security.
The
rate
disclosed
is
the
rate
in
effect
at
March
31,
2026.
(e)
Rounds
to
less
than
$1
thousand.
(f)
Security
was
fair
valued
based
upon
procedures
approved
by
the
Board
of
Trustees
and
represents
0.1%
of
net
assets
as
of
March
31,
2026.
This
security
is
classified
as
Level
3
within
the
fair
value
hierarchy
based
on
significant
unobservable
inputs.
(See
Note
2
in
the
Notes
to
Financial
Statements)
(g)
Zero-coupon
bond.
(h)
Security
is
interest
only.
(i)
Amount
represents
less
than
0.05%
of
net
assets.
(j)
The
rates
for
this
senior
secured
loan
will
be
known
on
settlement
date
of
the
loan,
subsequent
to
this
report
date.
Senior
secured
loans
have
rates
that
will
fluctuate
over
time
in
line
with
prevailing
interest
rates.
(k)
The
following
table
details
the
earliest
acquisition
date
and
cost
of
the
Fund's
restricted
securities
due
to
trading
restrictions
at
March
31,
2026
(amounts
in
thousands):
(l)
Non-income
producing
security.
(m)
Issued
as
preference
shares.
(n)
Issued
as
participation
notes.
(o)
Stepped
coupon
security
for
which
the
coupon
rate
of
interest
adjusts
on
specified
date(s);
rate
shown
is
effective
rate
at
period-end.
(p)
Rate
represents
the
effective
yield
at
March
31,
2026.
ABS
—
Asset-Backed
Securities
bps
—
Basis
points
Victory
Portfolios
IV
Victory
Pioneer
Multi-Asset
Ultrashort
Income
Fund
Schedule
of
Portfolio
Investments
—
continued
March
31,
2026
See
notes
to
financial
statements.
BRMMUSDF
—
BlackRock
Liquidity
Fund
Treasury
Trust
Fund
Portfolio
Fund
Yield
CLO
—
Collateralized
Loan
Obligations
CMO
—
Collateralized
Mortgage
Obligations
FHMMUSTF
—
Federated
Hermes
US
Treasury
Cash
Reserves
Fund
Yield
H15T1Y
—
1
Year
Treasury
Constant
Maturity
Rate,
rate
disclosed
as
of
March
31,
2026.
JMMMUSTF
—
JPMorgan
100%
US
Treasury
Securities
Money
Market
Fund
Yield
LLC
—
Limited
Liability
Company
LP
—
Limited
Partnership
MBS
—
Mortgage-Backed
Securities
MTN
—
Medium
Term
Note
PLC
—
Public
Limited
Company
PRIME
—
US
Prime
rate,
rate
disclosed
as
of
March
31,
2026.
REMIC
—
Real
Estate
Mortgage
Investment
Conduits
RFUCCT1Y
—
Refinitiv
USD
Interbank
Offered
Rate
Customer
Cash
Fallbacks
Term
1
Year,
rate
disclosed
as
of
March
31,
2026
SOFR
—
Secured
Overnight
Financing
Rate
SOFRINDX
—
United
States
SOFR
Compounded
Index,
rate
disclosed
as
of
March
31,
2026.
SOFR01M
—
1
Month
SOFR,
rate
disclosed
as
of
March
31,
2026.
SOFR03M
—
3
Month
SOFR,
rate
disclosed
as
of
March
31,
2026.
SOFR06M
—
6
Month
SOFR,
rate
disclosed
as
of
March
31,
2026.
SOFR30A
—
30
day
average
of
SOFR,
rate
disclosed
as
of
March
31,
2026.
SOFR90A
—
90
day
average
of
SOFR,
rate
disclosed
as
of
March
31,
2026.
STRIPS
—
Separately
Trading Registered
Interest
and
Principal
Securities
TBA
—
To
Be
Announced
Securities
TSFR1M
—
1
Month
Term
SOFR,
rate
disclosed
as
of
March
31,
2026.
TSFR3M
—
3
Month
Term
SOFR,
rate
disclosed
as
of
March
31,
2026.
ULC
—
Unlimited
Liability
Co.
US0001M
—
1
Month
US
Dollar
London
Interbank
Offered
Rate,
rate
disclosed
as
of
March
31,
2026,
based
on
the
last
reset
date
of
the
security.
TBA
Sales
Commitments
Security
Description
Principal
Amount
(000)
Value
(000)
TBA
Sales
Commitments
-
(1.30%)
Collateralized
Mortgage
Obligations
— (1.30%)
Federal
National
Mortgage
Association,
TBA
6.00%
,
4/25/56
....................................................
(27,800)
$
(28,337)
6.50%
,
4/25/56
....................................................
(75,800)
(78,416)
Total
TBA
Sales
Commitments
(Proceeds $107,083)
$(106,753)
Futures
Contracts
Purchased
Number
of
Contracts
Expiration
Date
Notional
Amount
(000)
Value
(000)
Unrealized
Appreciation
(Depreciation)
(000)
2-Year
U.S.
Treasury
Note
Futures
.......
500
6/30/26
$
103,511
$
103,723
$
212
Futures
Contracts
Sold
Number
of
Contracts
Expiration
Date
Notional
Amount
(000)
Value
(000)
Unrealized
Appreciation
(Depreciation)
(000)
30-Year
U.S.
Treasury
Bond
Futures
.....
113
6/18/26
$
13,264
$
12,868
$
396
Total
unrealized
appreciation
$
608
Total
unrealized
depreciation
—
Total
net
unrealized
appreciation
(depreciation)
$
608
Statement
of
Assets
and
Liabilities
March
31,
2026
See
notes
to
financial
statements.
(Amounts
in
Thousands,
Except
Per
Share
Amounts)
Victory
Pioneer
Multi-Asset
Ultrashort
Income
Fund
Assets:
Investments,
at
value
(Cost
$7,702,281)
$
7,666,052
Repurchase
agreements,
at
value
(Cost
$547,840)
547,840
Cash
60,569
Futures
contracts
collateral
2,390
TBA
sales
commitments
collateral
328
Receivables:
Dividends
and
interest
34,967
Capital
shares
issued
11,532
Investments
sold
110,529
Prepaid
expenses
127
Total
Assets
8,434,334
Liabilities:
Payables:
Distributions
1,263
Investments
purchased
216,387
Capital
shares
redeemed
23,985
Variation
margin
on
open
futures
contracts
3
TBA
sales
commitments,
at
value
(Proceeds
$107,083)
106,753
Accrued
expenses
and
other
payables:
Investment
advisory
fees
1,997
Administration
fees
304
Custodian
fees
30
Transfer
agent
fees
46
Sub-Transfer
agent
fees
998
12b-1
fees
322
Other
accrued
expenses
180
Total
Liabilities
352,268
Commitments
and
contingencies
(Note
5
)
Net
Assets:
Capital
8,417,349
Total
accumulated
earnings
(loss)
(335,283)
Net
Assets
$
8,082,066
Net
Assets:
Class
A
$
3,557,724
Class
C
42,475
Class
R6
522,936
Class
Y
3,958,931
Total
$
8,082,066
Shares
(unlimited
number
of
shares
authorized
with
a
par
value
of
$0.001
per
share):
Class
A
370,693
Class
C
4,421
Class
R6
54,327
Class
Y
411,807
Total
841,248
Net
asset
value,
offering
and
redemption
price
per
share:(a)
Class
A
$
9.60
Class
C(b)
9.61
Class
R6
9.63
Class
Y
9.61
(a)
Per
share
amount
may
not
recalculate
due
to
rounding
of
net
assets
and/or
shares
outstanding.
(b)
Redemption
price
per
share
varies
by
length
of
time
shares
are
held.
Statement
of
Operations
For
the
Year
Ended
March
31,
2026
See
notes
to
financial
statements.
Victory
Pioneer
Multi-Asset
Ultrashort
Income
Fund
Investment
Income:
Dividends
$
2,551
Interest
414,229
Total
Income
416,780
Expenses:
Investment
advisory
fees
22,643
Administration
fees
3,495
Sub-Administration
fees
1
12b-1
fees
—
Class
A
6,534
12b-1
fees
—
Class
C
123
Custodian
fees
103
Transfer
agent
fees
—
Class
A
41
Transfer
agent
fees
—
Class
C
1
Transfer
agent
fees
—
Class
R6
1
Transfer
agent
fees
—
Class
Y
131
Sub-Transfer
agent
fees
—
Class
A
1,092
Sub-Transfer
agent
fees
—
Class
C
139
Sub-Transfer
agent
fees
—
Class
Y
3,987
Trustees'
fees
325
Legal
and
audit
fees
384
State
registration
and
filing
fees
528
Other
expenses
256
Total
Expenses
39,784
Less
fees
paid
indirectly
(
69
)
Expenses
waived/reimbursed
by
Adviser
(
517
)
Net
Expenses
39,198
Net
Investment
Income
(Loss)
377,582
Realized/Unrealized
Gains
(Losses)
from
Investments:
Net
realized
gains
(losses)
from
investment
securities
(
19,574
)
Net
realized
gains
(losses)
from
futures
contracts
(
669
)
Net
change
in
unrealized
appreciation/depreciation
on
investment
securities
(
23,135
)
Net
change
in
unrealized
appreciation/depreciation
on
TBA
sales
commitments
510
Net
change
in
unrealized
appreciation/depreciation
on
futures
contracts
1,038
Net
realized/unrealized
gains
(losses)
on
investments
(
41,830
)
Change
in
net
assets
resulting
from
operations
$
335,752
Statements
of
Changes
in
Net
Assets
See
notes
to
financial
statements.
Victory
Pioneer
Multi-Asset
Ultrashort
Income
Fund
Year
Ended
March
31,
2026
Year
Ended
March
31,
2025*
From
Investment
Activities:
Operations:
Net
Investment
Income
(Loss)
$
377,582
$
360,225
Net
realized
gains
(losses)
(
20,243
)
(
1,212
)
Net
change
in
unrealized
appreciation/depreciation
(
21,587
)
2,404
Change
in
net
assets
resulting
from
operations
335,752
361,417
Distributions
to
Shareholders:
Class
A
(
153,247
)
(
114,320
)
Class
C
(
2,179
)
(
2,970
)
Class
C2
—
(
409
)
Class
R6
(
27,479
)
(
31,380
)
Class
Y
(
197,379
)
(
209,740
)
Change
in
net
assets
resulting
from
distributions
to
shareholders
(
380,284
)
(
358,819
)
Change
in
net
assets
resulting
from
capital
transactions
328,550
2,506,877
Change
in
net
assets
284,018
2,509,475
Net
Assets:
Beginning
of
period
7,798,048
5,288,573
End
of
period
$
8,082,066
$
7,798,048
*
Pioneer
Multi-Asset
Ultrashort
Income
Fund
(the
“Predecessor
Fund”)
reorganized
with
the
Fund
effective
April
1,
2025
(the
“Reorganization”).
The
Predecessor
Fund
is
the
accounting
survivor
of
the
Reorganization
and
shareholders
holding
Class
A,
Class
C,
Class
C2,
Class
K,
and
Class
Y
shares
of
the
Predecessor
Fund
received
Class
A,
Class
C,
Class
C,
Class
R6,
and
Class
Y
shares
of
the
Fund,
respectively.
Statements
of
Changes
in
Net
Assets
See
notes
to
financial
statements.
Victory
Pioneer
Multi-Asset
Ultrashort
Income
Fund
Year
Ended
March
31,
2026
Year
Ended
March
31,
2025*
Capital
Transactions:
Class
A
Proceeds
from
shares
issued
$
2,494,549
$
2,678,505
Distributions
reinvested
151,320
112,986
Cost
of
shares
redeemed
(
2,090,407
)
(
1,265,054
)
Total
Class
A
$
555,462
$
1,526,437
Class
C
Proceeds
from
shares
issued
$
57,368
$
14,168
Distributions
reinvested
1,931
2,970
Cost
of
shares
redeemed
(
74,839
)
(
24,276
)
Total
Class
C
$
(
15,540
)
$
(
7,138
)
Class
C2
Proceeds
from
shares
issued
$
—
$
4,115
Distributions
reinvested
—
23
Cost
of
shares
redeemed
—
(
5,799
)
Total
Class
C2
$
—
$
(
1,661
)
Class
R6
Proceeds
from
shares
issued
$
45,957
$
122,112
Distributions
reinvested
27,471
31,380
Cost
of
shares
redeemed
(
100,404
)
(
95,342
)
Total
Class
R6
$
(
26,976
)
$
58,150
Class
Y
Proceeds
from
shares
issued
$
2,198,908
$
2,884,227
Distributions
reinvested
179,783
188,640
Cost
of
shares
redeemed
(
2,563,087
)
(
2,141,778
)
Total
Class
Y
$
(
184,396
)
$
931,089
Change
in
net
assets
resulting
from
capital
transactions
$
328,550
$
2,506,877
Share
Transactions:
Class
A
Issued
259,015
277,427
Reinvested
15,714
11,704
Redeemed
(
217,108
)
(
131,049
)
Total
Class
A
57,621
158,082
Class
C
Issued
5,940
1,465
Reinvested
200
308
Redeemed
(
7,752
)
(
2,512
)
Total
Class
C
(
1,612
)
(
739
)
Class
C2
Issued
—
426
Reinvested
—
2
Redeemed
—
(
601
)
Total
Class
C2
—
(
173
)
Class
R6
Issued
4,760
12,588
Reinvested
2,844
3,260
Redeemed
(
10,405
)
(
9,849
)
Total
Class
R6
(
2,801
)
5,999
Class
Y
Issued
227,951
298,228
Reinvested
18,642
19,501
Redeemed
(
265,725
)
(
221,419
)
Total
Class
Y
(
19,132
)
96,310
Change
in
Shares
34,076
259,479
*
Pioneer
Multi-Asset
Ultrashort
Income
Fund
(the
“Predecessor
Fund”)
reorganized
with
the
Fund
effective
April
1,
2025
(the
“Reorganization”).
The
Predecessor
Fund
is
the
accounting
survivor
of
the
Reorganization
and
shareholders
holding
Class
A,
Class
C,
Class
C2,
Class
K,
and
Class
Y
shares
of
the
Predecessor
Fund
received
Class
A,
Class
C,
Class
C,
Class
R6,
and
Class
Y
shares
of
the
Fund,
respectively.
For
a
Share
Outstanding
Throughout
Each
Period
See
notes
to
financial
statements.
Victory
Pioneer
Multi-Asset
Ultrashort
Income
Fund
Class
A*
Year
Ended
March
31,
2026
Year
Ended
March
31,
2025
Year
Ended
March
31,
2024
Year
Ended
March
31,
2023
Year
Ended
March
31,
2022
Net
Asset
Value,
Beginning
of
Period
$9.65
$9.64
$9.53
$9.61
$9.71
Investment
Activities:
Net
investment
income
(loss)(a)
0.45
0.53
0.57
0.31
0.09
Net
realized
and
unrealized
gains
(losses)
(0.05)
0.02
0.12
(0.06)
(0.07)
Total
from
Investment
Activities
0.40
0.55
0.69
0.25
0.02
Distributions
to
Shareholders
from:
Net
investment
income
(0.45)
(0.54)
(0.57)
(0.33)
(0.12)
Return
of
capital
—
—
(0.01)
—
—
Total
Distributions
(0.45)
(0.54)
(0.58)
(0.33)
(0.12)
Net
Asset
Value,
End
of
Period
$9.60
$9.65
$9.64
$9.53
$9.61
Total
Return(b)
4.25%
5.85%
7.45%
2.62%
0.16%
Ratios
to
Average
Net
Assets:
Net
Expenses(c)
0.58%(d)
0.58%
0.60%
0.60%
0.59%
Net
Investment
Income
(Loss)
4.65%
5.54%
5.96%
3.21%
0.96%
Gross
Expenses(c)
0.58%(d)
0.58%
0.60%
0.60%
0.59%
Supplemental
Data:
Net
Assets
at
end
of
period
(000's)
$3,557,724
$3,021,146
$1,494,536
$1,126,767
$1,824,401
Portfolio
Turnover(e)
54%
53%
57%
34%
52%
*
Pioneer
Multi-Asset
Ultrashort
Income
Fund
(the
“Predecessor
Fund”)
reorganized
with
the
Fund
effective
April
1,
2025
(the
“Reorganization”).
The
Predecessor
Fund
is
the
accounting
survivor
of
the
Reorganization
and
shareholders
holding
Class
A,
Class
C,
Class
C2,
Class
K,
and
Class
Y
shares
of
the
Predecessor
Fund
received
Class
A,
Class
C,
Class
C,
Class
R6,
and
Class
Y
shares
of
the
Fund,
respectively.
(a)
Per
share
net
investment
income
(loss)
has
been
calculated
using
the
average
daily
shares
method.
(b)
Assumes
reinvestment
of
all
net
investment
income
and
realized
capital
gain
distributions,
if
any,
during
the
period.
Includes
adjustments
in
accordance
with
U.S.
Generally
Accepted
Accounting
Principles
and
could
differ
from
the
reported
return.
(c)
Does
not
include
acquired
fund
fees
and
expenses,
if
any.
(d)
Reflects
total
annual
operating
expenses
before
reductions
of
any
expenses
paid
indirectly.
The
Fund's
expenses
paid
indirectly
decreased
the
expense
ratios
by
less
than
0.01%.
(e)
Portfolio
turnover
is
calculated
on
the
basis
of
the
Fund
as
a
whole
without
distinguishing
between
the
classes
of
shares.
Financial
Highlights
—
continued
For
a
Share
Outstanding
Throughout
Each
Period
See
notes
to
financial
statements.
Victory
Pioneer
Multi-Asset
Ultrashort
Income
Fund
Class
C*
Year
Ended
March
31,
2026
Year
Ended
March
31,
2025
Year
Ended
March
31,
2024
Year
Ended
March
31,
2023
Year
Ended
March
31,
2022
Net
Asset
Value,
Beginning
of
Period
$9.66
$9.65
$9.53
$9.62
$9.72
Investment
Activities:
Net
investment
income
(loss)(a)
0.43
0.52
0.54
0.27
0.07
Net
realized
and
unrealized
gains
(losses)
(0.06)
—
0.13
(0.06)
(0.08)
Total
from
Investment
Activities
0.37
0.52
0.67
0.21
(0.01)
Distributions
to
Shareholders
from:
Net
investment
income
(0.42)
(0.51)
(0.54)
(0.30)
(0.09)
Return
of
capital
—
—
(0.01)
—
—
Total
Distributions
(0.42)
(0.51)
(0.55)
(0.30)
(0.09)
Net
Asset
Value,
End
of
Period
$9.61
$9.66
$9.65
$9.53
$9.62
Total
Return(b)
3.93%
5.53%
7.24%
2.21%
(0.14)%
Ratios
to
Average
Net
Assets:
Net
Expenses(c)
0.88%(d)
0.88%
0.89%
0.91%
0.88%
Net
Investment
Income
(Loss)
4.42%
5.34%
5.65%
2.85%
0.69%
Gross
Expenses(c)
0.89%(d)
0.88%
0.89%
0.91%
0.88%
Supplemental
Data:
Net
Assets
at
end
of
period
(000's)
$42,475
$5,917
$7,571
$8,463
$15,861
Portfolio
Turnover(e)
54%
53%
57%
34%
52%
*
Pioneer
Multi-Asset
Ultrashort
Income
Fund
(the
“Predecessor
Fund”)
reorganized
with
the
Fund
effective
April
1,
2025
(the
“Reorganization”).
The
Predecessor
Fund
is
the
accounting
survivor
of
the
Reorganization
and
shareholders
holding
Class
A,
Class
C,
Class
C2,
Class
K,
and
Class
Y
shares
of
the
Predecessor
Fund
received
Class
A,
Class
C,
Class
C,
Class
R6,
and
Class
Y
shares
of
the
Fund,
respectively.
(a)
Per
share
net
investment
income
(loss)
has
been
calculated
using
the
average
daily
shares
method.
(b)
Assumes
reinvestment
of
all
net
investment
income
and
realized
capital
gain
distributions,
if
any,
during
the
period.
Includes
adjustments
in
accordance
with
U.S.
Generally
Accepted
Accounting
Principles
and
could
differ
from
the
reported
return.
Excludes
any
applicable
sales
charges,
including
contingent
deferred
sales
charges.
Total
return
would
be
reduced
if
sales
charges
were
taken
into
account.
(c)
Does
not
include
acquired
fund
fees
and
expenses,
if
any.
(d)
Reflects
total
annual
operating
expenses
before
reductions
of
any
expenses
paid
indirectly.
The
Fund's
expenses
paid
indirectly
decreased
the
expense
ratios
by
less
than
0.01%.
(e)
Portfolio
turnover
is
calculated
on
the
basis
of
the
Fund
as
a
whole
without
distinguishing
between
the
classes
of
shares.
For
a
Share
Outstanding
Throughout
Each
Period
Financial
Highlights
—
continued
See
notes
to
financial
statements.
Victory
Pioneer
Multi-Asset
Ultrashort
Income
Fund
Class
R6*
Year
Ended
March
31,
2026
Year
Ended
March
31,
2025
Year
Ended
March
31,
2024
Year
Ended
March
31,
2023
Year
Ended
March
31,
2022
Net
Asset
Value,
Beginning
of
Period
$9.68
$9.67
$9.56
$9.64
$9.74
Investment
Activities:
Net
investment
income
(loss)(a)
0.47
0.57
0.60
0.35
0.12
Net
realized
and
unrealized
gains
(losses)
(0.05)
—
0.12
(0.08)
(0.08)
Total
from
Investment
Activities
0.42
0.57
0.72
0.27
0.04
Distributions
to
Shareholders
from:
Net
investment
income
(0.47)
(0.56)
(0.60)
(0.35)
(0.14)
Return
of
capital
—
—
(0.01)
—
—
Total
Distributions
(0.47)
(0.56)
(0.61)
(0.35)
(0.14)
Net
Asset
Value,
End
of
Period
$9.63
$9.68
$9.67
$9.56
$9.64
Total
Return(b)
4.38%
6.09%
7.70%
2.86%
0.39%
Ratios
to
Average
Net
Assets:
Net
Expenses(c)
0.35%(d)
0.35%
0.37%
0.38%
0.36%
Net
Investment
Income
(Loss)
4.90%
5.85%
6.19%
3.71%
1.20%
Gross
Expenses(c)
0.35%(d)
0.35%
0.37%
0.38%
0.36%
Supplemental
Data:
Net
Assets
at
end
of
period
(000's)
$522,936
$552,952
$494,518
$465,248
$382,288
Portfolio
Turnover(e)
54%
53%
57%
34%
52%
*
Pioneer
Multi-Asset
Ultrashort
Income
Fund
(the
“Predecessor
Fund”)
reorganized
with
the
Fund
effective
April
1,
2025
(the
“Reorganization”).
The
Predecessor
Fund
is
the
accounting
survivor
of
the
Reorganization
and
shareholders
holding
Class
A,
Class
C,
Class
C2,
Class
K,
and
Class
Y
shares
of
the
Predecessor
Fund
received
Class
A,
Class
C,
Class
C,
Class
R6,
and
Class
Y
shares
of
the
Fund,
respectively.
(a)
Per
share
net
investment
income
(loss)
has
been
calculated
using
the
average
daily
shares
method.
(b)
Assumes
reinvestment
of
all
net
investment
income
and
realized
capital
gain
distributions,
if
any,
during
the
period.
Includes
adjustments
in
accordance
with
U.S.
Generally
Accepted
Accounting
Principles
and
could
differ
from
the
reported
return.
(c)
Does
not
include
acquired
fund
fees
and
expenses,
if
any.
(d)
Reflects
total
annual
operating
expenses
before
reductions
of
any
expenses
paid
indirectly.
The
Fund's
expenses
paid
indirectly
decreased
the
expense
ratios
by
less
than
0.01%.
(e)
Portfolio
turnover
is
calculated
on
the
basis
of
the
Fund
as
a
whole
without
distinguishing
between
the
classes
of
shares.
Financial
Highlights
—
continued
For
a
Share
Outstanding
Throughout
Each
Period
See
notes
to
financial
statements.
Victory
Pioneer
Multi-Asset
Ultrashort
Income
Fund
Class
Y*
Year
Ended
March
31,
2026
Year
Ended
March
31,
2025
Year
Ended
March
31,
2024
Year
Ended
March
31,
2023
Year
Ended
March
31,
2022
Net
Asset
Value,
Beginning
of
Period
$9.67
$9.66
$9.54
$9.63
$9.73
Investment
Activities:
Net
investment
income
(loss)(a)
0.46
0.55
0.59
0.34
0.11
Net
realized
and
unrealized
gains
(losses)
(0.05)
0.02
0.13
(0.09)
(0.08)
Total
from
Investment
Activities
0.41
0.57
0.72
0.25
0.03
Distributions
to
Shareholders
from:
Net
investment
income
(0.47)
(0.56)
(0.59)
(0.34)
(0.13)
Return
of
capital
—
—
(0.01)
—
—
Total
Distributions
(0.47)
(0.56)
(0.60)
(0.34)
(0.13)
Net
Asset
Value,
End
of
Period
$9.61
$9.67
$9.66
$9.54
$9.63
Total
Return(b)
4.28%
6.00%
7.73%
2.67%
0.30%
Ratios
to
Average
Net
Assets:
Net
Expenses(c)
0.44%(d)
0.44%
0.46%
0.45%
0.44%
Net
Investment
Income
(Loss)
4.81%
5.74%
6.11%
3.53%
1.12%
Gross
Expenses(c)
0.45%(d)
0.44%
0.46%
0.45%
0.44%
Supplemental
Data:
Net
Assets
at
end
of
period
(000's)
$3,958,931
$4,165,683
$3,232,507
$2,659,258
$2,725,842
Portfolio
Turnover(e)
54%
53%
57%
34%
52%
*
Pioneer
Multi-Asset
Ultrashort
Income
Fund
(the
“Predecessor
Fund”)
reorganized
with
the
Fund
effective
April
1,
2025
(the
“Reorganization”).
The
Predecessor
Fund
is
the
accounting
survivor
of
the
Reorganization
and
shareholders
holding
Class
A,
Class
C,
Class
C2,
Class
K,
and
Class
Y
shares
of
the
Predecessor
Fund
received
Class
A,
Class
C,
Class
C,
Class
R6,
and
Class
Y
shares
of
the
Fund,
respectively.
(a)
Per
share
net
investment
income
(loss)
has
been
calculated
using
the
average
daily
shares
method.
(b)
Assumes
reinvestment
of
all
net
investment
income
and
realized
capital
gain
distributions,
if
any,
during
the
period.
Includes
adjustments
in
accordance
with
U.S.
Generally
Accepted
Accounting
Principles
and
could
differ
from
the
reported
return.
(c)
Does
not
include
acquired
fund
fees
and
expenses,
if
any.
(d)
Reflects
total
annual
operating
expenses
before
reductions
of
any
expenses
paid
indirectly.
The
Fund's
expenses
paid
indirectly
decreased
the
expense
ratios
by
less
than
0.01%.
(e)
Portfolio
turnover
is
calculated
on
the
basis
of
the
Fund
as
a
whole
without
distinguishing
between
the
classes
of
shares.
Notes
to
Financial
Statements
March
31,
2026
1.
Organization:
Victory
Portfolios
IV
(the
“Trust”)
is
organized as
a
Delaware
statutory
trust and is
registered
under
the
Investment
Company
Act
of
1940,
as
amended
(the
“1940
Act”),
as
an
open-end
investment
company.
The
Trust
is
comprised
of
26
funds, and
is
authorized
to
issue
an
unlimited
number
of
shares,
which
are
units
of
beneficial
interest
with
no
par
value.
The
accompanying
financial
statements
are
those
of
the
following
fund
(the
“Fund”). The
Fund
is
classified
as
diversified
under
the
1940
Act.
Each
class
of
shares
of the
Fund
has
substantially
identical
rights
and
privileges
except
with
respect
to
sales
charges,
fees
paid
under
distribution
plans,
expenses
allocable
exclusively
to
each
class
of
shares,
voting
rights
on
matters
solely
affecting
a
single
class
of
shares,
and
the
exchange
privilege
of
each
class
of
shares.
Victory
Capital
Management
Inc.
(“VCM”
or
the
“Adviser”)
is
an
indirect
wholly
owned
subsidiary
of
Victory
Capital
Holdings,
Inc.,
a
publicly
traded
Delaware
corporation,
and
a
wholly
owned
direct
subsidiary
of
Victory
Capital
Operating,
LLC.
Under
the
Trust’s
organizational
documents,
its
officers
and
trustees
are
indemnified
against
certain
liabilities
arising
out
of
the
performance
of
their
duties
to
the
Fund.
In
addition,
in
the
normal
course
of
business,
the
Fund
enters
into
contracts
with
its
vendors
and
others
that
provide
for
general
indemnifications.
The
Fund’s
maximum
exposure
under
these
arrangements
is
unknown,
as
this
would
involve
future
claims
that
may
be
made
against
the
Fund.
However,
based
on
experience,
the
Fund
expects
that
risk
of
loss
to
be
remote.
The
Fund,
which
commenced
operations
on
April
1,
2025,
is
the
successor
to
the
Pioneer
Multi-Asset
Ultrashort
Income
Fund
(the
“Predecessor
Fund”).
The
Predecessor
Fund
transferred
all
of
the
net
assets
of
Class
A,
Class
C,
Class
C2,
Class
K,
and
Class
Y
shares
in
exchange
for
the
Fund’s
Class
A,
Class
C,
Class
C,
Class
R6,
and
Class
Y
shares,
respectively,
on
April
1,
2025,
pursuant
to
an
agreement
and
plan
of
reorganization
(the
“Reorganization”)
which
was
approved
by
the
shareholders
of
the
Predecessor
Fund
on
March
27,
2025.
The
Reorganization
was
structured
so
that
the
transfer
of
assets
and
liabilities
did
not
result
in
any federal
tax
liability
to
the
Predecessor
Fund
or
its
shareholders.
Shareholders
holding
Class
A,
Class
C,
Class
C2,
Class
K,
and
Class
Y
shares
of
the
Predecessor
Fund
received
Class
A,
Class
C,
Class
C,
Class
R6,
and
Class
Y
shares
of
the
Fund,
respectively,
in
the
Reorganization.
The
Predecessor
Fund
was
the
accounting
survivor
of
the
Reorganization.
Accordingly,
the
Predecessor
Fund’s
performance
and
financial
history
have
become
the
performance
and
financial
history
of
the
Fund.
The
Fund’s
investment
objective
is
to
seek
a
high
level
of
current
income
to
the
extent
consistent
with
a
relatively
high
level
of
stability
of
principal.
Effective
April
1,
2025,
VCM
serves
as
the
Fund’s
investment
adviser,
succeeding
Amundi
Asset
Management
US,
Inc.
(“Amundi
US”).
On
the
same
date,
Victory
Capital
Services,
Inc.
(the
“Distributor”),
an
affiliate
of
the
Adviser,
became
the
Distributor
for
the
Fund's
shares,
succeeding
Amundi
Distributor
US,
Inc.
The
Distributor
receives
no
fee
or
other
compensation
for
these
services
(See
Note
5).
On
September
30,
2025,
the
Trust’s
Board
of
Trustees
(the
“Board”),
upon
the
recommendation
of
the
Adviser,
approved
a
change
in
the
Fund's
custodian,
sub-administrator,
sub-fund
accountant,
and
transfer
agent.
Effective
as
of
February
9,
2026, Citibank,
N.A.
serves
as
the
custodian
of
the
Fund,
Citi
Fund
Services
Ohio,
Inc.
serves
as
sub-administrator
and
sub-fund
accountant
of
the
Fund
and
FIS
Investor
Services
LLC
serves
as
transfer
agent
of
the
Fund.
2.
Significant
Accounting
Policies:
The
following
is
a
summary
of
significant
accounting
policies
followed
by
the Fund
in
the
preparation
of
its
financial
statements.
The
policies
are
in
conformity
with
U.S.
Generally
Accepted
Accounting
Principles
(“GAAP”).
The
preparation
of
financial
statements
in
accordance
with
GAAP
requires
the
Adviser
to
make
estimates
and
assumptions
that
affect
the
reported
amounts
of
assets
and
liabilities
and
disclosure
of
contingent
assets
and
liabilities
at
the
date
of
the
financial
statements
and
the
reported
amounts
of
income
and
expenses
for
the
period.
Actual
results
could
differ
from
those
estimates.
The
Fund
follows
the
specialized
accounting
and
reporting
requirements
under
GAAP
that
are
applicable
to
investment
companies
under
Accounting
Standards
Codification
Topic 946.
Investment
Valuation:
The
Fund
records
investments
at
fair
value.
Fair
value
is
defined
as
the
price
that
would
be
received
to sell
an asset
or
paid
to
transfer
a
liability
in
an
orderly
transaction
between
market
participants
at
the
measurement
date.
The
valuation
techniques
described
below
maximize
the
use
of
observable
inputs
and
minimize
the
use
of
unobservable
inputs
in
determining
fair
value.
The
inputs
used
for
valuing
the
Fund’s
investments
are
summarized
in
the
three
broad
levels
listed
below:
Level
1
—
quoted
prices
(unadjusted)
in
active
markets
for
identical
securities
Level
2
—
other
significant
observable
inputs
(including
quoted
prices
for
similar
securities,
interest
rates,
or
credit
spreads,
applicable
to
those
securities,
etc.)
Level
3
—
significant
unobservable
inputs
(including
the
Adviser’s
assumptions
in
determining
the
fair
value
of
investments)
Changes
in
valuation
techniques
may
result
in
transfers
in
or
out
of
an
assigned
level
within
the
disclosure
hierarchy.
The
inputs
or
methodologies
used
for
valuation
techniques
are
not
necessarily
an
indication
of
the
risks
associated
with
entering
into
those
investments.
The Adviser,
appointed
as
the
valuation
designee
by the
Board, has
established
the
Pricing
Committee
(the
“Committee”),
and
subject
to
Board
oversight,
the
Committee
administers
and
oversees
the
Fund’s
valuation
policies
and
procedures,
which
are
approved
by
the
Board.
Fund
(Legal
Name)
Fund
(Short
Name)
Investment
Share
Classes
Offered
Victory
Pioneer
Multi-Asset
Ultrashort
Income
Fund
Multi-Asset
Ultrashort
Income
Fund
Class
A,
Class
C,
Class
R6,
and
Class
Y
Notes
to
Financial
Statements
—
continued
March
31,
2026
Portfolio
securities
listed
or
traded
on
securities
exchanges,
are
valued
at
the
last
sale
price
on
the
exchange
or
system
where
the
security
is
principally
traded,
if
available,
or
at
the
Nasdaq
Official
Closing
Price.
If
there
have
been
no
sales
for
that
day
on
the
exchange
or
system,
then
a
security
is
valued
at
the
closing mean
if
available,
otherwise
the
bid
quotation
on
the
exchange
or
system
where
the
security
is
principally
traded.
In
each
of
these
situations,
valuations
are
typically
categorized
as
Level
1
in
the
fair
value
hierarchy.
Debt
securities
are
valued
each
business
day
by
a
pricing
service
approved
by
the
valuation
designee
and
subject
to
the
oversight
of
the
Board.
The
pricing
service
uses
the
evaluated
bid
or market
quotes to
value
securities.
Debt
obligations
maturing
within
60
days
may
be
valued
at
amortized
cost,
provided
that
the
amortized
cost
represents
the
fair
value
of
such
securities.
These
valuations
are
typically
categorized
as
Level
2
in
the
fair
value
hierarchy.
Investments
in
open-end
investment
companies are
valued
at their
net
asset
value
(“NAV”).
These
valuations
are
typically
categorized
as
Level
1 in
the
fair
value
hierarchy.
Loan
interests
are
valued
at
the
mean
between
the
last
available
bid
and
asked
prices
from
one
or
more
brokers
or
dealers
as
obtained
from
an
independent
third
party
pricing
service.
If
price
information
is
not
available,
or
if
the
price
information
is
deemed
to
be
unreliable,
price
information
will
be
obtained
from
an
alternative
loan
interest
pricing
service.
If
no
reliable
price
quotes
are
available
from
either
the
primary
or
alternative
pricing
service,
broker
quotes
will
be
solicited.
These
valuations
are
typically
categorized
as
Level
2
in
the
fair
value
hierarchy.
Event-linked
bonds
are
valued
at
the
bid
price
obtained
from
an
independent
third-party
pricing
service.
Other
insurance-linked
securities
(including
reinsurance
sidecars,
collateralized
reinsurance
and
industry
loss
warranties)
may
be
valued
at
the
bid
price
obtained
from
an
independent
pricing
service,
or
through
a
third
party
using
a
pricing
matrix,
insurance
valuation
models,
or
other
fair
value
methods
or
techniques
to
provide
an
estimated
value
of
the
instrument.
Event-linked
bond
valuations
are
typically
categorized
as
Level
2
in
the
fair
value
hierarchy.
Other
insurance-linked
valuations
are
typically
categorized
as
Level
3
in
the
fair
value
hierarchy.
Repurchase
agreements
are
valued
at
cost,
which
approximates
market
value.
Futures
contracts
are
valued
at
the
settlement
price
established
each
day
by
the
board
of
trade
or
an
exchange
on
which
they
are
traded.
These
valuations
are
typically
categorized
as
Level
1
in
the
fair
value
hierarchy.
In
the
event
that
price
quotations
or
valuations
are
not
readily
available,
investments
are
valued
at
fair
value
in
accordance
with
procedures
established
by
and
under
the
general
supervision
and
responsibility
of
the
Board.
These
valuations
are
typically
categorized
as
Level
2
or
Level
3
in
the
fair
value
hierarchy,
based
on
the
observability
of
inputs
used
to
determine
the
fair
value.
The
effect
of
fair
value
pricing
is
that
securities
may
not
be
priced
on
the
basis
of
quotations
from
the
primary
market
in
which
they
are
traded
and
the
actual
price
realized
from
the
sale
of
a
security
may
differ
materially
from
the
fair
value
price.
Valuing
these
securities
at
fair
value
is
intended
to
cause
the
Fund’s
net
asset
value to
be
more
reliable
than
it
otherwise
would
be.
A
summary
of
the
valuations
as
of
March
31,
2026, based
upon
the
three
levels
defined
above,
is
included
in
the
table
below
while
the
breakdown,
by
category,
of
investments
is
disclosed
on
the
Schedule
of
Portfolio
Investments
(amounts
in
thousands):
As
of March
31,
2026,
there
were
no
significant transfers
into/out
of
Level
3.
Level
1
Level
2
Level
3
Total
Multi-Asset
Ultrashort
Income
Fund
Asset-Backed
Securities
.........................................
$
—
$
1,368,810
$
7,995
$
1,376,805
Collateralized
Loan
Obligations
...................................
—
1,301,592
—
1,301,592
Collateralized
Mortgage
Obligations
................................
—
1,156,212
610
1,156,822
Senior
Secured
Loans
...........................................
—
155,336
—
155,336
Corporate
Bonds
..............................................
—
1,783,137
1,138
1,784,275
Insurance-Linked
Securities
......................................
—
7,898
241
8,139
Yankee
Dollars
...............................................
—
928,544
—
928,544
U.S.
Government
Agency
Mortgages
................................
—
249,295
—
249,295
Commercial
Paper
.............................................
—
705,244
—
705,244
Repurchase
Agreements
.........................................
—
547,840
—
547,840
Total
.......................................................
$
—
$
8,203,908
$
9,984
$
8,213,892
Liabilities:
TBA
Sales
Commitments
........................................
$
—
$
(106,753)
$
—
$
(106,753)
Total
.......................................................
$
—
$
(106,753)
$
—
$
(106,753)
Other
Financial
Investments:*
Assets:
Futures
Contracts
..............................................
608
—
—
608
Total
.......................................................
$
608
$
—
$
—
$
608
*
Futures
Contracts
are
valued
at
the
unrealized
appreciation
(depreciation)
on
the
investment.
Notes
to
Financial
Statements
—
continued
March
31,
2026
Investment
Companies:
Open-End
Funds:
The
Fund
may
invest
in
portfolios
of
open-end
investment
companies.
These
investment
companies
value
securities
in
their
portfolios
for
which
market
quotations
are
readily
available
at
their
market
values
(generally
the
last
reported
sale
price)
and
all
other
securities
and
assets
at
their
fair
value
by
the
methods
established
by
the
board
of
directors
of
the
underlying
funds.
Repurchase
Agreements:
The
Fund
may
enter
into
repurchase
agreements
with
commercial
banks
or
recognized
security
dealers
pursuant
to
the
terms
of
a
Master
Repurchase
Agreement.
A
repurchase
agreement
is
an
arrangement
wherein
the
Fund
purchases
securities
and
the
seller
agrees
to
repurchase
the
securities
at
an
agreed
upon
time
and
at
an
agreed
upon
price.
The
purchased
securities
are
marked-to-market
daily
to
ensure
their
value
is
equal
to
at
least
102%
of
principal
including
accrued
interest
and
are
held
by
the
Fund,
either
through
its
regular
custodian
or
through
a
special
“tri-party”
custodian
that
maintains
separate
accounts
for
both
the
Fund
and
its
counterparty,
until
maturity
of
the
repurchase
agreement.
Master
Repurchase
Agreements
typically
contain
netting
provisions,
which
provide
for
the
net
settlement
of
all
transactions
and
collateral
with
the
Fund
through
a
single
payment
in
the
event
of
default
or
termination.
Repurchase
agreements
are
subject
to
credit
risk,
and
the
Fund’s Adviser
monitors
the
creditworthiness
of
sellers
with
which
the
Fund
may
enter
into
repurchase
agreements.
Investments
in
repurchase
agreements
as
presented
on
the
Schedule
of
Portfolio
Investments
are
not
net
settlement
amounts
but
gross.
At
March
31,
2026,
the
value
of
the
related
collateral
exceeded
the
value
of
the
repurchase
agreements,
reducing
the
net
settlement
amount
to
zero.
Details
on
the
collateral
are
included
on
the
Schedule
of
Portfolio
Investments.
Insurance-Linked
Securities
("ILS"):
The Fund
invests
in
ILS.
The Fund
could
lose
a
portion
or
all
of
the
principal
it
has
invested
in
an
ILS,
and
the
right
to
additional
interest
or
dividend
payments
with
respect
to
the
security,
upon
the
occurrence
of
one
or
more
trigger
events,
as
defined
within
the
terms
of
an
insurance-
linked
security.
Trigger
events,
generally,
are
hurricanes,
earthquakes,
or
other
natural
events
of
a
specific
size
or
magnitude
that
occur
in
a
designated
geographic
region
during
a
specified
time
period,
and/or
that
involve
losses
or
other
metrics
that
exceed
a
specific
amount.
There
is
no
way
to
accurately
predict
whether
a
trigger
event
will
occur,
and
accordingly,
ILS
carry
significant
risk.
The Fund
is
entitled
to
receive
principal,
and
interest
and/or
dividend
payments
so
long
as
no
trigger
event
occurs
of
the
description
and
magnitude
specified
by
the
instrument.
In
addition
to
the
specified
trigger
events,
ILS
may
expose
the Fund
to
other
risks,
including
but
not
limited
to
issuer
(credit)
default,
adverse
regulatory
or
jurisdictional
interpretations
and
adverse
tax
consequences.
The
Fund’s
investments
in
ILS
may
include
event-linked
bonds.
ILS
also
may
include
special
purpose
vehicles
(“SPVs”)
or
similar
instruments
structured
to
comprise
a
portion
of
a
reinsurer’s
catastrophe-oriented
business,
known
as
quota
share
instruments
(sometimes
referred
to
as
reinsurance
sidecars),
or
to
provide
reinsurance
relating
to
specific
risks
to
insurance
or
reinsurance
companies
through
a
collateralized
instrument,
known
as
collateralized
reinsurance.
Structured
reinsurance
investments
also
may
include
industry
loss
warranties
(“ILWs”).
A
traditional
ILW
takes
the
form
of
a
bilateral
reinsurance
contract,
but
there
are
also
products
that
take
the
form
of
derivatives,
collateralized
structures,
or
exchange-traded
instruments.
Where
the
ILS
are
based
on
the
performance
of
underlying
reinsurance
contracts,
the Fund
has
limited
transparency
into
the
individual
underlying
contracts,
and
therefore
must
rely
upon
the
risk
assessment
and
sound
underwriting
practices
of
the
issuer.
Accordingly,
it
may
be
more
difficult
for
the
Adviser
to
fully
evaluate
the
underlying
risk
profile
of
the
Fund’s
structured
reinsurance
investments,
and
therefore
the
Fund’s
assets
are
placed
at
greater
risk
of
loss
than
if
the
Adviser
had
more
complete
information.
Structured
reinsurance
instruments
generally
will
be
considered
illiquid
securities
by
the
Fund.
These
securities
may
be
difficult
to
purchase,
sell
or
unwind.
Illiquid
securities
also
may
be
difficult
to
value.
If
the Fund
is
forced
to
sell
an
illiquid
asset,
the Fund
may
be
forced
to
sell
at
a
loss.
Municipal
Obligations:
The
values
of
municipal
obligations
can
fluctuate
and
may
be
affected
by
adverse
tax,
legislative,
or
political
changes,
and
by
financial
developments
affecting
municipal
issuers.
Payments
of
municipal
obligations
may
depend
on
a
relatively
limited
source
of
revenue,
resulting
in
greater
credit
risk.
Future
changes
in
federal
tax
laws
or
the
activity
of
an
issuer
may
adversely
affect
the
tax-exempt
status
of
municipal
obligations.
Mortgage-
and
Asset-Backed
Securities:
The
values
of
some
mortgage-related
or
asset-backed
securities
may
be
particularly
sensitive
to
changes
in
prevailing
interest
rates.
Early
repayment
of
principal
on
some
mortgage-related
securities
may
expose
the
Fund
to
a
lower
rate
of
return
upon
reinvestment
of
principal.
The
values
of
mortgage-
and
asset-backed
securities
depend
in
part
on
the
credit
quality
and
adequacy
of
the
underlying
assets
or
collateral
and
may
fluctuate
in
response
to
the
market’s
perception
of
these
factors
as
well
as
current
and
future
repayment
rates.
Some
mortgage-backed
securities
are
backed
by
the
full
faith
and
credit
of
the
U.S.
government
(e.g.,
mortgage-backed
securities
issued
by
the
Government
National
Mortgage
Association,
commonly
known
as
“Ginnie
Mae”),
while
other
mortgage-backed
securities
(e.g.,
mortgage-backed
securities
issued
by
the
Federal
National
Mortgage
Association
and
the
Federal
Home
Loan
Mortgage
Corporation,
commonly
known
as
“Fannie
Mae”
and
“Freddie
Mac,”
respectively),
are
backed
only
by
the
credit
of
the
government
entity
issuing
them.
In
addition,
some
mortgage-backed
securities
are
issued
by
private
entities
and,
as
such,
are
not
guaranteed
by
the
U.S.
government
or
any
agency
or
instrumentality
of
the
U.S.
government.
Notes
to
Financial
Statements
—
continued
March
31,
2026
TBAs
:
The
Fund
may
enter
into
to-be-announced
(TBA)
purchases
or
sales
commitments
(collectively,
TBA
transactions),
pursuant
to
which
it
agrees
to
purchase
or
sell,
respectively,
mortgage-backed
securities
for
a
fixed
unit
price,
with
payment
and
delivery
at
a
scheduled
future
date
beyond
the
customary
settlement
period
for
such
securities.
With
TBA
transactions,
the
particular
securities
to
be
received
or
delivered
by
the
Fund
are
not
identified
at
the
trade
date;
however,
the
securities
must
meet
specified
terms,
including
issuer,
rate,
and
mortgage
term,
and
be
within
industry-accepted
“good
delivery”
standards.
The
Fund
may
enter
into
TBA
transactions
with
the
intention
of
taking
possession
of
or
relinquishing
the
underlying
securities,
may
elect
to
extend
the
settlement
by
“rolling”
the
transaction,
and/or
may
use
TBA
transactions
to
gain
or
reduce
interim
exposure
to
underlying
securities.
Until
settlement,
the
Fund
maintains
liquid
assets
sufficient
to
settle
its
commitment
to
purchase
a
TBA
or,
in
the
case
of
a
sale
commitment,
the
Fund
maintains
an
entitlement
to
the
security
to
be
sold.
To
mitigate
counterparty
risk,
the
Fund
has
entered
into
agreements
with
TBA
counterparties
that
provide
for
collateral
and
the
right
to
offset
amounts
due
to
or
from
those
counterparties
under
specified
conditions.
Subject
to
minimum
transfer
amounts,
collateral
requirements
are
determined
and
transfers
made
based
on
the
net
aggregate
unrealized
gain
or
loss
on
all
TBA
commitments
with
a
particular
counterparty.
At
any
time,
the
Fund’s
risk
of
loss
from
a
particular
counterparty
related
to
its
TBA
commitments
is
the
aggregate
unrealized
gain
on
appreciated
TBAs
in
excess
of
unrealized
loss
on
depreciated
TBAs
and
collateral
received,
if
any,
from
such
counterparty.
The
cash
collateral
held
by
the
Fund
is
reflected
on
the
Statement
of
Assets
and
Liabilities
under
TBA
sales
commitments
collateral.
Loans:
Floating
rate
loans
in
which
the
Fund
invests
are
primarily
“senior”
loans.
Senior
floating
rate
loans
typically
hold
a
senior
position
in
the
capital
structure
of
the
borrower,
are
typically
secured
by
specific
collateral,
and
have
a
claim
on
the
assets
and/or
stock
of
the
borrower
that
is
senior
to
that
held
by
subordinated
debtholders
and
stockholders
of
the
borrower.
While
these
protections
may
reduce
risk,
these
investments
still
present
significant
credit
risk.
A
significant
portion
of
the
Fund’s
floating
rate
investments
may
be
issued
in
connection
with
highly
leveraged
transactions
such
as
leveraged
buyouts,
leveraged
recapitalization
loans,
and
other
types
of
acquisition
financing.
Obligations
in
these
types
of
transactions
are
subject
to
greater
credit
risk
(including
default
and
bankruptcy)
than
many
other
investments
and
may
be,
or
become,
illiquid.
See
note
regarding
below-investment-grade
securities.
The
Fund
may
purchase
second
lien
loans
(secured
loans
with
a
claim
on
collateral
subordinate
to
a
senior
lender’s
claim
on
such
collateral),
fixed
rate
loans,
unsecured
loans,
and
other
debt
obligations.
Transactions
in
loans
often
settle
on
a
delayed
basis,
and
the
Fund
may
not
receive
the
proceeds
from
the
sale
of
a
loan
or
pay
for
a
loan
purchase
for
a
substantial
period
of
time
after
entering
into
the
transactions.
Securities
Purchased
on
a
Delayed-Delivery
or
When-Issued
Basis:
The
Fund
may
purchase
securities
on
a
delayed-delivery
or
when-issued
basis.
Delivery
and
payment
for
securities
that
have
been
purchased
by
the
Fund
on
a
delayed-delivery
or
when-issued
basis,
or
for
delayed
draws
on
loans
can
generally
take
place
within
35
days after
the
trade
date.
Securities
that
require
more
than
35
days
to
settle
are
considered
a
senior
security
and
subject
to
Rule
18f-4.
At
the
time
the
Fund
makes
the
commitment
to
purchase
a
security
on
a
delayed-delivery
or
when-issued
basis,
the
Fund
records
the
transaction
and
reflects
the
value
of
the
security
in
determining
NAV.
No
interest
accrues
to
the
Fund
until
the
transaction
settles
and
payment
takes
place.
If
the
Fund
owns
delayed-
delivery
or
when-issued
securities,
these
values
are
included
in
Payables
for
Investments
purchased
on
the
accompanying
Statement
of
Assets
and
Liabilities.
Unfunded
Loan
Commitments:
The
Fund
may
enter
into
unfunded
loan
commitments.
Unfunded
loan
commitments
may
be
partially
or
wholly
unfunded.
During
the
contractual
period,
the
Fund
is
obliged
to
provide
funding
to
the
borrower
upon
demand.
A
fee
is
earned
by
the
Fund
on
the
unfunded
loan
commitment
and
is
recorded
as
interest
income
on
the
Statement
of
Operations.
Unrealized
appreciation
or
depreciation,
if
any,
is
recorded
on
the
Statement
of
Assets
and
Liabilities.
As
of
March
31,
2026,
the
Fund
had
no
unfunded
loan
commitment
outstanding.
Derivative
Instruments:
Futures
Contracts:
The
Fund
may
enter
into
contracts
for
the
future
delivery
of
securities
or
foreign
currencies
and
futures
contracts
based
on
a
specific
security,
class
of
securities,
foreign
currency
or
an
index,
and
purchase
or
sell
options
on
any
such
futures
contracts.
A
futures
contract
on
a
securities
index
is
an
agreement
obligating
either
party
to
pay,
and
entitling
the
other
party
to
receive,
while
the
contract
is
outstanding,
cash
payments
based
on
the
level
of
a
specified
securities
index.
No
physical
delivery
of
the
underlying
asset
is
made.
The
Fund
may
enter
into
futures
contracts
in
an
effort
to
hedge
against
market
risks.
The
acquisition
of
put
and
call
options
on
futures
contracts
will
give
the
Fund
the
right
(but
not
the
obligation),
for
a
specified
price,
to
sell
or
to
purchase
the
underlying
futures
contract,
upon
exercise
of
the
option,
at
any
time
during
the
option
period.
Futures
transactions
involve
brokerage
costs
and a
good
faith
margin
deposit,
known
as
initial
margin,
of
cash
or
government
securities
with
a
broker
or
custodian
is
required
to
initiate
and
maintain
open
positions
in
futures
contracts.
Subsequent
payments,
known
as
variation
margin,
are
made
or
received
by
the
Fund
based
on
the
change
in
the
market
value
of
the
position
and
are
recorded
as
unrealized
appreciation
or
depreciation
until
the
contract
is
closed
out,
at
which
time
the
gain
or
loss
is
realized.
The
Fund
may
lose
the
expected
benefit
of
futures
transactions
if
interest
rates,
exchange
rates
or
securities
prices
change
in
an
unanticipated
manner.
Such
unanticipated
changes
may
also
result
in
lower
overall
performance
than
if
the
Fund
had
not
entered
into
any
futures
transactions.
In
addition,
the
value
of
the
Fund’s
futures
positions
Notes
to
Financial
Statements
—
continued
March
31,
2026
may
not
prove
to
be
perfectly
or
even
highly
correlated
with
the
value
of
its
portfolio
securities
or
foreign
currencies,
limiting
the
Fund’s
ability
to
hedge
effectively
against
interest
rate,
exchange
rate
and/or
market
risk
and
giving
rise
to
additional
risks.
There
is
no
assurance
of
liquidity
in
the
secondary
market
for
purposes
of
closing
out
futures
positions.
The
collateral
held
by
the
Fund
is
reflected
on
the
Statement
of
Assets
and
Liabilities
under
Deposit
with
broker
for
futures
contracts.
Management
has
determined
that
no
offsetting
requirements
exist
as
a
result
of
their
conclusion
that
the
Fund
is
not
subject
to
master
netting
agreements
for
futures
contracts. During
the year ended
March
31,
2026,
the
Fund
entered
into
futures
contracts
primarily
for
the
strategy
of
gaining
exposure
to
a
particular
asset
class
or
securities
market.
Summary
of
Derivative
Instruments:
The
following
table
summarizes
the
fair
values
of
derivative
instruments
on
the
Statement
of
Assets
and
Liabilities,
categorized
by
risk
exposure,
as
of
March
31,
2026 (amounts
in
thousands):
*
Includes
cumulative
unrealized appreciation
(depreciation)
of
futures
contracts as
reported
on
the
Schedule
of
Portfolio
Investments.
Only
current
day’s
variation
margin
for
futures
contracts
is
reported
within
the
Statement
of
Assets
and
Liabilities.
The
following
table
presents the
effect
of
derivative
instruments
on
the
Statement
of
Operations,
categorized
by
risk
exposure,
for
the year
ended
March
31,
2026 (amounts
in
thousands):
All
open
derivative
positions
at
year end
are
reflected
on
the
Fund’s
Schedule
of
Portfolio
Investments.
The
underlying
face
value
of
open
derivative
positions
relative
to the
Fund’s
net
assets
at year
end
is
representative
of
the
notional
amount
of
open
positions
to
net
assets
throughout
the
year.
Investment
Transactions
and
Related
Income:
Changes
in
holdings
of
investments
are
accounted
for
no
later
than
one
business
day
following
the
trade
date.
For
financial
reporting
purposes,
however,
investment
transactions
are
accounted
for
on
trade
date
or
the
last
business
day
of
the
reporting
period.
Interest
income
is
determined
on
the
basis
of
coupon
interest
accrued
and recorded
daily
using
the
effective
interest
method
which
adjusts,
where
applicable,
the
amortization
of
premiums
or
accretion
of
discounts. Dividend
income
is
recorded
on
the
ex-dividend
date.
Non-cash
dividends
included
in
income,
if
any,
are
recorded
at
the
fair
value
of
the
securities
received. Interest
income
is
recorded
daily
on
the
accrual
basis. Gains
or
losses
realized
on
sales
of
securities
are
recorded
on
the
identified
cost
basis. Paydown
gains
or
losses
on
applicable
securities,
if
any,
are
recorded
as
components
of
Interest
income
on
the
Statement
of
Operations.
The Fund
may
receive
other
income
from
investments
in
loan
assignments
and/or
unfunded
commitments,
including
amendment
fees,
consent
fees,
and
commitment
fees.
These
fees
are
recorded
as
income
when
received.
These
amounts,
if
received,
are
included
in
Interest
income
on
the
Statement
of
Operations.
Withholding
taxes
on
interest,
dividends,
and
gains
as
a
result
of
certain
investments
by
the
Fund
have
been
provided
for
in
accordance
with
each
investment’s
applicable
country’s
tax
rules
and
rates.
Federal
Income
Taxes:
The
Fund
intends
to
continue
to
qualify
as
a
regulated
investment
company
by
complying
with
the
provisions
available
to
certain
investment
companies,
as
defined
in
applicable
sections
of
the
Internal
Revenue
Code,
and
to
make
distributions
of
net
investment
income
and
net
realized
gains
sufficient
to
relieve
it
from
all,
or
substantially
all,
federal
income
taxes.
Accordingly,
no
provision
for
federal
income
taxes
is
required
in
the
financial
statements.
The
Fund
has
a
tax
year
end
of March
31.
For
the
year
ended
March
31,
2026,
the
Fund
did
not
incur
any
income
tax,
interest,
or
penalties,
and
has
recorded
no
liability
for
net
unrecognized
tax
benefits
relating
to
uncertain
tax
positions.
Management
of
the
Fund
has
reviewed
tax
positions
taken
in
tax
years
that
remain
subject
to
examination
by
all
major
tax
jurisdictions,
including
federal
(i.e.,
the
last
four
tax
years,
which
includes
the
current
fiscal
tax
year
end).
Management
believes
that
there
is
no
tax
liability
resulting
from
unrecognized
tax
benefits
related
to
uncertain
tax
positions
taken.
Assets
Futures
contracts*
Interest
Rate
Risk
Exposure:
608,000
Multi-Asset
Ultrashort
Income
Fund
......................................................................
$
608
Net
realized
gains
(losses)
from
futures
contracts
Net
change
in
unrealized
appreciation/
depreciation
on
futures
contracts
Interest
Rate
Risk
Exposure:
(669,000)
1,038,000
Multi-Asset
Ultrashort
Income
Fund
....................................................
$
(669)
$
1,038
Notes
to
Financial
Statements
—
continued
March
31,
2026
Allocations:
Expenses
directly
attributable
to the
Fund
are
charged
to the
Fund,
while
expenses
that
are
attributable
to
more
than
one
fund
in
the
Trust,
or
jointly
with
an
affiliated
trust,
are
allocated
among
the
respective
funds
in
the
Trust
and/or
an
affiliated
trust
based
upon
net
assets
or
another
appropriate
basis.
Income,
expenses
(other
than
class-specific
expenses
such
as
transfer
agent
fees,
state
registration
fees,
printing
fees,
and
12b-1
fees),
and
realized
and
unrealized
gains
or
losses
on
investments
are
allocated
to
each
class
of
shares
based
on
its
relative
net
assets
on
the
date
income
is
earned
or
expenses
and
realized
and
unrealized
gains
and
losses
are
incurred.
Fees
Paid
Indirectly:
Expense
offsets
to
custody
fees
that
arise
from
credits
on
cash
balances
maintained
on
deposit
are
reflected
on
the
Statement
of
Operations,
as
applicable,
as
Fees
paid
indirectly.
3.
Purchases
and
Sales:
Purchases
and sales
of
securities
(excluding
securities
maturing
less
than
one
year
from
acquisition)
for
the
year
ended
March
31,
2026,
were
as
follows
(amounts
in
thousands):
4.
Affiliated
Fund
Ownership:
The
Fund
offers
shares
for
investment
by
other
funds
including
VCM
affiliated
fund-of-funds.
The
affiliated fund-of-funds
do
not
invest
in
the
underlying
funds
for
the
purpose
of
exercising
management
or
control;
however,
investments
by
affiliated fund-of-funds
within
its
principal
investment
strategies
may
represent
a
significant
portion
of
an
underlying
fund’s
assets,
and
together
with
the
investments
of
the
other
affiliated
funds-of-funds,
may
represent
a
substantial
portion
or
even
all
of
an
underlying
fund’s
net
assets.
The
affiliated
fund-of-funds’
annual
and
semi-
annual
reports
may
be
viewed
at
vcm.com.
As
of
March
31,
2026,
certain
affiliated
fund-of-funds
owned
total
outstanding
shares
of
the
Fund
as
follows:
5.
Fees
and
Transactions
with
Affiliates
and
Related
Parties:
Investment
Advisory
Fees:
Investment
advisory
services
are
provided
to
the
Fund
by
the
Adviser,
which
is
a
New
York
corporation
registered
as
an
investment
adviser
with
the
Securities
and
Exchange
Commission
(“SEC”).
Under
the
terms
of
the
Investment
Advisory
Agreement,
the
Adviser
is
entitled
to
receive
fees
accrued
daily
and
paid
monthly
at
an
annualized
rate
based
on
a
percentage
of
the
average
daily
net
assets
of the
Fund. The
rates
at
which
the
Adviser
is
paid
by the
Fund
are
included
in
the
table
below.
Amounts
incurred
and
paid
to
VCM
for
the
year ended
March
31,
2026,
are
reflected
on
the
Statement
of
Operations
as
Investment
advisory
fees.
Administration
and
Servicing
Fees:
VCM
also
serves
as
the
Fund’s
administrator
and
fund
accountant.
Under
the Administration
and
Fund
Accounting
Agreement,
VCM
is
paid
an
administration
fee
based
on
a
percentage
of
the
average
daily
net
assets
of
all
Companies
and
Funds
(as
defined
in
the
Administration
and
Fund
Accounting
Agreement)
together
with
all
other
registered
investment
companies
for
which
VCM
acts
as
administrator,
and
allocating
to the
Fund
on
a
pro
rata
basis
calculated
based
on
the
Fund’s
average
daily
net
assets.
The
tiered
rates
at
which
VCM
is
paid
by
the
Fund
are
shown
in
the
table
below:
Excluding
U.S.
Government
Securities
U.S.
Government
Securities
Purchases
Sales
Purchases
Sales
Multi-Asset
Ultrashort
Income
Fund
..................................
$
3,507,466
$
3,1
12
,7
10
$
733,172
$
475,564
Multi-Asset
Ultrashort
Income
Fund
Ownership
%
Victory
Pioneer
Solutions
–
Balanced
Fund
.
.
.
.
.
.
.
.
.
.
.
.
.
.
.
.
.
.
.
.
.
.
.
.
.
.
.
.
.
.
.
.
.
.
.
.
.
.
.
.
.
.
.
.
.
.
.
.
.
.
.
.
0.3
Adviser
Fee
Tier
Rates
Up
to
$1
billion
Over
$1
billion
-
$5
billion
Over
$5
billion
-
$7.5
billion
Over
$7.5
billion
Multi-Asset
Ultrashort
Income
Fund
..........................
0.35%,
plus
0.30%,
plus
0.25%,
plus
0.20%
Notes
to
Financial
Statements
—
continued
March
31,
2026
Amounts
incurred
for
the
year
ended
March
31,
2026,
are
reflected
on
the
Statement
of
Operations
as
Administration
fees.
Effective
February
9,
2026,
Citi
Fund
Services
Ohio,
Inc.
(“Citi”),
an
affiliate
of
Citibank,
acts
as
sub-administrator
and
sub-fund
accountant
to
the
Fund
pursuant
to
a
Sub-Administration
and
Sub-Fund
Accounting
Services
Agreement
between
VCM
and
Citi.
VCM
pays
Citi
a
fee
for
providing
these
services.
The
Fund
reimburses
VCM
and
Citi
for
out-of-pocket
expenses
incurred
in
providing
these
services,
including
costs
associated
with
the Chief
Compliance
Officer,
and
implementing
new
reports
required
by
new
rules
adopted
by
the
SEC
under
the
1940
Act.
Prior
to
February
9,
2026,
BNY
Mellon
served
as
sub-administrator
and
sub-fund
accountant
for
the
Fund.
The
total
amounts
incurred
and
paid
through
the
year
ended
March
31,
2026,
are
reflected
within
Sub-Administration
fees
on
the
Statements
of
Operations.
Transfer
Agency
Fees:
Effective February
9,
2026,
FIS
Investor
Services
LLC,
serves
as
the
Fund’s
transfer
agent.
Under
the
Transfer
Agent
Agreement,
the
Trust
pays
FIS
a
fee
for
its
services
and
reimburses
FIS
for
all
of
their
reasonable
out-of-pocket
expenses
incurred
in
providing
these
services.
Prior
to February
9,
2026,
BNY
Mellon
Investment
Servicing
(US)
Inc.
served
as
the
transfer
agent
to
the
Fund at
negotiated
rates
where
transfer
agent
fees
included
sub-transfer
agent
expenses
incurred
through
the
Fund's
omnibus
relationship
contracts.
In
addition,
the
Fund
would
reimburse
out-of-pocket
expenses
incurred
by
the
former
transfer
agent
related
to
shareholder
communications
activities
such
as
proxy
and
statement
mailings,
and
outgoing
phone
calls.
Total
transfer
agent
fees
incurred
for
the
year
ended
March
31,
2026,
are
reflected
on
the
Statement
of
Operations
as
Transfer
agent
fees.
Sub-Transfer
Agency
Fees:
Effective
February
9,
2026,
the
Fund
has
entered
into
Sub-Transfer
Agency
Agreements
with
financial
intermediaries
that
provide
recordkeeping,
processing,
shareholder
communications
and
other
services
to
customers
of
the
intermediaries
that
hold
positions
in
the
Fund
and
have
agreed
to
compensate
the
intermediaries
for
providing
those
services.
Intermediaries
transact
with
the
Fund
primarily
through
the
use
of
omnibus
accounts
on
behalf
of
their
customers
who
hold
positions
in
the
Fund.
These
services
would
have
been
provided
by
the
Fund’s
transfer
agent
and
other
service
providers
if
the
shareholders'
accounts
were
maintained
directly
at
the
Fund's
transfer
agent.
Prior
to
February
9,
2026,
BNY
Mellon
served
as
sub-transfer
agent.
Total
sub-transfer
agent
fees
incurred
for
the
year
ended
March
31,
2026,
are
reflected
on
the
Statement
of
Operations
as
Sub-Transfer
agent
fees.
Distributor/Underwriting
Services:
Victory
Capital
Services, Inc.
(the
“Distributor”),
an
affiliate
of
the
Adviser,
serves
as
Distributor
for
the
continuous
offering
of
the
shares
of
the
Fund
pursuant
to
a
Distribution
Agreement
between
the
Distributor
and
the
Trust.
Pursuant
to
the
Distribution
and
Services
Plan
adopted
in
accordance
with
Rule
12b-1
under
the
1940
Act,
the
Distributor
may
receive
a
monthly
distribution
and
service
fee
for
Class
A
and
Class
C,
at
an
annual
rate
of
up
to
0.20%
and
0.50%,
respectively,
of
the
average
daily
net
assets. Amounts
incurred
and
paid
to
the
Distributor
for
the year
ended
March
31,
2026, are
reflected
on
the
Statement
of
Operations
as
12b-1
fees.
In
addition,
the
Distributor
is
entitled
to
receive
commissions
in
connection
with
sales
of
Class
A
and
Class
C.
For
the
year
ended
March
31,
2026,
the
Distributor
did
not
receive
any
commissions.
Other
Fees:
Effective
February
9,
2026,
Citibank
serves
as
the
Fund's
custodian.
The
Fund
pays
Citibank
a
fee
for
providing
these
services.
Prior
to
February
9,
2026,
BNY
Mellon
served
as
the
Fund's
custodian. Total
custodian
fees
incurred
for
the
year ended
March
31,
2026, are
reflected
on
the
Statement
of
Operations
as
Custodian
fees.
Sidley
Austin
LLP
provides
legal
services
to
the
Trust.
The
Adviser
has
entered
into
an
expense
limitation
agreement
with the Fund.
Under
the
terms
of
the
agreement,
the
Adviser
has
agreed
to
waive
fees
or
reimburse
certain
expenses
to
the
extent
that
ordinary
operating
expenses
incurred
by
certain
classes
of
the
Fund
in
any
fiscal
year
exceed
the
expense limits
for
such
classes
of the
Fund.
Such
excess
amounts
will
be
the
liability
of
the
Adviser. Acquired
fund
fees
and
expenses,
interest,
taxes,
brokerage
commissions,
other
expenditures which
are
capitalized
in
accordance
with
GAAP,
and
other
extraordinary
expenses
not
incurred
in
the
ordinary
course
of the
Fund’s
business
are
excluded
from
the
expense
limits.
As
of
March
31,
2026,
the
expense
limits
(excluding
voluntary
waivers) were
as
follows:
Annual
Charge
Up
to
$15
billion
Over
$15
billion
-
$30
billion
Over
$30
billion
-
$85
billion
Over
$85
billion
Multi-Asset
Ultrashort
Income
Fund
.
.
.
.
.
.
.
.
.
.
.
.
.
.
.
.
.
.
.
.
.
.
.
.
.
.
0.08%,
plus
0.05%,
plus
0.04%,
plus
0.03%
In
effect
until
April
1,
2028
Class
A
Class
C
Class
R6
Class
Y
Multi-Asset
Ultrashort
Income
Fund
.
.
.
.
.
.
.
.
.
.
.
.
.
.
.
.
.
.
.
.
.
.
.
.
.
.
0.58%
0.88%
0.35%
0.44%
Notes
to
Financial
Statements
—
continued
March
31,
2026
Under
the
terms
of
the
expense
limitation
agreement,
the
Fund
has
agreed
to
repay
fees
and
expenses
that
were
waived
or
reimbursed
by
the
Adviser
for
a
period
of
up
to two
years
(twenty-four
(24)
months)
after
the
waiver
or
reimbursement
took
place,
subject
to
the
lesser
of
any
operating
expense limits
in
effect
at
the
time
of:
(a)
the
original
waiver
or
expense
reimbursement;
or
(b)
the
recoupment,
after
giving
effect
to
the
recoupment
amount.
The
Fund
has
not
recorded
any
amounts
available
to
be
repaid
to
the
Adviser
as
a
commitment
and
contingency
liability
due
to
an
assessment
that
such
repayments
are
not
probable
at
March
31,
2026.
As
of March
31,
2026,
the
following amounts
in
the
table
below
represent
the
fiscal
year-end
in
which
the 24-month recoupment
period
expires.
These
amounts
are
available
to
be
repaid
to
the
Adviser
(amounts
in
thousands):
The
Adviser
may
voluntarily
waive
or
reimburse
additional
fees
to
assist
the
Fund
in
maintaining
competitive
expense
ratios.
Voluntary
waivers
and
reimbursements
applicable
to
the
Fund
are
not
available
to
be
recouped
at
a
future
time.
There
were
no
voluntary
waivers
or
reimbursements
for
the year
ended
March
31,
2026.
Certain
officers
and/or
interested
trustees
of
the
Fund
are
also
officers
and/or
employees
of
the
Adviser,
administrator,
fund
accountant,
legal
counsel,
and
Distributor.
6.
Risks:
The
following
describes
principal
risks
that
you
may
assume
as
an
investor
in
the
Fund.
The
Fund’s
prospectus
contains
unaudited
information
regarding
the
Fund’s
principal
risks.
Please
refer
to
that
document
when
considering
the
Fund’s
principal
risks.
The
Fund
may
be
subject
to
other
risks
in
addition
to
these
identified
risks.
Market
Risk
—
The
market
prices
of
securities
or
other
assets
held
by
the
Fund
may
go
up
or
down,
sometimes
rapidly
or
unpredictably,
due
to
general
market
conditions,
such
as
real
or
perceived
adverse
economic,
political,
or
regulatory
conditions,
political
instability,
recessions,
inflation,
changes
in
interest
or
currency
rates,
lack
of
liquidity
in
the
bond
markets,
the
spread
of
infectious
illness
or
other
public
health
issues,
weather
or
climate
events,
armed
conflict,
market
disruptions
caused
by
tariffs,
trade
disputes,
sanctions
or
other
government
actions,
or
other
factors
or
adverse
investor
sentiment.
If
the
market
prices
of
the
Fund’s
securities
and
assets
fall,
the
value
of
your
investment
will
go
down.
A
change
in
financial
condition
or
other
event
affecting
a
single
issuer
or
market
may
adversely
impact
securities
markets
as
a
whole.
Duration Risk
— The Duration
seeks
to
measure
the
price
sensitivity
of
a
fixed
income
security
to
changes
in
interest
rates.
The
longer
a
portfolio’s
duration,
the
more
sensitive
it
will
be
to
changes
in
interest
rates.
The
Fund’s
average
portfolio
maturity
may
be
greater
than
the
Fund’s
average
portfolio
duration,
and,
accordingly,
the
Fund
may
be
more
sensitive
to
changes
in
yield
or
interest
rates.
A
portfolio
with
negative
duration
may
increase
in
value
when
interest
rates
rise,
and
generally
incurs
a
loss
when
interest
rates
and
yields
fall.
The
assumptions
that
are
made
about
a
security’s
features
and
options
when
calculating
duration
may
prove
to
be
incorrect.
Duration
is
calculated
by
the
Fund’s
Adviser,
is
not
an
exact
measurement
and
may
not
reliably
predict
the
Fund’s
or
a
particular
security’s
price
sensitivity
to
changes
in
yield
or
interest
rates.
The
Fund’s
Adviser
may
not
be
successful
in
its
efforts
to
limit
sensitivity
to
interest
rate
changes.
Interest
Rate Risk
— The market
prices
of
the
Fund's
fixed
income
securities
may
fluctuate
significantly
when
interest
rates
change.
The
value
of
your
investment
will
generally
go
down
when
interest
rates
rise.
A
rise
in
rates
tends
to
have
a
greater
impact
on
the
prices
of
longer
term
or
duration
securities.
Duration
is
a
measure
of
a
fixed
income
security’s
sensitivity
to
changes
in
interest
rates.
For
example,
if
interest
rates
increase
by
1%,
the
value
of
a
fund’s
portfolio
with
a
portfolio
duration
of
ten
years
would
be
expected
to
decrease
by
10%,
all
other
things
being
equal.
A
general
rise
in
interest
rates
could
adversely
affect
the
price
and
liquidity
of
fixed
income
securities
and
could
also
result
in
increased
redemptions
from
the
Fund.
The
maturity
of
a
security
may
be
significantly
longer
than
its
effective
duration.
A
security’s
maturity
and
other
features
may
be
more
relevant
than
its
effective
duration
in
determining
the
security’s
sensitivity
to
other
factors
affecting
the
issuer
or
markets
generally,
such
as
changes
in
credit
quality
or
in
the
yield
premium
that
the
market
may
establish
for
certain
types
of
securities
(sometimes
called
“credit
spread”).
In
general,
the
longer
its
maturity
the
more
a
security
may
be
susceptible
to
these
factors.
When
the
credit
spread
for
a
fixed
income
security
goes
up
or
“widens,”
the
value
of
the
security
generally
will
go
down.
Rising
interest
rates
can
lead
to
increased
default
rates,
as
issuers
of
floating
rate
securities
find
themselves
faced
with
higher
payments.
Unlike
fixed
rate
securities,
floating
rate
securities
generally
will
not
increase
in
value
if
interest
rates
decline.
Changes
in
interest
rates
also
will
affect
the
amount
of
interest
income
the
Fund
earns
on
its
floating
rate
investments.
Credit Risk
—
If
an
issuer
or
guarantor
of
a
security
held
by
the
Fund
or
a
counterparty
to
a
financial
contract
with
the
Fund
defaults
on
its
obligation
to
pay
principal
and/or
interest,
has
its
credit
rating
downgraded
or
is
perceived
to
be
less
creditworthy,
or
the
credit
quality
or
value
of
any
underlying
assets
declines,
the
value
of
your
investment
will
typically
decline.
The
values
of
lower-quality
debt
securities
tend
to
be
particularly
sensitive
to
these
changes.
Changes
in
actual
or
perceived
creditworthiness
may
occur
quickly.
The
values
of
securities
also
may
decline
for
a
number
of
other
reasons
that
relate
directly
to
the
issuer,
such
as
management
performance,
financial
leverage
and
reduced
demand
for
the
issuer’s
goods
and
services,
as
well
as
the
historical
and
prospective
earnings
of
the
issuer
and
the
value
of
its
assets.
The
Fund
also
could
be
delayed
or
hindered
in
its
enforcement
of
rights
against
an
issuer,
guarantor
or
counterparty.
March
31,
2028
Total
Multi-Asset
Ultrashort
Income
Fund
...............................................................
$
517
$
517
Notes
to
Financial
Statements
—
continued
March
31,
2026
Mortgage-
and
Asset-Backed
Securities
Risk
—
The
value
of
mortgage-related
securities,
including
commercial
mortgage-backed
securities,
collateralized
mortgage-backed
securities,
credit
risk
transfer
securities,
and
asset-backed
securities,
will
be
influenced
by
factors
affecting
the
assets
underlying
such
securities.
As
a
result,
during
periods
of
declining
asset
value,
difficult
or
frozen
credit
markets,
swings
in
interest
rates,
or
deteriorating
economic
conditions,
mortgage-related
and
asset-backed
securities
may
decline
in
value,
face
valuation
difficulties,
become
more
volatile
and/or
become
illiquid.
Mortgage-backed
securities
tend
to
be
more
sensitive
to
changes
in
interest
rates
than
other
types
of
debt
securities.
These
securities
are
also
subject
to
interest
rate,
prepayment
and
extension
risks.
Some
of
these
securities
may
receive
little
or
no
collateral
protection
from
the
underlying
assets
and
are
thus
subject
to
the
risk
of
default.
The
risk
of
such
defaults
is
generally
higher
in
the
case
of
mortgage-backed
investments
offered
by
non-governmental
issuers
and
those
that
include
so-called
“sub-prime”
mortgages.
The
structure
of
some
of
these
securities
may
be
complex
and
there
may
be
less
available
information
than
for
other
types
of
debt
securities.
Upon
the
occurrence
of
certain
triggering
events
or
defaults,
the
Fund
may
become
the
holder
of
underlying
assets
at
a
time
when
those
assets
may
be
difficult
to
sell
or
may
be
sold
only
at
a
loss.
For
debt
instruments
secured
by
specific
assts,
those
assets
are
often
the
sole
source
of
principal
and
interest
payments
for
the
instrument.
Should
those
assets
underperform
expectations
or
decline
in
value,
the
Fund
could
experience
shortfalls
in
principal
and
interest.
7.
Borrowing
and
Interfund
Lending:
Line
of
Credit:
The Trust
participates
in
a
short-term
demand
note
“Line
of
Credit”
agreement
with
Citibank.
Under
the
agreement
with
Citibank
the
Trust
may
borrow
up
to
$250
million.
The
purpose
of
the
Line
of
Credit
is
to
meet
temporary
or
emergency
cash
needs.
For
the
period
from
September
1,
2025,
through
January
27,
2026,
Citibank
received
an
annual
commitment
fee
of
0.20%
for
providing
the
Line
of
Credit.
Effective
January
28,
2026,
the
agreement
was
renewed
with
a
termination
date
of
June
22,
2026,
and
the
annual
commitment
fee
changed
to
0.275%.
Each
fund
in
the
Trust
paid
a
pro-rata
portion
of
the
commitment
fees
plus
an
interest
on
amounts
borrowed.
Interest
is
based
on
the
one-month
Secured
Overnight
Financing
Rate
plus
1.00
percent.
Interest
charged
to
the
Fund
during
the
period,
if
applicable,
is
reflected
on
the
Statement
of
Operations
under
Line
of
credit
fees.
The
Fund
had
no
borrowings
under the
Line
of
Credit
agreement
during
the
year
ended
March
31,
2026.
Interfund
Lending:
The
Trust
and
the
Adviser
rely
on
an
exemptive
order
granted
by
the
SEC
in
March
2017
(the
“Order”),
permitting
the
establishment
and
operation
of
an
Interfund
Lending
Facility
(the
“Facility”).
The
Facility
allows
the
Fund
to
directly
lend
and
borrow
money
to
or
from
any
other
fund
in
the
Victory
Funds
Complex
that
is
permitted
to
participate
in
the
Facility,
relying
upon
the
Order
at
rates
beneficial
to
both
the
borrowing
and
lending
funds.
Advances
under
the
Facility
are
allowed
for
temporary
or
emergency
purposes,
including
the
meeting
of
redemption
requests
that
otherwise
might
require
the
untimely
disposition
of
securities,
and
are
subject
to
each
Fund’s
borrowing
restrictions.
The
interfund
loan
rate
is
determined,
as
specified
in
the
Order,
by
averaging
the
current
repurchase
agreement
rate
and
the
current
bank
loan
rate.
As
a
Borrower
(as
defined
in
the
Order),
interest
charged
to
the
Fund,
if
any,
during
the
period,
is
reflected
on
the
Statement
of
Operations
under
Interfund
lending
fees.
As
a
Lender
(as
defined
in
the
Order),
interest
earned
by
the
Fund,
if
any,
during
the
period,
is
reflected
on
the
Statement
of
Operations
under
Interfund
lending.
The
Fund
did
not
utilize
or
participate
in
the
Facility
during
the
year
ended
March
31,
2026.
8.
Federal
Income
Tax
Information:
Distributions
from
the
Fund's
net
investment
income
are
accrued
daily
and
distributed
on
the
last
business
day
of
each
month.
Distributable
net
realized
gains,
if
any,
are
declared
and
paid
at
least
annually.
The
amounts
of
dividends
from
net
investment
income
and
distributions
from
net
realized
gains
(collectively,
distributions
to
shareholders)
are
determined
in
accordance
with
federal
income
tax
regulations,
which
may
differ
from
GAAP.
To
the
extent
these
“book/tax”
differences
are
permanent
in
nature
(e.g.,
net
operating
loss
and
distribution
reclassification),
such
amounts
are
reclassified
within
the
components
of
net
assets
based
on
their
federal
tax-basis
treatment;
temporary
differences
(e.g.,
wash
sales)
do
not
require
reclassification.
To
the
extent
dividends
and
distributions
exceed
net
investment
income
and
net
realized
gains
for
tax
purposes,
they
are
reported
as
distributions
of
capital.
Net
investment
losses
incurred
by
the
Fund
may
be
reclassified
as
an
offset
to
capital
on
the
accompanying
Statement
of
Assets
and
Liabilities.
As
of
March
31,
2026,
on
the
Statement
of
Assets
and
Liabilities,
as
a
result
of
permanent
book-to-tax
differences,
reclassification
adjustments
were
as
follows
(amounts
in
thousands):
The
tax
character
of
distributions
paid
during
the
tax
years
ended,
as
noted
below,
were
as
follows
(total
distributions
paid
may
differ
from
the
Statements
of
Changes
in
Net
Assets
because,
for
tax
purposes,
dividends
are
recognized
when
actually
paid)
(amounts
in
thousands):
Total
Accumulated
Earnings
(Loss)
Capital
Multi-Asset
Ultrashort
Income
Fund
.............................................................
$
2,135
$
(2,135
)
Notes
to
Financial
Statements
—
continued
March
31,
2026
As
of
March
31,
2026,
the
components
of
accumulated
earnings
(loss)
on
a
tax
basis
were
as
follows
(amounts
in
thousands):
*
The
difference
between
the
book-basis
and
tax-basis
unrealized
appreciation
(depreciation)
is
attributable
primarily
to
tax
deferral
of
losses
on
wash
sales,
derivatives,
event-linked
bonds,
insurance
linked
securities,
and
the
tax
treatment
of
premium
and
amortization.
As
of March
31,
2026,
the
Fund
had
net
capital
loss
carryforwards as
shown
in the
table
below
(amounts
in
thousands).
It
is
unlikely
that
the
Board
will
authorize
a
distribution
of
capital
gains
realized
in
the
future
until
the
capital
loss
carryforwards
have
been
used.
As
of March
31,
2026,
the
cost
basis
for
federal
income
tax
purposes,
gross
unrealized
appreciation,
gross
unrealized
depreciation,
and
net
unrealized
appreciation
(depreciation)
for
investments were
as
follows
(amounts
in
thousands):
9.
Segment
Reporting:
The
Adviser’s
Management
Committee
acts
as
the
Fund’s
Chief
Operating
Decision
Maker
(“CODM”).
The
Fund
represents
a
single
operating
segment,
as
the
CODM
monitors
the
operating
results
of
the
Fund
as
a
whole
and
the
Fund’s
long-term
strategic
asset
allocation
is
predetermined
in
accordance
with
the
Fund's
single
investment
objective.
The
financial
information
in
the
form
of
the
Fund’s
portfolio
composition,
total
returns,
expense
ratios,
and
changes
in
net
assets,
which
are
used
by
the
CODM
to
assess
the
segment’s
performance
versus
the
Fund’s
comparative
benchmarks
and
to
make
resource
allocation
decisions
for
the
Fund’s
single
segment,
is
consistent
with
that
presented
within
the
Fund’s
financial
statements.
Segment
assets
are
reflected
on
the
accompanying
Statement
of
Assets
and
Liabilities
as
“total
assets”
and
significant
segment
expenses
are
listed
on
the
accompanying
Statement
of
Operations.
Year
Ended
March
31,
2026
Distributions
Paid
From:
Ordinary
Income
Total
Distributions
Paid
Multi-Asset
Ultrashort
Income
Fund
..........................................................
$
380,284
$
380,284
Year
Ended
March
31,
2025
Distributions
Paid
From:
Ordinary
Income
Total
Distributions
Paid
Multi-Asset
Ultrashort
Income
Fund
..........................................................
$
358,819
$
358,819
Distributions
Payable
Accumulated
Earnings
(Loss)
Accumulated
Capital
and
Other
Losses
Unrealized
Appreciation
(Depreciation)*
Total
Accumulated
Earnings
(Loss)
Multi-Asset
Ultrashort
Income
Fund
.................
$
(1,263)
$
(1,263)
$
(294,069)
$
(39,951)
$
(335,283)
Short-Term
Amount
Long-Term
Amount
Total
Multi-Asset
Ultrashort
Income
Fund
........................................
$
(162,051)
$
(132,018)
$
(294,069)
Cost
of
Investments
for
Federal
Tax
Purposes
Gross
Unrealized
Appreciation
Gross
Unrealized
Depreciation
Net
Unrealized
Appreciation
(Depreciation)
Multi-Asset
Ultrashort
Income
Fund
......................
$
8,254,174
$
14,152
$
(54,434)
$
(40,282)
Report
of
Independent
Registered
Public
Accounting
Firm
To
the
Board
of
Trustees
of
Victory
Portfolios
IV
and
the
Shareholders
of
Victory
Pioneer
Multi-Asset
Ultrashort
Income
Fund:
Opinion
on
the
Financial
Statements
and
Financial
Highlights
We
have
audited
the
accompanying
statement
of
assets
and
liabilities
of
Victory
Pioneer
Multi-Asset
Ultrashort
Income
Fund
(the
“Fund”)
(one
of
the
funds
constituting
Victory
Portfolios
IV),
including
the
schedule
of
investments,
as
of
March
31,
2026,
the
related
statement
of
operations
for
the
year
then
ended,
statements
of
changes
in
net
assets
for
each
of
the
two
years
in
the
period
then
ended
and
financial
highlights
for
each
of
the
three
years
in
the
period
then
ended,
and
the
related
notes
(collectively
referred
to
as
the
"financial
statements
and
financial
highlights")..
In
our
opinion,
the
financial
statements
and
financial
highlights
present
fairly,
in
all
material
respects,
the
financial
position
of
the
Fund
as
of
March
31,
2026,
and
the
results
of
its
operations
for
the
year
then
ended,
the
changes
in
its
net
assets
for
each
of
the
two
years
in
the
period
then
ended
and
the
financial
highlights
for
each
of
the
three
years
in
the
period
then
ended
in
conformity
with
accounting
principles
generally
accepted
in
the
United
States
of
America.
The
financial
highlights
for
the
years
ended
March
31,
2023
and
2022
were
audited
by
other
auditors.
Those
auditors
expressed
an
unqualified
opinion
on
those
financial
statements
and
financial
highlights
in
their
report
dated
May
25,
2023.
Basis
for
Opinion
These
financial
statements
and
financial
highlights
are
the
responsibility
of
the
Fund’s
management.
Our
responsibility
is
to
express
an
opinion
on
the
Fund’s
financial
statements
and
financial
highlights
based
on
our
audits.
We
are
a
public
accounting
firm
registered
with
the
Public
Company
Accounting
Oversight
Board
(United
States)
(PCAOB)
and
are
required
to
be
independent
with
respect
to
the
Fund
in
accordance
with
the
U.S.
federal
securities
laws
and
the
applicable
rules
and
regulations
of
the
Securities
and
Exchange
Commission
and
the
PCAOB.
We
conducted
our
audits
in
accordance
with
the
standards
of
the
PCAOB.
Those
standards
require
that
we
plan
and
perform
the
audit
to
obtain
reasonable
assurance
about
whether
the
financial
statements
and
financial
highlights
are
free
of
material
misstatement,
whether
due
to
error
or
fraud.
The
Fund
is
not
required
to
have,
nor
were
we
engaged
to
perform,
an
audit
of
its
internal
control
over
financial
reporting.
As
part
of
our
audits,
we
are
required
to
obtain
an
understanding
of
internal
control
over
financial
reporting
but
not
for
the
purpose
of
expressing
an
opinion
on
the
effectiveness
of
the
Fund’s
internal
control
over
financial
reporting.
Accordingly,
we
express
no
such
opinion.
Our
audits
included
performing
procedures
to
assess
the
risks
of
material
misstatement
of
the
financial
statements
and
financial
highlights,
whether
due
to
error
or
fraud,
and
performing
procedures
that
respond
to
those
risks.
Such
procedures
included
examining,
on
a
test
basis,
evidence
regarding
the
amounts
and
disclosures
in
the
financial
statements
and
financial
highlights.
Our
audits
also
included
evaluating
the
accounting
principles
used
and
significant
estimates
made
by
management,
as
well
as
evaluating
the
overall
presentation
of
the
financial
statements
and
financial
highlights.
Our
procedures
included
confirmation
of
securities
owned
as
of
March
31,
2026,
by
correspondence
with
the
custodian
and
brokers;
when
replies
were
not
received
from
brokers,
we
performed
other
auditing
procedures.
We
believe
that
our
audits
provide
a
reasonable
basis
for
our
opinion.
DELOITTE
&
TOUCHE
LLP
Boston,
Massachusetts
May
27,
2026
We
have
served
as
the
auditor
of
one
or
more
of
the
Victory
Pioneer
investment
companies
since
2024.
Supplemental
Information
March
31,
2026
Additional
Federal
Income
Tax
Information
For
the
fiscal
year
ended
March
31,
2026,
the
Fund
hereby
designates
the
maximum
amount
allowable
of
its
net
taxable
income
as
qualified
dividends
taxed
at
individual
net
capital
gain
rates.
Shareholders
will
be
notified
via
IRS
Form
1099
of
the
amounts
for
use
in
preparing
their
income
tax
return.
Victory
Funds
P.O.
Box
182593
Columbus,
Ohio
43218-2593
Visit
our
website
at:
vcm.com
Call
Victory
at:
(800)
539-3863
(b) The Financial
Highlights are included as a part of the Financial Statements filed under Item
7(a) of this Form.
Item 8. Changes in
and Disagreements with Accountants for Open-End Management Investment Companies.
Not applicable.
Item 9. Proxy
Disclosures for Open-End Management Investment Companies.
Proxy
disclosures, if any, are included as part of the Financial Statements filed under Item 7(a) of this Form.
Item 10. Remuneration
Paid to Directors, Officers, and Others of Open-End Management Investment
Companies.
Not
applicable.
Item 11. Statement
Regarding Basis for Approval of Investment Advisory Contract.
Not applicable.
Item 12. Disclosure
of Proxy Voting Policies and Procedures for Closed-End Management Investment
Companies.
Not applicable.
Item 13. Portfolio
Managers of Closed-End Management Investment Companies.
Not applicable.
Item 14. Purchases of
Equity Securities by Closed-End Management Investment Company and Affiliated
Purchasers.
Not applicable.
Item 15. Submission
of Matters to a Vote of Security Holders.
Not applicable.
Item 16. Controls and
Procedures.
(a) The Registrant’s principal
executive officer and principal financial officer have concluded, based on
their evaluation of the Registrant’s disclosure controls and procedures as
conducted within 90 days of the filing date of this report, that those disclosure
controls and procedures provide reasonable assurance that material information
required to be disclosed by the Registrant on this report is recorded,
processed, summarized and reported within the time periods specified in the
Securities and Exchange Commission's rules and forms.
(b) There were no changes in the Registrant’s internal control over financial
reporting (as defined in Rule 30a-3(d) under the Act (17CFR 270.30a-3(d)) that
occurred during the period covered by this report that have materially affected
or are reasonably likely to materially affect, the Registrant’s internal
control over financial reporting.
Item 17. Disclosure
of Securities Lending Activities for Closed-End Management Investment
Companies.
Not applicable.
Item 18. Recovery of
Erroneously Awarded Compensation.
Not applicable.
Item 19. Exhibits.
(a)(2) Not applicable.
(a)(4) Not Applicable
(a)(5) Not Applicable
SIGNATURES
Pursuant to the requirements of the Securities Exchange Act of 1934 and the Investment Company Act of 1940,
the registrant has duly caused this report to be signed on its behalf by the
undersigned, thereunto duly authorized.
(Registrant) Victory
Portfolios IV
By (Signature and
Title) /s/ Carol D. Trevino
Carol
D. Trevino, Treasurer and Principal Financial Officer
Date June 8, 2026
Pursuant to the requirements of the Securities Exchange Act of 1934 and the Investment
Company Act of 1940, this report has been signed below by the following persons
on behalf of the registrant and in the capacities and on the dates indicated.
By (Signature and
Title) /s/ Thomas
Dusenberry
Thomas
Dusenberry, President and Principal Executive Officer
Date June 8, 2026
By (Signature and
Title) /s/ Carol D. Trevino
Carol D. Trevino, Treasurer and Principal
Financial Officer
Date June 8, 2026