Shareholder Report
|
12 Months Ended |
|
Mar. 31, 2026
USD ($)
Holding
|
|---|
| Shareholder Report [Line Items] |
|
| Document Type |
N-CSR
|
| Amendment Flag |
false
|
| Registrant Name |
Victory Portfolios IV
|
| Entity Central Index Key |
0002042316
|
| Entity Investment Company Type |
N-1A
|
| Document Period End Date |
Mar. 31, 2026
|
| Shareholder Report Annual or Semi-Annual |
annual shareholder report
|
| C000256497 |
|
| Shareholder Report [Line Items] |
|
| Fund Name |
Victory Pioneer Fundamental Growth Fund
|
| Class Name |
Class A
|
| Trading Symbol |
PIGFX
|
| Annual or Semi-Annual Statement [Text Block] |
Annual Shareholder Report
|
| Additional Information [Text Block] |
You can find additional information about the Fund at advisor.vcm.com/literature/mutual-fund-prospectuses. You may also request more information by calling 800-539-3863 or visiting vcm.com/contact-us.
|
| Additional Information Phone Number |
800-539-3863
|
| Additional Information Website |
vcm.com
|
| Expenses [Text Block] |
What were the Fund's costs for the last year?(based on a hypothetical $10,000 investment) Table SummaryClass Name | Costs of a $10,000 Investment | Costs paid as a percentage of a $10,000 Investment |
|---|
Class A | $104 | 0.99% |
|---|
| | |
|---|
|
| Expenses Paid, Amount |
$ 104
|
| Expense Ratio, Percent |
0.99%
|
| Factors Affecting Performance [Text Block] |
What affected the Fund’s performance during the last year?Top contributors to performance: Consumer staples was the largest sector contributor to relative performance as compared to the Russell 1000® Growth Index (the “Index”), and the portfolio benefited from its lack of exposure to the declining real estate sector. At the individual security level, overweight positions in Amphenol Corp., Class A and ASML Holding NV, Class NY were the top contributors to relative performance, as both positions significantly outperformed the Index on the strength of robust revenue growth and expanding AI-driven demand.
Top detractors from performance: Stock selection in industrials and communication services were the largest detractors to performance relative to the Index. At the individual security level, NVIDIA Corp. and Broadcom, Inc., were the largest detractors, as the portfolio's underweight positions in both names proved costly given their substantial outperformance during the period.
Holdings are subject to change. There is no guarantee that securities mentioned remain in or out of the Fund. |
| Performance Past Does Not Indicate Future [Text] |
The investment return and principal value will fluctuate so that an investor's shares, when redeemed, may be worth more or less than the original cost. Past performance is not a good predictor of the Fund's future performance.
|
| Line Graph [Table Text Block] |
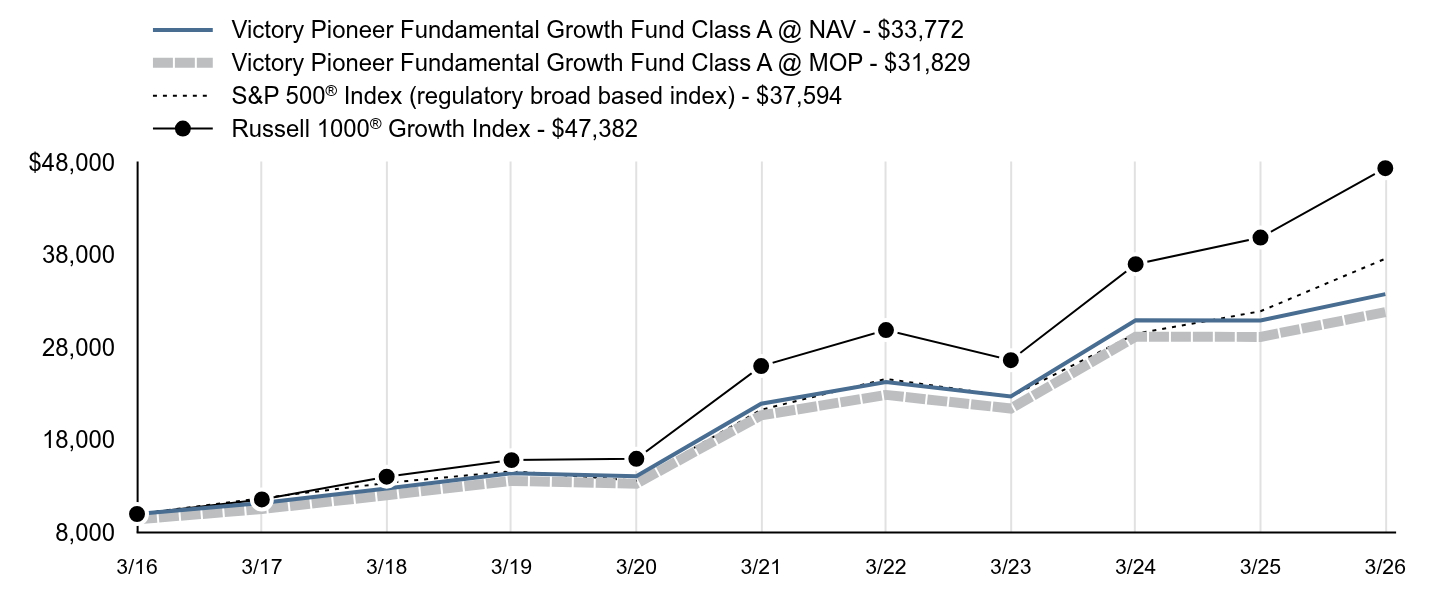
Table Summary | Victory Pioneer Fundamental Growth Fund Class A @ NAV - $33,772 | Victory Pioneer Fundamental Growth Fund Class A @ MOP - $31,829 | S&P 500® Index (regulatory broad based index) - $37,594 | Russell 1000® Growth Index - $47,382 |
|---|
3/16 | $10,000 | $9,425 | $10,000 | $10,000 |
|---|
3/17 | $11,178 | $10,535 | $11,717 | $11,576 |
|---|
3/18 | $12,760 | $12,026 | $13,357 | $14,036 |
|---|
3/19 | $14,406 | $13,578 | $14,625 | $15,825 |
|---|
3/20 | $14,094 | $13,283 | $13,605 | $15,969 |
|---|
3/21 | $21,924 | $20,663 | $21,271 | $25,989 |
|---|
3/22 | $24,270 | $22,873 | $24,599 | $29,882 |
|---|
3/23 | $22,706 | $21,400 | $22,698 | $26,624 |
|---|
3/24 | $30,946 | $29,165 | $29,480 | $37,007 |
|---|
3/25 | $30,921 | $29,142 | $31,913 | $39,879 |
|---|
3/26 | $33,772 | $31,829 | $37,594 | $47,382 |
|---|
|
| Average Annual Return [Table Text Block] |
Table Summary | 1 Year | 5 Year | 10 Year |
|---|
Class A @ NAV | 9.22% | 9.03% | 12.94% |
|---|
Class A @ MOP | 2.96% | 7.74% | 12.27% |
|---|
S&P 500® Index | 17.80% | 12.06% | 14.16% |
|---|
Russell 1000® Growth Index | 18.81% | 12.76% | 16.83% |
|---|
|
| No Deduction of Taxes [Text Block] |
The graph and table total returns do not reflect the deduction of taxes that a shareholder would pay on Fund distributions, or redemption of shares.
|
| Previous Investment Adviser [Text Block] |
The maximum offering price (“MOP”) figures reflect a maximum sales charge of 5.75% for Class A. The Net Asset Value ("NAV") figures do not reflect sales charges.
|
| AssetsNet |
$ 5,786,549,000
|
| Holdings Count | Holding |
37
|
| Advisory Fees Paid, Amount |
$ 42,644,000
|
| InvestmentCompanyPortfolioTurnover |
24.00%
|
| Additional Fund Statistics [Text Block] |
FUND STATISTICS($ amounts in 000s)(as of March 31, 2026)Table SummaryNet Assets | $5,786,549 |
|---|
Number of Holdings | 37 |
|---|
Investment Advisory Fees | $42,644 |
|---|
Portfolio Turnover | 24% |
|---|
|
| Holdings [Text Block] |
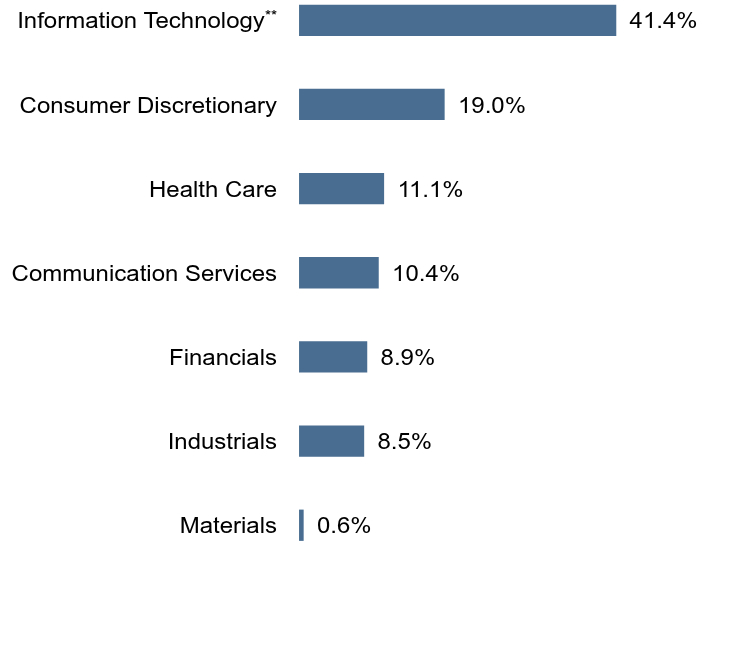
Top SectorsFootnote Reference* (% of Net Assets)Footnote Reference(as of March 31, 2026)Table SummaryValue | Value |
|---|
Materials | 0.6% | Industrials | 8.5% | Financials | 8.9% | Communication Services | 10.4% | Health Care | 11.1% | Consumer Discretionary | 19.0% | Information TechnologyFootnote Reference** | 41.4% | Top 10 HoldingsFootnote Reference* (% of Net Assets)Footnote Reference(as of March 31, 2026)Table SummaryApple, Inc. | 7.9% |
|---|
Amazon.com, Inc. | 7.3% |
|---|
Microsoft Corp. | 4.4% |
|---|
Eli Lilly & Co. | 4.4% |
|---|
Amphenol Corp., Class A | 4.3% |
|---|
ASML Holding NV, Class NY | 4.2% |
|---|
Visa, Inc., Class A | 3.8% |
|---|
Synopsys, Inc. | 3.5% |
|---|
Uber Technologies, Inc. | 3.5% |
|---|
Advanced Micro Devices, Inc. | 3.2% |
|---|
|
| C000256499 |
|
| Shareholder Report [Line Items] |
|
| Fund Name |
Victory Pioneer Fundamental Growth Fund
|
| Class Name |
Class C
|
| Trading Symbol |
FUNCX
|
| Annual or Semi-Annual Statement [Text Block] |
Annual Shareholder Report
|
| Additional Information [Text Block] |
You can find additional information about the Fund at advisor.vcm.com/literature/mutual-fund-prospectuses. You may also request more information by calling 800-539-3863 or visiting vcm.com/contact-us.
|
| Additional Information Phone Number |
800-539-3863
|
| Additional Information Website |
vcm.com
|
| Expenses [Text Block] |
What were the Fund's costs for the last year?(based on a hypothetical $10,000 investment) Table SummaryClass Name | Costs of a $10,000 Investment | Costs paid as a percentage of a $10,000 Investment |
|---|
Class C | $179 | 1.72% |
|---|
| | |
|---|
|
| Expenses Paid, Amount |
$ 179
|
| Expense Ratio, Percent |
1.72%
|
| Factors Affecting Performance [Text Block] |
What affected the Fund’s performance during the last year?Top contributors to performance: Consumer staples was the largest sector contributor to relative performance as compared to the Russell 1000® Growth Index (the “Index”), and the portfolio benefited from its lack of exposure to the declining real estate sector. At the individual security level, overweight positions in Amphenol Corp., Class A and ASML Holding NV, Class NY were the top contributors to relative performance, as both positions significantly outperformed the Index on the strength of robust revenue growth and expanding AI-driven demand.
Top detractors from performance: Stock selection in industrials and communication services were the largest detractors to performance relative to the Index. At the individual security level, NVIDIA Corp. and Broadcom, Inc., were the largest detractors, as the portfolio's underweight positions in both names proved costly given their substantial outperformance during the period.
Holdings are subject to change. There is no guarantee that securities mentioned remain in or out of the Fund. |
| Performance Past Does Not Indicate Future [Text] |
The investment return and principal value will fluctuate so that an investor's shares, when redeemed, may be worth more or less than the original cost. Past performance is not a good predictor of the Fund's future performance.
|
| Line Graph [Table Text Block] |
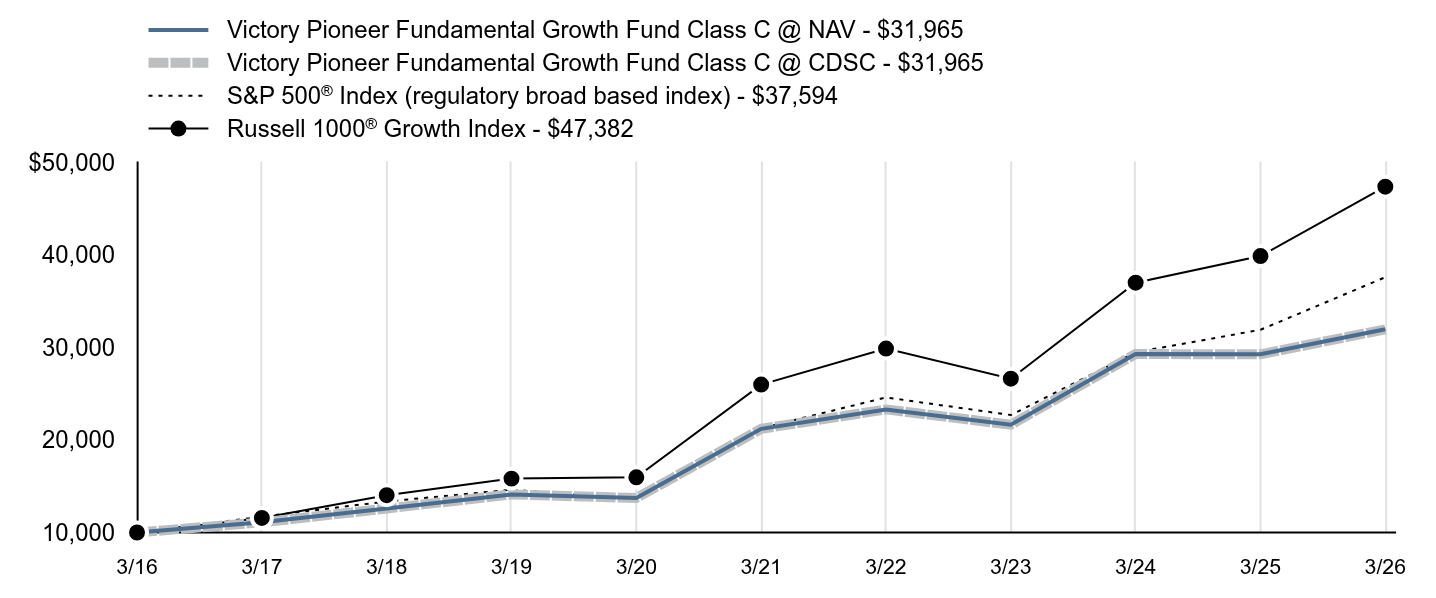
Table Summary | Victory Pioneer Fundamental Growth Fund Class C @ NAV - $31,965 | Victory Pioneer Fundamental Growth Fund Class C @ CDSC - $31,965 | S&P 500® Index (regulatory broad based index) - $37,594 | Russell 1000® Growth Index - $47,382 |
|---|
3/16 | $10,000 | $10,000 | $10,000 | $10,000 |
|---|
3/17 | $11,098 | $11,098 | $11,717 | $11,576 |
|---|
3/18 | $12,592 | $12,592 | $13,357 | $14,036 |
|---|
3/19 | $14,118 | $14,118 | $14,625 | $15,825 |
|---|
3/20 | $13,729 | $13,729 | $13,605 | $15,969 |
|---|
3/21 | $21,204 | $21,204 | $21,271 | $25,989 |
|---|
3/22 | $23,305 | $23,305 | $24,599 | $29,882 |
|---|
3/23 | $21,652 | $21,652 | $22,698 | $26,624 |
|---|
3/24 | $29,290 | $29,290 | $29,480 | $37,007 |
|---|
3/25 | $29,266 | $29,266 | $31,913 | $39,879 |
|---|
3/26 | $31,965 | $31,965 | $37,594 | $47,382 |
|---|
|
| Average Annual Return [Table Text Block] |
Table Summary | 1 Year | 5 Year | 10 Year |
|---|
Class C @ NAV | 8.43% | 8.24% | 12.32% |
|---|
Class C @ CDSC | 7.56% | 8.24% | 12.32% |
|---|
S&P 500® Index | 17.80% | 12.06% | 14.16% |
|---|
Russell 1000® Growth Index | 18.81% | 12.76% | 16.83% |
|---|
|
| No Deduction of Taxes [Text Block] |
The graph and table total returns do not reflect the deduction of taxes that a shareholder would pay on Fund distributions, or redemption of shares.
|
| Previous Investment Adviser [Text Block] |
Class C is not subject to an initial sales charge, but is subject to Contingent Deferred Sales Charge (“CDSC”) of 1.00% on shares redeemed within one year of purchase. The Net Asset Value ("NAV") figures do not reflect sales charges.
|
| AssetsNet |
$ 5,786,549,000
|
| Holdings Count | Holding |
37
|
| Advisory Fees Paid, Amount |
$ 42,644,000
|
| InvestmentCompanyPortfolioTurnover |
24.00%
|
| Additional Fund Statistics [Text Block] |
FUND STATISTICS($ amounts in 000s)(as of March 31, 2026)Table SummaryNet Assets | $5,786,549 |
|---|
Number of Holdings | 37 |
|---|
Investment Advisory Fees | $42,644 |
|---|
Portfolio Turnover | 24% |
|---|
|
| Holdings [Text Block] |
Top SectorsFootnote Reference* (% of Net Assets)Footnote Reference(as of March 31, 2026)Table SummaryValue | Value |
|---|
Materials | 0.6% | Industrials | 8.5% | Financials | 8.9% | Communication Services | 10.4% | Health Care | 11.1% | Consumer Discretionary | 19.0% | Information TechnologyFootnote Reference** | 41.4% | Top 10 HoldingsFootnote Reference* (% of Net Assets)Footnote Reference(as of March 31, 2026)Table SummaryApple, Inc. | 7.9% |
|---|
Amazon.com, Inc. | 7.3% |
|---|
Microsoft Corp. | 4.4% |
|---|
Eli Lilly & Co. | 4.4% |
|---|
Amphenol Corp., Class A | 4.3% |
|---|
ASML Holding NV, Class NY | 4.2% |
|---|
Visa, Inc., Class A | 3.8% |
|---|
Synopsys, Inc. | 3.5% |
|---|
Uber Technologies, Inc. | 3.5% |
|---|
Advanced Micro Devices, Inc. | 3.2% |
|---|
|
| C000256495 |
|
| Shareholder Report [Line Items] |
|
| Fund Name |
Victory Pioneer Fundamental Growth Fund
|
| Class Name |
Class R
|
| Trading Symbol |
PFGRX
|
| Annual or Semi-Annual Statement [Text Block] |
Annual Shareholder Report
|
| Additional Information [Text Block] |
You can find additional information about the Fund at advisor.vcm.com/literature/mutual-fund-prospectuses. You may also request more information by calling 800-539-3863 or visiting vcm.com/contact-us.
|
| Additional Information Phone Number |
800-539-3863
|
| Additional Information Website |
vcm.com
|
| Expenses [Text Block] |
What were the Fund's costs for the last year?(based on a hypothetical $10,000 investment) Table SummaryClass Name | Costs of a $10,000 Investment | Costs paid as a percentage of a $10,000 Investment |
|---|
Class R | $142 | 1.36% |
|---|
| | |
|---|
|
| Expenses Paid, Amount |
$ 142
|
| Expense Ratio, Percent |
1.36%
|
| Factors Affecting Performance [Text Block] |
What affected the Fund’s performance during the last year?Top contributors to performance: Consumer staples was the largest sector contributor to relative performance as compared to the Russell 1000® Growth Index (the “Index”), and the portfolio benefited from its lack of exposure to the declining real estate sector. At the individual security level, overweight positions in Amphenol Corp., Class A and ASML Holding NV, Class NY were the top contributors to relative performance, as both positions significantly outperformed the Index on the strength of robust revenue growth and expanding AI-driven demand.
Top detractors from performance: Stock selection in industrials and communication services were the largest detractors to performance relative to the Index. At the individual security level, NVIDIA Corp. and Broadcom, Inc., were the largest detractors, as the portfolio's underweight positions in both names proved costly given their substantial outperformance during the period.
Holdings are subject to change. There is no guarantee that securities mentioned remain in or out of the Fund. |
| Performance Past Does Not Indicate Future [Text] |
The investment return and principal value will fluctuate so that an investor's shares, when redeemed, may be worth more or less than the original cost. Past performance is not a good predictor of the Fund's future performance.
|
| Line Graph [Table Text Block] |
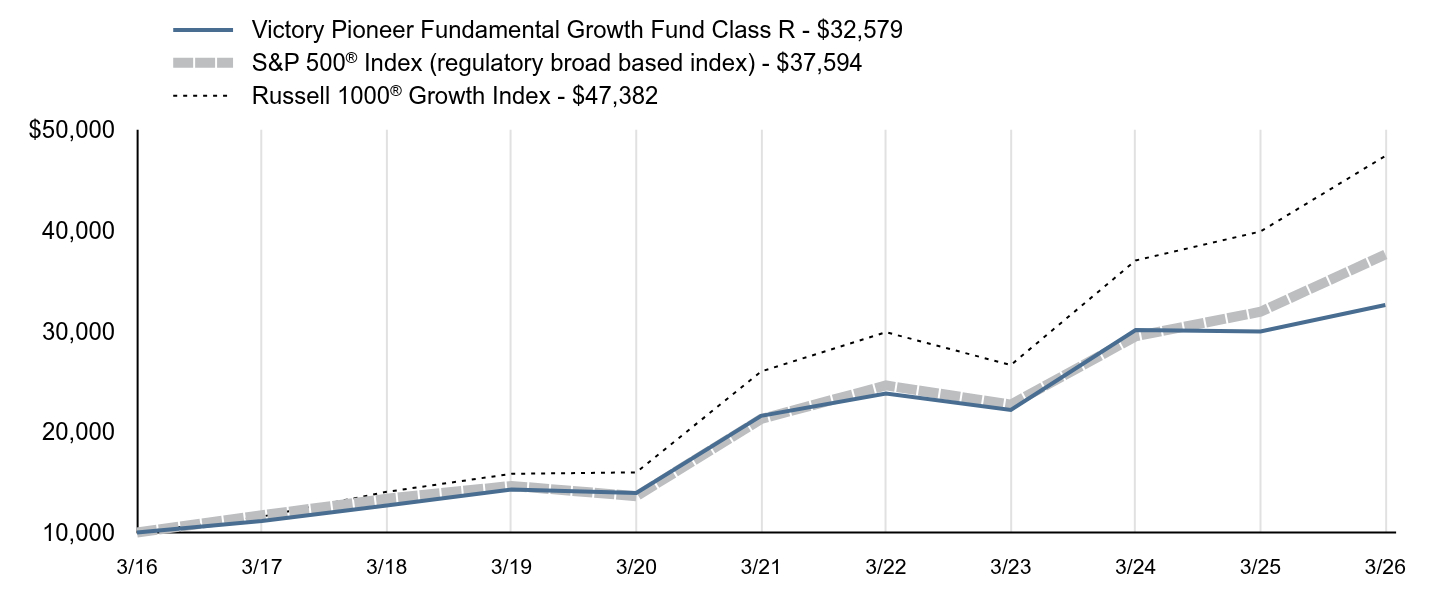
Table Summary | Victory Pioneer Fundamental Growth Fund Class R - $32,579 | S&P 500® Index (regulatory broad based index) - $37,594 | Russell 1000® Growth Index - $47,382 |
|---|
3/16 | $10,000 | $10,000 | $10,000 |
|---|
3/17 | $11,141 | $11,717 | $11,576 |
|---|
3/18 | $12,680 | $13,357 | $14,036 |
|---|
3/19 | $14,274 | $14,625 | $15,825 |
|---|
3/20 | $13,924 | $13,605 | $15,969 |
|---|
3/21 | $21,582 | $21,271 | $25,989 |
|---|
3/22 | $23,788 | $24,599 | $29,882 |
|---|
3/23 | $22,170 | $22,698 | $26,624 |
|---|
3/24 | $30,101 | $29,480 | $37,007 |
|---|
3/25 | $29,954 | $31,913 | $39,879 |
|---|
3/26 | $32,579 | $37,594 | $47,382 |
|---|
|
| Average Annual Return [Table Text Block] |
Table Summary | 1 Year | 5 Year | 10 Year |
|---|
Class R | 8.76% | 8.58% | 12.54% |
|---|
S&P 500® Index | 17.80% | 12.06% | 14.16% |
|---|
Russell 1000® Growth Index | 18.81% | 12.76% | 16.83% |
|---|
|
| No Deduction of Taxes [Text Block] |
The graph and table total returns do not reflect the deduction of taxes that a shareholder would pay on Fund distributions, or redemption of shares.
|
| AssetsNet |
$ 5,786,549,000
|
| Holdings Count | Holding |
37
|
| Advisory Fees Paid, Amount |
$ 42,644,000
|
| InvestmentCompanyPortfolioTurnover |
24.00%
|
| Additional Fund Statistics [Text Block] |
FUND STATISTICS($ amounts in 000s)(as of March 31, 2026)Table SummaryNet Assets | $5,786,549 |
|---|
Number of Holdings | 37 |
|---|
Investment Advisory Fees | $42,644 |
|---|
Portfolio Turnover | 24% |
|---|
|
| Holdings [Text Block] |
Top SectorsFootnote Reference* (% of Net Assets)Footnote Reference(as of March 31, 2026)Table SummaryValue | Value |
|---|
Materials | 0.6% | Industrials | 8.5% | Financials | 8.9% | Communication Services | 10.4% | Health Care | 11.1% | Consumer Discretionary | 19.0% | Information TechnologyFootnote Reference** | 41.4% | Top 10 HoldingsFootnote Reference* (% of Net Assets)Footnote Reference(as of March 31, 2026)Table SummaryApple, Inc. | 7.9% |
|---|
Amazon.com, Inc. | 7.3% |
|---|
Microsoft Corp. | 4.4% |
|---|
Eli Lilly & Co. | 4.4% |
|---|
Amphenol Corp., Class A | 4.3% |
|---|
ASML Holding NV, Class NY | 4.2% |
|---|
Visa, Inc., Class A | 3.8% |
|---|
Synopsys, Inc. | 3.5% |
|---|
Uber Technologies, Inc. | 3.5% |
|---|
Advanced Micro Devices, Inc. | 3.2% |
|---|
|
| C000256496 |
|
| Shareholder Report [Line Items] |
|
| Fund Name |
Victory Pioneer Fundamental Growth Fund
|
| Class Name |
Class R6
|
| Trading Symbol |
PFGKX
|
| Annual or Semi-Annual Statement [Text Block] |
Annual Shareholder Report
|
| Additional Information [Text Block] |
You can find additional information about the Fund at advisor.vcm.com/literature/mutual-fund-prospectuses. You may also request more information by calling 800-539-3863 or visiting vcm.com/contact-us.
|
| Additional Information Phone Number |
800-539-3863
|
| Additional Information Website |
vcm.com
|
| Expenses [Text Block] |
What were the Fund's costs for the last year?(based on a hypothetical $10,000 investment) Table SummaryClass Name | Costs of a $10,000 Investment | Costs paid as a percentage of a $10,000 Investment |
|---|
Class R6 | $68 | 0.65% |
|---|
| | |
|---|
|
| Expenses Paid, Amount |
$ 68
|
| Expense Ratio, Percent |
0.65%
|
| Factors Affecting Performance [Text Block] |
What affected the Fund’s performance during the last year?Top contributors to performance: Consumer staples was the largest sector contributor to relative performance as compared to the Russell 1000® Growth Index (the “Index”), and the portfolio benefited from its lack of exposure to the declining real estate sector. At the individual security level, overweight positions in Amphenol Corp., Class A and ASML Holding NV, Class NY were the top contributors to relative performance, as both positions significantly outperformed the Index on the strength of robust revenue growth and expanding AI-driven demand.
Top detractors from performance: Stock selection in industrials and communication services were the largest detractors to performance relative to the Index. At the individual security level, NVIDIA Corp. and Broadcom, Inc., were the largest detractors, as the portfolio's underweight positions in both names proved costly given their substantial outperformance during the period.
Holdings are subject to change. There is no guarantee that securities mentioned remain in or out of the Fund. |
| Performance Past Does Not Indicate Future [Text] |
The investment return and principal value will fluctuate so that an investor's shares, when redeemed, may be worth more or less than the original cost. Past performance is not a good predictor of the Fund's future performance.
|
| Line Graph [Table Text Block] |
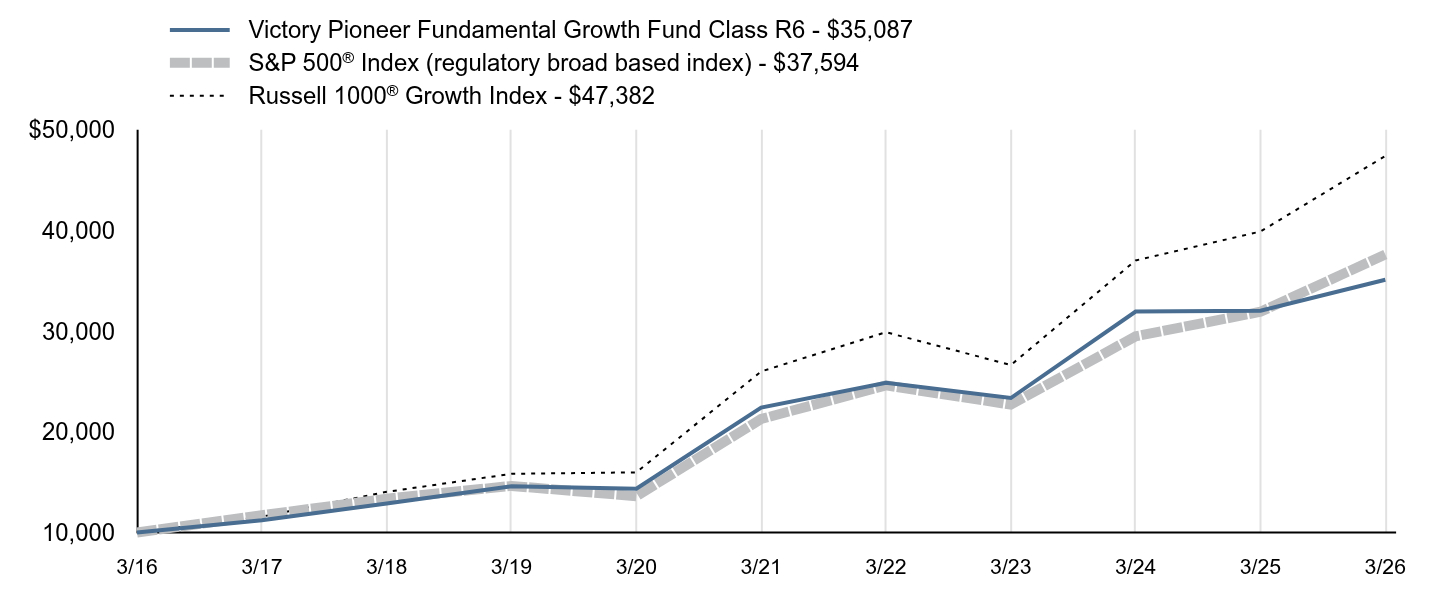
Table Summary | Victory Pioneer Fundamental Growth Fund Class R6 - $35,087 | S&P 500® Index (regulatory broad based index) - $37,594 | Russell 1000® Growth Index - $47,382 |
|---|
3/16 | $10,000 | $10,000 | $10,000 |
|---|
3/17 | $11,224 | $11,717 | $11,576 |
|---|
3/18 | $12,872 | $13,357 | $14,036 |
|---|
3/19 | $14,594 | $14,625 | $15,825 |
|---|
3/20 | $14,341 | $13,605 | $15,969 |
|---|
3/21 | $22,393 | $21,271 | $25,989 |
|---|
3/22 | $24,874 | $24,599 | $29,882 |
|---|
3/23 | $23,348 | $22,698 | $26,624 |
|---|
3/24 | $31,932 | $29,480 | $37,007 |
|---|
3/25 | $32,019 | $31,913 | $39,879 |
|---|
3/26 | $35,087 | $37,594 | $47,382 |
|---|
|
| Average Annual Return [Table Text Block] |
Table Summary | 1 Year | 5 Year | 10 Year |
|---|
Class R6 | 9.58% | 9.40% | 13.37% |
|---|
S&P 500® Index | 17.80% | 12.06% | 14.16% |
|---|
Russell 1000® Growth Index | 18.81% | 12.76% | 16.83% |
|---|
|
| No Deduction of Taxes [Text Block] |
The graph and table total returns do not reflect the deduction of taxes that a shareholder would pay on Fund distributions, or redemption of shares.
|
| AssetsNet |
$ 5,786,549,000
|
| Holdings Count | Holding |
37
|
| Advisory Fees Paid, Amount |
$ 42,644,000
|
| InvestmentCompanyPortfolioTurnover |
24.00%
|
| Additional Fund Statistics [Text Block] |
FUND STATISTICS($ amounts in 000s)(as of March 31, 2026)Table SummaryNet Assets | $5,786,549 |
|---|
Number of Holdings | 37 |
|---|
Investment Advisory Fees | $42,644 |
|---|
Portfolio Turnover | 24% |
|---|
|
| Holdings [Text Block] |
Top SectorsFootnote Reference* (% of Net Assets)Footnote Reference(as of March 31, 2026)Table SummaryValue | Value |
|---|
Materials | 0.6% | Industrials | 8.5% | Financials | 8.9% | Communication Services | 10.4% | Health Care | 11.1% | Consumer Discretionary | 19.0% | Information TechnologyFootnote Reference** | 41.4% | Top 10 HoldingsFootnote Reference* (% of Net Assets)Footnote Reference(as of March 31, 2026)Table SummaryApple, Inc. | 7.9% |
|---|
Amazon.com, Inc. | 7.3% |
|---|
Microsoft Corp. | 4.4% |
|---|
Eli Lilly & Co. | 4.4% |
|---|
Amphenol Corp., Class A | 4.3% |
|---|
ASML Holding NV, Class NY | 4.2% |
|---|
Visa, Inc., Class A | 3.8% |
|---|
Synopsys, Inc. | 3.5% |
|---|
Uber Technologies, Inc. | 3.5% |
|---|
Advanced Micro Devices, Inc. | 3.2% |
|---|
|
| C000256498 |
|
| Shareholder Report [Line Items] |
|
| Fund Name |
Victory Pioneer Fundamental Growth Fund
|
| Class Name |
Class Y
|
| Trading Symbol |
FUNYX
|
| Annual or Semi-Annual Statement [Text Block] |
Annual Shareholder Report
|
| Additional Information [Text Block] |
You can find additional information about the Fund at advisor.vcm.com/literature/mutual-fund-prospectuses. You may also request more information by calling 800-539-3863 or visiting vcm.com/contact-us.
|
| Additional Information Phone Number |
800-539-3863
|
| Additional Information Website |
vcm.com
|
| Expenses [Text Block] |
What were the Fund's costs for the last year?(based on a hypothetical $10,000 investment) Table SummaryClass Name | Costs of a $10,000 Investment | Costs paid as a percentage of a $10,000 Investment |
|---|
Class Y | $80 | 0.76% |
|---|
| | |
|---|
|
| Expenses Paid, Amount |
$ 80
|
| Expense Ratio, Percent |
0.76%
|
| Factors Affecting Performance [Text Block] |
What affected the Fund’s performance during the last year?Top contributors to performance: Consumer staples was the largest sector contributor to relative performance as compared to the Russell 1000® Growth Index (the “Index”), and the portfolio benefited from its lack of exposure to the declining real estate sector. At the individual security level, overweight positions in Amphenol Corp., Class A and ASML Holding NV, Class NY were the top contributors to relative performance, as both positions significantly outperformed the Index on the strength of robust revenue growth and expanding AI-driven demand.
Top detractors from performance: Stock selection in industrials and communication services were the largest detractors to performance relative to the Index. At the individual security level, NVIDIA Corp. and Broadcom, Inc., were the largest detractors, as the portfolio's underweight positions in both names proved costly given their substantial outperformance during the period.
Holdings are subject to change. There is no guarantee that securities mentioned remain in or out of the Fund. |
| Performance Past Does Not Indicate Future [Text] |
The investment return and principal value will fluctuate so that an investor's shares, when redeemed, may be worth more or less than the original cost. Past performance is not a good predictor of the Fund's future performance.
|
| Line Graph [Table Text Block] |
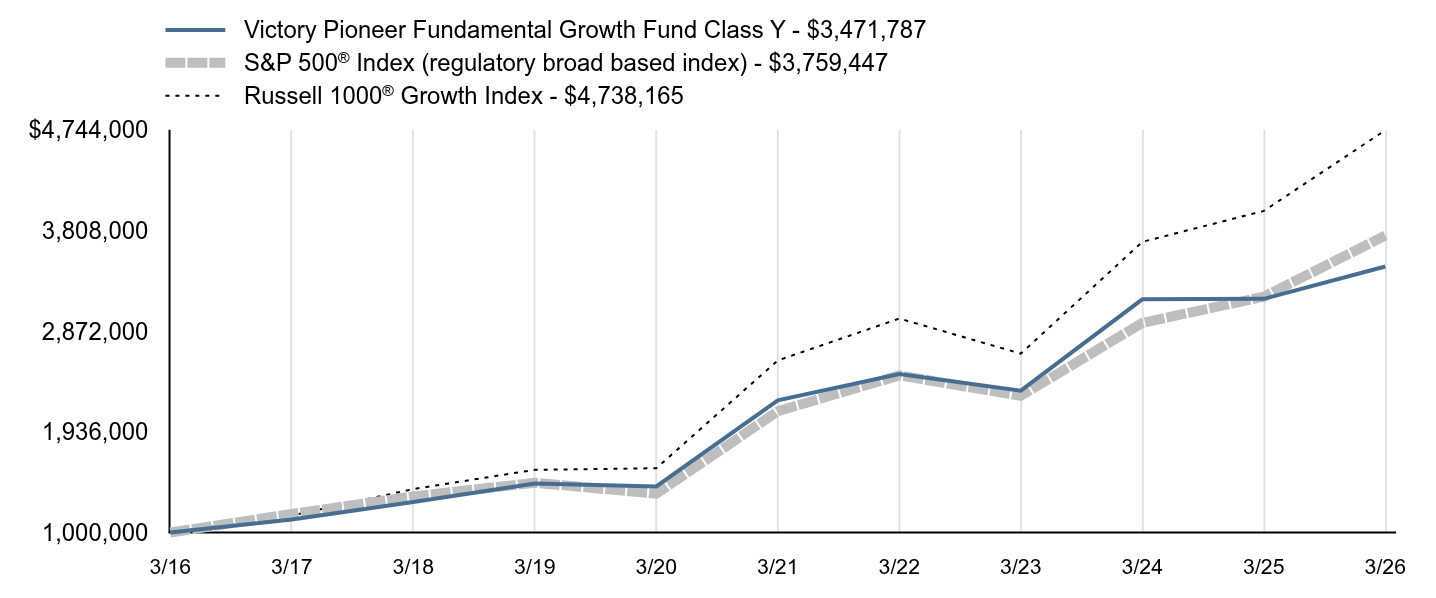
Table Summary | Victory Pioneer Fundamental Growth Fund Class Y - $3,471,787 | S&P 500® Index (regulatory broad based index) - $3,759,447 | Russell 1000® Growth Index - $4,738,165 |
|---|
3/16 | $1,000,000 | $1,000,000 | $1,000,000 |
|---|
3/17 | $1,121,131 | $1,171,722 | $1,157,562 |
|---|
3/18 | $1,284,137 | $1,335,668 | $1,403,589 |
|---|
3/19 | $1,454,655 | $1,462,509 | $1,582,515 |
|---|
3/20 | $1,427,850 | $1,360,457 | $1,596,942 |
|---|
3/21 | $2,227,279 | $2,127,097 | $2,598,918 |
|---|
3/22 | $2,471,504 | $2,459,899 | $2,988,165 |
|---|
3/23 | $2,318,294 | $2,269,786 | $2,662,407 |
|---|
3/24 | $3,166,512 | $2,948,026 | $3,700,652 |
|---|
3/25 | $3,171,347 | $3,191,288 | $3,987,942 |
|---|
3/26 | $3,471,787 | $3,759,447 | $4,738,165 |
|---|
|
| Average Annual Return [Table Text Block] |
Table Summary | 1 Year | 5 Year | 10 Year |
|---|
Class Y | 9.47% | 9.28% | 13.25% |
|---|
S&P 500® Index | 17.80% | 12.06% | 14.16% |
|---|
Russell 1000® Growth Index | 18.81% | 12.76% | 16.83% |
|---|
|
| No Deduction of Taxes [Text Block] |
The graph and table total returns do not reflect the deduction of taxes that a shareholder would pay on Fund distributions, or redemption of shares.
|
| AssetsNet |
$ 5,786,549,000
|
| Holdings Count | Holding |
37
|
| Advisory Fees Paid, Amount |
$ 42,644,000
|
| InvestmentCompanyPortfolioTurnover |
24.00%
|
| Additional Fund Statistics [Text Block] |
FUND STATISTICS($ amounts in 000s)(as of March 31, 2026)Table SummaryNet Assets | $5,786,549 |
|---|
Number of Holdings | 37 |
|---|
Investment Advisory Fees | $42,644 |
|---|
Portfolio Turnover | 24% |
|---|
|
| Holdings [Text Block] |
Top SectorsFootnote Reference* (% of Net Assets)Footnote Reference(as of March 31, 2026)Table SummaryValue | Value |
|---|
Materials | 0.6% | Industrials | 8.5% | Financials | 8.9% | Communication Services | 10.4% | Health Care | 11.1% | Consumer Discretionary | 19.0% | Information TechnologyFootnote Reference** | 41.4% | Top 10 HoldingsFootnote Reference* (% of Net Assets)Footnote Reference(as of March 31, 2026)Table SummaryApple, Inc. | 7.9% |
|---|
Amazon.com, Inc. | 7.3% |
|---|
Microsoft Corp. | 4.4% |
|---|
Eli Lilly & Co. | 4.4% |
|---|
Amphenol Corp., Class A | 4.3% |
|---|
ASML Holding NV, Class NY | 4.2% |
|---|
Visa, Inc., Class A | 3.8% |
|---|
Synopsys, Inc. | 3.5% |
|---|
Uber Technologies, Inc. | 3.5% |
|---|
Advanced Micro Devices, Inc. | 3.2% |
|---|
|
| C000256539 |
|
| Shareholder Report [Line Items] |
|
| Fund Name |
Victory Pioneer Multi-Asset Ultrashort Income Fund
|
| Class Name |
Class A
|
| Trading Symbol |
MAFRX
|
| Annual or Semi-Annual Statement [Text Block] |
Annual Shareholder Report
|
| Additional Information [Text Block] |
You can find additional information about the Fund at advisor.vcm.com/literature/ mutual-fund-prospectuses. You may also request more information by calling 800-539-3863 or visiting vcm.com/contact-us.
|
| Additional Information Phone Number |
800-539-3863
|
| Additional Information Website |
vcm.com
|
| Expenses [Text Block] |
What were the Fund's costs for the last year?(based on a hypothetical $10,000 investment) Table SummaryClass Name | Costs of a $10,000 Investment | Costs paid as a percentage of a $10,000 Investment |
|---|
Class A | $59 | 0.58% |
|---|
| | |
|---|
|
| Expenses Paid, Amount |
$ 59
|
| Expense Ratio, Percent |
0.58%
|
| Factors Affecting Performance [Text Block] |
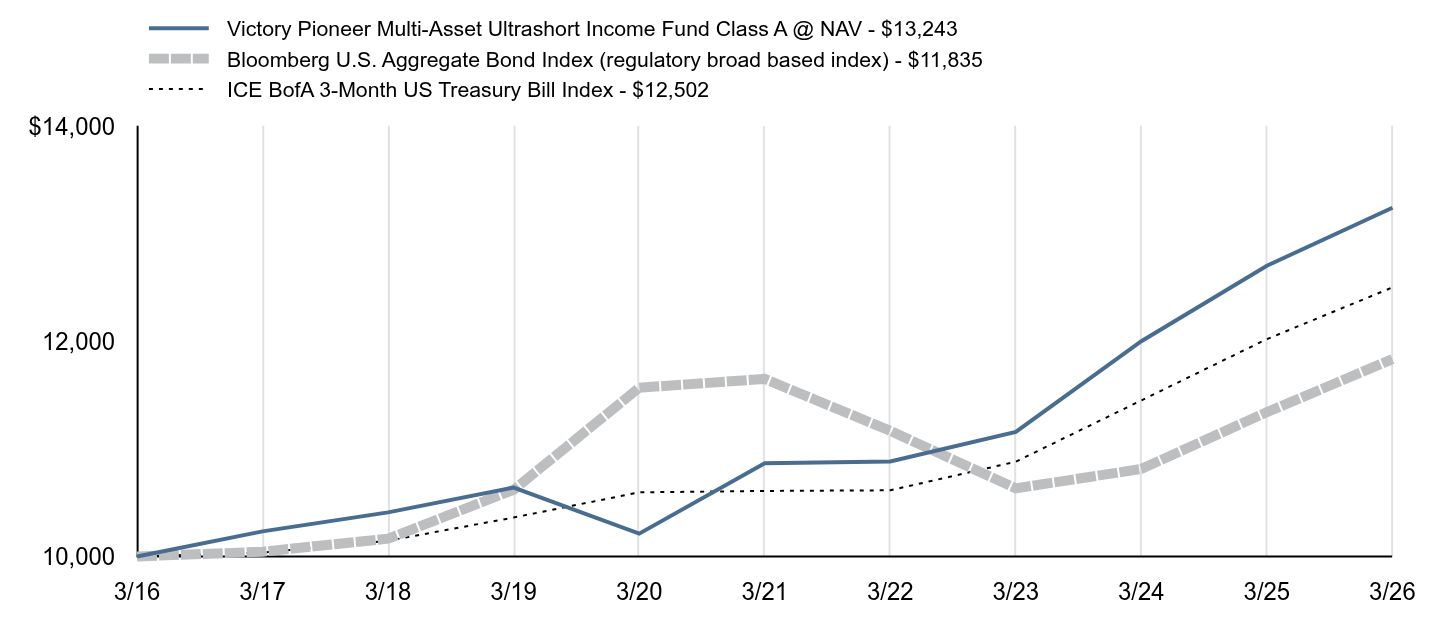
What affected the Fund’s performance during the last year?Top contributors to performance: The Fund’s exposures to collateralized loan obligations, industrials and agency mortgage-backed securities contributed to performance relative to the ICE BofA 3-Month US Treasury Bill Index (the “Index”). The Fund’s long average U.S. duration position relative to the Index of 0.1 years contributed to performance as yields moved lower in the middle part of the period. The Fund benefited from out of Index allocations to non-agency mortgage-backed securities, commercial mortgage-backed securities, and the financial sector.
Top detractors from performance: |
| Performance Past Does Not Indicate Future [Text] |
The investment return and principal value will fluctuate so that an investor's shares, when redeemed, may be worth more or less than the original cost. Past performance is not a good predictor of the Fund's future performance.
|
| Line Graph [Table Text Block] |
Table Summary | Victory Pioneer Multi-Asset Ultrashort Income Fund Class A @ NAV - $13,243 | Bloomberg U.S. Aggregate Bond Index (regulatory broad based index) - $11,835 | ICE BofA 3-Month US Treasury Bill Index - $12,502 |
|---|
3/16 | $10,000 | $10,000 | $10,000 |
|---|
3/17 | $10,233 | $10,044 | $10,036 |
|---|
3/18 | $10,410 | $10,165 | $10,146 |
|---|
3/19 | $10,641 | $10,620 | $10,362 |
|---|
3/20 | $10,212 | $11,569 | $10,596 |
|---|
3/21 | $10,867 | $11,651 | $10,609 |
|---|
3/22 | $10,884 | $11,168 | $10,615 |
|---|
3/23 | $11,158 | $10,633 | $10,881 |
|---|
3/24 | $12,002 | $10,814 | $11,451 |
|---|
3/25 | $12,703 | $11,342 | $12,021 |
|---|
3/26 | $13,243 | $11,835 | $12,502 |
|---|
|
| Average Annual Return [Table Text Block] |
Table Summary | 1 Year | 5 Year | 10 Year |
|---|
Class A @ NAV | 4.25% | 4.03% | 2.85% |
|---|
Bloomberg U.S. Aggregate Bond Index | 4.35% | 0.31% | 1.70% |
|---|
ICE BofA 3-Month US Treasury Bill Index | 4.00% | 3.34% | 2.26% |
|---|
|
| No Deduction of Taxes [Text Block] |
The graph and table total returns do not reflect the deduction of taxes that a shareholder would pay on Fund distributions, or redemption of shares.
|
| Previous Investment Adviser [Text Block] |
|
| AssetsNet |
$ 8,082,066,000
|
| Holdings Count | Holding |
1,175
|
| Advisory Fees Paid, Amount |
$ 22,643,000
|
| InvestmentCompanyPortfolioTurnover |
54.00%
|
| Additional Fund Statistics [Text Block] |
FUND STATISTICS($ amounts in 000s)(as of March 31, 2026)Table SummaryNet Assets | $8,082,066 |
|---|
Number of Holdings | 1,175 |
|---|
Investment Advisory Fees | $22,643 |
|---|
Portfolio Turnover | 54% |
|---|
|
| Holdings [Text Block] |
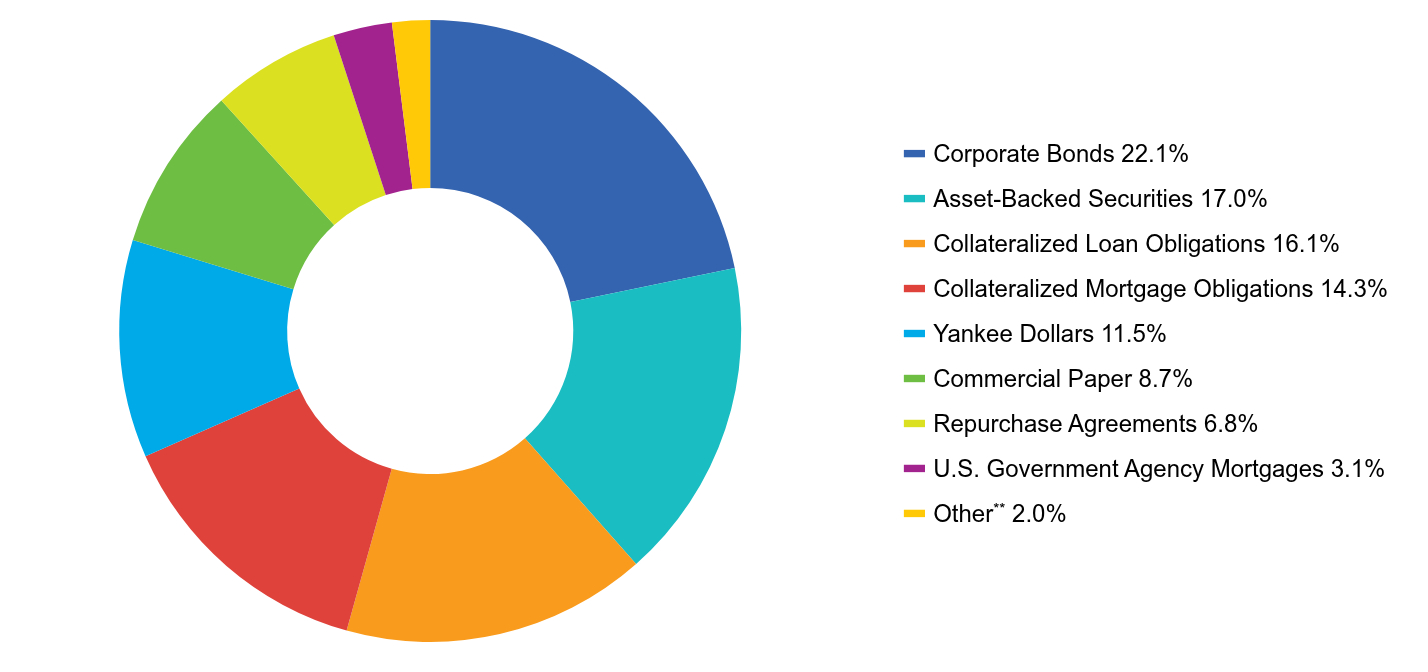
Asset AllocationFootnote Reference* ^ (% of Net Assets)(as of March 31, 2026)Table SummaryValue | Value |
|---|
Corporate Bonds | 22.1% | Asset-Backed Securities | 17.0% | Collateralized Loan Obligations | 16.1% | Collateralized Mortgage Obligations | 14.3% | Yankee Dollars | 11.5% | Commercial Paper | 8.7% | Repurchase Agreements | 6.8% | U.S. Government Agency Mortgages | 3.1% | OtherFootnote Reference** | 2.0% | |
| C000256540 |
|
| Shareholder Report [Line Items] |
|
| Fund Name |
Victory Pioneer Multi-Asset Ultrashort Income Fund
|
| Class Name |
Class C
|
| Trading Symbol |
MAUCX
|
| Annual or Semi-Annual Statement [Text Block] |
Annual Shareholder Report
|
| Additional Information [Text Block] |
You can find additional information about the Fund at advisor.vcm.com/literature/ mutual-fund-prospectuses. You may also request more information by calling 800-539-3863 or visiting vcm.com/contact-us.
|
| Additional Information Phone Number |
800-539-3863
|
| Additional Information Website |
vcm.com
|
| Expenses [Text Block] |
What were the Fund's costs for the last year?(based on a hypothetical $10,000 investment) Table SummaryClass Name | Costs of a $10,000 Investment | Costs paid as a percentage of a $10,000 Investment |
|---|
Class C | $90 | 0.88% |
|---|
| | |
|---|
|
| Expenses Paid, Amount |
$ 90
|
| Expense Ratio, Percent |
0.88%
|
| Factors Affecting Performance [Text Block] |
What affected the Fund’s performance during the last year?Top contributors to performance: The Fund’s exposures to collateralized loan obligations, industrials and agency mortgage-backed securities contributed to performance relative to the ICE BofA 3-Month US Treasury Bill Index (the “Index”). The Fund’s long average U.S. duration position relative to the Index of 0.1 years contributed to performance as yields moved lower in the middle part of the period. The Fund benefited from out of Index allocations to non-agency mortgage-backed securities, commercial mortgage-backed securities, and the financial sector.
Top detractors from performance: |
| Performance Past Does Not Indicate Future [Text] |
The investment return and principal value will fluctuate so that an investor's shares, when redeemed, may be worth more or less than the original cost. Past performance is not a good predictor of the Fund's future performance.
|
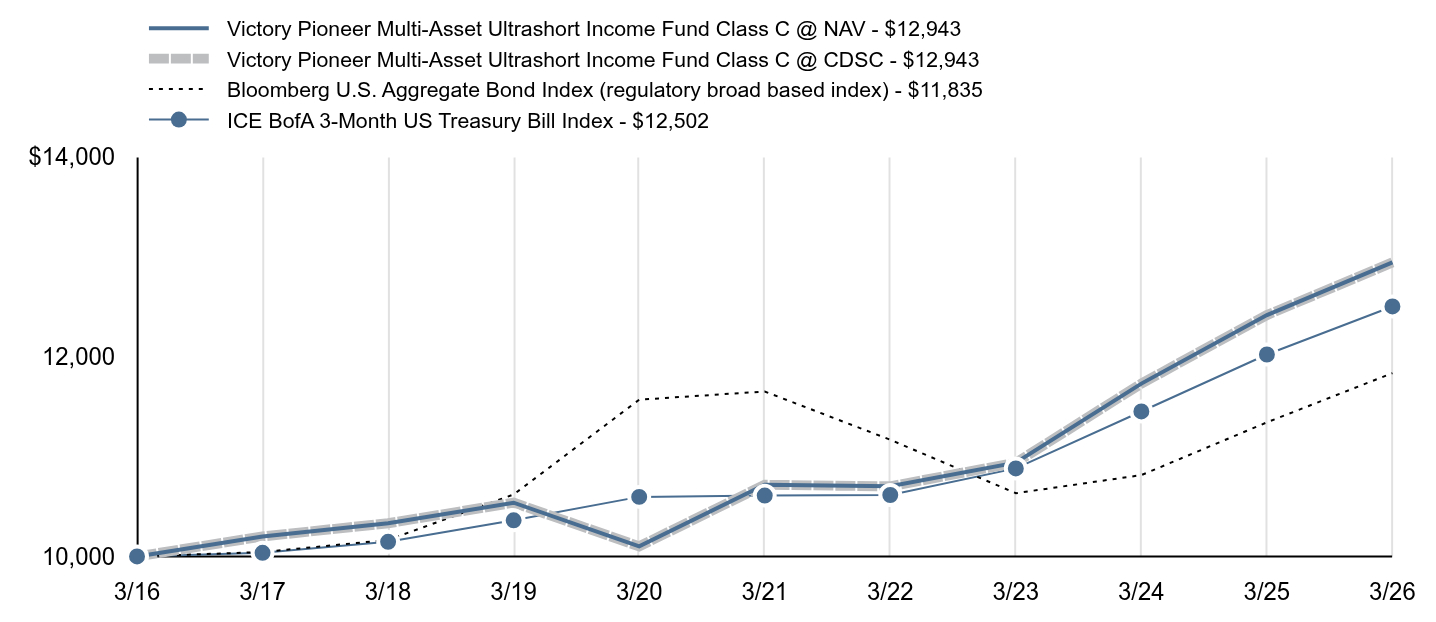
| Line Graph [Table Text Block] |
Table Summary | Victory Pioneer Multi-Asset Ultrashort Income Fund Class C @ NAV - $12,943 | Victory Pioneer Multi-Asset Ultrashort Income Fund Class C @ CDSC - $12,943 | Bloomberg U.S. Aggregate Bond Index (regulatory broad based index) - $11,835 | ICE BofA 3-Month US Treasury Bill Index - $12,502 |
|---|
3/16 | $10,000 | $10,000 | $10,000 | $10,000 |
|---|
3/17 | $10,200 | $10,200 | $10,044 | $10,036 |
|---|
3/18 | $10,332 | $10,332 | $10,165 | $10,146 |
|---|
3/19 | $10,538 | $10,538 | $10,620 | $10,362 |
|---|
3/20 | $10,101 | $10,101 | $11,569 | $10,596 |
|---|
3/21 | $10,717 | $10,717 | $11,651 | $10,609 |
|---|
3/22 | $10,702 | $10,702 | $11,168 | $10,615 |
|---|
3/23 | $10,938 | $10,938 | $10,633 | $10,881 |
|---|
3/24 | $11,730 | $11,730 | $10,814 | $11,451 |
|---|
3/25 | $12,416 | $12,416 | $11,342 | $12,021 |
|---|
3/26 | $12,943 | $12,943 | $11,835 | $12,502 |
|---|
|
| Average Annual Return [Table Text Block] |
Table Summary | 1 Year | 5 Year | 10 Year |
|---|
Class C @ NAV | 3.93% | 3.72% | 2.61% |
|---|
Class C @ CDSC | 2.94% | 3.72% | 2.61% |
|---|
Bloomberg U.S. Aggregate Bond Index | 4.35% | 0.31% | 1.70% |
|---|
ICE BofA 3-Month US Treasury Bill Index | 4.00% | 3.34% | 2.26% |
|---|
|
| No Deduction of Taxes [Text Block] |
The graph and table total returns do not reflect the deduction of taxes that a shareholder would pay on Fund distributions, or redemption of shares.
|
| Previous Investment Adviser [Text Block] |
Class C is not subject to an initial sales charge, but is subject to Contingent Deferred Sales Charge (“CDSC”) of 1.00% on shares redeemed within one year of purchase. The Net Asset Value ("NAV") figures do not reflect sales charges.
|
| AssetsNet |
$ 8,082,066,000
|
| Holdings Count | Holding |
1,175
|
| Advisory Fees Paid, Amount |
$ 22,643,000
|
| InvestmentCompanyPortfolioTurnover |
54.00%
|
| Additional Fund Statistics [Text Block] |
FUND STATISTICS($ amounts in 000s)(as of March 31, 2026)Table SummaryNet Assets | $8,082,066 |
|---|
Number of Holdings | 1,175 |
|---|
Investment Advisory Fees | $22,643 |
|---|
Portfolio Turnover | 54% |
|---|
|
| Holdings [Text Block] |
Asset AllocationFootnote Reference* ^ (% of Net Assets)(as of March 31, 2026)Table SummaryValue | Value |
|---|
Corporate Bonds | 22.1% | Asset-Backed Securities | 17.0% | Collateralized Loan Obligations | 16.1% | Collateralized Mortgage Obligations | 14.3% | Yankee Dollars | 11.5% | Commercial Paper | 8.7% | Repurchase Agreements | 6.8% | U.S. Government Agency Mortgages | 3.1% | OtherFootnote Reference** | 2.0% | |
| C000256541 |
|
| Shareholder Report [Line Items] |
|
| Fund Name |
Victory Pioneer Multi-Asset Ultrashort Income Fund
|
| Class Name |
Class R6
|
| Trading Symbol |
MAUKX
|
| Annual or Semi-Annual Statement [Text Block] |
Annual Shareholder Report
|
| Additional Information [Text Block] |
You can find additional information about the Fund at advisor.vcm.com/literature/ mutual-fund-prospectuses. You may also request more information by calling 800-539-3863 or visiting vcm.com/contact-us.
|
| Additional Information Phone Number |
800-539-3863
|
| Additional Information Website |
vcm.com
|
| Expenses [Text Block] |
What were the Fund's costs for the last year?(based on a hypothetical $10,000 investment) Table SummaryClass Name | Costs of a $10,000 Investment | Costs paid as a percentage of a $10,000 Investment |
|---|
Class R6 | $36 | 0.35% |
|---|
| | |
|---|
|
| Expenses Paid, Amount |
$ 36
|
| Expense Ratio, Percent |
0.35%
|
| Factors Affecting Performance [Text Block] |
What affected the Fund’s performance during the last year?Top contributors to performance: The Fund’s exposures to collateralized loan obligations, industrials and agency mortgage-backed securities contributed to performance relative to the ICE BofA 3-Month US Treasury Bill Index (the “Index”). The Fund’s long average U.S. duration position relative to the Index of 0.1 years contributed to performance as yields moved lower in the middle part of the period. The Fund benefited from out of Index allocations to non-agency mortgage-backed securities, commercial mortgage-backed securities, and the financial sector.
Top detractors from performance: |
| Performance Past Does Not Indicate Future [Text] |
The investment return and principal value will fluctuate so that an investor's shares, when redeemed, may be worth more or less than the original cost. Past performance is not a good predictor of the Fund's future performance.
|
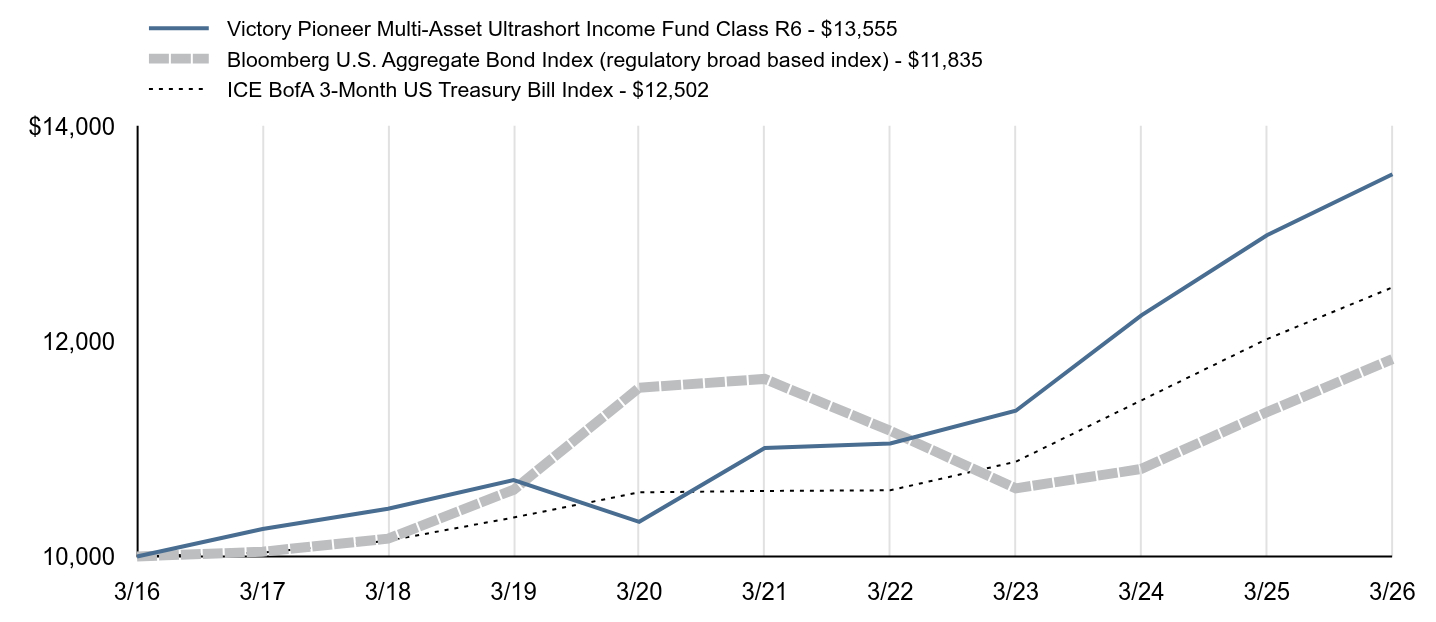
| Line Graph [Table Text Block] |
Table Summary | Victory Pioneer Multi-Asset Ultrashort Income Fund Class R6 - $13,555 | Bloomberg U.S. Aggregate Bond Index (regulatory broad based index) - $11,835 | ICE BofA 3-Month US Treasury Bill Index - $12,502 |
|---|
3/16 | $10,000 | $10,000 | $10,000 |
|---|
3/17 | $10,255 | $10,044 | $10,036 |
|---|
3/18 | $10,444 | $10,165 | $10,146 |
|---|
3/19 | $10,710 | $10,620 | $10,362 |
|---|
3/20 | $10,322 | $11,569 | $10,596 |
|---|
3/21 | $11,008 | $11,651 | $10,609 |
|---|
3/22 | $11,051 | $11,168 | $10,615 |
|---|
3/23 | $11,355 | $10,633 | $10,881 |
|---|
3/24 | $12,242 | $10,814 | $11,451 |
|---|
3/25 | $12,987 | $11,342 | $12,021 |
|---|
3/26 | $13,555 | $11,835 | $12,502 |
|---|
|
| Average Annual Return [Table Text Block] |
Table Summary | 1 Year | 5 Year | 10 Year |
|---|
Class R6 | 4.38% | 4.25% | 3.09% |
|---|
Bloomberg U.S. Aggregate Bond Index | 4.35% | 0.31% | 1.70% |
|---|
ICE BofA 3-Month US Treasury Bill Index | 4.00% | 3.34% | 2.26% |
|---|
|
| No Deduction of Taxes [Text Block] |
The graph and table total returns do not reflect the deduction of taxes that a shareholder would pay on Fund distributions, or redemption of shares.
|
| AssetsNet |
$ 8,082,066,000
|
| Holdings Count | Holding |
1,175
|
| Advisory Fees Paid, Amount |
$ 22,643,000
|
| InvestmentCompanyPortfolioTurnover |
54.00%
|
| Additional Fund Statistics [Text Block] |
FUND STATISTICS($ amounts in 000s)(as of March 31, 2026)Table SummaryNet Assets | $8,082,066 |
|---|
Number of Holdings | 1,175 |
|---|
Investment Advisory Fees | $22,643 |
|---|
Portfolio Turnover | 54% |
|---|
|
| Holdings [Text Block] |
Asset AllocationFootnote Reference* ^ (% of Net Assets)(as of March 31, 2026)Table SummaryValue | Value |
|---|
Corporate Bonds | 22.1% | Asset-Backed Securities | 17.0% | Collateralized Loan Obligations | 16.1% | Collateralized Mortgage Obligations | 14.3% | Yankee Dollars | 11.5% | Commercial Paper | 8.7% | Repurchase Agreements | 6.8% | U.S. Government Agency Mortgages | 3.1% | OtherFootnote Reference** | 2.0% | |
| C000256538 |
|
| Shareholder Report [Line Items] |
|
| Fund Name |
Victory Pioneer Multi-Asset Ultrashort Income Fund
|
| Class Name |
Class Y
|
| Trading Symbol |
MYFRX
|
| Annual or Semi-Annual Statement [Text Block] |
Annual Shareholder Report
|
| Additional Information [Text Block] |
You can find additional information about the Fund at advisor.vcm.com/literature/ mutual-fund-prospectuses. You may also request more information by calling 800-539-3863 or visiting vcm.com/contact-us.
|
| Additional Information Phone Number |
800-539-3863
|
| Additional Information Website |
vcm.com
|
| Expenses [Text Block] |
What were the Fund's costs for the last year?(based on a hypothetical $10,000 investment) Table SummaryClass Name | Costs of a $10,000 Investment | Costs paid as a percentage of a $10,000 Investment |
|---|
Class Y | $45 | 0.44% |
|---|
| | |
|---|
|
| Expenses Paid, Amount |
$ 45
|
| Expense Ratio, Percent |
0.44%
|
| Factors Affecting Performance [Text Block] |
What affected the Fund’s performance during the last year?Top contributors to performance: The Fund’s exposures to collateralized loan obligations, industrials and agency mortgage-backed securities contributed to performance relative to the ICE BofA 3-Month US Treasury Bill Index (the “Index”). The Fund’s long average U.S. duration position relative to the Index of 0.1 years contributed to performance as yields moved lower in the middle part of the period. The Fund benefited from out of Index allocations to non-agency mortgage-backed securities, commercial mortgage-backed securities, and the financial sector.
Top detractors from performance: |
| Performance Past Does Not Indicate Future [Text] |
The investment return and principal value will fluctuate so that an investor's shares, when redeemed, may be worth more or less than the original cost. Past performance is not a good predictor of the Fund's future performance.
|
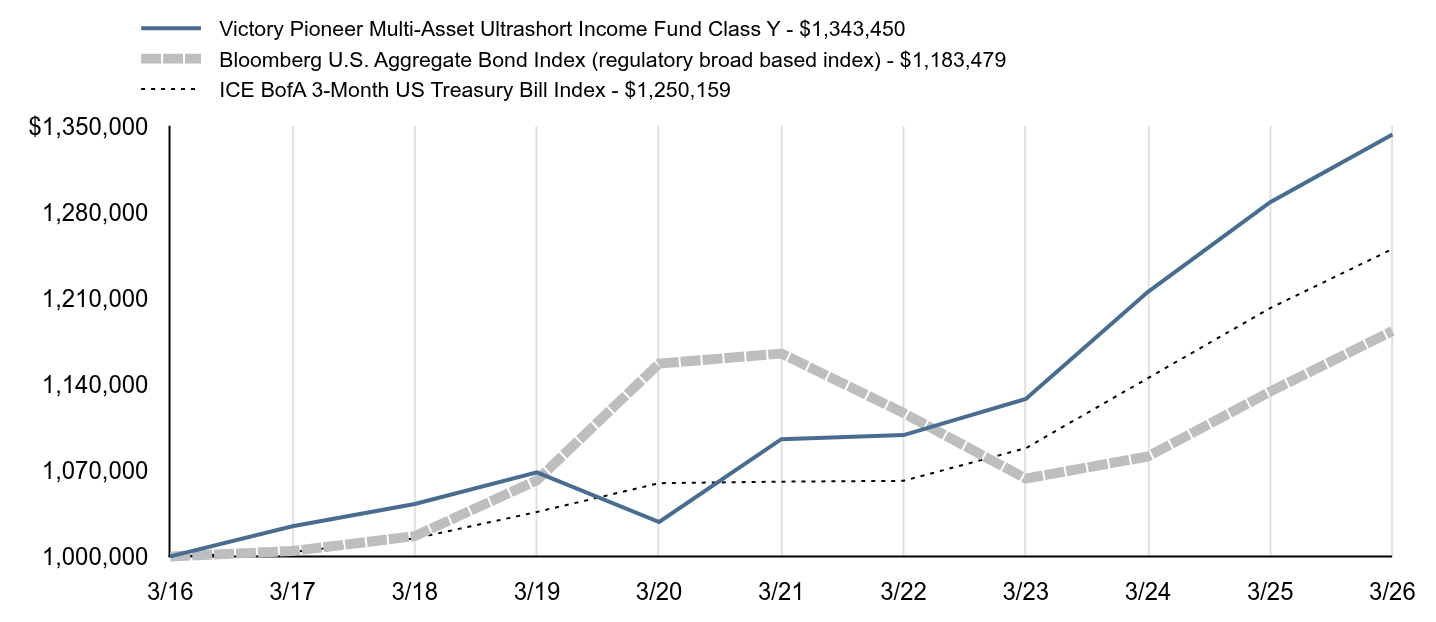
| Line Graph [Table Text Block] |
Table Summary | Victory Pioneer Multi-Asset Ultrashort Income Fund Class Y - $1,343,450 | Bloomberg U.S. Aggregate Bond Index (regulatory broad based index) - $1,183,479 | ICE BofA 3-Month US Treasury Bill Index - $1,250,159 |
|---|
3/16 | $1,000,000 | $1,000,000 | $1,000,000 |
|---|
3/17 | $1,024,544 | $1,004,406 | $1,003,570 |
|---|
3/18 | $1,042,665 | $1,016,489 | $1,014,649 |
|---|
3/19 | $1,068,461 | $1,062,033 | $1,036,166 |
|---|
3/20 | $1,028,009 | $1,156,913 | $1,059,616 |
|---|
3/21 | $1,095,410 | $1,165,130 | $1,060,857 |
|---|
3/22 | $1,098,751 | $1,116,752 | $1,061,528 |
|---|
3/23 | $1,128,148 | $1,063,334 | $1,088,113 |
|---|
3/24 | $1,215,293 | $1,081,390 | $1,145,147 |
|---|
3/25 | $1,288,250 | $1,134,159 | $1,202,095 |
|---|
3/26 | $1,343,450 | $1,183,479 | $1,250,159 |
|---|
|
| Average Annual Return [Table Text Block] |
Table Summary | 1 Year | 5 Year | 10 Year |
|---|
Class Y | 4.28% | 4.17% | 3.00% |
|---|
Bloomberg U.S. Aggregate Bond Index | 4.35% | 0.31% | 1.70% |
|---|
ICE BofA 3-Month US Treasury Bill Index | 4.00% | 3.34% | 2.26% |
|---|
|
| No Deduction of Taxes [Text Block] |
The graph and table total returns do not reflect the deduction of taxes that a shareholder would pay on Fund distributions, or redemption of shares.
|
| AssetsNet |
$ 8,082,066,000
|
| Holdings Count | Holding |
1,175
|
| Advisory Fees Paid, Amount |
$ 22,643,000
|
| InvestmentCompanyPortfolioTurnover |
54.00%
|
| Additional Fund Statistics [Text Block] |
FUND STATISTICS($ amounts in 000s)(as of March 31, 2026)Table SummaryNet Assets | $8,082,066 |
|---|
Number of Holdings | 1,175 |
|---|
Investment Advisory Fees | $22,643 |
|---|
Portfolio Turnover | 54% |
|---|
|
| Holdings [Text Block] |
Asset AllocationFootnote Reference* ^ (% of Net Assets)(as of March 31, 2026)Table SummaryValue | Value |
|---|
Corporate Bonds | 22.1% | Asset-Backed Securities | 17.0% | Collateralized Loan Obligations | 16.1% | Collateralized Mortgage Obligations | 14.3% | Yankee Dollars | 11.5% | Commercial Paper | 8.7% | Repurchase Agreements | 6.8% | U.S. Government Agency Mortgages | 3.1% | OtherFootnote Reference** | 2.0% | |