false
N-1A
0001742912
0001742912
2025-03-01
2026-02-28
0001742912
sofi:C000263366Member
2025-03-01
2026-02-28
0001742912
sofi:C000246517Member
2025-03-01
2026-02-28
0001742912
sofi:C000210797Member
2025-03-01
2026-02-28
0001742912
sofi:C000210799Member
2025-03-01
2026-02-28
0001742912
sofi:C000263366Member
2025-09-02
2025-09-02
0001742912
sofi:SAndP500TotalReturnIndexMember
2025-09-02
2025-09-02
0001742912
sofi:BITAUSAgenticAISelectIndexMember
2025-09-02
2025-09-02
0001742912
sofi:C000263366Member
2025-09-02
2025-09-30
0001742912
sofi:SAndP500TotalReturnIndexMember
2025-09-02
2025-09-30
0001742912
sofi:BITAUSAgenticAISelectIndexMember
2025-09-02
2025-09-30
0001742912
sofi:C000263366Member
2025-09-02
2025-10-31
0001742912
sofi:SAndP500TotalReturnIndexMember
2025-09-02
2025-10-31
0001742912
sofi:BITAUSAgenticAISelectIndexMember
2025-09-02
2025-10-31
0001742912
sofi:C000263366Member
2025-09-02
2025-11-30
0001742912
sofi:SAndP500TotalReturnIndexMember
2025-09-02
2025-11-30
0001742912
sofi:BITAUSAgenticAISelectIndexMember
2025-09-02
2025-11-30
0001742912
sofi:C000263366Member
2025-09-02
2025-12-31
0001742912
sofi:SAndP500TotalReturnIndexMember
2025-09-02
2025-12-31
0001742912
sofi:BITAUSAgenticAISelectIndexMember
2025-09-02
2025-12-31
0001742912
sofi:C000263366Member
2025-09-02
2026-01-31
0001742912
sofi:SAndP500TotalReturnIndexMember
2025-09-02
2026-01-31
0001742912
sofi:BITAUSAgenticAISelectIndexMember
2025-09-02
2026-01-31
0001742912
sofi:C000263366Member
2025-09-02
2026-02-28
0001742912
sofi:SAndP500TotalReturnIndexMember
2025-09-02
2026-02-28
0001742912
sofi:BITAUSAgenticAISelectIndexMember
2025-09-02
2026-02-28
0001742912
sofi:C000246517Member
2023-11-14
2026-02-28
0001742912
sofi:BloombergUSAggregateBondIndexMember
2025-03-01
2026-02-28
0001742912
sofi:BloombergUSAggregateBondIndexMember
2023-11-14
2026-02-28
0001742912
sofi:C000210797Member
2019-04-10
2019-04-10
0001742912
sofi:SAndP500TotalReturnIndexMember
2019-04-10
2019-04-10
0001742912
sofi:SolactiveSoFiUS500GrowthIndexMember
2019-04-10
2019-04-10
0001742912
sofi:C000210797Member
2019-04-10
2019-04-30
0001742912
sofi:SAndP500TotalReturnIndexMember
2019-04-10
2019-04-30
0001742912
sofi:SolactiveSoFiUS500GrowthIndexMember
2019-04-10
2019-04-30
0001742912
sofi:C000210797Member
2019-04-10
2019-05-31
0001742912
sofi:SAndP500TotalReturnIndexMember
2019-04-10
2019-05-31
0001742912
sofi:SolactiveSoFiUS500GrowthIndexMember
2019-04-10
2019-05-31
0001742912
sofi:C000210797Member
2019-04-10
2019-06-30
0001742912
sofi:SAndP500TotalReturnIndexMember
2019-04-10
2019-06-30
0001742912
sofi:SolactiveSoFiUS500GrowthIndexMember
2019-04-10
2019-06-30
0001742912
sofi:C000210797Member
2019-04-10
2019-07-31
0001742912
sofi:SAndP500TotalReturnIndexMember
2019-04-10
2019-07-31
0001742912
sofi:SolactiveSoFiUS500GrowthIndexMember
2019-04-10
2019-07-31
0001742912
sofi:C000210797Member
2019-04-10
2019-08-31
0001742912
sofi:SAndP500TotalReturnIndexMember
2019-04-10
2019-08-31
0001742912
sofi:SolactiveSoFiUS500GrowthIndexMember
2019-04-10
2019-08-31
0001742912
sofi:C000210797Member
2019-04-10
2019-09-30
0001742912
sofi:SAndP500TotalReturnIndexMember
2019-04-10
2019-09-30
0001742912
sofi:SolactiveSoFiUS500GrowthIndexMember
2019-04-10
2019-09-30
0001742912
sofi:C000210797Member
2019-04-10
2019-10-31
0001742912
sofi:SAndP500TotalReturnIndexMember
2019-04-10
2019-10-31
0001742912
sofi:SolactiveSoFiUS500GrowthIndexMember
2019-04-10
2019-10-31
0001742912
sofi:C000210797Member
2019-04-10
2019-11-30
0001742912
sofi:SAndP500TotalReturnIndexMember
2019-04-10
2019-11-30
0001742912
sofi:SolactiveSoFiUS500GrowthIndexMember
2019-04-10
2019-11-30
0001742912
sofi:C000210797Member
2019-04-10
2019-12-31
0001742912
sofi:SAndP500TotalReturnIndexMember
2019-04-10
2019-12-31
0001742912
sofi:SolactiveSoFiUS500GrowthIndexMember
2019-04-10
2019-12-31
0001742912
sofi:C000210797Member
2019-04-10
2020-01-31
0001742912
sofi:SAndP500TotalReturnIndexMember
2019-04-10
2020-01-31
0001742912
sofi:SolactiveSoFiUS500GrowthIndexMember
2019-04-10
2020-01-31
0001742912
sofi:C000210797Member
2019-04-10
2020-02-29
0001742912
sofi:SAndP500TotalReturnIndexMember
2019-04-10
2020-02-29
0001742912
sofi:SolactiveSoFiUS500GrowthIndexMember
2019-04-10
2020-02-29
0001742912
sofi:C000210797Member
2019-04-10
2020-03-31
0001742912
sofi:SAndP500TotalReturnIndexMember
2019-04-10
2020-03-31
0001742912
sofi:SolactiveSoFiUS500GrowthIndexMember
2019-04-10
2020-03-31
0001742912
sofi:C000210797Member
2019-04-10
2020-04-30
0001742912
sofi:SAndP500TotalReturnIndexMember
2019-04-10
2020-04-30
0001742912
sofi:SolactiveSoFiUS500GrowthIndexMember
2019-04-10
2020-04-30
0001742912
sofi:C000210797Member
2019-04-10
2020-05-31
0001742912
sofi:SAndP500TotalReturnIndexMember
2019-04-10
2020-05-31
0001742912
sofi:SolactiveSoFiUS500GrowthIndexMember
2019-04-10
2020-05-31
0001742912
sofi:C000210797Member
2019-04-10
2020-06-30
0001742912
sofi:SAndP500TotalReturnIndexMember
2019-04-10
2020-06-30
0001742912
sofi:SolactiveSoFiUS500GrowthIndexMember
2019-04-10
2020-06-30
0001742912
sofi:C000210797Member
2019-04-10
2020-07-31
0001742912
sofi:SAndP500TotalReturnIndexMember
2019-04-10
2020-07-31
0001742912
sofi:SolactiveSoFiUS500GrowthIndexMember
2019-04-10
2020-07-31
0001742912
sofi:C000210797Member
2019-04-10
2020-08-31
0001742912
sofi:SAndP500TotalReturnIndexMember
2019-04-10
2020-08-31
0001742912
sofi:SolactiveSoFiUS500GrowthIndexMember
2019-04-10
2020-08-31
0001742912
sofi:C000210797Member
2019-04-10
2020-09-30
0001742912
sofi:SAndP500TotalReturnIndexMember
2019-04-10
2020-09-30
0001742912
sofi:SolactiveSoFiUS500GrowthIndexMember
2019-04-10
2020-09-30
0001742912
sofi:C000210797Member
2019-04-10
2020-10-31
0001742912
sofi:SAndP500TotalReturnIndexMember
2019-04-10
2020-10-31
0001742912
sofi:SolactiveSoFiUS500GrowthIndexMember
2019-04-10
2020-10-31
0001742912
sofi:C000210797Member
2019-04-10
2020-11-30
0001742912
sofi:SAndP500TotalReturnIndexMember
2019-04-10
2020-11-30
0001742912
sofi:SolactiveSoFiUS500GrowthIndexMember
2019-04-10
2020-11-30
0001742912
sofi:C000210797Member
2019-04-10
2020-12-31
0001742912
sofi:SAndP500TotalReturnIndexMember
2019-04-10
2020-12-31
0001742912
sofi:SolactiveSoFiUS500GrowthIndexMember
2019-04-10
2020-12-31
0001742912
sofi:C000210797Member
2019-04-10
2021-01-31
0001742912
sofi:SAndP500TotalReturnIndexMember
2019-04-10
2021-01-31
0001742912
sofi:SolactiveSoFiUS500GrowthIndexMember
2019-04-10
2021-01-31
0001742912
sofi:C000210797Member
2019-04-10
2021-02-28
0001742912
sofi:SAndP500TotalReturnIndexMember
2019-04-10
2021-02-28
0001742912
sofi:SolactiveSoFiUS500GrowthIndexMember
2019-04-10
2021-02-28
0001742912
sofi:C000210797Member
2019-04-10
2021-03-31
0001742912
sofi:SAndP500TotalReturnIndexMember
2019-04-10
2021-03-31
0001742912
sofi:SolactiveSoFiUS500GrowthIndexMember
2019-04-10
2021-03-31
0001742912
sofi:C000210797Member
2019-04-10
2021-04-30
0001742912
sofi:SAndP500TotalReturnIndexMember
2019-04-10
2021-04-30
0001742912
sofi:SolactiveSoFiUS500GrowthIndexMember
2019-04-10
2021-04-30
0001742912
sofi:C000210797Member
2019-04-10
2021-05-31
0001742912
sofi:SAndP500TotalReturnIndexMember
2019-04-10
2021-05-31
0001742912
sofi:SolactiveSoFiUS500GrowthIndexMember
2019-04-10
2021-05-31
0001742912
sofi:C000210797Member
2019-04-10
2021-06-30
0001742912
sofi:SAndP500TotalReturnIndexMember
2019-04-10
2021-06-30
0001742912
sofi:SolactiveSoFiUS500GrowthIndexMember
2019-04-10
2021-06-30
0001742912
sofi:C000210797Member
2019-04-10
2021-07-31
0001742912
sofi:SAndP500TotalReturnIndexMember
2019-04-10
2021-07-31
0001742912
sofi:SolactiveSoFiUS500GrowthIndexMember
2019-04-10
2021-07-31
0001742912
sofi:C000210797Member
2019-04-10
2021-08-31
0001742912
sofi:SAndP500TotalReturnIndexMember
2019-04-10
2021-08-31
0001742912
sofi:SolactiveSoFiUS500GrowthIndexMember
2019-04-10
2021-08-31
0001742912
sofi:C000210797Member
2019-04-10
2021-09-30
0001742912
sofi:SAndP500TotalReturnIndexMember
2019-04-10
2021-09-30
0001742912
sofi:SolactiveSoFiUS500GrowthIndexMember
2019-04-10
2021-09-30
0001742912
sofi:C000210797Member
2019-04-10
2021-10-31
0001742912
sofi:SAndP500TotalReturnIndexMember
2019-04-10
2021-10-31
0001742912
sofi:SolactiveSoFiUS500GrowthIndexMember
2019-04-10
2021-10-31
0001742912
sofi:C000210797Member
2019-04-10
2021-11-30
0001742912
sofi:SAndP500TotalReturnIndexMember
2019-04-10
2021-11-30
0001742912
sofi:SolactiveSoFiUS500GrowthIndexMember
2019-04-10
2021-11-30
0001742912
sofi:C000210797Member
2019-04-10
2021-12-31
0001742912
sofi:SAndP500TotalReturnIndexMember
2019-04-10
2021-12-31
0001742912
sofi:SolactiveSoFiUS500GrowthIndexMember
2019-04-10
2021-12-31
0001742912
sofi:C000210797Member
2019-04-10
2022-01-31
0001742912
sofi:SAndP500TotalReturnIndexMember
2019-04-10
2022-01-31
0001742912
sofi:SolactiveSoFiUS500GrowthIndexMember
2019-04-10
2022-01-31
0001742912
sofi:C000210797Member
2019-04-10
2022-02-28
0001742912
sofi:SAndP500TotalReturnIndexMember
2019-04-10
2022-02-28
0001742912
sofi:SolactiveSoFiUS500GrowthIndexMember
2019-04-10
2022-02-28
0001742912
sofi:C000210797Member
2019-04-10
2022-03-31
0001742912
sofi:SAndP500TotalReturnIndexMember
2019-04-10
2022-03-31
0001742912
sofi:SolactiveSoFiUS500GrowthIndexMember
2019-04-10
2022-03-31
0001742912
sofi:C000210797Member
2019-04-10
2022-04-30
0001742912
sofi:SAndP500TotalReturnIndexMember
2019-04-10
2022-04-30
0001742912
sofi:SolactiveSoFiUS500GrowthIndexMember
2019-04-10
2022-04-30
0001742912
sofi:C000210797Member
2019-04-10
2022-05-31
0001742912
sofi:SAndP500TotalReturnIndexMember
2019-04-10
2022-05-31
0001742912
sofi:SolactiveSoFiUS500GrowthIndexMember
2019-04-10
2022-05-31
0001742912
sofi:C000210797Member
2019-04-10
2022-06-30
0001742912
sofi:SAndP500TotalReturnIndexMember
2019-04-10
2022-06-30
0001742912
sofi:SolactiveSoFiUS500GrowthIndexMember
2019-04-10
2022-06-30
0001742912
sofi:C000210797Member
2019-04-10
2022-07-31
0001742912
sofi:SAndP500TotalReturnIndexMember
2019-04-10
2022-07-31
0001742912
sofi:SolactiveSoFiUS500GrowthIndexMember
2019-04-10
2022-07-31
0001742912
sofi:C000210797Member
2019-04-10
2022-08-31
0001742912
sofi:SAndP500TotalReturnIndexMember
2019-04-10
2022-08-31
0001742912
sofi:SolactiveSoFiUS500GrowthIndexMember
2019-04-10
2022-08-31
0001742912
sofi:C000210797Member
2019-04-10
2022-09-30
0001742912
sofi:SAndP500TotalReturnIndexMember
2019-04-10
2022-09-30
0001742912
sofi:SolactiveSoFiUS500GrowthIndexMember
2019-04-10
2022-09-30
0001742912
sofi:C000210797Member
2019-04-10
2022-10-31
0001742912
sofi:SAndP500TotalReturnIndexMember
2019-04-10
2022-10-31
0001742912
sofi:SolactiveSoFiUS500GrowthIndexMember
2019-04-10
2022-10-31
0001742912
sofi:C000210797Member
2019-04-10
2022-11-30
0001742912
sofi:SAndP500TotalReturnIndexMember
2019-04-10
2022-11-30
0001742912
sofi:SolactiveSoFiUS500GrowthIndexMember
2019-04-10
2022-11-30
0001742912
sofi:C000210797Member
2019-04-10
2022-12-31
0001742912
sofi:SAndP500TotalReturnIndexMember
2019-04-10
2022-12-31
0001742912
sofi:SolactiveSoFiUS500GrowthIndexMember
2019-04-10
2022-12-31
0001742912
sofi:C000210797Member
2019-04-10
2023-01-31
0001742912
sofi:SAndP500TotalReturnIndexMember
2019-04-10
2023-01-31
0001742912
sofi:SolactiveSoFiUS500GrowthIndexMember
2019-04-10
2023-01-31
0001742912
sofi:C000210797Member
2019-04-10
2023-02-28
0001742912
sofi:SAndP500TotalReturnIndexMember
2019-04-10
2023-02-28
0001742912
sofi:SolactiveSoFiUS500GrowthIndexMember
2019-04-10
2023-02-28
0001742912
sofi:C000210797Member
2019-04-10
2023-03-31
0001742912
sofi:SAndP500TotalReturnIndexMember
2019-04-10
2023-03-31
0001742912
sofi:SolactiveSoFiUS500GrowthIndexMember
2019-04-10
2023-03-31
0001742912
sofi:C000210797Member
2019-04-10
2023-04-30
0001742912
sofi:SAndP500TotalReturnIndexMember
2019-04-10
2023-04-30
0001742912
sofi:SolactiveSoFiUS500GrowthIndexMember
2019-04-10
2023-04-30
0001742912
sofi:C000210797Member
2019-04-10
2023-05-31
0001742912
sofi:SAndP500TotalReturnIndexMember
2019-04-10
2023-05-31
0001742912
sofi:SolactiveSoFiUS500GrowthIndexMember
2019-04-10
2023-05-31
0001742912
sofi:C000210797Member
2019-04-10
2023-06-30
0001742912
sofi:SAndP500TotalReturnIndexMember
2019-04-10
2023-06-30
0001742912
sofi:SolactiveSoFiUS500GrowthIndexMember
2019-04-10
2023-06-30
0001742912
sofi:C000210797Member
2019-04-10
2023-07-31
0001742912
sofi:SAndP500TotalReturnIndexMember
2019-04-10
2023-07-31
0001742912
sofi:SolactiveSoFiUS500GrowthIndexMember
2019-04-10
2023-07-31
0001742912
sofi:C000210797Member
2019-04-10
2023-08-31
0001742912
sofi:SAndP500TotalReturnIndexMember
2019-04-10
2023-08-31
0001742912
sofi:SolactiveSoFiUS500GrowthIndexMember
2019-04-10
2023-08-31
0001742912
sofi:C000210797Member
2019-04-10
2023-09-30
0001742912
sofi:SAndP500TotalReturnIndexMember
2019-04-10
2023-09-30
0001742912
sofi:SolactiveSoFiUS500GrowthIndexMember
2019-04-10
2023-09-30
0001742912
sofi:C000210797Member
2019-04-10
2023-10-31
0001742912
sofi:SAndP500TotalReturnIndexMember
2019-04-10
2023-10-31
0001742912
sofi:SolactiveSoFiUS500GrowthIndexMember
2019-04-10
2023-10-31
0001742912
sofi:C000210797Member
2019-04-10
2023-11-30
0001742912
sofi:SAndP500TotalReturnIndexMember
2019-04-10
2023-11-30
0001742912
sofi:SolactiveSoFiUS500GrowthIndexMember
2019-04-10
2023-11-30
0001742912
sofi:C000210797Member
2019-04-10
2023-12-31
0001742912
sofi:SAndP500TotalReturnIndexMember
2019-04-10
2023-12-31
0001742912
sofi:SolactiveSoFiUS500GrowthIndexMember
2019-04-10
2023-12-31
0001742912
sofi:C000210797Member
2019-04-10
2024-01-31
0001742912
sofi:SAndP500TotalReturnIndexMember
2019-04-10
2024-01-31
0001742912
sofi:SolactiveSoFiUS500GrowthIndexMember
2019-04-10
2024-01-31
0001742912
sofi:C000210797Member
2019-04-10
2024-02-29
0001742912
sofi:SAndP500TotalReturnIndexMember
2019-04-10
2024-02-29
0001742912
sofi:SolactiveSoFiUS500GrowthIndexMember
2019-04-10
2024-02-29
0001742912
sofi:C000210797Member
2019-04-10
2024-03-31
0001742912
sofi:SAndP500TotalReturnIndexMember
2019-04-10
2024-03-31
0001742912
sofi:SolactiveSoFiUS500GrowthIndexMember
2019-04-10
2024-03-31
0001742912
sofi:C000210797Member
2019-04-10
2024-04-30
0001742912
sofi:SAndP500TotalReturnIndexMember
2019-04-10
2024-04-30
0001742912
sofi:SolactiveSoFiUS500GrowthIndexMember
2019-04-10
2024-04-30
0001742912
sofi:C000210797Member
2019-04-10
2024-05-31
0001742912
sofi:SAndP500TotalReturnIndexMember
2019-04-10
2024-05-31
0001742912
sofi:SolactiveSoFiUS500GrowthIndexMember
2019-04-10
2024-05-31
0001742912
sofi:C000210797Member
2019-04-10
2024-06-30
0001742912
sofi:SAndP500TotalReturnIndexMember
2019-04-10
2024-06-30
0001742912
sofi:SolactiveSoFiUS500GrowthIndexMember
2019-04-10
2024-06-30
0001742912
sofi:C000210797Member
2019-04-10
2024-07-31
0001742912
sofi:SAndP500TotalReturnIndexMember
2019-04-10
2024-07-31
0001742912
sofi:SolactiveSoFiUS500GrowthIndexMember
2019-04-10
2024-07-31
0001742912
sofi:C000210797Member
2019-04-10
2024-08-31
0001742912
sofi:SAndP500TotalReturnIndexMember
2019-04-10
2024-08-31
0001742912
sofi:SolactiveSoFiUS500GrowthIndexMember
2019-04-10
2024-08-31
0001742912
sofi:C000210797Member
2019-04-10
2024-09-30
0001742912
sofi:SAndP500TotalReturnIndexMember
2019-04-10
2024-09-30
0001742912
sofi:SolactiveSoFiUS500GrowthIndexMember
2019-04-10
2024-09-30
0001742912
sofi:C000210797Member
2019-04-10
2024-10-31
0001742912
sofi:SAndP500TotalReturnIndexMember
2019-04-10
2024-10-31
0001742912
sofi:SolactiveSoFiUS500GrowthIndexMember
2019-04-10
2024-10-31
0001742912
sofi:C000210797Member
2019-04-10
2024-11-30
0001742912
sofi:SAndP500TotalReturnIndexMember
2019-04-10
2024-11-30
0001742912
sofi:SolactiveSoFiUS500GrowthIndexMember
2019-04-10
2024-11-30
0001742912
sofi:C000210797Member
2019-04-10
2024-12-31
0001742912
sofi:SAndP500TotalReturnIndexMember
2019-04-10
2024-12-31
0001742912
sofi:SolactiveSoFiUS500GrowthIndexMember
2019-04-10
2024-12-31
0001742912
sofi:C000210797Member
2019-04-10
2025-01-31
0001742912
sofi:SAndP500TotalReturnIndexMember
2019-04-10
2025-01-31
0001742912
sofi:SolactiveSoFiUS500GrowthIndexMember
2019-04-10
2025-01-31
0001742912
sofi:C000210797Member
2019-04-10
2025-02-28
0001742912
sofi:SAndP500TotalReturnIndexMember
2019-04-10
2025-02-28
0001742912
sofi:SolactiveSoFiUS500GrowthIndexMember
2019-04-10
2025-02-28
0001742912
sofi:C000210797Member
2019-04-10
2025-03-31
0001742912
sofi:SAndP500TotalReturnIndexMember
2019-04-10
2025-03-31
0001742912
sofi:SolactiveSoFiUS500GrowthIndexMember
2019-04-10
2025-03-31
0001742912
sofi:C000210797Member
2019-04-10
2025-04-30
0001742912
sofi:SAndP500TotalReturnIndexMember
2019-04-10
2025-04-30
0001742912
sofi:SolactiveSoFiUS500GrowthIndexMember
2019-04-10
2025-04-30
0001742912
sofi:C000210797Member
2019-04-10
2025-05-31
0001742912
sofi:SAndP500TotalReturnIndexMember
2019-04-10
2025-05-31
0001742912
sofi:SolactiveSoFiUS500GrowthIndexMember
2019-04-10
2025-05-31
0001742912
sofi:C000210797Member
2019-04-10
2025-06-30
0001742912
sofi:SAndP500TotalReturnIndexMember
2019-04-10
2025-06-30
0001742912
sofi:SolactiveSoFiUS500GrowthIndexMember
2019-04-10
2025-06-30
0001742912
sofi:C000210797Member
2019-04-10
2025-07-31
0001742912
sofi:SAndP500TotalReturnIndexMember
2019-04-10
2025-07-31
0001742912
sofi:SolactiveSoFiUS500GrowthIndexMember
2019-04-10
2025-07-31
0001742912
sofi:C000210797Member
2019-04-10
2025-08-31
0001742912
sofi:SAndP500TotalReturnIndexMember
2019-04-10
2025-08-31
0001742912
sofi:SolactiveSoFiUS500GrowthIndexMember
2019-04-10
2025-08-31
0001742912
sofi:C000210797Member
2019-04-10
2025-09-30
0001742912
sofi:SAndP500TotalReturnIndexMember
2019-04-10
2025-09-30
0001742912
sofi:SolactiveSoFiUS500GrowthIndexMember
2019-04-10
2025-09-30
0001742912
sofi:C000210797Member
2019-04-10
2025-10-31
0001742912
sofi:SAndP500TotalReturnIndexMember
2019-04-10
2025-10-31
0001742912
sofi:SolactiveSoFiUS500GrowthIndexMember
2019-04-10
2025-10-31
0001742912
sofi:C000210797Member
2019-04-10
2025-11-30
0001742912
sofi:SAndP500TotalReturnIndexMember
2019-04-10
2025-11-30
0001742912
sofi:SolactiveSoFiUS500GrowthIndexMember
2019-04-10
2025-11-30
0001742912
sofi:C000210797Member
2019-04-10
2025-12-31
0001742912
sofi:SAndP500TotalReturnIndexMember
2019-04-10
2025-12-31
0001742912
sofi:SolactiveSoFiUS500GrowthIndexMember
2019-04-10
2025-12-31
0001742912
sofi:C000210797Member
2019-04-10
2026-01-31
0001742912
sofi:SAndP500TotalReturnIndexMember
2019-04-10
2026-01-31
0001742912
sofi:SolactiveSoFiUS500GrowthIndexMember
2019-04-10
2026-01-31
0001742912
sofi:C000210797Member
2019-04-10
2026-02-28
0001742912
sofi:SAndP500TotalReturnIndexMember
2019-04-10
2026-02-28
0001742912
sofi:SolactiveSoFiUS500GrowthIndexMember
2019-04-10
2026-02-28
0001742912
sofi:C000210797Member
2021-03-01
2026-02-28
0001742912
sofi:SAndP500TotalReturnIndexMember
2025-03-01
2026-02-28
0001742912
sofi:SAndP500TotalReturnIndexMember
2021-03-01
2026-02-28
0001742912
sofi:SolactiveSoFiUS500GrowthIndexMember
2025-03-01
2026-02-28
0001742912
sofi:SolactiveSoFiUS500GrowthIndexMember
2021-03-01
2026-02-28
0001742912
sofi:C000210799Member
2021-03-01
2026-02-28
0001742912
sofi:C000210799Member
2019-05-07
2026-02-28
0001742912
sofi:SAndP500TotalReturnIndexMember
2019-05-07
2026-02-28
0001742912
sofi:SoFiSocial50IndexMember
2025-03-01
2026-02-28
0001742912
sofi:SoFiSocial50IndexMember
2021-03-01
2026-02-28
0001742912
sofi:SoFiSocial50IndexMember
2019-05-07
2026-02-28
0001742912
sofi:C000263366Member
2026-02-28
0001742912
sofi:C000246517Member
2026-02-28
0001742912
sofi:C000210797Member
2026-02-28
0001742912
sofi:C000210799Member
2026-02-28
0001742912
sofi:C000263366Member
sofi:SoftwareAndTechServicesMember
2026-02-28
0001742912
sofi:C000263366Member
sofi:TechHardwareAndSemiconductorsMember
2026-02-28
0001742912
sofi:C000263366Member
sofi:IndustrialProductsMember
2026-02-28
0001742912
sofi:C000263366Member
us-gaap:HealthCareMember
2026-02-28
0001742912
sofi:C000263366Member
sofi:ConsumerDiscretionaryProductsMember
2026-02-28
0001742912
sofi:C000263366Member
sofi:MediaMember
2026-02-28
0001742912
sofi:C000263366Member
sofi:CashAndOtherMember
2026-02-28
0001742912
sofi:C000210797Member
sofi:TechHardwareAndSemiconductorsMember
2026-02-28
0001742912
sofi:C000210797Member
us-gaap:HealthCareMember
2026-02-28
0001742912
sofi:C000210797Member
sofi:MediaMember
2026-02-28
0001742912
sofi:C000210797Member
sofi:SoftwareAndTechServicesMember
2026-02-28
0001742912
sofi:C000210797Member
sofi:FinancialServicesMember
2026-02-28
0001742912
sofi:C000210797Member
sofi:IndustrialProductsMember
2026-02-28
0001742912
sofi:C000210797Member
sofi:RetailAndWholesaleDiscretionaryMember
2026-02-28
0001742912
sofi:C000210797Member
us-gaap:BankingMember
2026-02-28
0001742912
sofi:C000210797Member
us-gaap:OilAndGasMember
2026-02-28
0001742912
sofi:C000210797Member
sofi:ConsumerStapleProductsMember
2026-02-28
0001742912
sofi:C000210797Member
sofi:MaterialsMember
2026-02-28
0001742912
sofi:C000210797Member
sofi:InsuranceMember
2026-02-28
0001742912
sofi:C000210797Member
sofi:UtilitiesMember
2026-02-28
0001742912
sofi:C000210797Member
sofi:IndustrialServicesMember
2026-02-28
0001742912
sofi:C000210797Member
us-gaap:RealEstateMember
2026-02-28
0001742912
sofi:C000210797Member
sofi:ConsumerDiscretionaryProductsMember
2026-02-28
0001742912
sofi:C000210797Member
sofi:RetailAndWholesaleStaplesMember
2026-02-28
0001742912
sofi:C000210797Member
sofi:ConsumerDiscretionaryServicesMember
2026-02-28
0001742912
sofi:C000210797Member
sofi:TelecommunicationsMember
2026-02-28
0001742912
sofi:C000210797Member
sofi:RenewableEnergyMember
2026-02-28
0001742912
sofi:C000210797Member
sofi:CashAndOtherMember
2026-02-28
0001742912
sofi:C000210799Member
sofi:TechHardwareAndSemiconductorsMember
2026-02-28
0001742912
sofi:C000210799Member
sofi:ConsumerDiscretionaryProductsMember
2026-02-28
0001742912
sofi:C000210799Member
sofi:MediaMember
2026-02-28
0001742912
sofi:C000210799Member
sofi:SoftwareAndTechServicesMember
2026-02-28
0001742912
sofi:C000210799Member
sofi:RetailAndWholesaleDiscretionaryMember
2026-02-28
0001742912
sofi:C000210799Member
sofi:RetailAndWholesaleStaplesMember
2026-02-28
0001742912
sofi:C000210799Member
us-gaap:HealthCareMember
2026-02-28
0001742912
sofi:C000210799Member
sofi:InsuranceMember
2026-02-28
0001742912
sofi:C000210799Member
us-gaap:OilAndGasMember
2026-02-28
0001742912
sofi:C000210799Member
sofi:FinancialServicesMember
2026-02-28
0001742912
sofi:C000210799Member
us-gaap:RealEstateMember
2026-02-28
0001742912
sofi:C000210799Member
sofi:ConsumerStapleProductsMember
2026-02-28
0001742912
sofi:C000210799Member
sofi:TelecommunicationsMember
2026-02-28
0001742912
sofi:C000210799Member
sofi:ConsumerDiscretionaryServicesMember
2026-02-28
0001742912
sofi:C000210799Member
sofi:IndustrialProductsMember
2026-02-28
0001742912
sofi:C000210799Member
sofi:IndustrialServicesMember
2026-02-28
0001742912
sofi:C000210799Member
sofi:CashAndOtherMember
2026-02-28
0001742912
sofi:C000263366Member
sofi:TeradyneIncMember
2026-02-28
0001742912
sofi:C000263366Member
sofi:NVIDIACorpMember
2026-02-28
0001742912
sofi:C000263366Member
sofi:DeereAndCoMember
2026-02-28
0001742912
sofi:C000263366Member
sofi:TeslaIncMember
2026-02-28
0001742912
sofi:C000263366Member
sofi:PalantirTechnologiesIncMember
2026-02-28
0001742912
sofi:C000263366Member
sofi:RockwellAutomationIncMember
2026-02-28
0001742912
sofi:C000263366Member
sofi:BaiduIncMember
2026-02-28
0001742912
sofi:C000263366Member
sofi:AristaNetworksIncMember
2026-02-28
0001742912
sofi:C000263366Member
sofi:ThermoFisherScientificIncMember
2026-02-28
0001742912
sofi:C000263366Member
sofi:IntuitiveSurgicalIncMember
2026-02-28
0001742912
sofi:C000246517Member
sofi:USTreasuryBillsMember
2026-02-28
0001742912
sofi:C000246517Member
sofi:PurchasedOptionsMember
2026-02-28
0001742912
sofi:C000246517Member
sofi:CashAndOtherMember
2026-02-28
0001742912
sofi:C000246517Member
sofi:WrittenOptionsMember
2026-02-28
0001742912
sofi:C000246517Member
sofi:UnitedStatesTreasuryBill348Member
2026-02-28
0001742912
sofi:C000246517Member
sofi:UnitedStatesTreasuryBill363Member
2026-02-28
0001742912
sofi:C000246517Member
sofi:UnitedStatesTreasuryBill361Member
2026-02-28
0001742912
sofi:C000246517Member
sofi:UnitedStatesTreasuryBill354Member
2026-02-28
0001742912
sofi:C000246517Member
sofi:UnitedStatesTreasuryBill364Member
2026-02-28
0001742912
sofi:C000246517Member
sofi:UnitedStatesTreasuryBill353Member
2026-02-28
0001742912
sofi:C000246517Member
sofi:SAndP500IndexExpiration03272026ExercisePrice550000Member
2026-02-28
0001742912
sofi:C000246517Member
sofi:SAndP500IndexExpiration03272026ExercisePrice745000Member
2026-02-28
0001742912
sofi:C000246517Member
sofi:SAndP500IndexExpiration03272026ExercisePrice740000Member
2026-02-28
0001742912
sofi:C000246517Member
sofi:SAndP500IndexExpiration03272026ExercisePrice555000Member
2026-02-28
0001742912
sofi:C000210797Member
sofi:NVIDIACorpMember
2026-02-28
0001742912
sofi:C000210797Member
sofi:BroadcomIncMember
2026-02-28
0001742912
sofi:C000210797Member
sofi:MicrosoftCorpMember
2026-02-28
0001742912
sofi:C000210797Member
sofi:AppleIncMember
2026-02-28
0001742912
sofi:C000210797Member
sofi:MetaPlatformsIncMember
2026-02-28
0001742912
sofi:C000210797Member
sofi:AmazoncomIncMember
2026-02-28
0001742912
sofi:C000210797Member
sofi:AlphabetIncMember
2026-02-28
0001742912
sofi:C000210797Member
sofi:MicronTechnologyIncMember
2026-02-28
0001742912
sofi:C000210797Member
sofi:EliLillyAndCoMember
2026-02-28
0001742912
sofi:C000210797Member
sofi:AlphabetInc1Member
2026-02-28
0001742912
sofi:C000210799Member
sofi:TeslaIncMember
2026-02-28
0001742912
sofi:C000210799Member
sofi:NVIDIACorpMember
2026-02-28
0001742912
sofi:C000210799Member
sofi:AmazoncomIncMember
2026-02-28
0001742912
sofi:C000210799Member
sofi:BerkshireHathawayIncMember
2026-02-28
0001742912
sofi:C000210799Member
sofi:AppleIncMember
2026-02-28
0001742912
sofi:C000210799Member
sofi:PalantirTechnologiesIncMember
2026-02-28
0001742912
sofi:C000210799Member
sofi:AlphabetIncMember
2026-02-28
0001742912
sofi:C000210799Member
sofi:MicrosoftCorpMember
2026-02-28
0001742912
sofi:C000210799Member
sofi:MetaPlatformsIncMember
2026-02-28
0001742912
sofi:C000210799Member
sofi:CostcoWholesaleCorpMember
2026-02-28
0001742912
sofi:C000246517Member
2023-11-14
2023-11-14
0001742912
sofi:BloombergUSAggregateBondIndexMember
2023-11-14
2023-11-14
0001742912
sofi:C000246517Member
2023-11-14
2023-11-30
0001742912
sofi:BloombergUSAggregateBondIndexMember
2023-11-14
2023-11-30
0001742912
sofi:C000246517Member
2023-11-14
2023-12-31
0001742912
sofi:BloombergUSAggregateBondIndexMember
2023-11-14
2023-12-31
0001742912
sofi:C000246517Member
2023-11-14
2024-01-31
0001742912
sofi:BloombergUSAggregateBondIndexMember
2023-11-14
2024-01-31
0001742912
sofi:C000246517Member
2023-11-14
2024-02-29
0001742912
sofi:BloombergUSAggregateBondIndexMember
2023-11-14
2024-02-29
0001742912
sofi:C000246517Member
2023-11-14
2024-03-31
0001742912
sofi:BloombergUSAggregateBondIndexMember
2023-11-14
2024-03-31
0001742912
sofi:C000246517Member
2023-11-14
2024-04-30
0001742912
sofi:BloombergUSAggregateBondIndexMember
2023-11-14
2024-04-30
0001742912
sofi:C000246517Member
2023-11-14
2024-05-31
0001742912
sofi:BloombergUSAggregateBondIndexMember
2023-11-14
2024-05-31
0001742912
sofi:C000246517Member
2023-11-14
2024-06-30
0001742912
sofi:BloombergUSAggregateBondIndexMember
2023-11-14
2024-06-30
0001742912
sofi:C000246517Member
2023-11-14
2024-07-31
0001742912
sofi:BloombergUSAggregateBondIndexMember
2023-11-14
2024-07-31
0001742912
sofi:C000246517Member
2023-11-14
2024-08-31
0001742912
sofi:BloombergUSAggregateBondIndexMember
2023-11-14
2024-08-31
0001742912
sofi:C000246517Member
2023-11-14
2024-09-30
0001742912
sofi:BloombergUSAggregateBondIndexMember
2023-11-14
2024-09-30
0001742912
sofi:C000246517Member
2023-11-14
2024-10-31
0001742912
sofi:BloombergUSAggregateBondIndexMember
2023-11-14
2024-10-31
0001742912
sofi:C000246517Member
2023-11-14
2024-11-30
0001742912
sofi:BloombergUSAggregateBondIndexMember
2023-11-14
2024-11-30
0001742912
sofi:C000246517Member
2023-11-14
2024-12-31
0001742912
sofi:BloombergUSAggregateBondIndexMember
2023-11-14
2024-12-31
0001742912
sofi:C000246517Member
2023-11-14
2025-01-31
0001742912
sofi:BloombergUSAggregateBondIndexMember
2023-11-14
2025-01-31
0001742912
sofi:C000246517Member
2023-11-14
2025-02-28
0001742912
sofi:BloombergUSAggregateBondIndexMember
2023-11-14
2025-02-28
0001742912
sofi:C000246517Member
2023-11-14
2025-03-31
0001742912
sofi:BloombergUSAggregateBondIndexMember
2023-11-14
2025-03-31
0001742912
sofi:C000246517Member
2023-11-14
2025-04-30
0001742912
sofi:BloombergUSAggregateBondIndexMember
2023-11-14
2025-04-30
0001742912
sofi:C000246517Member
2023-11-14
2025-05-31
0001742912
sofi:BloombergUSAggregateBondIndexMember
2023-11-14
2025-05-31
0001742912
sofi:C000246517Member
2023-11-14
2025-06-30
0001742912
sofi:BloombergUSAggregateBondIndexMember
2023-11-14
2025-06-30
0001742912
sofi:C000246517Member
2023-11-14
2025-07-31
0001742912
sofi:BloombergUSAggregateBondIndexMember
2023-11-14
2025-07-31
0001742912
sofi:C000246517Member
2023-11-14
2025-08-31
0001742912
sofi:BloombergUSAggregateBondIndexMember
2023-11-14
2025-08-31
0001742912
sofi:C000246517Member
2023-11-14
2025-09-30
0001742912
sofi:BloombergUSAggregateBondIndexMember
2023-11-14
2025-09-30
0001742912
sofi:C000246517Member
2023-11-14
2025-10-31
0001742912
sofi:BloombergUSAggregateBondIndexMember
2023-11-14
2025-10-31
0001742912
sofi:C000246517Member
2023-11-14
2025-11-30
0001742912
sofi:BloombergUSAggregateBondIndexMember
2023-11-14
2025-11-30
0001742912
sofi:C000246517Member
2023-11-14
2025-12-31
0001742912
sofi:BloombergUSAggregateBondIndexMember
2023-11-14
2025-12-31
0001742912
sofi:C000246517Member
2023-11-14
2026-01-31
0001742912
sofi:BloombergUSAggregateBondIndexMember
2023-11-14
2026-01-31
0001742912
sofi:C000210799Member
2019-05-07
2019-05-07
0001742912
sofi:SAndP500TotalReturnIndexMember
2019-05-07
2019-05-07
0001742912
sofi:SoFiSocial50IndexMember
2019-05-07
2019-05-07
0001742912
sofi:C000210799Member
2019-05-07
2019-05-31
0001742912
sofi:SAndP500TotalReturnIndexMember
2019-05-07
2019-05-31
0001742912
sofi:SoFiSocial50IndexMember
2019-05-07
2019-05-31
0001742912
sofi:C000210799Member
2019-05-07
2019-06-30
0001742912
sofi:SAndP500TotalReturnIndexMember
2019-05-07
2019-06-30
0001742912
sofi:SoFiSocial50IndexMember
2019-05-07
2019-06-30
0001742912
sofi:C000210799Member
2019-05-07
2019-07-31
0001742912
sofi:SAndP500TotalReturnIndexMember
2019-05-07
2019-07-31
0001742912
sofi:SoFiSocial50IndexMember
2019-05-07
2019-07-31
0001742912
sofi:C000210799Member
2019-05-07
2019-08-31
0001742912
sofi:SAndP500TotalReturnIndexMember
2019-05-07
2019-08-31
0001742912
sofi:SoFiSocial50IndexMember
2019-05-07
2019-08-31
0001742912
sofi:C000210799Member
2019-05-07
2019-09-30
0001742912
sofi:SAndP500TotalReturnIndexMember
2019-05-07
2019-09-30
0001742912
sofi:SoFiSocial50IndexMember
2019-05-07
2019-09-30
0001742912
sofi:C000210799Member
2019-05-07
2019-10-31
0001742912
sofi:SAndP500TotalReturnIndexMember
2019-05-07
2019-10-31
0001742912
sofi:SoFiSocial50IndexMember
2019-05-07
2019-10-31
0001742912
sofi:C000210799Member
2019-05-07
2019-11-30
0001742912
sofi:SAndP500TotalReturnIndexMember
2019-05-07
2019-11-30
0001742912
sofi:SoFiSocial50IndexMember
2019-05-07
2019-11-30
0001742912
sofi:C000210799Member
2019-05-07
2019-12-31
0001742912
sofi:SAndP500TotalReturnIndexMember
2019-05-07
2019-12-31
0001742912
sofi:SoFiSocial50IndexMember
2019-05-07
2019-12-31
0001742912
sofi:C000210799Member
2019-05-07
2020-01-31
0001742912
sofi:SAndP500TotalReturnIndexMember
2019-05-07
2020-01-31
0001742912
sofi:SoFiSocial50IndexMember
2019-05-07
2020-01-31
0001742912
sofi:C000210799Member
2019-05-07
2020-02-29
0001742912
sofi:SAndP500TotalReturnIndexMember
2019-05-07
2020-02-29
0001742912
sofi:SoFiSocial50IndexMember
2019-05-07
2020-02-29
0001742912
sofi:C000210799Member
2019-05-07
2020-03-31
0001742912
sofi:SAndP500TotalReturnIndexMember
2019-05-07
2020-03-31
0001742912
sofi:SoFiSocial50IndexMember
2019-05-07
2020-03-31
0001742912
sofi:C000210799Member
2019-05-07
2020-04-30
0001742912
sofi:SAndP500TotalReturnIndexMember
2019-05-07
2020-04-30
0001742912
sofi:SoFiSocial50IndexMember
2019-05-07
2020-04-30
0001742912
sofi:C000210799Member
2019-05-07
2020-05-31
0001742912
sofi:SAndP500TotalReturnIndexMember
2019-05-07
2020-05-31
0001742912
sofi:SoFiSocial50IndexMember
2019-05-07
2020-05-31
0001742912
sofi:C000210799Member
2019-05-07
2020-06-30
0001742912
sofi:SAndP500TotalReturnIndexMember
2019-05-07
2020-06-30
0001742912
sofi:SoFiSocial50IndexMember
2019-05-07
2020-06-30
0001742912
sofi:C000210799Member
2019-05-07
2020-07-31
0001742912
sofi:SAndP500TotalReturnIndexMember
2019-05-07
2020-07-31
0001742912
sofi:SoFiSocial50IndexMember
2019-05-07
2020-07-31
0001742912
sofi:C000210799Member
2019-05-07
2020-08-31
0001742912
sofi:SAndP500TotalReturnIndexMember
2019-05-07
2020-08-31
0001742912
sofi:SoFiSocial50IndexMember
2019-05-07
2020-08-31
0001742912
sofi:C000210799Member
2019-05-07
2020-09-30
0001742912
sofi:SAndP500TotalReturnIndexMember
2019-05-07
2020-09-30
0001742912
sofi:SoFiSocial50IndexMember
2019-05-07
2020-09-30
0001742912
sofi:C000210799Member
2019-05-07
2020-10-31
0001742912
sofi:SAndP500TotalReturnIndexMember
2019-05-07
2020-10-31
0001742912
sofi:SoFiSocial50IndexMember
2019-05-07
2020-10-31
0001742912
sofi:C000210799Member
2019-05-07
2020-11-30
0001742912
sofi:SAndP500TotalReturnIndexMember
2019-05-07
2020-11-30
0001742912
sofi:SoFiSocial50IndexMember
2019-05-07
2020-11-30
0001742912
sofi:C000210799Member
2019-05-07
2020-12-31
0001742912
sofi:SAndP500TotalReturnIndexMember
2019-05-07
2020-12-31
0001742912
sofi:SoFiSocial50IndexMember
2019-05-07
2020-12-31
0001742912
sofi:C000210799Member
2019-05-07
2021-01-31
0001742912
sofi:SAndP500TotalReturnIndexMember
2019-05-07
2021-01-31
0001742912
sofi:SoFiSocial50IndexMember
2019-05-07
2021-01-31
0001742912
sofi:C000210799Member
2019-05-07
2021-02-28
0001742912
sofi:SAndP500TotalReturnIndexMember
2019-05-07
2021-02-28
0001742912
sofi:SoFiSocial50IndexMember
2019-05-07
2021-02-28
0001742912
sofi:C000210799Member
2019-05-07
2021-03-31
0001742912
sofi:SAndP500TotalReturnIndexMember
2019-05-07
2021-03-31
0001742912
sofi:SoFiSocial50IndexMember
2019-05-07
2021-03-31
0001742912
sofi:C000210799Member
2019-05-07
2021-04-30
0001742912
sofi:SAndP500TotalReturnIndexMember
2019-05-07
2021-04-30
0001742912
sofi:SoFiSocial50IndexMember
2019-05-07
2021-04-30
0001742912
sofi:C000210799Member
2019-05-07
2021-05-31
0001742912
sofi:SAndP500TotalReturnIndexMember
2019-05-07
2021-05-31
0001742912
sofi:SoFiSocial50IndexMember
2019-05-07
2021-05-31
0001742912
sofi:C000210799Member
2019-05-07
2021-06-30
0001742912
sofi:SAndP500TotalReturnIndexMember
2019-05-07
2021-06-30
0001742912
sofi:SoFiSocial50IndexMember
2019-05-07
2021-06-30
0001742912
sofi:C000210799Member
2019-05-07
2021-07-31
0001742912
sofi:SAndP500TotalReturnIndexMember
2019-05-07
2021-07-31
0001742912
sofi:SoFiSocial50IndexMember
2019-05-07
2021-07-31
0001742912
sofi:C000210799Member
2019-05-07
2021-08-31
0001742912
sofi:SAndP500TotalReturnIndexMember
2019-05-07
2021-08-31
0001742912
sofi:SoFiSocial50IndexMember
2019-05-07
2021-08-31
0001742912
sofi:C000210799Member
2019-05-07
2021-09-30
0001742912
sofi:SAndP500TotalReturnIndexMember
2019-05-07
2021-09-30
0001742912
sofi:SoFiSocial50IndexMember
2019-05-07
2021-09-30
0001742912
sofi:C000210799Member
2019-05-07
2021-10-31
0001742912
sofi:SAndP500TotalReturnIndexMember
2019-05-07
2021-10-31
0001742912
sofi:SoFiSocial50IndexMember
2019-05-07
2021-10-31
0001742912
sofi:C000210799Member
2019-05-07
2021-11-30
0001742912
sofi:SAndP500TotalReturnIndexMember
2019-05-07
2021-11-30
0001742912
sofi:SoFiSocial50IndexMember
2019-05-07
2021-11-30
0001742912
sofi:C000210799Member
2019-05-07
2021-12-31
0001742912
sofi:SAndP500TotalReturnIndexMember
2019-05-07
2021-12-31
0001742912
sofi:SoFiSocial50IndexMember
2019-05-07
2021-12-31
0001742912
sofi:C000210799Member
2019-05-07
2022-01-31
0001742912
sofi:SAndP500TotalReturnIndexMember
2019-05-07
2022-01-31
0001742912
sofi:SoFiSocial50IndexMember
2019-05-07
2022-01-31
0001742912
sofi:C000210799Member
2019-05-07
2022-02-28
0001742912
sofi:SAndP500TotalReturnIndexMember
2019-05-07
2022-02-28
0001742912
sofi:SoFiSocial50IndexMember
2019-05-07
2022-02-28
0001742912
sofi:C000210799Member
2019-05-07
2022-03-31
0001742912
sofi:SAndP500TotalReturnIndexMember
2019-05-07
2022-03-31
0001742912
sofi:SoFiSocial50IndexMember
2019-05-07
2022-03-31
0001742912
sofi:C000210799Member
2019-05-07
2022-04-30
0001742912
sofi:SAndP500TotalReturnIndexMember
2019-05-07
2022-04-30
0001742912
sofi:SoFiSocial50IndexMember
2019-05-07
2022-04-30
0001742912
sofi:C000210799Member
2019-05-07
2022-05-31
0001742912
sofi:SAndP500TotalReturnIndexMember
2019-05-07
2022-05-31
0001742912
sofi:SoFiSocial50IndexMember
2019-05-07
2022-05-31
0001742912
sofi:C000210799Member
2019-05-07
2022-06-30
0001742912
sofi:SAndP500TotalReturnIndexMember
2019-05-07
2022-06-30
0001742912
sofi:SoFiSocial50IndexMember
2019-05-07
2022-06-30
0001742912
sofi:C000210799Member
2019-05-07
2022-07-31
0001742912
sofi:SAndP500TotalReturnIndexMember
2019-05-07
2022-07-31
0001742912
sofi:SoFiSocial50IndexMember
2019-05-07
2022-07-31
0001742912
sofi:C000210799Member
2019-05-07
2022-08-31
0001742912
sofi:SAndP500TotalReturnIndexMember
2019-05-07
2022-08-31
0001742912
sofi:SoFiSocial50IndexMember
2019-05-07
2022-08-31
0001742912
sofi:C000210799Member
2019-05-07
2022-09-30
0001742912
sofi:SAndP500TotalReturnIndexMember
2019-05-07
2022-09-30
0001742912
sofi:SoFiSocial50IndexMember
2019-05-07
2022-09-30
0001742912
sofi:C000210799Member
2019-05-07
2022-10-31
0001742912
sofi:SAndP500TotalReturnIndexMember
2019-05-07
2022-10-31
0001742912
sofi:SoFiSocial50IndexMember
2019-05-07
2022-10-31
0001742912
sofi:C000210799Member
2019-05-07
2022-11-30
0001742912
sofi:SAndP500TotalReturnIndexMember
2019-05-07
2022-11-30
0001742912
sofi:SoFiSocial50IndexMember
2019-05-07
2022-11-30
0001742912
sofi:C000210799Member
2019-05-07
2022-12-31
0001742912
sofi:SAndP500TotalReturnIndexMember
2019-05-07
2022-12-31
0001742912
sofi:SoFiSocial50IndexMember
2019-05-07
2022-12-31
0001742912
sofi:C000210799Member
2019-05-07
2023-01-31
0001742912
sofi:SAndP500TotalReturnIndexMember
2019-05-07
2023-01-31
0001742912
sofi:SoFiSocial50IndexMember
2019-05-07
2023-01-31
0001742912
sofi:C000210799Member
2019-05-07
2023-02-28
0001742912
sofi:SAndP500TotalReturnIndexMember
2019-05-07
2023-02-28
0001742912
sofi:SoFiSocial50IndexMember
2019-05-07
2023-02-28
0001742912
sofi:C000210799Member
2019-05-07
2023-03-31
0001742912
sofi:SAndP500TotalReturnIndexMember
2019-05-07
2023-03-31
0001742912
sofi:SoFiSocial50IndexMember
2019-05-07
2023-03-31
0001742912
sofi:C000210799Member
2019-05-07
2023-04-30
0001742912
sofi:SAndP500TotalReturnIndexMember
2019-05-07
2023-04-30
0001742912
sofi:SoFiSocial50IndexMember
2019-05-07
2023-04-30
0001742912
sofi:C000210799Member
2019-05-07
2023-05-31
0001742912
sofi:SAndP500TotalReturnIndexMember
2019-05-07
2023-05-31
0001742912
sofi:SoFiSocial50IndexMember
2019-05-07
2023-05-31
0001742912
sofi:C000210799Member
2019-05-07
2023-06-30
0001742912
sofi:SAndP500TotalReturnIndexMember
2019-05-07
2023-06-30
0001742912
sofi:SoFiSocial50IndexMember
2019-05-07
2023-06-30
0001742912
sofi:C000210799Member
2019-05-07
2023-07-31
0001742912
sofi:SAndP500TotalReturnIndexMember
2019-05-07
2023-07-31
0001742912
sofi:SoFiSocial50IndexMember
2019-05-07
2023-07-31
0001742912
sofi:C000210799Member
2019-05-07
2023-08-31
0001742912
sofi:SAndP500TotalReturnIndexMember
2019-05-07
2023-08-31
0001742912
sofi:SoFiSocial50IndexMember
2019-05-07
2023-08-31
0001742912
sofi:C000210799Member
2019-05-07
2023-09-30
0001742912
sofi:SAndP500TotalReturnIndexMember
2019-05-07
2023-09-30
0001742912
sofi:SoFiSocial50IndexMember
2019-05-07
2023-09-30
0001742912
sofi:C000210799Member
2019-05-07
2023-10-31
0001742912
sofi:SAndP500TotalReturnIndexMember
2019-05-07
2023-10-31
0001742912
sofi:SoFiSocial50IndexMember
2019-05-07
2023-10-31
0001742912
sofi:C000210799Member
2019-05-07
2023-11-30
0001742912
sofi:SAndP500TotalReturnIndexMember
2019-05-07
2023-11-30
0001742912
sofi:SoFiSocial50IndexMember
2019-05-07
2023-11-30
0001742912
sofi:C000210799Member
2019-05-07
2023-12-31
0001742912
sofi:SAndP500TotalReturnIndexMember
2019-05-07
2023-12-31
0001742912
sofi:SoFiSocial50IndexMember
2019-05-07
2023-12-31
0001742912
sofi:C000210799Member
2019-05-07
2024-01-31
0001742912
sofi:SAndP500TotalReturnIndexMember
2019-05-07
2024-01-31
0001742912
sofi:SoFiSocial50IndexMember
2019-05-07
2024-01-31
0001742912
sofi:C000210799Member
2019-05-07
2024-02-29
0001742912
sofi:SAndP500TotalReturnIndexMember
2019-05-07
2024-02-29
0001742912
sofi:SoFiSocial50IndexMember
2019-05-07
2024-02-29
0001742912
sofi:C000210799Member
2019-05-07
2024-03-31
0001742912
sofi:SAndP500TotalReturnIndexMember
2019-05-07
2024-03-31
0001742912
sofi:SoFiSocial50IndexMember
2019-05-07
2024-03-31
0001742912
sofi:C000210799Member
2019-05-07
2024-04-30
0001742912
sofi:SAndP500TotalReturnIndexMember
2019-05-07
2024-04-30
0001742912
sofi:SoFiSocial50IndexMember
2019-05-07
2024-04-30
0001742912
sofi:C000210799Member
2019-05-07
2024-05-31
0001742912
sofi:SAndP500TotalReturnIndexMember
2019-05-07
2024-05-31
0001742912
sofi:SoFiSocial50IndexMember
2019-05-07
2024-05-31
0001742912
sofi:C000210799Member
2019-05-07
2024-06-30
0001742912
sofi:SAndP500TotalReturnIndexMember
2019-05-07
2024-06-30
0001742912
sofi:SoFiSocial50IndexMember
2019-05-07
2024-06-30
0001742912
sofi:C000210799Member
2019-05-07
2024-07-31
0001742912
sofi:SAndP500TotalReturnIndexMember
2019-05-07
2024-07-31
0001742912
sofi:SoFiSocial50IndexMember
2019-05-07
2024-07-31
0001742912
sofi:C000210799Member
2019-05-07
2024-08-31
0001742912
sofi:SAndP500TotalReturnIndexMember
2019-05-07
2024-08-31
0001742912
sofi:SoFiSocial50IndexMember
2019-05-07
2024-08-31
0001742912
sofi:C000210799Member
2019-05-07
2024-09-30
0001742912
sofi:SAndP500TotalReturnIndexMember
2019-05-07
2024-09-30
0001742912
sofi:SoFiSocial50IndexMember
2019-05-07
2024-09-30
0001742912
sofi:C000210799Member
2019-05-07
2024-10-31
0001742912
sofi:SAndP500TotalReturnIndexMember
2019-05-07
2024-10-31
0001742912
sofi:SoFiSocial50IndexMember
2019-05-07
2024-10-31
0001742912
sofi:C000210799Member
2019-05-07
2024-11-30
0001742912
sofi:SAndP500TotalReturnIndexMember
2019-05-07
2024-11-30
0001742912
sofi:SoFiSocial50IndexMember
2019-05-07
2024-11-30
0001742912
sofi:C000210799Member
2019-05-07
2024-12-31
0001742912
sofi:SAndP500TotalReturnIndexMember
2019-05-07
2024-12-31
0001742912
sofi:SoFiSocial50IndexMember
2019-05-07
2024-12-31
0001742912
sofi:C000210799Member
2019-05-07
2025-01-31
0001742912
sofi:SAndP500TotalReturnIndexMember
2019-05-07
2025-01-31
0001742912
sofi:SoFiSocial50IndexMember
2019-05-07
2025-01-31
0001742912
sofi:C000210799Member
2019-05-07
2025-02-28
0001742912
sofi:SAndP500TotalReturnIndexMember
2019-05-07
2025-02-28
0001742912
sofi:SoFiSocial50IndexMember
2019-05-07
2025-02-28
0001742912
sofi:C000210799Member
2019-05-07
2025-03-31
0001742912
sofi:SAndP500TotalReturnIndexMember
2019-05-07
2025-03-31
0001742912
sofi:SoFiSocial50IndexMember
2019-05-07
2025-03-31
0001742912
sofi:C000210799Member
2019-05-07
2025-04-30
0001742912
sofi:SAndP500TotalReturnIndexMember
2019-05-07
2025-04-30
0001742912
sofi:SoFiSocial50IndexMember
2019-05-07
2025-04-30
0001742912
sofi:C000210799Member
2019-05-07
2025-05-31
0001742912
sofi:SAndP500TotalReturnIndexMember
2019-05-07
2025-05-31
0001742912
sofi:SoFiSocial50IndexMember
2019-05-07
2025-05-31
0001742912
sofi:C000210799Member
2019-05-07
2025-06-30
0001742912
sofi:SAndP500TotalReturnIndexMember
2019-05-07
2025-06-30
0001742912
sofi:SoFiSocial50IndexMember
2019-05-07
2025-06-30
0001742912
sofi:C000210799Member
2019-05-07
2025-07-31
0001742912
sofi:SAndP500TotalReturnIndexMember
2019-05-07
2025-07-31
0001742912
sofi:SoFiSocial50IndexMember
2019-05-07
2025-07-31
0001742912
sofi:C000210799Member
2019-05-07
2025-08-31
0001742912
sofi:SAndP500TotalReturnIndexMember
2019-05-07
2025-08-31
0001742912
sofi:SoFiSocial50IndexMember
2019-05-07
2025-08-31
0001742912
sofi:C000210799Member
2019-05-07
2025-09-30
0001742912
sofi:SAndP500TotalReturnIndexMember
2019-05-07
2025-09-30
0001742912
sofi:SoFiSocial50IndexMember
2019-05-07
2025-09-30
0001742912
sofi:C000210799Member
2019-05-07
2025-10-31
0001742912
sofi:SAndP500TotalReturnIndexMember
2019-05-07
2025-10-31
0001742912
sofi:SoFiSocial50IndexMember
2019-05-07
2025-10-31
0001742912
sofi:C000210799Member
2019-05-07
2025-11-30
0001742912
sofi:SAndP500TotalReturnIndexMember
2019-05-07
2025-11-30
0001742912
sofi:SoFiSocial50IndexMember
2019-05-07
2025-11-30
0001742912
sofi:C000210799Member
2019-05-07
2025-12-31
0001742912
sofi:SAndP500TotalReturnIndexMember
2019-05-07
2025-12-31
0001742912
sofi:SoFiSocial50IndexMember
2019-05-07
2025-12-31
0001742912
sofi:C000210799Member
2019-05-07
2026-01-31
0001742912
sofi:SAndP500TotalReturnIndexMember
2019-05-07
2026-01-31
0001742912
sofi:SoFiSocial50IndexMember
2019-05-07
2026-01-31
iso4217:USD
xbrli:shares
iso4217:USD
xbrli:shares
xbrli:pure
sofi:Holdings
UNITED STATES
SECURITIES AND EXCHANGE COMMISSION
Washington, D.C. 20549
FORM N-CSR
CERTIFIED SHAREHOLDER REPORT OF REGISTERED
MANAGEMENT INVESTMENT COMPANIES
Investment Company Act file number (811-23377)
Tidal Trust I
(Exact name of registrant as specified in charter)
234 West Florida Street, Suite 700
Milwaukee, Wisconsin 53204
(Address of principal executive offices) (Zip code)
Eric W. Falkeis
Tidal Trust I
234 West Florida Street, Suite 203
Milwaukee, Wisconsin 53204
(Name and address of agent for service)
(844) 986-7700
Registrant’s telephone number, including area code
Date of fiscal year end: February 28
Date of reporting period: February 28, 2026
Updated June 27, 2024
Item 1. Reports to Stockholders.
SoFi Agentic AI ETF Tailored Shareholder Report
SoFi Agentic AI ETF Tailored Shareholder Report
annual shareholder report February 28, 2026
SoFi Agentic AI ETF
Ticker: AGIQ (Listed on NYSE Arca, Inc.) |
This annual shareholder report contains important information about the SoFi Agentic AI ETF (the "Fund") for the period September 2, 2025 to February 28, 2026. You can find additional information about the Fund at www.sofi.com/invest/etfs/agiq/. You can also request this information by contacting us at (877) 358-0096 or by writing the Fund at SoFi Agentic AI ETF, c/o U.S. Bank Global Fund Services, P.O. Box 701, Milwaukee, Wisconsin 53201-0701.
What were the Fund costs for the past year?
(based on a hypothetical $10,000 investment)
|
Fund Name |
Costs of a $10,000 investment* |
Costs paid as a percentage of a $10,000 investment** |
|
SoFi Agentic AI ETF |
$35 |
0.69% |
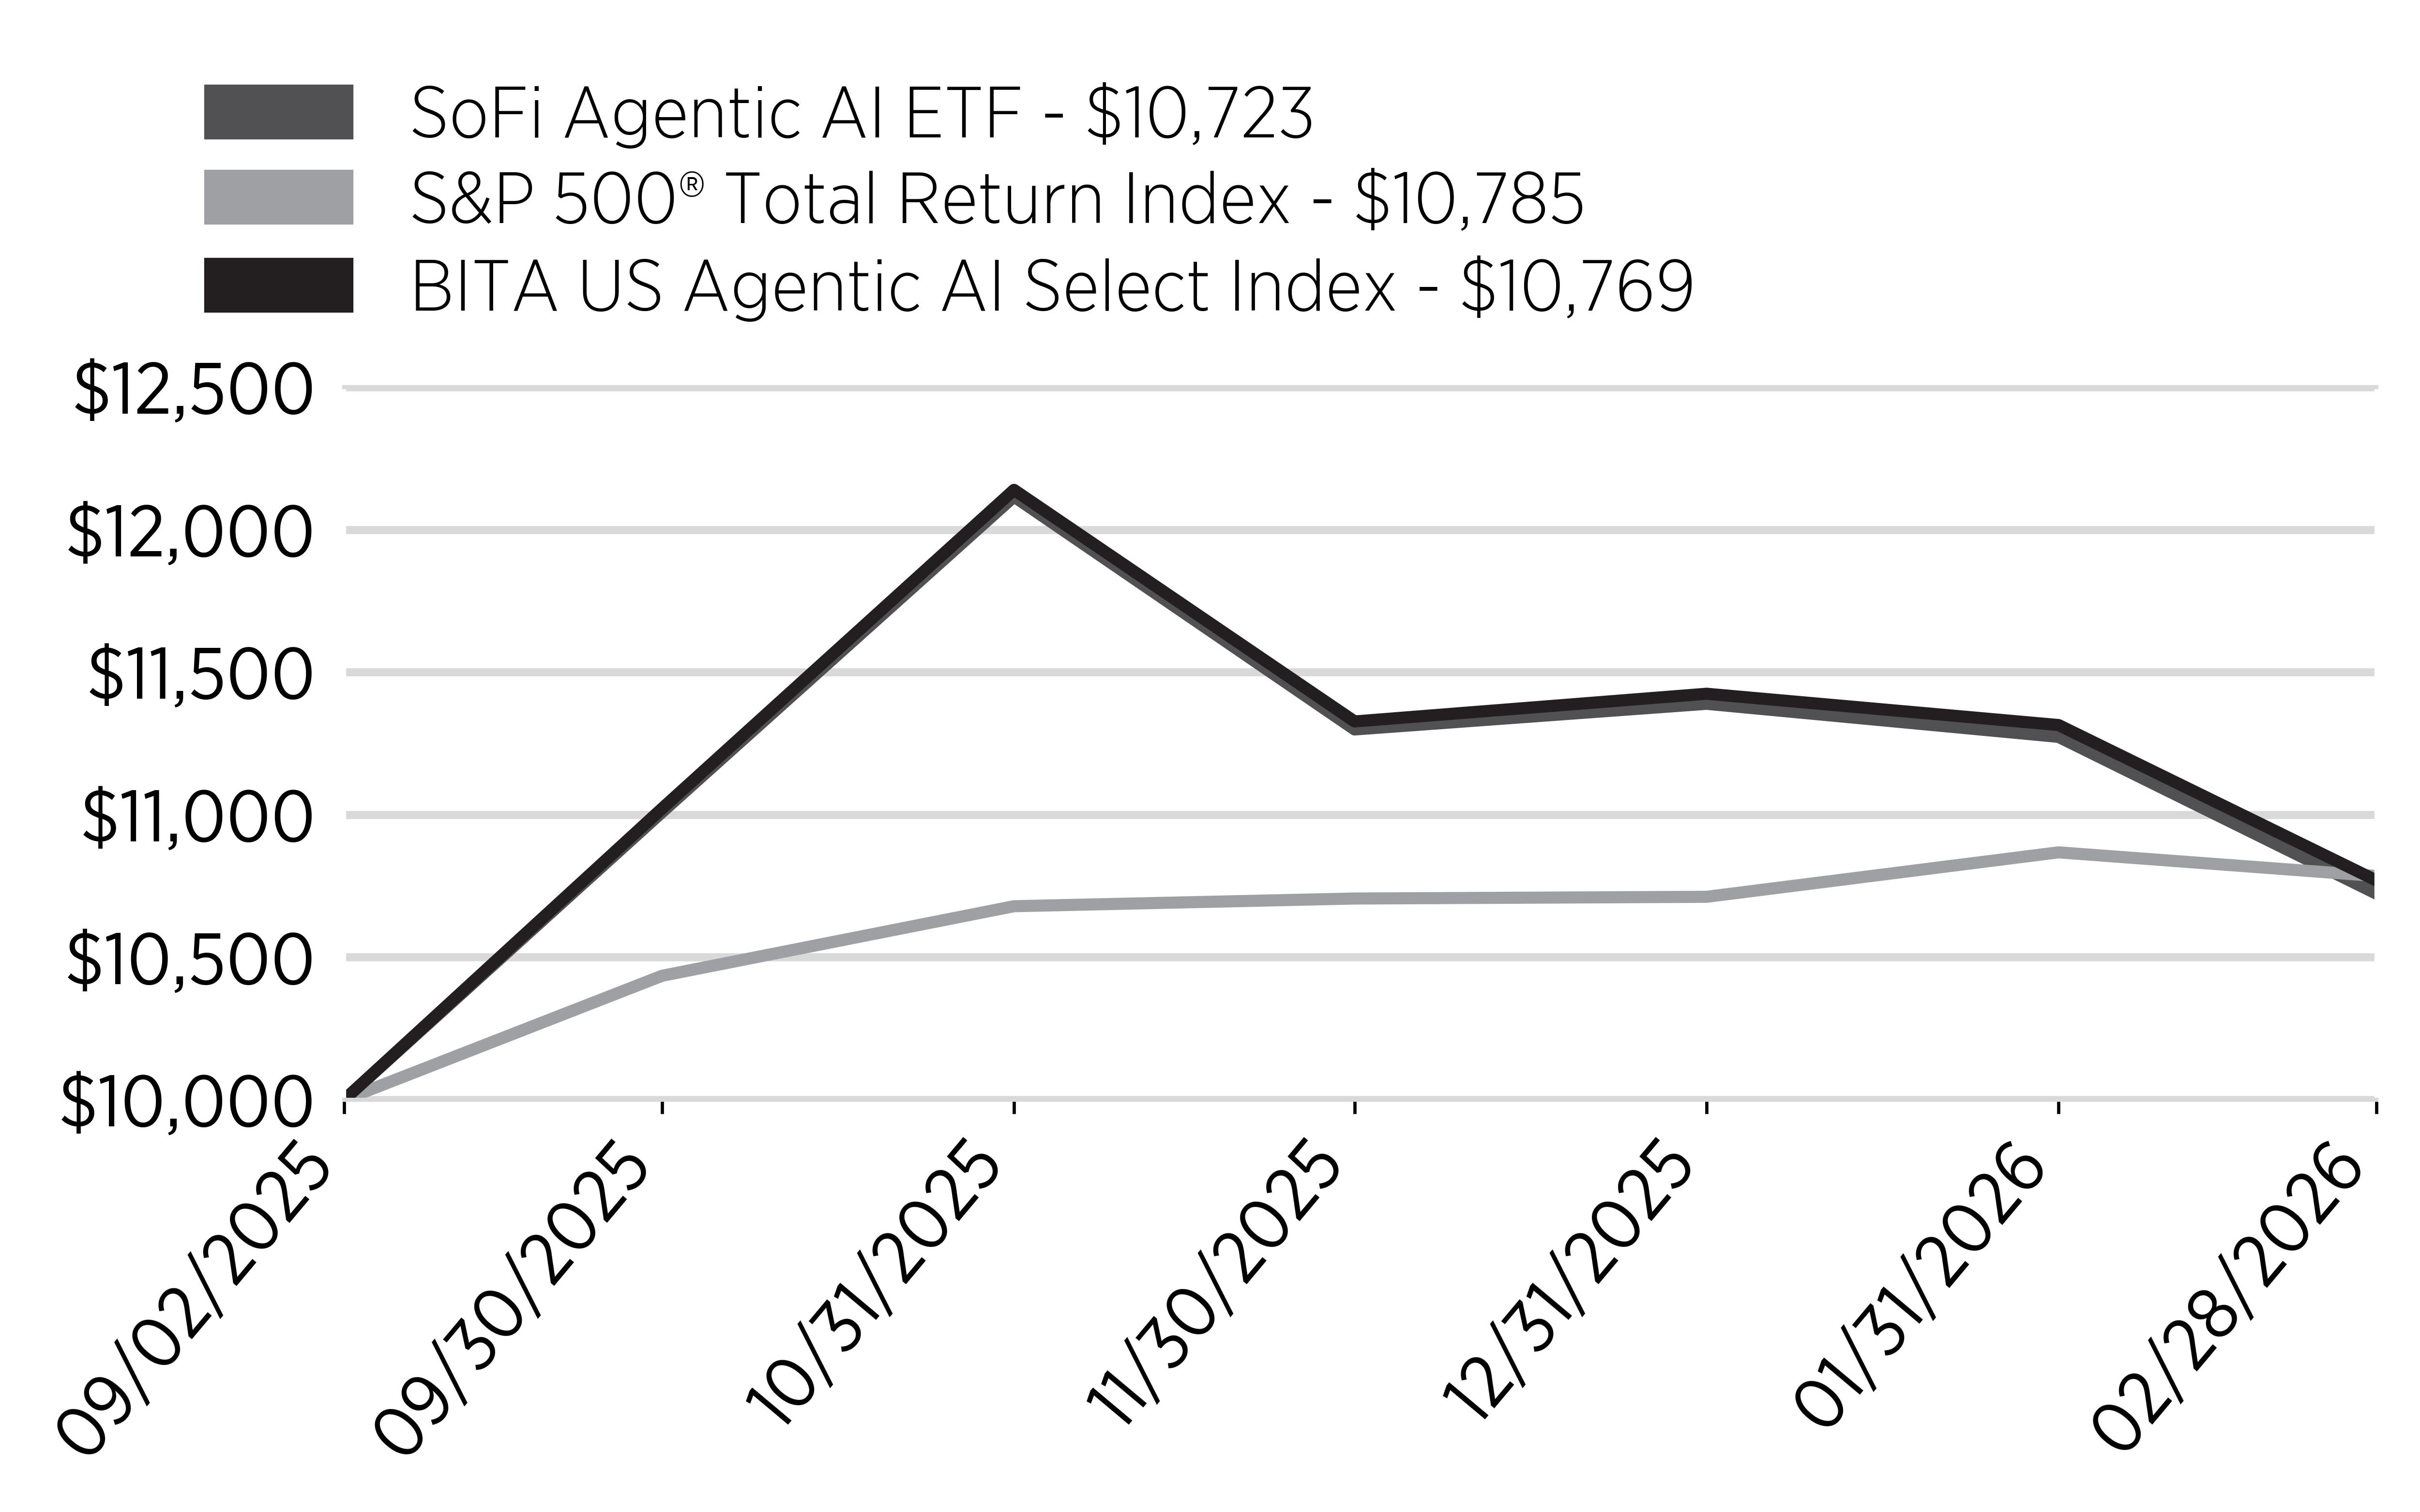
Cumulative Performance
(Initial Investment of $10,000)
|
Date |
SoFi Agentic AI ETF - $10,723 |
S&P 500® Total Return Index - $10,785 |
BITA US Agentic AI Select Index - $10,769 |
|
9/2/2025 |
10000 |
10000 |
10000 |
|
9/30/2025 |
11009 |
10435 |
11022 |
|
10/31/2025 |
12116 |
10679 |
12139 |
|
11/30/2025 |
11299 |
10706 |
11327 |
|
12/31/2025 |
11389 |
10712 |
11424 |
|
1/31/2026 |
11273 |
10868 |
11315 |
|
2/28/2026 |
10723 |
10785 |
10769 |
Annual Performance
|
Returns for the Period Ended
February 28, 2026 |
Since Inception
(9/2/2025) |
|
SoFi Agentic AI ETF |
7.23% |
|
S&P 500® Total Return Index |
7.85% |
|
BITA US Agentic AI Select Index |
7.69% |
The Fund's past performance is not a good indicator of how the Fund will perform in the future. The graph and table do not reflect the deduction of tax that a shareholder would pay on fund distributions or redemption of fund shares.
Visit www.sofi.com/invest/etfs/agiq/ for more recent performance information.
How did the Fund perform last year and what affected its performance?
During the period ended February 28, 2026, U.S. equity markets posted positive returns, supported by continued corporate earnings growth, moderating inflation, and sustained investor enthusiasm for artificial intelligence ("AI") related investment. Market conditions remained supportive for much of the period, although volatility increased later in the period as investors weighed valuation levels, the expected payoff from elevated AI spending, and the timing of future interest-rate cuts.
For the period ended February 28, 2026, the Fund returned 7.23%, compared with 7.69% for the BITA US Agentic AI Select Index (the "AGIQ Index"), the Fund's underlying index, and 7.85% for the S&P 500® Total Return Index. The Fund’s performance reflected gains in companies associated with AI infrastructure, automation, and related technology themes, although returns were tempered by periods of market volatility as investors became more cautious toward richly valued AI-oriented stocks and questioned the near-term returns on significant AI capital expenditures.
What factors influenced performance?
Sector performance attribution showed that the Industrials and Health Care sectors were the largest contributors to the Fund’s returns, while Information Technology detracted from performance.
At the individual stock level, leading contributors to the Fund’s results included Teradyne, Inc., Tesla, Inc., and Deere & Company. Conversely, ServiceNow, Inc., Salesforce, Inc., and Palo Alto Networks, Inc. were among the top detractors.
SoFi Agentic AI ETF Tailored Shareholder Report
SoFi Agentic AI ETF Tailored Shareholder Report
SoFi Agentic AI ETF Tailored Shareholder Report
Key Fund Statistics
(as of February 28, 2026)
|
Fund Size (Thousands) |
$10,148 |
|
Number of Holdings |
28 |
|
Total Advisory Fee Paid |
$29,654 |
|
Portfolio Turnover Rate |
24% |
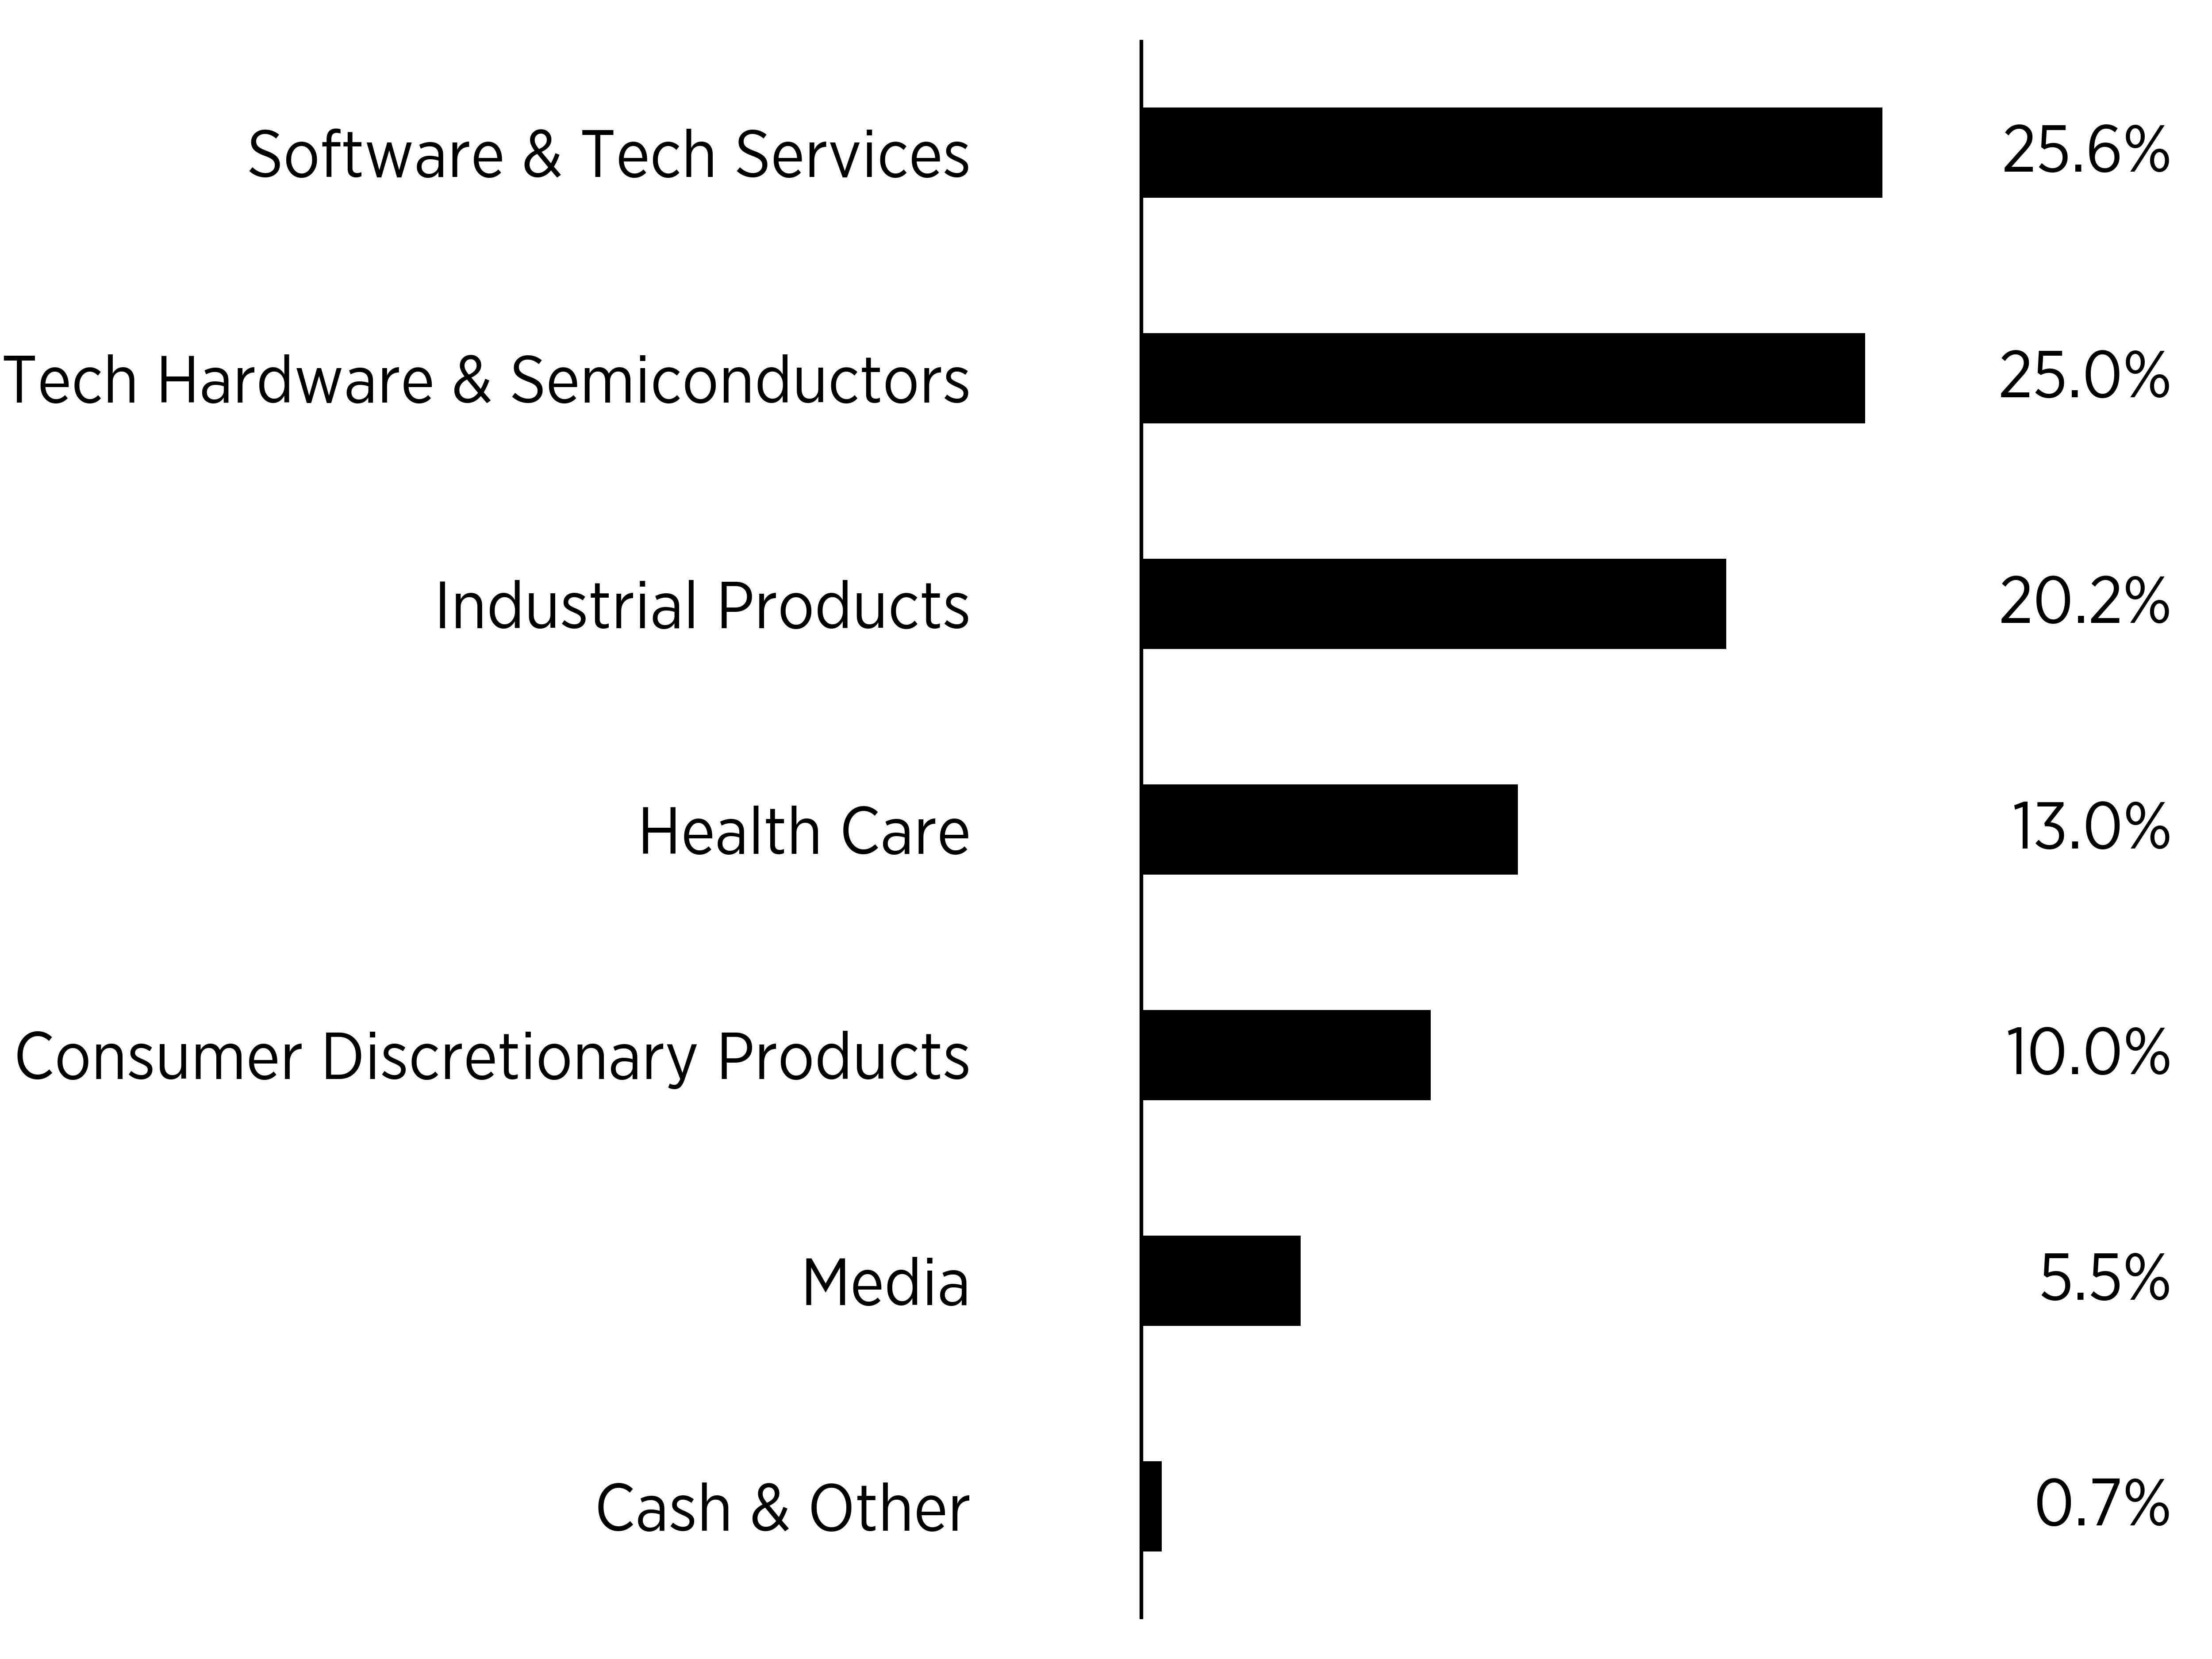
What did the Fund invest in?
(as of February 28, 2026)
Security Breakdown
(% of total net assets)
|
sector |
% |
|
Software & Tech Services |
0.256 |
|
Tech Hardware & Semiconductors |
0.25 |
|
Industrial Products |
0.202 |
|
Health Care |
0.13 |
|
Consumer Discretionary Products |
0.1 |
|
Media |
0.055 |
|
Cash & Other |
0.007 |
|
Top Ten Holdings |
(% of total net assets) |
|
Teradyne Inc |
8.0 |
|
NVIDIA Corp |
7.7 |
|
Deere & Co |
7.0 |
|
Tesla Inc |
7.0 |
|
Palantir Technologies Inc |
6.0 |
|
Rockwell Automation Inc |
5.8 |
|
Baidu Inc |
5.5 |
|
Arista Networks Inc |
5.1 |
|
Thermo Fisher Scientific Inc |
4.8 |
|
Intuitive Surgical Inc |
4.6 |
Householding
Householding is an option available to certain investors of the Fund. Householding is a method of delivery, based on the preference of the individual investor, in which a single copy of certain shareholder documents can be delivered to investors who share the same address, even if their accounts are registered under different names. Householding for the Fund is available through certain broker-dealers. If you are interested in enrolling in householding and receiving a single copy of prospectuses and other shareholder documents, please contact your broker-dealer. If you are currently enrolled in householding and wish to change your householding status, please contact your broker-dealer.
For additional information about the Fund, including its prospectus, financial information, holdings and proxy voting information, visit www.sofi.com/invest/etfs/agiq/.
SoFi Agentic AI ETF Tailored Shareholder Report
SoFi Enhanced Yield ETF Tailored Shareholder Report
SoFi Enhanced Yield ETF Tailored Shareholder Report
annual Shareholder Report February 28, 2026
SoFi Enhanced Yield ETF
Ticker: THTA (Listed on NYSE Arca, Inc.) |
This annual shareholder report contains important information about the SoFi Enhanced Yield ETF (the "Fund") for the period March 1, 2025 to February 28, 2026. You can find additional information about the Fund at www.sofi.com/invest/etfs/thta/. You can also request this information by contacting us at (877) 358-0096 or by writing the Fund at SoFi Enhanced Yield ETF, c/o U.S. Bank Global Fund Services, P.O. Box 701, Milwaukee, Wisconsin 53201-0701.
This report describes changes to the Fund that occurred during the reporting period.
What were the Fund costs for the past year?
(based on a hypothetical $10,000 investment)
|
Fund Name |
Costs of a $10,000 investment |
Costs paid as a percentage of a $10,000 investment |
|
SoFi Enhanced Yield ETF |
$62 |
0.65% |
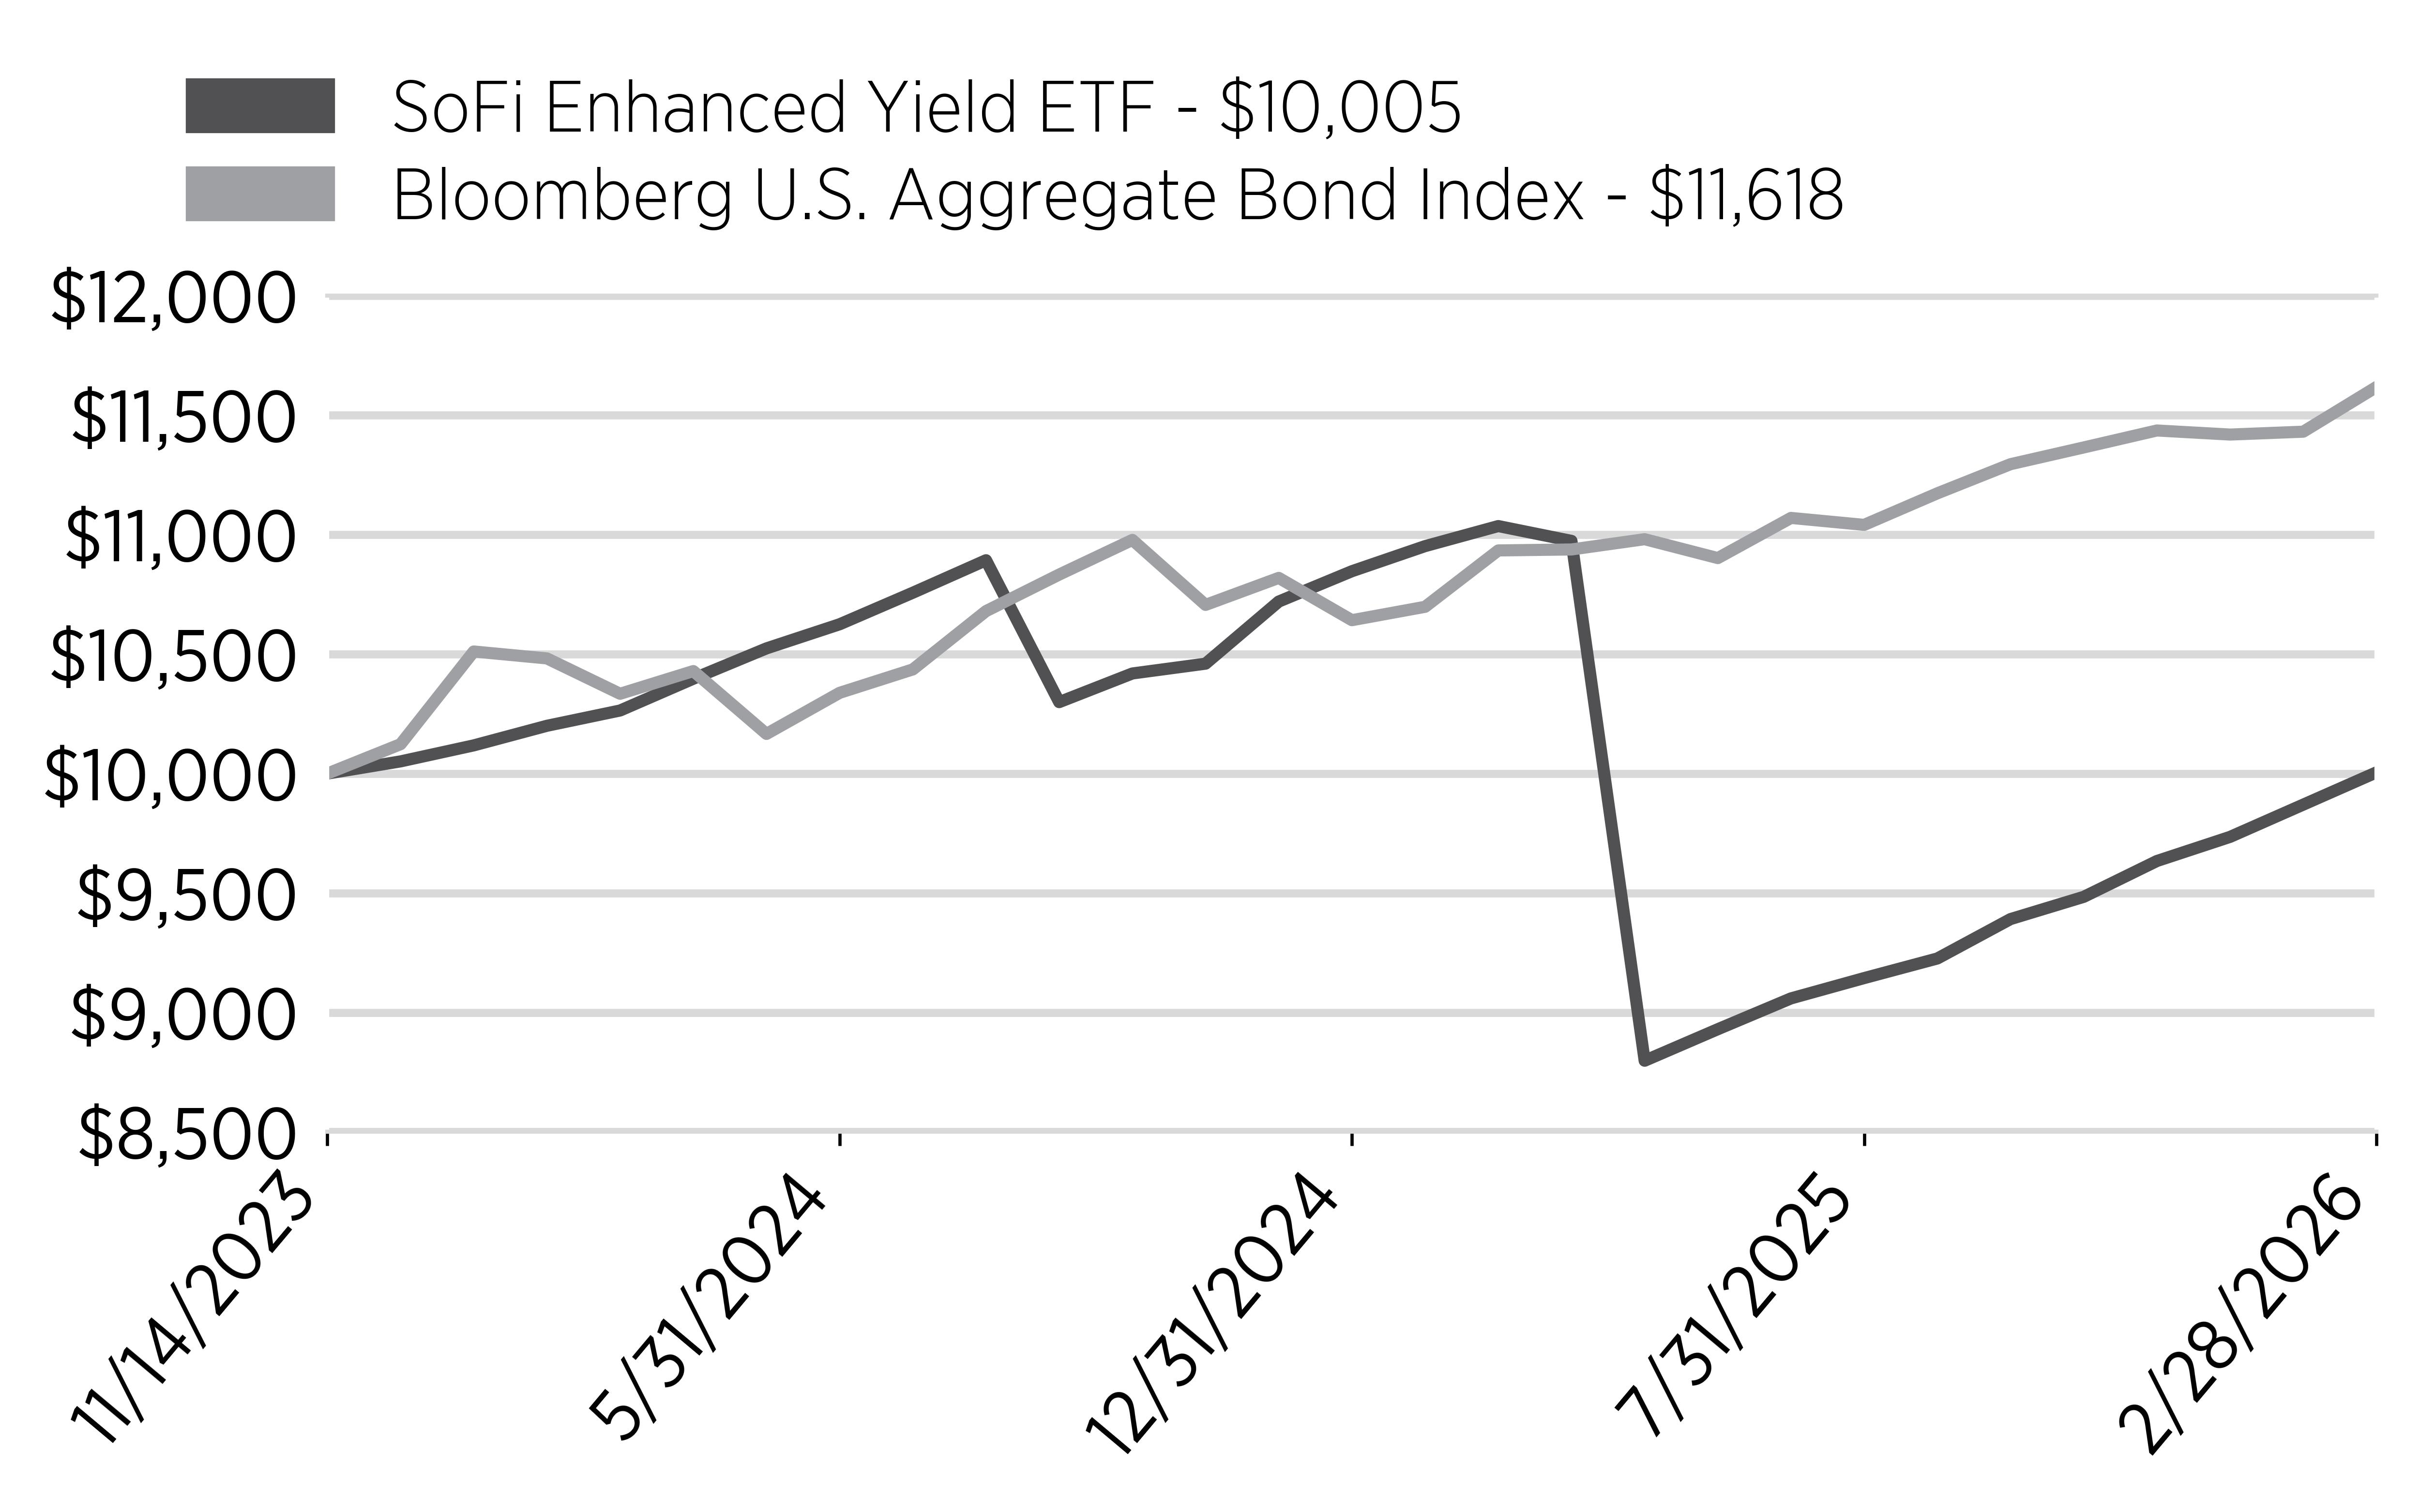
Cumulative Performance
(Initial Investment of $10,000)
|
Date |
SoFi Enhanced Yield ETF - $10,005 |
Bloomberg U.S. Aggregate Bond Index - $11,618 |
|
11/14/2023 |
10000 |
10000 |
|
11/30/2023 |
10051 |
10123 |
|
12/31/2023 |
10118 |
10511 |
|
1/31/2024 |
10200 |
10482 |
|
2/29/2024 |
10264 |
10334 |
|
3/31/2024 |
10397 |
10429 |
|
4/30/2024 |
10524 |
10166 |
|
5/31/2024 |
10625 |
10338 |
|
6/30/2024 |
10757 |
10436 |
|
7/31/2024 |
10893 |
10680 |
|
8/31/2024 |
10299 |
10833 |
|
9/30/2024 |
10419 |
10978 |
|
10/31/2024 |
10460 |
10706 |
|
11/30/2024 |
10720 |
10819 |
|
12/31/2024 |
10847 |
10642 |
|
1/31/2025 |
10952 |
10698 |
|
2/28/2025 |
11036 |
10934 |
|
3/31/2025 |
10974 |
10938 |
|
4/30/2025 |
8798 |
10981 |
|
5/31/2025 |
8930 |
10902 |
|
6/30/2025 |
9059 |
11070 |
|
7/31/2025 |
9144 |
11041 |
|
8/31/2025 |
9226 |
11173 |
|
9/30/2025 |
9391 |
11295 |
|
10/31/2025 |
9484 |
11365 |
|
11/30/2025 |
9634 |
11436 |
|
12/31/2025 |
9735 |
11419 |
|
1/31/2026 |
9870 |
11431 |
|
2/28/2026 |
10005 |
11618 |
Annual Performance
|
Average Annual Returns for the Periods Ended February 28, 2026 |
1 Year |
Since Inception (11/14/2023) |
|
SoFi Enhanced Yield ETF |
-9.34% |
0.02% |
|
Bloomberg U.S. Aggregate Bond Index |
6.26% |
6.77% |
The Fund's past performance is not a good indicator of how the Fund will perform in the future. The graph and table do not reflect the deduction of tax that a shareholder would pay on fund distributions or redemption of fund shares.
Visit www.sofi.com/invest/etfs/thta/ for more recent performance information.
How did the Fund perform last year and what affected its performance?
During the fiscal year ended February 28, 2026, fixed income markets faced a mixed but ultimately constructive backdrop. While the Federal Reserve continued its transition toward lower interest rates, market sentiment shifted throughout the year in response to changing growth expectations, inflation concerns, and bouts of market volatility. U.S. Treasuries experienced a sharp selloff in the spring of 2025, but later recovered as investors sought higher-quality fixed income exposure and yields declined into the end of the period. Corporate credit spreads generally remained relatively tight, which supported returns across much of the taxable bond market. Against this backdrop, the Fund’s Treasury holdings provided income and some support later in the year, but the option overlay portion of the strategy was negatively affected by sudden equity-market declines and elevated volatility, which created a challenging environment for credit spread positions. As a result, for the fiscal year ended February 28, 2026, the Fund returned -9.34%, compared with 6.26% for the Bloomberg U.S. Aggregate Bond Index.
What factors influenced performance?
Detractors from performance included certain options positions, notably the SPXW 04/25/25 5000 put, and the SPXW 05/02/25 4700 put, reflecting the Fund's active management of credit spreads in response to market volatility. The Fund's drawdown occurred after President Trump's "Liberation Day" tariffs, in response to the S&P 500 Index dropping approximately 14% during that period of adjustment.
SoFi Enhanced Yield ETF Tailored Shareholder Report
SoFi Enhanced Yield ETF Tailored Shareholder Report
SoFi Enhanced Yield ETF Tailored Shareholder Report
Key Fund Statistics
(as of February 28, 2026)
|
Fund Size (Thousands) |
$37,526 |
|
Number of Holdings |
11 |
|
Total Advisory Fee Paid |
$182,851 |
|
Portfolio Turnover Rate |
0% |
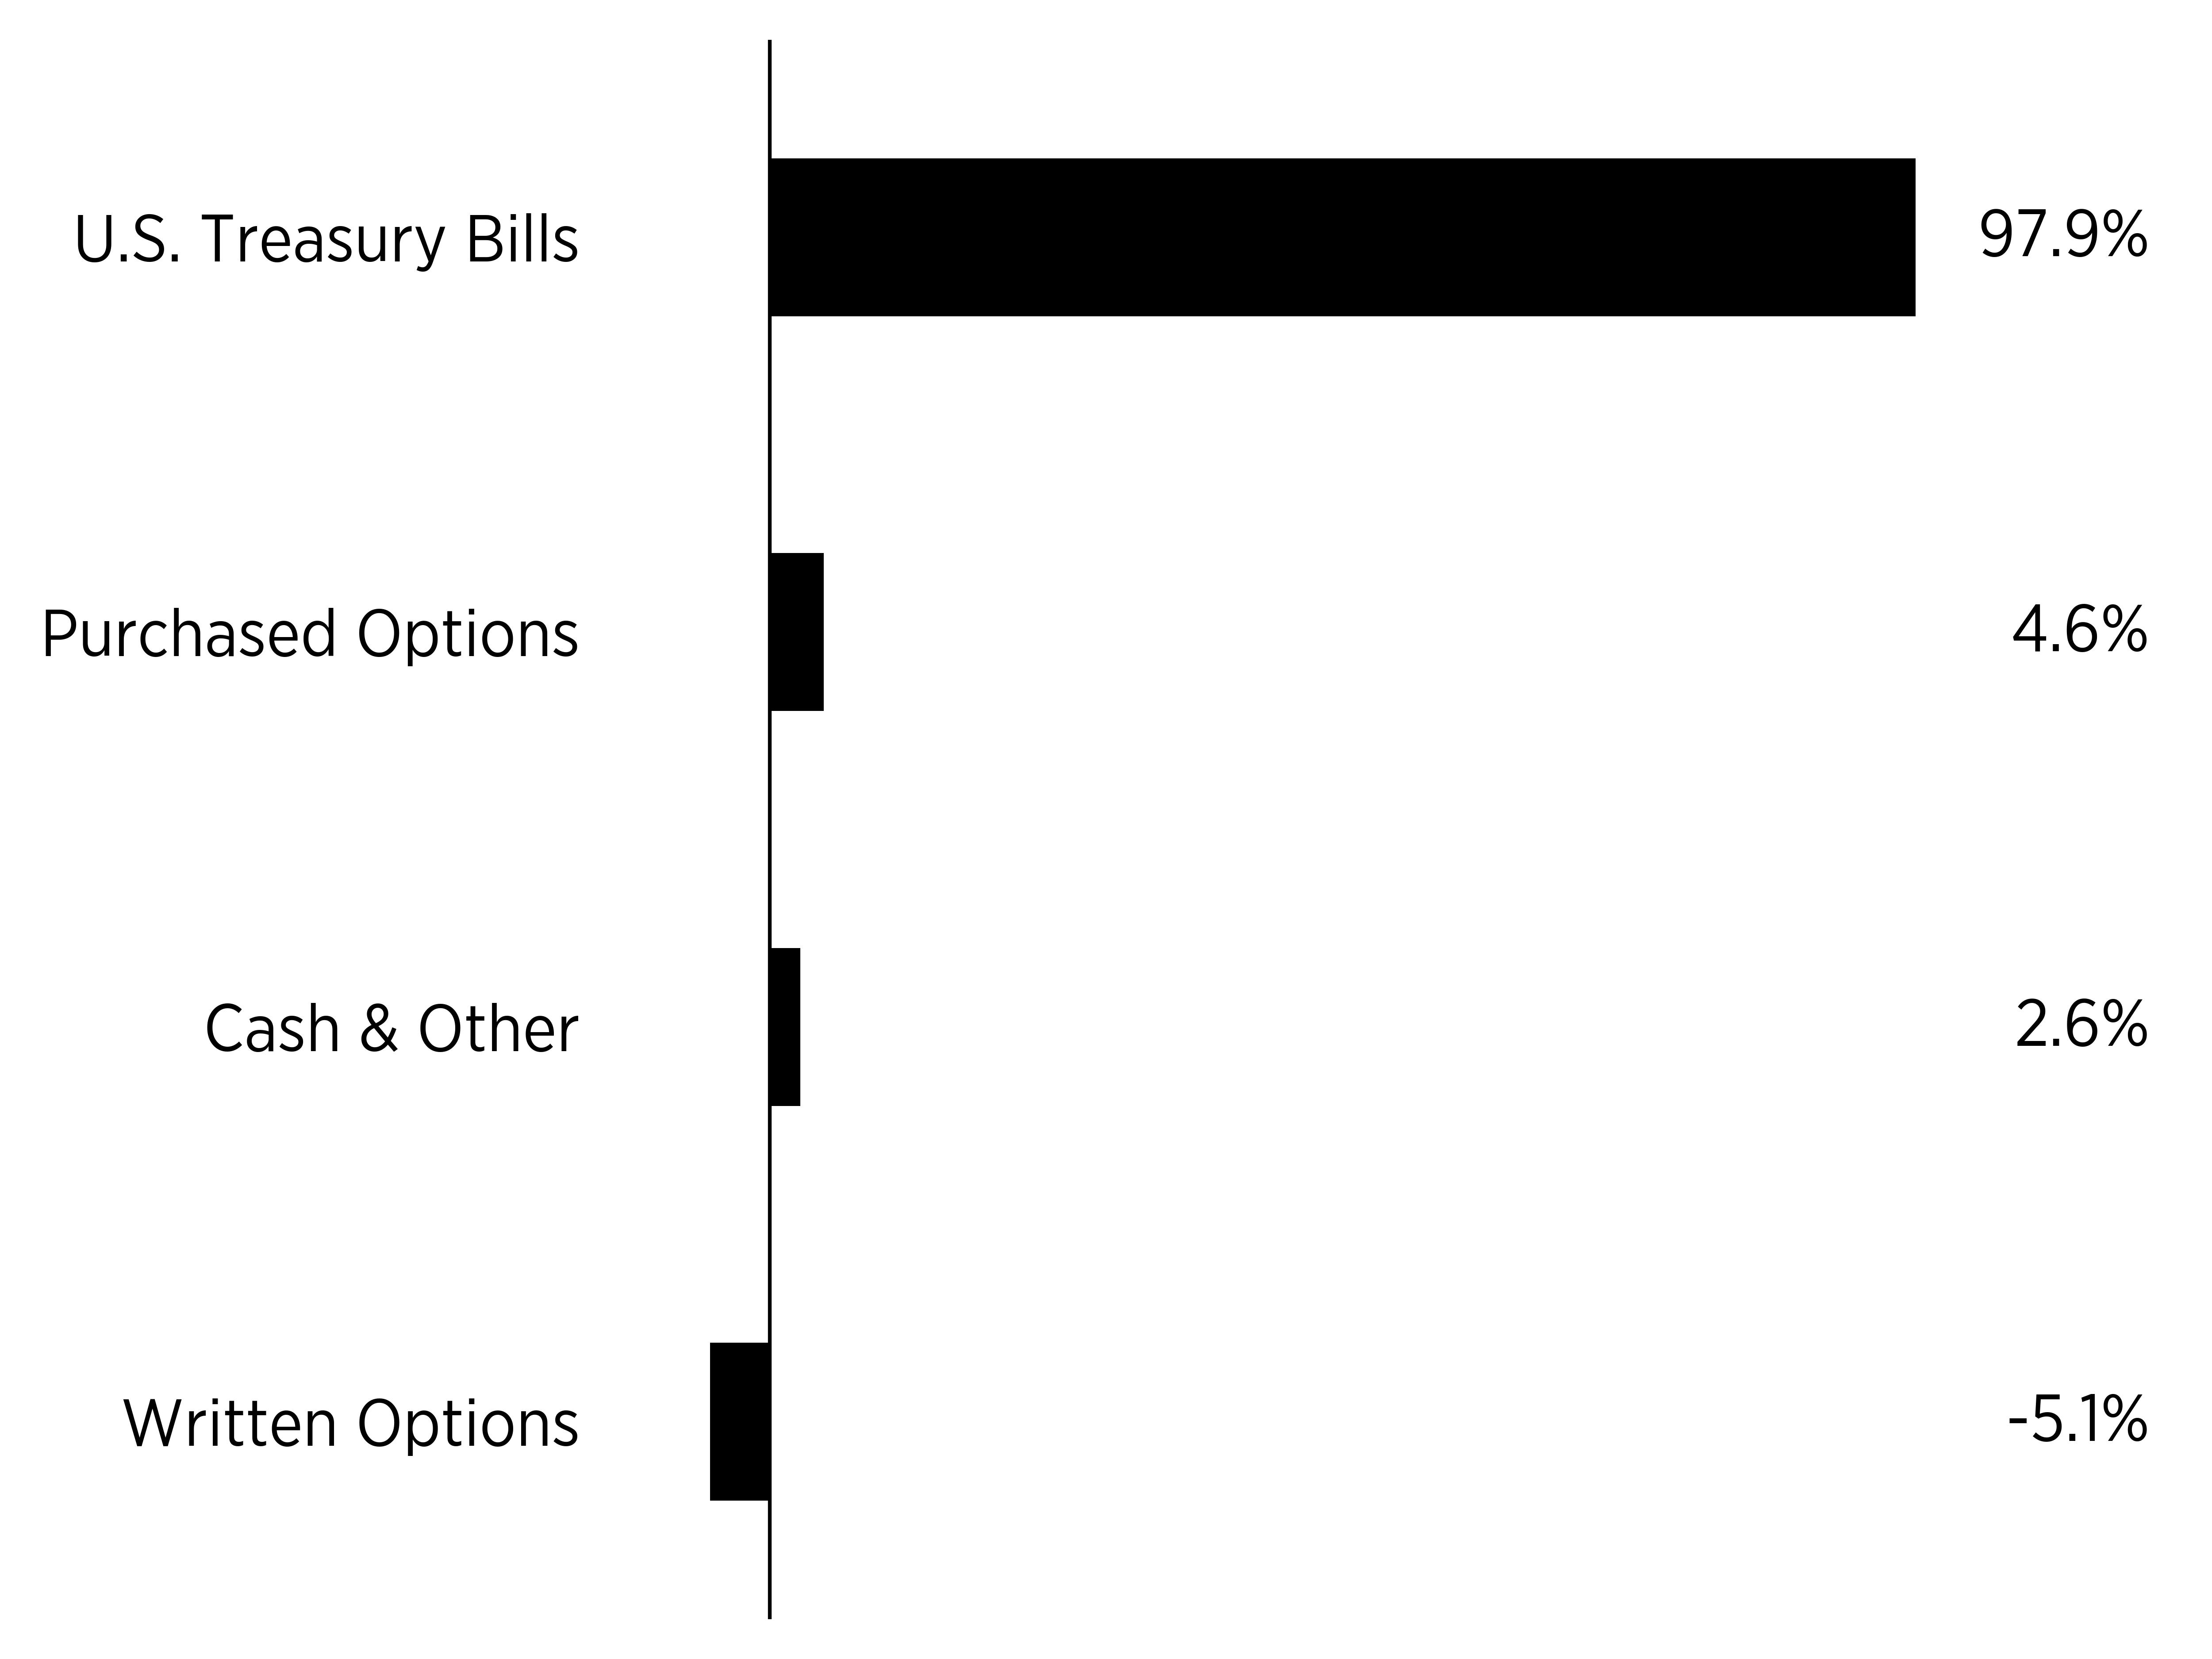
What did the Fund invest in?
(as of February 28, 2026)
Security Breakdown
(% of total net assets)
|
sector |
% |
|
U.S. Treasury Bills |
0.979 |
|
Purchased Options |
0.046 |
|
Cash & Other |
0.026 |
|
Written Options |
-0.051 |
|
Top Ten Holdings |
(% of total net assets) |
|
United States Treasury Bill - 3.48%,
07/09/2026 |
23.5 |
|
United States Treasury Bill - 3.63%,
05/12/2026 |
19.1 |
|
United States Treasury Bill - 3.61%,
06/11/2026 |
15.5 |
|
United States Treasury Bill - 3.54%,
09/03/2026 |
15.4 |
|
United States Treasury Bill - 3.64%,
04/09/2026 |
15.1 |
|
United States Treasury Bill - 3.53%,
08/06/2026 |
9.4 |
|
S&P 500 Index,
Expiration: 03/27/2026;
Exercise Price: $5,500.00 |
4.4 |
|
S&P 500 Index,
Expiration: 03/27/2026;
Exercise Price: $7,450.00 |
0.5 |
|
S&P 500 Index,
Expiration: 03/27/2026;
Exercise Price: $7,400.00 |
0.2 |
|
S&P 500 Index,
Expiration: 03/27/2026;
Exercise Price: $5,550.00 |
0.0 |
This is a summary of certain changes to the Fund. For more complete information, you may review the Fund's prospectus.
How has the Fund Changed?
Effective August 1, 2025, U.S. Bancorp Fund Services, LLC, doing business as Global Fund Services, no longer serves as the Sub‑Administrator for each series of Tidal Trust I, including the Fund.
For additional information about the Fund, including its prospectus, financial information, holdings and proxy voting information, visit www.sofi.com/invest/etfs/thta/.
Householding
Householding is an option available to certain investors of the Fund. Householding is a method of delivery, based on the preference of the individual investor, in which a single copy of certain shareholder documents can be delivered to investors who share the same address, even if their accounts are registered under different names. Householding for the Fund is available through certain broker-dealers. If you are interested in enrolling in householding and receiving a single copy of prospectuses and other shareholder documents, please contact your broker-dealer. If you are currently enrolled in householding and wish to change your householding status, please contact your broker-dealer.
SoFi Enhanced Yield ETF Tailored Shareholder Report
SoFi Select 500 ETF Tailored Shareholder Report
SoFi Select 500 ETF Tailored Shareholder Report
annual Shareholder Report February 28, 2026
SoFi Select 500 ETF
Ticker: SFY (Listed on NYSE Arca, Inc.) |
This annual shareholder report contains important information about the SoFi Select 500 ETF (the "Fund") for the period March 1, 2025 to February 28, 2026. You can find additional information about the Fund at www.sofi.com/invest/etfs/sfy/. You can also request this information by contacting us at (877) 358-0096 or by writing the Fund at SoFi Select 500 ETF, c/o U.S. Bank Global Fund Services, P.O. Box 701, Milwaukee, Wisconsin 53201-0701.
This report describes changes to the Fund that occurred during the reporting period.
What were the Fund costs for the past year?
(based on a hypothetical $10,000 investment)
|
Fund Name |
Costs of a $10,000 investment |
Costs paid as a percentage of a $10,000 investment |
|
SoFi Select 500 ETF |
$6 |
0.05% |
Cumulative Performance
(Initial Investment of $10,000)
|
Date |
SoFi Select 500 ETF - $28,579 |
S&P 500® Total Return Index - $26,530 |
Solactive SoFi US 500 Growth Index - $28,558 |
|
4/10/2019 |
10000 |
10000 |
10000 |
|
4/30/2019 |
10206 |
10204 |
10207 |
|
5/31/2019 |
9549 |
9556 |
9547 |
|
6/30/2019 |
10211 |
10229 |
10213 |
|
7/31/2019 |
10374 |
10376 |
10376 |
|
8/31/2019 |
10173 |
10212 |
10173 |
|
9/30/2019 |
10330 |
10403 |
10331 |
|
10/31/2019 |
10576 |
10628 |
10578 |
|
11/30/2019 |
10967 |
11014 |
10970 |
|
12/31/2019 |
11298 |
11346 |
11304 |
|
1/31/2020 |
11373 |
11342 |
11378 |
|
3/31/2020 |
9218 |
9123 |
9214 |
|
4/30/2020 |
10519 |
10292 |
10518 |
|
5/31/2020 |
11067 |
10782 |
11065 |
|
6/30/2020 |
11329 |
10997 |
11329 |
|
7/31/2020 |
12026 |
11617 |
12027 |
|
8/31/2020 |
12994 |
12452 |
12996 |
|
9/30/2020 |
12575 |
11979 |
12576 |
|
10/31/2020 |
12222 |
11660 |
12222 |
|
11/30/2020 |
13647 |
12936 |
13650 |
|
12/31/2020 |
14130 |
13434 |
14135 |
|
1/31/2021 |
14005 |
13298 |
14009 |
|
2/28/2021 |
14270 |
13665 |
14275 |
|
3/31/2021 |
14805 |
14263 |
14811 |
|
4/30/2021 |
15584 |
15025 |
15592 |
|
5/31/2021 |
15689 |
15129 |
15697 |
|
6/30/2021 |
16290 |
15483 |
16299 |
|
7/31/2021 |
16699 |
15850 |
16709 |
|
8/31/2021 |
17248 |
16332 |
17260 |
|
9/30/2021 |
16433 |
15573 |
16443 |
|
10/31/2021 |
17688 |
16664 |
17700 |
|
11/30/2021 |
17617 |
16548 |
17628 |
|
12/31/2021 |
18057 |
17290 |
18070 |
|
1/31/2022 |
16821 |
16395 |
16832 |
|
2/28/2022 |
16253 |
15904 |
16263 |
|
3/31/2022 |
16916 |
16495 |
16928 |
|
4/30/2022 |
15170 |
15057 |
15177 |
|
5/31/2022 |
15096 |
15084 |
15110 |
|
6/30/2022 |
13699 |
13839 |
13710 |
|
7/31/2022 |
15115 |
15115 |
15130 |
|
8/31/2022 |
14563 |
14499 |
14577 |
|
9/30/2022 |
13234 |
13163 |
13243 |
|
10/31/2022 |
14285 |
14229 |
14297 |
|
11/30/2022 |
14950 |
15024 |
14964 |
|
12/31/2022 |
13944 |
14159 |
13955 |
|
1/31/2023 |
14989 |
15048 |
15004 |
|
2/28/2023 |
14663 |
14681 |
14675 |
|
3/31/2023 |
15172 |
15220 |
15185 |
|
4/30/2023 |
15215 |
15458 |
15229 |
|
5/31/2023 |
15476 |
15525 |
15488 |
|
6/30/2023 |
16566 |
16551 |
16583 |
|
7/31/2023 |
17171 |
17082 |
17189 |
|
8/31/2023 |
16891 |
16810 |
16909 |
|
9/30/2023 |
16168 |
16009 |
16183 |
|
10/31/2023 |
15706 |
15672 |
15719 |
|
11/30/2023 |
17227 |
17104 |
17245 |
|
12/31/2023 |
18042 |
17881 |
18063 |
|
1/31/2024 |
18246 |
18181 |
18266 |
|
2/29/2024 |
19252 |
19152 |
19275 |
|
3/31/2024 |
19821 |
19768 |
19848 |
|
4/30/2024 |
19057 |
18961 |
19079 |
|
5/31/2024 |
20234 |
19901 |
20263 |
|
6/30/2024 |
21276 |
20615 |
21309 |
|
7/31/2024 |
21226 |
20866 |
21255 |
|
8/31/2024 |
21722 |
21372 |
21751 |
|
9/30/2024 |
22242 |
21828 |
22271 |
|
10/31/2024 |
22418 |
21630 |
22445 |
|
11/30/2024 |
23905 |
22900 |
23943 |
|
12/31/2024 |
23408 |
22354 |
23438 |
|
1/31/2025 |
23888 |
22977 |
23908 |
|
2/28/2025 |
23615 |
22677 |
23656 |
|
3/31/2025 |
21942 |
21399 |
21984 |
|
4/30/2025 |
22048 |
21254 |
22081 |
|
5/31/2025 |
23943 |
22592 |
23977 |
|
6/30/2025 |
25564 |
23741 |
25598 |
|
7/31/2025 |
26442 |
24274 |
26478 |
|
8/31/2025 |
26779 |
24766 |
26813 |
|
9/30/2025 |
27971 |
25670 |
28011 |
|
10/31/2025 |
29002 |
26271 |
29038 |
|
11/30/2025 |
28715 |
26335 |
28719 |
|
12/31/2025 |
28731 |
26351 |
28736 |
|
1/31/2026 |
29116 |
26733 |
29105 |
|
2/28/2026 |
28579 |
26530 |
28558 |
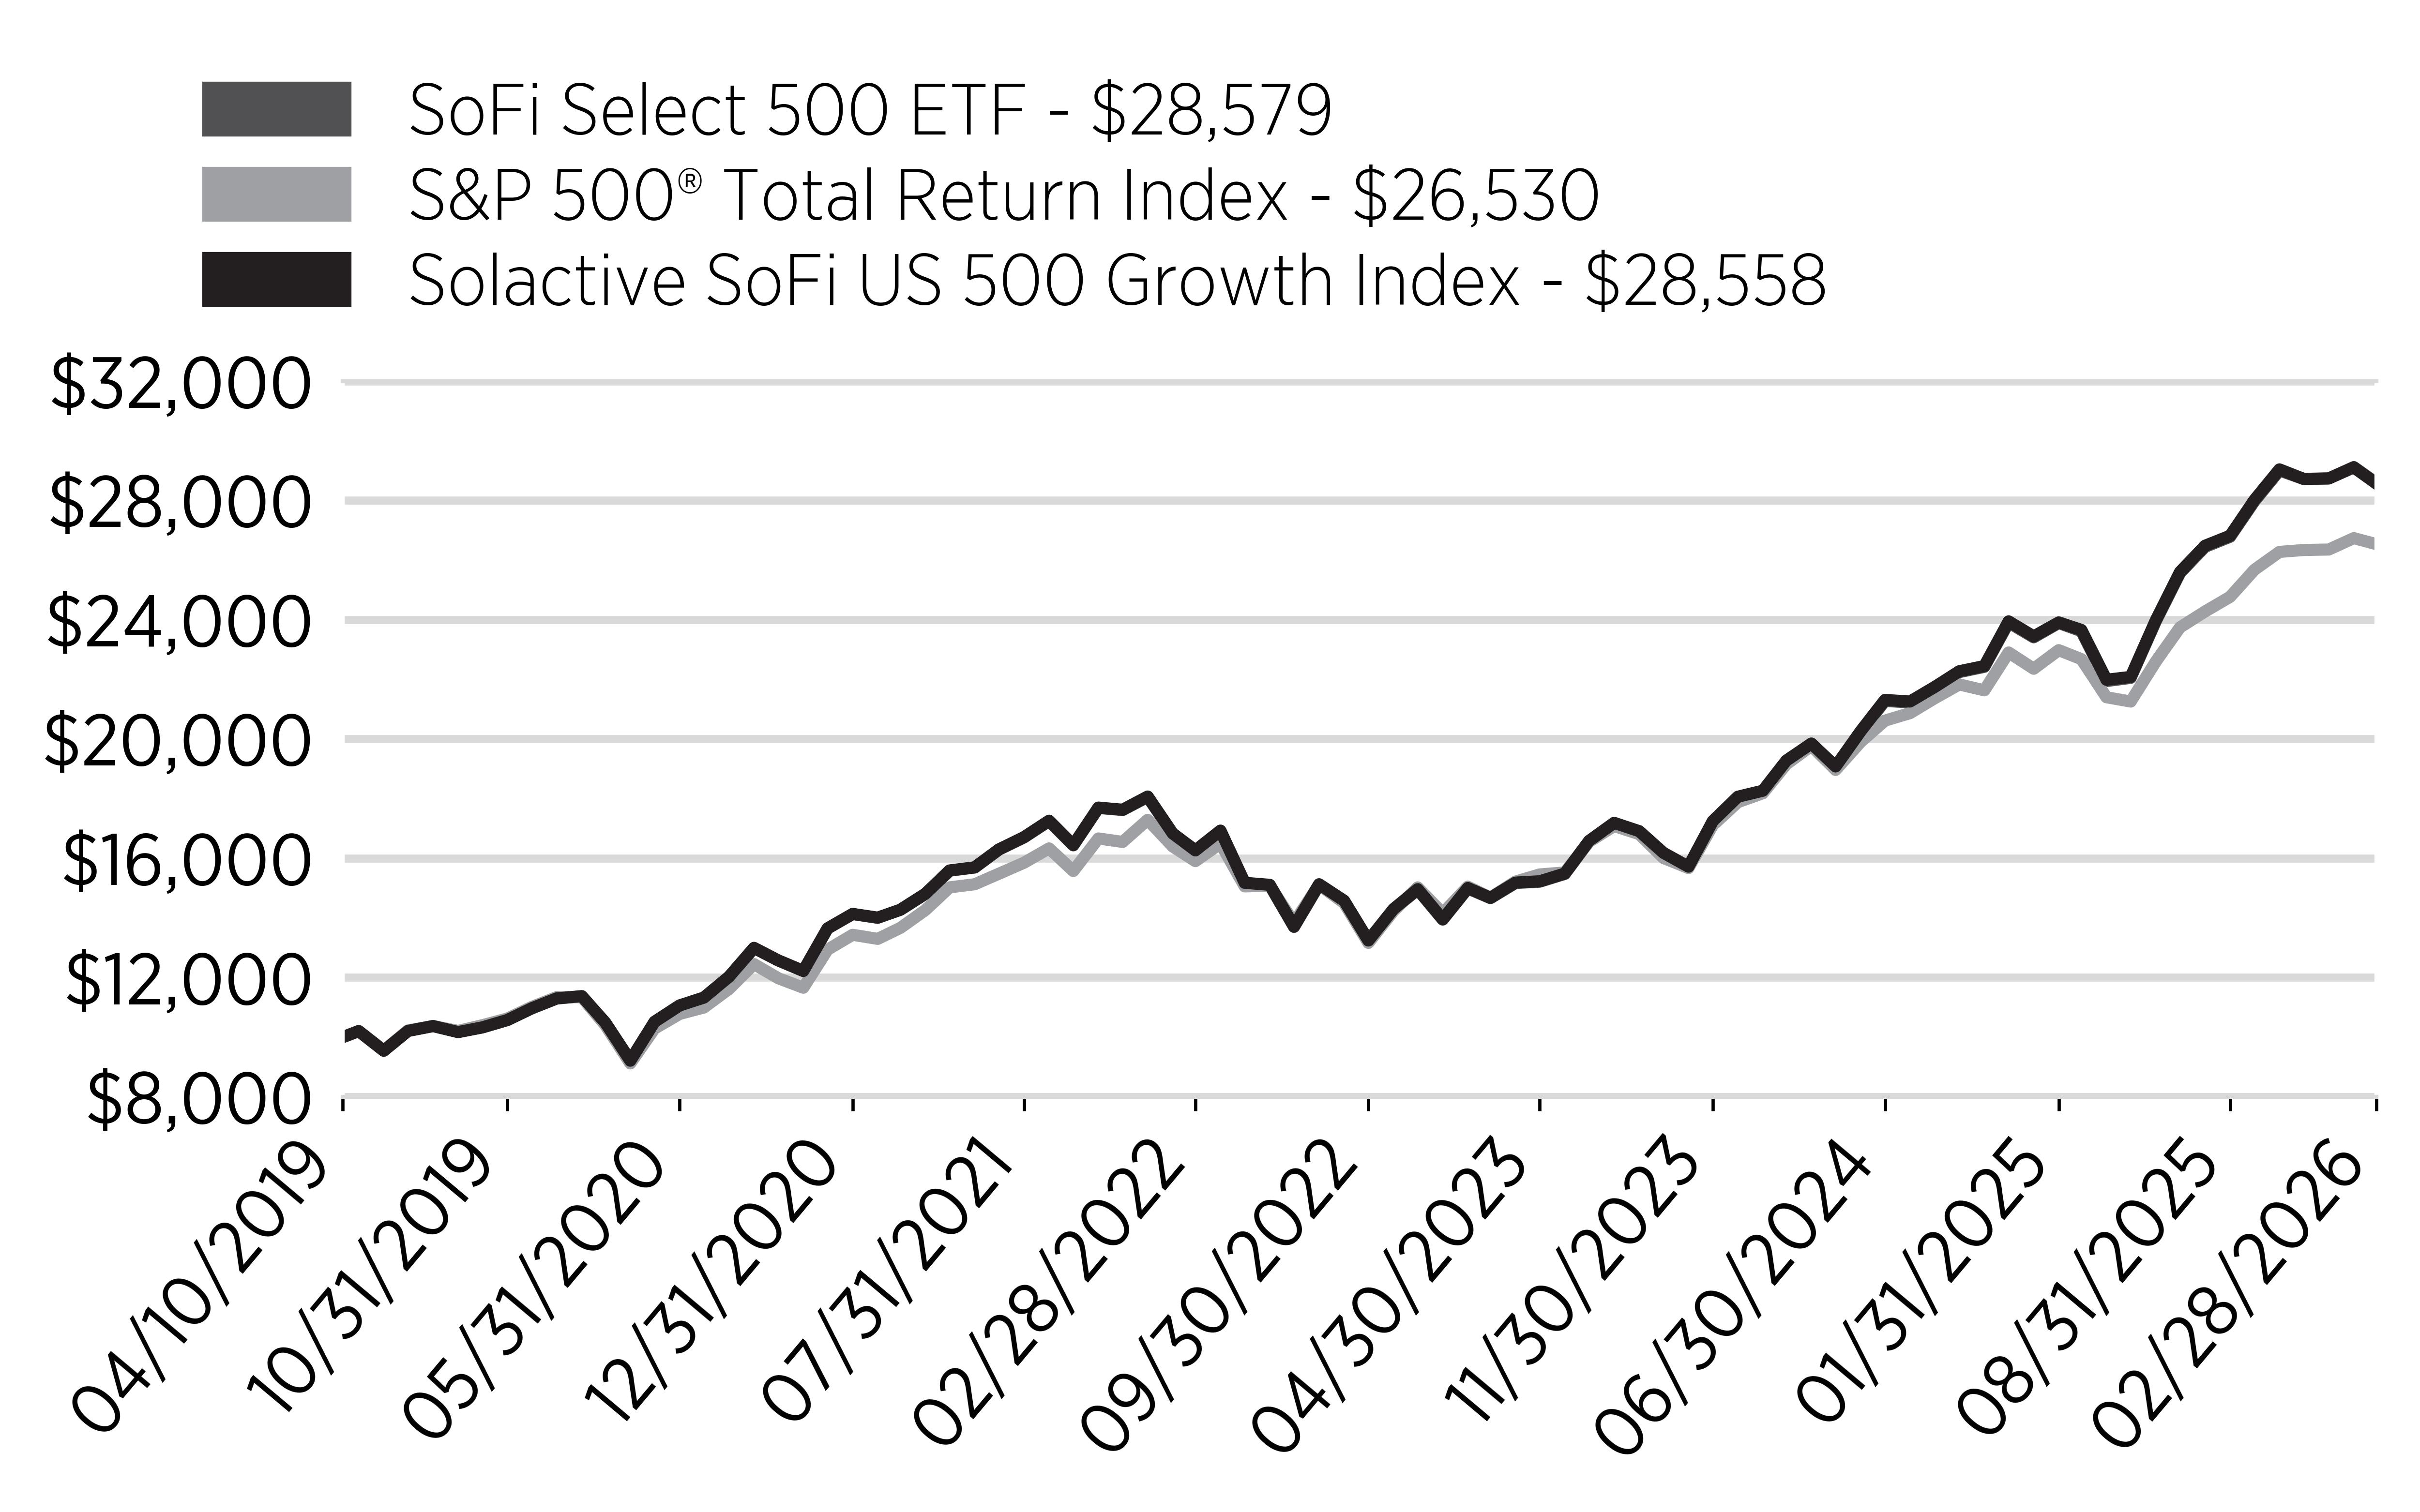
Annual Performance
|
Average Annual Returns for the Periods Ended February 28, 2026 |
1 Year |
5 Years |
Since Inception 4/10/2019 |
|
SoFi Select 500 ETF |
21.02% |
14.90% |
16.47% |
|
S&P 500® Total Return Index |
16.99% |
14.19% |
15.22% |
|
Solactive SoFi US 500 Growth Index |
20.72% |
14.88% |
16.46% |
The Fund's past performance is not a good indicator of how the Fund will perform in the future. The graph and table do not reflect the deduction of tax that a shareholder would pay on fund distributions or redemption of fund shares.
Visit www.sofi.com/invest/etfs/sfy/ for more recent performance information.
How did the Fund perform last year and what affected its performance?
For the fiscal year ended February 28, 2026, U.S. financial markets posted positive returns, supported by solid corporate earnings, continued artificial intelligence ("AI")-related investment, and moderating inflation. However, market conditions became more volatile later in the period as investors responded to shifting interest-rate expectations, tariff-related uncertainty, and changing leadership within large-cap equities.
For the fiscal year ended February 28, 2026, the Fund returned 21.02%. This closely tracked the 20.72% total return of the Solactive SoFi US 500 Growth Index (“SFY Index”), the Fund’s underlying index. In comparison, the S&P 500® Total Return Index, a broad market benchmark, gained 16.99% over the same period. Equity returns were supported by continued strength in growth-oriented sectors, especially information technology and communication services, as investors favored companies with strong earnings momentum and exposure to AI-related spending trends. While market breadth improved at times, performance leadership remained concentrated for much of the period, which benefited the Fund’s growth tilt relative to the broader market.
What factors influenced performance?
Sector performance attribution showed that the Information Technology and Communication Services sectors were the largest contributors to the Fund’s returns, while the Financials and Real Estate sectors contributed less favorably to performance.
At the individual stock level, leading contributors to the Fund’s results included NVIDIA Corp., Broadcom Inc., and Micron Technology, Inc. Conversely, UnitedHealth Group Incorporated, ServiceNow, Inc., and Salesforce, Inc. were among the top detractors.
SoFi Select 500 ETF Tailored Shareholder Report
SoFi Select 500 ETF Tailored Shareholder Report
SoFi Select 500 ETF Tailored Shareholder Report
Key Fund Statistics
(as of February 28, 2026)
|
Fund Size (Thousands) |
$578,251 |
|
Number of Holdings |
506 |
|
Net Advisory Fee Paid |
$260,284 |
|
Portfolio Turnover Rate |
15% |
What did the Fund invest in?
(as of February 28, 2026)
Sector Breakdown
(% of total net assets)
|
sector |
% |
|
Tech Hardware & Semiconductors |
0.308 |
|
Health Care |
0.11 |
|
Media |
0.105 |
|
Software & Tech Services |
0.092 |
|
Financial Services |
0.06 |
|
Industrial Products |
0.059 |
|
Retail & Wholesale - Discretionary |
0.042 |
|
Banking |
0.024 |
|
Oil & Gas |
0.024 |
|
Consumer Staple Products |
0.023 |
|
Materials |
0.023 |
|
Insurance |
0.022 |
|
Utilities |
0.021 |
|
Industrial Services |
0.018 |
|
Real Estate |
0.017 |
|
Consumer Discretionary Products |
0.016 |
|
Retail & Wholesale - Staples |
0.015 |
|
Consumer Discretionary Services |
0.012 |
|
Telecommunications |
0.006 |
|
Renewable Energy |
0 |
|
Cash & Other |
0.003 |
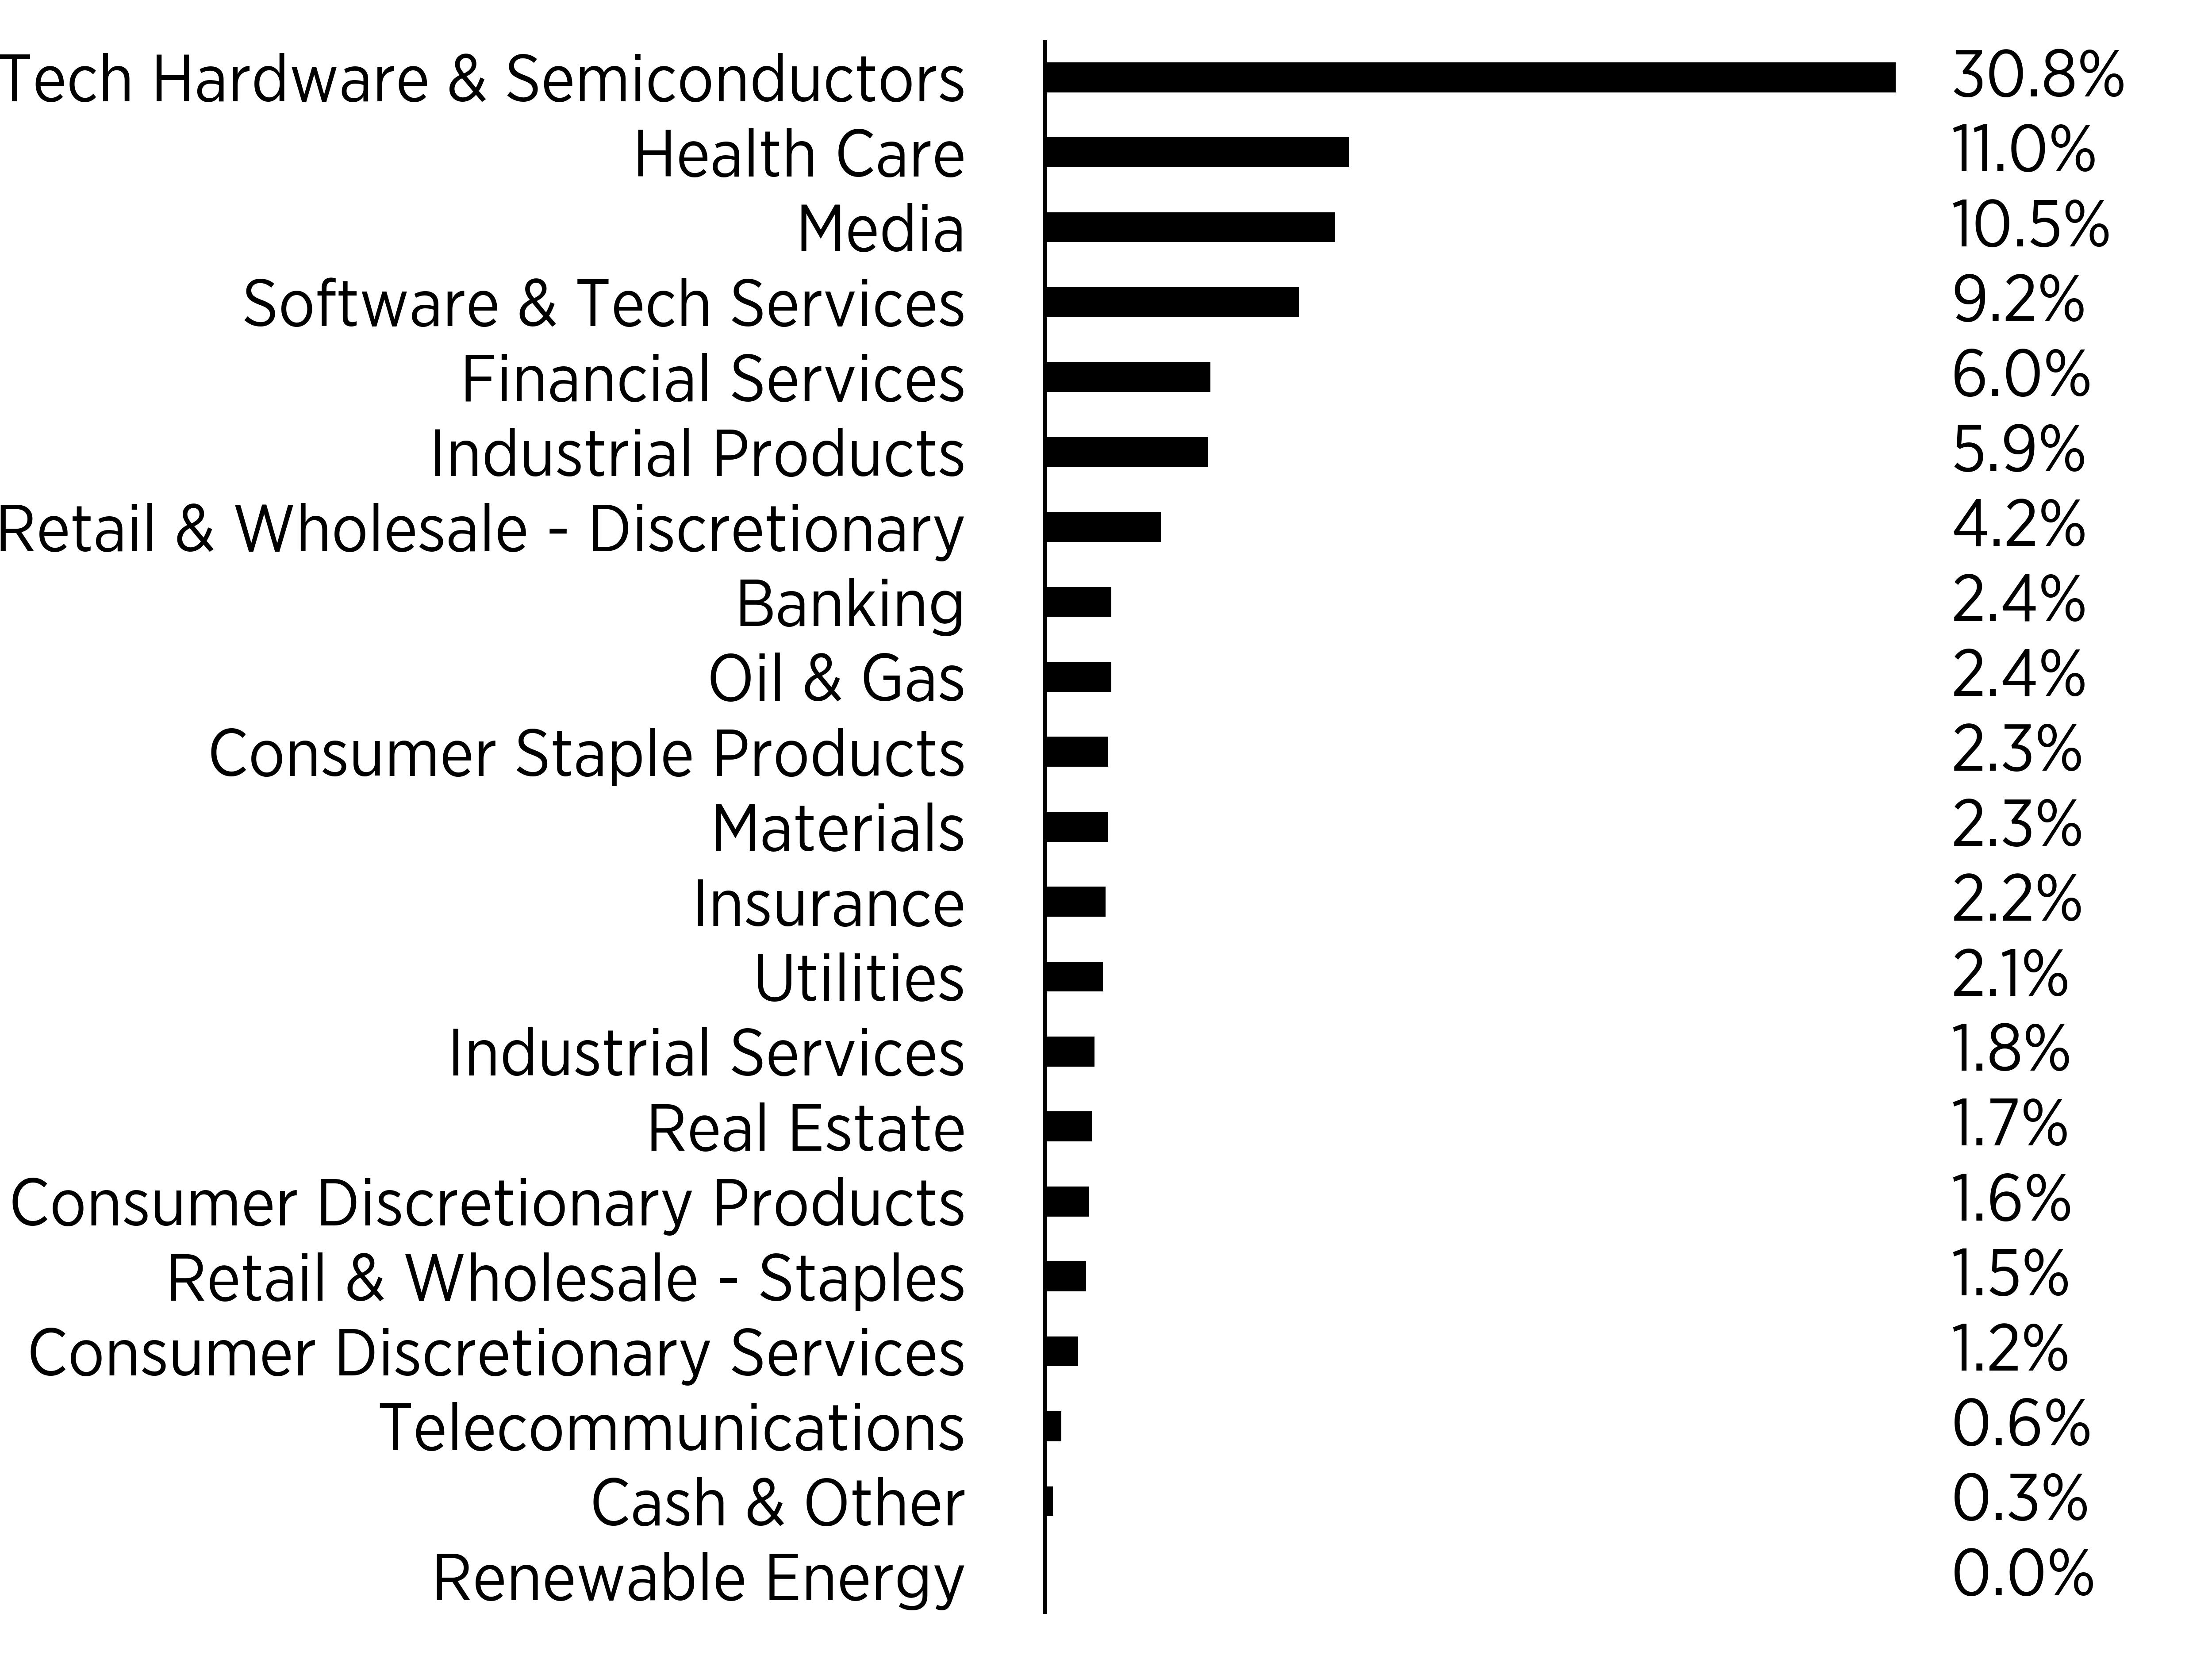
|
Top Ten Holdings |
(% of total net assets) |
|
NVIDIA Corp. |
13.2 |
|
Broadcom, Inc. |
4.8 |
|
Microsoft Corp. |
4.4 |
|
Apple, Inc. |
4.3 |
|
Meta Platforms, Inc. |
2.8 |
|
Amazon.com, Inc. |
2.7 |
|
Alphabet, Inc. |
2.4 |
|
Micron Technology, Inc. |
2.4 |
|
Eli Lilly & Co. |
2.2 |
|
Alphabet, Inc. |
2.1 |
Householding
Householding is an option available to certain investors of the Fund. Householding is a method of delivery, based on the preference of the individual investor, in which a single copy of certain shareholder documents can be delivered to investors who share the same address, even if their accounts are registered under different names. Householding for the Fund is available through certain broker-dealers. If you are interested in enrolling in householding and receiving a single copy of prospectuses and other shareholder documents, please contact your broker-dealer. If you are currently enrolled in householding and wish to change your householding status, please contact your broker-dealer.
This is a summary of certain changes to the Fund. For more complete information, you may review the Fund's prospectus.
How has the Fund Changed?
Effective August 1, 2025, U.S. Bancorp Fund Services, LLC, doing business as Global Fund Services, no longer serves as the Sub‑Administrator for each series of Tidal Trust I, including the Fund.
For additional information about the Fund, including its prospectus, financial information, holdings and proxy voting information, visit www.sofi.com/invest/etfs/sfy/.
SoFi Select 500 ETF Tailored Shareholder Report
SoFi Social 50 ETF Tailored Shareholder Report
SoFi Social 50 ETF Tailored Shareholder Report
annual Shareholder Report February 28, 2026
SoFi Social 50 ETF
Ticker: SFYF (Listed on NYSE Arca, Inc.) |
This annual shareholder report contains important information about the SoFi Social 50 ETF (the "Fund") for the period March 1, 2025 to February 28, 2026. You can find additional information about the Fund at www.sofi.com/invest/etfs/sfyf/. You can also request this information by contacting us at (877) 358-0096 or by writing the Fund at SoFi Social 50 ETF, c/o U.S. Bank Global Fund Services, P.O. Box 701, Milwaukee, Wisconsin 53201-0701.
This report describes changes to the Fund that occurred during the reporting period.
What were the Fund costs for the past year?
(based on a hypothetical $10,000 investment)
|
Fund Name |
Costs of a $10,000 investment |
Costs paid as a percentage of a $10,000 investment |
|
SoFi Social 50 ETF |
$33 |
0.29% |
Cumulative Performance
(Initial Investment of $10,000)
|
Date |
SoFi Social 50 ETF - $28,068 |
S&P 500® Total Return Index - $26,550 |
SoFi Social 50 Index - $28,668 |
|
5/7/2019 |
10000 |
10000 |
10000 |
|
5/31/2019 |
9368 |
9563 |
9370 |
|
6/30/2019 |
10224 |
10237 |
10230 |
|
7/31/2019 |
10107 |
10384 |
10113 |
|
8/31/2019 |
9463 |
10219 |
9470 |
|
9/30/2019 |
9478 |
10411 |
9487 |
|
10/31/2019 |
9650 |
10636 |
9661 |
|
11/30/2019 |
10191 |
11022 |
10212 |
|
12/31/2019 |
10528 |
11355 |
10553 |
|
1/31/2020 |
10293 |
11350 |
10321 |
|
2/29/2020 |
9433 |
10416 |
9457 |
|
3/31/2020 |
7567 |
9130 |
7581 |
|
4/30/2020 |
8902 |
10300 |
8931 |
|
5/31/2020 |
9430 |
10790 |
9469 |
|
6/30/2020 |
9587 |
11005 |
9628 |
|
7/31/2020 |
10539 |
11626 |
10592 |
|
8/31/2020 |
12456 |
12461 |
12523 |
|
9/30/2020 |
11707 |
11988 |
11783 |
|
10/31/2020 |
11288 |
11669 |
11306 |
|
11/30/2020 |
13723 |
12946 |
13750 |
|
12/31/2020 |
14056 |
13444 |
14090 |
|
1/31/2021 |
14628 |
13308 |
14681 |
|
2/28/2021 |
14874 |
13675 |
14919 |
|
3/31/2021 |
15161 |
14274 |
15316 |
|
4/30/2021 |
15480 |
15036 |
15576 |
|
5/31/2021 |
16758 |
15141 |
16864 |
|
6/30/2021 |
20265 |
15494 |
20578 |
|
7/31/2021 |
19163 |
15863 |
19290 |
|
8/31/2021 |
20407 |
16345 |
20509 |
|
9/30/2v021 |
19070 |
15585 |
19166 |
|
10/31/2021 |
20386 |
16677 |
20494 |
|
11/30/2021 |
20227 |
16561 |
20349 |
|
12/31/2021 |
19091 |
17303 |
19160 |
|
1/31/2022 |
16494 |
16408 |
16525 |
|
2/28/2022 |
16042 |
15917 |
16077 |
|
3/31/2022 |
16913 |
16508 |
16971 |
|
4/30/2022 |
13534 |
15068 |
13568 |
|
5/31/2022 |
13053 |
15096 |
13084 |
|
6/30/2022 |
11669 |
13850 |
11692 |
|
7/31/2022 |
13467 |
15127 |
13490 |
|
8/31/2022 |
12839 |
14510 |
12763 |
|
9/30/2022 |
11253 |
13173 |
11179 |
|
10/31/2022 |
11693 |
14240 |
11611 |
|
11/30/2022 |
11844 |
15036 |
11771 |
|
12/31/2022 |
9989 |
14169 |
9930 |
|
1/31/2023 |
11957 |
15060 |
11911 |
|
2/28/2023 |
11713 |
14692 |
11921 |
|
3/31/2023 |
12227 |
15232 |
12437 |
|
4/30/2023 |
11873 |
15469 |
12057 |
|
5/31/2023 |
13051 |
15537 |
13247 |
|
6/30/2023 |
14374 |
16563 |
14580 |
|
7/31/2023 |
15706 |
17095 |
15929 |
|
8/31/2023 |
14528 |
16823 |
14685 |
|
9/30/2023 |
13823 |
16021 |
13975 |
|
10/31/2023 |
12945 |
15684 |
13076 |
|
11/30/2023 |
14660 |
17117 |
14819 |
|
12/31/2023 |
15667 |
17894 |
15862 |
|
1/31/2024 |
14948 |
18195 |
15136 |
|
2/29/2024 |
16746 |
19166 |
16985 |
|
3/31/2024 |
17047 |
19783 |
17291 |
|
4/30/2024 |
16049 |
18975 |
16292 |
|
5/31/2024 |
17206 |
19916 |
17470 |
|
6/30/2024 |
18437 |
20631 |
18716 |
|
7/31/2024 |
18625 |
20882 |
18909 |
|
8/31/2024 |
18684 |
21388 |
18964 |
|
9/30/2024 |
19676 |
21845 |
19979 |
|
10/31/2024 |
19660 |
21647 |
19970 |
|
11/30/2024 |
22319 |
22918 |
22709 |
|
12/31/2024 |
22630 |
22371 |
23069 |
|
1/31/2025 |
23299 |
22994 |
23755 |
|
2/28/2025 |
22005 |
22694 |
22423 |
|
3/31/2025 |
20192 |
21416 |
20575 |
|
4/30/2025 |
21016 |
21270 |
21423 |
|
5/31/2025 |
23162 |
22609 |
23622 |
|
6/30/2025 |
24578 |
23759 |
25086 |
|
7/31/2025 |
25571 |
24292 |
26101 |
|
8/31/2025 |
26437 |
24785 |
27000 |
|
9/30/2025 |
28802 |
25689 |
29420 |
|
10/31/2025 |
30105 |
26291 |
30753 |
|
11/30/2025 |
29366 |
26355 |
30003 |
|
12/31/2025 |
29388 |
26371 |
30030 |
|
1/31/2026 |
28950 |
26754 |
29584 |
|
2/28/2026 |
28068 |
26550 |
28688 |
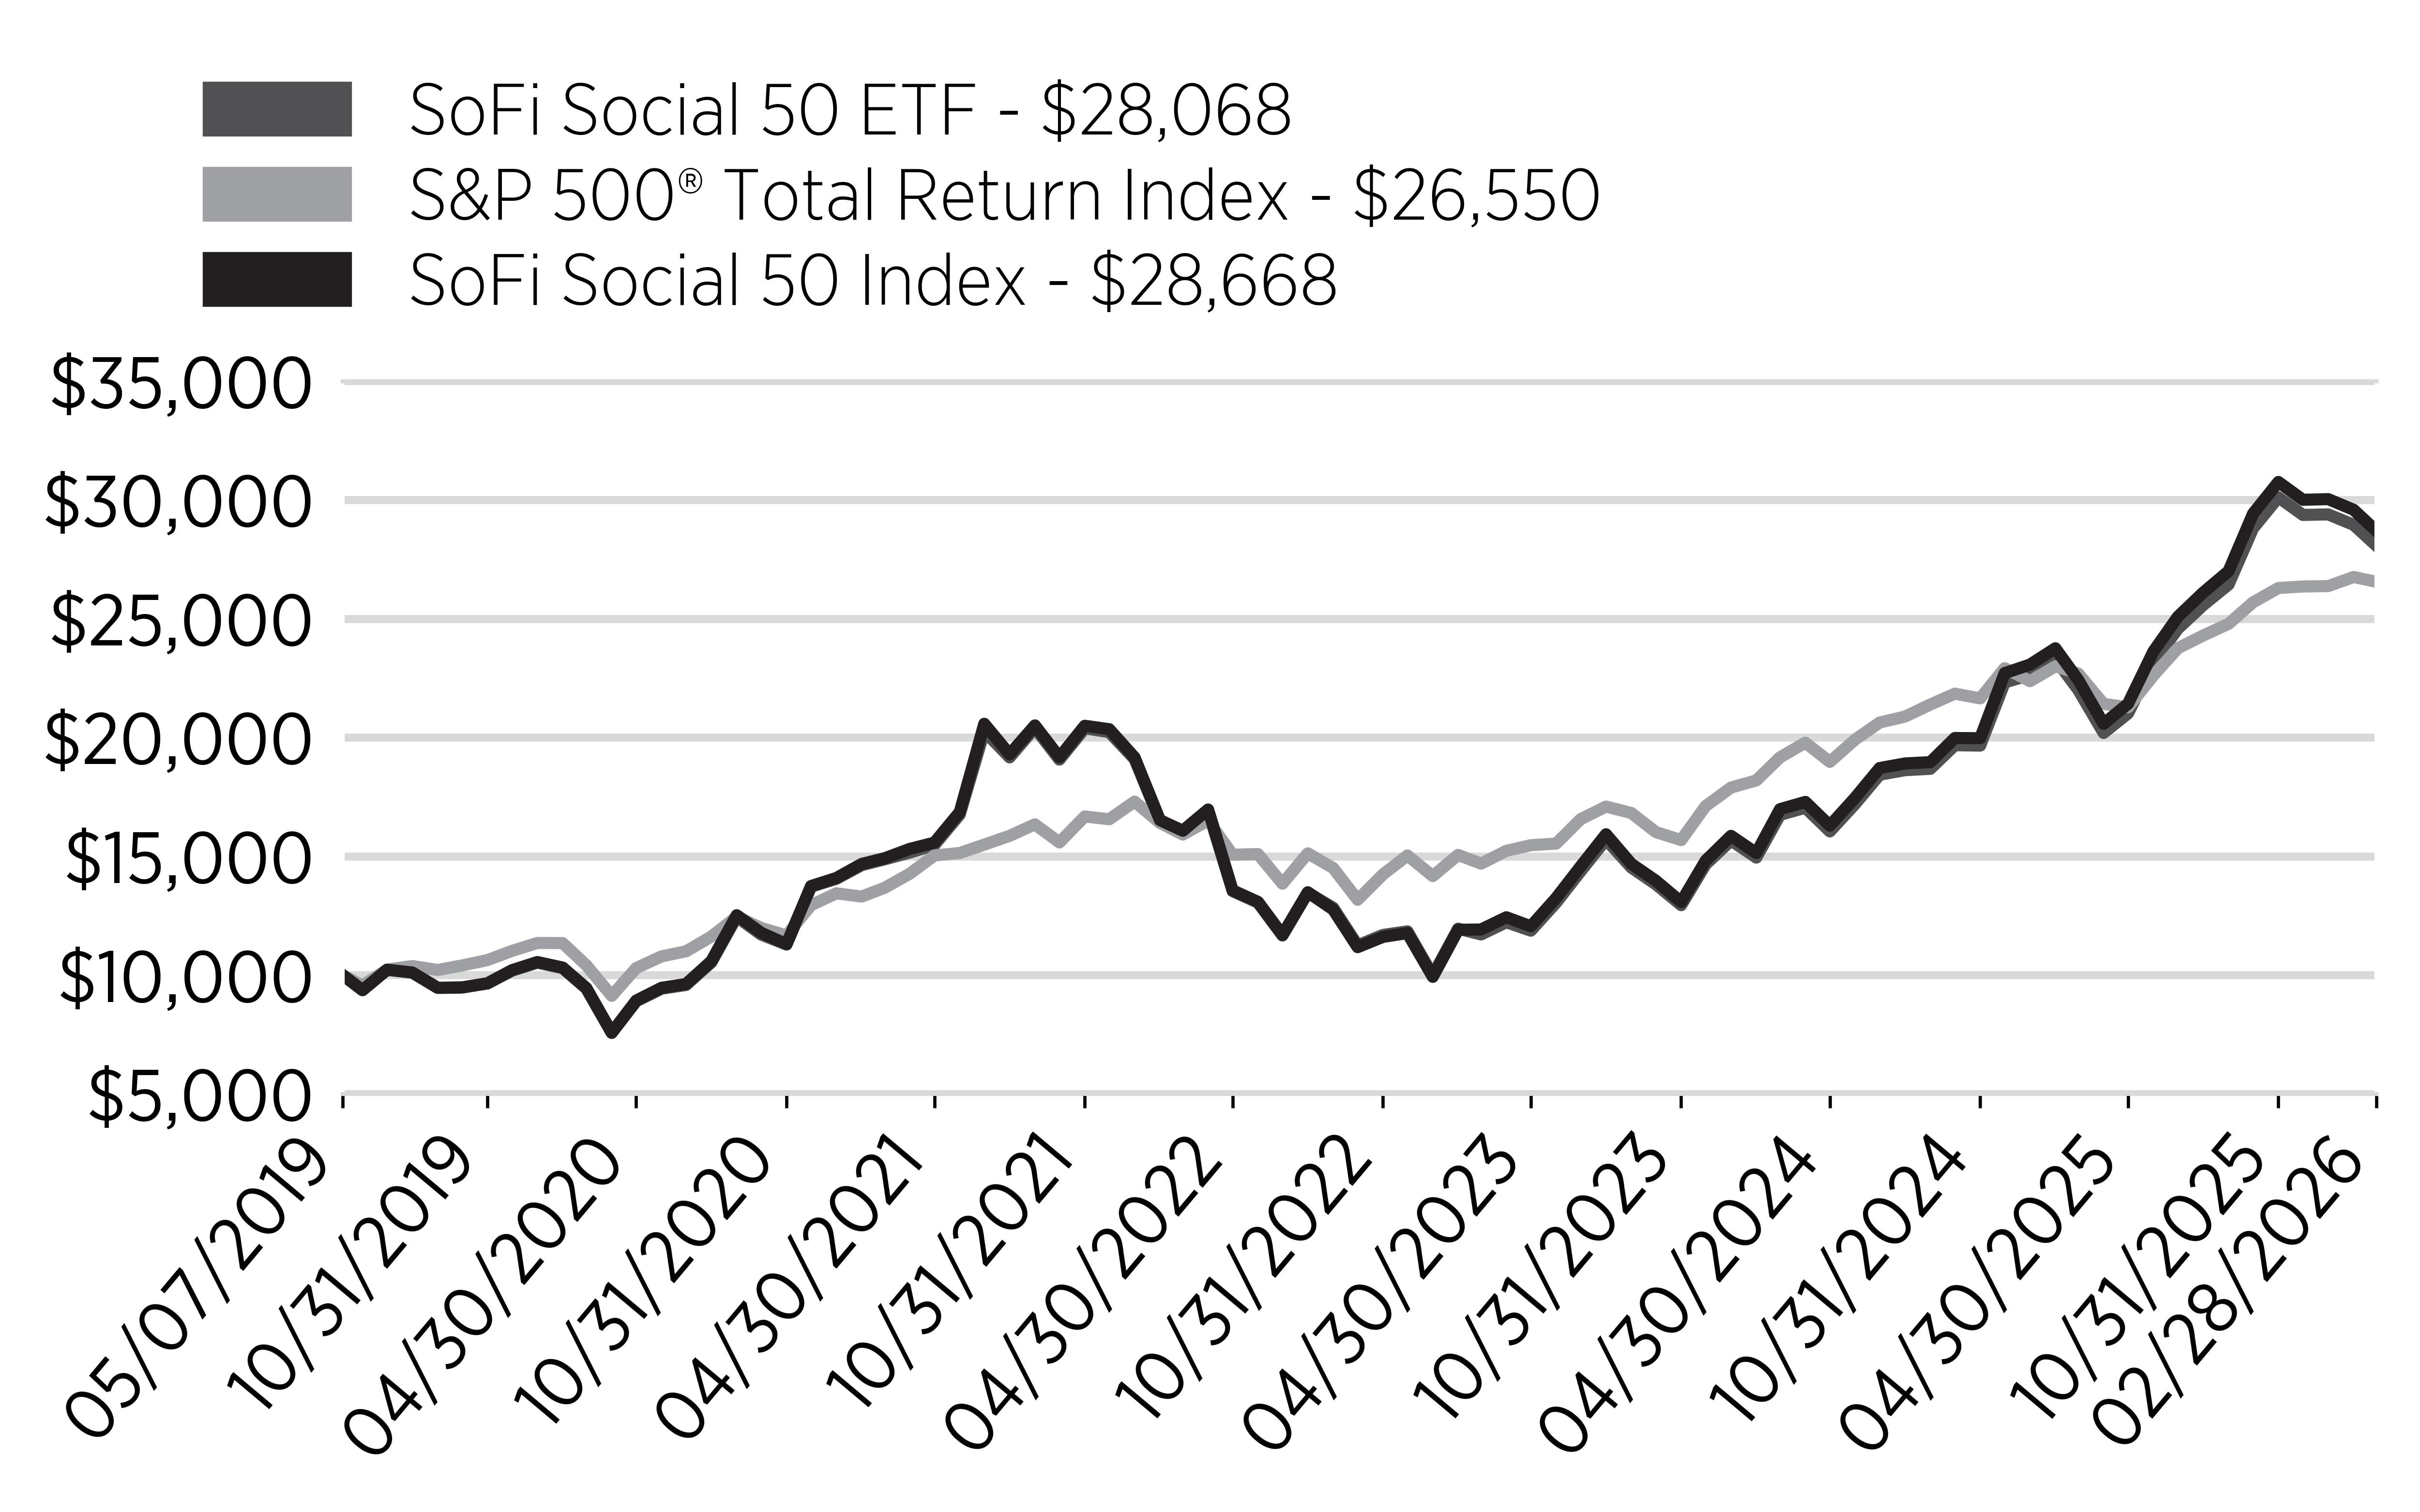
Annual Performance
|
Average Annual Returns for the Periods Ended February 28, 2026 |
1 Year |
5 Years |
Since Inception (5/7/2019) |
|
SoFi Social 50 ETF |
27.55% |
13.54% |
16.35% |
|
S&P 500® Total Return Index |
16.99% |
14.19% |
15.41% |
|
SoFi Social 50 Index |
27.94% |
13.97% |
16.73% |
The Fund's past performance is not a good indicator of how the Fund will perform in the future. The graph and table do not reflect the deduction of tax that a shareholder would pay on fund distributions or redemption of fund shares.
Visit www.sofi.com/invest/etfs/sfyf/ for more recent performance information.
How did the Fund perform last year and what affected its performance?
For the fiscal year ended February 28, 2026, U.S. equity markets generated strong returns, supported by continued earnings growth, ongoing artificial intelligence ("AI")-related capital spending, and moderating inflation. Market conditions remained constructive for much of the period, aided by a relatively stable interest-rate backdrop, although volatility increased at times as investors weighed trade-policy developments, valuation levels, and the sustainability of AI-driven growth expectations.
For the fiscal year ended February 28, 2026, the Fund returned 27.55%, compared with 27.94% for the SoFi Social 50 index (the "SFYF Index"), the Fund's underlying index, and 16.99% for the S&P 500® Total Return Index. The Fund’s performance reflected the strength of large-cap growth stocks, particularly technology and internet-related companies that benefited from strong earnings results and continued investor interest in AI-related themes. While these exposures supported returns, they also contributed to periods of volatility as markets periodically pulled back on concerns about trade policy, valuation, inflation, and the timing of future monetary easing.
What factors influenced performance?
Sector performance attribution showed that Information Technology and Consumer Discretionary were the largest contributors to the Fund’s returns, driven in part by strong performance from several large technology-oriented holdings. The Financials sector detracted from performance.
At the individual stock level, top contributors included Tesla, Inc., NVIDIA Corp., and Alphabet Inc. Leading detractors included PayPal Holdings, Inc., Lucid Group, Inc., and Figma, Inc.
SoFi Social 50 ETF Tailored Shareholder Report
SoFi Social 50 ETF Tailored Shareholder Report
SoFi Social 50 ETF Tailored Shareholder Report
Key Fund Statistics
(as of February 28, 2026)
|
Fund Size (Thousands) |
$35,714 |
|
Number of Holdings |
52 |
|
Total Advisory Fee Paid |
$93,551 |
|
Portfolio Turnover Rate |
51% |
What did the Fund invest in?
(as of February 28, 2026)
Sector Breakdown
(% of total net assets)
|
sector |
% |
|
Tech Hardware & Semiconductors |
0.242 |
|
Consumer Discretionary Products |
0.154 |
|
Media |
0.151 |
|
Software & Tech Services |
0.104 |
|
Retail & Wholesale - Discretionary |
0.077 |
|
Retail & Wholesale - Staples |
0.064 |
|
Health Care |
0.059 |
|
Insurance |
0.047 |
|
Oil & Gas |
0.022 |
|
Financial Services |
0.021 |
|
Real Estate |
0.015 |
|
Consumer Staple Products |
0.014 |
|
Telecommunications |
0.012 |
|
Consumer Discretionary Services |
0.006 |
|
Industrial Products |
0.006 |
|
Industrial Services |
0.005 |
|
Cash & other |
0.001 |
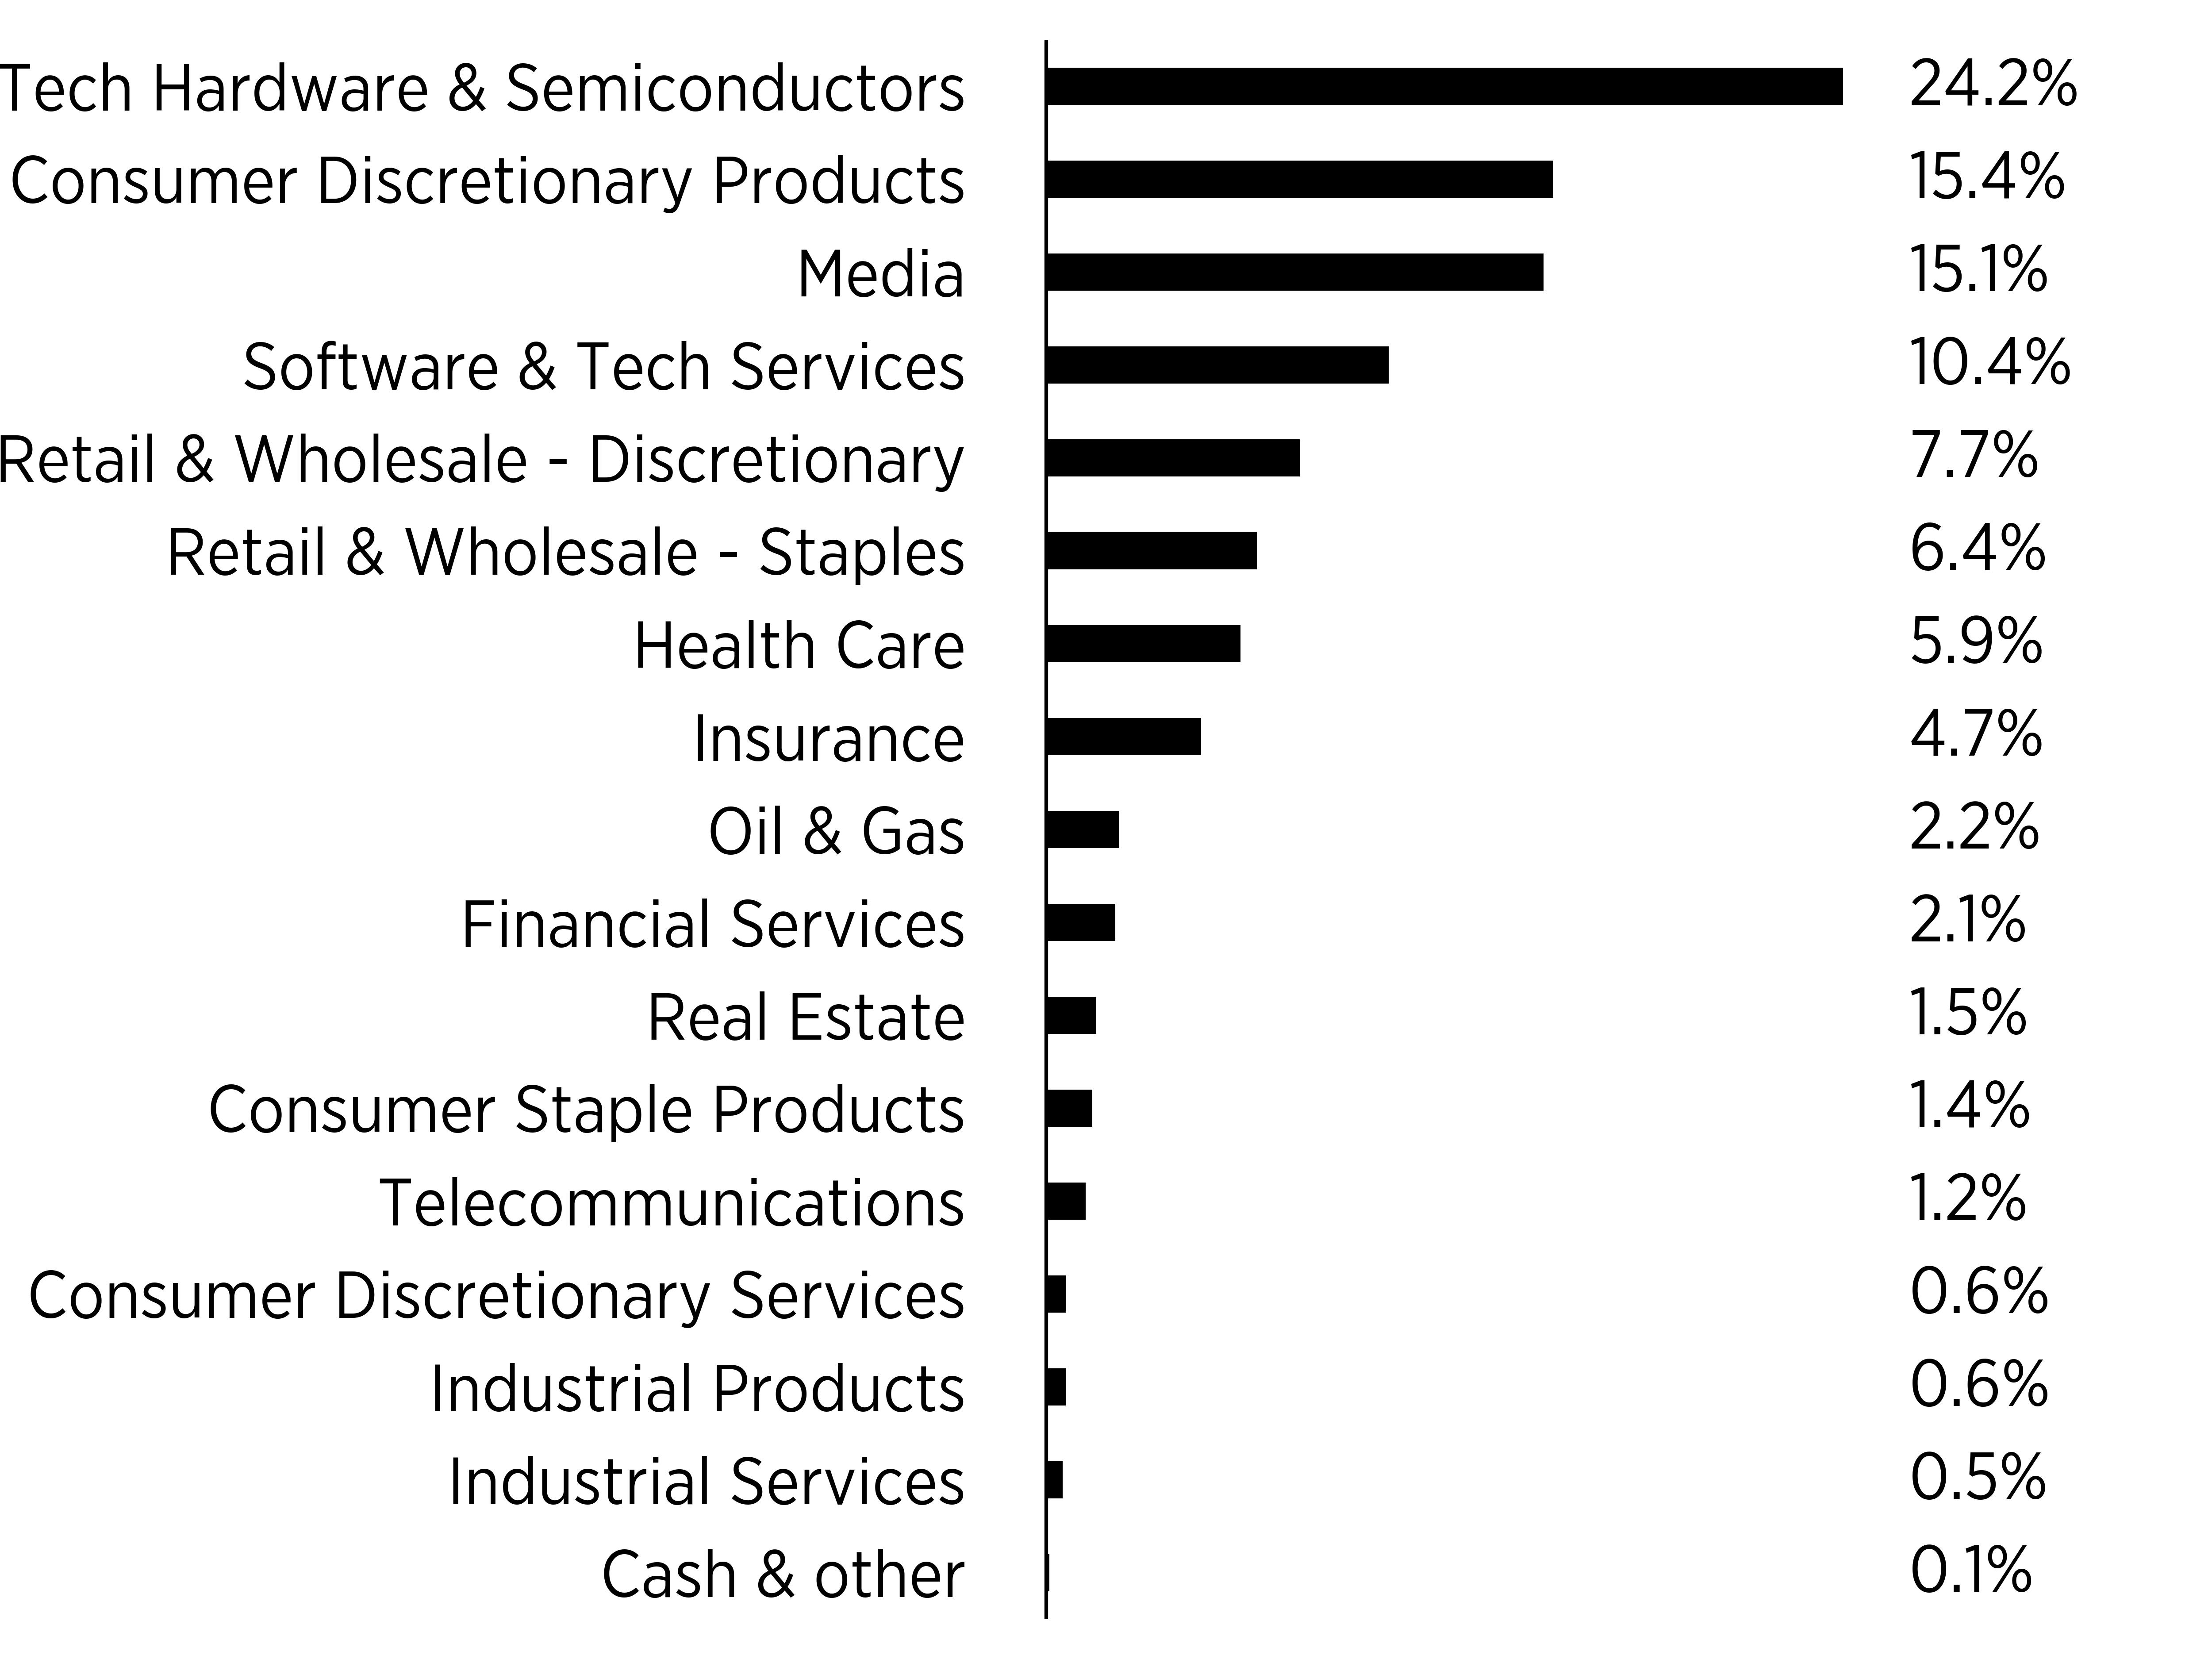
|
Top Ten Holdings |
(% of total net assets) |
|
Tesla Inc |
9.6 |
|
NVIDIA Corp |
7.8 |
|
Amazon.com Inc |
6.3 |
|
Berkshire Hathaway Inc |
4.7 |
|
Apple Inc |
4.3 |
|
Palantir Technologies Inc |
3.9 |
|
Alphabet Inc |
3.9 |
|
Microsoft Corp |
3.8 |
|
Meta Platforms Inc |
3.8 |
|
Costco Wholesale Corp |
3.7 |
Householding
Householding is an option available to certain investors of the Fund. Householding is a method of delivery, based on the preference of the individual investor, in which a single copy of certain shareholder documents can be delivered to investors who share the same address, even if their accounts are registered under different names. Householding for the Fund is available through certain broker-dealers. If you are interested in enrolling in householding and receiving a single copy of prospectuses and other shareholder documents, please contact your broker-dealer. If you are currently enrolled in householding and wish to change your householding status, please contact your broker-dealer.
This is a summary of certain changes to the Fund. For more complete information, you may review the Fund's prospectus.
How has the Fund Changed?
Effective August 1, 2025, U.S. Bancorp Fund Services, LLC, doing business as Global Fund Services, no longer serves as the Sub‑Administrator for each series of Tidal Trust I, including the Fund.
For additional information about the Fund, including its prospectus, financial information, holdings and proxy voting information, visit www.sofi.com/invest/etfs/sfyf/.
SoFi Social 50 ETF Tailored Shareholder Report
Item 2. Code of Ethics.
The registrant has adopted a code of ethics that applies to the registrant’s principal executive officer and principal financial officer. The registrant has not made any substantive amendments to its code of ethics during the period covered by this report. The registrant has not granted any waivers from any provisions of the code of ethics during the period covered by this report.
A copy of the registrant’s Code of Ethics is filed herewith.
Item 3. Audit Committee Financial Expert.
The registrant’s Board of Trustees of the Trust has determined that there are at least two audit committee financial expert serving on its audit committee. Mr. Dusko Culafic and Mr. Eduardo Mendoza are the “audit committee financial experts” and are considered to be “independent” as each term is defined in Item 3 of Form N-CSR.
Item 4. Principal Accountant Fees and Services.
The registrant has engaged its principal accountant to perform audit services, audit-related services, tax services and other services during the past two fiscal years. “Audit services” refer to performing an audit of the registrant’s annual financial statements or services that are normally provided by the accountant in connection with statutory and regulatory filings or engagements for the fiscal year. “Audit-related services” refer to the assurance and related services by the principal accountant that are reasonably related to the performance of the audit. “Tax services” refer to professional services rendered by the principal accountant for tax compliance, tax advice, and tax planning. There were no “Other services” provided by the principal accountant. The following table details the aggregate fees billed or expected to be billed for each of the last two fiscal years for audit fees, audit-related fees, tax fees and other fees by the principal accountant.
SoFi Select 500 ETF
| |
FYE 2/28/2026 |
FYE 2/28/2025 |
| Audit Fees |
$13,875 |
$13,500 |
| Audit-Related Fees |
N/A |
N/A |
| Tax Fees |
$2,875 |
$2,750 |
| All Other Fees |
N/A |
N/A |
SoFi Social 50 ETF
| |
FYE 2/28/2026 |
FYE 2/28/2025 |
| Audit Fees |
$13,875 |
$13,500 |
| Audit-Related Fees |
N/A |
N/A |
| Tax Fees |
$2,875 |
$2,750 |
| All Other Fees |
N/A |
N/A |
SoFi Enhanced Yield ETF
| |
FYE 2/28/2026 |
FYE 2/28/2025 |
| Audit Fees |
$13,875 |
$13,500 |
| Audit-Related Fees |
N/A |
N/A |
| Tax Fees |
$2,875 |
$2,750 |
| All Other Fees |
N/A |
N/A |
SoFi Agentic AI ETF
| |
FYE 2/28/2026 |
FYE 2/28/2025 |
| Audit Fees |
$13,500 |
N/A |
| Audit-Related Fees |
N/A |
N/A |
| Tax Fees |
$2,750 |
N/A |
| All Other Fees |
N/A |
N/A |
(e)(1) The audit committee has adopted pre-approval policies and procedures that require the audit committee to pre-approve all audit and non-audit services of the registrant, including services provided to any entity affiliated with the registrant.
(e)(2) The percentage of fees billed by Tait Weller & Baker LLP applicable to non-audit services pursuant to waiver of pre-approval requirement were as follows:
| |
FYE 2/28/2026 |
FYE 2/28/2025 |
| Audit-Related Fees |
0% |
0% |
| Tax Fees |
0% |
0% |
| All Other Fees |
0% |
0% |
(f) All of the principal accountant’s hours spent on auditing the registrant’s financial statements were attributed to work performed by full-time permanent employees of the principal accountant.
(g) The following table indicates the non-audit fees billed or expected to be billed by the registrant’s accountant for services to the registrant and to the registrant’s investment adviser (and any other controlling entity, etc.—not sub-adviser) for the last two years.
| Non-Audit Related Fees |
FYE 2/28/2026 |
FYE 2/28/2025 |
| Registrant |
N/A |
N/A |
| Registrant’s Investment Adviser |
N/A |
N/A |
(h) The audit committee of the board of trustees/directors has considered whether the provision of non-audit services that were rendered to the registrant’s investment adviser is compatible with maintaining the principal accountant’s independence and has concluded that the provision of such non-audit services by the accountant has not compromised the accountant’s independence.
(i) The registrant has not been identified by the U.S. Securities and Exchange Commission as having filed an annual report issued by a registered public accounting firm branch or office that is located in a foreign jurisdiction where the Public Company Accounting Oversight Board is unable to inspect or completely investigate because of a position taken by an authority in that jurisdiction.
(j) The registrant is not a foreign issuer.
Item 5. Audit Committee of Listed Registrants.
(a) The registrant is an issuer as defined in Rule 10A-3 under the Securities Exchange Act of 1934, (the “Act”) and has a separately-designated standing audit committee established in accordance with Section 3(a)(58)(A) of the Act. The independent members of the committee are as follows: Dusko Culafic, Eduardo Mendoza, and Mark H.W. Baltimore.
(b) Not applicable
Item 6. Investments.
|
(a) |
Schedule of Investments is included within the financial statements filed under Item 7 of this Form. |
Item 7. Financial Statements and Financial Highlights for Open-End Investment Companies.

Core Financial Statements
February 28, 2026
| Tidal Trust I |
|
|
| SoFi Agentic AI ETF |
| AGIQ |
| NYSE Arca, Inc. |
| SoFi Enhanced Yield ETF |
| THTA |
| NYSE Arca, Inc. |
| SoFi Select 500 ETF |
| SFY |
| NYSE Arca, Inc. |
| SoFi Social 50 ETF |
| SFYF |
| NYSE Arca, Inc. |
SoFi ETFs
Table of Contents
SoFi Agentic AI ETF
Schedule of Investments
February 28, 2026
| COMMON STOCKS - 99.3% |
|
Shares |
|
|
Value |
|
| Consumer Discretionary Products - 10.0% |
|
|
|
|
|
|
|
|
| Aurora Innovation, Inc. - Class A(a) |
|
|
17,530 |
|
|
$ |
82,040 |
|
| Tesla, Inc.(a) |
|
|
1,772 |
|
|
|
713,248 |
|
| Xpeng, Inc., ADR(a) |
|
|
12,723 |
|
|
|
223,416 |
|
| |
|
|
|
|
|
|
1,018,704 |
|
|
Health Care - 13.0% |
|
|
|
|
|
|
|
|
| Illumina, Inc.(a) |
|
|
2,499 |
|
|
|
336,015 |
|
| Intuitive Surgical, Inc.(a) |
|
|
936 |
|
|
|
471,285 |
|
| Recursion Pharmaceuticals, Inc. - Class A(a) |
|
|
6,640 |
|
|
|
24,369 |
|
| Thermo Fisher Scientific, Inc. |
|
|
933 |
|
|
|
486,196 |
|
| |
|
|
|
|
|
|
1,317,865 |
|
|
Industrial Products - 20.2% |
|
|
|
|
|
|
|
|
| AeroVironment, Inc.(a) |
|
|
813 |
|
|
|
205,079 |
|
| Deere & Co. |
|
|
1,135 |
|
|
|
714,721 |
|
| Kratos Defense & Security Solutions, Inc.(a) |
|
|
2,712 |
|
|
|
233,720 |
|
| Rockwell Automation, Inc. |
|
|
1,457 |
|
|
|
593,655 |
|
| Symbotic, Inc. - Class A(a) |
|
|
694 |
|
|
|
38,018 |
|
| Trimble, Inc.(a) |
|
|
3,898 |
|
|
|
260,659 |
|
| |
|
|
|
|
|
|
2,045,852 |
|
|
Media - 5.5% |
|
|
|
|
|
|
|
|
| Baidu, Inc. - Class A(a) |
|
|
4,456 |
|
|
|
554,505 |
|
| |
|
|
|
|
|
|
|
|
|
Software & Tech Services - 25.6%(b) |
|
|
|
|
|
|
|
|
| C3.ai, Inc. - Class A(a) |
|
|
1,984 |
|
|
|
15,773 |
|
| CrowdStrike Holdings, Inc. - Class A(a) |
|
|
1,055 |
|
|
|
392,439 |
|
| Palantir Technologies, Inc. - Class A(a) |
|
|
4,432 |
|
|
|
608,026 |
|
| Palo Alto Networks, Inc.(a) |
|
|
2,759 |
|
|
|
410,870 |
|
| Salesforce, Inc. |
|
|
2,247 |
|
|
|
437,693 |
|
| ServiceNow, Inc.(a) |
|
|
3,144 |
|
|
|
339,583 |
|
| UiPath, Inc. - Class A(a) |
|
|
6,659 |
|
|
|
71,451 |
|
| Zoom Communications, Inc. - Class A(a) |
|
|
4,358 |
|
|
|
322,231 |
|
| |
|
|
|
|
|
|
2,598,066 |
|
|
Tech Hardware & Semiconductors - 25.0%(b) |
|
|
|
|
|
|
|
|
| Arista Networks, Inc.(a) |
|
|
3,713 |
|
|
|
495,685 |
|
| NVIDIA Corp. |
|
|
4,419 |
|
|
|
783,003 |
|
| Ouster, Inc.(a) |
|
|
564 |
|
|
|
10,688 |
|
| QUALCOMM, Inc. |
|
|
3,091 |
|
|
|
440,035 |
|
| Teradyne, Inc. |
|
|
2,536 |
|
|
|
811,596 |
|
| |
|
|
|
|
|
|
2,541,007 |
|
| |
|
|
|
|
|
|
|
|
|
TOTAL COMMON STOCKS (Cost $10,225,790) |
|
|
|
|
|
|
10,075,999 |
|
The accompanying notes are an integral part of these financial statements.
| SHORT-TERM INVESTMENTS - 0.5% |
|
Shares |
|
|
Value |
|
| Money Market Funds - 0.5% |
|
|
|
|
|
|
|
|
| First American Government Obligations Fund - Class X, 3.60%(c) |
|
|
55,399 |
|
|
|
55,399 |
|
| |
|
|
|
|
|
|
|
|
|
TOTAL SHORT-TERM INVESTMENTS (Cost $55,399) |
|
|
|
|
|
|
55,399 |
|
| |
|
|
|
|
|
|
|
|
|
TOTAL INVESTMENTS - 99.8% (Cost $10,281,189) |
|
|
|
|
|
|
10,131,398 |
|
| Other Assets in Excess of Liabilities - 0.2% |
|
|
|
|
|
|
16,818 |
|
| TOTAL NET ASSETS - 100.0% |
|
|
|
|
|
$ |
10,148,216 |
|
| |
|
|
|
|
|
|
|
|
| Percentages are stated as a percent of net assets. |
|
|
|
|
|
|
|
|
| |
|
|
|
|
|
|
|
|
| ADR American Depositary Receipt |
|
|
|
|
|
|
|
|
| (a) |
Non-income producing security. |
| (b) |
To the extent that the Fund invests more heavily in a particular industry or sector of the economy, its performance will be especially sensitive to developments that significantly affect those industries or sectors. |
| (c) |
The rate shown represents the 7-day annualized effective yield as of February 28, 2026. |
The accompanying notes are an integral part of these financial statements.
SoFi Enhanced Yield ETF
Schedule of Investments
February 28, 2026
| PURCHASED OPTIONS - 4.6%(a)(b)(c)(d) |
|
Notional Amount |
|
Contracts |
|
|
Value |
|
| Call Options - 0.2% |
|
|
|
|
|
|
|
|
|
|
|
|
| S&P 500 Index, Expiration: 3/27/2026; Exercise Price: $7,450.00 |
|
$ |
1,169,409,600 |
|
|
|
1,700 |
|
|
$ |
68,000 |
|
| |
|
|
|
|
|
|
|
|
|
|
|
|
|
Put Options - 4.4%
|
|
|
|
|
|
|
|
|
|
|
|
|
| S&P 500 Index, Expiration: 3/27/2026; Exercise Price: $5,500.00 |
|
|
2,321,622,000 |
|
|
|
3,375 |
|
|
|
1,653,750 |
|
| |
|
|
|
|
|
|
|
|
|
|
|
|
|
TOTAL PURCHASED OPTIONS (Cost $2,458,041) |
|
|
|
|
|
|
|
|
|
|
1,721,750 |
|
| SHORT-TERM INVESTMENTS - 98.3% |
|
|
|
|
| Money Market Funds - 0.4% |
|
Shares |
|
|
Value |
|
| First American Government Obligations Fund - Class X, 3.60%(e) |
|
|
168,250 |
|
|
|
168,250 |
|
|
U.S. Treasury Bills - 97.9% |
|
Principal Amount |
|
|
Value |
|
| U.S. Treasury Bill, 4/9/2026, 3.50%(f) |
|
$ |
5,694,000 |
|
|
|
5,672,258 |
|
| U.S. Treasury Bill, 5/12/2026, 3.56%(f) |
|
|
7,198,000 |
|
|
|
7,147,167 |
|
| U.S. Treasury Bill, 6/11/2026, 3.57%(f) |
|
|
5,879,000 |
|
|
|
5,820,364 |
|
| U.S. Treasury Bill, 7/9/2026, 3.60%(f) |
|
|
8,923,000 |
|
|
|
8,809,332 |
|
| U.S. Treasury Bill, 8/6/2026, 3.57%(f) |
|
|
3,572,000 |
|
|
|
3,517,322 |
|
| U.S. Treasury Bill, 9/3/2026, 3.56%(f) |
|
|
5,865,000 |
|
|
|
5,759,851 |
|
| |
|
|
|
|
|
|
36,726,294 |
|
| |
|
|
|
|
|
|
|
|
|
TOTAL SHORT-TERM INVESTMENTS (Cost $36,880,548) |
|
|
|
|
|
|
36,894,544 |
|
| |
|
|
|
|
|
|
|
|
|
TOTAL INVESTMENTS - 102.9% (Cost $39,338,589) |
|
|
|
|
|
|
38,616,294 |
|
| Liabilities in Excess of Other Assets - (2.9)% |
|
|
|
|
|
|
(1,090,671 |
) |
| TOTAL NET ASSETS - 100.0% |
|
|
|
|
|
$ |
37,525,623 |
|
| |
Percentages are stated as a percent of net assets. |
| |
|
| (a) |
Exchange-traded. |
| (b) |
100 shares per contract. |
| (c) |
Held in connection with written option contracts. See Schedule of Written Options Contracts for further information. |
| (d) |
Non-income producing security. |
| (e) |
The rate shown represents the 7-day annualized effective yield as of February 28, 2026. |
| (f) |
The rate shown is the annualized effective yield as of February 28, 2026. |
The accompanying notes are an integral part of these financial statements.
SoFi Enhanced Yield ETF
Schedule of Written Options Contracts
February 28, 2026
|
WRITTEN OPTIONS - (5.1)%(a)(b) |
|
Notional
Amount |
|
|
Contracts |
|
|
Value |
|
| Call Options - (0.3)% |
|
|
|
|
|
|
|
|
|
|
|
|
| |
|
|
|
|
|
|
|
|
|
|
|
|
| S&P 500 Index, Expiration: 3/27/2026; Exercise Price: $7,400.00 |
|
$ |
(1,169,409,600 |
) |
|
|
(1,700 |
) |
|
$ |
(102,000 |
) |
| |
|
|
|
|
|
|
|
|
|
|
|
|
| Put Options - (4.8)% |
|
|
|
|
|
|
|
|
|
|
|
|
| |
|
|
|
|
|
|
|
|
|
|
|
|
| S&P 500 Index, Expiration: 3/27/2026; Exercise Price: $5,550.00 |
|
|
(2,321,622,000 |
) |
|
|
(3,375 |
) |
|
|
(1,805,625 |
) |
| |
|
|
|
|
|
|
|
|
|
|
|
|
| TOTAL WRITTEN OPTIONS (Premiums received $2,701,783) |
|
|
|
|
|
|
|
|
|
$ |
(1,907,625 |
) |
| |
|
|
|
|
|
|
|
|
|
|
|
|
| Percentages are stated as a percent of net assets. |
|
|
|
|
|
|
|
|
|
|
|
|
| (a) |
100 shares per contract. |
| (b) |
Exchange-traded. |
The accompanying notes are an integral part of these financial statements.
SoFi Select 500 ETF
Schedule of Investments
February 28, 2026
| COMMON STOCKS - 99.7% |
|
Shares |
|
|
Value |
|
| Banking - 2.4% |
|
|
|
|
|
|
|
|
| Bank of America Corp. |
|
|
42,261 |
|
|
$ |
2,105,866 |
|
| Citigroup, Inc. |
|
|
12,697 |
|
|
|
1,399,082 |
|
| Citizens Financial Group, Inc. |
|
|
2,672 |
|
|
|
160,828 |
|
| Fifth Third Bancorp |
|
|
5,953 |
|
|
|
294,495 |
|
| First Citizens BancShares, Inc. - Class A |
|
|
65 |
|
|
|
123,380 |
|
| Huntington Bancshares, Inc. |
|
|
12,497 |
|
|
|
209,950 |
|
| JPMorgan Chase & Co. |
|
|
17,277 |
|
|
|
5,188,283 |
|
| KeyCorp |
|
|
11,509 |
|
|
|
238,697 |
|
| M&T Bank Corp. |
|
|
1,380 |
|
|
|
299,432 |
|
| PNC Financial Services Group, Inc. |
|
|
2,715 |
|
|
|
576,530 |
|
| Regions Financial Corp. |
|
|
6,104 |
|
|
|
169,874 |
|
| Truist Financial Corp. |
|
|
17,529 |
|
|
|
864,355 |
|
| U.S. Bancorp |
|
|
10,897 |
|
|
|
595,630 |
|
| Wells Fargo & Co. |
|
|
19,574 |
|
|
|
1,594,302 |
|
| |
|
|
|
|
|
|
13,820,704 |
|
| |
|
|
|
|
|
|
|
|
|
Consumer Discretionary Products - 1.6% |
|
|
|
|
|
|
|
|
| D.R. Horton, Inc. |
|
|
2,056 |
|
|
|
329,762 |
|
| Deckers Outdoor Corp.(a) |
|
|
1,414 |
|
|
|
165,820 |
|
| Ford Motor Co. |
|
|
31,729 |
|
|
|
447,061 |
|
| General Motors Co. |
|
|
7,341 |
|
|
|
577,810 |
|
| Lennar Corp. - Class A |
|
|
1,588 |
|
|
|
181,604 |
|
| Masco Corp. |
|
|
1,340 |
|
|
|
95,971 |
|
| Nike, Inc. - Class B |
|
|
6,657 |
|
|
|
413,932 |
|
| NVR, Inc.(a) |
|
|
17 |
|
|
|
127,802 |
|
| PulteGroup, Inc. |
|
|
1,291 |
|
|
|
177,125 |
|
| Tapestry, Inc. |
|
|
2,836 |
|
|
|
440,913 |
|
| Tesla, Inc.(a) |
|
|
15,286 |
|
|
|
6,152,768 |
|
| |
|
|
|
|
|
|
9,110,568 |
|
| |
|
|
|
|
|
|
|
|
|
Consumer Discretionary Services - 1.2% |
|
|
|
|
|
|
|
|
| Carnival Corp. |
|
|
10,050 |
|
|
|
317,078 |
|
| Chipotle Mexican Grill, Inc. - Class A(a) |
|
|
13,914 |
|
|
|
517,879 |
|
| Darden Restaurants, Inc. |
|
|
883 |
|
|
|
188,830 |
|
| Domino's Pizza, Inc. |
|
|
184 |
|
|
|
74,062 |
|
| DraftKings, Inc. - Class A(a) |
|
|
8,588 |
|
|
|
204,738 |
|
| Flutter Entertainment PLC(a)(b) |
|
|
3,916 |
|
|
|
415,644 |
|
| Hilton Worldwide Holdings, Inc. |
|
|
1,939 |
|
|
|
604,541 |
|
| Las Vegas Sands Corp. |
|
|
2,536 |
|
|
|
143,842 |
|
| Live Nation Entertainment, Inc.(a) |
|
|
1,772 |
|
|
|
287,312 |
|
| Marriott International, Inc. - Class A |
|
|
1,607 |
|
|
|
549,160 |
|
| McDonald's Corp. |
|
|
4,594 |
|
|
|
1,566,830 |
|
| Royal Caribbean Cruises Ltd. |
|
|
3,024 |
|
|
|
940,343 |
|
| Starbucks Corp. |
|
|
7,200 |
|
|
|
705,744 |
|
The accompanying notes are an integral part of these financial statements.
| Yum! Brands, Inc. |
|
|
1,803 |
|
|
|
303,192 |
|
| |
|
|
|
|
|
|
6,819,195 |
|
| |
|
|
|
|
|
|
|
|
| Consumer Staple Products - 2.3% |
|
|
|
|
|
|
|
|
| Altria Group, Inc. |
|
|
10,816 |
|
|
|
746,737 |
|
| Church & Dwight Co., Inc. |
|
|
2,015 |
|
|
|
211,293 |
|
| Clorox Co. |
|
|
1,270 |
|
|
|
161,493 |
|
| Coca-Cola Co. |
|
|
25,629 |
|
|
|
2,090,301 |
|
| Colgate-Palmolive Co. |
|
|
5,706 |
|
|
|
565,693 |
|
| Constellation Brands, Inc. - Class A |
|
|
1,196 |
|
|
|
188,801 |
|
| Estee Lauder Cos., Inc. - Class A |
|
|
1,709 |
|
|
|
187,084 |
|
| General Mills, Inc. |
|
|
3,182 |
|
|
|
143,922 |
|
| Hershey Co. |
|
|
1,024 |
|
|
|
241,951 |
|
| Kenvue, Inc. |
|
|
13,137 |
|
|
|
251,179 |
|
| Keurig Dr Pepper, Inc.(b) |
|
|
8,522 |
|
|
|
258,046 |
|
| Kimberly-Clark Corp.(b) |
|
|
2,135 |
|
|
|
237,924 |
|
| Kraft Heinz Co. |
|
|
5,073 |
|
|
|
124,846 |
|
| McCormick & Co., Inc. |
|
|
1,676 |
|
|
|
119,063 |
|
| Mondelez International, Inc. - Class A |
|
|
7,689 |
|
|
|
473,489 |
|
| Monster Beverage Corp.(a) |
|
|
5,209 |
|
|
|
444,328 |
|
| PepsiCo, Inc. |
|
|
8,982 |
|
|
|
1,524,605 |
|
| Philip Morris International, Inc. |
|
|
13,205 |
|
|
|
2,467,090 |
|
| Procter & Gamble Co. |
|
|
15,230 |
|
|
|
2,546,456 |
|
| Tyson Foods, Inc. - Class A |
|
|
4,652 |
|
|
|
302,333 |
|
| |
|
|
|
|
|
|
13,286,634 |
|
| |
|
|
|
|
|
|
|
|
| Financial Services - 6.0% |
|
|
|
|
|
|
|
|
| American Express Co. |
|
|
3,962 |
|
|
|
1,223,862 |
|
| Ameriprise Financial, Inc. |
|
|
831 |
|
|
|
390,670 |
|
| Apollo Global Management, Inc. |
|
|
1,869 |
|
|
|
195,497 |
|
| Ares Management Corp. |
|
|
3,758 |
|
|
|
420,934 |
|
| Bank of New York Mellon Corp. |
|
|
4,541 |
|
|
|
540,833 |
|
| Blackrock, Inc. |
|
|
1,655 |
|
|
|
1,759,646 |
|
| Blackstone, Inc. |
|
|
11,100 |
|
|
|
1,258,407 |
|
| Block, Inc. - Class A(a) |
|
|
6,796 |
|
|
|
432,905 |
|
| Broadridge Financial Solutions, Inc. |
|
|
934 |
|
|
|
173,603 |
|
| Capital One Financial Corp. |
|
|
12,961 |
|
|
|
2,535,690 |
|
| Cboe Global Markets, Inc. |
|
|
679 |
|
|
|
203,510 |
|
| Charles Schwab Corp. |
|
|
14,030 |
|
|
|
1,335,656 |
|
| Circle Internet Group, Inc. - Class A(a) |
|
|
1,177 |
|
|
|
98,209 |
|
| CME Group, Inc. - Class A |
|
|
3,043 |
|
|
|
972,238 |
|
| Coinbase Global, Inc. - Class A(a) |
|
|
4,567 |
|
|
|
803,107 |
|
| Corpay, Inc.(a) |
|
|
476 |
|
|
|
154,748 |
|
| Equifax, Inc. |
|
|
933 |
|
|
|
194,960 |
|
| Fair Isaac Corp.(a) |
|
|
200 |
|
|
|
281,872 |
|
| Fidelity National Financial, Inc. |
|
|
3,599 |
|
|
|
190,315 |
|
| Fidelity National Information Services, Inc. |
|
|
11,002 |
|
|
|
560,662 |
|
| Fiserv, Inc.(a) |
|
|
7,895 |
|
|
|
491,780 |
|
| Global Payments, Inc. |
|
|
2,431 |
|
|
|
185,874 |
|
| Goldman Sachs Group, Inc. |
|
|
1,988 |
|
|
|
1,708,825 |
|
| Interactive Brokers Group, Inc. - Class A |
|
|
4,547 |
|
|
|
323,701 |
|
| Intercontinental Exchange, Inc. |
|
|
5,324 |
|
|
|
873,828 |
|
The accompanying notes are an integral part of these financial statements.
| Jack Henry & Associates, Inc. |
|
|
557 |
|
|
|
90,490 |
|
| KKR & Co., Inc. |
|
|
3,492 |
|
|
|
306,179 |
|
| LPL Financial Holdings, Inc. |
|
|
654 |
|
|
|
196,448 |
|
| Mastercard, Inc. - Class A |
|
|
6,994 |
|
|
|
3,617,367 |
|
| Moody's Corp. |
|
|
1,372 |
|
|
|
655,253 |
|
| Morgan Stanley |
|
|
10,123 |
|
|
|
1,685,581 |
|
| MSCI, Inc. - Class A |
|
|
660 |
|
|
|
377,408 |
|
| Nasdaq, Inc. |
|
|
5,318 |
|
|
|
465,750 |
|
| Northern Trust Corp. |
|
|
1,182 |
|
|
|
169,132 |
|
| PayPal Holdings, Inc. |
|
|
7,648 |
|
|
|
353,414 |
|
| Raymond James Financial, Inc.(b) |
|
|
1,397 |
|
|
|
213,853 |
|
| Robinhood Markets, Inc. - Class A(a) |
|
|
21,903 |
|
|
|
1,661,343 |
|
| S&P Global, Inc. |
|
|
2,544 |
|
|
|
1,124,143 |
|
| SoFi Technologies, Inc.(a) |
|
|
26,580 |
|
|
|
472,061 |
|
| State Street Corp. |
|
|
2,572 |
|
|
|
330,811 |
|
| Synchrony Financial |
|
|
2,376 |
|
|
|
164,205 |
|
| T. Rowe Price Group, Inc. |
|
|
1,440 |
|
|
|
136,267 |
|
| Toast, Inc. - Class A(a) |
|
|
9,429 |
|
|
|
257,506 |
|
| Tradeweb Markets, Inc. - Class A |
|
|
1,602 |
|
|
|
197,454 |
|
| TransUnion |
|
|
3,441 |
|
|
|
270,291 |
|
| Verisk Analytics, Inc. - Class A |
|
|
899 |
|
|
|
186,605 |
|
| Visa, Inc. - Class A |
|
|
13,561 |
|
|
|
4,341,418 |
|
| |
|
|
|
|
|
|
34,584,311 |
|
| |
|
|
|
|
|
|
|
|
| Health Care - 11.0% |
|
|
|
|
|
|
|
|
| Abbott Laboratories, ADR |
|
|
17,240 |
|
|
|
2,005,874 |
|
| AbbVie, Inc. |
|
|
25,845 |
|
|
|
5,998,108 |
|
| Agilent Technologies, Inc. |
|
|
1,564 |
|
|
|
189,838 |
|
| Alnylam Pharmaceuticals, Inc.(a) |
|
|
996 |
|
|
|
331,588 |
|
| Amgen, Inc. |
|
|
5,702 |
|
|
|
2,213,288 |
|
| Baxter International, Inc.(b) |
|
|
2,407 |
|
|
|
49,031 |
|
| Becton Dickinson & Co.(b) |
|
|
2,806 |
|
|
|
495,203 |
|
| Biogen, Inc.(a) |
|
|
828 |
|
|
|
158,827 |
|
| Boston Scientific Corp.(a) |
|
|
19,747 |
|
|
|
1,517,557 |
|
| Bristol-Myers Squibb Co. |
|
|
24,134 |
|
|
|
1,505,238 |
|
| Cardinal Health, Inc. |
|
|
1,533 |
|
|
|
351,410 |
|
| Cencora, Inc. |
|
|
1,472 |
|
|
|
547,790 |
|
| Centene Corp.(a) |
|
|
3,611 |
|
|
|
162,062 |
|
| Cigna Group |
|
|
3,246 |
|
|
|
940,756 |
|
| Cooper Cos., Inc.(a) |
|
|
1,781 |
|
|
|
149,016 |
|
| CVS Health Corp. |
|
|
7,721 |
|
|
|
616,908 |
|
| Danaher Corp. |
|
|
4,168 |
|
|
|
877,947 |
|
| Dexcom, Inc.(a) |
|
|
2,999 |
|
|
|
220,217 |
|
| Edwards Lifesciences Corp.(a) |
|
|
4,073 |
|
|
|
352,192 |
|
| Elevance Health, Inc. |
|
|
1,589 |
|
|
|
508,480 |
|
| Eli Lilly & Co. |
|
|
12,248 |
|
|
|
12,884,773 |
|
| GE HealthCare Technologies, Inc. |
|
|
2,766 |
|
|
|
233,091 |
|
| Gilead Sciences, Inc. |
|
|
24,539 |
|
|
|
3,655,084 |
|
| HCA Healthcare, Inc. |
|
|
1,326 |
|
|
|
702,382 |
|
| Hologic, Inc.(a) |
|
|
1,327 |
|
|
|
100,003 |
|
| Humana, Inc. |
|
|
898 |
|
|
|
171,105 |
|
| IDEXX Laboratories, Inc.(a) |
|
|
500 |
|
|
|
328,365 |
|
The accompanying notes are an integral part of these financial statements.
| Illumina, Inc.(a) |
|
|
1,249 |
|
|
|
167,940 |
|
| Incyte Corp.(a) |
|
|
2,631 |
|
|
|
266,441 |
|
| Insmed, Inc.(a) |
|
|
1,608 |
|
|
|
240,123 |
|
| Insulet Corp.(a) |
|
|
950 |
|
|
|
234,279 |
|
| Intuitive Surgical, Inc.(a) |
|
|
4,152 |
|
|
|
2,090,573 |
|
| IQVIA Holdings, Inc.(a) |
|
|
1,297 |
|
|
|
231,917 |
|
| Johnson & Johnson |
|
|
18,674 |
|
|
|
4,639,182 |
|
| Labcorp Holdings, Inc. |
|
|
852 |
|
|
|
246,330 |
|
| McKesson Corp. |
|
|
1,145 |
|
|
|
1,130,539 |
|
| Medtronic PLC |
|
|
9,834 |
|
|
|
960,388 |
|
| Merck & Co., Inc. |
|
|
18,427 |
|
|
|
2,281,631 |
|
| Mettler-Toledo International, Inc.(a) |
|
|
136 |
|
|
|
185,870 |
|
| Natera, Inc.(a) |
|
|
2,129 |
|
|
|
442,917 |
|
| Pfizer, Inc. |
|
|
129,814 |
|
|
|
3,589,357 |
|
| Quest Diagnostics, Inc. |
|
|
597 |
|
|
|
126,510 |
|
| Regeneron Pharmaceuticals, Inc. |
|
|
610 |
|
|
|
476,819 |
|
| ResMed, Inc. |
|
|
1,107 |
|
|
|
283,680 |
|
| Revvity, Inc.(b) |
|
|
778 |
|
|
|
76,485 |
|
| Royalty Pharma PLC - Class A |
|
|
2,520 |
|
|
|
116,449 |
|
| STERIS PLC |
|
|
666 |
|
|
|
168,065 |
|
| Stryker Corp. |
|
|
2,836 |
|
|
|
1,098,837 |
|
| Thermo Fisher Scientific, Inc. |
|
|
2,418 |
|
|
|
1,260,044 |
|
| UnitedHealth Group, Inc. |
|
|
7,669 |
|
|
|
2,249,088 |
|
| Vertex Pharmaceuticals, Inc.(a) |
|
|
5,528 |
|
|
|
2,746,476 |
|
| Viatris, Inc.(b) |
|
|
7,578 |
|
|
|
113,140 |
|
| Waters Corp.(a) |
|
|
740 |
|
|
|
236,401 |
|
| West Pharmaceutical Services, Inc. |
|
|
391 |
|
|
|
99,447 |
|
| Zimmer Biomet Holdings, Inc. |
|
|
1,860 |
|
|
|
183,098 |
|
| Zoetis, Inc. - Class A |
|
|
3,568 |
|
|
|
467,765 |
|
| |
|
|
|
|
|
|
63,675,924 |
|
| |
|
|
|
|
|
|
|
|
| Industrial Products - 5.9% |
|
|
|
|
|
|
|
|
| 3M Co. |
|
|
4,877 |
|
|
|
806,266 |
|
| AMETEK, Inc. |
|
|
1,484 |
|
|
|
355,002 |
|
| Amphenol Corp. |
|
|
21,620 |
|
|
|
3,157,817 |
|
| Axon Enterprise, Inc.(a) |
|
|
907 |
|
|
|
491,957 |
|
| Bloom Energy Corp. - Class A(a) |
|
|
3,239 |
|
|
|
504,215 |
|
| Boeing Co.(a) |
|
|
3,975 |
|
|
|
904,432 |
|
| Carrier Global Corp. |
|
|
4,937 |
|
|
|
317,943 |
|
| Caterpillar, Inc. |
|
|
2,352 |
|
|
|
1,747,136 |
|
| Cummins, Inc. |
|
|
1,002 |
|
|
|
585,038 |
|
| Curtiss-Wright Corp. |
|
|
248 |
|
|
|
173,682 |
|
| Deere & Co. |
|
|
974 |
|
|
|
613,337 |
|
| Dover Corp. |
|
|
834 |
|
|
|
188,067 |
|
| Eaton Corp. PLC |
|
|
2,979 |
|
|
|
1,119,866 |
|
| Emerson Electric Co. |
|
|
4,728 |
|
|
|
712,746 |
|
| Entegris, Inc. |
|
|
1,526 |
|
|
|
202,119 |
|
| Fortive Corp. |
|
|
2,844 |
|
|
|
168,365 |
|
| GE Aerospace |
|
|
5,121 |
|
|
|
1,752,713 |
|
| GE Vernova, Inc. |
|
|
2,838 |
|
|
|
2,479,277 |
|
| General Dynamics Corp. |
|
|
2,177 |
|
|
|
777,298 |
|
| Honeywell International, Inc. |
|
|
4,271 |
|
|
|
1,040,373 |
|
The accompanying notes are an integral part of these financial statements.
| Howmet Aerospace, Inc. |
|
|
3,481 |
|
|
|
913,867 |
|
| Hubbell, Inc.(b) |
|
|
465 |
|
|
|
237,908 |
|
| IDEX Corp. |
|
|
465 |
|
|
|
97,404 |
|
| Illinois Tool Works, Inc. |
|
|
1,701 |
|
|
|
494,362 |
|
| Ingersoll Rand, Inc. |
|
|
3,458 |
|
|
|
325,536 |
|
| Johnson Controls International PLC |
|
|
3,389 |
|
|
|
489,033 |
|
| Keysight Technologies, Inc.(a) |
|
|
1,021 |
|
|
|
313,784 |
|
| L3Harris Technologies, Inc. |
|
|
1,626 |
|
|
|
592,742 |
|
| Lennox International, Inc. |
|
|
267 |
|
|
|
152,174 |
|
| Lockheed Martin Corp. |
|
|
1,594 |
|
|
|
1,048,979 |
|
| Northrop Grumman Corp. |
|
|
1,256 |
|
|
|
909,821 |
|
| Otis Worldwide Corp. |
|
|
2,648 |
|
|
|
245,099 |
|
| PACCAR, Inc. |
|
|
2,260 |
|
|
|
284,963 |
|
| Parker-Hannifin Corp. |
|
|
787 |
|
|
|
794,225 |
|
| Pentair PLC |
|
|
1,016 |
|
|
|
100,777 |
|
| Rocket Lab Corp.(a) |
|
|
7,357 |
|
|
|
508,369 |
|
| Rockwell Automation, Inc. |
|
|
671 |
|
|
|
273,399 |
|
| RTX Corp. |
|
|
19,170 |
|
|
|
3,884,225 |
|
| Snap-on, Inc. |
|
|
386 |
|
|
|
148,695 |
|
| TE Connectivity PLC |
|
|
1,783 |
|
|
|
410,357 |
|
| Textron, Inc. |
|
|
1,519 |
|
|
|
149,849 |
|
| Trane Technologies PLC |
|
|
1,878 |
|
|
|
868,237 |
|
| TransDigm Group, Inc. |
|
|
492 |
|
|
|
640,973 |
|
| Trimble, Inc.(a) |
|
|
1,466 |
|
|
|
98,031 |
|
| Veralto Corp. |
|
|
1,608 |
|
|
|
156,667 |
|
| Vertiv Holdings Co. - Class A |
|
|
5,425 |
|
|
|
1,382,778 |
|
| Westinghouse Air Brake Technologies Corp. |
|
|
1,551 |
|
|
|
409,386 |
|
| Xylem, Inc. |
|
|
1,735 |
|
|
|
224,787 |
|
| |
|
|
|
|
|
|
34,254,076 |
|
| |
|
|
|
|
|
|
|
|
| Industrial Services - 1.8% |
|
|
|
|
|
|
|
|
| Automatic Data Processing, Inc. |
|
|
2,741 |
|
|
|
587,561 |
|
| Cintas Corp. |
|
|
2,501 |
|
|
|
503,026 |
|
| Comfort Systems USA, Inc. |
|
|
500 |
|
|
|
714,685 |
|
| CSX Corp. |
|
|
10,621 |
|
|
|
453,411 |
|
| Delta Air Lines, Inc. |
|
|
4,612 |
|
|
|
303,008 |
|
| EMCOR Group, Inc. |
|
|
463 |
|
|
|
335,499 |
|
| Expeditors International of Washington, Inc. |
|
|
628 |
|
|
|
91,079 |
|
| Fastenal Co. |
|
|
7,064 |
|
|
|
325,227 |
|
| FedEx Corp. |
|
|
1,321 |
|
|
|
511,227 |
|
| J.B. Hunt Transport Services, Inc. |
|
|
468 |
|
|
|
109,236 |
|
| Jacobs Solutions, Inc. |
|
|
961 |
|
|
|
132,484 |
|
| Norfolk Southern Corp. |
|
|
1,807 |
|
|
|
568,735 |
|
| Old Dominion Freight Line, Inc. |
|
|
1,018 |
|
|
|
206,705 |
|
| Paychex, Inc. |
|
|
2,165 |
|
|
|
202,752 |
|
| Quanta Services, Inc. |
|
|
1,418 |
|
|
|
798,447 |
|
| Republic Services, Inc. - Class A |
|
|
1,498 |
|
|
|
343,042 |
|
| Rollins, Inc. |
|
|
2,618 |
|
|
|
159,410 |
|
| Southwest Airlines Co. |
|
|
7,122 |
|
|
|
350,830 |
|
| Union Pacific Corp.(b) |
|
|
3,587 |
|
|
|
950,483 |
|
| United Airlines Holdings, Inc.(a) |
|
|
2,311 |
|
|
|
245,659 |
|
| United Parcel Service, Inc. - Class B |
|
|
4,640 |
|
|
|
538,054 |
|
The accompanying notes are an integral part of these financial statements.
| United Rentals, Inc. |
|
|
590 |
|
|
|
495,600 |
|
| W.W. Grainger, Inc.(b) |
|
|
284 |
|
|
|
325,103 |
|
| Waste Management, Inc. |
|
|
3,524 |
|
|
|
848,720 |
|
| Watsco, Inc.(b) |
|
|
233 |
|
|
|
97,238 |
|
| |
|
|
|
|
|
|
10,197,221 |
|
| |
|
|
|
|
|
|
|
|
| Insurance - 2.2% |
|
|
|
|
|
|
|
|
| Aflac, Inc. |
|
|
2,169 |
|
|
|
244,945 |
|
| Allstate Corp. |
|
|
2,528 |
|
|
|
542,307 |
|
| American International Group, Inc. |
|
|
2,999 |
|
|
|
241,390 |
|
| Aon PLC - Class A |
|
|
2,121 |
|
|
|
711,532 |
|
| Arch Capital Group Ltd.(a) |
|
|
4,008 |
|
|
|
401,401 |
|
| Arthur J. Gallagher & Co. |
|
|
2,961 |
|
|
|
675,700 |
|
| Berkshire Hathaway, Inc. - Class B(a) |
|
|
7,669 |
|
|
|
3,872,462 |
|
| Brown & Brown, Inc. |
|
|
1,964 |
|
|
|
141,054 |
|
| Chubb Ltd. |
|
|
2,585 |
|
|
|
881,123 |
|
| Cincinnati Financial Corp. |
|
|
1,133 |
|
|
|
185,789 |
|
| Everest Group Ltd. |
|
|
477 |
|
|
|
160,029 |
|
| F&G Annuities & Life, Inc. |
|
|
215 |
|
|
|
4,864 |
|
| Hartford Financial Services Group, Inc. |
|
|
2,311 |
|
|
|
325,458 |
|
| Markel Group, Inc.(a) |
|
|
78 |
|
|
|
161,653 |
|
| Marsh & McLennan Cos., Inc. |
|
|
3,880 |
|
|
|
724,551 |
|
| MetLife, Inc. |
|
|
4,568 |
|
|
|
329,216 |
|
| Principal Financial Group, Inc. |
|
|
1,289 |
|
|
|
122,996 |
|
| Progressive Corp. |
|
|
7,306 |
|
|
|
1,561,000 |
|
| Prudential Financial, Inc. |
|
|
2,439 |
|
|
|
239,949 |
|
| Travelers Cos., Inc. |
|
|
1,882 |
|
|
|
580,860 |
|
| W.R. Berkley Corp.(b) |
|
|
2,508 |
|
|
|
179,824 |
|
| Willis Towers Watson PLC |
|
|
1,977 |
|
|
|
603,321 |
|
| |
|
|
|
|
|
|
12,891,424 |
|
| |
|
|
|
|
|
|
|
|
| Materials - 2.3% |
|
|
|
|
|
|
|
|
| Air Products and Chemicals, Inc. |
|
|
1,308 |
|
|
|
360,576 |
|
| Amrize Ltd.(a) |
|
|
3,192 |
|
|
|
207,448 |
|
| Avery Dennison Corp. |
|
|
466 |
|
|
|
91,499 |
|
| Ball Corp. |
|
|
1,686 |
|
|
|
113,181 |
|
| Carlisle Cos., Inc.(b) |
|
|
231 |
|
|
|
91,192 |
|
| CF Industries Holdings, Inc. |
|
|
768 |
|
|
|
76,447 |
|
| Corteva, Inc. |
|
|
4,901 |
|
|
|
392,668 |
|
| CRH PLC |
|
|
4,270 |
|
|
|
512,315 |
|
| Dow, Inc.(b) |
|
|
4,426 |
|
|
|
136,011 |
|
| DuPont de Nemours, Inc. |
|
|
7,798 |
|
|
|
390,212 |
|
| Ecolab, Inc. |
|
|
2,030 |
|
|
|
625,951 |
|
| Freeport-McMoRan, Inc. |
|
|
10,575 |
|
|
|
719,946 |
|
| International Flavors & Fragrances, Inc. |
|
|
3,149 |
|
|
|
258,942 |
|
| International Paper Co. |
|
|
14,878 |
|
|
|
647,937 |
|
| Linde PLC |
|
|
3,142 |
|
|
|
1,596,387 |
|
| LyondellBasell Industries NV - Class A(b) |
|
|
1,612 |
|
|
|
92,722 |
|
| Martin Marietta Materials, Inc. |
|
|
474 |
|
|
|
320,694 |
|
| Newmont Corp. |
|
|
28,782 |
|
|
|
3,741,660 |
|
| Nucor Corp. |
|
|
1,017 |
|
|
|
179,887 |
|
| Packaging Corp. of America |
|
|
486 |
|
|
|
112,820 |
|
The accompanying notes are an integral part of these financial statements.
| PPG Industries, Inc. |
|
|
1,564 |
|
|
|
192,794 |
|
| Qnity Electronics, Inc. |
|
|
3,968 |
|
|
|
502,984 |
|
| Reliance, Inc. |
|
|
301 |
|
|
|
95,008 |
|
| RPM International, Inc. |
|
|
833 |
|
|
|
95,062 |
|
| Sherwin-Williams Co. |
|
|
1,413 |
|
|
|
512,340 |
|
| Smurfit WestRock PLC |
|
|
13,100 |
|
|
|
615,831 |
|
| Solstice Advanced Materials, Inc.(a) |
|
|
1,065 |
|
|
|
83,613 |
|
| Steel Dynamics, Inc. |
|
|
740 |
|
|
|
142,916 |
|
| Vulcan Materials Co. |
|
|
829 |
|
|
|
256,990 |
|
| |
|
|
|
|
|
|
13,166,033 |
|
| |
|
|
|
|
|
|
|
|
| Media - 10.5% |
|
|
|
|
|
|
|
|
| Airbnb, Inc. - Class A(a) |
|
|
3,046 |
|
|
|
411,545 |
|
| Alphabet, Inc. - Class A |
|
|
45,354 |
|
|
|
14,139,563 |
|
| Alphabet, Inc. - Class C |
|
|
39,491 |
|
|
|
12,298,682 |
|
| AppLovin Corp. - Class A(a) |
|
|
4,630 |
|
|
|
2,012,985 |
|
| Booking Holdings, Inc. |
|
|
283 |
|
|
|
1,199,736 |
|
| Charter Communications, Inc. - Class A(a)(b) |
|
|
471 |
|
|
|
110,511 |
|
| Comcast Corp. - Class A |
|
|
23,547 |
|
|
|
729,015 |
|
| DoorDash, Inc. - Class A(a) |
|
|
7,474 |
|
|
|
1,318,937 |
|
| Electronic Arts, Inc. |
|
|
1,620 |
|
|
|
324,923 |
|
| Expedia Group, Inc. - Class A |
|
|
1,033 |
|
|
|
222,808 |
|
| GoDaddy, Inc. - Class A(a) |
|
|
934 |
|
|
|
81,407 |
|
| Meta Platforms, Inc. - Class A |
|
|
24,899 |
|
|
|
16,139,034 |
|
| Netflix, Inc.(a) |
|
|
44,124 |
|
|
|
4,246,494 |
|
| Omnicom Group, Inc.(b) |
|
|
1,307 |
|
|
|
111,474 |
|
| Pinterest, Inc. - Class A(a) |
|
|
13,506 |
|
|
|
231,358 |
|
| Reddit, Inc. - Class A(a) |
|
|
3,145 |
|
|
|
458,573 |
|
| Roblox Corp. - Class A(a) |
|
|
8,029 |
|
|
|
551,271 |
|
| Take-Two Interactive Software, Inc.(a) |
|
|
1,409 |
|
|
|
297,975 |
|
| Trade Desk, Inc. - Class A(a) |
|
|
6,038 |
|
|
|
143,825 |
|
| Uber Technologies, Inc.(a) |
|
|
44,584 |
|
|
|
3,362,525 |
|
| VeriSign, Inc. |
|
|
600 |
|
|
|
136,764 |
|
| Versant Media Group, Inc. - Class A |
|
|
941 |
|
|
|
31,338 |
|
| Walt Disney Co. |
|
|
17,239 |
|
|
|
1,828,024 |
|
| Warner Bros Discovery, Inc.(a) |
|
|
11,003 |
|
|
|
309,955 |
|
| |
|
|
|
|
|
|
60,698,722 |
|
| |
|
|
|
|
|
|
|
|
| Oil & Gas - 2.4% |
|
|
|
|
|
|
|
|
| Baker Hughes Co. |
|
|
7,168 |
|
|
|
467,784 |
|
| Cheniere Energy, Inc. |
|
|
1,594 |
|
|
|
375,754 |
|
| Chevron Corp. |
|
|
10,309 |
|
|
|
1,925,309 |
|
| ConocoPhillips |
|
|
7,614 |
|
|
|
863,884 |
|
| Coterra Energy, Inc.(b) |
|
|
3,145 |
|
|
|
96,205 |
|
| Devon Energy Corp. |
|
|
2,948 |
|
|
|
128,326 |
|
| Diamondback Energy, Inc. |
|
|
2,696 |
|
|
|
469,320 |
|
| EOG Resources, Inc. |
|
|
2,859 |
|
|
|
354,745 |
|
| EQT Corp. |
|
|
11,108 |
|
|
|
682,253 |
|
| Expand Energy Corp. |
|
|
5,991 |
|
|
|
646,549 |
|
| Exxon Mobil Corp. |
|
|
24,059 |
|
|
|
3,668,997 |
|
| Halliburton Co. |
|
|
5,536 |
|
|
|
199,296 |
|
| Kinder Morgan, Inc. |
|
|
10,466 |
|
|
|
348,204 |
|
The accompanying notes are an integral part of these financial statements.
| Marathon Petroleum Corp. |
|
|
1,663 |
|
|
|
329,623 |
|
| Occidental Petroleum Corp. |
|
|
3,323 |
|
|
|
176,385 |
|
| ONEOK, Inc. |
|
|
10,373 |
|
|
|
858,573 |
|
| Phillips 66 |
|
|
2,446 |
|
|
|
377,491 |
|
| SLB NV |
|
|
8,687 |
|
|
|
445,991 |
|
| Targa Resources Corp.(b) |
|
|
1,535 |
|
|
|
361,953 |
|
| Texas Pacific Land Corp.(b) |
|
|
486 |
|
|
|
254,805 |
|
| Valero Energy Corp. |
|
|
1,386 |
|
|
|
283,631 |
|
| Williams Cos., Inc. |
|
|
8,590 |
|
|
|
641,845 |
|
| |
|
|
|
|
|
|
13,956,923 |
|
| |
|
|
|
|
|
|
|
|
| Real Estate - 1.7% |
|
|
|
|
|
|
|
|
| Alexandria Real Estate Equities, Inc. - REIT |
|
|
2,045 |
|
|
|
110,512 |
|
| American Tower Corp. - REIT |
|
|
3,045 |
|
|
|
584,214 |
|
| AvalonBay Communities, Inc. - REIT |
|
|
899 |
|
|
|
159,330 |
|
| CBRE Group, Inc. - Class A(a) |
|
|
3,467 |
|
|
|
511,937 |
|
| CoStar Group, Inc.(a) |
|
|
2,907 |
|
|
|
129,739 |
|
| Crown Castle, Inc. - REIT |
|
|
2,228 |
|
|
|
199,495 |
|
| Digital Realty Trust, Inc. - REIT |
|
|
1,916 |
|
|
|
339,515 |
|
| Equinix, Inc. - REIT |
|
|
736 |
|
|
|
717,055 |
|
| Equity Residential - REIT |
|
|
2,396 |
|
|
|
151,451 |
|
| Essex Property Trust, Inc. - REIT |
|
|
417 |
|
|
|
106,381 |
|
| Extra Space Storage, Inc. - REIT |
|
|
1,646 |
|
|
|
248,595 |
|
| Healthpeak Properties, Inc. - REIT |
|
|
4,448 |
|
|
|
78,641 |
|
| Host Hotels & Resorts, Inc. - REIT |
|
|
4,832 |
|
|
|
94,659 |
|
| Invitation Homes, Inc. - REIT |
|
|
4,960 |
|
|
|
130,646 |
|
| Iron Mountain, Inc. - REIT |
|
|
5,822 |
|
|
|
630,697 |
|
| Kimco Realty Corp. - REIT |
|
|
4,523 |
|
|
|
106,517 |
|
| Mid-America Apartment Communities, Inc. - REIT |
|
|
738 |
|
|
|
98,789 |
|
| Prologis, Inc. - REIT |
|
|
7,495 |
|
|
|
1,068,562 |
|
| Public Storage - REIT |
|
|
929 |
|
|
|
285,259 |
|
| Realty Income Corp. - REIT |
|
|
8,646 |
|
|
|
579,282 |
|
| SBA Communications Corp. - Class A - REIT |
|
|
753 |
|
|
|
151,474 |
|
| Simon Property Group, Inc. - REIT |
|
|
2,264 |
|
|
|
461,516 |
|
| Sun Communities, Inc. - REIT |
|
|
989 |
|
|
|
134,959 |
|
| UDR, Inc. - REIT(b) |
|
|
1,803 |
|
|
|
67,613 |
|
| Ventas, Inc. - REIT |
|
|
6,088 |
|
|
|
524,542 |
|
| VICI Properties, Inc. - REIT |
|
|
8,772 |
|
|
|
265,002 |
|
| Welltower, Inc. - REIT |
|
|
9,473 |
|
|
|
1,962,048 |
|
| Weyerhaeuser Co. - REIT |
|
|
3,399 |
|
|
|
83,378 |
|
| WP Carey, Inc. - REIT |
|
|
1,296 |
|
|
|
96,746 |
|
| |
|
|
|
|
|
|
10,078,554 |
|
| |
|
|
|
|
|
|
|
|
|
Renewable Energy - 0.0%(c) |
|
|
|
|
|
|
|
|
| First Solar, Inc.(a) |
|
|
956 |
|
|
|
188,523 |
|
| |
|
|
|
|
|
|
|
|
| Retail & Wholesale - Discretionary - 4.2% |
|
|
|
|
|
|
|
|
| Amazon.com, Inc.(a) |
|
|
75,181 |
|
|
|
15,788,010 |
|
| AutoZone, Inc.(a) |
|
|
110 |
|
|
|
413,114 |
|
| Best Buy Co., Inc. |
|
|
1,242 |
|
|
|
76,967 |
|
| Builders FirstSource, Inc.(a) |
|
|
562 |
|
|
|
58,611 |
|
| Burlington Stores, Inc.(a) |
|
|
598 |
|
|
|
183,508 |
|
The accompanying notes are an integral part of these financial statements.
| Carvana Co. - Class A(a) |
|
|
2,170 |
|
|
|
725,127 |
|
| Copart, Inc.(a) |
|
|
5,933 |
|
|
|
225,988 |
|
| eBay, Inc. |
|
|
2,750 |
|
|
|
249,865 |
|
| Ferguson Enterprises, Inc. |
|
|
1,119 |
|
|
|
291,790 |
|
| Genuine Parts Co. |
|
|
852 |
|
|
|
101,610 |
|
| Home Depot, Inc. |
|
|
7,258 |
|
|
|
2,763,266 |
|
| Lowe's Cos., Inc. |
|
|
3,478 |
|
|
|
920,174 |
|
| O'Reilly Automotive, Inc.(a) |
|
|
5,976 |
|
|
|
561,027 |
|
| Ross Stores, Inc. |
|
|
1,903 |
|
|
|
391,333 |
|
| TJX Cos., Inc. |
|
|
7,239 |
|
|
|
1,170,257 |
|
| Tractor Supply Co. |
|
|
3,199 |
|
|
|
165,836 |
|
| Ulta Beauty, Inc.(a) |
|
|
276 |
|
|
|
189,002 |
|
| Williams-Sonoma, Inc. |
|
|
680 |
|
|
|
139,842 |
|
| |
|
|
|
|
|
|
24,415,327 |
|
| |
|
|
|
|
|
|
|
|
| Retail & Wholesale - Staples - 1.5% |
|
|
|
|
|
|
|
|
| Archer-Daniels-Midland Co. |
|
|
2,422 |
|
|
|
167,215 |
|
| Bunge Global SA |
|
|
769 |
|
|
|
92,780 |
|
| Casey's General Stores, Inc. |
|
|
268 |
|
|
|
183,738 |
|
| Costco Wholesale Corp. |
|
|
3,185 |
|
|
|
3,219,366 |
|
| Dollar General Corp. |
|
|
1,411 |
|
|
|
220,455 |
|
| Dollar Tree, Inc.(a) |
|
|
1,393 |
|
|
|
176,187 |
|
| Kroger Co. |
|
|
3,762 |
|
|
|
256,719 |
|
| Sysco Corp. |
|
|
3,146 |
|
|
|
286,789 |
|
| Target Corp. |
|
|
2,845 |
|
|
|
323,732 |
|
| Walmart, Inc. |
|
|
31,675 |
|
|
|
4,052,816 |
|
| |
|
|
|
|
|
|
8,979,797 |
|
| |
|
|
|
|
|
|
|
|
| Software & Tech Services - 9.2% |
|
|
|
|
|
|
|
|
| Accenture PLC - Class A |
|
|
4,164 |
|
|
|
869,110 |
|
| Adobe, Inc.(a) |
|
|
3,739 |
|
|
|
981,151 |
|
| Atlassian Corp. - Class A(a) |
|
|
2,969 |
|
|
|
223,061 |
|
| Autodesk, Inc.(a) |
|
|
1,965 |
|
|
|
483,135 |
|
| Booz Allen Hamilton Holding Corp. - Class A(b) |
|
|
1,290 |
|
|
|
101,691 |
|
| Cadence Design Systems, Inc.(a) |
|
|
2,811 |
|
|
|
847,235 |
|
| CDW Corp. |
|
|
847 |
|
|
|
103,876 |
|
| Cloudflare, Inc. - Class A(a) |
|
|
4,993 |
|
|
|
859,745 |
|
| Cognizant Technology Solutions Corp. - Class A |
|
|
3,002 |
|
|
|
193,419 |
|
| CoreWeave, Inc. - Class A(a) |
|
|
4,001 |
|
|
|
318,320 |
|
| CrowdStrike Holdings, Inc. - Class A(a) |
|
|
2,999 |
|
|
|
1,115,568 |
|
| Datadog, Inc. - Class A(a) |
|
|
5,476 |
|
|
|
613,093 |
|
| DocuSign, Inc.(a) |
|
|
1,536 |
|
|
|
69,227 |
|
| Fortinet, Inc.(a) |
|
|
5,907 |
|
|
|
466,830 |
|
| Gartner, Inc.(a)(b) |
|
|
530 |
|
|
|
83,316 |
|
| Gen Digital, Inc. |
|
|
4,106 |
|
|
|
92,672 |
|
| Guidewire Software, Inc.(a) |
|
|
2,104 |
|
|
|
305,753 |
|
| HubSpot, Inc.(a) |
|
|
1,258 |
|
|
|
332,754 |
|
| International Business Machines Corp. |
|
|
6,560 |
|
|
|
1,575,778 |
|
| Intuit, Inc. |
|
|
2,642 |
|
|
|
1,080,657 |
|
| IonQ, Inc.(a)(b) |
|
|
4,158 |
|
|
|
159,542 |
|
| Leidos Holdings, Inc. |
|
|
1,529 |
|
|
|
267,728 |
|
| Manhattan Associates, Inc.(a) |
|
|
679 |
|
|
|
91,957 |
|
The accompanying notes are an integral part of these financial statements.
| Microsoft Corp. |
|
|
65,511 |
|
|
|
25,728,790 |
|
| MongoDB, Inc. - Class A(a) |
|
|
1,415 |
|
|
|
464,785 |
|
| Nutanix, Inc. - Class A(a) |
|
|
5,253 |
|
|
|
201,085 |
|
| Okta, Inc. - Class A(a) |
|
|
2,992 |
|
|
|
216,920 |
|
| Oracle Corp. |
|
|
15,413 |
|
|
|
2,241,050 |
|
| Palantir Technologies, Inc. - Class A(a) |
|
|
37,636 |
|
|
|
5,163,283 |
|
| Palo Alto Networks, Inc.(a) |
|
|
5,353 |
|
|
|
797,169 |
|
| PTC, Inc.(a) |
|
|
1,085 |
|
|
|
169,900 |
|
| Roper Technologies, Inc. |
|
|
969 |
|
|
|
338,888 |
|
| Salesforce, Inc. |
|
|
7,562 |
|
|
|
1,473,002 |
|
| ServiceNow, Inc.(a) |
|
|
13,640 |
|
|
|
1,473,256 |
|
| Snowflake, Inc. - Class A(a) |
|
|
3,754 |
|
|
|
632,211 |
|
| SS&C Technologies Holdings, Inc. |
|
|
1,864 |
|
|
|
140,341 |
|
| Strategy, Inc. - Class A(a)(b) |
|
|
5,008 |
|
|
|
648,536 |
|
| Synopsys, Inc.(a) |
|
|
1,473 |
|
|
|
609,822 |
|
| Twilio, Inc. - Class A(a) |
|
|
2,641 |
|
|
|
319,455 |
|
| Tyler Technologies, Inc.(a) |
|
|
375 |
|
|
|
133,009 |
|
| Veeva Systems, Inc. - Class A(a) |
|
|
1,391 |
|
|
|
253,176 |
|
| Workday, Inc. - Class A(a) |
|
|
2,456 |
|
|
|
328,515 |
|
| Zoom Communications, Inc. - Class A(a) |
|
|
2,182 |
|
|
|
161,337 |
|
| Zscaler, Inc.(a) |
|
|
2,434 |
|
|
|
357,774 |
|
| |
|
|
|
|
|
|
53,087,922 |
|
| |
|
|
|
|
|
|
|
|
|
Tech Hardware & Semiconductors - 30.8%(d) |
|
|
|
|
|
|
|
|
| Advanced Micro Devices, Inc.(a) |
|
|
27,056 |
|
|
|
5,416,882 |
|
| Analog Devices, Inc. |
|
|
4,507 |
|
|
|
1,603,545 |
|
| Apple, Inc. |
|
|
95,045 |
|
|
|
25,108,988 |
|
| Applied Materials, Inc. |
|
|
5,068 |
|
|
|
1,886,816 |
|
| Arista Networks, Inc.(a) |
|
|
12,958 |
|
|
|
1,729,893 |
|
| Astera Labs, Inc.(a) |
|
|
2,741 |
|
|
|
325,713 |
|
| Broadcom, Inc. |
|
|
87,683 |
|
|
|
28,019,103 |
|
| Ciena Corp.(a) |
|
|
1,712 |
|
|
|
596,974 |
|
| Cisco Systems, Inc. |
|
|
27,032 |
|
|
|
2,147,963 |
|
| Corning, Inc. |
|
|
10,440 |
|
|
|
1,569,967 |
|
| Dell Technologies, Inc. - Class C |
|
|
2,220 |
|
|
|
328,738 |
|
| Garmin Ltd. |
|
|
1,761 |
|
|
|
445,234 |
|
| Hewlett Packard Enterprise Co. |
|
|
9,048 |
|
|
|
194,261 |
|
| HP, Inc. |
|
|
5,639 |
|
|
|
107,085 |
|
| Intel Corp.(a) |
|
|
21,327 |
|
|
|
972,724 |
|
| Jabil, Inc. |
|
|
651 |
|
|
|
172,508 |
|
| KLA Corp. |
|
|
1,447 |
|
|
|
2,206,024 |
|
| Lam Research Corp. |
|
|
15,124 |
|
|
|
3,537,352 |
|
| Marvell Technology, Inc. |
|
|
24,569 |
|
|
|
2,007,042 |
|
| Microchip Technology, Inc. |
|
|
6,368 |
|
|
|
475,307 |
|
| Micron Technology, Inc. |
|
|
33,194 |
|
|
|
13,688,210 |
|
| Monolithic Power Systems, Inc. |
|
|
1,023 |
|
|
|
1,169,023 |
|
| Motorola Solutions, Inc. |
|
|
1,311 |
|
|
|
632,243 |
|
| NetApp, Inc. |
|
|
1,254 |
|
|
|
124,184 |
|
| NVIDIA Corp. |
|
|
432,154 |
|
|
|
76,573,367 |
|
| ON Semiconductor Corp.(a) |
|
|
2,221 |
|
|
|
147,652 |
|
| Pure Storage, Inc. - Class A(a) |
|
|
4,808 |
|
|
|
308,770 |
|
| QUALCOMM, Inc. |
|
|
9,346 |
|
|
|
1,330,497 |
|
The accompanying notes are an integral part of these financial statements.
| Sandisk Corp.(a) |
|
|
803 |
|
|
|
510,194 |
|
| Seagate Technology Holdings PLC |
|
|
4,102 |
|
|
|
1,672,960 |
|
| Skyworks Solutions, Inc. |
|
|
944 |
|
|
|
56,243 |
|
| Super Micro Computer, Inc.(a)(b) |
|
|
7,482 |
|
|
|
242,342 |
|
| Teledyne Technologies, Inc.(a) |
|
|
313 |
|
|
|
213,184 |
|
| Teradyne, Inc. |
|
|
1,113 |
|
|
|
356,193 |
|
| Texas Instruments, Inc. |
|
|
6,526 |
|
|
|
1,384,230 |
|
| Western Digital Corp. |
|
|
2,940 |
|
|
|
822,318 |
|
| Zebra Technologies, Corp. - Class A(a) |
|
|
718 |
|
|
|
160,803 |
|
| |
|
|
|
|
|
|
178,244,532 |
|
| |
|
|
|
|
|
|
|
|
| Telecommunications - 0.6% |
|
|
|
|
|
|
|
|
| AT&T, Inc. |
|
|
47,788 |
|
|
|
1,338,542 |
|
| T-Mobile US, Inc. |
|
|
3,396 |
|
|
|
737,238 |
|
| Verizon Communications, Inc. |
|
|
29,824 |
|
|
|
1,495,375 |
|
| |
|
|
|
|
|
|
3,571,155 |
|
| |
|
|
|
|
|
|
|
|
| Utilities - 2.1% |
|
|
|
|
|
|
|
|
| Alliant Energy Corp.(b) |
|
|
1,513 |
|
|
|
109,450 |
|
| Ameren Corp. |
|
|
2,453 |
|
|
|
277,876 |
|
| American Electric Power Co., Inc. |
|
|
4,034 |
|
|
|
539,830 |
|
| American Water Works Co., Inc. |
|
|
1,387 |
|
|
|
188,674 |
|
| Atmos Energy Corp. |
|
|
780 |
|
|
|
145,696 |
|
| CenterPoint Energy, Inc. |
|
|
3,456 |
|
|
|
150,336 |
|
| CMS Energy Corp. |
|
|
1,607 |
|
|
|
125,458 |
|
| Consolidated Edison, Inc. |
|
|
1,975 |
|
|
|
222,227 |
|
| Constellation Energy Corp. |
|
|
2,792 |
|
|
|
921,025 |
|
| Dominion Energy, Inc. |
|
|
5,933 |
|
|
|
374,610 |
|
| DTE Energy Co. |
|
|
1,796 |
|
|
|
266,239 |
|
| Duke Energy Corp. |
|
|
5,281 |
|
|
|
691,019 |
|
| Edison International |
|
|
2,611 |
|
|
|
195,146 |
|
| Entergy Corp.(b) |
|
|
2,155 |
|
|
|
230,822 |
|
| Evergy, Inc. |
|
|
1,326 |
|
|
|
110,933 |
|
| Eversource Energy |
|
|
8,893 |
|
|
|
677,736 |
|
| Exelon Corp. |
|
|
8,618 |
|
|
|
426,332 |
|
| FirstEnergy Corp. |
|
|
5,350 |
|
|
|
273,706 |
|
| NextEra Energy, Inc. |
|
|
19,809 |
|
|
|
1,857,490 |
|
| NiSource, Inc. |
|
|
2,329 |
|
|
|
110,162 |
|
| NRG Energy, Inc. |
|
|
1,536 |
|
|
|
274,883 |
|
| PG&E Corp. |
|
|
16,871 |
|
|
|
320,549 |
|
| PPL Corp. |
|
|
4,656 |
|
|
|
181,491 |
|
| Public Service Enterprise Group, Inc. |
|
|
4,302 |
|
|
|
370,273 |
|
| Sempra |
|
|
2,843 |
|
|
|
273,696 |
|
| Southern Co. |
|
|
8,000 |
|
|
|
779,040 |
|
| Vistra Corp. |
|
|
7,754 |
|
|
|
1,348,343 |
|
| WEC Energy Group, Inc. |
|
|
1,772 |
|
|
|
207,253 |
|
| Xcel Energy, Inc. |
|
|
2,890 |
|
|
|
240,910 |
|
| |
|
|
|
|
|
|
11,891,205 |
|
| |
|
|
|
|
|
|
|
|
| TOTAL COMMON STOCKS (Cost $447,691,515) |
|
|
|
|
|
|
576,918,750 |
|
The accompanying notes are an integral part of these financial statements.
| CONTINGENT VALUE RIGHTS - 0.0% |
|
Shares |
|
|
Value |
|
| Health Care - 0.0% |
|
|
|
|
|
|
|
|
| ABIOMED, Inc., Expires, Exercise Price $0.00 (a)(e) |
|
|
455 |
|
|
|
– |
|
| |
|
|
|
|
|
|
|
|
| TOTAL CONTINGENT VALUE RIGHTS (Cost $–) |
|
|
|
|
|
|
– |
|
| |
|
|
|
|
|
|
|
|
| SHORT-TERM INVESTMENTS - 1.2% |
|
|
|
|
|
|
|
|
|
Investments Purchased with Collateral from Securities Lending - 1.0% |
|
|
Units |
|
|
|
Value |
|
| Mount Vernon Liquid Assets Portfolio, LLC, 3.78%(f) |
|
|
5,687,284 |
|
|
|
5,687,284 |
|
| |
|
|
|
|
|
|
|
|
|
Money Market Funds - 0.2% |
|
|
Shares |
|
|
|
Value |
|
| First American Government Obligations Fund - Class X, 3.60%(f) |
|
|
895,148 |
|
|
|
895,148 |
|
| |
|
|
|
|
|
|
|
|
|
TOTAL SHORT-TERM INVESTMENTS (Cost $6,582,432) |
|
|
|
|
|
|
6,582,432 |
|
| |
|
|
|
|
|
|
|
|
|
TOTAL INVESTMENTS - 100.9% (Cost $454,273,947) |
|
|
|
|
|
|
583,501,182 |
|
| Liabilities in Excess of Other Assets - (0.9)% |
|
|
|
|
|
|
(5,250,039 |
) |
| TOTAL NET ASSETS - 100.0% |
|
|
|
|
|
$ |
578,251,143 |
|
| |
|
|
|
|
|
|
|
|
| Percentages are stated as a percent of net assets. |
|
|
|
|
|
|
|
|
| ADR |
American Depositary Receipt |
| PLC |
Public Limited Company |
| REIT |
Real Estate Investment Trust |
| (a) |
Non-income producing security. |
| (b) |
All or a portion of this security is on loan as of February 28, 2026. The total market value of these securities was $5,502,490 which represented 1.0% of net assets. |
| (c) |
Does not round to 0.1% or (0.1)%, as applicable. |
| (d) |
To the extent that the Fund invests more heavily in a particular industry or sector of the economy, its performance will be especially sensitive to developments that significantly affect those industries or sectors. |
| (e) |
Fair value determined using significant unobservable inputs in accordance with procedures established by and under the supervision of the Adviser, acting as Valuation Designee. These securities represented $0 or 0.0% of net assets as of February 28, 2026. |
| (f) |
The rate shown represents the 7-day annualized effective yield as of February 28, 2026. |
The accompanying notes are an integral part of these financial statements.
SoFi Social 50 ETF
Schedule of Investments
February 28, 2026
| COMMON STOCKS - 99.9% |
|
Shares |
|
|
Value |
|
| Consumer Discretionary Products - 15.4% |
|
|
|
|
|
|
|
|
| Ford Motor Co. |
|
|
21,532 |
|
|
$ |
303,386 |
|
| Lucid Group, Inc.(a)(b) |
|
|
11,806 |
|
|
|
118,060 |
|
| Nike, Inc. - Class B |
|
|
4,973 |
|
|
|
309,221 |
|
| NIO, Inc. - Class A, ADR(a)(b) |
|
|
67,211 |
|
|
|
327,318 |
|
| Rivian Automotive, Inc. - Class A(a) |
|
|
65,987 |
|
|
|
1,011,581 |
|
| Tesla, Inc.(a) |
|
|
8,548 |
|
|
|
3,440,655 |
|
| |
|
|
|
|
|
|
5,510,221 |
|
| |
|
|
|
|
|
|
|
|
| Consumer Discretionary Services - 0.6% |
|
|
|
|
|
|
|
|
| AMC Entertainment Holdings, Inc. - Class A(a)(b) |
|
|
49,544 |
|
|
|
57,471 |
|
| Starbucks Corp. |
|
|
1,669 |
|
|
|
163,595 |
|
| |
|
|
|
|
|
|
221,066 |
|
| |
|
|
|
|
|
|
|
|
| Consumer Staple Products - 1.4% |
|
|
|
|
|
|
|
|
| Coca-Cola Co. |
|
|
5,264 |
|
|
|
429,332 |
|
| Tilray Brands Inc(a)(b) |
|
|
9,436 |
|
|
|
74,261 |
|
| |
|
|
|
|
|
|
503,593 |
|
| |
|
|
|
|
|
|
|
|
| Financial Services - 2.1% |
|
|
|
|
|
|
|
|
| Coinbase Global, Inc. - Class A(a) |
|
|
2,077 |
|
|
|
365,240 |
|
| Klarna Group PLC(a)(b) |
|
|
5,447 |
|
|
|
73,861 |
|
| PayPal Holdings, Inc. |
|
|
6,969 |
|
|
|
322,038 |
|
| |
|
|
|
|
|
|
761,139 |
|
| |
|
|
|
|
|
|
|
|
| Health Care - 5.9% |
|
|
|
|
|
|
|
|
| Eli Lilly & Co. |
|
|
600 |
|
|
|
631,194 |
|
| Johnson & Johnson |
|
|
931 |
|
|
|
231,289 |
|
| Pfizer, Inc. |
|
|
13,482 |
|
|
|
372,777 |
|
| UnitedHealth Group, Inc. |
|
|
2,923 |
|
|
|
857,228 |
|
| |
|
|
|
|
|
|
2,092,488 |
|
| |
|
|
|
|
|
|
|
|
| Industrial Products - 0.6% |
|
|
|
|
|
|
|
|
| Boeing Co.(a) |
|
|
878 |
|
|
|
199,771 |
|
| |
|
|
|
|
|
|
|
|
| Industrial Services - 0.5% |
|
|
|
|
|
|
|
|
| Delta Air Lines, Inc. |
|
|
2,626 |
|
|
|
172,528 |
|
| |
|
|
|
|
|
|
|
|
| Insurance - 4.7% |
|
|
|
|
|
|
|
|
| Berkshire Hathaway, Inc. - Class B(a) |
|
|
3,326 |
|
|
|
1,679,464 |
|
| |
|
|
|
|
|
|
|
|
| Media - 15.1% |
|
|
|
|
|
|
|
|
| Alphabet, Inc. - Class A |
|
|
4,431 |
|
|
|
1,381,409 |
|
| Alphabet, Inc. - Class C |
|
|
3,578 |
|
|
|
1,114,296 |
|
| Meta Platforms, Inc. - Class A |
|
|
2,092 |
|
|
|
1,355,993 |
|
| Netflix, Inc.(a) |
|
|
8,011 |
|
|
|
770,979 |
|
| Reddit, Inc. - Class A(a)(b) |
|
|
1,974 |
|
|
|
287,829 |
|
The accompanying notes are an integral part of these financial statements.
| Stubhub Holdings, Inc. - Class A(a)(b) |
|
|
3,321 |
|
|
|
31,782 |
|
| Walt Disney Co. |
|
|
4,262 |
|
|
|
451,942 |
|
| |
|
|
|
|
|
|
5,394,230 |
|
| |
|
|
|
|
|
|
|
|
| Oil & Gas - 2.2% |
|
|
|
|
|
|
|
|
| Chevron Corp. |
|
|
1,929 |
|
|
|
360,260 |
|
| Exxon Mobil Corp. |
|
|
2,710 |
|
|
|
413,275 |
|
| |
|
|
|
|
|
|
773,535 |
|
| |
|
|
|
|
|
|
|
|
| Real Estate - 1.5% |
|
|
|
|
|
|
|
|
| Realty Income Corp. - REIT |
|
|
7,947 |
|
|
|
532,449 |
|
| |
|
|
|
|
|
|
|
|
| Retail & Wholesale - Discretionary - 7.7% |
|
|
|
|
|
|
|
|
| Amazon.com, Inc.(a) |
|
|
10,750 |
|
|
|
2,257,500 |
|
| GameStop Corp. - Class A(a)(b) |
|
|
19,958 |
|
|
|
479,591 |
|
| |
|
|
|
|
|
|
2,737,091 |
|
| |
|
|
|
|
|
|
|
|
| Retail & Wholesale - Staples - 6.4% |
|
|
|
|
|
|
|
|
| Costco Wholesale Corp. |
|
|
1,306 |
|
|
|
1,320,092 |
|
| Target Corp. |
|
|
1,939 |
|
|
|
220,639 |
|
| Walmart, Inc. |
|
|
5,854 |
|
|
|
749,019 |
|
| |
|
|
|
|
|
|
2,289,750 |
|
| |
|
|
|
|
|
|
|
|
| Software & Tech Services - 10.4% |
|
|
|
|
|
|
|
|
| Figma, Inc. - Class A(a) |
|
|
4,088 |
|
|
|
120,146 |
|
| Microsoft Corp. |
|
|
3,486 |
|
|
|
1,369,092 |
|
| Oracle Corp. |
|
|
1,743 |
|
|
|
253,432 |
|
| Palantir Technologies, Inc. - Class A(a) |
|
|
10,219 |
|
|
|
1,401,945 |
|
| Shopify, Inc. - Class A(a) |
|
|
3,410 |
|
|
|
411,689 |
|
| SoundHound AI, Inc. - Class A(a)(b) |
|
|
17,933 |
|
|
|
154,224 |
|
| |
|
|
|
|
|
|
3,710,528 |
|
| |
|
|
|
|
|
|
|
|
| Tech Hardware & Semiconductors - 24.2% |
|
|
|
|
|
|
|
|
| Advanced Micro Devices, Inc.(a) |
|
|
6,327 |
|
|
|
1,266,729 |
|
| Apple, Inc. |
|
|
5,773 |
|
|
|
1,525,111 |
|
| Broadcom, Inc. |
|
|
2,357 |
|
|
|
753,179 |
|
| Intel Corp.(a) |
|
|
9,454 |
|
|
|
431,197 |
|
| Micron Technology, Inc. |
|
|
2,019 |
|
|
|
832,575 |
|
| NVIDIA Corp. |
|
|
15,676 |
|
|
|
2,777,631 |
|
| Taiwan Semiconductor Manufacturing Co. Ltd., ADR |
|
|
2,838 |
|
|
|
1,063,058 |
|
| |
|
|
|
|
|
|
8,649,480 |
|
| |
|
|
|
|
|
|
|
|
| Telecommunications - 1.2% |
|
|
|
|
|
|
|
|
| AT&T, Inc. |
|
|
7,239 |
|
|
|
202,764 |
|
| Verizon Communications, Inc. |
|
|
4,389 |
|
|
|
220,065 |
|
| |
|
|
|
|
|
|
422,829 |
|
| |
|
|
|
|
|
|
|
|
| TOTAL COMMON STOCKS (Cost $27,467,607) |
|
|
|
|
|
|
35,650,162 |
|
The accompanying notes are an integral part of these financial statements.
| SHORT-TERM INVESTMENTS - 4.3% |
|
|
|
|
|
|
| Investments Purchased with Collateral from Securities Lending - 4.2% |
|
Units |
|
|
Value |
|
| Mount Vernon Liquid Assets Portfolio, LLC, 3.78%(c) |
|
|
1,513,590 |
|
|
|
1,513,590 |
|
| |
|
|
|
|
|
|
|
|
|
Money Market Funds - 0.1% |
|
Shares |
|
|
Value |
|
| First American Government Obligations Fund - Class X, 3.60%(c) |
|
|
42,375 |
|
|
|
42,375 |
|
| |
|
|
|
|
|
|
|
|
| TOTAL SHORT-TERM INVESTMENTS (Cost $1,555,965) |
|
|
|
|
|
|
1,555,965 |
|
| |
|
|
|
|
|
|
|
|
| TOTAL INVESTMENTS - 104.2% (Cost $29,023,572) |
|
|
|
|
|
|
37,206,127 |
|
| Liabilities in Excess of Other Assets - (4.2)% |
|
|
|
|
|
|
(1,492,144 |
) |
| TOTAL NET ASSETS - 100.0% |
|
|
|
|
|
$ |
35,713,983 |
|
| |
|
|
|
|
|
|
|
|
| Percentages are stated as a percent of net assets. |
|
|
|
|
|
|
|
|
| ADR |
American Depositary Receipt |
| PLC |
Public Limited Company |
| REIT |
Real Estate Investment Trust |
| (a) |
Non-income producing security. |
| (b) |
All or a portion of this security is on loan as of February 28, 2026. The total market value of these securities was $1,429,819 which represented 4.0% of net assets. |
| (c) |
The rate shown represents the 7-day annualized effective yield as of February 28, 2026. |
The accompanying notes are an integral part of these financial statements.
Statements of Assets and Liabilities
February 28, 2026
| |
|
SoFi Agentic AI
ETF |
|
|
SoFi Enhanced
Yield ETF |
|
|
SoFi Select 500
ETF |
|
|
SoFi Social 50
ETF |
|
| ASSETS: |
|
|
|
|
|
|
|
|
|
|
|
|
|
|
|
|
|
Investments, at value (cost $10,281,189, $39,338,589, $454,273,947 and $29,023,572. Including $-, $-, $5,502,490 and $1,429,819 of securities loaned) (Note 2)(b) |
|
$ |
10,131,398 |
|
|
$ |
38,616,294 |
|
|
$ |
583,501,182 |
|
|
$ |
37,206,127 |
|
| Receivable for investments sold |
|
|
19,897 |
|
|
|
– |
|
|
|
– |
|
|
|
– |
|
| Dividends receivable |
|
|
2,340 |
|
|
|
– |
|
|
|
452,132 |
|
|
|
27,304 |
|
| Interest receivable |
|
|
40 |
|
|
|
553 |
|
|
|
3,946 |
|
|
|
223 |
|
| Dividend tax reclaim receivable |
|
|
– |
|
|
|
– |
|
|
|
1,529 |
|
|
|
– |
|
| Deposits with brokers for other investments |
|
|
– |
|
|
|
830,441 |
|
|
|
– |
|
|
|
– |
|
| Security lending income receivable (Note 6) |
|
|
– |
|
|
|
– |
|
|
|
1,148 |
|
|
|
2,373 |
|
| Total assets |
|
|
10,153,675 |
|
|
|
39,447,288 |
|
|
|
583,959,937 |
|
|
|
37,236,027 |
|
| |
|
|
|
|
|
|
|
|
|
|
|
|
|
|
|
|
| LIABILITIES: |
|
|
|
|
|
|
|
|
|
|
|
|
|
|
|
|
| Written option contracts, premium received (cost $–, $2,701,783, $– and $–) |
|
|
– |
|
|
|
1,907,625 |
|
|
|
– |
|
|
|
– |
|
| Payable upon return of securities loaned (Note 6) |
|
|
– |
|
|
|
– |
|
|
|
5,687,284 |
|
|
|
1,513,590 |
|
| Payable to adviser (Note 4) |
|
|
5,459 |
|
|
|
14,040 |
|
|
|
21,510 |
|
|
|
8,454 |
|
| Total liabilities |
|
|
5,459 |
|
|
|
1,921,665 |
|
|
|
5,708,794 |
|
|
|
1,522,044 |
|
| NET ASSETS |
|
$ |
10,148,216 |
|
|
$ |
37,525,623 |
|
|
$ |
578,251,143 |
|
|
$ |
35,713,983 |
|
| |
|
|
|
|
|
|
|
|
|
|
|
|
|
|
|
|
| NET ASSETS CONSISTS OF: |
|
|
|
|
|
|
|
|
|
|
|
|
|
|
|
|
| Paid-in capital |
|
$ |
10,343,377 |
|
|
$ |
44,955,583 |
|
|
$ |
492,716,713 |
|
|
$ |
37,241,943 |
|
| Total distributable earnings/(accumulated losses) |
|
|
(195,161 |
) |
|
|
(7,429,960 |
) |
|
|
85,534,430 |
|
|
|
(1,527,960 |
) |
| Total Net Assets |
|
$ |
10,148,216 |
|
|
$ |
37,525,623 |
|
|
$ |
578,251,143 |
|
|
$ |
35,713,983 |
|
| |
|
|
|
|
|
|
|
|
|
|
|
|
|
|
|
|
| Net assets |
|
$ |
10,148,216 |
|
|
$ |
37,525,623 |
|
|
$ |
578,251,143 |
|
|
$ |
35,713,983 |
|
| Shares issued and outstanding(a) |
|
|
475,000 |
|
|
|
2,450,000 |
|
|
|
4,399,973 |
|
|
|
670,000 |
|
| Net asset value per share |
|
$ |
21.36 |
|
|
$ |
15.32 |
|
|
$ |
131.42 |
|
|
$ |
53.30 |
|
| (a) |
Unlimited shares authorized without par value. |
| (b) |
Investments in securities include securities purchased with cash proceeds from securities loans. |
The accompanying notes are an integral part of these financial statements.
Statements of Operations
For the Period Ended February 28, 2026
| |
|
SoFi Agentic AI ETF(a) |
|
|
SoFi Enhanced
Yield ETF |
|
|
SoFi Select 500
ETF |
|
|
SoFi Social 50
ETF |
|
| |
|
|
|
|
|
|
|
|
|
|
|
|
|
INVESTMENT INCOME: |
|
|
|
|
|
|
|
|
|
|
|
|
|
|
|
|
| Dividend income |
|
$ |
12,206 |
|
|
$ |
– |
|
|
$ |
5,352,231 |
|
|
$ |
198,866 |
|
| Less: Dividend withholding taxes |
|
|
– |
|
|
|
– |
|
|
|
– |
|
|
|
(1,833 |
) |
| Less: Issuance fees |
|
|
– |
|
|
|
– |
|
|
|
(124 |
) |
|
|
(1,587 |
) |
| Interest income |
|
|
300 |
|
|
|
1,516,089 |
|
|
|
55,834 |
|
|
|
2,934 |
|
| Securities lending income (Note 6) |
|
|
– |
|
|
|
– |
|
|
|
16,458 |
|
|
|
28,120 |
|
| Total investment income |
|
|
12,506 |
|
|
|
1,516,089 |
|
|
|
5,424,399 |
|
|
|
226,500 |
|
| |
|
|
|
|
|
|
|
|
|
|
|
|
|
|
|
|
|
EXPENSES: |
|
|
|
|
|
|
|
|
|
|
|
|
|
|
|
|
| Investment advisory fee (Note 4) |
|
|
29,654 |
|
|
|
182,851 |
|
|
|
989,079 |
|
|
|
93,551 |
|
| Interest expense |
|
|
– |
|
|
|
51,633 |
|
|
|
– |
|
|
|
– |
|
| Broker Fees |
|
|
– |
|
|
|
9,532 |
|
|
|
– |
|
|
|
– |
|
| Total expenses |
|
|
29,654 |
|
|
|
244,016 |
|
|
|
989,079 |
|
|
|
93,551 |
|
| Expense reimbursement by Adviser (Note 4) |
|
|
– |
|
|
|
– |
|
|
|
(728,795 |
) |
|
|
– |
|
| Net expenses |
|
|
29,654 |
|
|
|
244,016 |
|
|
|
260,284 |
|
|
|
93,551 |
|
| NET INVESTMENT INCOME (LOSS) |
|
|
(17,148 |
) |
|
|
1,272,073 |
|
|
|
5,164,115 |
|
|
|
132,949 |
|
| |
|
|
|
|
|
|
|
|
|
|
|
|
|
|
|
|
|
REALIZED AND UNREALIZED GAIN (LOSS) |
|
|
|
|
|
|
|
|
|
|
|
|
|
|
|
|
| Net realized gain (loss) from: |
|
|
|
|
|
|
|
|
|
|
|
|
|
|
|
|
| Investments |
|
|
10,739 |
|
|
|
42,244,695 |
|
|
|
(4,955,675 |
) |
|
|
378,169 |
|
| In-kind redemptions |
|
|
– |
|
|
|
– |
|
|
|
35,271,550 |
|
|
|
3,671,735 |
|
| Written option contracts |
|
|
– |
|
|
|
(49,340,358 |
) |
|
|
– |
|
|
|
– |
|
| Net realized gain (loss) |
|
|
10,739 |
|
|
|
(7,095,663 |
) |
|
|
30,315,875 |
|
|
|
4,049,904 |
|
| Net change in unrealized appreciation (depreciation) on: |
| Investments |
|
|
(149,791 |
) |
|
|
1,469,046 |
|
|
|
61,062,999 |
|
|
|
2,755,718 |
|
| Written option contracts |
|
|
– |
|
|
|
(1,528,139 |
) |
|
|
– |
|
|
|
– |
|
|
Net change in unrealized appreciation (depreciation) |
|
|
(149,791 |
) |
|
|
(59,093 |
) |
|
|
61,062,999 |
|
|
|
2,755,718 |
|
| Net realized and unrealized gain (loss) |
|
|
(139,052 |
) |
|
|
(7,154,756 |
) |
|
|
91,378,874 |
|
|
|
6,805,622 |
|
|
NET INCREASE (DECREASE) IN NET ASSETS RESULTING FROM OPERATIONS |
|
$ |
(156,200 |
) |
|
$ |
(5,882,683 |
) |
|
$ |
96,542,989 |
|
|
$ |
6,938,571 |
|
| (a) |
Inception date of the Fund was September 2, 2025. |
The accompanying notes are an integral part of these financial statements.
Statements of Changes in Net Assets
| |
|
SoFi Agentic AI
ETF |
|
|
SoFi Enhanced Yield ETF |
|
| |
|
Period Ended February 28, 2026(a) |
|
|
Year Ended February 28, 2026 |
|
|
Year Ended February 28,
2025 |
|
| OPERATIONS: |
|
|
|
|
|
|
|
|
|
|
|
|
| Net investment income (loss) |
|
$ |
(17,148 |
) |
|
$ |
1,272,073 |
|
|
$ |
1,229,149 |
|
| Net realized gain (loss) |
|
|
10,739 |
|
|
|
(7,095,663 |
) |
|
|
(365,056 |
) |
| Net change in unrealized appreciation (depreciation) |
|
|
(149,791 |
) |
|
|
(59,093 |
) |
|
|
97,107 |
|
| Net increase (decrease) in net assets resulting from operations |
|
|
(156,200 |
) |
|
|
(5,882,683 |
) |
|
|
961,200 |
|
| |
|
|
|
|
|
|
|
|
|
|
|
|
| DISTRIBUTIONS TO SHAREHOLDERS: |
|
|
|
|
|
|
|
|
|
|
|
|
| From earnings |
|
|
(38,961 |
) |
|
|
(1,270,624 |
) |
|
|
(1,234,835 |
) |
| Return of capital |
|
|
– |
|
|
|
(3,170,241 |
) |
|
|
(2,590,578 |
) |
| Total distributions to shareholders |
|
|
(38,961 |
) |
|
|
(4,440,865 |
) |
|
|
(3,825,413 |
) |
| |
|
|
|
|
|
|
|
|
|
|
|
|
| CAPITAL TRANSACTIONS: |
|
|
|
|
|
|
|
|
|
|
|
|
| Subscriptions |
|
|
10,343,377 |
|
|
|
14,460,854 |
|
|
|
66,975,188 |
|
| Redemptions |
|
|
– |
|
|
|
(15,679,035 |
) |
|
|
(25,097,133 |
) |
| ETF transaction fees (Note 9) |
|
|
– |
|
|
|
6,028 |
|
|
|
18,414 |
|
| Net increase (decrease) in net assets from capital transactions |
|
|
10,343,377 |
|
|
|
(1,212,153 |
) |
|
|
41,896,469 |
|
| |
|
|
|
|
|
|
|
|
|
|
|
|
| NET INCREASE (DECREASE) IN NET ASSETS |
|
|
10,148,216 |
|
|
|
(11,535,701 |
) |
|
|
39,032,256 |
|
| |
|
|
|
|
|
|
|
|
|
|
|
|
| NET ASSETS: |
|
|
|
|
|
|
|
|
|
|
|
|
| Beginning of the period |
|
|
– |
|
|
|
49,061,324 |
|
|
|
10,029,068 |
|
| End of the period |
|
$ |
10,148,216 |
|
|
$ |
37,525,623 |
|
|
$ |
49,061,324 |
|
| |
|
|
|
|
|
|
|
|
|
|
|
|
| SHARES TRANSACTIONS |
|
|
|
|
|
|
|
|
|
|
|
|
| Subscriptions |
|
|
475,000 |
|
|
|
950,000 |
|
|
|
3,400,000 |
|
| Redemptions |
|
|
– |
|
|
|
(1,075,000 |
) |
|
|
(1,325,000 |
) |
| Total increase (decrease) in shares outstanding |
|
|
475,000 |
|
|
|
(125,000 |
) |
|
|
2,075,000 |
|
| (a) |
Inception date of the Fund was September 2, 2025. |
The accompanying notes are an integral part of these financial statements.
Statements of Changes in Net Assets
| |
|
SoFi Select 500 ETF |
|
|
SoFi Social 50 ETF |
|
| |
|
Year Ended
February 28, 2026 |
|
|
Year Ended
February 28, 2025 |
|
|
Year Ended
February 28, 2026 |
|
|
Year Ended
February 28, 2025 |
|
| OPERATIONS: |
|
|
|
|
|
|
|
|
|
|
|
|
|
|
|
|
| Net investment income (loss) |
|
$ |
5,164,115 |
|
|
$ |
8,793,514 |
|
|
$ |
132,949 |
|
|
$ |
72,296 |
|
| Net realized gain (loss) |
|
|
30,315,875 |
|
|
|
240,669,888 |
|
|
|
4,049,904 |
|
|
|
1,530,568 |
|
| Net change in unrealized appreciation (depreciation) |
|
|
61,062,999 |
|
|
|
(64,328,209 |
) |
|
|
2,755,718 |
|
|
|
3,114,916 |
|
| Net increase (decrease) in net assets resulting from operations |
|
|
96,542,989 |
|
|
|
185,135,193 |
|
|
|
6,938,571 |
|
|
|
4,717,780 |
|
| |
|
|
|
|
|
|
|
|
|
|
|
|
|
|
|
|
|
DISTRIBUTIONS TO SHAREHOLDERS: |
|
|
|
|
|
|
|
|
|
|
|
|
|
|
|
|
| Distributions to shareholders |
|
|
(5,386,671 |
) |
|
|
(9,213,159 |
) |
|
|
(123,020 |
) |
|
|
(71,108 |
) |
| Total distributions to shareholders |
|
|
(5,386,671 |
) |
|
|
(9,213,159 |
) |
|
|
(123,020 |
) |
|
|
(71,108 |
) |
| |
|
|
|
|
|
|
|
|
|
|
|
|
|
|
|
|
|
CAPITAL TRANSACTIONS: |
|
|
|
|
|
|
|
|
|
|
|
|
|
|
|
|
| Subscriptions |
|
|
84,600,405 |
|
|
|
328,846,800 |
|
|
|
12,102,222 |
|
|
|
6,088,547 |
|
| Redemptions |
|
|
(107,634,125 |
) |
|
|
(664,162,650 |
) |
|
|
(7,529,863 |
) |
|
|
(3,704,703 |
) |
| Net increase (decrease) in net assets from capital transactions |
|
|
(23,033,720 |
) |
|
|
(335,315,850 |
) |
|
|
4,572,359 |
|
|
|
2,383,844 |
|
| |
|
|
|
|
|
|
|
|
|
|
|
|
|
|
|
|
|
NET INCREASE (DECREASE) IN NET ASSETS |
|
|
68,122,598 |
|
|
|
(159,393,816 |
) |
|
|
11,387,910 |
|
|
|
7,030,516 |
|
| |
|
|
|
|
|
|
|
|
|
|
|
|
|
|
|
|
|
NET ASSETS: |
|
|
|
|
|
|
|
|
|
|
|
|
|
|
|
|
| Beginning of the period |
|
|
510,128,545 |
|
|
|
669,522,361 |
|
|
|
24,326,073 |
|
|
|
17,295,557 |
|
| End of the period |
|
$ |
578,251,143 |
|
|
$ |
510,128,545 |
|
|
$ |
35,713,983 |
|
|
$ |
24,326,073 |
|
| |
|
|
|
|
|
|
|
|
|
|
|
|
|
|
|
|
|
SHARES TRANSACTIONS |
|
|
|
|
|
|
|
|
|
|
|
|
|
|
|
|
| Subscriptions |
|
|
650,000 |
|
|
|
10,650,000 |
(a) |
|
|
250,000 |
|
|
|
140,000 |
|
| Redemptions |
|
|
(900,000 |
) |
|
|
(8,650,027 |
)(a) |
|
|
(160,000 |
) |
|
|
(100,000 |
) |
| Total increase (decrease) in shares outstanding |
|
|
(250,000 |
) |
|
|
1,999,973 |
|
|
|
90,000 |
|
|
|
40,000 |
|
|
(a) |
Share amounts for the Fund have been adjusted for a one-for-five reverse stock split effective on October 1, 2024 (Note 10). |
The accompanying notes are an integral part of these financial statements.
Financial Highlights
For a share outstanding throughout the period presented
| |
|
SoFi Agentic AI ETF |
| |
|
Period Ended February 28, 2026(a) |
| PER SHARE DATA: |
|
|
|
|
| |
|
|
|
|
| Net asset value, beginning of period |
|
|
$20.00 |
|
| |
|
|
|
|
| INVESTMENTS OPERATIONS: |
|
|
|
|
| Net investment income (loss)(b) |
|
|
(0.04) |
|
| Net realized and unrealized gain (loss)(c) |
|
|
1.49 |
|
| Total from investment operations |
|
|
1.45 |
|
| |
|
|
|
|
| LESS DISTRIBUTIONS FROM: |
|
|
|
|
| Net investment income |
|
|
(0.09) |
|
| Total distributions |
|
|
(0.09) |
|
| |
|
|
|
|
| Net asset value, end of period |
|
|
$21.36 |
|
| TOTAL RETURN(d) |
|
|
7.23% |
|
| |
|
|
|
|
| SUPPLEMENTAL DATA AND RATIOS: |
|
|
|
|
| Net assets, end of period (in thousands) |
|
|
$10,148 |
|
| Ratio of expenses to average net assets(e) |
|
|
0.69% |
|
| Ratio of net investment income to average net assets(e) |
|
|
(0.40)% |
|
| Portfolio turnover rate(d)(f) |
|
|
24% |
|
| (a) |
Inception date of the Fund was September 2, 2025. |
| (b) |
Net investment income per share has been calculated based on average shares outstanding during the period. |
| (c) |
Realized and unrealized gains and losses per share in the caption are balancing amounts necessary to reconcile the change in net asset value per share for the period, and may not reconcile with the aggregate gains and losses in the Statements of Operations due to share transactions for the period. |
| (d) |
Not annualized for periods less than one year. |
| (e) |
Annualized for periods less than one year. |
| (f) |
Portfolio turnover rate excludes in-kind transactions, if any. |
The accompanying notes are an integral part of these financial statements.
Financial Highlights
For a share outstanding throughout the periods presented
| |
|
SoFi Enhanced Yield ETF |
|
| |
|
Year Ended February 28, 2026 |
|
Year Ended February 28, 2025 |
|
Period Ended February 29, 2024(a) |
| PER SHARE DATA: |
|
|
|
|
|
|
|
|
|
|
|
|
| |
|
|
|
|
|
|
|
|
|
|
|
|
| Net asset value, beginning of period |
|
|
$19.05 |
|
|
|
$20.06 |
|
|
|
$20.00 |
|
| |
|
|
|
|
|
|
|
|
|
|
|
|
| INVESTMENTS OPERATIONS: |
|
|
|
|
|
|
|
|
|
|
|
|
| Net investment income (loss)(b) |
|
|
0.53 |
|
|
|
0.76 |
|
|
|
0.26 |
|
| Net realized and unrealized gain (loss)(c) |
|
|
(2.41) |
|
|
|
0.64 |
|
|
|
0.26 |
|
| Total from investment operations |
|
|
(1.88) |
|
|
|
1.40 |
|
|
|
0.52 |
|
| |
|
|
|
|
|
|
|
|
|
|
|
|
| LESS DISTRIBUTIONS FROM: |
|
|
|
|
|
|
|
|
|
|
|
|
| Net investment income |
|
|
(0.53) |
|
|
|
(0.78) |
|
|
|
(0.46) |
|
| Return of capital |
|
|
(1.32) |
|
|
|
(1.64) |
|
|
|
– |
|
| Total distributions |
|
|
(1.85) |
|
|
|
(2.42) |
|
|
|
(0.46) |
|
| |
|
|
|
|
|
|
|
|
|
|
|
|
| ETF transaction fees per share |
|
|
0.00(d) |
|
|
|
0.01 |
|
|
|
0.00(d) |
|
| Net asset value, end of period |
|
|
$15.32 |
|
|
|
$19.05 |
|
|
|
$20.06 |
|
| TOTAL RETURN(e) |
|
|
(9.34)% |
|
|
|
7.53% |
|
|
|
2.64% |
|
| |
|
|
|
|
|
|
|
|
|
|
|
|
| SUPPLEMENTAL DATA AND RATIOS: |
|
|
|
|
|
|
|
|
|
|
|
|
| Net assets, end of period (in thousands) |
|
|
$37,526 |
|
|
|
$49,061 |
|
|
|
$10,029 |
|
| Ratio of expenses to average net assets(f) |
|
|
0.65% |
|
|
|
0.61% |
|
|
|
0.49% |
|
| Ratio of broker fee expense to average net assets(f) |
|
|
0.02% |
|
|
|
0.12% |
|
|
|
–% |
|
| Ratio of interest expense to average net assets(f) |
|
|
0.14% |
|
|
|
–% |
|
|
|
–% |
|
|
Ratio of operational expenses to average net assets excluding broker fee and interest expense(f) |
|
|
0.49% |
|
|
|
0.49% |
|
|
|
–% |
|
| Ratio of net investment income to average net assets(f) |
|
|
3.41% |
|
|
|
3.93% |
|
|
|
4.50% |
|
| Portfolio turnover rate(e)(g) |
|
|
0% |
|
|
|
330% |
|
|
|
8% |
|
| (a) |
Inception date of the Fund was November 14, 2023. |
| (b) |
Net investment income per share has been calculated based on average shares outstanding during the periods. |
| (c) |
Realized and unrealized gains and losses per share in the caption are balancing amounts necessary to reconcile the change in net asset value per share for the periods, and may not reconcile with the aggregate gains and losses in the Statements of Operations due to share transactions for the periods. |
| (d) |
Amount represents less than $0.005 per share. |
| (e) |
Not annualized for periods less than one year. |
| (f) |
Annualized for periods less than one year. |
| (g) |
Portfolio turnover rate excludes in-kind transactions, if any. |
The accompanying notes are an integral part of these financial statements.
Financial Highlights
For a share outstanding throughout the years presented
| |
|
SoFi Select 500 ETF |
|
| |
|
Year Ended February 28, 2026 |
|
Year Ended February 28, 2025 |
|
Year Ended February 29, 2024 |
|
Year Ended February 28, 2023 |
|
Year Ended February 28, 2022 |
| PER SHARE DATA:(a) |
|
|
|
|
|
|
|
|
|
|
|
|
|
|
|
|
|
|
|
|
| |
|
|
|
|
|
|
|
|
|
|
|
|
|
|
|
|
|
|
|
|
| Net asset value, beginning of year |
|
|
$109.71 |
|
|
|
$90.35 |
|
|
|
$69.85 |
|
|
|
$78.65 |
|
|
|
$69.70 |
|
| |
|
|
|
|
|
|
|
|
|
|
|
|
|
|
|
|
|
|
|
|
| INVESTMENTS OPERATIONS: |
|
|
|
|
|
|
|
|
|
|
|
|
|
|
|
|
|
|
|
|
| Net investment income (loss)(b) |
|
|
1.20 |
|
|
|
1.10 |
|
|
|
1.25 |
|
|
|
1.18 |
|
|
|
0.93 |
|
| Net realized and unrealized gain (loss)(c) |
|
|
21.78 |
|
|
|
19.33 |
|
|
|
20.43 |
|
|
|
(8.91) |
|
|
|
8.81 |
|
| Total from investment operations |
|
|
22.98 |
|
|
|
20.43 |
|
|
|
21.68 |
|
|
|
(7.73) |
|
|
|
9.74 |
|
| |
|
|
|
|
|
|
|
|
|
|
|
|
|
|
|
|
|
|
|
|
| LESS DISTRIBUTIONS FROM: |
|
|
|
|
|
|
|
|
|
|
|
|
|
|
|
|
|
|
|
|
| Net investment income |
|
|
(1.27) |
|
|
|
(1.07) |
|
|
|
(1.18) |
|
|
|
(1.07) |
|
|
|
(0.79) |
|
| Total distributions |
|
|
(1.27) |
|
|
|
(1.07) |
|
|
|
(1.18) |
|
|
|
(1.07) |
|
|
|
(0.79) |
|
| |
|
|
|
|
|
|
|
|
|
|
|
|
|
|
|
|
|
|
|
|
| Net asset value, end of year |
|
|
$131.42 |
|
|
|
$109.71 |
|
|
|
$90.35 |
|
|
|
$69.85 |
|
|
|
$78.65 |
|
| TOTAL RETURN |
|
|
21.02% |
|
|
|
22.66% |
|
|
|
31.30% |
|
|
|
(9.78)% |
|
|
|
13.89% |
|
| |
|
|
|
|
|
|
|
|
|
|
|
|
|
|
|
|
|
|
|
|
| SUPPLEMENTAL DATA AND RATIOS: |
|
|
|
|
|
|
|
|
|
|
|
|
|
|
|
|
|
|
|
|
| Net assets, end of year (in thousands) |
|
|
$578,251 |
|
|
|
$510,129 |
|
|
|
$669,522 |
|
|
|
$425,968 |
|
|
|
$380,646 |
|
| Ratio of expenses to average net assets: |
|
|
|
|
|
|
|
|
|
|
|
|
|
|
|
|
|
|
|
|
| Before Investment Advisory Fees waived |
|
|
0.19% |
|
|
|
0.19% |
|
|
|
0.19% |
|
|
|
0.19% |
|
|
|
0.19% |
|
| After Investment Advisory Fees waived |
|
|
0.05% |
|
|
|
0.00%(d) |
|
|
|
–% |
|
|
|
–% |
|
|
|
–% |
|
| Ratio of net investment income to average net assets: |
|
|
|
|
|
|
|
|
|
|
|
|
|
|
|
|
|
|
|
|
| Before Investment Advisory Fees waived |
|
|
0.86% |
|
|
|
0.89% |
|
|
|
1.40% |
|
|
|
1.48% |
|
|
|
0.96% |
|
| After Investment Advisory Fees waived |
|
|
1.00% |
|
|
|
1.08% |
|
|
|
1.59% |
|
|
|
1.67% |
|
|
|
1.15% |
|
| Portfolio turnover rate(e) |
|
|
15% |
|
|
|
29% |
|
|
|
16% |
|
|
|
17% |
|
|
|
9% |
|
| (a) |
During the year ended February 28, 2025, the Fund effected the following reverse stock split: October 1, 2024, 1 for 5. All historical per share information has been retroactively adjusted to reflect this reverse stock split. See Note 10 in the Notes to the Financial Statements. |
| (b) |
Net investment income per share has been calculated based on average shares outstanding during the years. |
| (c) |
Realized and unrealized gains and losses per share in the caption are balancing amounts necessary to reconcile the change in net asset value per share for the years, and may not reconcile with the aggregate gains and losses in the Statements of Operations due to share transactions for the years. |
| (d) |
Amount represents less than 0.005%. |
| (e) |
Portfolio turnover rate excludes in-kind transactions, if any. |
The accompanying notes are an integral part of these financial statements.
Financial Highlights
For a share outstanding throughout the years presented
| |
|
SoFi Social 50 ETF |
|
| |
|
Year Ended February 28, 2026 |
|
Year Ended February 28, 2025 |
|
Year Ended February 29, 2024 |
|
Year Ended February 28, 2023 |
|
Year Ended February 28, 2022 |
| PER SHARE DATA: |
|
|
|
|
|
|
|
|
|
|
|
|
|
|
|
|
|
|
|
|
| |
|
|
|
|
|
|
|
|
|
|
|
|
|
|
|
|
|
|
|
|
| Net asset value, beginning of year |
|
|
$41.94 |
|
|
|
$32.03 |
|
|
|
$22.82 |
|
|
|
$31.60 |
|
|
|
$29.38 |
|
| |
|
|
|
|
|
|
|
|
|
|
|
|
|
|
|
|
|
|
|
|
| INVESTMENTS OPERATIONS: |
|
|
|
|
|
|
|
|
|
|
|
|
|
|
|
|
|
|
|
|
| Net investment income (loss)(a) |
|
|
0.21 |
|
|
|
0.14 |
|
|
|
0.37 |
|
|
|
0.31 |
|
|
|
0.11 |
|
| Net realized and unrealized gain (loss)(b) |
|
|
11.33 |
|
|
|
9.91 |
|
|
|
9.35 |
|
|
|
(8.86) |
|
|
|
2.21 |
|
| Total from investment operations |
|
|
11.54 |
|
|
|
10.05 |
|
|
|
9.72 |
|
|
|
(8.55) |
|
|
|
2.32 |
|
| |
|
|
|
|
|
|
|
|
|
|
|
|
|
|
|
|
|
|
|
|
| LESS DISTRIBUTIONS FROM: |
|
|
|
|
|
|
|
|
|
|
|
|
|
|
|
|
|
|
|
|
| Net investment income |
|
|
(0.18) |
|
|
|
(0.14) |
|
|
|
(0.51) |
|
|
|
(0.23) |
|
|
|
(0.10) |
|
| Total distributions |
|
|
(0.18) |
|
|
|
(0.14) |
|
|
|
(0.51) |
|
|
|
(0.23) |
|
|
|
(0.10) |
|
| |
|
|
|
|
|
|
|
|
|
|
|
|
|
|
|
|
|
|
|
|
| Net asset value, end of year |
|
|
$53.30 |
|
|
|
$41.94 |
|
|
|
$32.03 |
|
|
|
$22.82 |
|
|
|
$31.60 |
|
| TOTAL RETURN |
|
|
27.55% |
|
|
|
31.41% |
|
|
|
42.96% |
|
|
|
(26.98)% |
|
|
|
7.85% |
|
| |
|
|
|
|
|
|
|
|
|
|
|
|
|
|
|
|
|
|
|
|
| SUPPLEMENTAL DATA AND RATIOS: |
|
|
|
|
|
|
|
|
|
|
|
|
|
|
|
|
|
|
|
|
| Net assets, end of year (in thousands) |
|
|
$35,714 |
|
|
|
$24,326 |
|
|
|
$17,296 |
|
|
|
$13,692 |
|
|
|
$20,542 |
|
| Ratio of expenses to average net assets |
|
|
0.29% |
|
|
|
0.29% |
|
|
|
0.29% |
|
|
|
0.29% |
|
|
|
0.29% |
|
| Ratio of net investment income to average net assets |
|
|
0.44% |
|
|
|
0.38% |
|
|
|
1.38% |
|
|
|
1.24% |
|
|
|
0.31% |
|
| Portfolio turnover rate(c) |
|
|
51% |
|
|
|
48% |
|
|
|
42% |
|
|
|
96% |
|
|
|
62% |
|
| (a) |
Net investment income per share has been calculated based on average shares outstanding during the years. |
| (b) |
Realized and unrealized gains and losses per share in the caption are balancing amounts necessary to reconcile the change in net asset value per share for the years, and may not reconcile with the aggregate gains and losses in the Statements of Operations due to share transactions for the years. |
| (c) |
Portfolio turnover rate excludes in-kind transactions, if any. |
The accompanying notes are an integral part of these financial statements.
Notes to Financial Statements
February 28, 2026
NOTE 1 - ORGANIZATION
The SoFi Agentic AI ETF and SoFi Enhanced Yield ETF are non-diversified series of shares and the SoFi Select 500 ETF and SoFi Social 50 ETF are diversified series of shares (each a “Fund”, and collectively, the “Funds”) of beneficial interest of Tidal Trust I (the “Trust”). The Trust was organized as a Delaware statutory trust on June 4, 2018, and is registered with the Securities and Exchange Commission (the “SEC”) under the Investment Company Act of 1940, as amended (the “1940 Act”), as an open-end management investment company and the offering of each Fund’s shares (“Shares”) is registered under the Securities Act of 1933, as amended. The Trust is governed by the Board of Trustees (the “Board”). Tidal Investments LLC (“Tidal Investments” or the “Adviser”), a Tidal Financial Group company, serves as investment adviser to the Funds. Each Fund is an investment company and accordingly follows the investment company accounting and reporting guidance of the Financial Accounting Standards Board (“FASB”) Accounting Standards Codification Topic 946 “Financial Services—Investment Companies.” The SoFi Agentic AI ETF commenced operations on September 2, 2025, the SoFi Enhanced Yield ETF commenced operations on November 14, 2023, the SoFi Select 500 ETF commenced operations on April 10, 2019, and the SoFi Social 50 ETF commenced operations on May 7, 2019.
The investment objective of the SoFi Agentic AI ETF is to seek to track the performance, before fees and expenses, of the BITA US Agentic AI Select Index. The investment objective of the SoFi Enhanced Yield ETF is to seek current income. The investment objective of the SoFi Select 500 ETF is to seek to track the performance, before fees and expenses, of the Solactive SoFi US 500 Growth Index. The investment objective of the SoFi Social 50 ETF is to seek to track the performance, before fees and expenses, of the SoFi Social 50 Index.
NOTE 2 - SIGNIFICANT ACCOUNTING POLICIES
The following is a summary of significant accounting policies consistently followed by the Funds. These policies are in conformity with accounting principles generally accepted in the United States of America (“U.S. GAAP”).
Security Valuation - Equity securities, which may include Real Estate Investment Trusts (“REITs”), Business Development Companies (“BDCs”), and Master Limited Partnerships (“MLPs”), listed on a securities exchange, market or automated quotation system for which quotations are readily available (except for securities traded on the Nasdaq Stock Market, LLC (the “NASDAQ”)), including securities traded over-the-counter, are valued at the last quoted sale price on the primary exchange or market (foreign or domestic) on which they are traded on the valuation date (or at approximately 4:00 p.m. EST if a security’s primary exchange is normally open at that time), or, if there is no such reported sale on the valuation date, at the most recent quoted bid price or mean between the most recent quoted bid and ask prices for long and short positions. For a security that trades on multiple exchanges, the primary exchange will generally be considered the exchange on which the security is generally most actively traded. For securities traded on the NASDAQ, the NASDAQ Official Closing Price will be used. Prices of securities traded on the securities exchange will be obtained from recognized independent pricing agents each day that the Funds are open for business.
Debt securities are valued by using an evaluated mean of the bid and ask prices provided by independent pricing agents. The independent pricing agents may employ methodologies that utilize actual market transactions (if the security is actively traded), broker-dealer supplied valuations, or other methodologies designed to identify the market value for such securities. In arriving at valuations, such methodologies generally consider factors such as security prices, yields, maturities, call features, ratings and developments relating to specific securities.
Notes to Financial Statements
February 28, 2026
Options are valued at the last quoted sales price. If there is no such reported sale on the valuation date, both long and short positions are valued at the mean between the most recent quoted bid and ask prices.
Units of Mount Vernon Liquid Assets Portfolio, LLC are not traded on an exchange and are measured at fair value using the investment company's net asset value (“NAV”) per share (or its equivalent) practical expedient as provided by the underlying fund's administrator.
Under Rule 2a-5 of the 1940 Act, a fair value will be determined for securities for which quotations are not readily available by the Valuation Designee (as defined in Rule 2a-5) in accordance with the Pricing and Valuation Policy and Fair Value Procedures, as applicable, of the Adviser, subject to oversight by the Board. When a security is “fair valued,” consideration is given to the facts and circumstances relevant to the particular situation, including a review of various factors set forth in the Adviser’s Pricing and Valuation Policy and Fair Value Procedures, as applicable. Fair value pricing is an inherently subjective process, and no single standard exists for determining fair value. Different funds could reasonably arrive at different values for the same security. The use of fair value pricing by a Fund may cause the NAV of its shares to differ significantly from the NAV that would be calculated without regard to such considerations.
As described above, the Funds utilize various methods to measure the fair value of their investments on a recurring basis. U.S. GAAP establishes a hierarchy that prioritizes inputs to valuation methods. The three levels of inputs are:
Level 1 – Unadjusted quoted prices in active markets for identical assets or liabilities that the Funds have the ability to access.
Level 2 – Observable inputs other than quoted prices included in Level 1 that are observable for the asset or liability, either directly or indirectly. These inputs may include quoted prices for the identical instrument on an inactive market, prices for similar instruments, interest rates, prepayment speeds, credit risk, yield curves, default rates and similar data.
Level 3 – Unobservable inputs for the asset or liability, to the extent relevant observable inputs are not available; representing the Funds’ own assumptions about the assumptions a market participant would use in valuing the asset or liability and would be based on the best information available.
The availability of observable inputs can vary from security to security and is affected by a wide variety of factors, including, for example, the type of security, whether the security is new and not yet established in the marketplace, the liquidity of markets, and other characteristics particular to the security. To the extent that valuation is based on models or inputs that are less observable or unobservable in the market, the determination of fair value requires more judgment. Accordingly, the degree of judgment exercised in determining fair value is greatest for instruments categorized in Level 3.
The inputs used to measure fair value may fall into different levels of the fair value hierarchy. In such cases, for disclosure purposes, the level in the fair value hierarchy within which the fair value measurement falls in its entirety, is determined based on the lowest level input that is significant to the fair value measurement in its entirety.
The following is a summary of the inputs used to value each Fund's investments as of February 28, 2026:
Notes to Financial Statements
February 28, 2026
| SoFi Agentic AI ETF |
|
|
|
|
|
|
|
|
|
|
|
|
| |
|
Level 1 |
|
|
Level 2 |
|
|
Level 3 |
|
|
Total |
|
| Investments: |
|
|
|
|
|
|
|
|
|
|
|
|
| Common Stocks |
|
$ |
10,075,999 |
|
|
$ |
– |
|
|
$ |
– |
|
|
$ |
10,075,999 |
|
| Money Market Funds |
|
|
55,399 |
|
|
|
– |
|
|
|
– |
|
|
|
55,399 |
|
| Total Investments |
|
$ |
10,131,398 |
|
|
$ |
– |
|
|
$ |
– |
|
|
$ |
10,131,398 |
|
| SoFi Enhanced Yield ETF |
|
|
|
|
|
|
|
|
|
|
|
|
| |
|
Level 1 |
|
|
Level 2 |
|
|
Level 3 |
|
|
Total |
|
| Assets: |
|
|
|
|
|
|
|
|
|
|
|
|
|
|
|
|
| Investments: |
|
|
|
|
|
|
|
|
|
|
|
|
|
|
|
|
| Purchased Options |
|
$ |
– |
|
|
$ |
1,721,750 |
|
|
$ |
– |
|
|
$ |
1,721,750 |
|
| U.S. Treasury Bills |
|
|
– |
|
|
|
36,726,294 |
|
|
|
– |
|
|
|
36,726,294 |
|
| Money Market Funds |
|
|
168,250 |
|
|
|
– |
|
|
|
– |
|
|
|
168,250 |
|
| Total Investments |
|
$ |
168,250 |
|
|
$ |
38,448,044 |
|
|
$ |
– |
|
|
$ |
38,616,294 |
|
| Liabilities: |
|
|
|
|
|
|
|
|
|
|
|
|
|
|
|
|
| Investments: |
|
|
|
|
|
|
|
|
|
|
|
|
|
|
|
|
| Written Options |
|
|
– |
|
|
|
(1,907,625 |
) |
|
|
– |
|
|
|
(1,907,625 |
) |
| Total Investments |
|
$ |
– |
|
|
$ |
(1,907,625 |
) |
|
$ |
– |
|
|
$ |
(1,907,625 |
) |
| SoFi Select 500 ETF |
|
|
|
|
|
|
|
|
|
|
|
|
| |
|
Level 1 |
|
|
Level 2 |
|
|
Level 3 |
|
|
Total |
|
| Investments: |
|
|
|
|
|
|
|
|
|
|
|
|
| Common Stocks |
|
$ |
576,918,750 |
|
|
$ |
– |
|
|
$ |
– |
|
|
$ |
576,918,750 |
|
| Rights |
|
|
– |
|
|
|
– |
|
|
|
0 |
(a) |
|
|
– |
|
|
Investments Purchased with Collateral from Securities Lending(b) |
|
|
– |
|
|
|
– |
|
|
|
– |
|
|
|
5,687,284 |
|
| Money Market Funds |
|
|
895,148 |
|
|
|
– |
|
|
|
– |
|
|
|
895,148 |
|
| Total Investments |
|
$ |
577,813,898 |
|
|
$ |
– |
|
|
$ |
0 |
(a) |
|
$ |
583,501,182 |
|
| SoFi Social 50 ETF |
|
|
|
|
|
|
|
|
|
|
|
|
| |
|
Level 1 |
|
|
Level 2 |
|
|
Level 3 |
|
|
Total |
|
| Investments: |
|
|
|
|
|
|
|
|
|
|
|
|
| Common Stocks |
|
$ |
35,650,162 |
|
|
$ |
– |
|
|
$ |
– |
|
|
$ |
35,650,162 |
|
|
Investments Purchased with Collateral from Securities Lending(b) |
|
|
– |
|
|
|
– |
|
|
|
– |
|
|
|
1,513,590 |
|
| Money Market Funds |
|
|
42,375 |
|
|
|
– |
|
|
|
– |
|
|
|
42,375 |
|
| Total Investments |
|
$ |
35,692,537 |
|
|
$ |
– |
|
|
$ |
– |
|
|
$ |
37,206,127 |
|
Refer to the Schedules of Investments for further disaggregation of investment categories.
(a) The Level 3 securities (Contingent Value Rights) are fair valued at $0 due to lack of market activity.
(b) Certain investments that are measured at fair value using the net asset value per share (or its equivalent) practical expedient have not been categorized in the fair value hierarchy. The fair value amounts presented in the table are intended to permit reconciliation of the fair value hierarchy to the amounts listed in the Schedules of Investments. SoFi Select 500 ETF held contingent value rights with $0 market value at the beginning and ending of the period with no activity during the year. As of the year ended February 28, 2026, this investment did not have material
Notes to Financial Statements
February 28, 2026
impact on the SoFi Select 500 ETF’s net assets and, therefore, disclosure of unobservable inputs used in formulating valuations is not presented.
Derivative Instruments (SoFi Enhanced Yield ETF Only) - As the buyer of a call option, a Fund has a right to buy the underlying reference instrument (e.g., a currency or security) at the exercise price at any time during the option period (for American style options). The Fund may enter into closing sale transactions with respect to call options, exercise them, or permit them to expire. For example, the Fund may buy call options on underlying reference instruments that it intends to buy with the goal of limiting the risk of a substantial increase in their market price before the purchase is effected. Unless the price of the underlying reference instrument changes sufficiently, a call option purchased by the Fund may expire without any value to the Fund, in which case such Fund would experience a loss to the extent of the premium paid for the option plus related transaction costs.
As the buyer of a put option, a Fund has the right to sell the underlying reference instrument at the exercise price at any time during the option period (for American style options). Like a call option, the Fund may enter into closing sale transactions with respect to put options, exercise them, or permit them to expire. The Fund may buy a put option on an underlying reference instrument owned by the Fund (a protective put) as a hedging technique in an attempt to protect against an anticipated decline in the market value of the underlying reference instrument. Such hedge protection is provided only during the life of the put option when the Fund, as the buyer of the put option, is able to sell the underlying reference instrument at the put exercise price, regardless of any decline in the underlying instrument’s market price. The Fund may also seek to offset a decline in the value of the underlying reference instrument through appreciation in the value of the put option. The premium paid for the put option and any transaction costs would reduce any short-term capital gain that may be available for distribution when the instrument is eventually sold. Buying put options at a time when the buyer does not own the underlying reference instrument allows the buyer to benefit from a decline in the market price of the underlying reference instrument, which generally increases the value of the put option.
If a put option is not terminated in a closing sale transaction when it has remaining value, and if the market price of the underlying reference instrument remains equal to or greater than the exercise price during the life of the put option, the buyer would not make any gain upon exercise of the option and would experience a loss to the extent of the premium paid for the option plus related transaction costs. In order for the purchase of a put option to be profitable, the market price of the underlying reference instrument must decline sufficiently below the exercise price to cover the premium and transaction costs.
Writing options may permit the writer to generate additional income in the form of the premium received for writing the option. The writer of an option may have no control over when the underlying reference instruments must be sold (in the case of a call option) or purchased (in the case of a put option) because the writer may be notified of exercise at any time prior to the expiration of the option (for American style options). In general, though, options are infrequently exercised prior to expiration. Whether or not an option expires unexercised, the writer retains the amount of the premium. Writing “covered” call options means that the writer owns the underlying reference instrument that is subject to the call option. Call options may also be written on reference instruments that the writer does not own.
If a Fund writes a covered call option, any underlying reference instruments that are held by the Fund and are subject to the call option will be earmarked on the books of such Fund as segregated to satisfy its obligations under the option. The Fund will be unable to sell the underlying reference instruments that are subject to the written call option until it either effects a closing transaction with respect to the written call, or otherwise satisfies the conditions for release of the underlying reference instruments from segregation. As the writer of a covered call option, the Fund gives up the potential for capital appreciation above the exercise price of the option should the underlying reference
Notes to Financial Statements
February 28, 2026
instrument rise in value. If the value of the underlying reference instrument rises above the exercise price of the call option, the reference instrument will likely be “called away,” requiring the Fund to sell the underlying instrument at the exercise price. In that case, the Fund will sell the underlying reference instrument to the option buyer for less than its market value, and such Fund will experience a loss (which will be offset by the premium received by the Fund as the writer of such option). If a call option expires unexercised, the Fund will realize a gain in the amount of the premium received. If the market price of the underlying reference instrument decreases, the call option will not be exercised, and the Fund will be able to use the amount of the premium received to hedge against the loss in value of the underlying reference instrument. The exercise price of a call option will be chosen based upon the expected price movement of the underlying reference instrument. The exercise price of a call option may be below, equal to (at-the-money), or above the current value of the underlying reference instrument at the time the option is written.
As the writer of a put option, a Fund has a risk of loss should the underlying reference instrument decline in value. If the value of the underlying reference instrument declines below the exercise price of the put option and the put option is exercised, the Fund, as the writer of the put option, will be required to buy the instrument at the exercise price, which will exceed the market value of the underlying reference instrument at that time. The Fund will incur a loss to the extent that the current market value of the underlying reference instrument is less than the exercise price of the put option. However, the loss will be offset in part by the premium received from the buyer of the put. If a put option written by the Fund expires unexercised, such Fund will realize a gain in the amount of the premium received.
By virtue of the Fund’s investment in option contracts on equity ETFs and equity indices, the Fund is exposed to common stocks indirectly which subjects the Fund to equity market risk. Common stocks are generally exposed to greater risk than other types of securities, such as preferred stock and debt obligations, because common stockholders generally have inferior rights to receive payment from specific issuers. Equity securities may experience sudden, unpredictable drops in value or long periods of decline in value. This may occur because of factors that affect securities markets generally or factors affecting specific issuers, industries, or sectors in which the Fund invests.
The Fund has adopted financial reporting rules and regulations that require enhanced disclosure regarding derivatives and hedging activity intending to improve financial reporting of derivative instruments by enabling investors to understand how an entity uses derivatives, how derivatives are accounted for, and how derivative instruments affect an entity’s results of operations and financial position.
For the year ended February 28, 2026, the SoFi Enhanced Yield ETF’s monthly average notional amount is described below:
| |
|
|
|
Average Notional Amount |
|
| SoFi Enhanced Yield ETF |
|
Purchased Options |
|
|
$ 4,796,693,843 |
|
| |
|
Written Options |
|
|
(4,796,693,843 |
) |
Notes to Financial Statements
February 28, 2026
Statements of Assets and Liabilities
Fair value of derivative instruments as of February 28, 2026:
| |
|
|
|
Asset Derivatives as of February 28, 2026 |
|
|
Liability Derivatives as of February 28, 2026 |
|
|
Fund |
|
Instrument |
|
Balance Sheet
Location |
|
Fair Value |
|
|
Balance Sheet
Location |
|
Fair Value |
| SoFi Enhanced Yield ETF |
| |
|
Equity Contracts: |
|
|
|
|
|
|
|
|
|
|
|
|
| |
|
Purchased Options |
|
Investments in securities, at value |
|
|
$1,721,750 |
|
|
— |
|
|
$— |
|
| |
|
Written Options |
|
— |
|
|
— |
|
|
Written option contracts, at value |
|
|
(1,907,625) |
|
Statements of Operations
The effect of derivative instruments on the Statements of Operations for the year ended February 28, 2026:
|
Fund |
|
Instrument |
|
Location of Gain
(Loss) on Derivatives Recognized in Income |
|
Realized Gain (Loss) |
|
Change in Unrealized
Appreciation (Depreciation) |
| SoFi Enhanced Yield ETF |
|
Equity Contracts: |
|
|
|
|
|
|
|
|
|
|
| |
|
Purchased Options |
|
Net realized and change in unrealized gain (loss) from Investments in unaffiliated securities: |
|
|
$42,252,633 |
|
|
|
$1,489,032 |
|
| |
|
Written Options |
|
Net realized and change in unrealized gain (loss) from Written option contracts: |
|
|
($49,340,358 |
) |
|
|
($1,528,139 |
) |
The SoFi Enhanced Yield ETF is not subject to a master netting agreement with respect to its investment in options written and options purchased; therefore, no additional disclosures regarding netting arrangements is required.
Federal Income Taxes - Each Fund has elected to be taxed as a regulated investment company (“RIC”) and intends to distribute substantially all taxable income to its shareholders and otherwise comply with the provisions of the Internal Revenue Code applicable to RICs. Therefore, no provision for federal income taxes or excise taxes has been made.
In order to avoid imposition of the excise tax applicable to RICs, the Funds intend to declare as dividends in each calendar year, at least 98% of their net investment income (earned during the calendar year) and at least 98.2% of their net realized capital gains (earned during the twelve months ended October 31) plus undistributed amounts, if any, from prior years. As a RIC, each Fund is subject to a 4% excise tax that is imposed if a Fund does not distribute by the end of any calendar year at least the sum of (i) 98% of its ordinary income (not taking into account any
Notes to Financial Statements
February 28, 2026
capital gain or loss) for the calendar year and (ii) 98.2% of its capital gain in excess of its capital loss (adjusted for certain ordinary losses) for a one-year period generally ending on October 31 of the calendar year (unless an election is made to use the Funds' fiscal year). The Funds generally intend to distribute income and capital gains in the manner necessary to minimize (but not necessarily eliminate) the imposition of such excise tax. The Funds may retain income or capital gains and pay excise tax when it is determined that doing so is in the best interest of shareholders. Management evaluates the costs of the excise tax relative to the benefits of retaining income and capital gains, including that such undistributed amounts (net of the excise tax paid) remain available for investment by the Funds and are available to supplement future distributions. Tax expense is disclosed in the Statements of Operations, if applicable.
As of February 28, 2026, the Funds did not have any tax positions that did not meet the threshold of being sustained by the applicable tax authority. Generally, tax authorities can examine all the tax returns filed for the last three years. The Funds identify their major tax jurisdiction as U.S. Federal and the Commonwealth of Delaware; however, the Funds are not aware of any tax positions for which it is reasonably possible that the total amounts of unrecognized tax benefits will change materially. The Funds recognize interest and penalties, if any, related to unrecognized tax benefits on uncertain tax positions as income tax expense in the Statements of Operations.
Securities Transactions and Investment Income - Investment securities transactions are accounted for on the trade date. Gains and losses realized on sales of securities are determined on a specific identification basis. Discounts/premiums on debt securities purchased are accreted/amortized over the life of the respective securities using the effective interest method. Dividend income is recorded on the ex-dividend date. Dividends received from REITs generally are comprised of ordinary income, capital gains, and may include return of capital. Interest income is recorded on an accrual basis. Other non-cash dividends are recognized as investment income at the fair value of the property received. Withholding taxes on foreign dividends have been provided for in accordance with the Funds' understanding of the applicable country’s tax rules and rates.
Foreign Currency - Investment securities and other assets and liabilities denominated in foreign currencies are translated into U.S. dollar amounts at the date of valuation. Purchases and sales of investment securities and income and expense items denominated in foreign currencies are translated into U.S. dollar amounts on the respective dates of such transactions.
The Funds do not isolate that portion of the results of operations resulting from changes in foreign exchange rates on investments from the fluctuations arising from changes in market prices of securities held. Such fluctuations are included with the net realized and unrealized gain or loss from investments.
The Funds report net realized foreign exchange gains or losses that arise from sales of foreign currencies, currency gains or losses realized between the trade and settlement dates on securities transactions, and the difference between the amounts of dividends, interest, and foreign withholding taxes recorded on the Funds' books and the U.S. dollar equivalent of the amounts actually received or paid. Net unrealized foreign exchange gains and losses arise from changes in the fair values of assets and liabilities, other than investments in securities at period end, resulting from changes in exchange rates.
Distributions to Shareholders - Distributions to shareholders from net investment income, if any, are declared and paid at least quarterly for the SoFi Agentic AI ETF, at least monthly for the SoFi Enhanced Yield ETF, and at least semi-annually for the SoFi Select 500 ETF and the SoFi Social 50 ETF. Distributions to shareholders from net realized gains on securities, if any, for the Funds normally are declared and paid at least annually. Distributions are recorded on the ex-dividend date.
Notes to Financial Statements
February 28, 2026
Use of Estimates - The preparation of financial statements in conformity with U.S. GAAP requires management to make estimates and assumptions that affect the reported amounts of assets and liabilities and disclosure of contingent assets and liabilities at the date of the financial statements and the reported amounts of increases and decreases in net assets from operations during the reporting period. Actual results could differ from those estimates.
Share Valuation - The NAV per Share of each Fund is calculated by dividing the sum of the value of the securities held by a Fund, plus cash or other assets, minus all liabilities by the total number of Shares outstanding for each Fund, rounded to the nearest cent. Fund Shares will not be priced on the days on which the New York Stock Exchange (“NYSE”) is closed for trading.
Guarantees and Indemnifications - In the normal course of business, the Funds enter into contracts with service providers that contain general indemnification clauses. The Funds' maximum exposure under these arrangements is unknown as this would involve future claims that may be made against the Funds that have not yet occurred. However, based on experience, the Funds expect the risk of loss to be remote.
Illiquid Securities - Pursuant to Rule 22e-4 under the 1940 Act, the Funds have adopted a Board-approved Liquidity Risk Management Program (the “Program”) that requires, among other things, that each Fund limit its illiquid investments that are assets to no more than 15% of the value of the Fund’s net assets. An illiquid investment is any security that a Fund reasonably expects cannot be sold or disposed of in current market conditions in seven calendar days or less without the sale or disposition significantly changing the market value of the investment. If a Fund should be in a position where the value of illiquid investments held by a Fund exceeds 15% of the Fund’s net assets, the Fund will take such steps as set forth in the Program.
Derivatives Transactions - Pursuant to Rule 18f-4 under the 1940 Act, the SEC imposes limits on the amount of derivatives a fund can enter into, eliminates the asset segregation and cover framework arising from prior SEC guidance for covering derivatives and certain financial instruments currently used by funds to comply with Section 18 of the 1940 Act and treats derivatives as senior securities. Under Rule 18f-4, a fund’s derivatives exposure is limited through a value-at-risk test. Funds whose use of derivatives is more than a limited specified exposure amount are required to establish and maintain a comprehensive derivatives risk management program, subject to oversight by a fund’s board of trustees, and appoint a derivatives risk manager. The Funds have implemented a Rule 18f-4 Derivative Risk Management Program that complies with Rule 18f-4.
Reclassification of Capital Accounts. U.S. GAAP requires that certain components of net assets relating to permanent differences be reclassified between financial and tax reporting. These reclassifications have no effect on net assets or NAV per Share. These differences are primarily due to redemptions in kind. For the year ended February 28, 2026, the following adjustments were made:
|
Fund |
|
Paid-In Capital |
|
Total distributable earnings/(accumulated losses) |
| SoFi Agentic AI ETF |
|
$ |
- |
|
|
$ |
- |
|
| SoFi Enhanced Yield ETF |
|
$ |
- |
|
|
$ |
- |
|
| SoFi Select 500 ETF |
|
$ |
34,367,840 |
|
|
$ |
(34,367,840 |
) |
| SoFi Social 50 ETF |
|
$ |
3,182,245 |
|
|
$ |
(3,182,245 |
) |
Notes to Financial Statements
February 28, 2026
NOTE 3 - PRINCIPAL INVESTMENT RISKS.
ADRs Risk. ADRs involve risks similar to those associated with investments in foreign securities and give rise to certain additional risks. ADRs listed on U.S. exchanges are issued by banks or trust companies, and entitle the holder to all dividends and capital gains that are paid out on the underlying foreign shares (Underlying Shares). When the Fund invests in ADRs as a substitute for an investment directly in the Underlying Shares, the Fund is exposed to the risk that the ADRs may not provide a return that corresponds precisely with that of the Underlying Shares. Investment in ADRs may be less liquid than the Underlying Shares in their primary trading market.
Artificial Intelligence Risk (SoFi Agentic AI ETF Only). Issuers engaged in artificial intelligence typically have high research and capital expenditures and, as a result, their profitability can vary widely, if they are profitable at all. The space in which they are engaged is highly competitive and issuers’ products and services may become obsolete very quickly. These companies are heavily dependent on intellectual property rights and may be adversely affected by loss or impairment of those rights. The issuers are also subject to legal, regulatory and political changes that may have a large impact on their profitability. A failure in an issuer’s product or even questions about the safety of the product could be devastating to the issuer, especially if it is the marquee product of the issuer. It can be difficult to accurately capture what qualifies as an artificial intelligence company. In addition, Agentic AI is a new area of artificial intelligence that may be considered speculative. Accordingly, artificial intelligence risks are heightened for companies devoting substantial resources to Agentic AI.
Concentration Risk (SoFi Agentic AI ETF, SoFi Select 500 ETF, and SoFi Social 50 ETF Only). The Funds’ investments will be concentrated in an industry or group of industries to the extent their respective Indexes are so concentrated. In such event, the value of Shares of a Fund may rise and fall more than the value of shares that invest in securities of companies in a broader range of industries.
Credit Risk (SoFi Enhanced Yield ETF Only). If an issuer or guarantor of a debt security held by the Fund or a counterparty to a financial contract with the Fund defaults or is downgraded or is perceived to be less creditworthy, or if the value of the assets underlying a security declines, the value of the Fund’s portfolio will typically decline.
Derivatives Risk (SoFi Enhanced Yield ETF Only). Derivatives include instruments and contracts that are based on and valued in relation to one or more underlying securities, financial benchmarks, indices, or other reference obligations or measures of value. Major types of derivatives include options. Depending on how the Fund uses derivatives and the relationship between the market value of the derivative and the underlying instrument, the use of derivatives could increase or decrease the Fund’s exposure to the risks of the underlying instrument. Using derivatives can have a leveraging effect if the Adviser is unable to set an appropriate spread between two options held by the Fund and could increase Fund volatility. In that event, a small investment in derivatives could have a potentially large impact on the Fund’s performance. Derivatives transactions can be highly illiquid and difficult to unwind or value, and changes in the value of a derivative held by the Fund may not correlate with the value of the underlying instrument or the Fund’s other investments. Many of the risks applicable to trading the instruments underlying derivatives are also applicable to derivatives trading. Financial reform laws have changed many aspects of financial regulation applicable to derivatives. Once implemented, new regulations, including margin, clearing, and trade execution requirements, may make derivatives more costly, may limit their availability, may present different risks or may otherwise adversely affect the value or performance of these instruments. The extent and impact of these regulations are not yet fully known and may not be known for some time.
Equity Market Risk (SoFi Agentic AI ETF, SoFi Select 500 ETF, and SoFi Social 50 ETF Only). The equity securities held in each Fund’s portfolio may experience sudden, unpredictable drops in value or long periods of decline in value. This may occur because of factors that affect securities markets generally or factors affecting
Notes to Financial Statements
February 28, 2026
specific issuers, industries, or sectors in which the Funds invest. Common stocks, such as those held by the Funds, are generally exposed to greater risk than other types of securities, such as preferred stock and debt obligations, because common stockholders generally have inferior rights to receive payment from issuers.
Exchange Traded Fund (“ETF”) Risks
|
● |
Authorized Participants, Market Makers, and Liquidity Providers Concentration Risk. Each Fund has a limited number of financial institutions that are authorized to purchase and redeem Shares directly from the Funds (known as “Authorized Participants” or “APs”). In addition, there may be a limited number of market makers and/or liquidity providers in the marketplace. To the extent either of the following events occur, Shares may trade at a material discount to NAV and possibly face delisting: (i) APs exit the business or otherwise become unable to process creation and/or redemption orders and no other APs step forward to perform these services; or (ii) market makers and/or liquidity providers exit the business or significantly reduce their business activities and no other entities step forward to perform their functions. |
|
● |
Cash Redemption Risk (SoFi Enhanced Yield ETF Only). The Fund’s investment strategy may require it to redeem Shares for cash or to otherwise include cash as part of its redemption proceeds. For example, the Fund may not be able to redeem in-kind certain securities held by the Fund (e.g., options contracts). In such a case, the Fund may be required to sell or unwind portfolio investments to obtain the cash needed to distribute redemption proceeds. This may cause the Fund to recognize a capital gain that it might not have recognized if it had made a redemption in-kind. As a result, the Fund may have less cash efficiency and pay out higher annual capital gain distributions to shareholders than if the in-kind redemption process was used. |
|
● |
Costs of Buying or Selling Shares. Due to the costs of buying or selling Shares, including brokerage commissions imposed by brokers and bid-ask spreads, frequent trading of Shares may significantly reduce investment results and an investment in Shares may not be advisable for investors who anticipate regularly making small investments. |
|
● |
Shares May Trade at Prices Other Than NAV. As with all ETFs, Shares may be bought and sold in the secondary market at market prices. Although it is expected that the market price of Shares will approximate a Fund’s NAV, there may be times when the market price of Shares is more than a Fund’s NAV intra-day (premium) or less than a Fund’s NAV intra-day (discount) due to supply and demand of Shares or during periods of market volatility. This risk is heightened in times of market volatility, periods of steep market declines, and periods when there is limited trading activity for Shares in the secondary market, in which case such premiums or discounts may be significant. |
|
● |
Trading. Although Shares are listed on a national securities exchange, such as NYSE Arca, Inc. (the “Exchange”), and may be traded on U.S. exchanges other than the Exchange, there can be no assurance that Shares will trade with any volume, or at all, on any stock exchange. In stressed market conditions, the liquidity of Shares may begin to mirror the liquidity of a Fund’s underlying portfolio holdings, which can be significantly less liquid than Shares. Also, in stressed market conditions, the market for Shares may become less liquid in response to deteriorating liquidity in the markets for a Fund’s underlying portfolio holdings. These adverse effect on liquidity for Shares, in turn, could lead to wider bid-ask spreads and differences between the market price of Shares and the underlying value of those Shares. |
Fixed-Income Securities Risk (SoFi Enhanced Yield ETF Only). The prices of fixed-income securities respond to economic developments, particularly interest rate changes, as well as to changes in an issuer’s credit rating or market perceptions about the creditworthiness of an issuer. Generally, fixed-income securities decrease in value if
Notes to Financial Statements
February 28, 2026
interest rates rise and increase in value if interest rates fall, and longer-term and lower-rated securities are more volatile than shorter-term and higher-rated securities.
Foreign Securities Risk (SoFi Agentic AI ETF Only). Investments in securities or other instruments of non-U.S. issuers involve certain risks not involved in domestic investments and may experience more rapid and extreme changes in value than investments in securities of U.S. companies. Financial markets in foreign countries often are not as developed, efficient, or liquid as financial markets in the United States, and therefore, the prices of non-U.S. securities and instruments can be more volatile. In addition, the Fund will be subject to risks associated with adverse political and economic developments in foreign countries, which may include the imposition of economic sanctions. Generally, there is less readily available and reliable information about non-U.S. issuers due to less rigorous disclosure or accounting standards and regulatory practices.
General Market Risk. Economies and financial markets throughout the world are becoming increasingly interconnected, which increases the likelihood that events or conditions in one country or region will adversely impact markets or issuers in other countries or regions. Securities in a Fund’s portfolio may underperform in comparison to securities in the general financial markets, a particular financial market, or other asset classes, due to a number of factors, including inflation (or expectations for inflation), interest rates, global demand for particular products or resources, natural disasters or events, pandemic diseases, terrorism, regulatory events, and government controls.
High Portfolio Turnover Risk. The Fund may actively and frequently trade all or a significant portion of the securities in its portfolio. A high portfolio turnover rate increases transaction costs, which may increase the Fund’s expenses. Frequent trading may also cause adverse tax consequences for investors in the Fund due to an increase in short-term capital gains.
Implied Volatility Risk (SoFi Enhanced Yield ETF Only). When the Fund sells an option, it gains the amount of the premium it receives, but also incurs a liability representing the value of the option it has sold until the option is either exercised and finishes “in the money,” meaning it has value and can be sold, or the option expires worthless, or the expiration of the option is “rolled,” or extended forward. The value of the options in which the Fund invests is based partly on the volatility used by market participants to price such options (i.e., implied volatility). Accordingly, increases in the implied volatility of such options will cause the value of such options to increase (even if the prices of the options’ underlying stocks do not change), which will result in a corresponding increase in the liabilities of the Fund under such options and thus decrease the Fund’s NAV.
Index Risk (SoFi Enhanced Yield ETF Only). If a derivative is linked to the performance of an index, the derivative will be subject to the risks associated with changes in that index.
Index ETF Risk (SoFi Agentic AI ETF, SoFi Select 500 ETF, and SoFi Social 50 ETF Only). The Funds’ strategies are linked to Indexes maintained by the Index Provider, which exercises complete control over the Indexes. Neither the Adviser nor the Index Provider is able to guarantee the continuous availability or timeliness of the production of the Indexes. There is no assurance that the Index Provider, or any agents that act on its behalf, will compile the Indexes accurately, or that the Indexes will be determined, maintained, constructed, reconstituted, rebalanced, composed, calculated or disseminated accurately. The Adviser relies upon the Index Provider and its agents to compile, determine, maintain, construct, reconstitute, rebalance, compose, calculate (or arrange for an agent to calculate), and disseminate the Indexes accurately. The Index Provider may delay or add a rebalance date, which may adversely impact the performance of the Funds and their correlation to the respective Indexes. In addition, there is no guarantee that the methodology used by the Index Provider to identify constituents for the Indexes will achieve its intended result or positive performance. The Indexes may not reflect all companies meeting
Notes to Financial Statements
February 28, 2026
the Indexes’ eligibility criteria if certain characteristics of a company are not known at the time the Indexes are composed or reconstituted. The calculation and dissemination of Index values may be delayed if the information technology or other facilities of the Index Provider, calculation agent, data providers and/or relevant stock exchange malfunction for any reason. A significant delay may cause trading in shares of the Funds to be suspended. Errors in Index data, computations and/or the construction of the Indexes in accordance with their methodologies may occur from time to time and may not be identified and corrected by the Index Provider, calculation agent or other applicable party for a period of time or at all, which may have an adverse impact on the Funds and their shareholders. Any losses or costs associated with errors made by the Index Provider or its agents generally will be borne by the Funds and their shareholders.
Interest Rate Risk (SoFi Enhanced Yield ETF Only). Generally fixed-income securities decrease in value if interest rates rise and increase in value if interest rates fall, with longer-term securities being more sensitive than shorter-term securities. For example, the price of a security with a one-year duration would be expected to drop by approximately 1% in response to a 1% increase in interest rates. Generally, the longer the maturity and duration of a bond or fixed rate loan, the more sensitive it is to this risk. Falling interest rates also create the potential for a decline in the Fund’s income. These risks are greater during periods of rising inflation.
Leveraging Risk (SoFi Enhanced Yield ETF Only). Derivative instruments held by the Fund involve inherent leverage, whereby small cash deposits allow the Fund to hold contracts with greater face value, which may magnify the Fund’s losses. Adverse changes in the value or level of the underlying asset, reference rate or index can result in loss of an amount substantially greater than the amount invested in the derivative. In addition, the use of leverage may cause the Fund to liquidate portfolio positions when it would not be advantageous to do so in order to satisfy redemption obligations.
Liquidity Risk (SoFi Enhanced Yield ETF Only). Liquidity risk exists when particular investments of the Fund would be difficult to purchase or sell, possibly preventing the Fund from selling such illiquid securities at an advantageous time or price, or possibly requiring the Fund to dispose of other investments at unfavorable times or prices in order to satisfy its obligations.
Management and Strategy Risk (SoFi Enhanced Yield ETF Only). The value of your investment depends on the judgment of the Adviser about the value and risks associated with its credit spread strategy, including its ability to correctly analyze the impact of volatility on the underlying equity indexes. The Adviser may be incorrect in its assessment of the potential rate of return of one or more credit spreads or may incorrectly forecast the outlook for an index or the markets in general with regard to whether make a credit put spread (bullish position) or a credit call spread (bearish position). The Adviser’s proprietary techniques to monitor the Fund’s credit spreads for potential exit triggers may not work as expected, thereby increasing the risks to the Fund of maintaining these positions through expiration. Like all managers, the Adviser activities are subject to operational risks, which may adversely impact the management of the Fund.
Market Capitalization Risk (SoFi Agentic AI ETF, SoFi Select 500 ETF, and SoFi Social 50 ETF Only).
|
● |
Large-Capitalization Investing (SoFi Agentic AI ETF, SoFi Select 500 ETF, and SoFi Social 50 ETF Only). The securities of large-capitalization companies may be relatively mature compared to smaller companies and therefore subject to slower growth during times of economic expansion. Large-capitalization companies may also be unable to respond quickly to new competitive challenges, such as changes in technology and consumer tastes. |
Notes to Financial Statements
February 28, 2026
|
● |
Mid-Capitalization Investing (SoFi Agentic AI ETF and SoFi Social 50 ETF Only). The securities of mid-capitalization companies may be more vulnerable to adverse issuer, market, political, or economic developments than securities of large-capitalization companies. The securities of mid-capitalization companies generally trade in lower volumes and are subject to greater and more unpredictable price changes than large-capitalization stocks or the stock market as a whole. |
|
● |
Small-Capitalization Investing (SoFi Agentic AI ETF Only). The securities of small-capitalization companies may be more vulnerable to adverse issuer, market, political, or economic developments than securities of large- or mid-capitalization companies. The securities of small-capitalization companies generally trade in lower volumes and are subject to greater and more unpredictable price changes than large- or mid-capitalization stocks or the stock market as a whole. There is typically less publicly available information concerning smaller-capitalization companies than for larger, more established companies. |
Models and Data Risk (SoFi Agentic AI ETF, SoFi Select 500 ETF, and SoFi Social 50 ETF Only). The composition of the Indexes is heavily dependent on proprietary quantitative models as well as information and data supplied by third parties (“Models and Data”). When Models and Data prove to be incorrect or incomplete, any decisions made in reliance thereon may lead to the inclusion or exclusion of securities from the Index universes that would have been excluded or included had the Models and Data been correct and complete. If the composition of the Indexes reflects such errors, the Funds’ portfolios can be expected to also reflect the errors.
Newer Fund Risk (SoFi Agentic AI ETF and SoFi Enhanced Yield ETF Only). The Funds are newer with limited operating histories. As a result, prospective investors have limited track records or histories on which to base their investment decisions. There can be no assurance that the Funds will grow to or maintain economically viable sizes.
Non-Diversification Risk (SoFi Agentic AI ETF and SoFi Enhanced Yield ETF Only). The Funds are classified as “non-diversified,” which means each Fund may invest a larger percentage of its assets in the securities of a smaller number of issuers than a diversified fund. SoFi Enhanced Yield ETF will generally have up to 15 credit spreads at any given time, with up to 25% exposure to a single equity index credit spread. Investment in a limited number of equity indexes exposes each Fund to greater market risk and potential losses than if its assets were diversified among a greater number of indexes.
Operational Risk (SoFi Agentic AI ETF Only). The Fund is subject to risks arising from various operational factors, including, but not limited to, human error, processing and communication errors, errors of the Fund’s service providers, counterparties or other third-parties, failed or inadequate processes and technology or systems failures. The Fund relies on third-parties for a range of services, including custody. Any delay or failure relating to engaging or maintaining such service providers may affect the Fund’s ability to meet its investment objective. Although the Fund and Adviser seek to reduce these operational risks through controls and procedures, there is no way to completely protect against such risks.
Options Risk (SoFi Enhanced Yield ETF Only). Purchasing and writing put and call options are highly specialized activities and entail greater than ordinary investment risks. The Fund may not fully benefit from or may lose money on an option if changes in its value do not correspond as anticipated to changes in the value of the underlying securities. If the Fund is not able to sell an option held in its portfolio, it would have to exercise the option to realize any profit and would incur transaction costs upon the purchase or sale of the underlying securities. Ownership of options involves the payment of premiums, which may adversely affect the Fund’s performance.
Notes to Financial Statements
February 28, 2026
Passive Investment Risk (SoFi Agentic AI ETF, SoFi Select 500 ETF, and SoFi Social 50 ETF Only). Each Fund invests in the securities included in, or representative of, its Index regardless of their investment merit. The Funds do not attempt to outperform their respective Indexes or take defensive positions in declining markets. As a result, a Fund’s performance may be adversely affected by a general decline in the market segments relating to its Index.
Regulatory Risk (SoFi Enhanced Yield ETF Only). Changes in the laws or regulations of the United States or other countries, including any changes to applicable tax laws and regulations, could impair the ability of the Fund to achieve its investment objective and could increase the operating expenses of the Fund.
REIT Risk (SoFi Select 500 ETF, and SoFi Social 50 ETF Only). Through their investments in REITs, the Funds are subject to the risks of investing in the real estate market, including decreases in property revenues, increases in interest rates, increases in property taxes and operating expenses, legal and regulatory changes, a lack of credit or capital, defaults by borrowers or tenants, environmental problems and natural disasters.
REITs are subject to additional risks, including those related to adverse governmental actions; declines in property value and the real estate market; the potential failure to qualify for tax-free pass through of income; and exemption from registration as an investment company. REITs are dependent upon specialized management skills and may invest in relatively few properties, a small geographic area, or a small number of property types. As a result, investments in REITs may be volatile. To the extent a Fund invests in REITs concentrated in specific geographic areas or property types, such Fund may be subject to a greater loss as a result of adverse developments affecting such area or property types. REITs are pooled investment vehicles with their own fees and expenses, and the Funds will indirectly bear a proportionate share of those fees and expenses.
Sector Risk (SoFi Agentic AI ETF, SoFi Select 500 ETF, and SoFi Social 50 ETF Only). At times a Fund may increase the relative emphasis of its investments in a particular sector or group of industries. The prices of securities of issuers in a particular sector may be more susceptible to fluctuations due to changes in economic or business conditions, government regulations, availability of basic resources or supplies, or other events that affect that industry or sector more than securities of issuers in other industries and sectors. To the extent that a Fund increases the relative emphasis of its investments in a particular industry or sector, the value of its Shares may fluctuate in response to events affecting that industry or sector.
|
● |
Communication Sector Risk (SoFi Social 50 ETF Only). The Fund may invest significantly in companies in the communications sector, and therefore the performance of the Fund could be negatively impacted by events affecting this sector. Communication companies are particularly vulnerable to the potential obsolescence of products and services due to technological advancement and the innovation of competitors. Companies in the communications sector may also be affected by other competitive pressures, such as pricing competition, as well as research and development costs, substantial capital requirements and government regulation. Additionally, fluctuating domestic and international demand, shifting demographics and often unpredictable changes in consumer tastes can drastically affect a communication company’s profitability. While all companies may be susceptible to network security breaches, certain companies in the communications sector may be particular targets of hacking and potential theft of proprietary or consumer information or disruptions in service, which could have a material adverse effect on their businesses. |
|
● |
Consumer Discretionary Sector Risk (SoFi Social 50 ETF Only). The Fund may emphasize its investments in companies in the consumer discretionary sector, and therefore the performance of the Fund could be negatively impacted by events affecting this sector. The success of consumer product |
Notes to Financial Statements
February 28, 2026
manufacturers and retailers is tied closely to the performance of domestic and international economies, interest rates, exchange rates, competition, consumer confidence, changes in demographics and consumer preferences. Companies in the consumer discretionary sector depend heavily on disposable household income and consumer spending, and may be strongly affected by social trends and marketing campaigns. These companies may be subject to severe competition, which may have an adverse impact on their profitability.
|
● |
Information Technology Sector Risk (SoFi Agentic AI ETF, SoFi Select 500 ETF, and SoFi Social 50 ETF Only ). Market or economic factors impacting information technology companies and companies that rely heavily on technological advances could have a significant effect on the value of the Fund’s investments. The value of stocks of information technology companies and companies that rely heavily on technology is particularly vulnerable to rapid changes in technology product cycles, rapid product obsolescence, government regulation and competition, both domestically and internationally, including competition from foreign competitors with lower production costs. Stocks of information technology companies and companies that rely heavily on technology, especially those of smaller, less-seasoned companies, tend to be more volatile than the overall market. Information technology companies are heavily dependent on patent and intellectual property rights, the loss or impairment of which may adversely affect profitability. |
|
● |
Software Industry Risk (SoFi Agentic AI ETF Only). Investing in the companies comprising the software industry may expose the Fund to specific risks related to companies operating in this industry. The software industry can be significantly affected by intense competition, aggressive pricing, technological innovations, and product obsolescence. These companies also face the risks that new services, equipment or technologies will not be accepted by consumers and businesses or will become rapidly obsolete. These factors can affect the profitability of these companies and, as a result, the value of their securities. Also, patent protection is integral to the success of many companies in this industry, and profitability can be affected materially by, among other things, the cost of obtaining (or failing to obtain) patent approvals, the cost of litigating patent infringement and the loss of patent protection for products (which significantly increases pricing pressures and can materially reduce profitability with respect to such products). In addition, many software companies have limited operating histories. Prices of these companies’ securities historically have been more volatile than other securities, especially over the short term. |
|
● |
Technology Sector Risk (SoFi Agentic AI ETF, SoFi Select 500 ETF, and SoFi Social 50 ETF Only). Each Fund may invest in companies in the technology sector, and therefore the performance of a Fund could be negatively impacted by events affecting this sector. Market or economic factors impacting technology companies and companies that rely heavily on technological advances could have a significant effect on the value of a Fund’s investments. The value of stocks of technology companies and companies that rely heavily on technology is particularly vulnerable to rapid changes in technology product cycles, rapid product obsolescence, government regulation and competition, both domestically and internationally, including competition from foreign competitors with lower production costs. Stocks of technology companies and companies that rely heavily on technology, especially those of smaller, less-seasoned companies, tend to be more volatile than the overall market. Technology companies are heavily dependent on patent and intellectual property rights, the loss or impairment of which may adversely affect profitability. |
Third Party Data Risk (SoFi Agentic AI ETF, SoFi Select 500 ETF, and SoFi Social 50 ETF Only). The composition of the Indexes, and consequently each Fund’s portfolio, is heavily dependent on information and data calculated and published by an independent third party calculation agent (“Third Party Data”). When Third Party
Notes to Financial Statements
February 28, 2026
Data proves to be incorrect or incomplete, any decisions made in reliance thereon may lead to the inclusion or exclusion of securities from the Indexes that would have been excluded or included had the Third Party Data been correct and complete. If the composition of the Indexes reflects such errors, each Fund’s portfolio can also be expected to reflect the errors.
Tracking Error Risk (SoFi Agentic AI ETF, SoFi Select 500 ETF, and SoFi Social 50 ETF Only). As with all index funds, the performance of each Fund and its Index may differ from each other for a variety of reasons. For example, each Fund incurs operating expenses and portfolio transaction costs not incurred by its Index. In addition, a Fund may not be fully invested in the securities of its Index at all times or may hold securities not included in its Index. The use of sampling techniques may affect a Fund’s ability to achieve close correlation with its Index. A Fund may use a representative sampling strategy to achieve its investment objective, if the Adviser believes it is in the best interests of such Fund, which generally can be expected to produce a greater non-correlation risk.
U.S. Government Securities Risk (SoFi Enhanced Yield ETF Only). U.S. Treasury obligations may differ in their interest rates, maturities, times of issuance and other characteristics. Obligations of U.S. Government agencies and authorities are supported by varying degrees of credit but generally are not backed by the full faith and credit of the
U.S. Government. No assurance can be given that the U.S. Government will provide financial support to its agencies and authorities if it is not obligated by law to do so. In addition, the value of U.S. Government securities may be affected by changes in the credit rating of the U.S. Government.
User Bias Risk (SoFi Social 50 ETF Only). The securities that comprise the Index are selected by retail investors holding SoFi Accounts, who may not be professional investors, may have no financial expertise, and may not do any research on the companies in which they invest prior to investing. In some cases, investment decisions made may be influenced by non-quantitative factors, including, without limitation, cognitive and emotional biases, resulting in the inclusion of certain securities in the Index which may underperform the market generally and result in lower returns for the Fund.
Written Options Risk (SoFi Enhanced Yield ETF Only). The Fund will incur a loss as a result of writing (selling) options (also referred to as a short position) if the price of the written option instrument increases in value between the date the Fund writes the option and the date on which the Fund purchases an offsetting position. The Fund’s losses are potentially large in a written put transaction and potentially unlimited in a written call transaction.). Because of the Fund’s strategy of coupling written and purchased puts and call options with the same expiration date and different strike prices, the Fund expects that the maximum potential loss for the Fund for any given credit spread is equal to the difference between the strike prices minus any net premium received. Nonetheless, because up to 90% of the Fund’s portfolio may be subject to this risk - the value of an investment in the Fund – could decline significantly and without warning, including to zero.
NOTE 4 - COMMITMENTS AND OTHER RELATED PARTY TRANSACTIONS
The Adviser serves as investment adviser to the Funds pursuant to an investment advisory agreement between the Adviser and the Trust, on behalf of the Funds (the “Advisory Agreement”), and, pursuant to the Advisory Agreement, provides investment advice to the Funds and oversees the day-to-day operations of the Funds, subject to the direction and oversight of the Board. The Adviser is also responsible for trading portfolio securities for the Funds, including selecting broker-dealers to execute purchase and sale transactions, subject to the supervision of the Board.
Pursuant to the Advisory Agreement, each Fund pays the Adviser a unitary management fee (the “Investment Advisory Fee”) based on the average daily net assets of each Fund as follows:
Notes to Financial Statements
February 28, 2026
| Fund |
Investment Advisory Fee |
Investment Advisory Fee After
Waiver |
| SoFi Agentic AI ETF |
0.69% |
0.69% |
| SoFi Enhanced Yield ETF |
0.49% |
0.49% |
| SoFi Select 500 ETF |
0.19% |
0.05% |
| SoFi Social 50 ETF |
0.29% |
0.29% |
The Adviser has contractually agreed to waive a portion of its Investment Advisory Fees for the SoFi Select 500 ETF until at least June 30, 2026 (the “Fee Waiver Agreement”) such that the management fees do not exceed 0.05%, of the average daily net assets for the SoFi Select 500 ETF. The Fee Waiver Agreement may be terminated only by, or with the consent of, the Board. Any waived Investment Advisory Fees are not able to be recouped by the Adviser under the Fee Waiver Agreement. There is currently no fee waiver agreement in effect for the SoFi Agentic AI ETF, SoFi Enhanced Yield ETF or the SoFi Social 50 ETF.
Out of the Investment Advisory Fees, the Adviser is obligated to pay, or arrange for the payment of, substantially all expenses of the Funds, including the cost of transfer agency, custody, fund administration, and all other related services necessary for the Funds to operate. Under the Advisory Agreement, the Adviser has agreed to pay all expenses incurred by the Funds except for interest charges on any borrowings, dividends and other expenses on securities sold short, taxes, brokerage commissions and other expenses incurred in placing orders for the purchase and sale of securities and other investment instruments, acquired fund fees and expenses, accrued deferred tax liability, extraordinary expenses, and distribution fees and expenses paid by the Funds under any distribution plan adopted pursuant to Rule 12b-1 under the 1940 Act (“Excluded Expenses”). The Investment Advisory Fees incurred are paid monthly to the Adviser. Investment Advisory Fees for the period ended February 28, 2026 are disclosed in the Statements of Operations.
The Adviser has entered into an agreement with Social Finance, Inc. (“SoFi”), with respect to each of the Funds, under which SoFi or an affiliate of SoFi, assumes the obligation of the Adviser to pay all or a portion of the expenses of the Funds, except Excluded Expenses (such expenses of a Fund, except Excluded Expenses, the “Unitary Expenses”). For assuming all or a portion of the payment obligation, SoFi is entitled to a fee, paid by the Adviser, based on the total Investment Advisory Fee earned by the Adviser under the Advisory Agreement less the Unitary Expenses and certain start-up costs.
Tidal ETF Services LLC (“Tidal”), a Tidal Financial Group company and an affiliate of the Adviser, serves as the Funds' administrator and, in that capacity, performs various administrative and management services for the Funds. Tidal coordinates the payment of Fund-related expenses and manages the Trust’s relationships with its various service providers. As compensation for the services it provides, Tidal receives a fee based on each Fund’s average daily net assets, subject to a minimum annual fee. Tidal also is entitled to certain out-of-pocket expenses for the services mentioned above.
U.S. Bancorp Fund Services, LLC, doing business as U.S. Bank Global Fund Services (“Fund Services”), serves as the Funds' fund accountant and transfer agent. In those capacities, Fund Services performs various accounting and transfer agency services for the Funds. U.S. Bank N.A. (the “Custodian”), an affiliate of Fund Services, serves as the Funds' custodian. The Custodian acts as the securities lending agent (the “Securities Lending Agent”) for the Funds, as applicable.
Foreside Fund Services, LLC (the “Distributor”) acts as the Funds' principal underwriter in a continuous public offering of each Fund’s Shares.
Notes to Financial Statements
February 28, 2026
Certain officers and a trustee of the Trust are affiliated with the Adviser. Neither the affiliated trustee nor the Trust’s officers receive compensation from the Funds.
NOTE 5 - SEGMENT REPORTING
In accordance with the FASB Accounting Standards Update 2023-07, Segment Reporting (Topic 280): Improvements to Reportable Segment Disclosures (“ASU 2023-07”), each Fund has evaluated their business activities and determined that they each operate as a single reportable segment.
Each Fund's investment activities are managed by the Principal Financial Officer, which serves as the Chief Operating Decision Maker ("CODM"). The Principal Financial Officer is responsible for assessing each Fund’s financial performance and allocating resources. In making these assessments, the Principal Financial Officer evaluates each Fund’s financial results on an aggregated basis, rather than by separate segments. As such, the Funds do not allocate operating expenses or assets to multiple segments, and accordingly, no additional segment disclosures are required. There were no intra-entity sales or transfers during the reporting period.
The Funds primarily generate income through dividends, interest, and realized/unrealized gains on their investment portfolios. Expenses incurred, including management fees, Fund operating expenses, and transaction costs, are considered general Fund-level expenses and are not allocated to specific segments or business lines.
Management has determined that the Funds do not meet the criteria for disaggregated segment reporting under ASU 2023-07 and will continue to evaluate its reporting requirements in accordance with applicable accounting standards.
NOTE 6 - SECURITIES LENDING
The SoFi Select 500 ETF and SoFi Social 50 ETF may lend up to 33 1/3% of the value of the securities in their portfolios to brokers, dealers and financial institutions (but not individuals) under terms of participation in a securities lending program administered by the Securities Lending Agent. The securities lending agreement requires that loans are collateralized at all times in an amount equal to at least the market value of the securities loaned by the SoFi Select 500 ETF and SoFi Social 50 ETF. Each Fund receives compensation in the form of fees and earned interest on the cash collateral. Due to timing issues of when a security is recalled from loan, the financial statements may differ in presentation. The amount of fees depends on a number of factors including the type of security and length of the loan. Each Fund continues to receive interest payments or dividends on the securities loaned during the borrowing period. Gain or loss in the value of securities loaned that may occur during the term of the loan will be for the account of each Fund. The SoFi Select 500 ETF and SoFi Social 50 ETF have the right under the terms of the securities lending agreements to recall the securities from the borrower on demand. The SoFi Agentic AI ETF and SoFi Enhanced Yield ETF do not currently participate in securities lending.
As of February 28, 2026, the market value of the securities on loan and payable on collateral received for securities lending were as follows:
| |
Market Value of
Securities on Loan |
Payable on Collateral
Received |
Percentage of Net Assets
of Securities on Loan |
| SoFi Select 500 ETF |
$5,502,490 |
$5,687,284 |
1.0% |
| SoFi Social 50 ETF |
$1,429,819 |
$1,513,590 |
4.0% |
Notes to Financial Statements
February 28, 2026
The cash collateral is invested in the Mount Vernon Liquid Assets Portfolio, LLC, of which the investment objective is to seek to maximize income to the extent consistent with the preservation of capital and liquidity and maintain a stable NAV of $1.00. Although risk is mitigated by the collateral, the Funds could experience a delay in recovering their securities and possible loss of income or value if the borrower fails to return the borrowed securities. In addition, the Funds bear the risk of loss associated with the investment of cash collateral received.
During the year ended February 28, 2026, the SoFi Select 500 ETF and SoFi Social 50 ETF each loaned securities that were collateralized by cash. The cash collateral received was invested in the Mount Vernon Liquid Assets Portfolio, LLC as listed in each Fund’s Schedule of Investments. Income earned from these investments is allocated to each Fund based on each Fund’s portion of total cash collateral received. Securities lending income is disclosed in each Fund’s Statement of Operations. The remaining contractual maturity of all of the securities lending transactions is overnight and continuous.
The Funds are not subject to a master netting agreement with respect to each Fund’s participation in securities lending; therefore, no additional disclosures regarding netting arrangements are required.
NOTE 7 - PURCHASES AND SALES OF SECURITIES
For the period ended February 28, 2026, the cost of purchases and proceeds from the sales or maturities of securities, excluding short-term investments, short-term U.S. government securities, in-kind transactions, and purchases and sales of the Subsidiary were:
| Fund |
|
Purchases |
|
Sales |
| SoFi Agentic AI ETF |
|
|
$3,279,350 |
|
|
|
$2,361,608 |
|
| SoFi Enhanced Yield ETF |
|
|
— |
|
|
|
— |
|
| SoFi Select 500 ETF |
|
|
83,599,333 |
|
|
|
80,393,327 |
|
| SoFi Social 50 ETF |
|
|
16,226,613 |
|
|
|
16,558,567 |
|
For the period ended February 28, 2026, the purchases and sales of long-term U.S. government securities were as follows:
| Fund |
|
Purchases |
|
Sales |
| SoFi Agentic AI ETF |
|
|
$— |
|
|
|
$ — |
|
| SoFi Enhanced Yield ETF |
|
|
— |
|
|
|
3,346,000 |
|
| SoFi Select 500 ETF |
|
|
— |
|
|
|
— |
|
| SoFi Social 50 ETF |
|
|
— |
|
|
|
— |
|
For the period ended February 28, 2026, in-kind transactions associated with creations and redemptions for the Funds were:
| Fund |
|
Purchases |
|
Sales |
| SoFi Agentic AI ETF |
|
|
$9,297,309 |
|
|
|
$ — |
|
| SoFi Enhanced Yield ETF |
|
|
— |
|
|
|
— |
|
| SoFi Select 500 ETF |
|
|
81,796,871 |
|
|
|
108,259,475 |
|
| SoFi Social 50 ETF |
|
|
11,975,184 |
|
|
|
7,035,935 |
|
Notes to Financial Statements
February 28, 2026
NOTE 8 - INCOME TAXES AND DISTRIBUTIONS TO SHAREHOLDERS
The tax character of distributions paid during the period ended February 28, 2026 and the year ended February 28, 2025, were as follows:
| Distributions paid from: |
|
February 28, 2026 |
|
|
February 28, 2025 |
|
| SoFi Agentic AI ETF |
|
|
|
|
|
|
|
|
| Ordinary Income |
|
$ |
38,961 |
|
|
$ |
– |
|
| SoFi Enhanced Yield ETF |
|
|
|
|
|
|
|
|
| Ordinary Income |
|
|
1,270,624 |
|
|
|
1,229,149 |
|
| Long-Term Capital Gains |
|
|
– |
|
|
|
5,686 |
|
| Return of Capital |
|
|
3,170,241 |
|
|
|
2,590,578 |
|
| SoFi Select 500 ETF |
|
|
|
|
|
|
|
|
| Ordinary Income |
|
|
5,386,671 |
|
|
|
9,213,159 |
|
| SoFi Social 50 ETF |
|
|
|
|
|
|
|
|
| Ordinary Income |
|
|
123,020 |
|
|
|
71,108 |
|
As of the fiscal period ended February 28, 2026, the components of distributable earnings/(accumulated losses) on a tax basis were as follows:
| |
|
SoFi Agentic AI ETF
|
|
SoFi Enhanced Yield ETF |
|
SoFi Select 500 ETF |
|
SoFi Social 50 ETF |
| Cost of investments(a) |
|
$ |
10,320,881 |
|
|
$ |
38,602,374 |
|
|
$ |
459,217,865 |
|
|
$ |
31,312,411 |
|
| Gross tax unrealized appreciation |
|
|
963,256 |
|
|
|
751,587 |
|
|
|
148,747,835 |
|
|
|
7,314,005 |
|
| Gross tax unrealized depreciation |
|
|
(1,152,739 |
) |
|
|
(737,667 |
) |
|
|
(24,464,518 |
) |
|
|
(1,420,289 |
) |
| Net tax unrealized appreciation (depreciation) |
|
|
(189,483 |
) |
|
|
13,920 |
|
|
|
124,283,317 |
|
|
|
5,893,716 |
|
| Undistributed ordinary income (loss) |
|
|
– |
|
|
|
– |
|
|
|
942,189 |
|
|
|
26,844 |
|
| Undistributed long-term capital gain (loss) |
|
|
– |
|
|
|
– |
|
|
|
– |
|
|
|
– |
|
| Total distributable earnings |
|
|
– |
|
|
|
– |
|
|
|
942,189 |
|
|
|
26,844 |
|
| Other accumulated gain (loss) |
|
|
(5,678 |
) |
|
|
(7,443,880 |
) |
|
|
(39,691,076 |
) |
|
|
(7,448,520 |
) |
| Total distributable earnings/(accumulated losses) |
|
$ |
(195,161 |
) |
|
$ |
(7,429,960 |
) |
|
$ |
85,534,430 |
|
|
$ |
(1,527,960 |
) |
|
(a) |
The difference between book and tax-basis cost of investments was attributable primarily related to wash sale and straddle adjustments. |
Net capital losses incurred after October 31 (post-October losses) and net investment losses incurred after December 31 (late-year losses), and within the taxable year, may be elected to be deferred to the first business day of each
Notes to Financial Statements
February 28, 2026
Fund’s next taxable year. As of the fiscal period ended February 28, 2026, the Funds had not elected to defer any post-October losses. Only the SoFi Agentic AI ETF had late-year losses, totaling $5,678.
As of February 28, 2026, the Funds had long-term and short-term capital loss carryovers of the following, which do not expire:
|
Fund |
|
Short-Term
Capital Loss Carryover |
|
|
Long-Term
Capital Loss Carryover |
|
| SoFi Agentic AI ETF |
|
$ |
- |
|
|
$ |
- |
|
| SoFi Enhanced Yield ETF |
|
|
2,990,026 |
|
|
|
4,453,854 |
|
| SoFi Select 500 ETF |
|
|
13,388,076 |
|
|
|
26,303,000 |
|
| SoFi Social 50 ETF |
|
|
3,671,865 |
|
|
|
3,776,655 |
|
The SoFi Social 50 ETF utilized $ 739,916 of capital loss carryovers during the year ended February 28, 2026.
NOTE 9 - SHARES TRANSACTIONS
Shares of the Funds are listed and traded on the Exchange. Market prices for the shares may be different from their NAV. The Funds issue and redeem shares on a continuous basis at NAV generally in large blocks of shares called Creation Units. Creation Units are issued and redeemed principally in-kind for securities included in a specified universe. Once created, shares generally trade in the secondary market at market prices that change throughout the day. Except when aggregated in Creation Units, shares are not redeemable securities of the Funds. Creation Units may only be purchased or redeemed by Authorized Participants. An Authorized Participant is either (i) a broker-dealer or other participant in the clearing process through the Continuous Net Settlement System of the National Securities Clearing Corporation or (ii) a Depository Trust Company participant and, in each case, must have executed a Participant Agreement with the Distributor. Most retail investors do not qualify as Authorized Participants nor have the resources to buy and sell whole Creation Units. Therefore, they are unable to purchase or redeem the shares directly from the Funds. Rather, most retail investors may purchase shares in the secondary market with the assistance of a broker and are subject to customary brokerage commissions or fees.
Each Fund currently offers one class of shares, which has no front-end sales load, no deferred sales charge, and no redemption fee. A fixed transaction fee is imposed for the transfer and other transaction costs associated with the purchase or sale of Creation Units. The standard fixed transaction fee for the SoFi Select 500 ETF, and SoFi Enhanced Yield ETF is $500, and for the SoFi Agentic AI ETF and SoFi Social 50 ETF is $300, payable to the Custodian. The fixed transaction fee may be waived on certain orders if the Funds’ Custodian has determined to waive some or all of the costs associated with the order or another party, such as the Adviser, has agreed to pay such fee. In addition, a variable fee may be charged on all cash transactions or substitutes for Creation Units and Redemption Units of up to a maximum of 2% of the value of the Creation Units and Redemption Units subject to the transaction. Variable fees received by the Funds, if any, are disclosed in the capital shares transactions section of the Statements of Changes in Net Assets. The Funds may issue an unlimited number of shares of beneficial interest, with no par value. All shares of the Funds have equal rights and privileges.
NOTE 10 - REVERSE STOCK SPLIT
During the year ended February 28, 2025, the shares of the SoFi Select 500 ETF were adjusted to reflect a reverse stock split. The effect of this reverse stock split was to reduce the number of shares outstanding in the Fund while
Notes to Financial Statements
February 28, 2026
maintaining the Fund’s and each shareholder’s aggregate NAV. All historical per share information has been retroactively adjusted to reflect this reverse stock split. Set forth below are details regarding the reverse stock split effected on October 2, 2024:
| |
Date |
Rate |
NAV Before Split |
NAV After Split |
Shares Outstanding Before Split |
Shares Outstanding After Split |
| SoFi Select 500 ETF |
10/2/2024 |
1 for 5 |
$20.52 |
$102.60 |
43,000,000 |
8,600,000 |
NOTE 11 - RECENT MARKET EVENTS
U.S. and international markets have experienced and may continue to experience significant periods of volatility in recent years and months due to a number of economic, political and global macro factors including uncertainty regarding inflation and central banks’ interest rate changes, the possibility of a national or global recession, trade tensions and tariffs, political events, armed conflict, war, and geopolitical conflict. These developments, as well as other events, could result in further market volatility and negatively affect financial asset prices, the liquidity of certain securities and the normal operations of securities exchanges and other markets, despite government efforts to address market disruptions. As a result, the risk environment remains elevated.
NOTE 12 - NEW ACCOUNTING PRONOUNCEMENTS
In December 2023, the Financial Accounting Standards Board (“FASB”) issued ASU No. 2023-09, Income Taxes (Topic 740): Improvements to Income Tax Disclosures (“ASU 2023-09”), which enhances the transparency and decision usefulness of income tax disclosures. The amendments are effective for annual periods beginning after December 15, 2024. The Funds have adopted ASU 2023-09, which did not have a material impact on the Funds’ financial statements or disclosures.
NOTE 13 – SUBSEQUENT EVENTS
In preparing these financial statements, management has evaluated events and transactions for potential recognition or disclosure through the date the financial statements were issued. Management has determined that there are no subsequent events that would need to be recognized or disclosed in the Funds' financial statements.
 |
taitweller.com |
| |
|
REPORT OF INDEPENDENT REGISTERED PUBLIC ACCOUNTING FIRM
To the Shareholders of
SoFi ETFs and
The Board of Trustees of
Tidal Trust I
Opinion on the Financial Statements
We have audited the accompanying statements of assets and liabilities of SoFi Agentic AI ETF, SoFi Enhanced Yield ETF, SoFi Select 500 ETF and SoFi Social 50 ETF (the “Funds”), each a series of Tidal Trust I (the “Trust”), including the schedules of investments, as of February 28, 2026, the related statements of operations, statements of changes in net assets, and the financial highlights for each of the periods indicated in the table below, and the related notes (collectively referred to as the “financial statements”). In our opinion, the financial statements present fairly, in all material respects, the financial position of the Funds as of February 28, 2026, the results of their operations, the changes in their net assets, and the financial highlights for the periods indicated in the table below, in conformity with accounting principles generally accepted in the United States of America.
| Individual Funds Constituting Tidal Trust I |
Statement Of Operations |
Statements Of Changes In Net Assets |
Financial Highlights |
|
SoFi Agentic AI ETF
|
For the period September 2, 2025 (commencement of operations) to February 28, 2026 |
For the period September 2, 2025 (commencement of operations) to February 28, 2026 |
For the period September 2, 2025 (commencement of operations) to February 28, 2026 |
| |
|
|
|
| SoFi Enhanced Yield ETF |
For the year ended February 28, 2026 |
For the two years ended February 28, 2026 |
For the two years ended February 28, 2026 and for the period November 14, 2023 (commencement of operations) to February 29, 2024 |
| |
|
|
|
|
SoFi Select 500 ETF and SoFi Social 50 ETF |
For the year ended February 28, 2026 |
For the two years ended February 28, 2026 |
For the five years ended February 28, 2026 |
Basis for Opinion
These financial statements are the responsibility of the Fund’s management. Our responsibility is to express an opinion on the Fund’s financial statements based on our audits. We are a public accounting firm registered with the Public Company Accounting Oversight Board (United States) (“PCAOB”) and are required to be independent with respect to the Fund in accordance with the U.S. federal securities laws and the applicable rules and regulations of the Securities and Exchange Commission and the PCAOB. We have served as the auditor of one or more of the funds in the Trust since 2018.
To the Shareholders of
SoFi ETFs and
The Board of Trustees of
Tidal Trust I
Page 2
We conducted our audits in accordance with the standards of the PCAOB. Those standards require that we plan and perform the audits to obtain reasonable assurance about whether the financial statements are free of material misstatement, whether due to error or fraud. The Funds are not required to have, nor were we engaged to perform, an audit of their internal control over financial reporting. As part of our audits we are required to obtain an understanding of internal control over financial reporting, but not for the purpose of expressing an opinion on the effectiveness of the Funds’ internal control over financial reporting. Accordingly, we express no such opinion.
Our audits included performing procedures to assess the risks of material misstatement of the financial statements, whether due to error or fraud, and performing procedures that respond to those risks. Such procedures included examining, on a test basis, evidence regarding the amounts and disclosures in the financial statements. Our audits also included evaluating the accounting principles used and significant estimates made by management, as well as evaluating the overall presentation of the financial statements. Our procedures included confirmation of securities owned as of February 28, 2026 by correspondence with the custodian and brokers. We believe that our audits provide a reasonable basis for our opinion.
| |
 |
| |
|
| |
TAIT, WELLER & BAKER LLP |
Philadelphia, Pennsylvania
April 28, 2026
| Other Non-Audited Information |
SoFi ETFs |
February 28, 2026
QUALIFIED DIVIDEND INCOME/DIVIDENDS RECEIVED DEDUCTION
For the year ended February 28, 2026, certain dividends paid by the Funds may be subject to a maximum tax rate of 23.8%, as provided for by the Jobs and Growth Tax Relief Reconciliation Act of 2003 and the Tax Cuts and Jobs Act of 2017. The percentage of dividends declared from ordinary income designated as qualified dividend income were as follows:
| SoFi Agentic AI ETF |
30.69% |
| SoFi Enhanced Yield ETF |
0.00% |
| SoFi Select 500 ETF |
98.50% |
| SoFi Social 50 ETF |
100.00% |
For corporate shareholders, the percent of ordinary income distributions qualifying for the corporate dividends received deduction for the year ended February 28, 2026, were as follows:
| SoFi Agentic AI ETF |
31.13% |
| SoFi Enhanced Yield ETF |
0.00% |
| SoFi Select 500 ETF |
95.18% |
| SoFi Social 50 ETF |
100.00% |
The percentage of taxable ordinary income distributions that are designated as short-term capital gain distributions under Internal Revenue Section 871(k)(2)(c) for the year ended February 28, 2026, were as follows:
| SoFi Agentic AI ETF |
0.00% |
| SoFi Enhanced Yield ETF |
0.00% |
| SoFi Select 500 ETF |
0.00% |
| SoFi Social 50 ETF |
0.00% |
|
(b) |
Financial Highlights are included within the financial statements filed under Item 7(a) of this Form. |
Item 8. Changes in and Disagreements with Accountants for Open-End Investment Companies.
There have been no changes in or disagreements with the Funds’ accountants.
Item 9. Proxy Disclosure for Open-End Investment Companies.
There were no matters submitted to a vote of shareholders during the period covered by the report.
Item 10. Remuneration Paid to Directors, Officers, and Others of Open-End Investment Companies.
See Item 7(a). Under the Investment Advisory Agreement, in exchange for a single unitary management fee from each Fund, the Adviser has agreed to pay all expenses incurred by the Fund, including Trustee compensation, except for certain excluded expenses.
Item 11. Statement Regarding Basis for Approval of Investment Advisory Contract.
The Board of Trustees (the “Board” or the “Trustees”) of Tidal Trust I (the “Trust”) met at a meeting held on July 31, 2025 to consider the initial approval of the Investment Advisory Agreement (the “Advisory Agreement”) between the Trust, on behalf of the SoFi Agentic AI ETF (the “Fund”), a proposed series of the Trust, and Tidal Investments LLC, the Fund’s proposed investment adviser (the “Adviser”). Prior to this meeting, the Board requested and received materials to assist them in considering the approval of the Advisory Agreement. The materials provided contained information with respect to the factors enumerated below, including a copy of the Advisory Agreement, a memorandum prepared by outside legal counsel to the Trust and Independent Trustees discussing in detail the Trustees’ fiduciary obligations and the factors they should assess in considering the approval of the Advisory Agreement, due diligence materials relating to the Adviser (including the due diligence response completed by the Adviser with respect to a specific request letter from outside legal counsel to the Trust and Independent Trustees, the Adviser’s Form ADV, select ownership, organizational, financial and insurance information for the Adviser, biographical information of the Adviser’s key management and compliance personnel, detailed comparative information regarding the proposed unitary advisory fee for the Fund, and information regarding the Adviser’s compliance program) and other pertinent information. Based on their evaluation of the information provided, the Trustees, by a unanimous vote (including a separate vote of the Trustees who are not “interested persons,” as that term is defined in the Investment Company Act of 1940, as amended (the “Independent Trustees”)), approved the Advisory Agreement for an initial two-year term.
Discussion of Factors Considered
In considering the approval of the Advisory Agreement and reaching their conclusions, the Trustees reviewed and analyzed various factors that they determined were relevant, including the factors enumerated below.
|
1. |
Nature, Extent and Quality of Services to be Provided. The Board considered the nature, extent and quality of the Adviser’s overall services to be provided to the Fund, as well as its specific responsibilities in all aspects of day-to-day investment management of the Fund, including trade execution. The Board considered the qualifications, experience and responsibilities of the Adviser’s investment management team, including Qiao Duan and Charles Ragauss, who will serve as a portfolio manager to the Fund, as well as the responsibilities of other key personnel of the Adviser to be involved in the day-to-day activities of the Fund. The Board reviewed due diligence information provided by the Adviser, including information regarding the Adviser’s compliance program, its compliance personnel and compliance record, as well as the Adviser’s cybersecurity program and business continuity plan. The Board noted that the Adviser does not manage any other accounts that utilize a strategy similar to that to be employed by the Fund. |
The Board also considered other services to be provided to the Fund by the Adviser, such as monitoring adherence to the Fund’s investment strategy and restrictions, oversight of service providers to the Fund, monitoring compliance with various Fund policies and procedures and with applicable securities regulations, monitoring the extent to which the Fund achieves its investment objective as a passively-managed ETF and quarterly reporting to the Board.
The Board concluded that the Adviser had sufficient quality and depth of personnel, resources, investment methods and compliance policies and procedures essential to performing its duties under the Advisory Agreement and managing the Fund and that the nature, overall quality and extent of the management services to be provided to the Fund, as well as the Adviser’s compliance program, were satisfactory.
|
2. |
Investment Performance of the Fund and the Adviser. The Board noted that the Fund had not yet commenced operations and, therefore, concluded that performance of the Fund was not a relevant factor for consideration. The Board also considered that because the Fund is designed to track the performance of an index, the performance of the Fund would not be the direct result of investment decisions made by the Adviser. However, with respect to the Fund’s performance, the Board in the future would focus on the Adviser’s trade execution services, including whether the Fund’s performance exhibited significant tracking error. |
|
3. |
Cost of Services to be Provided and Profits to be Realized by the Adviser. The Board considered the cost of services and the structure of the Adviser’s proposed advisory fee, including a review of comparative expenses, expense components and peer group selection. The Board took into consideration that the advisory fee for the Fund was a “unitary fee,” meaning that the Fund would pay no expenses other than the advisory fee and certain other costs such as interest, brokerage, and extraordinary expenses and, to the extent it is implemented, fees pursuant to the Fund’s Rule 12b-1 Plan. The Board noted that the Adviser agreed to pay all other expenses incurred by the Fund, subject to the contractual agreement of the Fund’s sponsor, Social Finance, Inc., to assume such obligations in exchange for the profits, if any, generated by the Fund’s unitary fee. The Board considered comparative information provided by the Adviser, in partnership with AltaVista Research, LLC, a third-party ETF research firm, utilizing a peer group selection process managed by the Adviser based on select criteria and the characteristics of the Fund. |
The Board concluded that the Fund’s proposed expense ratio and the advisory fee to be paid to the Adviser were fair and reasonable in light of the comparative expense information and the investment management services to be provided to the Fund by the Adviser given the nature of the Fund’s investment strategy. The Board also evaluated, based on information provided by the Adviser, the compensation and benefits expected to be received by the Adviser and its affiliates from their relationship with the Fund, taking into account an analysis of the Adviser’s expected profitability with respect to the Fund. The Board further concluded that the Adviser has adequate financial resources to support its services to the Fund from the revenues of its overall investment advisory business.
|
4. |
Extent of Economies of Scale as the Fund Grows. The Board considered the potential economies of scale that the Fund might realize under the structure of the proposed advisory fee. The Board noted the advisory fee did not contain any breakpoint reductions as the Fund’s assets grow in size, but that the Adviser would evaluate future circumstances that may warrant breakpoints in the fee structure. |
|
5. |
Benefits to be Derived from the Relationship with the Fund. The Board considered the direct and indirect benefits that could be received by the Adviser and its affiliates from association with the Fund. The Board concluded that the benefits the Adviser may receive, such as greater name recognition or the ability to attract additional investor assets, appear to be reasonable and in many cases may benefit the Fund. |
Conclusion. Based on the Board’s deliberations and its evaluation of the information described above, with no single factor determinative of a conclusion, the Board, including the Independent Trustees, unanimously concluded that: (a) the terms of the Advisory Agreement are fair and reasonable; (b) the advisory fee is reasonable in light of the services that the Adviser will provide to the Fund; and (c) the approval of the Advisory Agreement for an initial term of two years was in the best interests of the Fund and its shareholders.
Item 12. Disclosure of Proxy Voting Policies and Procedures for Closed-End Management Investment Companies.
Not applicable to open-end investment companies.
Item 13. Portfolio Managers of Closed-End Management Investment Companies.
Not applicable to open-end investment companies.
Item 14. Purchases of Equity Securities by Closed-End Management Investment Company and Affiliated Purchasers.
Not applicable to open-end investment companies.
Item 15. Submission of Matters to a Vote of Security Holders.
Not Applicable.
Item 16. Controls and Procedures.
|
(a) |
The Registrant’s President/Principal Executive Officer and Treasurer/Principal Financial Officer have reviewed the Registrant’s disclosure controls and procedures (as defined in Rule 30a-3(c) under the Investment Company Act of 1940 (the “Act”)) as of a date within 90 days of the filing of this report, as required by Rule 30a-3(b) under the Act and Rules 13a-15(b) or 15d-15(b) under the Securities Exchange Act of 1934. Based on their review, such officers have concluded that the disclosure controls and procedures are effective in ensuring that information required to be disclosed in this report is appropriately recorded, processed, summarized and reported and made known to them by others within the Registrant and by the Registrant’s service provider. |
|
(b) |
There were no changes in the Registrant’s internal control over financial reporting (as defined in Rule 30a-3(d) under the Act) that occurred during the period covered by this report that have materially affected, or are reasonably likely to materially affect, the Registrant’s internal control over financial reporting. |
Item 17. Disclosure of Securities Lending Activities for Closed-End Management Investment Companies
Not applicable to open-end investment companies.
Item 18. Recovery of Erroneously Awarded Compensation.
(a) Not Applicable
(b) Not Applicable
Item 19. Exhibits.
(2) Any policy required by the listing standards adopted pursuant to Rule 10D-1 under the Exchange Act (17 CFR 240.10D-1) by the registered national securities exchange or registered national securities association upon which the registrant’s securities are listed. Not applicable.
(3) A separate certification for each principal executive officer and principal financial officer pursuant to Section 302 of the Sarbanes-Oxley Act of 2002. Filed herewith.
(4) Any written solicitation to purchase securities under Rule 23c-1 under the Act sent or given during the period covered by the report by or on behalf of the registrant to 10 or more persons. Not applicable.
(5) Change in the registrant’s independent public accountant. Provide the information called for by Item 4 of Form 8-K under the Exchange Act (17 CFR 249.308). Unless otherwise specified by Item 4, or related to and necessary for a complete understanding of information not previously disclosed, the information should relate to events occurring during the reporting period. Not applicable.
SIGNATURES
Pursuant to the requirements of the Securities Exchange Act of 1934 and the Investment Company Act of 1940, the registrant has duly caused this report to be signed on its behalf by the undersigned, thereunto duly authorized.
| |
(Registrant) |
Tidal Trust I |
| |
By (Signature and Title)* |
/s/ Eric W. Falkeis |
| |
|
Eric W. Falkeis, President/Principal Executive Officer |
Pursuant to the requirements of the Securities Exchange Act of 1934 and the Investment Company Act of 1940, this report has been signed below by the following persons on behalf of the registrant and in the capacities and on the dates indicated.
| |
By (Signature and Title)* |
/s/ Eric W. Falkeis |
| |
|
Eric W. Falkeis, President/Principal Executive Officer |
| |
By (Signature and Title)* |
/s/ Aaron J. Perkovich |
| |
|
Aaron J. Perkovich, Treasurer/Principal Financial Officer |
* Print the name and title of each signing officer under his or her signature.