What were the Fund costs for the past year?
(based on a hypothetical $10,000 investment)
|
Fund Name |
Costs of a $10,000 investment* |
Costs paid as a percentage of a $10,000 investment** |
|---|---|---|
|
SoFi Agentic AI ETF |
$35 |
0.69% |
| * | The Fund commenced operations on September 2, 2025. Expenses for a full reporting period would be higher than figures shown. |
| ** | Cost paid as a percentage of a $10,000 investment is an annualized figure. |
How did the Fund perform last year and what affected its performance?
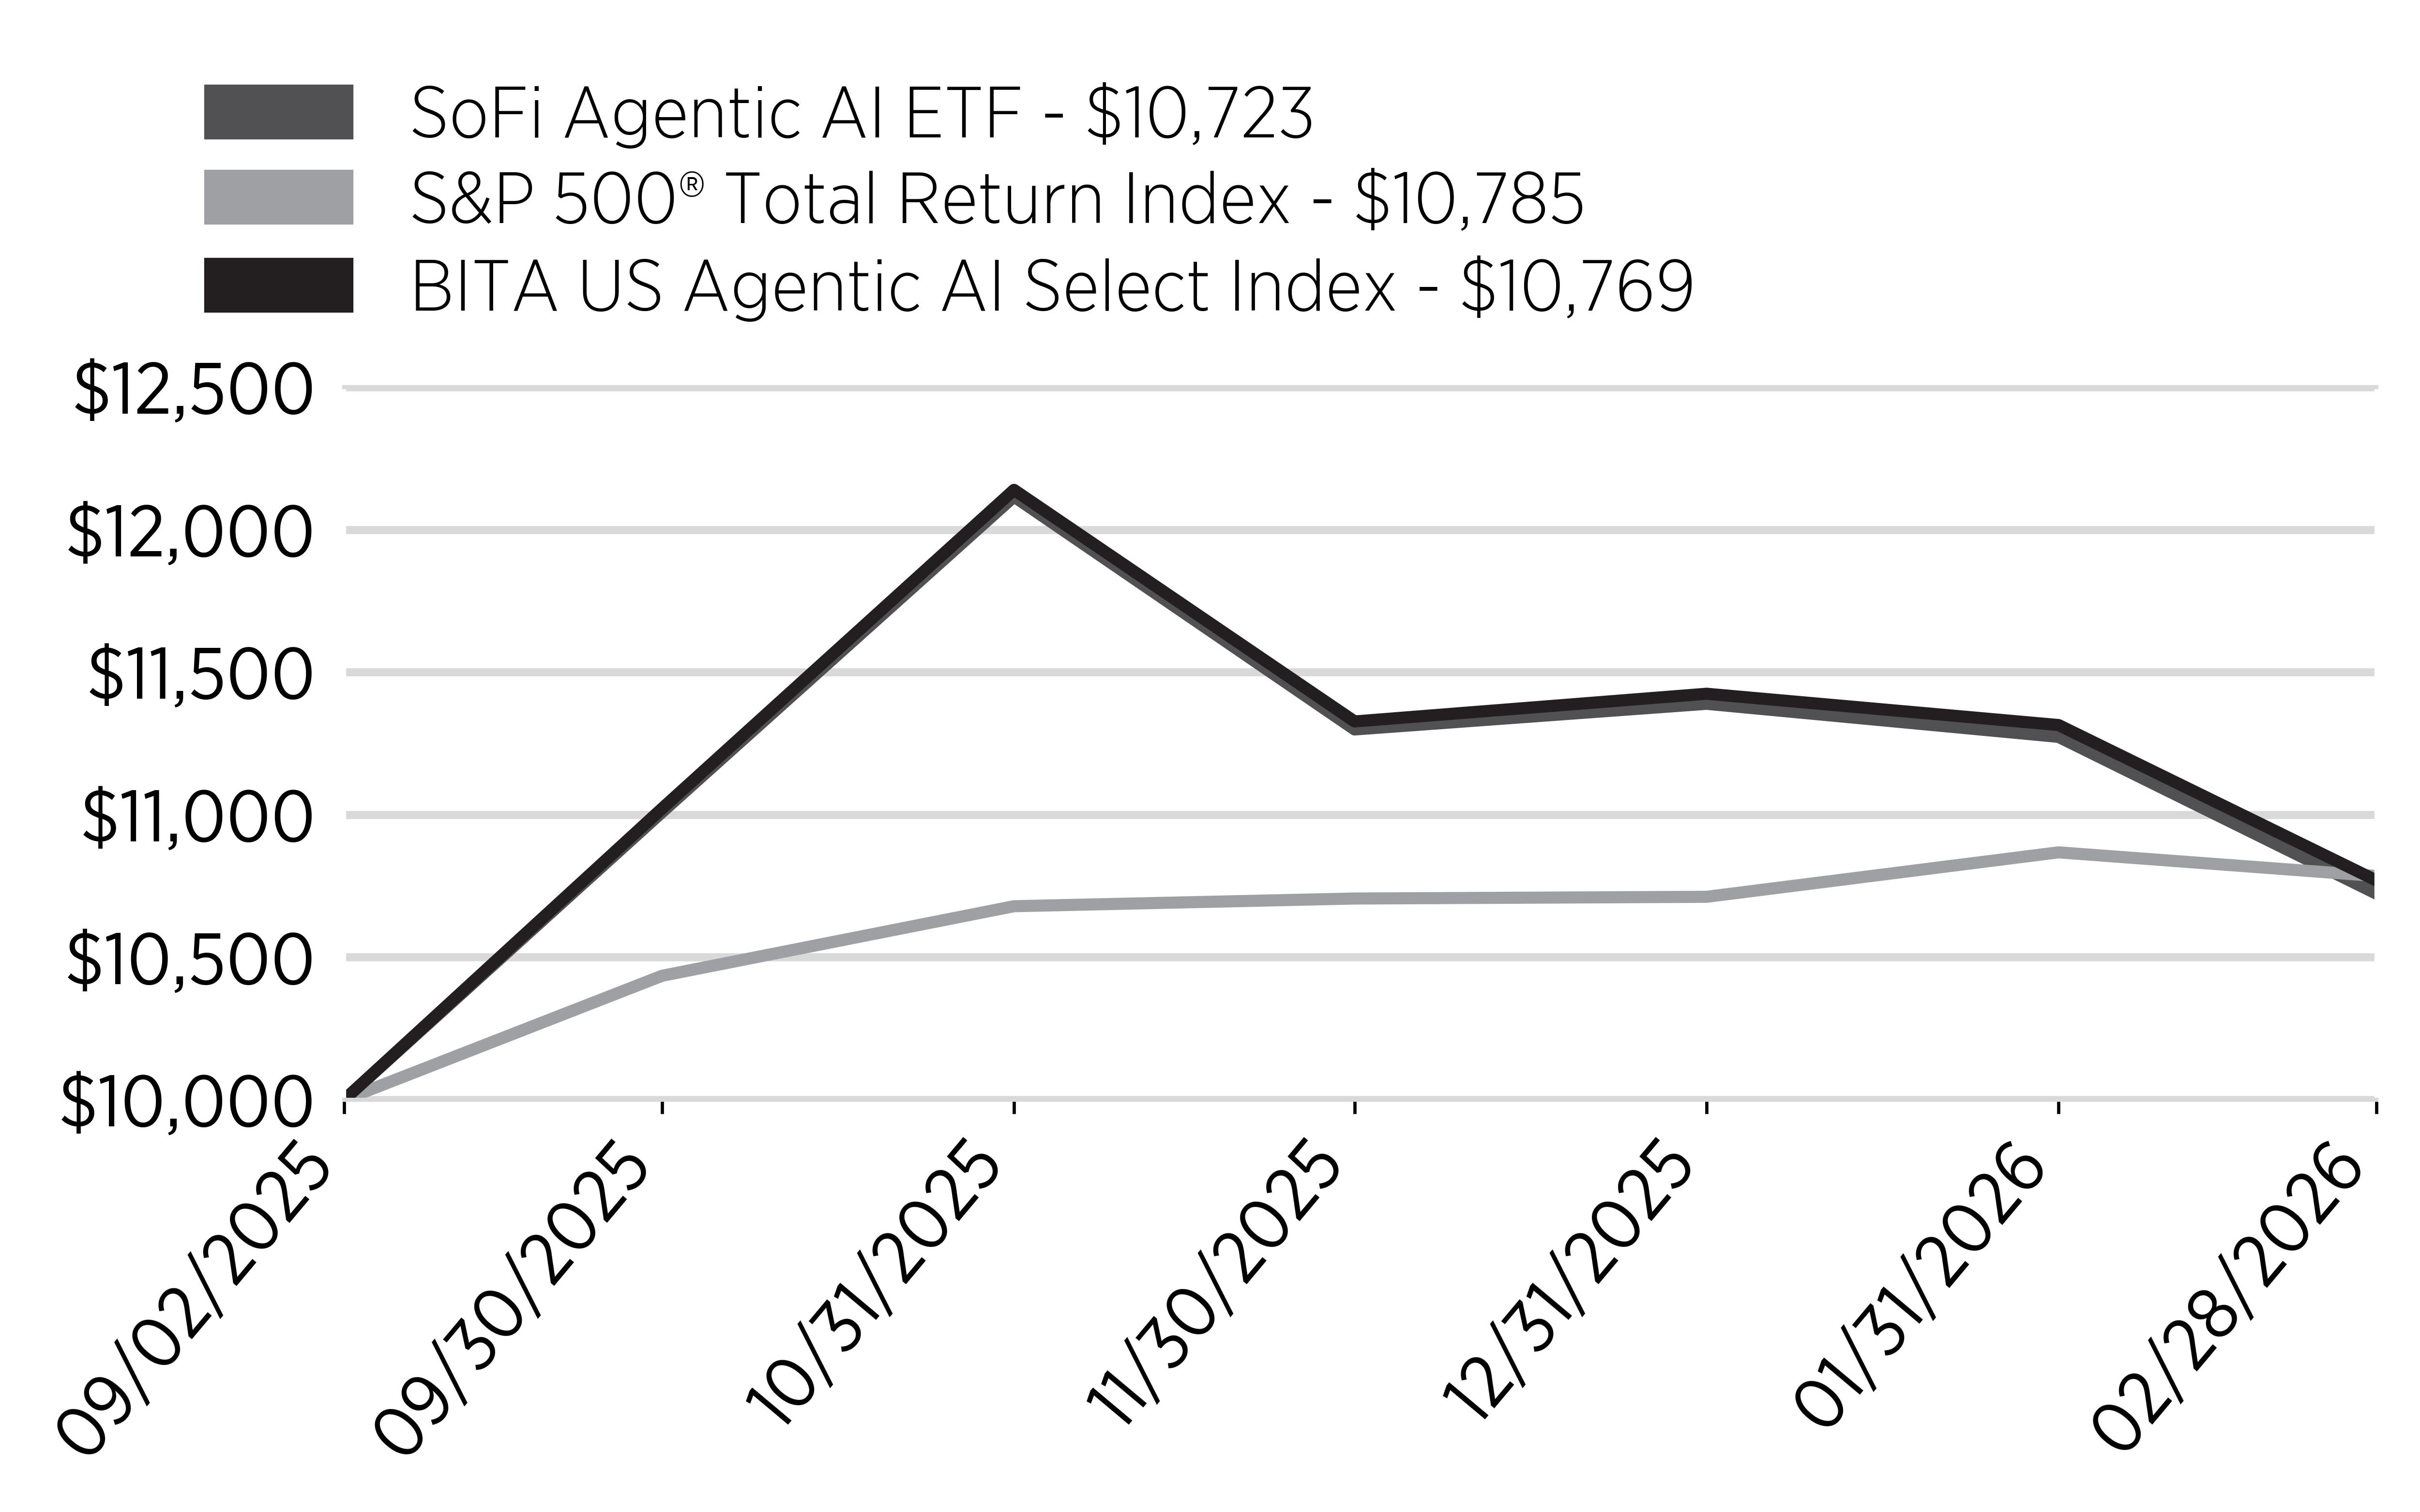
During the period ended February 28, 2026, U.S. equity markets posted positive returns, supported by continued corporate earnings growth, moderating inflation, and sustained investor enthusiasm for artificial intelligence ("AI") related investment. Market conditions remained supportive for much of the period, although volatility increased later in the period as investors weighed valuation levels, the expected payoff from elevated AI spending, and the timing of future interest-rate cuts.
For the period ended February 28, 2026, the Fund returned 7.23%, compared with 7.69% for the BITA US Agentic AI Select Index (the "AGIQ Index"), the Fund's underlying index, and 7.85% for the S&P 500® Total Return Index. The Fund’s performance reflected gains in companies associated with AI infrastructure, automation, and related technology themes, although returns were tempered by periods of market volatility as investors became more cautious toward richly valued AI-oriented stocks and questioned the near-term returns on significant AI capital expenditures.
What factors influenced performance?
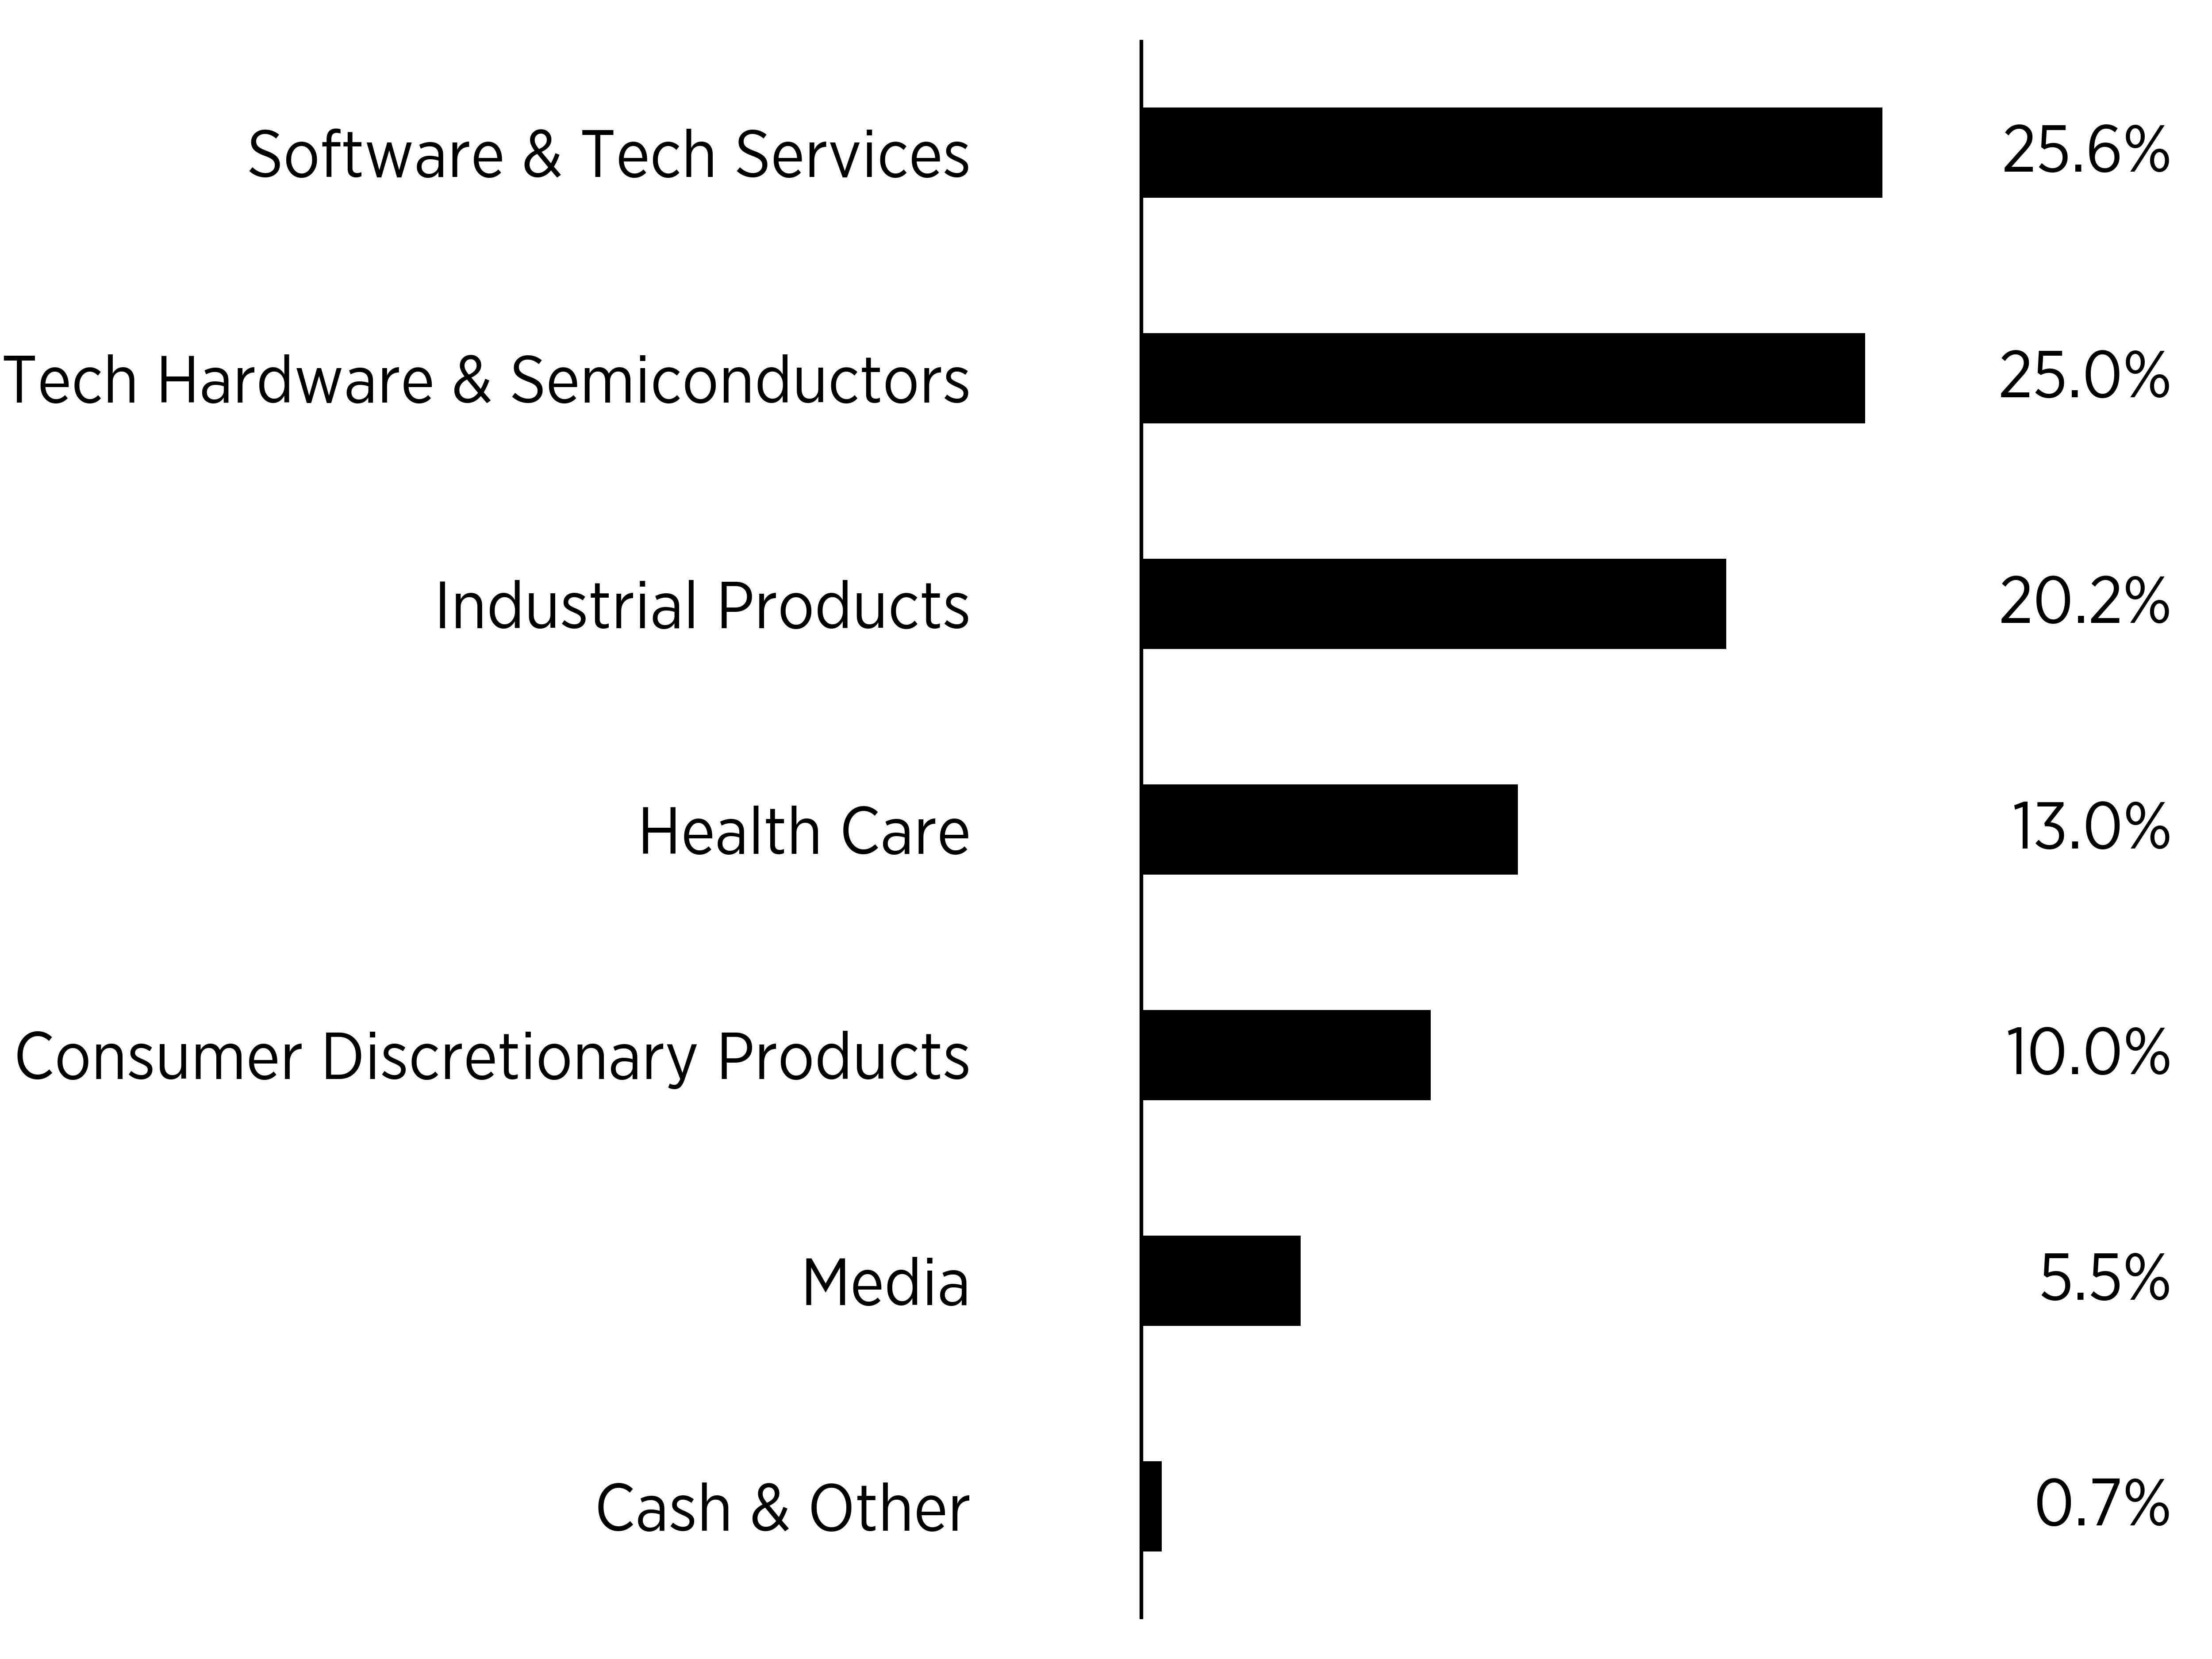
Sector performance attribution showed that the Industrials and Health Care sectors were the largest contributors to the Fund’s returns, while Information Technology detracted from performance.
Cumulative Performance
(Initial Investment of $10,000)
Annual Performance
|
Returns for the Period Ended
February 28, 2026 |
Since Inception
(9/2/2025) |
|---|---|
|
SoFi Agentic AI ETF |
7.23% |
|
S&P 500® Total Return Index |
7.85% |
|
BITA US Agentic AI Select Index |
7.69% |
Key Fund Statistics
(as of February 28, 2026)
|
Fund Size (Thousands) |
$10,148 |
|
Number of Holdings |
28 |
|
Total Advisory Fee Paid |
$29,654 |
|
Portfolio Turnover Rate |
24% |
What did the Fund invest in?
(as of February 28, 2026)
Security Breakdown
(% of total net assets)
|
Top Ten Holdings |
(% of total net assets) |
|---|---|
|
Teradyne Inc |
|
|
NVIDIA Corp |
|
|
Deere & Co |
|
|
Tesla Inc |
|
|
Palantir Technologies Inc |
|
|
Rockwell Automation Inc |
|
|
Baidu Inc |
|
|
Arista Networks Inc |
|
|
Thermo Fisher Scientific Inc |
|
|
Intuitive Surgical Inc |
What were the Fund costs for the past year?
(based on a hypothetical $10,000 investment)
|
Fund Name |
Costs of a $10,000 investment |
Costs paid as a percentage of a $10,000 investment |
|---|---|---|
|
SoFi Enhanced Yield ETF |
$62 |
0.65% |
How did the Fund perform last year and what affected its performance?
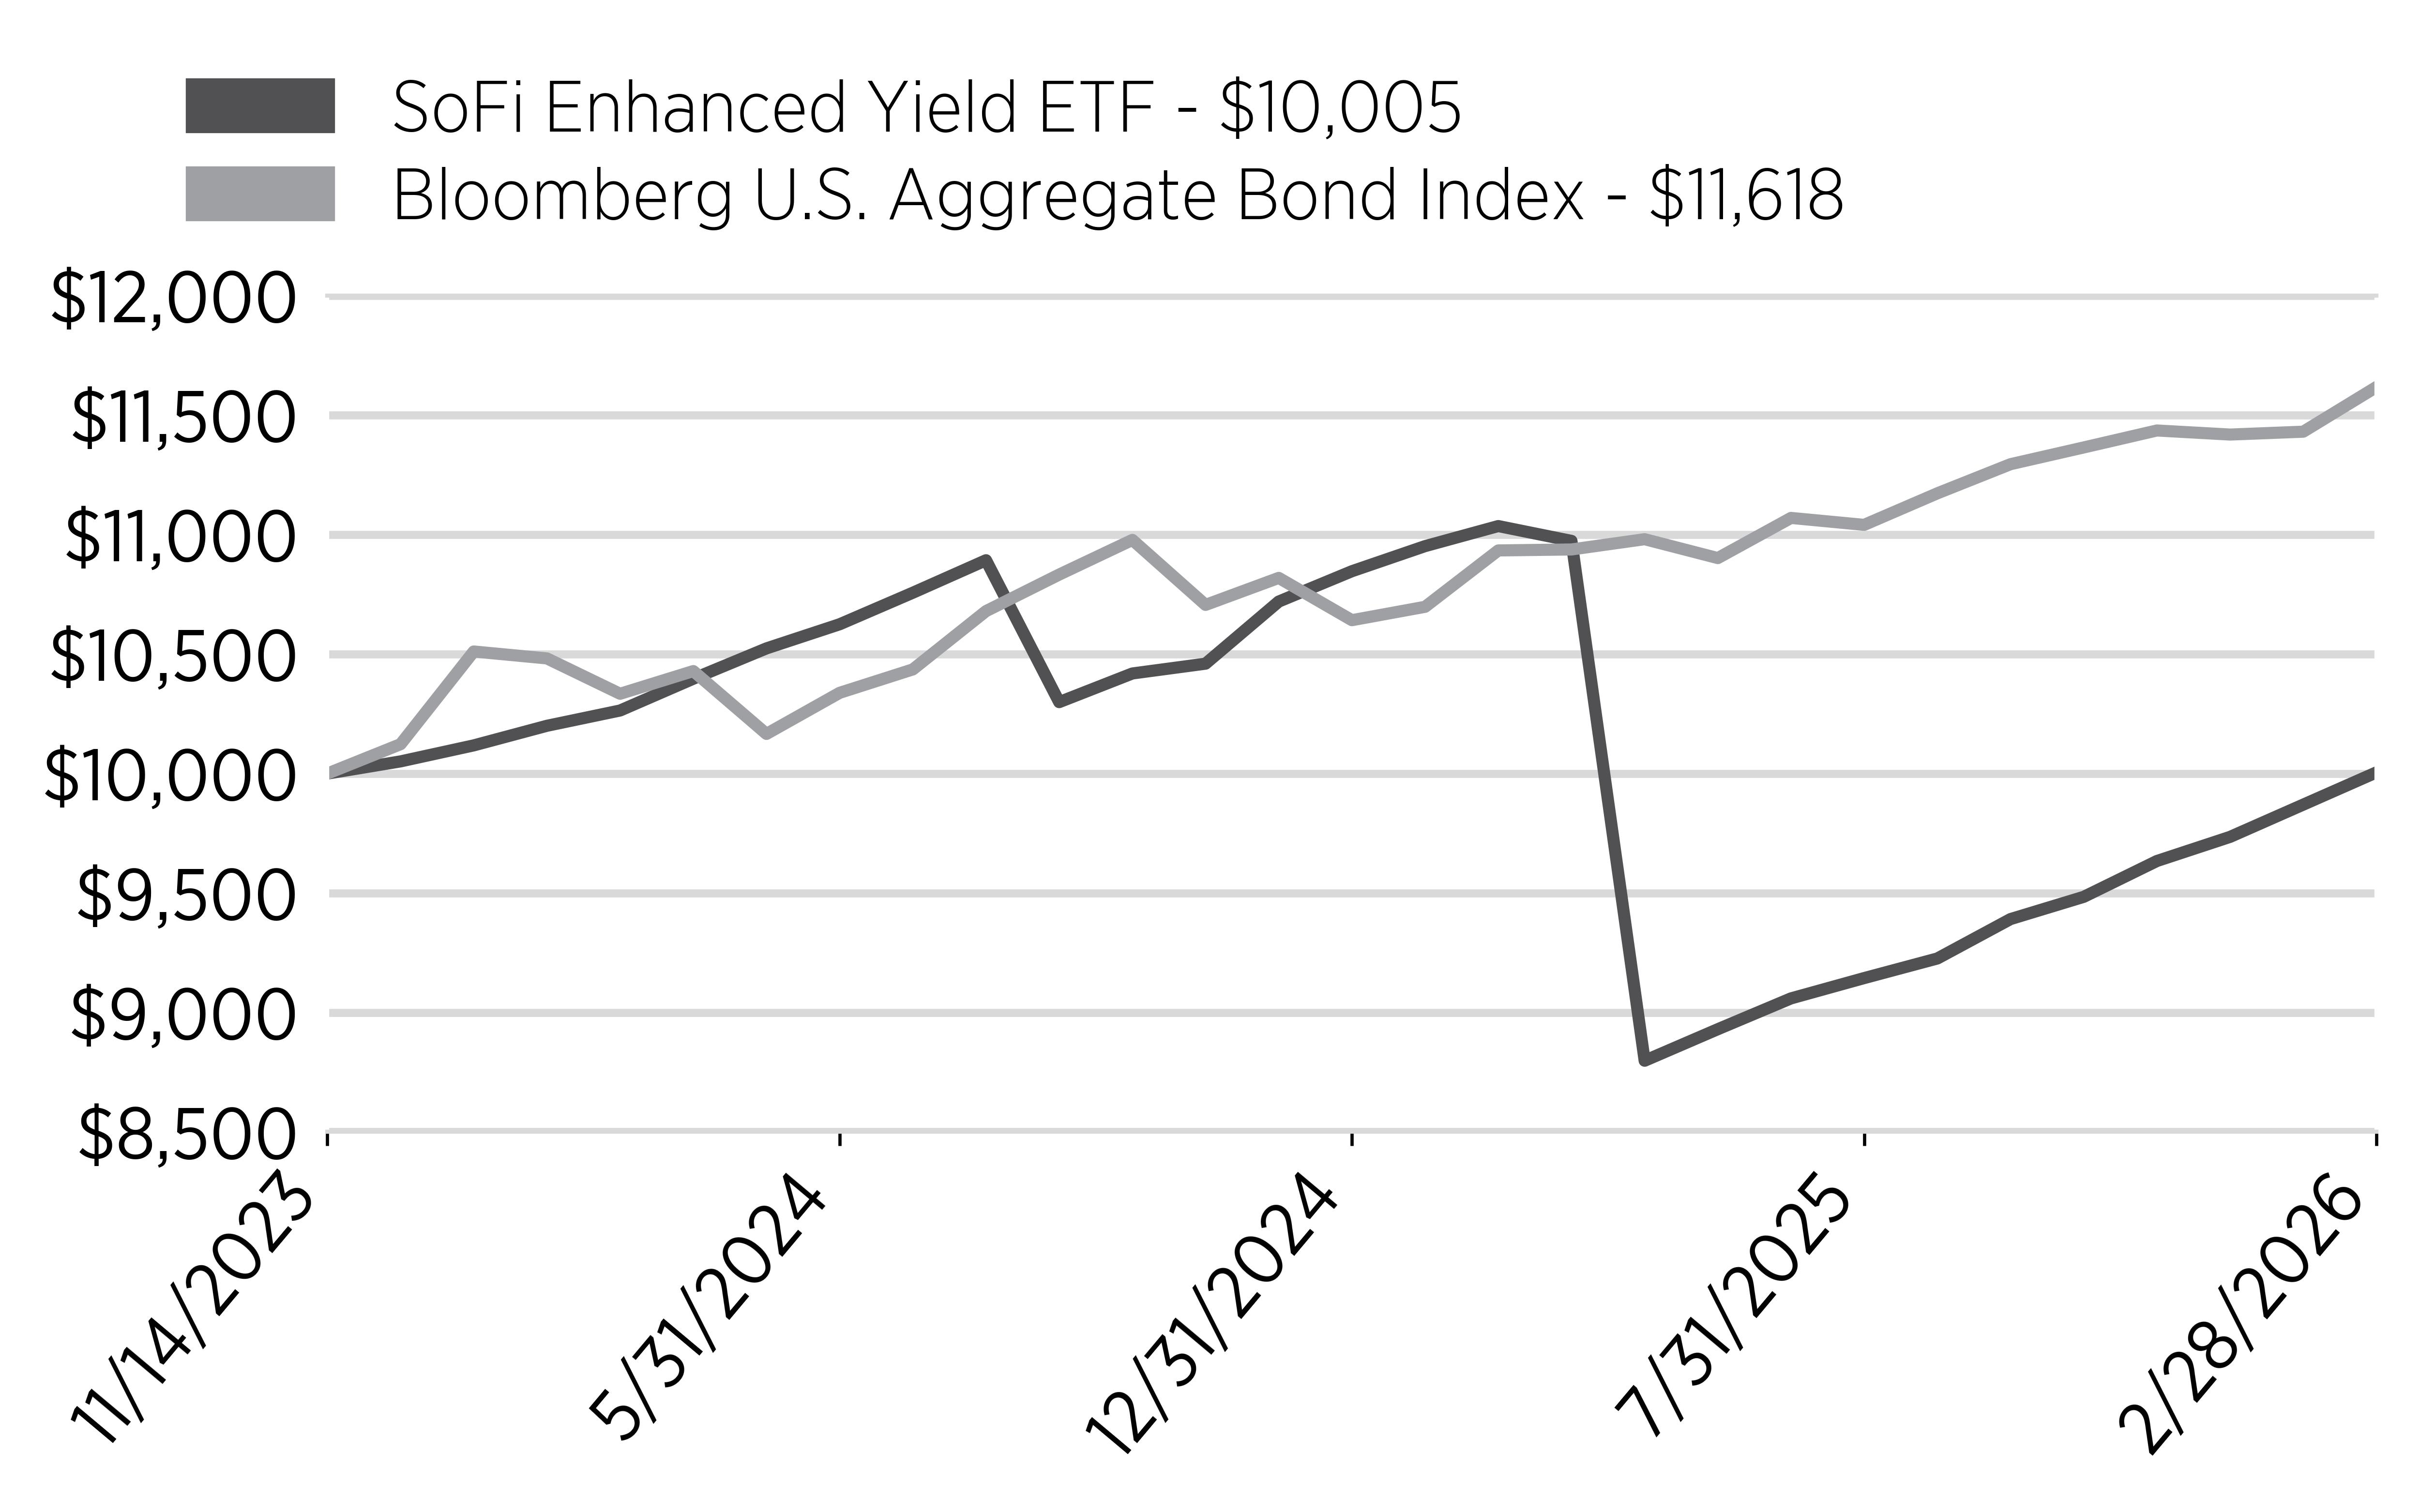
During the fiscal year ended February 28, 2026, fixed income markets faced a mixed but ultimately constructive backdrop. While the Federal Reserve continued its transition toward lower interest rates, market sentiment shifted throughout the year in response to changing growth expectations, inflation concerns, and bouts of market volatility. U.S. Treasuries experienced a sharp selloff in the spring of 2025, but later recovered as investors sought higher-quality fixed income exposure and yields declined into the end of the period. Corporate credit spreads generally remained relatively tight, which supported returns across much of the taxable bond market. Against this backdrop, the Fund’s Treasury holdings provided income and some support later in the year, but the option overlay portion of the strategy was negatively affected by sudden equity-market declines and elevated volatility, which created a challenging environment for credit spread positions. As a result, for the fiscal year ended February 28, 2026, the Fund returned -9.34%, compared with 6.26% for the Bloomberg U.S. Aggregate Bond Index.
What factors influenced performance?
Detractors from performance included certain options positions, notably the SPXW 04/25/25 5000 put, and the SPXW 05/02/25 4700 put, reflecting the Fund's active management of credit spreads in response to market volatility. The Fund's drawdown occurred after President Trump's "Liberation Day" tariffs, in response to the S&P 500 Index dropping approximately 14% during that period of adjustment.
Cumulative Performance
(Initial Investment of $10,000)
Annual Performance
|
Average Annual Returns for the Periods Ended February 28, 2026 |
1 Year |
Since Inception (11/14/2023) |
|---|---|---|
|
SoFi Enhanced Yield ETF |
-9.34% |
0.02% |
|
Bloomberg U.S. Aggregate Bond Index |
6.26% |
6.77% |
Key Fund Statistics
(as of February 28, 2026)
|
Fund Size (Thousands) |
$37,526 |
|
Number of Holdings |
11 |
|
Total Advisory Fee Paid |
$182,851 |
|
Portfolio Turnover Rate |
0% |
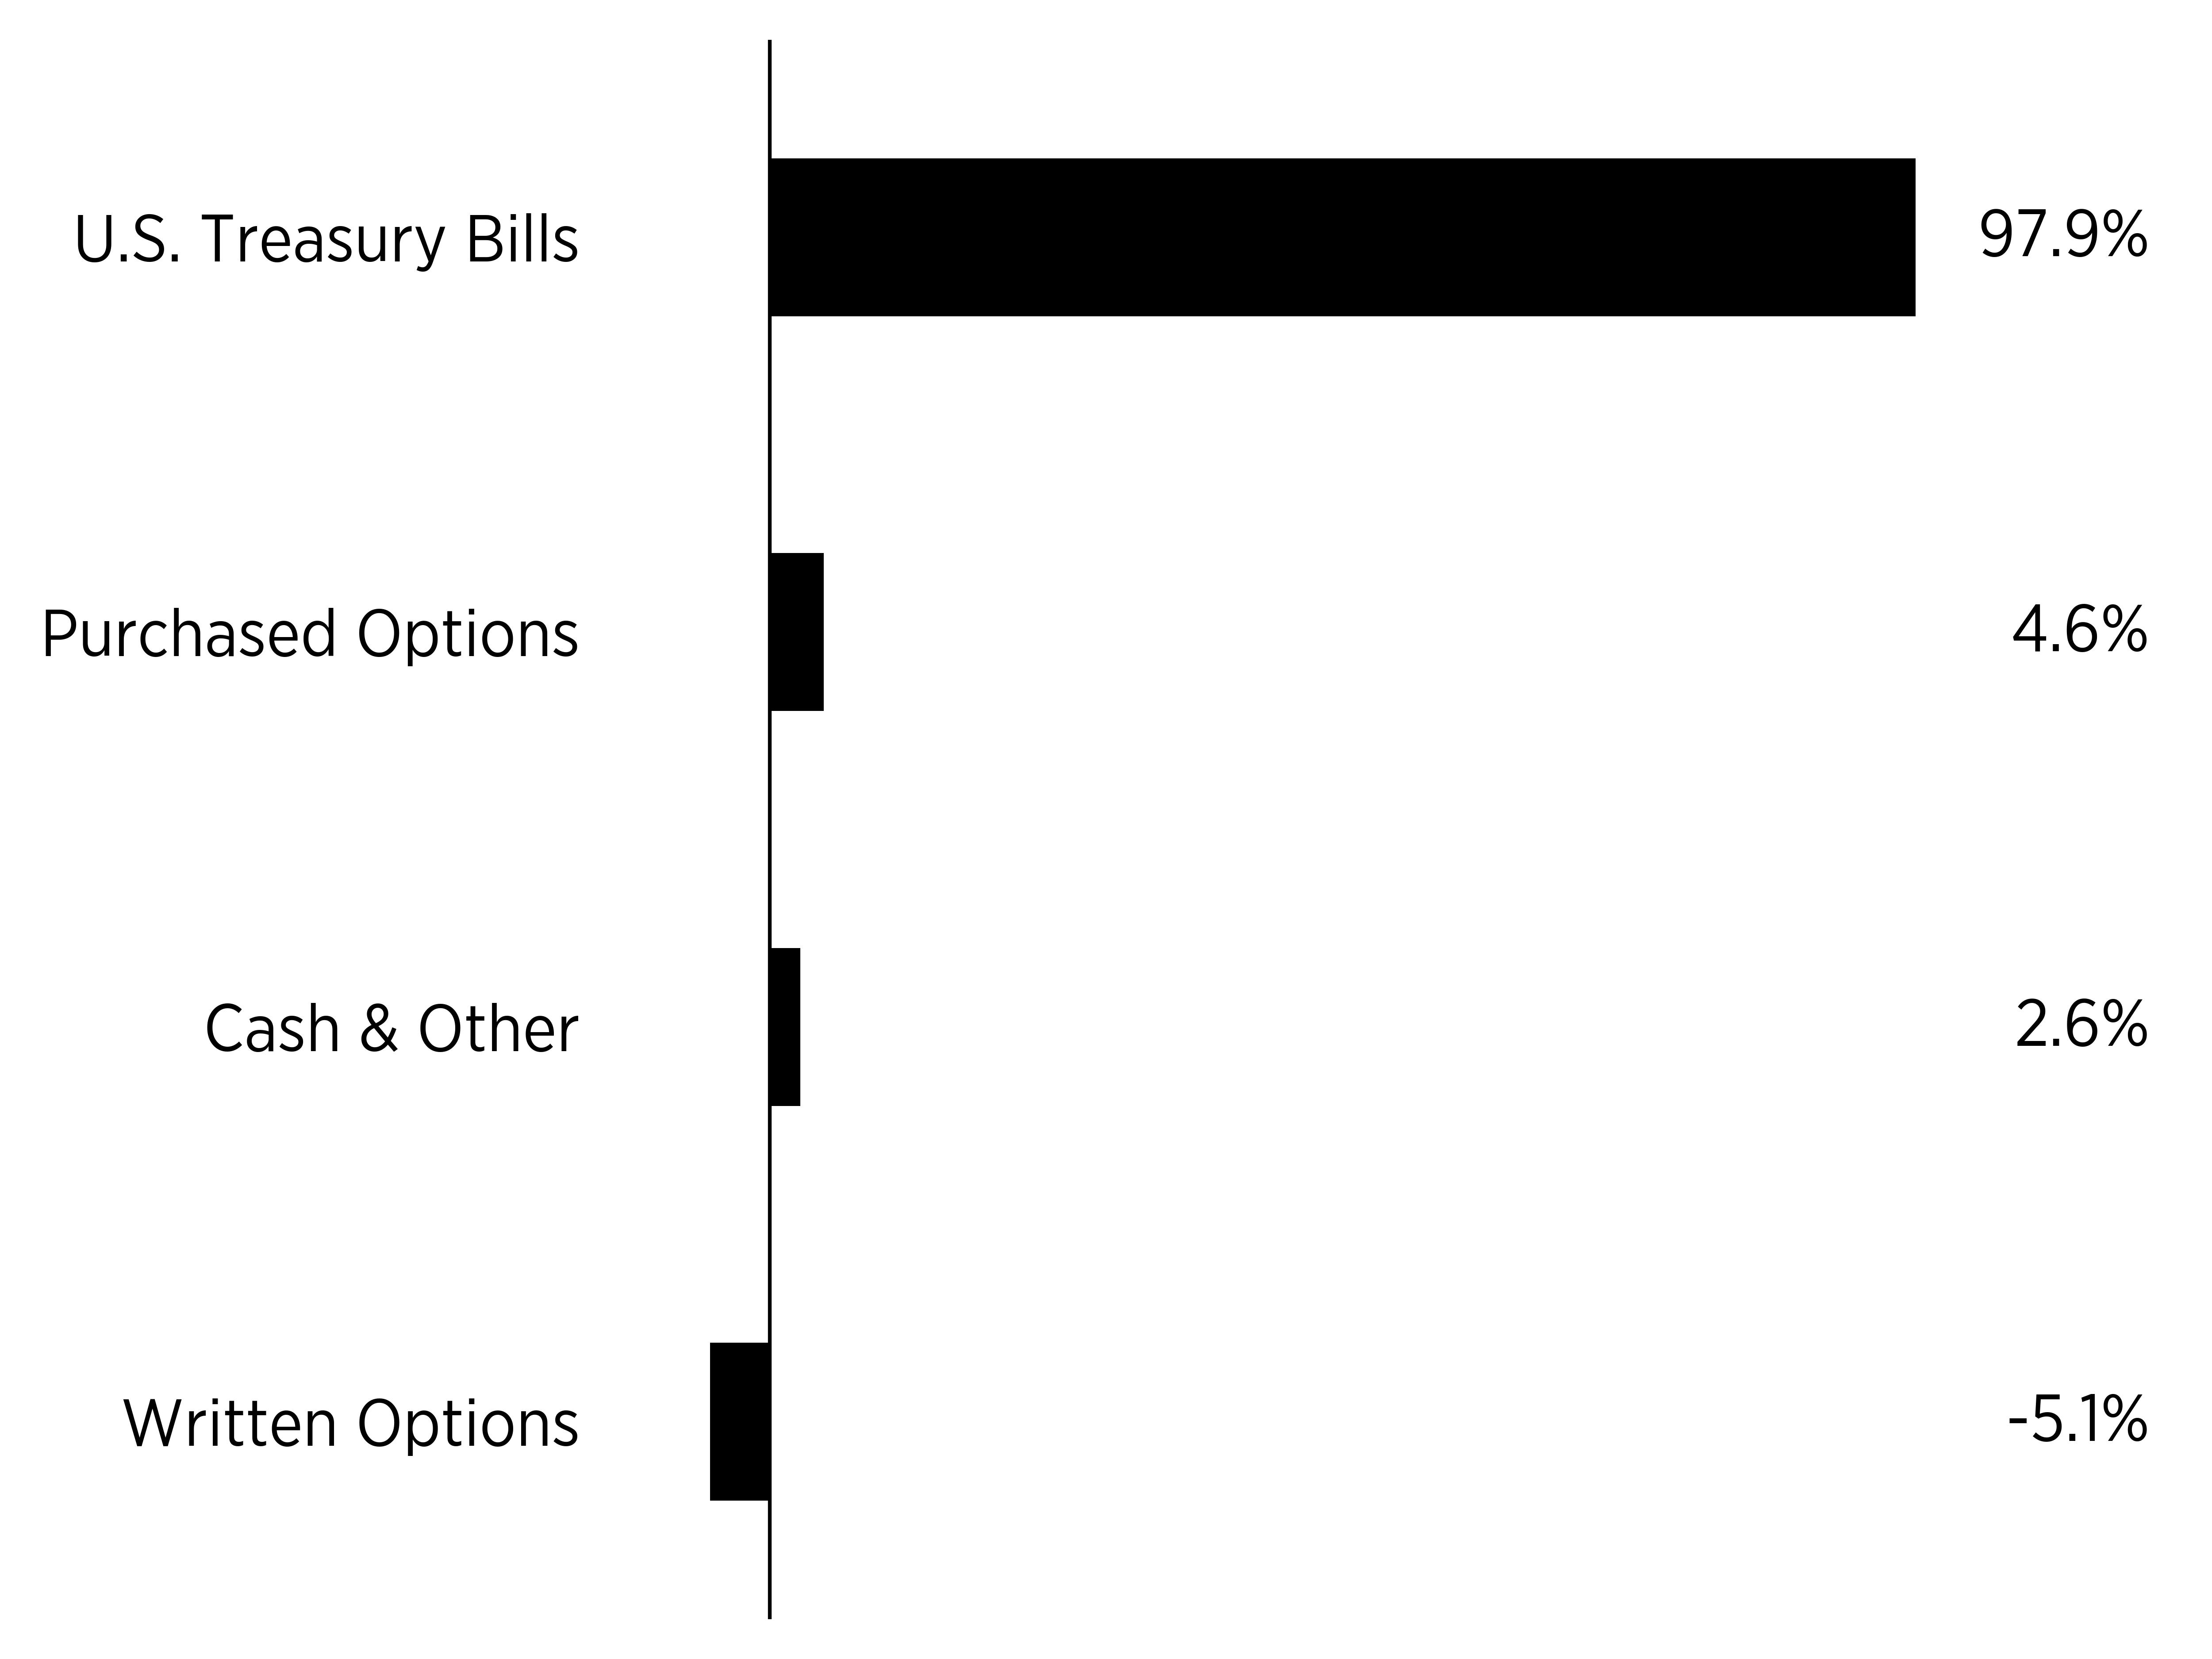
What did the Fund invest in?
(as of February 28, 2026)
Security Breakdown
(% of total net assets)
|
Top Ten Holdings |
(% of total net assets) |
|---|---|
|
United States Treasury Bill - 3.48%,
07/09/2026 |
|
|
United States Treasury Bill - 3.63%,
05/12/2026 |
|
|
United States Treasury Bill - 3.61%,
06/11/2026 |
|
|
United States Treasury Bill - 3.54%,
09/03/2026 |
|
|
United States Treasury Bill - 3.64%,
04/09/2026 |
|
|
United States Treasury Bill - 3.53%,
08/06/2026 |
|
|
S&P 500 Index,
Expiration: 03/27/2026;
Exercise Price: $5,500.00 |
|
|
S&P 500 Index,
Expiration: 03/27/2026;
Exercise Price: $7,450.00 |
|
|
S&P 500 Index,
Expiration: 03/27/2026;
Exercise Price: $7,400.00 |
|
|
S&P 500 Index,
Expiration: 03/27/2026;
Exercise Price: $5,550.00 |
How has the Fund Changed?
Effective August 1, 2025, U.S. Bancorp Fund Services, LLC, doing business as Global Fund Services, no longer serves as the Sub‑Administrator for each series of Tidal Trust I, including the Fund.
What were the Fund costs for the past year?
(based on a hypothetical $10,000 investment)
|
Fund Name |
Costs of a $10,000 investment |
Costs paid as a percentage of a $10,000 investment |
|---|---|---|
|
SoFi Select 500 ETF |
$6 |
0.05% |
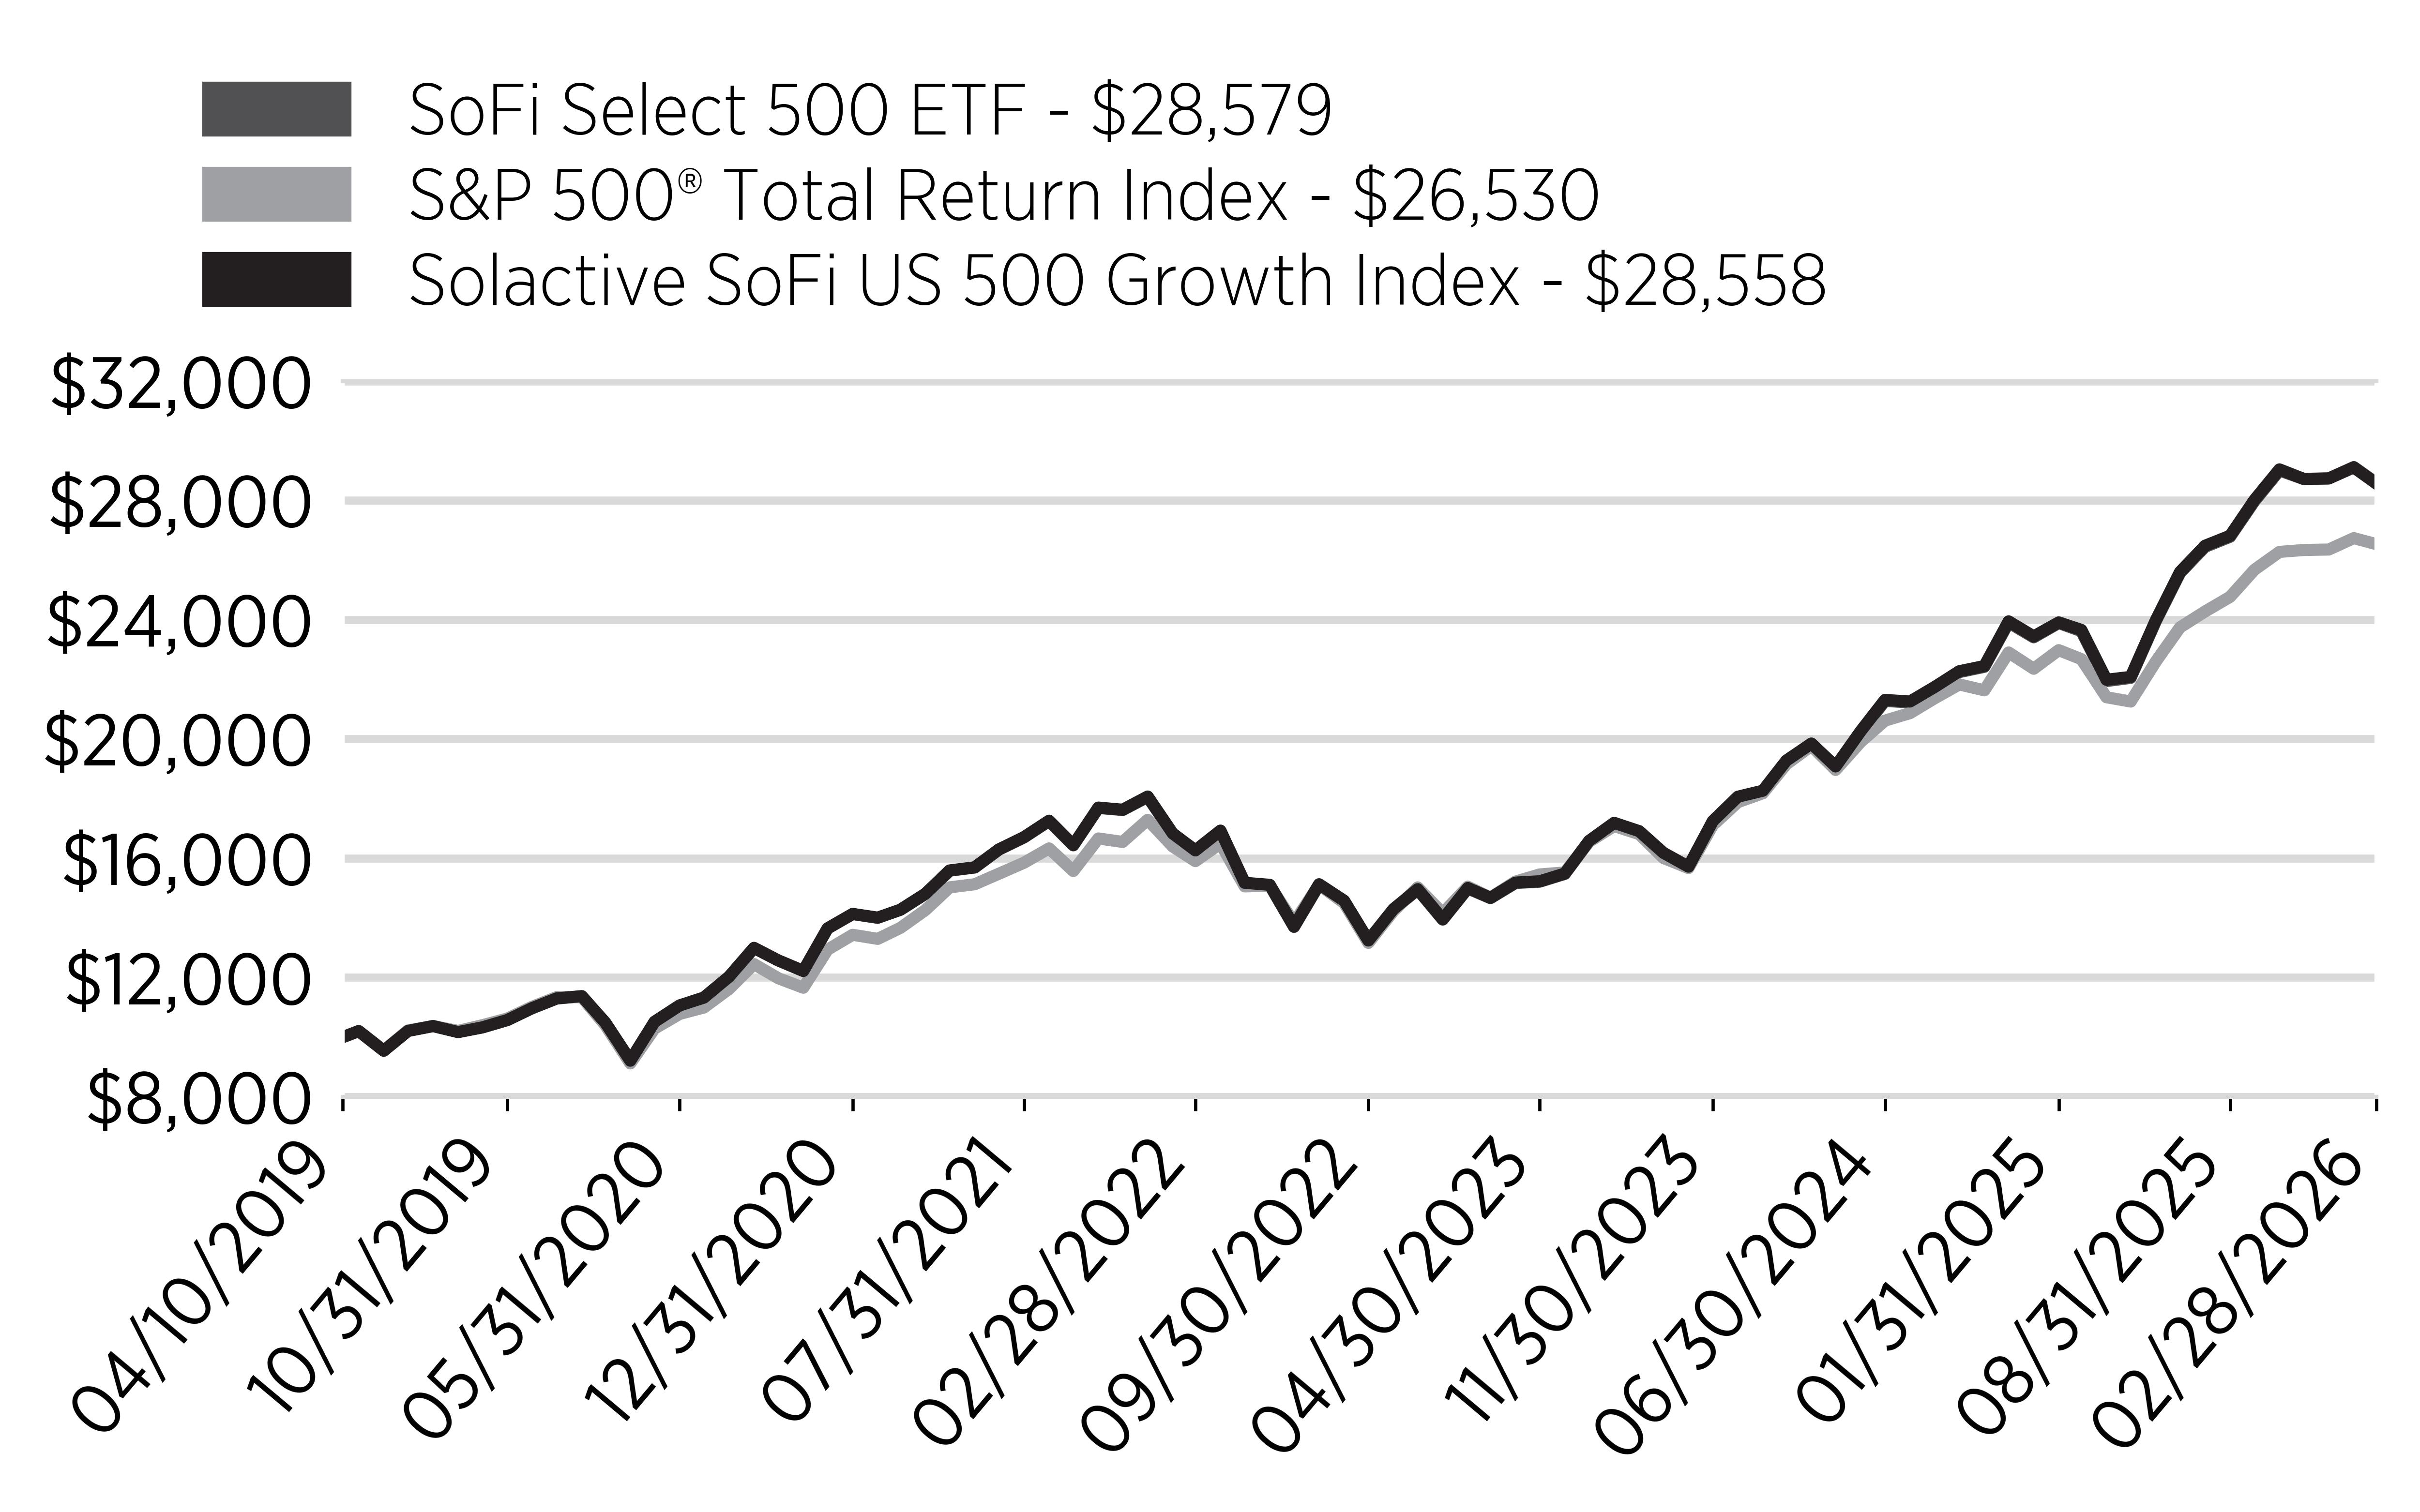
How did the Fund perform last year and what affected its performance?
For the fiscal year ended February 28, 2026, U.S. financial markets posted positive returns, supported by solid corporate earnings, continued artificial intelligence ("AI")-related investment, and moderating inflation. However, market conditions became more volatile later in the period as investors responded to shifting interest-rate expectations, tariff-related uncertainty, and changing leadership within large-cap equities.
For the fiscal year ended February 28, 2026, the Fund returned 21.02%. This closely tracked the 20.72% total return of the Solactive SoFi US 500 Growth Index (“SFY Index”), the Fund’s underlying index. In comparison, the S&P 500® Total Return Index, a broad market benchmark, gained 16.99% over the same period. Equity returns were supported by continued strength in growth-oriented sectors, especially information technology and communication services, as investors favored companies with strong earnings momentum and exposure to AI-related spending trends. While market breadth improved at times, performance leadership remained concentrated for much of the period, which benefited the Fund’s growth tilt relative to the broader market.
What factors influenced performance?
Sector performance attribution showed that the Information Technology and Communication Services sectors were the largest contributors to the Fund’s returns, while the Financials and Real Estate sectors contributed less favorably to performance.
Cumulative Performance
(Initial Investment of $10,000)
Annual Performance
|
Average Annual Returns for the Periods Ended February 28, 2026 |
1 Year |
5 Years |
Since Inception 4/10/2019 |
|---|---|---|---|
|
SoFi Select 500 ETF |
21.02% |
14.90% |
16.47% |
|
S&P 500® Total Return Index |
16.99% |
14.19% |
15.22% |
|
Solactive SoFi US 500 Growth Index |
20.72% |
14.88% |
16.46% |
Key Fund Statistics
(as of February 28, 2026)
|
Fund Size (Thousands) |
$578,251 |
|
Number of Holdings |
506 |
|
Net Advisory Fee Paid |
$260,284 |
|
Portfolio Turnover Rate |
15% |
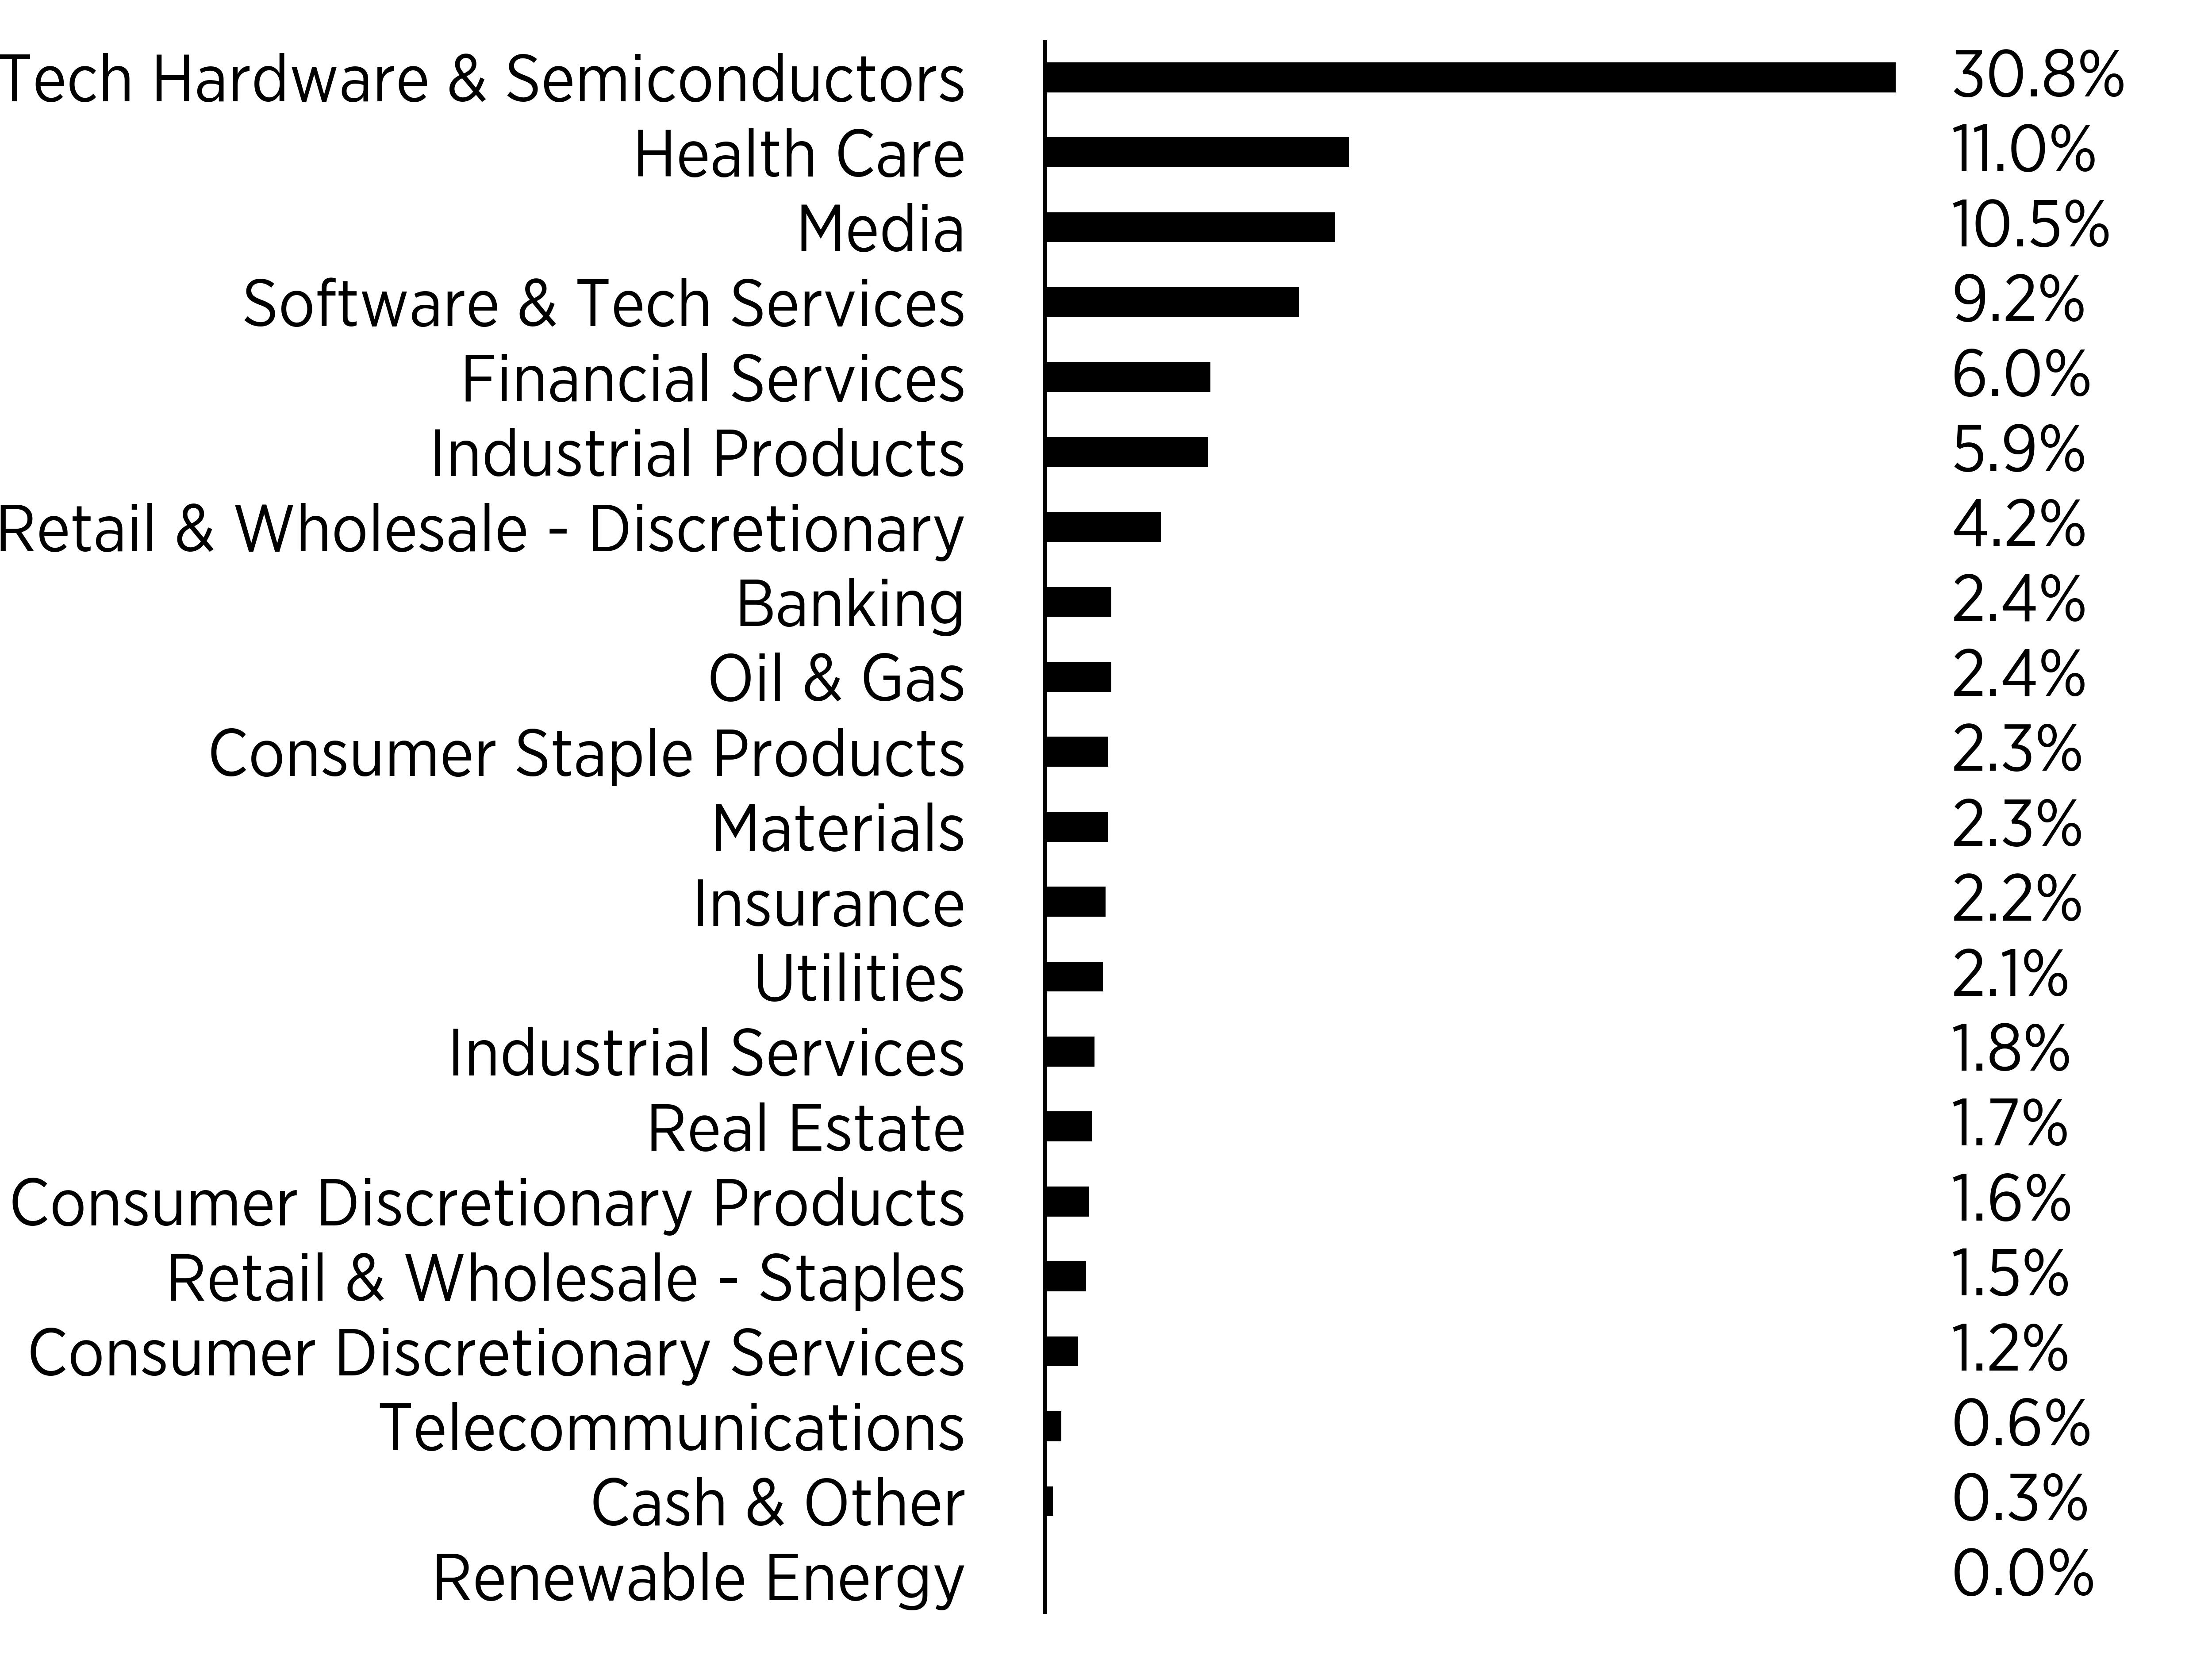
What did the Fund invest in?
(as of February 28, 2026)
Sector Breakdown
(% of total net assets)
|
Top Ten Holdings |
(% of total net assets) |
|---|---|
|
NVIDIA Corp. |
|
|
Broadcom, Inc. |
|
|
Microsoft Corp. |
|
|
Apple, Inc. |
|
|
Meta Platforms, Inc. |
|
|
Amazon.com, Inc. |
|
|
Alphabet, Inc. |
|
|
Micron Technology, Inc. |
|
|
Eli Lilly & Co. |
|
|
Alphabet, Inc. |
How has the Fund Changed?
Effective August 1, 2025, U.S. Bancorp Fund Services, LLC, doing business as Global Fund Services, no longer serves as the Sub‑Administrator for each series of Tidal Trust I, including the Fund.
What were the Fund costs for the past year?
(based on a hypothetical $10,000 investment)
|
Fund Name |
Costs of a $10,000 investment |
Costs paid as a percentage of a $10,000 investment |
|---|---|---|
|
SoFi Social 50 ETF |
$33 |
0.29% |
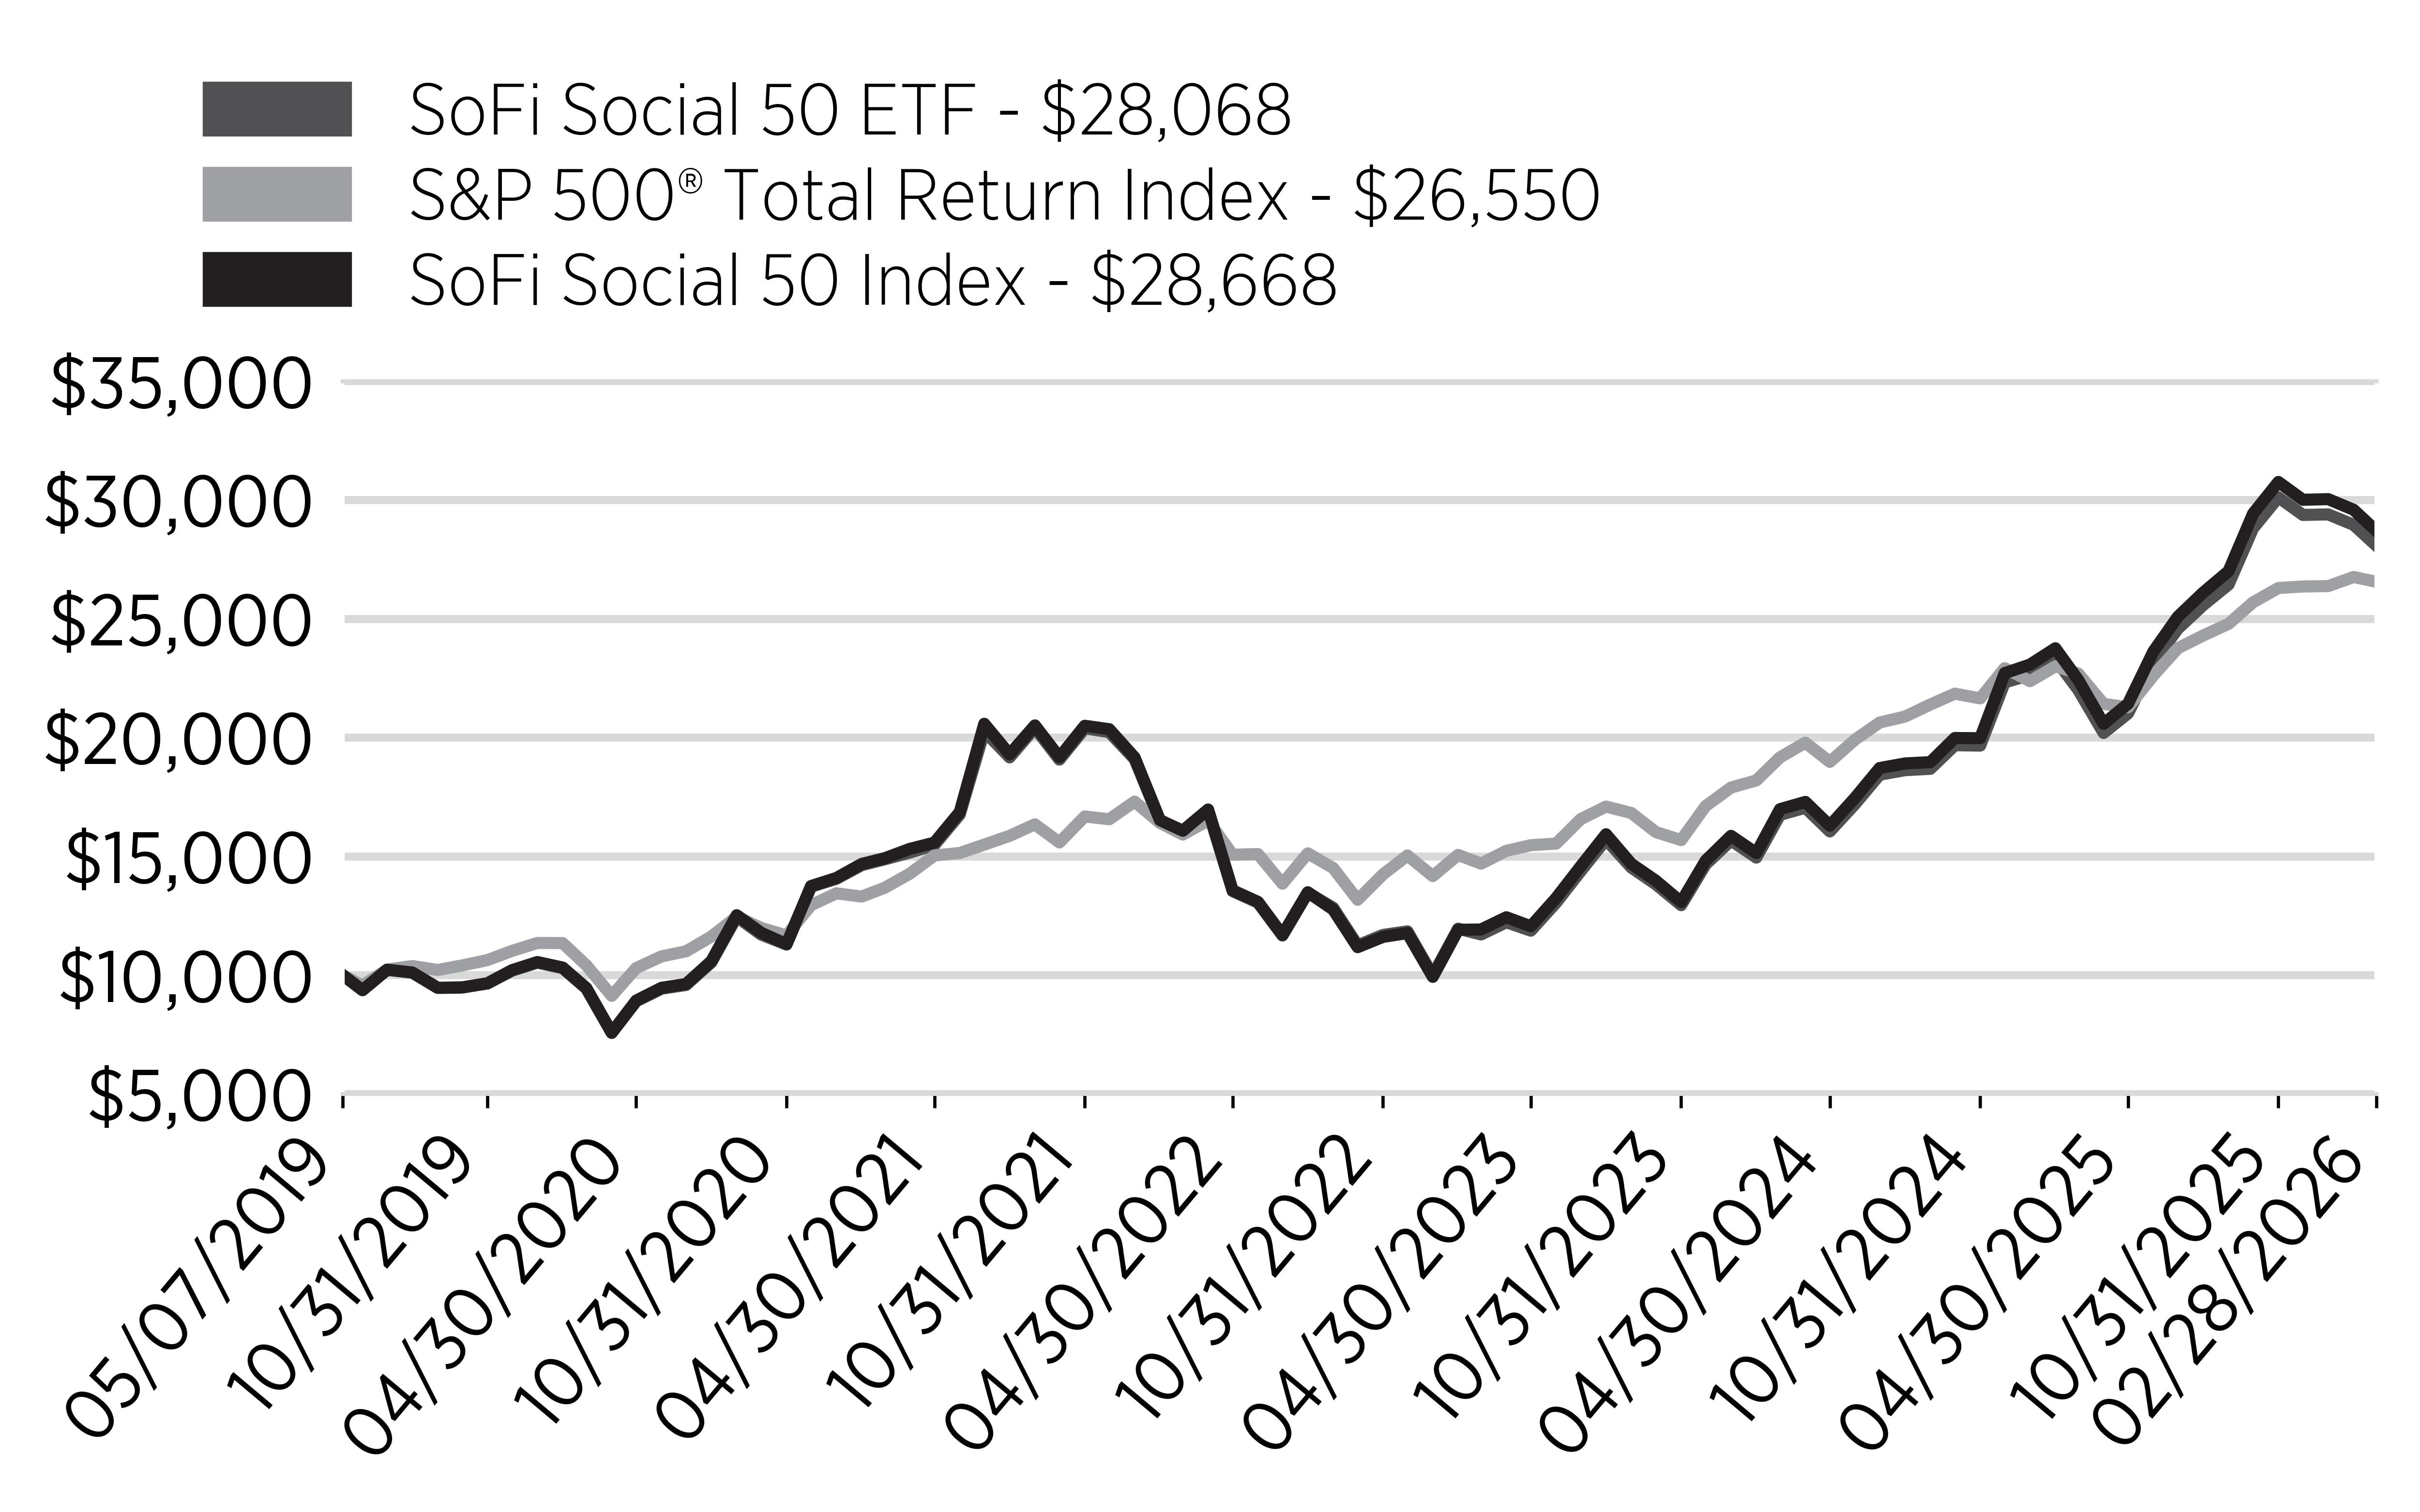
How did the Fund perform last year and what affected its performance?
For the fiscal year ended February 28, 2026, U.S. equity markets generated strong returns, supported by continued earnings growth, ongoing artificial intelligence ("AI")-related capital spending, and moderating inflation. Market conditions remained constructive for much of the period, aided by a relatively stable interest-rate backdrop, although volatility increased at times as investors weighed trade-policy developments, valuation levels, and the sustainability of AI-driven growth expectations.
For the fiscal year ended February 28, 2026, the Fund returned 27.55%, compared with 27.94% for the SoFi Social 50 index (the "SFYF Index"), the Fund's underlying index, and 16.99% for the S&P 500® Total Return Index. The Fund’s performance reflected the strength of large-cap growth stocks, particularly technology and internet-related companies that benefited from strong earnings results and continued investor interest in AI-related themes. While these exposures supported returns, they also contributed to periods of volatility as markets periodically pulled back on concerns about trade policy, valuation, inflation, and the timing of future monetary easing.
What factors influenced performance?
Sector performance attribution showed that Information Technology and Consumer Discretionary were the largest contributors to the Fund’s returns, driven in part by strong performance from several large technology-oriented holdings. The Financials sector detracted from performance.
Cumulative Performance
(Initial Investment of $10,000)
Annual Performance
|
Average Annual Returns for the Periods Ended February 28, 2026 |
1 Year |
5 Years |
Since Inception (5/7/2019) |
|---|---|---|---|
|
SoFi Social 50 ETF |
27.55% |
13.54% |
16.35% |
|
S&P 500® Total Return Index |
16.99% |
14.19% |
15.41% |
|
SoFi Social 50 Index |
27.94% |
13.97% |
16.73% |
Key Fund Statistics
(as of February 28, 2026)
|
Fund Size (Thousands) |
$35,714 |
|
Number of Holdings |
52 |
|
Total Advisory Fee Paid |
$93,551 |
|
Portfolio Turnover Rate |
51% |
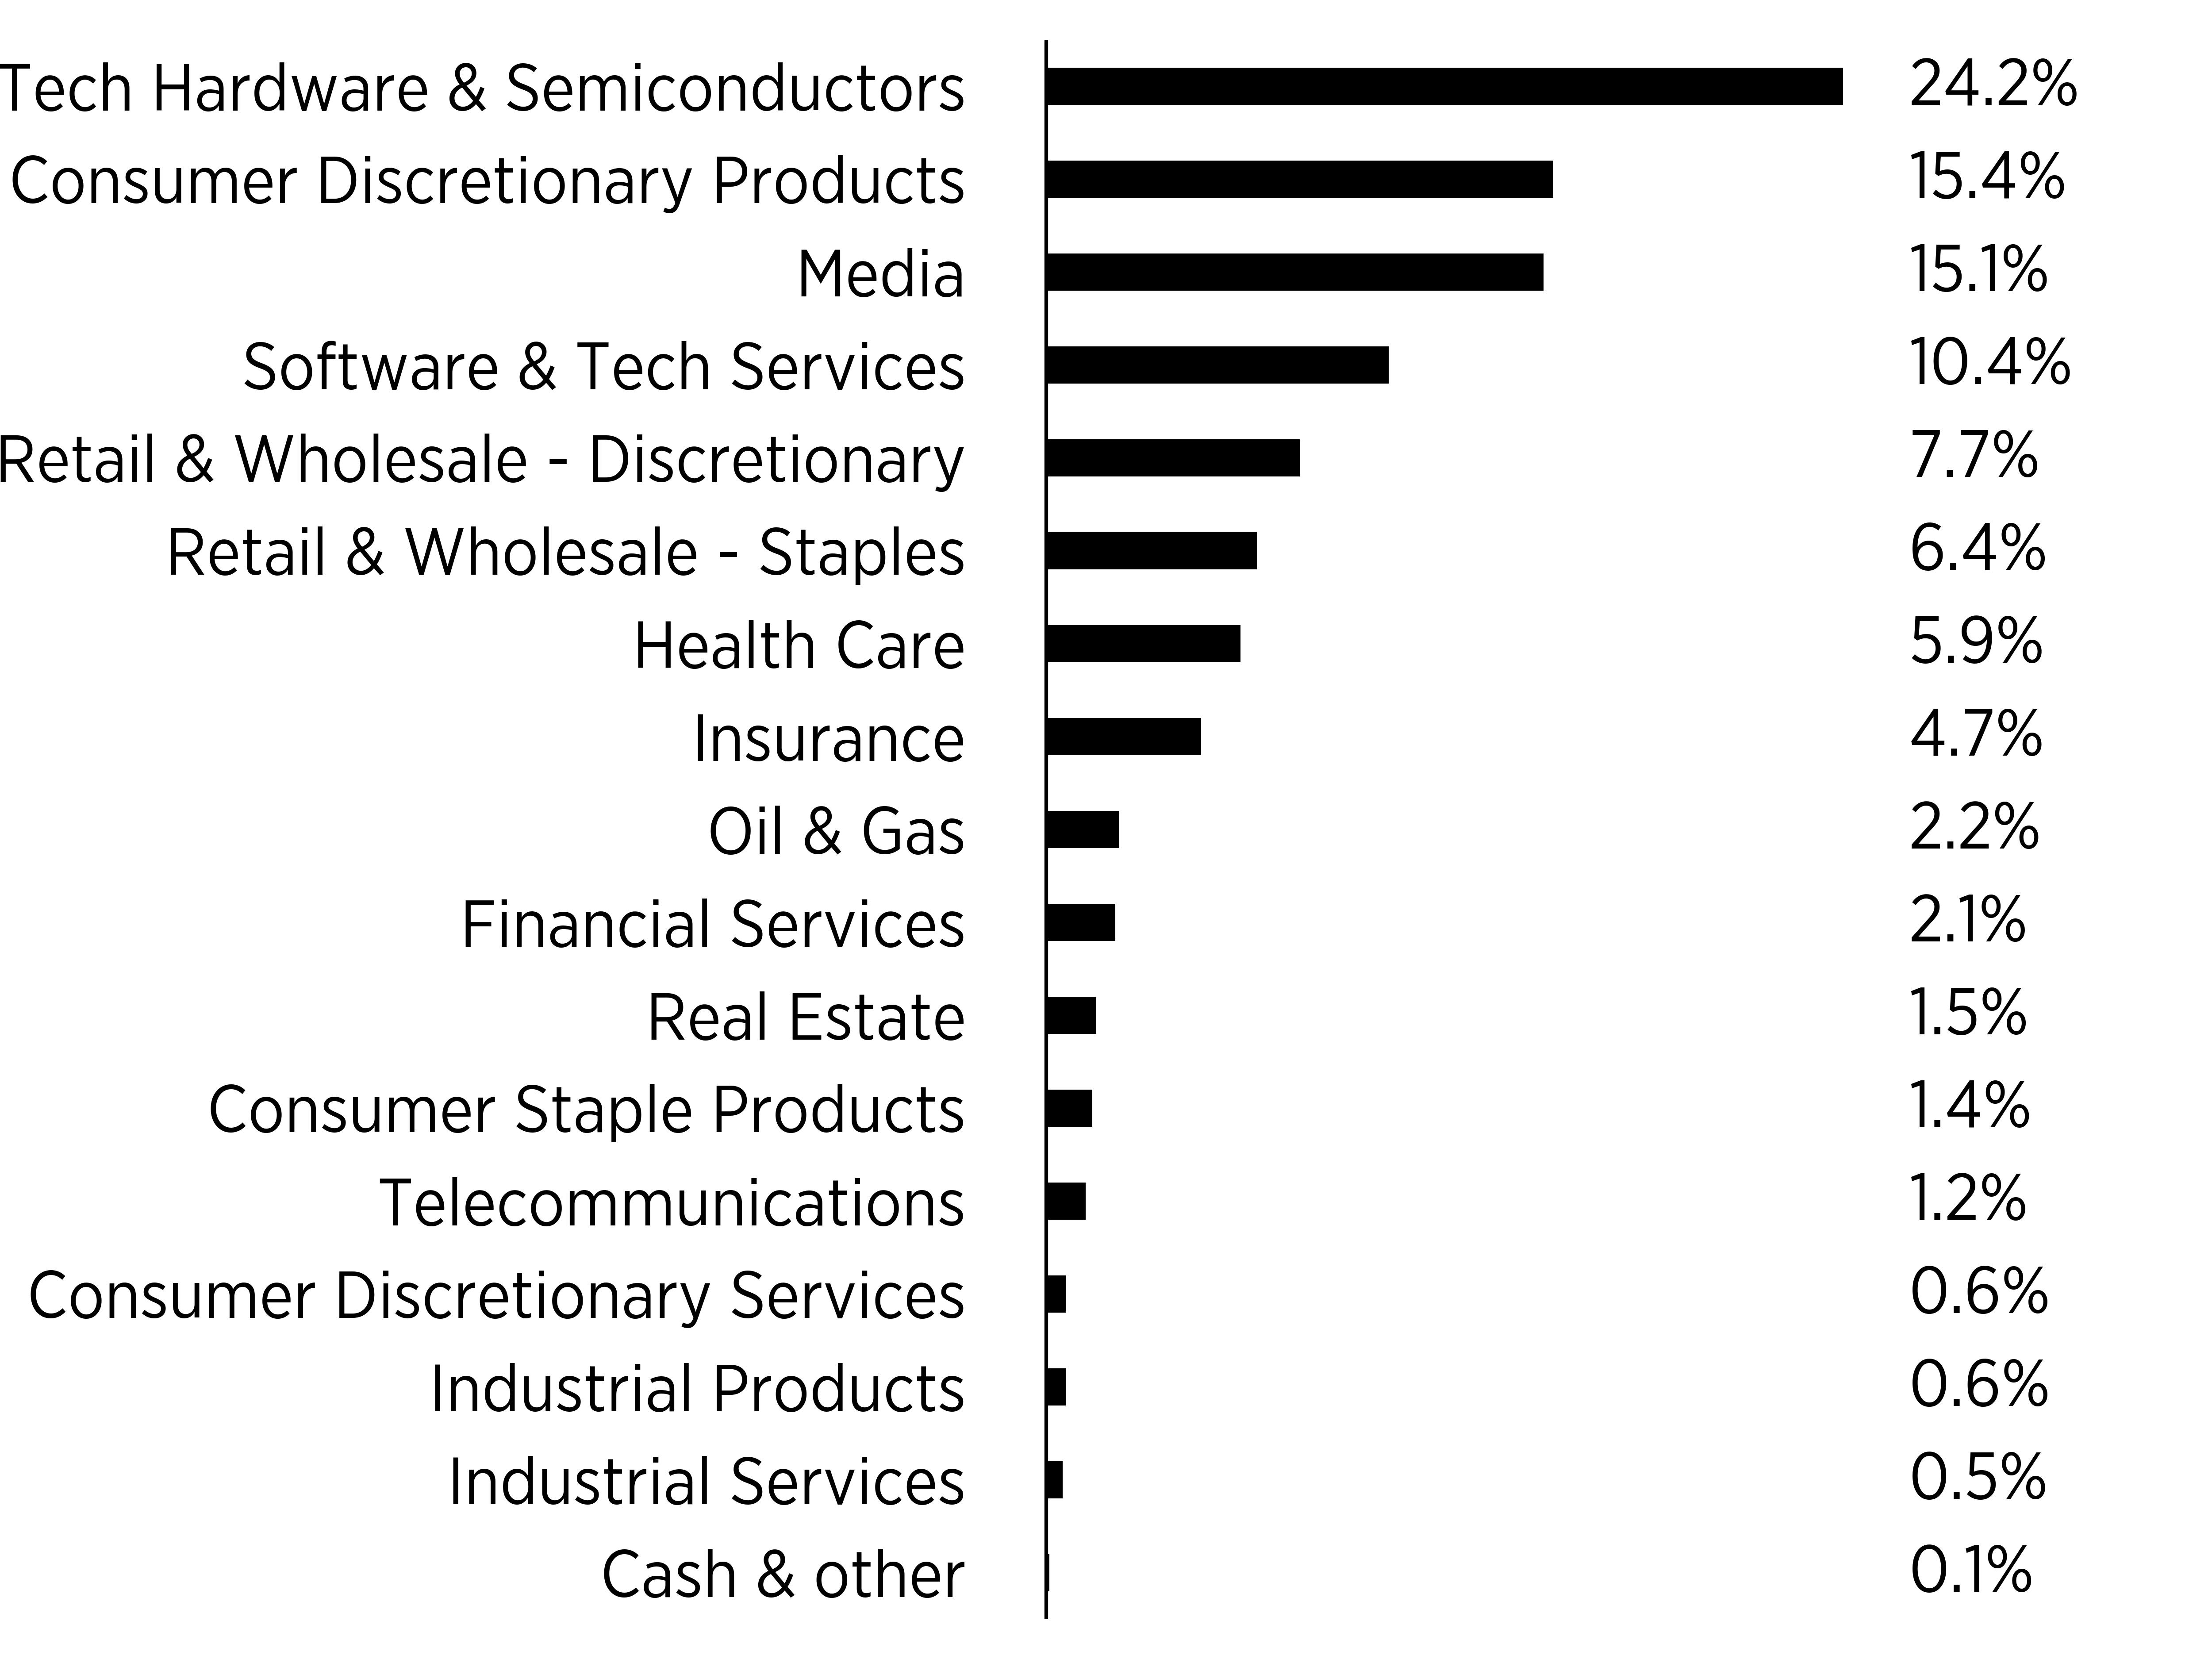
What did the Fund invest in?
(as of February 28, 2026)
Sector Breakdown
(% of total net assets)
|
Top Ten Holdings |
(% of total net assets) |
|---|---|
|
Tesla Inc |
|
|
NVIDIA Corp |
|
|
Amazon.com Inc |
|
|
Berkshire Hathaway Inc |
|
|
Apple Inc |
|
|
Palantir Technologies Inc |
|
|
Alphabet Inc |
|
|
Microsoft Corp |
|
|
Meta Platforms Inc |
|
|
Costco Wholesale Corp |
How has the Fund Changed?
Effective August 1, 2025, U.S. Bancorp Fund Services, LLC, doing business as Global Fund Services, no longer serves as the Sub‑Administrator for each series of Tidal Trust I, including the Fund.
| [1] | The Fund commenced operations on September 2, 2025. Expenses for a full reporting period would be higher than figures shown. |
| [2] | Cost paid as a percentage of a $10,000 investment is an annualized figure. |