false
0001027596
N-1A
0001027596
tsr:C000138962Member
2025-03-01
2026-02-28
0001027596
tsr:bench20260501112284_6782Member
2025-03-01
2026-02-28
0001027596
tsr:benchmark286613198_6782Member
2025-03-01
2026-02-28
0001027596
tsr:C000138962Member
2026-02-28
0001027596
tsr:C000138962Member
tsr:bench2025033195249_6782Member
2026-02-28
0001027596
tsr:C000138962Member
tsr:bench2024090550303_6782Member
2026-02-28
0001027596
tsr:C000138962Member
country:US
2026-02-28
0001027596
tsr:C000138962Member
tsr:bench2024090550353_6782Member
2026-02-28
0001027596
tsr:C000138962Member
tsr:bench2024090550306_6782Member
2026-02-28
0001027596
tsr:C000138962Member
country:CA
2026-02-28
0001027596
tsr:C000138962Member
tsr:bench2024090550355_6782Member
2026-02-28
0001027596
tsr:C000138962Member
tsr:bench2024090550322_6782Member
2026-02-28
0001027596
tsr:C000138962Member
country:IE
2026-02-28
0001027596
tsr:C000138962Member
tsr:bench20251003102318_6782Member
2026-02-28
0001027596
tsr:C000138962Member
tsr:bench2024090550302_6782Member
2026-02-28
0001027596
tsr:C000138962Member
country:DE
2026-02-28
0001027596
tsr:C000138962Member
tsr:bench2024090550356_6782Member
2026-02-28
0001027596
tsr:C000138962Member
tsr:bench2025042497373_6782Member
2026-02-28
0001027596
tsr:C000138962Member
tsr:bench2024103181494_6782Member
2026-02-28
0001027596
tsr:C000138962Member
tsr:bench20260401111367_6782Member
2026-02-28
0001027596
tsr:C000138962Member
tsr:bench2025042497374_6782Member
2026-02-28
0001027596
tsr:C000138962Member
tsr:bench2025033195257_6782Member
2026-02-28
0001027596
tsr:C000138962Member
tsr:bench2024090550305_6782Member
2026-02-28
0001027596
tsr:C000138962Member
tsr:bench2024092450999_6782Member
2026-02-28
0001027596
tsr:C000138962Member
tsr:bench2024090550323_6782Member
2026-02-28
0001027596
tsr:C000138962Member
tsr:bench2025033195261_6782Member
2026-02-28
0001027596
tsr:C000138962Member
tsr:bench2024090550311_6782Member
2026-02-28
0001027596
tsr:C000138962Member
tsr:bench20260401111368_6782Member
2026-02-28
0001027596
tsr:C000138962Member
2021-03-01
2026-02-28
0001027596
tsr:bench20260501112284_6782Member
2021-03-01
2026-02-28
0001027596
tsr:benchmark286613198_6782Member
2021-03-01
2026-02-28
0001027596
tsr:C000138962Member
2016-02-29
2026-02-28
0001027596
tsr:bench20260501112284_6782Member
2016-02-29
2026-02-28
0001027596
tsr:benchmark286613198_6782Member
2016-02-29
2026-02-28
0001027596
tsr:C000138962Member
2016-02-29
2016-02-29
0001027596
tsr:bench20260501112284_6782Member
2016-02-29
2016-02-29
0001027596
tsr:benchmark286613198_6782Member
2016-02-29
2016-02-29
0001027596
tsr:C000138962Member
2017-02-28
2017-02-28
0001027596
tsr:bench20260501112284_6782Member
2017-02-28
2017-02-28
0001027596
tsr:benchmark286613198_6782Member
2017-02-28
2017-02-28
0001027596
tsr:C000138962Member
2018-02-28
2018-02-28
0001027596
tsr:bench20260501112284_6782Member
2018-02-28
2018-02-28
0001027596
tsr:benchmark286613198_6782Member
2018-02-28
2018-02-28
0001027596
tsr:C000138962Member
2019-02-28
2019-02-28
0001027596
tsr:bench20260501112284_6782Member
2019-02-28
2019-02-28
0001027596
tsr:benchmark286613198_6782Member
2019-02-28
2019-02-28
0001027596
tsr:C000138962Member
2020-02-29
2020-02-29
0001027596
tsr:bench20260501112284_6782Member
2020-02-29
2020-02-29
0001027596
tsr:benchmark286613198_6782Member
2020-02-29
2020-02-29
0001027596
tsr:C000138962Member
2021-02-28
2021-02-28
0001027596
tsr:bench20260501112284_6782Member
2021-02-28
2021-02-28
0001027596
tsr:benchmark286613198_6782Member
2021-02-28
2021-02-28
0001027596
tsr:C000138962Member
2022-02-28
2022-02-28
0001027596
tsr:bench20260501112284_6782Member
2022-02-28
2022-02-28
0001027596
tsr:benchmark286613198_6782Member
2022-02-28
2022-02-28
0001027596
tsr:C000138962Member
2023-02-28
2023-02-28
0001027596
tsr:bench20260501112284_6782Member
2023-02-28
2023-02-28
0001027596
tsr:benchmark286613198_6782Member
2023-02-28
2023-02-28
0001027596
tsr:C000138962Member
2024-02-29
2024-02-29
0001027596
tsr:bench20260501112284_6782Member
2024-02-29
2024-02-29
0001027596
tsr:benchmark286613198_6782Member
2024-02-29
2024-02-29
0001027596
tsr:C000138962Member
2025-02-28
2025-02-28
0001027596
tsr:bench20260501112284_6782Member
2025-02-28
2025-02-28
0001027596
tsr:benchmark286613198_6782Member
2025-02-28
2025-02-28
0001027596
2025-03-01
2026-02-28
tsr:Years
iso4217:USD
xbrli:pure
xbrli:shares
iso4217:USD
xbrli:shares
0001027596
tsr:C000138961Member
2025-03-01
2026-02-28
0001027596
tsr:bench20260501112284_6783Member
2025-03-01
2026-02-28
0001027596
tsr:benchmark286613198_6783Member
2025-03-01
2026-02-28
0001027596
tsr:C000138961Member
2026-02-28
0001027596
tsr:C000138961Member
tsr:bench2025033195249_6783Member
2026-02-28
0001027596
tsr:C000138961Member
tsr:bench2024090550303_6783Member
2026-02-28
0001027596
tsr:C000138961Member
country:US
2026-02-28
0001027596
tsr:C000138961Member
tsr:bench2024090550353_6783Member
2026-02-28
0001027596
tsr:C000138961Member
tsr:bench2024090550306_6783Member
2026-02-28
0001027596
tsr:C000138961Member
country:CA
2026-02-28
0001027596
tsr:C000138961Member
tsr:bench2024090550355_6783Member
2026-02-28
0001027596
tsr:C000138961Member
tsr:bench2024090550322_6783Member
2026-02-28
0001027596
tsr:C000138961Member
country:IE
2026-02-28
0001027596
tsr:C000138961Member
tsr:bench20251003102318_6783Member
2026-02-28
0001027596
tsr:C000138961Member
tsr:bench2024090550302_6783Member
2026-02-28
0001027596
tsr:C000138961Member
country:DE
2026-02-28
0001027596
tsr:C000138961Member
tsr:bench2024090550356_6783Member
2026-02-28
0001027596
tsr:C000138961Member
tsr:bench2025042497373_6783Member
2026-02-28
0001027596
tsr:C000138961Member
tsr:bench2024103181494_6783Member
2026-02-28
0001027596
tsr:C000138961Member
tsr:bench20260401111367_6783Member
2026-02-28
0001027596
tsr:C000138961Member
tsr:bench2025042497374_6783Member
2026-02-28
0001027596
tsr:C000138961Member
tsr:bench2025033195257_6783Member
2026-02-28
0001027596
tsr:C000138961Member
tsr:bench2024090550305_6783Member
2026-02-28
0001027596
tsr:C000138961Member
tsr:bench2024092450999_6783Member
2026-02-28
0001027596
tsr:C000138961Member
tsr:bench2024090550323_6783Member
2026-02-28
0001027596
tsr:C000138961Member
tsr:bench2025033195261_6783Member
2026-02-28
0001027596
tsr:C000138961Member
tsr:bench2024090550311_6783Member
2026-02-28
0001027596
tsr:C000138961Member
tsr:bench20260401111368_6783Member
2026-02-28
0001027596
tsr:C000138961Member
2021-03-01
2026-02-28
0001027596
tsr:bench20260501112284_6783Member
2021-03-01
2026-02-28
0001027596
tsr:benchmark286613198_6783Member
2021-03-01
2026-02-28
0001027596
tsr:C000138961Member
2016-02-29
2026-02-28
0001027596
tsr:bench20260501112284_6783Member
2016-02-29
2026-02-28
0001027596
tsr:benchmark286613198_6783Member
2016-02-29
2026-02-28
0001027596
tsr:C000138961Member
2016-02-29
2016-02-29
0001027596
tsr:bench20260501112284_6783Member
2016-02-29
2016-02-29
0001027596
tsr:benchmark286613198_6783Member
2016-02-29
2016-02-29
0001027596
tsr:C000138961Member
2017-02-28
2017-02-28
0001027596
tsr:bench20260501112284_6783Member
2017-02-28
2017-02-28
0001027596
tsr:benchmark286613198_6783Member
2017-02-28
2017-02-28
0001027596
tsr:C000138961Member
2018-02-28
2018-02-28
0001027596
tsr:bench20260501112284_6783Member
2018-02-28
2018-02-28
0001027596
tsr:benchmark286613198_6783Member
2018-02-28
2018-02-28
0001027596
tsr:C000138961Member
2019-02-28
2019-02-28
0001027596
tsr:bench20260501112284_6783Member
2019-02-28
2019-02-28
0001027596
tsr:benchmark286613198_6783Member
2019-02-28
2019-02-28
0001027596
tsr:C000138961Member
2020-02-29
2020-02-29
0001027596
tsr:bench20260501112284_6783Member
2020-02-29
2020-02-29
0001027596
tsr:benchmark286613198_6783Member
2020-02-29
2020-02-29
0001027596
tsr:C000138961Member
2021-02-28
2021-02-28
0001027596
tsr:bench20260501112284_6783Member
2021-02-28
2021-02-28
0001027596
tsr:benchmark286613198_6783Member
2021-02-28
2021-02-28
0001027596
tsr:C000138961Member
2022-02-28
2022-02-28
0001027596
tsr:bench20260501112284_6783Member
2022-02-28
2022-02-28
0001027596
tsr:benchmark286613198_6783Member
2022-02-28
2022-02-28
0001027596
tsr:C000138961Member
2023-02-28
2023-02-28
0001027596
tsr:bench20260501112284_6783Member
2023-02-28
2023-02-28
0001027596
tsr:benchmark286613198_6783Member
2023-02-28
2023-02-28
0001027596
tsr:C000138961Member
2024-02-29
2024-02-29
0001027596
tsr:bench20260501112284_6783Member
2024-02-29
2024-02-29
0001027596
tsr:benchmark286613198_6783Member
2024-02-29
2024-02-29
0001027596
tsr:C000138961Member
2025-02-28
2025-02-28
0001027596
tsr:bench20260501112284_6783Member
2025-02-28
2025-02-28
0001027596
tsr:benchmark286613198_6783Member
2025-02-28
2025-02-28
0001027596
tsr:C000138964Member
2025-03-01
2026-02-28
0001027596
tsr:bench20260430112243_6776Member
2025-03-01
2026-02-28
0001027596
tsr:benchmark160113194_6776Member
2025-03-01
2026-02-28
0001027596
tsr:C000138964Member
2026-02-28
0001027596
tsr:C000138964Member
tsr:bench2024090550317_6776Member
2026-02-28
0001027596
tsr:C000138964Member
tsr:bench2024090550302_6776Member
2026-02-28
0001027596
tsr:C000138964Member
country:KR
2026-02-28
0001027596
tsr:C000138964Member
tsr:bench2024090550312_6776Member
2026-02-28
0001027596
tsr:C000138964Member
tsr:bench2024090550304_6776Member
2026-02-28
0001027596
tsr:C000138964Member
country:CN
2026-02-28
0001027596
tsr:C000138964Member
tsr:bench2024090550316_6776Member
2026-02-28
0001027596
tsr:C000138964Member
tsr:bench2024090550303_6776Member
2026-02-28
0001027596
tsr:C000138964Member
country:BR
2026-02-28
0001027596
tsr:C000138964Member
tsr:bench20260401111355_6776Member
2026-02-28
0001027596
tsr:C000138964Member
tsr:bench2024090550305_6776Member
2026-02-28
0001027596
tsr:C000138964Member
country:TW
2026-02-28
0001027596
tsr:C000138964Member
tsr:bench20260401111356_6776Member
2026-02-28
0001027596
tsr:C000138964Member
tsr:bench2024090550306_6776Member
2026-02-28
0001027596
tsr:C000138964Member
country:HK
2026-02-28
0001027596
tsr:C000138964Member
tsr:bench20260401111357_6776Member
2026-02-28
0001027596
tsr:C000138964Member
tsr:bench2024090550307_6776Member
2026-02-28
0001027596
tsr:C000138964Member
country:HU
2026-02-28
0001027596
tsr:C000138964Member
tsr:bench2024090550314_6776Member
2026-02-28
0001027596
tsr:C000138964Member
tsr:bench2024090550308_6776Member
2026-02-28
0001027596
tsr:C000138964Member
country:TH
2026-02-28
0001027596
tsr:C000138964Member
tsr:bench2024090550320_6776Member
2026-02-28
0001027596
tsr:C000138964Member
tsr:bench2024090550323_6776Member
2026-02-28
0001027596
tsr:C000138964Member
country:IN
2026-02-28
0001027596
tsr:C000138964Member
tsr:bench20251003102308_6776Member
2026-02-28
0001027596
tsr:C000138964Member
tsr:bench2024090550309_6776Member
2026-02-28
0001027596
tsr:C000138964Member
country:PE
2026-02-28
0001027596
tsr:C000138964Member
tsr:bench2024090550321_6776Member
2026-02-28
0001027596
tsr:C000138964Member
tsr:bench2024090550311_6776Member
2026-02-28
0001027596
tsr:C000138964Member
tsr:bench2024103181494_6776Member
2026-02-28
0001027596
tsr:C000138964Member
2021-03-01
2026-02-28
0001027596
tsr:bench20260430112243_6776Member
2021-03-01
2026-02-28
0001027596
tsr:benchmark160113194_6776Member
2021-03-01
2026-02-28
0001027596
tsr:C000138964Member
2016-02-29
2026-02-28
0001027596
tsr:bench20260430112243_6776Member
2016-02-29
2026-02-28
0001027596
tsr:benchmark160113194_6776Member
2016-02-29
2026-02-28
0001027596
tsr:C000138964Member
2016-02-29
2016-02-29
0001027596
tsr:bench20260430112243_6776Member
2016-02-29
2016-02-29
0001027596
tsr:benchmark160113194_6776Member
2016-02-29
2016-02-29
0001027596
tsr:C000138964Member
2017-02-28
2017-02-28
0001027596
tsr:bench20260430112243_6776Member
2017-02-28
2017-02-28
0001027596
tsr:benchmark160113194_6776Member
2017-02-28
2017-02-28
0001027596
tsr:C000138964Member
2018-02-28
2018-02-28
0001027596
tsr:bench20260430112243_6776Member
2018-02-28
2018-02-28
0001027596
tsr:benchmark160113194_6776Member
2018-02-28
2018-02-28
0001027596
tsr:C000138964Member
2019-02-28
2019-02-28
0001027596
tsr:bench20260430112243_6776Member
2019-02-28
2019-02-28
0001027596
tsr:benchmark160113194_6776Member
2019-02-28
2019-02-28
0001027596
tsr:C000138964Member
2020-02-29
2020-02-29
0001027596
tsr:bench20260430112243_6776Member
2020-02-29
2020-02-29
0001027596
tsr:benchmark160113194_6776Member
2020-02-29
2020-02-29
0001027596
tsr:C000138964Member
2021-02-28
2021-02-28
0001027596
tsr:bench20260430112243_6776Member
2021-02-28
2021-02-28
0001027596
tsr:benchmark160113194_6776Member
2021-02-28
2021-02-28
0001027596
tsr:C000138964Member
2022-02-28
2022-02-28
0001027596
tsr:bench20260430112243_6776Member
2022-02-28
2022-02-28
0001027596
tsr:benchmark160113194_6776Member
2022-02-28
2022-02-28
0001027596
tsr:C000138964Member
2023-02-28
2023-02-28
0001027596
tsr:bench20260430112243_6776Member
2023-02-28
2023-02-28
0001027596
tsr:benchmark160113194_6776Member
2023-02-28
2023-02-28
0001027596
tsr:C000138964Member
2024-02-29
2024-02-29
0001027596
tsr:bench20260430112243_6776Member
2024-02-29
2024-02-29
0001027596
tsr:benchmark160113194_6776Member
2024-02-29
2024-02-29
0001027596
tsr:C000138964Member
2025-02-28
2025-02-28
0001027596
tsr:bench20260430112243_6776Member
2025-02-28
2025-02-28
0001027596
tsr:benchmark160113194_6776Member
2025-02-28
2025-02-28
0001027596
tsr:C000138963Member
2025-03-01
2026-02-28
0001027596
tsr:bench20260430112243_6777Member
2025-03-01
2026-02-28
0001027596
tsr:benchmark160113194_6777Member
2025-03-01
2026-02-28
0001027596
tsr:C000138963Member
2026-02-28
0001027596
tsr:C000138963Member
tsr:bench2024090550317_6777Member
2026-02-28
0001027596
tsr:C000138963Member
tsr:bench2024090550302_6777Member
2026-02-28
0001027596
tsr:C000138963Member
country:KR
2026-02-28
0001027596
tsr:C000138963Member
tsr:bench2024090550312_6777Member
2026-02-28
0001027596
tsr:C000138963Member
tsr:bench2024090550304_6777Member
2026-02-28
0001027596
tsr:C000138963Member
country:CN
2026-02-28
0001027596
tsr:C000138963Member
tsr:bench2024090550316_6777Member
2026-02-28
0001027596
tsr:C000138963Member
tsr:bench2024090550303_6777Member
2026-02-28
0001027596
tsr:C000138963Member
country:BR
2026-02-28
0001027596
tsr:C000138963Member
tsr:bench20260401111355_6777Member
2026-02-28
0001027596
tsr:C000138963Member
tsr:bench2024090550305_6777Member
2026-02-28
0001027596
tsr:C000138963Member
country:HK
2026-02-28
0001027596
tsr:C000138963Member
tsr:bench20260401111356_6777Member
2026-02-28
0001027596
tsr:C000138963Member
tsr:bench2024090550306_6777Member
2026-02-28
0001027596
tsr:C000138963Member
country:TW
2026-02-28
0001027596
tsr:C000138963Member
tsr:bench20260401111357_6777Member
2026-02-28
0001027596
tsr:C000138963Member
tsr:bench2024090550307_6777Member
2026-02-28
0001027596
tsr:C000138963Member
country:HU
2026-02-28
0001027596
tsr:C000138963Member
tsr:bench2024090550314_6777Member
2026-02-28
0001027596
tsr:C000138963Member
tsr:bench2024090550308_6777Member
2026-02-28
0001027596
tsr:C000138963Member
country:TH
2026-02-28
0001027596
tsr:C000138963Member
tsr:bench2024090550320_6777Member
2026-02-28
0001027596
tsr:C000138963Member
tsr:bench2024090550323_6777Member
2026-02-28
0001027596
tsr:C000138963Member
country:IN
2026-02-28
0001027596
tsr:C000138963Member
tsr:bench20251003102308_6777Member
2026-02-28
0001027596
tsr:C000138963Member
tsr:bench2024090550309_6777Member
2026-02-28
0001027596
tsr:C000138963Member
country:PE
2026-02-28
0001027596
tsr:C000138963Member
tsr:bench2024090550321_6777Member
2026-02-28
0001027596
tsr:C000138963Member
tsr:bench2024090550311_6777Member
2026-02-28
0001027596
tsr:C000138963Member
tsr:bench2024103181494_6777Member
2026-02-28
0001027596
tsr:C000138963Member
2021-03-01
2026-02-28
0001027596
tsr:bench20260430112243_6777Member
2021-03-01
2026-02-28
0001027596
tsr:benchmark160113194_6777Member
2021-03-01
2026-02-28
0001027596
tsr:C000138963Member
2016-02-29
2026-02-28
0001027596
tsr:bench20260430112243_6777Member
2016-02-29
2026-02-28
0001027596
tsr:benchmark160113194_6777Member
2016-02-29
2026-02-28
0001027596
tsr:C000138963Member
2016-02-29
2016-02-29
0001027596
tsr:bench20260430112243_6777Member
2016-02-29
2016-02-29
0001027596
tsr:benchmark160113194_6777Member
2016-02-29
2016-02-29
0001027596
tsr:C000138963Member
2017-02-28
2017-02-28
0001027596
tsr:bench20260430112243_6777Member
2017-02-28
2017-02-28
0001027596
tsr:benchmark160113194_6777Member
2017-02-28
2017-02-28
0001027596
tsr:C000138963Member
2018-02-28
2018-02-28
0001027596
tsr:bench20260430112243_6777Member
2018-02-28
2018-02-28
0001027596
tsr:benchmark160113194_6777Member
2018-02-28
2018-02-28
0001027596
tsr:C000138963Member
2019-02-28
2019-02-28
0001027596
tsr:bench20260430112243_6777Member
2019-02-28
2019-02-28
0001027596
tsr:benchmark160113194_6777Member
2019-02-28
2019-02-28
0001027596
tsr:C000138963Member
2020-02-29
2020-02-29
0001027596
tsr:bench20260430112243_6777Member
2020-02-29
2020-02-29
0001027596
tsr:benchmark160113194_6777Member
2020-02-29
2020-02-29
0001027596
tsr:C000138963Member
2021-02-28
2021-02-28
0001027596
tsr:bench20260430112243_6777Member
2021-02-28
2021-02-28
0001027596
tsr:benchmark160113194_6777Member
2021-02-28
2021-02-28
0001027596
tsr:C000138963Member
2022-02-28
2022-02-28
0001027596
tsr:bench20260430112243_6777Member
2022-02-28
2022-02-28
0001027596
tsr:benchmark160113194_6777Member
2022-02-28
2022-02-28
0001027596
tsr:C000138963Member
2023-02-28
2023-02-28
0001027596
tsr:bench20260430112243_6777Member
2023-02-28
2023-02-28
0001027596
tsr:benchmark160113194_6777Member
2023-02-28
2023-02-28
0001027596
tsr:C000138963Member
2024-02-29
2024-02-29
0001027596
tsr:bench20260430112243_6777Member
2024-02-29
2024-02-29
0001027596
tsr:benchmark160113194_6777Member
2024-02-29
2024-02-29
0001027596
tsr:C000138963Member
2025-02-28
2025-02-28
0001027596
tsr:bench20260430112243_6777Member
2025-02-28
2025-02-28
0001027596
tsr:benchmark160113194_6777Member
2025-02-28
2025-02-28
0001027596
tsr:C000168874Member
2025-03-01
2026-02-28
0001027596
tsr:bench20260430112238_6784Member
2025-03-01
2026-02-28
0001027596
tsr:benchmark28481731_6784Member
2025-03-01
2026-02-28
0001027596
tsr:C000168874Member
2026-02-28
0001027596
tsr:C000168874Member
tsr:bench2025033195249_6784Member
2026-02-28
0001027596
tsr:C000168874Member
tsr:bench2024090550306_6784Member
2026-02-28
0001027596
tsr:C000168874Member
country:US
2026-02-28
0001027596
tsr:C000168874Member
tsr:bench2024090550340_6784Member
2026-02-28
0001027596
tsr:C000168874Member
tsr:bench2024090550302_6784Member
2026-02-28
0001027596
tsr:C000168874Member
country:IE
2026-02-28
0001027596
tsr:C000168874Member
tsr:bench20260401111362_6784Member
2026-02-28
0001027596
tsr:C000168874Member
tsr:bench2024090550303_6784Member
2026-02-28
0001027596
tsr:C000168874Member
country:CH
2026-02-28
0001027596
tsr:C000168874Member
tsr:bench2024092450999_6784Member
2026-02-28
0001027596
tsr:C000168874Member
tsr:bench2024090550322_6784Member
2026-02-28
0001027596
tsr:C000168874Member
country:HK
2026-02-28
0001027596
tsr:C000168874Member
tsr:bench2025033195251_6784Member
2026-02-28
0001027596
tsr:C000168874Member
tsr:bench2025042497374_6784Member
2026-02-28
0001027596
tsr:C000168874Member
tsr:bench2024103181494_6784Member
2026-02-28
0001027596
tsr:C000168874Member
tsr:bench20251003102312_6784Member
2026-02-28
0001027596
tsr:C000168874Member
tsr:bench2024090550305_6784Member
2026-02-28
0001027596
tsr:C000168874Member
tsr:bench2024092451000_6784Member
2026-02-28
0001027596
tsr:C000168874Member
tsr:bench2025042497373_6784Member
2026-02-28
0001027596
tsr:C000168874Member
tsr:bench2024090550356_6784Member
2026-02-28
0001027596
tsr:C000168874Member
tsr:bench2024090550323_6784Member
2026-02-28
0001027596
tsr:C000168874Member
tsr:bench2025033195250_6784Member
2026-02-28
0001027596
tsr:C000168874Member
tsr:bench2024090550309_6784Member
2026-02-28
0001027596
tsr:C000168874Member
tsr:bench20260401111363_6784Member
2026-02-28
0001027596
tsr:C000168874Member
tsr:bench2024090550311_6784Member
2026-02-28
0001027596
tsr:C000168874Member
2021-03-01
2026-02-28
0001027596
tsr:bench20260430112238_6784Member
2021-03-01
2026-02-28
0001027596
tsr:benchmark28481731_6784Member
2021-03-01
2026-02-28
0001027596
tsr:C000168874Member
2016-04-27
2026-02-28
0001027596
tsr:bench20260430112238_6784Member
2016-04-27
2026-02-28
0001027596
tsr:benchmark28481731_6784Member
2016-04-27
2026-02-28
0001027596
tsr:C000168874Member
2016-04-27
2016-04-27
0001027596
tsr:bench20260430112238_6784Member
2016-04-27
2016-04-27
0001027596
tsr:benchmark28481731_6784Member
2016-04-27
2016-04-27
0001027596
tsr:C000168874Member
2017-02-28
2017-02-28
0001027596
tsr:bench20260430112238_6784Member
2017-02-28
2017-02-28
0001027596
tsr:benchmark28481731_6784Member
2017-02-28
2017-02-28
0001027596
tsr:C000168874Member
2018-02-28
2018-02-28
0001027596
tsr:bench20260430112238_6784Member
2018-02-28
2018-02-28
0001027596
tsr:benchmark28481731_6784Member
2018-02-28
2018-02-28
0001027596
tsr:C000168874Member
2019-02-28
2019-02-28
0001027596
tsr:bench20260430112238_6784Member
2019-02-28
2019-02-28
0001027596
tsr:benchmark28481731_6784Member
2019-02-28
2019-02-28
0001027596
tsr:C000168874Member
2020-02-29
2020-02-29
0001027596
tsr:bench20260430112238_6784Member
2020-02-29
2020-02-29
0001027596
tsr:benchmark28481731_6784Member
2020-02-29
2020-02-29
0001027596
tsr:C000168874Member
2021-02-28
2021-02-28
0001027596
tsr:bench20260430112238_6784Member
2021-02-28
2021-02-28
0001027596
tsr:benchmark28481731_6784Member
2021-02-28
2021-02-28
0001027596
tsr:C000168874Member
2022-02-28
2022-02-28
0001027596
tsr:bench20260430112238_6784Member
2022-02-28
2022-02-28
0001027596
tsr:benchmark28481731_6784Member
2022-02-28
2022-02-28
0001027596
tsr:C000168874Member
2023-02-28
2023-02-28
0001027596
tsr:bench20260430112238_6784Member
2023-02-28
2023-02-28
0001027596
tsr:benchmark28481731_6784Member
2023-02-28
2023-02-28
0001027596
tsr:C000168874Member
2024-02-29
2024-02-29
0001027596
tsr:bench20260430112238_6784Member
2024-02-29
2024-02-29
0001027596
tsr:benchmark28481731_6784Member
2024-02-29
2024-02-29
0001027596
tsr:C000168874Member
2025-02-28
2025-02-28
0001027596
tsr:bench20260430112238_6784Member
2025-02-28
2025-02-28
0001027596
tsr:benchmark28481731_6784Member
2025-02-28
2025-02-28
0001027596
tsr:C000168873Member
2025-03-01
2026-02-28
0001027596
tsr:bench20260430112238_6785Member
2025-03-01
2026-02-28
0001027596
tsr:benchmark28481731_6785Member
2025-03-01
2026-02-28
0001027596
tsr:C000168873Member
2026-02-28
0001027596
tsr:C000168873Member
tsr:bench2025033195249_6785Member
2026-02-28
0001027596
tsr:C000168873Member
tsr:bench2024090550306_6785Member
2026-02-28
0001027596
tsr:C000168873Member
country:US
2026-02-28
0001027596
tsr:C000168873Member
tsr:bench2024090550340_6785Member
2026-02-28
0001027596
tsr:C000168873Member
tsr:bench2024090550302_6785Member
2026-02-28
0001027596
tsr:C000168873Member
country:IE
2026-02-28
0001027596
tsr:C000168873Member
tsr:bench20260401111362_6785Member
2026-02-28
0001027596
tsr:C000168873Member
tsr:bench2024090550303_6785Member
2026-02-28
0001027596
tsr:C000168873Member
country:CH
2026-02-28
0001027596
tsr:C000168873Member
tsr:bench2024092450999_6785Member
2026-02-28
0001027596
tsr:C000168873Member
tsr:bench2024090550322_6785Member
2026-02-28
0001027596
tsr:C000168873Member
country:HK
2026-02-28
0001027596
tsr:C000168873Member
tsr:bench2025033195251_6785Member
2026-02-28
0001027596
tsr:C000168873Member
tsr:bench2025042497374_6785Member
2026-02-28
0001027596
tsr:C000168873Member
tsr:bench2024103181494_6785Member
2026-02-28
0001027596
tsr:C000168873Member
tsr:bench20251003102312_6785Member
2026-02-28
0001027596
tsr:C000168873Member
tsr:bench2025042497373_6785Member
2026-02-28
0001027596
tsr:C000168873Member
tsr:bench2024092451000_6785Member
2026-02-28
0001027596
tsr:C000168873Member
tsr:bench2024090550305_6785Member
2026-02-28
0001027596
tsr:C000168873Member
tsr:bench2024090550356_6785Member
2026-02-28
0001027596
tsr:C000168873Member
tsr:bench2024090550323_6785Member
2026-02-28
0001027596
tsr:C000168873Member
tsr:bench2025033195250_6785Member
2026-02-28
0001027596
tsr:C000168873Member
tsr:bench2024090550309_6785Member
2026-02-28
0001027596
tsr:C000168873Member
tsr:bench20260401111363_6785Member
2026-02-28
0001027596
tsr:C000168873Member
tsr:bench2024090550311_6785Member
2026-02-28
0001027596
tsr:C000168873Member
2021-03-01
2026-02-28
0001027596
tsr:bench20260430112238_6785Member
2021-03-01
2026-02-28
0001027596
tsr:benchmark28481731_6785Member
2021-03-01
2026-02-28
0001027596
tsr:C000168873Member
2016-04-27
2026-02-28
0001027596
tsr:bench20260430112238_6785Member
2016-04-27
2026-02-28
0001027596
tsr:benchmark28481731_6785Member
2016-04-27
2026-02-28
0001027596
tsr:C000168873Member
2016-04-27
2016-04-27
0001027596
tsr:bench20260430112238_6785Member
2016-04-27
2016-04-27
0001027596
tsr:benchmark28481731_6785Member
2016-04-27
2016-04-27
0001027596
tsr:C000168873Member
2017-02-28
2017-02-28
0001027596
tsr:bench20260430112238_6785Member
2017-02-28
2017-02-28
0001027596
tsr:benchmark28481731_6785Member
2017-02-28
2017-02-28
0001027596
tsr:C000168873Member
2018-02-28
2018-02-28
0001027596
tsr:bench20260430112238_6785Member
2018-02-28
2018-02-28
0001027596
tsr:benchmark28481731_6785Member
2018-02-28
2018-02-28
0001027596
tsr:C000168873Member
2019-02-28
2019-02-28
0001027596
tsr:bench20260430112238_6785Member
2019-02-28
2019-02-28
0001027596
tsr:benchmark28481731_6785Member
2019-02-28
2019-02-28
0001027596
tsr:C000168873Member
2020-02-29
2020-02-29
0001027596
tsr:bench20260430112238_6785Member
2020-02-29
2020-02-29
0001027596
tsr:benchmark28481731_6785Member
2020-02-29
2020-02-29
0001027596
tsr:C000168873Member
2021-02-28
2021-02-28
0001027596
tsr:bench20260430112238_6785Member
2021-02-28
2021-02-28
0001027596
tsr:benchmark28481731_6785Member
2021-02-28
2021-02-28
0001027596
tsr:C000168873Member
2022-02-28
2022-02-28
0001027596
tsr:bench20260430112238_6785Member
2022-02-28
2022-02-28
0001027596
tsr:benchmark28481731_6785Member
2022-02-28
2022-02-28
0001027596
tsr:C000168873Member
2023-02-28
2023-02-28
0001027596
tsr:bench20260430112238_6785Member
2023-02-28
2023-02-28
0001027596
tsr:benchmark28481731_6785Member
2023-02-28
2023-02-28
0001027596
tsr:C000168873Member
2024-02-29
2024-02-29
0001027596
tsr:bench20260430112238_6785Member
2024-02-29
2024-02-29
0001027596
tsr:benchmark28481731_6785Member
2024-02-29
2024-02-29
0001027596
tsr:C000168873Member
2025-02-28
2025-02-28
0001027596
tsr:bench20260430112238_6785Member
2025-02-28
2025-02-28
0001027596
tsr:benchmark28481731_6785Member
2025-02-28
2025-02-28
0001027596
tsr:C000201596Member
2025-03-01
2026-02-28
0001027596
tsr:bench20260501112283_6778Member
2025-03-01
2026-02-28
0001027596
tsr:benchmark13356226_6778Member
2025-03-01
2026-02-28
0001027596
tsr:benchmark1604226_6778Member
2025-03-01
2026-02-28
0001027596
tsr:C000201596Member
2026-02-28
0001027596
tsr:C000201596Member
tsr:bench2024090550342_6778Member
2026-02-28
0001027596
tsr:C000201596Member
tsr:bench2024090550306_6778Member
2026-02-28
0001027596
tsr:C000201596Member
country:GB
2026-02-28
0001027596
tsr:C000201596Member
tsr:bench20260401111364_6778Member
2026-02-28
0001027596
tsr:C000201596Member
tsr:bench2024090550303_6778Member
2026-02-28
0001027596
tsr:C000201596Member
country:JP
2026-02-28
0001027596
tsr:C000201596Member
tsr:bench2025033195253_6778Member
2026-02-28
0001027596
tsr:C000201596Member
tsr:bench2024090550307_6778Member
2026-02-28
0001027596
tsr:C000201596Member
country:FR
2026-02-28
0001027596
tsr:C000201596Member
tsr:bench2024092451002_6778Member
2026-02-28
0001027596
tsr:C000201596Member
tsr:bench2024090550305_6778Member
2026-02-28
0001027596
tsr:C000201596Member
country:IE
2026-02-28
0001027596
tsr:C000201596Member
tsr:bench20251003102315_6778Member
2026-02-28
0001027596
tsr:C000201596Member
tsr:bench2024090550302_6778Member
2026-02-28
0001027596
tsr:C000201596Member
country:DE
2026-02-28
0001027596
tsr:C000201596Member
tsr:bench20260401111365_6778Member
2026-02-28
0001027596
tsr:C000201596Member
tsr:bench2024090550310_6778Member
2026-02-28
0001027596
tsr:C000201596Member
country:HK
2026-02-28
0001027596
tsr:C000201596Member
tsr:bench20251003102314_6778Member
2026-02-28
0001027596
tsr:C000201596Member
tsr:bench2024090550304_6778Member
2026-02-28
0001027596
tsr:C000201596Member
country:CA
2026-02-28
0001027596
tsr:C000201596Member
tsr:bench20251003102316_6778Member
2026-02-28
0001027596
tsr:C000201596Member
tsr:bench2024090550322_6778Member
2026-02-28
0001027596
tsr:C000201596Member
country:NL
2026-02-28
0001027596
tsr:C000201596Member
tsr:bench2024090550347_6778Member
2026-02-28
0001027596
tsr:C000201596Member
tsr:bench2024090550309_6778Member
2026-02-28
0001027596
tsr:C000201596Member
country:AU
2026-02-28
0001027596
tsr:C000201596Member
tsr:bench20260401111366_6778Member
2026-02-28
0001027596
tsr:C000201596Member
tsr:bench2024090550311_6778Member
2026-02-28
0001027596
tsr:C000201596Member
tsr:bench2024103181494_6778Member
2026-02-28
0001027596
tsr:C000201596Member
2021-03-01
2026-02-28
0001027596
tsr:bench20260501112283_6778Member
2021-03-01
2026-02-28
0001027596
tsr:benchmark13356226_6778Member
2021-03-01
2026-02-28
0001027596
tsr:benchmark1604226_6778Member
2021-03-01
2026-02-28
0001027596
tsr:C000201596Member
2018-07-02
2026-02-28
0001027596
tsr:bench20260501112283_6778Member
2018-07-02
2026-02-28
0001027596
tsr:benchmark13356226_6778Member
2018-07-02
2026-02-28
0001027596
tsr:benchmark1604226_6778Member
2018-07-02
2026-02-28
0001027596
tsr:C000201596Member
2018-07-02
2018-07-02
0001027596
tsr:bench20260501112283_6778Member
2018-07-02
2018-07-02
0001027596
tsr:benchmark13356226_6778Member
2018-07-02
2018-07-02
0001027596
tsr:benchmark1604226_6778Member
2018-07-02
2018-07-02
0001027596
tsr:C000201596Member
2019-02-28
2019-02-28
0001027596
tsr:bench20260501112283_6778Member
2019-02-28
2019-02-28
0001027596
tsr:benchmark13356226_6778Member
2019-02-28
2019-02-28
0001027596
tsr:benchmark1604226_6778Member
2019-02-28
2019-02-28
0001027596
tsr:C000201596Member
2020-02-29
2020-02-29
0001027596
tsr:bench20260501112283_6778Member
2020-02-29
2020-02-29
0001027596
tsr:benchmark13356226_6778Member
2020-02-29
2020-02-29
0001027596
tsr:benchmark1604226_6778Member
2020-02-29
2020-02-29
0001027596
tsr:C000201596Member
2021-02-28
2021-02-28
0001027596
tsr:bench20260501112283_6778Member
2021-02-28
2021-02-28
0001027596
tsr:benchmark13356226_6778Member
2021-02-28
2021-02-28
0001027596
tsr:benchmark1604226_6778Member
2021-02-28
2021-02-28
0001027596
tsr:C000201596Member
2022-02-28
2022-02-28
0001027596
tsr:bench20260501112283_6778Member
2022-02-28
2022-02-28
0001027596
tsr:benchmark13356226_6778Member
2022-02-28
2022-02-28
0001027596
tsr:benchmark1604226_6778Member
2022-02-28
2022-02-28
0001027596
tsr:C000201596Member
2023-02-28
2023-02-28
0001027596
tsr:bench20260501112283_6778Member
2023-02-28
2023-02-28
0001027596
tsr:benchmark13356226_6778Member
2023-02-28
2023-02-28
0001027596
tsr:benchmark1604226_6778Member
2023-02-28
2023-02-28
0001027596
tsr:C000201596Member
2024-02-29
2024-02-29
0001027596
tsr:bench20260501112283_6778Member
2024-02-29
2024-02-29
0001027596
tsr:benchmark13356226_6778Member
2024-02-29
2024-02-29
0001027596
tsr:benchmark1604226_6778Member
2024-02-29
2024-02-29
0001027596
tsr:C000201596Member
2025-02-28
2025-02-28
0001027596
tsr:bench20260501112283_6778Member
2025-02-28
2025-02-28
0001027596
tsr:benchmark13356226_6778Member
2025-02-28
2025-02-28
0001027596
tsr:benchmark1604226_6778Member
2025-02-28
2025-02-28
0001027596
tsr:C000201595Member
2025-03-01
2026-02-28
0001027596
tsr:bench20260501112283_6779Member
2025-03-01
2026-02-28
0001027596
tsr:benchmark13356226_6779Member
2025-03-01
2026-02-28
0001027596
tsr:benchmark1604226_6779Member
2025-03-01
2026-02-28
0001027596
tsr:C000201595Member
2026-02-28
0001027596
tsr:C000201595Member
tsr:bench2024090550342_6779Member
2026-02-28
0001027596
tsr:C000201595Member
tsr:bench2024090550306_6779Member
2026-02-28
0001027596
tsr:C000201595Member
country:GB
2026-02-28
0001027596
tsr:C000201595Member
tsr:bench20260401111364_6779Member
2026-02-28
0001027596
tsr:C000201595Member
tsr:bench2024090550303_6779Member
2026-02-28
0001027596
tsr:C000201595Member
country:JP
2026-02-28
0001027596
tsr:C000201595Member
tsr:bench2025033195253_6779Member
2026-02-28
0001027596
tsr:C000201595Member
tsr:bench2024090550307_6779Member
2026-02-28
0001027596
tsr:C000201595Member
country:FR
2026-02-28
0001027596
tsr:C000201595Member
tsr:bench2024092451002_6779Member
2026-02-28
0001027596
tsr:C000201595Member
tsr:bench2024090550305_6779Member
2026-02-28
0001027596
tsr:C000201595Member
country:IE
2026-02-28
0001027596
tsr:C000201595Member
tsr:bench20251003102315_6779Member
2026-02-28
0001027596
tsr:C000201595Member
tsr:bench2024090550302_6779Member
2026-02-28
0001027596
tsr:C000201595Member
country:DE
2026-02-28
0001027596
tsr:C000201595Member
tsr:bench20260401111365_6779Member
2026-02-28
0001027596
tsr:C000201595Member
tsr:bench2024090550310_6779Member
2026-02-28
0001027596
tsr:C000201595Member
country:HK
2026-02-28
0001027596
tsr:C000201595Member
tsr:bench20251003102314_6779Member
2026-02-28
0001027596
tsr:C000201595Member
tsr:bench2024090550304_6779Member
2026-02-28
0001027596
tsr:C000201595Member
country:CA
2026-02-28
0001027596
tsr:C000201595Member
tsr:bench20251003102316_6779Member
2026-02-28
0001027596
tsr:C000201595Member
tsr:bench2024090550322_6779Member
2026-02-28
0001027596
tsr:C000201595Member
country:NL
2026-02-28
0001027596
tsr:C000201595Member
tsr:bench2024090550347_6779Member
2026-02-28
0001027596
tsr:C000201595Member
tsr:bench2024090550309_6779Member
2026-02-28
0001027596
tsr:C000201595Member
country:AU
2026-02-28
0001027596
tsr:C000201595Member
tsr:bench20260401111366_6779Member
2026-02-28
0001027596
tsr:C000201595Member
tsr:bench2024090550311_6779Member
2026-02-28
0001027596
tsr:C000201595Member
tsr:bench2024103181494_6779Member
2026-02-28
0001027596
tsr:C000201595Member
2021-03-01
2026-02-28
0001027596
tsr:bench20260501112283_6779Member
2021-03-01
2026-02-28
0001027596
tsr:benchmark13356226_6779Member
2021-03-01
2026-02-28
0001027596
tsr:benchmark1604226_6779Member
2021-03-01
2026-02-28
0001027596
tsr:C000201595Member
2018-07-02
2026-02-28
0001027596
tsr:bench20260501112283_6779Member
2018-07-02
2026-02-28
0001027596
tsr:benchmark13356226_6779Member
2018-07-02
2026-02-28
0001027596
tsr:benchmark1604226_6779Member
2018-07-02
2026-02-28
0001027596
tsr:C000201595Member
2018-07-02
2018-07-02
0001027596
tsr:bench20260501112283_6779Member
2018-07-02
2018-07-02
0001027596
tsr:benchmark13356226_6779Member
2018-07-02
2018-07-02
0001027596
tsr:benchmark1604226_6779Member
2018-07-02
2018-07-02
0001027596
tsr:C000201595Member
2019-02-28
2019-02-28
0001027596
tsr:bench20260501112283_6779Member
2019-02-28
2019-02-28
0001027596
tsr:benchmark13356226_6779Member
2019-02-28
2019-02-28
0001027596
tsr:benchmark1604226_6779Member
2019-02-28
2019-02-28
0001027596
tsr:C000201595Member
2020-02-29
2020-02-29
0001027596
tsr:bench20260501112283_6779Member
2020-02-29
2020-02-29
0001027596
tsr:benchmark13356226_6779Member
2020-02-29
2020-02-29
0001027596
tsr:benchmark1604226_6779Member
2020-02-29
2020-02-29
0001027596
tsr:C000201595Member
2021-02-28
2021-02-28
0001027596
tsr:bench20260501112283_6779Member
2021-02-28
2021-02-28
0001027596
tsr:benchmark13356226_6779Member
2021-02-28
2021-02-28
0001027596
tsr:benchmark1604226_6779Member
2021-02-28
2021-02-28
0001027596
tsr:C000201595Member
2022-02-28
2022-02-28
0001027596
tsr:bench20260501112283_6779Member
2022-02-28
2022-02-28
0001027596
tsr:benchmark13356226_6779Member
2022-02-28
2022-02-28
0001027596
tsr:benchmark1604226_6779Member
2022-02-28
2022-02-28
0001027596
tsr:C000201595Member
2023-02-28
2023-02-28
0001027596
tsr:bench20260501112283_6779Member
2023-02-28
2023-02-28
0001027596
tsr:benchmark13356226_6779Member
2023-02-28
2023-02-28
0001027596
tsr:benchmark1604226_6779Member
2023-02-28
2023-02-28
0001027596
tsr:C000201595Member
2024-02-29
2024-02-29
0001027596
tsr:bench20260501112283_6779Member
2024-02-29
2024-02-29
0001027596
tsr:benchmark13356226_6779Member
2024-02-29
2024-02-29
0001027596
tsr:benchmark1604226_6779Member
2024-02-29
2024-02-29
0001027596
tsr:C000201595Member
2025-02-28
2025-02-28
0001027596
tsr:bench20260501112283_6779Member
2025-02-28
2025-02-28
0001027596
tsr:benchmark13356226_6779Member
2025-02-28
2025-02-28
0001027596
tsr:benchmark1604226_6779Member
2025-02-28
2025-02-28
0001027596
tsr:C000228587Member
2025-03-01
2026-02-28
0001027596
tsr:bench20260501112285_6780Member
2025-03-01
2026-02-28
0001027596
tsr:benchmark36577012_6780Member
2025-03-01
2026-02-28
0001027596
tsr:C000228587Member
2026-02-28
0001027596
tsr:C000228587Member
tsr:bench2024090550317_6780Member
2026-02-28
0001027596
tsr:C000228587Member
tsr:bench2024090550302_6780Member
2026-02-28
0001027596
tsr:C000228587Member
country:JP
2026-02-28
0001027596
tsr:C000228587Member
tsr:bench2025033195247_6780Member
2026-02-28
0001027596
tsr:C000228587Member
tsr:bench2024090550322_6780Member
2026-02-28
0001027596
tsr:C000228587Member
country:GB
2026-02-28
0001027596
tsr:C000228587Member
tsr:bench20260401111358_6780Member
2026-02-28
0001027596
tsr:C000228587Member
tsr:bench2024090550306_6780Member
2026-02-28
0001027596
tsr:C000228587Member
country:FR
2026-02-28
0001027596
tsr:C000228587Member
tsr:bench2024092450996_6780Member
2026-02-28
0001027596
tsr:C000228587Member
tsr:bench2024090550303_6780Member
2026-02-28
0001027596
tsr:C000228587Member
country:DE
2026-02-28
0001027596
tsr:C000228587Member
tsr:bench20260401111359_6780Member
2026-02-28
0001027596
tsr:C000228587Member
tsr:bench2024090550304_6780Member
2026-02-28
0001027596
tsr:C000228587Member
country:KR
2026-02-28
0001027596
tsr:C000228587Member
tsr:bench20260401111360_6780Member
2026-02-28
0001027596
tsr:C000228587Member
tsr:bench2024090550305_6780Member
2026-02-28
0001027596
tsr:C000228587Member
country:CH
2026-02-28
0001027596
tsr:C000228587Member
tsr:bench2024090550330_6780Member
2026-02-28
0001027596
tsr:C000228587Member
tsr:bench2024090550307_6780Member
2026-02-28
0001027596
tsr:C000228587Member
country:NL
2026-02-28
0001027596
tsr:C000228587Member
tsr:bench2024092450998_6780Member
2026-02-28
0001027596
tsr:C000228587Member
tsr:bench2024090550323_6780Member
2026-02-28
0001027596
tsr:C000228587Member
country:IE
2026-02-28
0001027596
tsr:C000228587Member
tsr:bench20260401111361_6780Member
2026-02-28
0001027596
tsr:C000228587Member
tsr:bench2024090550310_6780Member
2026-02-28
0001027596
tsr:C000228587Member
country:CN
2026-02-28
0001027596
tsr:C000228587Member
tsr:bench2024090550327_6780Member
2026-02-28
0001027596
tsr:C000228587Member
tsr:bench2024090550311_6780Member
2026-02-28
0001027596
tsr:C000228587Member
tsr:bench2024103181494_6780Member
2026-02-28
0001027596
tsr:C000228587Member
2021-06-28
2026-02-28
0001027596
tsr:bench20260501112285_6780Member
2021-06-28
2026-02-28
0001027596
tsr:benchmark36577012_6780Member
2021-06-28
2026-02-28
0001027596
tsr:C000228587Member
2021-06-28
2021-06-28
0001027596
tsr:bench20260501112285_6780Member
2021-06-28
2021-06-28
0001027596
tsr:benchmark36577012_6780Member
2021-06-28
2021-06-28
0001027596
tsr:C000228587Member
2022-02-28
2022-02-28
0001027596
tsr:bench20260501112285_6780Member
2022-02-28
2022-02-28
0001027596
tsr:benchmark36577012_6780Member
2022-02-28
2022-02-28
0001027596
tsr:C000228587Member
2023-02-28
2023-02-28
0001027596
tsr:bench20260501112285_6780Member
2023-02-28
2023-02-28
0001027596
tsr:benchmark36577012_6780Member
2023-02-28
2023-02-28
0001027596
tsr:C000228587Member
2024-02-29
2024-02-29
0001027596
tsr:bench20260501112285_6780Member
2024-02-29
2024-02-29
0001027596
tsr:benchmark36577012_6780Member
2024-02-29
2024-02-29
0001027596
tsr:C000228587Member
2025-02-28
2025-02-28
0001027596
tsr:bench20260501112285_6780Member
2025-02-28
2025-02-28
0001027596
tsr:benchmark36577012_6780Member
2025-02-28
2025-02-28
0001027596
tsr:C000228588Member
2025-03-01
2026-02-28
0001027596
tsr:bench20260501112285_6781Member
2025-03-01
2026-02-28
0001027596
tsr:benchmark36577012_6781Member
2025-03-01
2026-02-28
0001027596
tsr:C000228588Member
2026-02-28
0001027596
tsr:C000228588Member
tsr:bench2024090550317_6781Member
2026-02-28
0001027596
tsr:C000228588Member
tsr:bench2024090550302_6781Member
2026-02-28
0001027596
tsr:C000228588Member
country:JP
2026-02-28
0001027596
tsr:C000228588Member
tsr:bench2025033195247_6781Member
2026-02-28
0001027596
tsr:C000228588Member
tsr:bench2024090550322_6781Member
2026-02-28
0001027596
tsr:C000228588Member
country:GB
2026-02-28
0001027596
tsr:C000228588Member
tsr:bench20260401111358_6781Member
2026-02-28
0001027596
tsr:C000228588Member
tsr:bench2024090550306_6781Member
2026-02-28
0001027596
tsr:C000228588Member
country:FR
2026-02-28
0001027596
tsr:C000228588Member
tsr:bench2024092450996_6781Member
2026-02-28
0001027596
tsr:C000228588Member
tsr:bench2024090550303_6781Member
2026-02-28
0001027596
tsr:C000228588Member
country:DE
2026-02-28
0001027596
tsr:C000228588Member
tsr:bench20260401111359_6781Member
2026-02-28
0001027596
tsr:C000228588Member
tsr:bench2024090550304_6781Member
2026-02-28
0001027596
tsr:C000228588Member
country:KR
2026-02-28
0001027596
tsr:C000228588Member
tsr:bench20260401111360_6781Member
2026-02-28
0001027596
tsr:C000228588Member
tsr:bench2024090550305_6781Member
2026-02-28
0001027596
tsr:C000228588Member
country:CH
2026-02-28
0001027596
tsr:C000228588Member
tsr:bench2024090550330_6781Member
2026-02-28
0001027596
tsr:C000228588Member
tsr:bench2024090550307_6781Member
2026-02-28
0001027596
tsr:C000228588Member
country:NL
2026-02-28
0001027596
tsr:C000228588Member
tsr:bench2024092450998_6781Member
2026-02-28
0001027596
tsr:C000228588Member
tsr:bench2024090550323_6781Member
2026-02-28
0001027596
tsr:C000228588Member
country:IE
2026-02-28
0001027596
tsr:C000228588Member
tsr:bench20260401111361_6781Member
2026-02-28
0001027596
tsr:C000228588Member
tsr:bench2024090550310_6781Member
2026-02-28
0001027596
tsr:C000228588Member
country:CN
2026-02-28
0001027596
tsr:C000228588Member
tsr:bench2024090550327_6781Member
2026-02-28
0001027596
tsr:C000228588Member
tsr:bench2024090550311_6781Member
2026-02-28
0001027596
tsr:C000228588Member
tsr:bench2024103181494_6781Member
2026-02-28
0001027596
tsr:C000228588Member
2021-06-28
2026-02-28
0001027596
tsr:bench20260501112285_6781Member
2021-06-28
2026-02-28
0001027596
tsr:benchmark36577012_6781Member
2021-06-28
2026-02-28
0001027596
tsr:C000228588Member
2021-06-28
2021-06-28
0001027596
tsr:bench20260501112285_6781Member
2021-06-28
2021-06-28
0001027596
tsr:benchmark36577012_6781Member
2021-06-28
2021-06-28
0001027596
tsr:C000228588Member
2022-02-28
2022-02-28
0001027596
tsr:bench20260501112285_6781Member
2022-02-28
2022-02-28
0001027596
tsr:benchmark36577012_6781Member
2022-02-28
2022-02-28
0001027596
tsr:C000228588Member
2023-02-28
2023-02-28
0001027596
tsr:bench20260501112285_6781Member
2023-02-28
2023-02-28
0001027596
tsr:benchmark36577012_6781Member
2023-02-28
2023-02-28
0001027596
tsr:C000228588Member
2024-02-29
2024-02-29
0001027596
tsr:bench20260501112285_6781Member
2024-02-29
2024-02-29
0001027596
tsr:benchmark36577012_6781Member
2024-02-29
2024-02-29
0001027596
tsr:C000228588Member
2025-02-28
2025-02-28
0001027596
tsr:bench20260501112285_6781Member
2025-02-28
2025-02-28
0001027596
tsr:benchmark36577012_6781Member
2025-02-28
2025-02-28
UNITED STATES
SECURITIES AND EXCHANGE COMMISSION
Washington, D.C. 20549
FORM
N-CSR
CERTIFIED SHAREHOLDER REPORT OF REGISTERED
MANAGEMENT INVESTMENT COMPANIES
Investment Company Act file number 811-07959
Advisors
Series Trust
(Exact name of registrant as specified in charter)
615 East
Michigan Street
Milwaukee,
WI 53202
(Address of principal executive offices) (Zip code)
Jeffrey T. Rauman, President/Principal Executive
Officer
Advisors Series Trust
c/o U.S. Bancorp Fund Services, LLC
777 East Wisconsin Avenue
(Name and address of agent for service)
(626) 914-7363
Registrant’s telephone number, including area
code
Date of fiscal year end: February
28, 2026
Date of reporting period: February
28, 2026
Item 1. Reports to Stockholders.
(a)
|
|
|
|
|
Pzena Mid Cap Value Fund
|
|
|
Institutional Class | PZIMX
|
|
Annual Shareholder Report | February 28, 2026
|
This annual shareholder report contains important information about the Pzena Mid Cap Value Fund for the period of March 1, 2025, to February 28, 2026. You can find additional information about the Fund at https://www.pzena.com/americas/institutional-investors/funds/us-mutual-funds/mid-cap-value-fund-pzimx/. You can also request this information by contacting us at 1-844-796-1996.
WHAT WERE THE FUND COSTS FOR THE PAST YEAR? (based on a hypothetical $10,000 investment)
|
|
|
|
Class Name
|
Costs of a $10,000 investment
|
Costs paid as a percentage of a $10,000 investment
|
|
Institutional Class
|
$93
|
0.90%
|
HOW DID THE FUND PERFORM LAST YEAR AND WHAT AFFECTED ITS PERFORMANCE?
U.S. mid-cap equities rose modestly during the trailing 12 months, against a backdrop of volatile market swings, strong enthusiasm for AI, and continued concentration in a narrow group of market leaders. While tariff-related uncertainty periodically unsettled markets, sentiment improved as the period progressed. Sector and stock-level dispersion remained elevated within the mid-cap segment. The Fund rose but trailed its benchmark, the Russell 1000 Index.
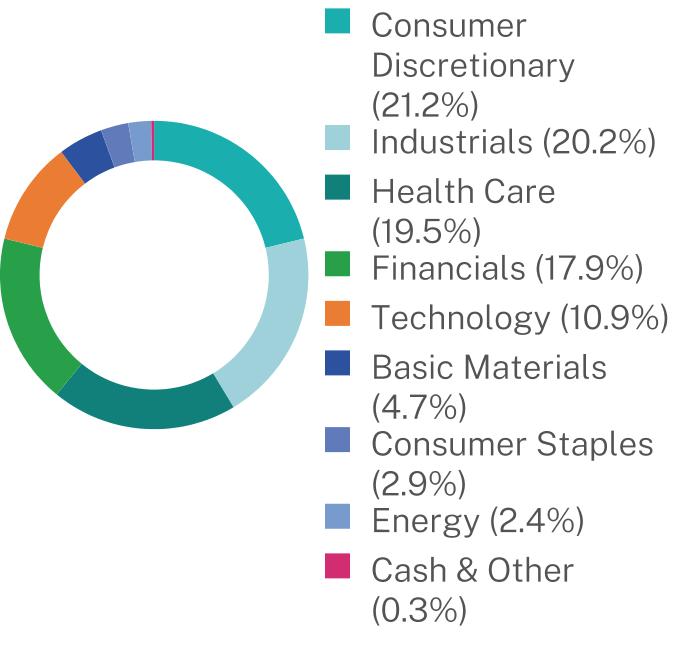
The Fund’s consumer discretionary holdings contributed most to absolute performance, while energy and financials also added positively. In contrast, health care and basic materials were the most notable detractors from performance, with telecommunications also weighing on results.
|
|
|
Top Contributors
|
|
↑
|
Equitable Holdings, Inc., CNO Financial Group, Inc., Delta Air Lines, Inc.
|
|
|
|
Top Detractors
|
|
↓
|
JELD-WEN Holding, Inc., Olin Corporation, Dollar General Corporation
|
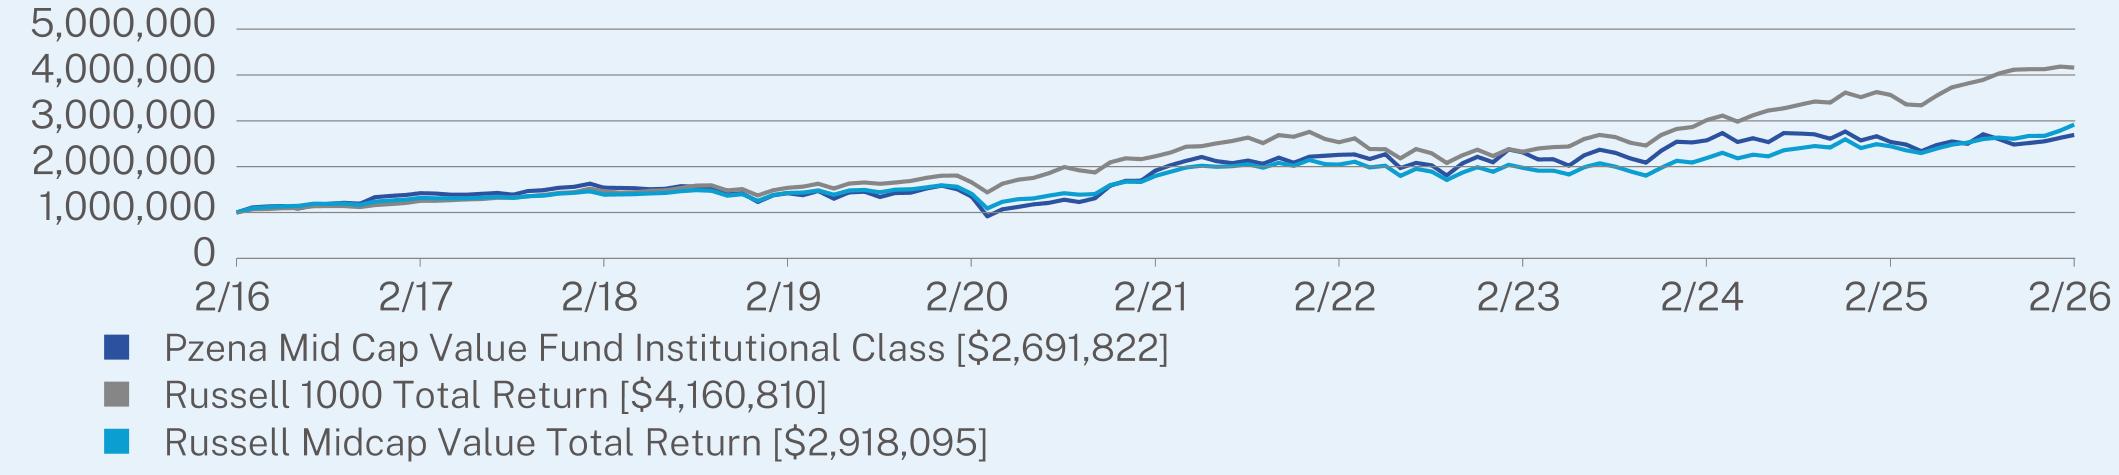
HOW DID THE FUND PERFORM OVER THE PAST 10 YEARS?*
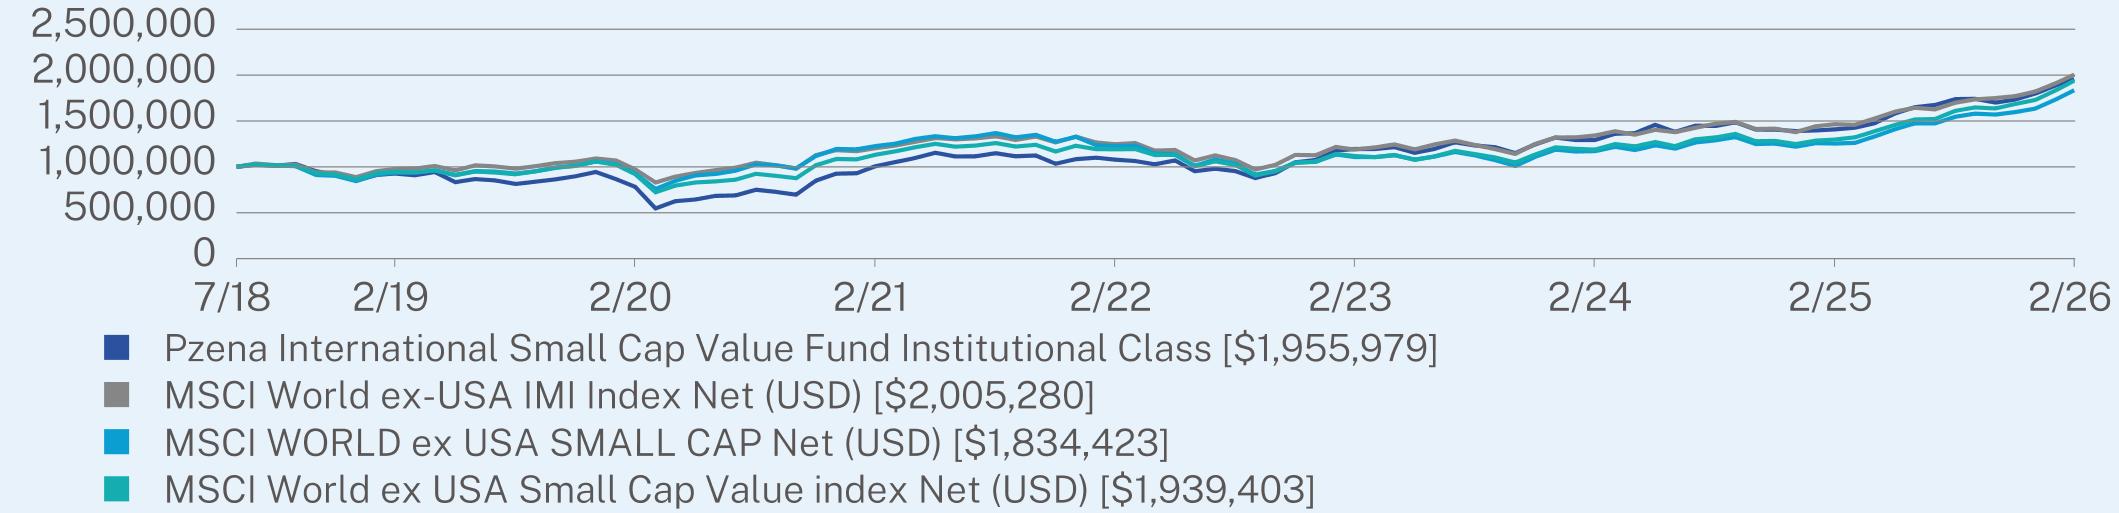
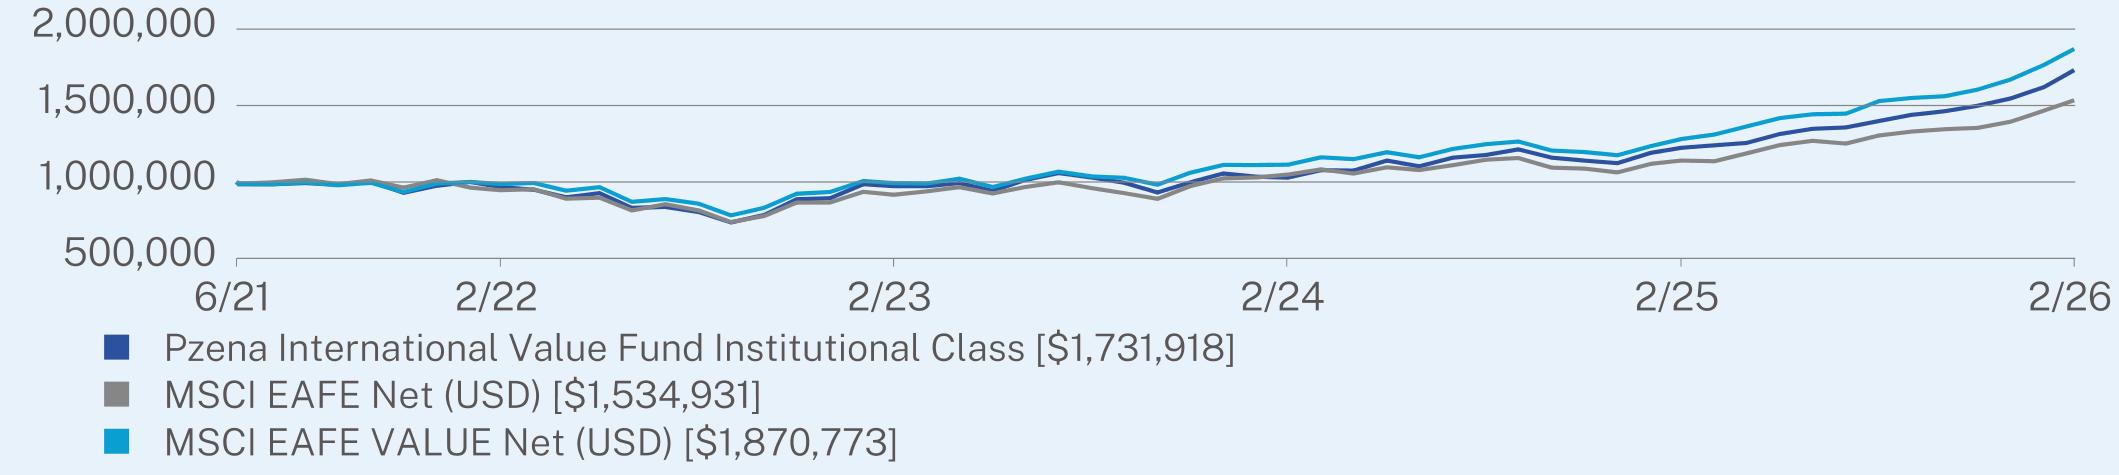
The $1,000,000 chart reflects a hypothetical $1,000,000 investment in the class of shares noted. The chart uses total return NAV performance and assumes reinvestment of dividends and capital gains. Fund expenses, including management fees and other expenses, were deducted.
CUMULATIVE PERFORMANCE (Initial Investment of $1,000,000)
| Pzena Mid Cap Value Fund
|
PAGE 1
|
TSR-AR-00770X659 |
ANNUAL AVERAGE TOTAL RETURN (%)
|
|
|
|
|
|
1 Year
|
5 Year
|
10 Year
|
|
Institutional Class
|
5.98
|
7.06
|
10.41
|
|
Russell 1000 Total Return
|
16.73
|
13.32
|
15.32
|
|
Russell Midcap Value Total Return
|
19.33
|
10.17
|
11.30
|
Visit https://www.pzena.com/americas/institutional-investors/funds/us-mutual-funds/mid-cap-value-fund-pzimx/ for more recent performance information.
| * |
The Fund’s past performance is not a good predictor of how the Fund will perform in the future. The graph and table do not reflect the deduction of taxes that a shareholder would pay on Fund distributions or redemption of Fund shares.
|
KEY FUND STATISTICS (as of February 28, 2026)
|
|
|
Net Assets
|
$98,126,725
|
|
Number of Holdings
|
40
|
|
Net Advisory Fee
|
$676,481
|
|
Portfolio Turnover
|
31%
|
WHAT DID THE FUND INVEST IN? (as of February 28, 2026)
|
|
|
Top 10 Holdings
|
(% of Net Assets)
|
|
Advance Auto Parts, Inc.
|
5.0%
|
|
Baxter International, Inc.
|
5.0%
|
|
Humana, Inc.
|
4.4%
|
|
Oshkosh Corp.
|
4.1%
|
|
Avnet, Inc.
|
3.8%
|
|
Magna International, Inc.
|
3.3%
|
|
Dollar General Corp.
|
3.2%
|
|
Adient PLC
|
3.1%
|
|
Fresenius Medical Care AG & Co. KGaA
|
3.1%
|
|
Skyworks Solutions, Inc.
|
3.1%
|
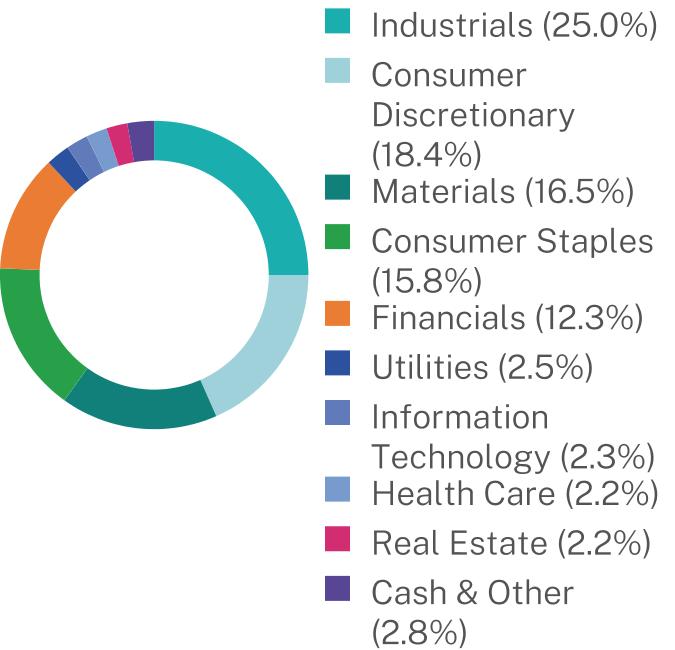
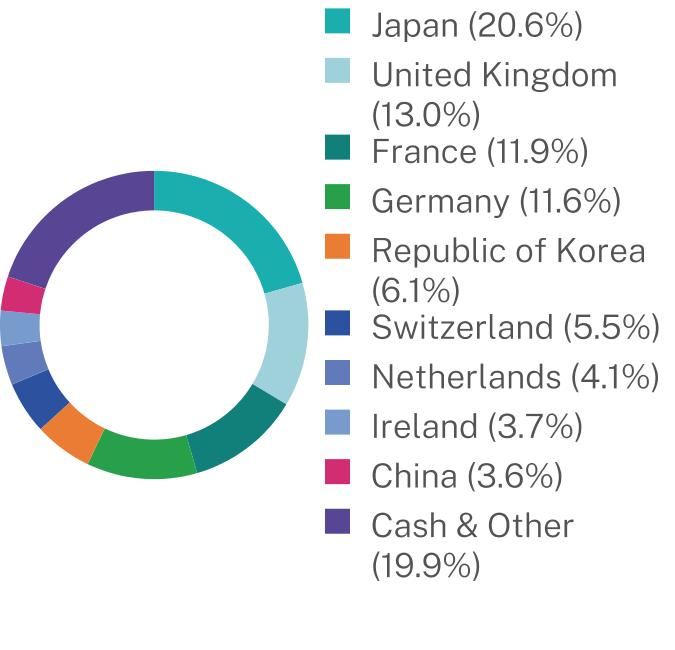
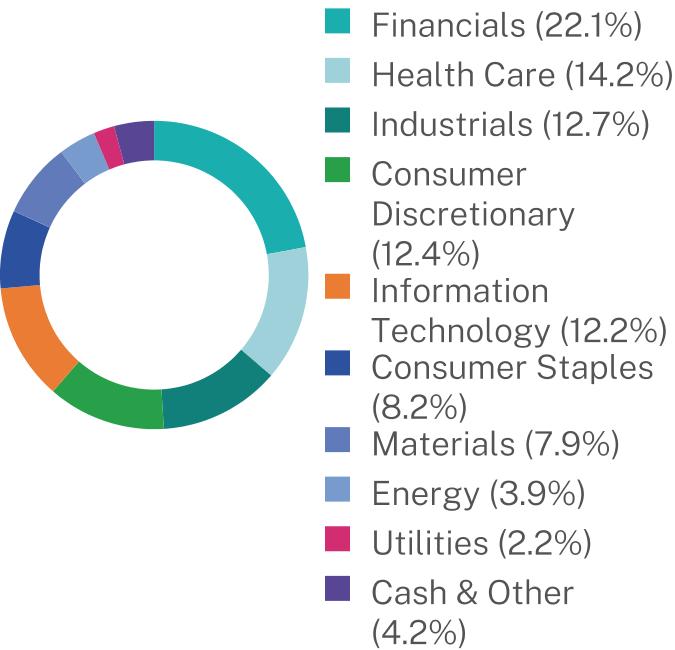
Sector Breakdown (% of Net Assets)
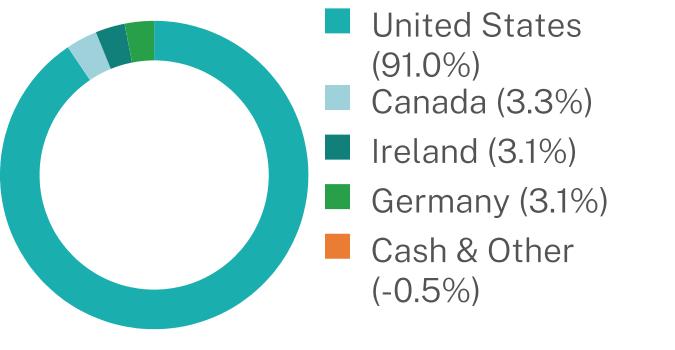
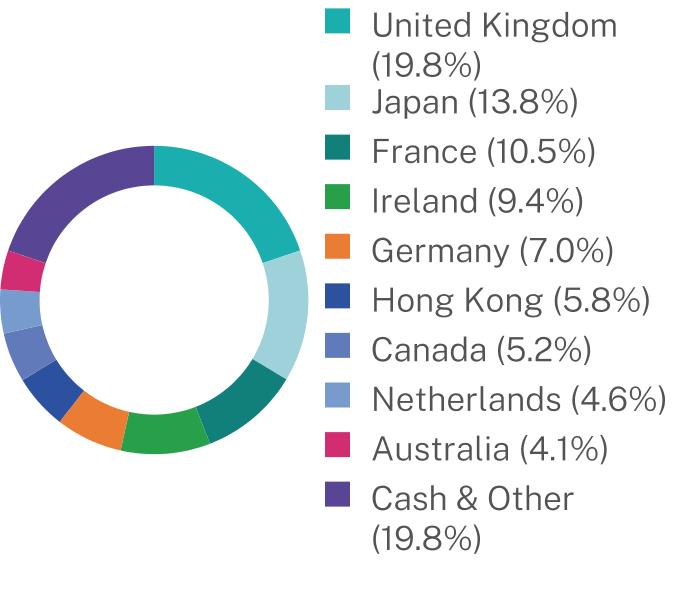
Geographic Breakdown (% of Net Assets)
For additional information about the Fund; including its prospectus, financial information, holdings and proxy information, scan the QR code or visit https://www.pzena.com/americas/institutional-investors/funds/us-mutual-funds/mid-cap-value-fund-pzimx/
HOUSEHOLDING
To reduce Fund expenses, only one copy of most shareholder documents may be mailed to shareholders with multiple accounts at the same address (Householding). If you would prefer that your Pzena Investment Management, LLC documents not be householded, please contact Pzena Investment Management, LLC at 1-844-796-1996, or contact your financial intermediary. Your instructions will typically be effective within 30 days of receipt by Pzena Investment Management, LLC or your financial intermediary.
| Pzena Mid Cap Value Fund
|
PAGE 2
|
TSR-AR-00770X659 |
10000001422061154100314204761346988191351722577242311320257416825399702691822100000012552891464915153804616583822226941253245623246443017727356432441608101000000131836613904191427045140756717978002045067197518221898142445395291809521.220.219.517.910.94.72.92.40.391.03.33.13.10.5
|
|
|
|
|
Pzena Mid Cap Value Fund
|
|
|
Investor Class | PZVMX
|
|
Annual Shareholder Report | February 28, 2026
|
This annual shareholder report contains important information about the Pzena Mid Cap Value Fund for the period of March 1, 2025, to February 28, 2026. You can find additional information about the Fund at https://www.pzena.com/americas/institutional-investors/funds/us-mutual-funds/mid-cap-value-fund-pzvmx/. You can also request this information by contacting us at 1-844-796-1996.
WHAT WERE THE FUND COSTS FOR THE PAST YEAR? (based on a hypothetical $10,000 investment)
|
|
|
|
Class Name
|
Costs of a $10,000 investment
|
Costs paid as a percentage of a $10,000 investment
|
|
Investor Class
|
$127
|
1.24%
|
HOW DID THE FUND PERFORM LAST YEAR AND WHAT AFFECTED ITS PERFORMANCE?
U.S. mid-cap equities rose modestly during the trailing 12 months, against a backdrop of volatile market swings, strong enthusiasm for AI, and continued concentration in a narrow group of market leaders. While tariff-related uncertainty periodically unsettled markets, sentiment improved as the period progressed. Sector and stock-level dispersion remained elevated within the mid-cap segment. The Fund rose but trailed its benchmark, the Russell 1000 Index.
The Fund’s consumer discretionary holdings contributed most to absolute performance, while energy and financials also added positively. In contrast, health care and basic materials were the most notable detractors from performance, with telecommunications also weighing on results.
|
|
|
Top Contributors
|
|
↑
|
Equitable Holdings, Inc., CNO Financial Group, Inc., Delta Air Lines, Inc.
|
|
|
|
Top Detractors
|
|
↓
|
JELD-WEN Holding, Inc., Olin Corporation, Dollar General Corporation
|
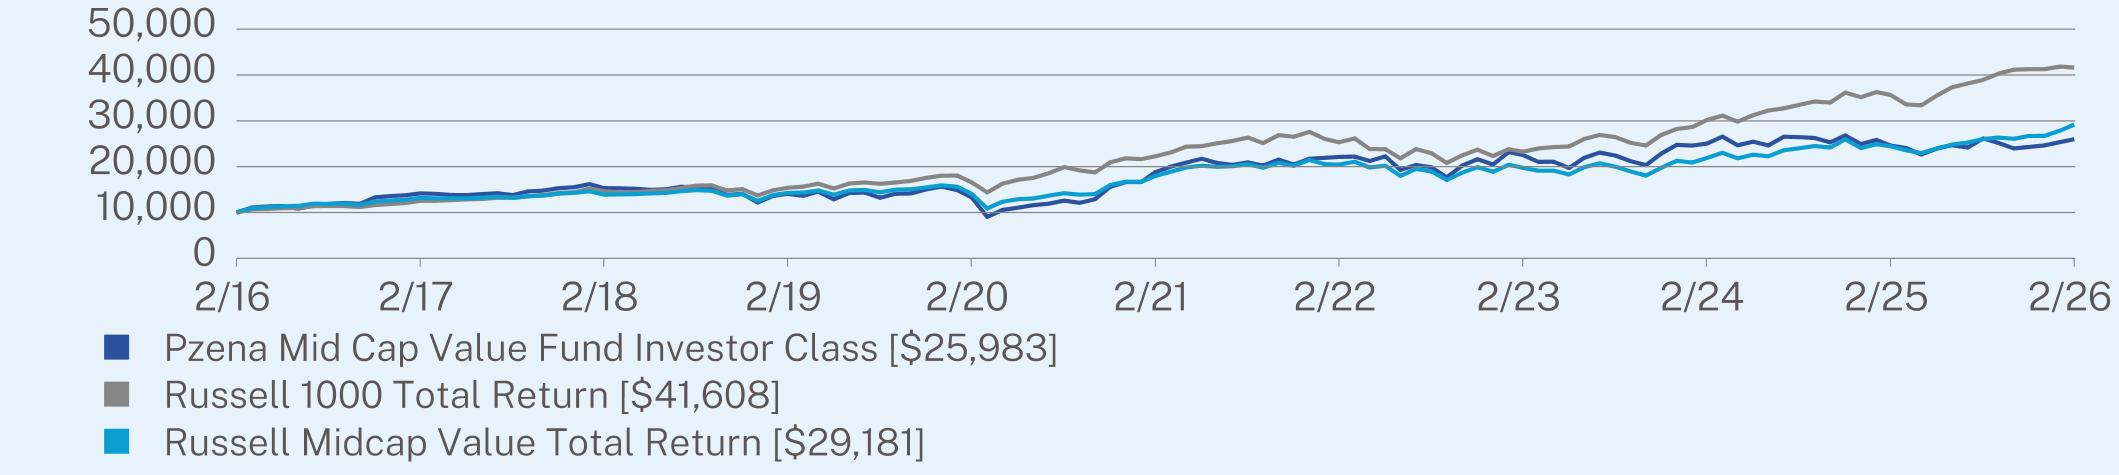
HOW DID THE FUND PERFORM OVER THE PAST 10 YEARS?*
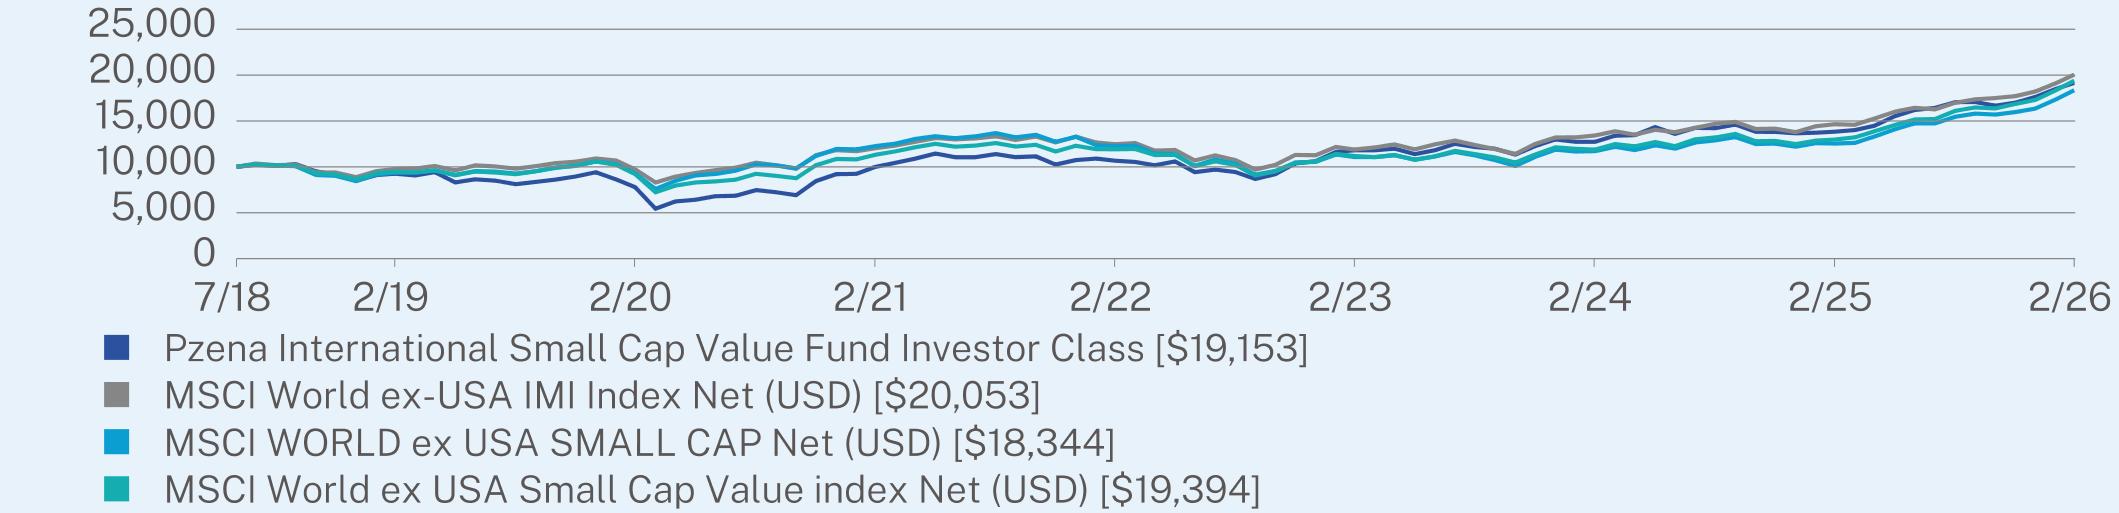
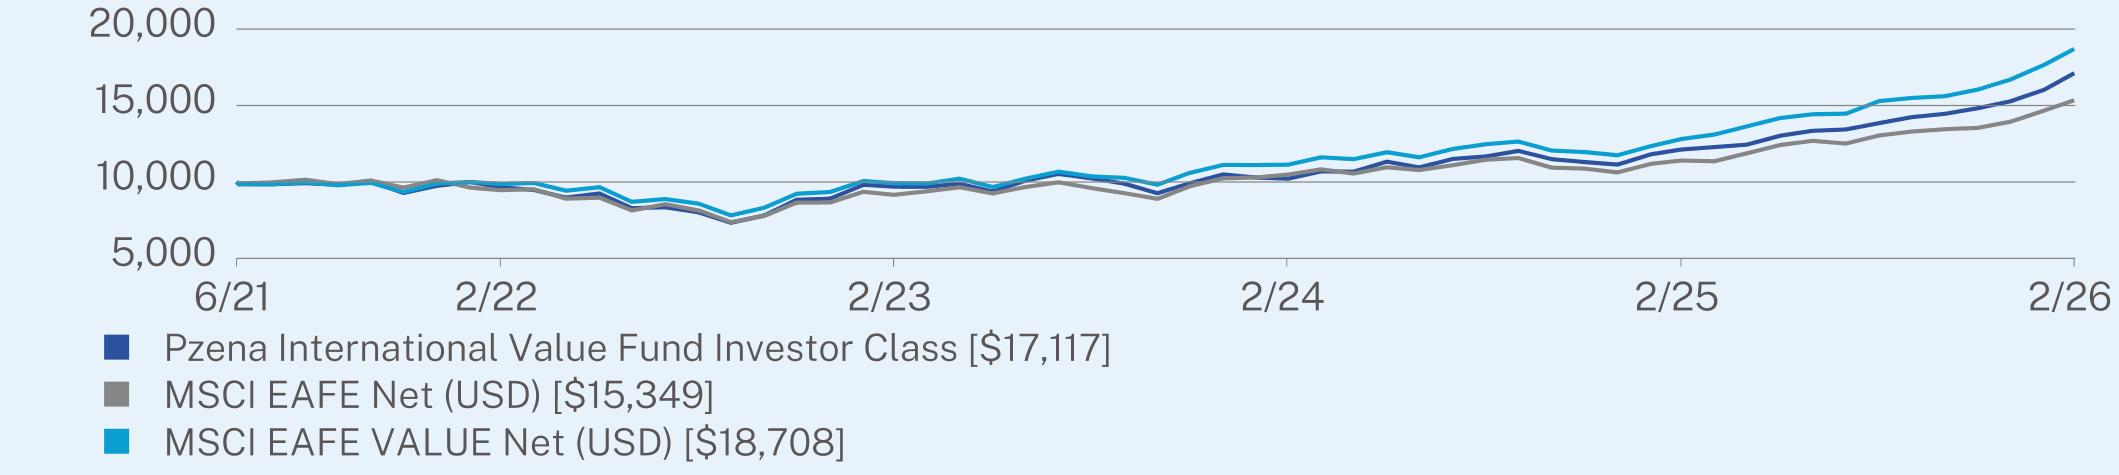
The $10,000 chart reflects a hypothetical $10,000 investment in the class of shares noted. The chart uses total return NAV performance and assumes reinvestment of dividends and capital gains. Fund expenses, including 12b-1 fees, management fees and other expenses were deducted.
CUMULATIVE PERFORMANCE (Initial Investment of $10,000)
| Pzena Mid Cap Value Fund
|
PAGE 1
|
TSR-AR-00770X667 |
ANNUAL AVERAGE TOTAL RETURN (%)
|
|
|
|
|
|
1 Year
|
5 Year
|
10 Year
|
|
Investor Class
|
5.59
|
6.65
|
10.02
|
|
Russell 1000 Total Return
|
16.73
|
13.32
|
15.32
|
|
Russell Midcap Value Total Return
|
19.33
|
10.17
|
11.30
|
Visit https://www.pzena.com/americas/institutional-investors/funds/us-mutual-funds/mid-cap-value-fund-pzvmx/ for more recent performance information.
| * |
The Fund’s past performance is not a good predictor of how the Fund will perform in the future. The graph and table do not reflect the deduction of taxes that a shareholder would pay on Fund distributions or redemption of Fund shares.
|
KEY FUND STATISTICS (as of February 28, 2026)
|
|
|
Net Assets
|
$98,126,725
|
|
Number of Holdings
|
40
|
|
Net Advisory Fee
|
$676,481
|
|
Portfolio Turnover
|
31%
|
WHAT DID THE FUND INVEST IN? (as of February 28, 2026)
|
|
|
Top 10 Holdings
|
(% of Net Assets)
|
|
Advance Auto Parts, Inc.
|
5.0%
|
|
Baxter International, Inc.
|
5.0%
|
|
Humana, Inc.
|
4.4%
|
|
Oshkosh Corp.
|
4.1%
|
|
Avnet, Inc.
|
3.8%
|
|
Magna International, Inc.
|
3.3%
|
|
Dollar General Corp.
|
3.2%
|
|
Adient PLC
|
3.1%
|
|
Fresenius Medical Care AG & Co. KGaA
|
3.1%
|
|
Skyworks Solutions, Inc.
|
3.1%
|
Sector Breakdown (% of Net Assets)
Geographic Breakdown (% of Net Assets)
For additional information about the Fund; including its prospectus, financial information, holdings and proxy information, scan the QR code or visit https://www.pzena.com/americas/institutional-investors/funds/us-mutual-funds/mid-cap-value-fund-pzvmx/
HOUSEHOLDING
To reduce Fund expenses, only one copy of most shareholder documents may be mailed to shareholders with multiple accounts at the same address (Householding). If you would prefer that your Pzena Investment Management, LLC documents not be householded, please contact Pzena Investment Management, LLC at 1-844-796-1996, or contact your financial intermediary. Your instructions will typically be effective within 30 days of receipt by Pzena Investment Management, LLC or your financial intermediary.
| Pzena Mid Cap Value Fund
|
PAGE 2
|
TSR-AR-00770X667 |
10000141731531914075133031882722126225612503124609259831000012553146491538016584222692532523246301773564341608100001318413904142701407617978204511975221898244542918121.220.219.517.910.94.72.92.40.391.03.33.13.10.5
|
|
|
|
|
Pzena Emerging Markets Value Fund
|
|
|
Institutional Class | PZIEX
|
|
Annual Shareholder Report | February 28, 2026
|
This annual shareholder report contains important information about the Pzena Emerging Markets Value Fund for the period of March 1, 2025, to February 28, 2026. You can find additional information about the Fund at https://www.pzena.com/americas/institutional-investors/funds/us-mutual-funds/emerging-markets-value-fund-pziex/. You can also request this information by contacting us at 1-844-796-1996.
WHAT WERE THE FUND COSTS FOR THE PAST YEAR? (based on a hypothetical $10,000 investment)
|
|
|
|
Class Name
|
Costs of a $10,000 investment
|
Costs paid as a percentage of a $10,000 investment
|
|
Institutional Class
|
$137
|
1.08%
|
HOW DID THE FUND PERFORM LAST YEAR AND WHAT AFFECTED ITS PERFORMANCE?
Emerging markets rose during the trailing 12 months, against a backdrop of volatile market conditions and continued strength in technology-related areas, though returns were increasingly dispersed across countries and sectors. Technology-driven gains in markets such as Korea and Taiwan, alongside strong performance in parts of Latin America, contrasted with softer results in countries including India and Indonesia. At the sector level, information technology, materials, industrials, and financials were the strongest performers, while no sector posted negative performance over the period. The Fund rose during the period and outperformed the MSCI Emerging Markets Index.
Financials, information technology, and industrials were the largest contributors to absolute performance, while consumer discretionary and consumer staples also contributed positively.
At the country level, Korea, China, and Brazil were the largest contributors to absolute performance, while Kazakhstan, South Africa, and Saudi Arabia weighed on results.
|
|
|
Top Contributors
|
|
↑
|
Hon Hai Precision Industry Co., Ltd., Alibaba Group Holding Limited, Taiwan Semiconductor Manufacturing Co., Ltd.
|
|
|
|
Top Detractors
|
|
↓
|
Samsung Electronics Co., Ltd., PT Bank Rakyat Indonesia (Persero) Tbk Class B, Hankook Tire & Technology Co., Ltd.
|
HOW DID THE FUND PERFORM OVER THE PAST 10 YEARS?*
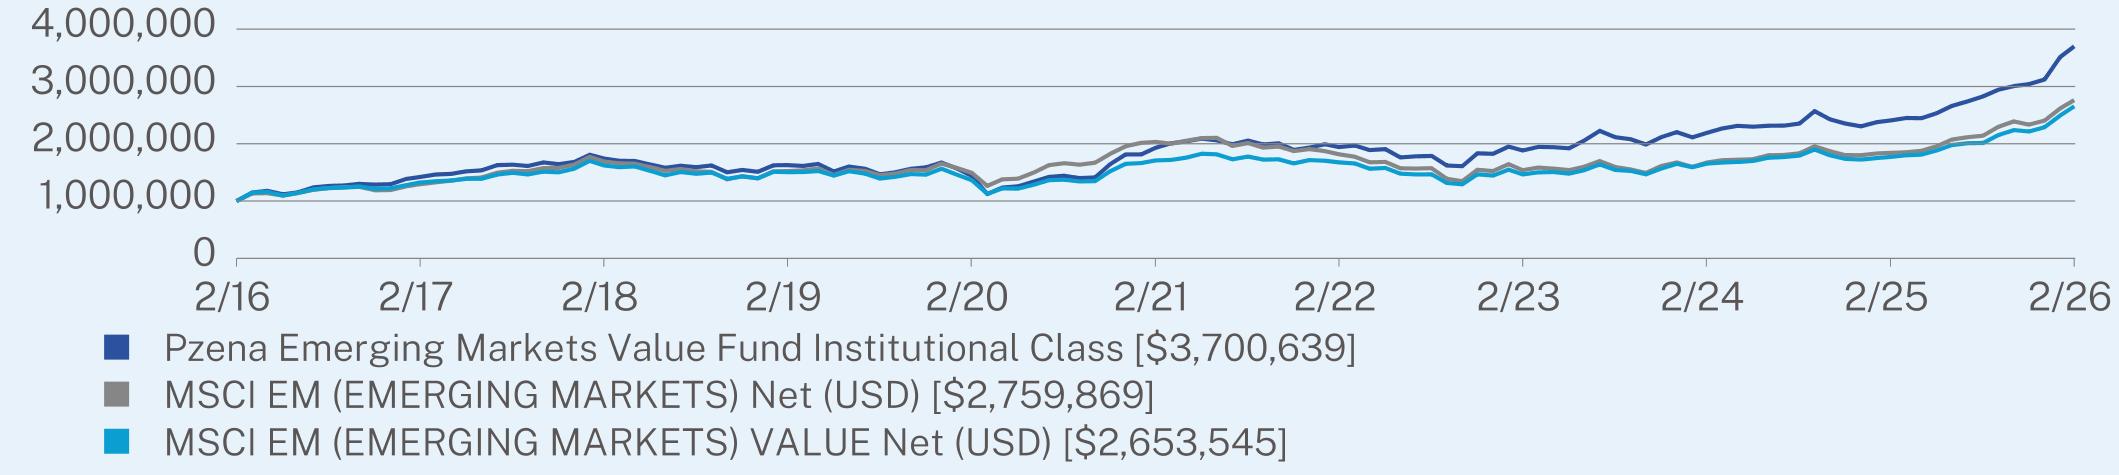
The $1,000,000 chart reflects a hypothetical $1,000,000 investment in the class of shares noted. The chart uses total return NAV performance and assumes reinvestment of dividends and capital gains. Fund expenses, including management fees and other expenses, were deducted.
CUMULATIVE PERFORMANCE (Initial Investment of $1,000,000)
| Pzena Emerging Markets Value Fund
|
PAGE 1
|
TSR-AR-00770X675 |
ANNUAL AVERAGE TOTAL RETURN (%)
|
|
|
|
|
|
1 Year
|
5 Year
|
10 Year
|
|
Institutional Class
|
53.76
|
13.92
|
13.98
|
|
MSCI EM (EMERGING MARKETS) Net (USD)
|
49.96
|
6.31
|
10.69
|
|
MSCI EM (EMERGING MARKETS) VALUE Net (USD)
|
49.90
|
9.21
|
10.25
|
Visit https://www.pzena.com/americas/institutional-investors/funds/us-mutual-funds/emerging-markets-value-fund-pziex/ for more recent performance information.
| * |
The Fund’s past performance is not a good predictor of how the Fund will perform in the future. The graph and table do not reflect the deduction of taxes that a shareholder would pay on Fund distributions or redemption of Fund shares.
|
KEY FUND STATISTICS (as of February 28, 2026)
|
|
|
Net Assets
|
$4,042,693,642
|
|
Number of Holdings
|
69
|
|
Net Advisory Fee
|
$27,725,831
|
|
Portfolio Turnover
|
28%
|
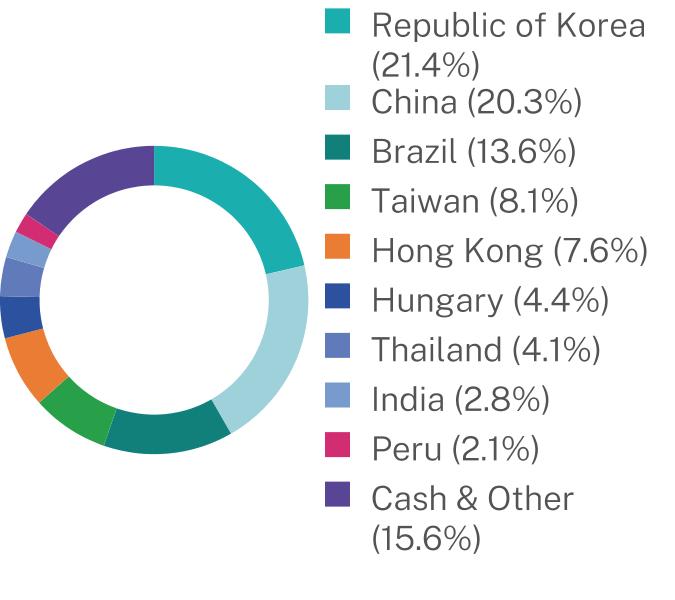
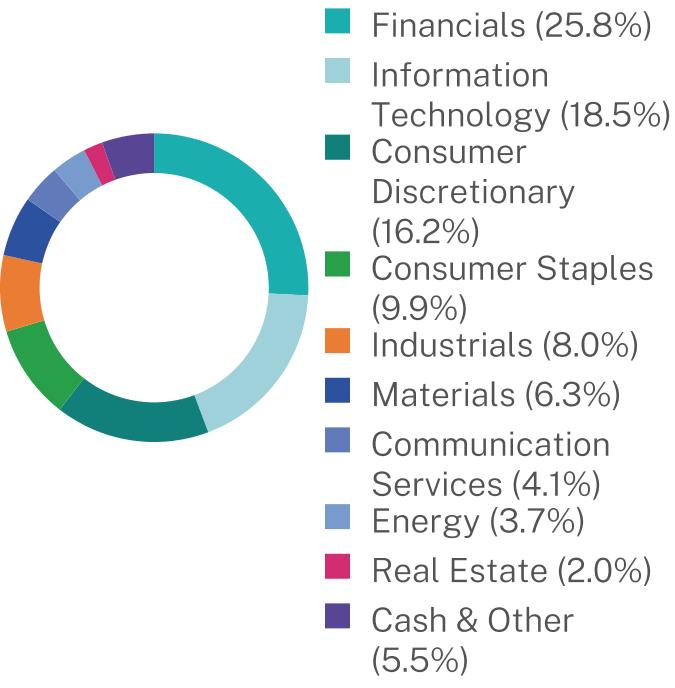
WHAT DID THE FUND INVEST IN? (as of February 28, 2026)
|
|
|
Top 10 Holdings
|
(% of Net Assets)
|
|
Samsung Electronics Co., Ltd.
|
7.3%
|
|
Taiwan Semiconductor Manufacturing Co., Ltd.
|
4.7%
|
|
Ambev S.A.
|
2.6%
|
|
Hyundai Mobis Co., Ltd.
|
2.5%
|
|
Pacific Basin Shipping, Ltd.
|
2.4%
|
|
Hankook Tire & Technology Co., Ltd.
|
2.4%
|
|
Alibaba Group Holding, Ltd.
|
2.3%
|
|
WH Group, Ltd.
|
2.2%
|
|
Credicorp, Ltd.
|
2.1%
|
|
Tencent Holdings, Ltd.
|
2.1%
|
Sector Breakdown (% of Net Assets)
Geographic Breakdown (% of Net Assets)
For additional information about the Fund; including its prospectus, financial information, holdings and proxy information, scan the QR code or visit https://www.pzena.com/americas/institutional-investors/funds/us-mutual-funds/emerging-markets-value-fund-pziex/
HOUSEHOLDING
To reduce Fund expenses, only one copy of most shareholder documents may be mailed to shareholders with multiple accounts at the same address (Householding). If you would prefer that your Pzena Investment Management, LLC documents not be householded, please contact Pzena Investment Management, LLC at 1-844-796-1996, or contact your financial intermediary. Your instructions will typically be effective within 30 days of receipt by Pzena Investment Management, LLC or your financial intermediary.
| Pzena Emerging Markets Value Fund
|
PAGE 2
|
TSR-AR-00770X675 |
10000001420081174149616270291439697192865419428361882454218965924067683700639100000012945781689557152250014938332032323181513315377001671974184039527598691000000132420016221161504841136541217084461674946146468116536791770267265354525.818.516.29.98.06.34.13.72.05.521.420.313.68.17.64.44.12.82.115.6
|
|
|
|
|
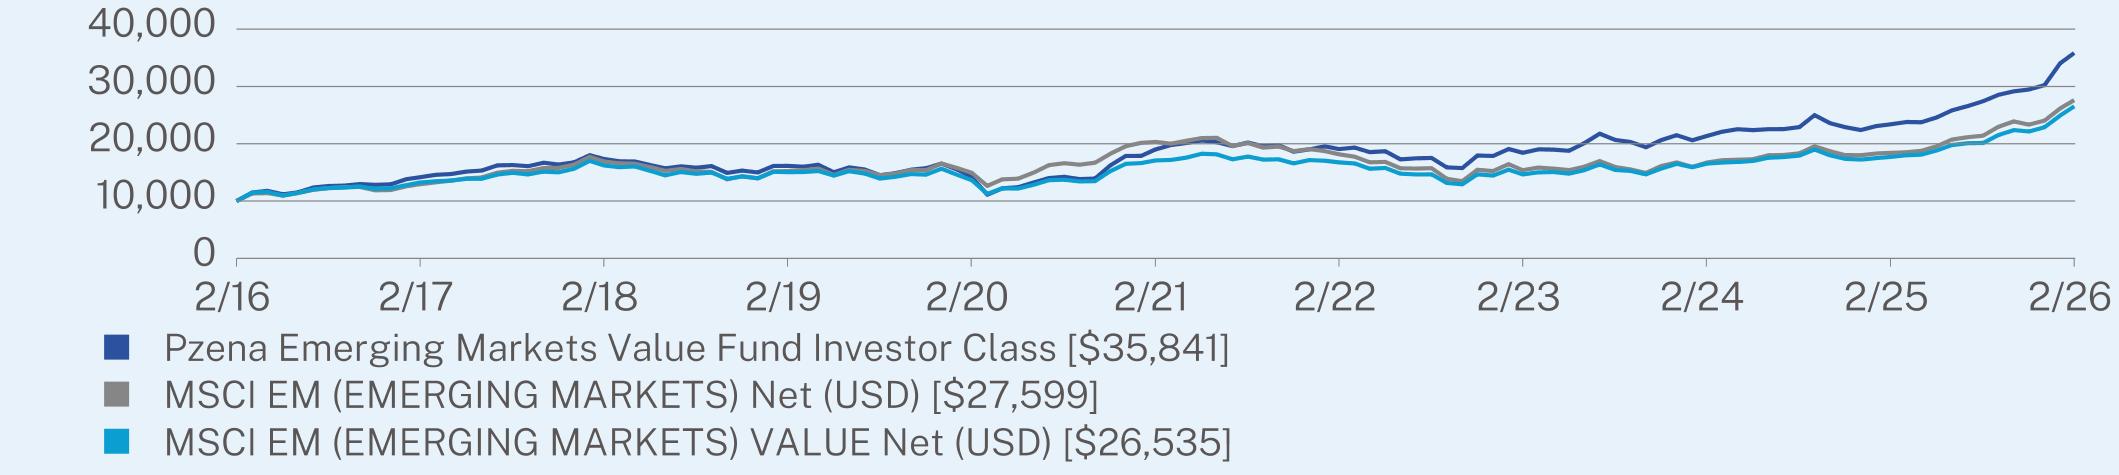
Pzena Emerging Markets Value Fund
|
|
|
Investor Class | PZVEX
|
|
Annual Shareholder Report | February 28, 2026
|
This annual shareholder report contains important information about the Pzena Emerging Markets Value Fund for the period of March 1, 2025, to February 28, 2026. You can find additional information about the Fund at https://www.pzena.com/americas/institutional-investors/funds/us-mutual-funds/emerging-markets-value-fund-pzvex/. You can also request this information by contacting us at 1-844-796-1996.
WHAT WERE THE FUND COSTS FOR THE PAST YEAR? (based on a hypothetical $10,000 investment)
|
|
|
|
Class Name
|
Costs of a $10,000 investment
|
Costs paid as a percentage of a $10,000 investment
|
|
Investor Class
|
$181
|
1.43%
|
HOW DID THE FUND PERFORM LAST YEAR AND WHAT AFFECTED ITS PERFORMANCE?
Emerging markets rose during the trailing 12 months, against a backdrop of volatile market conditions and continued strength in technology-related areas, though returns were increasingly dispersed across countries and sectors. Technology-driven gains in markets such as Korea and Taiwan, alongside strong performance in parts of Latin America, contrasted with softer results in countries including India and Indonesia. At the sector level, information technology, materials, industrials, and financials were the strongest performers, while no sector posted negative performance over the period. The Fund rose during the period and outperformed the MSCI Emerging Markets Index.
Financials, information technology, and industrials were the largest contributors to absolute performance, while consumer discretionary and consumer staples also contributed positively.
At the country level, Korea, China, and Brazil were the largest contributors to absolute performance, while Kazakhstan, South Africa, and Saudi Arabia weighed on results.
|
|
|
Top Contributors
|
|
↑
|
Hon Hai Precision Industry Co., Ltd., Alibaba Group Holding Limited, Taiwan Semiconductor Manufacturing Co., Ltd.
|
|
|
|
Top Detractors
|
|
↓
|
Samsung Electronics Co., Ltd., PT Bank Rakyat Indonesia (Persero) Tbk Class B, Hankook Tire & Technology Co., Ltd.
|
HOW DID THE FUND PERFORM OVER THE PAST 10 YEARS?*
The $10,000 chart reflects a hypothetical $10,000 investment in the class of shares noted. The chart uses total return NAV performance and assumes reinvestment of dividends and capital gains. Fund expenses, including 12b-1 fees, management fees and other expenses were deducted.
CUMULATIVE PERFORMANCE (Initial Investment of $10,000)
| Pzena Emerging Markets Value Fund
|
PAGE 1
|
TSR-AR-00770X683 |
ANNUAL AVERAGE TOTAL RETURN (%)
|
|
|
|
|
|
1 Year
|
5 Year
|
10 Year
|
|
Investor Class
|
53.19
|
13.53
|
13.62
|
|
MSCI EM (EMERGING MARKETS) Net (USD)
|
49.96
|
6.31
|
10.69
|
|
MSCI EM (EMERGING MARKETS) VALUE Net (USD)
|
49.90
|
9.21
|
10.25
|
Visit https://www.pzena.com/americas/institutional-investors/funds/us-mutual-funds/emerging-markets-value-fund-pzvex/ for more recent performance information.
| * |
The Fund’s past performance is not a good predictor of how the Fund will perform in the future. The graph and table do not reflect the deduction of taxes that a shareholder would pay on Fund distributions or redemption of Fund shares.
|
KEY FUND STATISTICS (as of February 28, 2026)
|
|
|
Net Assets
|
$4,042,693,642
|
|
Number of Holdings
|
69
|
|
Net Advisory Fee
|
$27,725,831
|
|
Portfolio Turnover
|
28%
|
WHAT DID THE FUND INVEST IN? (as of February 28, 2026)
|
|
|
Top 10 Holdings
|
(% of Net Assets)
|
|
Samsung Electronics Co., Ltd.
|
7.3%
|
|
Taiwan Semiconductor Manufacturing Co., Ltd.
|
4.7%
|
|
Ambev S.A.
|
2.6%
|
|
Hyundai Mobis Co., Ltd.
|
2.5%
|
|
Pacific Basin Shipping, Ltd.
|
2.4%
|
|
Hankook Tire & Technology Co., Ltd.
|
2.4%
|
|
Alibaba Group Holding, Ltd.
|
2.3%
|
|
WH Group, Ltd.
|
2.2%
|
|
Credicorp, Ltd.
|
2.1%
|
|
Tencent Holdings, Ltd.
|
2.1%
|
Sector Breakdown (% of Net Assets)
Geographic Breakdown (% of Net Assets)
For additional information about the Fund; including its prospectus, financial information, holdings and proxy information, scan the QR code or visit https://www.pzena.com/americas/institutional-investors/funds/us-mutual-funds/emerging-markets-value-fund-pzvex/
HOUSEHOLDING
To reduce Fund expenses, only one copy of most shareholder documents may be mailed to shareholders with multiple accounts at the same address (Householding). If you would prefer that your Pzena Investment Management, LLC documents not be householded, please contact Pzena Investment Management, LLC at 1-844-796-1996, or contact your financial intermediary. Your instructions will typically be effective within 30 days of receipt by Pzena Investment Management, LLC or your financial intermediary.
| Pzena Emerging Markets Value Fund
|
PAGE 2
|
TSR-AR-00770X683 |
10000141631734116135110961900719066184202135323396358411000012946168961522512638203231815115377167201840427599100001324216221150481126117084167491464716537177032653525.818.516.29.98.06.34.13.72.05.521.420.313.68.17.64.44.12.82.115.6
|
|
|
|
|
Pzena Small Cap Value Fund
|
|
|
Institutional Class | PZISX
|
|
Annual Shareholder Report | February 28, 2026
|
This annual shareholder report contains important information about the Pzena Small Cap Value Fund for the period of March 1, 2025, to February 28, 2026. You can find additional information about the Fund at https://www.pzena.com/americas/institutional-investors/funds/us-mutual-funds/small-cap-value-fund-pzisx/. You can also request this information by contacting us at 1-844-796-1996.
WHAT WERE THE FUND COSTS FOR THE PAST YEAR? (based on a hypothetical $10,000 investment)
|
|
|
|
Class Name
|
Costs of a $10,000 investment
|
Costs paid as a percentage of a $10,000 investment
|
|
Institutional Class
|
$106
|
1.00%
|
HOW DID THE FUND PERFORM LAST YEAR AND WHAT AFFECTED ITS PERFORMANCE?
U.S. small-cap equities rose during the trailing 12 months. Markets moved higher through year-end and into early 2026, supported by resilient economic data and stable interest-rate expectations. Small caps underperformed for much of the period, but rebounded to start 2026 as leadership broadened beyond large-cap technology toward more cyclical areas and smaller-cap stocks showed relative resilience. Dispersion across sectors and individual stocks remained elevated. The Fund rose but trailed its benchmark, the Russell 2000 Index.
The Fund’s industrials and consumer discretionary holdings contributed most to absolute performance, while financials also added positively. In contrast, basic materials and real estate were the only sectors to detract from absolute performance over the period.
|
|
|
Top Contributors
|
|
↑
|
CNO Financial Group, Inc., Columbia Banking System, Inc., Old National Bancorp
|
|
|
|
Top Detractors
|
|
↓
|
JELD-WEN Holding, Inc., Adient plc, Olin Corporation
|
HOW DID THE FUND PERFORM SINCE INCEPTION?*
The $1,000,000 chart reflects a hypothetical $1,000,000 investment in the class of shares noted. The chart uses total return NAV performance and assumes reinvestment of dividends and capital gains. Fund expenses, including management fees and other expenses, were deducted.
CUMULATIVE PERFORMANCE (Initial Investment of $1,000,000)
| Pzena Small Cap Value Fund
|
PAGE 1
|
TSR-AR-00770X394 |
ANNUAL AVERAGE TOTAL RETURN (%)
|
|
|
|
|
|
1 Year
|
5 Year
|
Since Inception
(04/27/2016)
|
|
Institutional Class
|
11.98
|
7.54
|
8.20
|
|
Russell 2000 Total Return Index
|
23.34
|
5.05
|
10.22
|
|
Russell 2000 Value Total Return
|
24.95
|
7.67
|
9.79
|
Visit https://www.pzena.com/americas/institutional-investors/funds/us-mutual-funds/small-cap-value-fund-pzisx/ for more recent performance information.
| * |
The Fund’s past performance is not a good predictor of how the Fund will perform in the future. The graph and table do not reflect the deduction of taxes that a shareholder would pay on Fund distributions or redemption of Fund shares.
|
KEY FUND STATISTICS (as of February 28, 2026)
|
|
|
Net Assets
|
$94,652,279
|
|
Number of Holdings
|
50
|
|
Net Advisory Fee
|
$315,579
|
|
Portfolio Turnover
|
41%
|
WHAT DID THE FUND INVEST IN? (as of February 28, 2026)
|
|
|
Top 10 Holdings
|
(% of Net Assets)
|
|
Advance Auto Parts, Inc.
|
4.3%
|
|
Spectrum Brands Holdings, Inc.
|
4.1%
|
|
Teleflex, Inc.
|
3.4%
|
|
Adient PLC
|
3.1%
|
|
Douglas Dynamics, Inc.
|
3.0%
|
|
Webster Financial Corp.
|
2.9%
|
|
Columbia Banking System, Inc.
|
2.8%
|
|
Avnet, Inc.
|
2.6%
|
|
Old National Bancorp of Indiana
|
2.6%
|
|
Aebi Schmidt Holding A.G.
|
2.5%
|
Sector Breakdown (% of Net Assets)
Geographic Breakdown (% of Net Assets)
For additional information about the Fund; including its prospectus, financial information, holdings and proxy information, scan the QR code or visit https://www.pzena.com/americas/institutional-investors/funds/us-mutual-funds/small-cap-value-fund-pzisx/
HOUSEHOLDING
To reduce Fund expenses, only one copy of most shareholder documents may be mailed to shareholders with multiple accounts at the same address (Householding). If you would prefer that your Pzena Investment Management, LLC documents not be householded, please contact Pzena Investment Management, LLC at 1-844-796-1996, or contact your financial intermediary. Your instructions will typically be effective within 30 days of receipt by Pzena Investment Management, LLC or your financial intermediary.
| Pzena Small Cap Value Fund
|
PAGE 2
|
TSR-AR-00770X394 |
10000001200233120287812368931087606151038216668501775154201904119402502172680100000012160691343891141887013490092036957191453817993781980203211270826057291000000125874512960591353379122761917317241846622176540518644142005731250615823.520.820.27.57.26.25.94.13.31.395.33.12.51.82.7
|
|
|
|
|
Pzena Small Cap Value Fund
|
|
|
Investor Class | PZVSX
|
|
Annual Shareholder Report | February 28, 2026
|
This annual shareholder report contains important information about the Pzena Small Cap Value Fund for the period of March 1, 2025, to February 28, 2026. You can find additional information about the Fund at https://www.pzena.com/americas/institutional-investors/funds/us-mutual-funds/small-cap-value-fund-pzvsx/. You can also request this information by contacting us at 1-844-796-1996.
WHAT WERE THE FUND COSTS FOR THE PAST YEAR? (based on a hypothetical $10,000 investment)
|
|
|
|
Class Name
|
Costs of a $10,000 investment
|
Costs paid as a percentage of a $10,000 investment
|
|
Investor Class
|
$138
|
1.30%
|
HOW DID THE FUND PERFORM LAST YEAR AND WHAT AFFECTED ITS PERFORMANCE?
U.S. small-cap equities rose during the trailing 12 months. Markets moved higher through year-end and into early 2026, supported by resilient economic data and stable interest-rate expectations. Small caps underperformed for much of the period, but rebounded to start 2026 as leadership broadened beyond large-cap technology toward more cyclical areas and smaller-cap stocks showed relative resilience. Dispersion across sectors and individual stocks remained elevated. The Fund rose but trailed its benchmark, the Russell 2000 Index.
The Fund’s industrials and consumer discretionary holdings contributed most to absolute performance, while financials also added positively. In contrast, basic materials and real estate were the only sectors to detract from absolute performance over the period.
|
|
|
Top Contributors
|
|
↑
|
CNO Financial Group, Inc., Columbia Banking System, Inc., Old National Bancorp
|
|
|
|
Top Detractors
|
|
↓
|
JELD-WEN Holding, Inc., Adient plc, Olin Corporation
|
HOW DID THE FUND PERFORM SINCE INCEPTION?*
The $10,000 chart reflects a hypothetical $10,000 investment in the class of shares noted. The chart uses total return NAV performance and assumes reinvestment of dividends and capital gains. Fund expenses, including 12b-1 fees, management fees and other expenses were deducted.
CUMULATIVE PERFORMANCE (Initial Investment of $10,000)
| Pzena Small Cap Value Fund
|
PAGE 1
|
TSR-AR-00770X410 |
ANNUAL AVERAGE TOTAL RETURN (%)
|
|
|
|
|
|
1 Year
|
5 Year
|
Since Inception
(04/27/2016)
|
|
Investor Class
|
11.62
|
7.26
|
7.90
|
|
Russell 2000 Total Return Index
|
23.34
|
5.05
|
10.22
|
|
Russell 2000 Value Total Return
|
24.95
|
7.67
|
9.79
|
Visit https://www.pzena.com/americas/institutional-investors/funds/us-mutual-funds/small-cap-value-fund-pzvsx/ for more recent performance information.
| * |
The Fund’s past performance is not a good predictor of how the Fund will perform in the future. The graph and table do not reflect the deduction of taxes that a shareholder would pay on Fund distributions or redemption of Fund shares.
|
KEY FUND STATISTICS (as of February 28, 2026)
|
|
|
Net Assets
|
$94,652,279
|
|
Number of Holdings
|
50
|
|
Net Advisory Fee
|
$315,579
|
|
Portfolio Turnover
|
41%
|
WHAT DID THE FUND INVEST IN? (as of February 28, 2026)
|
|
|
Top 10 Holdings
|
(% of Net Assets)
|
|
Advance Auto Parts, Inc.
|
4.3%
|
|
Spectrum Brands Holdings, Inc.
|
4.1%
|
|
Teleflex, Inc.
|
3.4%
|
|
Adient PLC
|
3.1%
|
|
Douglas Dynamics, Inc.
|
3.0%
|
|
Webster Financial Corp.
|
2.9%
|
|
Columbia Banking System, Inc.
|
2.8%
|
|
Avnet, Inc.
|
2.6%
|
|
Old National Bancorp of Indiana
|
2.6%
|
|
Aebi Schmidt Holding A.G.
|
2.5%
|
Sector Breakdown (% of Net Assets)
Geographic Breakdown (% of Net Assets)
For additional information about the Fund; including its prospectus, financial information, holdings and proxy information, scan the QR code or visit https://www.pzena.com/americas/institutional-investors/funds/us-mutual-funds/small-cap-value-fund-pzvsx/
HOUSEHOLDING
To reduce Fund expenses, only one copy of most shareholder documents may be mailed to shareholders with multiple accounts at the same address (Householding). If you would prefer that your Pzena Investment Management, LLC documents not be householded, please contact Pzena Investment Management, LLC at 1-844-796-1996, or contact your financial intermediary. Your instructions will typically be effective within 30 days of receipt by Pzena Investment Management, LLC or your financial intermediary.
| Pzena Small Cap Value Fund
|
PAGE 2
|
TSR-AR-00770X410 |
10000119721195912245107511488616381174201975018930211301000012161134391418913490203701914517994198022112726057100001258712961135341227617317184661765418644200572506223.520.820.27.57.26.25.94.13.31.395.33.12.51.82.7
|
|
|
|
|
Pzena International Small Cap Value Fund
|
|
|
Institutional Class | PZIIX
|
|
Annual Shareholder Report | February 28, 2026
|
This annual shareholder report contains important information about the Pzena International Small Cap Value Fund for the period of March 1, 2025, to February 28, 2026. You can find additional information about the Fund at https://www.pzena.com/americas/institutional-investors/funds/us-mutual-funds/international-small-cap-value-fund-pziix/. You can also request this information by contacting us at 1-844-796-1996.
WHAT WERE THE FUND COSTS FOR THE PAST YEAR? (based on a hypothetical $10,000 investment)
|
|
|
|
Class Name
|
Costs of a $10,000 investment
|
Costs paid as a percentage of a $10,000 investment
|
|
Institutional Class
|
$123
|
1.03%
|
HOW DID THE FUND PERFORM LAST YEAR AND WHAT AFFECTED ITS PERFORMANCE?
International small-cap equities rose during the trailing 12 months, as markets navigated periods of elevated volatility, improving sentiment, and a gradual broadening in leadership beyond the narrowest areas of the market. The backdrop was supported by stabilizing interest rate expectations and improving risk appetite, though returns remained uneven across countries, sectors, and individual companies. Against this backdrop, the Fund rose and outperformed the MSCI World ex-USA IMI Index.
The Fund’s materials, financials, consumer discretionary, and industrials holdings contributed most to absolute performance, while no sector detracted from performance over the period.
At the country level, Japan, Ireland, and the United Kingdom were among the largest contributors to performance, while Denmark was a modest detractor.
|
|
|
Top Contributors
|
|
↑
|
BPER Banca S.p.A., Unicaja Banco S.A., Yue Yuen Industrial (Holdings) Limited
|
|
|
|
Top Detractors
|
|
↓
|
ams-OSRAM AG, Nexity SA, Umicore SA
|
HOW DID THE FUND PERFORM SINCE INCEPTION?*
The $1,000,000 chart reflects a hypothetical $1,000,000 investment in the class of shares noted. The chart uses total return NAV performance and assumes reinvestment of dividends and capital gains. Fund expenses, including management fees and other expenses, were deducted.
CUMULATIVE PERFORMANCE (Initial Investment of $1,000,000)
| Pzena International Small Cap Value Fund
|
PAGE 1
|
TSR-AR-00770X345 |
ANNUAL AVERAGE TOTAL RETURN (%)
|
|
|
|
|
|
1 Year
|
5 Year
|
Since Inception
(07/02/2018)
|
|
Institutional Class
|
38.90
|
14.25
|
9.15
|
|
MSCI World ex-USA IMI Index Net (USD)
|
36.95
|
10.79
|
9.51
|
|
MSCI WORLD ex USA SMALL CAP Net (USD)
|
46.34
|
8.40
|
8.24
|
|
MSCI World ex USA Small Cap Value index Net (USD)
|
49.48
|
11.40
|
9.03
|
Visit https://www.pzena.com/americas/institutional-investors/funds/us-mutual-funds/international-small-cap-value-fund-pziix/ for more recent performance information.
| * |
The Fund’s past performance is not a good predictor of how the Fund will perform in the future. The graph and table do not reflect the deduction of taxes that a shareholder would pay on Fund distributions or redemption of Fund shares.
|
KEY FUND STATISTICS (as of February 28, 2026)
|
|
|
Net Assets
|
$225,707,857
|
|
Number of Holdings
|
50
|
|
Net Advisory Fee
|
$1,417,211
|
|
Portfolio Turnover
|
47%
|
WHAT DID THE FUND INVEST IN? (as of February 28, 2026)
|
|
|
Top 10 Holdings
|
(% of Net Assets)
|
|
Origin Enterprises PLC
|
3.9%
|
|
Kanto Denka Kogyo Co., Ltd.
|
3.9%
|
|
Senior PLC
|
3.5%
|
|
Permanent TSB Group Holdings PLC
|
3.4%
|
|
Nokian Renkaat Oyj
|
3.3%
|
|
Fukuoka Financial Group, Inc.
|
3.2%
|
|
Elders, Ltd.
|
2.9%
|
|
Unicaja Banco S.A.
|
2.8%
|
|
Sabre Insurance Group PLC
|
2.6%
|
|
Fletcher Building, Ltd.
|
2.6%
|
Sector Breakdown (% of Net Assets)
Geographic Breakdown (% of Net Assets)
For additional information about the Fund; including its prospectus, financial information, holdings and proxy information, scan the QR code or visit https://www.pzena.com/americas/institutional-investors/funds/us-mutual-funds/international-small-cap-value-fund-pziix/
HOUSEHOLDING
To reduce Fund expenses, only one copy of most shareholder documents may be mailed to shareholders with multiple accounts at the same address (Householding). If you would prefer that your Pzena Investment Management, LLC documents not be householded, please contact Pzena Investment Management, LLC at 1-844-796-1996, or contact your financial intermediary. Your instructions will typically be effective within 30 days of receipt by Pzena Investment Management, LLC or your financial intermediary.
| Pzena International Small Cap Value Fund
|
PAGE 2
|
TSR-AR-00770X345 |
100000092676378267310049801078582119433412920461408173195597910000009771609724941201471124672711887861341299146428320052801000000936995927861122561412253411106771117007612535281834423100000094652992036111306321190500111798011874121297447193940325.018.416.515.812.32.52.32.22.22.819.813.810.59.47.05.85.24.64.119.8
|
|
|
|
|
Pzena International Small Cap Value Fund
|
|
|
Investor Class | PZVIX
|
|
Annual Shareholder Report | February 28, 2026
|
This annual shareholder report contains important information about the Pzena International Small Cap Value Fund for the period of March 1, 2025, to February 28, 2026. You can find additional information about the Fund at https://www.pzena.com/americas/institutional-investors/funds/us-mutual-funds/international-small-cap-value-fund-pzvix/. You can also request this information by contacting us at 1-844-796-1996.
WHAT WERE THE FUND COSTS FOR THE PAST YEAR? (based on a hypothetical $10,000 investment)
|
|
|
|
Class Name
|
Costs of a $10,000 investment
|
Costs paid as a percentage of a $10,000 investment
|
|
Investor Class
|
$159
|
1.33%
|
HOW DID THE FUND PERFORM LAST YEAR AND WHAT AFFECTED ITS PERFORMANCE?
International small-cap equities rose during the trailing 12 months, as markets navigated periods of elevated volatility, improving sentiment, and a gradual broadening in leadership beyond the narrowest areas of the market. The backdrop was supported by stabilizing interest rate expectations and improving risk appetite, though returns remained uneven across countries, sectors, and individual companies. Against this backdrop, the Fund rose and outperformed the MSCI World ex-USA IMI Index.
The Fund’s materials, financials, consumer discretionary, and industrials holdings contributed most to absolute performance, while no sector detracted from performance over the period.
At the country level, Japan, Ireland, and the United Kingdom were among the largest contributors to performance, while Denmark was a modest detractor.
|
|
|
Top Contributors
|
|
↑
|
BPER Banca S.p.A., Unicaja Banco S.A., Yue Yuen Industrial (Holdings) Limited
|
|
|
|
Top Detractors
|
|
↓
|
ams-OSRAM AG, Nexity SA, Umicore SA
|
HOW DID THE FUND PERFORM SINCE INCEPTION?*
The $10,000 chart reflects a hypothetical $10,000 investment in the class of shares noted. The chart uses total return NAV performance and assumes reinvestment of dividends and capital gains. Fund expenses, including 12b-1 fees, management fees and other expenses were deducted.
CUMULATIVE PERFORMANCE (Initial Investment of $10,000)
| Pzena International Small Cap Value Fund
|
PAGE 1
|
TSR-AR-00770X352 |
ANNUAL AVERAGE TOTAL RETURN (%)
|
|
|
|
|
|
1 Year
|
5 Year
|
Since Inception
(07/02/2018)
|
|
Investor Class
|
38.52
|
13.92
|
8.85
|
|
MSCI World ex-USA IMI Index Net (USD)
|
36.95
|
10.79
|
9.51
|
|
MSCI WORLD ex USA SMALL CAP Net (USD)
|
46.34
|
8.40
|
8.24
|
|
MSCI World ex USA Small Cap Value index Net (USD)
|
49.48
|
11.40
|
9.03
|
Visit https://www.pzena.com/americas/institutional-investors/funds/us-mutual-funds/international-small-cap-value-fund-pzvix/ for more recent performance information.
| * |
The Fund’s past performance is not a good predictor of how the Fund will perform in the future. The graph and table do not reflect the deduction of taxes that a shareholder would pay on Fund distributions or redemption of Fund shares.
|
KEY FUND STATISTICS (as of February 28, 2026)
|
|
|
Net Assets
|
$225,707,857
|
|
Number of Holdings
|
50
|
|
Net Advisory Fee
|
$1,417,211
|
|
Portfolio Turnover
|
47%
|
WHAT DID THE FUND INVEST IN? (as of February 28, 2026)
|
|
|
Top 10 Holdings
|
(% of Net Assets)
|
|
Origin Enterprises PLC
|
3.9%
|
|
Kanto Denka Kogyo Co., Ltd.
|
3.9%
|
|
Senior PLC
|
3.5%
|
|
Permanent TSB Group Holdings PLC
|
3.4%
|
|
Nokian Renkaat Oyj
|
3.3%
|
|
Fukuoka Financial Group, Inc.
|
3.2%
|
|
Elders, Ltd.
|
2.9%
|
|
Unicaja Banco S.A.
|
2.8%
|
|
Sabre Insurance Group PLC
|
2.6%
|
|
Fletcher Building, Ltd.
|
2.6%
|
Sector Breakdown (% of Net Assets)
Geographic Breakdown (% of Net Assets)
For additional information about the Fund; including its prospectus, financial information, holdings and proxy information, scan the QR code or visit https://www.pzena.com/americas/institutional-investors/funds/us-mutual-funds/international-small-cap-value-fund-pzvix/
HOUSEHOLDING
To reduce Fund expenses, only one copy of most shareholder documents may be mailed to shareholders with multiple accounts at the same address (Householding). If you would prefer that your Pzena Investment Management, LLC documents not be householded, please contact Pzena Investment Management, LLC at 1-844-796-1996, or contact your financial intermediary. Your instructions will typically be effective within 30 days of receipt by Pzena Investment Management, LLC or your financial intermediary.
| Pzena International Small Cap Value Fund
|
PAGE 2
|
TSR-AR-00770X352 |
10000925277879983106741179612725138271915310000977297251201512467118881341314643200531000093709279122561225311068117011253518344100009465920411306119051118011874129741939425.018.416.515.812.32.52.32.22.22.819.813.810.59.47.05.85.24.64.119.8
|
|
|
|
|
Pzena International Value Fund
|
|
|
Institutional Class | PZINX
|
|
Annual Shareholder Report | February 28, 2026
|
This annual shareholder report contains important information about the Pzena International Value Fund for the period of March 1, 2025, to February 28, 2026. You can find additional information about the Fund at https://www.pzena.com/americas/institutional-investors/funds/us-mutual-funds/international-value-fund-pzinx/. You can also request this information by contacting us at 1-844-796-1996.
WHAT WERE THE FUND COSTS FOR THE PAST YEAR? (based on a hypothetical $10,000 investment)
|
|
|
|
Class Name
|
Costs of a $10,000 investment
|
Costs paid as a percentage of a $10,000 investment
|
|
Institutional Class
|
$89
|
0.74%
|
HOW DID THE FUND PERFORM LAST YEAR AND WHAT AFFECTED ITS PERFORMANCE?
International equity markets rose during the trailing 12 months, supported by improving risk appetite and strength across major regions, particularly in Europe, as leadership broadened beyond a narrow group of large-cap growth stocks. The period was marked by elevated volatility and shifting sentiment, but non-U.S. markets benefited from increased investor interest as global equity performance became less concentrated in the U.S. Value outperformed growth, and cyclical areas of the market contributed meaningfully to returns. The Fund rose and outperformed the MSCI EAFE Index.
The Fund’s financials, information technology, and consumer discretionary holdings were the largest contributors to absolute performance, while no sector detracted from absolute performance over the period, reflecting strength across cyclical and economically sensitive areas of the market.
At the country level, Japan, the United Kingdom, and Korea were among the largest contributors to performance, while no country materially detracted from performance over the period.
|
|
|
Top Contributors
|
|
↑
|
Hon Hai Precision Industry Co., Ltd. Sponsored GDR RegS, Alibaba Group Holding Limited, CaixaBank SA
|
|
|
|
Top Detractors
|
|
↓
|
Magna International Inc., Randstad NV, Galaxy Entertainment Group Limited
|
HOW DID THE FUND PERFORM SINCE INCEPTION?*
The $1,000,000 chart reflects a hypothetical $1,000,000 investment in the class of shares noted. The chart uses total return NAV performance and assumes reinvestment of dividends and capital gains. Fund expenses, including management fees and other expenses, were deducted.
CUMULATIVE PERFORMANCE (Initial Investment of $1,000,000)
| Pzena International Value Fund
|
PAGE 1
|
TSR-AR-00770X279 |
ANNUAL AVERAGE TOTAL RETURN (%)
|
|
|
|
|
1 Year
|
Since Inception
(06/28/2021)
|
|
Institutional Class
|
41.59
|
12.48
|
|
MSCI EAFE Net (USD)
|
34.63
|
9.61
|
|
MSCI EAFE VALUE Net (USD)
|
46.09
|
14.35
|
Visit https://www.pzena.com/americas/institutional-investors/funds/us-mutual-funds/international-value-fund-pzinx/ for more recent performance information.
| * |
The Fund’s past performance is not a good predictor of how the Fund will perform in the future. The graph and table do not reflect the deduction of taxes that a shareholder would pay on Fund distributions or redemption of Fund shares.
|
KEY FUND STATISTICS (as of February 28, 2026)
|
|
|
Net Assets
|
$140,408,701
|
|
Number of Holdings
|
69
|
|
Net Advisory Fee
|
$559,394
|
|
Portfolio Turnover
|
29%
|
WHAT DID THE FUND INVEST IN? (as of February 28, 2026)
|
|
|
Top 10 Holdings
|
(% of Net Assets)
|
|
Samsung Electronics Co., Ltd.
|
5.3%
|
|
HSBC Holdings PLC
|
2.8%
|
|
Murata Manufacturing Co., Ltd.
|
2.8%
|
|
Daimler Truck Holding AG
|
2.6%
|
|
ArcelorMittal S.A.
|
2.6%
|
|
Daikin Industries, Ltd.
|
2.4%
|
|
Reckitt Benckiser Group PLC
|
2.4%
|
|
ING Groep N.V.
|
2.3%
|
|
Suntory Beverage & Food, Ltd.
|
2.3%
|
|
Rexel S.A.
|
2.3%
|
Sector Breakdown (% of Net Assets)
Geographic Breakdown (% of Net Assets)
For additional information about the Fund; including its prospectus, financial information, holdings and proxy information, scan the QR code or visit https://www.pzena.com/americas/institutional-investors/funds/us-mutual-funds/international-value-fund-pzinx/
HOUSEHOLDING
To reduce Fund expenses, only one copy of most shareholder documents may be mailed to shareholders with multiple accounts at the same address (Householding). If you would prefer that your Pzena Investment Management, LLC documents not be householded, please contact Pzena Investment Management, LLC at 1-844-796-1996, or contact your financial intermediary. Your instructions will typically be effective within 30 days of receipt by Pzena Investment Management, LLC or your financial intermediary.
| Pzena International Value Fund
|
PAGE 2
|
TSR-AR-00770X279 |
10000009670689722211028142122317617319181000000945866916132104815611400811534931100000098635899240511127271280590187077322.114.212.712.412.28.27.93.92.24.220.613.011.911.66.15.54.13.73.619.9
|
|
|
|
|
Pzena International Value Fund
|
|
|
Investor Class | PZVNX
|
|
Annual Shareholder Report | February 28, 2026
|
This annual shareholder report contains important information about the Pzena International Value Fund for the period of March 1, 2025, to February 28, 2026. You can find additional information about the Fund at https://www.pzena.com/americas/institutional-investors/funds/us-mutual-funds/international-value-fund-pzvnx/. You can also request this information by contacting us at 1-844-796-1996.
WHAT WERE THE FUND COSTS FOR THE PAST YEAR? (based on a hypothetical $10,000 investment)
|
|
|
|
Class Name
|
Costs of a $10,000 investment
|
Costs paid as a percentage of a $10,000 investment
|
|
Investor Class
|
$121
|
1.00%
|
HOW DID THE FUND PERFORM LAST YEAR AND WHAT AFFECTED ITS PERFORMANCE?
International equity markets rose during the trailing 12 months, supported by improving risk appetite and strength across major regions, particularly in Europe, as leadership broadened beyond a narrow group of large-cap growth stocks. The period was marked by elevated volatility and shifting sentiment, but non-U.S. markets benefited from increased investor interest as global equity performance became less concentrated in the U.S. Value outperformed growth, and cyclical areas of the market contributed meaningfully to returns. The Fund rose and outperformed the MSCI EAFE Index.
The Fund’s financials, information technology, and consumer discretionary holdings were the largest contributors to absolute performance, while no sector detracted from absolute performance over the period, reflecting strength across cyclical and economically sensitive areas of the market.
At the country level, Japan, the United Kingdom, and Korea were among the largest contributors to performance, while no country materially detracted from performance over the period.
|
|
|
Top Contributors
|
|
↑
|
Hon Hai Precision Industry Co., Ltd. Sponsored GDR RegS, Alibaba Group Holding Limited, CaixaBank SA
|
|
|
|
Top Detractors
|
|
↓
|
Magna International Inc., Randstad NV, Galaxy Entertainment Group Limited
|
HOW DID THE FUND PERFORM SINCE INCEPTION?*
The $10,000 chart reflects a hypothetical $10,000 investment in the class of shares noted. The chart uses total return NAV performance and assumes reinvestment of dividends and capital gains. Fund expenses, including 12b-1 fees, management fees and other expenses were deducted.
CUMULATIVE PERFORMANCE (Initial Investment of $10,000)
| Pzena International Value Fund
|
PAGE 1
|
TSR-AR-00770X287 |
ANNUAL AVERAGE TOTAL RETURN (%)
|
|
|
|
|
1 Year
|
Since Inception
(06/28/2021)
|
|
Investor Class
|
41.23
|
12.19
|
|
MSCI EAFE Net (USD)
|
34.63
|
9.61
|
|
MSCI EAFE VALUE Net (USD)
|
46.09
|
14.35
|
Visit https://www.pzena.com/americas/institutional-investors/funds/us-mutual-funds/international-value-fund-pzvnx/ for more recent performance information.
| * |
The Fund’s past performance is not a good predictor of how the Fund will perform in the future. The graph and table do not reflect the deduction of taxes that a shareholder would pay on Fund distributions or redemption of Fund shares.
|
KEY FUND STATISTICS (as of February 28, 2026)
|
|
|
Net Assets
|
$140,408,701
|
|
Number of Holdings
|
69
|
|
Net Advisory Fee
|
$559,394
|
|
Portfolio Turnover
|
29%
|
WHAT DID THE FUND INVEST IN? (as of February 28, 2026)
|
|
|
Top 10 Holdings
|
(% of Net Assets)
|
|
Samsung Electronics Co., Ltd.
|
5.3%
|
|
HSBC Holdings PLC
|
2.8%
|
|
Murata Manufacturing Co., Ltd.
|
2.8%
|
|
Daimler Truck Holding AG
|
2.6%
|
|
ArcelorMittal S.A.
|
2.6%
|
|
Daikin Industries, Ltd.
|
2.4%
|
|
Reckitt Benckiser Group PLC
|
2.4%
|
|
ING Groep N.V.
|
2.3%
|
|
Suntory Beverage & Food, Ltd.
|
2.3%
|
|
Rexel S.A.
|
2.3%
|
Sector Breakdown (% of Net Assets)
Geographic Breakdown (% of Net Assets)
For additional information about the Fund; including its prospectus, financial information, holdings and proxy information, scan the QR code or visit https://www.pzena.com/americas/institutional-investors/funds/us-mutual-funds/international-value-fund-pzvnx/
HOUSEHOLDING
To reduce Fund expenses, only one copy of most shareholder documents may be mailed to shareholders with multiple accounts at the same address (Householding). If you would prefer that your Pzena Investment Management, LLC documents not be householded, please contact Pzena Investment Management, LLC at 1-844-796-1996, or contact your financial intermediary. Your instructions will typically be effective within 30 days of receipt by Pzena Investment Management, LLC or your financial intermediary.
| Pzena International Value Fund
|
PAGE 2
|
TSR-AR-00770X287 |
10000965796891021312120171171000094599161104821140115349100009864992411127128061870822.114.212.712.412.28.27.93.92.24.220.613.011.911.66.15.54.13.73.619.9
(b) Not Applicable.
Item 2. Code of Ethics.
The registrant has adopted a code of ethics that applies to the
registrant’s principal executive officer and principal financial officer. The registrant has not made any substantive amendments
to its code of ethics during the period covered by this report. The registrant has not granted any waivers from any provisions of the
code of ethics during the period covered by this report.
A copy of the registrant’s Code of Ethics is filed herewith.
Item 3. Audit Committee
Financial Expert.
The registrant’s Board of Trustees has determined that there
is at least one audit committee financial expert serving on its audit committee. Ms. Michele Rackey, Ms. Anne Kritzmire and Mr. Craig
Wainscott are the “audit committee financial experts” and are considered to be “independent” as each term is defined
in Item 3 of Form N-CSR.
Item
4. Principal Accountant Fees and Services.
The registrant has engaged
its principal accountant to perform audit services, audit-related services, tax services and other services during the past two fiscal
years. “Audit services” refer to performing an audit of the registrant’s annual financial statements or services that
are normally provided by the accountant in connection with statutory and regulatory filings or engagements for those fiscal years. “Audit-related
services” refer to the assurance and related services by the principal accountant that are reasonably related to the performance
of the audit. “Tax services” refer to professional services rendered by the principal accountant including the review of federal
income tax returns, review of federal excise tax returns, review of state tax returns, if any, and assistance with calculation of required
income, capital gain and excise distributions. There were no “other services” provided by the principal accountant. The following
table details the aggregate fees billed or expected to be billed for each of the last two fiscal years for audit fees, audit-related fees,
tax fees and other fees by the principal accountant.
| |
FYE
2/28/2026 |
FYE
2/28/2025 |
| (a) Audit Fees |
$125,000 |
$125,000 |
| (b) Audit-Related Fees |
N/A |
N/A |
| (c) Tax Fees |
$25,000 |
$25,000 |
| (d) All Other Fees |
N/A |
N/A |
(e)(1) The audit committee has adopted pre-approval policies and
procedures that require the audit committee to pre-approve all audit and non-audit services of the registrant, including services provided
to any entity affiliated with the registrant.
(e)(2) The percentage of fees billed by Deloitte and Touche LLP
applicable to non-audit services pursuant to waiver of pre-approval requirement were as follows:
| |
FYE
2/28/2026 |
FYE
2/28/2025 |
| Audit-Related Fees |
0% |
0% |
| Tax Fees |
0% |
0% |
| All Other Fees |
0% |
0% |
(f) During the audit of the registrant’s financial statements,
100 percent of the hours were attributed to work performed by persons other than full-time permanent employees of the principal accountant.
(g) The following table indicates the non-audit fees billed or expected
to be billed by the registrant’s accountant for services to the registrant and to the registrant’s investment adviser (and
any other controlling entity, etc.—not sub-adviser) for the last two years.
| Non-Audit
Related Fees |
FYE
2/28/2026 |
FYE
2/28/2025 |
| Registrant |
N/A |
N/A |
| Registrant’s Investment Adviser |
$30,000 |
$30,000 |
(h) The audit committee of the board of trustees/directors has considered
whether the provision of non-audit services that were rendered to the registrant’s investment adviser is compatible with maintaining
the principal accountant’s independence and has concluded that the provision of such non-audit services by the accountant has not
compromised the accountant’s independence.
(i) The registrant has not been identified by the U.S. Securities and
Exchange Commission as having filed an annual report issued by a registered public accounting firm branch or office that is located in
a foreign jurisdiction where the Public Company Accounting Oversight Board is unable to inspect or completely investigate because of a
position taken by an authority in that jurisdiction.
(j) The registrant is not a foreign issuer.
Item
5. Audit Committee of Listed Registrants.
Not applicable.
Item
6. Investments.
| (a) |
Schedule of Investments is included as part of the report to shareholders filed under
Item 7 of this Form. |
| |
|
| (b) |
Not applicable. |
Item
7. Financial Statements and Financial Highlights for Open-End Investment Companies.
PZENA
FUNDS
Pzena
Mid Cap Value Fund
Pzena
Emerging Markets Value Fund
Pzena
Small Cap Value Fund
Pzena
International Small Cap Value Fund
Pzena
International Value Fund
Annual
Financial Statements and Other Information
February
28, 2026
TABLE OF CONTENTS
PZENA
MID CAP VALUE FUND
SCHEDULE
OF INVESTMENTS
February
28, 2026
|
|
|
|
|
|
|
|
|
COMMON
STOCKS - 99.7%
|
|
|
|
|
|
|
|
Basic
Materials - 4.7%
|
|
|
|
|
|
|
|
FMC
Corp. |
|
|
39,811 |
|
|
$586,814
|
|
Huntsman
Corp. |
|
|
140,637 |
|
|
1,779,058
|
|
Olin
Corp. |
|
|
88,902 |
|
|
2,255,444
|
|
|
|
|
|
|
|
4,621,316
|
|
Consumer
Discretionary - 21.2%
|
|
|
|
|
|
|
|
Adient
PLC(a) |
|
|
125,523 |
|
|
3,052,719
|
|
Advance
Auto Parts, Inc. |
|
|
92,476 |
|
|
4,916,949
|
|
Dollar
General Corp. |
|
|
19,921 |
|
|
3,112,457
|
|
Lear
Corp. |
|
|
8,583 |
|
|
1,126,519
|
|
LKQ
Corp. |
|
|
65,113 |
|
|
2,155,891
|
|
Magna
International, Inc. |
|
|
51,492 |
|
|
3,246,571
|
|
Newell
Brands, Inc. |
|
|
338,861 |
|
|
1,541,818
|
|
PVH
Corp. |
|
|
23,945 |
|
|
1,642,627
|
|
|
|
|
|
|
|
20,795,551
|
|
Consumer
Staples - 2.9%
|
|
|
|
|
|
|
|
Tyson
Foods, Inc. - Class A |
|
|
43,696 |
|
|
2,839,803
|
|
Energy
- 2.4%
|
|
|
|
|
|
|
|
NOV,
Inc. |
|
|
116,835 |
|
|
2,367,077
|
|
Financials
- 17.9%
|
|
|
|
|
|
|
|
CNO
Financial Group, Inc. |
|
|
43,621 |
|
|
1,823,794
|
|
Corebridge
Financial, Inc. |
|
|
93,055 |
|
|
2,404,541
|
|
Equitable
Holdings, Inc. |
|
|
37,448 |
|
|
1,506,159
|
|
Fifth
Third Bancorp |
|
|
49,459 |
|
|
2,446,737
|
|
Globe
Life, Inc. |
|
|
17,112 |
|
|
2,485,689
|
|
Keycorp |
|
|
45,103 |
|
|
935,436
|
|
MetLife,
Inc. |
|
|
29,001 |
|
|
2,090,102
|
|
Voya
Financial, Inc. |
|
|
31,420 |
|
|
2,101,370
|
|
Webster
Financial Corp. |
|
|
23,672 |
|
|
1,707,461
|
|
|
|
|
|
|
|
17,501,289
|
|
Health
Care - 19.5%
|
|
|
|
|
|
|
|
Baxter
International, Inc. |
|
|
239,548 |
|
|
4,879,593
|
|
Fresenius
Medical Care AG & Co. KGaA - ADR |
|
|
129,999 |
|
|
3,049,777
|
|
Henry
Schein, Inc.(a) |
|
|
30,559 |
|
|
2,517,756
|
|
Humana,
Inc. |
|
|
22,588 |
|
|
4,303,917
|
|
Solventum
Corp.(a) |
|
|
26,739 |
|
|
1,984,034
|
|
Universal
Health Services, Inc. - Class B |
|
|
11,521 |
|
|
2,374,478
|
|
|
|
|
|
|
|
19,109,555
|
|
Industrials
- 20.2%
|
|
|
|
|
|
|
|
Capital
One Financial Corp. |
|
|
11,406 |
|
|
2,231,470
|
|
Dow,
Inc. |
|
|
81,363 |
|
|
2,500,285
|
|
Global
Payments, Inc. |
|
|
35,327 |
|
|
2,701,102
|
|
Knight-Swift
Transportation Holdings,
Inc. |
|
|
43,894 |
|
|
2,761,810
|
|
Oshkosh
Corp. |
|
|
23,775 |
|
|
4,042,226
|
|
Robert
Half, Inc. |
|
|
110,489 |
|
|
2,698,141
|
|
Sensata
Technologies Holding PLC |
|
|
77,253 |
|
|
2,884,627
|
|
|
|
|
|
|
|
19,819,661
|
|
|
|
|
|
|
|
|
|
|
|
|
|
|
|
|
|
Technology
- 10.9%
|
|
|
|
|
|
|
|
Avnet,
Inc. |
|
|
56,410 |
|
|
$3,714,035
|
|
Cognizant
Technology Solutions Corp. - Class A |
|
|
30,426 |
|
|
1,960,347
|
|
Concentrix
Corp. |
|
|
61,674 |
|
|
2,022,907
|
|
Skyworks
Solutions, Inc. |
|
|
50,423 |
|
|
3,004,202
|
|
|
|
|
|
|
|
10,701,491
|
|
TOTAL
COMMON STOCKS
(Cost
$91,107,316) |
|
|
|
|
|
97,755,743
|
|
SHORT-TERM
INVESTMENTS - 0.8%
|
|
|
|
|
Money
Market Funds - 0.8%
|
|
|
|
|
|
|
|
First
American Government Obligations Fund - Class X, 3.60%(b) |
|
|
827,685 |
|
|
827,685
|
|
TOTAL
SHORT-TERM INVESTMENTS
(Cost
$827,685) |
|
|
|
|
|
827,685
|
|
TOTAL
INVESTMENTS - 100.5%
(Cost
$91,935,001) |
|
|
|
|
|
$98,583,428
|
|
Liabilities
in Excess of Other
Assets
- (0.5)% |
|
|
|
|
|
(456,703)
|
|
TOTAL
NET ASSETS - 100.0% |
|
|
|
|
|
$98,126,725 |
|
|
|
|
|
|
|
|
Percentages
are stated as a percent of net assets.
ADR
- American Depositary Receipt
|
(a)
|
Non-income producing
security. |
|
(b)
|
The rate shown
represents the 7-day annualized yield as of February 28, 2026. |
The
accompanying notes are an integral part of these financial statements.
TABLE OF CONTENTS
PZENA
EMERGING MARKETS VALUE FUND
SCHEDULE
OF INVESTMENTS
February
28, 2026
|
|
|
|
|
|
|
|
|
COMMON
STOCKS - 93.9%
|
|
|
|
|
|
|
|
Brazil
- 9.8%
|
|
|
|
|
|
|
|
Ambev
S.A. |
|
|
32,747,200 |
|
|
$103,929,961
|
|
B3
S.A. - Brasil Bolsa Balcao |
|
|
18,338,000 |
|
|
64,101,621
|
|
Banco
do Brasil S.A. |
|
|
12,529,200 |
|
|
66,061,499
|
|
Natura
Cosmeticos S.A.(a) |
|
|
24,153,700 |
|
|
42,969,227
|
|
Neoenergia
S.A. |
|
|
1,179,400 |
|
|
7,559,755
|
|
Petroleo
Brasileiro SA - Petrobras |
|
|
6,260,300 |
|
|
52,155,938
|
|
Vale
S.A. |
|
|
3,540,600 |
|
|
61,080,789
|
|
|
|
|
|
|
|
397,858,790
|
|
China
- 20.3%
|
|
|
|
|
|
|
|
Alibaba
Group Holding, Ltd. |
|
|
5,028,800
|
|
|
91,854,631 |
|
Baidu,
Inc. - Class A(a) |
|
|
2,728,800 |
|
|
43,146,530
|
|
Beijing
Oriental Yuhong Waterproof Technology Co. Ltd. - Class A |
|
|
23,714,745 |
|
|
62,264,307
|
|
China
Merchants Bank Co., Ltd. - Class A |
|
|
11,074,756 |
|
|
62,597,079
|
|
China
Overseas Land & Investment, Ltd. |
|
|
44,809,118 |
|
|
82,190,716
|
|
Haier
Smart Home Co., Ltd. - Class H |
|
|
23,045,800 |
|
|
78,592,676
|
|
Ping
An Insurance Group Co. of China, Ltd. - Class H |
|
|
6,647,500 |
|
|
57,779,226
|
|
Shenzhou
International Group Holdings, Ltd. |
|
|
6,550,900 |
|
|
53,045,928
|
|
Tencent
Holdings, Ltd. |
|
|
1,278,100 |
|
|
84,625,074
|
|
Weichai
Power Co., Ltd. - Class H |
|
|
18,601,000 |
|
|
77,557,663
|
|
Zhejiang
Longsheng Group Co., Ltd. - Class A |
|
|
13,845,905 |
|
|
33,101,563
|
|
Zhongsheng
Group Holdings, Ltd. |
|
|
24,398,000 |
|
|
32,308,623
|
|
ZTO
Express Cayman, Inc. |
|
|
1,139,000 |
|
|
27,880,269
|
|
ZTO
Express Cayman, Inc. - ADR |
|
|
1,378,959 |
|
|
33,619,020
|
|
|
|
|
|
|
|
820,563,305
|
|
Hong
Kong - 7.6%
|
|
|
|
|
|
|
|
Galaxy
Entertainment Group, Ltd. |
|
|
14,131,000 |
|
|
75,428,913
|
|
Man
Wah Holdings, Ltd. |
|
|
47,250,645 |
|
|
30,802,246
|
|
Pacific
Basin Shipping, Ltd. |
|
|
215,367,066 |
|
|
95,248,875
|
|
WH
Group, Ltd.(b) |
|
|
70,507,200 |
|
|
88,681,500
|
|
Yue
Yuen Industrial (Holdings), Ltd. |
|
|
7,769,500 |
|
|
18,461,923
|
|
|
|
|
|
|
|
308,623,457
|
|
Hungary
– 4.4%
|
|
|
|
|
|
|
|
MOL
Hungarian Oil & Gas PLC |
|
|
3,486,315 |
|
|
38,567,898
|
|
OTP
Bank PLC |
|
|
676,105 |
|
|
83,338,939
|
|
Richter
Gedeon Nyrt |
|
|
1,475,383 |
|
|
55,238,245
|
|
|
|
|
|
|
|
177,145,082
|
|
India
- 2.8%
|
|
|
|
|
|
|
|
HDFC
Bank, Ltd. |
|
|
5,320,696 |
|
|
51,919,571
|
|
REC,
Ltd. |
|
|
2,585,530 |
|
|
9,941,258
|
|
UPL,
Ltd. |
|
|
7,434,791 |
|
|
52,089,812
|
|
|
|
|
|
|
|
113,950,641
|
|
Indonesia
- 1.8%
|
|
|
|
|
|
|
|
Bank
Rakyat Indonesia Persero Tbk |
|
|
304,679,400 |
|
|
71,058,542
|
|
Kazakhstan
- 1.1%
|
|
|
|
|
|
|
|
Kaspi.KZ
JSC - ADR(a) |
|
|
633,758 |
|
|
44,736,977
|
|
|
|
|
|
|
|
|
|
|
|
|
|
|
|
|
|
Luxembourg
- 1.2%
|
|
|
|
|
|
|
|
Globant
S.A.(a) |
|
|
965,087 |
|
|
$48,022,729
|
|
Peru
- 2.1%
|
|
|
|
|
|
|
|
Credicorp,
Ltd. |
|
|
247,531 |
|
|
85,739,788
|
|
Republic
of Korea - 21.4%
|
|
|
|
|
|
|
|
DB
Insurance Co., Ltd. |
|
|
324,285 |
|
|
41,276,735
|
|
Doosan
Bobcat, Inc. |
|
|
914,767 |
|
|
41,334,623
|
|
Hankook
Tire & Technology Co., Ltd. |
|
|
1,877,151
|
|
|
95,129,863
|
|
Hyundai
Mobis Co., Ltd. |
|
|
279,816 |
|
|
100,566,473
|
|
KB
Financial Group, Inc. |
|
|
630,220 |
|
|
69,659,354
|
|
Kia
Corp. |
|
|
73,101 |
|
|
10,443,000
|
|
KT
Corp. - ADR(a) |
|
|
1,573,478
|
|
|
37,448,776
|
|
Orion
Corp. |
|
|
610,788 |
|
|
56,641,724
|
|
Samsung
Electronics Co., Ltd. |
|
|
1,952,384
|
|
|
293,841,596
|
|
Shinhan
Financial Group Co., Ltd. |
|
|
954,930 |
|
|
64,325,837
|
|
WONIK
IPS Co., Ltd. |
|
|
646,815 |
|
|
56,475,470
|
|
|
|
|
|
|
|
867,143,451
|
|
Romania
- 0.4%
|
|
|
|
|
|
|
|
Banca
Transilvania S.A. |
|
|
1,942,250 |
|
|
15,537,460
|
|
Russia
- 0.0%(c)
|
|
|
|
|
|
|
|
Sberbank
of Russia PJSC - ADR(a)(d) |
|
|
408,511 |
|
|
4,085
|
|
Saudi
Arabia - 0.8%
|
|
|
|
|
|
|
|
Saudi
Arabian Oil Co.(b) |
|
|
4,695,730 |
|
|
31,247,280
|
|
Singapore
- 1.6%
|
|
|
|
|
|
|
|
Wilmar
International, Ltd. |
|
|
22,537,400 |
|
|
62,717,723
|
|
Taiwan
- 8.1%
|
|
|
|
|
|
|
|
Compal
Electronics, Inc. |
|
|
48,133,161 |
|
|
48,810,180
|
|
Hon
Hai Precision Industry Co., Ltd. |
|
|
6,810,132 |
|
|
53,021,758
|
|
Nien
Made Enterprise Co., Ltd. |
|
|
2,762,000 |
|
|
35,707,507
|
|
Taiwan
Semiconductor Manufacturing Co., Ltd. |
|
|
2,968,000 |
|
|
189,713,883
|
|
|
|
|
|
|
|
327,253,328
|
|
Thailand
- 4.1%
|
|
|
|
|
|
|
|
Bangkok
Bank Public Co., Ltd. |
|
|
5,287,900 |
|
|
30,194,700
|
|
Bangkok
Bank Public Co., Ltd. -
NVDR |
|
|
4,268,000 |
|
|
24,370,919
|
|
Indorama
Ventures PCL - NVDR |
|
|
62,996,200 |
|
|
46,408,653
|
|
SCB
X PCL |
|
|
13,259,800 |
|
|
63,345,031
|
|
|
|
|
|
|
|
164,319,303
|
|
Turkey
- 1.4%
|
|
|
|
|
|
|
|
Akbank
T.A.S. |
|
|
28,384,251 |
|
|
58,242,824
|
|
United
Kingdom - 1.6%
|
|
|
|
|
|
|
|
Standard
Chartered PLC |
|
|
749,038 |
|
|
18,493,021
|
|
Wizz
Air Holdings PLC(a) |
|
|
2,827,593 |
|
|
46,489,542
|
|
|
|
|
|
|
|
64,982,563
|
|
United
States - 1.4%
|
|
|
|
|
|
|
|
Cognizant
Technology Solutions Corp. - Class A |
|
|
878,445 |
|
|
56,598,211
|
|
|
|
|
|
|
|
|
The
accompanying notes are an integral part of these financial statements.
TABLE OF CONTENTS
PZENA
EMERGING MARKETS VALUE FUND
SCHEDULE
OF INVESTMENTS
February
28, 2026(Continued)
|
|
|
|
|
|
|
|
|
COMMON
STOCKS - (Continued)
|
|
Uruguay
- 0.8%
|
|
|
|
|
|
|
|
Arcos
Dorados Holdings, Inc. -
Class A |
|
|
3,641,568 |
|
|
$32,045,798
|
|
Vietnam
- 1.2%
|
|
|
|
|
|
|
|
Vietnam
Dairy Products JSC |
|
|
18,059,530 |
|
|
47,289,689
|
|
TOTAL
COMMON STOCKS
(Cost
$2,582,903,708) |
|
|
|
|
|
3,795,081,026
|
|
PREFERRED
STOCKS - 3.8%
|
|
|
|
|
|
|
|
Brazil
- 3.8%
|
|
|
|
|
|
|
|
Cia
Energetica de Minas Gerais, 13.45% |
|
|
29,180,263 |
|
|
69,158,333
|
|
Itau
Unibanco Holding S.A., 6.41% |
|
|
6,534,286 |
|
|
59,205,615
|
|
Petroleo
Brasileiro S.A. - Petrobras, 7.35% |
|
|
3,668,400 |
|
|
28,272,405
|
|
TOTAL
PREFERRED STOCKS
(Cost
$101,334,625) |
|
|
|
|
|
156,636,353
|
|
SHORT-TERM
INVESTMENTS - 2.1%
|
|
|
|
|
Money
Market Funds – 2.1%
|
|
|
|
|
|
|
|
First
American Government Obligations Fund - Class X, 3.60%(e) |
|
|
83,534,080 |
|
|
83,534,080
|
|
TOTAL
SHORT-TERM INVESTMENTS
(Cost
$83,534,080) |
|
|
|
|
|
83,534,080
|
|
TOTAL
INVESTMENTS - 99.8%
(Cost
$2,767,772,413) |
|
|
|
|
|
$4,035,251,459
|
|
Other
Assets in Excess of
Liabilities
- 0.2% |
|
|
|
|
|
7,442,183
|
|
TOTAL
NET ASSETS - 100.0% |
|
|
|
|
|
$4,042,693,642 |
|
|
|
|
|
|
|
|
Percentages
are stated as a percent of net assets.
ADR
- American Depositary Receipt
NVDR
- Non-Voting Depositary Receipt
|
(a)
|
Non-income producing
security.
|
|
(b)
|
Security is exempt
from registration pursuant to Rule 144A under the Securities Act of 1933, as amended. These securities may only be resold in transactions
exempt from registration to qualified institutional investors. As of February 28, 2026, the value of these securities total $119,928,780
or 3.0% of the Fund’s net assets.
|
|
(c)
|
Represents less than
0.05% of net assets.
|
|
(d)
|
Fair value determined
using significant unobservable inputs in accordance with procedures established by and under the supervision of the Adviser, acting as
Valuation Designee. These securities represented $4,085 or 0.0% of net assets as of February 28, 2026.
|
|
(e)
|
The rate shown
represents the 7-day annualized yield as of February 28, 2026. |
The
accompanying notes are an integral part of these financial statements.
TABLE OF CONTENTS
PZENA
SMALL CAP VALUE FUND
SCHEDULE
OF INVESTMENTS
February
28, 2026
|
|
|
|
|
|
|
|
|
COMMON
STOCKS - 97.8%
|
|
|
|
|
|
|
|
Basic
Materials - 7.2%
|
|
|
|
|
|
|
|
Huntsman
Corp. |
|
|
125,481 |
|
|
$1,587,335
|
|
Koppers
Holdings, Inc. |
|
|
55,463 |
|
|
2,096,501
|
|
Olin
Corp. |
|
|
77,884 |
|
|
1,975,917
|
|
Orion
S.A. |
|
|
195,293 |
|
|
1,111,217
|
|
|
|
|
|
|
|
6,770,970
|
|
Consumer
Discretionary - 20.2%
|
|
|
|
|
|
|
|
Adient
PLC(a) |
|
|
120,581 |
|
|
2,932,530
|
|
Advance
Auto Parts, Inc. |
|
|
75,734 |
|
|
4,026,777
|
|
Genesco,
Inc.(a) |
|
|
40,058 |
|
|
1,091,180
|
|
Haverty
Furniture Cos., Inc. |
|
|
56,037 |
|
|
1,334,241
|
|
Helen
of Troy, Ltd.(a) |
|
|
38,972 |
|
|
687,466
|
|
Hooker
Furnishings Corp. |
|
|
23,915 |
|
|
342,941
|
|
Malibu
Boats, Inc. - Class A(a) |
|
|
64,807 |
|
|
1,883,291
|
|
Newell
Brands, Inc. |
|
|
447,933 |
|
|
2,038,095
|
|
PVH
Corp. |
|
|
20,762 |
|
|
1,424,273
|
|
Samsonite
Group S.A. - ADR |
|
|
140,170 |
|
|
1,723,867
|
|
Winnebago
Industries, Inc. |
|
|
40,864 |
|
|
1,630,065
|
|
|
|
|
|
|
|
19,114,726
|
|
Consumer
Staples - 5.9%
|
|
|
|
|
|
|
|
Spectrum
Brands Holdings, Inc. |
|
|
48,949 |
|
|
3,836,623
|
|
Universal
Corp. |
|
|
15,031 |
|
|
807,616
|
|
USANA
Health Sciences, Inc.(a) |
|
|
43,670 |
|
|
939,778
|
|
|
|
|
|
|
|
5,584,017
|
|
Energy
- 4.1%
|
|
|
|
|
|
|
|
DNOW,
Inc.(a) |
|
|
163,772 |
|
|
1,929,234
|
|
NOV,
Inc. |
|
|
96,092 |
|
|
1,946,824
|
|
|
|
|
|
|
|
3,876,058
|
|
Financials
- 20.8%
|
|
|
|
|
|
|
|
Associated
Banc-Corp. |
|
|
85,902 |
|
|
2,268,672
|
|
Bread
Financial Holdings, Inc. |
|
|
24,454 |
|
|
1,732,810
|
|
CNO
Financial Group, Inc. |
|
|
53,408 |
|
|
2,232,988
|
|
Columbia
Banking System, Inc. |
|
|
93,499 |
|
|
2,660,047
|
|
Globe
Life, Inc. |
|
|
13,183 |
|
|
1,914,963
|
|
Old
National Bancorp of Indiana |
|
|
106,880 |
|
|
2,468,928
|
|
Univest
Financial Corp. |
|
|
41,755 |
|
|
1,400,880
|
|
Webster
Financial Corp. |
|
|
37,797 |
|
|
2,726,298
|
|
WSFS
Financial Corp. |
|
|
36,484 |
|
|
2,317,099
|
|
|
|
|
|
|
|
19,722,685
|
|
Health
Care - 7.5%
|
|
|
|
|
|
|
|
Envista
Holdings Corp.(a) |
|
|
71,580 |
|
|
2,090,852
|
|
Teleflex,
Inc. |
|
|
26,113 |
|
|
3,187,353
|
|
Varex
Imaging Corp.(a) |
|
|
139,412 |
|
|
1,836,056
|
|
|
|
|
|
|
|
7,114,261
|
|
|
|
|
|
|
|
|
|
|
|
|
|
|
|
|
|
Industrials
- 23.5%
|
|
|
|
|
|
|
|
ABM
Industries, Inc. |
|
|
48,414 |
|
|
$2,154,423
|
|
Aebi
Schmidt Holding AG |
|
|
164,052 |
|
|
2,365,630
|
|
American
Woodmark Corp.(a) |
|
|
45,646 |
|
|
2,286,864
|
|
Douglas
Dynamics, Inc. |
|
|
61,604 |
|
|
2,828,856
|
|
Korn
Ferry |
|
|
31,922 |
|
|
2,000,552
|
|
Masterbrand,
Inc.(a) |
|
|
87,340 |
|
|
883,881
|
|
Myers
Industries, Inc. |
|
|
63,529 |
|
|
1,421,144
|
|
Resideo
Technologies, Inc.(a) |
|
|
52,126 |
|
|
2,017,276
|
|
Robert
Half, Inc. |
|
|
91,401 |
|
|
2,232,012
|
|
Sensata
Technologies Holding PLC |
|
|
61,165 |
|
|
2,283,901
|
|
TriMas
Corp. |
|
|
30,440 |
|
|
1,189,595
|
|
TrueBlue,
Inc.(a) |
|
|
142,243 |
|
|
601,688
|
|
|
|
|
|
|
|
22,265,822
|
|
Real
Estate - 2.4%
|
|
|
|
|
|
|
|
Marcus
& Millichap, Inc. |
|
|
84,337 |
|
|
2,227,340
|
|
Technology
- 6.2%
|
|
|
|
|
|
|
|
Avnet,
Inc. |
|
|
37,561 |
|
|
2,473,016
|
|
Concentrix
Corp. |
|
|
57,506 |
|
|
1,886,197
|
|
ScanSource,
Inc.(a) |
|
|
41,277 |
|
|
1,518,168
|
|
|
|
|
|
|
|
5,877,381
|
|
TOTAL
COMMON STOCKS
(Cost
$88,312,860) |
|
|
|
|
|
92,553,260
|
|
REAL
ESTATE INVESTMENT TRUSTS - 0.9%
|
|
|
|
|
DiamondRock
Hospitality Co. |
|
|
88,163 |
|
|
885,156
|
|
TOTAL
REAL ESTATE
INVESTMENT
TRUSTS
(Cost
$763,659) |
|
|
|
|
|
885,156
|
|
SHORT-TERM
INVESTMENTS - 3.4%
|
|
|
|
|
|
|
|
Money
Market Funds - 3.4%
|
|
|
|
|
|
|
|
First
American Government Obligations Fund - Class X, 3.60%(b) |
|
|
3,235,984 |
|
|
3,235,984
|
|
TOTAL
SHORT-TERM INVESTMENTS
(Cost
$3,235,984) |
|
|
|
|
|
3,235,984
|
|
TOTAL
INVESTMENTS - 102.1%
(Cost
$92,312,503) |
|
|
|
|
|
$96,674,400
|
|
Liabilities
in Excess of Other
Assets
- (2.1)% |
|
|
|
|
|
(2,022,121)
|
|
TOTAL
NET ASSETS - 100.0% |
|
|
|
|
|
$94,652,279 |
|
|
|
|
|
|
|
|
Percentages
are stated as a percent of net assets.
ADR
- American Depositary Receipt
|
(a)
|
Non-income producing
security. |
|
(b)
|
The rate shown
represents the 7-day annualized yield as of February 28, 2026. |
The
accompanying notes are an integral part of these financial statements.
TABLE OF CONTENTS
PZENA
INTERNATIONAL SMALL CAP VALUE FUND
SCHEDULE
OF INVESTMENTS
February
28, 2026
|
|
|
|
|
|
|
|
|
COMMON
STOCKS - 97.2%
|
|
|
|
|
|
|
|
Australia
- 4.1%
|
|
|
|
|
|
|
|
Elders,
Ltd. |
|
|
1,252,719 |
|
|
$6,472,249
|
|
Perenti,
Ltd. |
|
|
1,645,996 |
|
|
2,752,717
|
|
|
|
|
|
|
|
9,224,966
|
|
Belgium
- 1.9%
|
|
|
|
|
|
|
|
Umicore
S.A. |
|
|
203,669 |
|
|
4,336,609
|
|
Canada
- 5.2%
|
|
|
|
|
|
|
|
Linamar
Corp. |
|
|
69,816 |
|
|
4,811,702
|
|
Spin
Master Corp.(b) |
|
|
179,510 |
|
|
2,533,315
|
|
Transcontinental,
Inc. - Class A |
|
|
255,060 |
|
|
4,349,324
|
|
|
|
|
|
|
|
11,694,341
|
|
Denmark
- 0.6%
|
|
|
|
|
|
|
|
Solar
AS - Class B |
|
|
43,233 |
|
|
1,360,517
|
|
Finland
- 3.4%
|
|
|
|
|
|
|
|
Nokian
Renkaat Oyj |
|
|
599,078 |
|
|
7,552,980
|
|
France
- 10.5%
|
|
|
|
|
|
|
|
Beneteau
SACA |
|
|
406,602 |
|
|
3,857,941
|
|
Manitou
BF S.A. |
|
|
139,177 |
|
|
3,872,834
|
|
Nexity
S.A.(a) |
|
|
436,404 |
|
|
4,916,771
|
|
Remy
Cointreau S.A. |
|
|
105,226 |
|
|
5,184,772
|
|
Rexel
S.A. |
|
|
97,064 |
|
|
4,228,651
|
|
Teleperformance
SE |
|
|
26,410 |
|
|
1,606,488
|
|
|
|
|
|
|
|
23,667,457
|
|
Germany
- 7.0%
|
|
|
|
|
|
|
|
Aurubis
AG |
|
|
11,966 |
|
|
2,443,224
|
|
Duerr
AG |
|
|
156,912 |
|
|
4,533,207
|
|
Evonik
Industries AG |
|
|
240,480 |
|
|
4,202,596
|
|
Hornbach
Holding AG & Co. KGaA |
|
|
44,929 |
|
|
4,565,578
|
|
|
|
|
|
|
|
15,744,605
|
|
Hong
Kong - 5.8%
|
|
|
|
|
|
|
|
Pacific
Basin Shipping, Ltd. |
|
|
5,286,426 |
|
|
2,337,990
|
|
VTech
Holdings, Ltd. |
|
|
614,416 |
|
|
5,069,478
|
|
Yue
Yuen Industrial (Holdings), Ltd. |
|
|
2,388,076 |
|
|
5,674,558
|
|
|
|
|
|
|
|
13,082,026
|
|
Ireland
- 9.4%
|
|
|
|
|
|
|
|
Bank
of Ireland Group PLC |
|
|
39,508 |
|
|
771,898
|
|
C&C
Group PLC |
|
|
2,445,221 |
|
|
3,875,288
|
|
Origin
Enterprises PLC |
|
|
1,773,603 |
|
|
8,885,723
|
|
Permanent
TSB Group Holdings PLC(a) |
|
|
2,013,907 |
|
|
7,567,232
|
|
|
|
|
|
|
|
21,100,141
|
|
Italy
- 2.3%
|
|
|
|
|
|
|
|
MARR
SpA |
|
|
461,829 |
|
|
5,151,382
|
|
Japan
- 13.8%
|
|
|
|
|
|
|
|
Fukuoka
Financial Group, Inc. |
|
|
163,037 |
|
|
7,144,124
|
|
Kanto
Denka Kogyo Co., Ltd. |
|
|
781,545 |
|
|
8,833,138
|
|
|
|
|
|
|
|
|
|
|
|
|
|
|
|
|
|
Sawai
Group Holdings Co., Ltd. |
|
|
338,089 |
|
|
$5,024,843
|
|
Tokai
Carbon Co., Ltd. |
|
|
611,949 |
|
|
4,363,367
|
|
Toyota
Boshoku Corp. |
|
|
279,530 |
|
|
5,729,680
|
|
|
|
|
|
|
|
31,095,152
|
|
Jersey
- 0.5%
|
|
|
|
|
|
|
|
B&M
European Value Retail S.A.(a) |
|
|
455,445 |
|
|
1,172,324 |
|
Luxembourg
- 2.5%
|
|
|
|
|
|
|
|
Samsonite
Group S.A.(b) |
|
|
2,281,800
|
|
|
5,611,605
|
|
Netherlands
- 4.6%
|
|
|
|
|
|
|
|
Ariston
Holding N.V. |
|
|
801,556 |
|
|
4,792,420 |
|
Signify
N.V.(b) |
|
|
246,199 |
|
|
5,736,721 |
|
|
|
|
|
|
|
10,529,141
|
|
New
Zealand - 2.6%
|
|
|
|
|
|
|
|
Fletcher
Building, Ltd.(a) |
|
|
2,753,037 |
|
|
5,779,616
|
|
Spain
- 2.8%
|
|
|
|
|
|
|
|
Unicaja
Banco S.A.(b) |
|
|
2,008,289 |
|
|
6,407,085
|
|
Switzerland
- 0.4%
|
|
|
|
|
|
|
|
Barry
Callebaut AG |
|
|
468 |
|
|
879,573
|
|
United
Kingdom - 19.8%
|
|
|
|
|
|
|
|
Ferrexpo
PLC(a) |
|
|
1,306,272 |
|
|
989,347
|
|
Hays
PLC |
|
|
1,686,233 |
|
|
921,709
|
|
Ibstock
PLC |
|
|
2,790,425 |
|
|
4,978,940
|
|
Pagegroup
PLC |
|
|
666,197 |
|
|
1,682,483
|
|
Pennon
Group PLC |
|
|
706,366 |
|
|
5,711,623
|
|
Sabre
Insurance Group PLC(b) |
|
|
3,221,549 |
|
|
5,947,903
|
|
Senior
PLC |
|
|
1,883,460 |
|
|
7,817,820
|
|
SThree
PLC |
|
|
1,618,876 |
|
|
3,813,586
|
|
Tate
& Lyle PLC |
|
|
1,021,661 |
|
|
5,185,202
|
|
Travis
Perkins PLC |
|
|
560,856 |
|
|
5,275,764
|
|
Wizz
Air Holdings PLC(a) |
|
|
155,397 |
|
|
2,554,942
|
|
|
|
|
|
|
|
44,879,319
|
|
TOTAL
COMMON STOCKS
(Cost
$170,338,889) |
|
|
|
|
|
219,268,839
|
|
SHORT-TERM
INVESTMENTS - 3.2%
|
|
|
|
|
|
|
|
Money
Market Funds - 3.2% |
|
|
|
|
|
|
|
First
American Government Obligations Fund - Class X, 3.60%(c) |
|
|
7,326,745 |
|
|
7,326,745
|
|
TOTAL
SHORT-TERM INVESTMENTS
(Cost
$7,326,745) |
|
|
|
|
|
7,326,745
|
|
TOTAL
INVESTMENTS - 100.4%
(Cost
$177,665,634) |
|
|
|
|
|
$226,595,584
|
|
Liabilities
in Excess of Other
Assets
- (0.4)% |
|
|
|
|
|
(887,727)
|
|
TOTAL
NET ASSETS - 100.0% |
|
|
|
|
|
$225,707,857 |
|
|
|
|
|
|
|
|
The
accompanying notes are an integral part of these financial statements.
TABLE OF CONTENTS
PZENA
INTERNATIONAL SMALL CAP VALUE FUND
SCHEDULE
OF INVESTMENTS
February
28, 2026(Continued)
Percentages
are stated as a percent of net assets.
|
(a)
|
Non-income producing
security. |
|
(b)
|
Security is exempt
from registration pursuant to Rule 144A under the Securities Act of 1933, as amended. These securities may only be resold in transactions
exempt from registration to qualified institutional investors. As of February 28, 2026, the value of these securities total $26,236,629
or 11.6% of the Fund’s net assets. |
|
(c)
|
The rate shown
represents the 7-day annualized yield as of February 28, 2026. |
The
accompanying notes are an integral part of these financial statements.
TABLE OF CONTENTS
PZENA
INTERNATIONAL VALUE FUND
SCHEDULE
OF INVESTMENTS
February
28, 2026
|
|
|
|
|
|
|
|
|
COMMON
STOCKS - 97.5%
|
|
|
|
|
|
|
|
Brazil
- 2.6%
|
|
|
|
|
|
|
|
Ambev
S.A. |
|
|
495,500 |
|
|
$1,572,571
|
|
Banco
do Brasil S.A. |
|
|
221,700 |
|
|
1,168,936
|
|
Vale
S.A. |
|
|
49,600 |
|
|
855,676
|
|
|
|
|
|
|
|
3,597,183
|
|
Canada
- 1.9%
|
|
|
|
|
|
|
|
Magna
International, Inc. |
|
|
25,582 |
|
|
1,613,070
|
|
Magna
International, Inc.(c) |
|
|
16,876 |
|
|
1,064,032
|
|
|
|
|
|
|
|
2,677,102
|
|
China
- 3.6%
|
|
|
|
|
|
|
|
Alibaba
Group Holding, Ltd. |
|
|
93,600 |
|
|
1,709,671
|
|
China
Merchants Bank Co., Ltd. -
Class H |
|
|
195,000 |
|
|
1,217,348
|
|
China
Overseas Land & Investment, Ltd. |
|
|
488,500 |
|
|
896,026
|
|
Haier
Smart Home Co., Ltd. - Class H |
|
|
374,800 |
|
|
1,278,174
|
|
|
|
|
|
|
|
5,101,219
|
|
Denmark
- 2.0%
|
|
|
|
|
|
|
|
Danske
Bank A/S |
|
|
55,398 |
|
|
2,891,846
|
|
Finland
- 1.3%
|
|
|
|
|
|
|
|
Nokia
Oyj - ADR |
|
|
242,316 |
|
|
1,870,679
|
|
France
- 11.9%
|
|
|
|
|
|
|
|
Accor
S.A. |
|
|
18,111 |
|
|
1,054,162
|
|
Amundi
S.A.(a) |
|
|
23,145 |
|
|
2,216,567
|
|
Arkema
S.A. |
|
|
22,216 |
|
|
1,626,214
|
|
Michelin
SCA |
|
|
68,252 |
|
|
2,774,242
|
|
Publicis
Groupe S.A. |
|
|
18,085 |
|
|
1,611,668
|
|
Rexel
S.A. |
|
|
74,062 |
|
|
3,226,555
|
|
Sanofi
S.A. |
|
|
30,275 |
|
|
2,940,536
|
|
Teleperformance
SE |
|
|
21,124 |
|
|
1,284,947
|
|
|
|
|
|
|
|
16,734,891
|
|
Germany
- 11.6%
|
|
|
|
|
|
|
|
BASF
SE |
|
|
51,381 |
|
|
2,956,665
|
|
Bayer
AG |
|
|
53,703 |
|
|
2,665,764
|
|
Continental
AG |
|
|
28,981 |
|
|
2,503,918
|
|
Daimler
Truck Holding AG |
|
|
71,607 |
|
|
3,640,804
|
|
Evonik
Industries AG |
|
|
70,934 |
|
|
1,239,633
|
|
Fresenius
Medical Care AG & Co. KGaA |
|
|
43,191 |
|
|
2,013,311
|
|
Mercedes-Benz
Group AG |
|
|
19,265 |
|
|
1,343,048
|
|
|
|
|
|
|
|
16,363,143
|
|
Hong
Kong – 1.7%
|
|
|
|
|
|
|
|
Galaxy
Entertainment Group, Ltd. |
|
|
438,000 |
|
|
2,337,971
|
|
Indonesia
- 0.4%
|
|
|
|
|
|
|
|
Bank
Rakyat Indonesia Persero Tbk |
|
|
2,253,600 |
|
|
525,593
|
|
Ireland
- 3.7%
|
|
|
|
|
|
|
|
Accenture
PLC - Class A |
|
|
3,781 |
|
|
789,170 |
|
Bank
of Ireland Group PLC |
|
|
143,527 |
|
|
2,804,196
|
|
Medtronic
PLC |
|
|
16,754 |
|
|
1,636,196
|
|
|
|
|
|
|
|
5,229,562
|
|
|
|
|
|
|
|
|
|
|
|
|
|
|
|
|
|
Italy
- 2.2%
|
|
|
|
|
|
|
|
Enel
S.p.A. |
|
|
253,650 |
|
|
$3,055,273
|
|
Japan
- 20.6%
|
|
|
|
|
|
|
|
Bridgestone
Corp. |
|
|
52,000 |
|
|
1,263,996
|
|
Daikin
Industries Ltd. |
|
|
26,500 |
|
|
3,379,422
|
|
Fukuoka
Financial Group, Inc. |
|
|
26,200 |
|
|
1,148,059
|
|
Iida
Group Holdings Co., Ltd. |
|
|
27,300 |
|
|
486,161
|
|
Komatsu,
Ltd. |
|
|
18,345 |
|
|
884,916
|
|
Kubota
Corp. |
|
|
105,329 |
|
|
2,142,125
|
|
Minebea
Mitsumi, Inc. |
|
|
133,700 |
|
|
2,880,074
|
|
Murata
Manufacturing Co., Ltd. |
|
|
150,400 |
|
|
3,956,349
|
|
Olympus
Corp. |
|
|
153,400 |
|
|
1,500,946
|
|
Resona
Holdings, Inc. |
|
|
121,200 |
|
|
1,482,743
|
|
Sumitomo
Mitsui Financial Group, Inc. |
|
|
24,000 |
|
|
921,641
|
|
Suntory
Beverage & Food Ltd. |
|
|
102,600 |
|
|
3,230,456
|
|
T&D
Holdings, Inc. |
|
|
11,400 |
|
|
307,621
|
|
Takeda
Pharmaceutical Co., Ltd. |
|
|
42,900 |
|
|
1,598,534
|
|
TDK
Corp. |
|
|
194,000 |
|
|
3,011,898
|
|
Toray
Industries, Inc. |
|
|
87,300 |
|
|
749,092
|
|
|
|
|
|
|
|
28,944,033
|
|
Luxembourg
- 2.6%
|
|
|
|
|
|
|
|
ArcelorMittal
S.A. |
|
|
55,260 |
|
|
3,622,579
|
|
Netherlands
- 4.1%
|
|
|
|
|
|
|
|
ING
Groep N.V. |
|
|
111,878 |
|
|
3,255,964
|
|
Koninklijke
Philips N.V. |
|
|
64,140 |
|
|
2,052,335
|
|
Randstad
N.V. |
|
|
13,080 |
|
|
430,122
|
|
|
|
|
|
|
|
5,738,421
|
|
Norway
- 2.2%
|
|
|
|
|
|
|
|
Equinor
ASA |
|
|
102,484 |
|
|
3,035,190
|
|
Republic
of Korea - 6.1%
|
|
|
|
|
|
|
|
Samsung
Electronics Co., Ltd. |
|
|
49,599 |
|
|
7,464,848
|
|
Shinhan
Financial Group Co., Ltd. |
|
|
12,850 |
|
|
865,599
|
|
Shinhan
Financial Group Co., Ltd. -
ADR |
|
|
3,710 |
|
|
247,865
|
|
|
|
|
|
|
|
8,578,312
|
|
Switzerland
- 5.5%
|
|
|
|
|
|
|
|
Julius
Baer Group, Ltd. |
|
|
32,618 |
|
|
2,783,041
|
|
Roche
Holding AG |
|
|
4,866 |
|
|
2,322,718
|
|
UBS
Group AG |
|
|
62,908 |
|
|
2,619,087
|
|
|
|
|
|
|
|
7,724,846
|
|
Thailand
- 0.5%
|
|
|
|
|
|
|
|
Bangkok
Bank PCL - NVDR |
|
|
117,100 |
|
|
668,658
|
|
United
Kingdom - 13.0%
|
|
|
|
|
|
|
|
Barclays
PLC |
|
|
191,327 |
|
|
1,167,641
|
|
GSK
PLC |
|
|
106,794 |
|
|
3,167,710
|
|
HSBC
Holdings PLC |
|
|
212,342 |
|
|
3,987,976
|
|
J
Sainsbury PLC |
|
|
576,174 |
|
|
2,709,927
|
|
Reckitt
Benckiser Group PLC |
|
|
37,985 |
|
|
3,333,560
|
|
Shell
PLC |
|
|
58,240 |
|
|
2,408,574
|
|
|
|
|
|
|
|
|
The
accompanying notes are an integral part of these financial statements.
TABLE OF CONTENTS
PZENA
INTERNATIONAL VALUE FUND
SCHEDULE
OF INVESTMENTS
February
28, 2026(Continued)
|
|
|
|
|
|
|
|
|
COMMON
STOCKS - (Continued)
|
|
|
|
|
|
|
|
United
Kingdom - (Continued)
|
|
|
Standard
Chartered PLC |
|
|
31,128 |
|
|
$768,520
|
|
Tesco
PLC |
|
|
104,139 |
|
|
674,490
|
|
|
|
|
|
|
|
18,218,398
|
|
TOTAL
COMMON STOCKS
(Cost
$91,338,032) |
|
|
|
|
|
136,914,899
|
|
SHORT-TERM
INVESTMENTS - 1.4%
|
|
|
|
|
|
|
|
Money
Market Funds – 1.4%
|
|
|
|
|
|
|
|
First
American Government Obligations Fund - Class X, 3.60%(b) |
|
|
1,963,891 |
|
|
1,963,891
|
|
TOTAL
SHORT-TERM INVESTMENTS
(Cost
$1,963,891) |
|
|
|
|
|
1,963,891
|
|
TOTAL
INVESTMENTS - 98.9%
(Cost
$93,301,923) |
|
|
|
|
|
$138,878,790
|
|
Other
Assets in Excess of
Liabilities
- 1.1% |
|
|
|
|
|
1,529,911
|
|
TOTAL
NET ASSETS - 100.0% |
|
|
|
|
|
$140,408,701 |
|
|
|
|
|
|
|
|
Percentages
are stated as a percent of net assets.
ADR
- American Depositary Receipt
|
(a)
|
Security is exempt
from registration pursuant to Rule 144A under the Securities Act of 1933, as amended. These securities may only be resold in transactions
exempt from registration to qualified institutional investors. As of February 28, 2026, the value of these securities total $2,216,567
or 1.6% of the Fund’s net assets.
|
|
(b)
|
The rate shown
represents the 7-day annualized yield as of February 28, 2026.
|
|
(c)
|
U.S. Traded Foreign
Security. |
The
accompanying notes are an integral part of these financial statements.
TABLE OF CONTENTS
Pzena
Funds
STATEMENTS
OF ASSETS AND LIABILITIES
February 28,
2026
|
|
|
|
|
|
|
|
|
|
|
|
|
|
|
|
|
|
ASSETS:
|
|
|
|
|
|
|
|
|
|
|
|
|
|
|
|
|
Investments,
at value |
|
|
$98,583,428 |
|
|
$4,035,251,459 |
|
|
$96,674,400
|
|
|
$226,595,584 |
|
|
$138,878,790 |
|
Receivable
for investments sold |
|
|
— |
|
|
33,223,214 |
|
|
—
|
|
|
1,032 |
|
|
2,101,098 |
|
Dividends
receivable |
|
|
248,457 |
|
|
9,999,412 |
|
|
147,053
|
|
|
176,760 |
|
|
201,286 |
|
Receivable
for fund shares sold |
|
|
38,267 |
|
|
6,634,528 |
|
|
43,609
|
|
|
35,099 |
|
|
2,133 |
|
Foreign
currency, at value |
|
|
— |
|
|
102,899 |
|
|
—
|
|
|
4,610 |
|
|
— |
|
Dividend
tax reclaims receivable |
|
|
54,227 |
|
|
79,863 |
|
|
—
|
|
|
232,653 |
|
|
212,344 |
|
Cash |
|
|
— |
|
|
— |
|
|
—
|
|
|
— |
|
|
28,439 |
|
Prepaid
expenses and other assets |
|
|
26,720 |
|
|
105,244 |
|
|
24,646
|
|
|
14,384 |
|
|
1,394 |
|
Total
assets |
|
|
98,951,099 |
|
|
4,085,396,619 |
|
|
96,889,708
|
|
|
227,060,122 |
|
|
141,425,484 |
|
LIABILITIES:
|
|
|
|
|
|
|
|
|
|
|
|
|
|
|
|
|
Payable
for investments purchased |
|
|
186,335 |
|
|
32,496,295 |
|
|
1,850,666
|
|
|
1,015,041 |
|
|
856,171 |
|
Deferred
foreign capital gains tax |
|
|
— |
|
|
4,680,146 |
|
|
—
|
|
|
— |
|
|
— |
|
Payable
to Adviser |
|
|
48,628 |
|
|
2,837,973 |
|
|
49,027
|
|
|
124,746 |
|
|
53,154 |
|
Payable
for capital shares redeemed |
|
|
498,267 |
|
|
1,799,504 |
|
|
244,816
|
|
|
25,000 |
|
|
— |
|
Payable
for custodian fees |
|
|
1,691 |
|
|
452,378 |
|
|
1,645
|
|
|
84,308 |
|
|
14,971 |
|
Payable
for fund administration and accounting fees |
|
|
21,591 |
|
|
215,102 |
|
|
22,552
|
|
|
30,056 |
|
|
22,118 |
|
Payable
for distribution and shareholder servicing fees |
|
|
2,218 |
|
|
70,017 |
|
|
1,906
|
|
|
7,555 |
|
|
2,022 |
|
Payable
for transfer agent fees and expenses |
|
|
7,561 |
|
|
43,552 |
|
|
8,408
|
|
|
8,951 |
|
|
7,260 |
|
Payable
for compliance fees |
|
|
2,797 |
|
|
2,797 |
|
|
2,798
|
|
|
2,797 |
|
|
2,798 |
|
Payable
for trustees’ fees |
|
|
9,992
|
|
|
5,652
|
|
|
8,690
|
|
|
10,821
|
|
|
9,645 |
|
Payable
to custodian foreign currency, at value |
|
|
— |
|
|
— |
|
|
—
|
|
|
— |
|
|
4,992 |
|
Payable
for expenses and other liabilities |
|
|
45,294 |
|
|
99,561 |
|
|
46,921
|
|
|
42,990 |
|
|
43,652 |
|
Total
liabilities |
|
|
824,374 |
|
|
42,702,977 |
|
|
2,237,429
|
|
|
1,352,265 |
|
|
1,016,783 |
|
Commitments
and Contingencies (Note 2)
|
|
|
|
|
|
|
|
|
|
|
|
|
|
|
|
|
NET
ASSETS |
|
|
$98,126,725 |
|
|
$4,042,693,642 |
|
|
$94,652,279
|
|
|
$225,707,857 |
|
|
$140,408,701 |
|
Net
Assets Consists of:
|
|
|
|
|
|
|
|
|
|
|
|
|
|
|
|
|
Paid-in
capital |
|
|
$93,188,831 |
|
|
$2,773,044,340 |
|
|
$92,342,145
|
|
|
$174,989,913 |
|
|
$93,288,513 |
|
Total
distributable earnings |
|
|
4,937,894 |
|
|
1,269,649,302 |
|
|
2,310,134
|
|
|
50,717,944 |
|
|
47,120,188 |
|
Total
net assets |
|
|
$98,126,725 |
|
|
$4,042,693,642 |
|
|
$94,652,279
|
|
|
$225,707,857 |
|
|
$140,408,701 |
|
Institutional
Class
|
|
|
|
|
|
|
|
|
|
|
|
|
|
|
|
|
Net
assets |
|
|
$96,038,145 |
|
|
$3,966,593,202 |
|
|
$91,059,357
|
|
|
$219,430,792 |
|
|
$138,554,231 |
|
Shares
issued and outstanding(a) |
|
|
8,003,850 |
|
|
218,021,634 |
|
|
6,331,230
|
|
|
15,061,552 |
|
|
9,442,670 |
|
Net
asset value per share |
|
|
$12.00 |
|
|
$18.19 |
|
|
$14.38
|
|
|
$14.57 |
|
|
$14.67 |
|
Investor
Class
|
|
|
|
|
|
|
|
|
|
|
|
|
|
|
|
|
Net
assets |
|
|
$2,088,580 |
|
|
$76,100,440 |
|
|
$3,592,922
|
|
|
$6,277,065 |
|
|
$1,854,470 |
|
Shares
issued and outstanding(a) |
|
|
171,073 |
|
|
4,206,127 |
|
|
252,733
|
|
|
432,315 |
|
|
126,542 |
|
Net
asset value per share |
|
|
$12.21 |
|
|
$18.09 |
|
|
$14.22
|
|
|
$14.52 |
|
|
$14.65 |
|
Cost:
|
|
|
|
|
|
|
|
|
|
|
|
|
|
|
|
|
Investments,
at cost |
|
|
$91,935,001 |
|
|
$2,767,772,413 |
|
|
$92,312,503
|
|
|
$177,665,634 |
|
|
$93,301,923 |
|
Foreign
currency, at cost |
|
|
$— |
|
|
$102,921 |
|
|
$—
|
|
|
$4,579 |
|
|
$— |
|
|
|
|
|
|
|
|
|
|
|
|
|
|
|
|
|
|
(a)
|
Unlimited shares authorized
without par value. |
The
accompanying notes are an integral part of these financial statements.
TABLE OF CONTENTS
Pzena
Funds
STATEMENTS
OF OPERATIONS
For
the Year Ended February 28, 2026
|
|
|
|
|
|
|
|
|
|
|
|
|
|
|
|
|
|
INVESTMENT
INCOME:
|
|
|
|
|
|
|
|
|
|
|
|
|
|
|
|
|
Dividend
income |
|
|
$2,637,107 |
|
|
$126,969,551 |
|
|
$1,297,019
|
|
|
$6,333,751 |
|
|
$4,765,593 |
|
Less:
issuance fees |
|
|
(4,571) |
|
|
(90,688) |
|
|
—
|
|
|
— |
|
|
(4,845) |
|
Less:
dividend withholding taxes |
|
|
(38,038) |
|
|
(9,945,294) |
|
|
(1,508)
|
|
|
(517,799) |
|
|
(489,825) |
|
Total
investment income |
|
|
2,594,498 |
|
|
116,933,569 |
|
|
1,295,511
|
|
|
5,815,952 |
|
|
4,270,923 |
|
EXPENSES:
|
|
|
|
|
|
|
|
|
|
|
|
|
|
|
|
|
Investment
advisory fee |
|
|
841,565 |
|
|
28,526,592 |
|
|
561,762
|
|
|
1,685,816 |
|
|
759,191 |
|
Custodian
fees |
|
|
6,878 |
|
|
1,609,629 |
|
|
6,790
|
|
|
133,667 |
|
|
50,269 |
|
Fund
administration and accounting
fees |
|
|
85,019 |
|
|
741,738 |
|
|
85,118
|
|
|
91,478 |
|
|
86,863 |
|
Transfer
agent fees |
|
|
29,008 |
|
|
157,402 |
|
|
31,696
|
|
|
33,022 |
|
|
26,993 |
|
Federal
and state registration fees |
|
|
33,548 |
|
|
155,562 |
|
|
24,567
|
|
|
43,465 |
|
|
37,324 |
|
Reports
to shareholders |
|
|
11,551 |
|
|
141,840 |
|
|
20,071
|
|
|
13,941 |
|
|
8,315 |
|
Distribution
expenses - Investor Class |
|
|
7,109 |
|
|
135,128 |
|
|
8,111
|
|
|
12,787 |
|
|
3,718 |
|
Shareholder
service costs - Investor
Class |
|
|
2,498 |
|
|
52,761 |
|
|
1,639
|
|
|
2,323 |
|
|
144 |
|
Audit
fees |
|
|
25,000 |
|
|
25,000 |
|
|
25,000
|
|
|
25,000 |
|
|
25,000 |
|
Trustees’
fees |
|
|
31,663 |
|
|
25,323 |
|
|
27,821
|
|
|
32,493 |
|
|
28,695 |
|
Compliance
fees |
|
|
11,048 |
|
|
11,048 |
|
|
11,048
|
|
|
11,047 |
|
|
11,048 |
|
Legal
fees |
|
|
3,652 |
|
|
3,327 |
|
|
3,327
|
|
|
3,900 |
|
|
3,328 |
|
Interest
expense |
|
|
2,289 |
|
|
— |
|
|
5,369
|
|
|
64 |
|
|
480 |
|
Other
expenses and fees |
|
|
30,623 |
|
|
211,960 |
|
|
34,942
|
|
|
22,493 |
|
|
26,604 |
|
Total
expenses |
|
|
1,121,451 |
|
|
31,797,310 |
|
|
847,261
|
|
|
2,111,496 |
|
|
1,067,972 |
|
Expense
reimbursement by Adviser |
|
|
(165,084) |
|
|
(800,761) |
|
|
(246,183)
|
|
|
(268,605) |
|
|
(199,797) |
|
Net
expenses |
|
|
956,367 |
|
|
30,996,549 |
|
|
601,078
|
|
|
1,842,891 |
|
|
868,175 |
|
Net
investment income (loss) |
|
|
1,638,131 |
|
|
85,937,020 |
|
|
694,433
|
|
|
3,973,061 |
|
|
3,402,748 |
|
REALIZED
AND UNREALIZED GAIN (LOSS)
|
|
|
|
|
|
|
|
|
|
|
|
|
|
|
|
|
Net
realized gain (loss) from:
|
|
|
|
|
|
|
|
|
|
|
|
|
|
|
|
|
Investments |
|
|
(1,575,990) |
|
|
66,640,244 |
|
|
(2,351,989)
|
|
|
3,697,897 |
|
|
3,832,379 |
|
Foreign
currency translation |
|
|
— |
|
|
(817,057) |
|
|
—
|
|
|
(9,538) |
|
|
(15,365) |
|
Non-U.S.
Taxes |
|
|
—
|
|
|
(1,555,118)
|
|
|
—
|
|
|
—
|
|
|
—
|
|
Net
realized gain (loss) |
|
|
(1,575,990) |
|
|
64,268,069 |
|
|
(2,351,989)
|
|
|
3,688,359 |
|
|
3,817,014 |
|
Net
change in unrealized appreciation (depreciation) on:
|
|
|
|
|
|
|
|
|
|
|
|
|
|
|
|
|
Investments |
|
|
3,927,570 |
|
|
1,164,967,252 |
|
|
7,969,523
|
|
|
49,031,489 |
|
|
34,727,525
|
|
Foreign
currency translation |
|
|
6 |
|
|
628,851 |
|
|
—
|
|
|
15,451 |
|
|
22,521
|
|
Deferred
Non-U.S. Taxes |
|
|
—
|
|
|
(1,103,755)
|
|
|
—
|
|
|
—
|
|
|
—
|
|
Net
change in unrealized appreciation (depreciation) |
|
|
3,927,576 |
|
|
1,164,492,348 |
|
|
7,969,523
|
|
|
49,046,940 |
|
|
34,750,046 |
|
Net
realized and unrealized gain (loss) |
|
|
2,351,586 |
|
|
1,228,760,417 |
|
|
5,617,534
|
|
|
52,735,299 |
|
|
38,567,060 |
|
NET
INCREASE (DECREASE) IN NET ASSETS RESULTING FROM OPERATIONS |
|
|
$3,989,717 |
|
|
$1,314,697,437 |
|
|
$6,311,967 |
|
|
$56,708,360 |
|
|
$41,969,808 |
|
|
|
|
|
|
|
|
|
|
|
|
|
|
|
|
|
The
accompanying notes are an integral part of these financial statements.
TABLE OF CONTENTS
Pzena
FundS
Statements
of Changes in Net Assets
|
|
|
|
|
|
|
|
|
OPERATIONS:
|
|
|
|
|
|
|
|
|
|
|
|
|
|
Net
investment income (loss) |
|
|
$1,638,131 |
|
|
$1,954,754 |
|
|
$85,937,020 |
|
|
$67,707,451
|
|
Net
realized gain (loss):
|
|
|
|
|
|
|
|
|
|
|
|
|
|
Investments |
|
|
(1,575,990) |
|
|
18,081,294 |
|
|
66,640,244 |
|
|
106,793,145
|
|
Foreign
currency translation |
|
|
—
|
|
|
—
|
|
|
(817,057)
|
|
|
(2,010,513) |
|
Non-U.S.
Taxes |
|
|
— |
|
|
—
|
|
|
(1,555,118)
|
|
|
(7,857,597) |
|
Net
change in unrealized appreciation (depreciation) on:
|
|
|
|
|
|
|
|
|
|
|
|
|
|
Investments
|
|
|
3,927,570 |
|
|
(21,769,126)
|
|
|
1,164,967,252
|
|
|
13,945,662
|
|
Foreign
currency translation |
|
|
6
|
|
|
(8)
|
|
|
628,851
|
|
|
(208,289) |
|
Deferred
non-U.S. Taxes |
|
|
—
|
|
|
—
|
|
|
(1,103,755)
|
|
|
(3,576,391) |
|
Net
increase (decrease) in net assets from operations |
|
|
3,989,717 |
|
|
(1,733,086) |
|
|
1,314,697,437 |
|
|
174,793,468
|
|
DISTRIBUTIONS
TO SHAREHOLDERS:
|
|
|
|
|
|
|
|
|
|
|
|
|
|
From
earnings - Institutional Class |
|
|
(4,057,099) |
|
|
(21,562,211) |
|
|
(146,733,081) |
|
|
(138,217,242)
|
|
From
earnings - Investor Class |
|
|
(80,767) |
|
|
(1,091,717) |
|
|
(2,721,898) |
|
|
(2,951,017)
|
|
Total
distributions to shareholders |
|
|
(4,137,866) |
|
|
(22,653,928) |
|
|
(149,454,979) |
|
|
(141,168,259)
|
|
CAPITAL
TRANSACTIONS:
|
|
|
|
|
|
|
|
|
|
|
|
|
|
Shares
sold - Institutional Class |
|
|
8,642,367 |
|
|
18,942,956 |
|
|
1,187,039,818 |
|
|
918,399,856
|
|
Shares
issued from reinvestment of
distributions -
Institutional Class |
|
|
3,127,918 |
|
|
12,116,221 |
|
|
104,112,416 |
|
|
94,472,625
|
|
Shares
redeemed - Institutional Class |
|
|
(45,303,685) |
|
|
(17,583,164) |
|
|
(561,972,914) |
|
|
(530,968,915)
|
|
Shares
sold - Investor Class |
|
|
298,768 |
|
|
737,649 |
|
|
33,333,467 |
|
|
16,959,682
|
|
Shares
issued from reinvestment of distributions - Investor Class |
|
|
61,320 |
|
|
996,839 |
|
|
2,687,761 |
|
|
2,884,744
|
|
Shares
redeemed - Investor Class |
|
|
(3,795,862) |
|
|
(2,605,426) |
|
|
(25,723,018) |
|
|
(19,467,847)
|
|
Net
increase (decrease) in net assets from capital transactions |
|
|
(36,969,174) |
|
|
12,605,075 |
|
|
739,477,530 |
|
|
482,280,145
|
|
NET
INCREASE (DECREASE) IN NET ASSETS |
|
|
(37,117,323) |
|
|
(11,781,939) |
|
|
1,904,719,988 |
|
|
515,905,354
|
|
NET
ASSETS:
|
|
|
|
|
|
|
|
|
|
|
|
|
|
Beginning
of the year |
|
|
135,244,048 |
|
|
147,025,987 |
|
|
2,137,973,654 |
|
|
1,622,068,300
|
|
End
of the year |
|
|
$98,126,725 |
|
|
$135,244,048 |
|
|
$4,042,693,642 |
|
|
$2,137,973,654
|
|
SHARES
TRANSACTIONS
|
|
|
|
|
|
|
|
|
|
|
|
|
|
Shares
sold - Institutional Class |
|
|
735,147 |
|
|
1,514,254 |
|
|
81,280,821 |
|
|
72,468,038
|
|
Shares
issued from reinvestment of distributions - Institutional Class |
|
|
270,581 |
|
|
1,030,291 |
|
|
6,922,368 |
|
|
7,918,912
|
|
Shares
redeemed - Institutional Class |
|
|
(3,966,315) |
|
|
(1,299,054) |
|
|
(38,937,994) |
|
|
(41,963,382)
|
|
Shares
sold - Investor Class |
|
|
25,072 |
|
|
52,362 |
|
|
2,253,237 |
|
|
1,333,723
|
|
Shares
issued from reinvestment of distributions - Investor Class |
|
|
5,210 |
|
|
83,139 |
|
|
179,543 |
|
|
242,619
|
|
Shares
redeemed - Investor Class |
|
|
(321,921) |
|
|
(197,842) |
|
|
(1,758,348) |
|
|
(1,544,524)
|
|
Total
increase (decrease) in shares outstanding |
|
|
(3,252,226) |
|
|
1,183,150 |
|
|
49,939,627 |
|
|
38,455,386 |
|
|
|
|
|
|
|
|
|
|
|
|
|
|
The
accompanying notes are an integral part of these financial statements.
TABLE OF CONTENTS
Pzena
FundS
Statements
of Changes in Net Assets(Continued)
|
|
|
|
|
|
|
|
|
OPERATIONS:
|
|
|
|
|
|
|
|
|
|
|
|
|
|
Net
investment income (loss) |
|
|
$694,433 |
|
|
$441,186
|
|
|
$3,973,061 |
|
|
$785,485 |
|
Net
realized gain (loss):
|
|
|
|
|
|
|
|
|
|
|
|
|
|
Investments |
|
|
(2,351,989) |
|
|
5,400,443
|
|
|
3,697,897
|
|
|
2,027,353 |
|
Foreign
currency translation |
|
|
—
|
|
|
—
|
|
|
(9,538)
|
|
|
(14,381) |
|
Net
change in unrealized appreciation (depreciation) on:
|
|
|
|
|
|
|
|
|
|
|
|
|
|
Investments |
|
|
7,969,523
|
|
|
(8,654,293)
|
|
|
49,031,489
|
|
|
(809,779) |
|
Foreign
currency translation |
|
|
—
|
|
|
—
|
|
|
15,451
|
|
|
(4,313)
|
|
Net
increase (decrease) in net assets from operations |
|
|
6,311,967 |
|
|
(2,812,664)
|
|
|
56,708,360 |
|
|
1,984,365 |
|
DISTRIBUTIONS
TO SHAREHOLDERS:
|
|
|
|
|
|
|
|
|
|
|
|
|
|
From
earnings - Institutional Class |
|
|
(1,681,193) |
|
|
(3,881,100)
|
|
|
(5,574,473) |
|
|
(2,724,867) |
|
From
earnings - Investor Class |
|
|
(72,342) |
|
|
(311,220)
|
|
|
(147,200) |
|
|
(353,089) |
|
Total
distributions to shareholders |
|
|
(1,753,535) |
|
|
(4,122,320)
|
|
|
(5,721,673) |
|
|
(3,077,956) |
|
CAPITAL
TRANSACTIONS:
|
|
|
|
|
|
|
|
|
|
|
|
|
|
Shares
sold - Institutional Class |
|
|
57,065,433 |
|
|
26,851,205
|
|
|
123,465,056 |
|
|
37,262,400 |
|
Shares
issued from reinvestment of distributions - Institutional Class |
|
|
1,647,306 |
|
|
3,609,479
|
|
|
5,126,021 |
|
|
2,557,372 |
|
Shares
redeemed - Institutional Class |
|
|
(28,634,363) |
|
|
(13,097,570)
|
|
|
(19,485,889) |
|
|
(752,775) |
|
Shares
sold - Investor Class |
|
|
402,628 |
|
|
852,224
|
|
|
3,270,605 |
|
|
557,234 |
|
Shares
issued from reinvestment of distributions - Investor Class |
|
|
72,342 |
|
|
311,221
|
|
|
101,676 |
|
|
246,020 |
|
Shares
redeemed - Investor Class |
|
|
(1,285,697) |
|
|
(611,351)
|
|
|
(1,903,037) |
|
|
(836,669) |
|
Net
increase (decrease) in net assets from capital transactions |
|
|
29,267,649 |
|
|
17,915,208
|
|
|
110,574,432 |
|
|
39,033,582 |
|
NET
INCREASE (DECREASE) IN NET ASSETS |
|
|
33,826,081 |
|
|
10,980,224
|
|
|
161,561,119 |
|
|
37,939,991 |
|
NET
ASSETS:
|
|
|
|
|
|
|
|
|
|
|
|
|
|
Beginning
of the year |
|
|
60,826,198 |
|
|
49,845,974
|
|
|
64,146,738 |
|
|
26,206,747 |
|
End
of the year |
|
|
$94,652,279 |
|
|
$60,826,198
|
|
|
$225,707,857 |
|
|
$64,146,738 |
|
SHARES
TRANSACTIONS
|
|
|
|
|
|
|
|
|
|
|
|
|
|
Shares
sold - Institutional Class |
|
|
4,209,076 |
|
|
1,814,176
|
|
|
10,518,470 |
|
|
3,393,224 |
|
Shares
issued from reinvestment of distributions - Institutional Class |
|
|
123,486 |
|
|
260,424
|
|
|
386,869 |
|
|
242,866 |
|
Shares
redeemed - Institutional Class |
|
|
(2,305,491) |
|
|
(879,506)
|
|
|
(1,478,062) |
|
|
(66,891) |
|
Shares
sold - Investor Class |
|
|
30,184 |
|
|
57,180
|
|
|
258,916 |
|
|
48,245 |
|
Shares
issued from reinvestment of distributions - Investor Class |
|
|
5,485 |
|
|
22,634
|
|
|
7,697 |
|
|
23,408 |
|
Shares
redeemed - Investor Class |
|
|
(109,044) |
|
|
(42,499)
|
|
|
(147,247) |
|
|
(72,365) |
|
Total
increase (decrease) in shares outstanding |
|
|
1,953,696 |
|
|
1,232,409 |
|
|
9,546,643 |
|
|
3,568,487 |
|
|
|
|
|
|
|
|
|
|
|
|
|
|
The
accompanying notes are an integral part of these financial statements.
TABLE OF CONTENTS
Pzena
FundS
Statements
of Changes in Net Assets(Continued)
|
|
|
|
|
|
OPERATIONS:
|
|
|
|
|
|
|
|
Net
investment income (loss) |
|
|
$3,402,748 |
|
|
$2,826,580
|
|
Net
realized gain (loss):
|
|
|
|
|
|
|
|
Investments
|
|
|
3,832,379
|
|
|
4,414,843
|
|
Foreign
currency translation |
|
|
(15,365)
|
|
|
(19,108) |
|
Net
change in unrealized appreciation (depreciation) on:
|
|
|
|
|
|
|
|
Investments
|
|
|
34,727,525
|
|
|
7,245,750
|
|
Foreign
currency translation |
|
|
22,521
|
|
|
(2,690)
|
|
Net
increase (decrease) in net assets from operations |
|
|
41,969,808 |
|
|
14,465,375
|
|
DISTRIBUTIONS
TO SHAREHOLDERS:
|
|
|
|
|
|
|
|
From
earnings - Institutional Class |
|
|
(7,059,840) |
|
|
(5,518,005)
|
|
From
earnings - Investor Class |
|
|
(87,768) |
|
|
(66,518)
|
|
Total
distributions to shareholders |
|
|
(7,147,608) |
|
|
(5,584,523)
|
|
CAPITAL
TRANSACTIONS:
|
|
|
|
|
|
|
|
Shares
sold - Institutional Class |
|
|
5,134,545 |
|
|
11,947,550
|
|
Shares
issued from reinvestment of distributions - Institutional Class |
|
|
4,307,368 |
|
|
3,186,600
|
|
Shares
redeemed - Institutional Class |
|
|
(2,550,232) |
|
|
(1,741,406)
|
|
Shares
sold - Investor Class |
|
|
139,160 |
|
|
3,000
|
|
Shares
issued from reinvestment of distributions - Investor Class |
|
|
87,769 |
|
|
66,519
|
|
Shares
redeemed - Investor Class |
|
|
(32,107) |
|
|
(87,228)
|
|
Net
increase (decrease) in net assets from capital transactions |
|
|
7,086,503 |
|
|
13,375,035
|
|
NET
INCREASE (DECREASE) IN NET ASSETS |
|
|
41,908,703 |
|
|
22,255,887
|
|
NET
ASSETS:
|
|
|
|
|
|
|
|
Beginning
of the year |
|
|
98,499,998 |
|
|
76,244,111
|
|
End
of the year |
|
|
$
140,408,701 |
|
|
$98,499,998
|
|
SHARES
TRANSACTIONS
|
|
|
|
|
|
|
|
Shares
sold - Institutional Class |
|
|
446,822 |
|
|
1,063,276
|
|
Shares
issued from reinvestment of distributions - Institutional Class |
|
|
333,904 |
|
|
320,262
|
|
Shares
redeemed - Institutional Class |
|
|
(196,967) |
|
|
(167,384)
|
|
Shares
sold - Investor Class |
|
|
11,642 |
|
|
295
|
|
Shares
issued from reinvestment of distributions - Investor Class |
|
|
6,809 |
|
|
6,685
|
|
Shares
redeemed - Investor Class |
|
|
(2,704) |
|
|
(8,266)
|
|
Total
increase (decrease) in shares outstanding |
|
|
599,506 |
|
|
1,214,868 |
|
|
|
|
|
|
|
|
The
accompanying notes are an integral part of these financial statements.
TABLE OF CONTENTS
PZENA
MID CAP VALUE FUND
FINANCIAL
HIGHLIGHTS
INSTITUTIONAL
CLASS
|
|
|
|
|
|
|
|
|
|
|
|
PER
SHARE DATA:
|
|
|
|
|
|
|
|
|
|
|
|
|
|
|
|
|
Net
asset value, beginning of year |
|
|
$11.83 |
|
|
$14.34 |
|
|
$14.07 |
|
|
$15.92 |
|
|
$14.87
|
|
INVESTMENT
OPERATIONS:
|
|
|
|
|
|
|
|
|
|
|
|
|
|
|
|
|
Net
investment income (loss)(a) |
|
|
0.18 |
|
|
0.19 |
|
|
0.20 |
|
|
0.22 |
|
|
0.17
|
|
Net
realized and unrealized gain (loss) on investments(b) |
|
|
0.51 |
|
|
(0.40) |
|
|
1.38 |
|
|
— |
|
|
2.42
|
|
Total
from investment operations |
|
|
0.69 |
|
|
(0.21) |
|
|
1.58 |
|
|
0.22 |
|
|
2.59
|
|
LESS
DISTRIBUTIONS FROM:
|
|
|
|
|
|
|
|
|
|
|
|
|
|
|
|
|
Net
investment income |
|
|
(0.03) |
|
|
(0.20) |
|
|
(0.19) |
|
|
(0.22) |
|
|
(0.29)
|
|
Net
realized gains |
|
|
(0.49) |
|
|
(2.10) |
|
|
(1.12) |
|
|
(1.85) |
|
|
(1.25)
|
|
Total
distributions |
|
|
(0.52) |
|
|
(2.30) |
|
|
(1.31) |
|
|
(2.07) |
|
|
(1.54)
|
|
Net
asset value, end of year |
|
|
$12.00 |
|
|
$11.83 |
|
|
$14.34 |
|
|
$14.07 |
|
|
$15.92
|
|
Total
return |
|
|
5.98% |
|
|
−1.33% |
|
|
11.37% |
|
|
2.37% |
|
|
17.99%
|
|
SUPPLEMENTAL
DATA AND RATIOS:
|
|
|
|
|
|
|
|
|
|
|
|
|
|
|
|
|
Net
assets, end of year (in thousands) |
|
|
$96,038 |
|
|
$129,668 |
|
|
$139,381 |
|
|
$128,225 |
|
|
$123,926
|
|
Ratio
of expenses to average net assets:
|
|
|
|
|
|
|
|
|
|
|
|
|
|
|
|
|
Before
expense reimbursement/recoupment |
|
|
1.06% |
|
|
0.97% |
|
|
0.99% |
|
|
0.98% |
|
|
0.97%
|
|
After
expense reimbursement/recoupment |
|
|
0.90% |
|
|
0.90% |
|
|
0.90% |
|
|
0.90% |
|
|
0.90%
|
|
Ratio
of interest and borrowing expenses on line of credit to average net assets |
|
|
0.00%(c) |
|
|
—% |
|
|
—% |
|
|
—% |
|
|
—%
|
|
Ratio
of net investment income (loss) to average net assets |
|
|
1.57% |
|
|
1.35% |
|
|
1.46% |
|
|
1.50% |
|
|
1.04%
|
|
Portfolio
turnover rate(d) |
|
|
31% |
|
|
35% |
|
|
39% |
|
|
35% |
|
|
22% |
|
|
|
|
|
|
|
|
|
|
|
|
|
|
|
|
|
|
(a)
|
Net investment income
(loss) per share has been calculated based on average shares outstanding during the years.
|
|
(b)
|
Realized and unrealized
gains and losses per share in the caption are balancing amounts necessary to reconcile the change in net asset value per share for the
years, and may not reconcile with the aggregate gains and losses in the Statement of Operations due to share transactions for the years.
|
|
(c)
|
Amount represents
less than 0.005%. |
|
(d)
|
Portfolio turnover
is calculated on the basis of the Fund as a whole. |
The
accompanying notes are an integral part of these financial statements.
TABLE OF CONTENTS
PZENA
MID CAP VALUE FUND
FINANCIAL
HIGHLIGHTS
INVESTOR
CLASS
|
|
|
|
|
|
|
|
|
|
|
|
PER
SHARE DATA:
|
|
|
|
|
|
|
|
|
|
|
|
|
|
|
|
|
Net
asset value, beginning of year |
|
|
$12.05 |
|
|
$14.56 |
|
|
$14.28 |
|
|
$16.12 |
|
|
$15.05
|
|
INVESTMENT
OPERATIONS:
|
|
|
|
|
|
|
|
|
|
|
|
|
|
|
|
|
Net
investment income (loss)(a) |
|
|
0.17 |
|
|
0.15 |
|
|
0.15 |
|
|
0.17 |
|
|
0.12
|
|
Net
realized and unrealized gain (loss) on investments(b) |
|
|
0.48 |
|
|
(0.41) |
|
|
1.40 |
|
|
(0.01) |
|
|
2.44
|
|
Total
from investment operations |
|
|
0.65 |
|
|
(0.26) |
|
|
1.55 |
|
|
0.16 |
|
|
2.56
|
|
LESS
DISTRIBUTIONS FROM:
|
|
|
|
|
|
|
|
|
|
|
|
|
|
|
|
|
Net
investment income |
|
|
— |
|
|
(0.15) |
|
|
(0.15) |
|
|
(0.15) |
|
|
(0.24)
|
|
Net
realized gains |
|
|
(0.49) |
|
|
(2.10) |
|
|
(1.12) |
|
|
(1.85) |
|
|
(1.25)
|
|
Total
distributions |
|
|
(0.49) |
|
|
(2.25) |
|
|
(1.27) |
|
|
(2.00) |
|
|
(1.49)
|
|
Net
asset value, end of year |
|
|
$12.21 |
|
|
$12.05 |
|
|
$14.56 |
|
|
$14.28 |
|
|
$16.12
|
|
Total
return |
|
|
5.59% |
|
|
−1.69% |
|
|
10.95% |
|
|
1.96% |
|
|
17.52%
|
|
SUPPLEMENTAL
DATA AND RATIOS:
|
|
|
|
|
|
|
|
|
|
|
|
|
|
|
|
|
Net
assets, end of year (in thousands) |
|
|
$2,089 |
|
|
$5,576 |
|
|
$7,645 |
|
|
$6,667 |
|
|
$11,934
|
|
Ratio
of expenses to average net assets:
|
|
|
|
|
|
|
|
|
|
|
|
|
|
|
|
|
Before
expense reimbursement/recoupment |
|
|
1.40% |
|
|
1.31% |
|
|
1.33% |
|
|
1.32% |
|
|
1.31%
|
|
After
expense reimbursement/recoupment |
|
|
1.24% |
|
|
1.24% |
|
|
1.24% |
|
|
1.24% |
|
|
1.24%
|
|
Ratio
of interest and borrowing expenses on line of credit to average net assets |
|
|
0.00%(c) |
|
|
—% |
|
|
—% |
|
|
—% |
|
|
—%
|
|
Ratio
of net investment income (loss) to average net assets |
|
|
1.23% |
|
|
1.01% |
|
|
1.12% |
|
|
1.15% |
|
|
0.70%
|
|
Portfolio
turnover rate(d) |
|
|
31% |
|
|
35% |
|
|
39% |
|
|
35% |
|
|
22% |
|
|
|
|
|
|
|
|
|
|
|
|
|
|
|
|
|
|
(a)
|
Net investment income
(loss) per share has been calculated based on average shares outstanding during the years.
|
|
(b)
|
Realized and unrealized
gains and losses per share in the caption are balancing amounts necessary to reconcile the change in net asset value per share for the
years, and may not reconcile with the aggregate gains and losses in the Statement of Operations due to share transactions for the years.
|
|
(c)
|
Amount represents
less than 0.005%. |
|
(d)
|
Portfolio turnover
is calculated on the basis of the Fund as a whole. |
The
accompanying notes are an integral part of these financial statements.
TABLE OF CONTENTS
PZENA
EMERGING MARKETS VALUE FUND
FINANCIAL
HIGHLIGHTS
INSTITUTIONAL
CLASS
|
|
|
|
|
|
|
|
|
|
|
|
PER
SHARE DATA:
|
|
|
|
|
|
|
|
|
|
|
|
|
|
|
|
|
Net
asset value, beginning of year |
|
|
$12.41 |
|
|
$12.12 |
|
|
$11.04 |
|
|
$11.63 |
|
|
$11.87
|
|
INVESTMENT
OPERATIONS:
|
|
|
|
|
|
|
|
|
|
|
|
|
|
|
|
|
Net
investment income (loss)(a) |
|
|
0.44 |
|
|
0.44 |
|
|
0.31 |
|
|
0.33 |
|
|
0.24
|
|
Net
realized and unrealized gain (loss) on investments(b) |
|
|
6.08 |
|
|
0.72 |
|
|
1.48 |
|
|
(0.70) |
|
|
(0.15)
|
|
Total
from investment operations |
|
|
6.52 |
|
|
1.16 |
|
|
1.79 |
|
|
(0.37) |
|
|
0.09
|
|
LESS
DISTRIBUTIONS FROM:
|
|
|
|
|
|
|
|
|
|
|
|
|
|
|
|
|
Net
investment income |
|
|
(0.54) |
|
|
(0.54) |
|
|
(0.42) |
|
|
(0.19) |
|
|
(0.25)
|
|
Net
realized gains |
|
|
(0.20) |
|
|
(0.33) |
|
|
(0.29) |
|
|
(0.03) |
|
|
(0.08)
|
|
Total
distributions |
|
|
(0.74) |
|
|
(0.87) |
|
|
(0.71) |
|
|
(0.22) |
|
|
(0.33)
|
|
Net
asset value, end of year |
|
|
$18.19 |
|
|
$12.41 |
|
|
$12.12 |
|
|
$11.04 |
|
|
$11.63
|
|
Total
return |
|
|
53.76% |
|
|
9.92% |
|
|
16.32% |
|
|
−3.11% |
|
|
0.74%
|
|
SUPPLEMENTAL
DATA AND RATIOS:
|
|
|
|
|
|
|
|
|
|
|
|
|
|
|
|
|
Net
assets, end of year (in thousands) |
|
|
$3,966,593 |
|
|
$2,094,332 |
|
|
$1,579,818 |
|
|
$1,014,109 |
|
|
$537,475
|
|
Ratio
of expenses to average net assets:
|
|
|
|
|
|
|
|
|
|
|
|
|
|
|
|
|
Before
expense reimbursement/ recoupment |
|
|
1.11% |
|
|
1.13% |
|
|
1.15% |
|
|
1.15% |
|
|
1.15%
|
|
After
expense reimbursement/
recoupment |
|
|
1.08% |
|
|
1.08% |
|
|
1.08% |
|
|
1.08% |
|
|
1.08%
|
|
Ratio
of net investment income (loss) to average net assets |
|
|
3.02% |
|
|
3.41% |
|
|
2.62% |
|
|
3.03% |
|
|
1.99%
|
|
Portfolio
turnover rate(c) |
|
|
28% |
|
|
22% |
|
|
38% |
|
|
15% |
|
|
10% |
|
|
|
|
|
|
|
|
|
|
|
|
|
|
|
|
|
|
(a)
|
Net investment income
(loss) per share has been calculated based on average shares outstanding during the years.
|
|
(b)
|
Realized and unrealized
gains and losses per share in the caption are balancing amounts necessary to reconcile the change in net asset value per share for the
years, and may not reconcile with the aggregate gains and losses in the Statement of Operations due to share transactions for the years. |
|
(c)
|
Portfolio turnover
is calculated on the basis of the Fund as a whole. |
The
accompanying notes are an integral part of these financial statements.
TABLE OF CONTENTS
PZENA
EMERGING MARKETS VALUE FUND
FINANCIAL
HIGHLIGHTS
INVESTOR
CLASS
|
|
|
|
|
|
|
|
|
|
|
|
PER
SHARE DATA:
|
|
|
|
|
|
|
|
|
|
|
|
|
|
|
|
|
Net
asset value, beginning of year |
|
|
$12.36 |
|
|
$12.07 |
|
|
$11.00 |
|
|
$11.59 |
|
|
$11.84
|
|
INVESTMENT
OPERATIONS:
|
|
|
|
|
|
|
|
|
|
|
|
|
|
|
|
|
Net
investment income (loss)(a) |
|
|
0.40 |
|
|
0.39 |
|
|
0.27 |
|
|
0.29 |
|
|
0.20
|
|
Net
realized and unrealized gain (loss) on investments(b) |
|
|
6.03 |
|
|
0.73 |
|
|
1.47 |
|
|
(0.69) |
|
|
(0.16)
|
|
Total
from investment operations |
|
|
6.43 |
|
|
1.12 |
|
|
1.74 |
|
|
(0.40) |
|
|
0.04
|
|
LESS
DISTRIBUTIONS FROM:
|
|
|
|
|
|
|
|
|
|
|
|
|
|
|
|
|
Net
investment income |
|
|
(0.50) |
|
|
(0.50) |
|
|
(0.38) |
|
|
(0.16) |
|
|
(0.21)
|
|
Net
realized gains |
|
|
(0.20) |
|
|
(0.33) |
|
|
(0.29) |
|
|
(0.03) |
|
|
(0.08)
|
|
Total
distributions |
|
|
(0.70) |
|
|
(0.83) |
|
|
(0.67) |
|
|
(0.19) |
|
|
(0.29)
|
|
Net
asset value, end of year |
|
|
$18.09 |
|
|
$12.36 |
|
|
$12.07 |
|
|
$11.00 |
|
|
$11.59
|
|
Total
return |
|
|
53.19% |
|
|
9.57% |
|
|
15.92% |
|
|
−3.39% |
|
|
0.31%
|
|
SUPPLEMENTAL
DATA AND RATIOS:
|
|
|
|
|
|
|
|
|
|
|
|
|
|
|
|
|
Net
assets, end of year (in thousands) |
|
|
$76,101 |
|
|
$43,642 |
|
|
$42,250 |
|
|
$36,800 |
|
|
$22,332
|
|
Ratio
of expenses to average net assets:
|
|
|
|
|
|
|
|
|
|
|
|
|
|
|
|
|
Before
expense reimbursement/recoupment |
|
|
1.46% |
|
|
1.47% |
|
|
1.50% |
|
|
1.50% |
|
|
1.50%
|
|
After
expense reimbursement/recoupment |
|
|
1.43% |
|
|
1.42% |
|
|
1.43% |
|
|
1.43% |
|
|
1.43%
|
|
Ratio
of net investment income (loss) to average net assets |
|
|
2.67% |
|
|
3.07% |
|
|
2.27% |
|
|
2.68% |
|
|
1.64%
|
|
Portfolio
turnover rate(c) |
|
|
28% |
|
|
22% |
|
|
38% |
|
|
15% |
|
|
10% |
|
|
|
|
|
|
|
|
|
|
|
|
|
|
|
|
|
|
(a)
|
Net investment income
(loss) per share has been calculated based on average shares outstanding during the years.
|
|
(b)
|
Realized and unrealized
gains and losses per share in the caption are balancing amounts necessary to reconcile the change in net asset value per share for the
years, and may not reconcile with the aggregate gains and losses in the Statement of Operations due to share transactions for the years. |
|
(c)
|
Portfolio turnover
is calculated on the basis of the Fund as a whole. |
The
accompanying notes are an integral part of these financial statements.
TABLE OF CONTENTS
PZENA
SMALL CAP VALUE FUND
FINANCIAL
HIGHLIGHTS
INSTITUTIONAL
CLASS
|
|
|
|
|
|
|
|
|
|
|
|
PER
SHARE DATA:
|
|
|
|
|
|
|
|
|
|
|
|
|
|
|
|
|
Net
asset value, beginning of year |
|
|
$13.14
|
|
|
$14.68
|
|
|
$12.97
|
|
|
$14.28
|
|
|
$13.14
|
|
INVESTMENT
OPERATIONS:
|
|
|
|
|
|
|
|
|
|
|
|
|
|
|
|
|
Net
investment income (loss)(a) |
|
|
0.16
|
|
|
0.12
|
|
|
0.13
|
|
|
0.10
|
|
|
0.05
|
|
Net
realized and unrealized gain (loss) on investments(b) |
|
|
1.39
|
|
|
(0.64)
|
|
|
1.65
|
|
|
0.65
|
|
|
1.31
|
|
Total
from investment operations |
|
|
1.55
|
|
|
(0.52)
|
|
|
1.78
|
|
|
0.75
|
|
|
1.36
|
|
LESS
DISTRIBUTIONS FROM:
|
|
|
|
|
|
|
|
|
|
|
|
|
|
|
|
|
Net
investment income |
|
|
(0.01)
|
|
|
(0.23)
|
|
|
(0.02)
|
|
|
(0.12)
|
|
|
(0.12)
|
|
Net
realized gains |
|
|
(0.30)
|
|
|
(0.79)
|
|
|
(0.05)
|
|
|
(1.94)
|
|
|
(0.10)
|
|
Total
distributions |
|
|
(0.31)
|
|
|
(1.02)
|
|
|
(0.07)
|
|
|
(2.06)
|
|
|
(0.22)
|
|
Net
asset value, end of year |
|
|
$14.38
|
|
|
$13.14
|
|
|
$14.68
|
|
|
$12.97
|
|
|
$14.28
|
|
Total
return |
|
|
11.98%
|
|
|
−3.90%
|
|
|
13.74%
|
|
|
6.50%
|
|
|
10.36%
|
|
SUPPLEMENTAL
DATA AND RATIOS:
|
|
|
|
|
|
|
|
|
|
|
|
|
|
|
|
|
Net
assets, end of year (in thousands) |
|
|
$91,059
|
|
|
$56,578
|
|
|
$45,642
|
|
|
$91,814
|
|
|
$118,998
|
|
Ratio
of expenses to average net assets:
|
|
|
|
|
|
|
|
|
|
|
|
|
|
|
|
|
Before
expense reimbursement/recoupment |
|
|
1.42%
|
|
|
1.39%
|
|
|
1.46%
|
|
|
1.18%
|
|
|
1.17%
|
|
After
expense reimbursement/recoupment |
|
|
1.00%
|
|
|
1.00%
|
|
|
1.00%
|
|
|
1.03%
|
|
|
1.10%
|
|
Ratio
of interest and borrowing expenses on line of credit to average net assets |
|
|
0.01%
|
|
|
—%
|
|
|
—%
|
|
|
—%
|
|
|
—%
|
|
Ratio
of operational expenses to average net assets excluding interest and borrowing expenses on line of credit |
|
|
0.99%
|
|
|
—%
|
|
|
—%
|
|
|
—%
|
|
|
—%
|
|
Ratio
of net investment income (loss) to average net assets |
|
|
1.19%
|
|
|
0.81%
|
|
|
1.06%
|
|
|
0.77%
|
|
|
0.38%
|
|
Portfolio
turnover rate(c) |
|
|
41%
|
|
|
30%
|
|
|
25%
|
|
|
28%
|
|
|
10% |
|
|
|
|
|
|
|
|
|
|
|
|
|
|
|
|
|
|
(a)
|
Net investment income
(loss) per share has been calculated based on average shares outstanding during the years.
|
|
(b)
|
Realized and unrealized
gains and losses per share in the caption are balancing amounts necessary to reconcile the change in net asset value per share for the
years, and may not reconcile with the aggregate gains and losses in the Statement of Operations due to share transactions for the years. |
|
(c)
|
Portfolio turnover
is calculated on the basis of the Fund as a whole. |
The
accompanying notes are an integral part of these financial statements.
TABLE OF CONTENTS
PZENA
SMALL CAP VALUE FUND
FINANCIAL
HIGHLIGHTS
INVESTOR
CLASS
|
|
|
|
|
|
|
|
|
|
|
|
PER
SHARE DATA:
|
|
|
|
|
|
|
|
|
|
|
|
|
|
|
|
|
Net
asset value, beginning of year |
|
|
$13.03
|
|
|
$14.56
|
|
|
$12.90
|
|
|
$14.20
|
|
|
$13.07
|
|
INVESTMENT
OPERATIONS:
|
|
|
|
|
|
|
|
|
|
|
|
|
|
|
|
|
Net
investment income (loss)(a) |
|
|
0.12
|
|
|
0.07
|
|
|
0.10
|
|
|
0.06
|
|
|
0.01
|
|
Net
realized and unrealized gain (loss) on investments(b) |
|
|
1.37
|
|
|
(0.62)
|
|
|
1.63
|
|
|
0.66
|
|
|
1.31
|
|
Total
from investment operations |
|
|
1.49
|
|
|
(0.55)
|
|
|
1.73
|
|
|
0.72
|
|
|
1.32
|
|
LESS
DISTRIBUTIONS FROM:
|
|
|
|
|
|
|
|
|
|
|
|
|
|
|
|
|
Net
investment income |
|
|
—
|
|
|
(0.19)
|
|
|
(0.02)
|
|
|
(0.08)
|
|
|
(0.09)
|
|
Net
realized gains |
|
|
(0.30)
|
|
|
(0.79)
|
|
|
(0.05)
|
|
|
(1.94)
|
|
|
(0.10)
|
|
Total
distributions |
|
|
(0.30)
|
|
|
(0.98)
|
|
|
(0.07)
|
|
|
(2.02)
|
|
|
(0.19)
|
|
Net
asset value, end of year |
|
|
$14.22
|
|
|
$13.03
|
|
|
$14.56
|
|
|
$12.90
|
|
|
$14.20
|
|
Total
return |
|
|
11.62%
|
|
|
−4.15%
|
|
|
13.38%
|
|
|
6.34%
|
|
|
10.04%
|
|
SUPPLEMENTAL
DATA AND RATIOS:
|
|
|
|
|
|
|
|
|
|
|
|
|
|
|
|
|
Net
assets, end of year (in thousands) |
|
|
$3,593
|
|
|
$4,248
|
|
|
$4,204
|
|
|
$4,132
|
|
|
$3,663
|
|
Ratio
of expenses to average net assets:
|
|
|
|
|
|
|
|
|
|
|
|
|
|
|
|
|
Before
expense reimbursement/recoupment |
|
|
1.72%
|
|
|
1.70%
|
|
|
1.77%
|
|
|
1.49%
|
|
|
1.48%
|
|
After
expense reimbursement/recoupment |
|
|
1.30%
|
|
|
1.31%
|
|
|
1.31%
|
|
|
1.34%
|
|
|
1.41%
|
|
Ratio
of interest and borrowing expenses on line of credit to average net assets |
|
|
0.01%
|
|
|
—%
|
|
|
—%
|
|
|
—%
|
|
|
—%
|
|
Ratio
of operational expenses to average net assets excluding interest and borrowing expenses on line of credit |
|
|
1.29%
|
|
|
—%
|
|
|
—%
|
|
|
—%
|
|
|
—%
|
|
Ratio
of net investment income (loss) to average net assets |
|
|
0.89%
|
|
|
0.50%
|
|
|
0.75%
|
|
|
0.46%
|
|
|
0.07%
|
|
Portfolio
turnover rate(c) |
|
|
41%
|
|
|
30%
|
|
|
25%
|
|
|
28%
|
|
|
10% |
|
|
|
|
|
|
|
|
|
|
|
|
|
|
|
|
|
|
(a)
|
Net investment income
(loss) per share has been calculated based on average shares outstanding during the years.
|
|
(b)
|
Realized and unrealized
gains and losses per share in the caption are balancing amounts necessary to reconcile the change in net asset value per share for the
years, and may not reconcile with the aggregate gains and losses in the Statement of Operations due to share transactions for the years. |
|
(c)
|
Portfolio turnover
is calculated on the basis of the Fund as a whole. |
The
accompanying notes are an integral part of these financial statements.
TABLE OF CONTENTS
PZENA
INTERNATIONAL SMALL CAP VALUE FUND
FINANCIAL
HIGHLIGHTS
INSTITUTIONAL
CLASS
|
|
|
|
|
|
|
|
|
|
|
|
PER
SHARE DATA:
|
|
|
|
|
|
|
|
|
|
|
|
|
|
|
|
|
Net
asset value, beginning of year |
|
|
$10.79 |
|
|
$11.02 |
|
|
$10.64 |
|
|
$10.07 |
|
|
$9.49
|
|
INVESTMENT
OPERATIONS:
|
|
|
|
|
|
|
|
|
|
|
|
|
|
|
|
|
Net
investment income (loss)(a) |
|
|
0.29 |
|
|
0.31 |
|
|
0.22 |
|
|
0.20 |
|
|
0.08
|
|
Net
realized and unrealized gain (loss) on investments(b) |
|
|
3.87 |
|
|
0.65 |
|
|
0.65 |
|
|
0.83 |
|
|
0.61
|
|
Total
from investment operations |
|
|
4.16 |
|
|
0.96 |
|
|
0.87 |
|
|
1.03 |
|
|
0.69
|
|
LESS
DISTRIBUTIONS FROM:
|
|
|
|
|
|
|
|
|
|
|
|
|
|
|
|
|
Net
investment income |
|
|
(0.26) |
|
|
(0.40) |
|
|
(0.19) |
|
|
(0.18) |
|
|
(0.09)
|
|
Net
realized gains |
|
|
(0.12) |
|
|
(0.79) |
|
|
(0.30) |
|
|
(0.28) |
|
|
(0.02)
|
|
Total
distributions |
|
|
(0.38) |
|
|
(1.19) |
|
|
(0.49) |
|
|
(0.46) |
|
|
(0.11)
|
|
Net
asset value, end of year |
|
|
$14.57 |
|
|
$10.79 |
|
|
$11.02 |
|
|
$10.64 |
|
|
$10.07
|
|
Total
return |
|
|
38.90% |
|
|
8.99% |
|
|
8.18% |
|
|
10.73% |
|
|
7.32%
|
|
SUPPLEMENTAL
DATA AND RATIOS:
|
|
|
|
|
|
|
|
|
|
|
|
|
|
|
|
|
Net
assets, end of year (in thousands) |
|
|
$219,431 |
|
|
$60,780 |
|
|
$22,759 |
|
|
$16,424 |
|
|
$13,919
|
|
Ratio
of expenses to average net assets:
|
|
|
|
|
|
|
|
|
|
|
|
|
|
|
|
|
Before
expense reimbursement/recoupment |
|
|
1.18% |
|
|
1.85% |
|
|
2.09% |
|
|
2.51% |
|
|
2.88%
|
|
After
expense reimbursement/recoupment |
|
|
1.03% |
|
|
1.16% |
|
|
1.17% |
|
|
1.17% |
|
|
1.17%
|
|
Ratio
of interest and borrowing expenses on line of credit to average net assets |
|
|
0.00%(c) |
|
|
—% |
|
|
—% |
|
|
—% |
|
|
—%
|
|
Ratio
of net investment income (loss) to average net assets |
|
|
2.25% |
|
|
2.62% |
|
|
2.04% |
|
|
2.15% |
|
|
0.74%
|
|
Portfolio
turnover rate(d) |
|
|
47% |
|
|
39% |
|
|
43% |
|
|
26% |
|
|
22% |
|
|
|
|
|
|
|
|
|
|
|
|
|
|
|
|
|
|
(a)
|
Net investment income
(loss) per share has been calculated based on average shares outstanding during the years.
|
|
(b)
|
Realized and unrealized
gains and losses per share in the caption are balancing amounts necessary to reconcile the change in net asset value per share for the
years, and may not reconcile with the aggregate gains and losses in the Statement of Operations due to share transactions for the years.
|
|
(c)
|
Amount represents
less than 0.005%. |
|
(d)
|
Portfolio turnover
is calculated on the basis of the Fund as a whole. |
The
accompanying notes are an integral part of these financial statements.
TABLE OF CONTENTS
PZENA
INTERNATIONAL SMALL CAP VALUE FUND
FINANCIAL
HIGHLIGHTS
INVESTOR
CLASS
|
|
|
|
|
|
|
|
|
|
|
|
PER
SHARE DATA:
|
|
|
|
|
|
|
|
|
|
|
|
|
|
|
|
|
Net
asset value, beginning of year |
|
|
$10.76 |
|
|
$10.99 |
|
|
$10.62 |
|
|
$10.05 |
|
|
$9.48
|
|
INVESTMENT
OPERATIONS:
|
|
|
|
|
|
|
|
|
|
|
|
|
|
|
|
|
Net
investment income (loss)(a) |
|
|
0.25 |
|
|
0.27 |
|
|
0.19 |
|
|
0.18 |
|
|
0.05
|
|
Net
realized and unrealized gain (loss) on investments(b) |
|
|
3.86 |
|
|
0.66 |
|
|
0.65 |
|
|
0.83 |
|
|
0.61
|
|
Total
from investment operations |
|
|
4.11 |
|
|
0.93 |
|
|
0.84 |
|
|
1.01 |
|
|
0.66
|
|
LESS
DISTRIBUTIONS FROM:
|
|
|
|
|
|
|
|
|
|
|
|
|
|
|
|
|
Net
investment income |
|
|
(0.23) |
|
|
(0.37) |
|
|
(0.17) |
|
|
(0.16) |
|
|
(0.07)
|
|
Net
realized gains |
|
|
(0.12) |
|
|
(0.79) |
|
|
(0.30) |
|
|
(0.28) |
|
|
(0.02)
|
|
Total
distributions |
|
|
(0.35) |
|
|
(1.16) |
|
|
(0.47) |
|
|
(0.44) |
|
|
(0.09)
|
|
Net
asset value, end of year |
|
|
$14.52 |
|
|
$10.76 |
|
|
$10.99 |
|
|
$10.62 |
|
|
$10.05
|
|
Total
return |
|
|
38.52% |
|
|
8.66% |
|
|
7.87% |
|
|
10.51% |
|
|
6.93%
|
|
SUPPLEMENTAL
DATA AND RATIOS:
|
|
|
|
|
|
|
|
|
|
|
|
|
|
|
|
|
Net
assets, end of year (in thousands) |
|
|
$6,277 |
|
|
$3,367 |
|
|
$3,448 |
|
|
$1,589 |
|
|
$1,538
|
|
Ratio
of expenses to average net assets:
|
|
|
|
|
|
|
|
|
|
|
|
|
|
|
|
|
Before
expense reimbursement/recoupment |
|
|
1.48% |
|
|
2.13% |
|
|
2.38% |
|
|
2.79% |
|
|
3.16%
|
|
After
expense reimbursement/recoupment |
|
|
1.33% |
|
|
1.44% |
|
|
1.46% |
|
|
1.45% |
|
|
1.45%
|
|
Ratio
of interest and borrowing expenses on line of credit to average net assets |
|
|
0.00%(c) |
|
|
—% |
|
|
—% |
|
|
—% |
|
|
—%
|
|
Ratio
of net investment income (loss) to average net assets |
|
|
1.95% |
|
|
2.34% |
|
|
1.75% |
|
|
1.87% |
|
|
0.46%
|
|
Portfolio
turnover rate(d) |
|
|
47% |
|
|
39% |
|
|
43% |
|
|
26% |
|
|
22% |
|
|
|
|
|
|
|
|
|
|
|
|
|
|
|
|
|
|
(a)
|
Net investment income
(loss) per share has been calculated based on average shares outstanding during the years.
|
|
(b)
|
Realized and unrealized
gains and losses per share in the caption are balancing amounts necessary to reconcile the change in net asset value per share for the
years, and may not reconcile with the aggregate gains and losses in the Statement of Operations due to share transactions for the years.
|
|
(c)
|
Amount represents
less than 0.005%. |
|
(d)
|
Portfolio turnover
is calculated on the basis of the Fund as a whole. |
The
accompanying notes are an integral part of these financial statements.
TABLE OF CONTENTS
Pzena
International Value Fund
Financial
Highlights
Institutional
Class
|
|
|
|
|
|
|
|
|
|
|
|
|
|
|
PER
SHARE DATA:
|
|
|
|
|
|
|
|
|
|
|
|
|
|
|
|
|
Net
asset value, beginning of period |
|
|
$10.98 |
|
|
$9.83 |
|
|
$9.48 |
|
|
$9.62 |
|
|
$10.00
|
|
INVESTMENT
OPERATIONS:
|
|
|
|
|
|
|
|
|
|
|
|
|
|
|
|
|
Net
investment income (loss)(b) |
|
|
0.37 |
|
|
0.34 |
|
|
0.24 |
|
|
0.23 |
|
|
0.05
|
|
Net
realized and unrealized gain (loss) on investments(c) |
|
|
4.10 |
|
|
1.46 |
|
|
0.31 |
|
|
(0.19) |
|
|
(0.38)
|
|
Total
from investment operations |
|
|
4.47 |
|
|
1.80 |
|
|
0.55 |
|
|
0.04 |
|
|
(0.33)
|
|
LESS
DISTRIBUTIONS FROM:
|
|
|
|
|
|
|
|
|
|
|
|
|
|
|
|
|
Net
investment income |
|
|
(0.35) |
|
|
(0.33) |
|
|
(0.20) |
|
|
(0.18) |
|
|
(0.05)
|
|
Net
realized gains |
|
|
(0.43) |
|
|
(0.32) |
|
|
— |
|
|
(0.00)(d) |
|
|
—
|
|
Total
distributions |
|
|
(0.78) |
|
|
(0.65) |
|
|
(0.20) |
|
|
(0.18) |
|
|
(0.05)
|
|
Net
asset value, end of period |
|
|
$14.67 |
|
|
$10.98 |
|
|
$9.83 |
|
|
$9.48 |
|
|
$9.62
|
|
Total
return |
|
|
41.59% |
|
|
18.97% |
|
|
5.75% |
|
|
0.53% |
|
|
−3.29%(g)
|
|
SUPPLEMENTAL
DATA AND RATIOS:
|
|
|
|
|
|
|
|
|
|
|
|
|
|
|
|
|
Net
assets, end of period (in thousands) |
|
|
$138,554 |
|
|
$97,284 |
|
|
$75,143 |
|
|
$42,424 |
|
|
$23,612
|
|
Ratio
of expenses to average net assets:
|
|
|
|
|
|
|
|
|
|
|
|
|
|
|
|
|
Before
expense reimbursement/recoupment |
|
|
0.91% |
|
|
0.99% |
|
|
1.11% |
|
|
1.48% |
|
|
2.58%(h)
|
|
After
expense reimbursement/recoupment |
|
|
0.74% |
|
|
0.74% |
|
|
0.74% |
|
|
0.74% |
|
|
0.74%(h)
|
|
Ratio
of interest and borrowing expenses on line of credit to average net assets |
|
|
0.00%(e) |
|
|
—% |
|
|
—% |
|
|
—% |
|
|
—%(h)
|
|
Ratio
of net investment income (loss) to average net assets |
|
|
2.92% |
|
|
3.20% |
|
|
2.45% |
|
|
2.68% |
|
|
0.75%(h)
|
|
Portfolio
turnover rate(f) |
|
|
29% |
|
|
21% |
|
|
16% |
|
|
19% |
|
|
4%(g) |
|
|
|
|
|
|
|
|
|
|
|
|
|
|
|
|
|
|
(a)
|
Commencement of Operations
for the Fund was June 28, 2021.
|
|
(b)
|
Net investment income
(loss) per share has been calculated based on average shares outstanding during the years.
|
|
(c)
|
Realized and unrealized
gains and losses per share in the caption are balancing amounts necessary to reconcile the change in net asset value per share for the
years, and may not reconcile with the aggregate gains and losses in the Statement of Operations due to share transactions for the years.
|
|
(d)
|
Amount represents
less than $0.005 per share.
|
|
(e)
|
Amount represents
less than 0.005%. |
|
(f)
|
Portfolio turnover
is calculated on the basis of the Fund as a whole. |
The
accompanying notes are an integral part of these financial statements.
TABLE OF CONTENTS
PZENA
INTERNATIONAL VALUE FUND
FINANCIAL
HIGHLIGHTS
INVESTOR
CLASS
|
|
|
|
|
|
|
|
|
|
|
|
|
|
|
PER
SHARE DATA:
|
|
|
|
|
|
|
|
|
|
|
|
|
|
|
|
|
Net
asset value, beginning of period |
|
|
$10.97 |
|
|
$9.82 |
|
|
$9.48 |
|
|
$9.62 |
|
|
$10.00
|
|
INVESTMENT
OPERATIONS:
|
|
|
|
|
|
|
|
|
|
|
|
|
|
|
|
|
Net
investment income (loss)(b) |
|
|
0.33 |
|
|
0.32 |
|
|
0.21 |
|
|
0.21 |
|
|
0.03
|
|
Net
realized and unrealized gain (loss) on investments(c) |
|
|
4.10 |
|
|
1.45 |
|
|
0.30 |
|
|
(0.19) |
|
|
(0.37)
|
|
Total
from investment operations |
|
|
4.43 |
|
|
1.77 |
|
|
0.51 |
|
|
0.02 |
|
|
(0.34)
|
|
LESS
DISTRIBUTIONS FROM:
|
|
|
|
|
|
|
|
|
|
|
|
|
|
|
|
|
Net
investment income |
|
|
(0.32) |
|
|
(0.30) |
|
|
(0.17) |
|
|
(0.16) |
|
|
(0.04)
|
|
Net
realized gains |
|
|
(0.43) |
|
|
(0.32) |
|
|
— |
|
|
(0.00)(d) |
|
|
—
|
|
Total
distributions |
|
|
(0.75) |
|
|
(0.62) |
|
|
(0.17) |
|
|
(0.16) |
|
|
(0.04)
|
|
Net
asset value, end of period |
|
|
$14.65 |
|
|
$10.97 |
|
|
$9.82 |
|
|
$9.48 |
|
|
$9.62
|
|
Total
return |
|
|
41.23% |
|
|
18.67% |
|
|
5.41% |
|
|
0.33% |
|
|
−3.43%(g)
|
|
SUPPLEMENTAL
DATA AND RATIOS:
|
|
|
|
|
|
|
|
|
|
|
|
|
|
|
|
|
Net
assets, end of period (in thousands) |
|
|
$1,855 |
|
|
$1,216 |
|
|
$1,101 |
|
|
$969 |
|
|
$966
|
|
Ratio
of expenses to average net assets:
|
|
|
|
|
|
|
|
|
|
|
|
|
|
|
|
|
Before
expense reimbursement/recoupment |
|
|
1.17% |
|
|
1.24% |
|
|
1.36% |
|
|
1.73% |
|
|
2.83%(h)
|
|
After
expense reimbursement/recoupment |
|
|
1.00% |
|
|
0.99% |
|
|
0.99% |
|
|
0.99% |
|
|
0.99%(h)
|
|
Ratio
of interest and borrowing expenses on line of credit to average net assets |
|
|
0.00%(e) |
|
|
—% |
|
|
—% |
|
|
—% |
|
|
—%(h)
|
|
Ratio
of net investment income (loss) to average net assets |
|
|
2.66% |
|
|
2.95% |
|
|
2.20% |
|
|
2.43% |
|
|
0.50%(h)
|
|
Portfolio
turnover rate(f) |
|
|
29% |
|
|
21% |
|
|
16% |
|
|
19% |
|
|
4%(g) |
|
|
|
|
|
|
|
|
|
|
|
|
|
|
|
|
|
|
(a)
|
Commencement of Operations
for the Fund was June 28, 2021.
|
|
(b)
|
Net investment income
(loss) per share has been calculated based on average shares outstanding during the years.
|
|
(c)
|
Realized and unrealized
gains and losses per share in the caption are balancing amounts necessary to reconcile the change in net asset value per share for the
years, and may not reconcile with the aggregate gains and losses in the Statement of Operations due to share transactions for the years.
|
|
(d)
|
Amount represents
less than $0.005 per share.
|
|
(e)
|
Amount represents
less than 0.005%. |
|
(f)
|
Portfolio turnover
is calculated on the basis of the Fund as a whole. |
The
accompanying notes are an integral part of these financial statements.
TABLE OF CONTENTS
Pzena
Funds
Notes
to Financial Statements
February
28, 2026
NOTE
1 – ORGANIZATION
The
Pzena Mid Cap Value Fund (the “Mid Cap Value Fund”), Pzena Emerging Markets Value Fund (the “Emerging Markets Value
Fund”), Pzena Small Cap Value Fund (the “Small Cap Value Fund”), Pzena International Small Cap Value Fund (the “International
Small Cap Value Fund”), and Pzena International Value Fund (the “International Value Fund”) (collectively, the “Funds”),
are each a diversified series of Advisors Series Trust (the “Trust”), which is registered under the Investment Company
Act of 1940, as amended, (the “1940 Act”) as an open-end management investment company. The Funds follow the investment company
accounting and reporting guidance of the Financial Accounting Standards Board (“FASB”) Accounting Standard Codification Topic
946 “Financial Services – Investment Companies”.
The
primary investment objective for each Fund is to achieve long-term capital appreciation. Currently, each Fund offers Investor Class and
Institutional Class shares. Each class of shares differs principally in its respective distribution and shareholder servicing expenses
and sales charges, if any. Each class of shares has identical rights to earnings, assets and voting privileges, except for class-specific
expenses and exclusive rights to vote on matters affecting only individual classes.
The
Mid Cap Value Fund and Emerging Markets Value Fund commenced operations on March 31, 2014. The Small Cap Value Fund commenced operations
on April 27, 2016, the International Small Cap Value Fund commenced operations on July 2, 2018, and the International Value
Fund commenced operations on June 28, 2021.
NOTE
2 – SIGNIFICANT ACCOUNTING POLICIES
The
following is a summary of significant accounting policies consistently followed by the Funds in the preparation of their financial statements.
These policies are in conformity with accounting principles generally accepted in the United States of America.
Security
Valuation – All investments in securities are recorded at their estimated fair value, as described
in Note 3.
Federal
Income Taxes – It is the policy of the Funds to comply with the requirements of Subchapter M of
the Internal Revenue Code applicable to regulated investment companies and to distribute substantially all of its taxable income to shareholders.
Therefore, no Federal income or excise tax provision is required.
The
Funds recognize the tax benefits of uncertain tax positions only where the position is “more likely than not” to be sustained
assuming examination by tax authorities. The tax returns of the Funds’ prior three fiscal years are open for examination. Management
has reviewed all open tax years in major jurisdictions and concluded that there is no impact on the Funds’ net assets and no tax
liability resulting from unrecognized tax events relating to uncertain income tax positions taken or expected to be taken on a tax return.
The Funds identify their major tax jurisdictions as U.S. Federal and the state of Wisconsin. The Funds are not aware of any tax positions
for which it is reasonably possible that the total amounts of unrecognized tax benefits will change materially in the next twelve months.
Security
Transactions, Income and Distributions – Security transactions are accounted for on the trade
date. Realized gains and losses on securities sold are determined on the basis of identified cost. Dividend income and distributions to
shareholders are recorded on the ex-dividend date. Withholding taxes on foreign dividends have been provided for in accordance with each
Fund’s understanding of the applicable country’s tax rules and rates. The Funds will make distributions of dividends and capital
gains, if any, at least annually, typically in December. The amount of dividends and distributions to shareholders from net investment
income and net realized capital gains is determined in accordance with Federal income tax regulations which differ from accounting principles
generally accepted in the United States of America.
Investment
income, expenses (other than those specific to the class of shares), and realized and unrealized gains and losses on investments are allocated
to the separate classes of each Fund based upon their relative net assets on the date income is earned or expensed and realized and unrealized
gains and losses are incurred.
Each
Fund is charged for those expenses that are directly attributable to the Fund, such as investment advisory, custody and transfer agent
fees. Expenses that are not attributable to a Fund are typically allocated among the Funds in proportion to their respective net assets.
Common expenses of the Trust are typically allocated among the funds in the Trust based on a fund’s respective net assets, or by
other equitable means.
TABLE OF CONTENTS
Pzena
Funds
Notes
to Financial Statements
February
28, 2026(Continued)
Reclassification
of Capital Accounts – Accounting principles generally accepted in the United States of America
require that certain components of net assets relating to permanent differences be reclassified between financial and tax reporting. These
reclassifications have no effect on net assets or net asset value per share. For the year ended February 28, 2026, the Funds made
the following permanent tax adjustments on the Statements of Assets and Liabilities:
|
|
|
|
|
|
|
|
|
Mid
Cap Value Fund |
|
|
$— |
|
|
$—
|
|
Emerging
Markets Value Fund |
|
|
$(17,955,379) |
|
|
$17,955,379
|
|
Small
Cap Value Fund |
|
|
$— |
|
|
$—
|
|
International
Small Cap Value Fund |
|
|
$(406,971) |
|
|
$406,971
|
|
International
Value Fund |
|
|
$(85,412) |
|
|
$85,412 |
|
|
|
|
|
|
|
|
Use
of Estimates – The preparation of financial statements in conformity with accounting principles
generally accepted in the United States of America requires management to make estimates and assumptions that affect the reported amounts
of assets and liabilities and disclosure of contingent assets and liabilities at the date of the financial statements and the reported
amounts of increases and decreases in net assets from operation during the reporting period. Actual results could differ from those estimates.
Guarantees
and Indemnifications – In the normal course of business, the Funds enter into contracts with service
providers that contain general indemnification clauses. The Funds’ maximum exposure under these arrangements is unknown as this
would involve future claims against the Funds that have not yet occurred. Based on experience, the Funds expect the risk of loss to be
remote.
Foreign
Currency – Investment securities and other assets and liabilities denominated in foreign currencies
are translated into U.S. dollar amounts at the date of valuation. Purchases and sales of investment securities and income and expense
items denominated in foreign currencies are translated to U.S. dollar amounts on the respective dates of such transactions.
The
Funds do not isolate those portions of the results of operations resulting from changes in foreign exchange rates on investments from
the fluctuations arising from changes in market prices of securities held. Such fluctuations are included with the net realized and unrealized
gain or loss from investments.
Reported
net realized foreign exchange gains or losses arise from sales of foreign currencies, currency gains or losses realized between the trade
and settlement dates on securities transactions, and the difference between the amounts of dividends, interest, and foreign withholding
taxes recorded on the Funds’ books and the U.S. dollar equivalent of the amounts actually received or paid. Net unrealized foreign
exchange gains and losses arise from changes in the fair values of assets and liabilities, other than investments in securities at fiscal
period-end, resulting from changes in exchange rates.
REITs
– The Funds can make certain investments in real estate investment trusts (“REITs”)
which pay dividends to their shareholders based upon funds available from operations. It is quite common for these dividends to exceed
the REITs’ taxable earnings and profits resulting in the excess portion of such dividends being designated as a return of capital.
Each Fund intends to include the gross dividends from such REITs in its annual distributions to its shareholders and, accordingly, a portion
of each Fund’s distributions may also be designated as a return of capital.
Derivatives
– The Trust Rule 18f-4 Compliance Policy (“Trust Policy”) governs the use of
derivatives by the Funds. The Trust Policy imposes limits on the amount of derivatives a fund can enter into, eliminates the asset segregation
framework currently used by a fund to comply with Section 18 of the 1940 Act, treats derivatives as senior securities and requires
funds whose use of derivatives is more than a limited specified exposure amount to establish and maintain a comprehensive derivatives
risk management program and appoint a derivatives risk manager. Each Fund is considered a limited derivatives user under the Trust Policy
and therefore, is required to limit its derivatives exposure to no more than 10% of the Fund’s net assets. For the year ended February 28,
2026, the Funds did not enter into derivatives transactions.
TABLE OF CONTENTS
Pzena
Funds
Notes
to Financial Statements
February
28, 2026(Continued)
Events
Subsequent to the Fiscal Year End – In preparing the financial statements as February 28, 2026,
management considered the impact of subsequent events for the potential recognition or disclosure in the financial statements. Refer to
Note 12 for more information about subsequent events.
Accounting
Pronouncements – In December 2023, the Financial Accounting Standard Board issued Accounting Standards
Update (“ASU”) 2023-09, Income Taxes (Topic 740) (“ASU 2023-09”) Improvements to Income Tax Disclosures, which
enhances income tax disclosures, including providing specific information regarding income taxes paid. The Funds have adopted ASU 2023-09
as of February 28, 2026, with no material impact on the Funds’ financial statements.
Segment
Reporting – An operating segment is defined in Topic 280 as a component of a public entity that
engages in business activities from which it may recognize revenues and incur expenses, has operating results that are regularly reviewed
by the public entity’s chief operating decision maker (“CODM”) to make decisions about resources to be allocated to
the segment and assess its performance, and has discrete financial information available. The Management Committee of Pzena Investment
Management, LLC (“Adviser”) acts as the CODM. This committee is composed of the Executive Committee, which includes the Chief
Executive Officer, Chief Financial Officer and Treasurer, Chief Operating Officer, Co-Chief Investment Officer, and President. Each Fund
within the Trust represents a single operating segment, as the CODM monitors the operating results of each fund as a whole and each Fund’s
long-term strategic asset allocation is pre-determined in accordance with the terms of its prospectus, based on a defined investment strategy
which is executed by each Fund’s portfolio managers as a team. The financial information in the form of a fund’s total returns,
expense ratios, changes in net assets resulting from operations, subscriptions and redemptions and profitability to the Adviser, which
are used by the CODM to assess the segment’s performance versus each Fund’s comparative benchmarks and peers to make resource
allocation decisions for each Fund’s single segment, is consistent with that presented within each Fund’s financial statements.
Segment assets are reflected on the accompanying statement of assets and liabilities as “total assets” and significant segment
expenses are listed on the accompanying statement of operations.
NOTE
3 – SECURITIES VALUATION
The
Funds have adopted authoritative fair value accounting standards which establish an authoritative definition of fair value and set out
a hierarchy for measuring fair value. These standards require additional disclosures about the various inputs and valuation techniques
used to develop the measurements of fair value, a discussion in changes in valuation techniques and related inputs during the period and
expanded disclosure of valuation levels for major security types. These inputs are summarized in the three broad levels listed below:
|
Level 1 –
|
Unadjusted quoted prices in active markets
for identical assets or liabilities that the Fund has the ability to access. |
|
Level 2 –
|
Observable inputs other than quoted prices
included in Level 1 that are observable for the asset or liability, either directly or indirectly. These inputs may include quoted prices
for the identical instrument on an inactive market, prices for similar instruments, interest rates, prepayment speeds, credit risk, yield
curves, default rates and similar data. |
|
Level 3 –
|
Unobservable inputs for the asset or liability,
to the extent relevant observable inputs are not available, representing the Funds’ own assumptions about the assumptions a market
participant would use in valuing the asset or liability, and would be based on the best information available. |
Following
is a description of the valuation techniques applied to the Funds’ major categories of assets and liabilities measured at fair value
on a recurring basis:
Each
Fund determines the fair value of its investments and computes its net asset value per share as of the close of regular trading on the
New York Stock Exchange (4:00 pm EST).
Equity
Securities – Equity securities, including common stocks, preferred stocks, foreign-issued common
stocks, exchange-traded funds, closed-end mutual funds and REITs, that are primarily traded on a national securities exchange shall be
valued at the last sale price on the exchange on which they are primarily traded on the day of valuation or, if there has been no sale
on such day, at the mean between the bid and asked prices. Securities primarily traded in the
TABLE OF CONTENTS
Pzena
Funds
Notes
to Financial Statements
February
28, 2026(Continued)
NASDAQ
Global Market System for which market quotations are readily available shall be valued using the NASDAQ Official Closing Price (“NOCP”).
If the NOCP is not available, such securities shall be valued at the last sale price on the day of valuation, or if there has been no
sale on such day, at the mean between the bid and asked prices. Over-the-counter securities which are not traded in the NASDAQ Global
Market System shall be valued at the most recent sales price. The values for foreign securities are reported in local currency and converted
to U.S. dollars using currency exchange rates. Exchange rates are provided daily by a recognized independent pricing agent. To the extent
these securities are actively traded and valuation adjustments are not applied, they are categorized in Level 1 of the fair value hierarchy.
Participatory
Notes – Participatory notes are valued with an evaluated price provided by an independent pricing
service. These securities will generally be classified in Level 2 of the fair value hierarchy.
Investment
Companies – Investments in open-end mutual funds, including money market funds, are valued at
their net asset value per share provided by the service agent of the Funds and will be classified in Level 1 of the fair value hierarchy.
Short-Term
Securities – Short-term securities having a maturity of less than 60 days are valued at the evaluated
mean between bid and asked price. To the extent the inputs are observable and timely, these securities would be classified in Level 2
of the fair value hierarchy.
Restricted
Securities – The Funds may invest in securities that are subject to legal or contractual restrictions
on resale (“restricted securities”). Restricted securities are often purchased in private placement transactions, are not
registered under the Securities Act of 1933, may have contractual restrictions on resale, and may be valued under methods approved by
the Board of Trustees (“Board”) as reflecting fair value. Certain restricted securities eligible for resale to qualified institutional
investors, including Rule 144a securities, are not subject to the limitation on the Funds’ investment in illiquid securities
if they are determined to be liquid in accordance with the procedures adopted by the Board.
The
Board has adopted a valuation policy for use by each Fund and its Valuation Designee (as defined below) in calculating each Fund’s
net asset value (“NAV”). Pursuant to Rule 2a-5 under the 1940 Act, the Board has designated the Adviser as the “Valuation
Designee” to perform all of the fair value determinations as well as to perform all of the responsibilities that may be performed
by the Valuation Designee in accordance with Rule 2a-5, subject to the Board’s oversight. The Adviser, as Valuation Designee,
is authorized to make all necessary determinations of the fair values of portfolio securities and other assets for which market quotations
are not readily available or if it is deemed that the prices obtained from brokers and dealers or independent pricing services are unreliable.
Depending
on the relative significance of the valuation inputs, fair valued securities may be classified in either Level 2 or Level 3
of the fair value hierarchy.
The
inputs or methodology used for valuing securities are not an indication of the risk associated with investing in those securities.
The
following is a summary of the inputs used to value the Funds’ securities as of February 28, 2026:
Mid
Cap Value Fund
|
|
|
|
|
|
|
|
|
|
|
|
|
|
|
Common
Stocks |
|
|
$97,755,743 |
|
|
$— |
|
|
$— |
|
|
$97,755,743
|
|
Short-Term
Investments |
|
|
827,685 |
|
|
— |
|
|
— |
|
|
827,685
|
|
Total
Assets |
|
|
$98,583,428 |
|
|
$— |
|
|
$— |
|
|
$98,583,428 |
|
|
|
|
|
|
|
|
|
|
|
|
|
|
Emerging
Markets Value Fund
|
|
|
|
|
|
|
|
|
|
|
|
|
|
|
Common
Stocks |
|
|
$3,795,076,941 |
|
|
$— |
|
|
$4,085 |
|
|
$3,795,081,026
|
|
Preferred
Stocks |
|
|
156,636,353 |
|
|
— |
|
|
— |
|
|
156,636,353
|
|
Short-Term
Investments |
|
|
83,534,080 |
|
|
— |
|
|
— |
|
|
83,534,080
|
|
Total
Assets |
|
|
$
4,035,247,374 |
|
|
$— |
|
|
$4,085 |
|
|
$4,035,251,459 |
|
|
|
|
|
|
|
|
|
|
|
|
|
|
TABLE OF CONTENTS
Pzena
Funds
Notes
to Financial Statements
February
28, 2026(Continued)
Small
Cap Value Fund
|
|
|
|
|
|
|
|
|
|
|
|
|
|
|
Common
Stocks |
|
|
$90,829,393 |
|
|
$1,723,867 |
|
|
$— |
|
|
$92,553,260
|
|
Real
Estate Investment Trusts |
|
|
885,156 |
|
|
— |
|
|
— |
|
|
885,156
|
|
Short-Term
Investments |
|
|
3,235,984 |
|
|
— |
|
|
— |
|
|
3,235,984
|
|
Total
Assets |
|
|
$94,950,533 |
|
|
$1,723,867 |
|
|
$— |
|
|
$96,674,400 |
|
|
|
|
|
|
|
|
|
|
|
|
|
|
International
Small Cap Value Fund
|
|
|
|
|
|
|
|
|
|
|
|
|
|
|
Common
Stocks |
|
|
$218,096,515 |
|
|
$1,172,324 |
|
|
$— |
|
|
$219,268,839
|
|
Short-Term
Investments |
|
|
7,326,745 |
|
|
— |
|
|
— |
|
|
7,326,745
|
|
Total
Assets |
|
|
$225,423,260 |
|
|
$1,172,324 |
|
|
$— |
|
|
$226,595,584 |
|
|
|
|
|
|
|
|
|
|
|
|
|
|
International
Value Fund
|
|
|
|
|
|
|
|
|
|
|
|
|
|
|
Common
Stocks |
|
|
$136,914,899 |
|
|
$— |
|
|
$— |
|
|
$136,914,899
|
|
Short-Term
Investments |
|
|
1,963,891 |
|
|
— |
|
|
— |
|
|
1,963,891
|
|
Total
Assets |
|
|
$138,878,790 |
|
|
$— |
|
|
$— |
|
|
$138,878,790 |
|
|
|
|
|
|
|
|
|
|
|
|
|
|
Refer
to the Funds’ schedule of investments for a detailed break-out of securities.
NOTE
4 – INVESTMENT ADVISORY FEE AND OTHER TRANSACTIONS WITH AFFILIATES
The
Funds have an investment advisory agreement with the Adviser pursuant to which the Adviser is responsible for providing investment management
services to each Fund. The Adviser furnishes all investment advice, office space and facilities, and provides most of the personnel needed
by the Funds. As compensation for its services, the Adviser is entitled to a monthly management fee, based upon the average daily net
assets of the Funds at the annual rates of:
|
|
|
|
|
|
Mid
Cap Value Fund |
|
|
0.80%
|
|
Emerging
Markets Value Fund |
|
|
1.00%
|
|
Small
Cap Value Fund |
|
|
0.95%
|
|
International
Small Cap Value Fund |
|
|
0.95%
|
|
International
Value Fund |
|
|
0.65% |
|
|
|
|
|
For
the year ended February 28, 2026, the Funds incurred the following in advisory fees:
|
|
|
|
|
|
Mid
Cap Value Fund |
|
|
$841,565
|
|
Emerging
Markets Value Fund |
|
|
28,526,592
|
|
Small
Cap Value Fund |
|
|
561,762
|
|
International
Small Cap Value Fund |
|
|
1,685,816
|
|
International
Value Fund |
|
|
759,191 |
|
|
|
|
|
TABLE OF CONTENTS
Pzena
Funds
Notes
to Financial Statements
February
28, 2026(Continued)
The
Funds are responsible for their own operating expenses. The Adviser has contractually agreed to waive a portion or all of its management
fees and pay expenses of the Funds to ensure that the net annual operating expenses (excluding acquired fund fees, interest expense, taxes,
dividends on securities sold short, extraordinary expenses, Rule 12b-1 fees, shareholder servicing fees, and other class-specific
expenses) do not exceed the following amounts of the average daily net assets for each class of shares:
|
|
|
|
|
|
|
|
|
|
|
|
|
|
|
0.90% |
|
|
1.08% |
|
|
1.00% |
|
|
1.03% |
|
|
0.74% |
|
|
|
|
|
|
|
|
|
|
|
|
|
|
Any
such reduction made by the Adviser in its fees or payment of expenses which are the Funds’ obligation are subject to reimbursement
by the Funds to the Adviser, if so requested by the Adviser, in any subsequent month in the 36-month period from the date of the management
fee reduction and expense payment if the aggregate amount actually paid by the Funds toward the operating expenses for such fiscal year
(taking into account the reimbursement) will not cause the Funds to exceed the lesser of: (1) the expense limitation in place at the time
of the management fee reduction and expense payment; or (2) the expense limitation in place at the time of the reimbursement. Any such
reimbursement is also contingent upon Board review and approval. Such reimbursement may not be paid prior to the Funds’ payment
of current ordinary operating expenses. For the year ended February 28, 2026, the Adviser reduced its fees and reduced other operating
expenses in the amount of $165,084 for the Mid Cap Value Fund, $800,761 for the Emerging Markets Value Fund, $246,183 for the Small Cap
Value Fund, $268,605 for the International Small Cap Value Fund, and $199,797 for the International Value Fund. The Adviser may recapture
portions of the amounts shown below no later than the corresponding dates:
|
|
|
|
|
|
|
|
|
|
|
|
|
|
|
Mid
Cap Value Fund |
|
|
$116,009 |
|
|
$102,504 |
|
|
$165,084 |
|
|
$383,597
|
|
Emerging
Markets Value Fund |
|
|
858,787 |
|
|
944,957 |
|
|
800,761 |
|
|
2,604,505
|
|
Small
Cap Value Fund |
|
|
243,889 |
|
|
221,715 |
|
|
246,183 |
|
|
711,787
|
|
International
Small Cap Value Fund |
|
|
205,550 |
|
|
208,537 |
|
|
268,605 |
|
|
682,692
|
|
International
Value Fund |
|
|
207,618 |
|
|
216,938 |
|
|
199,797 |
|
|
624,353 |
|
|
|
|
|
|
|
|
|
|
|
|
|
|
U.S.
Bancorp Fund Services, doing business as U.S. Bank Global Fund Services (“Fund Services”) serves as the Funds’ administrator,
fund accountant, and transfer agent. U.S. Bank N.A. serves as custodian (the “Custodian”) to the Funds. The Custodian is an
affiliate of Fund Services. Fund Services maintains the Funds’ books and records, calculates the Funds’ NAV, prepares various
federal and state regulatory filings, coordinates the payment of fund expenses, reviews expense accruals and prepares materials supplied
to the Board.
The
officers of the Trust and the Chief Compliance Officer are also employees of Fund Services. Fees paid by the Funds for administration
and accounting, transfer agency, custody and compliance services for the year ended February 28, 2026 are disclosed in the statements
of operations.
Quasar
Distributors, LLC (“Quasar”) acts as the Funds’ principal underwriter in a continuous public offering of the Funds’
shares. Quasar is a wholly-owned subsidiary of Foreside Financial Group, LLC, doing business as ACA Group.
NOTE
5 – 12b-1 DISTRIBUTION FEES
The
Funds have adopted a Distribution Plan pursuant to Rule 12b-1 (the “Plan”). The Plan permits the Funds to pay for distribution
and related expenses at an annual rate of up to 0.25% of the average daily net assets of the Funds’ Investor Class shares.
The expenses covered by the Plan may include the cost in connection with the promotion and distribution of shares and the provision of
personal services to shareholders, including, but not necessarily limited to, advertising, compensation to underwriters, dealers and selling
personnel, the printing and mailing of prospectuses to other than current Fund shareholders, and the printing and mailing of sales literature.
Payments made pursuant to the Plan will represent compensation for distribution and service activities, not reimbursements for specific
expenses incurred. For the year ended February 28, 2026, the 12b-1 distribution fees incurred under the Plan by each of the Fund’s
Investor Class shares are disclosed in the statements of operations.
TABLE OF CONTENTS
Pzena
Funds
Notes
to Financial Statements
February
28, 2026(Continued)
NOTE
6 – SHAREHOLDER SERVICING FEES
The
Funds have entered into a shareholder servicing agreement (the “Agreement”) with the Adviser, under which the Adviser will
provide, or arrange for others to provide, certain specified shareholder services. As compensation for the provision of shareholder services,
the Funds may pay servicing fees at an annual rate of up to 0.10% of the average daily net assets of the Investor Class shares. Payments
to the Adviser under the Agreement may reimburse the Adviser for payments it makes to selected brokers, dealers and administrators which
have entered into service agreements with the Adviser for services provided to shareholders of each Fund. The services provided by such
intermediaries are primarily designed to assist shareholders of the Funds and include the furnishing of office space and equipment, telephone
facilities, personnel, and assistance to the Funds in servicing such shareholders. Services provided by such intermediaries also include
the provision of support services to the Funds and include establishing and maintaining shareholders’ accounts and record processing,
purchase and redemption transactions, answering routine client inquiries regarding the Funds, and providing such other personal services
to shareholders as the Funds may reasonably request. For the year ended February 28, 2026, the shareholder servicing fees incurred
under the Agreement by each of the Fund’s Investor Class shares are disclosed in the statements of operations.
NOTE
7 – PURCHASES AND SALES OF SECURITIES
For
the year ended February 28, 2026, the cost of purchases and the proceeds from sales of securities, excluding short-term securities,
were as follows:
|
|
|
|
|
|
|
|
|
Mid
Cap Value Fund |
|
|
$32,524,985 |
|
|
$69,054,011
|
|
Emerging
Markets Value Fund |
|
|
1,449,399,969 |
|
|
782,233,257
|
|
Small
Cap Value Fund |
|
|
53,735,844 |
|
|
24,337,752
|
|
International
Small Cap Value Fund |
|
|
191,478,350 |
|
|
79,117,521
|
|
International
Value Fund |
|
|
35,173,747 |
|
|
32,954,548 |
|
|
|
|
|
|
|
|
There
were no purchases or sales of long-term U.S. Government securities.
NOTE
8 – LINE OF CREDIT
The
Funds have a secured line of credit in the amount of $100,000,000 or 10% of the market value or 33% of the fair value of the unencumbered
assets of each Fund. The line of credit matures on March 18, 2027. This line of credit is intended to provide short-term financing, if
necessary, subject to certain restrictions, in connection with shareholder redemptions. The credit facility is with the Funds’ custodian,
U.S. Bank N.A. During the year ended February 28, 2026, the Emerging Markets Value Fund did not draw upon the line of credit. During
the year ended February 28, 2026, the Mid Cap Value Fund had an average daily outstanding balance of $30,323, a weighted average
interest rate of 7.45%, incurred interest expense of $2,289 and had a maximum amount outstanding of $4,782,000. The International Small
Cap Value Fund had an average daily outstanding balance of $929, a weighted average interest rate of 6.75%, incurred interest expense
of $64 and had a maximum amount outstanding of $339,000. The Small Cap Value Fund had an average daily outstanding balance of $70,611,
a weighted average interest rate of 7.50%, incurred interest expense of $5,369 and had a maximum amount outstanding of $6,561,000. The
International Value Fund had an average daily outstanding balance of $7,014, a weighted average interest rate of 6.75%, incurred interest
expense of $480 and had a maximum amount outstanding of $686,000. At February 28, 2026, the Funds had no outstanding loan amounts.
TABLE OF CONTENTS
Pzena
Funds
Notes
to Financial Statements
February
28, 2026(Continued)
NOTE
9 – INCOME TAXES AND DISTRIBUTIONS TO SHAREHOLDERS
As
of February 28, 2026, the components of accumulated earnings/(losses) on a tax basis were as follows:
|
|
|
|
|
|
|
|
|
|
|
|
|
|
|
|
|
|
Cost
of investments(a) |
|
|
$93,874,643 |
|
|
$2,838,603,932 |
|
|
$92,889,620 |
|
|
$177,734,640 |
|
|
$93,410,333
|
|
Gross
unrealized appreciation |
|
|
22,170,139 |
|
|
1,329,876,195 |
|
|
13,433,668 |
|
|
53,031,630 |
|
|
47,354,009
|
|
Gross
unrealized depreciation |
|
|
(17,461,354) |
|
|
(133,228,668) |
|
|
(9,648,888) |
|
|
(4,170,686) |
|
|
(1,885,552)
|
|
Net
unrealized appreciation (depreciation)(a) |
|
|
4,708,785 |
|
|
1,196,647,527 |
|
|
3,784,780 |
|
|
48,860,944 |
|
|
45,468,457
|
|
Net
unrealized appreciation (depreciation) on foreign currency |
|
|
(7)
|
|
|
489,582
|
|
|
—
|
|
|
11,129
|
|
|
20,228 |
|
Undistributed
ordinary income |
|
|
1,638,074 |
|
|
56,613,268 |
|
|
694,418 |
|
|
119,571 |
|
|
206,653
|
|
Undistributed
long-term capital
gains |
|
|
— |
|
|
17,002,679 |
|
|
— |
|
|
1,726,300 |
|
|
1,424,850
|
|
Total
distributable earnings |
|
|
1,638,074 |
|
|
73,615,947 |
|
|
694,418 |
|
|
1,845,871 |
|
|
1,631,503
|
|
Other
accumulated earnings/ (losses) |
|
|
(1,408,958)
|
|
|
(1,103,754)
|
|
|
(2,169,064)
|
|
|
—
|
|
|
— |
|
Total
accumulated earnings/
(losses) |
|
|
$4,937,894 |
|
|
$1,269,649,302 |
|
|
$2,310,134 |
|
|
$50,717,944 |
|
|
$47,120,188 |
|
|
|
|
|
|
|
|
|
|
|
|
|
|
|
|
|
|
(a)
|
The difference
between the book basis and tax basis net unrealized appreciation/(depreciation) and cost is attributable primarily to the tax deferral
of losses on wash sales adjustments and passive foreign investment companies. |
At
February 28, 2026, the Funds had tax basis capital losses to offset future gains as follows:
|
|
|
|
|
|
|
|
|
Pzena
Mid Cap Value Fund |
|
|
$448,348
|
|
|
$960,610 |
|
|
$1,408,958 |
|
|
No Expiration
|
|
Pzena
Small Cap Value Fund |
|
|
1,164,124
|
|
|
1,004,940 |
|
|
2,169,064 |
|
|
No Expiration |
|
|
|
|
|
|
|
|
|
|
|
|
|
|
The
tax character of distributions paid during the years ended February 28, 2026 and February 28, 2025 was as follows:
|
|
|
|
|
|
|
|
|
Mid
Cap Value Fund
|
|
|
|
|
|
|
|
Ordinary
income |
|
|
$207,614 |
|
|
$3,614,367
|
|
Long-term
capital gains |
|
|
3,930,252 |
|
|
19,039,561
|
|
Emerging
Markets Value Fund
|
|
|
|
|
|
|
|
Ordinary
income |
|
|
$116,010,429 |
|
|
$79,046,110
|
|
Long-term
capital gains |
|
|
33,444,550 |
|
|
62,122,149
|
|
Small
Cap Value Fund
|
|
|
|
|
|
|
|
Ordinary
income |
|
|
$47,775 |
|
|
$979,195
|
|
Long-term
capital gains |
|
|
1,705,760 |
|
|
3,143,125
|
|
International
Small Cap Value Fund
|
|
|
|
|
|
|
|
Ordinary
income |
|
|
$4,619,368 |
|
|
$1,151,319
|
|
Long-term
capital gains |
|
|
1,102,305 |
|
|
1,926,637
|
|
International
Value Fund
|
|
|
|
|
|
|
|
Ordinary
income |
|
|
$3,204,494 |
|
|
$
2,942,125 |
|
Long-term
capital gains |
|
|
3,943,114 |
|
|
2,642,398 |
|
|
|
|
|
|
|
|
TABLE OF CONTENTS
Pzena
Funds
Notes
to Financial Statements
February
28, 2026(Continued)
The
Funds may be subject to taxes imposed by countries in which they invest. Such taxes are generally based on income and/or capital gains
earned or repatriated. Taxes are accrued based on net investment income, net realized gains and net unrealized appreciation as such income
and/or gains are earned. Taxes may also be based on transactions in foreign currency and are accrued based on the value of investments
denominated in such currency.
NOTE
10 – PRINCIPAL RISKS
Below
is a summary of some, but not all, of the principal risks of investing in the Funds, each of which may adversely affect a Fund’s
net asset value and total return. The Funds’ most recent prospectus provides further descriptions of each Fund’s investment
objective, principal investment strategies and principal risks. The following risks apply to all Funds, unless specifically noted.
|
• |
Currency Risk.
Changes in foreign currency exchange rates will affect the value of what the Funds own and the Funds’ share price. Generally,
when the U.S. dollar rises in value against a foreign currency, an investment in that country loses value because that currency is worth
fewer U.S. dollars. Devaluation of a currency by a country’s government or banking authority also will have a significant impact
on the value of any investments denominated in that currency. Currency markets generally are not as regulated as securities markets and
the risk may be higher in emerging markets. |
|
• |
Emerging Markets
Risk. In addition to the risks of foreign securities in general, investments in emerging markets may be riskier than investments
in or exposure to investments in the U.S. and other developed markets for many reasons, including smaller market capitalizations, greater
price volatility, less liquidity, a higher degree of political and economic instability (which can freeze, restrict or suspend transactions
in those investments, including cash), the impact of economic sanctions, less governmental regulation and supervision of the financial
industry and markets, and less stringent financial reporting and accounting standards and controls. |
|
• |
Equity Securities
Risk. The price of equity securities may rise or fall because of economic or political
changes or changes in a company’s financial condition, sometimes rapidly or unpredictably. These price movements may result from
factors affecting individual companies, sectors or industries selected for the Funds’ portfolio or the securities market as a whole,
such as changes in economic or political conditions. |
|
• |
Foreign Securities
Risk. Investing in foreign securities typically involves more risks than investing in U.S. securities, and includes risks
associated with: (i) internal and external political and economic developments – e.g., the
political, economic and social policies and structures of some foreign countries may be less stable and more volatile than those in the
U.S. or some foreign countries may be subject to trading restrictions or economic sanctions; (ii) trading practices – e.g.,
government supervision and regulation of foreign securities and currency markets, trading systems and brokers may be less than in the
U.S.; (iii) availability of information – e.g., foreign issuers may not be subject
to the same disclosure, accounting and financial reporting standards and practices as U.S. issuers; (iv) limited markets – e.g.,
the securities of certain foreign issuers may be less liquid (harder to sell) and more volatile; and (v) currency exchange rate fluctuations
and policies. |
|
• |
General Market
Risk. Economies and financial markets throughout the world are becoming increasingly interconnected, which increases the likelihood
that events or conditions in one country or region will adversely impact markets or issuers in other countries or regions. Securities
in the Fund’s portfolio may underperform in comparison to securities in general financial markets, a particular financial market
or other asset classes due to a number of factors, including: inflation (or expectations for inflation); interest rates; global demand
for particular products or resources; natural disasters or events; pandemic diseases; terrorism; regulatory events; and government controls.
U.S. and international markets have experienced significant periods of volatility in recent years and months due to a number of economic,
political and global macro factors, which has resulted in disruptions to business operations and supply chains, stress on the global healthcare
system, growth concerns in the U.S. and overseas, staffing shortages and the inability to meet consumer demand, and widespread concern
and uncertainty. Continuing uncertainties regarding interest rates, rising inflation, political events, rising government debt in the
U.S. and trade tensions also contribute to market volatility. Conflict, loss of life and disaster connected to ongoing armed conflict
between Ukraine |
TABLE OF CONTENTS
Pzena
Funds
Notes
to Financial Statements
February
28, 2026(Continued)
and
Russia in Europe and Israel and Hamas in the Middle East could have severe adverse effects on the region, including significant adverse
effects on the regional or global economies and the markets for certain securities. The U.S. and the European Union imposed sanctions
on certain Russian individuals and companies, including certain financial institutions, and have limited certain exports and imports to
and from Russia. The war has contributed to recent market volatility and may continue to do so.
|
• |
Management
Risk. Each Fund is an actively managed investment portfolio and each Fund relies on the
Adviser’s ability to pursue the Fund’s goal. The Adviser will apply its investment techniques and risk analyses in making
investment decisions for the Funds, but there can be no guarantee that its decisions will produce the desired results. |
|
• |
Mid Cap Company
Risk (Mid Cap Value Fund). A mid cap company may be more vulnerable to adverse business or economic events than stocks of larger
companies. These stocks present greater risks than securities of larger, more diversified companies. |
|
• |
Small Cap Company
Risk (Small Cap Value Fund and International Small Cap Value Fund). Securities of companies with smaller market capitalizations
tend to be more volatile and less liquid than larger company stocks. Smaller companies may have no or relatively short operating histories,
or be newly public companies. |
|
• |
Value Style
Investing Risk. The Funds emphasize a “value” style of investing, which targets undervalued companies with characteristics
for improved valuations. This style of investing is subject to the risk that the valuations never improve or that the returns on “value”
securities may not move in tandem with the returns on other styles of investing or the stock market in general. |
NOTE
11 – TRUSTEES
Effective
December 31, 2025, Joe Redwine retired from the Board.
NOTE
12 – SUBSEQUENT EVENT
Ms.
Elaine Richards resigned as Secretary and Vice President of the Trust effective March 20, 2026. Ms. Lillian Kabakali was appointed Secretary
and Vice President of the Trust effective March 20, 2026.
TABLE OF CONTENTS
PZENA
FUNDS
REPORT
OF INDEPENDENT REGISTERED PUBLIC ACCOUNTING FIRM
To
the shareholders of Pzena Funds and the Board of Trustees of Advisors Series Trust:
Opinion
on the Financial Statements and Financial Highlights
We
have audited the accompanying statements of assets and liabilities of Pzena Funds, (the "Funds"), comprising Pzena Mid Cap Value Fund,
Pzena Emerging Markets Value Fund, Pzena Small Cap Value Fund, Pzena International Small Cap Value Fund, and Pzena International Value
Fund, including the schedules of investments as of February 28, 2026, the related statements of operations for the year then ended, statements
of changes in net assets for each of the two years in the period then ended, financial highlights for each of the two years in the period
then ended, and the related notes (collectively referred to as the "financial statements and financial highlights"). In our opinion, the
financial statements and financial highlights present fairly, in all material respects, the financial position of each of the funds constituting
the Advisors Series Trust as of February 28, 2026, and the results of their operations for the year then ended, the changes in their net
assets for each of the two years in the period then ended, and the financial highlights for each of the two years in the period then ended
in conformity with accounting principles generally accepted in the United States of America. The financial highlights for the year or
period ended February 29 (28), 2024, 2023, and 2022, were audited by other auditors, whose report dated April 29, 2024, expressed an unqualified
opinion on such financial highlights.
Basis
for Opinion
These
financial statements and financial highlights are the responsibility of the Funds’ management. Our responsibility is to express
an opinion on the Funds’ financial statements and financial highlights based on our audits. We are a public accounting firm registered
with the Public Company Accounting Oversight Board (United States) (PCAOB) and are required to be independent with respect to the Funds
in accordance with the U.S. federal securities laws and the applicable rules and regulations of the Securities and Exchange Commission
and the PCAOB.
We
conducted our audits in accordance with the standards of the PCAOB. Those standards require that we plan and perform the audit to obtain
reasonable assurance about whether the financial statements and financial highlights are free of material misstatement, whether due to
error or fraud. The Funds are not required to have, nor were we engaged to perform, an audit of their internal control over financial
reporting. As part of our audits we are required to obtain an understanding of internal control over financial reporting but not for the
purpose of expressing an opinion on the effectiveness of the Funds’ internal control over financial reporting. Accordingly, we express
no such opinion.
Our
audits included performing procedures to assess the risks of material misstatement of the financial statements and financial highlights,
whether due to error or fraud, and performing procedures that respond to those risks. Such procedures included examining, on a test basis,
evidence regarding the amounts and disclosures in the financial statements and financial highlights. Our audits also included evaluating
the accounting principles used and significant estimates made by management, as well as evaluating the overall presentation of the financial
statements and financial highlights. Our procedures included confirmation of securities owned as of February 28, 2026, by correspondence
with the custodian and brokers; when replies were not received from brokers, we performed other auditing procedures. We believe that our
audits provide a reasonable basis for our opinion.
Milwaukee,
Wisconsin
April
29, 2026
We
have served as the auditor of one or more Advisors Series Trust investment companies since 2024.
TABLE OF CONTENTS
Pzena
Funds
Additional
Information
The
below information is required disclosure from Form N-CSR
Item 8.
Changes in and Disagreements with Accountants for Open-End Investment Companies.
There
were no changes in or disagreements with accountants during the period covered by this report.
Item 9.
Proxy Disclosure for Open-End Investment Companies.
There
were no matters submitted to a vote of shareholders during the period covered by this report.
Item 10.
Remuneration Paid to Directors, Officers, and Others of Open-End Investment Companies.
Refer
to information provided within financial statements.
Item 11.
Statement Regarding Basis for Approval of Investment Advisory Contract.
Pzena
Mid Cap Value Fund
Pzena
Emerging Markets Value Fund
Pzena
Small Cap Value Fund
Pzena
International Small Cap Value Fund
Pzena
International Value Fund
Approval
of Investment Advisory Agreement (Unaudited)
At
meetings held on October 22, 2025 and December 11-12, 2025, the Board (which is comprised of five persons, all of whom are Independent
Trustees as defined under the Investment Company Act of 1940, as amended), considered and approved, for another annual term, the continuance
of the investment advisory agreement (the “Advisory Agreement”) between Advisors Series Trust (the “Trust”)
and Pzena Investment Management, LLC (the “Adviser”) on behalf of the Pzena Mid Cap Value Fund (the “Mid Cap Value Fund”),
Pzena Emerging Markets Value Fund (the “Emerging Markets Value Fund”), Pzena Small Cap Value Fund (the “Small Cap Value
Fund”), Pzena International Small Cap Value Fund (“International Small Cap Value Fund”) and Pzena International Value
Fund (“International Value Fund”) (each, a “Fund,” and together, the “Funds”). At both meetings, the
Board received and reviewed substantial information regarding the Funds, the Adviser and the services provided by the Adviser to the Funds
under the Advisory Agreement. This information, together with the information provided to the Board throughout the course of the year,
formed the primary (but not exclusive) basis for the Board’s determinations. Below is a summary of the factors considered by the
Board and the conclusions that formed the basis for the Board’s approval of the continuance of the Advisory Agreement:
|
1.
|
The
nature, extent and quality of the services provided and to be provided by the Adviser under the Advisory Agreement. The Board considered
the nature, extent and quality of the Adviser’s overall services provided to the Funds, as well as its specific responsibilities
in all aspects of day-to-day investment management of the Funds. The Board considered the qualifications, experience and responsibilities
of the portfolio managers, as well as the responsibilities of other key personnel of the Adviser involved in the day-to-day activities
of the Funds, noting that the Adviser currently serves as investment sub-adviser to a number of mutual funds not affiliated with the Trust
and previously managed its own family of proprietary mutual funds. The Board also considered the resources and compliance structure of
the Adviser, including information regarding its compliance program, its chief compliance officer and the Adviser’s compliance record,
as well as the Adviser’s cybersecurity program, AI-use policy, liquidity risk management program, valuation procedures, business
continuity plan, and risk management process. The Board further considered its knowledge of the Adviser’s operations and noted that
during the course of the prior year they had met with certain personnel of the Adviser to discuss the Funds’ performance and investment
outlook as well as various compliance topics and fund marketing/distribution. The Board concluded that the Adviser had the quality and
depth of personnel, resources, investment processes and compliance policies and procedures essential to performing its duties under the
Advisory Agreement and that they were satisfied with the nature, overall quality and extent of such management services. |
|
2.
|
The
Funds historical performance and the overall performance of the Adviser. In assessing the quality of the portfolio management delivered
by the Adviser, the Board reviewed the short-term and long-term performance of the Funds as of June 30, 2025 on both an absolute
basis and a relative basis in comparison to their peer funds utilizing Morningstar classifications, appropriate securities market benchmarks,
the |
TABLE OF CONTENTS
Pzena
Funds
Additional
Information(Continued)
Adviser’s
similarly managed accounts, and a cohort that is comprised of similarly managed funds selected by an independent third-party consulting
firm engaged by the Board to assist it in its 15(c) review (the “Cohort”). While the Board considered both short-term and
long-term performance, it placed greater emphasis on longer term performance. When reviewing performance against the comparative peer
group universe, the Board took into account that the investment objectives and strategies of each Fund, as well as its level of risk tolerance,
may differ significantly from funds in the peer universe. When reviewing a Fund’s performance against broad market benchmarks, the
Board took into account the differences in portfolio construction between the Fund and such benchmarks as well as other differences between
actively managed funds and passive benchmarks, such as objectives and risks. In assessing periods of relative underperformance or outperformance,
the Board took into account that relative performance can be significantly impacted by performance measurement periods and that some periods
of underperformance may be transitory in nature while others may reflect more significant underlying issues.
Mid
Cap Value Fund: The Board noted that the Fund underperformed the Morningstar peer group average for
the one- and three-year periods, and outperformed for the five- and ten-year periods ended June 30, 2025. The Fund underperformed
the average of its Cohort for the one-, three- and ten-year periods and outperformed for the five-year period ended June 30, 2025.
The Board also reviewed the performance of the Fund against a broad-based securities market benchmark, noting that it had underperformed
its primary benchmark index for the one-, three-, and ten-year periods and outperformed for the five-year period, all periods ended June 30,
2025.
The
Board also considered the Fund’s performance compared to the Adviser’s similarly managed accounts, noting that the Fund outperformed
the similarly managed composite for the one-, three-, five-, and ten-year periods ended June 30, 2025.
Emerging
Markets Value Fund: The Board noted that the Fund outperformed the Morningstar peer group average for
the one-, three-, five-, and ten-year periods ended June 30, 2025. The Board further noted that the Fund underperformed the Cohort
average for the one-year period, and outperformed for the three-, five-, and ten-year periods, all periods ended June 30, 2025. The
Board also reviewed the performance of the Fund against two broad-based securities market benchmarks, noting that it had underperformed
its primary benchmark for the one-year period and outperformed over the three-, five-, and ten-year periods, all periods ended June 30,
2025. The Fund outperformed its secondary benchmark for the one-, three-, five-, and ten-year periods, all periods ended June 30,
2025.
The
Board also considered the Fund’s performance compared to the Adviser’s similarly managed accounts, noting that the Fund outperformed
the similarly managed account composite for the one-year period and underperformed for the three-, five-, and ten-year periods, all periods
ended June 30, 2025.
Small
Cap Value Fund: The Board noted that the Fund underperformed the Morningstar peer group for the one-
and three-year periods, and outperformed for the five-year period, all periods ended June 30, 2025. The Board further noted that
the Fund underperformed the average of its Cohort for the one-year period and outperformed for the three- and five-year periods ended
June 30, 2025. The Board also reviewed the performance of the Fund against a broad-based securities market benchmark, noting that
it had underperformed its primary benchmark for the one-year period and outperformed for the three- and five-year periods, all periods
ended June 30, 2025.
The
Adviser represented that it does not manage any other accounts with a similar strategy to that of the Small Cap Value Fund.
International
Small Cap Value Fund: The Board noted that the Fund underperformed each of the Morningstar peer group
and Cohort average for the one-year period and outperformed for the three- and five-year periods, all periods ended June 30, 2025.
The Board also reviewed the performance of the Fund against two broad-based securities market benchmarks, noting that it underperformed
both its primary and secondary benchmark for the one-year period and outperformed over the three- and five-year periods, all periods ended
June 30, 2025.
TABLE OF CONTENTS
Pzena
Funds
Additional
Information(Continued)
The
Board also considered the Fund’s performance compared to the Adviser’s similarly managed accounts, noting that the Fund outperformed
the similarly managed account composite for the one-, three-, and five-year periods ended June 30, 2025.
International
Value Fund: The Board noted that the Fund underperformed the Morningstar peer group for the one-year
period, and outperformed for the three-year period, all periods ended June 30, 2025. The Board further noted that the Fund underperformed
the average of its Cohort for the one- and three-year periods ended June 30, 2025. The Board also reviewed the performance of the
Fund against two broad-based securities market benchmarks. The Board noted that the Fund outperformed its primary benchmark for the one-
and three-year periods, and underperformed its secondary benchmark for the one-and three-year periods, all periods ended June 30,
2025.
The
Board also considered the Fund’s performance compared to the Adviser’s similarly managed accounts, noting that the Fund outperformed
the similarly managed account composite for the one-year period and performed in line for the three-year period, all periods ended June 30,
2025.
|
3.
|
The
costs of the services to be provided by the Adviser and the structure of the Adviser’s fee under the Advisory Agreement. In
considering the advisory fee and total fees and expenses of the Funds, the Board reviewed comparisons to the applicable Morningstar peer
group, the Cohort and the Adviser’s similarly managed accounts for other types of clients, as well as all expense waivers and reimbursements.
When reviewing fees charged to other similarly managed accounts, the Board took into account the type of account and the differences in
the management of that account that might be germane to the difference, if any, in the fees charged to such accounts. |
Mid
Cap Value Fund: The Board noted that the Adviser had contractually agreed to maintain an annual expense
ratio for the Fund of 0.90%, excluding certain operating expenses and class-level expenses (the “Expense Cap”). The Board
noted that the Fund’s contractual management fee and net expense ratio were above the Cohort median and average. The Board also
took into consideration the services the Adviser provides to its similarly managed account clients, comparing the fees charged for those
management services to the management fees charged to the Fund. The Board found that the management fees charged to the Fund were lower
than, equal to, or higher than the fees charged to the Adviser’s similarly managed account clients depending on the asset level.
Emerging
Markets Value Fund: The Board noted that the Adviser had contractually agreed to maintain an annual
expense ratio for the Fund of 1.08%, excluding certain operating expenses and class-level expenses (the “Expense Cap”). The
Board noted that the contractual advisory fee and net expense ratio were above the Cohort median and average. The Board also took into
consideration the services the Adviser provides to its similarly managed account clients, comparing the fees charged for those management
services to the management fees charged to the Fund. The Board found that the management fees charged to the Fund were equal to or higher
than the fees charged to the Adviser’s similarly managed account clients depending on the asset level.
Small
Cap Value Fund: The Board noted that the Adviser had contractually agreed to maintain annual expense
ratios for the Fund of 1.00%, excluding certain operating expenses and class-level expenses (the “Expense Cap”). The Board
noted that the contractual advisory fee was above the Cohort median and average, while the net expense ratio was below the Cohort median
and average. The Board also considered that the Adviser does not manage any other accounts with a similar strategy to that of the Small
Cap Value Fund.
International
Small Cap Value Fund: The Board noted that the Adviser had contractually agreed to maintain an annual
expense ratio for the Fund of 1.03%, excluding certain operating expenses and class-level expenses (the “Expense Cap”). The
Board noted that the Fund’s contractual management fee was at the median and above the average of the Cohort, and the Fund’s
net expense ratio was above the Cohort median and average. The Board found that the management fees charged to the Fund were equal to
or higher than the fees charged to the Adviser’s similarly managed account clients depending on the asset level.
TABLE OF CONTENTS
Pzena
Funds
Additional
Information(Continued)
International
Value Fund: The Board noted that the Adviser had contractually agreed to maintain an annual expense
ratio for the Fund of 0.74%, excluding certain operating expenses and class-level expenses (the “Expense Cap”). The Board
noted that the Fund’s contractual management fee and net expense ratio were below the Cohort median and average. The Board found
that the management fees charged to the Fund were higher than the fees charged to the Adviser’s similarly managed account clients.
The
Board determined that it would continue to monitor the appropriateness of the advisory fees for the Funds and concluded that, at this
time, the fees to be paid to the Adviser were fair and reasonable.
|
4.
|
Economies
of Scale. The Board also considered whether economies of scale were being realized by the Adviser that should be shared with shareholders.
The Board further noted that the Adviser has contractually agreed to reduce its advisory fees or reimburse Fund expenses so that the Funds
do not exceed the specified Expense Caps. The Board noted that at current asset levels, it did not appear that there were additional significant
economies of scale being realized by the Adviser that should be shared with shareholders and concluded that it would continue to monitor
economies of scale in the future as circumstances changed and assuming asset levels increase. |
|
5.
|
The
profits to be realized by the Adviser and its affiliates from their relationship with the Funds. The Board reviewed the Adviser’s
financial information and took into account both the direct benefits and the indirect benefits to the Adviser from advising the Funds.
The Board considered the profitability to the Adviser from its relationship with the Funds and considered any additional material benefits
derived by the Adviser from its relationship with the Funds, such as Rule 12b-1 fees received from the Funds’ Investor Class shares.
The Board also considered “soft dollar” benefits that may be received by the Adviser in exchange for Fund brokerage. After
such review, the Board determined that the profitability to the Adviser with respect to the Advisory Agreement was not excessive, and
that the Adviser had maintained adequate profit levels to support the services it provides to the Funds. |
No
single factor was determinative of the Board’s decision to approve the continuance of the Advisory Agreement for the Funds, but
rather the Trustees based their determination on the total mix of information available to them. Based on a consideration of all the factors
in their totality, the Trustees determined that the advisory arrangement with the Adviser, including the advisory fee, was fair and reasonable
to the Funds. The Board, including a majority of the Independent Trustees, therefore determined that the continuance of the Advisory Agreement
for the Funds would be in the best interest of each Fund and its shareholders.
|
(b) |
Financial Highlights are included within the financial statements filed under Item 7 of
this Form. |
Item
8. Changes in and Disagreements with Accountants for Open-End Investment Companies.
There were no changes in or disagreements with accountants during
the period covered by this report.
Item
9. Proxy Disclosure for Open-End Investment Companies.
There were no matters submitted to a vote of shareholders during
the period covered by this report.
Item
10. Remuneration Paid to Directors, Officers, and Others of Open-End Investment Companies.
See Item 7(a).
Item
11. Statement Regarding Basis for Approval of Investment Advisory Contract.
See Item 7(a).
Item
12. Disclosure of Proxy Voting Policies and Procedures for Closed-End Management Investment Companies.
Not applicable to open-end investment companies.
Item 13. Portfolio Managers
of Closed-End Management Investment Companies.
Not applicable to open-end investment companies.
Item
14. Purchases of Equity Securities by Closed-End Management Investment Company and Affiliated Purchasers.
Not applicable to open-end investment companies.
Item 15. Submission
of Matters to a Vote of Security Holders.
There have been no material changes to the procedures by which shareholders
may recommend nominees to the Registrant’s Board of Trustees.
Item 16. Controls and
Procedures.
|
(a) |
The Registrant’s Principal Executive Officer and Principal Financial Officer have
reviewed the Registrant’s disclosure controls and procedures (as defined in Rule 30a-3(c) under the Investment Company Act of 1940,
as amended, (the “Act”)) as of a date within 90 days of the filing of this report, as required by Rule 30a-3(b) under the
Act and Rules 13a-15(b) or 15d-15(b) under the Securities Exchange Act of 1934. Based on their review, such officers have concluded that
the disclosure controls and procedures are effective in ensuring that information required to be disclosed in this report is appropriately
recorded, processed, summarized and reported and made known to them by others within the Registrant and by the Registrant’s service
provider. |
|
(b) |
There were no changes in the Registrant’s internal control over financial reporting
(as defined in Rule 30a-3(d) under the Act) that occurred during the period covered by this report that have materially affected, or are
reasonably likely to materially affect, the Registrant’s internal control over financial reporting. |
Item 17. Disclosure
of Securities Lending Activities for Closed-End Management Investment Companies.
Not applicable to open-end investment companies.
Item 18. Recovery of
Erroneously Awarded Compensation.
Not applicable.
Item 19. Exhibits.
(2) Any policy required by the listing standards adopted pursuant
to Rule 10D-1 under the Exchange Act (17 CFR 240.10D-1) by the registered national securities exchange or registered national securities
association upon which the registrant’s securities are listed. Not applicable.
(3) A separate certification
for each principal executive officer and principal financial officer of the registrant as required by Rule 30a-2(a) under the Investment
Company Act of 1940 (17 CFR 270.30a-2(a)). Filed herewith.
(4) Any written solicitation to purchase securities under
Rule 23c-1 under the Act sent or given during the period covered by the report by or on behalf of the registrant to 10 or more persons.
Not applicable to open-end investment companies.
(5) Change in the registrant’s independent public accountant. Provide the information called for by Item 4 of Form 8-K under the Exchange Act (17 CFR 249.308). Unless otherwise specified by Item 4, or related to and necessary for a complete understanding of information not previously disclosed, the information should relate to events occurring during the reporting period. Not applicable to open-end investment companies.
SIGNATURES
Pursuant to the requirements of the Securities
Exchange Act of 1934 and the Investment Company Act of 1940, as amended, the registrant has duly caused this report to be signed on its
behalf by the undersigned, thereunto duly authorized.
| |
(Registrant) |
Advisors Series Trust |
|
| |
By (Signature and Title) |
/s/ Jeffrey T. Rauman |
|
| |
|
Jeffrey T. Rauman, President/Chief Executive Officer/Principal Executive Officer |
|
Pursuant to the requirements of the Securities
Exchange Act of 1934 and the Investment Company Act of 1940, as amended, this report has been signed below by the following persons on
behalf of the registrant and in the capacities and on the dates indicated.
| |
By (Signature and Title) |
/s/ Jeffrey T. Rauman |
|
| |
|
Jeffrey T. Rauman, President/Chief Executive Officer/Principal Executive Officer |
|
| |
By (Signature and Title) |
/s/ Kevin J. Hayden |
|
| |
|
Kevin J. Hayden, Vice President/Treasurer/Principal Financial Officer |
|