Shareholder Report
Feb. 28, 2026
USD ($)
$ / shares
WHAT WERE THE FUND COSTS FOR THE PAST YEAR? (based on a hypothetical $10,000 investment)
|
Class Name
|
Costs of a $10,000 investment
|
Costs paid as a percentage of a $10,000 investment
|
|
Institutional Class
|
$93
|
0.90%
|
HOW DID THE FUND PERFORM LAST YEAR AND WHAT AFFECTED ITS PERFORMANCE?
U.S. mid-cap equities rose modestly during the trailing 12 months, against a backdrop of volatile market swings, strong enthusiasm for AI, and continued concentration in a narrow group of market leaders. While tariff-related uncertainty periodically unsettled markets, sentiment improved as the period progressed. Sector and stock-level dispersion remained elevated within the mid-cap segment. The Fund rose but trailed its benchmark, the Russell 1000 Index.
The Fund’s consumer discretionary holdings contributed most to absolute performance, while energy and financials also added positively. In contrast, health care and basic materials were the most notable detractors from performance, with telecommunications also weighing on results.
|
Top Contributors
|
|
|
↑
|
Equitable Holdings, Inc., CNO Financial Group, Inc., Delta Air Lines, Inc.
|
|
Top Detractors
|
|
|
↓
|
JELD-WEN Holding, Inc., Olin Corporation, Dollar General Corporation
|
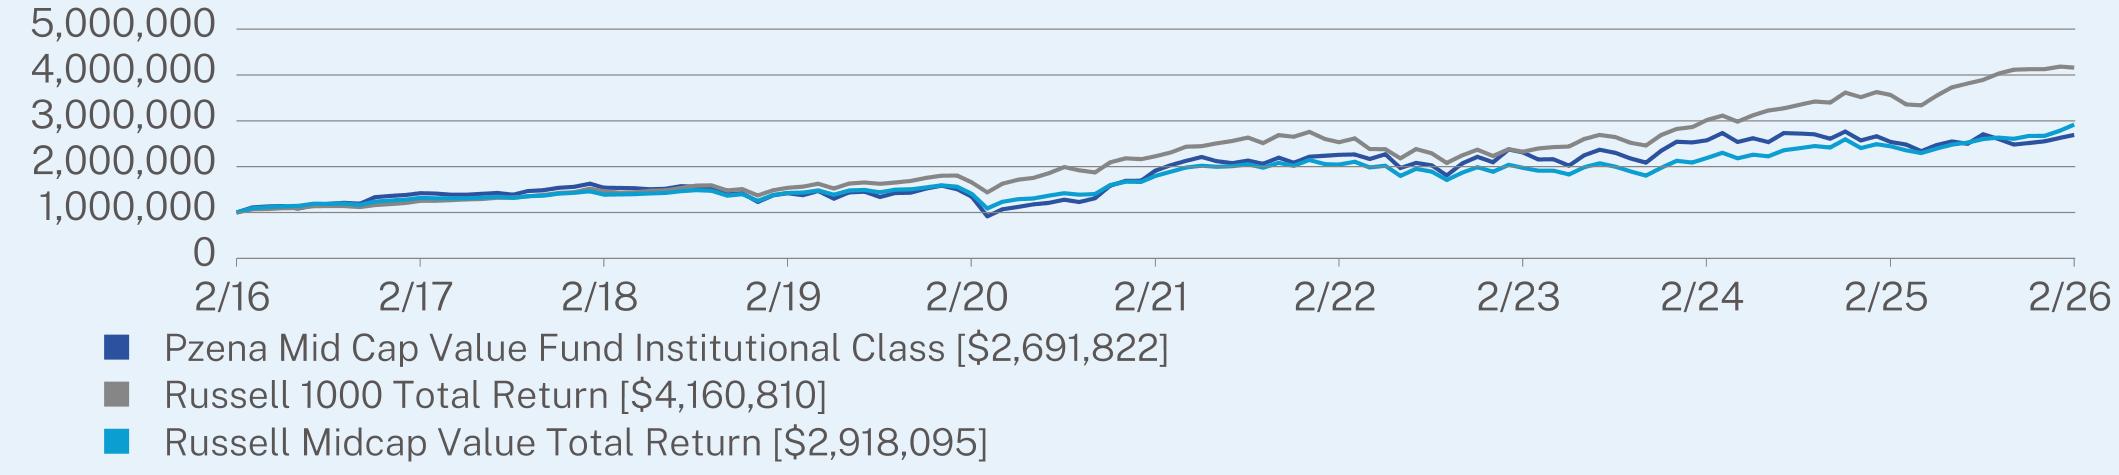
ANNUAL AVERAGE TOTAL RETURN (%)
|
|
1 Year
|
5 Year
|
10 Year
|
|
Institutional Class
|
5.98
|
7.06
|
10.41
|
|
Russell 1000 Total Return
|
16.73
|
13.32
|
15.32
|
|
Russell Midcap Value Total Return
|
19.33
|
10.17
|
11.30
|
Visit https://www.pzena.com/americas/institutional-investors/funds/us-mutual-funds/mid-cap-value-fund-pzimx/ for more recent performance information.
KEY FUND STATISTICS (as of February 28, 2026)
|
Net Assets
|
$98,126,725
|
|
Number of Holdings
|
40
|
|
Net Advisory Fee
|
$676,481
|
|
Portfolio Turnover
|
31%
|
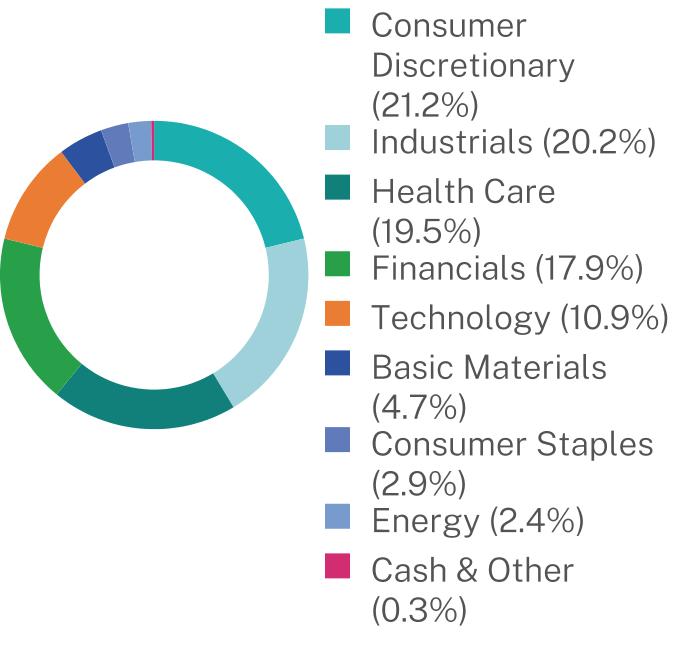
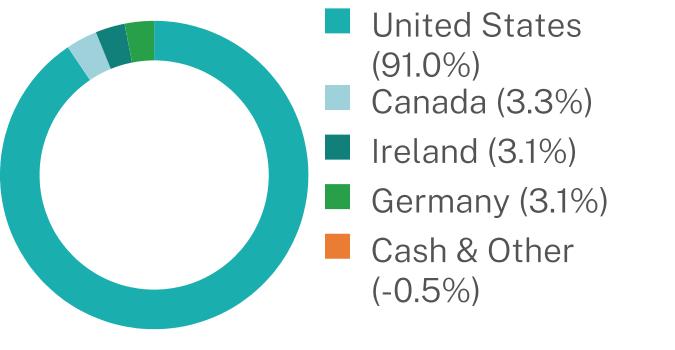
WHAT DID THE FUND INVEST IN? (as of February 28, 2026)
|
Top 10 Holdings
|
(% of Net Assets)
|
|
Advance Auto Parts, Inc.
|
5.0%
|
|
Baxter International, Inc.
|
5.0%
|
|
Humana, Inc.
|
4.4%
|
|
Oshkosh Corp.
|
4.1%
|
|
Avnet, Inc.
|
3.8%
|
|
Magna International, Inc.
|
3.3%
|
|
Dollar General Corp.
|
3.2%
|
|
Adient PLC
|
3.1%
|
|
Fresenius Medical Care AG & Co. KGaA
|
3.1%
|
|
Skyworks Solutions, Inc.
|
3.1%
|
Sector Breakdown (% of Net Assets)

Geographic Breakdown (% of Net Assets)

WHAT WERE THE FUND COSTS FOR THE PAST YEAR? (based on a hypothetical $10,000 investment)
|
Class Name
|
Costs of a $10,000 investment
|
Costs paid as a percentage of a $10,000 investment
|
|
Investor Class
|
$127
|
1.24%
|
HOW DID THE FUND PERFORM LAST YEAR AND WHAT AFFECTED ITS PERFORMANCE?
U.S. mid-cap equities rose modestly during the trailing 12 months, against a backdrop of volatile market swings, strong enthusiasm for AI, and continued concentration in a narrow group of market leaders. While tariff-related uncertainty periodically unsettled markets, sentiment improved as the period progressed. Sector and stock-level dispersion remained elevated within the mid-cap segment. The Fund rose but trailed its benchmark, the Russell 1000 Index.
The Fund’s consumer discretionary holdings contributed most to absolute performance, while energy and financials also added positively. In contrast, health care and basic materials were the most notable detractors from performance, with telecommunications also weighing on results.
|
Top Contributors
|
|
|
↑
|
Equitable Holdings, Inc., CNO Financial Group, Inc., Delta Air Lines, Inc.
|
|
Top Detractors
|
|
|
↓
|
JELD-WEN Holding, Inc., Olin Corporation, Dollar General Corporation
|
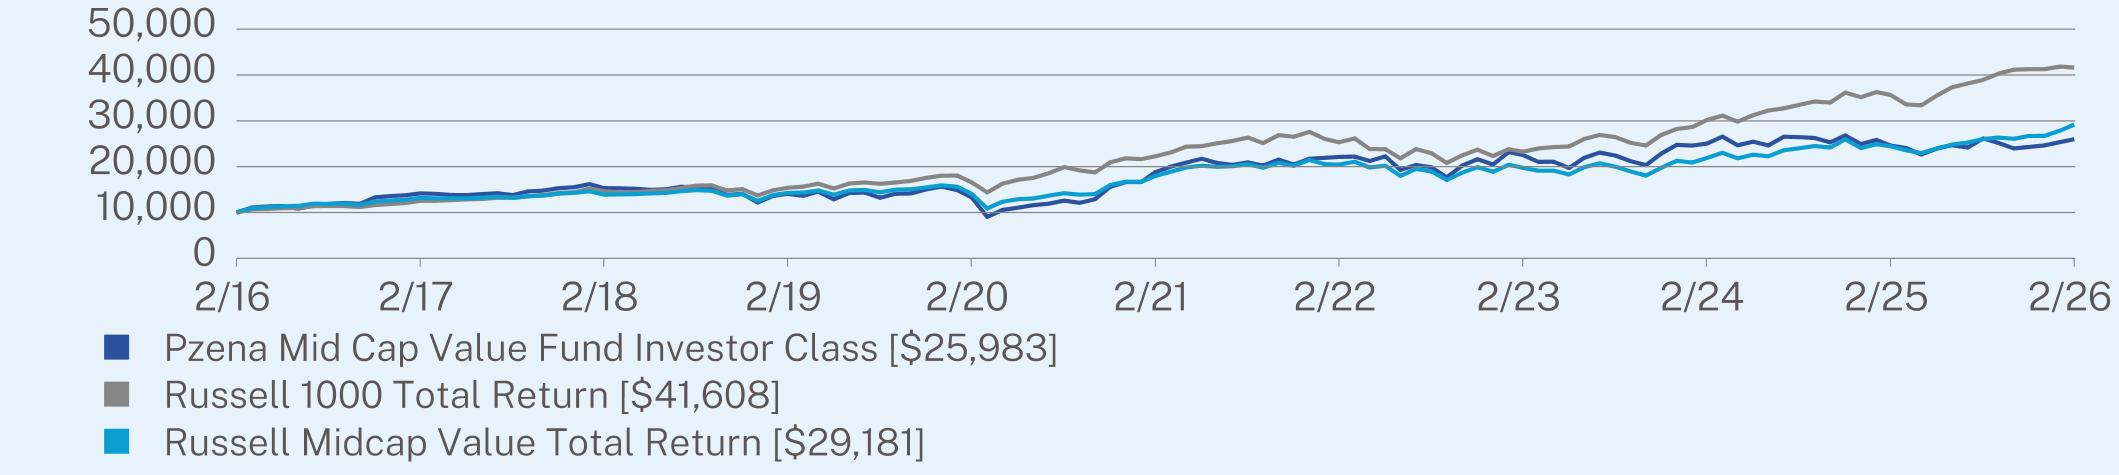
ANNUAL AVERAGE TOTAL RETURN (%)
|
|
1 Year
|
5 Year
|
10 Year
|
|
Investor Class
|
5.59
|
6.65
|
10.02
|
|
Russell 1000 Total Return
|
16.73
|
13.32
|
15.32
|
|
Russell Midcap Value Total Return
|
19.33
|
10.17
|
11.30
|
Visit https://www.pzena.com/americas/institutional-investors/funds/us-mutual-funds/mid-cap-value-fund-pzvmx/ for more recent performance information.
KEY FUND STATISTICS (as of February 28, 2026)
|
Net Assets
|
$98,126,725
|
|
Number of Holdings
|
40
|
|
Net Advisory Fee
|
$676,481
|
|
Portfolio Turnover
|
31%
|
WHAT DID THE FUND INVEST IN? (as of February 28, 2026)
|
Top 10 Holdings
|
(% of Net Assets)
|
|
Advance Auto Parts, Inc.
|
5.0%
|
|
Baxter International, Inc.
|
5.0%
|
|
Humana, Inc.
|
4.4%
|
|
Oshkosh Corp.
|
4.1%
|
|
Avnet, Inc.
|
3.8%
|
|
Magna International, Inc.
|
3.3%
|
|
Dollar General Corp.
|
3.2%
|
|
Adient PLC
|
3.1%
|
|
Fresenius Medical Care AG & Co. KGaA
|
3.1%
|
|
Skyworks Solutions, Inc.
|
3.1%
|
Sector Breakdown (% of Net Assets)
Geographic Breakdown (% of Net Assets)
WHAT WERE THE FUND COSTS FOR THE PAST YEAR? (based on a hypothetical $10,000 investment)
|
Class Name
|
Costs of a $10,000 investment
|
Costs paid as a percentage of a $10,000 investment
|
|
Institutional Class
|
$137
|
1.08%
|
HOW DID THE FUND PERFORM LAST YEAR AND WHAT AFFECTED ITS PERFORMANCE?
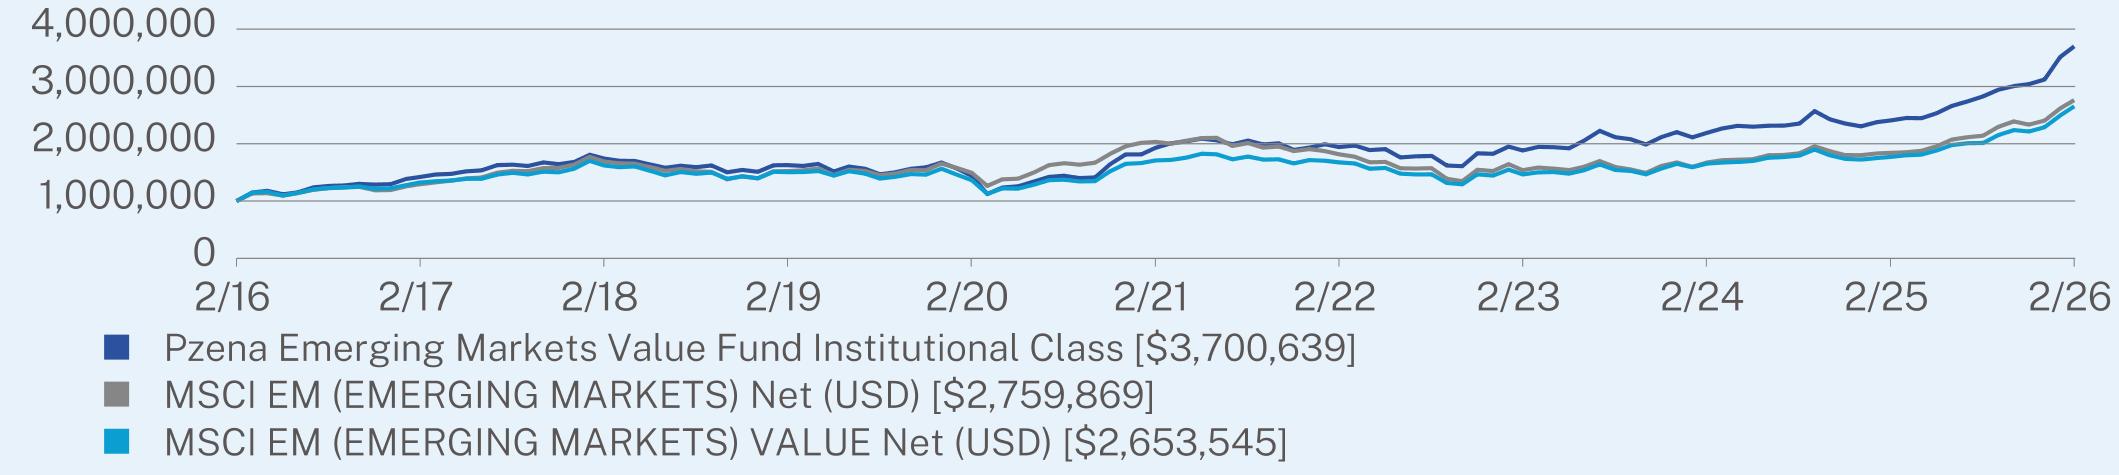
Emerging markets rose during the trailing 12 months, against a backdrop of volatile market conditions and continued strength in technology-related areas, though returns were increasingly dispersed across countries and sectors. Technology-driven gains in markets such as Korea and Taiwan, alongside strong performance in parts of Latin America, contrasted with softer results in countries including India and Indonesia. At the sector level, information technology, materials, industrials, and financials were the strongest performers, while no sector posted negative performance over the period. The Fund rose during the period and outperformed the MSCI Emerging Markets Index.
Financials, information technology, and industrials were the largest contributors to absolute performance, while consumer discretionary and consumer staples also contributed positively.
At the country level, Korea, China, and Brazil were the largest contributors to absolute performance, while Kazakhstan, South Africa, and Saudi Arabia weighed on results.
|
Top Contributors
|
|
|
↑
|
Hon Hai Precision Industry Co., Ltd., Alibaba Group Holding Limited, Taiwan Semiconductor Manufacturing Co., Ltd.
|
|
Top Detractors
|
|
|
↓
|
Samsung Electronics Co., Ltd., PT Bank Rakyat Indonesia (Persero) Tbk Class B, Hankook Tire & Technology Co., Ltd.
|
ANNUAL AVERAGE TOTAL RETURN (%)
|
|
1 Year
|
5 Year
|
10 Year
|
|
Institutional Class
|
53.76
|
13.92
|
13.98
|
|
MSCI EM (EMERGING MARKETS) Net (USD)
|
49.96
|
6.31
|
10.69
|
|
MSCI EM (EMERGING MARKETS) VALUE Net (USD)
|
49.90
|
9.21
|
10.25
|
Visit https://www.pzena.com/americas/institutional-investors/funds/us-mutual-funds/emerging-markets-value-fund-pziex/ for more recent performance information.
KEY FUND STATISTICS (as of February 28, 2026)
|
Net Assets
|
$4,042,693,642
|
|
Number of Holdings
|
69
|
|
Net Advisory Fee
|
$27,725,831
|
|
Portfolio Turnover
|
28%
|
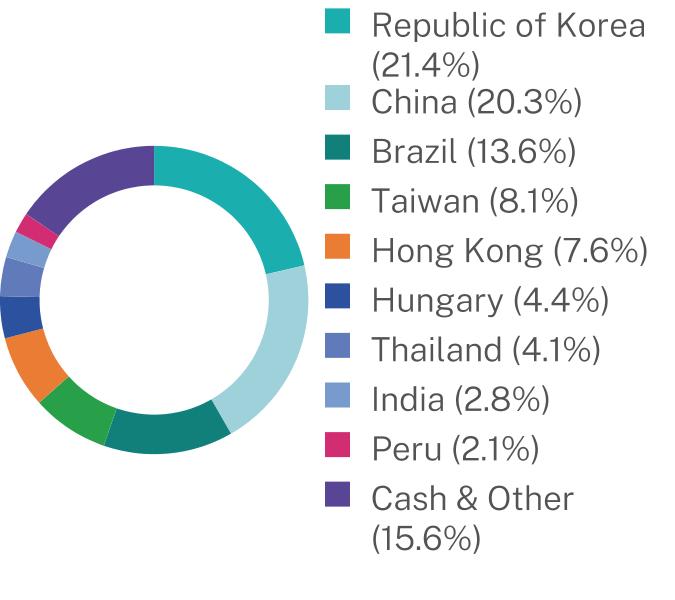
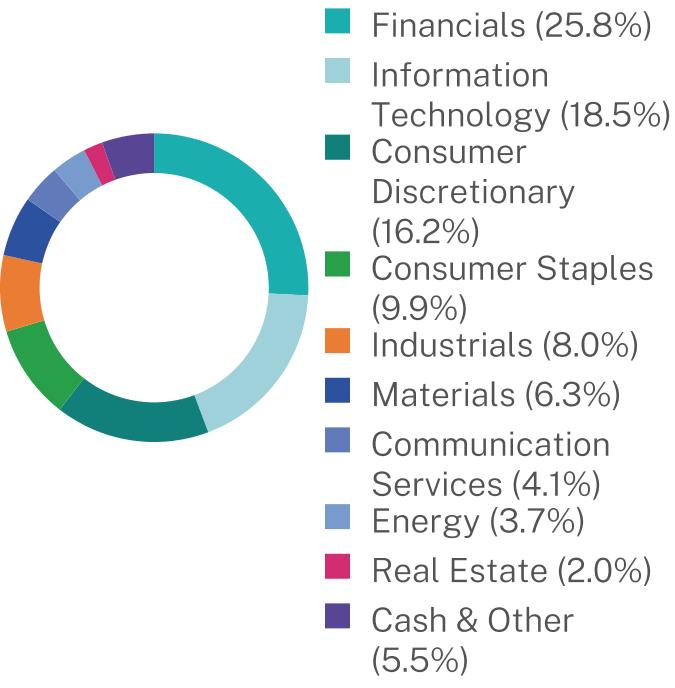
WHAT DID THE FUND INVEST IN? (as of February 28, 2026)
|
Top 10 Holdings
|
(% of Net Assets)
|
|
Samsung Electronics Co., Ltd.
|
7.3%
|
|
Taiwan Semiconductor Manufacturing Co., Ltd.
|
4.7%
|
|
Ambev S.A.
|
2.6%
|
|
Hyundai Mobis Co., Ltd.
|
2.5%
|
|
Pacific Basin Shipping, Ltd.
|
2.4%
|
|
Hankook Tire & Technology Co., Ltd.
|
2.4%
|
|
Alibaba Group Holding, Ltd.
|
2.3%
|
|
WH Group, Ltd.
|
2.2%
|
|
Credicorp, Ltd.
|
2.1%
|
|
Tencent Holdings, Ltd.
|
2.1%
|
Sector Breakdown (% of Net Assets)

Geographic Breakdown (% of Net Assets)
WHAT WERE THE FUND COSTS FOR THE PAST YEAR? (based on a hypothetical $10,000 investment)
|
Class Name
|
Costs of a $10,000 investment
|
Costs paid as a percentage of a $10,000 investment
|
|
Investor Class
|
$181
|
1.43%
|
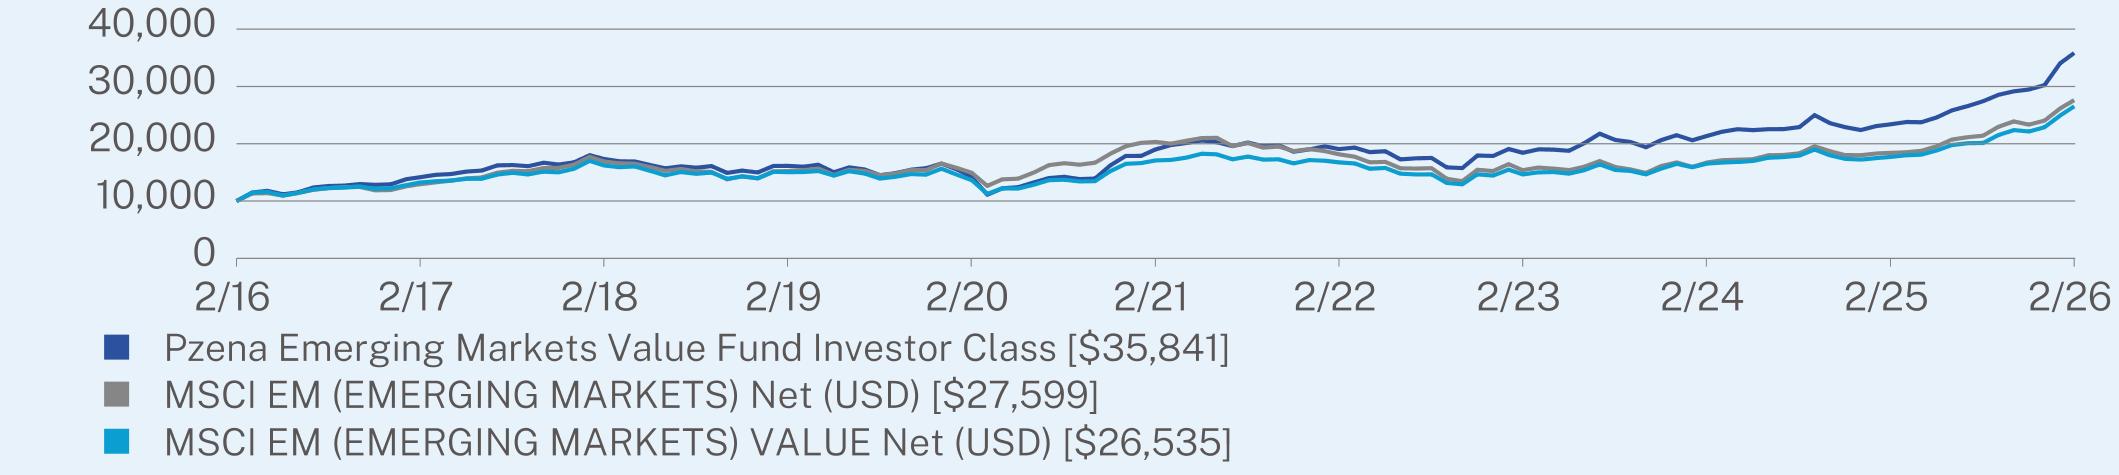
HOW DID THE FUND PERFORM LAST YEAR AND WHAT AFFECTED ITS PERFORMANCE?
Emerging markets rose during the trailing 12 months, against a backdrop of volatile market conditions and continued strength in technology-related areas, though returns were increasingly dispersed across countries and sectors. Technology-driven gains in markets such as Korea and Taiwan, alongside strong performance in parts of Latin America, contrasted with softer results in countries including India and Indonesia. At the sector level, information technology, materials, industrials, and financials were the strongest performers, while no sector posted negative performance over the period. The Fund rose during the period and outperformed the MSCI Emerging Markets Index.
Financials, information technology, and industrials were the largest contributors to absolute performance, while consumer discretionary and consumer staples also contributed positively.
At the country level, Korea, China, and Brazil were the largest contributors to absolute performance, while Kazakhstan, South Africa, and Saudi Arabia weighed on results.
|
Top Contributors
|
|
|
↑
|
Hon Hai Precision Industry Co., Ltd., Alibaba Group Holding Limited, Taiwan Semiconductor Manufacturing Co., Ltd.
|
|
Top Detractors
|
|
|
↓
|
Samsung Electronics Co., Ltd., PT Bank Rakyat Indonesia (Persero) Tbk Class B, Hankook Tire & Technology Co., Ltd.
|
ANNUAL AVERAGE TOTAL RETURN (%)
|
|
1 Year
|
5 Year
|
10 Year
|
|
Investor Class
|
53.19
|
13.53
|
13.62
|
|
MSCI EM (EMERGING MARKETS) Net (USD)
|
49.96
|
6.31
|
10.69
|
|
MSCI EM (EMERGING MARKETS) VALUE Net (USD)
|
49.90
|
9.21
|
10.25
|
Visit https://www.pzena.com/americas/institutional-investors/funds/us-mutual-funds/emerging-markets-value-fund-pzvex/ for more recent performance information.
KEY FUND STATISTICS (as of February 28, 2026)
|
Net Assets
|
$4,042,693,642
|
|
Number of Holdings
|
69
|
|
Net Advisory Fee
|
$27,725,831
|
|
Portfolio Turnover
|
28%
|
WHAT DID THE FUND INVEST IN? (as of February 28, 2026)
|
Top 10 Holdings
|
(% of Net Assets)
|
|
Samsung Electronics Co., Ltd.
|
7.3%
|
|
Taiwan Semiconductor Manufacturing Co., Ltd.
|
4.7%
|
|
Ambev S.A.
|
2.6%
|
|
Hyundai Mobis Co., Ltd.
|
2.5%
|
|
Pacific Basin Shipping, Ltd.
|
2.4%
|
|
Hankook Tire & Technology Co., Ltd.
|
2.4%
|
|
Alibaba Group Holding, Ltd.
|
2.3%
|
|
WH Group, Ltd.
|
2.2%
|
|
Credicorp, Ltd.
|
2.1%
|
|
Tencent Holdings, Ltd.
|
2.1%
|
Sector Breakdown (% of Net Assets)
Geographic Breakdown (% of Net Assets)

WHAT WERE THE FUND COSTS FOR THE PAST YEAR? (based on a hypothetical $10,000 investment)
|
Class Name
|
Costs of a $10,000 investment
|
Costs paid as a percentage of a $10,000 investment
|
|
Institutional Class
|
$106
|
1.00%
|
HOW DID THE FUND PERFORM LAST YEAR AND WHAT AFFECTED ITS PERFORMANCE?
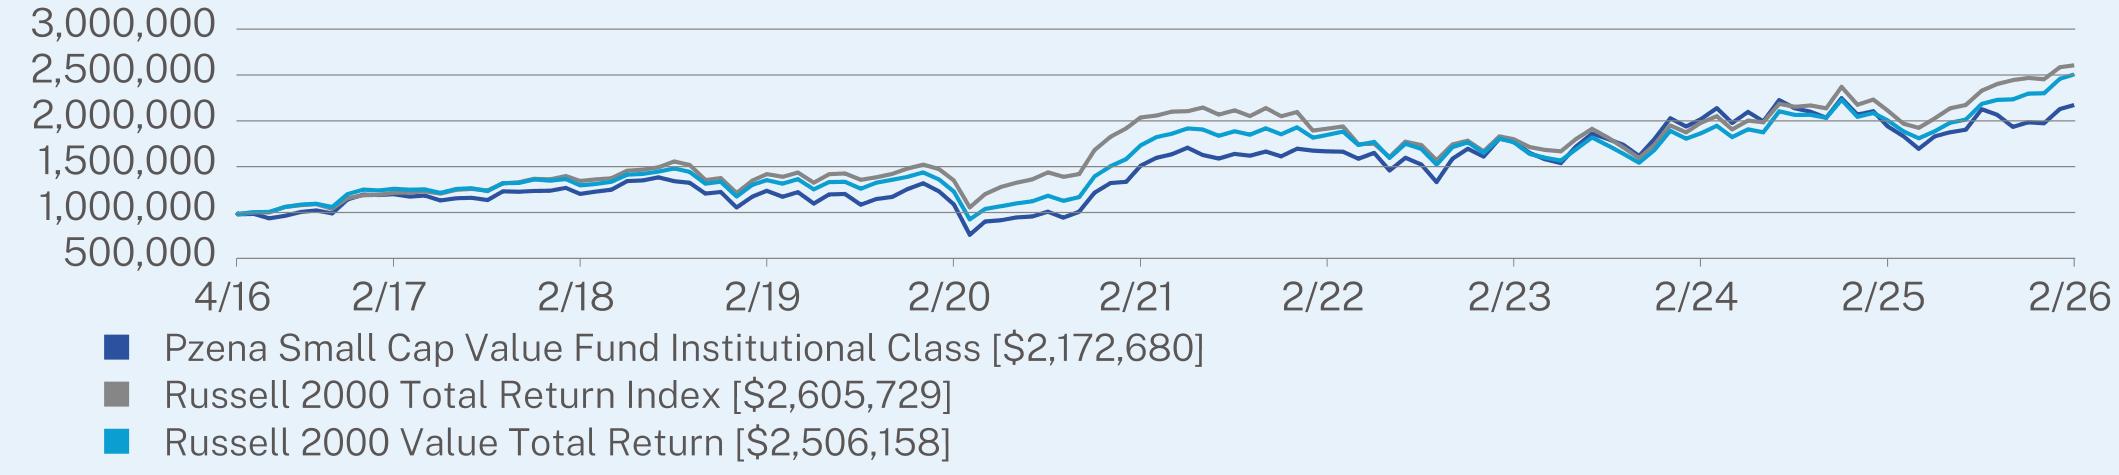
U.S. small-cap equities rose during the trailing 12 months. Markets moved higher through year-end and into early 2026, supported by resilient economic data and stable interest-rate expectations. Small caps underperformed for much of the period, but rebounded to start 2026 as leadership broadened beyond large-cap technology toward more cyclical areas and smaller-cap stocks showed relative resilience. Dispersion across sectors and individual stocks remained elevated. The Fund rose but trailed its benchmark, the Russell 2000 Index.
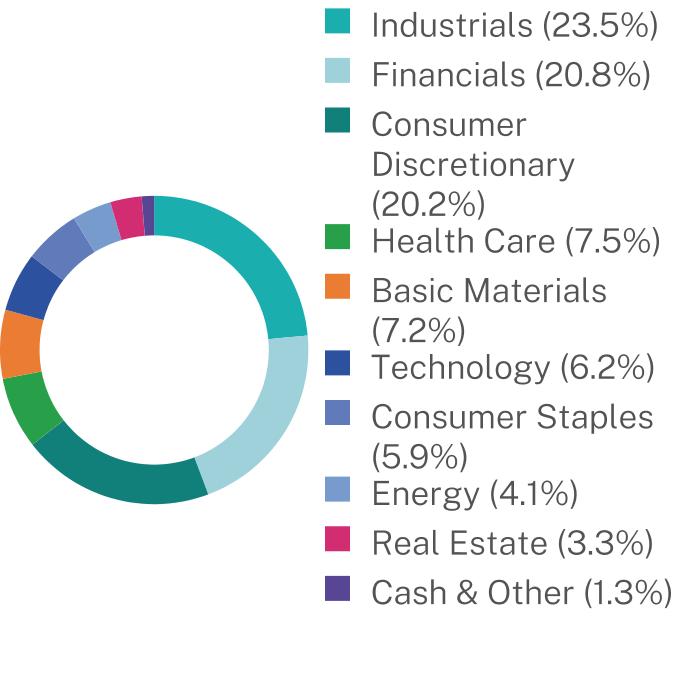
The Fund’s industrials and consumer discretionary holdings contributed most to absolute performance, while financials also added positively. In contrast, basic materials and real estate were the only sectors to detract from absolute performance over the period.
|
Top Contributors
|
|
|
↑
|
CNO Financial Group, Inc., Columbia Banking System, Inc., Old National Bancorp
|
|
Top Detractors
|
|
|
↓
|
JELD-WEN Holding, Inc., Adient plc, Olin Corporation
|
ANNUAL AVERAGE TOTAL RETURN (%)
|
|
1 Year
|
5 Year
|
Since Inception
(04/27/2016) |
|
Institutional Class
|
11.98
|
7.54
|
8.20
|
|
Russell 2000 Total Return Index
|
23.34
|
5.05
|
10.22
|
|
Russell 2000 Value Total Return
|
24.95
|
7.67
|
9.79
|
Visit https://www.pzena.com/americas/institutional-investors/funds/us-mutual-funds/small-cap-value-fund-pzisx/ for more recent performance information.
KEY FUND STATISTICS (as of February 28, 2026)
|
Net Assets
|
$94,652,279
|
|
Number of Holdings
|
50
|
|
Net Advisory Fee
|
$315,579
|
|
Portfolio Turnover
|
41%
|
WHAT DID THE FUND INVEST IN? (as of February 28, 2026)
|
Top 10 Holdings
|
(% of Net Assets)
|
|
Advance Auto Parts, Inc.
|
4.3%
|
|
Spectrum Brands Holdings, Inc.
|
4.1%
|
|
Teleflex, Inc.
|
3.4%
|
|
Adient PLC
|
3.1%
|
|
Douglas Dynamics, Inc.
|
3.0%
|
|
Webster Financial Corp.
|
2.9%
|
|
Columbia Banking System, Inc.
|
2.8%
|
|
Avnet, Inc.
|
2.6%
|
|
Old National Bancorp of Indiana
|
2.6%
|
|
Aebi Schmidt Holding A.G.
|
2.5%
|
Sector Breakdown (% of Net Assets)

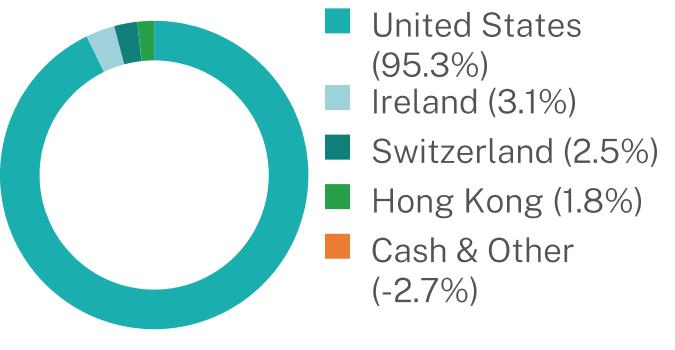
Geographic Breakdown (% of Net Assets)

WHAT WERE THE FUND COSTS FOR THE PAST YEAR? (based on a hypothetical $10,000 investment)
|
Class Name
|
Costs of a $10,000 investment
|
Costs paid as a percentage of a $10,000 investment
|
|
Investor Class
|
$138
|
1.30%
|
HOW DID THE FUND PERFORM LAST YEAR AND WHAT AFFECTED ITS PERFORMANCE?
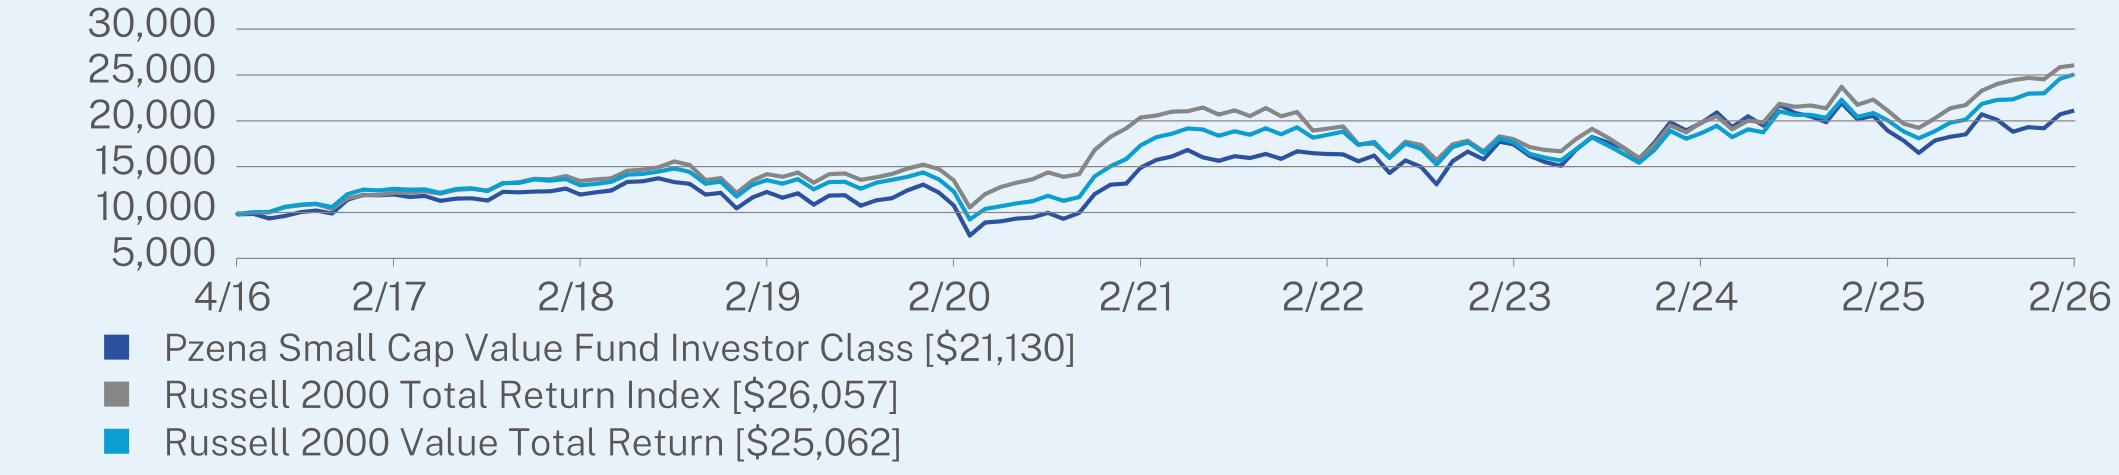
U.S. small-cap equities rose during the trailing 12 months. Markets moved higher through year-end and into early 2026, supported by resilient economic data and stable interest-rate expectations. Small caps underperformed for much of the period, but rebounded to start 2026 as leadership broadened beyond large-cap technology toward more cyclical areas and smaller-cap stocks showed relative resilience. Dispersion across sectors and individual stocks remained elevated. The Fund rose but trailed its benchmark, the Russell 2000 Index.
The Fund’s industrials and consumer discretionary holdings contributed most to absolute performance, while financials also added positively. In contrast, basic materials and real estate were the only sectors to detract from absolute performance over the period.
|
Top Contributors
|
|
|
↑
|
CNO Financial Group, Inc., Columbia Banking System, Inc., Old National Bancorp
|
|
Top Detractors
|
|
|
↓
|
JELD-WEN Holding, Inc., Adient plc, Olin Corporation
|
ANNUAL AVERAGE TOTAL RETURN (%)
|
|
1 Year
|
5 Year
|
Since Inception
(04/27/2016) |
|
Investor Class
|
11.62
|
7.26
|
7.90
|
|
Russell 2000 Total Return Index
|
23.34
|
5.05
|
10.22
|
|
Russell 2000 Value Total Return
|
24.95
|
7.67
|
9.79
|
Visit https://www.pzena.com/americas/institutional-investors/funds/us-mutual-funds/small-cap-value-fund-pzvsx/ for more recent performance information.
KEY FUND STATISTICS (as of February 28, 2026)
|
Net Assets
|
$94,652,279
|
|
Number of Holdings
|
50
|
|
Net Advisory Fee
|
$315,579
|
|
Portfolio Turnover
|
41%
|
WHAT DID THE FUND INVEST IN? (as of February 28, 2026)
|
Top 10 Holdings
|
(% of Net Assets)
|
|
Advance Auto Parts, Inc.
|
4.3%
|
|
Spectrum Brands Holdings, Inc.
|
4.1%
|
|
Teleflex, Inc.
|
3.4%
|
|
Adient PLC
|
3.1%
|
|
Douglas Dynamics, Inc.
|
3.0%
|
|
Webster Financial Corp.
|
2.9%
|
|
Columbia Banking System, Inc.
|
2.8%
|
|
Avnet, Inc.
|
2.6%
|
|
Old National Bancorp of Indiana
|
2.6%
|
|
Aebi Schmidt Holding A.G.
|
2.5%
|
Sector Breakdown (% of Net Assets)
Geographic Breakdown (% of Net Assets)
WHAT WERE THE FUND COSTS FOR THE PAST YEAR? (based on a hypothetical $10,000 investment)
|
Class Name
|
Costs of a $10,000 investment
|
Costs paid as a percentage of a $10,000 investment
|
|
Institutional Class
|
$123
|
1.03%
|
HOW DID THE FUND PERFORM LAST YEAR AND WHAT AFFECTED ITS PERFORMANCE?
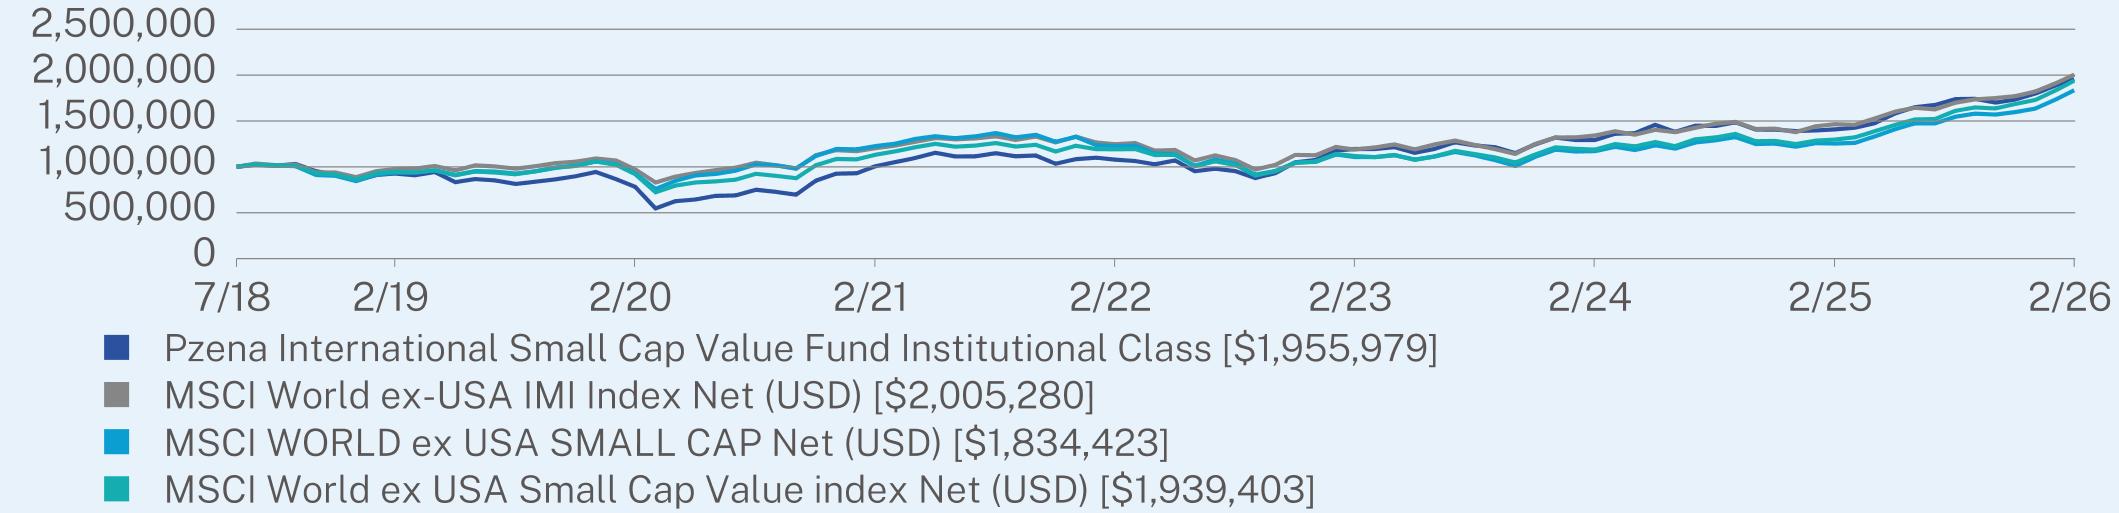
International small-cap equities rose during the trailing 12 months, as markets navigated periods of elevated volatility, improving sentiment, and a gradual broadening in leadership beyond the narrowest areas of the market. The backdrop was supported by stabilizing interest rate expectations and improving risk appetite, though returns remained uneven across countries, sectors, and individual companies. Against this backdrop, the Fund rose and outperformed the MSCI World ex-USA IMI Index.
The Fund’s materials, financials, consumer discretionary, and industrials holdings contributed most to absolute performance, while no sector detracted from performance over the period.
At the country level, Japan, Ireland, and the United Kingdom were among the largest contributors to performance, while Denmark was a modest detractor.
|
Top Contributors
|
|
|
↑
|
BPER Banca S.p.A., Unicaja Banco S.A., Yue Yuen Industrial (Holdings) Limited
|
|
Top Detractors
|
|
|
↓
|
ams-OSRAM AG, Nexity SA, Umicore SA
|
ANNUAL AVERAGE TOTAL RETURN (%)
|
|
1 Year
|
5 Year
|
Since Inception
(07/02/2018) |
|
Institutional Class
|
38.90
|
14.25
|
9.15
|
|
MSCI World ex-USA IMI Index Net (USD)
|
36.95
|
10.79
|
9.51
|
|
MSCI WORLD ex USA SMALL CAP Net (USD)
|
46.34
|
8.40
|
8.24
|
|
MSCI World ex USA Small Cap Value index Net (USD)
|
49.48
|
11.40
|
9.03
|
Visit https://www.pzena.com/americas/institutional-investors/funds/us-mutual-funds/international-small-cap-value-fund-pziix/ for more recent performance information.
KEY FUND STATISTICS (as of February 28, 2026)
|
Net Assets
|
$225,707,857
|
|
Number of Holdings
|
50
|
|
Net Advisory Fee
|
$1,417,211
|
|
Portfolio Turnover
|
47%
|
WHAT DID THE FUND INVEST IN? (as of February 28, 2026)
|
Top 10 Holdings
|
(% of Net Assets)
|
|
Origin Enterprises PLC
|
3.9%
|
|
Kanto Denka Kogyo Co., Ltd.
|
3.9%
|
|
Senior PLC
|
3.5%
|
|
Permanent TSB Group Holdings PLC
|
3.4%
|
|
Nokian Renkaat Oyj
|
3.3%
|
|
Fukuoka Financial Group, Inc.
|
3.2%
|
|
Elders, Ltd.
|
2.9%
|
|
Unicaja Banco S.A.
|
2.8%
|
|
Sabre Insurance Group PLC
|
2.6%
|
|
Fletcher Building, Ltd.
|
2.6%
|
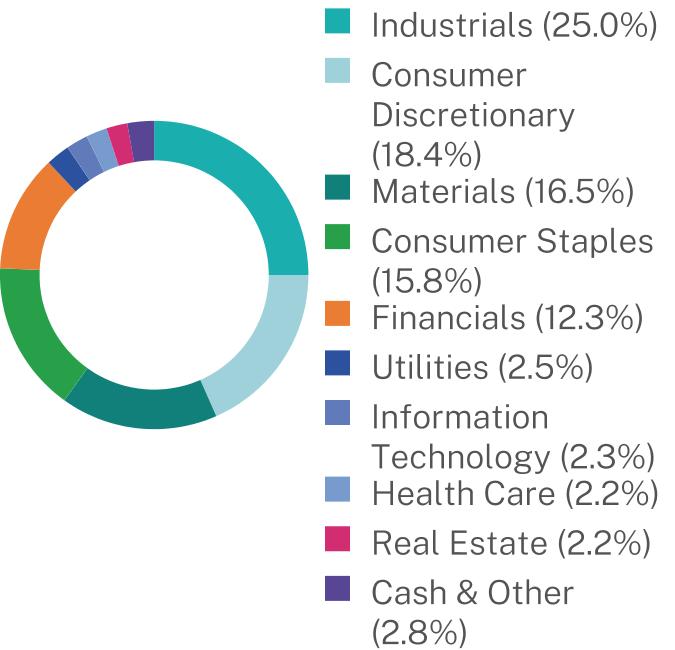
Sector Breakdown (% of Net Assets)

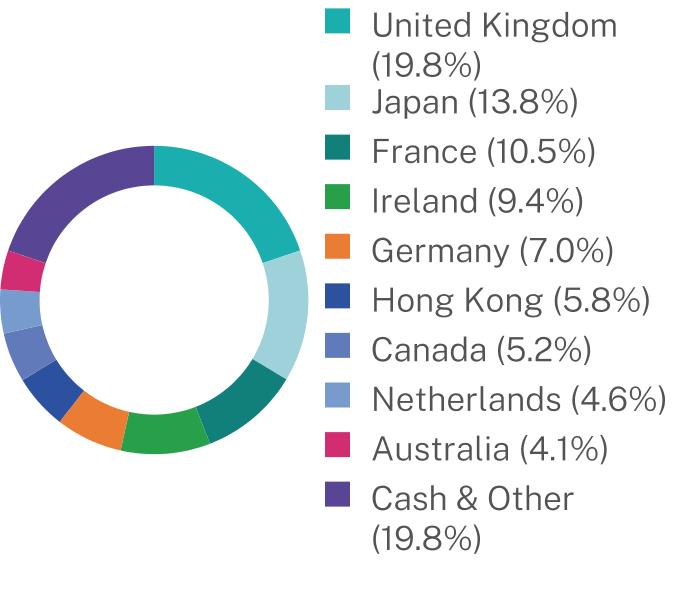
Geographic Breakdown (% of Net Assets)

WHAT WERE THE FUND COSTS FOR THE PAST YEAR? (based on a hypothetical $10,000 investment)
|
Class Name
|
Costs of a $10,000 investment
|
Costs paid as a percentage of a $10,000 investment
|
|
Investor Class
|
$159
|
1.33%
|
HOW DID THE FUND PERFORM LAST YEAR AND WHAT AFFECTED ITS PERFORMANCE?
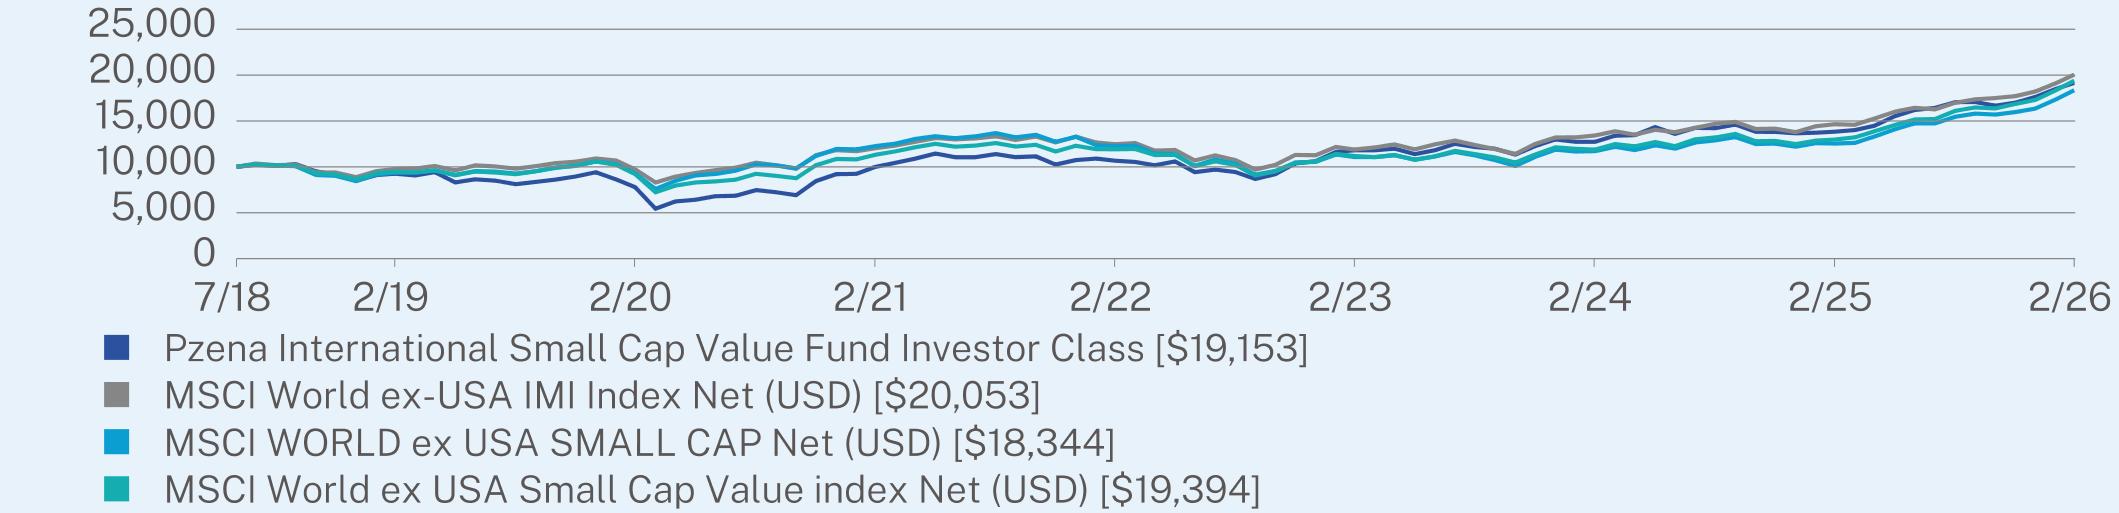
International small-cap equities rose during the trailing 12 months, as markets navigated periods of elevated volatility, improving sentiment, and a gradual broadening in leadership beyond the narrowest areas of the market. The backdrop was supported by stabilizing interest rate expectations and improving risk appetite, though returns remained uneven across countries, sectors, and individual companies. Against this backdrop, the Fund rose and outperformed the MSCI World ex-USA IMI Index.
The Fund’s materials, financials, consumer discretionary, and industrials holdings contributed most to absolute performance, while no sector detracted from performance over the period.
At the country level, Japan, Ireland, and the United Kingdom were among the largest contributors to performance, while Denmark was a modest detractor.
|
Top Contributors
|
|
|
↑
|
BPER Banca S.p.A., Unicaja Banco S.A., Yue Yuen Industrial (Holdings) Limited
|
|
Top Detractors
|
|
|
↓
|
ams-OSRAM AG, Nexity SA, Umicore SA
|
ANNUAL AVERAGE TOTAL RETURN (%)
|
|
1 Year
|
5 Year
|
Since Inception
(07/02/2018) |
|
Investor Class
|
38.52
|
13.92
|
8.85
|
|
MSCI World ex-USA IMI Index Net (USD)
|
36.95
|
10.79
|
9.51
|
|
MSCI WORLD ex USA SMALL CAP Net (USD)
|
46.34
|
8.40
|
8.24
|
|
MSCI World ex USA Small Cap Value index Net (USD)
|
49.48
|
11.40
|
9.03
|
Visit https://www.pzena.com/americas/institutional-investors/funds/us-mutual-funds/international-small-cap-value-fund-pzvix/ for more recent performance information.
KEY FUND STATISTICS (as of February 28, 2026)
|
Net Assets
|
$225,707,857
|
|
Number of Holdings
|
50
|
|
Net Advisory Fee
|
$1,417,211
|
|
Portfolio Turnover
|
47%
|
WHAT DID THE FUND INVEST IN? (as of February 28, 2026)
|
Top 10 Holdings
|
(% of Net Assets)
|
|
Origin Enterprises PLC
|
3.9%
|
|
Kanto Denka Kogyo Co., Ltd.
|
3.9%
|
|
Senior PLC
|
3.5%
|
|
Permanent TSB Group Holdings PLC
|
3.4%
|
|
Nokian Renkaat Oyj
|
3.3%
|
|
Fukuoka Financial Group, Inc.
|
3.2%
|
|
Elders, Ltd.
|
2.9%
|
|
Unicaja Banco S.A.
|
2.8%
|
|
Sabre Insurance Group PLC
|
2.6%
|
|
Fletcher Building, Ltd.
|
2.6%
|
Sector Breakdown (% of Net Assets)
Geographic Breakdown (% of Net Assets)
WHAT WERE THE FUND COSTS FOR THE PAST YEAR? (based on a hypothetical $10,000 investment)
|
Class Name
|
Costs of a $10,000 investment
|
Costs paid as a percentage of a $10,000 investment
|
|
Institutional Class
|
$89
|
0.74%
|
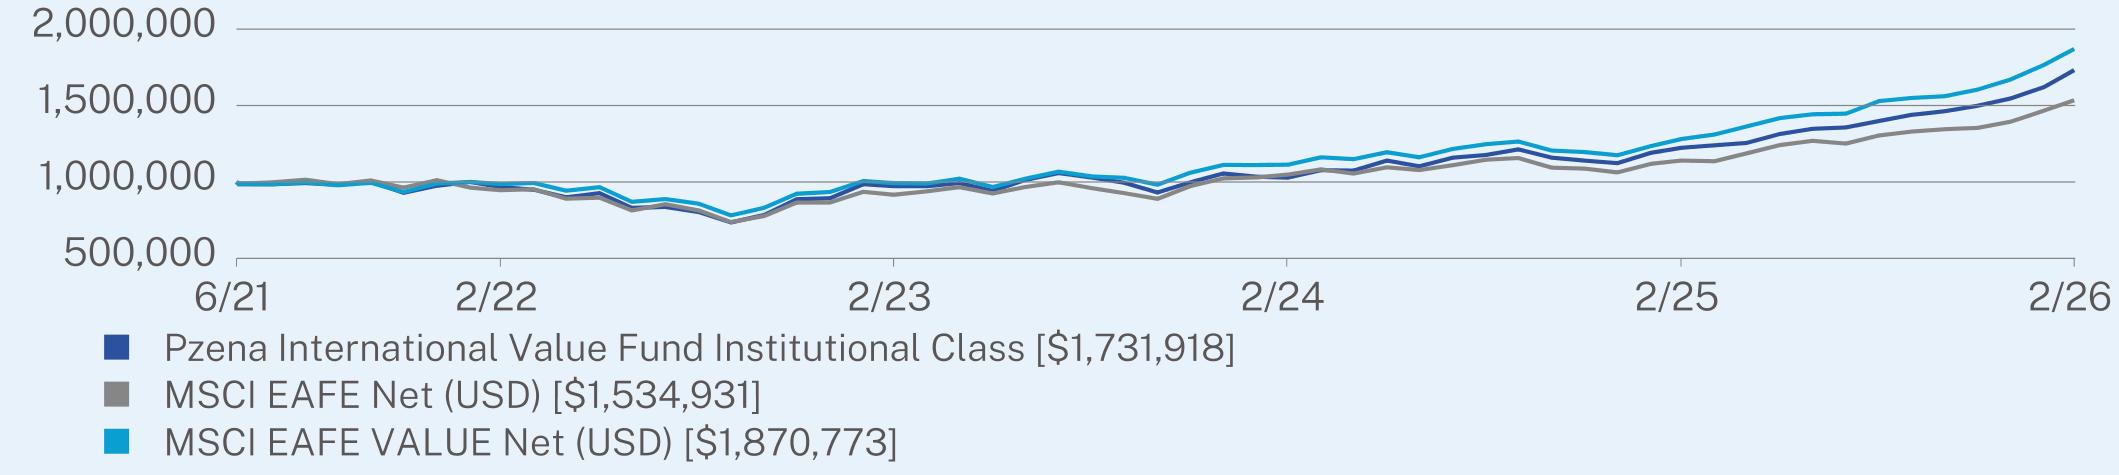
HOW DID THE FUND PERFORM LAST YEAR AND WHAT AFFECTED ITS PERFORMANCE?
International equity markets rose during the trailing 12 months, supported by improving risk appetite and strength across major regions, particularly in Europe, as leadership broadened beyond a narrow group of large-cap growth stocks. The period was marked by elevated volatility and shifting sentiment, but non-U.S. markets benefited from increased investor interest as global equity performance became less concentrated in the U.S. Value outperformed growth, and cyclical areas of the market contributed meaningfully to returns. The Fund rose and outperformed the MSCI EAFE Index.
The Fund’s financials, information technology, and consumer discretionary holdings were the largest contributors to absolute performance, while no sector detracted from absolute performance over the period, reflecting strength across cyclical and economically sensitive areas of the market.
At the country level, Japan, the United Kingdom, and Korea were among the largest contributors to performance, while no country materially detracted from performance over the period.
|
Top Contributors
|
|
|
↑
|
Hon Hai Precision Industry Co., Ltd. Sponsored GDR RegS, Alibaba Group Holding Limited, CaixaBank SA
|
|
Top Detractors
|
|
|
↓
|
Magna International Inc., Randstad NV, Galaxy Entertainment Group Limited
|
ANNUAL AVERAGE TOTAL RETURN (%)
|
|
1 Year
|
Since Inception
(06/28/2021) |
|
Institutional Class
|
41.59
|
12.48
|
|
MSCI EAFE Net (USD)
|
34.63
|
9.61
|
|
MSCI EAFE VALUE Net (USD)
|
46.09
|
14.35
|
Visit https://www.pzena.com/americas/institutional-investors/funds/us-mutual-funds/international-value-fund-pzinx/ for more recent performance information.
KEY FUND STATISTICS (as of February 28, 2026)
|
Net Assets
|
$140,408,701
|
|
Number of Holdings
|
69
|
|
Net Advisory Fee
|
$559,394
|
|
Portfolio Turnover
|
29%
|
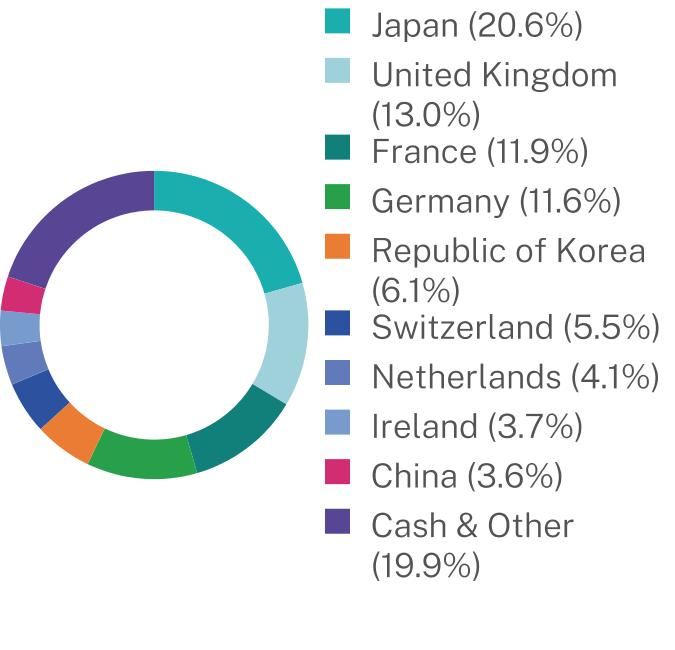
WHAT DID THE FUND INVEST IN? (as of February 28, 2026)
|
Top 10 Holdings
|
(% of Net Assets)
|
|
Samsung Electronics Co., Ltd.
|
5.3%
|
|
HSBC Holdings PLC
|
2.8%
|
|
Murata Manufacturing Co., Ltd.
|
2.8%
|
|
Daimler Truck Holding AG
|
2.6%
|
|
ArcelorMittal S.A.
|
2.6%
|
|
Daikin Industries, Ltd.
|
2.4%
|
|
Reckitt Benckiser Group PLC
|
2.4%
|
|
ING Groep N.V.
|
2.3%
|
|
Suntory Beverage & Food, Ltd.
|
2.3%
|
|
Rexel S.A.
|
2.3%
|
Sector Breakdown (% of Net Assets)

Geographic Breakdown (% of Net Assets)
WHAT WERE THE FUND COSTS FOR THE PAST YEAR? (based on a hypothetical $10,000 investment)
|
Class Name
|
Costs of a $10,000 investment
|
Costs paid as a percentage of a $10,000 investment
|
|
Investor Class
|
$121
|
1.00%
|
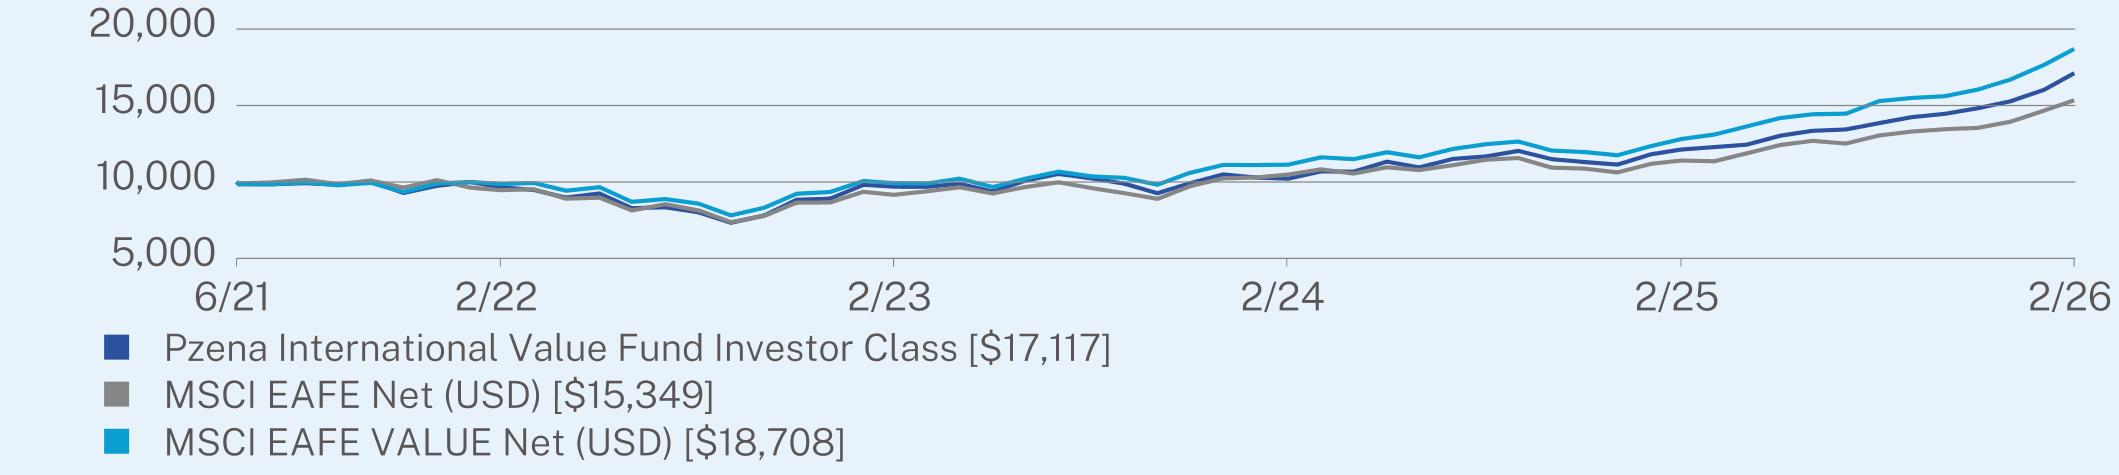
HOW DID THE FUND PERFORM LAST YEAR AND WHAT AFFECTED ITS PERFORMANCE?
International equity markets rose during the trailing 12 months, supported by improving risk appetite and strength across major regions, particularly in Europe, as leadership broadened beyond a narrow group of large-cap growth stocks. The period was marked by elevated volatility and shifting sentiment, but non-U.S. markets benefited from increased investor interest as global equity performance became less concentrated in the U.S. Value outperformed growth, and cyclical areas of the market contributed meaningfully to returns. The Fund rose and outperformed the MSCI EAFE Index.
The Fund’s financials, information technology, and consumer discretionary holdings were the largest contributors to absolute performance, while no sector detracted from absolute performance over the period, reflecting strength across cyclical and economically sensitive areas of the market.
At the country level, Japan, the United Kingdom, and Korea were among the largest contributors to performance, while no country materially detracted from performance over the period.
|
Top Contributors
|
|
|
↑
|
Hon Hai Precision Industry Co., Ltd. Sponsored GDR RegS, Alibaba Group Holding Limited, CaixaBank SA
|
|
Top Detractors
|
|
|
↓
|
Magna International Inc., Randstad NV, Galaxy Entertainment Group Limited
|
ANNUAL AVERAGE TOTAL RETURN (%)
|
|
1 Year
|
Since Inception
(06/28/2021) |
|
Investor Class
|
41.23
|
12.19
|
|
MSCI EAFE Net (USD)
|
34.63
|
9.61
|
|
MSCI EAFE VALUE Net (USD)
|
46.09
|
14.35
|
Visit https://www.pzena.com/americas/institutional-investors/funds/us-mutual-funds/international-value-fund-pzvnx/ for more recent performance information.
KEY FUND STATISTICS (as of February 28, 2026)
|
Net Assets
|
$140,408,701
|
|
Number of Holdings
|
69
|
|
Net Advisory Fee
|
$559,394
|
|
Portfolio Turnover
|
29%
|
WHAT DID THE FUND INVEST IN? (as of February 28, 2026)
|
Top 10 Holdings
|
(% of Net Assets)
|
|
Samsung Electronics Co., Ltd.
|
5.3%
|
|
HSBC Holdings PLC
|
2.8%
|
|
Murata Manufacturing Co., Ltd.
|
2.8%
|
|
Daimler Truck Holding AG
|
2.6%
|
|
ArcelorMittal S.A.
|
2.6%
|
|
Daikin Industries, Ltd.
|
2.4%
|
|
Reckitt Benckiser Group PLC
|
2.4%
|
|
ING Groep N.V.
|
2.3%
|
|
Suntory Beverage & Food, Ltd.
|
2.3%
|
|
Rexel S.A.
|
2.3%
|
Sector Breakdown (% of Net Assets)
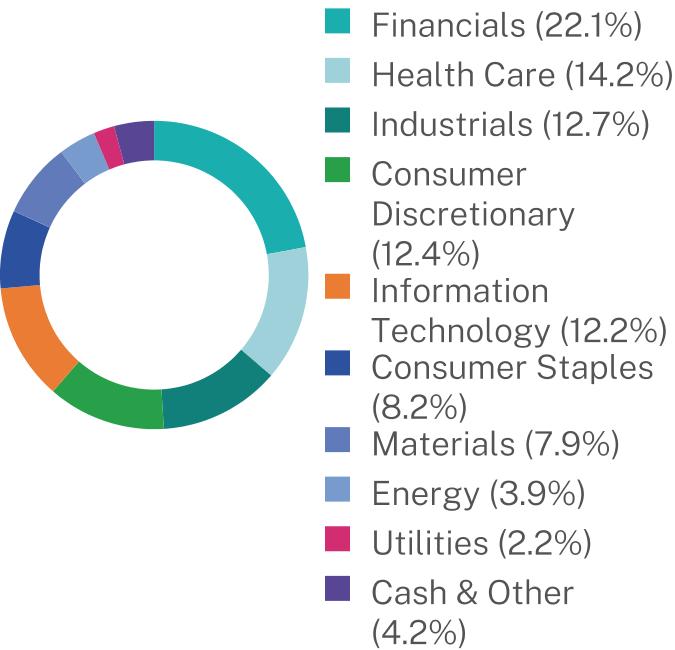
Geographic Breakdown (% of Net Assets)
