| ANNUAL MEEING OF SHAREHOLDERS May 13, 2025 |
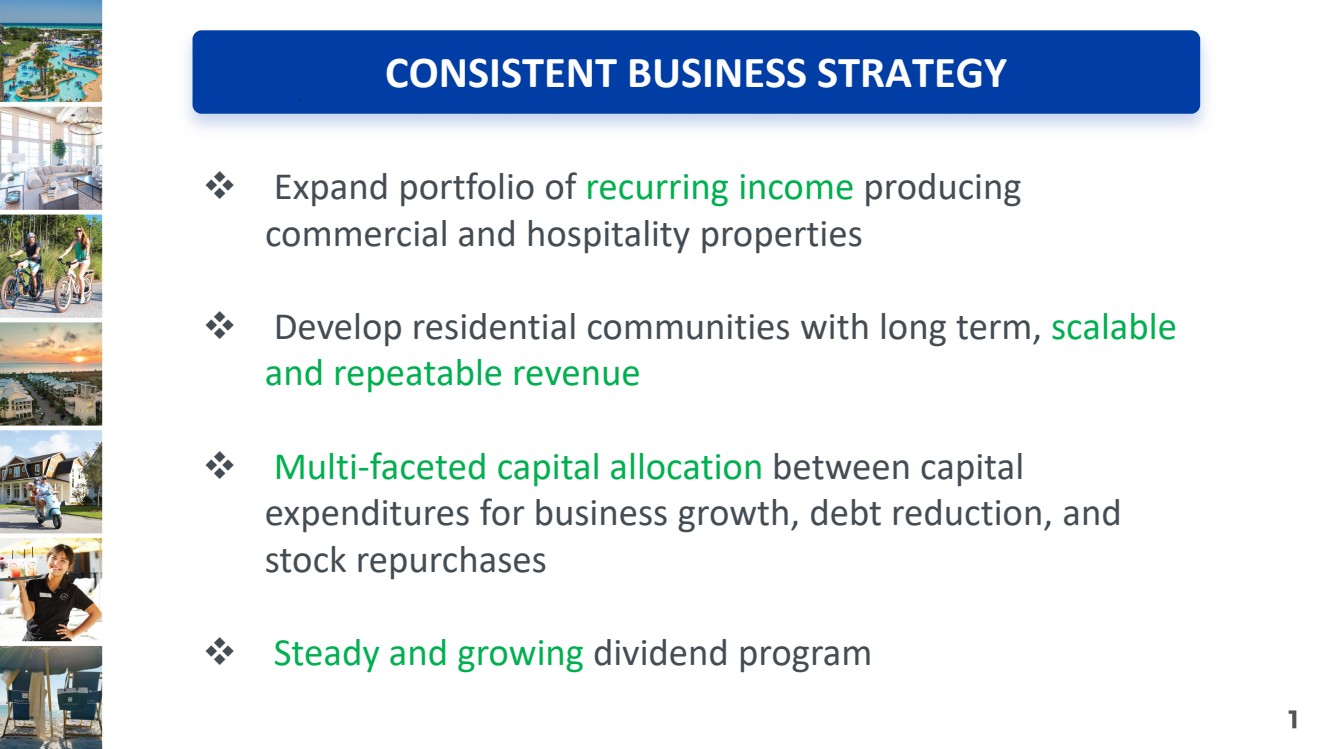
| Expand portfolio of recurring income producing commercial and hospitality properties Develop residential communities with long term, scalable and repeatable revenue Multi-faceted capital allocation between capital expenditures for business growth, debt reduction, and stock repurchases Steady and growing dividend program CONSISTENT BUSINESS STRATEGY |
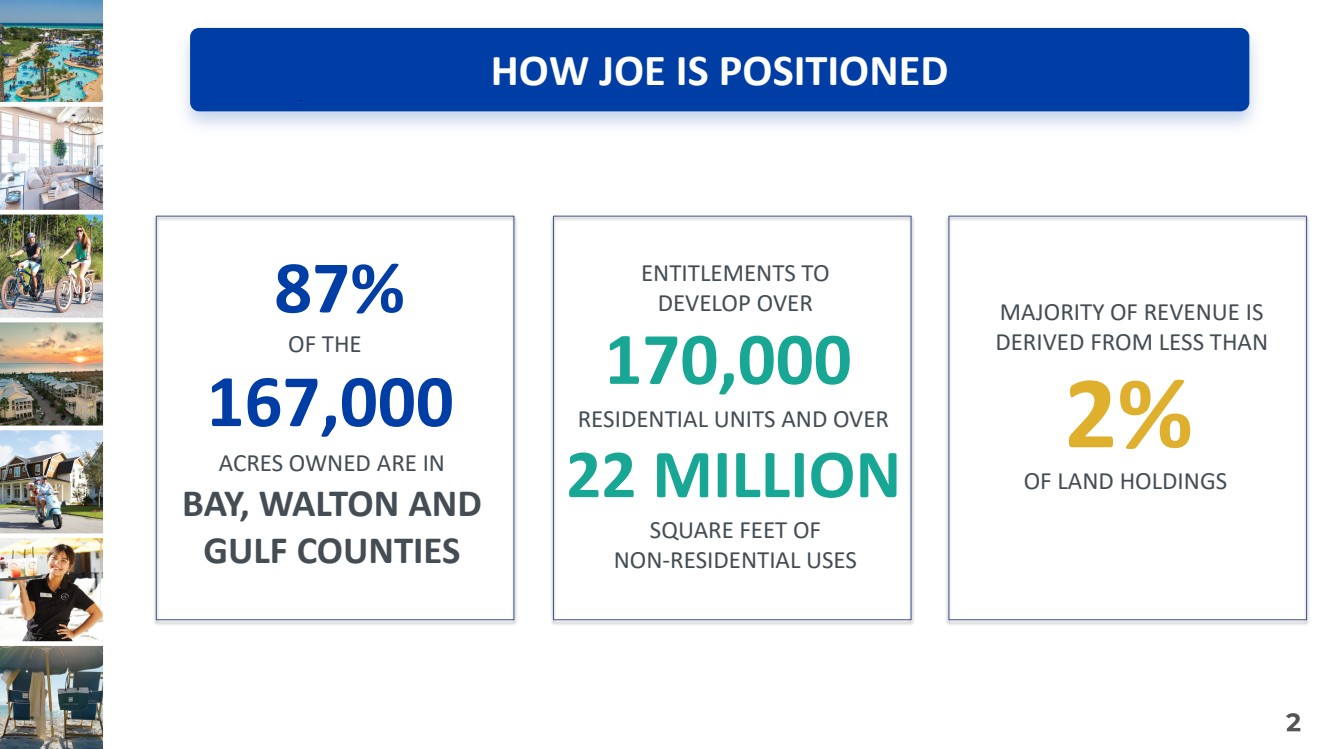
| 87% OF THE 167,000 ACRES OWNED ARE IN BAY, WALTON AND GULF COUNTIES ENTITLEMENTS TO DEVELOP OVER 170,000 RESIDENTIAL UNITS AND OVER 22 MILLION SQUARE FEET OF NON-RESIDENTIAL USES MAJORITY OF REVENUE IS DERIVED FROM LESS THAN 2% OF LAND HOLDINGS HOW JOE IS POSITIONED |
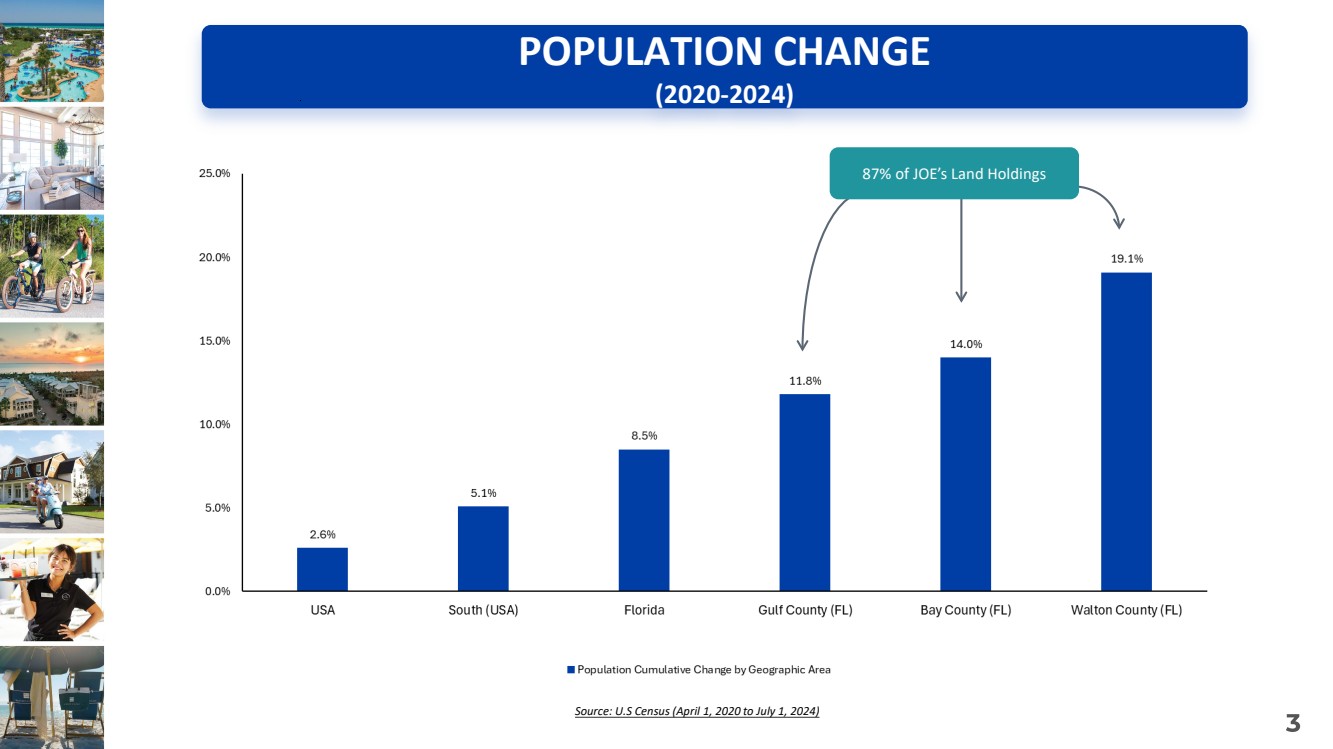
| POPULATION CHANGE (2020-2024) Source: U.S Census (April 1, 2020 to July 1, 2024) 87% of JOE’s Land Holdings |
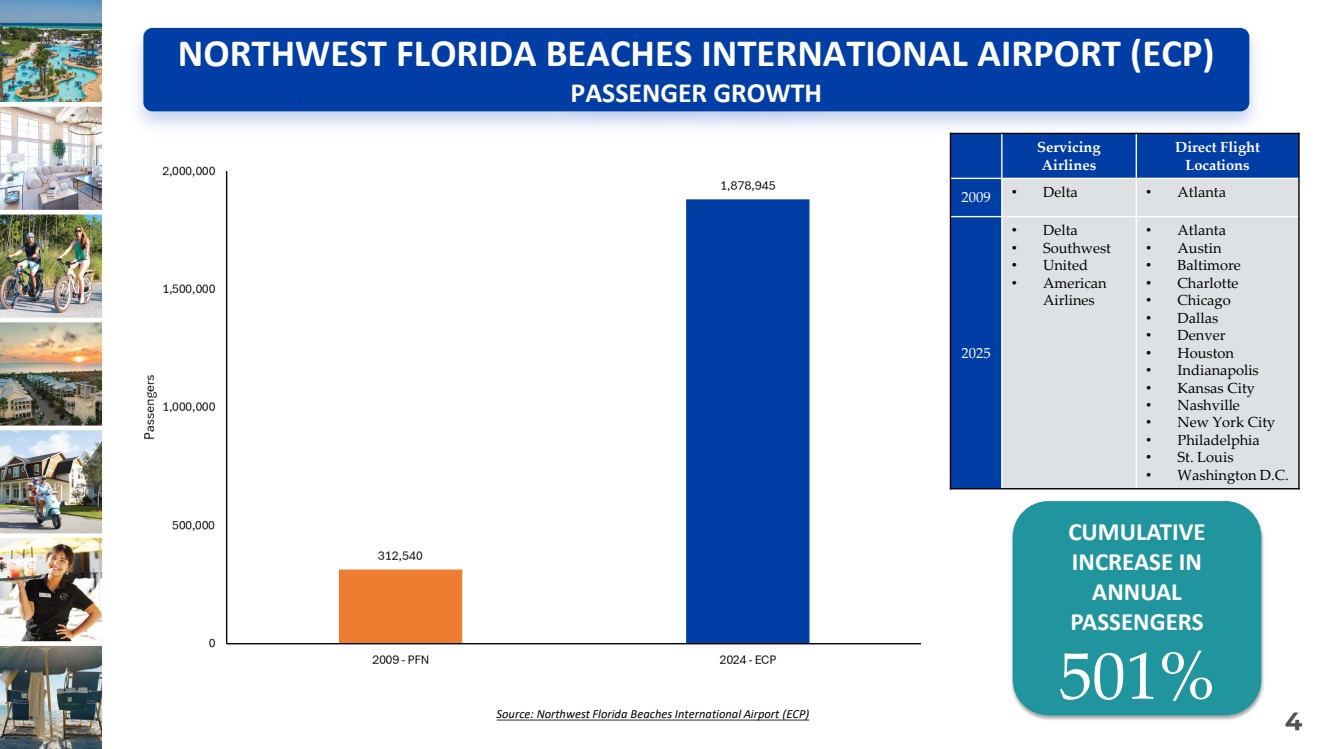
| NORTHWEST FLORIDA BEACHES INTERNATIONAL AIRPORT (ECP) PASSENGER GROWTH Servicing Airlines Direct Flight Locations 2009 • Delta • Atlanta 2025 • Delta • Southwest • United • American Airlines • Atlanta • Austin • Baltimore • Charlotte • Chicago • Dallas • Denver • Houston • Indianapolis • Kansas City • Nashville • New York City • Philadelphia • St. Louis • Washington D.C. Source: Northwest Florida Beaches International Airport (ECP) CUMULATIVE INCREASE IN ANNUAL PASSENGERS 501% |
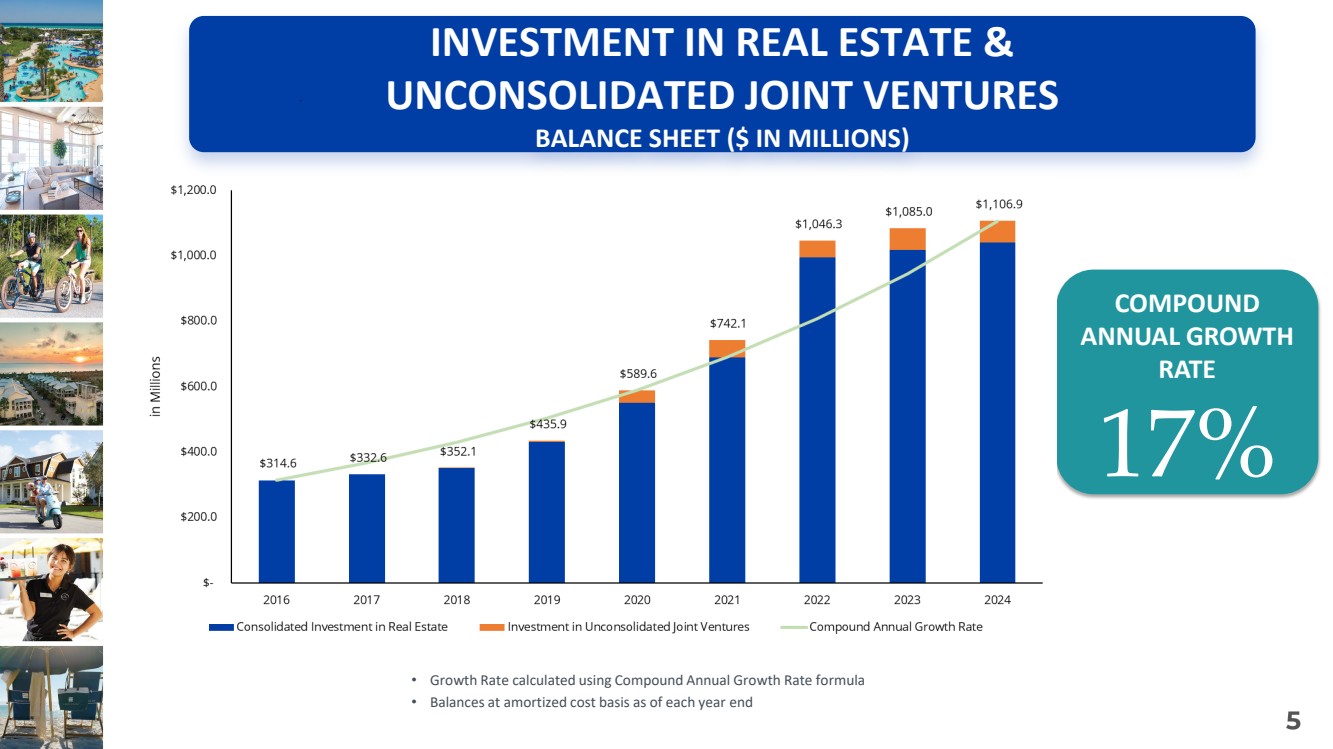
| COMPOUND ANNUAL GROWTH RATE 17% • Growth Rate calculated using Compound Annual Growth Rate formula • Balances at amortized cost basis as of each year end INVESTMENT IN REAL ESTATE & UNCONSOLIDATED JOINT VENTURES BALANCE SHEET ($ IN MILLIONS) |
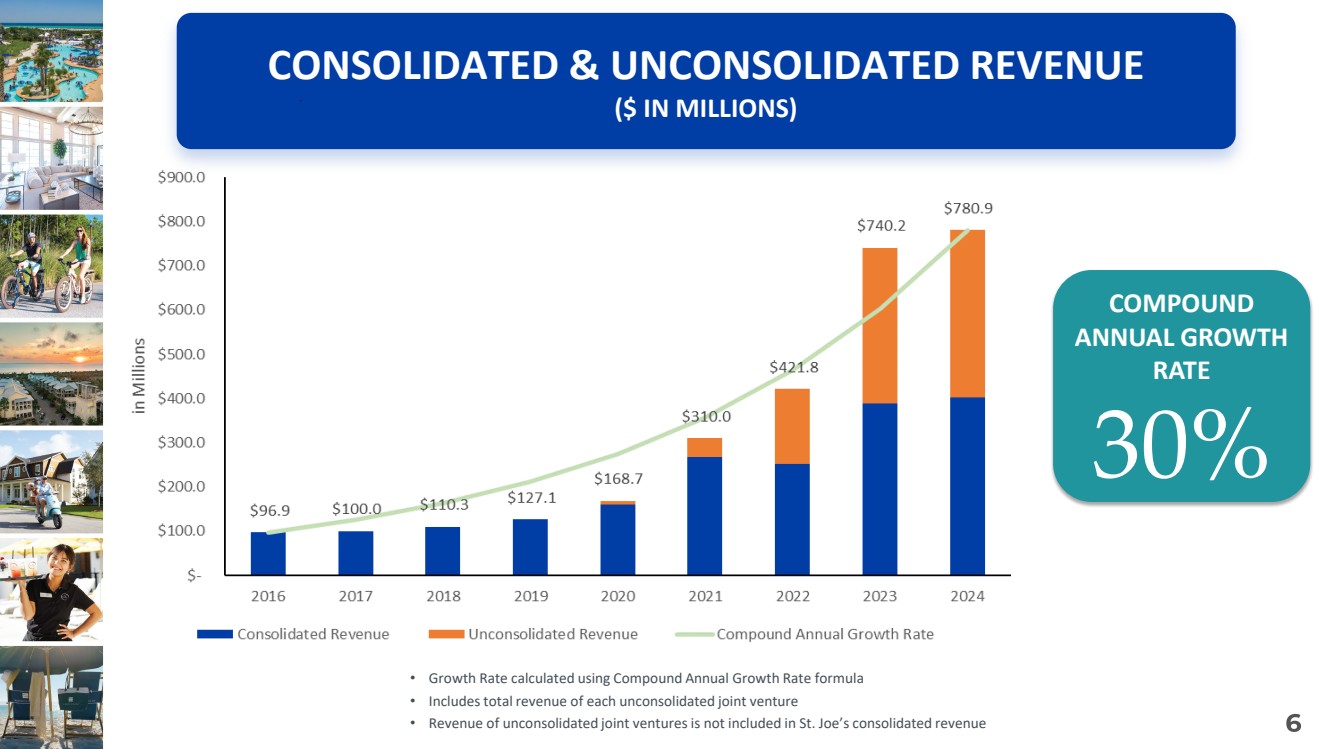
| COMPOUND ANNUAL GROWTH RATE 30% • Growth Rate calculated using Compound Annual Growth Rate formula • Includes total revenue of each unconsolidated joint venture • Revenue of unconsolidated joint ventures is not included in St. Joe’s consolidated revenue CONSOLIDATED & UNCONSOLIDATED REVENUE ($ IN MILLIONS) |
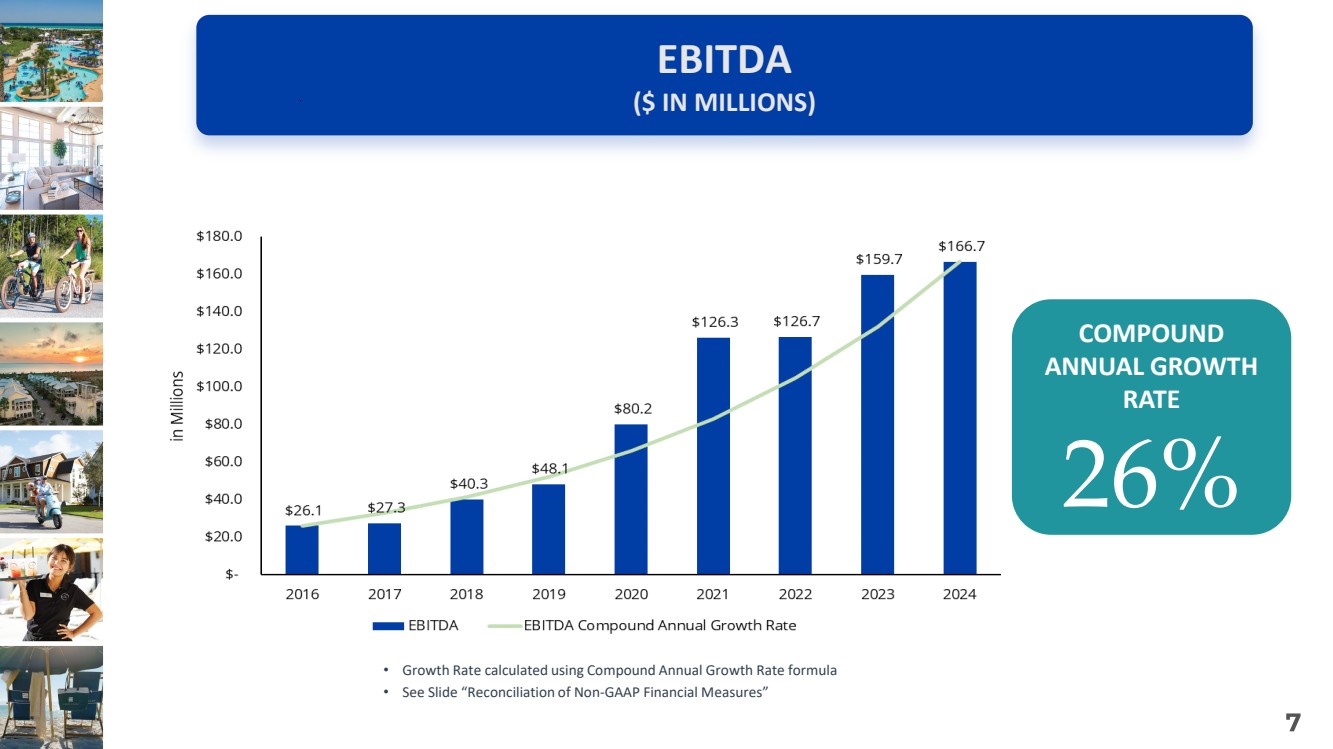
| • Growth Rate calculated using Compound Annual Growth Rate formula • See Slide “Reconciliation of Non-GAAP Financial Measures” COMPOUND ANNUAL GROWTH RATE 26% EBITDA ($ IN MILLIONS) |
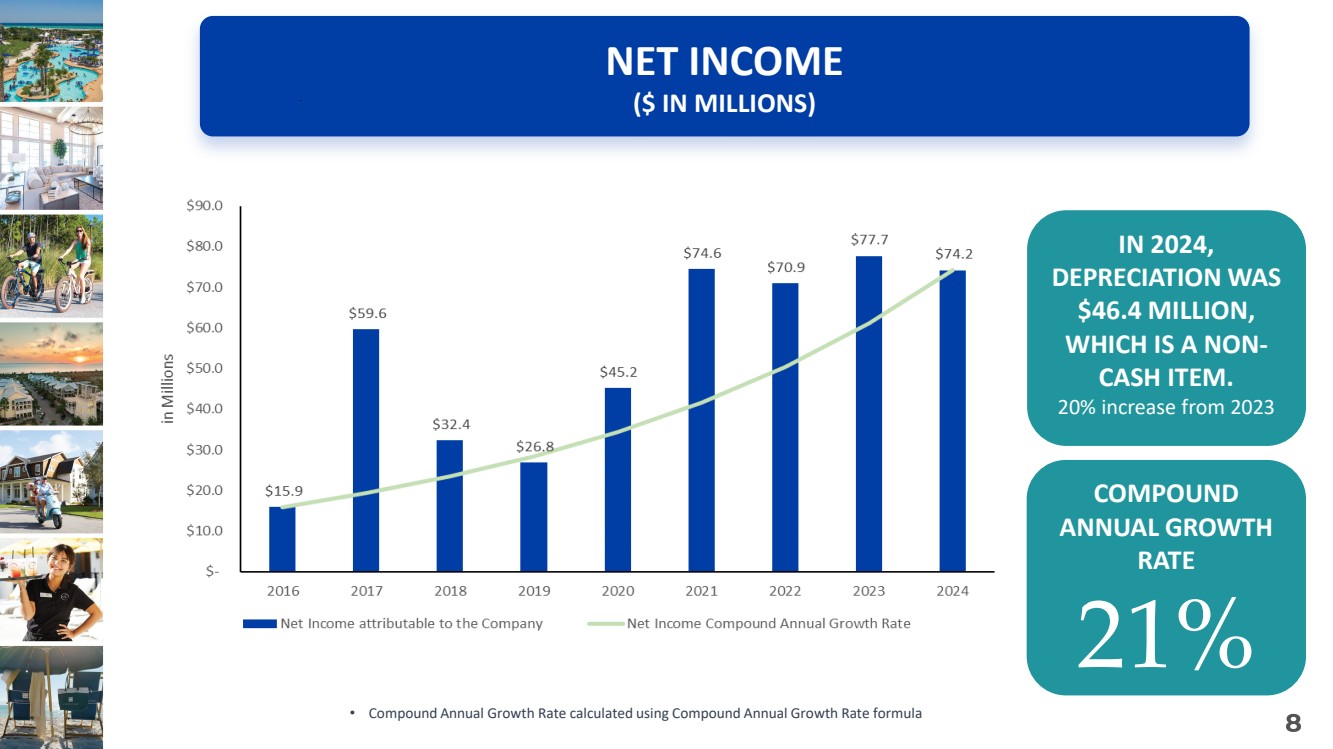
| IN 2024, DEPRECIATION WAS $46.4 MILLION, WHICH IS A NON-CASH ITEM. 20% increase from 2023 COMPOUND ANNUAL GROWTH RATE 21% • Compound Annual Growth Rate calculated using Compound Annual Growth Rate formula NET INCOME ($ IN MILLIONS) |
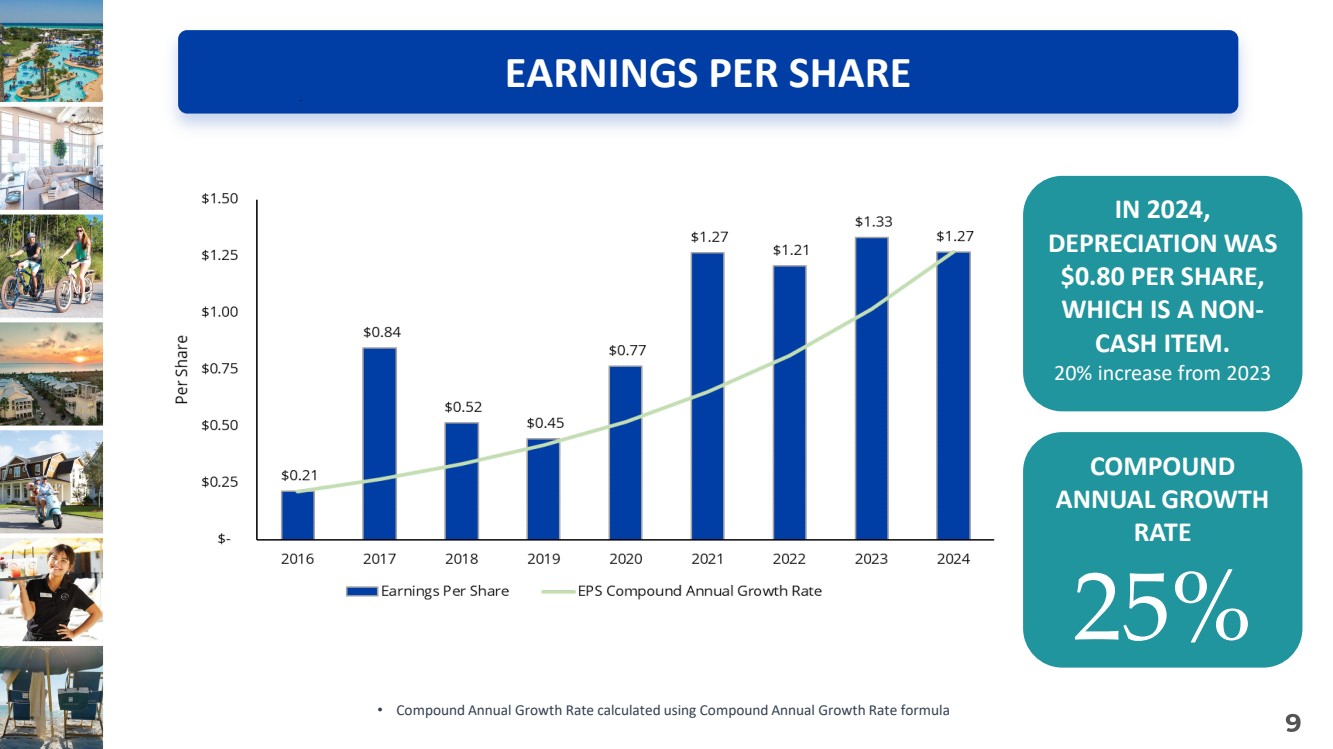
| COMPOUND ANNUAL GROWTH RATE 25% • Compound Annual Growth Rate calculated using Compound Annual Growth Rate formula EARNINGS PER SHARE IN 2024, DEPRECIATION WAS $0.80 PER SHARE, WHICH IS A NON-CASH ITEM. 20% increase from 2023 |
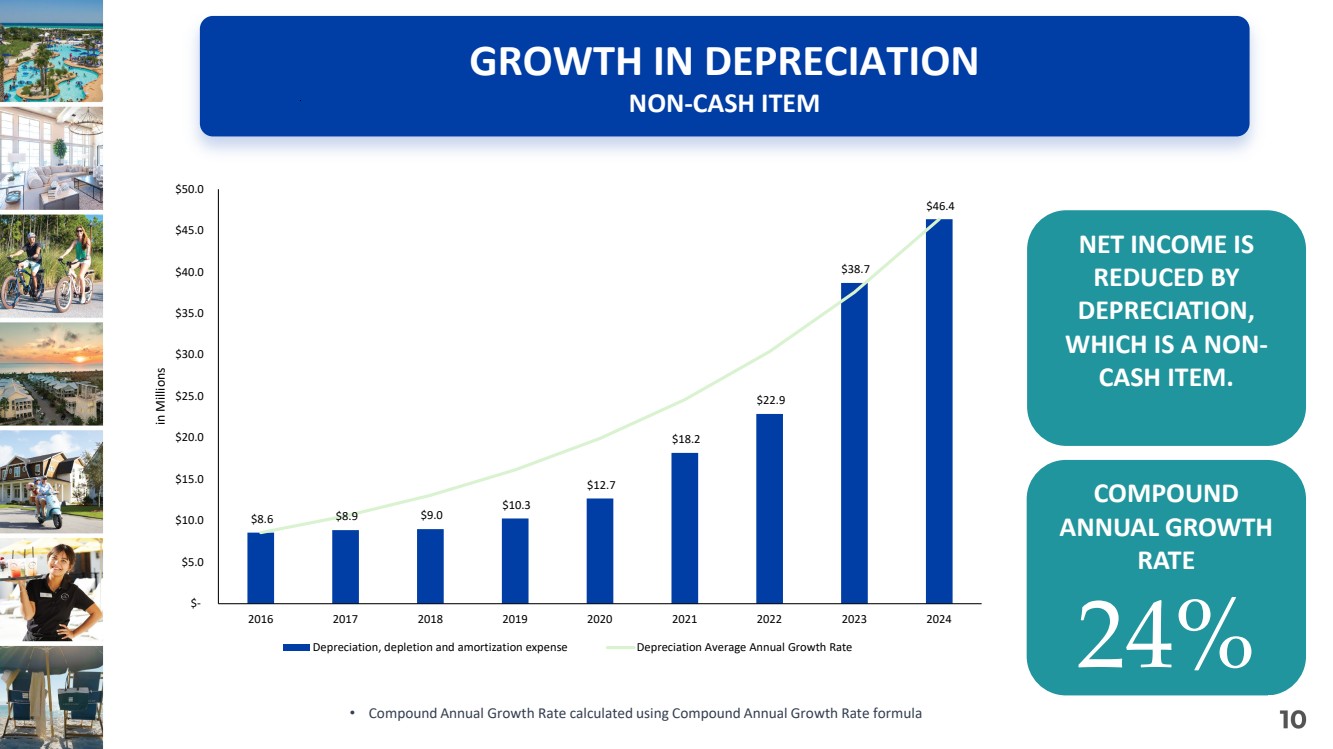
| NET INCOME IS REDUCED BY DEPRECIATION, WHICH IS A NON-CASH ITEM. COMPOUND ANNUAL GROWTH RATE 24% • Compound Annual Growth Rate calculated using Compound Annual Growth Rate formula GROWTH IN DEPRECIATION NON-CASH ITEM $8.6 $8.9 $9.0 $10.3 $12.7 $18.2 $22.9 $38.7 $46.4 $- $5.0 $10.0 $15.0 $20.0 $25.0 $30.0 $35.0 $40.0 $45.0 $50.0 2016 2017 2018 2019 2020 2021 2022 2023 2024 in Millions Depreciation, depletion and amortization expense Depreciation Average Annual Growth Rate |
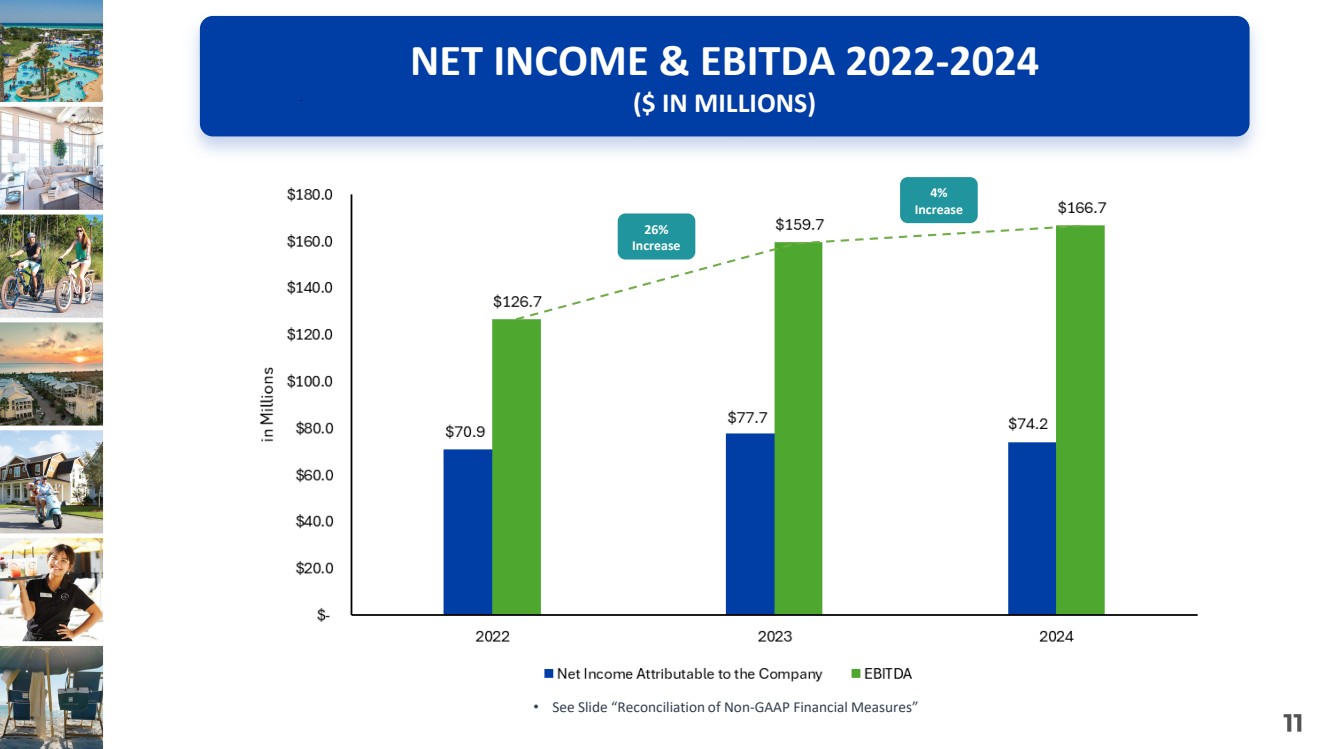
| NET INCOME & EBITDA 2022-2024 ($ IN MILLIONS) 26% Increase 4% Increase • See Slide “Reconciliation of Non-GAAP Financial Measures” |
| “FREE CASH FLOW” DEPRECIATION/SUSTAINING CAPITAL 2024 SNAPSHOT ($ in thousands) 2024 Net income attributable to the Company $74,189 Depreciation, depletion and amortization (non-cash item) $46,385 Sustaining Capital $(7,607) Total $112,967 • Sustaining Capital represents Capital Expenditures for maintaining existing operating assets • Repairs and Maintenance (R&M) are accounted for in Net Income • “Free Cash Flow” is a non-GAAP financial measure, which management believes assists investors by providing insight into operating performance of the Company and provides useful information regarding how cash compares to the capital required to maintain and grow the business. However, “Free Cash Flow” has limitations as an analytical tool and should not be considered in isolation or as a substitute for analysis of results reported under GAAP. “Free Cash Flow” is calculated as “Net income attributable to the Company” increased by “Depreciation, depletion and amortization” and reduced by “Sustaining Capital.” |

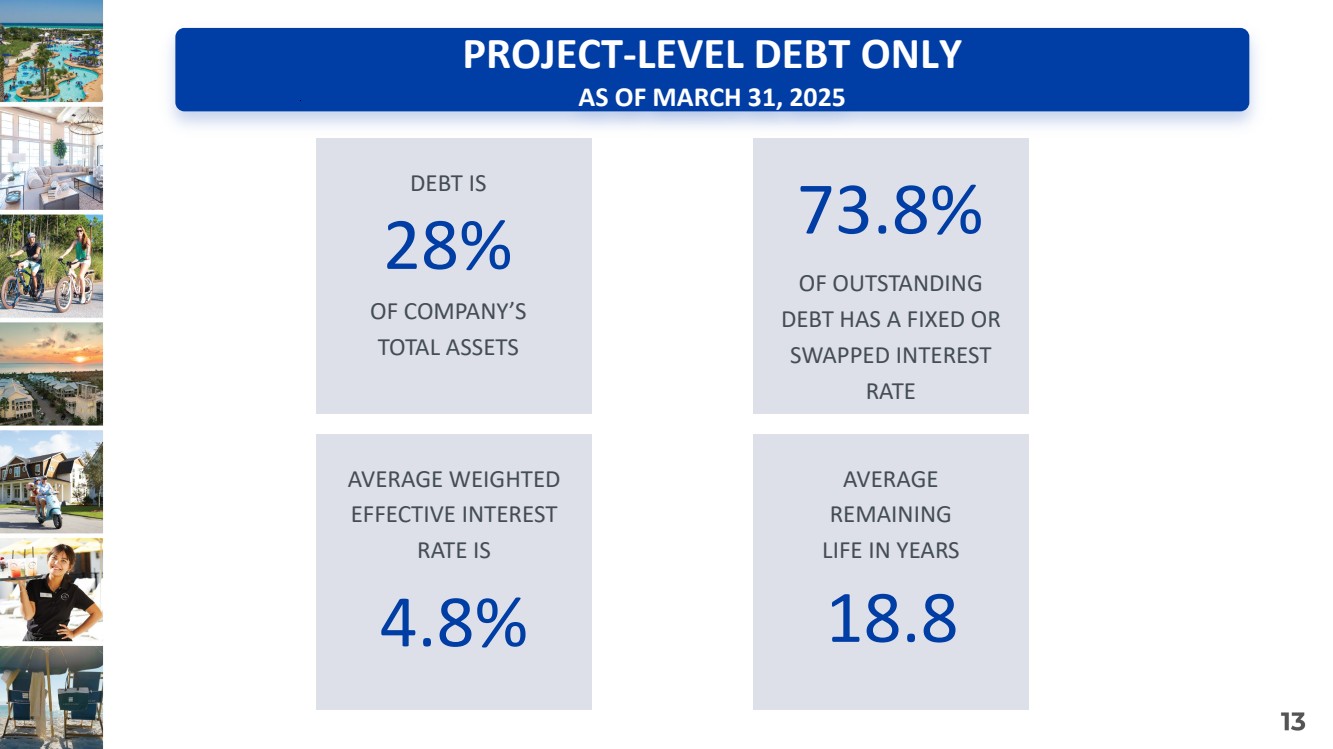
| DEBT IS 28% OF OUTSTANDING DEBT HAS A FIXED OR SWAPPED INTEREST RATE 73.8% AVERAGE WEIGHTED EFFECTIVE INTEREST RATE IS 4.8% AVERAGE REMAINING LIFE IN YEARS 18.8 OF COMPANY’S TOTAL ASSETS PROJECT-LEVEL DEBT ONLY AS OF MARCH 31, 2025 |
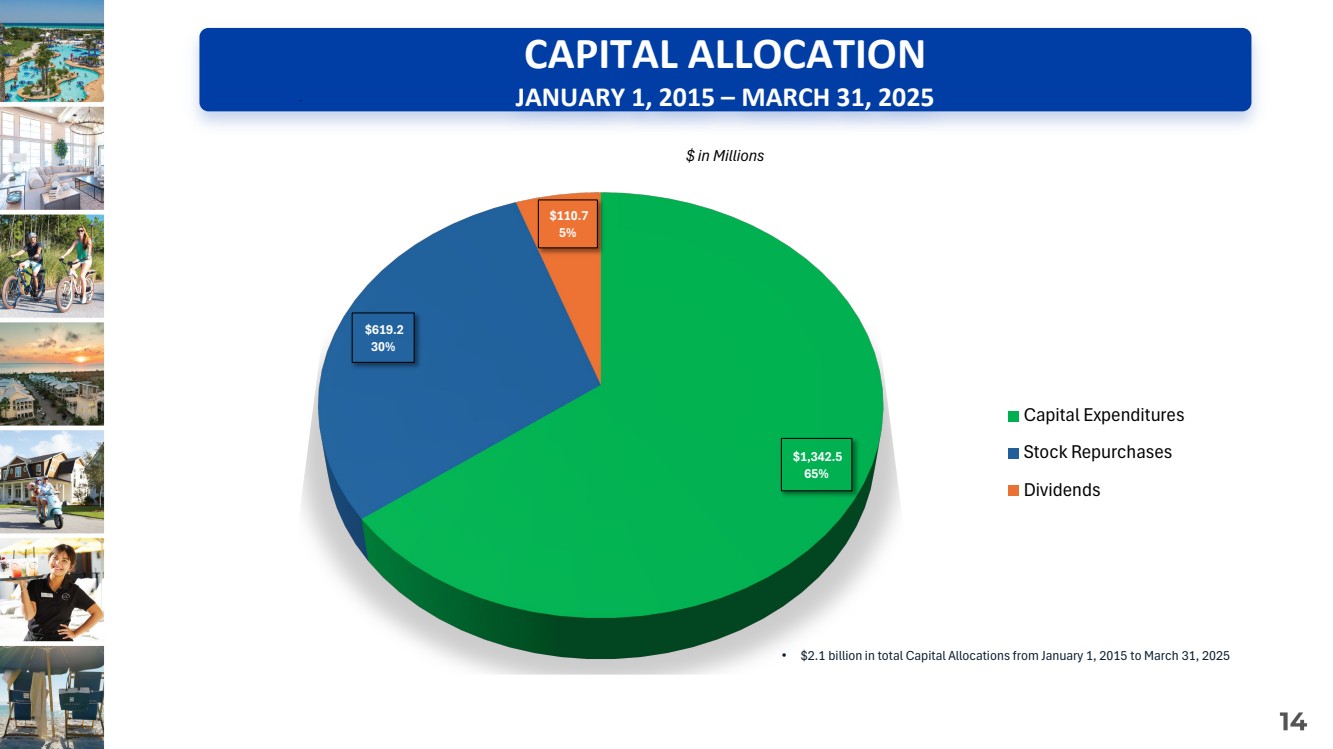
| CAPITAL ALLOCATION JANUARY 1, 2015 – MARCH 31, 2025 $1,342.5 65% $619.2 30% $110.7 5% $ in Millions Capital Expenditures Stock Repurchases Dividends • $2.1 billion in total Capital Allocations from January 1, 2015 to March 31, 2025 |
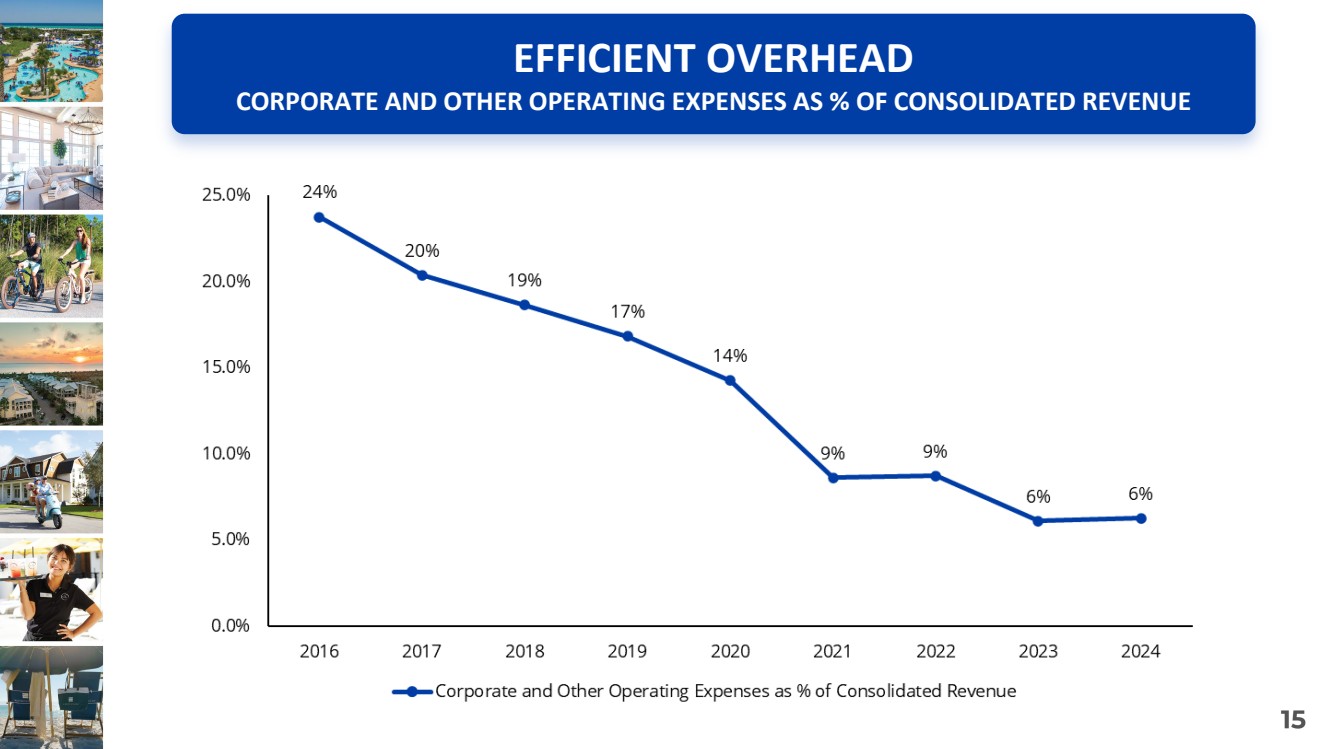
| EFFICIENT OVERHEAD CORPORATE AND OTHER OPERATING EXPENSES AS % OF CONSOLIDATED REVENUE |
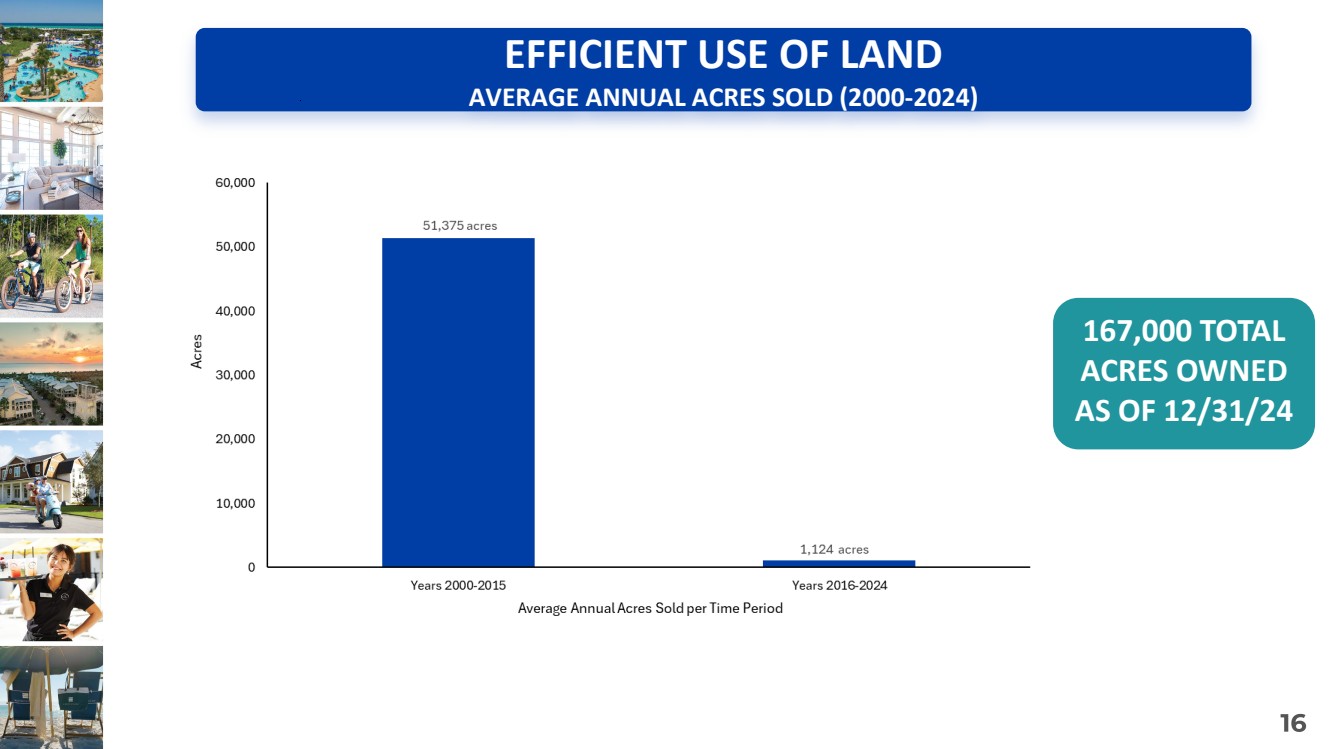
| EFFICIENT USE OF LAND AVERAGE ANNUAL ACRES SOLD (2000-2024) 167,000 TOTAL ACRES OWNED AS OF 12/31/24 |
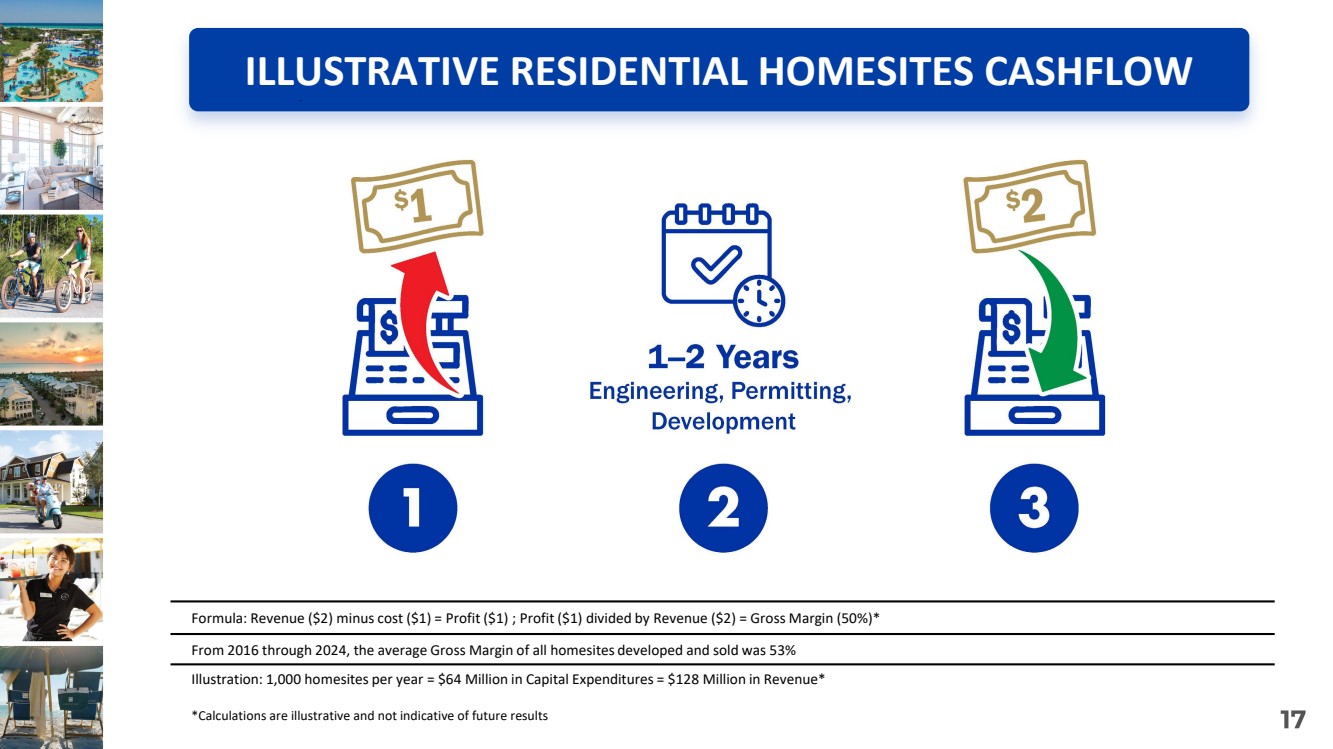
| ILLUSTRATIVE RESIDENTIAL HOMESITES CASHFLOW Formula: Revenue ($2) minus cost ($1) = Profit ($1) ; Profit ($1) divided by Revenue ($2) = Gross Margin (50%)* From 2016 through 2024, the average Gross Margin of all homesites developed and sold was 53% Illustration: 1,000 homesites per year = $64 Million in Capital Expenditures = $128 Million in Revenue* *Calculations are illustrative and not indicative of future results |
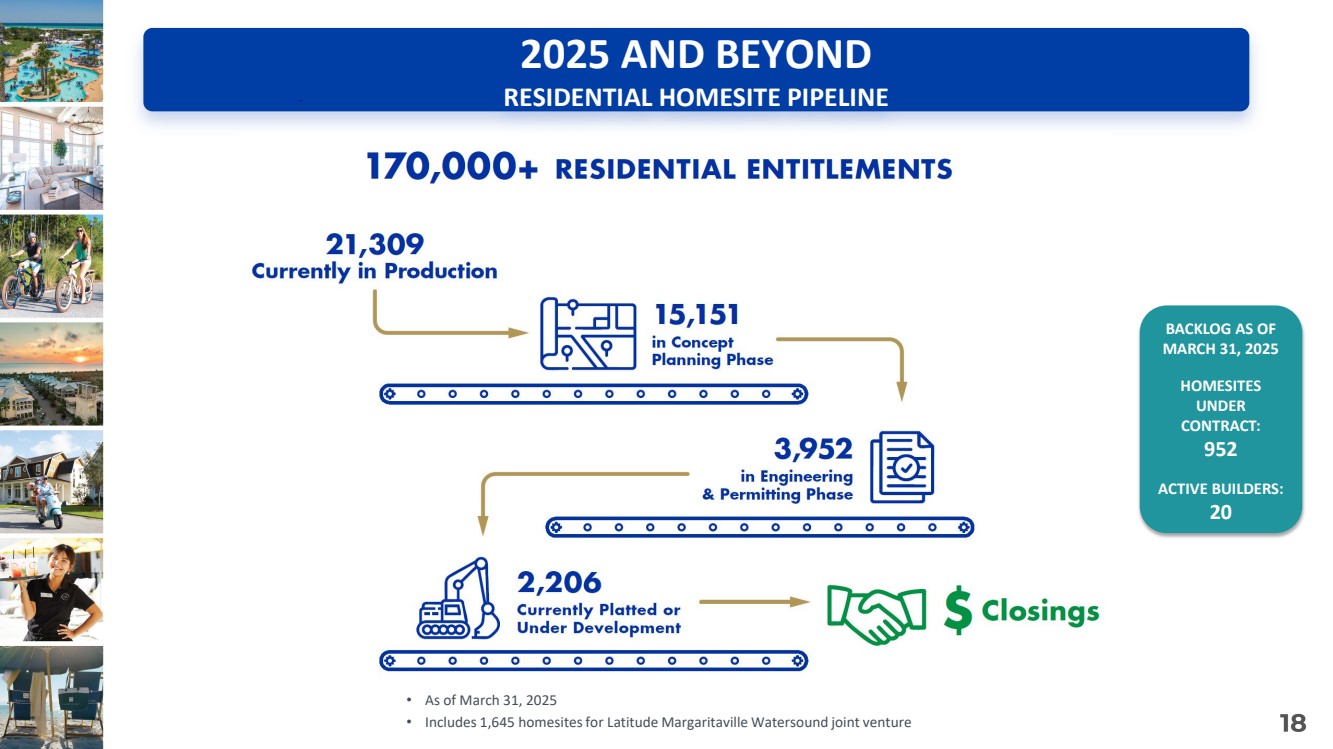
| BACKLOG AS OF MARCH 31, 2025 952 ACTIVE BUILDERS 20 HOMESITES UNDER CONTRACT 2025 AND BEYOND RESIDENTIAL HOMESITE PIPELINE BACKLOG AS OF MARCH 31, 2025 HOMESITES UNDER CONTRACT: 952 ACTIVE BUILDERS: 20 • As of March 31, 2025 • Includes 1,645 homesites for Latitude Margaritaville Watersound joint venture |
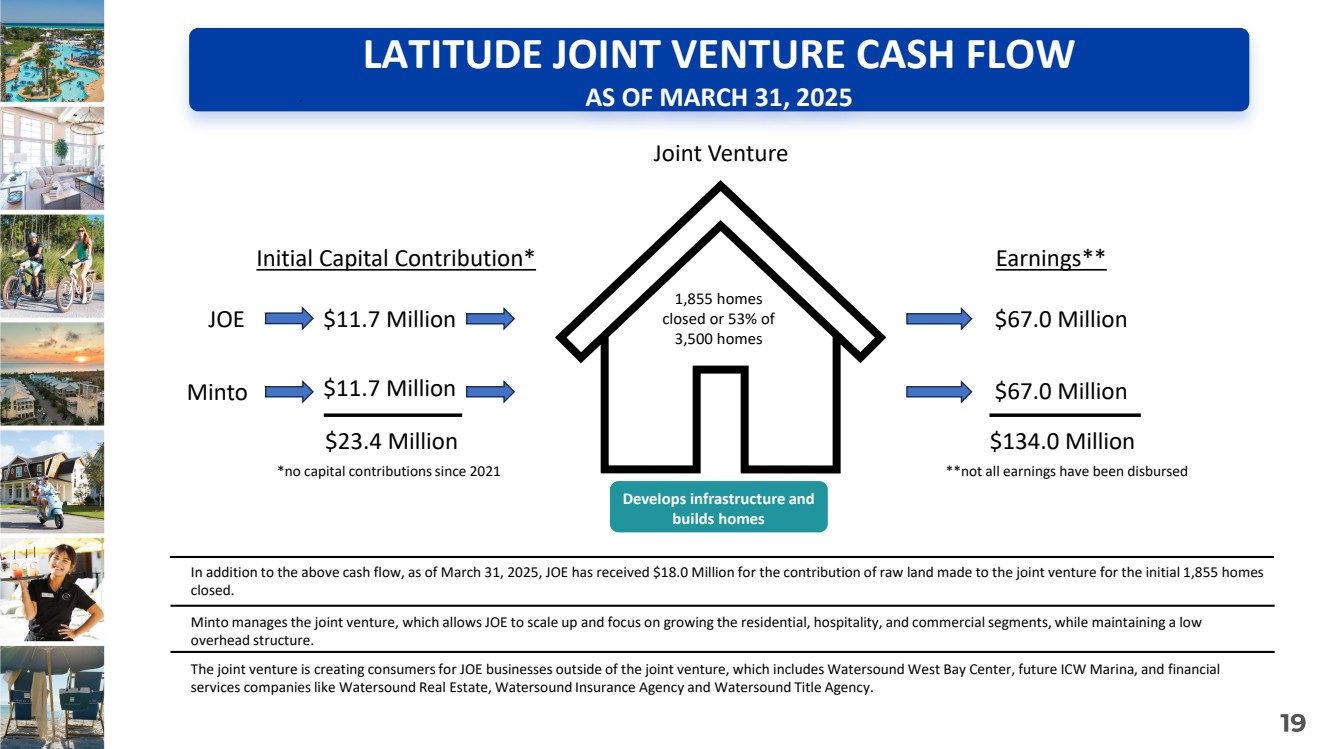
| LATITUDE JOINT VENTURE CASH FLOW AS OF MARCH 31, 2025 Develops infrastructure and builds homes JOE Minto Initial Capital Contribution* Earnings** $67.0 Million $134.0 Million *no capital contributions since 2021 Minto manages the joint venture, which allows JOE to scale up and focus on growing the residential, hospitality, and commercial segments, while maintaining a low overhead structure. The joint venture is creating consumers for JOE businesses outside of the joint venture, which includes Watersound West Bay Center, future ICW Marina, and financial services companies like Watersound Real Estate, Watersound Insurance Agency and Watersound Title Agency. 1,855 homes closed or 53% of 3,500 homes $11.7 Million $11.7 Million $23.4 Million $67.0 Million Joint Venture In addition to the above cash flow, as of March 31, 2025, JOE has received $18.0 Million for the contribution of raw land made to the joint venture for the initial 1,855 homes closed. **not all earnings have been disbursed |
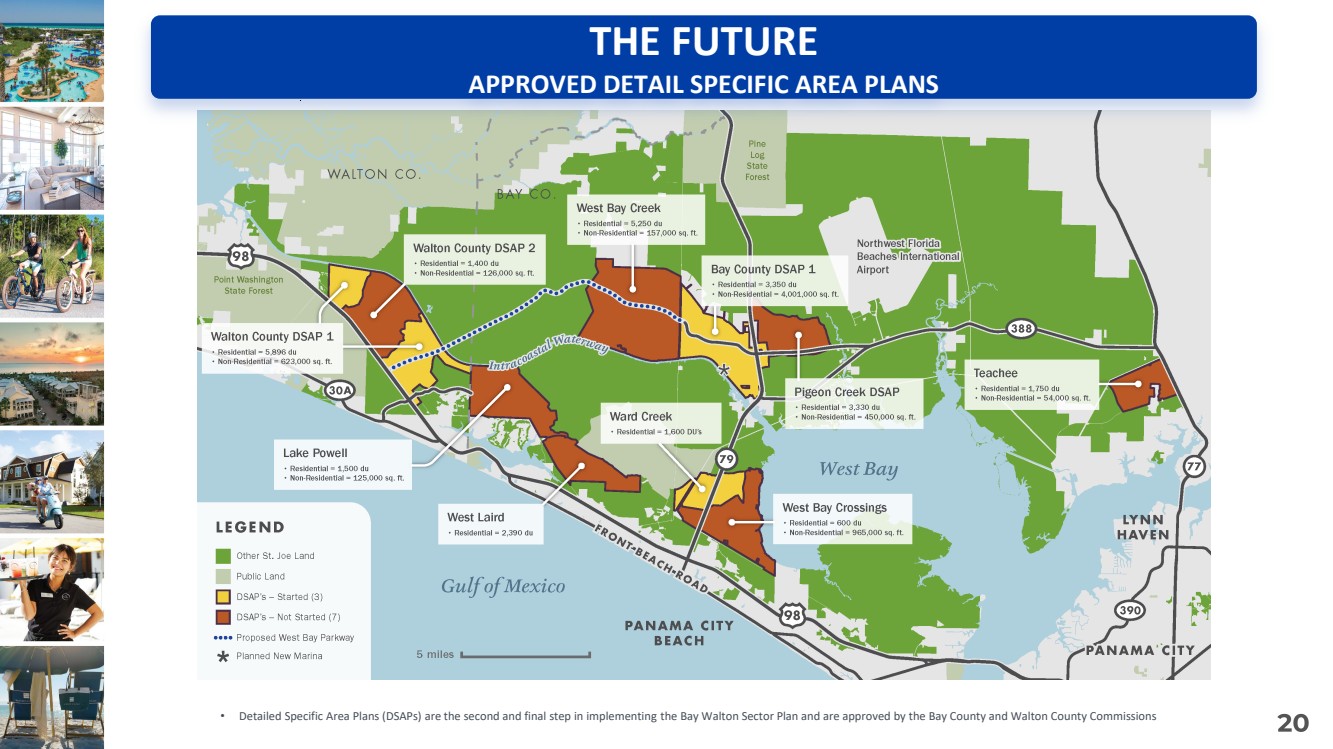
| LAND HOLDINGS AND DEVELOPMENTS THE FUTURE APPROVED DETAIL SPECIFIC AREA PLANS • Detailed Specific Area Plans (DSAPs) are the second and final step in implementing the Bay Walton Sector Plan and are approved by the Bay County and Walton County Commissions |
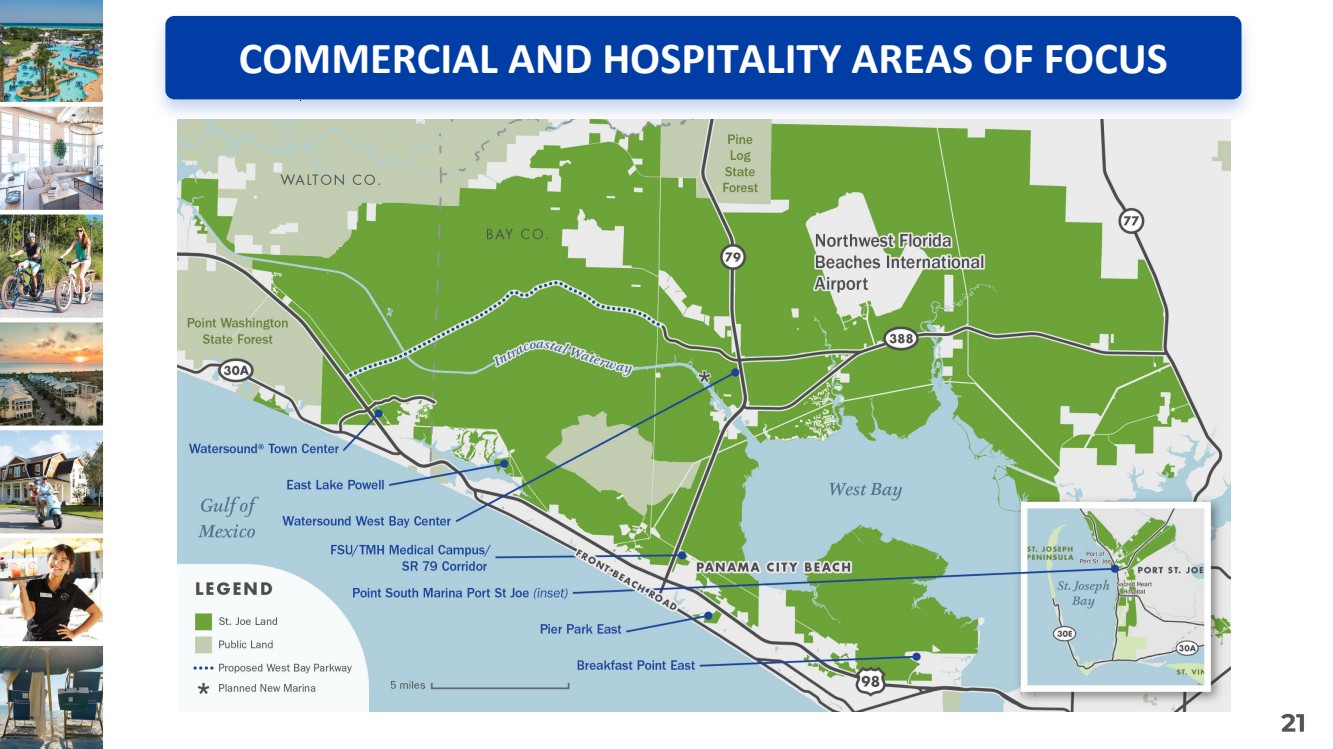
| LAND HOLDINGS AND DEVELOPMENTS COMMERCIAL AND HOSPITALITY AREAS OF FOCUS |
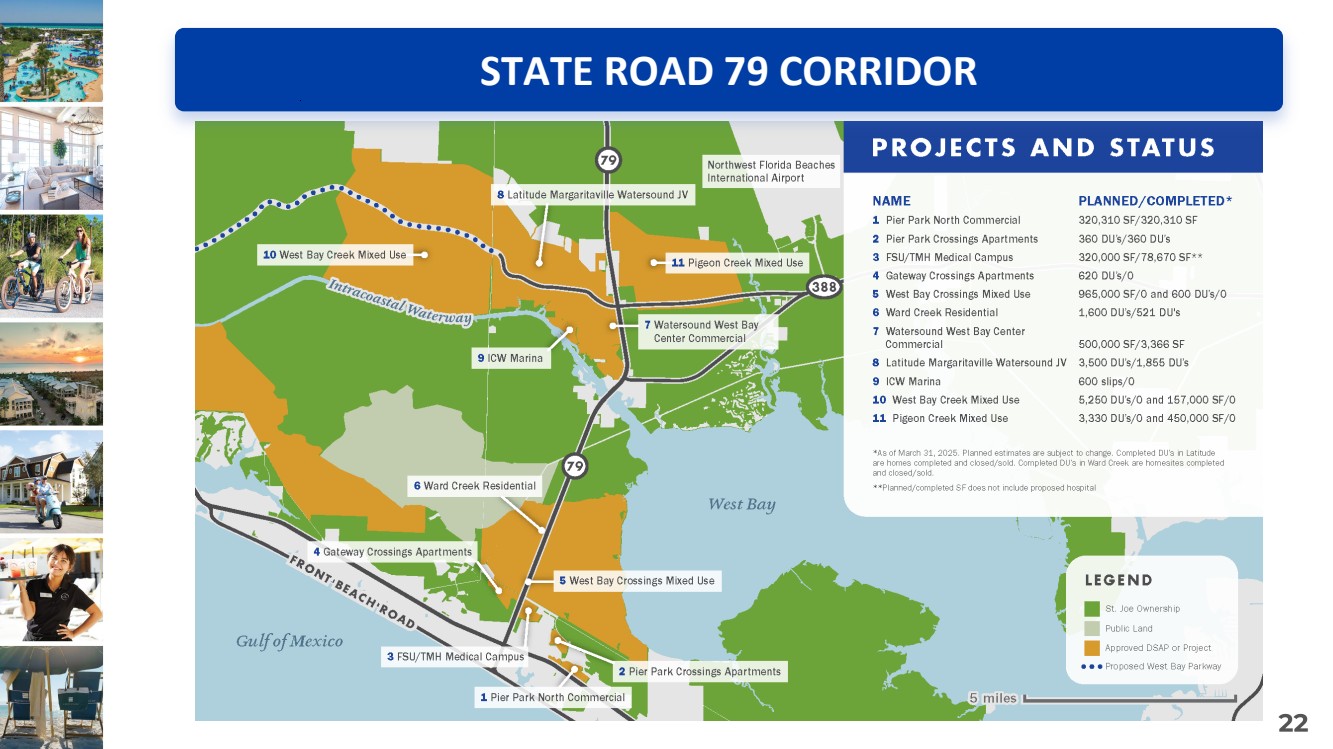
| STATE ROAD 79 CORRIDOR |
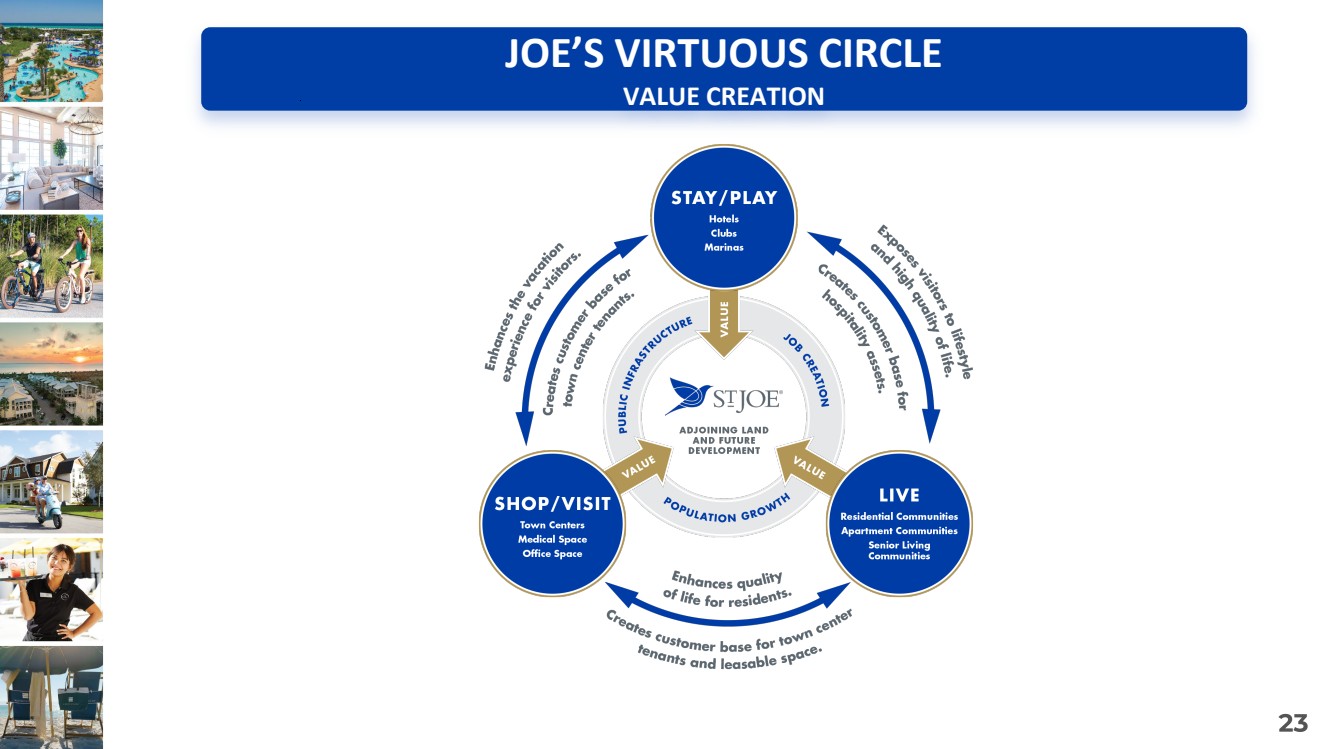
| JOE’S VIRTUOUS CIRCLE VALUE CREATION |
| • Based on a broker’s opinion of value provided by Jones Lang LaSalle and management estimates, the Company’s income-producing assets are estimated to have a value range of approximately $1.5 billion to $1.7 billion. 1 • The income-producing assets encompass 491 acres (excluding golf courses) and 1,358 acres (including golf courses), occupying less than 1% of the total 167,000 acres owned by the Company. 2 • Income-producing assets consist of a private membership club with amenities, hotels, restaurants, retail outlets, vacation rental homes, marinas, commercial leasing portfolio, multi-family housing, senior living communities, self-storage, and other assets. 3 For additional information regarding the Company’s income producing assets, see Item 2 of the Company’s most recent Quarterly Report on Form 10-Q. VALUATION RANGE INCOME PRODUCING ASSETS 1 The valuation range above represents a broker opinion provided by Jones Lang LaSalle Americas, Inc. as of April 30, 2025. These valuations are strictly the opinion of the commercial real estate broker conducting the analysis. This estimate is not a certified appraisal developed by a licensed appraiser under the Uniform Standards of Professional Appraisal Practice and should not be used as a substitute for a formal appraisal. The primary methodology used to determine property value was multiplying an appropriate capitalization rate to each property’s net operating income. Several income-producing assets are relatively new and not yet stabilized, and therefore the net operating income used in the valuation calculation may not reflect the full potential value once such properties are stabilized. In determining the appropriate capitalization rate, the broker considered factors such as property type, location, age, physical condition, local market conditions, and comparable property sales. The data, documentation, and assumptions used in the valuation determination were derived from information supplied by management, published information, and other industry sources. This information has not been independently verified by the broker. The valuation is as of the date set forth above and is subject to change due to shifts in market conditions, changes in property performance, modifications to zoning or regulations, or other factors affecting the applicable property value. 2 Acreage related to income-producing assets does not include residential communities, vacant land or land under development. 3 Includes assets of hospitality and commercial unconsolidated joint ventures. The Company is providing this valuation information to offer investors additional transparency regarding our income-producing property portfolio and to help illustrate the underlying value of these assets as part of its overall business. The income-producing assets included in this valuation are not currently being held for sale, and the Company does not have any current plans to sell such assets. These properties continue to be important components of the Company’s overall business strategy of expanding its portfolio of recurring income producing commercial and hospitality properties to drive long-term growth. This valuation disclosure should not be interpreted as an indication of any intent to divest these properties or change the Company’s current business strategy. |
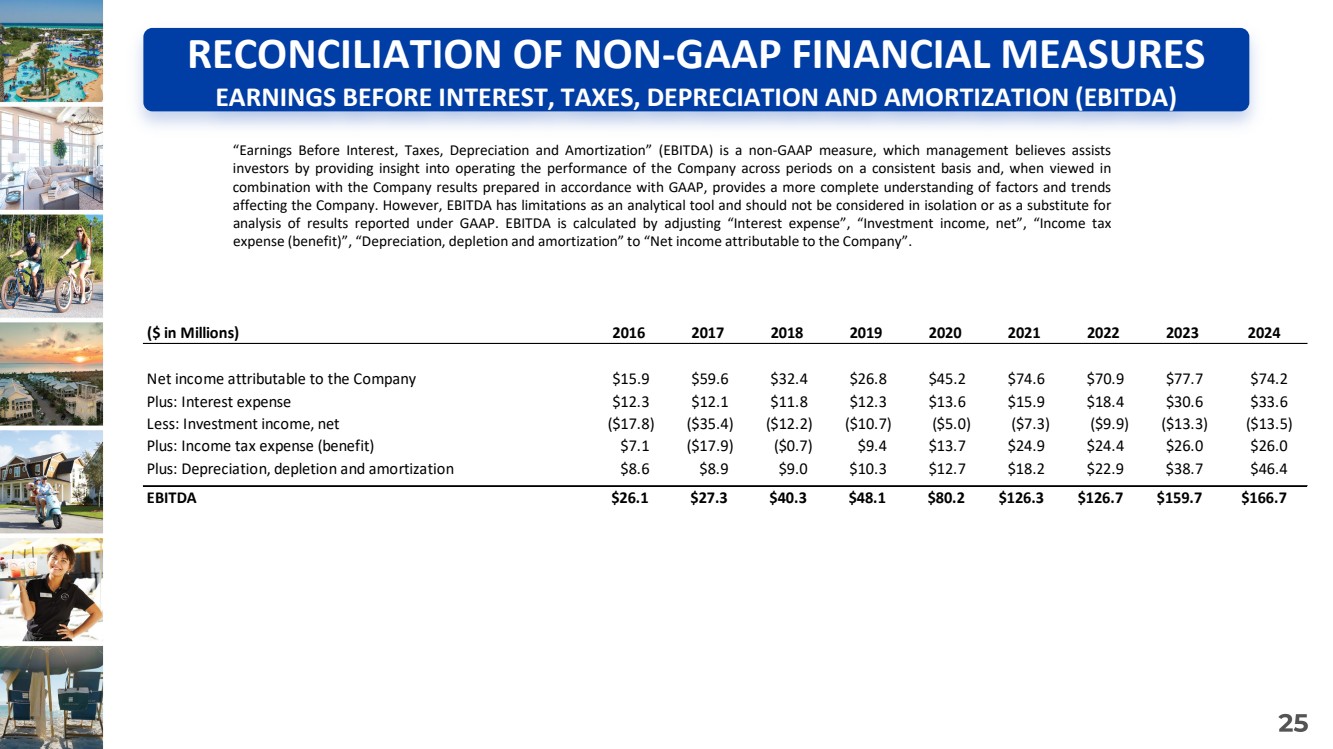
| “Earnings Before Interest, Taxes, Depreciation and Amortization” (EBITDA) is a non-GAAP measure, which management believes assists investors by providing insight into operating the performance of the Company across periods on a consistent basis and, when viewed in combination with the Company results prepared in accordance with GAAP, provides a more complete understanding of factors and trends affecting the Company. However, EBITDA has limitations as an analytical tool and should not be considered in isolation or as a substitute for analysis of results reported under GAAP. EBITDA is calculated by adjusting “Interest expense”, “Investment income, net”, “Income tax expense (benefit)”, “Depreciation, depletion and amortization” to “Net income attributable to the Company”. RECONCILIATION OF NON-GAAP FINANCIAL MEASURES EARNINGS BEFORE INTEREST, TAXES, DEPRECIATION AND AMORTIZATION (EBITDA) ($ in Millions) 2016 2017 2018 2019 2020 2021 2022 2023 2024 Net income attributable to the Company $15.9 $59.6 $32.4 $26.8 $45.2 $74.6 $70.9 $77.7 $74.2 Plus: Interest expense $12.3 $12.1 $11.8 $12.3 $13.6 $15.9 $18.4 $30.6 $33.6 Less: Investment income, net ($17.8) ($35.4) ($12.2) ($10.7) ($5.0) ($7.3) ($9.9) ($13.3) ($13.5) Plus: Income tax expense (benefit) $7.1 ($17.9) ($0.7) $9.4 $13.7 $24.9 $24.4 $26.0 $26.0 Plus: Depreciation, depletion and amortization $8.6 $8.9 $9.0 $10.3 $12.7 $18.2 $22.9 $38.7 $46.4 EBITDA $26.1 $27.3 $40.3 $48.1 $80.2 $126.3 $126.7 $159.7 $166.7 |
| All Rights Reserved. Important Notice Regarding Forward-Looking Statements This presentation contains “forward-looking statements” within the meaning of Section 27A of the Securities Act and Section 21E of the Exchange Act. These statements include, among other things, information about possible or assumed future results of the business and our financial condition, liquidity, results of operations, plans, strategies, prospects and objectives. Such forward-looking statements can generally be identified by our use of forward-looking terminology such as “guidance,” “may,” “will,” “expect,” “intend,” “anticipate,” “estimate,” “forecast,” “project,” “plan,” “intend,” “believe,” “confident,” “should,” “can have,” “likely,” “future,” “continue” or other similar expressions concerning matters that are not historical facts. We caution you that all forward-looking statements involve risks and uncertainties, and while we believe that our expectations for the future are reasonable in view of currently available information, you are cautioned not to place undue reliance on our forward-looking statements. Actual results or events may differ materially from those indicated as a result of various important factors, including: our ability to successfully implement our strategic objectives; new or increased competition across our business units; any decline in general economic conditions, particularly in our primary markets; interest rate fluctuations; inflation; financial institution disruptions; supply chain disruptions; geopolitical conflicts and political uncertainty and the corresponding impact on the global economy; our ability to successfully execute or integrate new business endeavors and acquisitions; our ability to yield anticipated returns from our developments and projects; our ability to effectively manage our real estate assets, as well as the ability for us or our joint venture partners to effectively manage the day-to-day activities of joint venture projects; imposition of tariffs; our ability to complete construction and development projects within expected timeframes; the interest of prospective guests in our hotels, including the new hotels we have opened since the beginning of 2023; reductions in travel and other risks inherent to the hospitality industry; the illiquidity of all real estate assets; financial risks, including risks relating to currency fluctuations, credit risks, and fluctuations in the market value of our investment portfolio; any potential negative impact of our longer-term property development strategy, including losses and negative cash flows for an extended period of time if we continue with the self-development of granted entitlements; our dependence on homebuilders; mix of sales from different communities and the corresponding impact on sales period over period; the financial condition of our commercial tenants; regulatory and insurance risks associated with our senior living facilities; public health emergencies; any reduction in the supply of mortgage loans or tightening of credit markets; our dependence on strong migration and population expansion in our regions of development, particularly Northwest Florida; our ability to fully recover from natural disasters and severe weather conditions; the actual or perceived threat of climate change; the seasonality of our business; our ability to obtain adequate insurance for our properties or rising insurance costs; our dependence on certain third party providers; the inability of minority shareholders to influence corporate matters, due to concentrated ownership of largest shareholder; the impact of unfavorable legal proceedings or government investigations; the impact of complex and changing laws and regulations in the areas we operate; changes in tax rates, the adoption of new U.S. tax legislation, and exposure to additional tax liabilities, including with respect to Qualified Opportunity Zone program; new litigation; our ability to attract and retain qualified employees, particularly in our hospitality business; our ability to protect our information technology infrastructure and defend against cyber-attacks; increased media, political, and regulatory scrutiny negatively impacting our reputation; our ability to maintain adequate internal controls; risks associated with our financing arrangements, including our compliance with certain restrictions and limitations; our ability to pay our quarterly dividend; our ability to repurchase stock under our stock repurchase program; and the potential volatility of our common stock and the other risks and uncertainties discussed in “Risk Factors” beginning on page 7 of our most recent Annual Report on Form 10-K and from time to time in our subsequent filings with the SEC . © The St. Joe Company 2025. All Rights Reserved. “JOE®”, “St. Joe®”, “St. Joe with Taking Flight Bird design®” , “Taking Flight Bird design®”, “Breakfast Point®”, “Camp Creek®”, “Camp CreekSM”, “Watersound®”, “Watersound Camp Creek®”, “Watersound Club®”, “Watersound Origins®”, “Watersound Origins Crossings®”, “Pier Park®”, and “WindMark Beach®” are service marks of The St. Joe Company, and are NOT for use by any other party unless licensed by The St. Joe Company. Watersound Fountains is a WatersoundSM independent living community, and a WatermarkSM managed independent living community. “Fountains” is a service mark of Watermark Retirement Communities, LLC and is used under license. Latitude Margaritaville and the Latitude Margaritaville logo are trademarks of Margaritaville Enterprises, LLC and are used under license. This document does not constitute an offer to sell real property. The maps depicted are to show proximity to communities/areas for illustrative purposes. No guarantee is made that the proposed developments will be built as currently proposed, or, if built, will be of the same type, size or nature. Proposed developments are expected to take several years and will likely be modified from time to time to respond to varying market conditions and changes in circumstances. The developer reserves the right to modify plans for the development described or depicted herein at any time without notice. |
|