| Nareit REITworld November 2026 | Nasdaq: SVC |
| Warning Concerning Forward-Looking Statements, Disclaimers and Non-GAAP Financial Measures Warning Concerning Forward-Looking Statements This presentation contains forward-looking statements within the meaning of the Private Securities Litigation Reform Act of 1995 and other securities laws that are subject to risks and uncertainties. These statements may include words such as “believe”, “expect”, “anticipate”, “intend”, “plan”, “estimate”, “will”, “may” and negatives or derivatives of these or similar expressions. These forward-looking statements include, among others, statements regarding: potential margin, RevPAR, CAD, cash flow and EBITDA growth; the Board’s assessment of the potential value of SVC’s retained hotel portfolio, including hypothetical enterprise values based on targeted EBITDA and assumed valuation multiples; SVC’s strategic transformation to a pure-play triple net lease REIT; the potential benefits from SVC’s capital recycling, liquidity, leasing, acquisition and asset management initiatives, asset sales, revenue mix, labor and operating efficiency, operating leverage, secured financings and unencumbered properties; the durability of SVC’s cash flows and its ability to generate free cash flow; SVC’s expectations regarding CapEx; SVC’s execution of additional hotel dispositions, including the expected timing thereof and plans to sell substantially all of its hotels by the end of 2028; the completion and timing of hotel renovations, redevelopments and reopenings, and the anticipated benefits therefrom, including enhanced guest experience, pricing power and market share gains; the potential benefits of SVC’s hotel portfolio mix, locations, event calendar, limited new supply, competitive positioning, market share and customer demand trends; the competitive advantages of SVC’s travel center properties; the potential benefits of SVC’s master trust and other secured financing structures, the focus of the executive leadership of Sonesta International Hotels Corporation and its subsidiaries, or Sonesta; the potential benefits of Sonesta’s strategic affiliation with Boyd Gaming Corporation and future branding of Boyd properties under Sonesta brands; SVC’s ability to enhance liquidity, refinance its secured revolving credit facility with a new $525 million secured revolving credit facility, including the expected terms, collateral and timing of closing of that facility, address upcoming debt maturities, accelerate deleveraging, reduce SVC’s leverage to no more than five times net debt to Adjusted EBITDAre, and unlock long-term value; SVC’s expected benefits from the second half of 2026 through 2028 demand drivers; and SVC's full year 2026 guidance and projections and related assumptions, including with respect to displacement as a result of hotel renovations. Forward-looking statements reflect management's current expectations, are based on judgments and assumptions, are inherently uncertain and are subject to risks, uncertainties and other factors, which could cause SVC's actual results, performance or achievements to differ materially from expected future results, performance or achievements expressed or implied in those forward-looking statements. Some of the risks, uncertainties and other factors that may cause SVC's actual results, performance or achievements to differ materially from those expressed or implied by forward-looking statements include, but are not limited to, the following: SVC's ability and the ability of SVC's tenants and managers to operate under unfavorable market and commercial real estate industry conditions due to, among other things, uncertainties surrounding interest rates and inflation, supply chain disruptions, emerging technologies, volatility in the public equity and debt markets, changing tariffs and trade policies and related uncertainty, geopolitical instability and tensions, pandemics, any U.S. government shutdown, economic downturns or a possible recession, labor market conditions or changes in real estate utilization; the ability of Sonesta to successfully operate the hotels it manages for SVC; SVC’s ability to achieve its targeted Hotel EBITDA, EBITDA margins, RevPAR, CAD, cost savings and other operating improvements within the expected time frames, or at all; whether completed or planned renovations, redevelopments, reopenings and operator initiatives produce the anticipated revenue, market share, margin or other benefits; whether Sonesta’s strategic affiliation with Boyd Gaming Corporation, the planned integration of the parties’ loyalty programs, the possible branding of Boyd properties under Sonesta brands and other growth initiatives are completed as anticipated or produce the expected benefits; whether industry RevPAR growth and other third party forecasts on which certain of SVC’s projections are based prove to be accurate; whether anticipated event, travel and other demand drivers materialize or benefit SVC’s hotels as expected; whether new hotel supply remains limited and customer demand remains strong in the relevant markets, and whether SVC’s hotels maintain or improve their competitive positioning and market share; whether labor efficiencies, operating expense savings, revenue mix changes and reductions in customer acquisition costs are achieved; the valuation multiples that hotel assets may command in the future, which may be lower than those assumed in this presentation; SVC’s ability to repay or refinance its debts as they mature or otherwise become due; SVC’s ability to sell properties at prices it targets, and the timing and completion of such sales; SVC’s ability to raise or appropriately balance the use of debt or equity capital; SVC’s ability to refinance its revolving credit facility with the proposed $525 million secured revolving credit facility on the anticipated terms, pricing and timeline, or at all; continued availability of borrowings under SVC’s revolving credit facility is subject to SVC satisfying certain financial covenants and other credit facility conditions; SVC's ability to maintain sufficient liquidity, including the availability of borrowings under its revolving credit facility; SVC's ability to pay interest on and principal of its debt; whether SVC’s unencumbered properties, master trust or other collateral provide the liquidity or refinancing flexibility anticipated; whether and the extent to which SVC’s tenants and managers will pay the contractual amounts of returns, rents or other obligations due to SVC; the impact of changes in U.S. and foreign government administrative policies, including the imposition of or increases in tariffs and changes to existing trade agreements, on macroeconomic conditions, supply chains and the cost of products SVC’s operators use, and on the results of operations of SVC’s operators and SVC; competition within the commercial real estate, hotel, transportation and travel center and other industries in which SVC's tenants and managers operate, particularly in those markets in which SVC's properties are located; potential defaults under SVC’s leases and management agreements by its tenants and managers; SVC's ability to make cost-effective improvements to SVC's properties that enhance their appeal to net lease tenants and hotel guests; the ability of SVC’s Retained Hotels to benefit from diverse sources of lodging demand and significant recent capital investment that strengthens their quality and competitive positioning; SVC's ability to pay distributions to its shareholders and to increase or sustain the amount of such distributions; SVC's ability to acquire properties that realize its targeted returns; SVC’s ability to identify properties that it wants to acquire or to negotiate acceptable purchase prices, acquisition financing terms, management agreements or lease terms for new properties, or ability to complete acquisitions; SVC's ability to increase rents at its net leased properties as SVC's leases expire and hotel room rates in excess of its operating expenses and to grow its business; SVC's ability to increase and maintain net lease property and hotel room occupancy at its properties; SVC’s ability to engage and retain qualified tenants and managers for its net lease properties and hotels on satisfactory terms; SVC's ability to diversify its sources of rents and returns that improve the security of its cash flows; SVC's credit ratings; the ability of SVC's manager, RMR, to successfully manage SVC; actual and potential conflicts of interest with SVC's related parties, including its Managing Trustees, Sonesta, RMR and others affiliated with them; SVC's ability to realize benefits from the scale, geographic diversity, strategic locations and variety of service levels of its hotels; limitations imposed by and SVC's ability to satisfy complex rules to maintain its qualification for taxation as a REIT for U.S. federal income tax purposes; compliance with, and changes to, federal, state and local laws and regulations, accounting rules, tax laws and similar matters; acts of terrorism, war or other hostilities, outbreaks of pandemics or other public health safety events or conditions, global climate change or other man-made or natural disasters beyond its control; and other matters. These risks, uncertainties and other factors are not exhaustive and should be read in conjunction with other cautionary statements that are included in SVC's periodic filings. The information contained in SVC's filings with the SEC, including under the caption "Risk Factors" in SVC's periodic reports, or incorporated therein, identifies important factors that could cause differences from SVC's forward-looking statements in this presentation. SVC's filings with the SEC are available on the SEC's website at www.sec.gov. You should not place undue reliance upon SVC's forward-looking statements. Except as required by law, SVC does not intend to update or change any forward-looking statements as a result of new information, future events or otherwise. Notes Regarding Certain Information in this Presentation This presentation contains industry and statistical data that SVC obtained from various third party sources. Nothing in the data used or derived from third party sources should be construed as investment advice. Some data and other information presented are also based on SVC’s good faith estimates and beliefs derived from its review of internal surveys and independent sources and its experience. SVC believes that these external sources, estimates and beliefs are reliable and reasonable, but it has not independently verified them. Although SVC is not aware of any misstatements regarding the data presented herein, these estimates and beliefs involve inherent risks and uncertainties and are based on assumptions that are subject to change. This presentation includes pro forma information for the transactions described in this presentation. The pro forma adjustments are based on available information and assumptions SVC’s management believes are reasonable; however, such adjustments are subject to change as transaction-related agreements are finalized. This presentation also includes hypothetical enterprise values for SVC’s retained hotel portfolio. These hypothetical values are presented for illustrative purposes only, are based on targeted EBITDA and assumed valuation multiples that may not be achieved, and are not projections of SVC’s future results or indications of the prices at which SVC’s hotels could be sold or the trading price of SVC’s common shares. Non-GAAP Financial Measures This presentation contains non-GAAP financial measures including FFO, Normalized FFO, CAD, EBITDA, Hotel EBITDA, Adjusted Hotel EBITDA, EBITDAre, Adjusted EBITDAre, NOI and Cash Basis NOI. Calculations of, and reconciliations (if applicable) for, these metrics to the closest GAAP metrics, are included in the appendix hereto. Please refer to Non-GAAP Financial Measures and Certain Definitions in the Appendix for terms used throughout this presentation. Unless otherwise noted, all data presented are as of or for the three or nine months ended September 30, 2026. 2 |
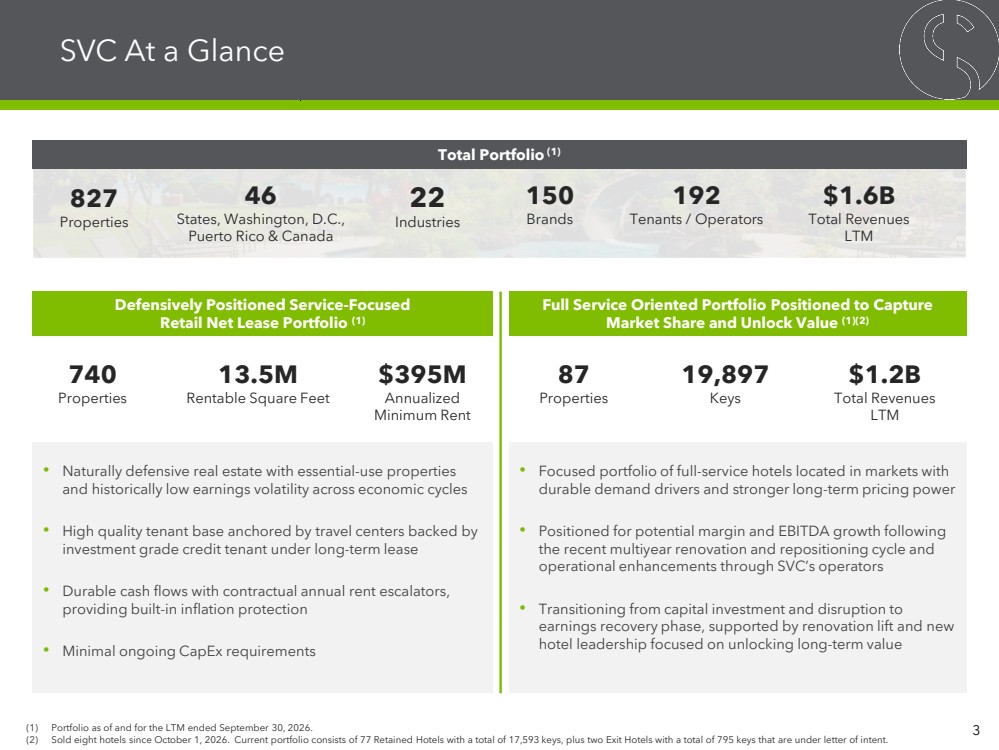
| SVC At a Glance Total Portfolio (1) 3 827 Properties 46 States, Washington, D.C., Puerto Rico & Canada 22 Industries 150 Brands 192 Tenants / Operators $1.6B Total Revenues LTM (1) Portfolio as of and for the LTM ended September 30, 2026. (2) Sold eight hotels since October 1, 2026. Current portfolio consists of 77 Retained Hotels with a total of 17,593 keys, plus two Exit Hotels with a total of 795 keys that are under letter of intent. Defensively Positioned Service-Focused Retail Net Lease Portfolio (1) Full Service Oriented Portfolio Positioned to Capture Market Share and Unlock Value (1)(2) 87 Properties 19,897 Keys $1.2B Total Revenues LTM 740 Properties 13.5M Rentable Square Feet $395M Annualized Minimum Rent • Naturally defensive real estate with essential-use properties and historically low earnings volatility across economic cycles • High quality tenant base anchored by travel centers backed by investment grade credit tenant under long-term lease • Durable cash flows with contractual annual rent escalators, providing built-in inflation protection • Minimal ongoing CapEx requirements • Focused portfolio of full-service hotels located in markets with durable demand drivers and stronger long-term pricing power • Positioned for potential margin and EBITDA growth following the recent multiyear renovation and repositioning cycle and operational enhancements through SVC’s operators • Transitioning from capital investment and disruption to earnings recovery phase, supported by renovation lift and new hotel leadership focused on unlocking long-term value |
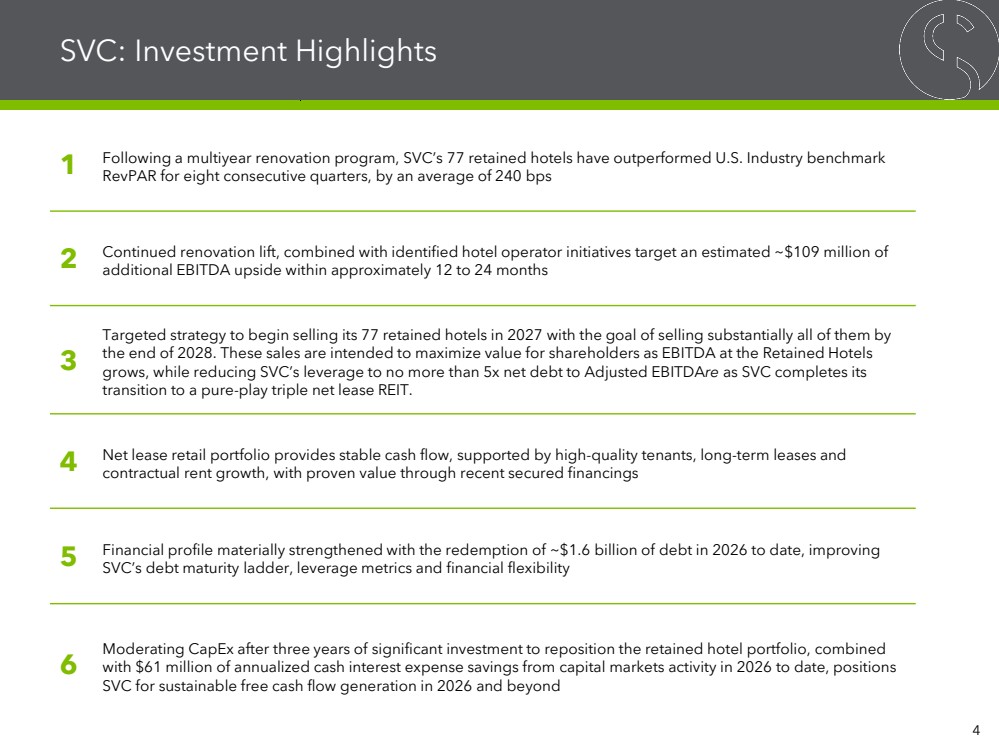
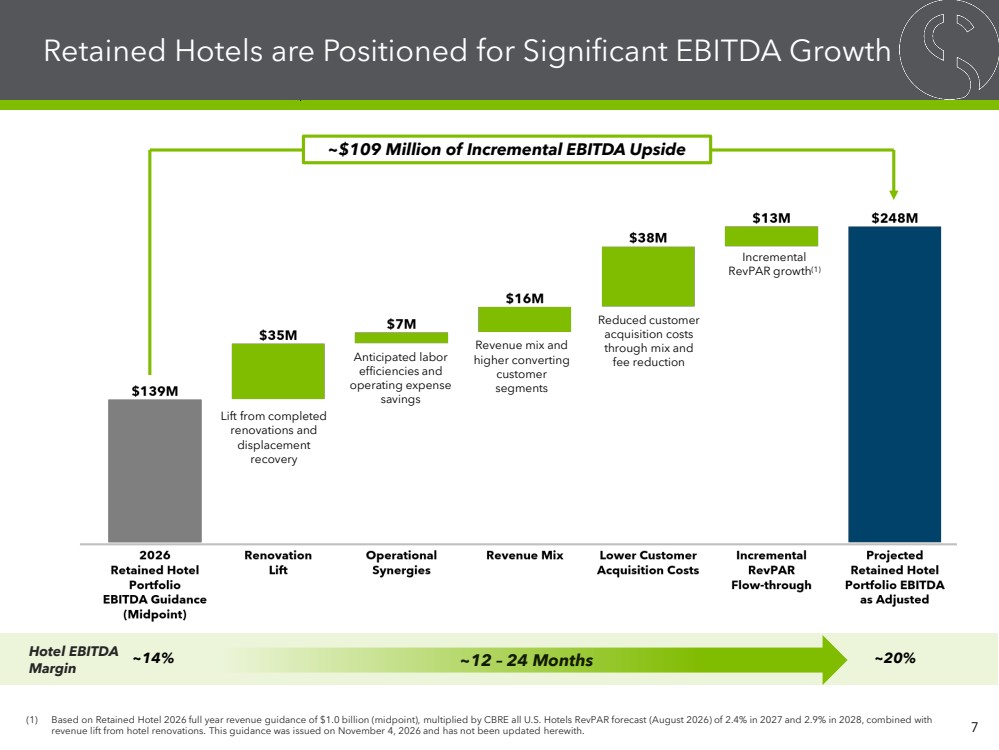
| SVC: Investment Highlights 1 Following a multiyear renovation program, SVC’s 77 retained hotels have outperformed U.S. Industry benchmark RevPAR for eight consecutive quarters, by an average of 240 bps 2 Continued renovation lift, combined with identified hotel operator initiatives target an estimated ~$109 million of additional EBITDA upside within approximately 12 to 24 months 3 Targeted strategy to begin selling its 77 retained hotels in 2027 with the goal of selling substantially all of them by the end of 2028. These sales are intended to maximize value for shareholders as EBITDA at the Retained Hotels grows, while reducing SVC’s leverage to no more than 5x net debt to Adjusted EBITDAre as SVC completes its transition to a pure-play triple net lease REIT. 4 Net lease retail portfolio provides stable cash flow, supported by high-quality tenants, long-term leases and contractual rent growth, with proven value through recent secured financings 5 Financial profile materially strengthened with the redemption of ~$1.6 billion of debt in 2026 to date, improving SVC’s debt maturity ladder, leverage metrics and financial flexibility 6 Moderating CapEx after three years of significant investment to reposition the retained hotel portfolio, combined with $61 million of annualized cash interest expense savings from capital markets activity in 2026 to date, positions SVC for sustainable free cash flow generation in 2026 and beyond 4 |
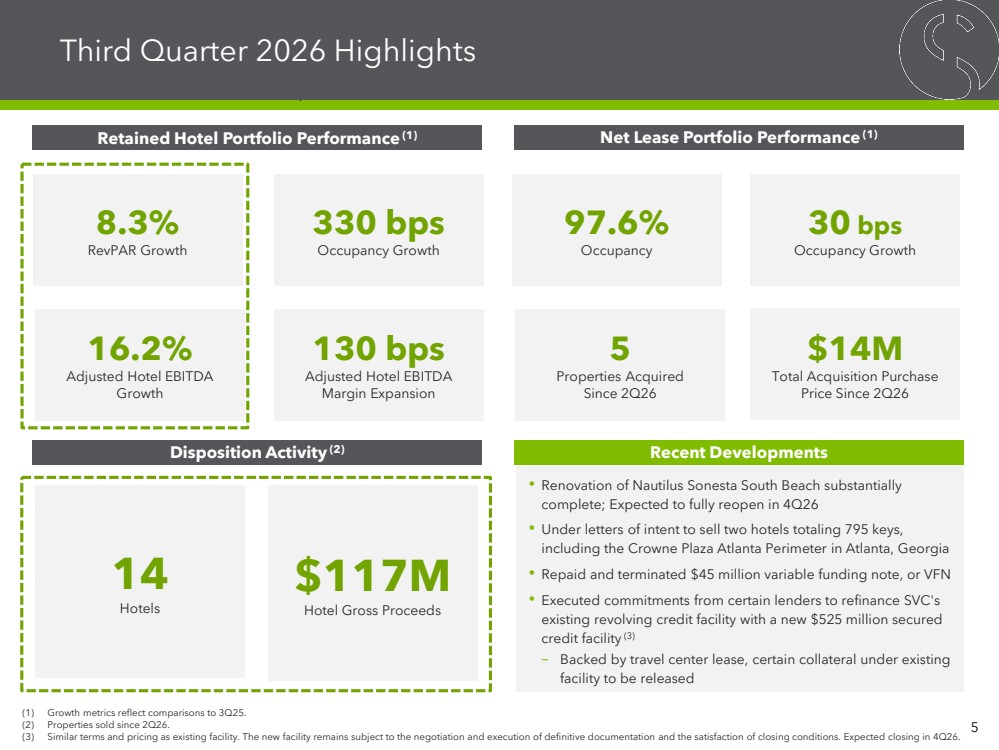
| • Renovation of Nautilus Sonesta South Beach substantially complete; Expected to fully reopen in 4Q26 • Under letters of intent to sell two hotels totaling 795 keys, including the Crowne Plaza Atlanta Perimeter in Atlanta, Georgia • Repaid and terminated $45 million variable funding note, or VFN • Executed commitments from certain lenders to refinance SVC's existing revolving credit facility with a new $525 million secured credit facility (3) – Backed by travel center lease, certain collateral under existing facility to be released Third Quarter 2026 Highlights 5 Recent Developments Net Lease Portfolio Performance Retained Hotel Portfolio Performance(1) (1) 97.6% Occupancy 30 bps Occupancy Growth 8.3% RevPAR Growth 16.2% Adjusted Hotel EBITDA Growth 330 bps Occupancy Growth 130 bps Adjusted Hotel EBITDA Margin Expansion $117M Hotel Gross Proceeds 14 Hotels (1) Growth metrics reflect comparisons to 3Q25. (2) Properties sold since 2Q26. (3) Similar terms and pricing as existing facility. The new facility remains subject to the negotiation and execution of definitive documentation and the satisfaction of closing conditions. Expected closing in 4Q26. $14M Total Acquisition Purchase Price Since 2Q26 5 Properties Acquired Since 2Q26 Disposition Activity (2) |
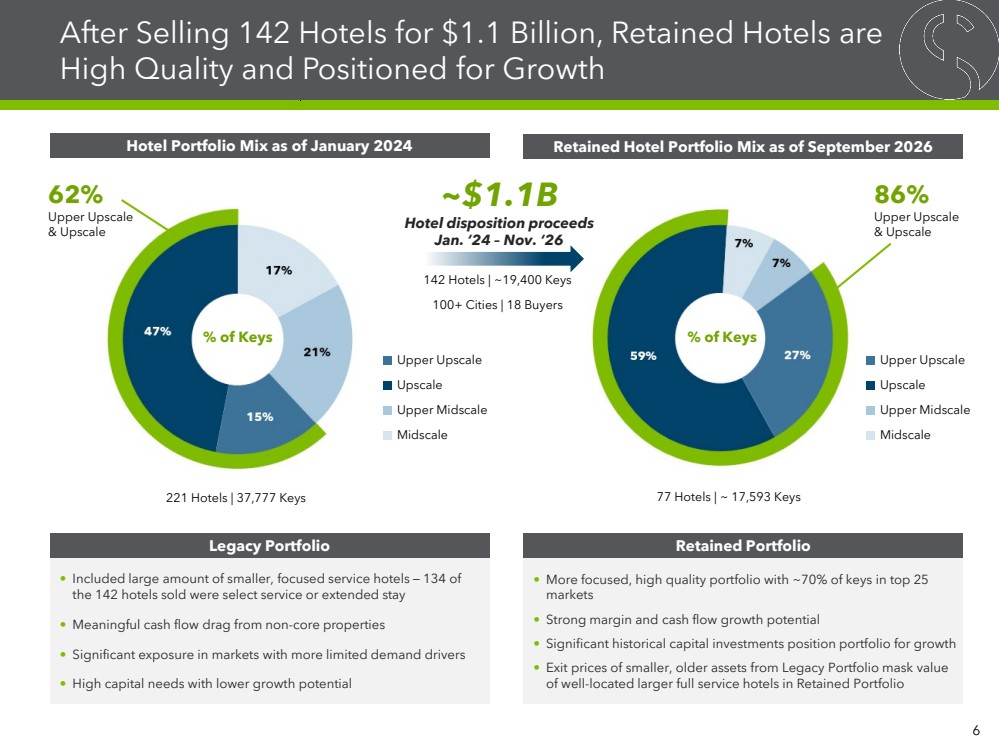
| After Selling 142 Hotels for $1.1 Billion, Retained Hotels are High Quality and Positioned for Growth 6 Hotel Portfolio Mix as of January 2024 Retained Hotel Portfolio Mix as of September 2026 • Included large amount of smaller, focused service hotels ─ 134 of the 142 hotels sold were select service or extended stay • Meaningful cash flow drag from non-core properties • Significant exposure in markets with more limited demand drivers • High capital needs with lower growth potential • More focused, high quality portfolio with ~70% of keys in top 25 markets • Strong margin and cash flow growth potential • Significant historical capital investments position portfolio for growth • Exit prices of smaller, older assets from Legacy Portfolio mask value of well-located larger full service hotels in Retained Portfolio ~$1.1B Hotel disposition proceeds Jan. ‘24 – Nov. ‘26 Legacy Portfolio Retained Portfolio 86% Upper Upscale & Upscale 62% Upper Upscale & Upscale % of Keys 142 Hotels | ~19,400 Keys 100+ Cities | 18 Buyers 221 Hotels | 37,777 Keys 77 Hotels | ~ 17,593 Keys Upscale Midscale Upper Midscale Upper Upscale Upscale Midscale Upper Midscale Upper Upscale % of Keys |
| ~12 – 24 Months Retained Hotels are Positioned for Significant EBITDA Growth 7 Lift from completed renovations and displacement recovery Anticipated labor efficiencies and operating expense savings Hotel EBITDA Margin Incremental RevPAR growth(1) Revenue mix and higher converting customer segments ~14% ~20% (1) Based on Retained Hotel 2026 full year revenue guidance of $1.0 billion (midpoint), multiplied by CBRE all U.S. Hotels RevPAR forecast (August 2026) of 2.4% in 2027 and 2.9% in 2028, combined with revenue lift from hotel renovations. This guidance was issued on November 4, 2026 and has not been updated herewith. Reduced customer acquisition costs through mix and fee reduction ~$109 Million of Incremental EBITDA Upside |
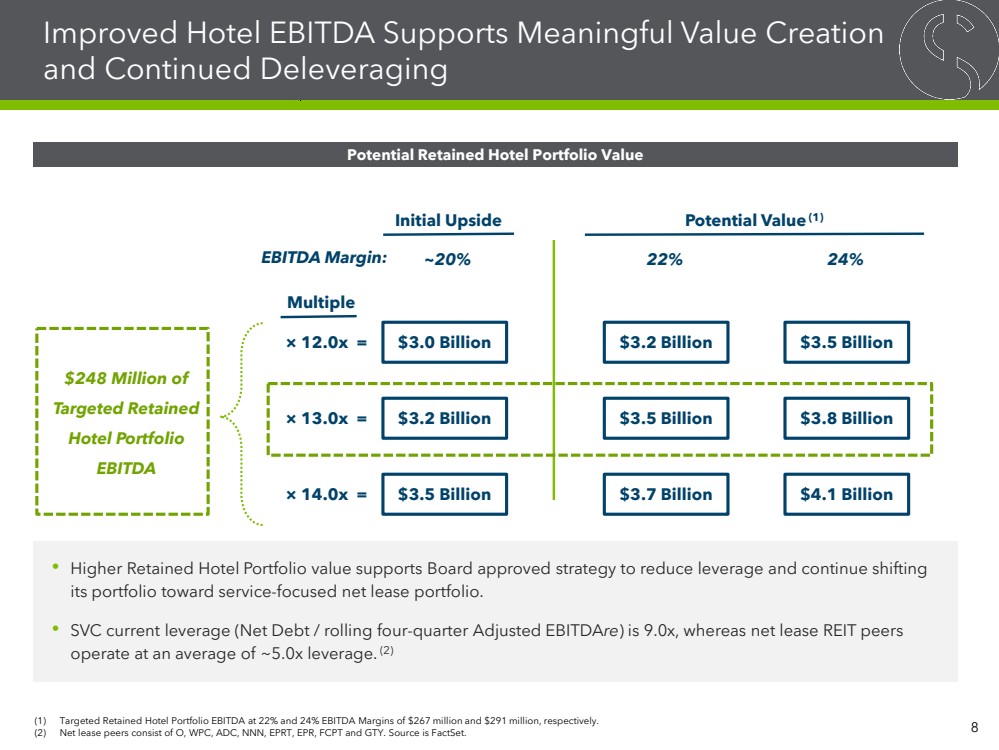
| $248 Million of Targeted Retained Hotel Portfolio EBITDA Improved Hotel EBITDA Supports Meaningful Value Creation and Continued Deleveraging 8 Potential Retained Hotel Portfolio Value • Higher Retained Hotel Portfolio value supports Board approved strategy to reduce leverage and continue shifting its portfolio toward service-focused net lease portfolio. • SVC current leverage (Net Debt / rolling four-quarter Adjusted EBITDAre) is 9.0x, whereas net lease REIT peers operate at an average of ~5.0x leverage. (2) $3.0 Billion $3.2 Billion $3.5 Billion × 12.0x = × 13.0x = × 14.0x = Initial Upside Potential Value (1) EBITDA Margin: ~20% $3.2 Billion $3.5 Billion $3.7 Billion 22% $3.5 Billion $3.8 Billion $4.1 Billion 24% Multiple (1) Targeted Retained Hotel Portfolio EBITDA at 22% and 24% EBITDA Margins of $267 million and $291 million, respectively. (2) Net lease peers consist of O, WPC, ADC, NNN, EPRT, EPR, FCPT and GTY. Source is FactSet. |
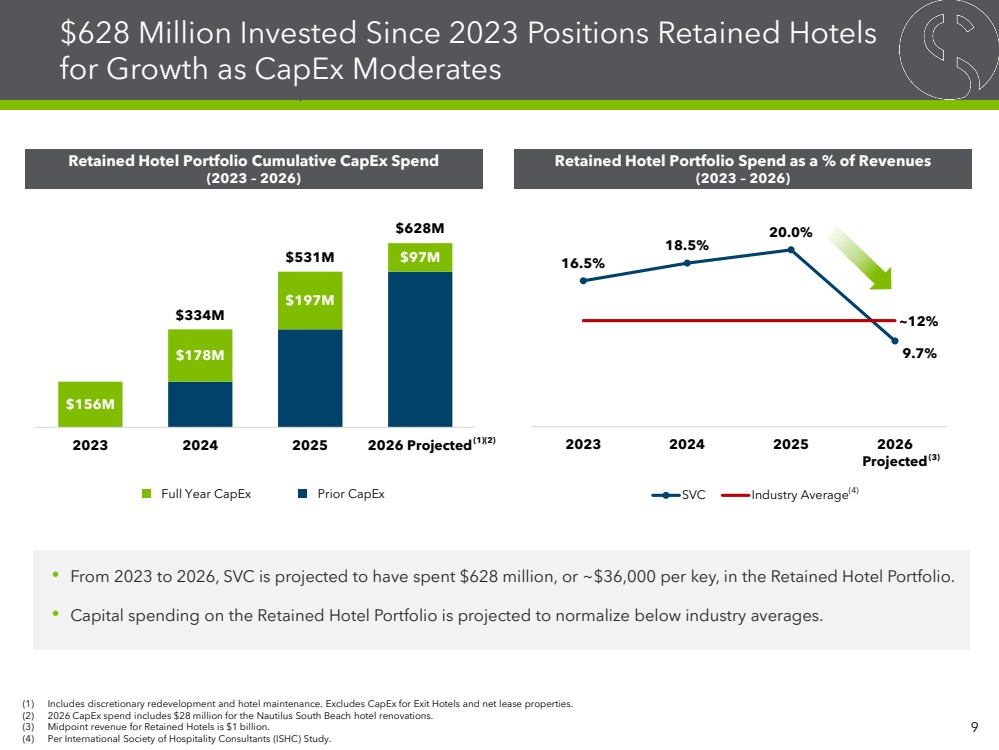
| $156M $178M $197M $97M $334M $531M $628M 2023 2024 2025 2026 Projected 16.5% 18.5% 20.0% 9.7% 2023 2024 2025 2026 Projected SVC Industry Average $628 Million Invested Since 2023 Positions Retained Hotels for Growth as CapEx Moderates 9 Retained Hotel Portfolio Spend as a % of Revenues (2023 – 2026) Retained Hotel Portfolio Cumulative CapEx Spend (2023 – 2026) • From 2023 to 2026, SVC is projected to have spent $628 million, or ~$36,000 per key, in the Retained Hotel Portfolio. • Capital spending on the Retained Hotel Portfolio is projected to normalize below industry averages. (4) (1) Includes discretionary redevelopment and hotel maintenance. Excludes CapEx for Exit Hotels and net lease properties. (2) 2026 CapEx spend includes $28 million for the Nautilus South Beach hotel renovations. (3) Midpoint revenue for Retained Hotels is $1 billion. (4) Per International Society of Hospitality Consultants (ISHC) Study. (1)(2) Full Year CapEx Prior CapEx ~12% (3) |
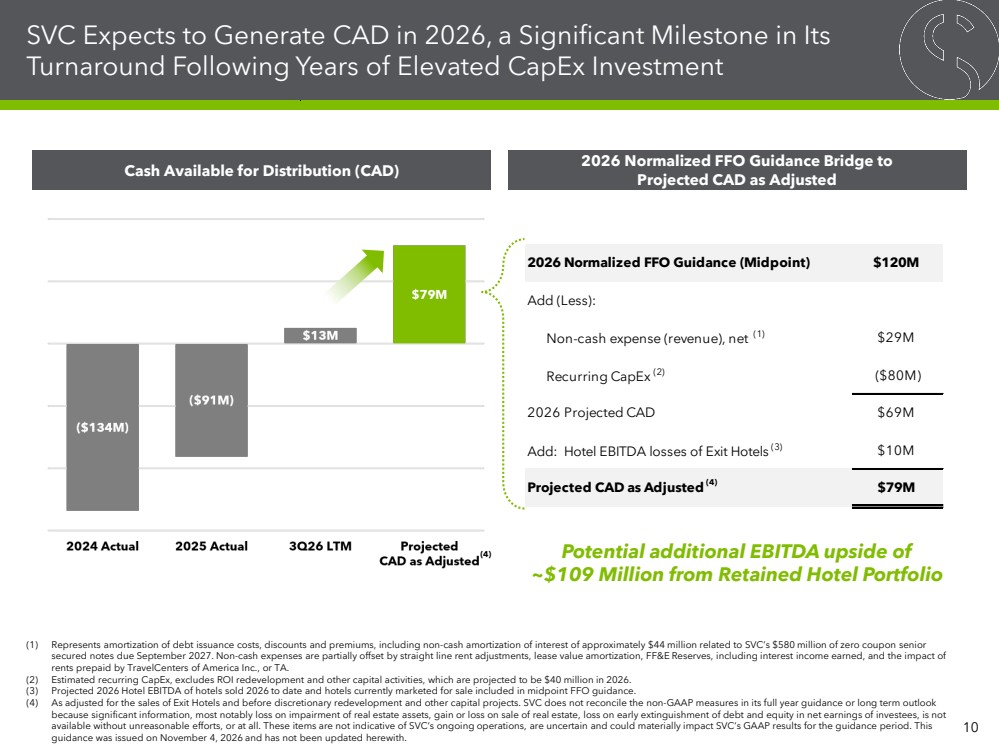
| 2026 Normalized FFO Guidance (Midpoint) $120M Add (Less): Non-cash expense (revenue), net (1) $29M Recurring CapEx (2) ($80M) 2026 Projected CAD $69M Add: Hotel EBITDA losses of Exit Hotels (3) $10M Projected CAD as Adjusted $79M SVC Expects to Generate CAD in 2026, a Significant Milestone in Its Turnaround Following Years of Elevated CapEx Investment 10 (1) Represents amortization of debt issuance costs, discounts and premiums, including non-cash amortization of interest of approximately $44 million related to SVC’s $580 million of zero coupon senior secured notes due September 2027. Non-cash expenses are partially offset by straight line rent adjustments, lease value amortization, FF&E Reserves, including interest income earned, and the impact of rents prepaid by TravelCenters of America Inc., or TA. (2) Estimated recurring CapEx, excludes ROI redevelopment and other capital activities, which are projected to be $40 million in 2026. (3) Projected 2026 Hotel EBITDA of hotels sold 2026 to date and hotels currently marketed for sale included in midpoint FFO guidance. (4) As adjusted for the sales of Exit Hotels and before discretionary redevelopment and other capital projects. SVC does not reconcile the non-GAAP measures in its full year guidance or long term outlook because significant information, most notably loss on impairment of real estate assets, gain or loss on sale of real estate, loss on early extinguishment of debt and equity in net earnings of investees, is not available without unreasonable efforts, or at all. These items are not indicative of SVC’s ongoing operations, are uncertain and could materially impact SVC’s GAAP results for the guidance period. This guidance was issued on November 4, 2026 and has not been updated herewith. Cash Available for Distribution (CAD) 2026 Normalized FFO Guidance Bridge to Projected CAD as Adjusted (4) Potential additional EBITDA upside of ~$109 Million from Retained Hotel Portfolio (4) |
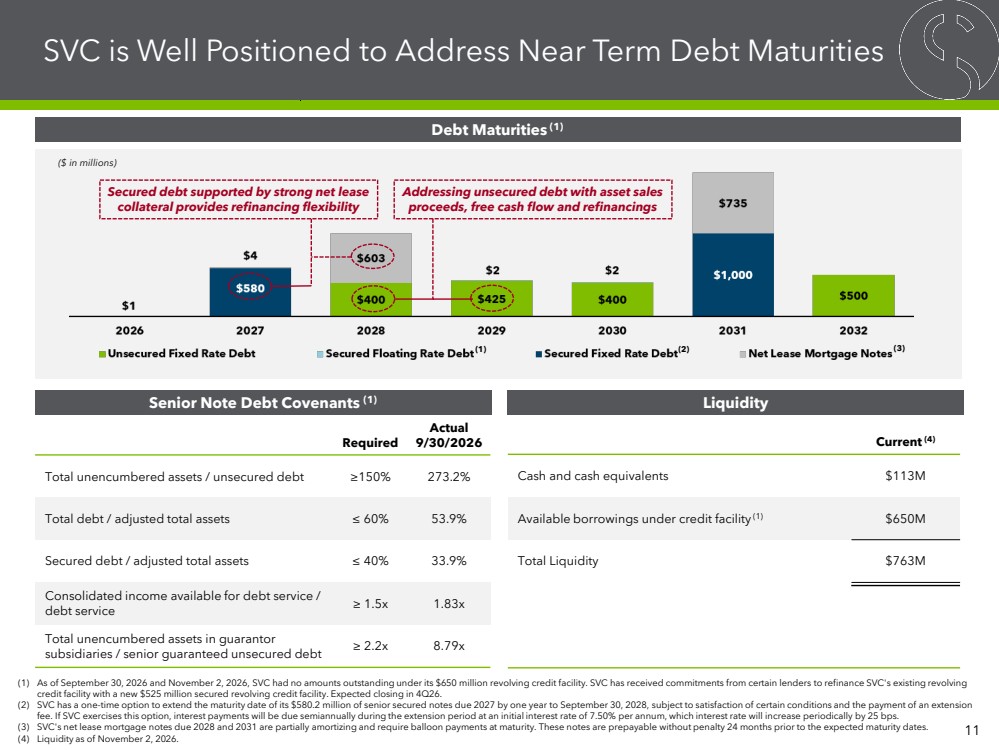
| Current(4) Cash and cash equivalents $113M Available borrowings under credit facility (1) $650M Total Liquidity $763M Required Actual 9/30/2026 Total unencumbered assets / unsecured debt ≥150% 273.2% Total debt / adjusted total assets ≤ 60% 53.9% Secured debt / adjusted total assets ≤ 40% 33.9% Consolidated income available for debt service / debt service ≥ 1.5x 1.83x Total unencumbered assets in guarantor subsidiaries / senior guaranteed unsecured debt ≥ 2.2x 8.79x SVC is Well Positioned to Address Near Term Debt Maturities 11 (1) As of September 30, 2026 and November 2, 2026, SVC had no amounts outstanding under its $650 million revolving credit facility. SVC has received commitments from certain lenders to refinance SVC's existing revolving credit facility with a new $525 million secured revolving credit facility. Expected closing in 4Q26. (2) SVC has a one-time option to extend the maturity date of its $580.2 million of senior secured notes due 2027 by one year to September 30, 2028, subject to satisfaction of certain conditions and the payment of an extension fee. If SVC exercises this option, interest payments will be due semiannually during the extension period at an initial interest rate of 7.50% per annum, which interest rate will increase periodically by 25 bps. (3) SVC's net lease mortgage notes due 2028 and 2031 are partially amortizing and require balloon payments at maturity. These notes are prepayable without penalty 24 months prior to the expected maturity dates. (4) Liquidity as of November 2, 2026. Debt Maturities (1) ($ in millions) Secured debt supported by strong net lease collateral provides refinancing flexibility Senior Note Debt Covenants (1) Liquidity (1) (2) (3) Addressing unsecured debt with asset sales proceeds, free cash flow and refinancings |
| Hotel Portfolio 12 |

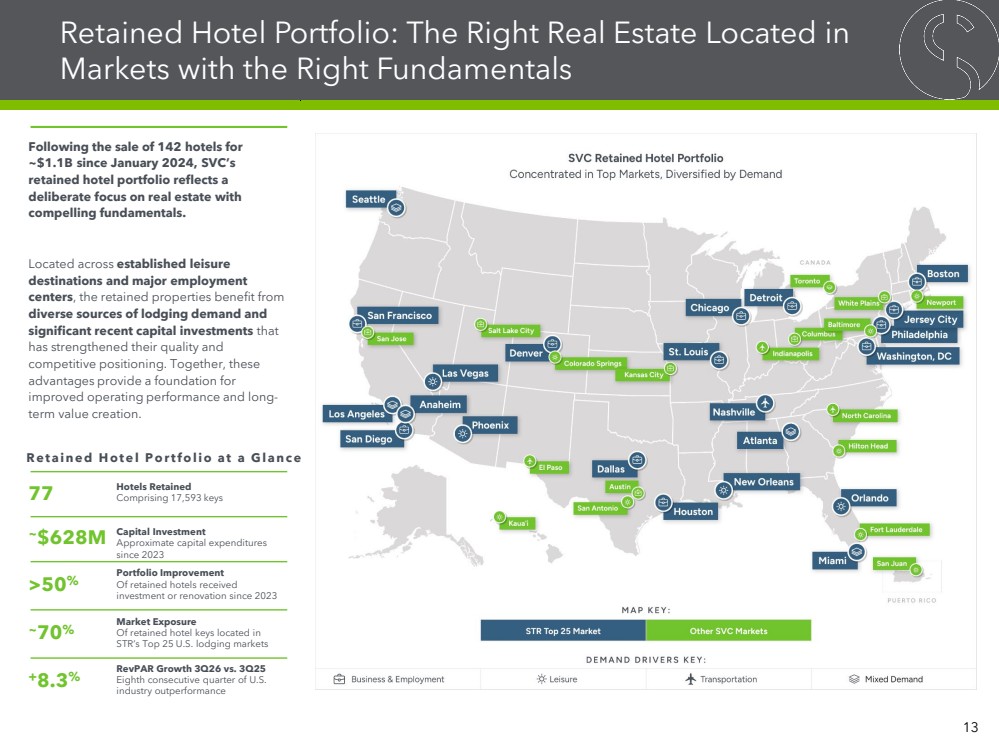
| Retained Hotel Portfolio: The Right Real Estate Located in Markets with the Right Fundamentals 13 Following the sale of 142 hotels for ~$1.1B since January 2024, SVC’s retained hotel portfolio reflects a deliberate focus on real estate with compelling fundamentals. Located across established leisure destinations and major employment centers, the retained properties benefit from diverse sources of lodging demand and significant recent capital investments that has strengthened their quality and competitive positioning. Together, these advantages provide a foundation for improved operating performance and long-term value creation. Retained Hotel Portfolio at a Glance 77 Hotels Retained Comprising 17,593 keys ~$628M Capital Investment Approximate capital expenditures since 2023 >50% Portfolio Improvement Of retained hotels received investment or renovation since 2023 ~70% Market Exposure Of retained hotel keys located in STR’s Top 25 U.S. lodging markets +8.3% RevPAR Growth 3Q26 vs. 3Q25 Eighth consecutive quarter of U.S. industry outperformance (1) |
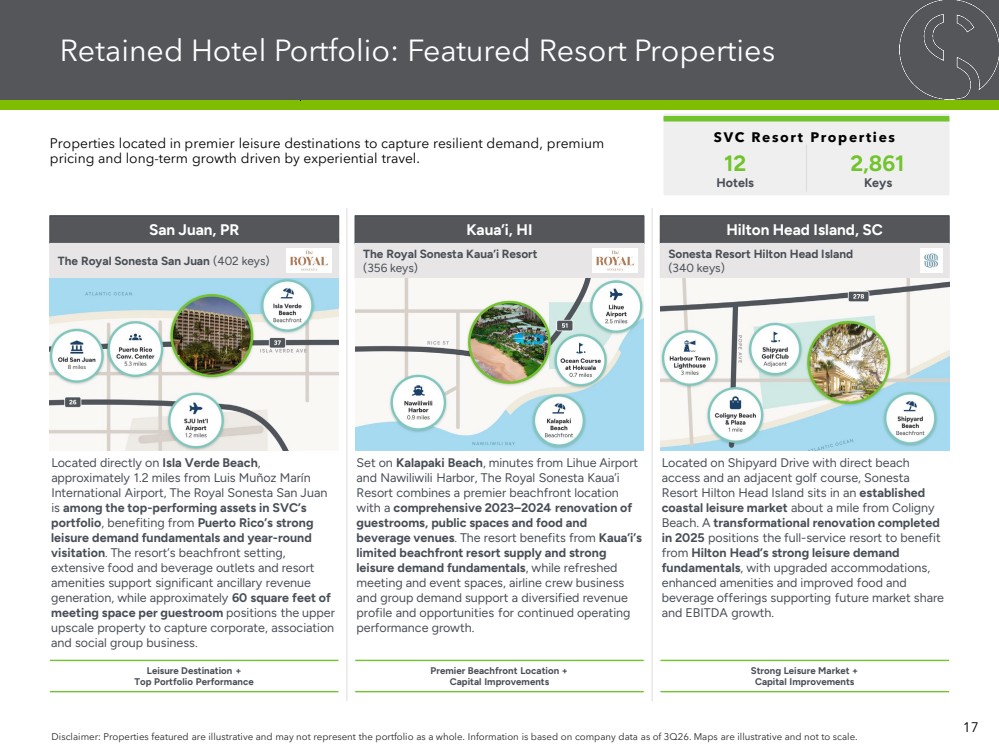
| Retained Hotel Portfolio: Featured Urban Properties 14 Jersey City, NJ Sonesta Simply Suites Jersey City (214 keys) Located in Jersey City’s vibrant waterfront district, one of New York’s most dynamic regional lodging markets, Sonesta Simply Suites offers 214 apartment-style accommodations with immediate access to Manhattan and major employment centers, including Goldman Sachs, JP Morgan Chase and the Exchange Place business district. Its extended-stay format appeals to corporate travelers seeking a more affordable, longer-term alternative to Manhattan hotels, while a 2023 guestroom renovation and a history of strong EBITDA performance reinforce its competitive positioning within this highly desirable metropolitan gateway market. Metropolitan Connectivity + Extended-Stay Profitability Toronto, ON The Yorkville Royal Sonesta Hotel (212 keys) The Yorkville Royal Sonesta Hotel occupies a prominent Bloor Street West address in Toronto’s affluent Yorkville neighborhood, directly across from the University of Toronto, steps from the Royal Ontario Museum and the luxury boutiques of the Mink Mile and minutes from Rogers Centre. A consistent performer in an A+ rated market, the upper upscale, full-service hotel draws on a diverse mix of cultural, academic, retail, sports and corporate demand generators, delivering steady occupancy while anchoring SVC’s presence in Canada. Premier Neighborhood + Consistent Profitability Chicago, IL The Royal Sonesta Chicago Riverfront (381 keys) The Royal Sonesta Chicago Downtown is located on East Wacker Drive along the Chicago River, within the city’s central business district, a STR Top 25 U.S. lodging market, with the Chicago Riverwalk at its doorstep and Millennium Park and the Magnificent Mile within half a mile. A 2021 renovation, a premier riverfront location in the heart of downtown Chicago and proximity to the city’s leading corporate, leisure and convention demand generators position the hotel to benefit from diversified year-round demand. Central Business District + Recent Renovation Well-located urban hotel properties in major gateway markets supported by diversified demand drivers and limited reliance on inbound international travel. Disclaimer: Properties featured are illustrative and may not represent the portfolio as a whole. Information is based on company data as of 3Q26. Maps are illustrative and not to scale. 22 Hotels 6,759 Keys SVC Urban Properties |
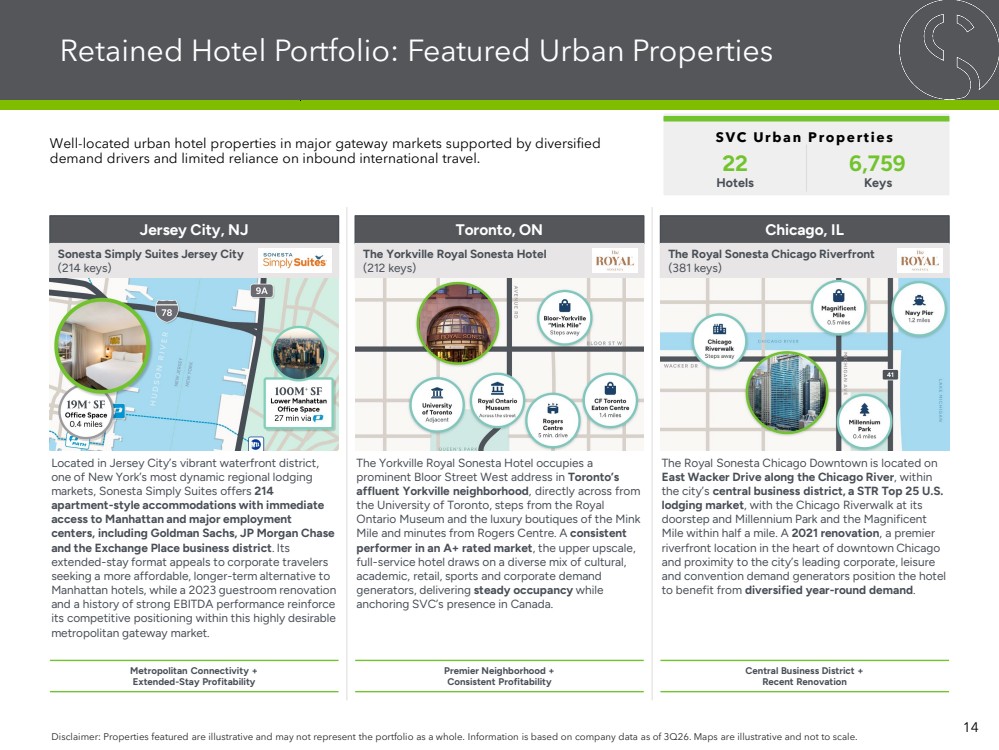
| Retained Hotel Portfolio: Featured Suburban Properties 15 Properties located in high-growth, residentially dense markets to capture steady demand from business travelers, local events and extended-stay guests. 25 Hotels 4,153 Keys SVC Suburban Properties Disclaimer: Properties featured are illustrative and may not represent the portfolio as a whole. Information is based on company data as of 3Q26. Maps are illustrative and not to scale. White Plains, NY Sonesta White Plains (403 keys) Sonesta White Plains is strategically positioned in the heart of Downtown White Plains, one of the New York metropolitan area’s most established suburban business centers. Benefiting from proximity to numerous corporate headquarters, regional office tenants and affluent Westchester County demand generators, the hotel serves a diverse mix of corporate, group and social business. A transformational 2024 renovation modernized guestrooms, meeting facilities and public spaces, enhancing the property’s competitive positioning and supporting continued market share gains and post-renovation EBITDA growth. Established Business Market + Capital Improvements Atlanta, GA Hyatt Place Atlanta Cobb Galleria (123 keys) Renovated in 2024, Hyatt Place Atlanta Cobb Galleria is positioned within Atlanta’s Cumberland district with access to The Battery Atlanta, Truist Park (home of the Braves Baseball team), Cobb Galleria Centre, as well as major corporate offices. Its recently renovated product and strong competitive market share, reflected in a 120.3 RevPAR Index, demonstrate the potential of well-located, select-service hotels serving diverse business and leisure demand. Diversified Demand + Demonstrated Market Share Sunnyvale, CA Radisson Hotel Sunnyvale (180 keys) Radisson Hotel Sunnyvale is located in the Moffett Park district in the heart of Silicon Valley, within the Santa Clara/Sunnyvale/Milpitas submarket, where hotel demand has grown every year since 2021 with historically limited new supply. Minutes from major technology campuses, the Santa Clara Convention Center and Levi’s Stadium, the hotel has demonstrated consistent market share outperformance and is well positioned to benefit from ongoing technology sector investment and employment growth across Silicon Valley. Silicon Valley Demand + Demonstrated Market Share |
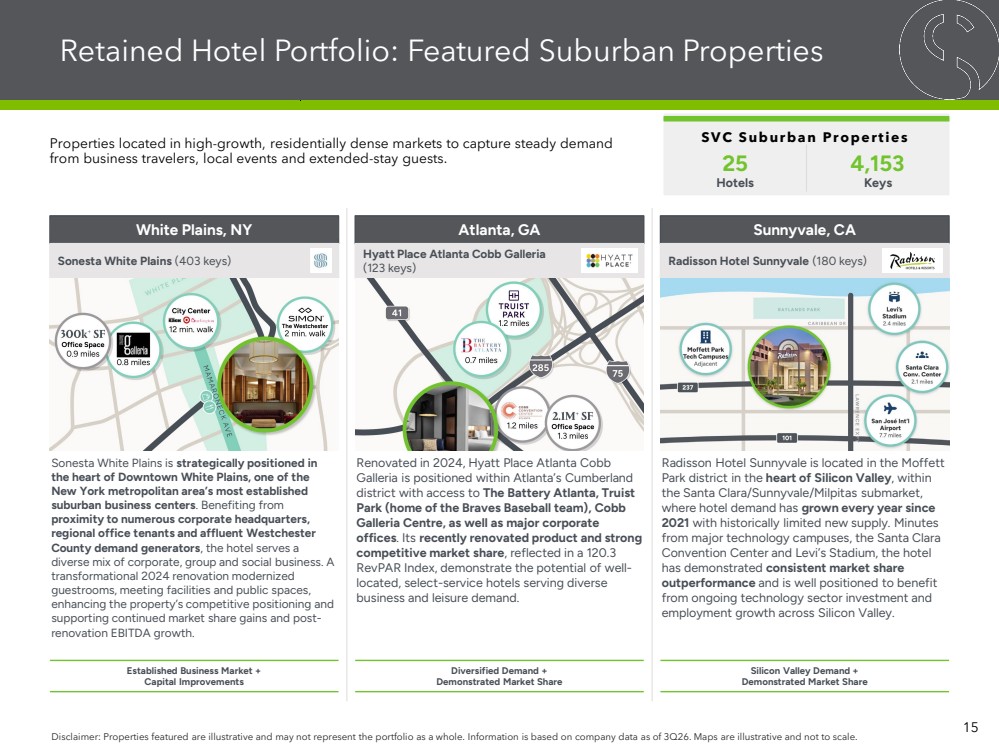
| Retained Hotel Portfolio: Featured Airport Properties 16 Properties in strategic airport-adjacent locations to capture consistent demand from business travelers, airline crews and overnight passengers. Disclaimer: Properties featured are illustrative and may not represent the portfolio as a whole. Information is based on company data as of 3Q26. Maps are illustrative and not to scale. Seattle, WA Radisson Seattle Airport (204 keys) Within walking distance of Seattle-Tacoma International Airport and steps from the Link light rail, Radisson Seattle Airport benefits from an established airline crew base that supports consistent demand and EBITDA contribution. With no new hotel supply in the submarket since 2021, anticipated demand growth and a strong leadership and sales team, the hotel continues to outperform its competitive set while capturing business travelers, airline crews and overnight passengers. Airport Connectivity + Consistent Crew Demand Miami, FL Sonesta Miami Airport (309 keys) Sonesta Miami Airport is located on N.W. LeJeune Road, approximately 1.5 miles from Miami International Airport and minutes from Coral Gables and Downtown Miami, in a strong, high-occupancy market. A 2024 renovation that included approximately 1,200 square feet of added meeting space, together with a tenured leadership team, supports strong transient and contract demand, with additional revenue and earnings growth potential as the hotel realizes the full benefits of its recent renovation. High-Occupancy Market + Capital Improvements Orlando, FL Hyatt Place Orlando Airport Northwest (134 keys) Hyatt Place Orlando Airport Northwest features fully renovated guestrooms and public areas following its 2024 renovation, positioning the hotel to capitalize on demand generated by Orlando International Airport, Port Canaveral and the region’s expanding tourism economy. Convenient access via the Beachline Expressway supports a broad mix of transient, airline crew and cruise-related demand, creating a diversified revenue profile and opportunities for continued operating performance growth. Airport Proximity + Diverse Transient Demand 18 Hotels 3,820 Keys SVC Airport Properties |
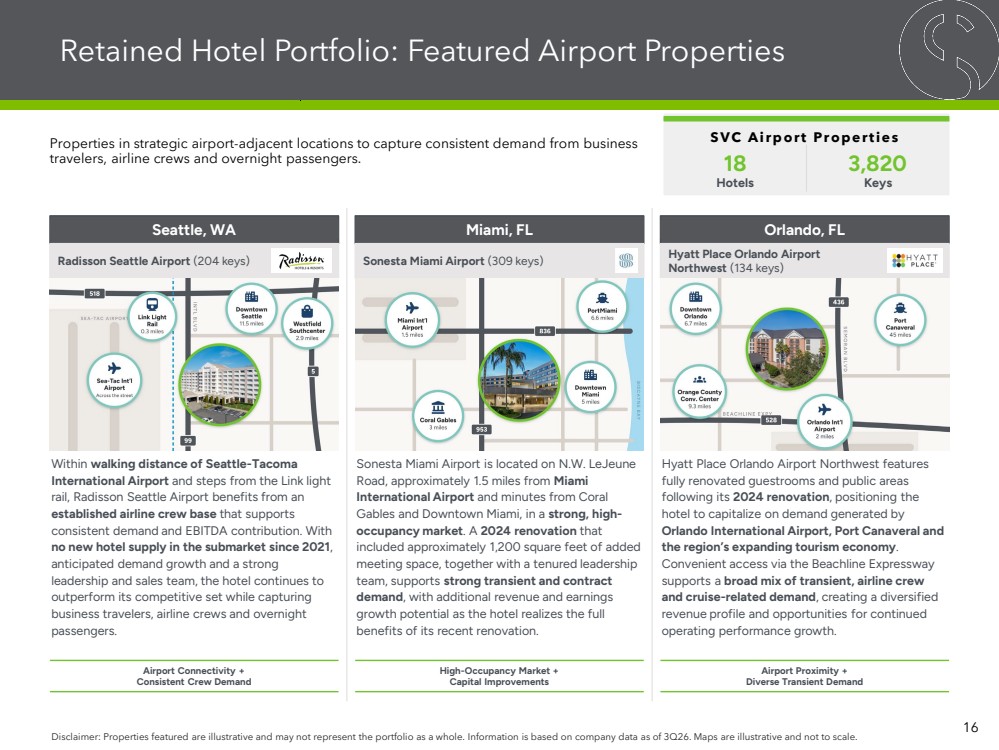
| Retained Hotel Portfolio: Featured Resort Properties 17 Properties located in premier leisure destinations to capture resilient demand, premium pricing and long-term growth driven by experiential travel. Disclaimer: Properties featured are illustrative and may not represent the portfolio as a whole. Information is based on company data as of 3Q26. Maps are illustrative and not to scale. San Juan, PR The Royal Sonesta San Juan (402 keys) Located directly on Isla Verde Beach, approximately 1.2 miles from Luis Muñoz Marín International Airport, The Royal Sonesta San Juan is among the top-performing assets in SVC’s portfolio, benefiting from Puerto Rico’s strong leisure demand fundamentals and year-round visitation. The resort’s beachfront setting, extensive food and beverage outlets and resort amenities support significant ancillary revenue generation, while approximately 60 square feet of meeting space per guestroom positions the upper upscale property to capture corporate, association and social group business. Leisure Destination + Top Portfolio Performance Kaua’i, HI The Royal Sonesta Kaua’i Resort (356 keys) Set on Kalapaki Beach, minutes from Lihue Airport and Nawiliwili Harbor, The Royal Sonesta Kaua’i Resort combines a premier beachfront location with a comprehensive 2023–2024 renovation of guestrooms, public spaces and food and beverage venues. The resort benefits from Kaua’i’s limited beachfront resort supply and strong leisure demand fundamentals, while refreshed meeting and event spaces, airline crew business and group demand support a diversified revenue profile and opportunities for continued operating performance growth. Premier Beachfront Location + Capital Improvements Hilton Head Island, SC Sonesta Resort Hilton Head Island (340 keys) Located on Shipyard Drive with direct beach access and an adjacent golf course, Sonesta Resort Hilton Head Island sits in an established coastal leisure market about a mile from Coligny Beach. A transformational renovation completed in 2025 positions the full-service resort to benefit from Hilton Head’s strong leisure demand fundamentals, with upgraded accommodations, enhanced amenities and improved food and beverage offerings supporting future market share and EBITDA growth. Strong Leisure Market + Capital Improvements 12 Hotels 2,861 Keys SVC Resort Properties |
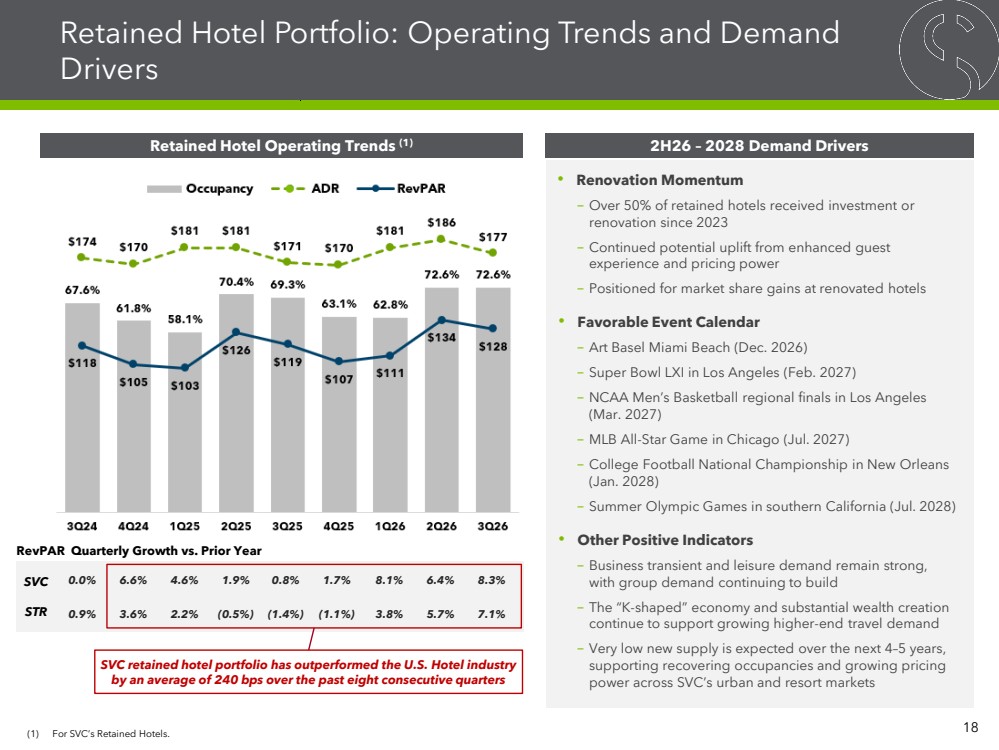
| Retained Hotel Portfolio: Operating Trends and Demand Drivers (1) For SVC’s Retained Hotels. 0.0% 6.6% 4.6% 1.9% 0.8% 1.7% 8.1% 6.4% 8.3% 0.9% 3.6% 2.2% (0.5%) (1.4%) (1.1%) 3.8% 5.7% 7.1% SVC RevPAR Quarterly Growth vs. Prior Year STR Retained Hotel Operating Trends (1) SVC retained hotel portfolio has outperformed the U.S. Hotel industry by an average of 240 bps over the past eight consecutive quarters 2H26 – 2028 Demand Drivers • Renovation Momentum – Over 50% of retained hotels received investment or renovation since 2023 – Continued potential uplift from enhanced guest experience and pricing power – Positioned for market share gains at renovated hotels • Favorable Event Calendar – Art Basel Miami Beach (Dec. 2026) – Super Bowl LXI in Los Angeles (Feb. 2027) – NCAA Men’s Basketball regional finals in Los Angeles (Mar. 2027) – MLB All-Star Game in Chicago (Jul. 2027) – College Football National Championship in New Orleans (Jan. 2028) – Summer Olympic Games in southern California (Jul. 2028) • Other Positive Indicators – Business transient and leisure demand remain strong, with group demand continuing to build – The “K-shaped” economy and substantial wealth creation continue to support growing higher-end travel demand – Very low new supply is expected over the next 4–5 years, supporting recovering occupancies and growing pricing power across SVC’s urban and resort markets 18 |
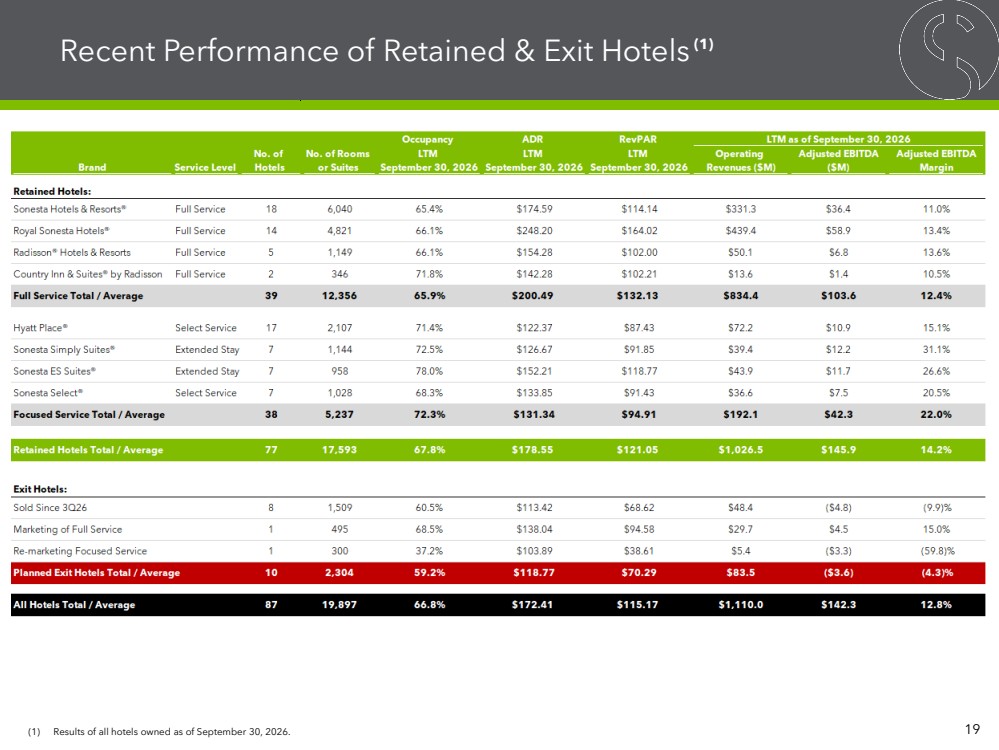
| Recent Performance of Retained & Exit Hotels (1) Results of all hotels owned as of September 30, 2026. 19 (1) |
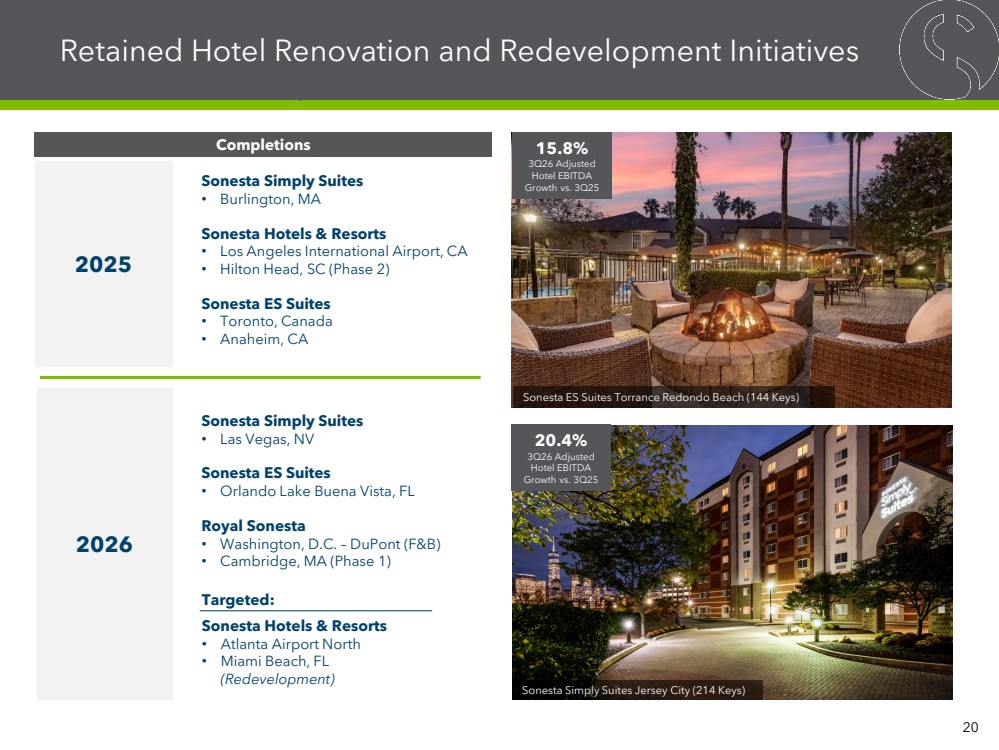
| Retained Hotel Renovation and Redevelopment Initiatives 2025 Sonesta Simply Suites • Burlington, MA Sonesta Hotels & Resorts • Los Angeles International Airport, CA • Hilton Head, SC (Phase 2) Sonesta ES Suites • Toronto, Canada • Anaheim, CA 20 Completions 2026 Sonesta Simply Suites • Las Vegas, NV Sonesta ES Suites • Orlando Lake Buena Vista, FL Royal Sonesta • Washington, D.C. – DuPont (F&B) • Cambridge, MA (Phase 1) Targeted: Sonesta Hotels & Resorts • Atlanta Airport North • Miami Beach, FL (Redevelopment) 15.8% 3Q26 Adjusted Hotel EBITDA Growth vs. 3Q25 Sonesta ES Suites Torrance Redondo Beach (144 Keys) Sonesta Simply Suites Jersey City (214 Keys) 20.4% 3Q26 Adjusted Hotel EBITDA Growth vs. 3Q25 |
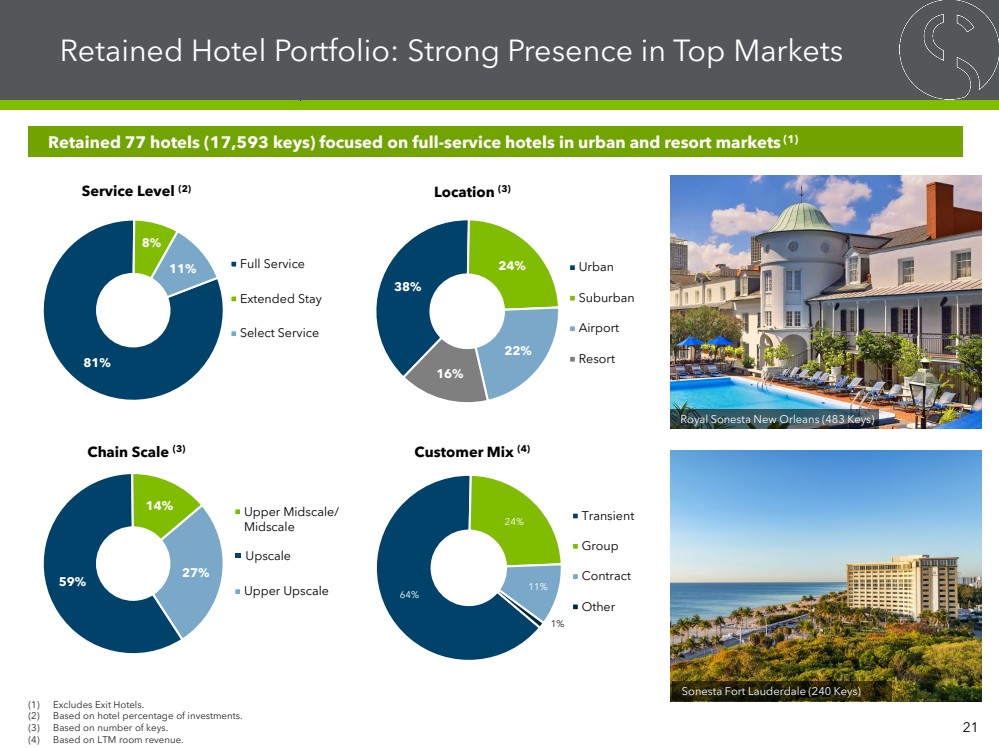
| Retained Hotel Portfolio: Strong Presence in Top Markets 81% 8% 11% Full Service Extended Stay Select Service 59% 14% 27% Upper Midscale/ Midscale Upper Upscale Chain Scale (3) 38% 24% 22% 16% Urban Suburban Airport Resort Location (3) 64% 24% 11% 1% Transient Group Contract Other Customer Mix (4) Service Level (2) Retained 77 hotels (17,593 keys) focused on full-service hotels in urban and resort markets (1) Upscale (1) Excludes Exit Hotels. (2) Based on hotel percentage of investments. (3) Based on number of keys. (4) Based on LTM room revenue. 21 Royal Sonesta New Orleans (483 Keys) Sonesta Fort Lauderdale (240 Keys) |
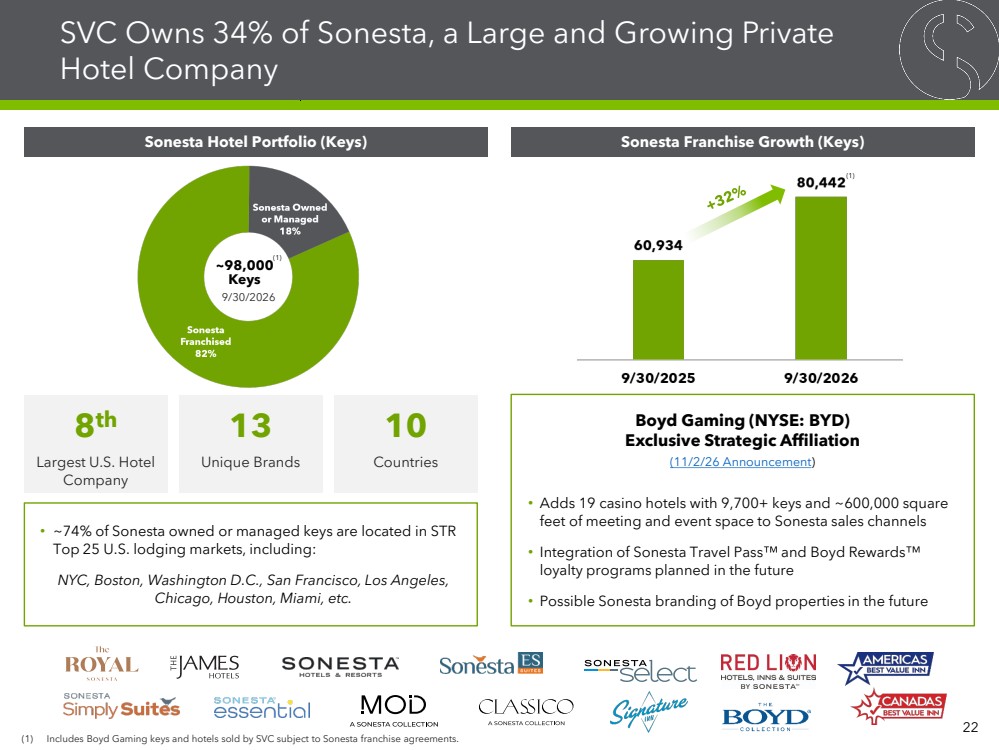
| SVC Owns 34% of Sonesta, a Large and Growing Private Hotel Company 22 8th Largest U.S. Hotel Company 13 Unique Brands ~98,000 Keys 9/30/2026 10 Countries Sonesta Franchise Growth (Keys) Boyd Gaming (NYSE: BYD) Exclusive Strategic Affiliation (11/2/26 Announcement) • Adds 19 casino hotels with 9,700+ keys and ~600,000 square feet of meeting and event space to Sonesta sales channels • Integration of Sonesta Travel Pass and Boyd Rewards loyalty programs planned in the future • Possible Sonesta branding of Boyd properties in the future • ~74% of Sonesta owned or managed keys are located in STR Top 25 U.S. lodging markets, including: NYC, Boston, Washington D.C., San Francisco, Los Angeles, Chicago, Houston, Miami, etc. Sonesta Hotel Portfolio (Keys) (1) (1) (1) Includes Boyd Gaming keys and hotels sold by SVC subject to Sonesta franchise agreements. |
| Net Lease Portfolio 23 |

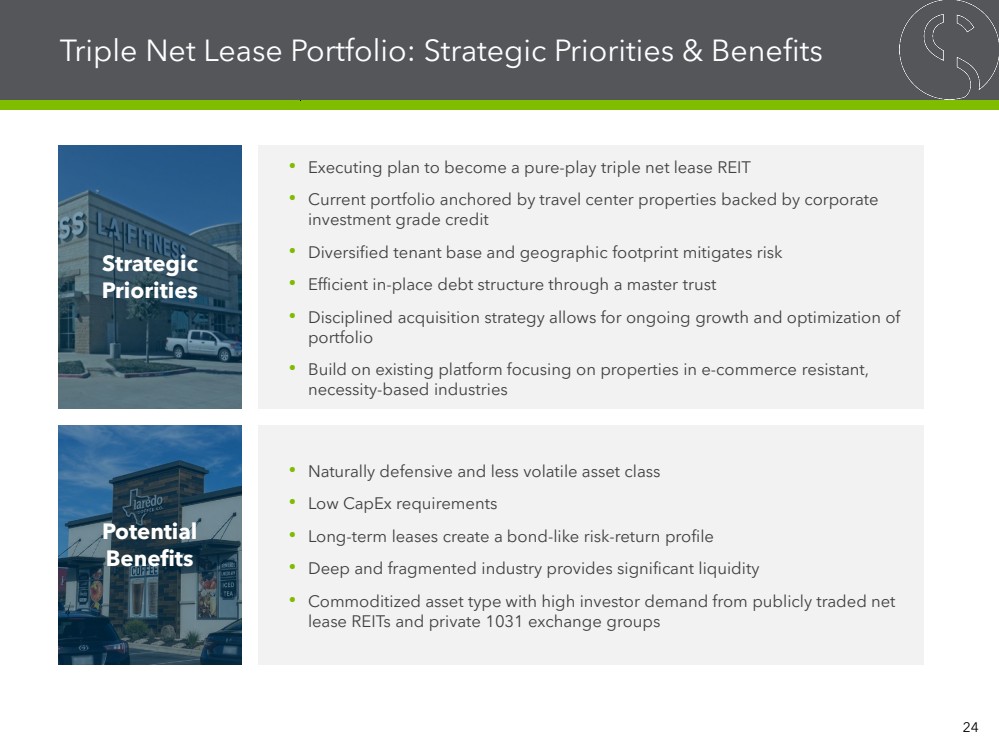
| Potential Benefits Strategic Priorities Triple Net Lease Portfolio: Strategic Priorities & Benefits • Executing plan to become a pure-play triple net lease REIT • Current portfolio anchored by travel center properties backed by corporate investment grade credit • Diversified tenant base and geographic footprint mitigates risk • Efficient in-place debt structure through a master trust • Disciplined acquisition strategy allows for ongoing growth and optimization of portfolio • Build on existing platform focusing on properties in e-commerce resistant, necessity-based industries • Naturally defensive and less volatile asset class • Low CapEx requirements • Long-term leases create a bond-like risk-return profile • Deep and fragmented industry provides significant liquidity • Commoditized asset type with high investor demand from publicly traded net lease REITs and private 1031 exchange groups 24 |
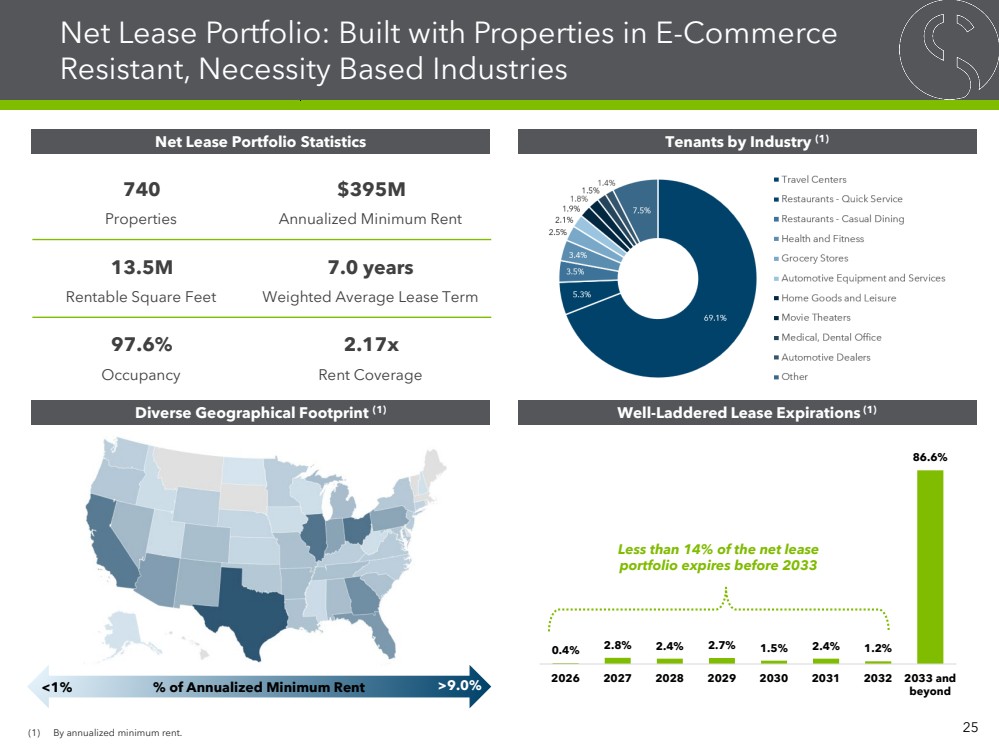
| 0.4% 2.8% 2.4% 2.7% 1.5% 2.4% 1.2% 86.6% 2026 2027 2028 2029 2030 2031 2032 2033 and beyond (1) By annualized minimum rent. Net Lease Portfolio: Built with Properties in E-Commerce Resistant, Necessity Based Industries 740 $395M Properties Annualized Minimum Rent 13.5M 7.0 years Rentable Square Feet Weighted Average Lease Term 97.6% 2.17x Occupancy Rent Coverage <1% % of Annualized Minimum Rent >9.0% Diverse Geographical Footprint (1) Net Lease Portfolio Statistics Tenants by Industry (1) 25 Well-Laddered Lease Expirations (1) Less than 14% of the net lease portfolio expires before 2033 |
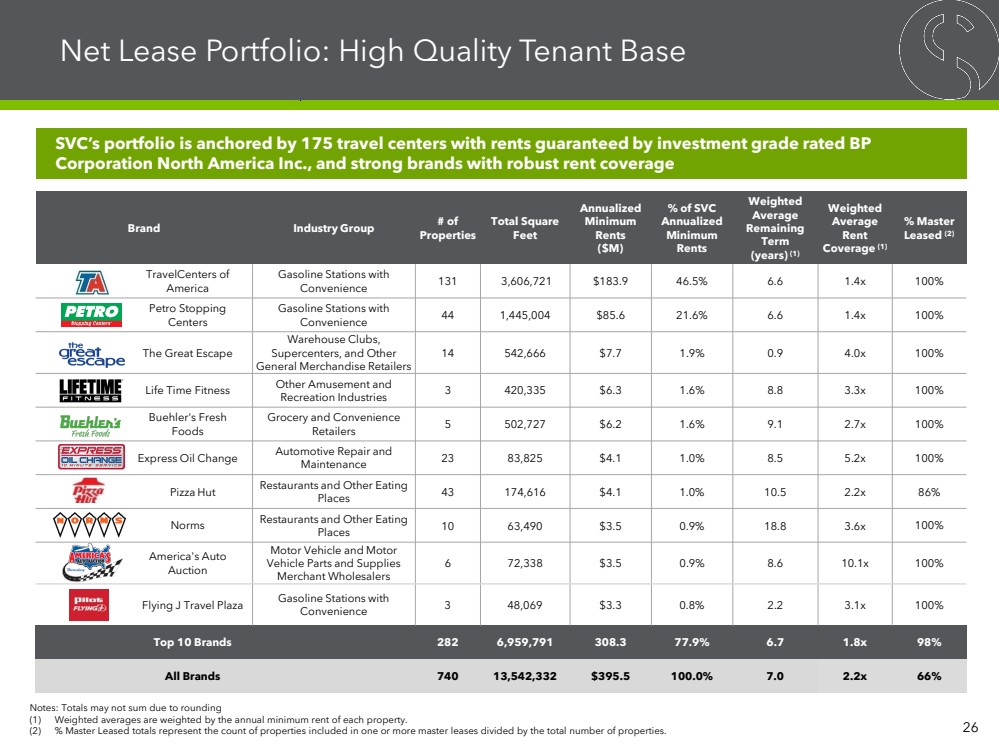
| Net Lease Portfolio: High Quality Tenant Base 26 Brand Industry Group # of Properties Total Square Feet Annualized Minimum Rents ($M) % of SVC Annualized Minimum Rents Weighted Average Remaining Term (years) (1) Weighted Average Rent Coverage (1) % Master Leased (2) TravelCenters of America Gasoline Stations with Convenience 131 3,606,721 $183.9 46.5% 6.6 1.4x 100% Petro Stopping Centers Gasoline Stations with Convenience 44 1,445,004 $85.6 21.6% 6.6 1.4x 100% The Great Escape Warehouse Clubs, Supercenters, and Other General Merchandise Retailers 14 542,666 $7.7 1.9% 0.9 4.0x 100% Life Time Fitness Other Amusement and Recreation Industries 3 420,335 $6.3 1.6% 8.8 3.3x 100% Buehler's Fresh Foods Grocery and Convenience Retailers 5 502,727 $6.2 1.6% 9.1 2.7x 100% Express Oil Change Automotive Repair and Maintenance 23 83,825 $4.1 1.0% 8.5 5.2x 100% Pizza Hut Restaurants and Other Eating Places 43 174,616 $4.1 1.0% 10.5 2.2x 86% Norms Restaurants and Other Eating Places 10 63,490 $3.5 0.9% 18.8 3.6x 100% America's Auto Auction Motor Vehicle and Motor Vehicle Parts and Supplies Merchant Wholesalers 6 72,338 $3.5 0.9% 8.6 10.1x 100% Flying J Travel Plaza Gasoline Stations with Convenience 3 48,069 $3.3 0.8% 2.2 3.1x 100% Top 10 Brands 282 6,959,791 308.3 77.9% 6.7 1.8x 98% All Brands 740 13,542,332 $395.5 100.0% 7.0 2.2x 66% Notes: Totals may not sum due to rounding (1) Weighted averages are weighted by the annual minimum rent of each property. (2) % Master Leased totals represent the count of properties included in one or more master leases divided by the total number of properties. SVC’s portfolio is anchored by 175 travel centers with rents guaranteed by investment grade rated BP Corporation North America Inc., and strong brands with robust rent coverage |
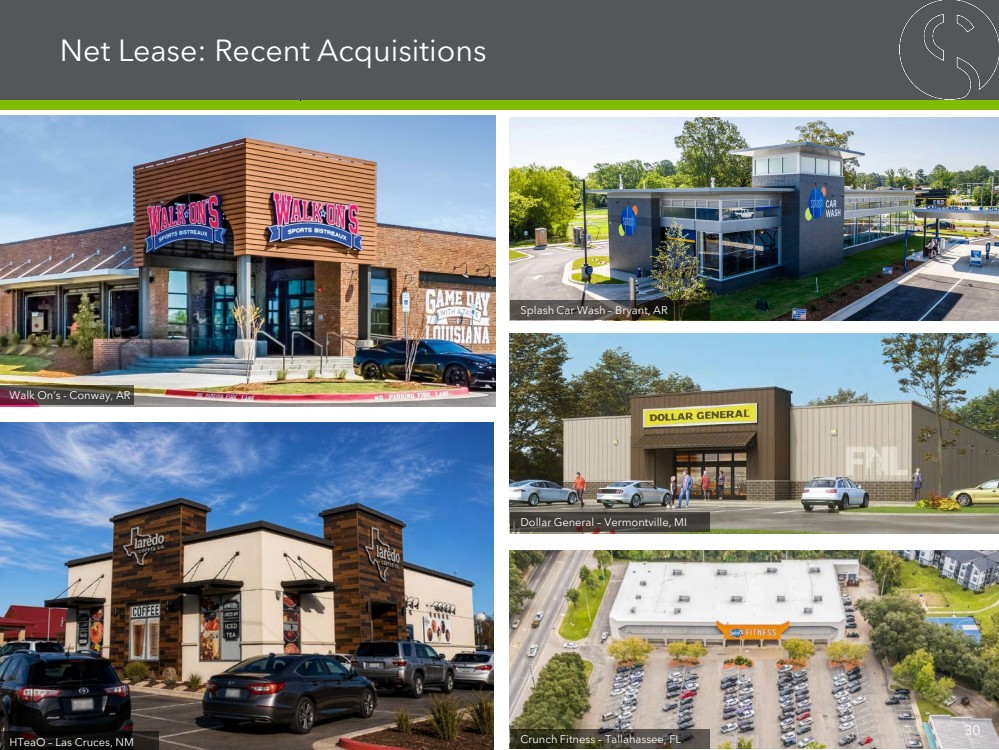
| TA’s Competitive Advantage 27 Typical SVC TA travel center spans ~25 acres with key infrastructure, facilities and amenities TA’s Competitive Advantage Sample TA Travel Centers Larger • Sites average ~25 acres of land and offer parking for ~182 trucks and cars, as well as ~9 fueling positions • The largest competitor sites are 9 to 13 acres of land and offer parking for ~84 trucks and cars and average ~8 fueling bays Drives Increased Traffic Volume and Ability to Offer Alternative Energy Options 1 More Robust Truck Service Ecosystem • Full suite of truck repair and maintenance facilities • Emergency roadside services via TA’s RoadSquad team Promotes Customer and Fleet Loyalty and Increases Traffic Volume 2 More Driver Amenities • More extensive amenities than competitor sites, such as showers, laundry area, fitness center, entertainment options, Wi-Fi internet access and parking reservation systems Drives Increased Traffic Volume and Profitability 3 Broader Non-Fuel Offering • A typical TA travel center typically includes one large travel store, one full service restaurant and one or more quick service restaurants • Compared to competitors, TA sites boast more restaurant options, as well as more fulsome travel store inventory Transforms Superior Traffic Volume into Improved Profitability 4 Potential Benefits |
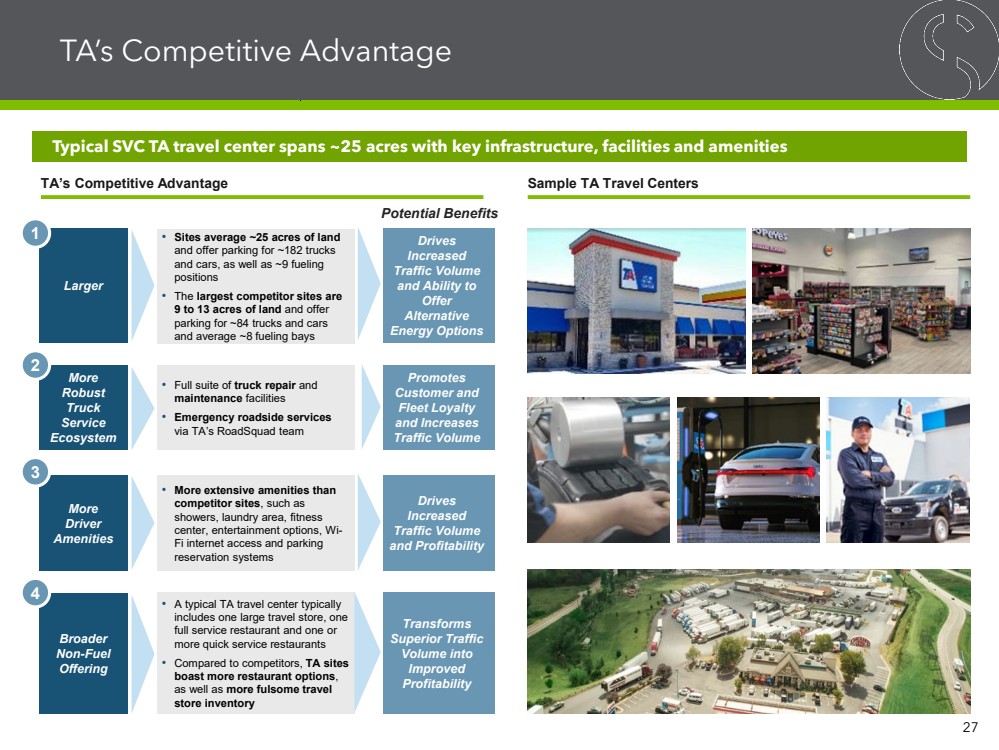
| SVC’s Master Trust Provides Efficient and Cost-Effective Net Lease Financing (1) 28 Master Trust Collateral Pool Snapshot Master Trust Overview Most recent issuance date March 2026 Outstanding series 2023-1, 2026-1 Ratings AAA / AA / A / BBB Current LTV 62% Current debt service coverage ratio (DSCR) 1.70x Next anticipated repayment date February 2028 Master Trust Industry Mix (2) Number of properties 471 Number of tenants 155 Number of brands 119 Occupancy 98.9% Annualized Minimum Rent $153M Weighted average remaining lease term 7.8 years Diversified form of financing with a unique investor base in the Asset-Backed Securities market (1) As of September 30, 2026. (2) Based on annualized minimum rent. ABS Financing • Strong asset base financed through the ABS market • Proven issuer of AAA-rated notes • Net lease represents a small share of ABS market, supporting strong investor demand • Refinancing flexibility with 24-month prepayment windows |
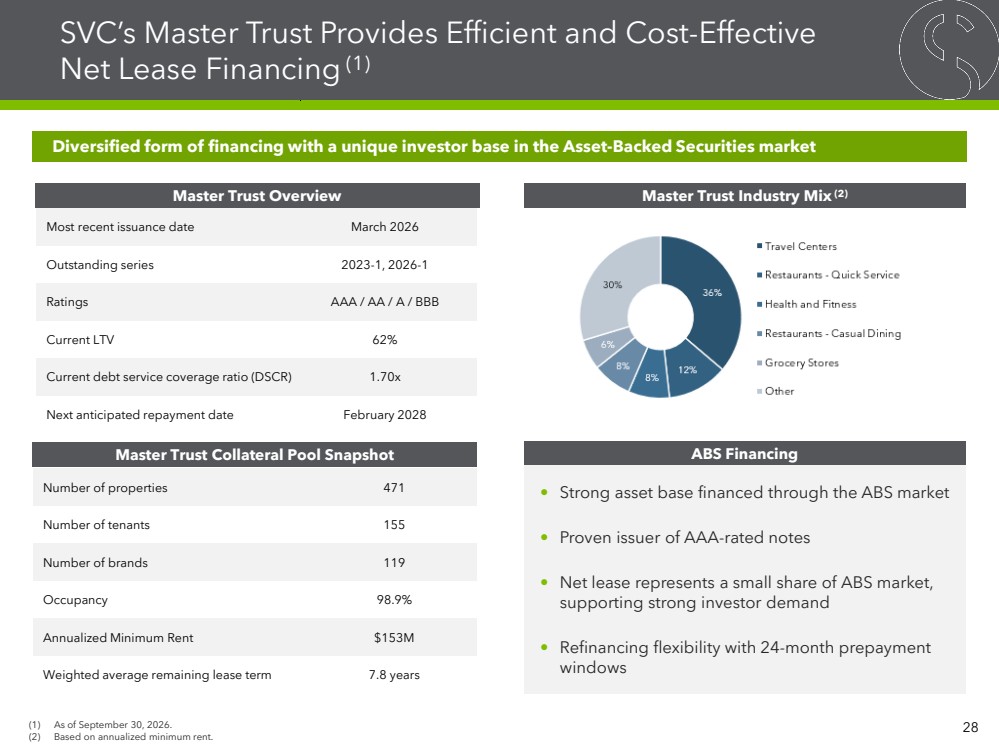
| SVC’s Unencumbered Net Lease Properties May Unlock Incremental Liquidity 29 Leasing opportunities and capital recycling strategies may drive added value and liquidity Properties 124 Occupancy 83.9% WALT 5.1 years Square Footage 2.7M SF Annualized Minimum Rent $24.7M Rent Coverage 3.1x Unencumbered Net Lease Portfolio Industry Mix (1) (1) Based on annualized minimum rent. Liquidity Initiatives Unencumbered Net Lease Portfolio Metrics Unencumbered Net Lease Portfolio Expirations (1) • Active leasing initiatives to enhance value and financing potential • Targeted dispositions of non-core assets and certain industry exposures |
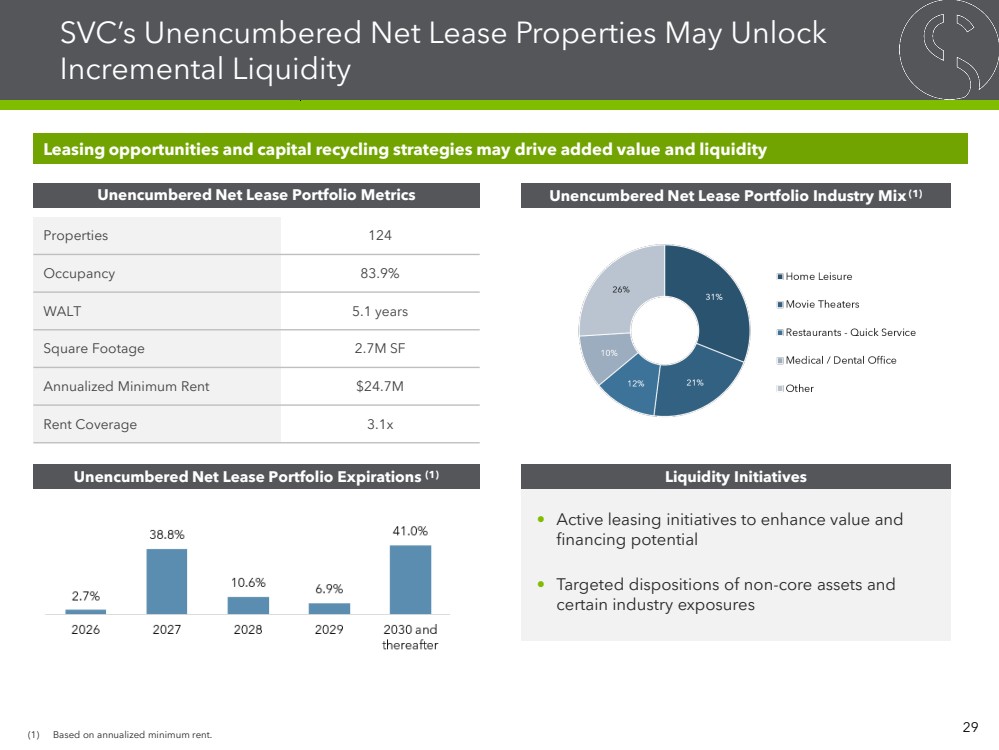
| Net Lease: Recent Acquisitions 30 HTeaO – Las Cruces, NM Walk On’s - Conway, AR Crunch Fitness – Tallahassee, FL Splash Car Wash – Bryant, AR Dollar General – Vermontville, MI |
| Appendix 31 |

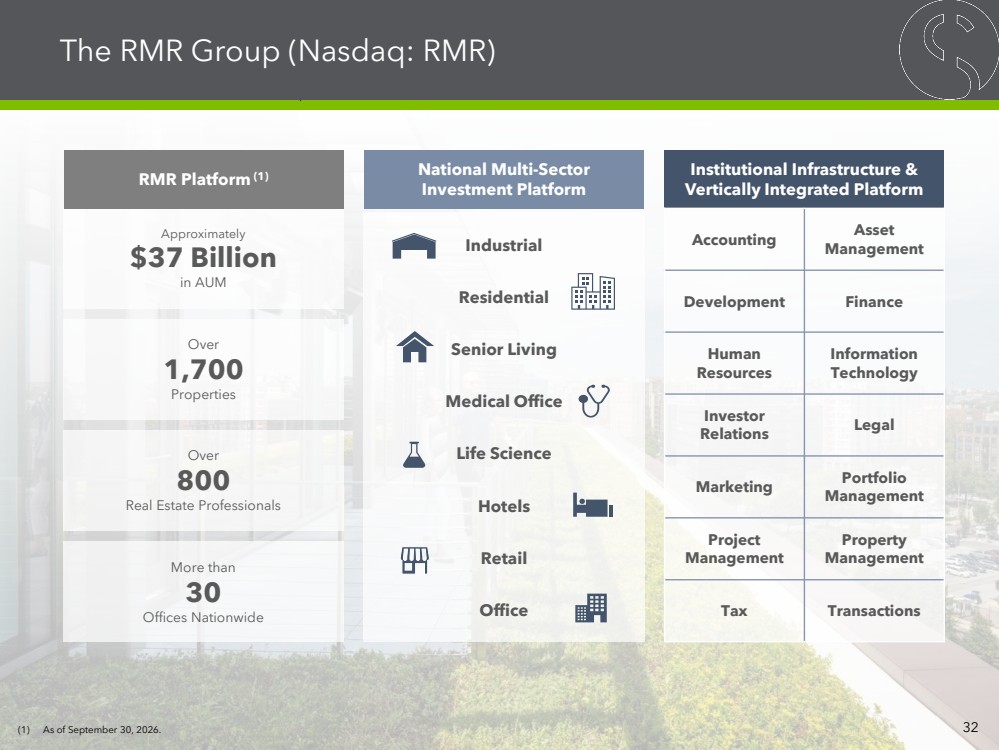
| Approximately $37 Billion in AUM RMR Platform (1) Over 1,700 Properties More than 30 Offices Nationwide National Multi-Sector Investment Platform Industrial Residential Senior Living Medical Office Life Science Hotels Retail Office Over 800 Real Estate Professionals Institutional Infrastructure & Vertically Integrated Platform Accounting Asset Management Development Finance Human Resources Information Technology Investor Relations Legal Marketing Portfolio Management Project Management Property Management Tax Transactions The RMR Group (Nasdaq: RMR) (1) As of September 30, 2026. 32 |
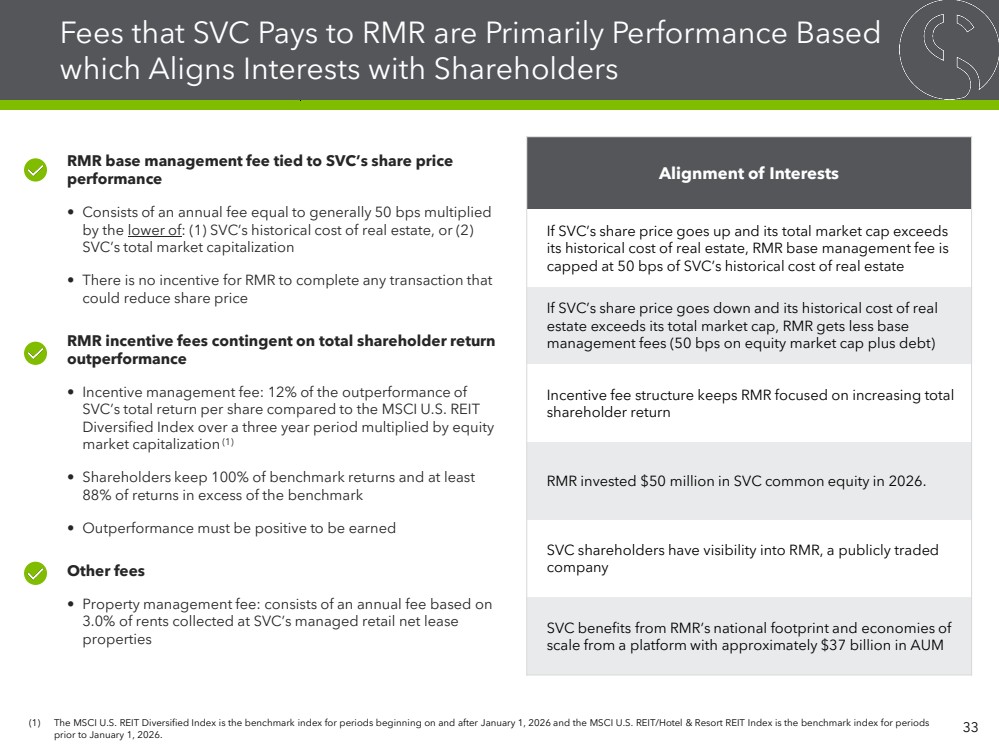
| Fees that SVC Pays to RMR are Primarily Performance Based which Aligns Interests with Shareholders RMR base management fee tied to SVC’s share price performance • Consists of an annual fee equal to generally 50 bps multiplied by the lower of: (1) SVC’s historical cost of real estate, or (2) SVC’s total market capitalization • There is no incentive for RMR to complete any transaction that could reduce share price RMR incentive fees contingent on total shareholder return outperformance • Incentive management fee: 12% of the outperformance of SVC’s total return per share compared to the MSCI U.S. REIT Diversified Index over a three year period multiplied by equity market capitalization(1) • Shareholders keep 100% of benchmark returns and at least 88% of returns in excess of the benchmark • Outperformance must be positive to be earned Other fees • Property management fee: consists of an annual fee based on 3.0% of rents collected at SVC’s managed retail net lease properties Alignment of Interests If SVC’s share price goes up and its total market cap exceeds its historical cost of real estate, RMR base management fee is capped at 50 bps of SVC’s historical cost of real estate If SVC’s share price goes down and its historical cost of real estate exceeds its total market cap, RMR gets less base management fees (50 bps on equity market cap plus debt) Incentive fee structure keeps RMR focused on increasing total shareholder return RMR invested $50 million in SVC common equity in 2026. SVC shareholders have visibility into RMR, a publicly traded company SVC benefits from RMR’s national footprint and economies of scale from a platform with approximately $37 billion in AUM 33 (1) The MSCI U.S. REIT Diversified Index is the benchmark index for periods beginning on and after January 1, 2026 and the MSCI U.S. REIT/Hotel & Resort REIT Index is the benchmark index for periods prior to January 1, 2026. |
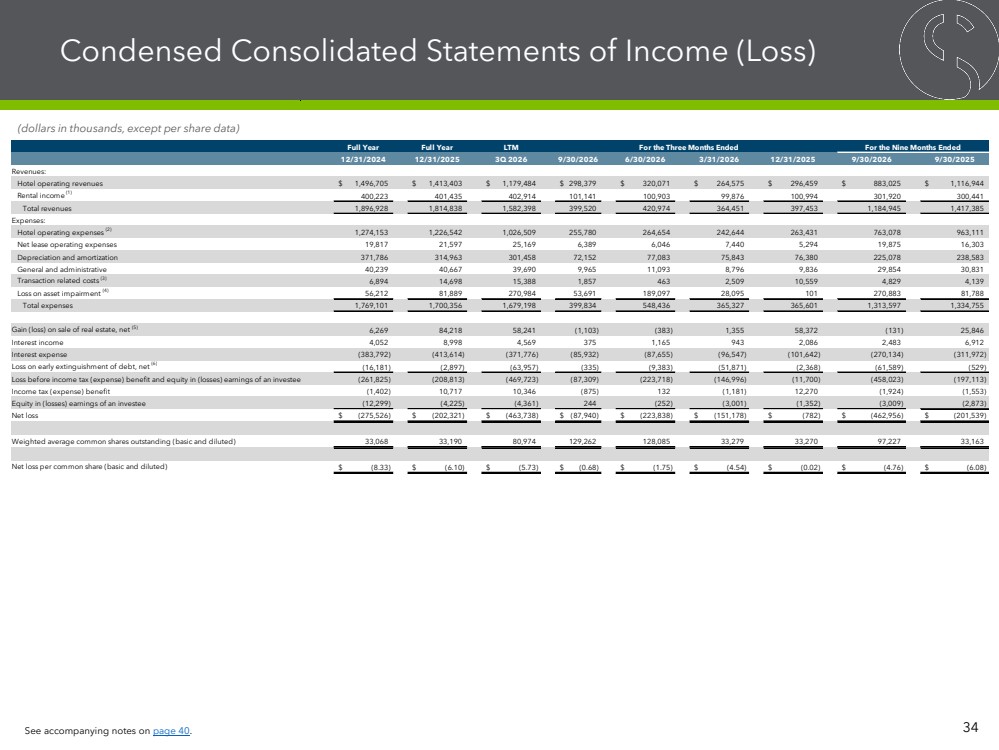
| Condensed Consolidated Statements of Income (Loss) 34 (dollars in thousands, except per share data) See accompanying notes on page 40. Full Year Full Year LTM 12/31/2024 12/31/2025 3Q 2026 9/30/2026 6/30/2026 3/31/2026 12/31/2025 9/30/2026 9/30/2025 Revenues: Hotel operating revenues $ 1,496,705 $ 1,413,403 $ 1,179,484 $ 298,379 $ 320,071 $ 264,575 $ 296,459 $ 883,025 $ 1,116,944 Rental income (1) 400,223 401,435 402,914 101,141 100,903 99,876 100,994 301,920 300,441 Total revenues 1,896,928 1,814,838 1,582,398 399,520 420,974 364,451 397,453 1,184,945 1,417,385 Expenses: Hotel operating expenses (2) 1,274,153 1,226,542 1,026,509 255,780 264,654 242,644 263,431 763,078 963,111 Net lease operating expenses 19,817 21,597 25,169 6,389 6,046 7,440 5,294 19,875 16,303 Depreciation and amortization 371,786 314,963 301,458 72,152 77,083 75,843 76,380 225,078 238,583 General and administrative 40,239 40,667 39,690 9,965 11,093 8,796 9,836 29,854 30,831 Transaction related costs (3) 6,894 14,698 15,388 1,857 463 2,509 10,559 4,829 4,139 Loss on asset impairment (4) 56,212 81,889 270,984 53,691 189,097 28,095 101 270,883 81,788 Total expenses 1,769,101 1,700,356 1,679,198 399,834 548,436 365,327 365,601 1,313,597 1,334,755 Gain (loss) on sale of real estate, net (5) 6,269 84,218 58,241 (1,103) (383) 1,355 58,372 (131) 25,846 Interest income 4,052 8,998 4,569 375 1,165 943 2,086 2,483 6,912 Interest expense (383,792) (413,614) (371,776) (85,932) (87,655) (96,547) (101,642) (270,134) (311,972) Loss on early extinguishment of debt, net (6) (16,181) (2,897) (63,957) (335) (9,383) (51,871) (2,368) (61,589) (529) Loss before income tax (expense) benefit and equity in (losses) earnings of an investee (261,825) (208,813) (469,723) (87,309) (223,718) (146,996) (11,700) (458,023) (197,113) Income tax (expense) benefit (1,402) 10,717 10,346 (875) 132 (1,181) 12,270 (1,924) (1,553) Equity in (losses) earnings of an investee (12,299) (4,225) (4,361) 244 (252) (3,001) (1,352) (3,009) (2,873) Net loss $ (275,526) $ (202,321) $ (463,738) $ (87,940) $ (223,838) $ (151,178) $ (782) $ (462,956) $ (201,539) Weighted average common shares outstanding (basic and diluted) 33,068 33,190 80,974 129,262 128,085 33,279 33,270 97,227 33,163 Net loss per common share (basic and diluted) $ (8.33) $ (6.10) $ (5.73) $ (0.68) $ (1.75) $ (4.54) $ (0.02) $ (4.76) $ (6.08) For the Three Months Ended For the Nine Months Ended |
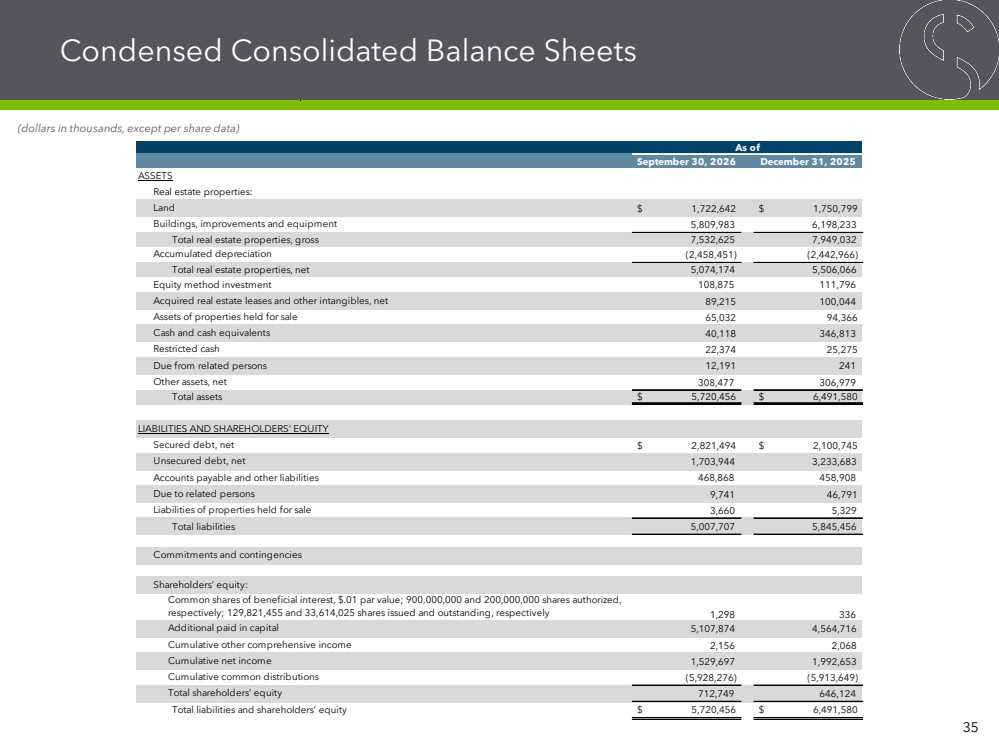
| Condensed Consolidated Balance Sheets 35 (dollars in thousands, except per share data) September 30, 2026 December 31, 2025 $ 1,722,642 $ 1,750,799 5,809,983 6,198,233 Total real estate properties, gross 7,532,625 7,949,032 (2,458,451) (2,442,966) Total real estate properties, net 5,074,174 5,506,066 108,875 111,796 89,215 100,044 65,032 94,366 40,118 346,813 22,374 25,275 12,191 241 308,477 306,979 Total assets $ 5,720,456 $ 6,491,580 $ 2,821,494 $ 2,100,745 1,703,944 3,233,683 468,868 458,908 9,741 46,791 3,660 5,329 Total liabilities 5,007,707 5,845,456 1,298 336 5,107,874 4,564,716 2,156 2,068 1,529,697 1,992,653 (5,928,276) (5,913,649) 712,749 646,124 Total liabilities and shareholders’ equity $ 5,720,456 $ 6,491,580 Cumulative common distributions Total shareholders’ equity As of Commitments and contingencies Shareholders’ equity: Common shares of beneficial interest, $.01 par value; 900,000,000 and 200,000,000 shares authorized, respectively; 129,821,455 and 33,614,025 shares issued and outstanding, respectively Additional paid in capital Cumulative other comprehensive income Cumulative net income Accounts payable and other liabilities Due to related persons Liabilities of properties held for sale Due from related persons Other assets, net LIABILITIES AND SHAREHOLDERS' EQUITY Secured debt, net Unsecured debt, net Equity method investment Acquired real estate leases and other intangibles, net Assets of properties held for sale Cash and cash equivalents Restricted cash ASSETS Real estate properties: Land Buildings, improvements and equipment Accumulated depreciation |
| Calculation of FFO, Normalized FFO and CAD 36 (amounts in thousands, except per share data) Full Year Full Year LTM 12/31/2024 12/31/2025 3Q 2026 9/30/2026 6/30/2026 3/31/2026 12/31/2025 9/30/2026 9/30/2025 Net loss $ (275,526) $ (202,321) $ (463,738) $ (87,940) $ (223,838) $ (151,178) $ (782) $ (462,956) $ (201,539) Add (Less): Depreciation and amortization 371,786 314,963 301,458 72,152 77,083 75,843 76,380 225,078 238,583 Loss (gain) on sale of real estate, net (5) (6,269) (84,218) (58,241) 1,103 383 (1,355) (58,372) 131 (25,846) Loss on asset impairment (4) 56,212 81,889 270,984 53,691 189,097 28,095 101 270,883 81,788 Adjustments to reflect SVC's share of FFO attributable to an investee 4,347 4,641 4,815 1,184 1,217 1,268 1,146 3,669 3,495 FFO 150,550 114,954 55,278 40,190 43,942 (47,327) 18,473 36,805 96,481 Add (Less): Loss on early extinguishment of debt, net (6) 16,181 2,897 63,957 335 9,383 51,871 2,368 61,589 529 Transaction related costs (3) 6,894 14,698 15,388 1,857 463 2,509 10,559 4,829 4,139 Adjustments to reflect SVC's share of Normalized FFO attributable to an investee 2,777 3,570 5,455 1,457 1,236 392 2,370 3,085 1,200 Deferred tax liability - (6,235) (6,235) - - - (6,235) - - Normalized FFO 176,402 129,884 133,843 43,839 55,024 7,445 27,535 106,308 102,349 Add (Less): Non-cash revenues (49,280) (42,818) (38,035) (9,026) (9,937) (9,225) (9,847) (28,188) (32,971) Non-cash interest expense 31,127 46,337 75,300 18,964 18,822 18,849 18,665 56,635 27,672 Non-cash expenses (2,448) (2,356) (2,347) (323) (166) (1,029) (829) (1,518) (1,527) SVC’s share of Normalized FFO attributable to an investee 5,175 (3,986) (5,909) (2,885) (2,201) 1,341 (2,164) (3,745) (1,822) Principal amortization (1,958) (1,957) (2,976) (999) (999) (489) (489) (2,487) (1,468) Recurring capital expenditures (293,428) (216,040) (147,313) (17,460) (18,092) (16,597) (95,164) (52,149) (120,876) CAD $ (134,410) $ (90,936) $ 12,563 $ 32,110 $ 42,451 $ 295 $ (62,293) $ 74,856 $ (28,643) Weighted average common shares outstanding (basic and diluted) 33,068 33,190 80,974 129,262 128,085 33,279 33,270 97,227 33,163 Basic and diluted per common share amounts: Net loss $ (8.33) $ (6.10) $ (5.73) $ (0.68) $ (1.75) $ (4.54) $ (0.02) $ (4.76) $ (6.08) FFO $ 4.55 $ 3.46 $ 0.68 $ 0.31 $ 0.34 $ (1.42) $ 0.56 $ 0.38 $ 2.91 Normalized FFO $ 5.33 $ 3.91 $ 1.65 $ 0.34 $ 0.43 $ 0.22 $ 0.83 $ 1.09 $ 3.09 CAD $ (4.06) $ (2.74) $ 0.16 $ 0.25 $ 0.33 $ 0.01 $ (1.87) $ 0.77 $ (0.86) For the Three Months Ended For the Nine Months Ended See accompanying notes on page 40. |
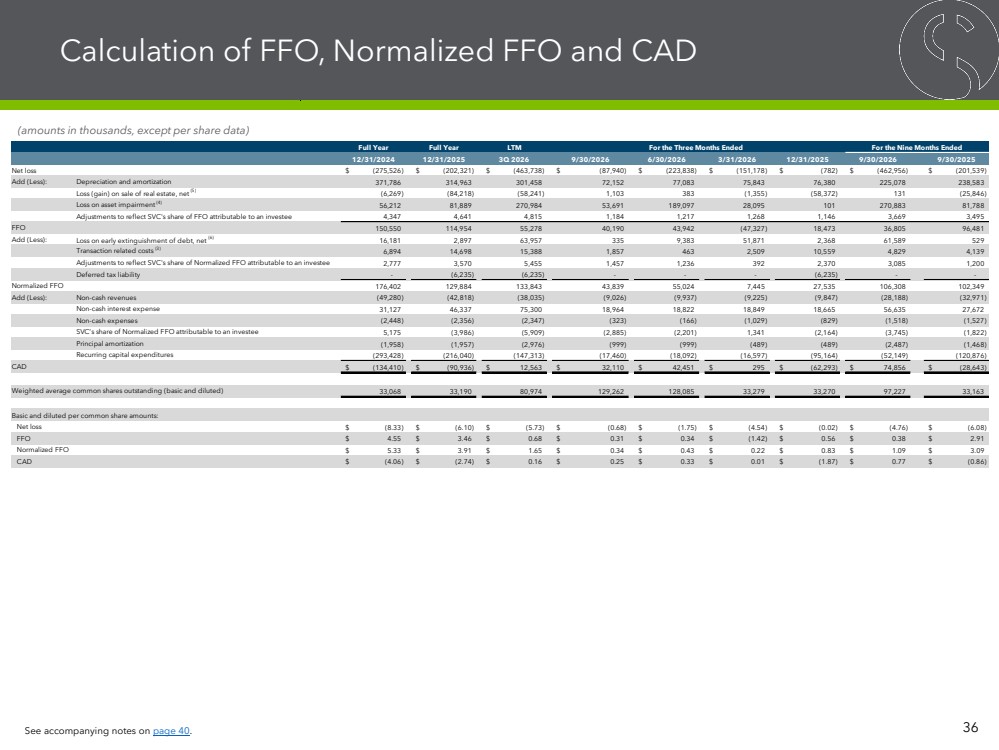
| Calculation of EBITDA, EBITDAre and Adjusted EBITDAre 37 (amounts in thousands) LTM 3Q 2026 9/30/2026 6/30/2026 3/31/2026 12/31/2025 9/30/2026 9/30/2025 Net loss $ (463,738) $ (87,940) $ (223,838) $ (151,178) $ (782) $ (462,956) $ (201,539) Add (Less): Interest expense 371,776 85,932 87,655 96,547 101,642 270,134 311,972 Income tax (benefit) expense (10,346) 875 (132) 1,181 (12,270) 1,924 1,553 Depreciation and amortization 301,458 72,152 77,083 75,843 76,380 225,078 238,583 EBITDA 199,150 71,019 (59,232) 22,393 164,970 34,180 350,569 Add (Less): Loss on asset impairment (4) 270,984 53,691 189,097 28,095 101 270,883 81,788 (Gain) loss on sale of real estate, net (5) (58,241) 1,103 383 (1,355) (58,372) 131 (25,846) Adjustments to reflect SVC's share of EBITDAre attributable to an investee 11,994 2,816 3,160 3,059 2,959 9,035 9,212 EBITDAre 423,887 128,629 133,408 52,192 109,658 314,229 415,723 Add (Less): Loss on early extinguishment of debt, net (6) 63,957 335 9,383 51,871 2,368 61,589 529 Adjustments to reflect SVC's share of Adjusted EBITDAre attributable to an investee 5,455 1,457 1,236 392 2,370 3,085 1,200 Transaction related costs (3) 15,388 1,857 463 2,509 10,559 4,829 4,139 General and administrative expense paid in common shares 3,721 1,194 1,351 488 688 3,033 3,024 Adjusted EBITDAre $ 512,408 $ 133,472 $ 145,841 $ 107,452 $ 125,643 $ 386,765 $ 424,615 Adjusted Hotel EBITDA $ 139,788 $ 39,910 $ 54,056 $ 17,928 $ 27,894 $ 111,894 $ 141,486 Adjusted Net Lease EBITDAre 377,745 94,752 94,857 92,436 95,700 282,045 284,138 (Less) plus: Corporate Adjustments (5,125) (1,190) (3,072) (2,912) 2,049 (7,174) (1,009) Adjusted EBITDAre $ 512,408 $ 133,472 $ 145,841 $ 107,452 $ 125,643 $ 386,765 $ 424,615 For the Three Months Ended For the Nine Months Ended See accompanying notes on page 40. |
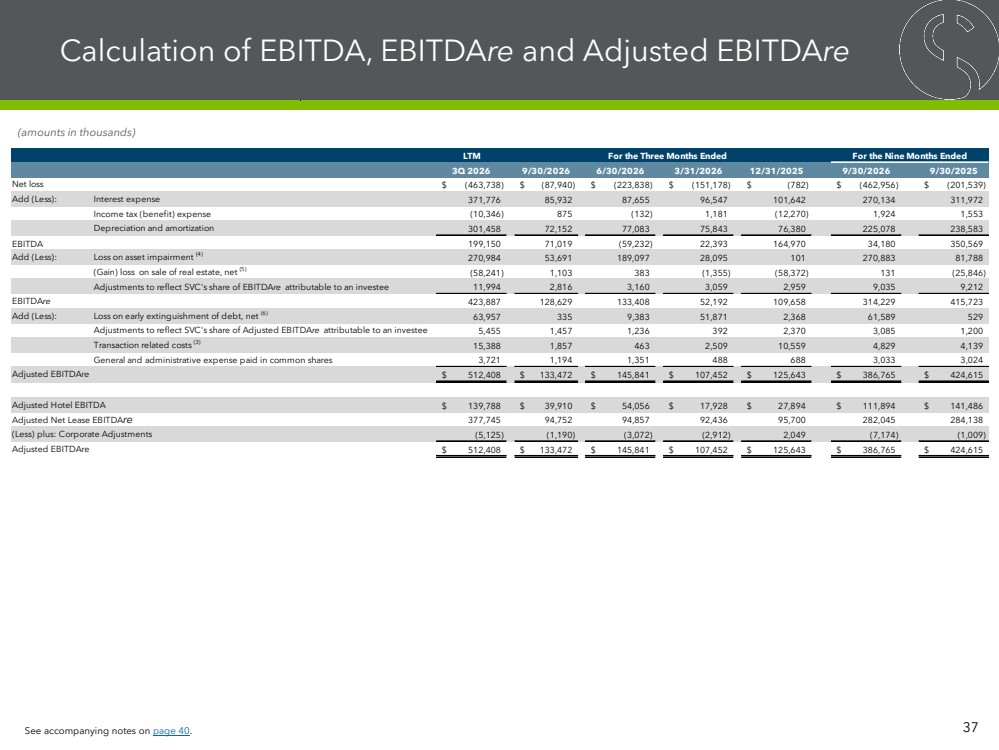
| Calculation and Reconciliation of Hotel EBITDA and Adjusted Hotel EBITDA – All Hotels* * Results of all hotels as owned during the periods presented, including the results of hotels sold by SVC for the periods owned by SVC. 38 (dollars in thousands) LTM 3Q 2026 9/30/2026 6/30/2026 3/31/2026 12/31/2025 9/30/2026 9/30/2025 Number of hotels 87 87 93 93 94 87 160 Room revenues $ 898,438 $ 232,419 $ 243,574 $ 197,565 $ 224,880 $ 673,558 $ 897,412 Food and beverage revenues 197,187 44,048 53,980 48,282 50,877 146,310 152,253 Other revenues 83,859 21,912 22,517 18,728 20,702 63,157 67,279 Hotel operating revenues 1,179,484 298,379 320,071 264,575 296,459 883,025 1,116,944 Room expenses 301,180 74,648 76,054 67,112 83,366 217,814 303,877 Food and beverage expenses 166,691 40,178 44,338 40,305 41,870 124,821 126,318 Other direct and indirect expenses 442,332 108,980 109,047 104,777 119,528 322,804 404,148 Management fees 41,097 10,520 11,051 9,129 10,397 30,700 41,802 Real estate taxes, insurance and other 98,740 24,018 26,128 26,251 22,343 76,397 99,006 FF&E Reserves 6,361 1,789 1,822 1,556 1,194 5,167 5,531 Hotel operating expenses 1,056,401 260,133 268,440 249,130 278,698 777,703 980,682 Hotel EBITDA 123,083 38,246 51,631 15,445 17,761 105,322 136,262 Transaction related costs (3) 16,705 1,664 2,425 2,483 10,133 6,572 5,224 Adjusted Hotel EBITDA $ 139,788 $ 39,910 $ 54,056 $ 17,928 $ 27,894 $ 111,894 $ 141,486 Adjusted Hotel EBITDA Margin 11.9% 13.4% 16.9% 6.8% 9.4% 12.7% 12.7% Hotel operating expenses (GAAP) $ 1,026,509 $ 255,780 $ 264,654 $ 242,644 $ 263,431 $ 763,078 $ 963,111 Add (Less): Transaction related costs (3) 16,705 1,664 2,425 2,483 10,133 6,572 5,224 Adjustments for guaranty fundings (replenishments), net (2) 4,342 279 (1,082) 1,826 3,319 1,023 4,953 FF&E Reserves from managed hotel operations 6,361 1,789 1,822 1,556 1,194 5,167 5,531 Other (7) 2,484 621 621 621 621 1,863 1,863 Hotel operating expenses $ 1,056,401 $ 260,133 $ 268,440 $ 249,130 $ 278,698 $ 777,703 $ 980,682 For the Three Months Ended For the Nine Months Ended See accompanying notes on page 40. |
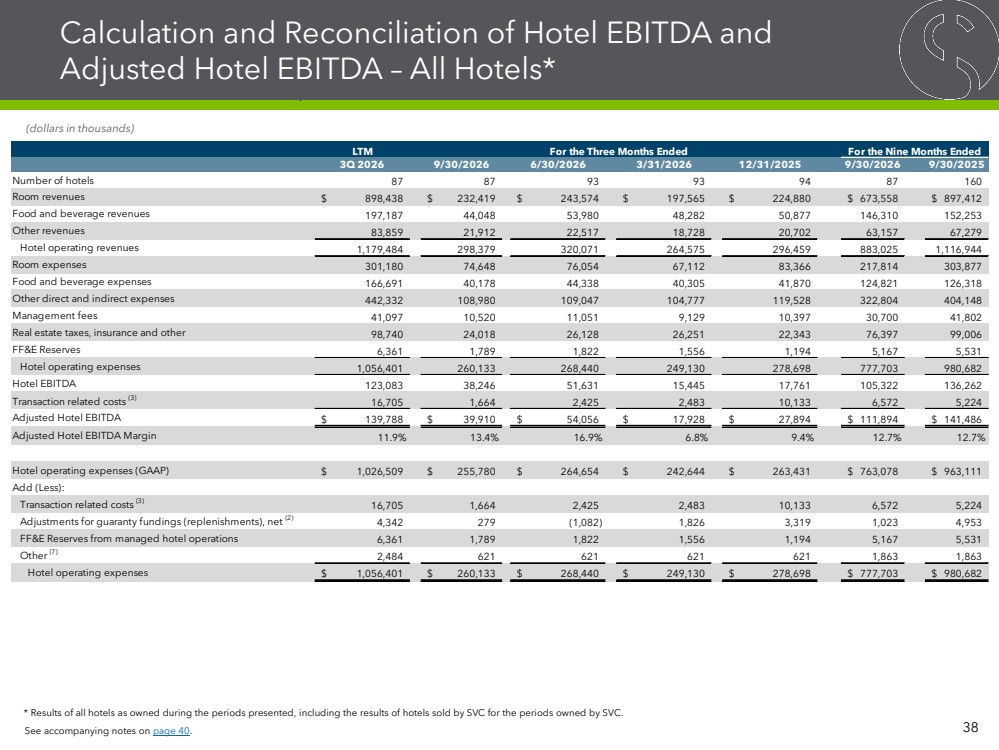
| Calculation and Reconciliation of NOI and Cash Basis NOI for Net Lease Properties 39 (dollars in thousands) LTM 3Q 2026 9/30/2026 6/30/2026 3/31/2026 12/31/2025 9/30/2026 9/30/2025 Calculation of NOI: Rental income (GAAP) (1) $ 402,914 $ 101,141 $ 100,903 $ 99,876 $ 100,994 $ 301,920 $ 300,441 Net lease operating expenses (GAAP) 25,169 6,389 6,046 7,440 5,294 19,875 16,303 NOI $ 377,745 $ 94,752 $ 94,857 $ 92,436 $ 95,700 $ 282,045 $ 284,138 Reconciliation of Cash Basis NOI: NOI $ 377,745 $ 94,752 $ 94,857 $ 92,436 $ 95,700 $ 282,045 $ 284,138 Less: Non-cash revenues 6,440 938 1,808 1,360 2,334 4,106 8,479 Cash Basis NOI $ 371,305 $ 93,814 $ 93,049 $ 91,076 $ 93,366 $ 277,939 $ 275,659 For the Three Months Ended For the Nine Months Ended See accompanying notes on page 40. |
| Notes to Condensed Consolidated Statements of Income (Loss) and Calculations of FFO, Normalized FFO, CAD, EBITDA, EBITDAre, Adjusted EBITDAre, NOI, Cash Basis NOI, Hotel EBITDA and Adjusted Hotel EBITDA 40 (dollars in thousands) 1. SVC increased rental income by $1,009 and $2,257 for the three months ended September 30, 2026 and 2025, respectively, and increased rental income by $4,318 and $8,818 for the nine months ended September 30, 2026 and 2025, respectively, to record scheduled rent changes under certain of its leases on a straight line basis. 2. When managers of SVC's hotels are required to fund the shortfalls of owner's priority return under the terms of the management agreements or their guarantees, SVC reflects such fundings in its condensed consolidated statements of income (loss) as a reduction of hotel operating expenses. When these shortfalls are replenished by cash flows from the applicable hotel operations in excess of the owner's priority return due, SVC reflects such replenishment in its condensed consolidated statements of income (loss) as an increase to hotel operating expenses. The net change to hotel operating expenses was a decrease of $279 and $1,023 for the three and nine months ended September 30, 2026, respectively, and the net change to hotel operating expenses was a decrease of $1,480 and $4,953 for the three and nine months ended September 30, 2025, respectively. 3. Transaction related costs for the three and nine months ended September 30, 2026 of $1,857 and $4,829, respectively, primarily consist of costs related to the sale of certain hotels, partially offset by the recovery of deposits associated with certain previously terminated hotel sales. Transaction related costs for the three and nine months ended September 30, 2025, of $2,683 and $4,139, respectively, primarily consist of costs related to the sale and renovation of certain hotels, partially offset by the recovery of a working capital reserve during the three months ended March 31, 2025 related to SVC’s former agreement with Marriott International, Inc. previously deemed uncollectable and expensed in 2021. 4. SVC recorded a loss on asset impairment for the three and nine months ended September 30, 2026 of $53,691 and $270,883, respectively, to reduce the carrying value of six net lease properties and six hotels in the three month period, and 27 net lease properties and 12 hotels in the nine month period, to their estimated fair value less costs to sell. SVC recorded a loss on asset impairment for the three and nine months ended September 30, 2025 of $27,067 and $81,788, respectively, to reduce the carrying value of one net lease property and 25 hotels in the three month period, and three net lease properties and 28 hotels in the nine month period, to their estimated fair value less costs to sell. 5. SVC recorded a loss on sale of real estate for the three and nine months ended September 30, 2026 of $1,103 and $131, respectively, in connection with the sales of six net lease properties and six hotels in the three month period, and 25 net lease properties and seven hotels in the nine month period. SVC recorded a net gain on sale of real estate for the three and nine months ended September 30, 2025 of $25,256 and $25,846, respectively, in connection with the sales of three net lease properties and 40 hotels in the three month period, and 10 net lease properties and 46 hotels in the nine month period. 6. SVC recorded a net loss on early extinguishment of debt during the three and nine months ended September 30, 2026 of $335 and $61,589, respectively, in connection with make-whole premiums and the write off of unamortized deferred financing costs and discounts relating to the early redemptions of certain previously outstanding unsecured senior notes and the repayment and termination of its VFN. SVC recorded a net loss on early extinguishment of debt during the three and nine months ended September 30, 2025 of $529 in connection with the write off of unamortized deferred financing costs and discounts relating to the redemption of $350,000 of its senior unsecured notes due 2026. 7. SVC is amortizing a liability it recorded for the fair value of its initial investment in Sonesta as a reduction to hotel operating expenses in its condensed consolidated statements of income (loss). SVC reduced hotel operating expenses by $621 for each of the three months ended September 30, 2026 and 2025, related to this liability, and $1,863 for each of the nine months ended September 30, 2026 and 2025, related to this liability. |
| Non-GAAP Financial Measures and Certain Definitions Non-GAAP Financial Measures SVC presents certain “non-GAAP financial measures” within the meaning of the applicable Securities and Exchange Commission, or SEC, rules, including FFO, Normalized FFO, CAD, EBITDA, EBITDAre, Adjusted EBITDAre, NOI, Cash Basis NOI, Hotel EBITDA and Adjusted Hotel EBITDA. These measures do not represent cash generated by operating activities in accordance with GAAP and should not be considered alternatives to net income (loss) as indicators of SVC's operating performance or as measures of its liquidity. These measures should be considered in conjunction with net income (loss) as presented in SVC's condensed consolidated statements of income (loss). SVC considers these non-GAAP measures to be appropriate supplemental measures of operating performance for a REIT, along with net income (loss). SVC believes these measures provide useful information to investors because by excluding the effects of certain historical amounts, such as depreciation and amortization expense, they may facilitate a comparison of its operating performance between periods and with other REITs and, in the case of NOI, Cash Basis NOI, Hotel EBITDA and Adjusted Hotel EBITDA, reflecting only those income and expense items that are generated and incurred at the property level may help both investors and management to understand the operations of its properties. FFO and Normalized FFO: SVC calculates funds from operations, or FFO, and normalized funds from operations, or Normalized FFO, as shown on page 36. FFO is calculated on the basis defined by The National Association of Real Estate Investment Trusts, or Nareit, which is net income (loss), calculated in accordance with GAAP, plus real estate depreciation and amortization, excluding any gain or loss on sale of real estate and any loss on impairment of real estate assets, as well as adjustments to reflect SVC's share of FFO attributable to an investee and certain other adjustments currently not applicable to SVC. In calculating Normalized FFO, SVC adjusts for the items shown on page 36. FFO and Normalized FFO are among the factors considered by SVC's Board of Trustees when determining the amount of distributions to SVC's shareholders. Other factors include, but are not limited to, requirements to satisfy SVC’s REIT distribution requirements, limitations in its debt agreements, the availability to SVC of debt and equity capital, SVC's distribution rate as a percentage of the trading price of its common shares, or dividend yield, and SVC’s dividend yield compared to the dividend yields of other REITs, SVC's expectation of its future capital requirements and operating performance and its expected needs for and availability of cash to pay its obligations. Other real estate companies and REITs may calculate FFO and Normalized FFO differently than SVC does. Cash Available for Distribution: SVC calculates cash available for distribution, or CAD, as shown on page 36. SVC defines CAD as Normalized FFO minus SVC’s proportionate share of Normalized FFO from its equity method investment, plus operating cash flow distributions from its equity method investment, if any, less real estate related capital expenditures and adjusted for other non-cash and nonrecurring items. CAD is among the factors considered by SVC's Board of Trustees when determining the amount of distributions to SVC's shareholders. Other real estate companies and REITs may calculate CAD differently than SVC does. EBITDA, EBITDAre and Adjusted EBITDAre: SVC calculates earnings before interest, taxes, depreciation and amortization, or EBITDA, EBITDA for real estate, or EBITDAre, and Adjusted EBITDAre as shown on page 37. EBITDAre is calculated on the basis defined by Nareit, which is EBITDA, excluding gains and losses on the sale of real estate, loss on impairment of real estate assets, if any, and adjustments to reflect SVC's share of EBITDAre attributable to an investee. In calculating Adjusted EBITDAre, SVC adjusts for the items shown on page 37. Other real estate companies and REITs may calculate EBITDA, EBITDAre and Adjusted EBITDAre differently than SVC does. NOI and Cash Basis NOI: The calculations of NOI and Cash Basis NOI exclude certain components of net income (loss) in order to provide results that are more closely related to SVC's property level results of operations. SVC calculates NOI, as rental income on its net lease properties, less net lease operating expenses as presented in its condensed consolidated statements of income (loss) in accordance with GAAP. NOI excludes depreciation and amortization. SVC defines Cash Basis NOI as NOI excluding non-cash straight line rent adjustments, lease value amortization and lease termination fees, if any. SVC calculates NOI and Cash Basis NOI to evaluate individual and company-wide property level performance. Other real estate companies and REITs may calculate NOI and Cash Basis NOI differently than SVC does. Hotel EBITDA and Adjusted Hotel EBITDA: SVC calculates Hotel EBITDA as hotel operating revenues less hotel operating expenses of all managed and leased hotels, prior to any adjustments required for presentation in its condensed consolidated statements of income (loss) in accordance with GAAP, as shown on page 38. Adjusted Hotel EBITDA excludes certain items SVC believes do not reflect the ongoing operating performance of SVC’s hotels. SVC believes that Hotel EBITDA and Adjusted Hotel EBITDA provide useful information to management and investors as a key measure of the profitability of its hotel operations. 41 |
| Non-GAAP Financial Measures and Certain Definitions (Continued) Adjusted Hotel EBITDA Margin: Adjusted Hotel EBITDA as a percentage of hotel operating revenues. Adjusted Total Assets and Total Unencumbered Assets: Adjusted total assets and total unencumbered assets include the original cost of real estate assets calculated in accordance with GAAP, before impairment write-downs, if any, and exclude depreciation and amortization, accounts receivable and intangible assets. ADR: ADR (average daily rate) represents rooms revenue divided by the total number of room nights sold in a given period. ADR provides useful insight on pricing at SVC's hotels and is a measure widely used in the hotel industry. Annualized Minimum Rent: Generally, SVC's lease agreements with its net lease tenants require payment of minimum rent to SVC. Certain of these minimum rent payment amounts are secured by full or limited guarantees. Annualized minimum rent represents cash amounts and excludes adjustments, if any, necessary to record scheduled rent changes on a straight line basis or any expense reimbursements. Annualized minimum rent for TA excludes the impact of rents prepaid by TA. Chain Scale: As characterized by STR Inc., a data benchmark and analytics provider for the lodging industry. Chain Scale segments are grouped primarily according to average room rates. Comparable Hotels Data: SVC presents RevPAR, ADR and occupancy for the periods presented on a comparable basis to facilitate comparisons between periods. SVC defines comparable hotels as those that it owned on September 30, 2026 and were open and operating for the entirety of the periods being compared. There were no non-comparable hotels in the periods presented. Consolidated Income Available for Debt Service: Consolidated income available for debt service, as defined in SVC's debt agreements, is earnings from operations excluding interest expense, depreciation and amortization, loss on asset impairment, unrealized appreciation on assets of properties held for sale, gains and losses on early extinguishment of debt, gains and losses on sales of property and amortization of deferred charges. Debt: Debt amounts reflect the principal balance as of the date reported. Net debt means total debt less unrestricted cash and cash equivalents as of the date reported. Earnings and Adjustments Attributable to an Investee: Earnings and Adjustments Attributable to an Investee represents SVC's proportionate share from its equity investment in Sonesta. Exit Hotels: Exit Hotels represents eight hotels sold since September 30, 2026, as well as one hotel managed by Sonesta and one hotel managed by InterContinental Hotels Group, PLC that are currently in various stages of being sold. Furniture, Fixtures and Equipment (FF&E) Reserves: FF&E Reserves, or FF&E Reserves from managed hotel operations, represents various percentages of total sales at certain of SVC's hotels that are escrowed as reserves for future renovations or refurbishments, or FF&E Reserve escrows. SVC owns all the FF&E Reserve escrows for its hotels. GAAP: is U.S. generally accepted accounting principles. General and Administrative Expense Paid in Common Shares: Amounts represent the equity compensation for SVC’s Trustees, officers and certain other officers and employees of RMR. 42 |
| Non-GAAP Financial Measures and Certain Definitions (Continued) Investment: SVC defines hotel investment as historical cost of its properties plus capital improvements funded by it less impairment write-downs, if any, and excludes capital improvements made from FF&E Reserves funded from hotel operations that do not result in increases in SVC’s incentive threshold or owner’s priority returns. SVC defines net lease investment as historical cost of its properties plus capital improvements funded by SVC less impairment write-downs, if any. LTM: LTM means last twelve months ended September 30, 2026. Non-Cash Expenses: Non-cash expenses represents general and administrative expense paid in common shares and amortization of liabilities relating to SVC’s initial investment in Sonesta and its former investment in The RMR Group, Inc. Non-Cash Interest Expense: Non-cash interest expense represents amortization of debt issuance costs, discounts and premiums. Non-Cash Revenues: Non-cash revenues represents straight-line rent adjustments, lease value amortization, FF&E Reserves, including interest income earned, and the impact of rents prepaid by TA. Occupancy: Occupancy represents the total number of room nights sold divided by the total number of room nights available at a hotel or group of hotels and represents occupied properties as of the end of the period shown for net lease properties. Occupancy is an important measure of the utilization rate and demand of SVC's properties. Owner's Priority Return: Each of its management agreements or leases with hotel operators provides for payment to SVC of an annual owner’s priority return or minimum rent, respectively. Certain of these minimum payment amounts are secured by full or limited guarantees. In addition, certain of its hotel management agreements provide for payment to SVC of additional amounts to the extent of available cash flows as defined in the management agreement. Payments of these additional amounts are not guaranteed. Recurring Capital: Recurring capital expenditures is capital expenditures excluding redevelopment and other activity. Redevelopment and Other Activities: Redevelopment and Other Activities generally include projects that reposition a property or result in new sources of revenue and other non-recurring capital expenditures. Rent Coverage: SVC defines rent coverage as earnings before interest, taxes, depreciation, amortization and rent, or EBITDAR, divided by the annual minimum rent due to SVC weighted by the minimum rent of the property to total minimum rents of the net lease portfolio. Tenants with no minimum rent required under the lease are excluded. EBITDAR amounts used to determine rent coverage are generally for the latest twelve-month period, based on the most recent operating information, if any, furnished by the tenant. Operating statements furnished by the tenant often are unaudited and, in certain cases, may not have been prepared in accordance with GAAP and are not independently verified by SVC. In instances where SVC does not have tenant financial information, it calculates an implied coverage ratio for the period based on other tenants with available financial statements operating the same brand or within the same industry. As a result, SVC believes using this implied coverage metric provides a more reasonable estimated representation of recent operating results and the financial condition for those tenants. Retained Hotels: Retained Hotels represents 53 hotels managed by Sonesta, 17 hotels managed by Hyatt Hotels Corporation and seven hotels managed by Radisson Hospitality, Inc. that SVC will continue to own after the Exit Hotels are sold. RevPAR: RevPAR (revenue per available room) represents rooms revenue divided by the total number of room nights available to guests for a given period. RevPAR is an industry metric correlated to occupancy and ADR and helps measure revenue performance over comparable periods. Weighted Average Lease Term: The average lease term in years weighted on annualized minimum rent. 43 |
| November 2026 | Nasdaq: SVC Two Newton Place 255 Washington Street, Suite 300 Newton, MA 02458 SVCREIT.COM Nareit REITworld |