Third Quarter 2026 Results 1 Klarna Q3’26 Earnings Release
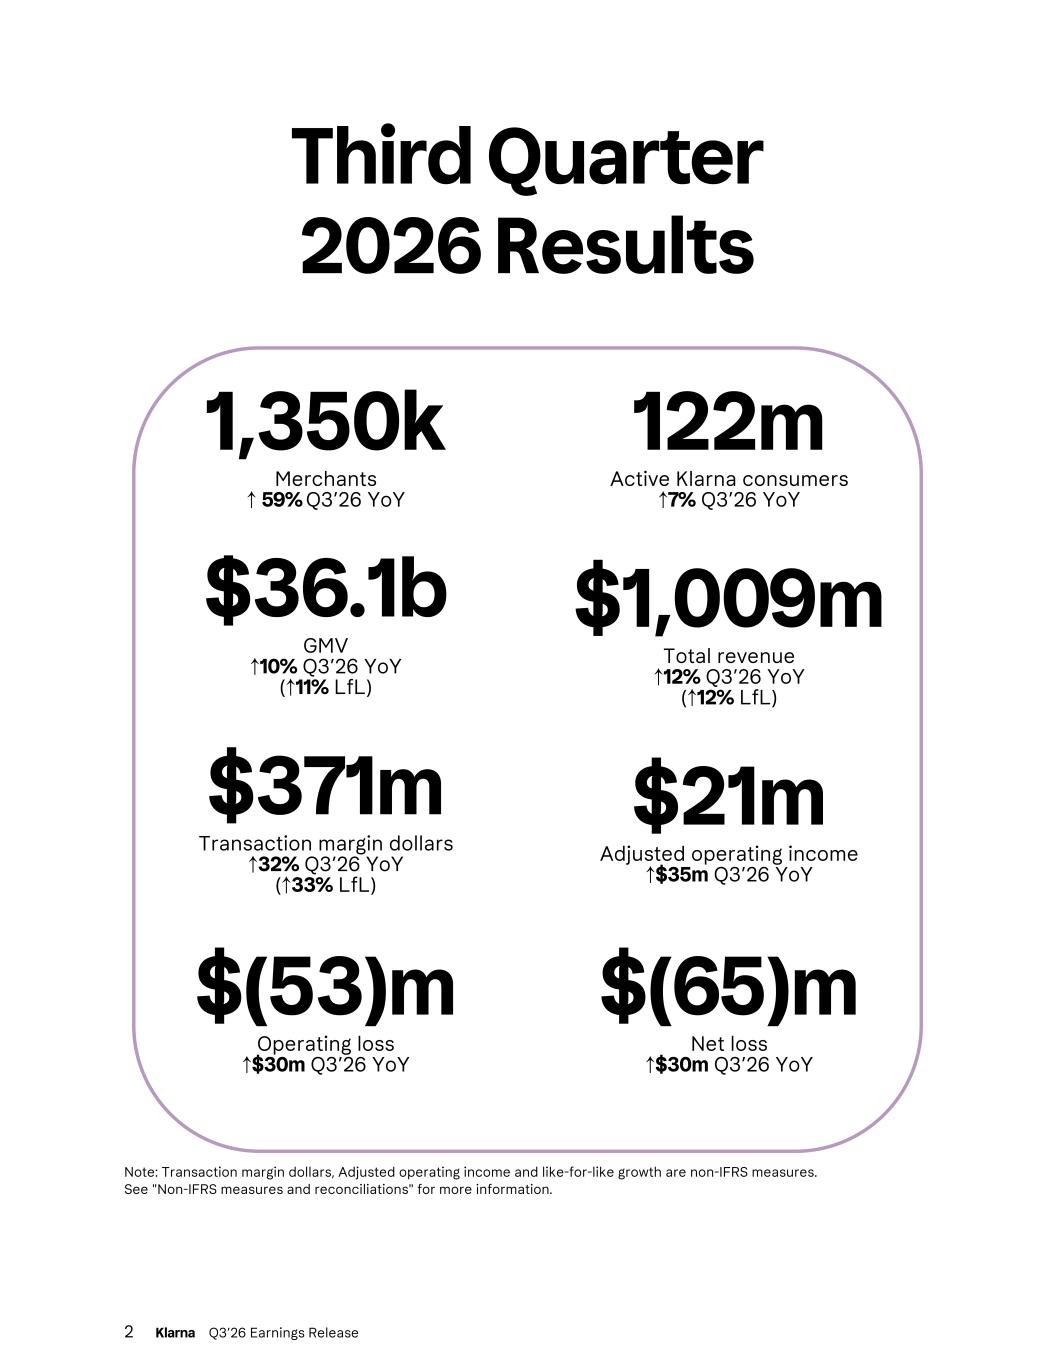
Third Quarter 2026 Results 1,350k Merchants ↑ 59% Q3’26 YoY 122m Active Klarna consumers ↑7% Q3’26 YoY $36.1b GMV ↑10% Q3’26 YoY (↑11% LfL) $1,009m Total revenue ↑12% Q3’26 YoY (↑12% LfL) $371m Transaction margin dollars ↑32% Q3’26 YoY (↑33% LfL) $21m Adjusted operating income ↑$35m Q3’26 YoY $(53)m Operating loss ↑$30m Q3’26 YoY $(65)m Net loss ↑$30m Q3’26 YoY Note: Transaction margin dollars, Adjusted operating income and like-for-like growth are non-IFRS measures. See "Non-IFRS measures and reconciliations" for more information. 2 Klarna Q3’26 Earnings Release
Key highlights Klarna delivered its fourth consecutive quarter of revenue above $1 billion and positive adjusted operating income. Transaction margin dollars grew 32%, and GMV rose 10% to $36.1 billion, led by 24% growth in the U.S. Fair Financing, our highest-earning product per dollar of volume, was also our fastest growing, up 61%. Adjusted operating income increased by $35 million year-over-year to $21 million. We now serve 122 million active consumers and 1.35 million merchants, the latter up 59%. Our strategy follows our business areas. Consumers typically discover Klarna through buy now, pay later in lifestyle spend, and from there we extend into everyday and big-ticket purchases with customers we have already underwritten. Underpinning all three, we also earn from consumer services and advertising: our shopping browser, agentic commerce and subscriptions. It generated $588 million of revenue in 2025 and has grown 30% so far this year. Over the past two years, Fair Financing has been our priority in the U.S. Volume reached $12.5 billion over the last 12 months, up 140% from $5.2 billion, supported by partners such as Walmart, through OnePay, Airbnb, and eBay. In Europe, our leadership in Pay Later and the strength of our brand give us a strong platform for Fair Financing, which reached $6.0 billion across our global ex-U.S. markets over the last 12 months, up 50%. Over a loan’s life, we target a transaction margin of 3% to 4% of volume on Fair Financing, more than three times what Pay Later earns per dollar of volume. The Klarna Card continued to scale, with third-quarter volume more than doubling to $4.5 billion. Subscriptions are becoming a meaningful source of high-value, recurring revenue: subscription revenue rose more than 500% to $43 million in the quarter. That is $178 million of annual recurring high margin revenue at September’s run rate. Card users shop with Klarna about three times as often, and the card is now used by 6% of our active consumers, rising to 11% in the U.S. During the quarter, we signed Fiserv, one of the largest U.S. payment processors, to offer Klarna to its merchants. Southwest Airlines and J.Crew launched Klarna in the U.S., and with Marks & Spencer now live, Klarna is available at every major UK department store. We also went live with Lands’ End, a classic American lifestyle brand, and CarParts.com, a leading U.S. online auto parts retailer. The Apple Upgrade program, launched in July, is gaining good traction as we approach our first holiday season together. Our shopping browser helps consumers discover products, compare and track prices, earn cashback and pay with Klarna. It has driven more than $34 billion of GMV since its launch in 2020. We are now building AI into this experience with our AI assistant, live with a small group of early users, with pre-registration open, on WhatsApp, iMessage and in the Klarna app. Heading into 2027, we see three key opportunities: scaling Fair Financing in the U.S. and expanding it across Europe, growing the Klarna Card beyond our merchant network, and AI to accelerate growth and productivity. 3 Klarna Q3’26 Earnings Release
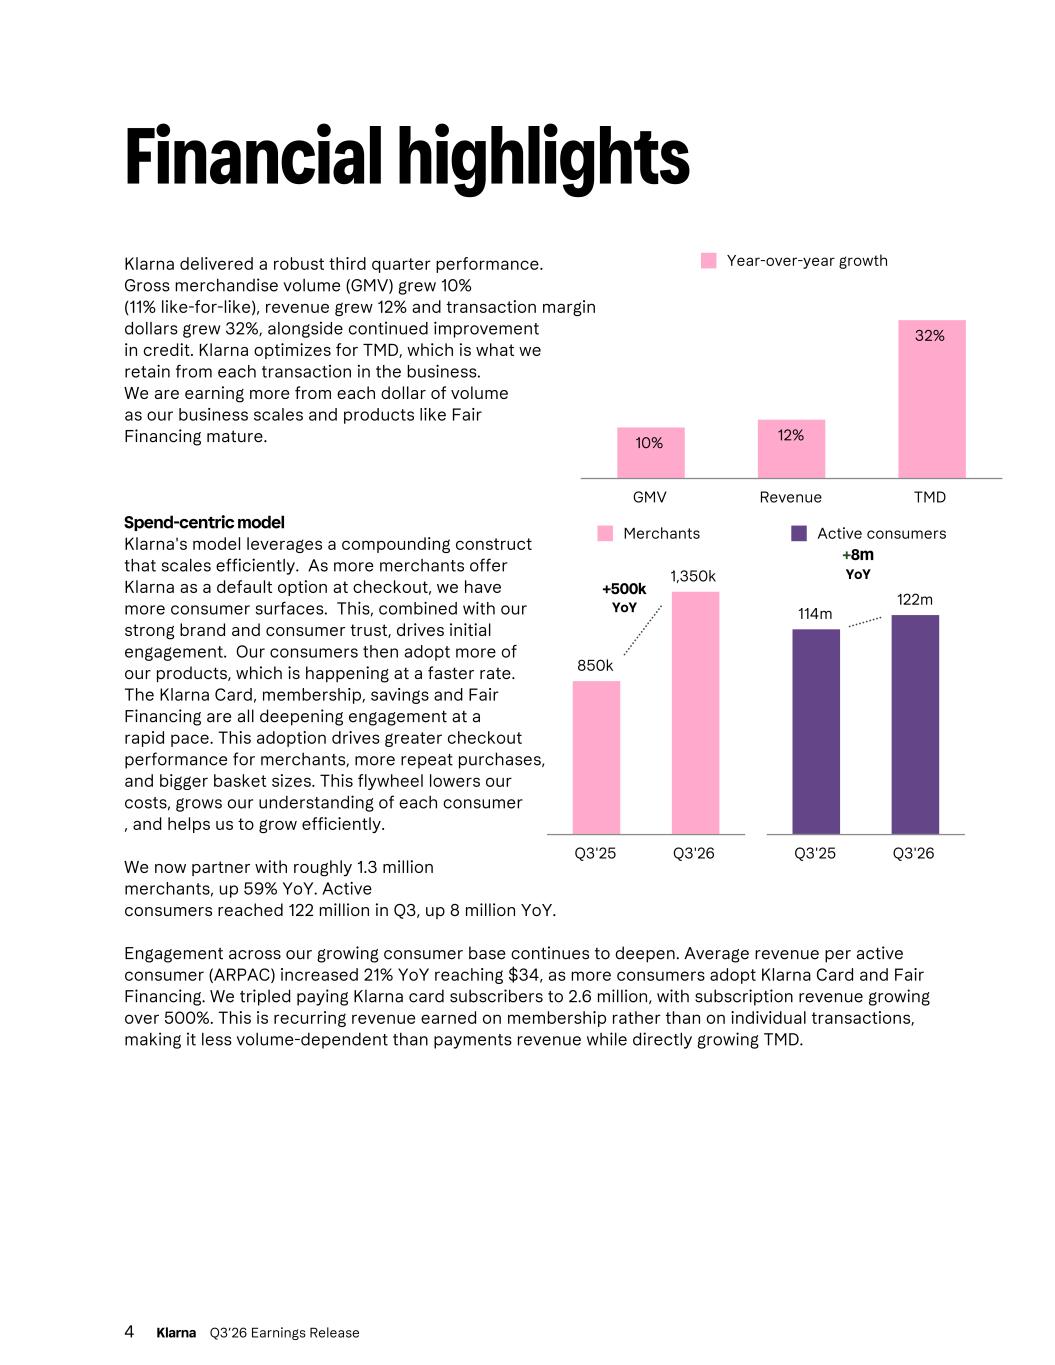
Financial highlights Klarna delivered a robust third quarter performance. Gross merchandise volume (GMV) grew 10% (11% like-for-like), revenue grew 12% and transaction margin dollars grew 32%, alongside continued improvement in credit. Klarna optimizes for TMD, which is what we retain from each transaction in the business. We are earning more from each dollar of volume as our business scales and products like Fair Financing mature. Spend-centric model Klarna's model leverages a compounding construct that scales efficiently. As more merchants offer Klarna as a default option at checkout, we have more consumer surfaces. This, combined with our strong brand and consumer trust, drives initial engagement. Our consumers then adopt more of our products, which is happening at a faster rate. The Klarna Card, membership, savings and Fair Financing are all deepening engagement at a rapid pace. This adoption drives greater checkout performance for merchants, more repeat purchases, and bigger basket sizes. This flywheel lowers our costs, grows our understanding of each consumer , and helps us to grow efficiently. We now partner with roughly 1.3 million merchants, up 59% YoY. Active consumers reached 122 million in Q3, up 8 million YoY. Engagement across our growing consumer base continues to deepen. Average revenue per active consumer (ARPAC) increased 21% YoY reaching $34, as more consumers adopt Klarna Card and Fair Financing. We tripled paying Klarna card subscribers to 2.6 million, with subscription revenue growing over 500%. This is recurring revenue earned on membership rather than on individual transactions, making it less volume-dependent than payments revenue while directly growing TMD. 4 Klarna Q3’26 Earnings Release 114m 122m Active consumers Q3'25 Q3'26 850k 1,350k Merchants Q3'25 Q3'26 +8m YoY +500k YoY 10% 12% 32% Year-over-year growth GMV Revenue TMD
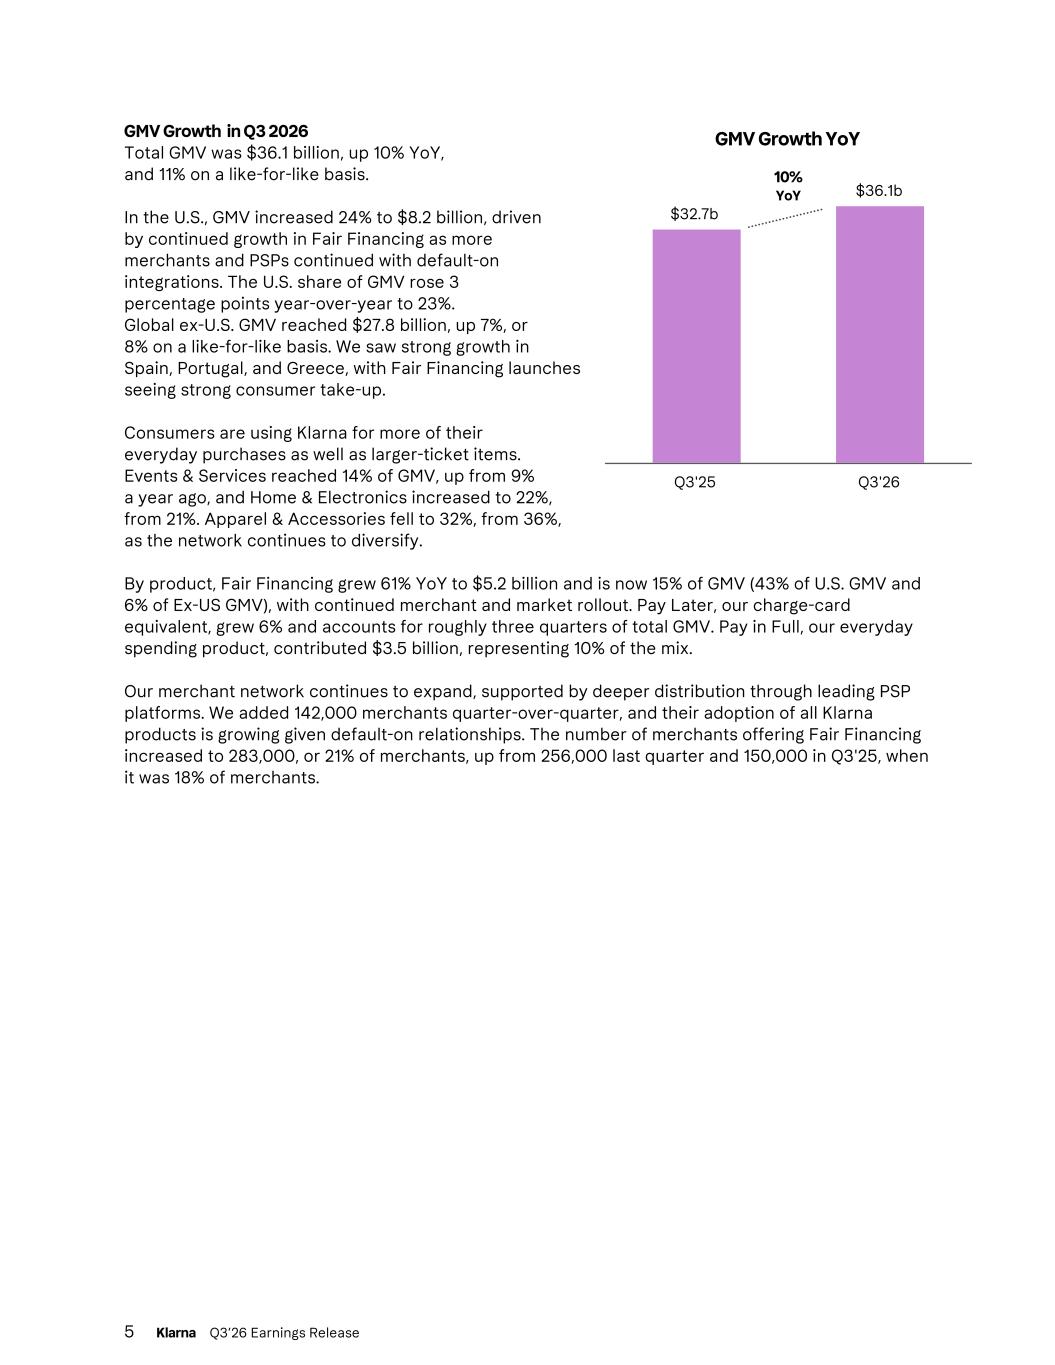
GMV Growth in Q3 2026 Total GMV was $36.1 billion, up 10% YoY, and 11% on a like-for-like basis. In the U.S., GMV increased 24% to $8.2 billion, driven by continued growth in Fair Financing as more merchants and PSPs continued with default-on integrations. The U.S. share of GMV rose 3 percentage points year-over-year to 23%. Global ex-U.S. GMV reached $27.8 billion, up 7%, or 8% on a like-for-like basis. We saw strong growth in Spain, Portugal, and Greece, with Fair Financing launches seeing strong consumer take-up. Consumers are using Klarna for more of their everyday purchases as well as larger-ticket items. Events & Services reached 14% of GMV, up from 9% a year ago, and Home & Electronics increased to 22%, from 21%. Apparel & Accessories fell to 32%, from 36%, as the network continues to diversify. By product, Fair Financing grew 61% YoY to $5.2 billion and is now 15% of GMV (43% of U.S. GMV and 6% of Ex-US GMV), with continued merchant and market rollout. Pay Later, our charge-card equivalent, grew 6% and accounts for roughly three quarters of total GMV. Pay in Full, our everyday spending product, contributed $3.5 billion, representing 10% of the mix. Our merchant network continues to expand, supported by deeper distribution through leading PSP platforms. We added 142,000 merchants quarter-over-quarter, and their adoption of all Klarna products is growing given default-on relationships. The number of merchants offering Fair Financing increased to 283,000, or 21% of merchants, up from 256,000 last quarter and 150,000 in Q3'25, when it was 18% of merchants. 5 Klarna Q3’26 Earnings Release GMV Growth YoY $32.7b $36.1b Q3'25 Q3'26 10% YoY
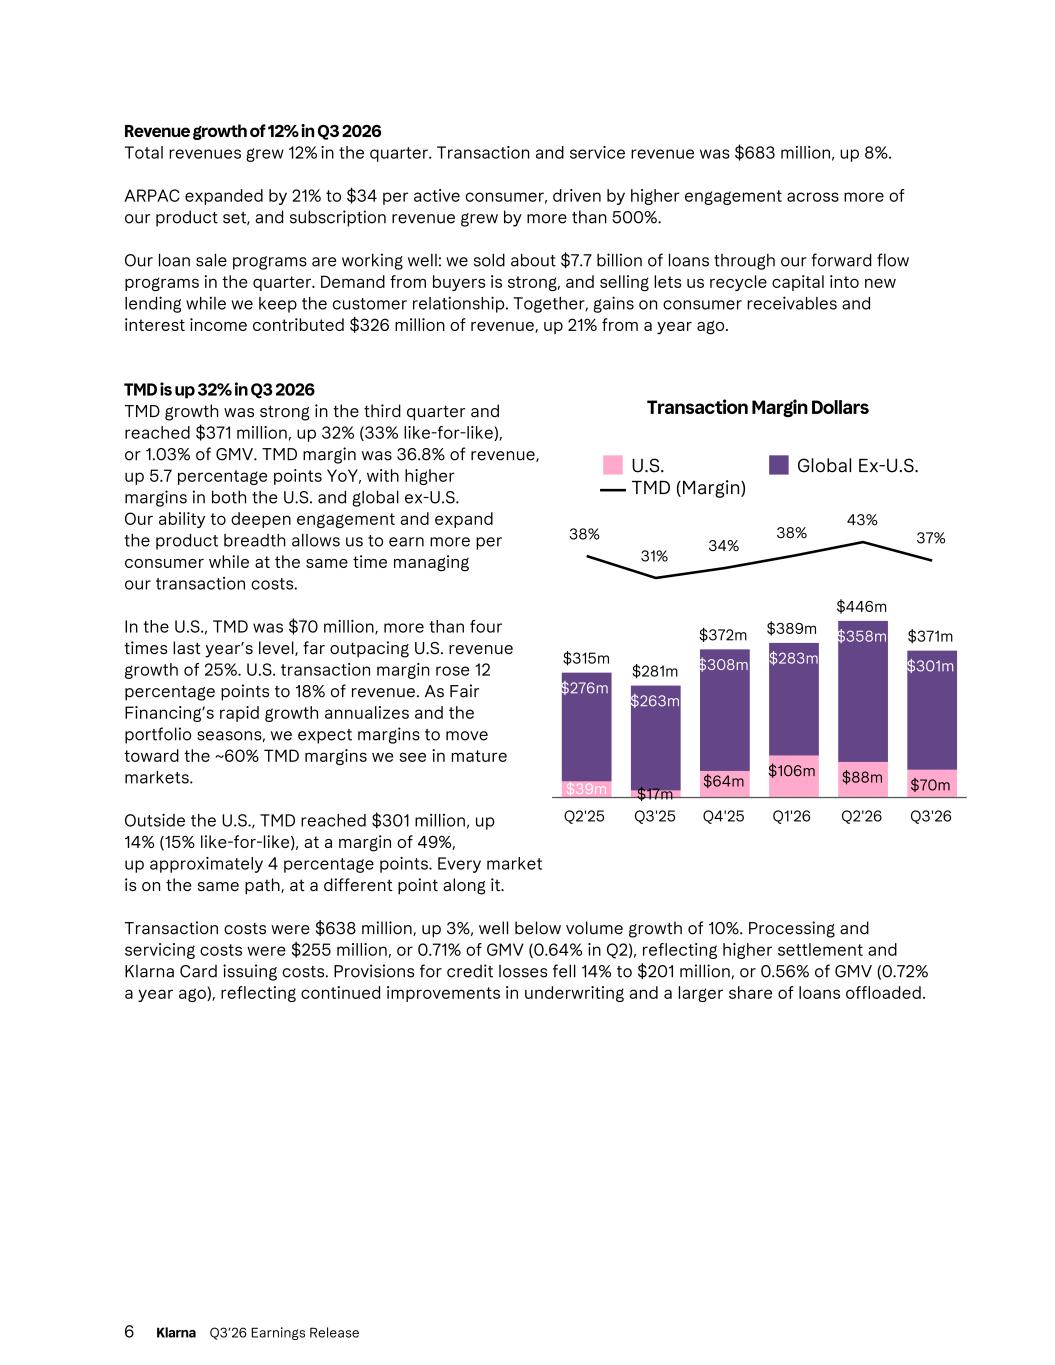
Revenue growth of 12% in Q3 2026 Total revenues grew 12% in the quarter. Transaction and service revenue was $683 million, up 8%. ARPAC expanded by 21% to $34 per active consumer, driven by higher engagement across more of our product set, and subscription revenue grew by more than 500%. Our loan sale programs are working well: we sold about $7.7 billion of loans through our forward flow programs in the quarter. Demand from buyers is strong, and selling lets us recycle capital into new lending while we keep the customer relationship. Together, gains on consumer receivables and interest income contributed $326 million of revenue, up 21% from a year ago. TMD is up 32% in Q3 2026 TMD growth was strong in the third quarter and reached $371 million, up 32% (33% like-for-like), or 1.03% of GMV. TMD margin was 36.8% of revenue, up 5.7 percentage points YoY, with higher margins in both the U.S. and global ex-U.S. Our ability to deepen engagement and expand the product breadth allows us to earn more per consumer while at the same time managing our transaction costs. In the U.S., TMD was $70 million, more than four times last year’s level, far outpacing U.S. revenue growth of 25%. U.S. transaction margin rose 12 percentage points to 18% of revenue. As Fair Financing’s rapid growth annualizes and the portfolio seasons, we expect margins to move toward the ~60% TMD margins we see in mature markets. Outside the U.S., TMD reached $301 million, up 14% (15% like-for-like), at a margin of 49%, up approximately 4 percentage points. Every market is on the same path, at a different point along it. Transaction costs were $638 million, up 3%, well below volume growth of 10%. Processing and servicing costs were $255 million, or 0.71% of GMV (0.64% in Q2), reflecting higher settlement and Klarna Card issuing costs. Provisions for credit losses fell 14% to $201 million, or 0.56% of GMV (0.72% a year ago), reflecting continued improvements in underwriting and a larger share of loans offloaded. 6 Klarna Q3’26 Earnings Release Transaction Margin Dollars $315m $281m $372m $389m $446m $371m $39m $17m $64m $106m $88m $70m $276m $263m $308m $283m $358m $301m 38% 31% 34% 38% 43% 37% U.S. Global Ex-U.S. TMD (Margin) Q2'25 Q3'25 Q4'25 Q1'26 Q2'26 Q3'26
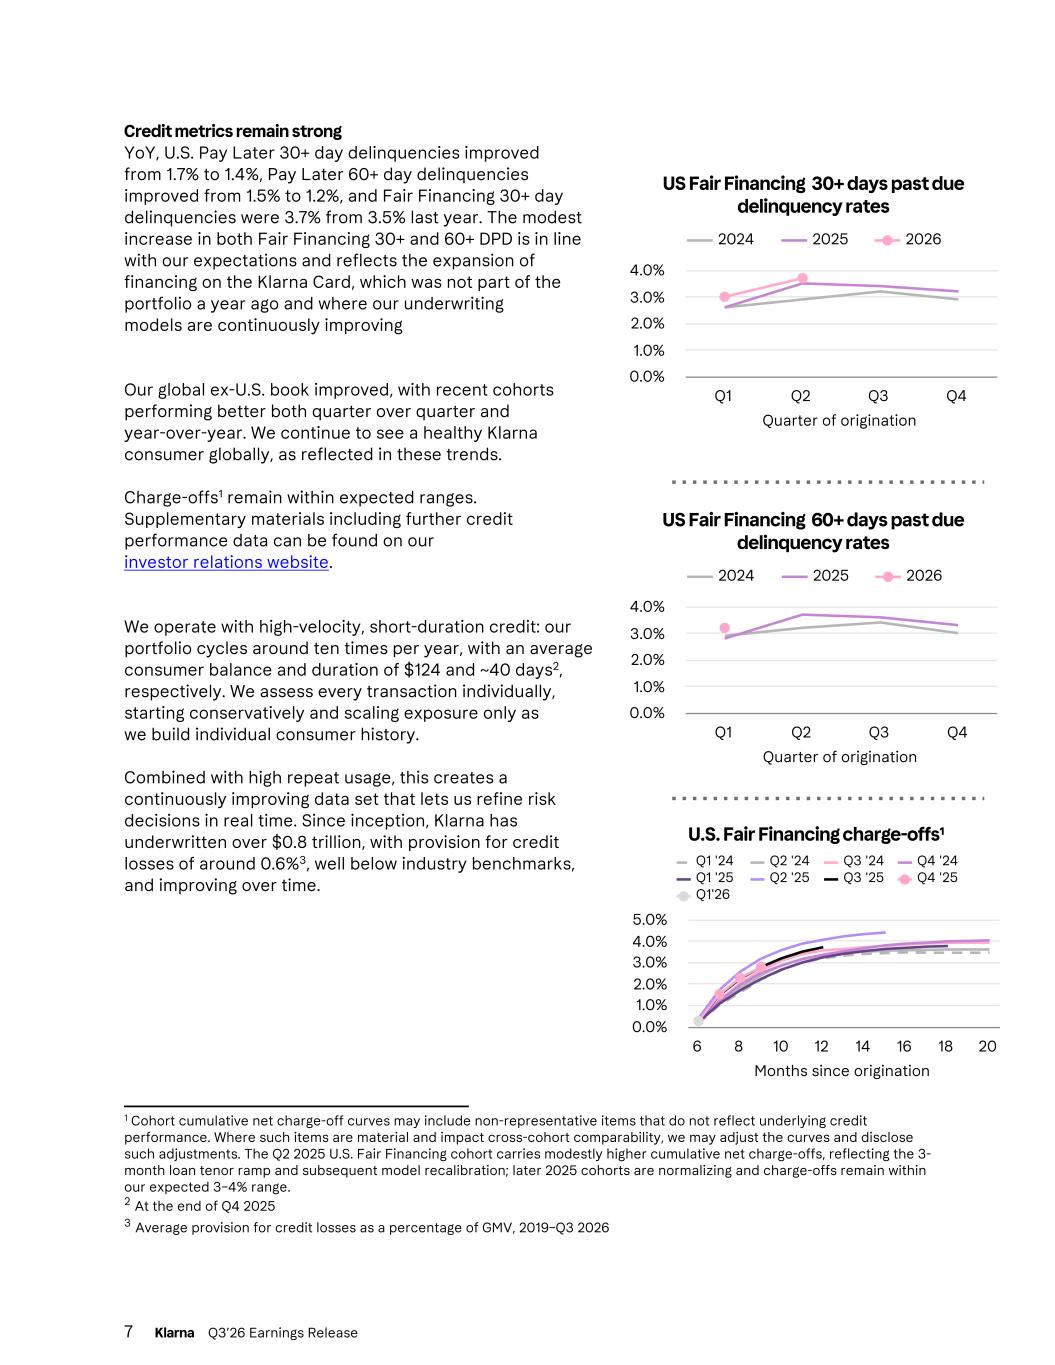
Credit metrics remain strong YoY, U.S. Pay Later 30+ day delinquencies improved from 1.7% to 1.4%, Pay Later 60+ day delinquencies improved from 1.5% to 1.2%, and Fair Financing 30+ day delinquencies were 3.7% from 3.5% last year. The modest increase in both Fair Financing 30+ and 60+ DPD is in line with our expectations and reflects the expansion of financing on the Klarna Card, which was not part of the portfolio a year ago and where our underwriting models are continuously improving Our global ex-U.S. book improved, with recent cohorts performing better both quarter over quarter and year-over-year. We continue to see a healthy Klarna consumer globally, as reflected in these trends. Charge-offs1 remain within expected ranges. Supplementary materials including further credit performance data can be found on our investor relations website. We operate with high-velocity, short-duration credit: our portfolio cycles around ten times per year, with an average consumer balance and duration of $124 and ~40 days2, respectively. We assess every transaction individually, starting conservatively and scaling exposure only as we build individual consumer history. Combined with high repeat usage, this creates a continuously improving data set that lets us refine risk decisions in real time. Since inception, Klarna has underwritten over $0.8 trillion, with provision for credit losses of around 0.6%3, well below industry benchmarks, and improving over time. 7 Klarna Q3’26 Earnings Release 1 Cohort cumulative net charge-off curves may include non-representative items that do not reflect underlying credit performance. Where such items are material and impact cross-cohort comparability, we may adjust the curves and disclose such adjustments. The Q2 2025 U.S. Fair Financing cohort carries modestly higher cumulative net charge-offs, reflecting the 3- month loan tenor ramp and subsequent model recalibration; later 2025 cohorts are normalizing and charge-offs remain within our expected 3–4% range. 2 At the end of Q4 2025 3 Average provision for credit losses as a percentage of GMV, 2019–Q3 2026 Quarter of origination US Fair Financing 60+ days past due delinquency rates 2024 2025 2026 Q1 Q2 Q3 Q4 0.0% 1.0% 2.0% 3.0% 4.0% Quarter of origination US Fair Financing 30+ days past due delinquency rates 2024 2025 2026 Q1 Q2 Q3 Q4 0.0% 1.0% 2.0% 3.0% 4.0% Months since origination U.S. Fair Financing charge-offs¹ Q1 '24 Q2 '24 Q3 '24 Q4 '24 Q1 '25 Q2 '25 Q3 '25 Q4 '25 Q1'26 6 8 10 12 14 16 18 20 0.0% 1.0% 2.0% 3.0% 4.0% 5.0%
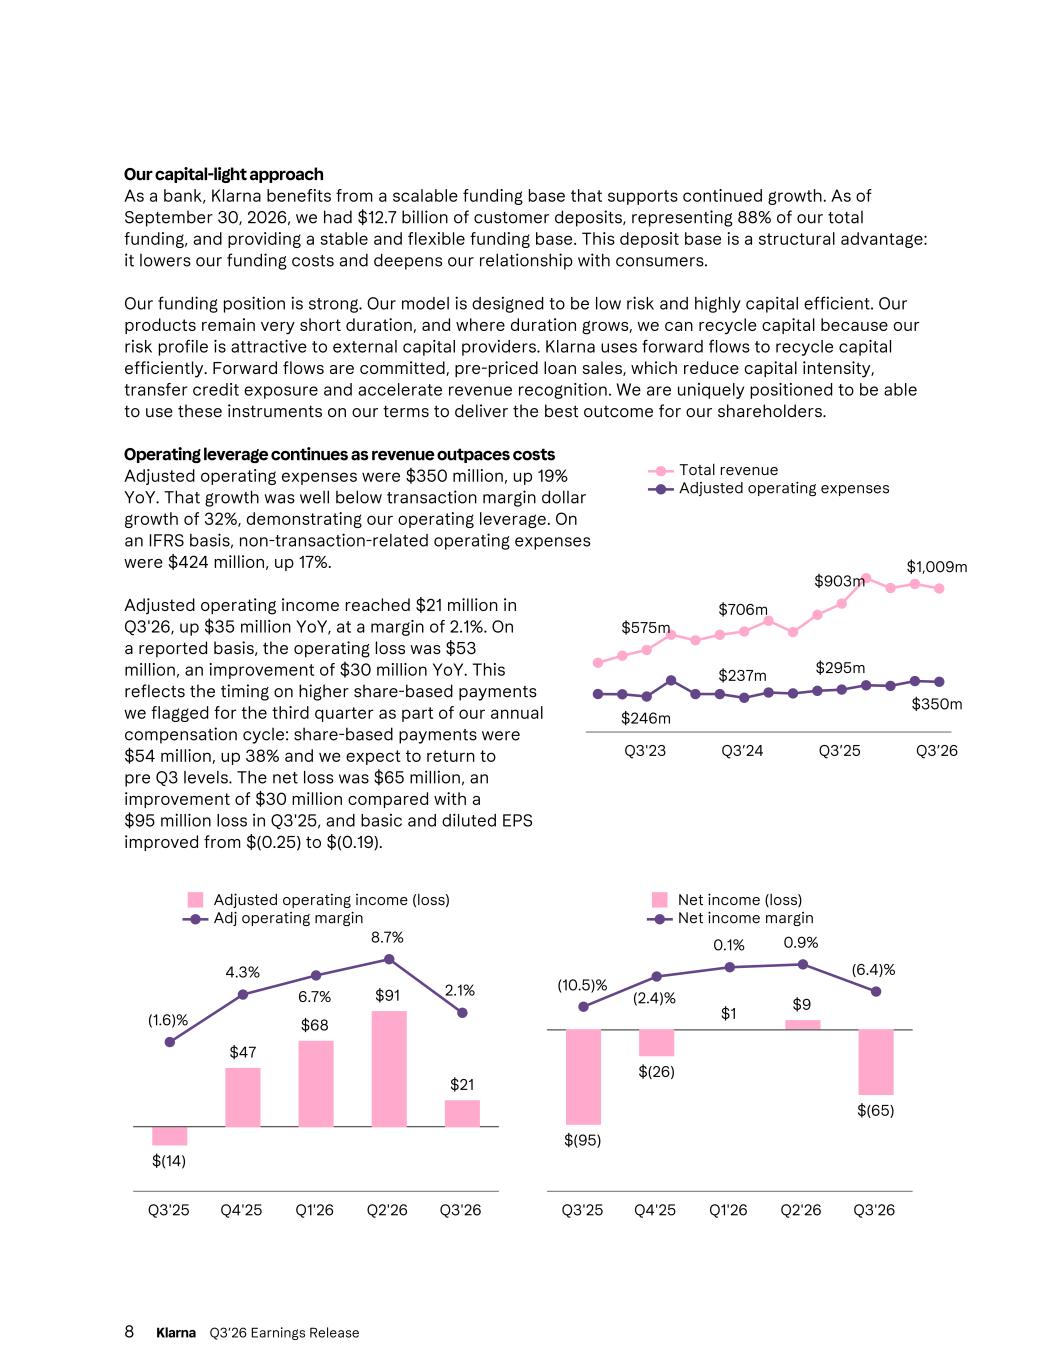
Our capital-light approach As a bank, Klarna benefits from a scalable funding base that supports continued growth. As of September 30, 2026, we had $12.7 billion of customer deposits, representing 88% of our total funding, and providing a stable and flexible funding base. This deposit base is a structural advantage: it lowers our funding costs and deepens our relationship with consumers. Our funding position is strong. Our model is designed to be low risk and highly capital efficient. Our products remain very short duration, and where duration grows, we can recycle capital because our risk profile is attractive to external capital providers. Klarna uses forward flows to recycle capital efficiently. Forward flows are committed, pre-priced loan sales, which reduce capital intensity, transfer credit exposure and accelerate revenue recognition. We are uniquely positioned to be able to use these instruments on our terms to deliver the best outcome for our shareholders. Operating leverage continues as revenue outpaces costs Adjusted operating expenses were $350 million, up 19% YoY. That growth was well below transaction margin dollar growth of 32%, demonstrating our operating leverage. On an IFRS basis, non-transaction-related operating expenses were $424 million, up 17%. Adjusted operating income reached $21 million in Q3'26, up $35 million YoY, at a margin of 2.1%. On a reported basis, the operating loss was $53 million, an improvement of $30 million YoY. This reflects the timing on higher share-based payments we flagged for the third quarter as part of our annual compensation cycle: share-based payments were $54 million, up 38% and we expect to return to pre Q3 levels. The net loss was $65 million, an improvement of $30 million compared with a $95 million loss in Q3'25, and basic and diluted EPS improved from $(0.25) to $(0.19). 8 Klarna Q3’26 Earnings Release $575m $706m $903m $1,009m $246m $237m $295m $350m Total revenue Adjusted operating expenses Q3'23 Q3’24 Q3’25 Q3’26 $(14) $47 $68 $91 $21 (1.6)% 4.3% 6.7% 8.7% 2.1% Adjusted operating income (loss) Adj operating margin Q3'25 Q4'25 Q1'26 Q2'26 Q3'26 $(95) $(26) $1 $9 $(65) (10.5)% (2.4)% 0.1% 0.9% (6.4)% Net income (loss) Net income margin Q3'25 Q4'25 Q1'26 Q2'26 Q3'26
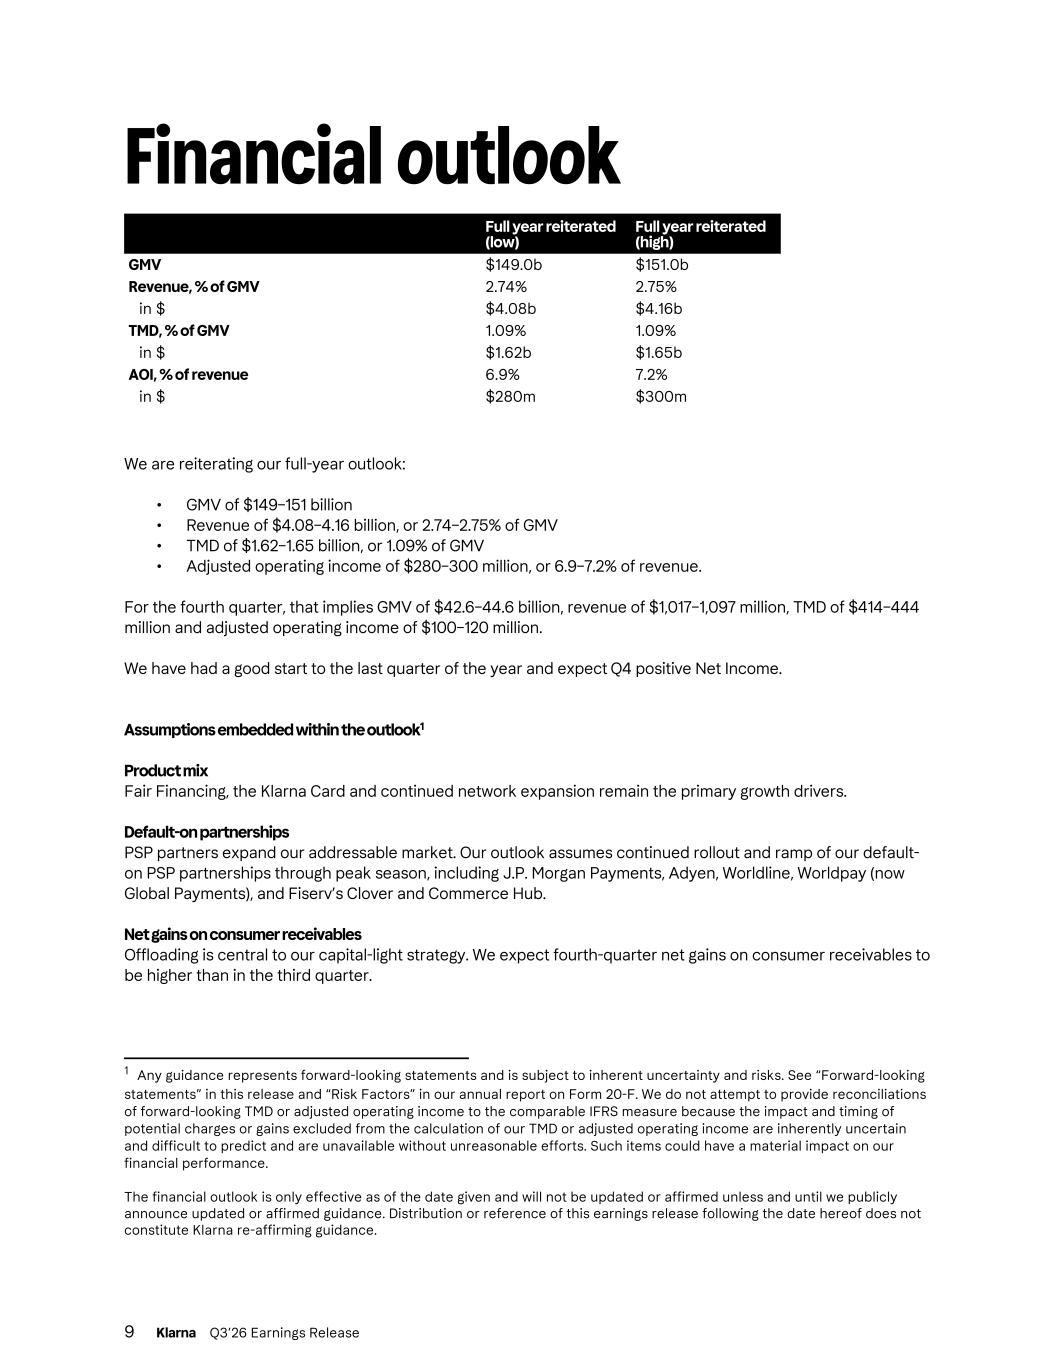
Financial outlook Full year reiterated (low) Full year reiterated (high) GMV $149.0b $151.0b Revenue, % of GMV 2.74% 2.75% in $ $4.08b $4.16b TMD, % of GMV 1.09% 1.09% in $ $1.62b $1.65b AOI, % of revenue 6.9% 7.2% in $ $280m $300m We are reiterating our full-year outlook: • GMV of $149–151 billion • Revenue of $4.08–4.16 billion, or 2.74–2.75% of GMV • TMD of $1.62–1.65 billion, or 1.09% of GMV • Adjusted operating income of $280–300 million, or 6.9–7.2% of revenue. For the fourth quarter, that implies GMV of $42.6–44.6 billion, revenue of $1,017–1,097 million, TMD of $414–444 million and adjusted operating income of $100–120 million. We have had a good start to the last quarter of the year and expect Q4 positive Net Income. Assumptions embedded within the outlook1 Product mix Fair Financing, the Klarna Card and continued network expansion remain the primary growth drivers. Default-on partnerships PSP partners expand our addressable market. Our outlook assumes continued rollout and ramp of our default- on PSP partnerships through peak season, including J.P. Morgan Payments, Adyen, Worldline, Worldpay (now Global Payments), and Fiserv’s Clover and Commerce Hub. Net gains on consumer receivables Offloading is central to our capital-light strategy. We expect fourth-quarter net gains on consumer receivables to be higher than in the third quarter. 9 Klarna Q3’26 Earnings Release 1 Any guidance represents forward-looking statements and is subject to inherent uncertainty and risks. See “Forward-looking statements” in this release and “Risk Factors” in our annual report on Form 20-F. We do not attempt to provide reconciliations of forward-looking TMD or adjusted operating income to the comparable IFRS measure because the impact and timing of potential charges or gains excluded from the calculation of our TMD or adjusted operating income are inherently uncertain and difficult to predict and are unavailable without unreasonable efforts. Such items could have a material impact on our financial performance. The financial outlook is only effective as of the date given and will not be updated or affirmed unless and until we publicly announce updated or affirmed guidance. Distribution or reference of this earnings release following the date hereof does not constitute Klarna re-affirming guidance.
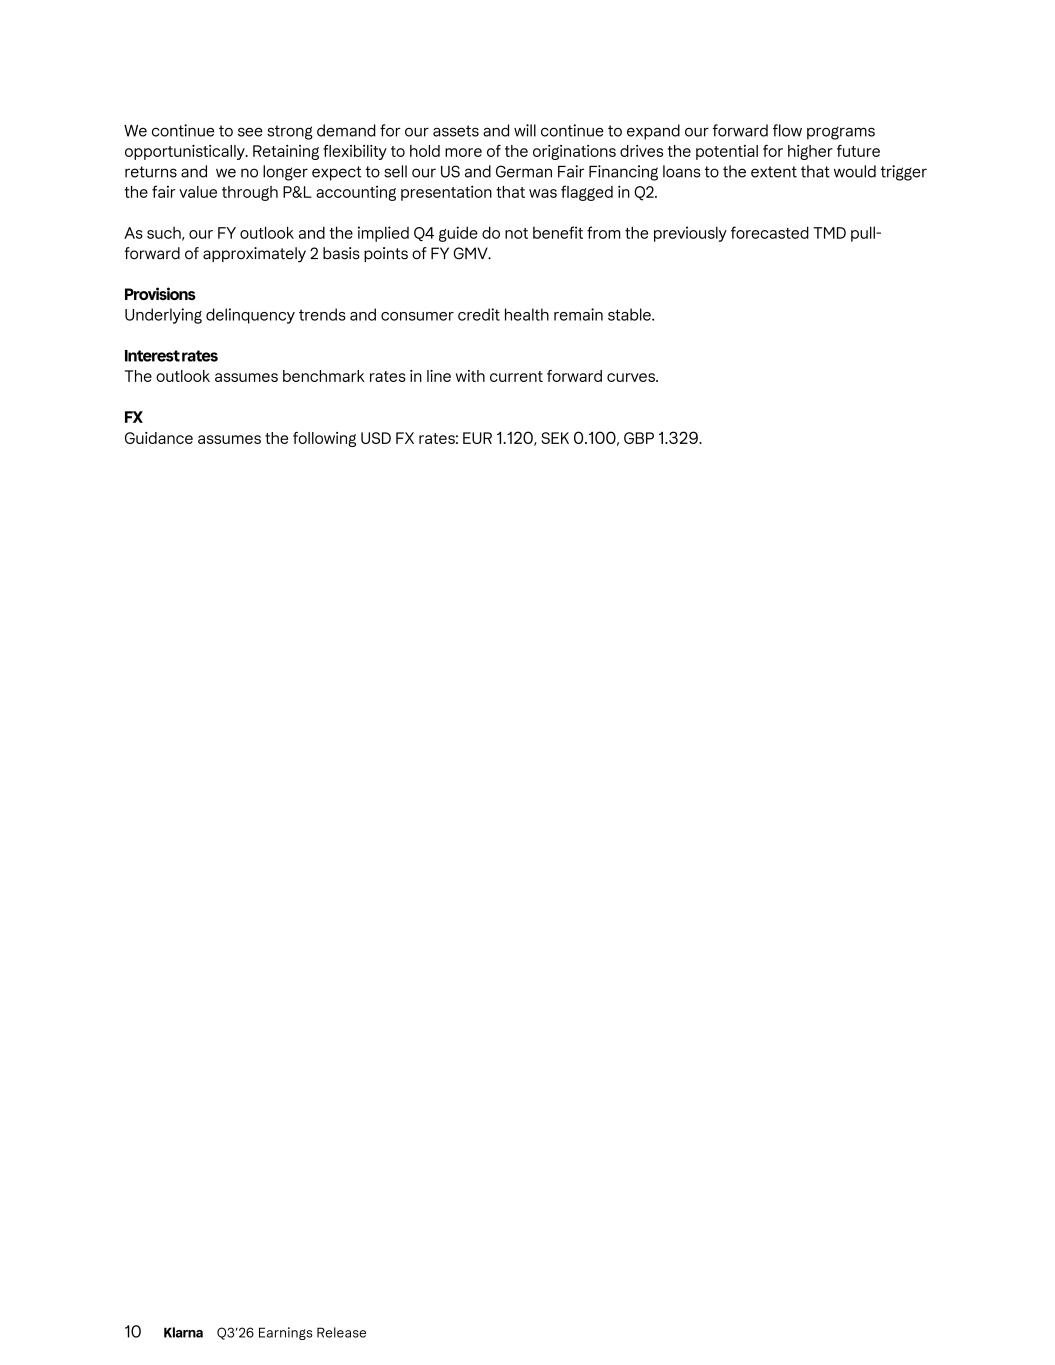
We continue to see strong demand for our assets and will continue to expand our forward flow programs opportunistically. Retaining flexibility to hold more of the originations drives the potential for higher future returns and we no longer expect to sell our US and German Fair Financing loans to the extent that would trigger the fair value through P&L accounting presentation that was flagged in Q2. As such, our FY outlook and the implied Q4 guide do not benefit from the previously forecasted TMD pull- forward of approximately 2 basis points of FY GMV. Provisions Underlying delinquency trends and consumer credit health remain stable. Interest rates The outlook assumes benchmark rates in line with current forward curves. FX Guidance assumes the following USD FX rates: EUR 1.120, SEK 0.100, GBP 1.329. 10 Klarna Q3’26 Earnings Release
Conference call Klarna will host a conference call and webcast to discuss its third quarter 2026 financial results on November 17, 2026, at 8:30 am ET. Participating on the call will be: • Sebastian Siemiatkowski, Chief Executive Officer, and • Niclas Neglén, Chief Financial Officer. The conference call will be webcast live on Klarna’s investor relations website at investors.klarna.com. A replay will be available on the same website following the call. 11 Klarna Q3’26 Earnings Release
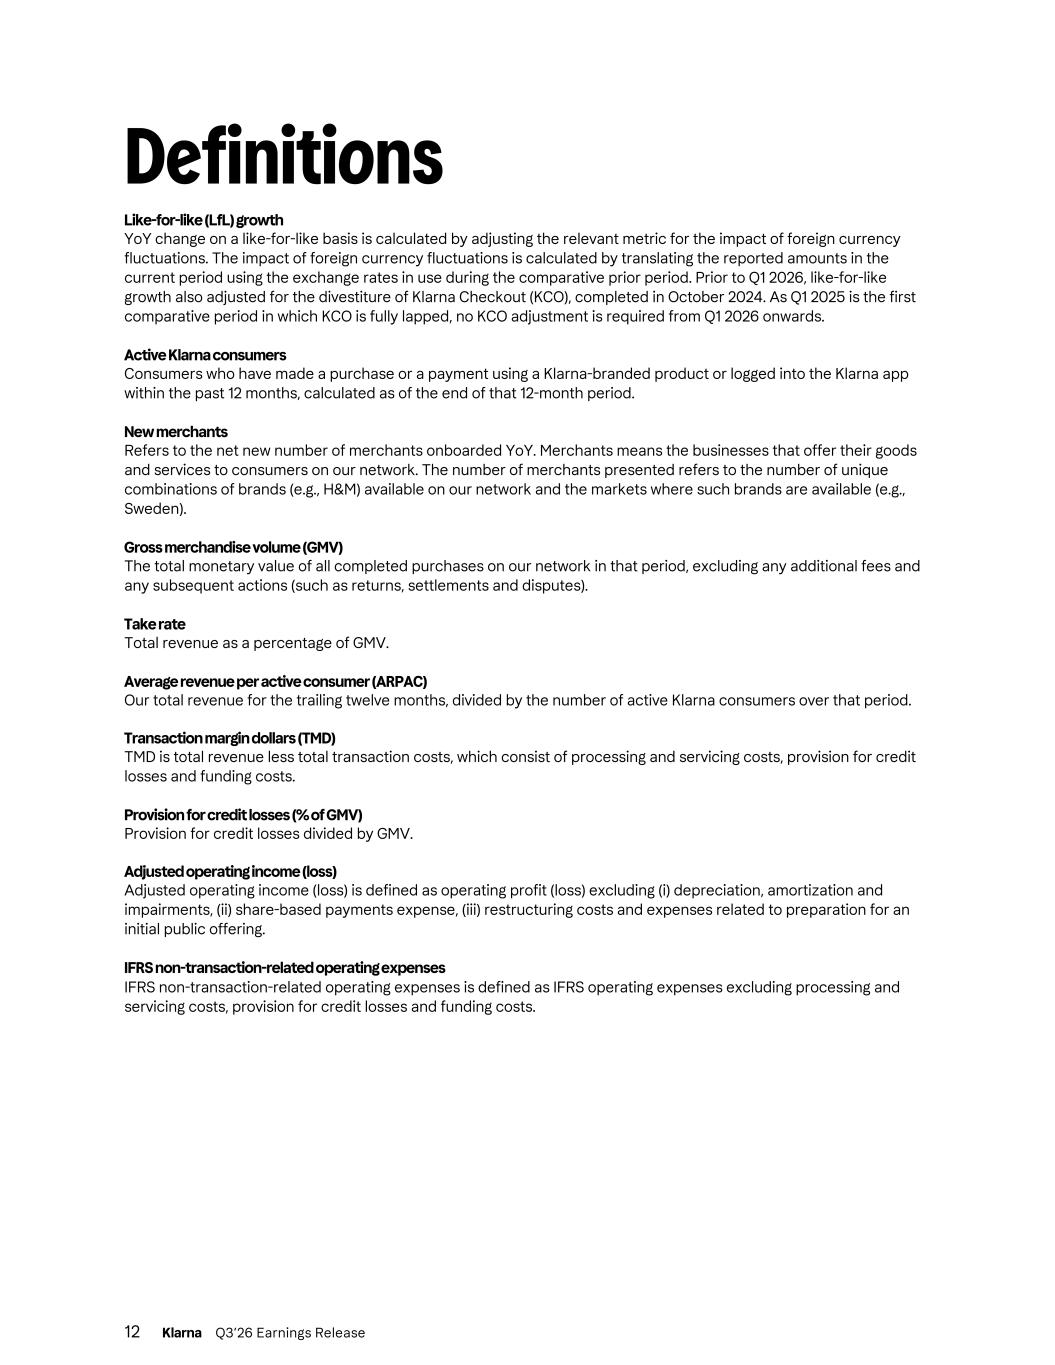
Definitions Like-for-like (LfL) growth YoY change on a like-for-like basis is calculated by adjusting the relevant metric for the impact of foreign currency fluctuations. The impact of foreign currency fluctuations is calculated by translating the reported amounts in the current period using the exchange rates in use during the comparative prior period. Prior to Q1 2026, like-for-like growth also adjusted for the divestiture of Klarna Checkout (KCO), completed in October 2024. As Q1 2025 is the first comparative period in which KCO is fully lapped, no KCO adjustment is required from Q1 2026 onwards. Active Klarna consumers Consumers who have made a purchase or a payment using a Klarna-branded product or logged into the Klarna app within the past 12 months, calculated as of the end of that 12-month period. New merchants Refers to the net new number of merchants onboarded YoY. Merchants means the businesses that offer their goods and services to consumers on our network. The number of merchants presented refers to the number of unique combinations of brands (e.g., H&M) available on our network and the markets where such brands are available (e.g., Sweden). Gross merchandise volume (GMV) The total monetary value of all completed purchases on our network in that period, excluding any additional fees and any subsequent actions (such as returns, settlements and disputes). Take rate Total revenue as a percentage of GMV. Average revenue per active consumer (ARPAC) Our total revenue for the trailing twelve months, divided by the number of active Klarna consumers over that period. Transaction margin dollars (TMD) TMD is total revenue less total transaction costs, which consist of processing and servicing costs, provision for credit losses and funding costs. Provision for credit losses (% of GMV) Provision for credit losses divided by GMV. Adjusted operating income (loss) Adjusted operating income (loss) is defined as operating profit (loss) excluding (i) depreciation, amortization and impairments, (ii) share-based payments expense, (iii) restructuring costs and expenses related to preparation for an initial public offering. IFRS non-transaction-related operating expenses IFRS non-transaction-related operating expenses is defined as IFRS operating expenses excluding processing and servicing costs, provision for credit losses and funding costs. 12 Klarna Q3’26 Earnings Release
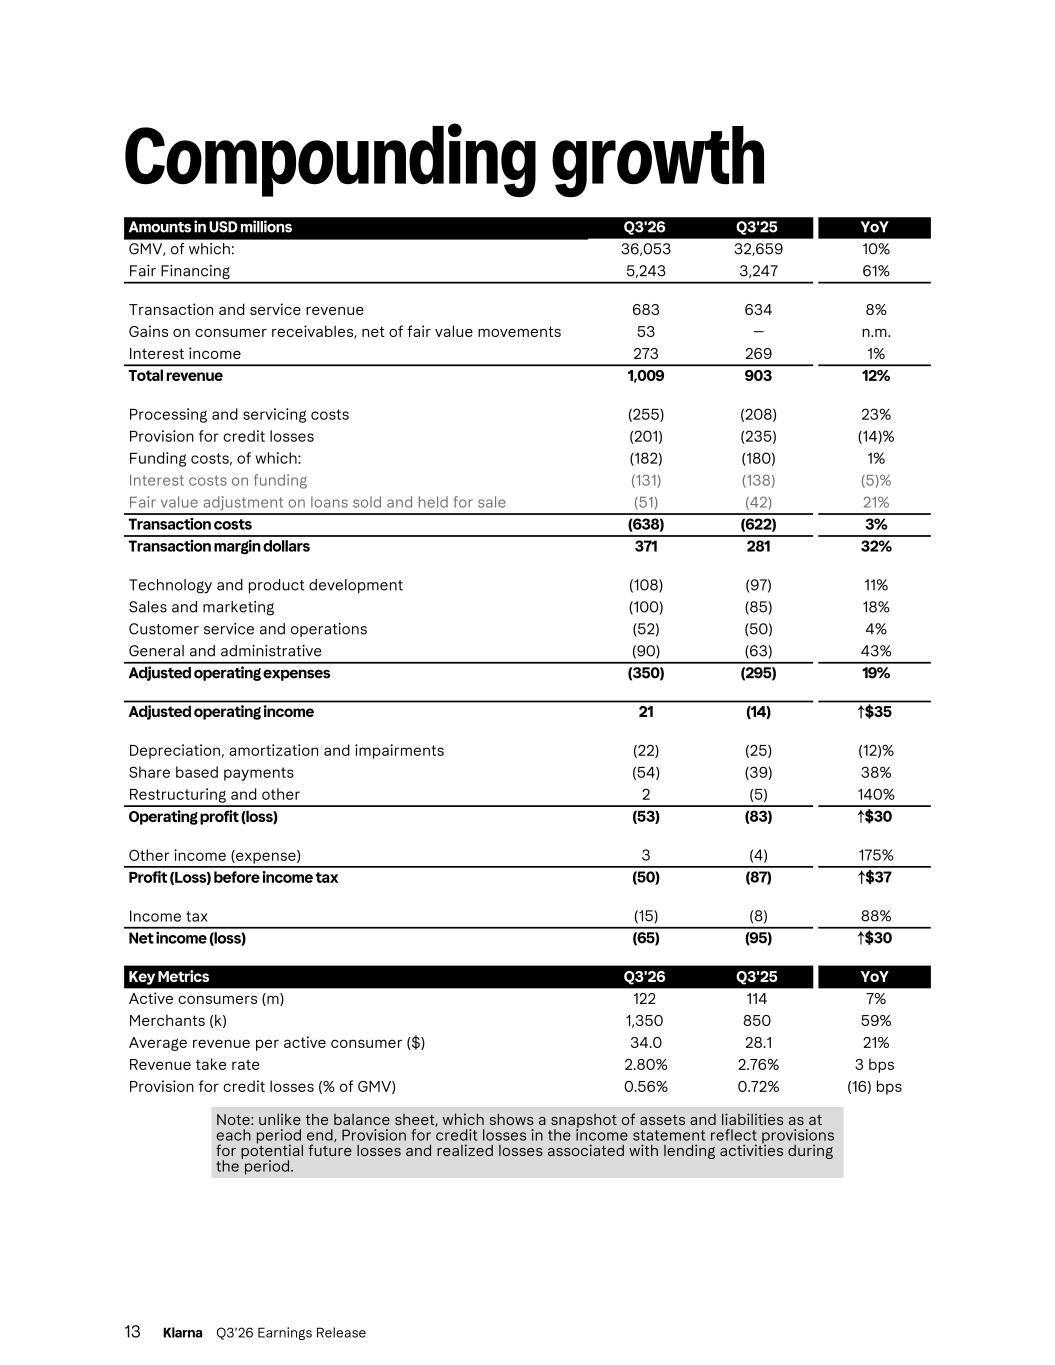
Compounding growth Amounts in USD millions Q3'26 Q3'25 YoY GMV, of which: 36,053 32,659 10% Fair Financing 5,243 3,247 61% Transaction and service revenue 683 634 8% Gains on consumer receivables, net of fair value movements 53 — n.m. Interest income 273 269 1% Total revenue 1,009 903 12% Processing and servicing costs (255) (208) 23% Provision for credit losses (201) (235) (14)% Funding costs, of which: (182) (180) 1% Interest costs on funding (131) (138) (5)% Fair value adjustment on loans sold and held for sale (51) (42) 21% Transaction costs (638) (622) 3% Transaction margin dollars 371 281 32% Technology and product development (108) (97) 11% Sales and marketing (100) (85) 18% Customer service and operations (52) (50) 4% General and administrative (90) (63) 43% Adjusted operating expenses (350) (295) 19% Adjusted operating income 21 (14) ↑$35 Depreciation, amortization and impairments (22) (25) (12)% Share based payments (54) (39) 38% Restructuring and other 2 (5) 140% Operating profit (loss) (53) (83) ↑$30 Other income (expense) 3 (4) 175% Profit (Loss) before income tax (50) (87) ↑$37 Income tax (15) (8) 88% Net income (loss) (65) (95) ↑$30 Key Metrics Q3'26 Q3'25 YoY Active consumers (m) 122 114 7% Merchants (k) 1,350 850 59% Average revenue per active consumer ($) 34.0 28.1 21% Revenue take rate 2.80% 2.76% 3 bps Provision for credit losses (% of GMV) 0.56% 0.72% (16) bps Note: unlike the balance sheet, which shows a snapshot of assets and liabilities as at each period end, Provision for credit losses in the income statement reflect provisions for potential future losses and realized losses associated with lending activities during the period. 13 Klarna Q3’26 Earnings Release
Non-IFRS measures and reconciliations We use certain non-IFRS financial measures to supplement our consolidated financial statements, which are presented in accordance with IFRS. These non-IFRS financial measures include TMD, Transaction margin, Adjusted operating income (loss), Adjusted operating expenses and Adjusted operating margin. We use these non-IFRS financial measures to facilitate the review of our operational performance and as a basis for strategic planning. We also present period-over-period changes in certain metrics on like-for-like (LfL) basis, which is calculated by adjusting the metric for the impact of foreign currency fluctuations. The impact of foreign currency fluctuations is calculated by translating the reported amounts in the current period using the exchange rates in use during the comparative prior period. TMD and Transaction margin are key performance measures used by our management to measure our ability to attain efficiency and scale and to grow these metrics over time. They measure our success in growing revenue while effectively managing our processing and servicing costs, provision for credit losses and funding costs. In addition, by excluding certain items that are nonrecurring or not reflective of the performance of our normal course of business, we believe that Adjusted operating expenses, Adjusted operating income (loss) and Adjusted operating margin provide meaningful supplemental information regarding our performance. Accordingly, we believe that these non-IFRS financial measures are useful to investors and others because they allow investors to supplement their understanding of our financial trends and evaluate our ongoing and future performance in the same manner as management. However, there are several limitations related to the use of non-IFRS financial measures as they reflect the exercise of judgment by our management about which expenses are excluded or included in determining these non-IFRS measures. These non-IFRS measures should be considered in addition to, not as a substitute for or in isolation from, our financial results prepared in accordance with IFRS. Other companies, including companies in our industry, may calculate these non-IFRS (or similar non-GAAP) financial measures differently or not at all, which reduces their usefulness as comparative measures. TMD is defined as total revenue less total transaction costs, consisting of processing and servicing, provision for credit losses and funding costs. Transaction margin is calculated by dividing TMD by our total revenue. Adjusted operating income (loss) is defined as operating profit (loss) excluding (i) depreciation, amortization and impairments, (ii) share-based payments expense, (iii) restructuring costs and expenses related to preparation for an initial public offering. Adjusted operating expenses are defined as operating expenses excluding (i) depreciation, amortization and impairments, (ii) share- based payments expense and (iii) restructuring costs and expenses related to preparation for an initial public offering. Adjusted operating margin is defined as Adjusted operating income (loss) divided by our total revenue. Depreciation, amortization and impairments below include amounts recorded within Technology and product development expenses in our consolidated statements of profit and loss. We consider the exclusion of certain nonrecurring or noncash items in calculating Adjusted operating income (loss), Adjusted operating margin and Adjusted non-transaction-related operating expenses to provide a useful measure for investors and others to evaluate our operating results and expenses in the same manner as management. 14 Klarna Q3’26 Earnings Release
Forward-looking statements This earnings release contains forward-looking statements within the meaning of applicable securities laws. These statements include, but are not limited to, statements regarding our future financial performance, business strategy, growth objectives, market opportunities, expected timing of becoming live with PSPs and other partners, utilization of our forward-flow and similar arrangements and other operational plans. Words such as "believe," "expect," "anticipate," "intend," "plan," "will," "may," "could," "estimate" and similar expressions identify forward-looking statements. These forward-looking statements are subject to risks, uncertainties, and assumptions that could cause actual results to differ materially from those expressed or implied, including risks related to: • Our ability to retain and grow consumer and merchant relationships; • Competition and technological developments; • Regulatory compliance and licensing requirements; • Credit risk management and funding availability; • General economic conditions and market volatility; and • Our ability to expand into new markets and products, including our ability to successfully develop, launch and monetize AI-enabled and agentic commerce products. Forward-looking statements reflect our views as of the date of this release and are based on information currently available to us. We undertake no obligation to update any forward-looking statements, except as required by law. Actual results may differ materially from those anticipated. Investors should not place undue reliance on these forward-looking statements and should review the risk factors in our filings with the SEC for a more complete discussion of risks. 15 Klarna Q3’26 Earnings Release
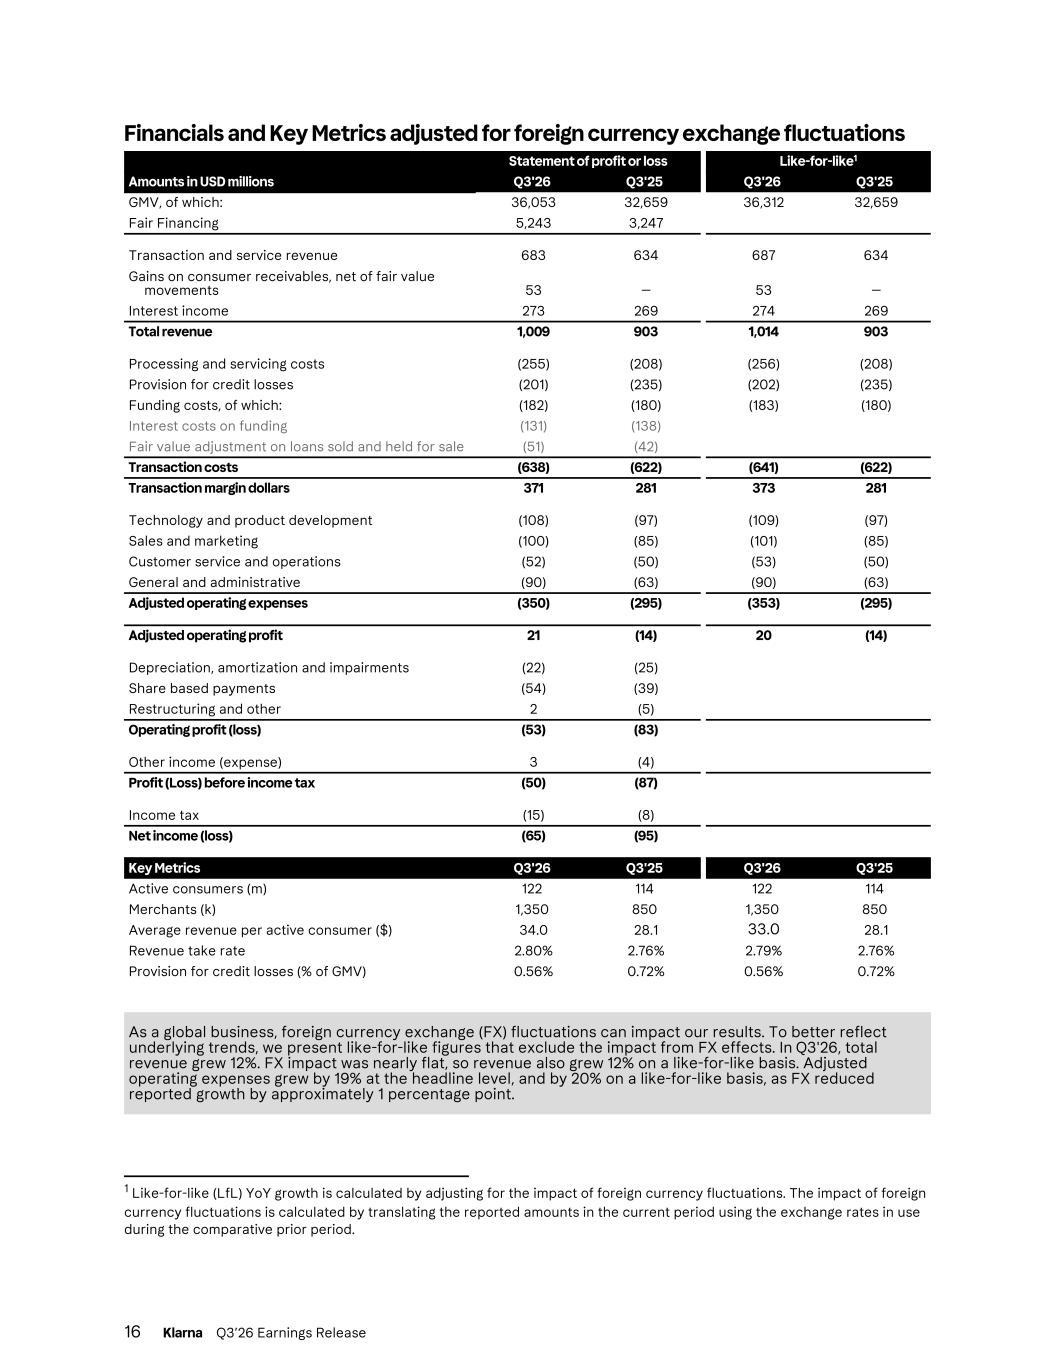
Financials and Key Metrics adjusted for foreign currency exchange fluctuations Statement of profit or loss Like-for-like1 Amounts in USD millions Q3'26 Q3'25 Q3'26 Q3'25 GMV, of which: 36,053 32,659 36,312 32,659 Fair Financing 5,243 3,247 Transaction and service revenue 683 634 687 634 Gains on consumer receivables, net of fair value movements 53 — 53 — Interest income 273 269 274 269 Total revenue 1,009 903 1,014 903 Processing and servicing costs (255) (208) (256) (208) Provision for credit losses (201) (235) (202) (235) Funding costs, of which: (182) (180) (183) (180) Interest costs on funding (131) (138) Fair value adjustment on loans sold and held for sale (51) (42) Transaction costs (638) (622) (641) (622) Transaction margin dollars 371 281 373 281 Technology and product development (108) (97) (109) (97) Sales and marketing (100) (85) (101) (85) Customer service and operations (52) (50) (53) (50) General and administrative (90) (63) (90) (63) Adjusted operating expenses (350) (295) (353) (295) Adjusted operating profit 21 (14) 20 (14) Depreciation, amortization and impairments (22) (25) Share based payments (54) (39) Restructuring and other 2 (5) Operating profit (loss) (53) (83) Other income (expense) 3 (4) Profit (Loss) before income tax (50) (87) Income tax (15) (8) Net income (loss) (65) (95) Key Metrics Q3'26 Q3'25 Q3'26 Q3'25 Active consumers (m) 122 114 122 114 Merchants (k) 1,350 850 1,350 850 Average revenue per active consumer ($) 34.0 28.1 33.0 28.1 Revenue take rate 2.80% 2.76% 2.79% 2.76% Provision for credit losses (% of GMV) 0.56% 0.72% 0.56% 0.72% As a global business, foreign currency exchange (FX) fluctuations can impact our results. To better reflect underlying trends, we present like-for-like figures that exclude the impact from FX effects. In Q3'26, total revenue grew 12%. FX impact was nearly flat, so revenue also grew 12% on a like-for-like basis. Adjusted operating expenses grew by 19% at the headline level, and by 20% on a like-for-like basis, as FX reduced reported growth by approximately 1 percentage point. 16 Klarna Q3’26 Earnings Release 1 Like-for-like (LfL) YoY growth is calculated by adjusting for the impact of foreign currency fluctuations. The impact of foreign currency fluctuations is calculated by translating the reported amounts in the current period using the exchange rates in use during the comparative prior period.
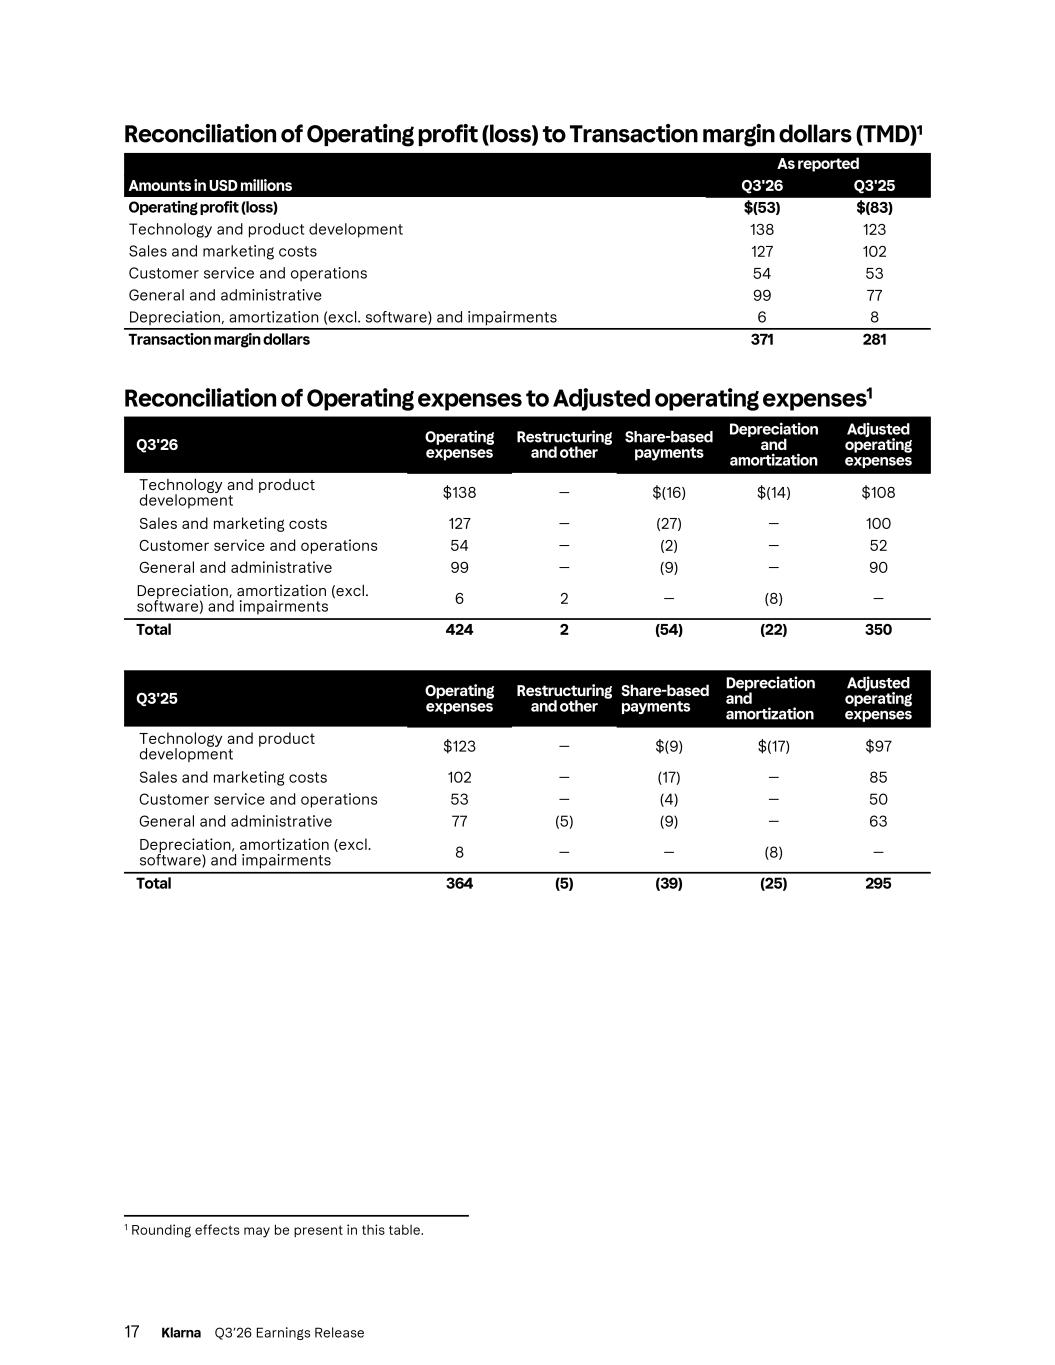
Reconciliation of Operating profit (loss) to Transaction margin dollars (TMD)¹ As reported Amounts in USD millions Q3'26 Q3'25 Operating profit (loss) $(53) $(83) Technology and product development 138 123 Sales and marketing costs 127 102 Customer service and operations 54 53 General and administrative 99 77 Depreciation, amortization (excl. software) and impairments 6 8 Transaction margin dollars 371 281 Reconciliation of Operating expenses to Adjusted operating expenses1 Q3'26 Operating expenses Restructuring and other Share-based payments Depreciation and amortization Adjusted operating expenses Technology and product development $138 — $(16) $(14) $108 Sales and marketing costs 127 — (27) — 100 Customer service and operations 54 — (2) — 52 General and administrative 99 — (9) — 90 Depreciation, amortization (excl. software) and impairments 6 2 — (8) — Total 424 2 (54) (22) 350 Q3'25 Operating expenses Restructuring and other Share-based payments Depreciation and amortization Adjusted operating expenses Technology and product development $123 — $(9) $(17) $97 Sales and marketing costs 102 — (17) — 85 Customer service and operations 53 — (4) — 50 General and administrative 77 (5) (9) — 63 Depreciation, amortization (excl. software) and impairments 8 — — (8) — Total 364 (5) (39) (25) 295 17 Klarna Q3’26 Earnings Release 1 Rounding effects may be present in this table.
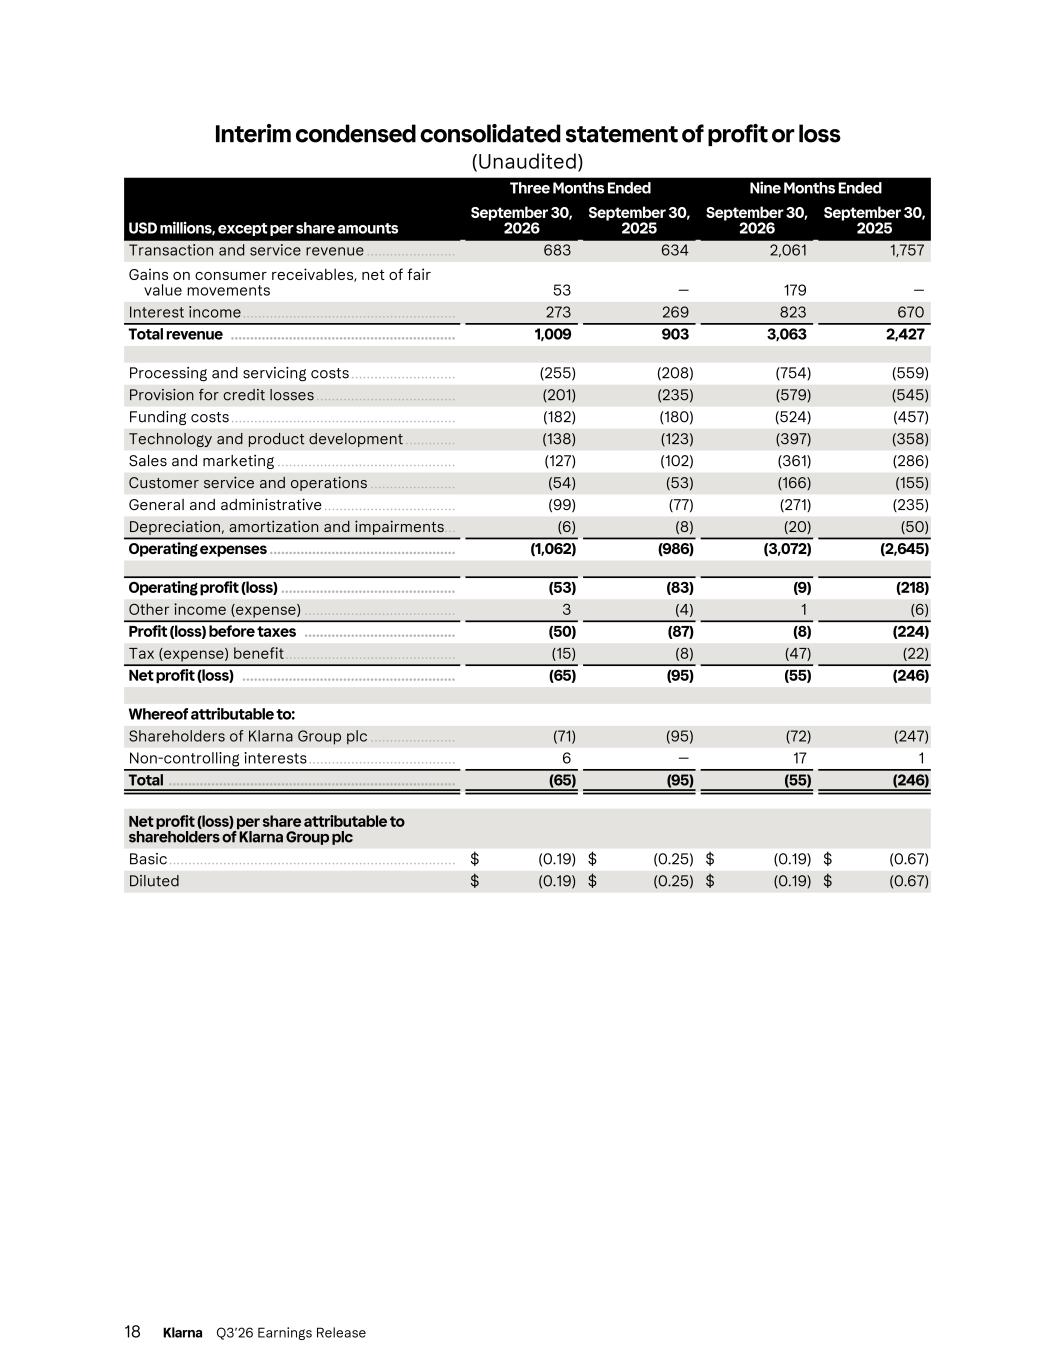
Interim condensed consolidated statement of profit or loss (Unaudited) Three Months Ended Nine Months Ended USD millions, except per share amounts September 30, 2026 September 30, 2025 September 30, 2026 September 30, 2025 Transaction and service revenue ....................... 683 634 2,061 1,757 Gains on consumer receivables, net of fair value movements 53 — 179 — Interest income ....................................................... 273 269 823 670 Total revenue .......................................................... 1,009 903 3,063 2,427 Processing and servicing costs ........................... (255) (208) (754) (559) Provision for credit losses .................................... (201) (235) (579) (545) Funding costs .......................................................... (182) (180) (524) (457) Technology and product development ............. (138) (123) (397) (358) Sales and marketing .............................................. (127) (102) (361) (286) Customer service and operations ...................... (54) (53) (166) (155) General and administrative .................................. (99) (77) (271) (235) Depreciation, amortization and impairments ... (6) (8) (20) (50) Operating expenses ................................................ (1,062) (986) (3,072) (2,645) Operating profit (loss) ............................................. (53) (83) (9) (218) Other income (expense) ....................................... 3 (4) 1 (6) Profit (loss) before taxes ....................................... (50) (87) (8) (224) Tax (expense) benefit ............................................ (15) (8) (47) (22) Net profit (loss) ....................................................... (65) (95) (55) (246) Whereof attributable to: Shareholders of Klarna Group plc ...................... (71) (95) (72) (247) Non-controlling interests ...................................... 6 — 17 1 Total .......................................................................... (65) (95) (55) (246) Net profit (loss) per share attributable to shareholders of Klarna Group plc Basic .......................................................................... $ (0.19) $ (0.25) $ (0.19) $ (0.67) Diluted $ (0.19) $ (0.25) $ (0.19) $ (0.67) 18 Klarna Q3’26 Earnings Release
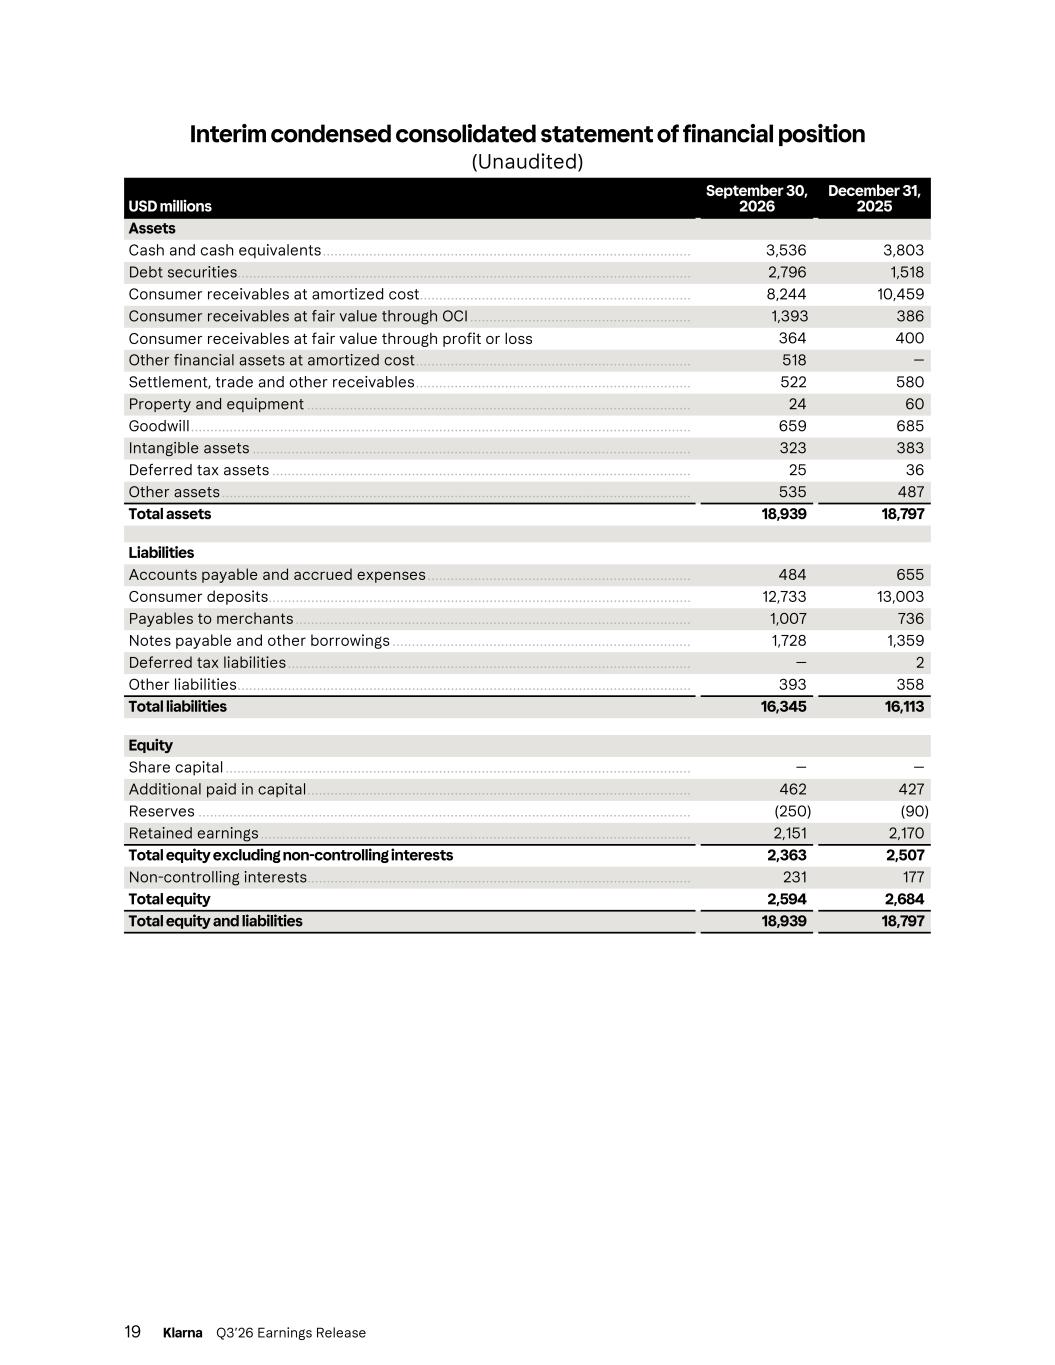
Interim condensed consolidated statement of financial position (Unaudited) USD millions September 30, 2026 December 31, 2025 Assets Cash and cash equivalents ............................................................................................... 3,536 3,803 Debt securities ..................................................................................................................... 2,796 1,518 Consumer receivables at amortized cost ...................................................................... 8,244 10,459 Consumer receivables at fair value through OCI ......................................................... 1,393 386 Consumer receivables at fair value through profit or loss 364 400 Other financial assets at amortized cost ....................................................................... 518 — Settlement, trade and other receivables ....................................................................... 522 580 Property and equipment ................................................................................................... 24 60 Goodwill ................................................................................................................................. 659 685 Intangible assets ................................................................................................................. 323 383 Deferred tax assets ............................................................................................................ 25 36 Other assets ......................................................................................................................... 535 487 Total assets 18,939 18,797 Liabilities Accounts payable and accrued expenses .................................................................... 484 655 Consumer deposits ............................................................................................................. 12,733 13,003 Payables to merchants ...................................................................................................... 1,007 736 Notes payable and other borrowings ............................................................................. 1,728 1,359 Deferred tax liabilities ........................................................................................................ — 2 Other liabilities ..................................................................................................................... 393 358 Total liabilities 16,345 16,113 Equity Share capital ........................................................................................................................ — — Additional paid in capital ................................................................................................... 462 427 Reserves ............................................................................................................................... (250) (90) Retained earnings ............................................................................................................... 2,151 2,170 Total equity excluding non-controlling interests 2,363 2,507 Non-controlling interests ................................................................................................... 231 177 Total equity 2,594 2,684 Total equity and liabilities 18,939 18,797 19 Klarna Q3’26 Earnings Release
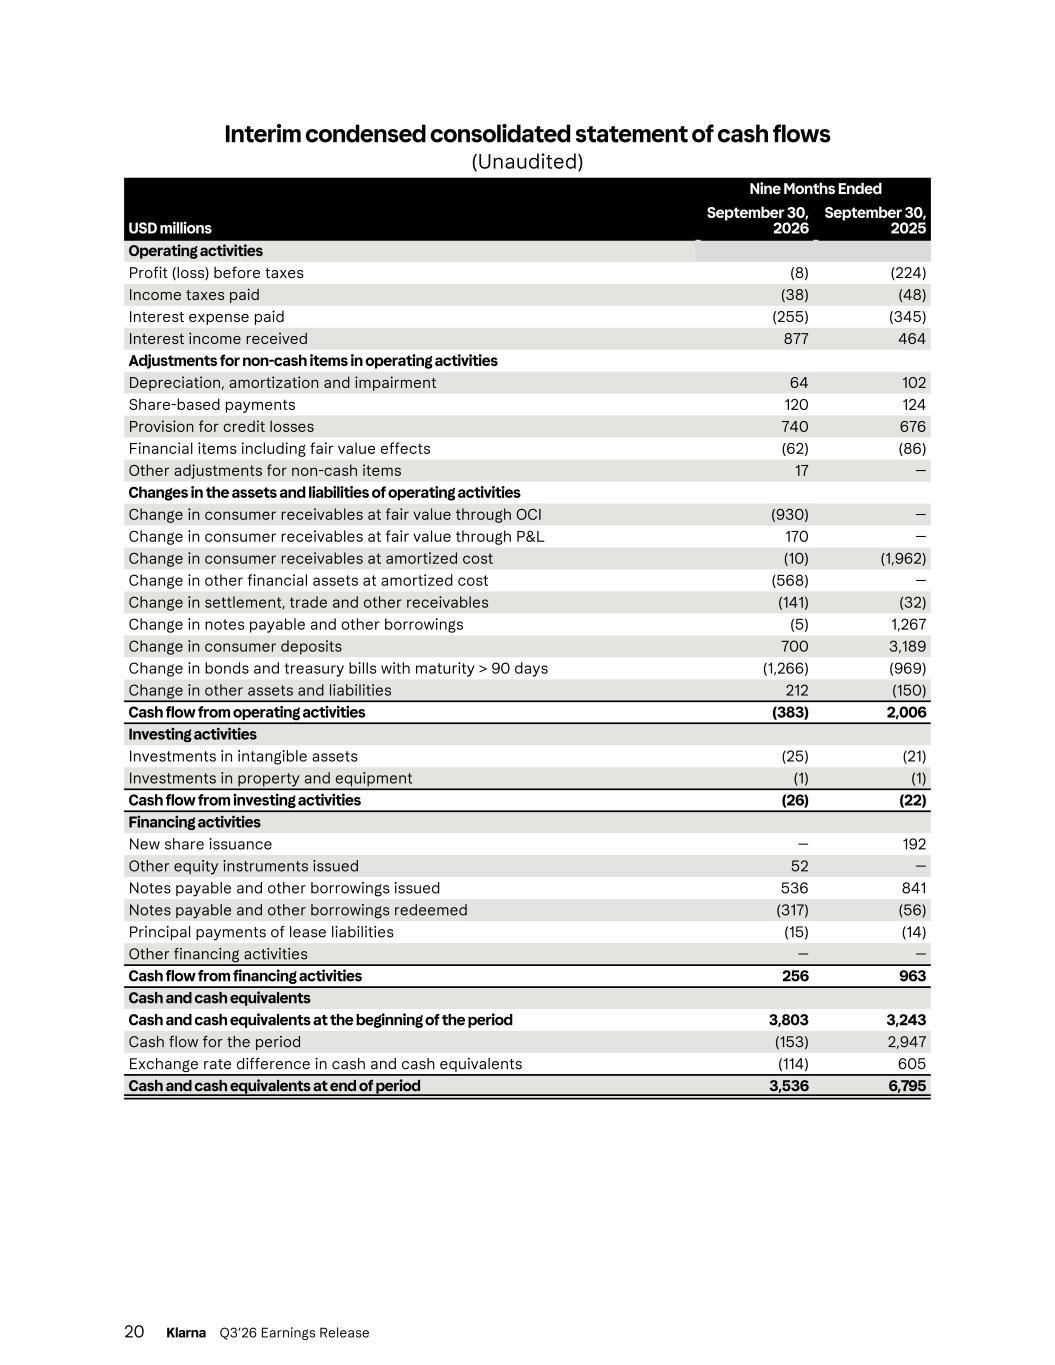
Interim condensed consolidated statement of cash flows (Unaudited) Nine Months Ended USD millions September 30, 2026 September 30, 2025 Operating activities Profit (loss) before taxes (8) (224) Income taxes paid (38) (48) Interest expense paid (255) (345) Interest income received 877 464 Adjustments for non-cash items in operating activities Depreciation, amortization and impairment 64 102 Share-based payments 120 124 Provision for credit losses 740 676 Financial items including fair value effects (62) (86) Other adjustments for non-cash items 17 — Changes in the assets and liabilities of operating activities Change in consumer receivables at fair value through OCI (930) — Change in consumer receivables at fair value through P&L 170 — Change in consumer receivables at amortized cost (10) (1,962) Change in other financial assets at amortized cost (568) — Change in settlement, trade and other receivables (141) (32) Change in notes payable and other borrowings (5) 1,267 Change in consumer deposits 700 3,189 Change in bonds and treasury bills with maturity > 90 days (1,266) (969) Change in other assets and liabilities 212 (150) Cash flow from operating activities (383) 2,006 Investing activities Investments in intangible assets (25) (21) Investments in property and equipment (1) (1) Cash flow from investing activities (26) (22) Financing activities New share issuance — 192 Other equity instruments issued 52 — Notes payable and other borrowings issued 536 841 Notes payable and other borrowings redeemed (317) (56) Principal payments of lease liabilities (15) (14) Other financing activities — — Cash flow from financing activities 256 963 Cash and cash equivalents Cash and cash equivalents at the beginning of the period 3,803 3,243 Cash flow for the period (153) 2,947 Exchange rate difference in cash and cash equivalents (114) 605 Cash and cash equivalents at end of period 3,536 6,795 20 Klarna Q3’26 Earnings Release