
Investor Presentation November 17, 2026
Forward Looking Statements Certain information in this report may contain forward-looking statements within the meaning of the safe harbor provisions of the U.S. Private Securities Reform Act of 1995, which are made in good faith by us. Forward-looking statements include, but are not limited to: (1) projections of revenues, income or loss, earnings or loss per common share, capital structure and other financial items; (2) plans and objectives of the management or Boards of Directors of the Company or CFBank; (3) statements regarding future events, actions or economic performance; and (4) statements of assumptions underlying such statements. Words such as "estimate," "strategy," "may," "believe," "anticipate," "expect," "predict," "will," "intend," "plan," "targeted," and the negative of these terms, or similar expressions, are intended to identify forward-looking statements, but are not the exclusive means of identifying such statements. Various risks and uncertainties may cause actual results to differ materially from those indicated by our forward-looking statements, including, without limitation, those risks detailed from time to time in our reports filed with the SEC, including those risk factors identified in “Item 1A. Risk Factors” of Part I of our Annual Report on Form 10-K filed with SEC for the year ended December 31, 2025. Forward-looking statements are not guarantees of performance or results. A forward-looking statement may include a statement of the assumptions or bases underlying the forward-looking statement. We believe that we have chosen these assumptions or bases in good faith and that they are reasonable. We caution you, however, that assumptions or bases almost always vary from actual results, and the differences between assumptions or bases and actual results can be material. The forward-looking statements included in this press release speak only as of the date hereof. We undertake no obligation to publicly release revisions to any forward-looking statements to reflect events or circumstances after the date of such statements, except to the extent required by law. Non-GAAP Financial Measures This presentation contains certain financial information determined by methods other than in accordance with accounting principles generally accepted in the United States (GAAP). Such non-GAAP financial information should be considered supplemental to, and not as a substitute for, or superior to, financial measures calculated in accordance with GAAP. However, we believe that non-GAAP reporting provides meaningful information and therefore we use it to supplement our GAAP information. We have chosen to provide this supplemental information to investors, analysts and other interested parties to enable them to perform additional analyses of operating results, to illustrate the results of operations giving effect to the non-GAAP adjustments and to provide an additional measure of performance. We believe this information is helpful in understanding the results of operations separate and apart from items that may, or could, have a disproportional positive or negative impact in any given period. For a reconciliation of the differences between the non-GAAP financial measures and the most comparable GAAP measures, please refer to the reconciliation tables in the appendix at the end of this presentation. Disclaimers
Table of Contents About CF Bankshares Inc. I. Financial Performance II. Appendix III.
About CF Bankshares Inc.
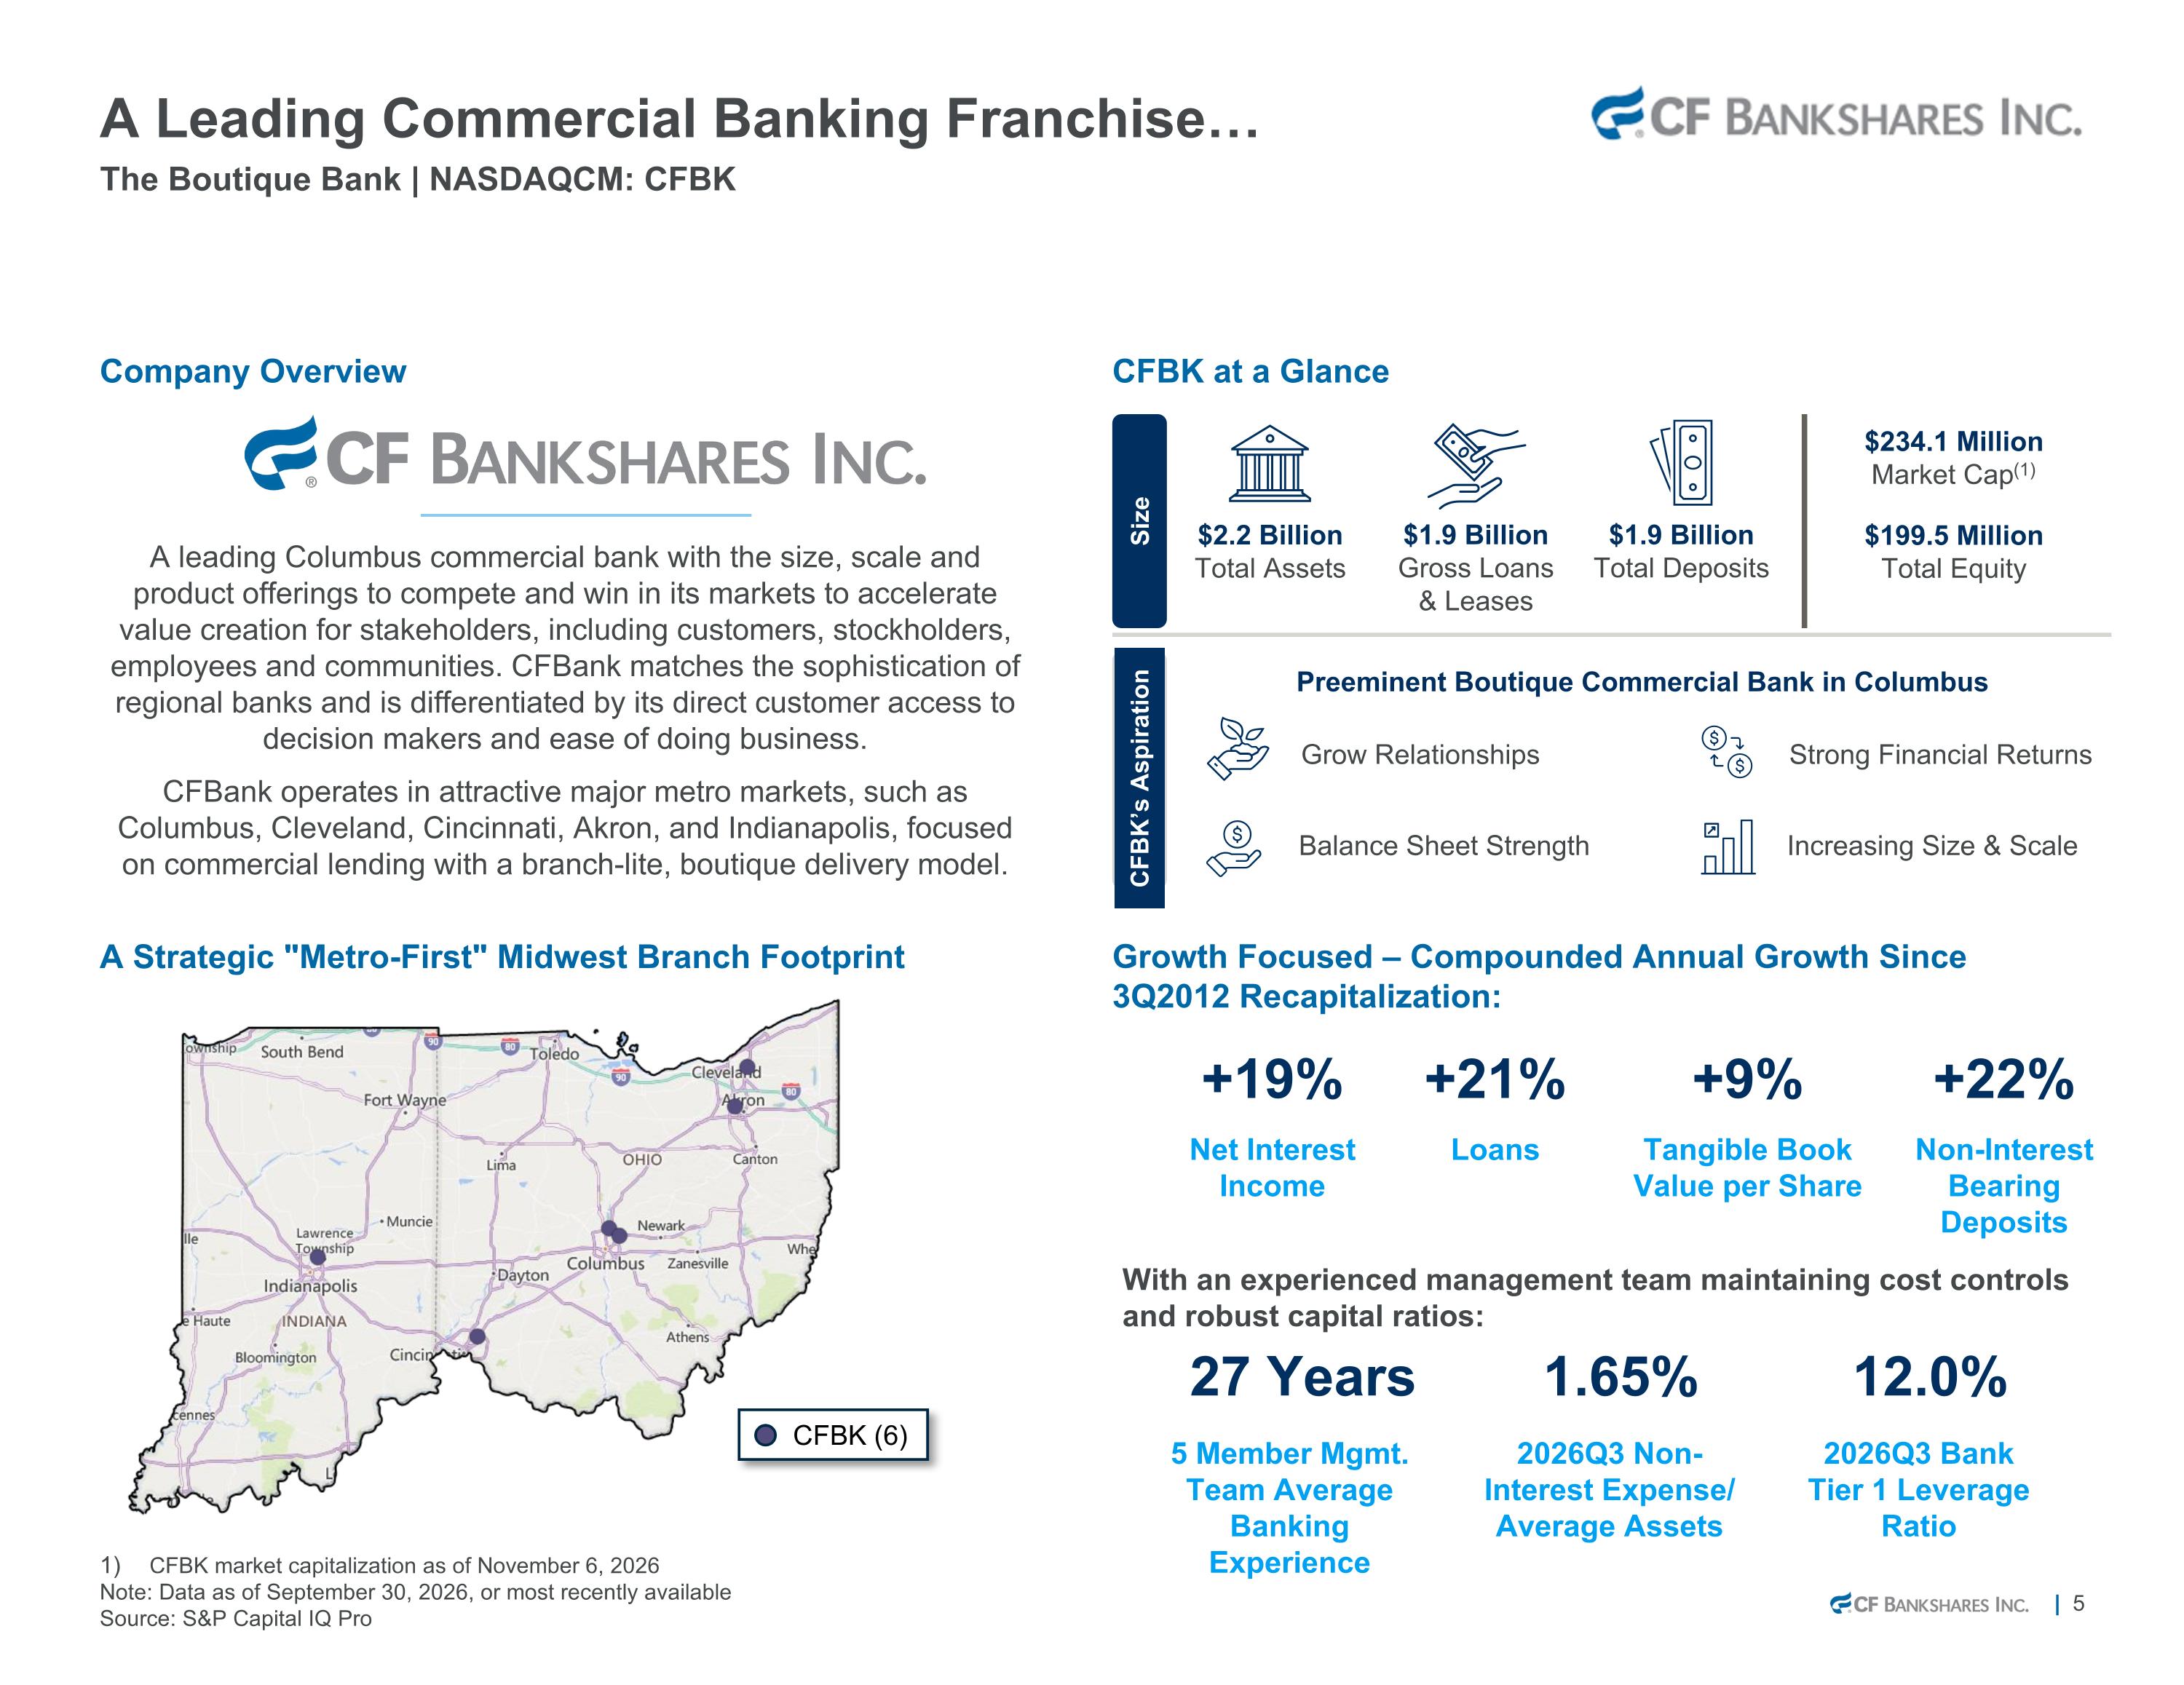
CFBK market capitalization as of November 6, 2026 Note: Data as of September 30, 2026, or most recently available Source: S&P Capital IQ Pro A Leading Commercial Banking Franchise… A leading Columbus commercial bank with the size, scale and product offerings to compete and win in its markets to accelerate value creation for stakeholders, including customers, stockholders, employees and communities. CFBank matches the sophistication of regional banks and is differentiated by its direct customer access to decision makers and ease of doing business. CFBank operates in attractive major metro markets, such as Columbus, Cleveland, Cincinnati, Akron, and Indianapolis, focused on commercial lending with a branch-lite, boutique delivery model. Company Overview The Boutique Bank | NASDAQCM: CFBK CFBK at a Glance A Strategic "Metro-First" Midwest Branch Footprint Growth Focused – Compounded Annual Growth Since 3Q2012 Recapitalization: Size CFBK’s Aspiration $2.2 Billion Total Assets $1.9 Billion Gross Loans & Leases $1.9 Billion Total Deposits $199.5 Million Total Equity $234.1 Million Market Cap(1) Preeminent Boutique Commercial Bank in Columbus Grow Relationships Balance Sheet Strength Strong Financial Returns Increasing Size & Scale CFBK (6) Non-Interest Bearing Deposits Tangible Book Value per Share Loans +22% +21% +9% Net Interest Income +19% With an experienced management team maintaining cost controls and robust capital ratios: 2026Q3 Non-Interest Expense/ Average Assets 1.65% 2026Q3 Bank Tier 1 Leverage Ratio 12.0% 5 Member Mgmt. Team Average Banking Experience 27 Years
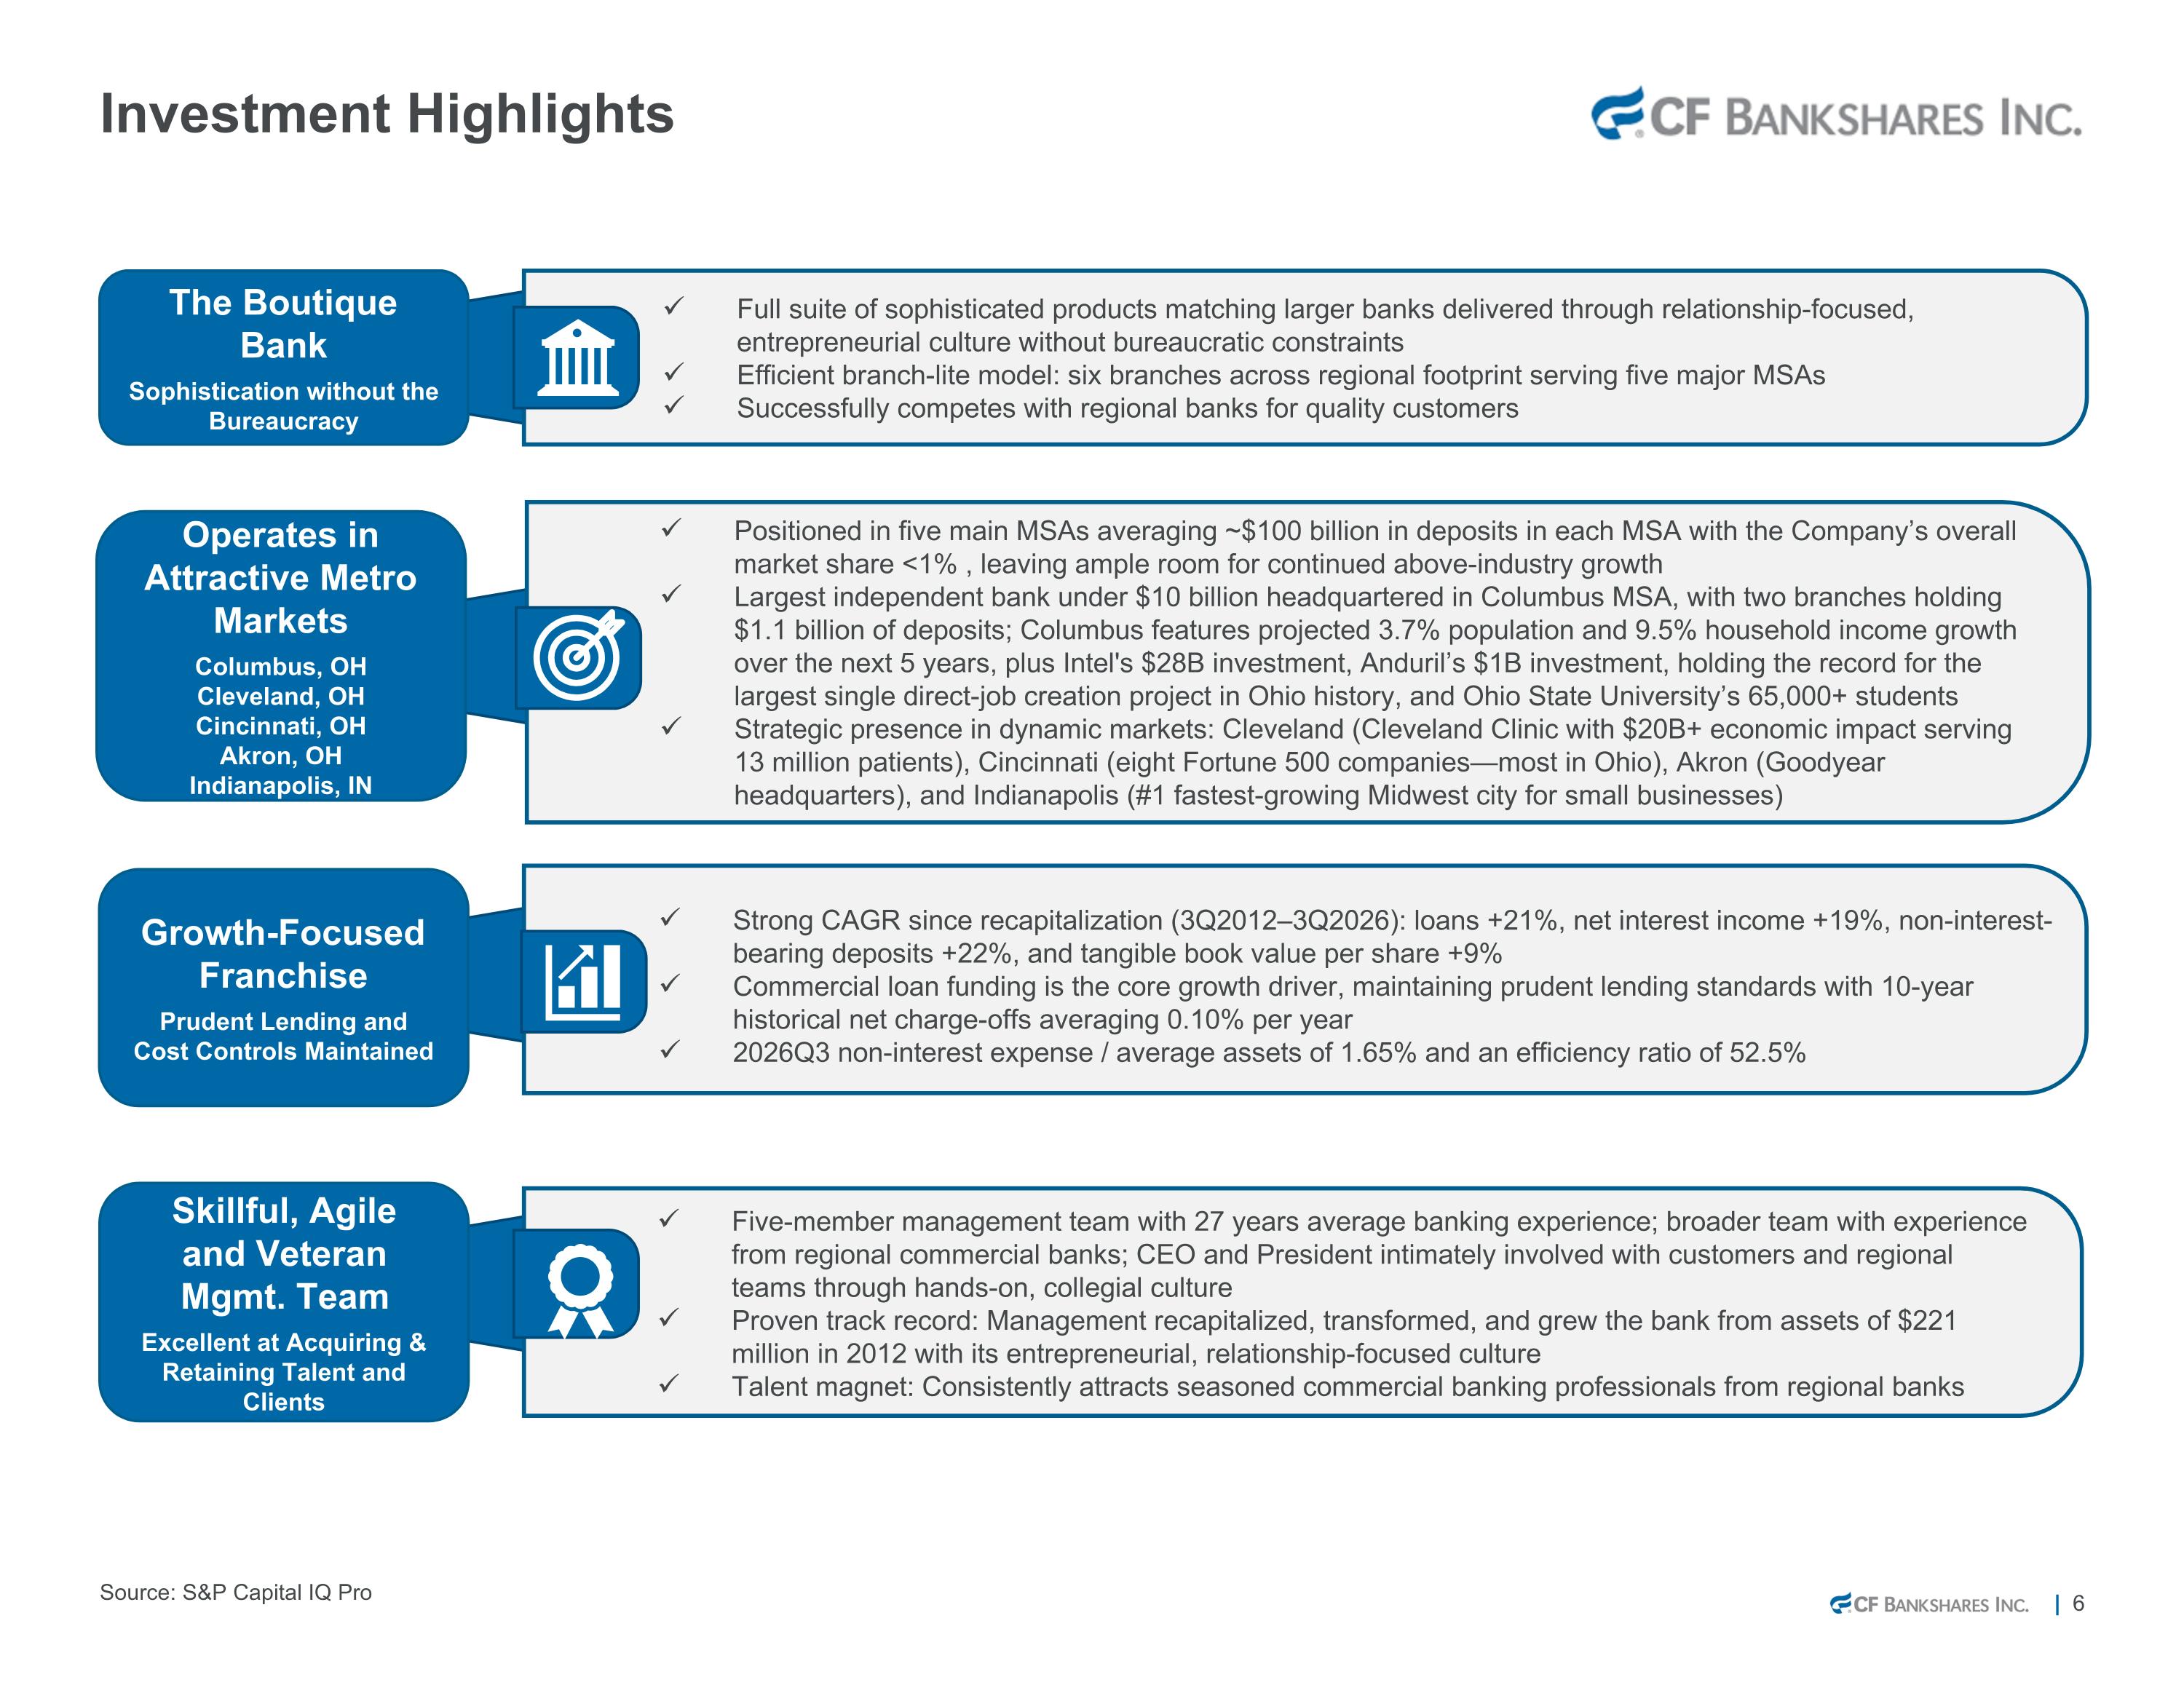
Investment Highlights Growth-Focused Franchise Prudent Lending and Cost Controls Maintained Skillful, Agile and Veteran Mgmt. Team Excellent at Acquiring & Retaining Talent and Clients Operates in Attractive Metro Markets Columbus, OH Cleveland, OH Cincinnati, OH Akron, OH Indianapolis, IN Strong CAGR since recapitalization (3Q2012–3Q2026): loans +21%, net interest income +19%, non-interest-bearing deposits +22%, and tangible book value per share +9% Commercial loan funding is the core growth driver, maintaining prudent lending standards with 10-year historical net charge-offs averaging 0.10% per year 2026Q3 non-interest expense / average assets of 1.65% and an efficiency ratio of 52.5% Five-member management team with 27 years average banking experience; broader team with experience from regional commercial banks; CEO and President intimately involved with customers and regional teams through hands-on, collegial culture Proven track record: Management recapitalized, transformed, and grew the bank from assets of $221 million in 2012 with its entrepreneurial, relationship-focused culture Talent magnet: Consistently attracts seasoned commercial banking professionals from regional banks Positioned in five main MSAs averaging ~$100 billion in deposits in each MSA with the Company’s overall market share <1% , leaving ample room for continued above-industry growth Largest independent bank under $10 billion headquartered in Columbus MSA, with two branches holding $1.1 billion of deposits; Columbus features projected 3.7% population and 9.5% household income growth over the next 5 years, plus Intel's $28B investment, Anduril’s $1B investment, holding the record for the largest single direct-job creation project in Ohio history, and Ohio State University’s 65,000+ students Strategic presence in dynamic markets: Cleveland (Cleveland Clinic with $20B+ economic impact serving 13 million patients), Cincinnati (eight Fortune 500 companies—most in Ohio), Akron (Goodyear headquarters), and Indianapolis (#1 fastest-growing Midwest city for small businesses) Full suite of sophisticated products matching larger banks delivered through relationship-focused, entrepreneurial culture without bureaucratic constraints Efficient branch-lite model: six branches across regional footprint serving five major MSAs Successfully competes with regional banks for quality customers The Boutique Bank Sophistication without the Bureaucracy Source: S&P Capital IQ Pro
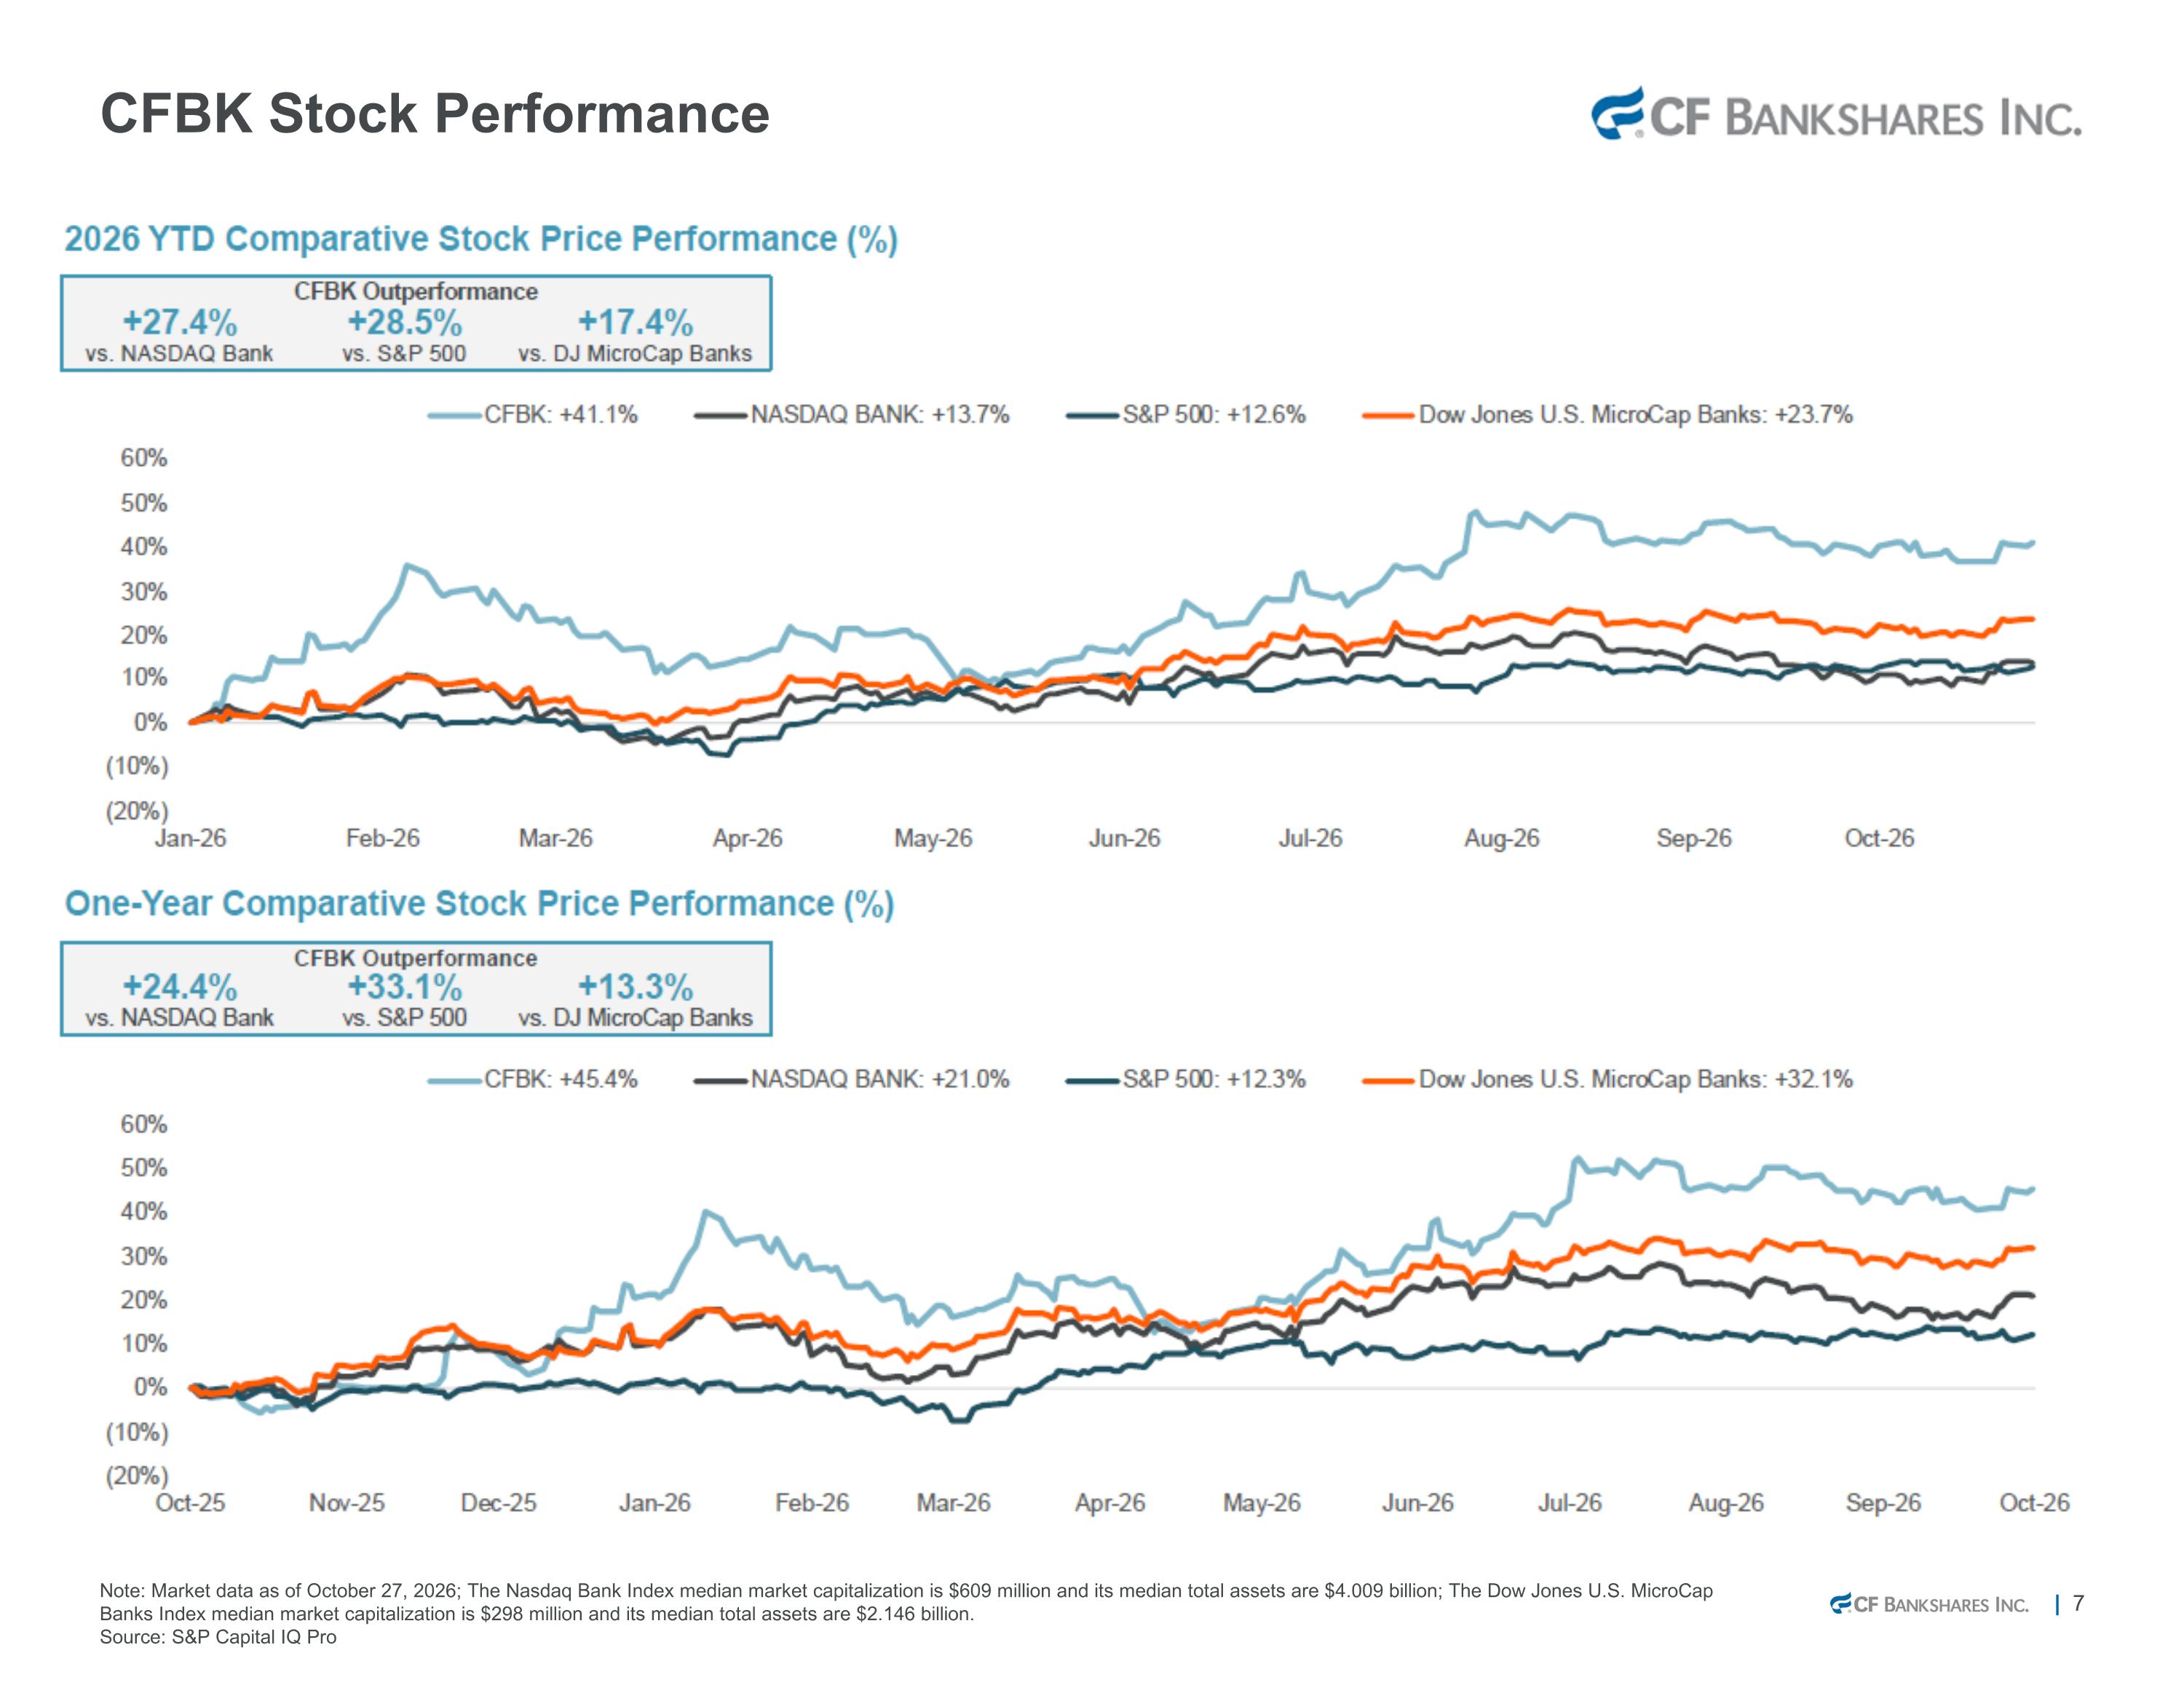
CFBK Stock Performance Note: Market data as of October 27, 2026; The Nasdaq Bank Index median market capitalization is $609 million and its median total assets are $4.009 billion; The Dow Jones U.S. MicroCap Banks Index median market capitalization is $298 million and its median total assets are $2.146 billion. Source: S&P Capital IQ Pro
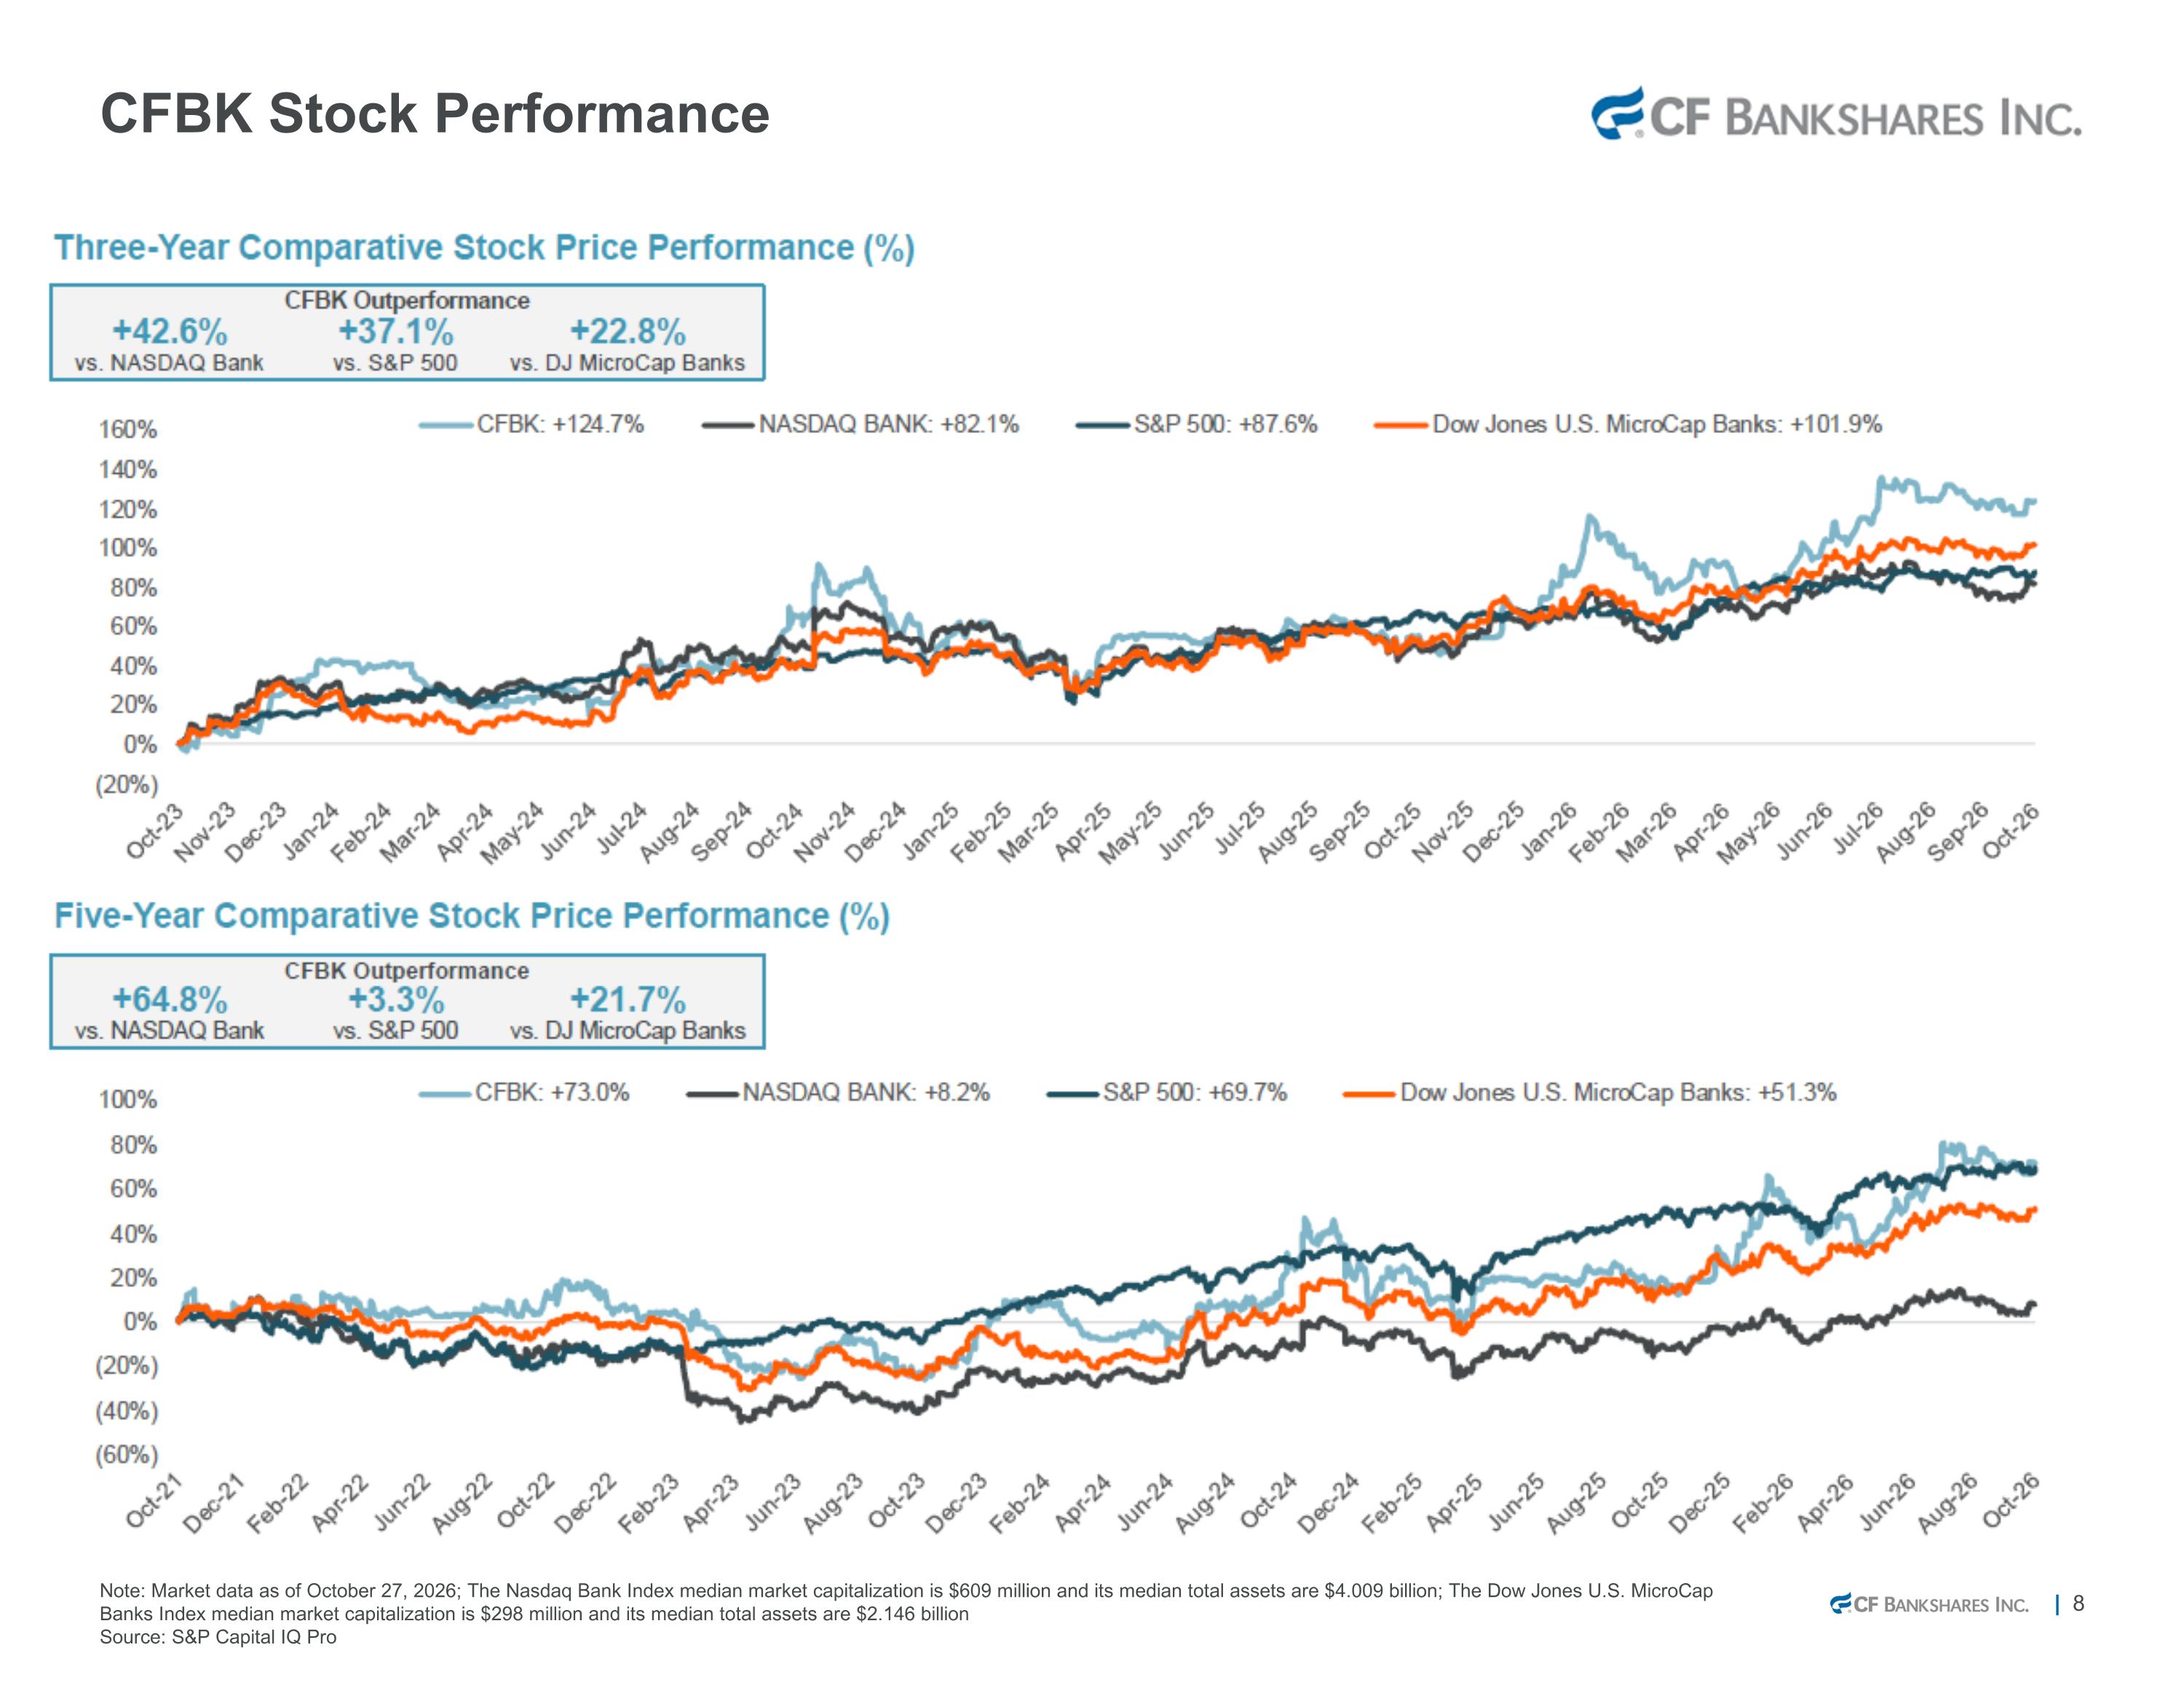
CFBK Stock Performance Note: Market data as of October 27, 2026; The Nasdaq Bank Index median market capitalization is $609 million and its median total assets are $4.009 billion; The Dow Jones U.S. MicroCap Banks Index median market capitalization is $298 million and its median total assets are $2.146 billion Source: S&P Capital IQ Pro
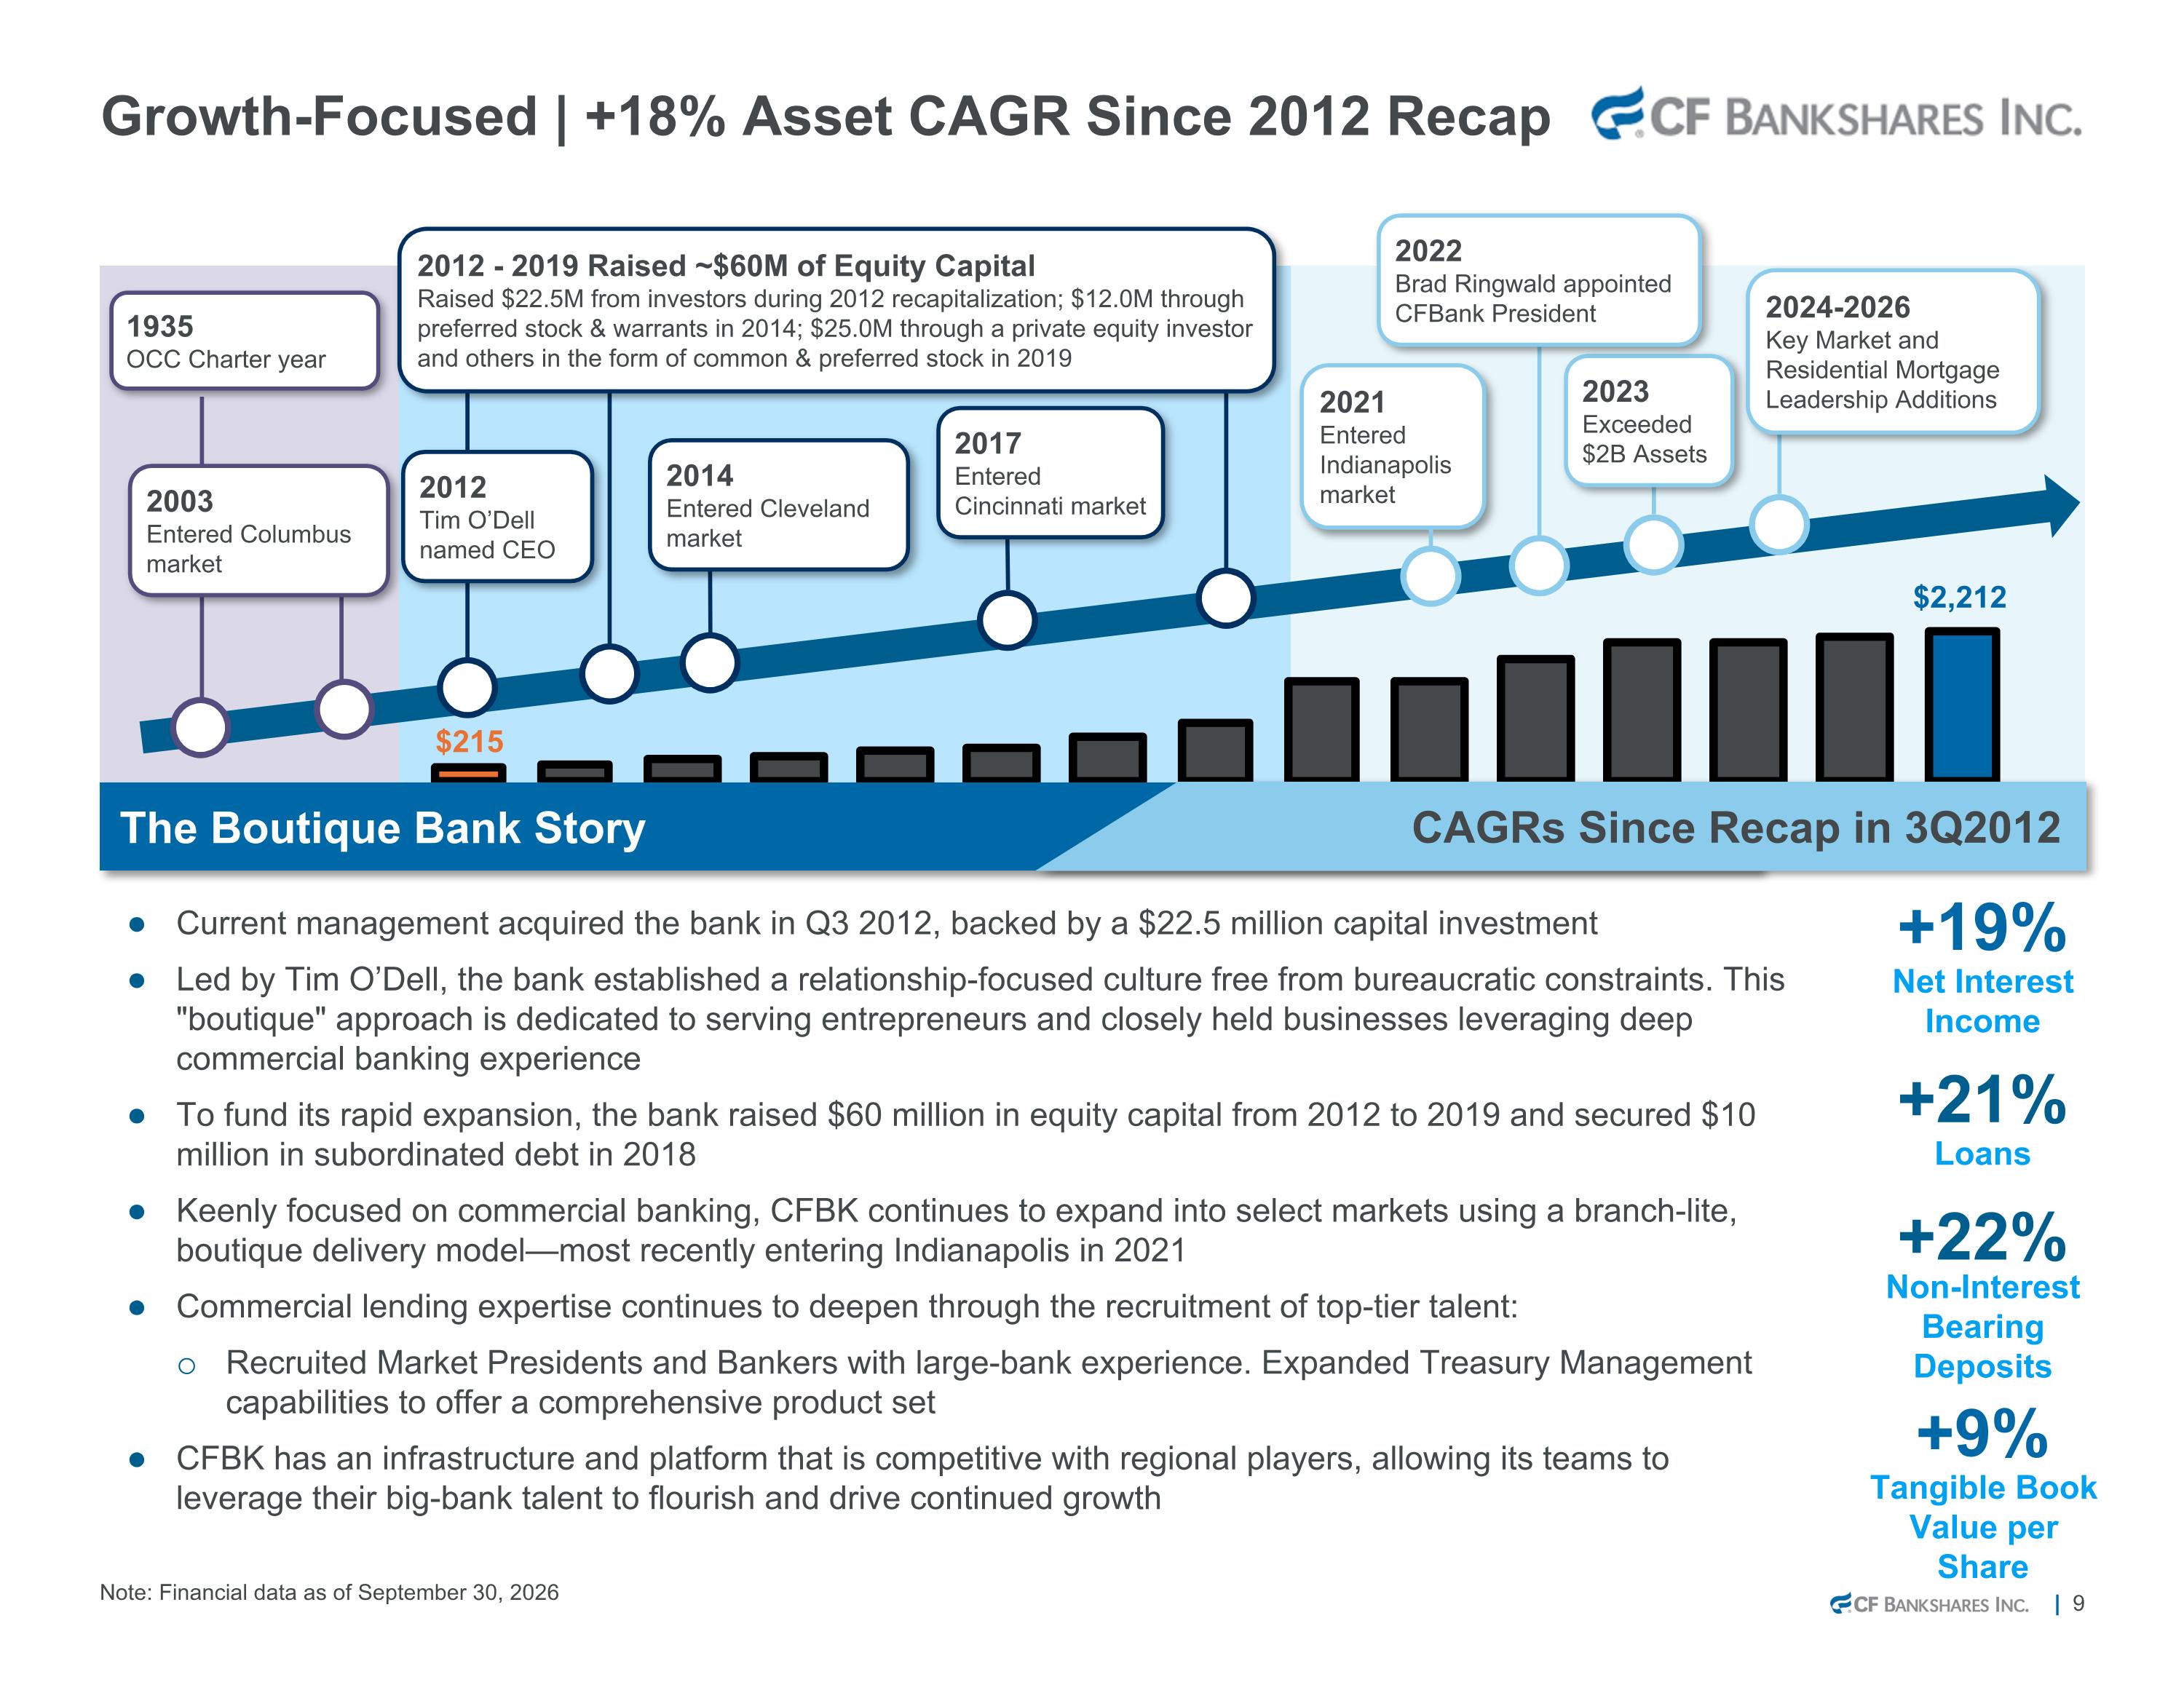
Note: Financial data as of September 30, 2026 Growth-Focused | +18% Asset CAGR Since 2012 Recap Non-Interest Bearing Deposits Tangible Book Value per Share Loans +22% +21% +9% Net Interest Income +19% Current management acquired the bank in Q3 2012, backed by a $22.5 million capital investment Led by Tim O’Dell, the bank established a relationship-focused culture free from bureaucratic constraints. This "boutique" approach is dedicated to serving entrepreneurs and closely held businesses leveraging deep commercial banking experience To fund its rapid expansion, the bank raised $60 million in equity capital from 2012 to 2019 and secured $10 million in subordinated debt in 2018 Keenly focused on commercial banking, CFBK continues to expand into select markets using a branch-lite, boutique delivery model—most recently entering Indianapolis in 2021 Commercial lending expertise continues to deepen through the recruitment of top-tier talent: Recruited Market Presidents and Bankers with large-bank experience. Expanded Treasury Management capabilities to offer a comprehensive product set CFBK has an infrastructure and platform that is competitive with regional players, allowing its teams to leverage their big-bank talent to flourish and drive continued growth 1935 OCC Charter year 2012 - 2019 Raised ~$60M of Equity Capital Raised $22.5M from investors during 2012 recapitalization; $12.0M through preferred stock & warrants in 2014; $25.0M through a private equity investor and others in the form of common & preferred stock in 2019 2021 Entered Indianapolis market The Boutique Bank Story CAGRs Since Recap in 3Q2012 2012 Tim O’Dell named CEO 2003 Entered Columbus market 2017 Entered Cincinnati market 2014 Entered Cleveland market 2024-2026 Key Market and Residential Mortgage Leadership Additions 2023 Exceeded $2B Assets 2022 Brad Ringwald appointed CFBank President
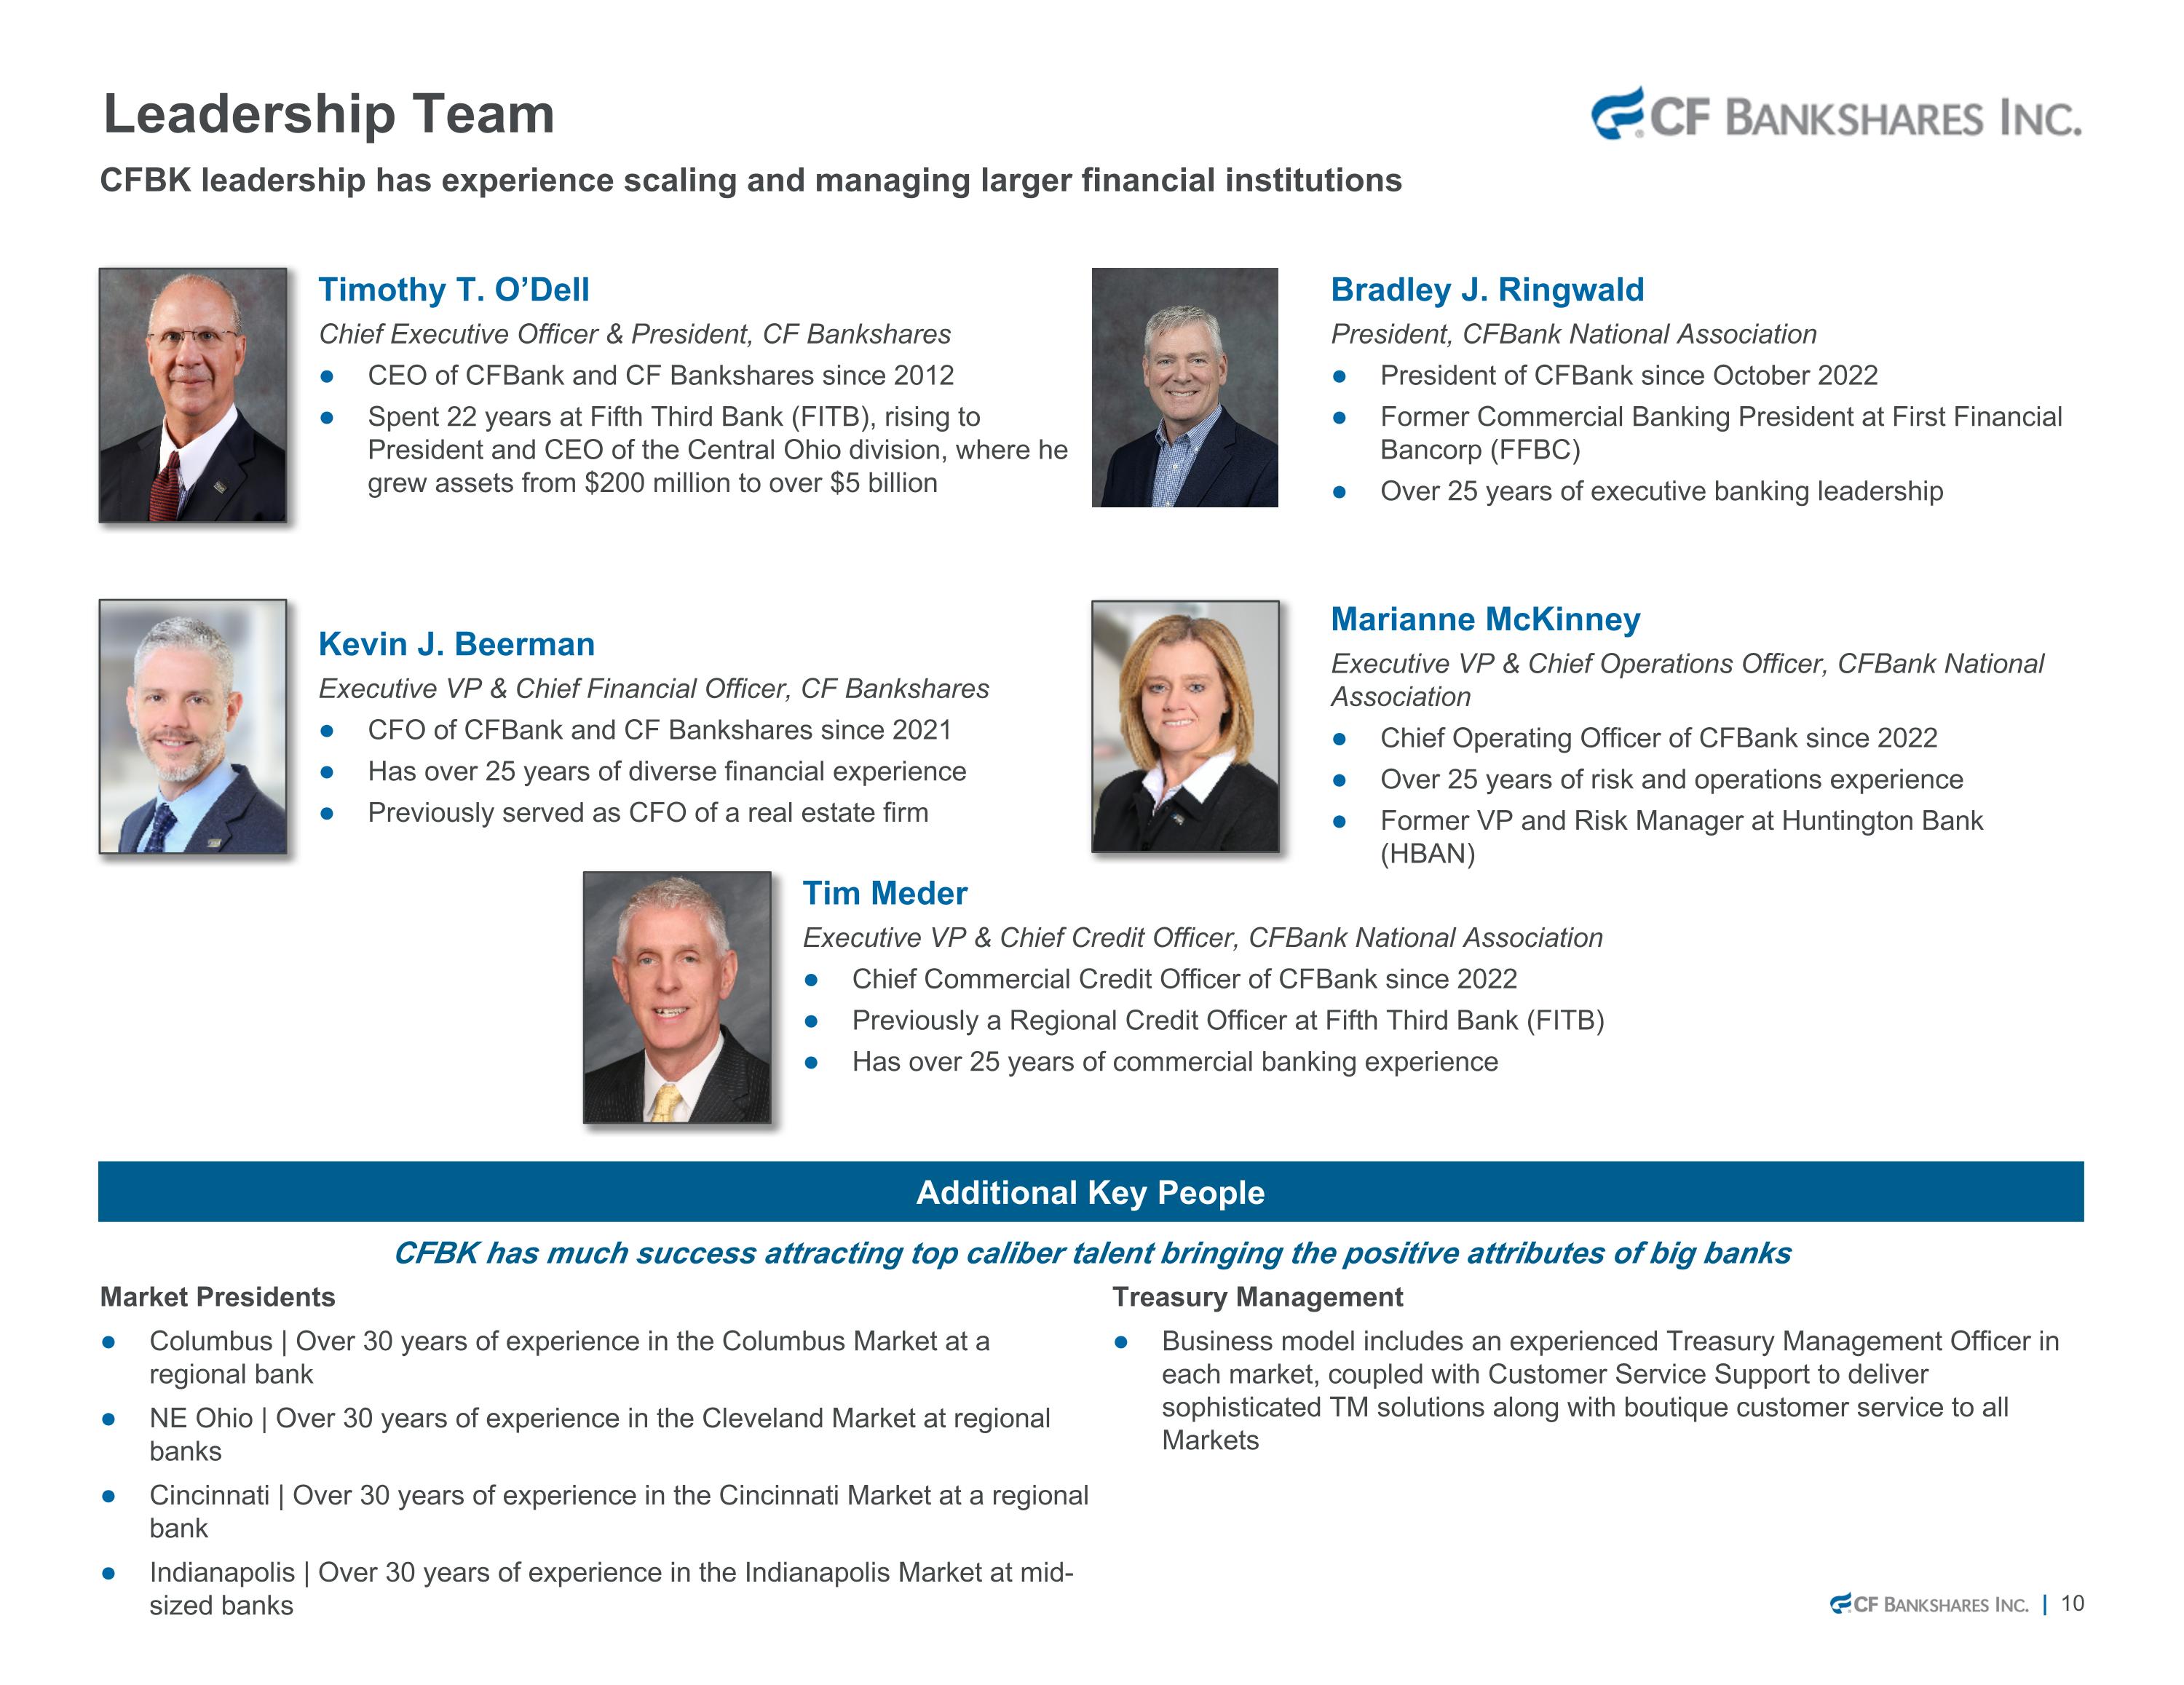
Leadership Team CFBK has much success attracting top caliber talent bringing the positive attributes of big banks Additional Key People Market Presidents Columbus | Over 30 years of experience in the Columbus Market at a regional bank NE Ohio | Over 30 years of experience in the Cleveland Market at regional banks Cincinnati | Over 30 years of experience in the Cincinnati Market at a regional bank Indianapolis | Over 30 years of experience in the Indianapolis Market at mid-sized banks Treasury Management Business model includes an experienced Treasury Management Officer in each market, coupled with Customer Service Support to deliver sophisticated TM solutions along with boutique customer service to all Markets Timothy T. O’Dell Chief Executive Officer & President, CF Bankshares CEO of CFBank and CF Bankshares since 2012 Spent 22 years at Fifth Third Bank (FITB), rising to President and CEO of the Central Ohio division, where he grew assets from $200 million to over $5 billion Kevin J. Beerman Executive VP & Chief Financial Officer, CF Bankshares CFO of CFBank and CF Bankshares since 2021 Has over 25 years of diverse financial experience Previously served as CFO of a real estate firm Tim Meder Executive VP & Chief Credit Officer, CFBank National Association Chief Commercial Credit Officer of CFBank since 2022 Previously a Regional Credit Officer at Fifth Third Bank (FITB) Has over 25 years of commercial banking experience Bradley J. Ringwald President, CFBank National Association President of CFBank since October 2022 Former Commercial Banking President at First Financial Bancorp (FFBC) Over 25 years of executive banking leadership Marianne McKinney Executive VP & Chief Operations Officer, CFBank National Association Chief Operating Officer of CFBank since 2022 Over 25 years of risk and operations experience Former VP and Risk Manager at Huntington Bank (HBAN) CFBK leadership has experience scaling and managing larger financial institutions
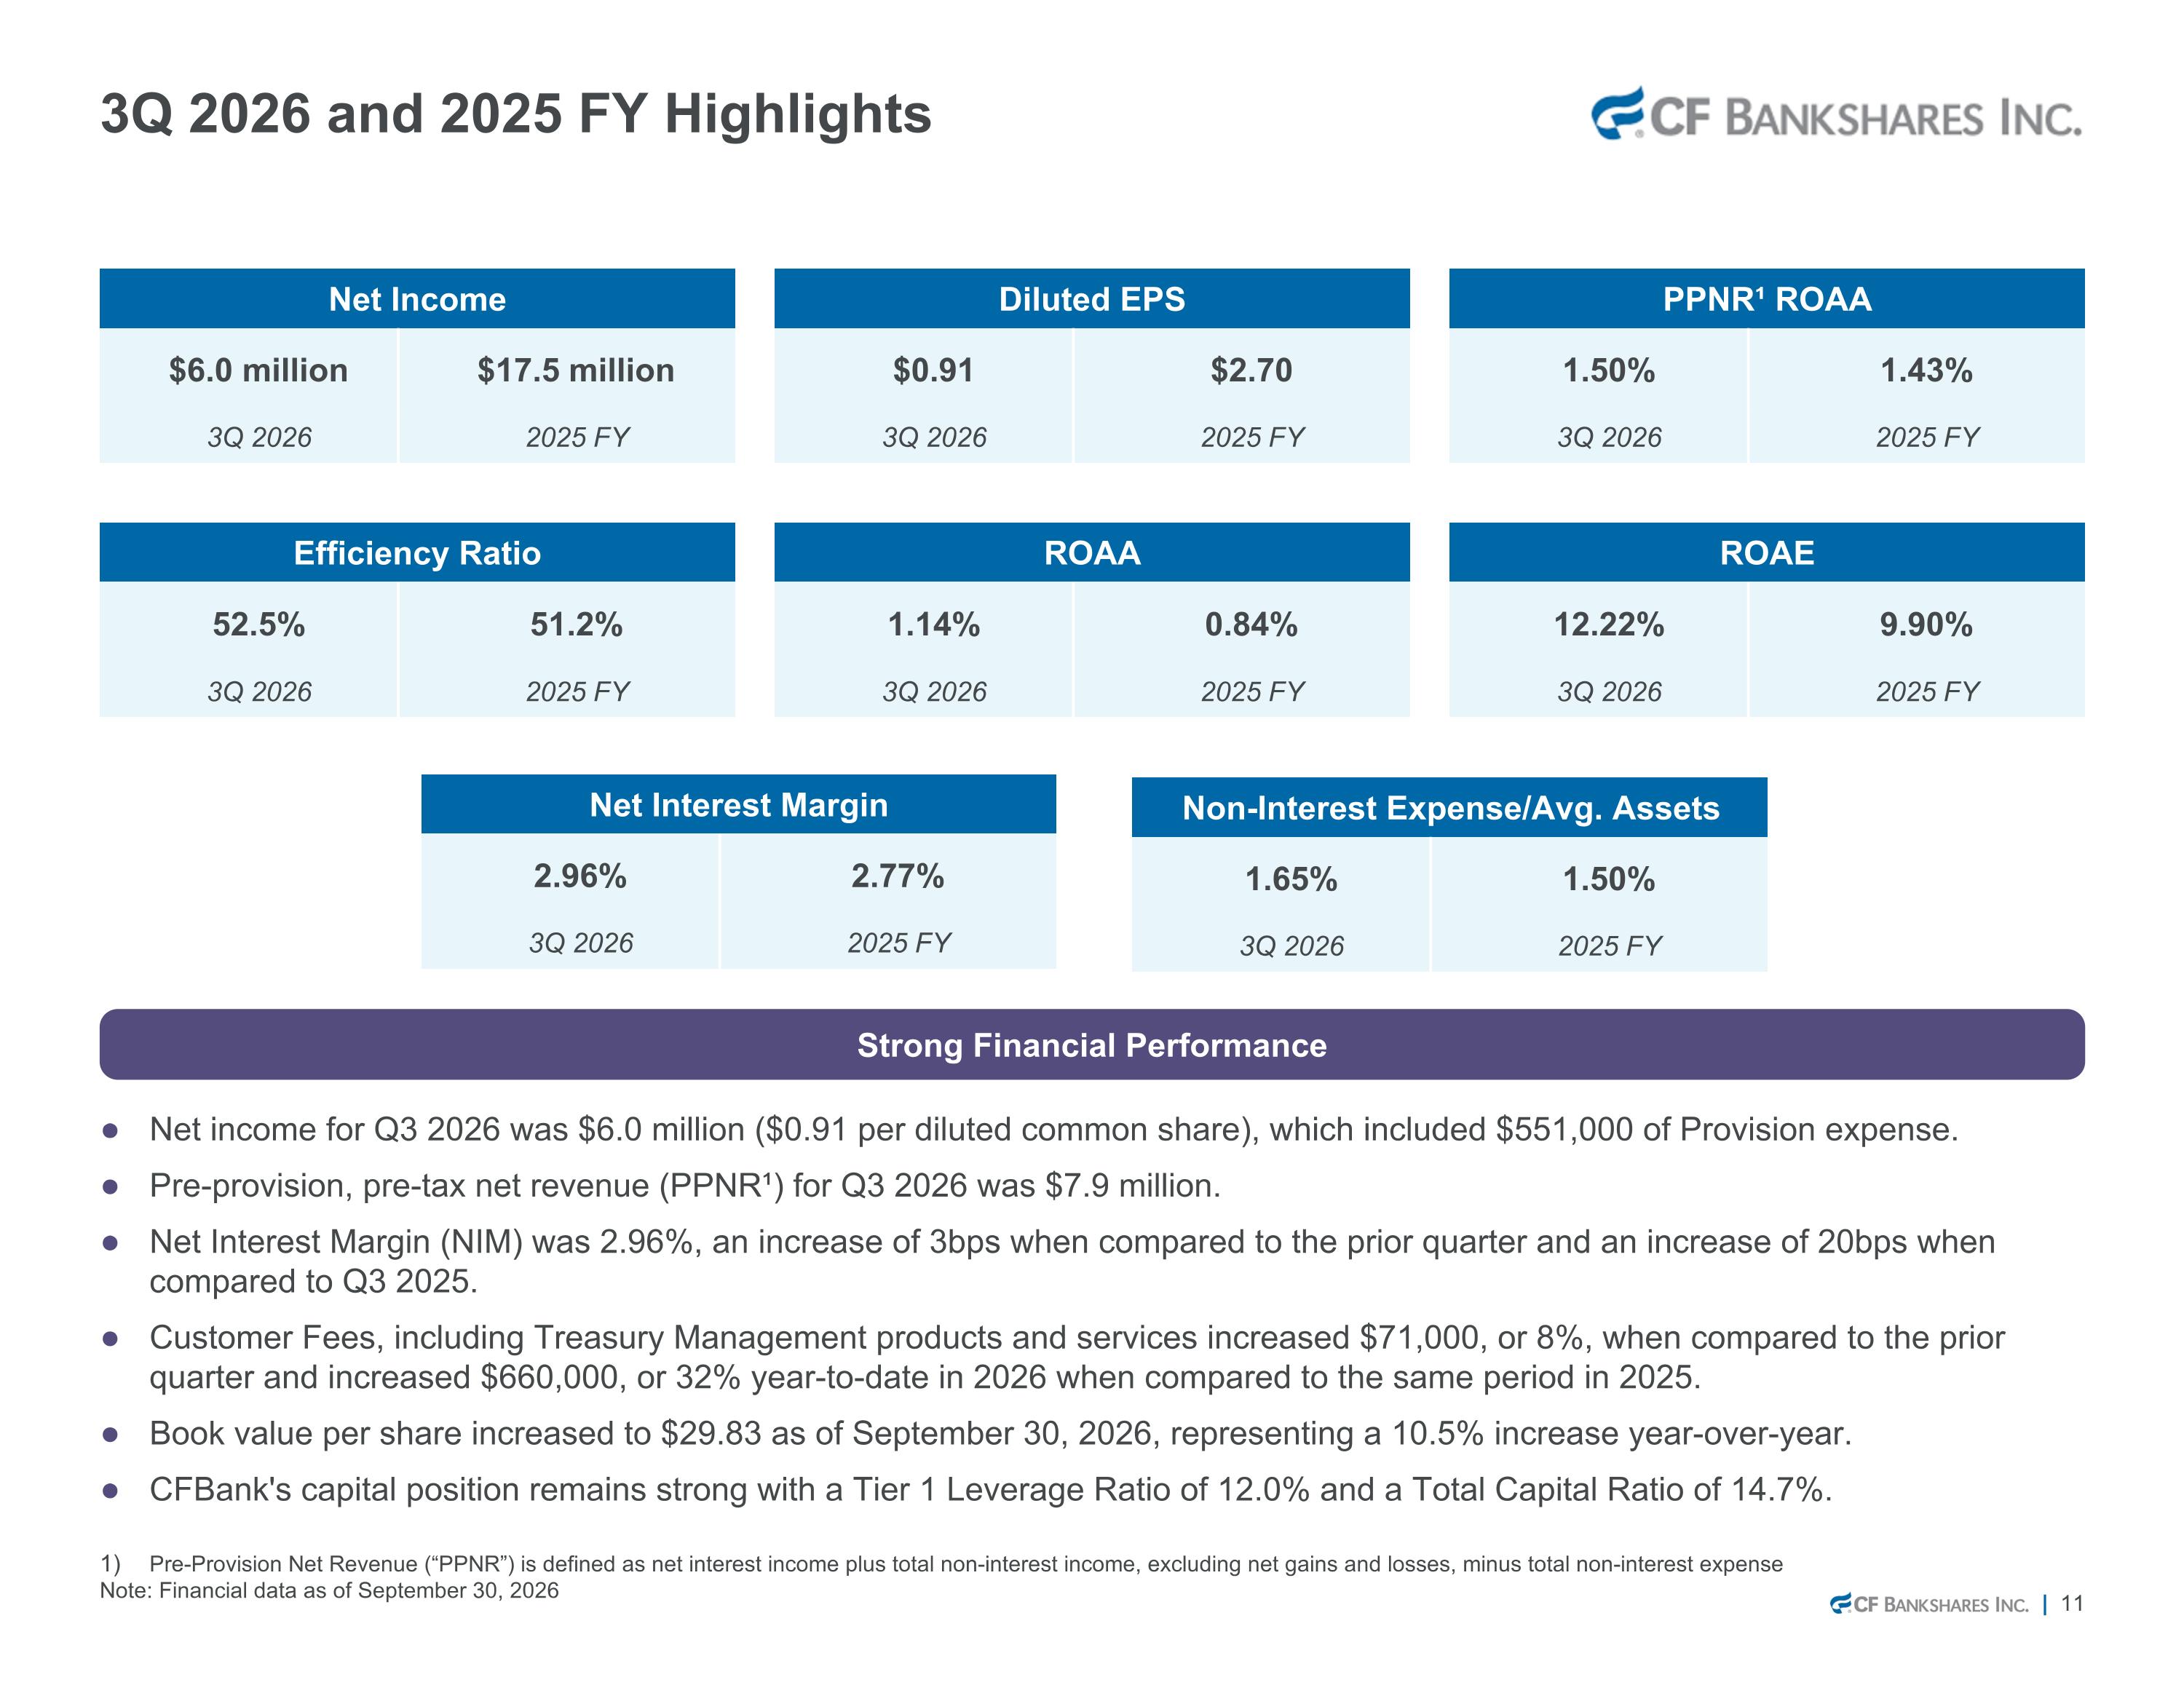
3Q 2026 and 2025 FY Highlights PPNR¹ ROAA 1.50% 1.43% 3Q 2026 2025 FY ROAE 12.22% 9.90% 3Q 2026 2025 FY Diluted EPS $0.91 $2.70 3Q 2026 2025 FY ROAA 1.14% 0.84% 3Q 2026 2025 FY Net Income $6.0 million $17.5 million 3Q 2026 2025 FY Efficiency Ratio 52.5% 51.2% 3Q 2026 2025 FY Strong Financial Performance Net income for Q3 2026 was $6.0 million ($0.91 per diluted common share), which included $551,000 of Provision expense. Pre-provision, pre-tax net revenue (PPNR¹) for Q3 2026 was $7.9 million. Net Interest Margin (NIM) was 2.96%, an increase of 3bps when compared to the prior quarter and an increase of 20bps when compared to Q3 2025. Customer Fees, including Treasury Management products and services increased $71,000, or 8%, when compared to the prior quarter and increased $660,000, or 32% year-to-date in 2026 when compared to the same period in 2025. Book value per share increased to $29.83 as of September 30, 2026, representing a 10.5% increase year-over-year. CFBank's capital position remains strong with a Tier 1 Leverage Ratio of 12.0% and a Total Capital Ratio of 14.7%. Net Interest Margin 2.96% 2.77% 3Q 2026 2025 FY Non-Interest Expense/Avg. Assets 1.65% 1.50% 3Q 2026 2025 FY Pre-Provision Net Revenue (“PPNR”) is defined as net interest income plus total non-interest income, excluding net gains and losses, minus total non-interest expense Note: Financial data as of September 30, 2026
Financial Performance
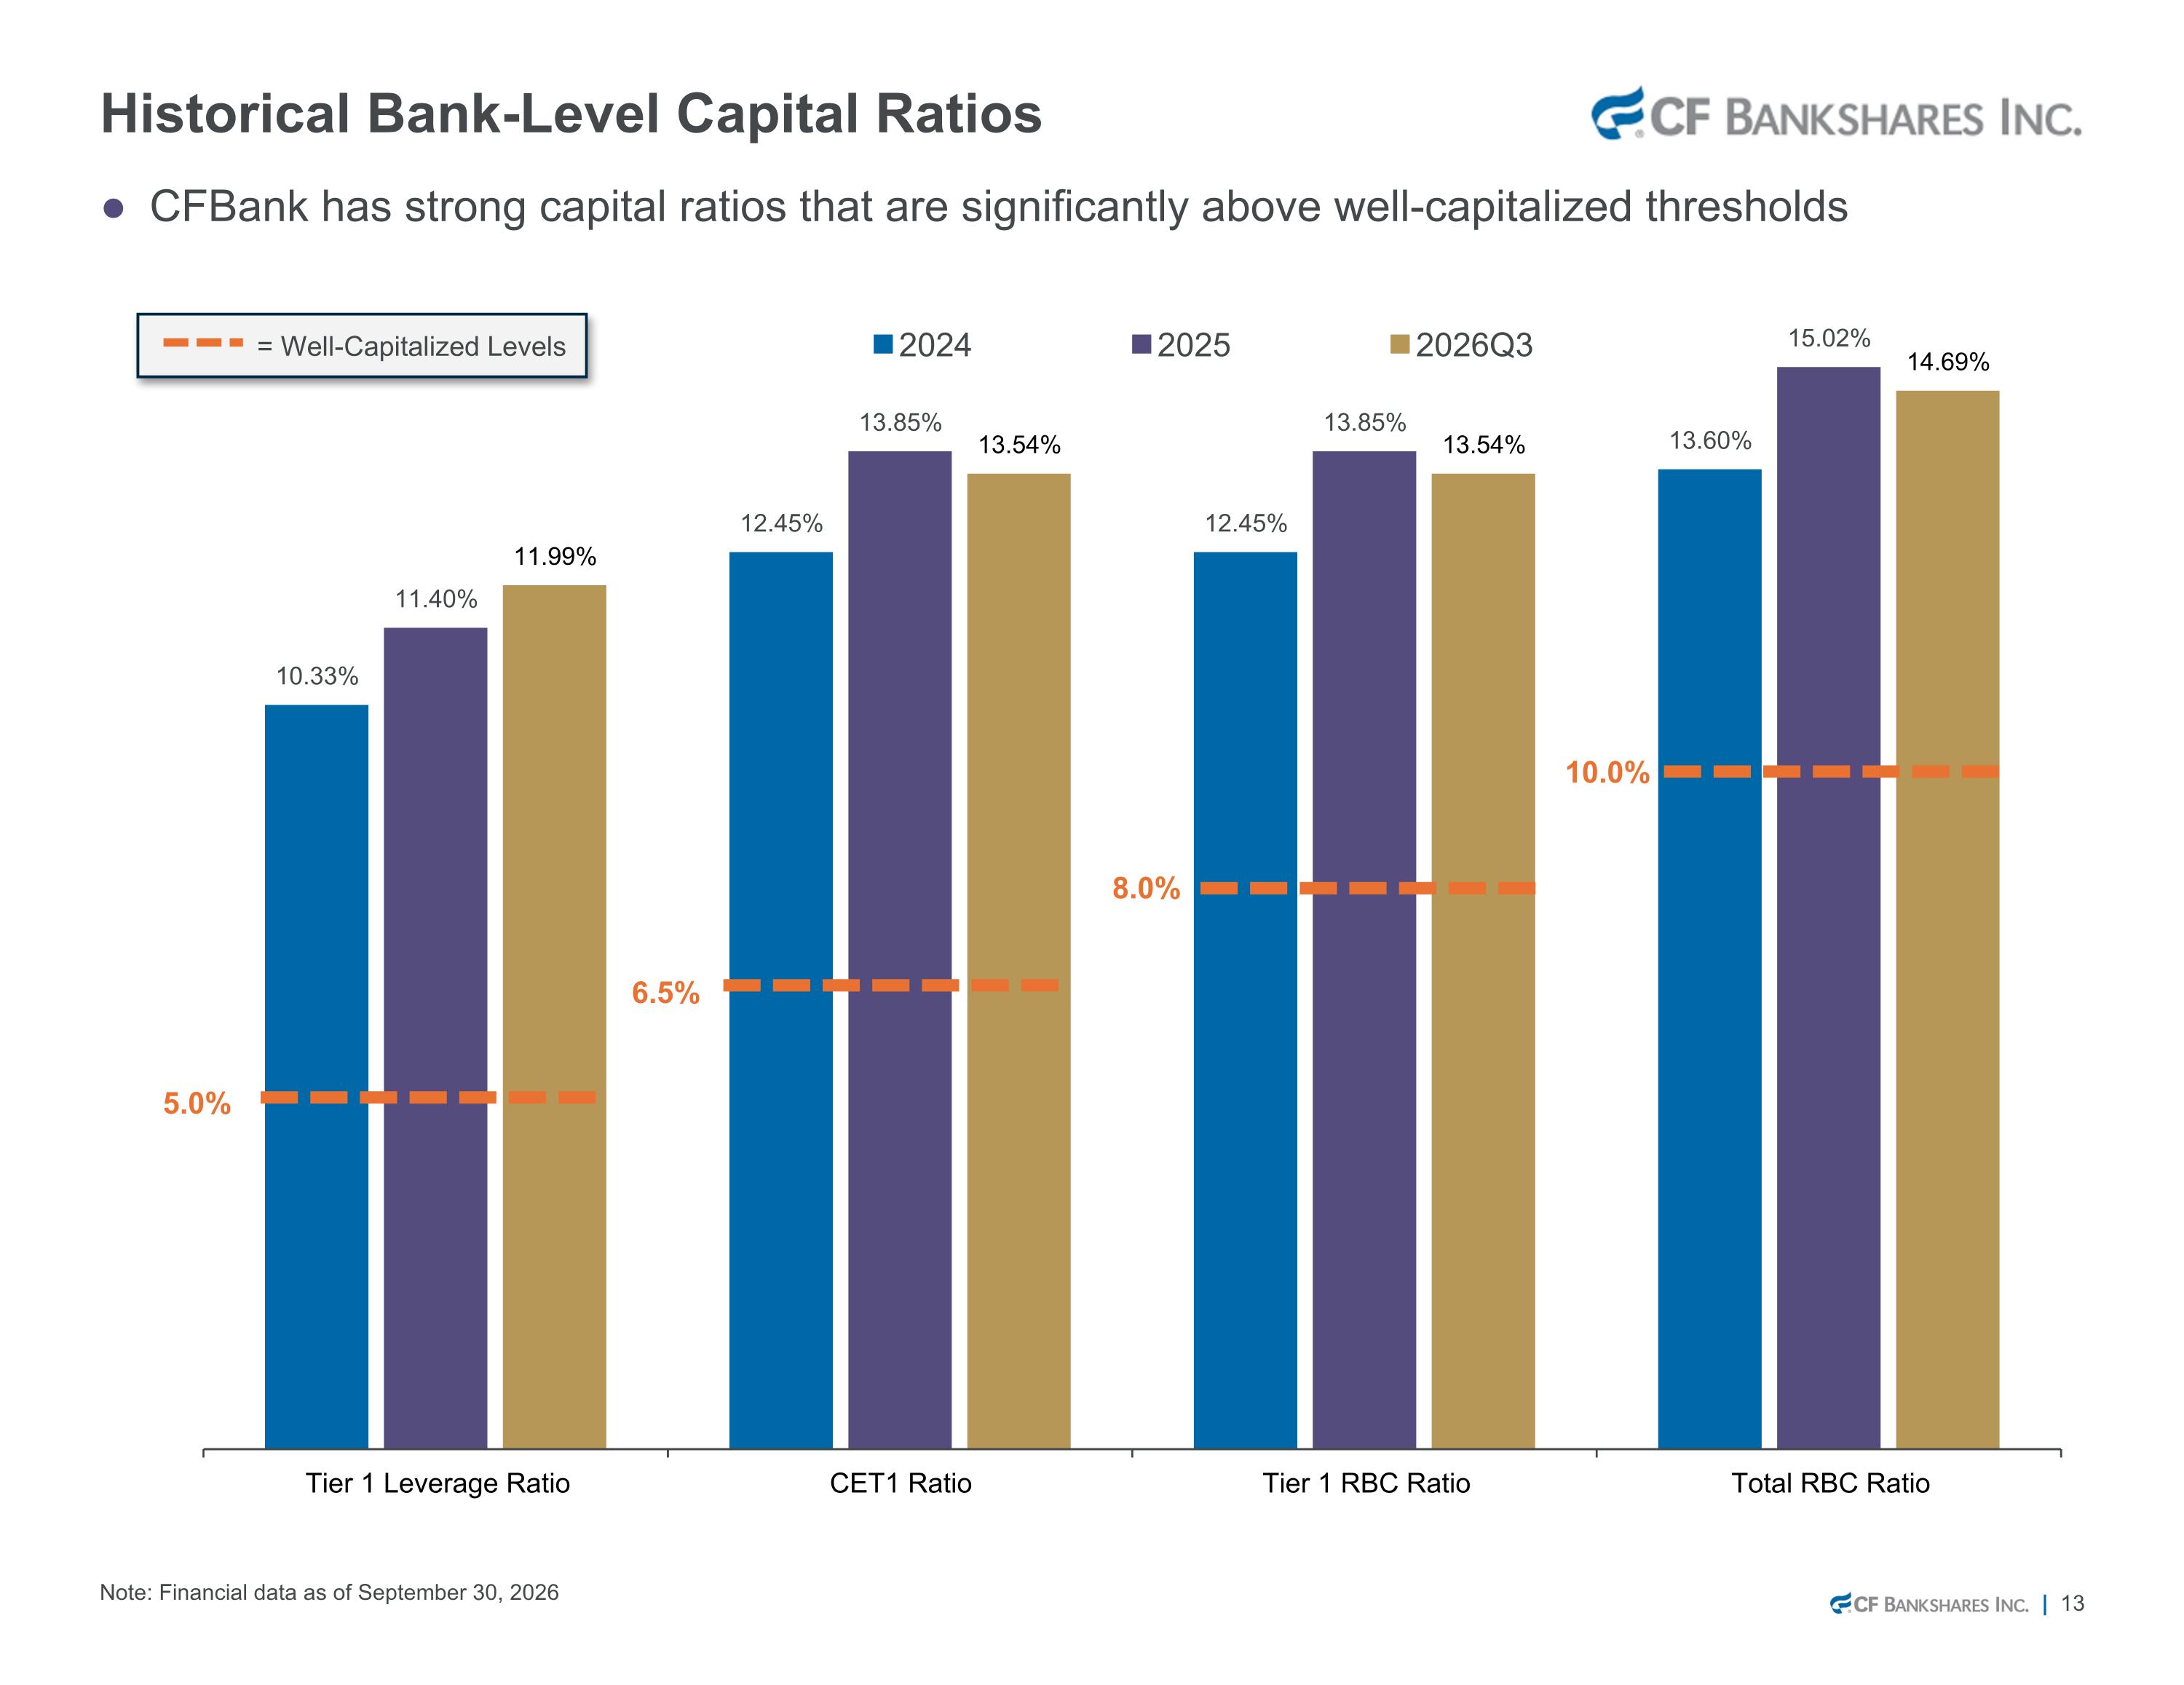
Note: Financial data as of September 30, 2026 Historical Bank-Level Capital Ratios CFBank has strong capital ratios that are significantly above well-capitalized thresholds = Well-Capitalized Levels 5.0% 6.5% 8.0% 10.0% 6.5% 8.0% 10.0% 5.0% = Well-Capitalized Levels
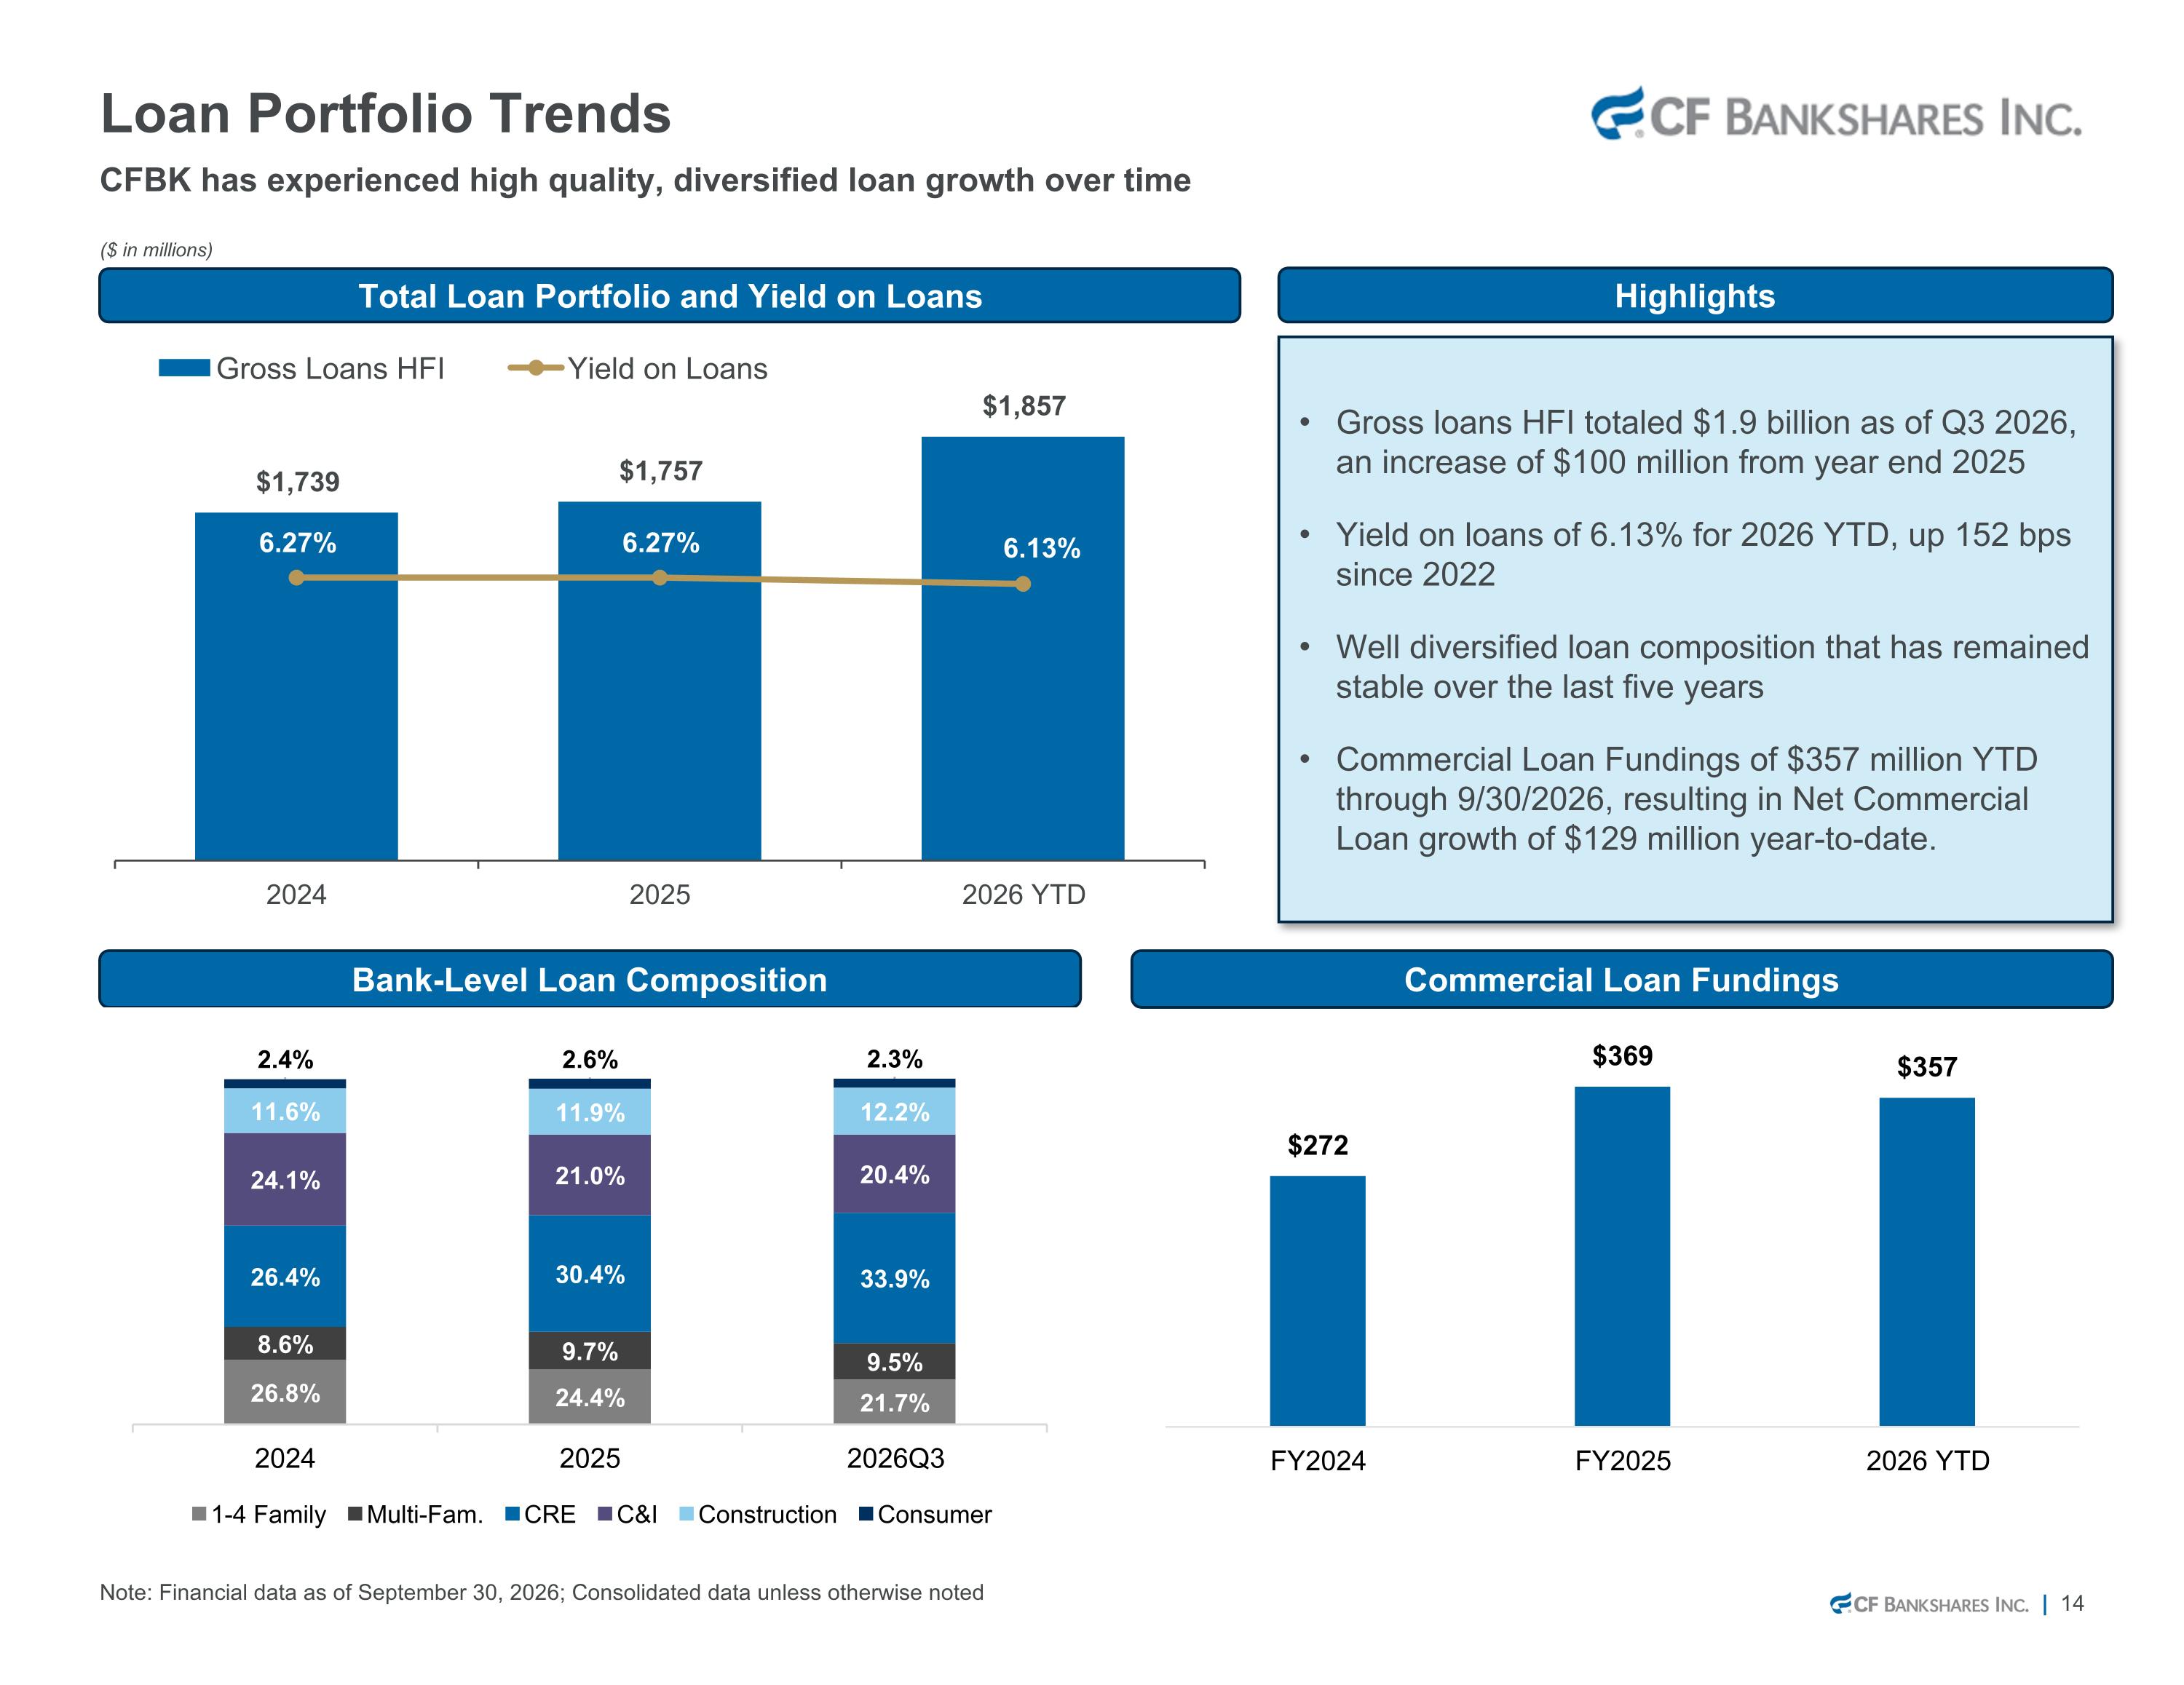
Note: Financial data as of September 30, 2026; Consolidated data unless otherwise noted Loan Portfolio Trends ($ in millions) Total Loan Portfolio and Yield on Loans Highlights Bank-Level Loan Composition Commercial Loan Fundings Gross loans HFI totaled $1.9 billion as of Q3 2026, an increase of $100 million from year end 2025 Yield on loans of 6.13% for 2026 YTD, up 152 bps since 2022 Well diversified loan composition that has remained stable over the last five years Commercial Loan Fundings of $357 million YTD through 9/30/2026, resulting in Net Commercial Loan growth of $129 million year-to-date. CFBK has experienced high quality, diversified loan growth over time
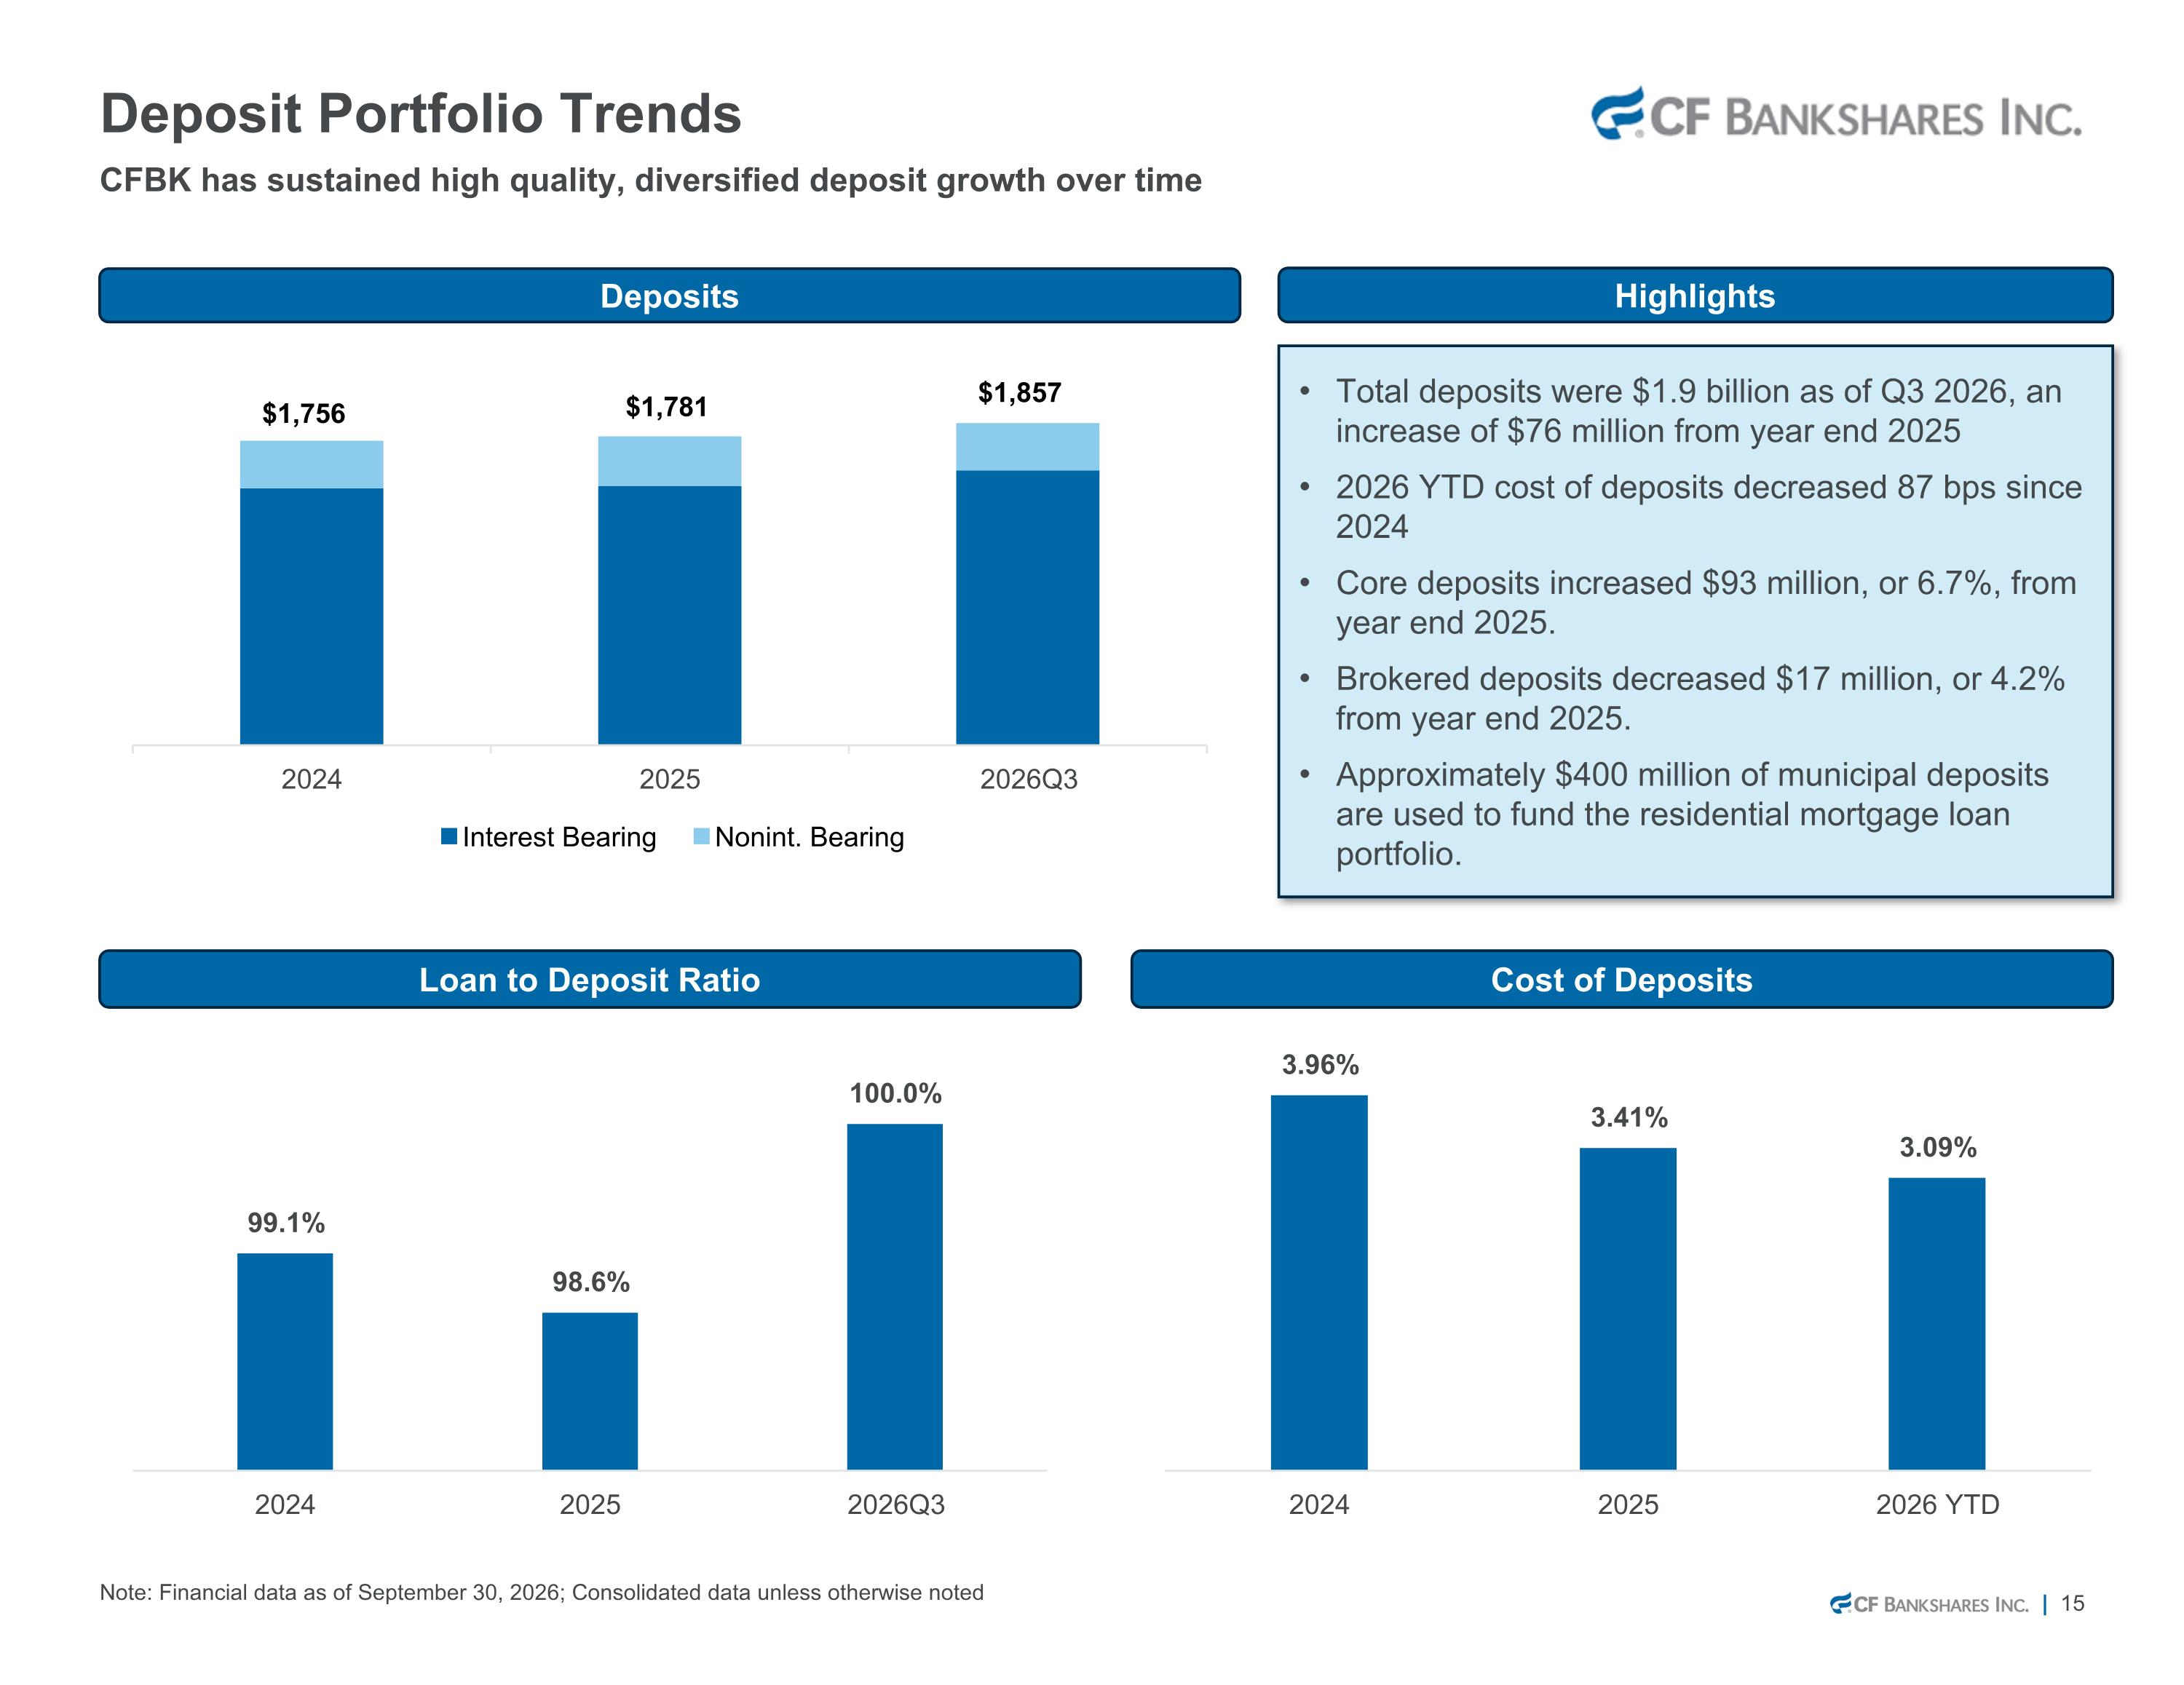
Total deposits were $1.9 billion as of Q3 2026, an increase of $76 million from year end 2025 2026 YTD cost of deposits decreased 87 bps since 2024 Core deposits increased $93 million, or 6.7%, from year end 2025. Brokered deposits decreased $17 million, or 4.2% from year end 2025. Approximately $400 million of municipal deposits are used to fund the residential mortgage loan portfolio. Deposits Note: Financial data as of September 30, 2026; Consolidated data unless otherwise noted Deposit Portfolio Trends Highlights Loan to Deposit Ratio Cost of Deposits CFBK has sustained high quality, diversified deposit growth over time $1,756 $1,781 $1,857
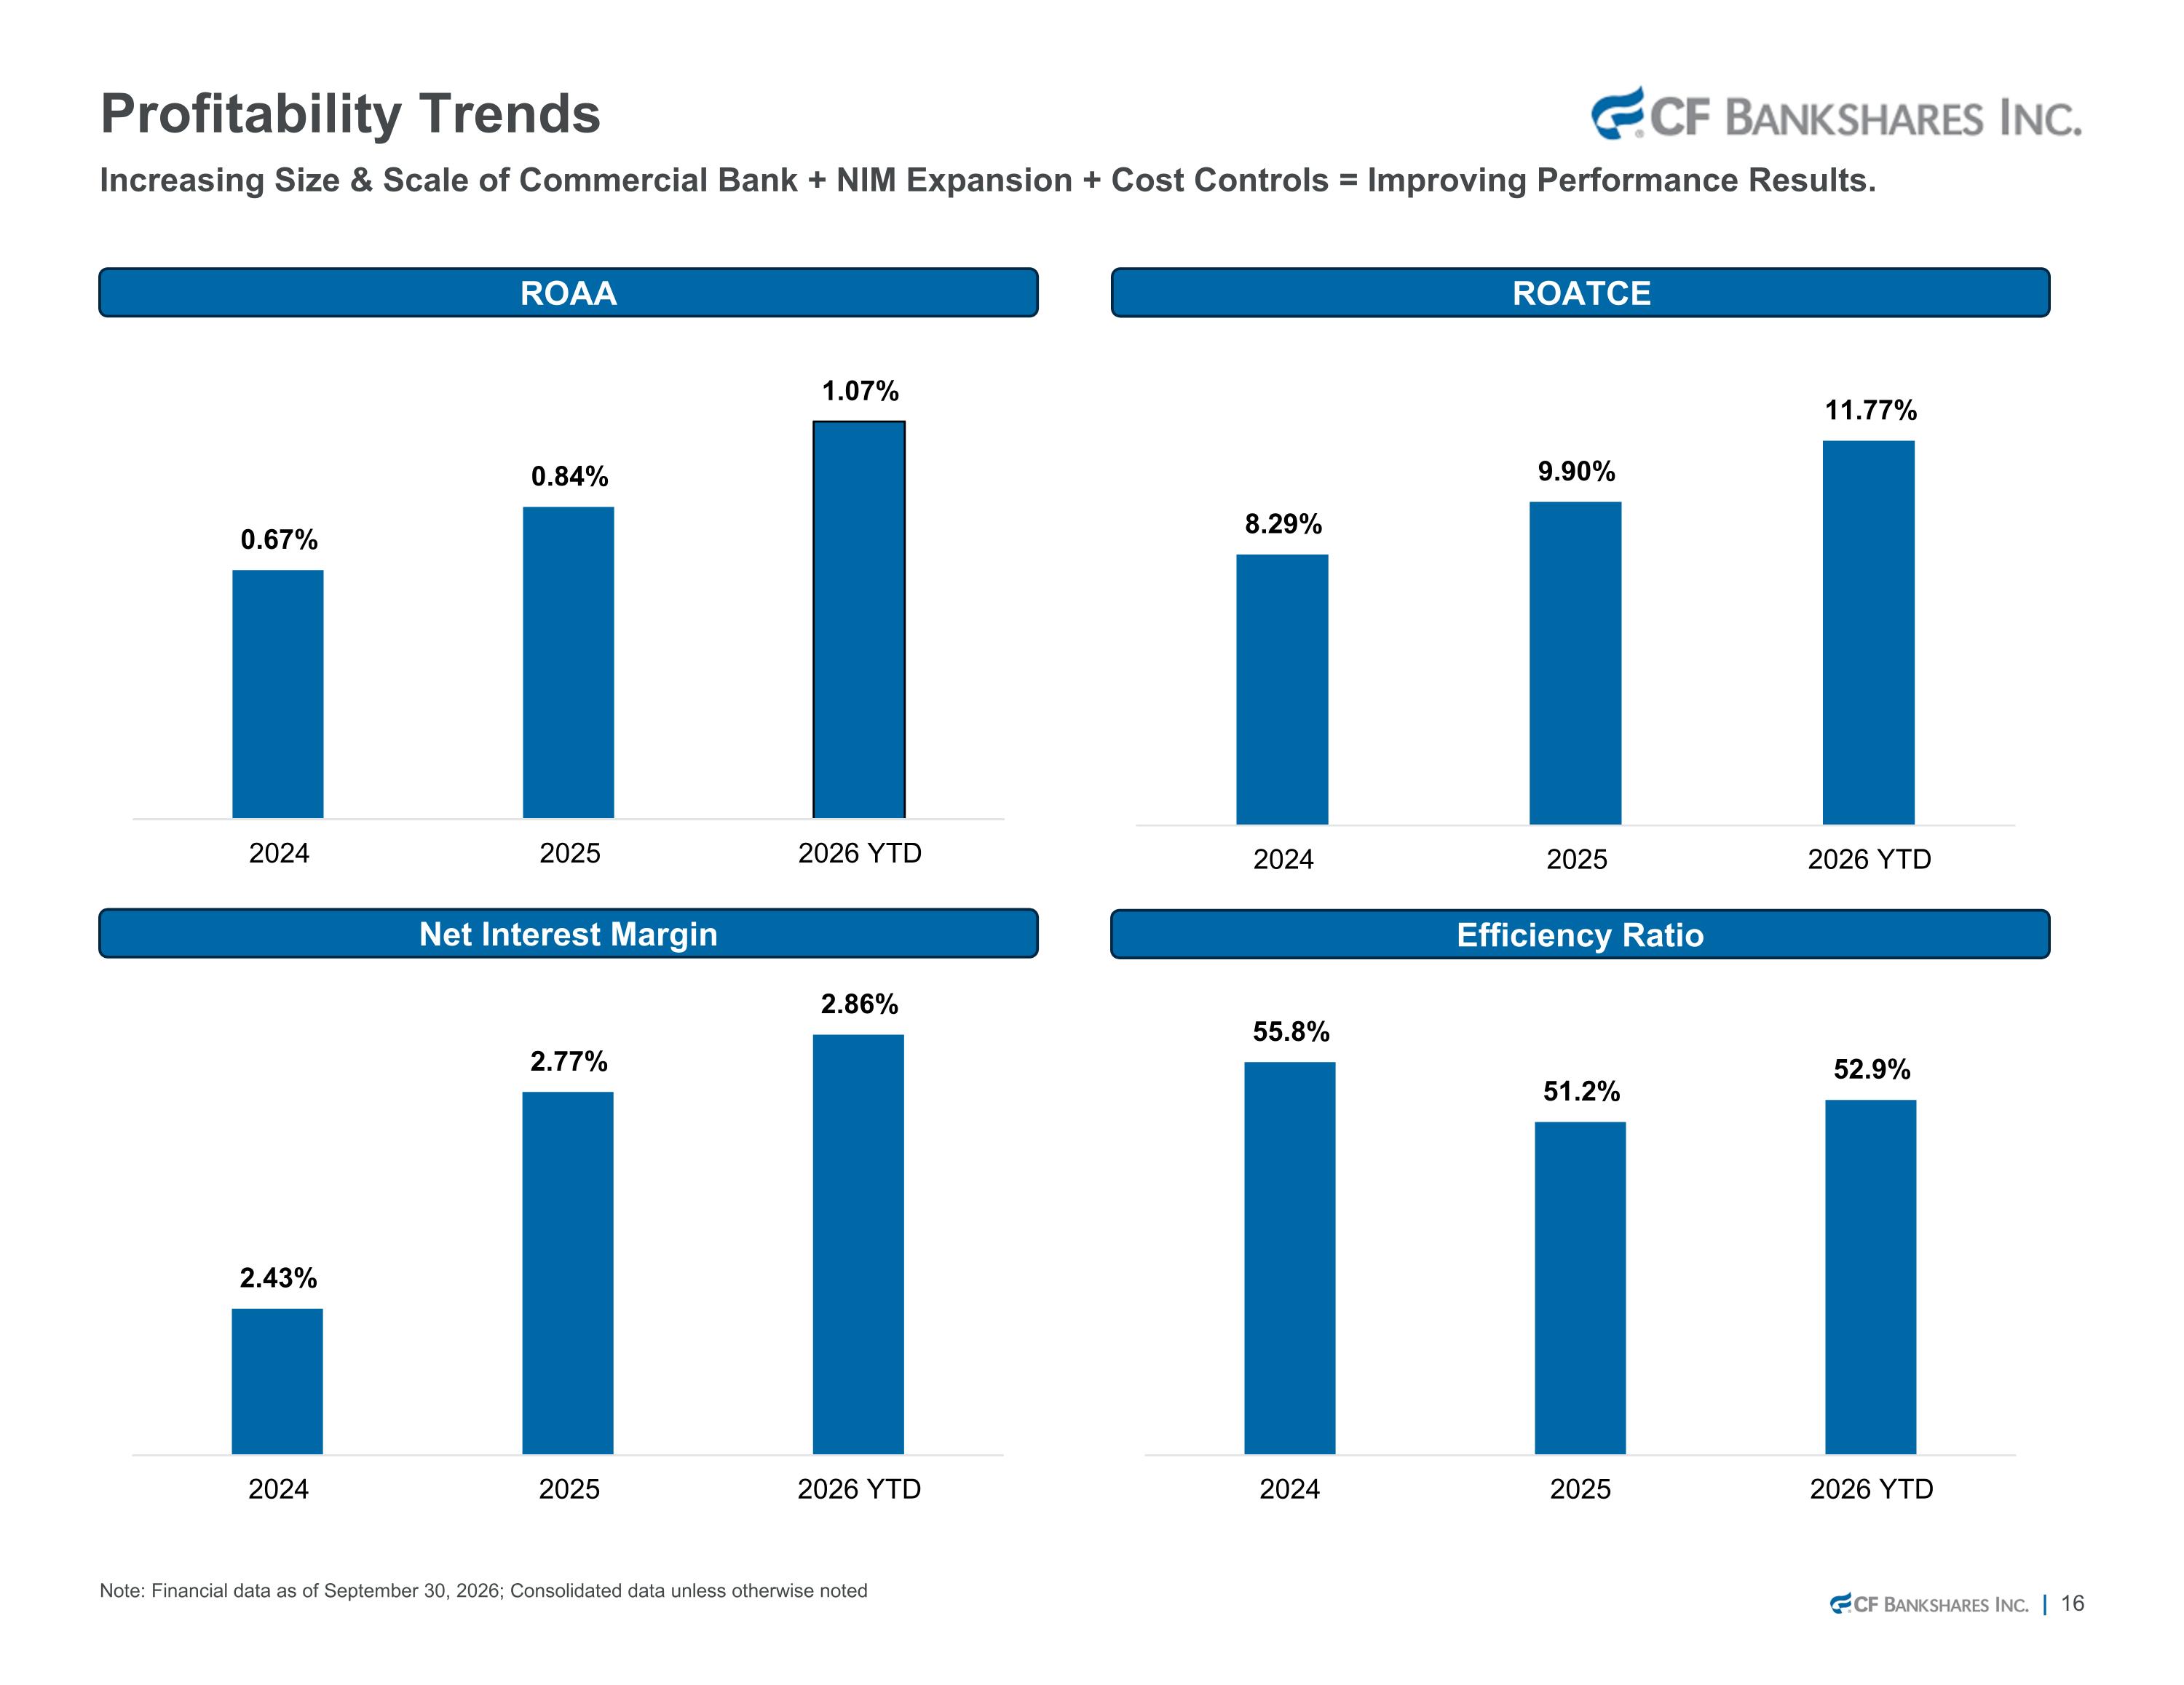
Net Interest Margin ROATCE ROAA Note: Financial data as of September 30, 2026; Consolidated data unless otherwise noted Profitability Trends Efficiency Ratio Increasing Size & Scale of Commercial Bank + NIM Expansion + Cost Controls = Improving Performance Results.
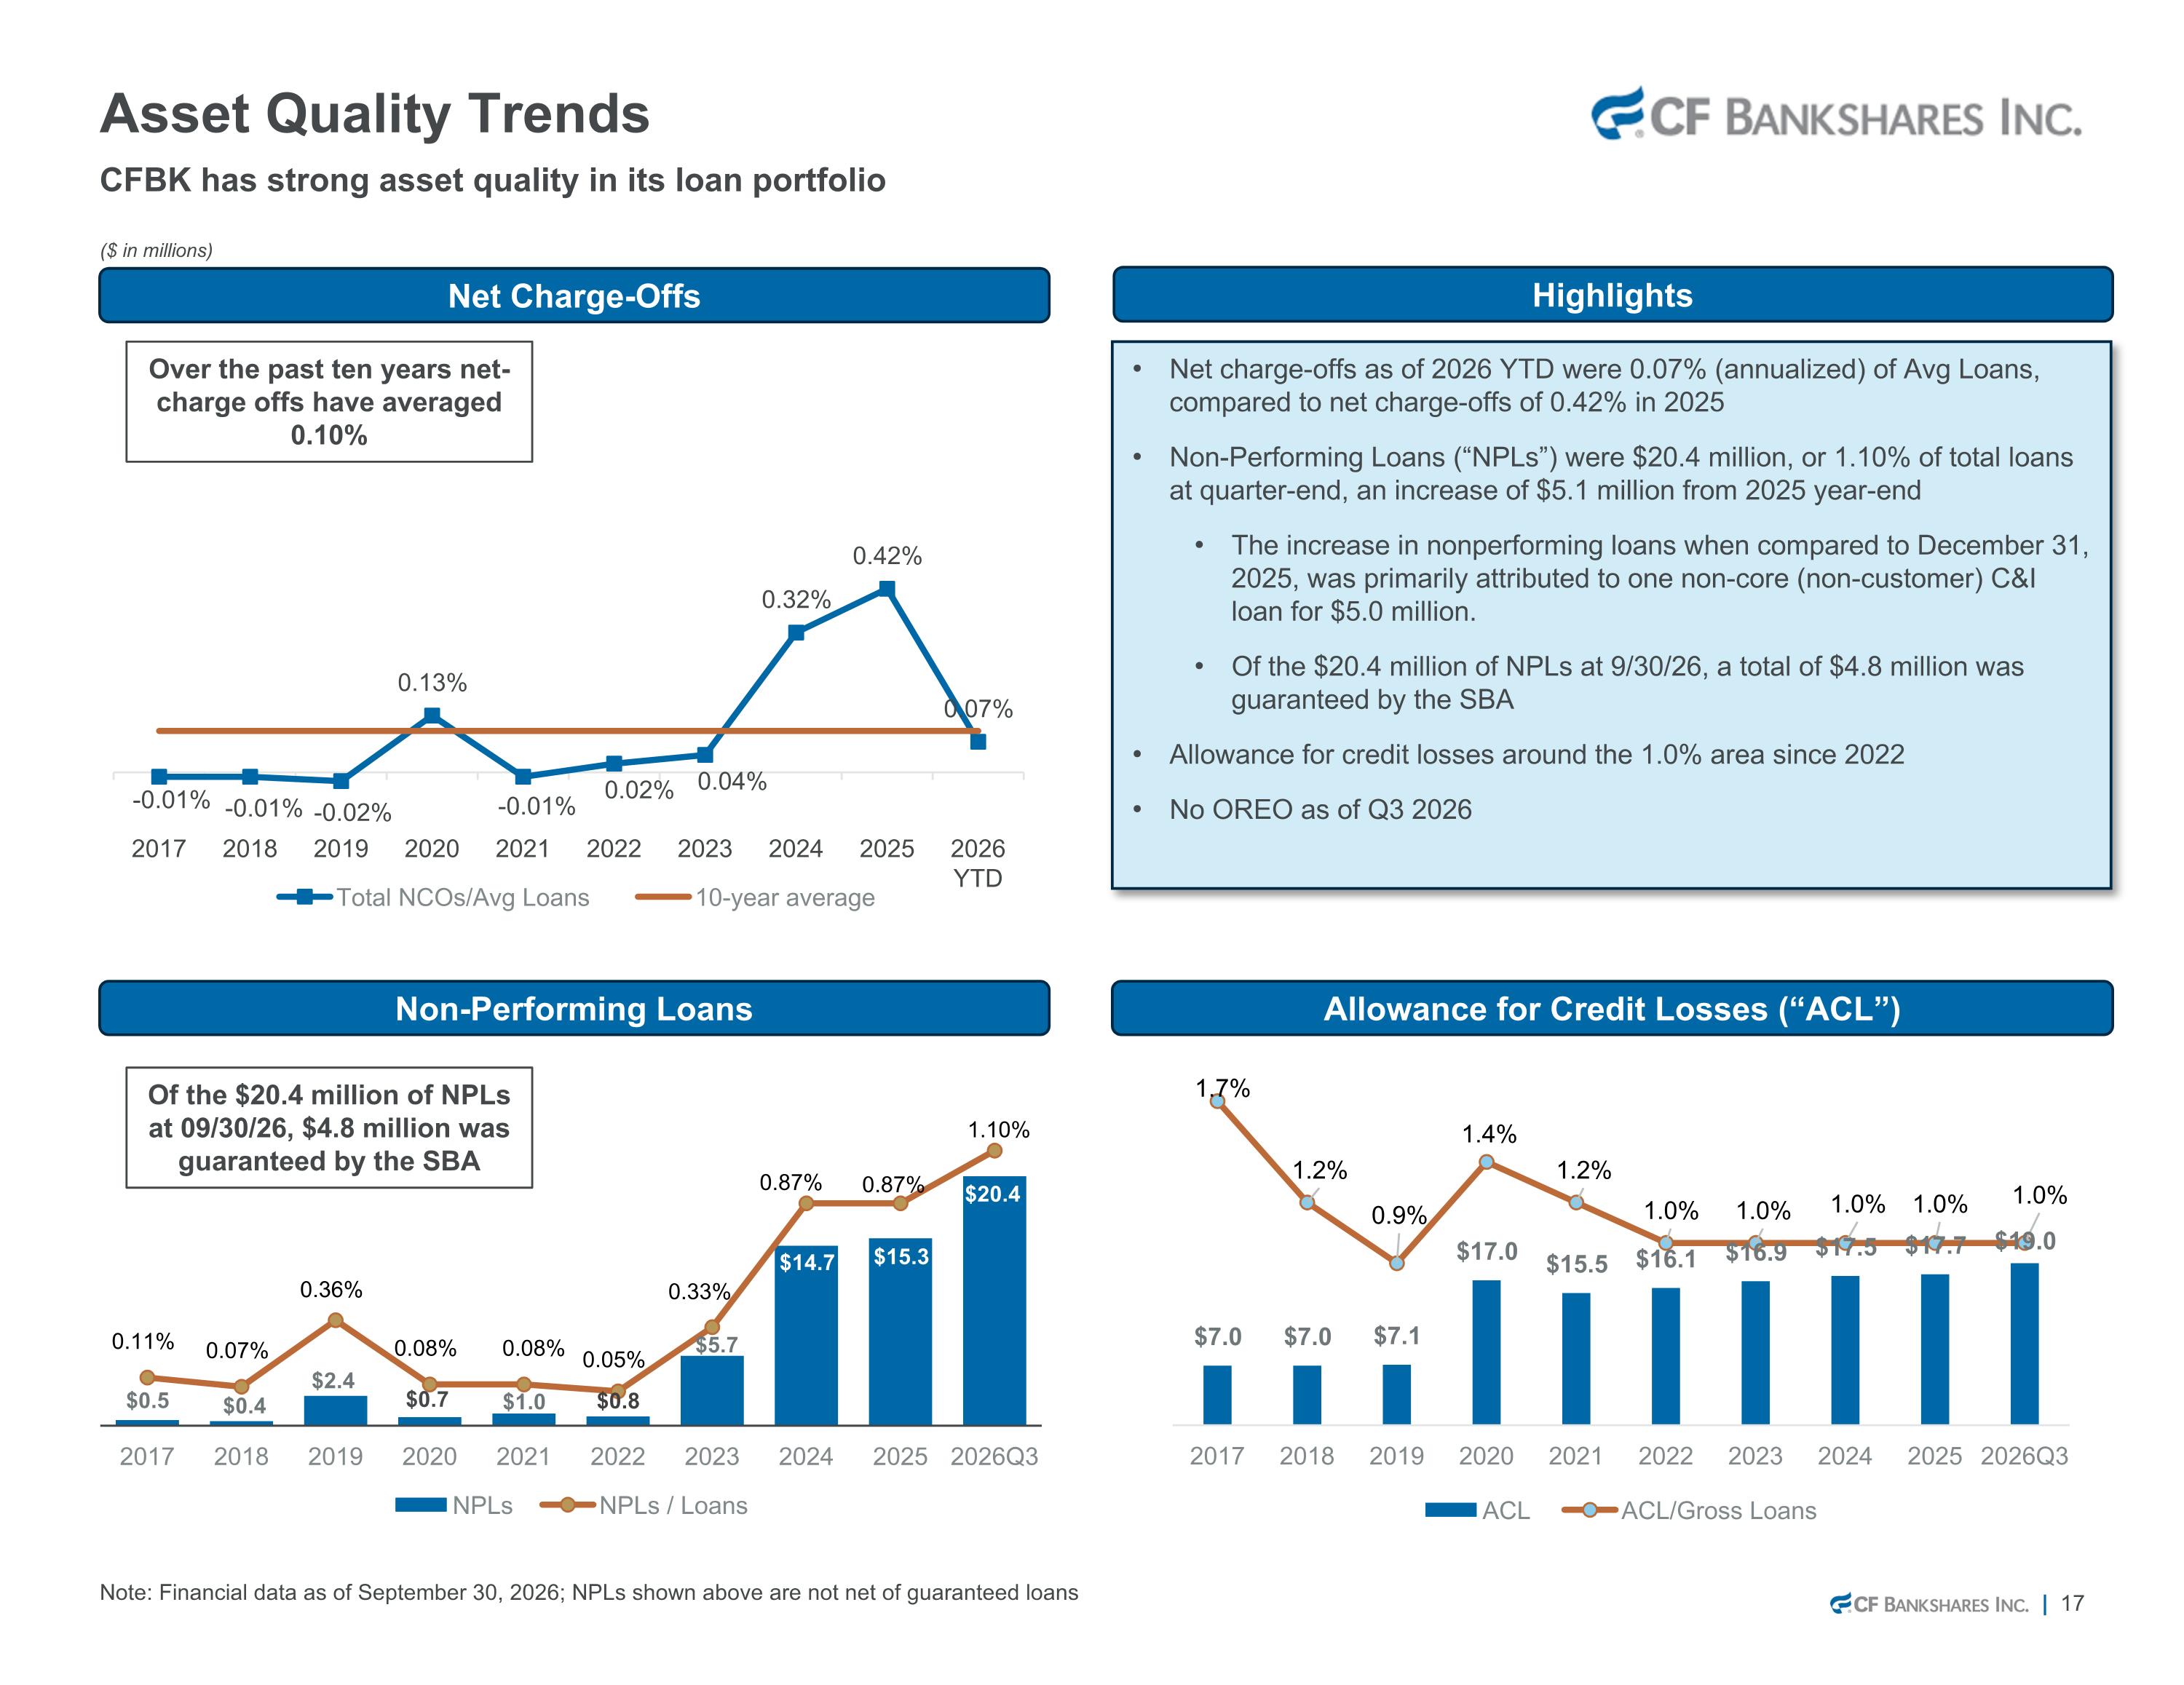
Non-Performing Loans Allowance for Credit Losses (“ACL”) Net Charge-Offs Note: Financial data as of September 30, 2026; NPLs shown above are not net of guaranteed loans Asset Quality Trends Highlights Net charge-offs as of 2026 YTD were 0.07% (annualized) of Avg Loans, compared to net charge-offs of 0.42% in 2025 Non-Performing Loans (“NPLs”) were $20.4 million, or 1.10% of total loans at quarter-end, an increase of $5.1 million from 2025 year-end The increase in nonperforming loans when compared to December 31, 2025, was primarily attributed to one non-core (non-customer) C&I loan for $5.0 million. Of the $20.4 million of NPLs at 9/30/26, a total of $4.8 million was guaranteed by the SBA Allowance for credit losses around the 1.0% area since 2022 No OREO as of Q3 2026 ($ in millions) CFBK has strong asset quality in its loan portfolio Over the past ten years net-charge offs have averaged 0.10% Of the $20.4 million of NPLs at 09/30/26, $4.8 million was guaranteed by the SBA
Appendix
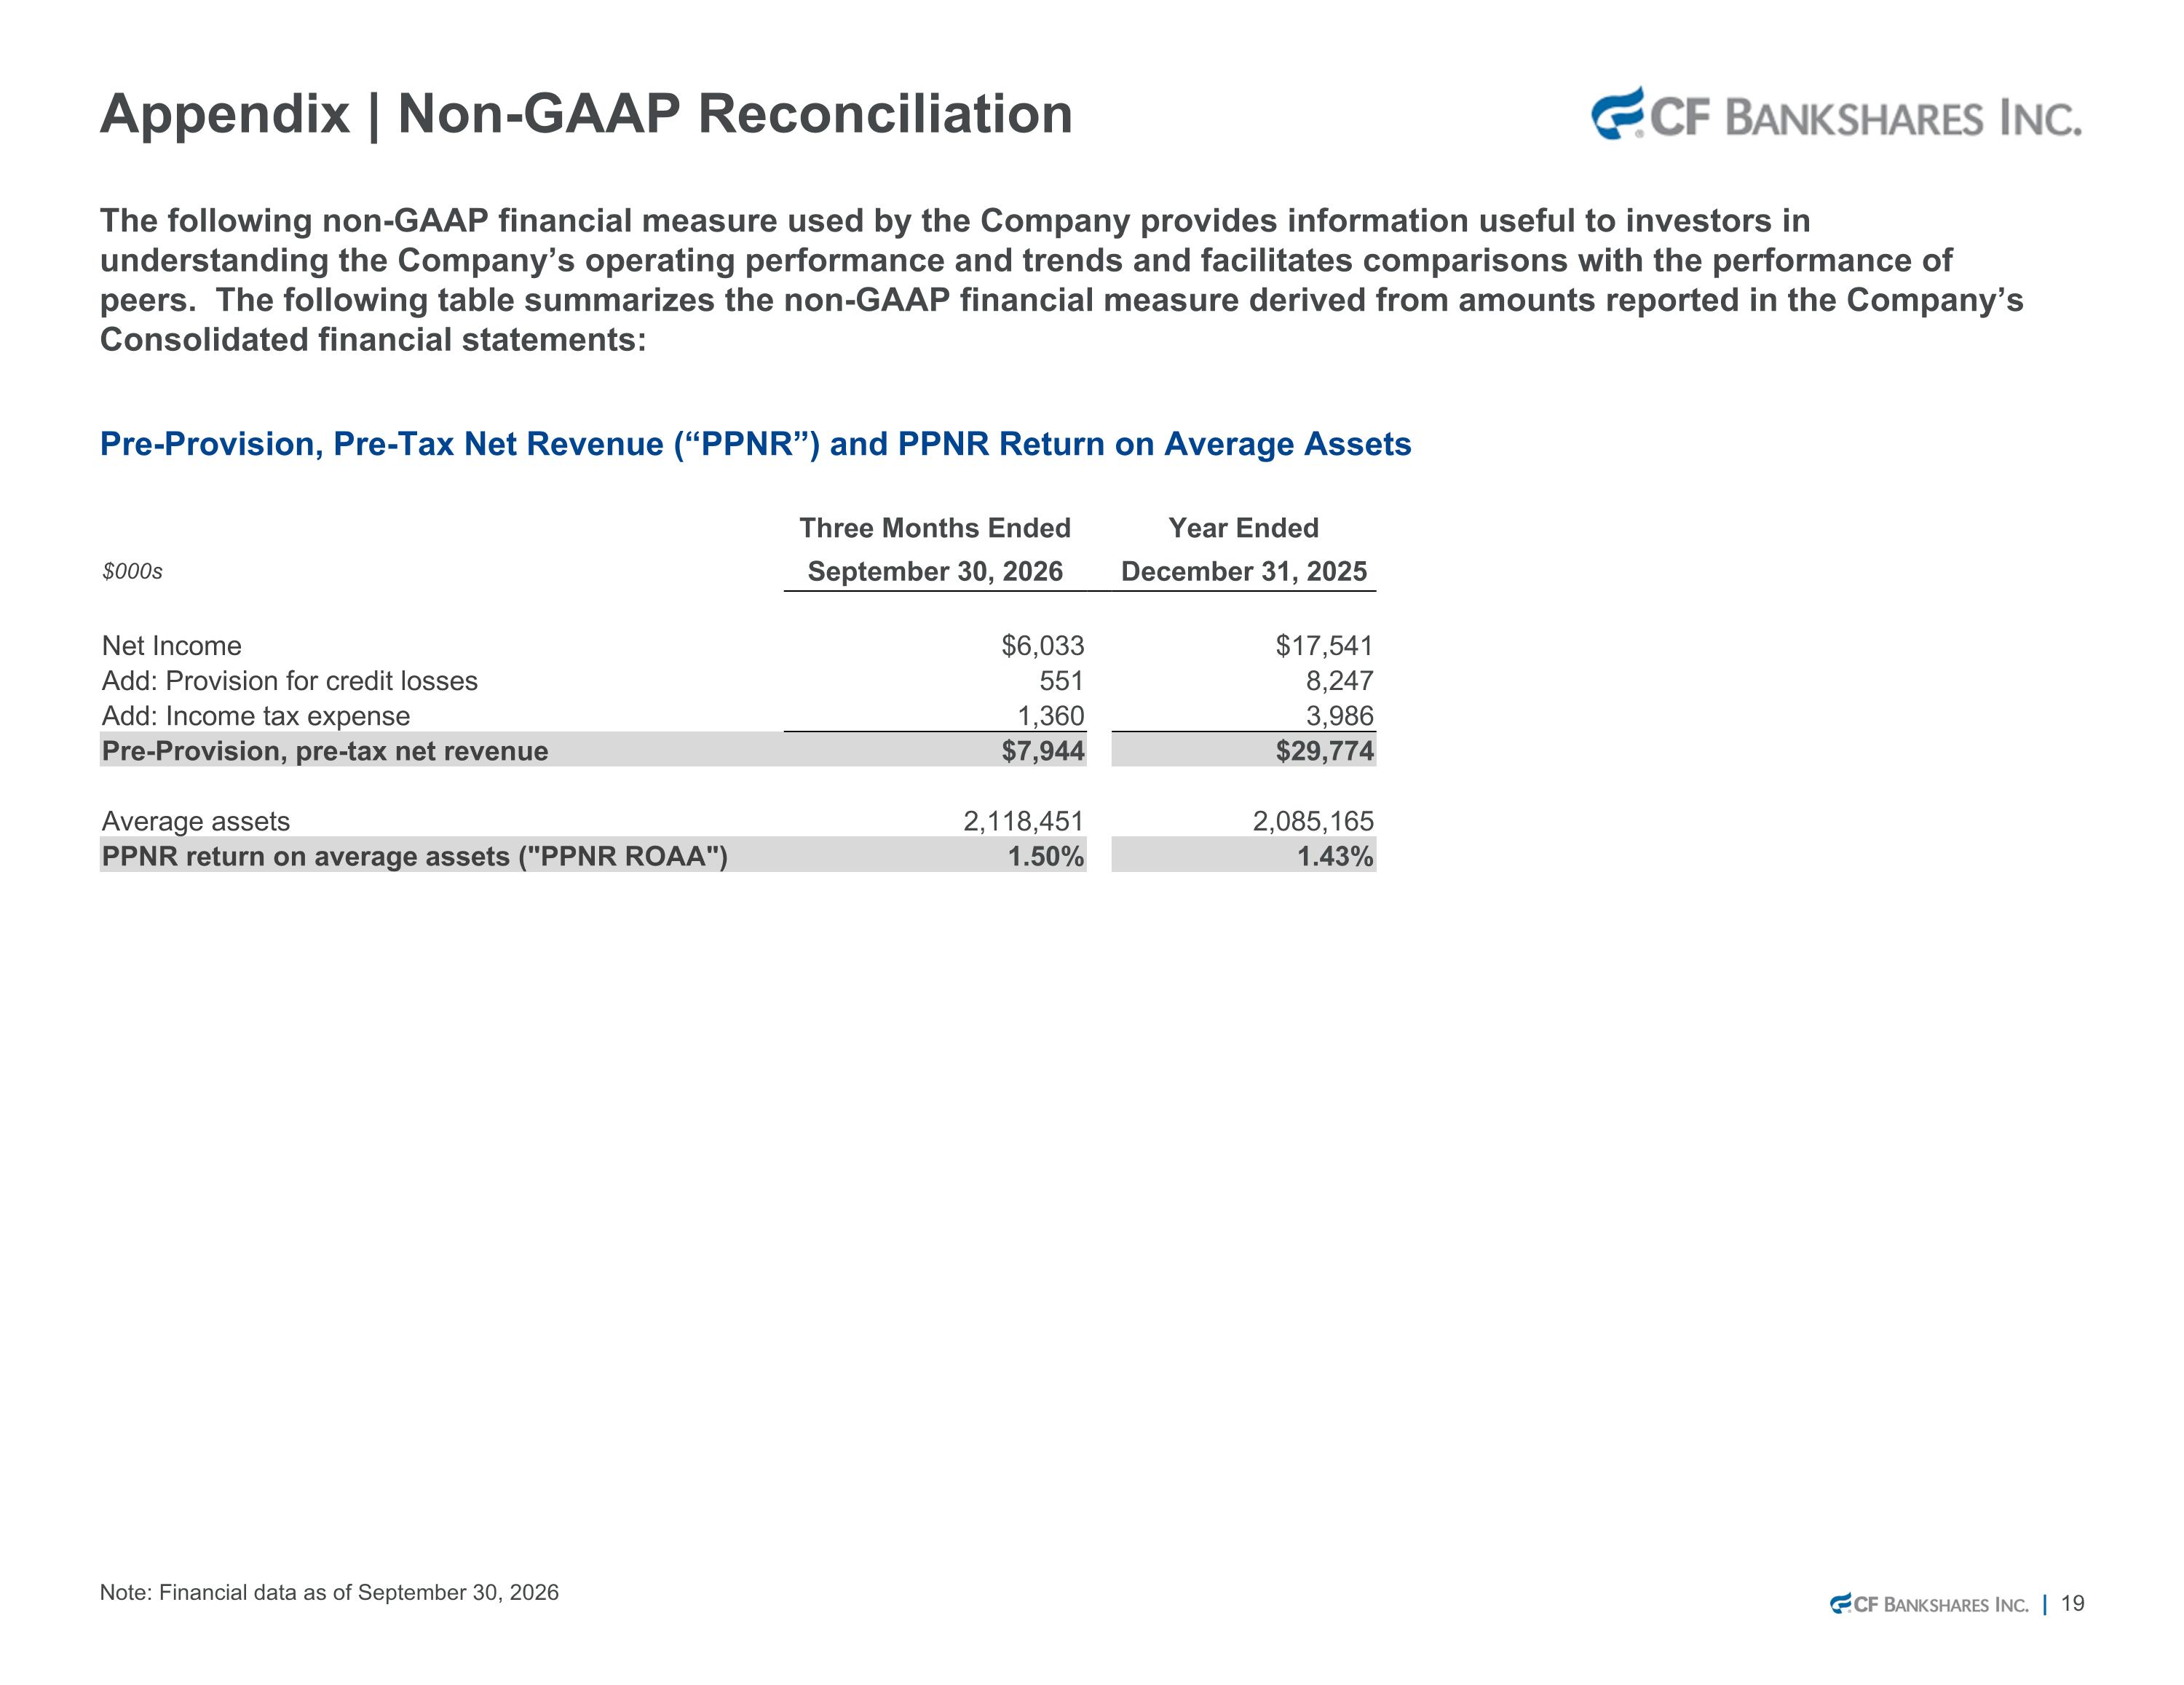
Note: Financial data as of September 30, 2026 Appendix | Non-GAAP Reconciliation Pre-Provision, Pre-Tax Net Revenue (“PPNR”) and PPNR Return on Average Assets Three Months Ended Year Ended $000s September 30, 2026 December 31, 2025 Net Income $6,033 $17,541 Add: Provision for credit losses 551 8,247 Add: Income tax expense 1,360 3,986 Pre-Provision, pre-tax net revenue $7,944 $29,774 Average assets 2,118,451 2,085,165 PPNR return on average assets ("PPNR ROAA") 1.50% 1.43% The following non-GAAP financial measure used by the Company provides information useful to investors in understanding the Company’s operating performance and trends and facilitates comparisons with the performance of peers. The following table summarizes the non-GAAP financial measure derived from amounts reported in the Company’s Consolidated financial statements: