VEON 2030: Better life for all Capital Markets Day 2026 Opening Keynote Telecom & Infrastructure Financial Services Digital Life NeoV Financial Model Closing Kaan Terzioğlu, Group CEO
DISCLAIMER BASIS OF PRESENTATION VEON's results and other financial information presented in this presentation are, unless otherwise stated, prepared in accordance with International Financial Reporting Standards (“IFRS”) and have not been externally reviewed and audited. The financial information included in this presentation is preliminary and is based on a number of assumptions that are subject to inherent uncertainties and subject to change. The financial information presented herein is based on internal management accounts, is the responsibility of management and has not been audited, reviewed or verified. Certain amounts and percentages that appear in this presentation have been subject to rounding adjustments. As a result, certain numerical figures shown as totals, including those in the tables, may not be an exact arithmetic aggregation of the figures that precede or follow them. Although we believe the information to be reasonable, actual results may vary from the information contained above and such variations could be material. As such, you should not place undue reliance on this information. This information may not be indicative of the actual results for the current period or any future period. UKRAINE Our operations in Ukraine continue to be affected by the war. We are doing everything we can to protect the safety of our employees, while continuing to ensure the uninterrupted operation of our communications, financial and digital services. We are closely monitoring the possibility of the imposition of further legal and regulatory restrictions, including sanctions and countersanctions, in connection with the ongoing war in Ukraine and any potential impact the war may have on our results, whether directly or indirectly. The financial results presented herein for Ukraine include the results of Kyivstar Group Ltd., which was listed on Nasdaq in August 2025, together with those of Ukraine Tower Company LLC (“UTC”), our Ukrainian network infrastructure business. UTC is not owned by Kyivstar Group Ltd. For this reason, the Ukraine results presented herein may differ from those prepared and published by Kyivstar Group Ltd. FORWARD-LOOKING STATEMENTS This presentation contains “forward-looking statements”, within the meaning of Section 27A of the U.S. Securities Act of 1933, as amended, and Section 21E of the U.S. Securities Exchange Act of 1934, as amended. Such forward-looking statements may be identified by words such as “may,” “will,” “expect,” “plan,” “anticipate,” “potential,” “continue,” “aim,” “goal,” “target,” and other similar words. Forward-looking statements include statements relating to, among other things, VEON’s plans to implement its strategic priorities, operating model and development plans; VEON's ability to achieve anticipated performance results, including VEON’s aspirations for its performance by 2030; VEON’s intended expansion of its digital experience, including digital, financial services and AI offerings; VEON’s assessment of the impact of the war in Ukraine, including recent escalations, on its current and future operations and financial condition; VEON’s assessment of the impact of political instability in Bangladesh; future market developments and trends, including addressable-market and penetration estimates; operational and network development and network investment, including the roll-out of 4G/5G networks and satellite direct-to-cell services; spectrum acquisitions and renewals; VEON’s ability to realize the acquisition and disposition of any of its businesses and assets, including through TowerCo and InfraCo structures, as well as the impact of the consolidation of such newly acquired business and assets, like Tabletki, into VEON’s financials and results of operations; VEON’s ability to execute its strategic transactions in the timeframes anticipated, or at all; VEON’s ability to realize financial improvements; VEON’s ability to realize its share buyback and cancellation targets; and VEON’s ability to realize its targets and commercial initiatives in its various countries of operation. While the forward-looking statements included in this presentation are based on management’s best assessment, there are numerous risks and uncertainties that could cause VEON’s actual results, plans and objectives to differ materially from those expressed, such as those risks discussed in the section entitled “Risk Factors” in VEON’s 2025 Form 20-F filed with the SEC on March 16, 2026 and other public filings made by VEON with the SEC. The forward-looking statements speak only as of the date hereof and we disclaim any obligation to update them, except to the extent required by law. NON-IFRS MEASURES AND OPERATING METRICS This presentation includes financial measures not presented in accordance with IFRS, including EBITDA, EBITDA margin, EBITDAaL, free cash flow (before and after leases and licences), net debt, net debt excluding leases, net leverage, capex and capex intensity, and growth rates in local currency, USD and inflation-adjusted terms. Digital revenue and customer, multiplay, ARPU, churn and lifetime value metrics are unaudited management measures. These measures are supplemental, should not be considered in isolation or as a substitute for, or superior to, IFRS measures, and may not be comparable to similarly titled measures of other companies. Reconciliations to the most directly comparable IFRS measures are included in VEON’s Earnings Release and Operating Highlights for the Third Quarter and Nine Months ended September 30, 2026, available on the VEON and SEC websites. Our 2030 ambitions (revenue and EBITDA growth, free cash flow, net leverage excluding leases and capex intensity) include non-IFRS measures. We are not able to provide a reconciliation of these forward- looking measures to the most directly comparable IFRS measures without unreasonable effort, because we cannot reliably forecast certain reconciling items, including income taxes, net foreign exchange gains and losses, gains and losses on disposals of businesses and assets, impairment, changes in the fair value of financial instruments, finance costs and the timing and amount of acquisitions and disposals. These items are uncertain, depend on factors outside our control and may be significant. MARKET DATA AND THIRD-PARTY INFORMATION Market, industry and population data are derived from third-party sources, including GSMA Intelligence, the UN, the IMF, the World Bank, McKinsey Value Intelligence, DataReportal, Microsoft, national regulators and public company disclosures, as well as VEON estimates. VEON has not independently verified third-party data, and estimates and projections to 2030 are inherently uncertain. Peer and industry benchmark information, including total shareholder return comparisons, is included for illustrative purposes only and is not an indication of the value of VEON or any of its businesses. The market value of listed holdings is stated as of the date indicated and fluctuates. INSIDE INFORMATION Furthermore, elements of this presentation contain or may contain, “inside information” as defined under the Market Abuse Regulation (EU) No. 596/2014.
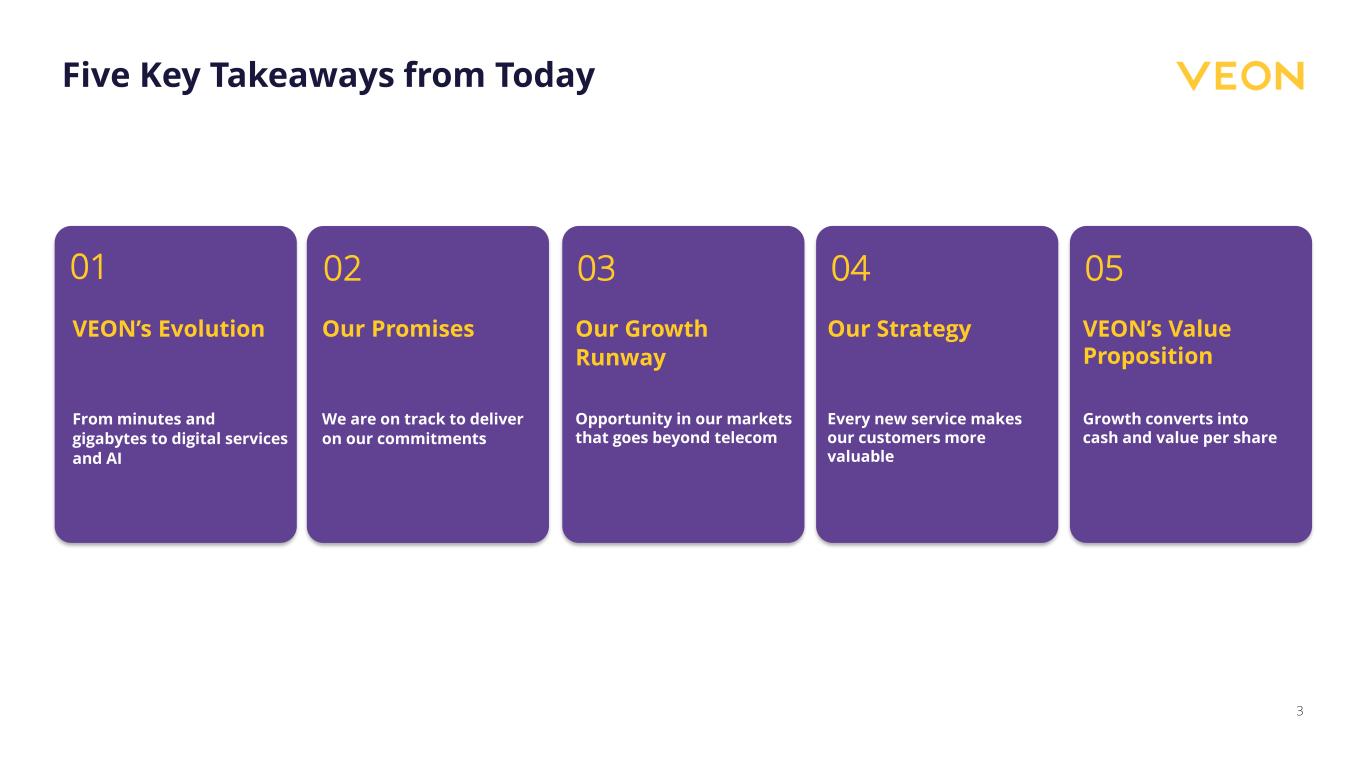
3 Five Key Takeaways from Today VEON’s Evolution From minutes and gigabytes to digital services and AI 0201 Our Promises We are on track to deliver on our commitments 03 Our Growth Runway Opportunity in our markets that goes beyond telecom 05 Growth converts into cash and value per share VEON’s Value Proposition 04 Every new service makes our customers more valuable Our Strategy
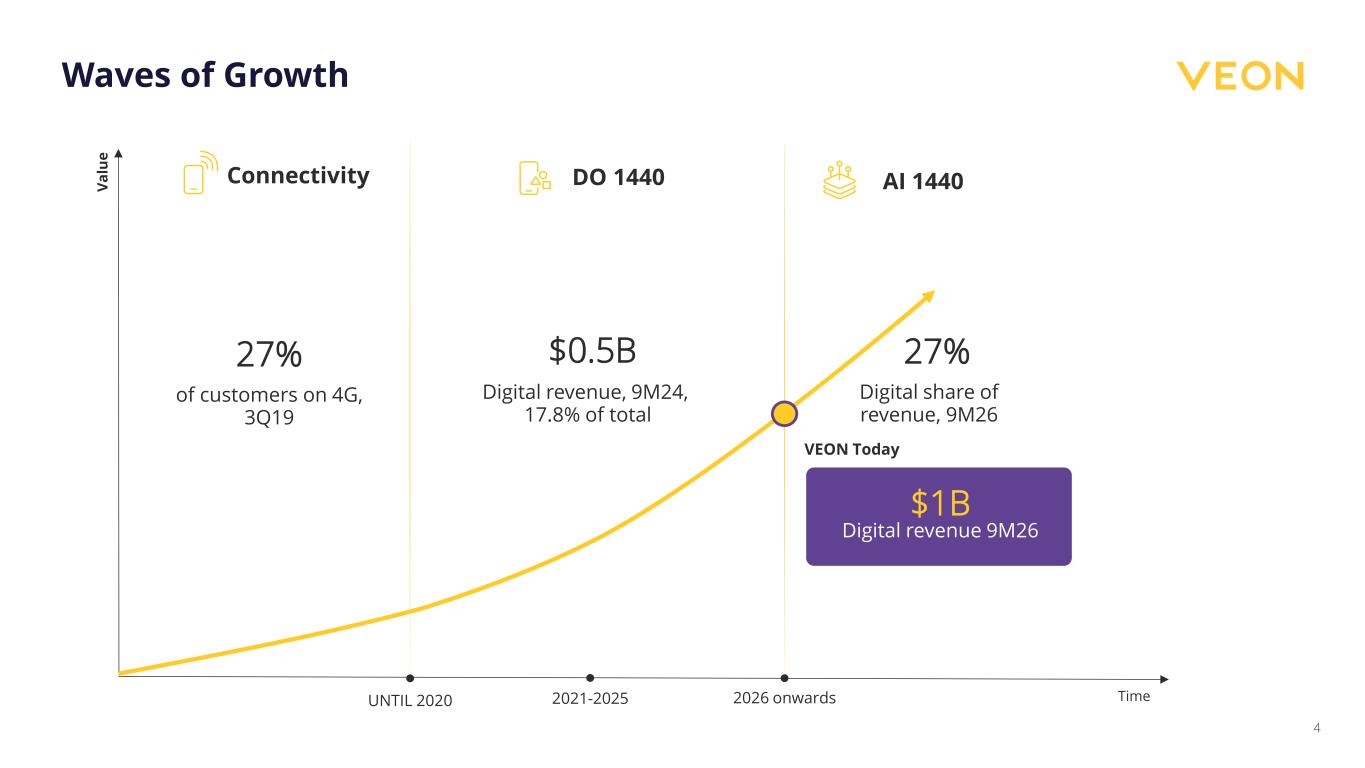
Waves of Growth Time 27% of customers on 4G, 3Q19 UNTIL 2020 2021-2025 2026 onwards V a lu e Connectivity DO 1440 AI 1440 $0.5B Digital revenue, 9M24, 17.8% of total 4 $1B Digital revenue 9M26 VEON Today 27% Digital share of revenue, 9M26
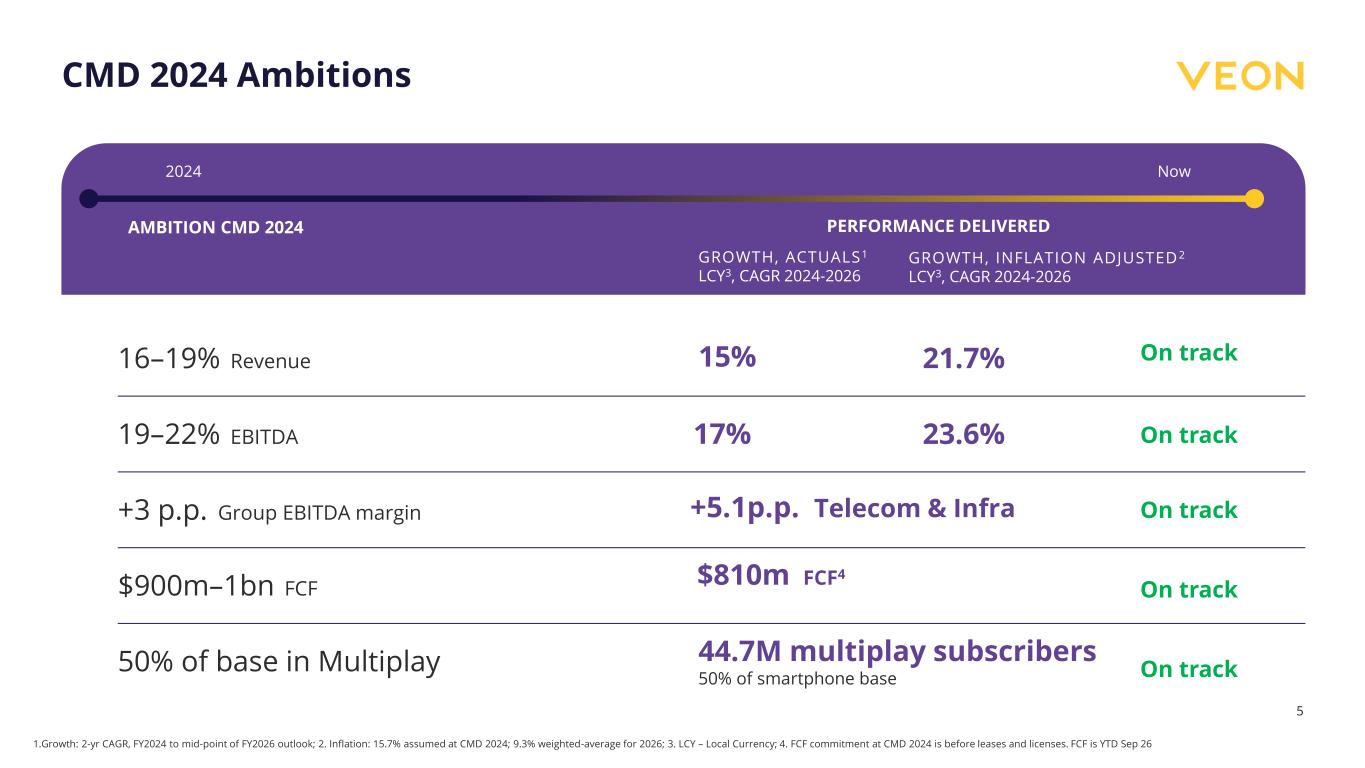
5 CMD 2024 Ambitions 19–22% EBITDA 23.6% +3 p.p. Group EBITDA margin $900m–1bn FCF 50% of base in Multiplay 44.7M multiplay subscribers 50% of smartphone base 1.Growth: 2-yr CAGR, FY2024 to mid-point of FY2026 outlook; 2. Inflation: 15.7% assumed at CMD 2024; 9.3% weighted-average for 2026; 3. LCY – Local Currency; 4. FCF commitment at CMD 2024 is before leases and licenses. FCF is YTD Sep 26 AMBITION CMD 2024 PERFORMANCE DELIVERED 2024 Now GROWTH, ACTUALS1 LCY3, CAGR 2024-2026 GROWTH, INFLATION ADJUSTED 2 LCY3, CAGR 2024-2026 16–19% Revenue 21.7%15% 17% +5.1p.p. Telecom & Infra $810m FCF4 5 On track On track On track On track On track
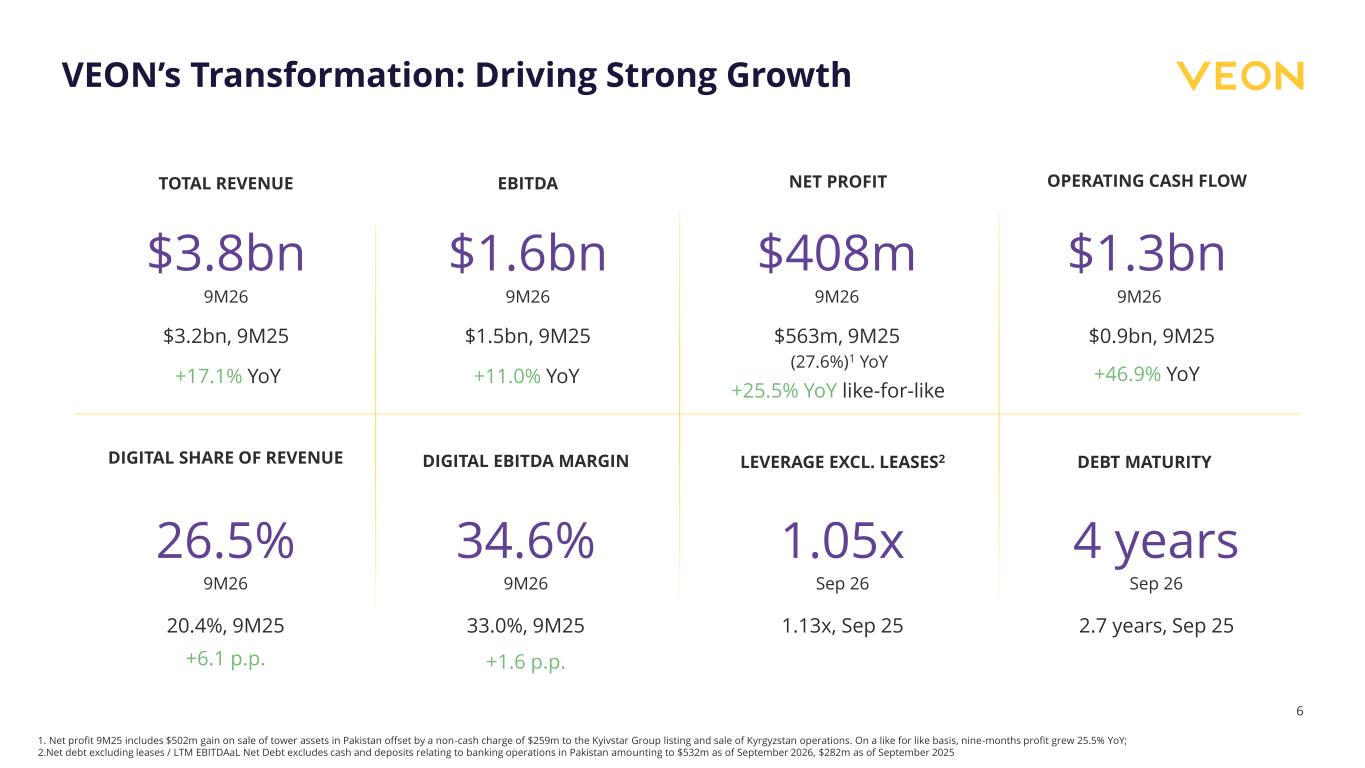
6 VEON’s Transformation: Driving Strong Growth TOTAL REVENUE EBITDA DIGITAL EBITDA MARGINDIGITAL SHARE OF REVENUE NET PROFIT OPERATING CASH FLOW LEVERAGE EXCL. LEASES2 6 $3.8bn $3.2bn, 9M25 +17.1% YoY $1.6bn $1.5bn, 9M25 $408m $563m, 9M25 (27.6%)1 YoY 26.5% 20.4%, 9M25 +6.1 p.p. 34.6% 33.0%, 9M25 +1.6 p.p. $1.3bn $0.9bn, 9M25 +46.9% YoY 1.05x 1.13x, Sep 25 9M26 1. Net profit 9M25 includes $502m gain on sale of tower assets in Pakistan offset by a non-cash charge of $259m to the Kyivstar Group listing and sale of Kyrgyzstan operations. On a like for like basis, nine-months profit grew 25.5% YoY; 2.Net debt excluding leases / LTM EBITDAaL Net Debt excludes cash and deposits relating to banking operations in Pakistan amounting to $532m as of September 2026, $282m as of September 2025 9M26 9M26 9M26 9M26 9M26 Sep 26 +11.0% YoY DEBT MATURITY 4 years Sep 26 2.7 years, Sep 25 +25.5% YoY like-for-like
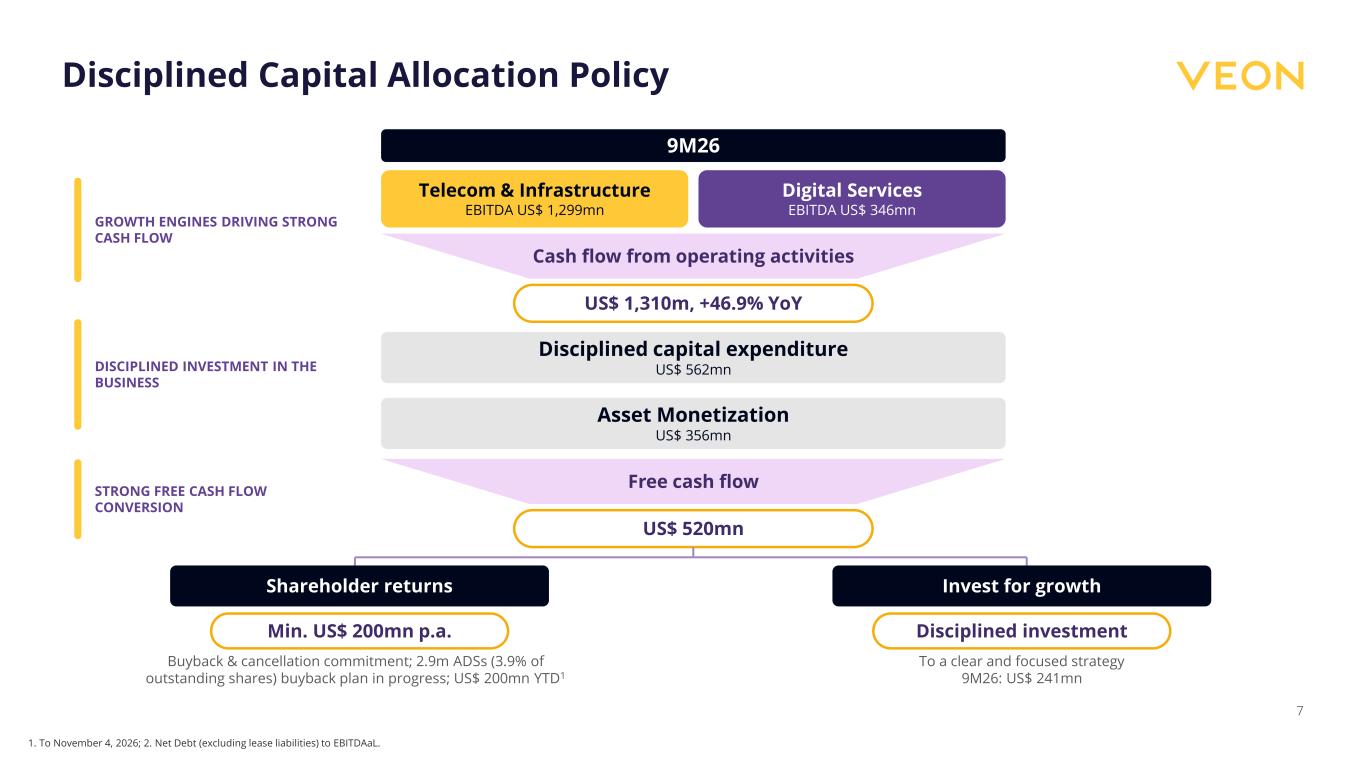
Disciplined Capital Allocation Policy 7 9M26 Telecom & Infrastructure EBITDA US$ 1,299mn Digital Services EBITDA US$ 346mn Cash flow from operating activities US$ 1,310m, +46.9% YoY Disciplined capital expenditure US$ 562mn Asset Monetization US$ 356mn Free cash flow US$ 520mn Shareholder returns Min. US$ 200mn p.a. Buyback & cancellation commitment; 2.9m ADSs (3.9% of outstanding shares) buyback plan in progress; US$ 200mn YTD1 Invest for growth Disciplined investment To a clear and focused strategy 9M26: US$ 241mn GROWTH ENGINES DRIVING STRONG CASH FLOW DISCIPLINED INVESTMENT IN THE BUSINESS STRONG FREE CASH FLOW CONVERSION 1. To November 4, 2026; 2. Net Debt (excluding lease liabilities) to EBITDAaL.
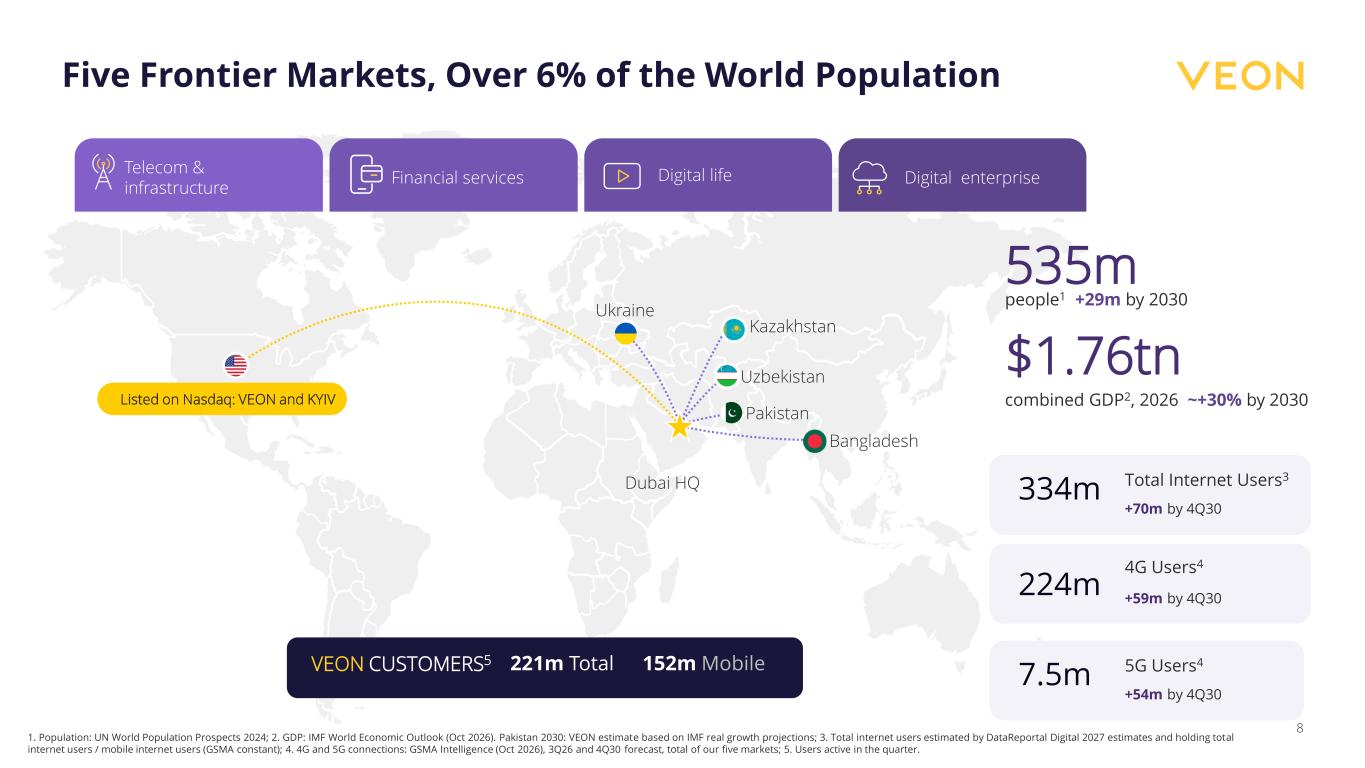
Five Frontier Markets, Over 6% of the World Population 1. Population: UN World Population Prospects 2024. 2. Users active in the quarter 8 Ukraine Kazakhstan Pakistan Bangladesh Listed on Nasdaq: VEON and KYIV Dubai HQ Uzbekistan Telecom & infrastructure Financial services Digital enterpriseDigital life 1. Population: UN World Population Prospects 2024; 2. GDP: IMF World Economic Outlook (Oct 2026). Pakistan 2030: VEON estimate based on IMF real growth projections; 3. Total internet users estimated by DataReportal Digital 2027 estimates and holding total internet users / mobile internet users (GSMA constant); 4. 4G and 5G connections: GSMA Intelligence (Oct 2026), 3Q26 and 4Q30 forecast, total of our five markets; 5. Users active in the quarter. 535m people1 +29m by 2030 $1.76tn combined GDP2, 2026 ~+30% by 2030 224m 4G Users4 +59m by 4Q30 7.5m 5G Users4 +54m by 4Q30 334m Total Internet Users3 +70m by 4Q30 8 221m Total VEON CUSTOMERS5 152m Mobile
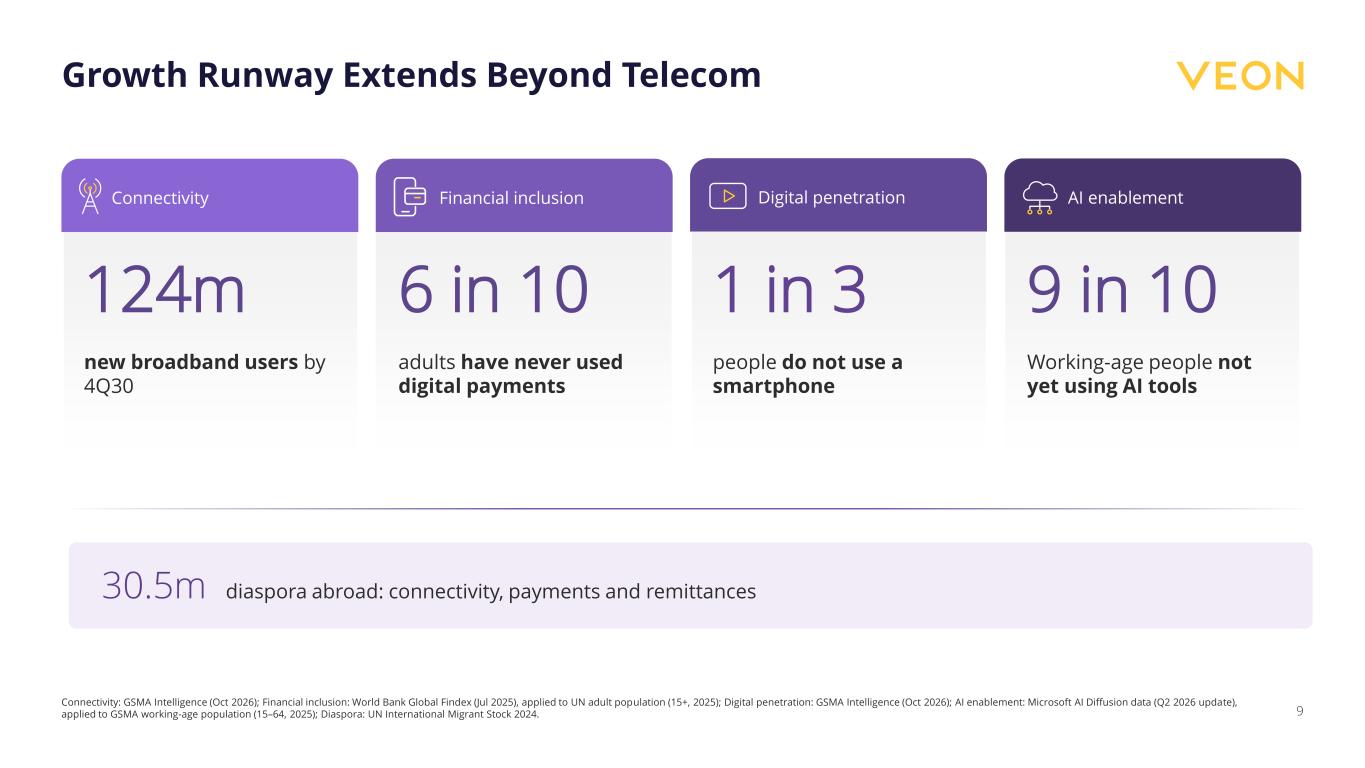
Connectivity: GSMA Intelligence (Oct 2026); Financial inclusion: World Bank Global Findex (Jul 2025), applied to UN adult population (15+, 2025); Digital penetration: GSMA Intelligence (Oct 2026); AI enablement: Microsoft AI Diffusion data (Q2 2026 update), applied to GSMA working-age population (15–64, 2025); Diaspora: UN International Migrant Stock 2024. Growth Runway Extends Beyond Telecom Connectivity 124m new broadband users by 4Q30 Financial inclusion 6 in 10 adults have never used digital payments AI enablement 9 in 10 Working-age people not yet using AI tools Digital penetration 1 in 3 people do not use a smartphone 30.5m diaspora abroad: connectivity, payments and remittances 9
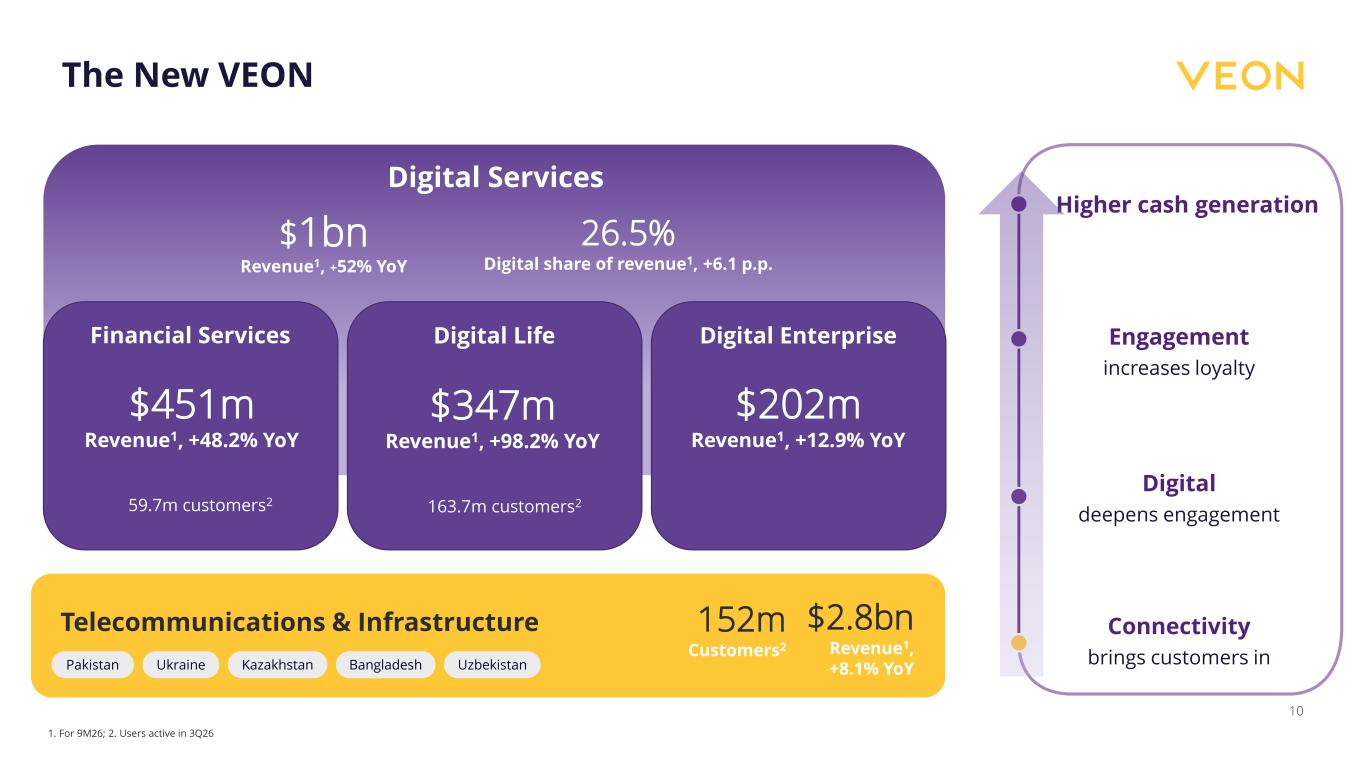
10 Telecommunications & Infrastructure Pakistan Ukraine Kazakhstan Bangladesh Uzbekistan Digital Life Digital EnterpriseFinancial Services Higher cash generation Engagement increases loyalty Digital deepens engagement Connectivity brings customers in Digital Services The New VEON $451m Revenue1, +48.2% YoY $347m Revenue1, +98.2% YoY $202m Revenue1, +12.9% YoY $2.8bn Revenue1, +8.1% YoY $1bn Revenue1, +52% YoY 26.5% Digital share of revenue1, +6.1 p.p. 152m Customers2 1. For 9M26; 2. Users active in 3Q26 163.7m customers259.7m customers2
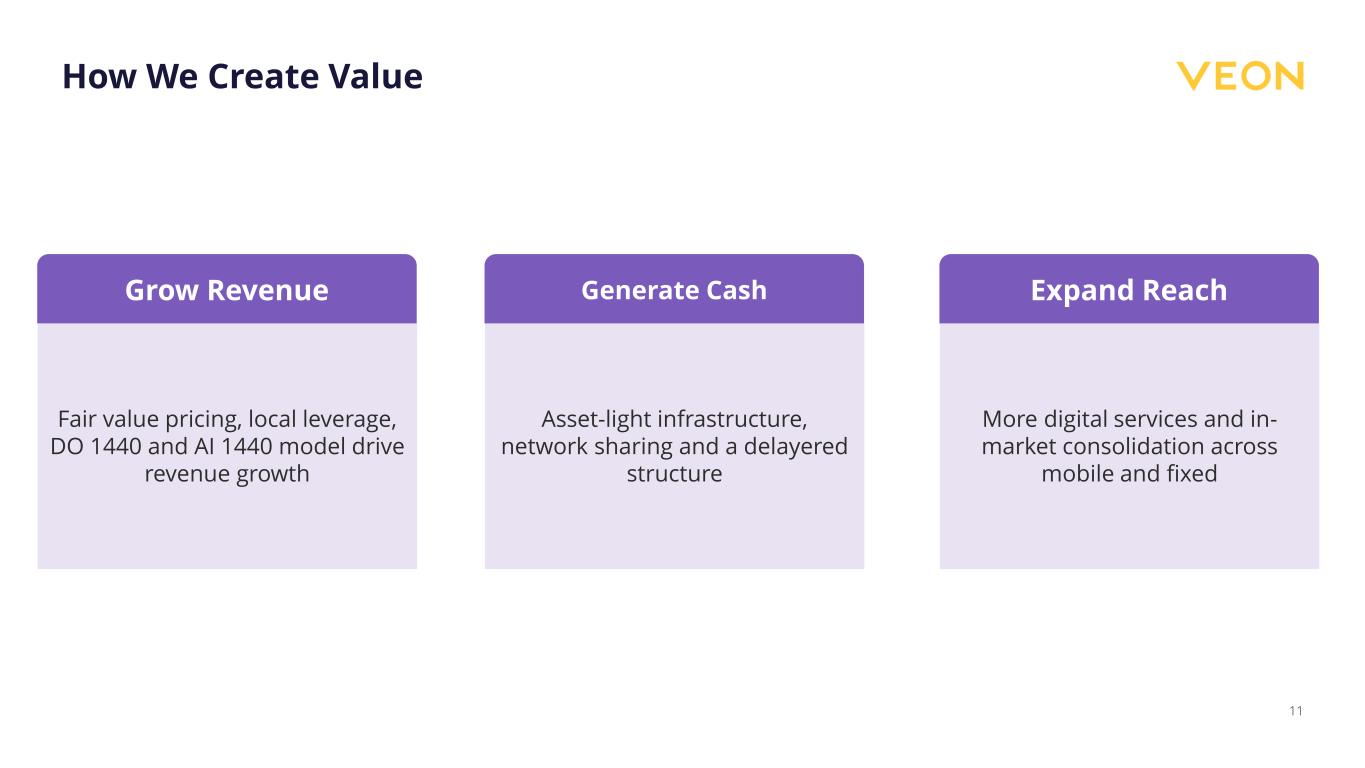
11 Fair value pricing, local leverage, DO 1440 and AI 1440 model drive revenue growth Grow Revenue Asset-light infrastructure, network sharing and a delayered structure Generate Cash More digital services and in- market consolidation across mobile and fixed Expand Reach How We Create Value
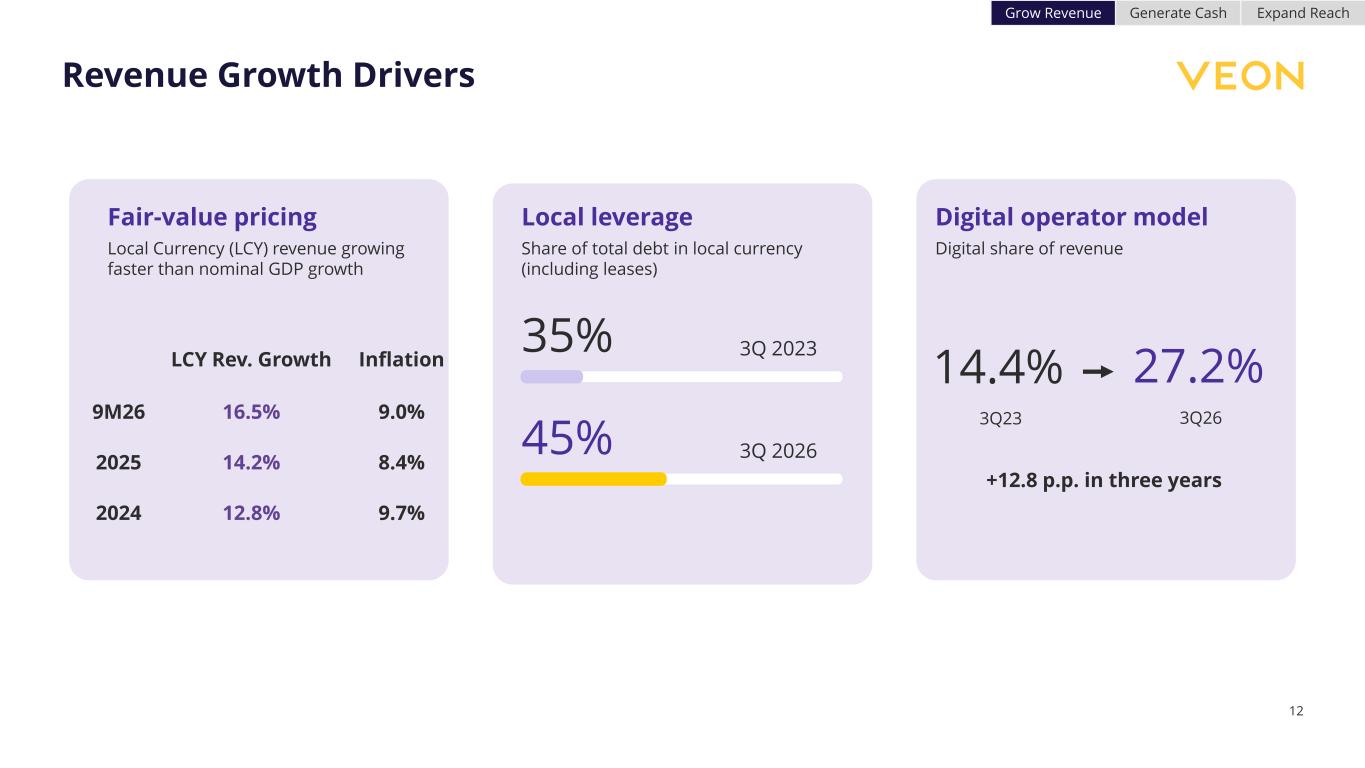
12 Revenue Growth Drivers Fair-value pricing Local Currency (LCY) revenue growing faster than nominal GDP growth Local leverage Share of total debt in local currency (including leases) Digital operator model Digital share of revenue 35% 3Q 2023 45% 3Q 2026 14.4% 3Q23 27.2% 3Q26 +12.8 p.p. in three years Grow Revenue Generate Cash Expand Reach LCY Rev. Growth Inflation 9M26 16.5% 9.0% 2025 14.2% 8.4% 2024 12.8% 9.7%
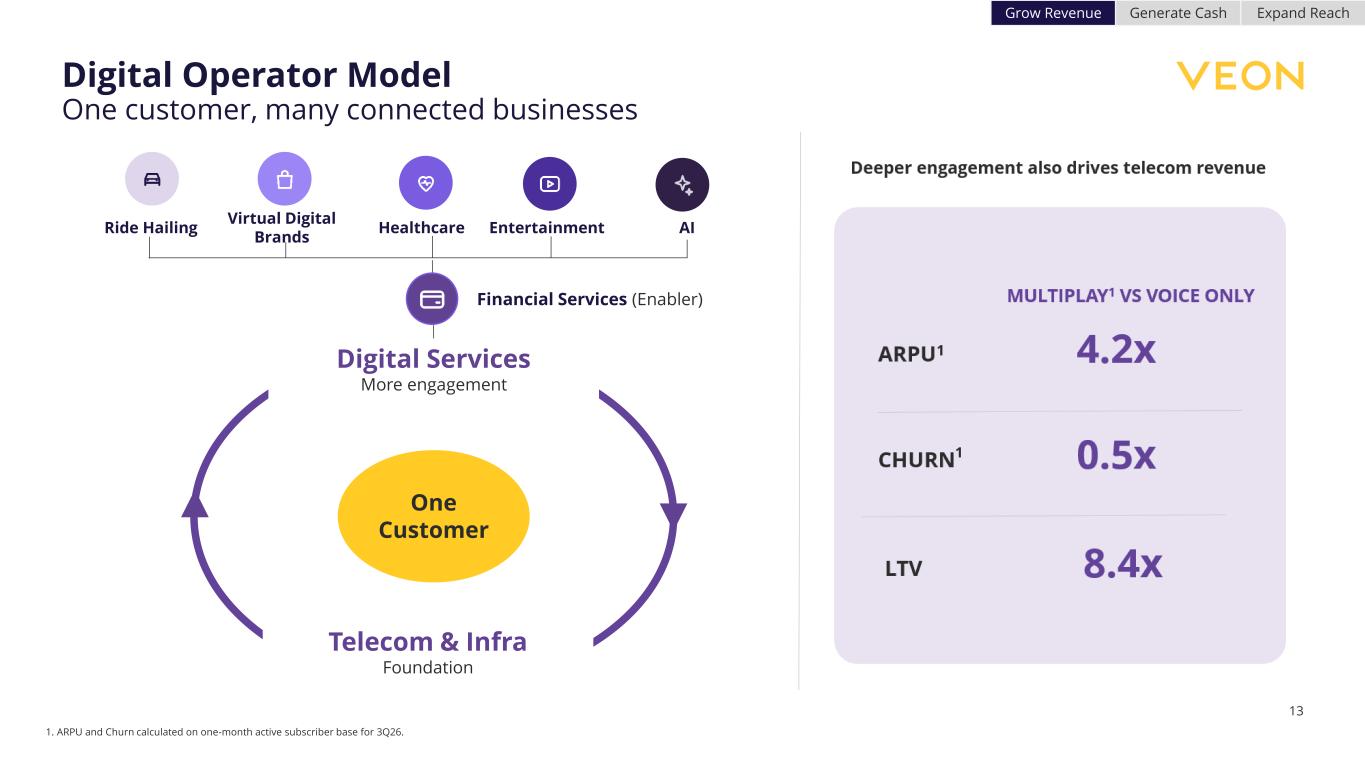
13 Digital Operator Model One customer, many connected businesses One Customer Digital Services More engagement Telecom & Infra Foundation Financial Services (Enabler) Ride Hailing Virtual Digital Brands Healthcare Entertainment AI 1. ARPU and Churn calculated on one-month active subscriber base for 3Q26. Grow Revenue Generate Cash Expand Reach 1
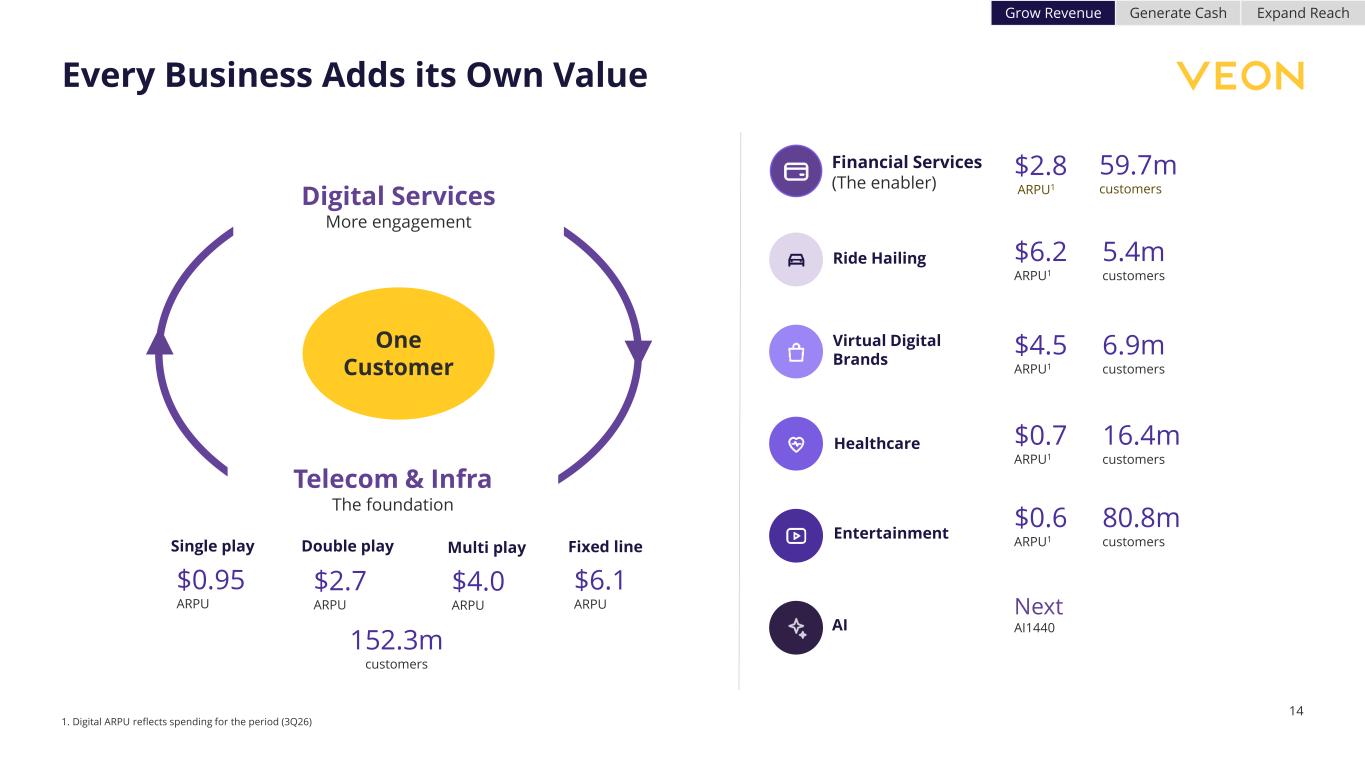
14 Every Business Adds its Own Value One Customer Digital Services More engagement Telecom & Infra The foundation Financial Services (The enabler) Ride Hailing Healthcare Entertainment AI $6.2 ARPU1 5.4m customers $4.5 ARPU1 6.9m customers $0.7 ARPU1 16.4m customers $0.6 ARPU1 80.8m customers $2.8 ARPU1 59.7m customers Next AI1440 152.3m customers Virtual Digital Brands 1. Digital ARPU reflects spending for the period (3Q26) Grow Revenue Generate Cash Expand Reach $0.95 ARPU Single play $2.7 ARPU Double play $4.0 ARPU Multi play Fixed line $6.1 ARPU
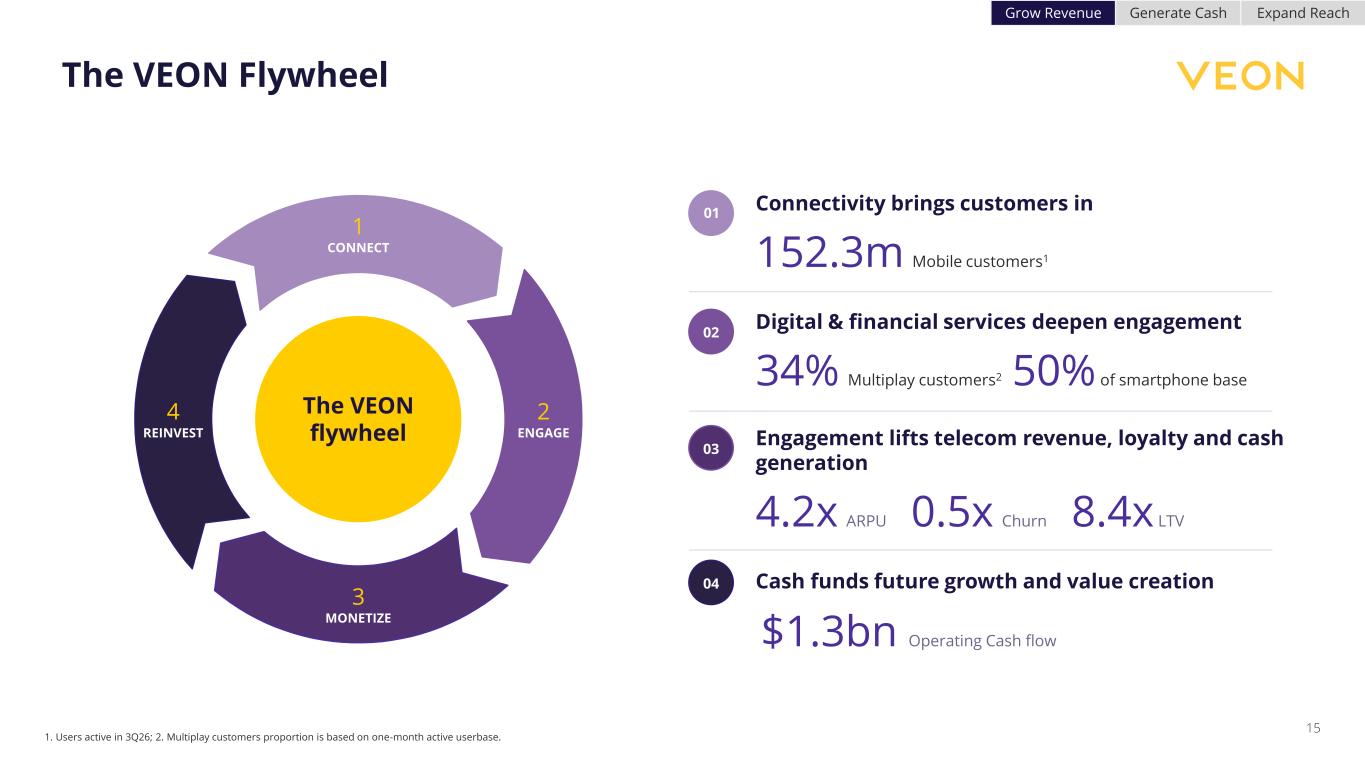
The VEON Flywheel 1. Users active in 3Q26; 2. Multiplay customers proportion is based on one-month active userbase. Grow Revenue Generate Cash Expand Reach 1 CONNECT 2 ENGAGE 3 MONETIZE 4 REINVEST The VEON flywheel 01 Connectivity brings customers in 152.3m Mobile customers1 02 Digital & financial services deepen engagement 34% Multiplay customers2 50% of smartphone base 03 Engagement lifts telecom revenue, loyalty and cash generation 4.2x ARPU 0.5x Churn 8.4x LTV 04 Cash funds future growth and value creation 15 $1.3bn Operating Cash flow
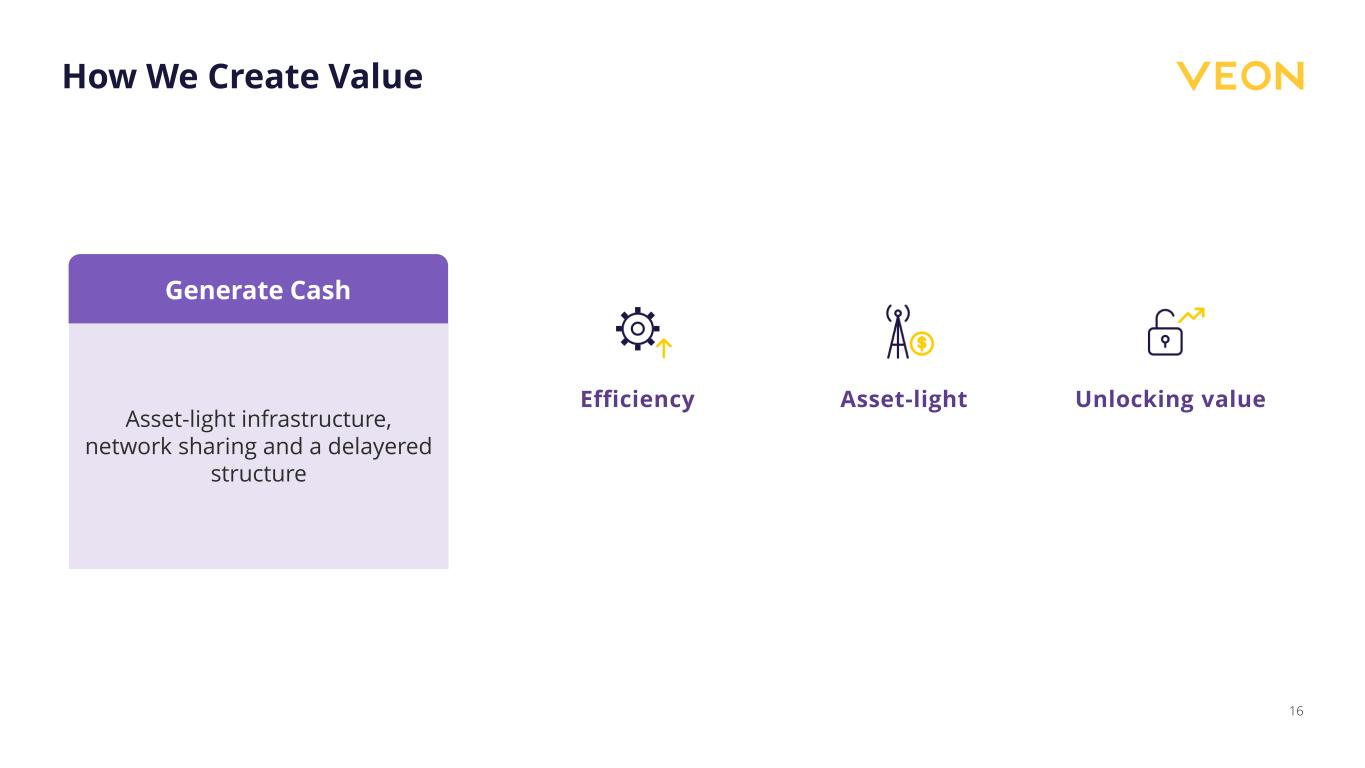
16 Asset-light infrastructure, network sharing and a delayered structure Generate Cash How We Create Value Efficiency Asset-light Unlocking value
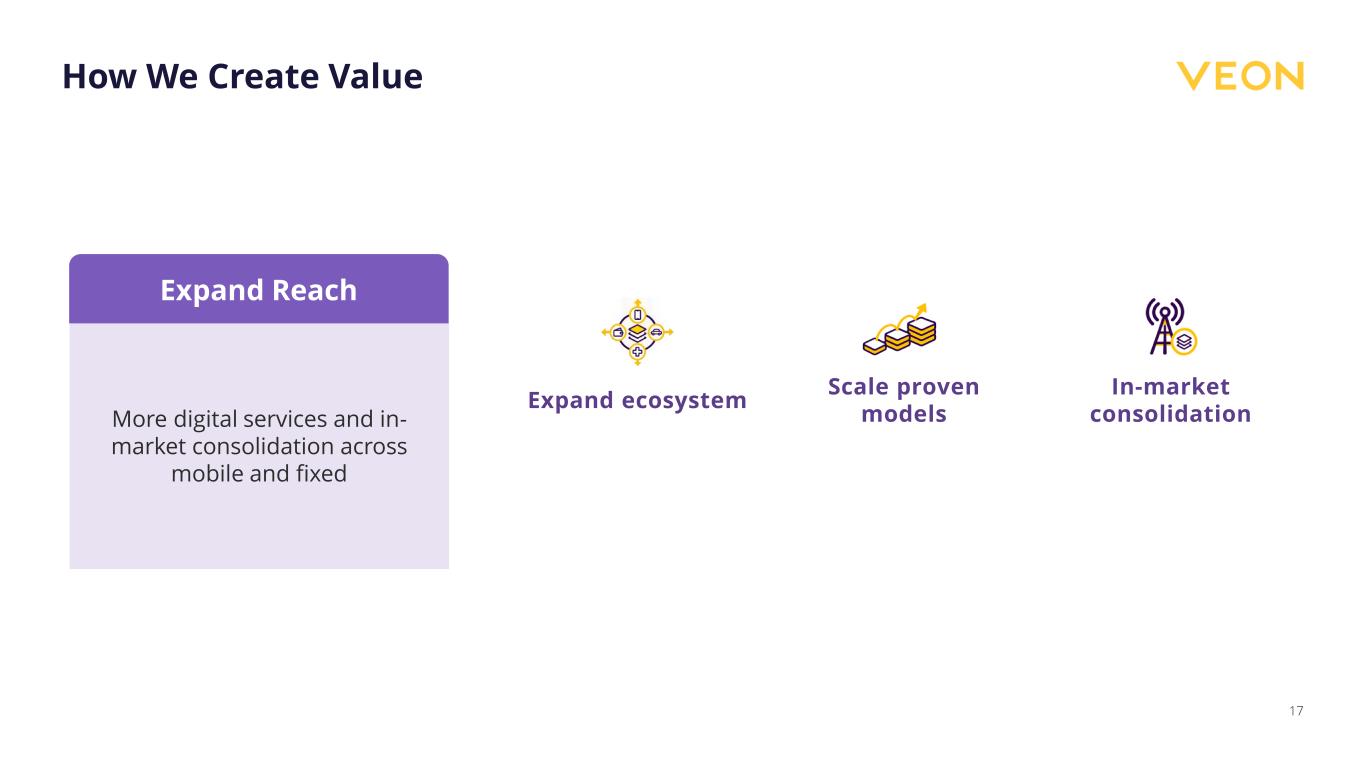
17 More digital services and in- market consolidation across mobile and fixed Expand Reach How We Create Value Expand ecosystem Scale proven models In-market consolidation
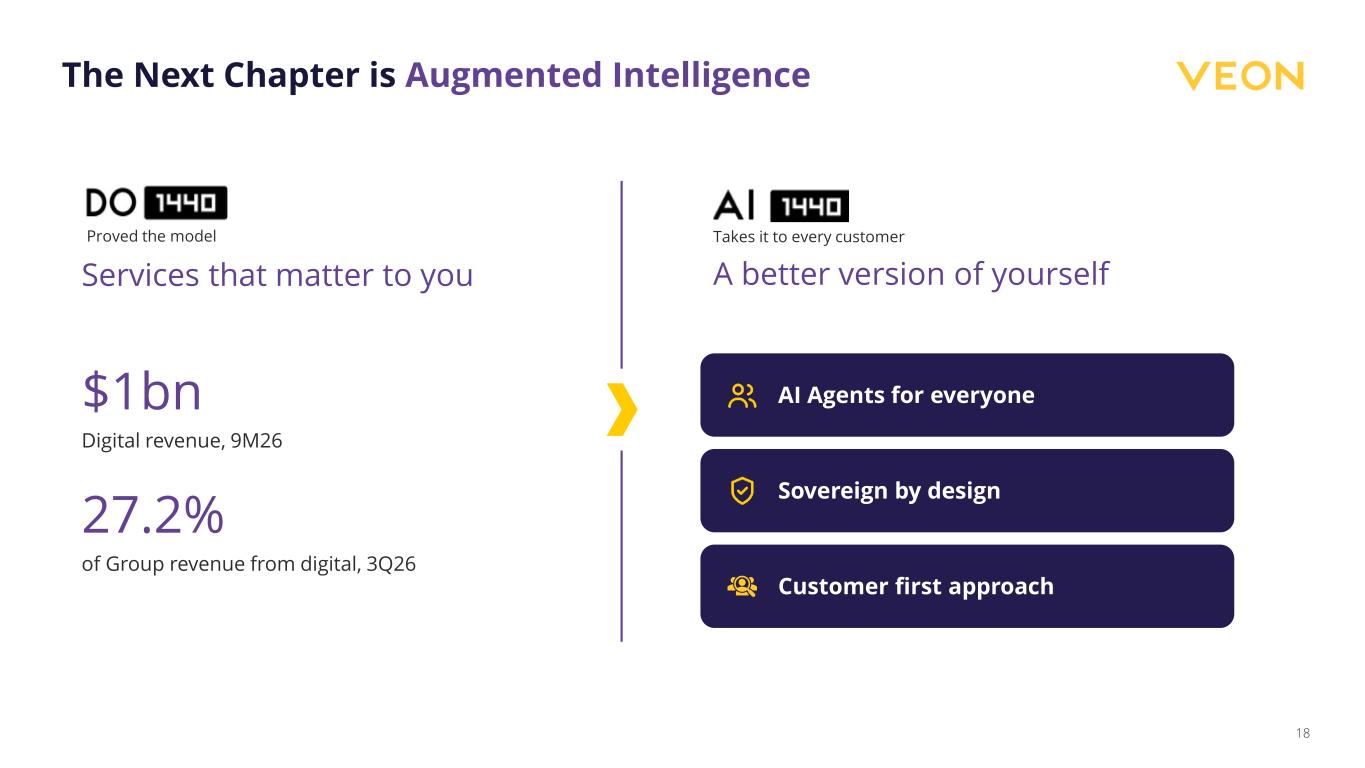
The Next Chapter is Augmented Intelligence Proved the model Services that matter to you 27.2% of Group revenue from digital, 3Q26 Takes it to every customer A better version of yourself AI Agents for everyone Sovereign by design Customer first approach 18 $1bn Digital revenue, 9M26 18
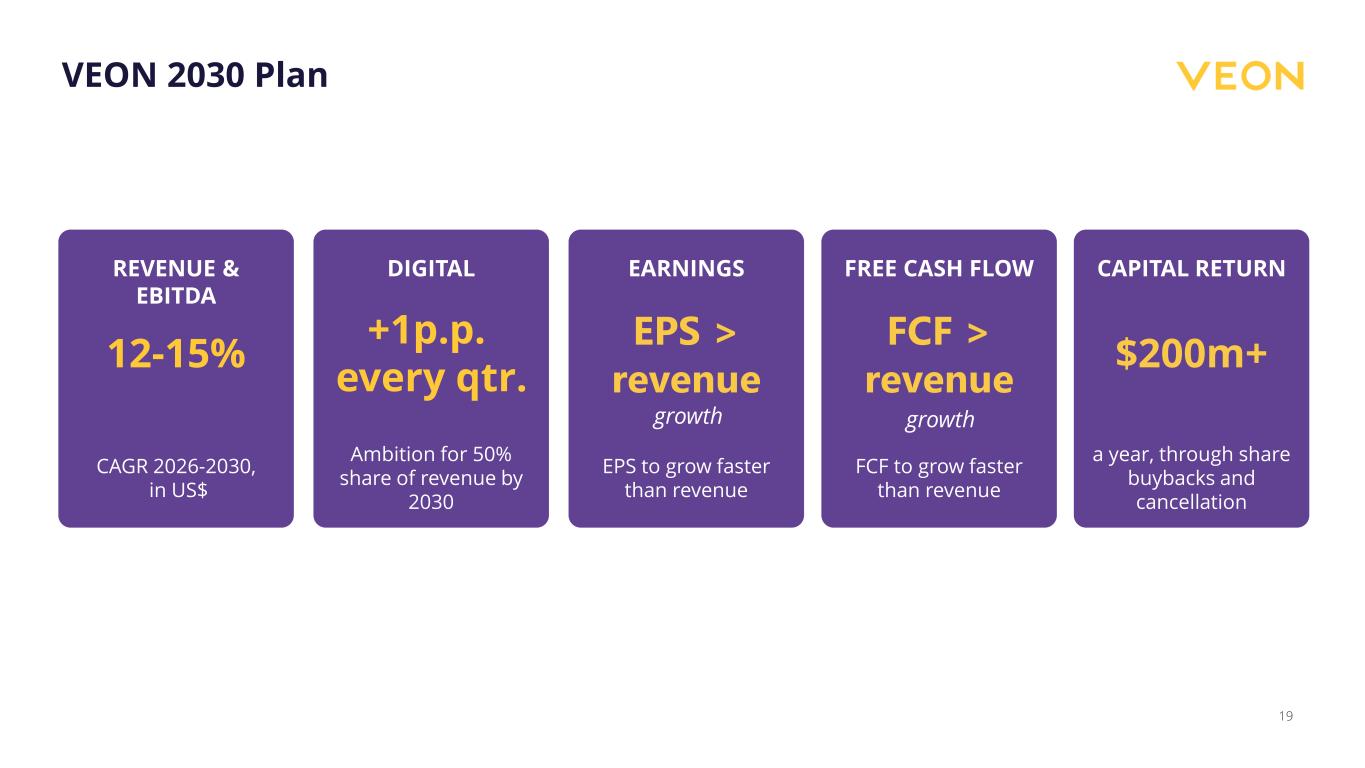
VEON 2030 Plan REVENUE & EBITDA 12-15% CAGR 2026-2030, in US$ DIGITAL +1p.p. every qtr. Ambition for 50% share of revenue by 2030 EARNINGS EPS > revenue EPS to grow faster than revenue FREE CASH FLOW FCF > revenue FCF to grow faster than revenue CAPITAL RETURN $200m+ a year, through share buybacks and cancellation 19 growth growth