Financial Model Capital Markets Day 2026 Opening Keynote Telecom & Infrastructure Financial Services Digital Life NeoV Financial Model Closing Burak Ozer, Group CFO
Disclaimer Important information about this presentation BASIS OF PRESENTATION VEON's results and other financial information presented in this presentation are, unless otherwise stated, prepared in accordance with International Financial Reporting Standards (“IFRS”) and have not been externally reviewed and audited. The financial information included in this presentation is preliminary and is based on a number of assumptions that are subject to inherent uncertainties and subject to change. The financial information presented herein is based on internal management accounts, is the responsibility of management and has not been audited, reviewed or verified. Certain amounts and percentages that appear in this presentation have been subject to rounding adjustments. As a result, certain numerical figures shown as totals, including those in the tables, may not be an exact arithmetic aggregation of the figures that precede or follow them. Although we believe the information to be reasonable, actual results may vary from the information contained above and such variations could be material. As such, you should not place undue reliance on this information. This information may not be indicative of the actual results for the current period or any future period. UKRAINE Our operations in Ukraine continue to be affected by the war. We are doing everything we can to protect the safety of our employees, while continuing to ensure the uninterrupted operation of our communications, financial and digital services. We are closely monitoring the possibility of the imposition of further legal and regulatory restrictions, including sanctions and countersanctions, in connection with the ongoing war in Ukraine and any potential impact the war may have on our results, whether directly or indirectly. The financial results presented herein for Ukraine include the results of Kyivstar Group Ltd., which was listed on Nasdaq in August 2025, together with those of Ukraine Tower Company LLC (“UTC”), our Ukrainian network infrastructure business. UTC is not owned by Kyivstar Group Ltd. For this reason, the Ukraine results presented herein may differ from those prepared and published by Kyivstar Group Ltd. FORWARD-LOOKING STATEMENTS This presentation contains “forward-looking statements”, within the meaning of Section 27A of the U.S. Securities Act of 1933, as amended, and Section 21E of the U.S. Securities Exchange Act of 1934, as amended. Such forward-looking statements may be identified by words such as “may,” “will,” “expect,” “plan,” “anticipate,” “potential,” “continue,” “aim,” “goal,” “target,” and other similar words. Forward-looking statements include statements relating to, among other things, VEON’s plans to implement its strategic priorities, operating model and development plans; VEON's ability to achieve anticipated performance results, including VEON’s FY26 outlook and VEON’s aspirations for its performance by 2030; VEON’s assessment of the impact of the war in Ukraine, including recent escalations, on its current and future operations and financial condition; VEON’s assessment of the impact of political instability in Bangladesh; future market developments and trends; operational and network development and network investment, including capex and capex intensity; VEON’s ability to realize the acquisition and disposition of any of its businesses and assets, including asset disposals, as well as the impact of the consolidation of such newly acquired business and assets, like Tabletki, into VEON’s financials and results of operations; VEON’s ability to execute its strategic transactions in the timeframes anticipated, or at all; VEON’s ability to realize financial improvements, including the debt maturity profile, refinancing and liquidity; VEON’s ability to realize its share buyback and cancellation targets; and VEON’s ability to realize its targets and commercial initiatives in its various countries of operation, including its CMD 2024 commitments. While the forward-looking statements included in this presentation are based on management’s best assessment, there are numerous risks and uncertainties that could cause VEON’s actual results, plans and objectives to differ materially from those expressed, such as those risks discussed in the section entitled “Risk Factors” in VEON’s 2025 Form 20-F filed with the SEC on March 16, 2026 and other public filings made by VEON with the SEC. The forward-looking statements speak only as of the date hereof and we disclaim any obligation to update them, except to the extent required by law. NON-IFRS MEASURES AND OPERATING METRICS This presentation includes financial measures not presented in accordance with IFRS, including EBITDA, EBITDA margin, EBITDAaL, free cash flow (equity free cash flow after lease and licence payments, including disposal proceeds and excluding banking cash flows), free cash flow before leases and licences, free cash flow margin and “underlying” free cash flow margin (excluding asset disposal proceeds and the banking balance adjustment), net debt (excluding cash and deposits relating to banking operations in Pakistan), net debt excluding leases, net leverage, capex and capex intensity (LTM, including excluding Ukraine and before licences and leases), growth rates and CAGRs in USD, local currency and inflation-adjusted terms, digital and telco revenue and EBITDA mix, and HQ cash. These measures are supplemental, should not be considered in isolation or as a substitute for, or superior to, IFRS measures, and may not be comparable to similarly titled measures of other companies. Reconciliations to the most directly comparable IFRS measures are included in VEON’s Earnings Release and Operating Highlights for the Third Quarter and Nine Months ended September 30, 2026, available on the VEON and SEC websites. Our FY26 outlook and 2030 ambitions include non-IFRS measures. We are not able to provide a reconciliation of these forward-looking measures to the most directly comparable IFRS measures without unreasonable effort, because we cannot reliably forecast certain reconciling items, including income taxes, net foreign exchange gains and losses, gains and losses on disposals of businesses and assets, impairment, changes in the fair value of financial instruments, finance costs and the timing and amount of acquisitions and disposals. These items are uncertain, depend on factors outside our control and may be significant. MARKET DATA AND THIRD-PARTY INFORMATION Market, industry and population data, and inflation and exchange-rate assumptions, are derived from third-party sources, including GSMA Intelligence, the UN, the IMF, the World Bank, national regulators and public company disclosures, as well as VEON estimates. VEON has not independently verified third-party data, and estimates and projections to 2030 are inherently uncertain. Peer company information is included for illustrative purposes only and is not an indication of the value of VEON or any of its businesses. INSIDE INFORMATION Furthermore, elements of this presentation contain or may contain, “inside information” as defined under the Market Abuse Regulation (EU) No. 596/2014.
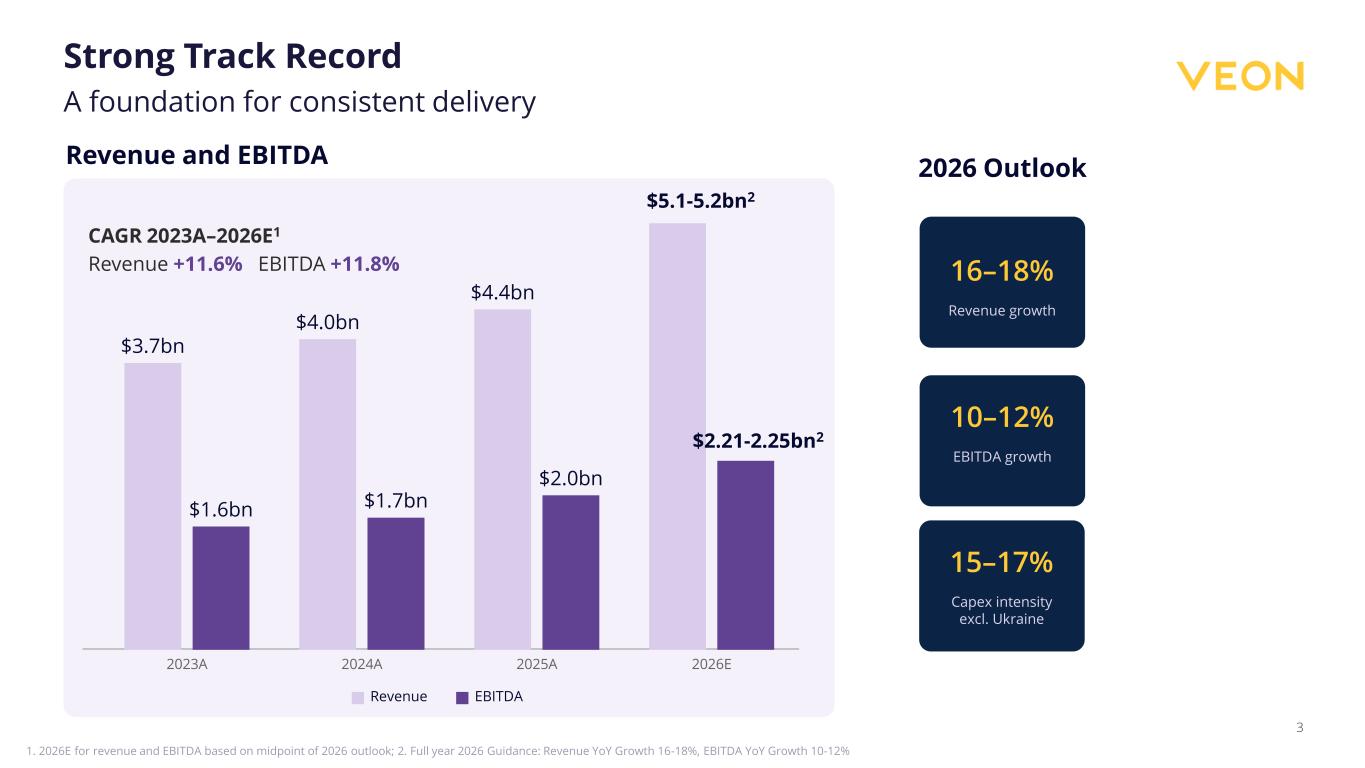
Strong Track Record A foundation for consistent delivery Revenue and EBITDA $3.7bn $1.6bn 2023A $4.0bn $1.7bn 2024A $4.4bn $2.0bn 2025A Revenue EBITDA 2026 Outlook 16–18% Revenue growth 10–12% EBITDA growth 15–17% Capex intensity excl. Ukraine 2026E CAGR 2023A–2026E1 Revenue +11.6% EBITDA +11.8% 1. 2026E for revenue and EBITDA based on midpoint of 2026 outlook; 2. Full year 2026 Guidance: Revenue YoY Growth 16-18%, EBITDA YoY Growth 10-12% $5.1-5.2bn2 $2.21-2.25bn2 3
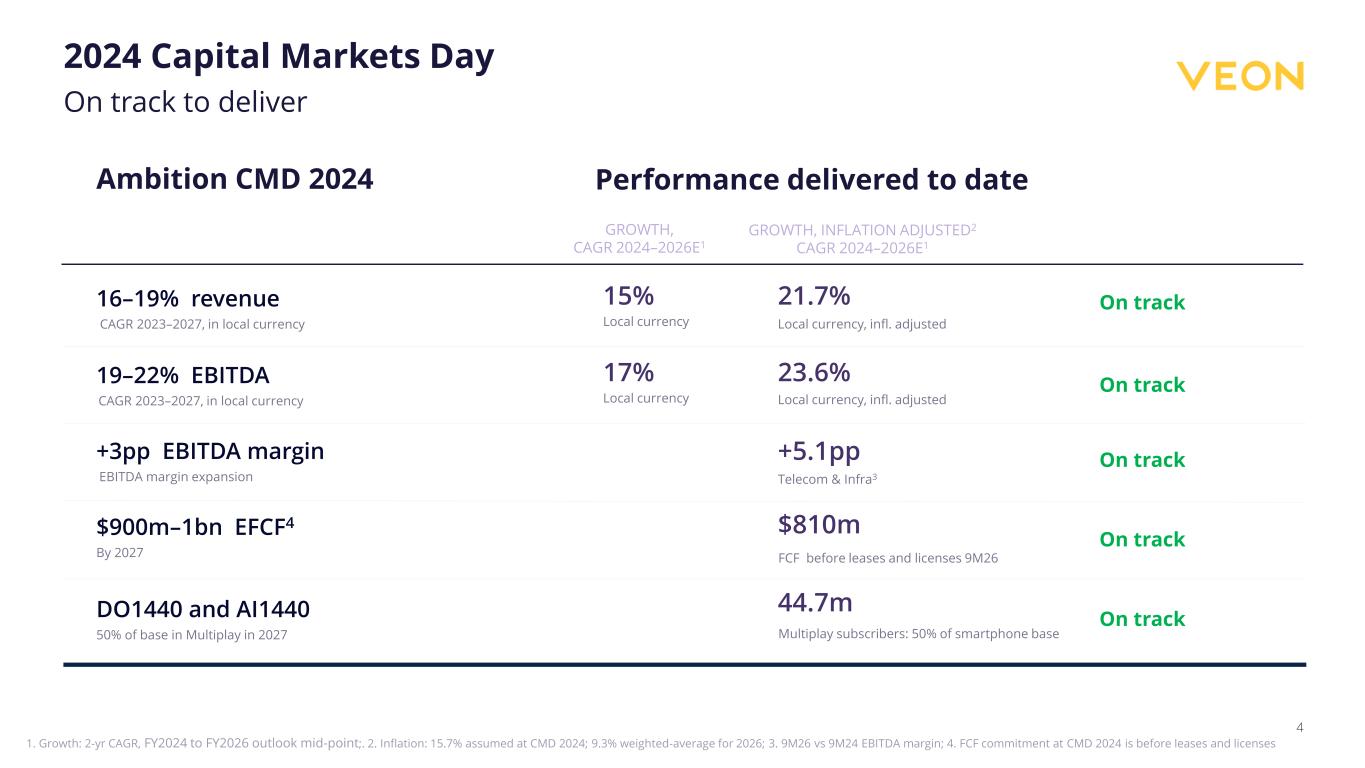
2024 Capital Markets Day On track to deliver Ambition CMD 2024 Performance delivered to date GROWTH, CAGR 2024–2026E1 GROWTH, INFLATION ADJUSTED2 CAGR 2024–2026E1 16–19% revenue CAGR 2023–2027, in local currency 15% Local currency 21.7% Local currency, infl. adjusted 19–22% EBITDA CAGR 2023–2027, in local currency 17% Local currency 23.6% Local currency, infl. adjusted +3pp EBITDA margin EBITDA margin expansion +5.1pp Telecom & Infra3 $900m–1bn EFCF4 By 2027 $810m FCF before leases and licenses 9M26 DO1440 and AI1440 50% of base in Multiplay in 2027 Multiplay subscribers: 50% of smartphone base 44.7m 1. Growth: 2-yr CAGR, FY2024 to FY2026 outlook mid-point;. 2. Inflation: 15.7% assumed at CMD 2024; 9.3% weighted-average for 2026; 3. 9M26 vs 9M24 EBITDA margin; 4. FCF commitment at CMD 2024 is before leases and licenses On track On track On track On track On track 4
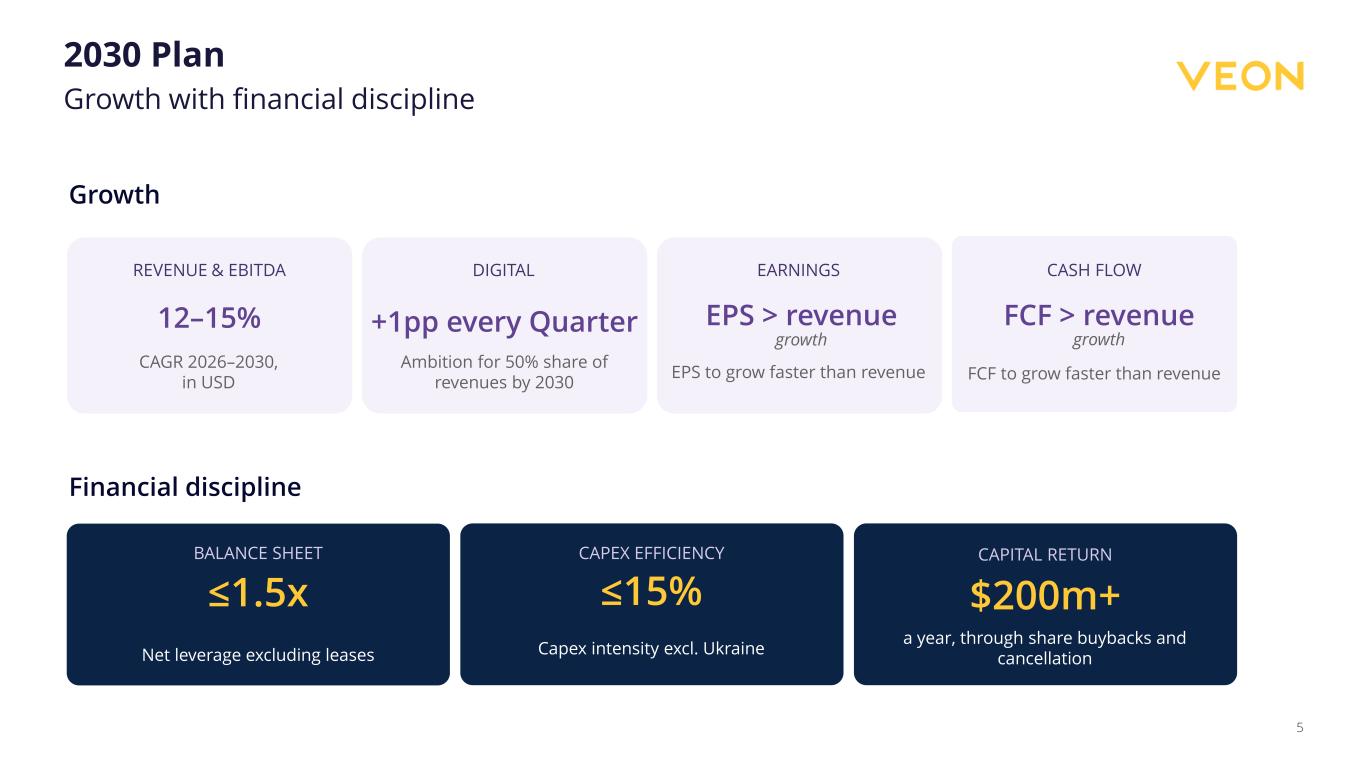
2030 Plan Growth with financial discipline Growth REVENUE & EBITDA 12–15% CAGR 2026–2030, in USD DIGITAL +1pp every Quarter Ambition for 50% share of revenues by 2030 EARNINGS EPS > revenue EPS to grow faster than revenue CAPITAL RETURN $200m+ a year, through share buybacks and cancellation Financial discipline BALANCE SHEET ≤1.5x Net leverage excluding leases CAPEX EFFICIENCY ≤15% Capex intensity excl. Ukraine CASH FLOW FCF > revenue FCF to grow faster than revenue growth growth 5
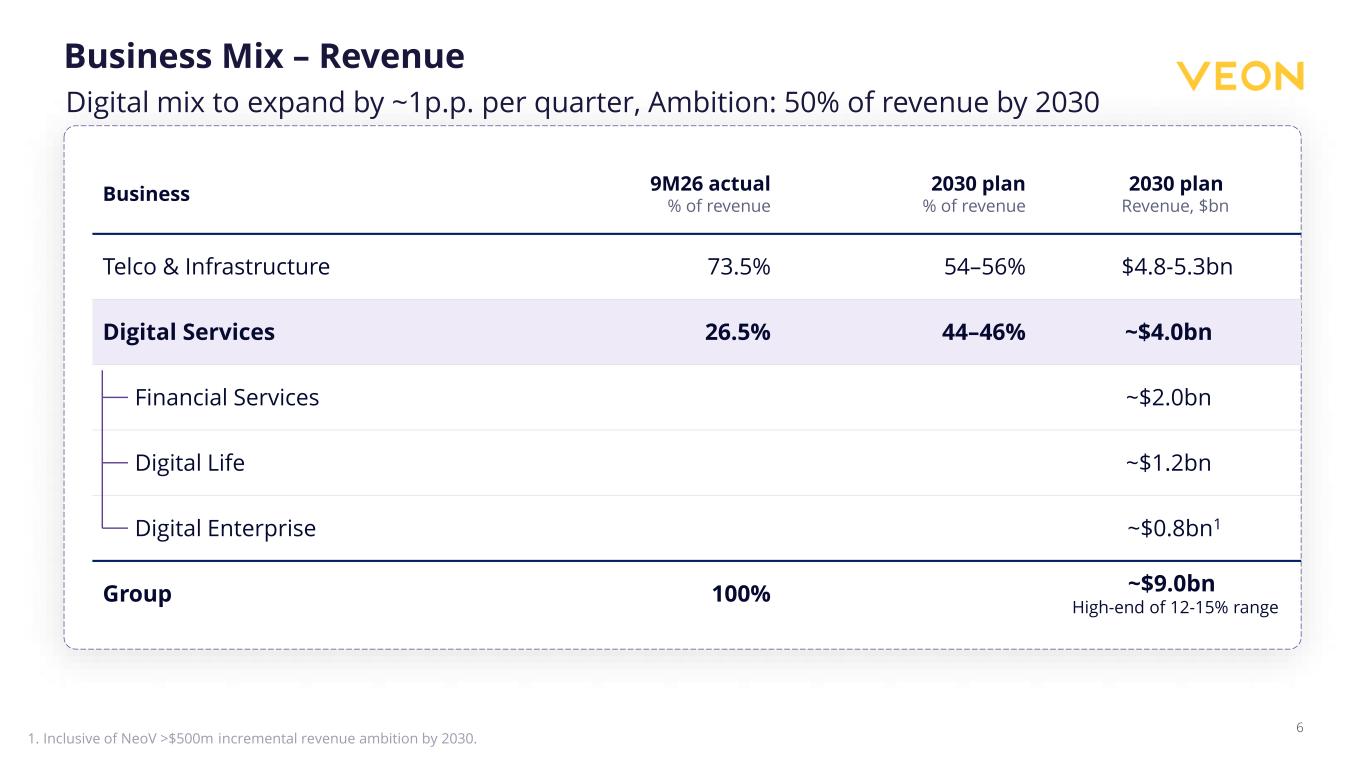
Business Mix – Revenue Digital mix to expand by ~1p.p. per quarter, Ambition: 50% of revenue by 2030 Business 9M26 actual % of revenue 2030 plan % of revenue 2030 plan Revenue, $bn Telco & Infrastructure 73.5% 54–56% $4.8-5.3bn Digital Services 26.5% 44–46% ~$4.0bn Financial Services ~$2.0bn Digital Life ~$1.2bn Digital Enterprise ~$0.8bn1 Group 100% ~$9.0bn High-end of 12-15% range 6 1. Inclusive of NeoV >$500m incremental revenue ambition by 2030.
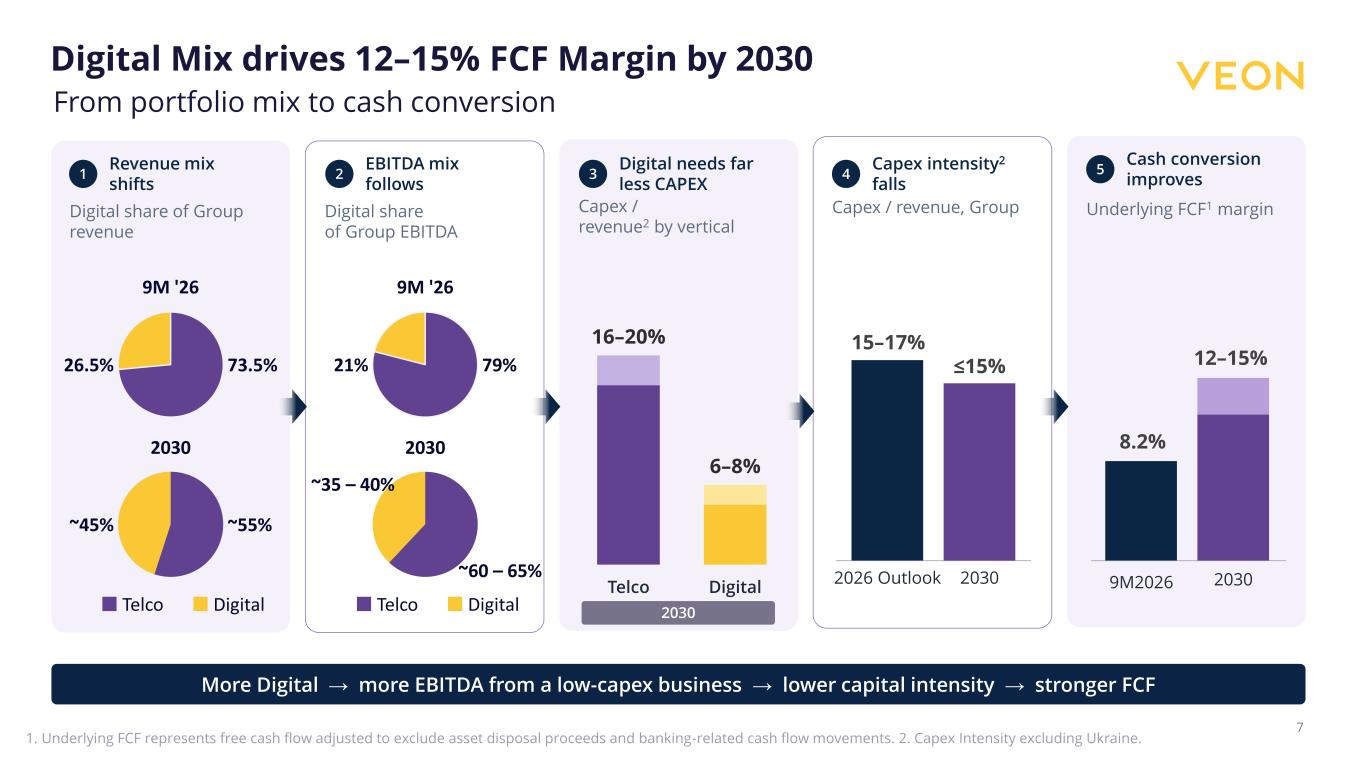
Digital Mix drives 12–15% FCF Margin by 2030 From portfolio mix to cash conversion 1 Revenue mix shifts Digital share of Group revenue Digital share of Group EBITDA Capex / revenue2 by vertical Capex / revenue, Group Underlying FCF1 margin Telco 16–20% Digital 6–8% 15–17% 2026 Outlook ≤15% 2030 8.2% 9M2026 12–15% 2030 2 EBITDA mix follows 3 Digital needs far less CAPEX 4 Capex intensity2 falls 5 Cash conversion improves More Digital → more EBITDA from a low-capex business → lower capital intensity → stronger FCF 1. Underlying FCF represents free cash flow adjusted to exclude asset disposal proceeds and banking-related cash flow movements. 2. Capex Intensity excluding Ukraine. 9M '26 2030 Telco Digital 9M '26 2030 Telco Digital 73.5%26.5% ~55%~45% 79%21% ~60 – 65% ~35 – 40% 2030 7
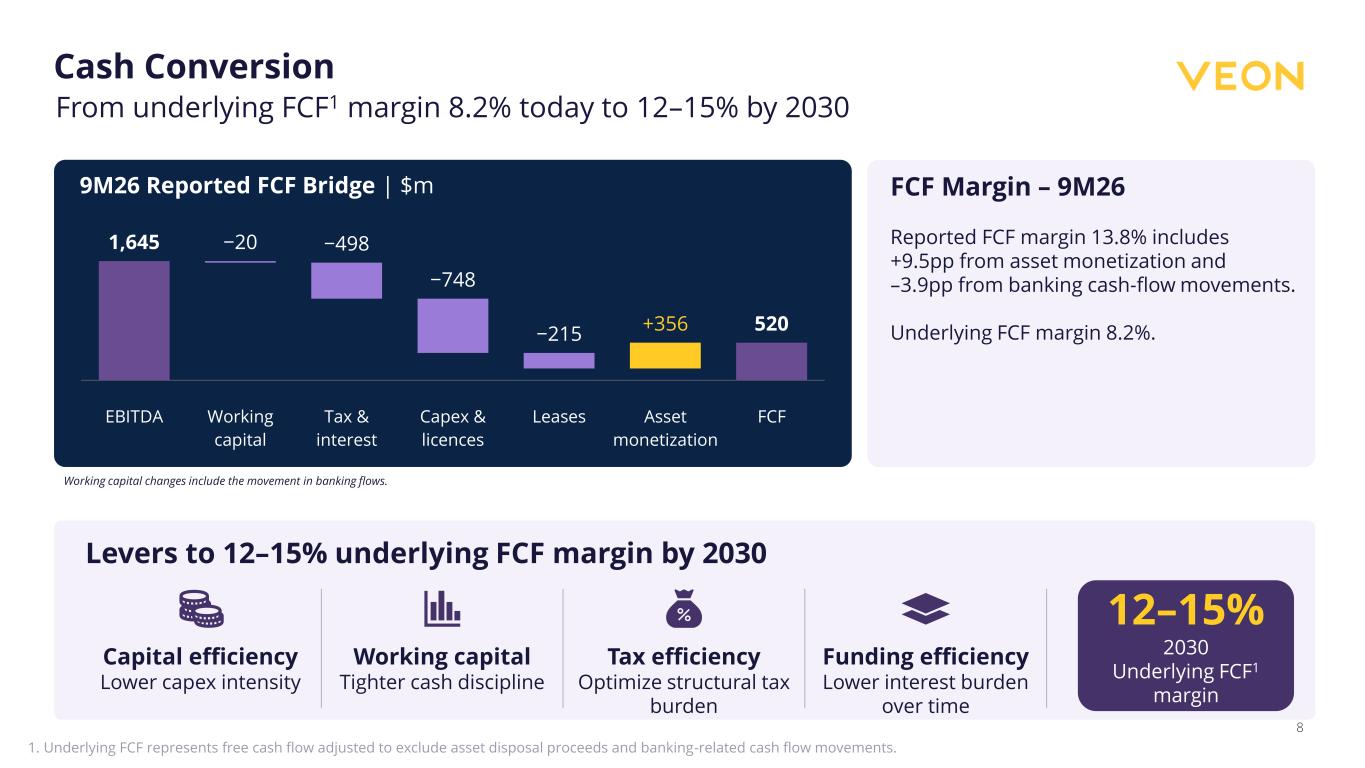
Cash Conversion From underlying FCF1 margin 8.2% today to 12–15% by 2030 9M26 Reported FCF Bridge | $m FCF Margin – 9M26 Reported FCF margin 13.8% includes +9.5pp from asset monetization and –3.9pp from banking cash-flow movements. Underlying FCF margin 8.2%. Levers to 12–15% underlying FCF margin by 2030 Capital efficiency Lower capex intensity Working capital Tighter cash discipline Tax efficiency Optimize structural tax burden Funding efficiency Lower interest burden over time 12–15% 2030 Underlying FCF1 margin 1,645 −20 −498 −748 −215 +356 520 EBITDA Working capital Tax & interest Capex & licences Leases Asset monetization FCF Working capital changes include the movement in banking flows. 1. Underlying FCF represents free cash flow adjusted to exclude asset disposal proceeds and banking-related cash flow movements. 8
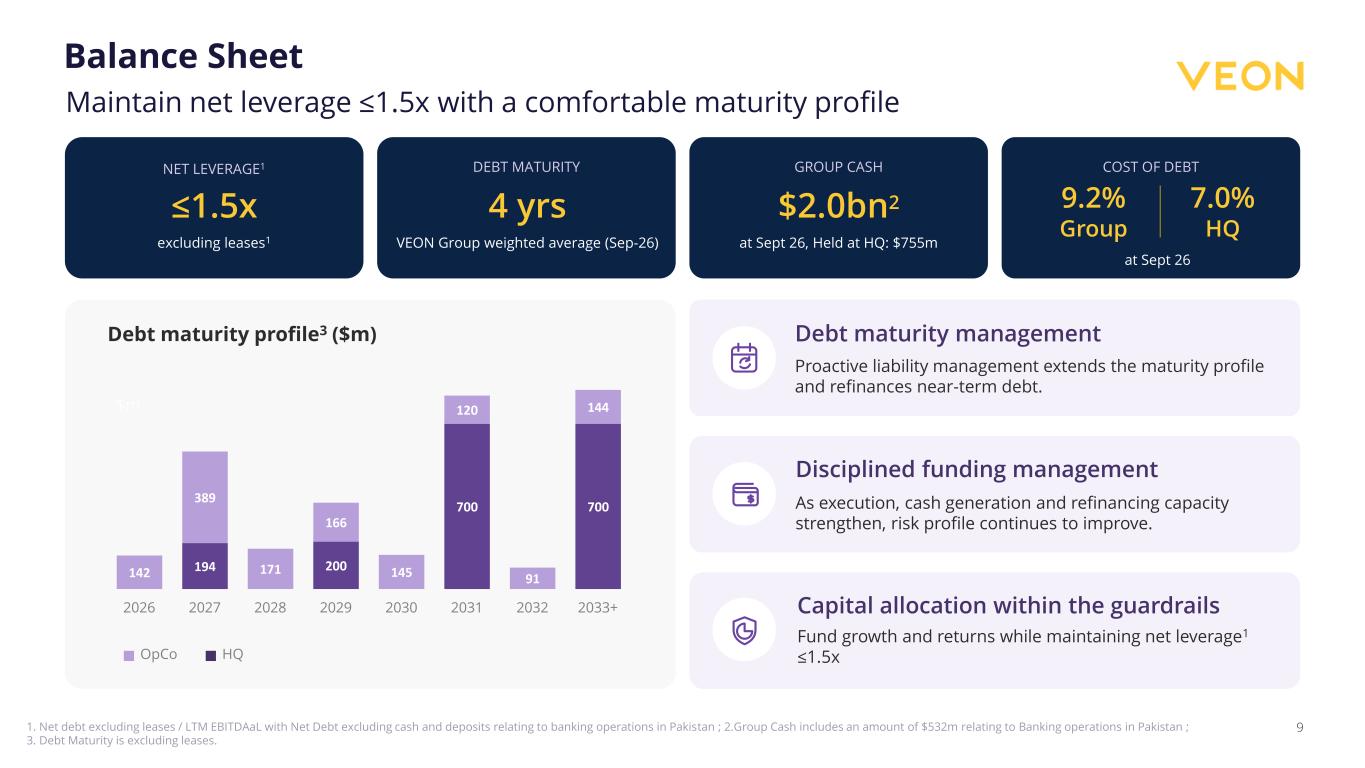
Balance Sheet Maintain net leverage ≤1.5x with a comfortable maturity profile NET LEVERAGE1 ≤1.5x excluding leases1 DEBT MATURITY 4 yrs VEON Group weighted average (Sep-26) GROUP CASH $2.0bn2 cash and equivalents at 3Q26 Debt maturity profile3 ($m) 142 2026 389 194 2027 171 2028 166 200 2029 145 2030 120 700 2031 91 2032 144 700 2033+ OpCo HQ Debt maturity management Proactive liability management extends the maturity profile and refinances near-term debt. Capital allocation within the guardrails Fund growth and returns while maintaining net leverage1 ≤1.5x $m 1. Net debt excluding leases / LTM EBITDAaL with Net Debt excluding cash and deposits relating to banking operations in Pakistan ; 2.Group Cash includes an amount of $532m relating to Banking operations in Pakistan ; 3. Debt Maturity is excluding leases. at Sept 26, Held at HQ: $755m COST OF DEBT 7.0% HQ at Sept 26 9.2% Group Disciplined funding management As execution, cash generation and refinancing capacity strengthen, risk profile continues to improve. 9
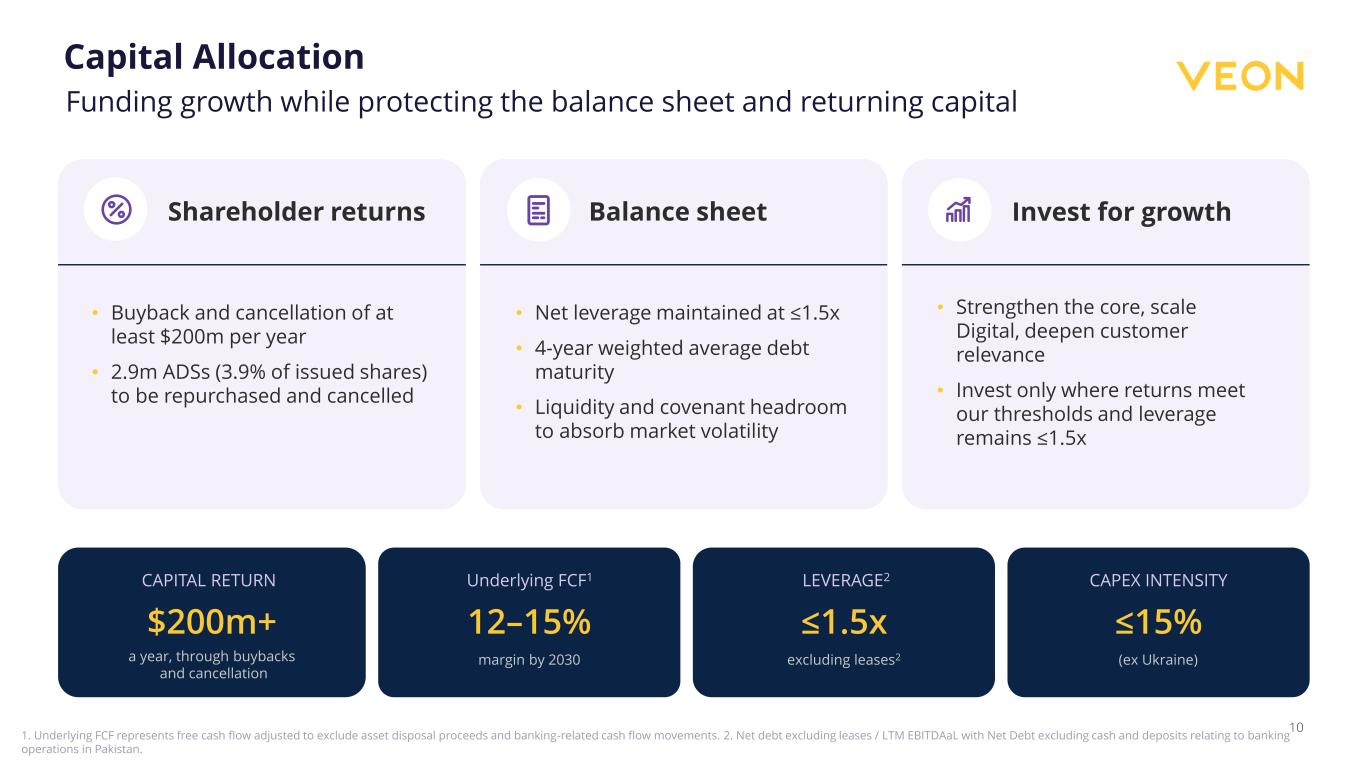
Capital Allocation Funding growth while protecting the balance sheet and returning capital Shareholder returns • Buyback and cancellation of at least $200m per year • 2.9m ADSs (3.9% of issued shares) to be repurchased and cancelled Balance sheet • Net leverage maintained at ≤1.5x • 4-year weighted average debt maturity • Liquidity and covenant headroom to absorb market volatility Invest for growth • Strengthen the core, scale Digital, deepen customer relevance • Invest only where returns meet our thresholds and leverage remains ≤1.5x CAPITAL RETURN $200m+ a year, through buybacks and cancellation Underlying FCF1 12–15% margin by 2030 LEVERAGE2 ≤1.5x excluding leases2 CAPEX INTENSITY ≤15% (ex Ukraine) 1. Underlying FCF represents free cash flow adjusted to exclude asset disposal proceeds and banking-related cash flow movements. 2. Net debt excluding leases / LTM EBITDAaL with Net Debt excluding cash and deposits relating to banking operations in Pakistan. 10
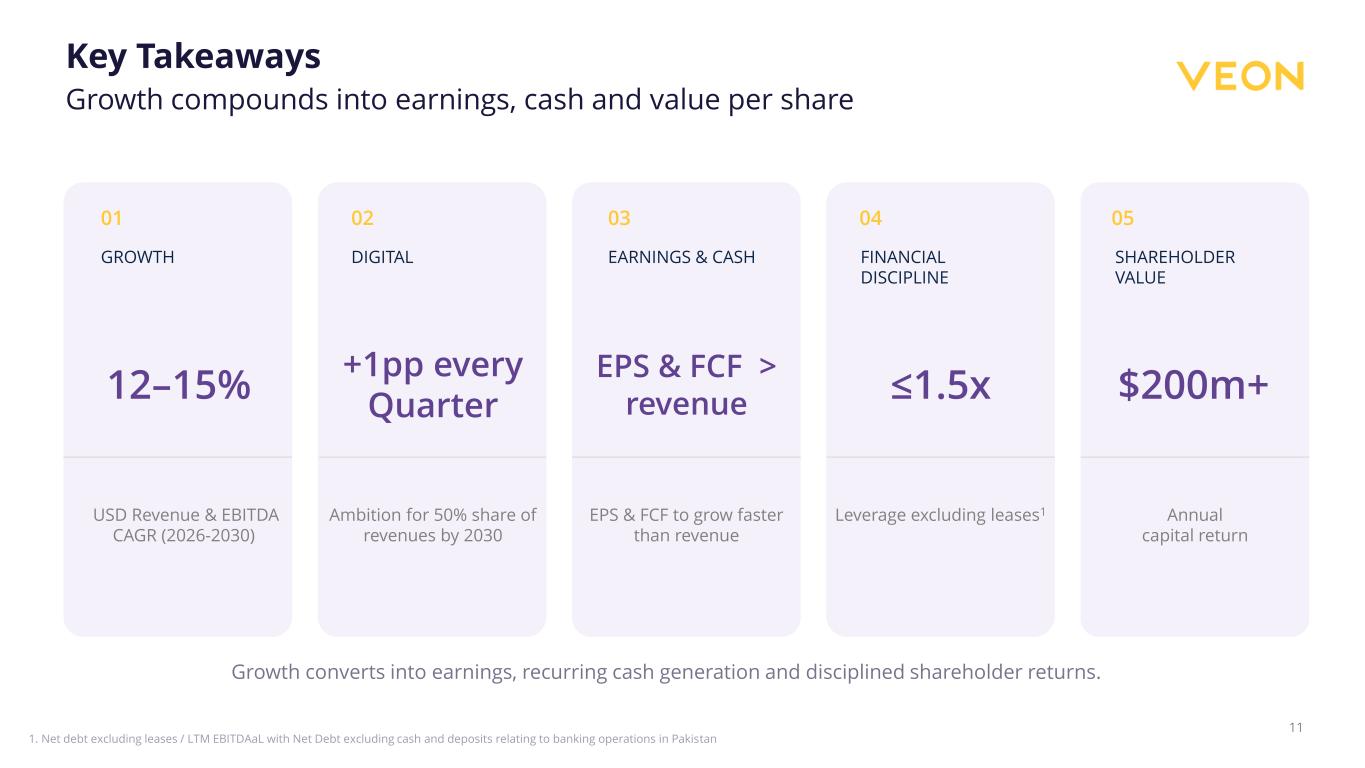
Key Takeaways Growth compounds into earnings, cash and value per share 01 GROWTH 12–15% USD Revenue & EBITDA CAGR (2026-2030) 02 DIGITAL +1pp every Quarter Ambition for 50% share of revenues by 2030 03 EARNINGS & CASH EPS & FCF > revenue EPS & FCF to grow faster than revenue 04 FINANCIAL DISCIPLINE ≤1.5x Leverage excluding leases1 05 SHAREHOLDER VALUE $200m+ Annual capital return Growth converts into earnings, recurring cash generation and disciplined shareholder returns. 1. Net debt excluding leases / LTM EBITDAaL with Net Debt excluding cash and deposits relating to banking operations in Pakistan 11