NN, Inc. Craig-Hallum Investor Conference November 16, 2026
2 Forward Looking Statements This presentation may contain forward-looking statements regarding our business, operations, and financial performance. Such statements are based on current expectations and assumptions that are subject to a number of risks and uncertainties. Actual results could differ materially. Please refer to our most recently filed Form 10-K and our Form 10-Q for the period following that Form 10-K, including the risk factors described therein. We undertake no obligation to update any forward-looking statement, except as required by law. Given these risks and uncertainties, investors are cautioned not to place undue reliance on such forward-looking statements. We present both GAAP and non-GAAP financial measures in this presentation. A reconciliation of non-GAAP to GAAP measures is included in this presentation and in the most recent earnings press release, which is distributed and available to the public through our Investor Relations website located at investors.nninc.com/news-events/presentations.
3 What’s New Since Q3 2026 Results Announcement? • October - results were better than expectations, business is continuing to outperform, especially in Data Center and Defense ➢ Sales, margins, new wins, production – all solid • November - US mid-term election results & NVIDIA issues have had no immediate impact on NN, monitoring for longer-term impacts ➢ Data Center, NVIDIA, Jensen Huang – the industry is so backed up globally, we are seeing only continued increased demand at a high rate, machine leadtimes continue to extend, NN is over-sold also ➢ Defense – no changes in NN program areas- missile defense, drone defense, firearms ➢ Vehicle MPG and emissions – if Democrats push to implement previous EPA and EU standards, it is good for NN ➢ Medical – if Democrats cause increased spend in this area, it is good for NN ➢ Tariff repatriation programs and optimization programs still continuing, steel is still hard to get in the US • Q4 - footprint activities on-track to enable 2027 and longer-term goals ➢ Adding capacity for data center in China ➢ Adding capacity for munitions and data center in US ➢ Replacing high-cost capacity for low-profit auto parts in US
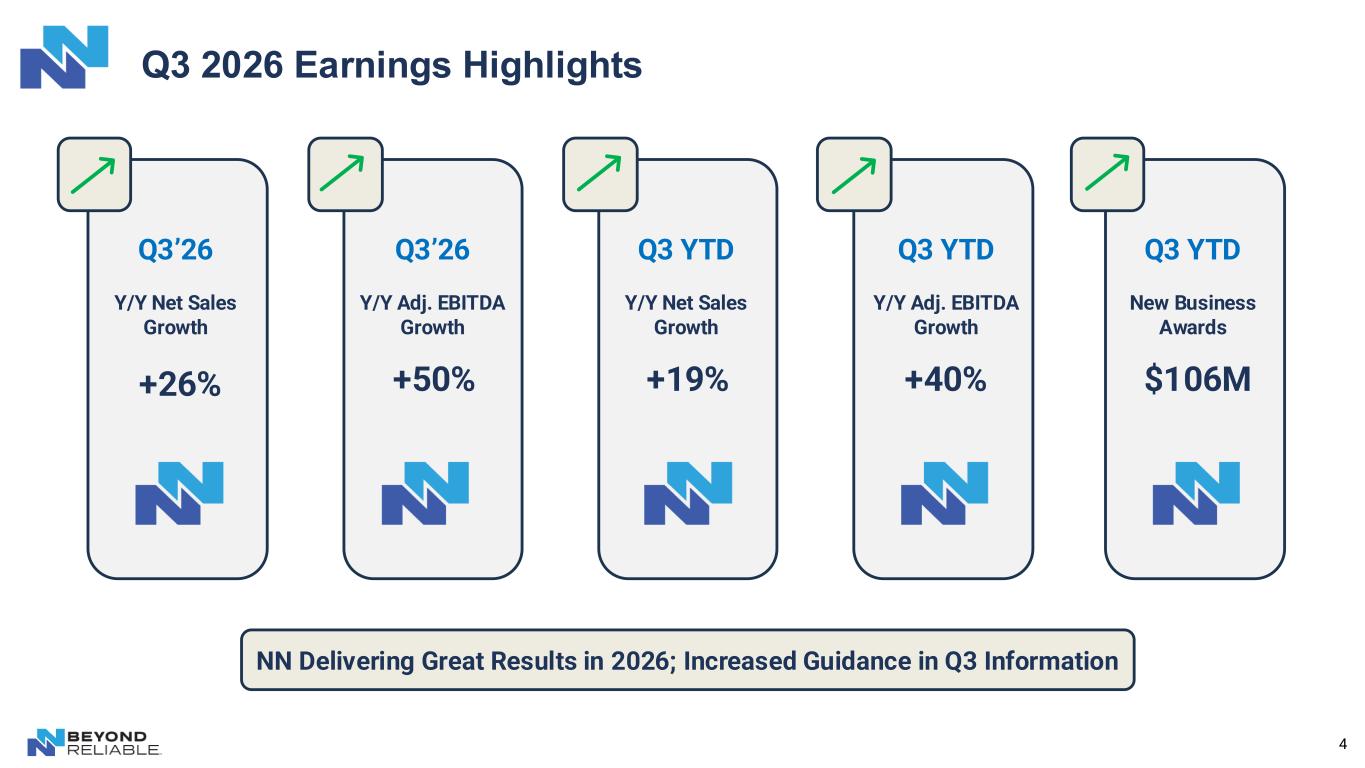
4 Q3 2026 Earnings Highlights +26% +19%+50% +40% $106M Q3’26 Y/Y Net Sales Growth Q3 YTD Y/Y Net Sales Growth Q3’26 Y/Y Adj. EBITDA Growth Q3 YTD Y/Y Adj. EBITDA Growth Q3 YTD New Business Awards NN Delivering Great Results in 2026; Increased Guidance in Q3 Information
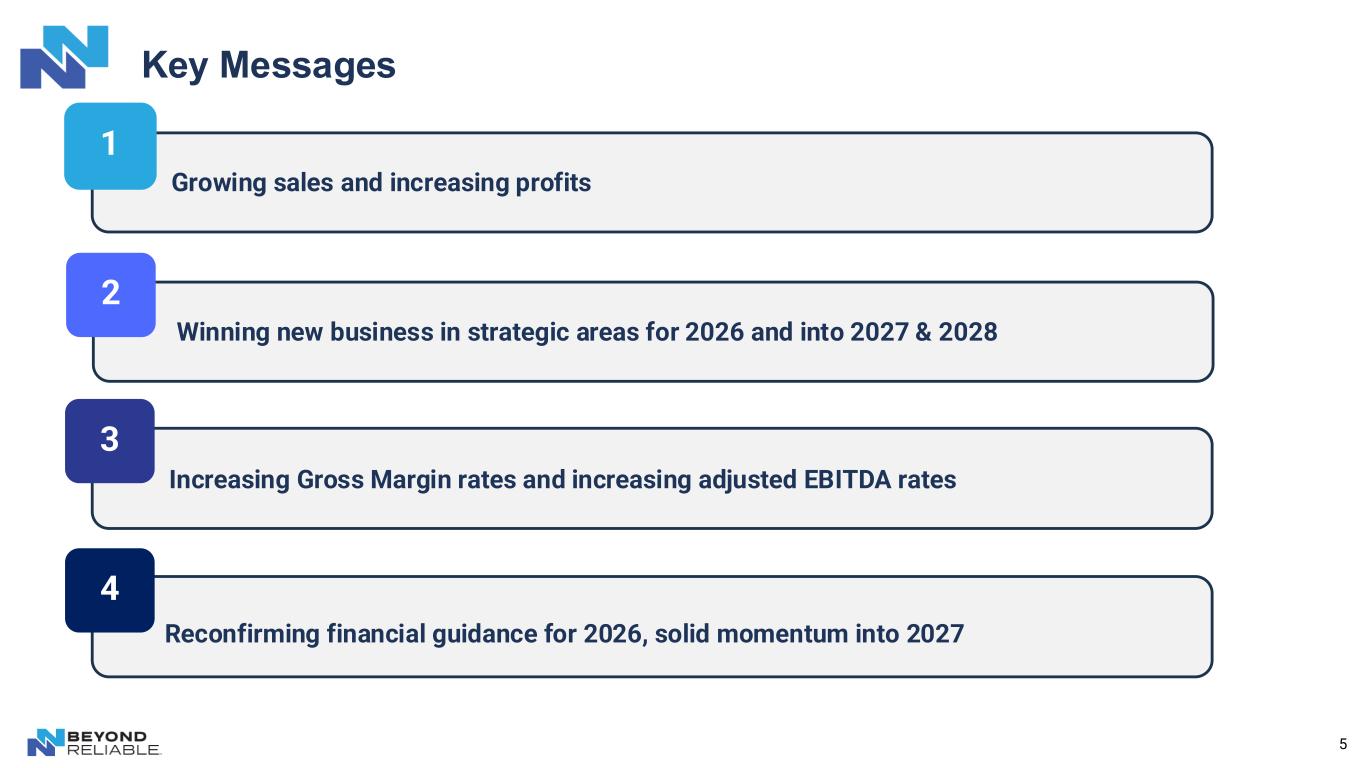
5 Key Messages 1 2 3 Growing sales and increasing profits Winning new business in strategic areas for 2026 and into 2027 & 2028 4 Increasing Gross Margin rates and increasing adjusted EBITDA rates Reconfirming financial guidance for 2026, solid momentum into 2027
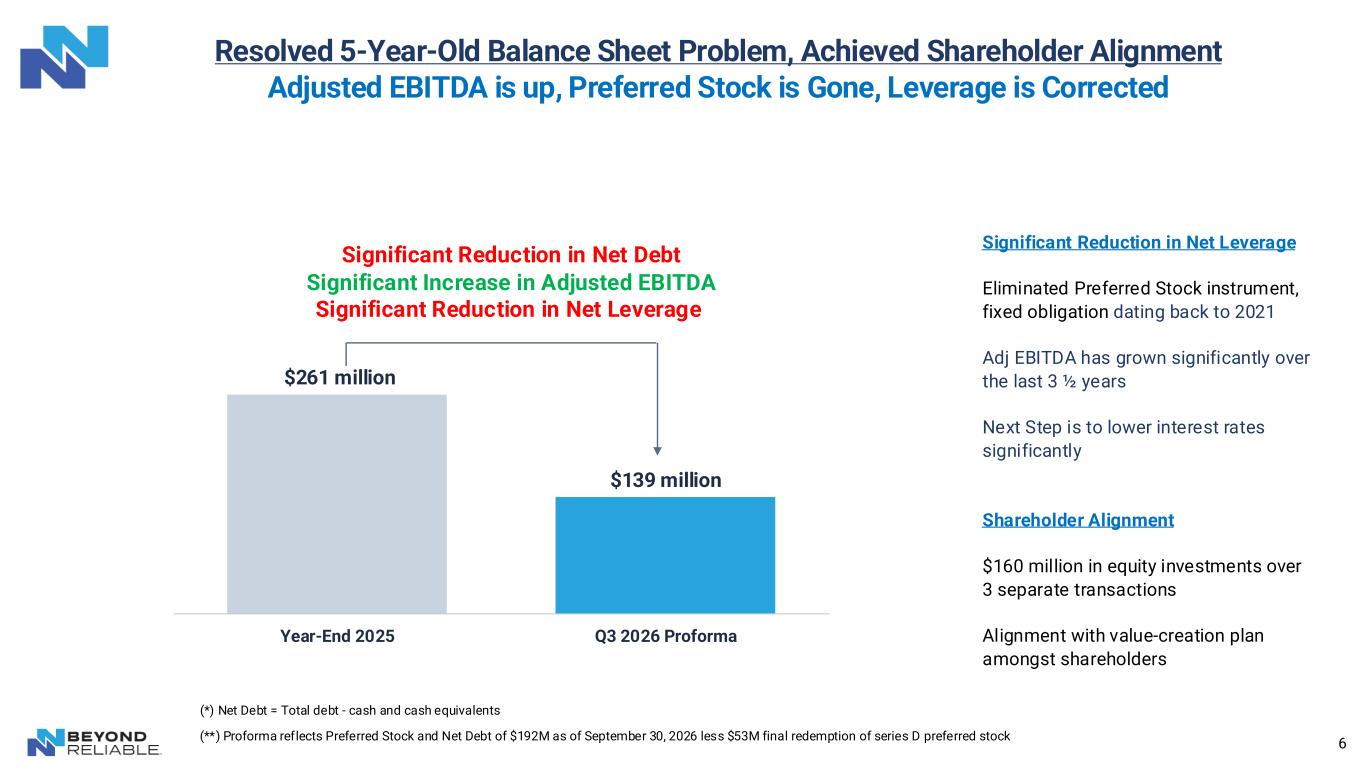
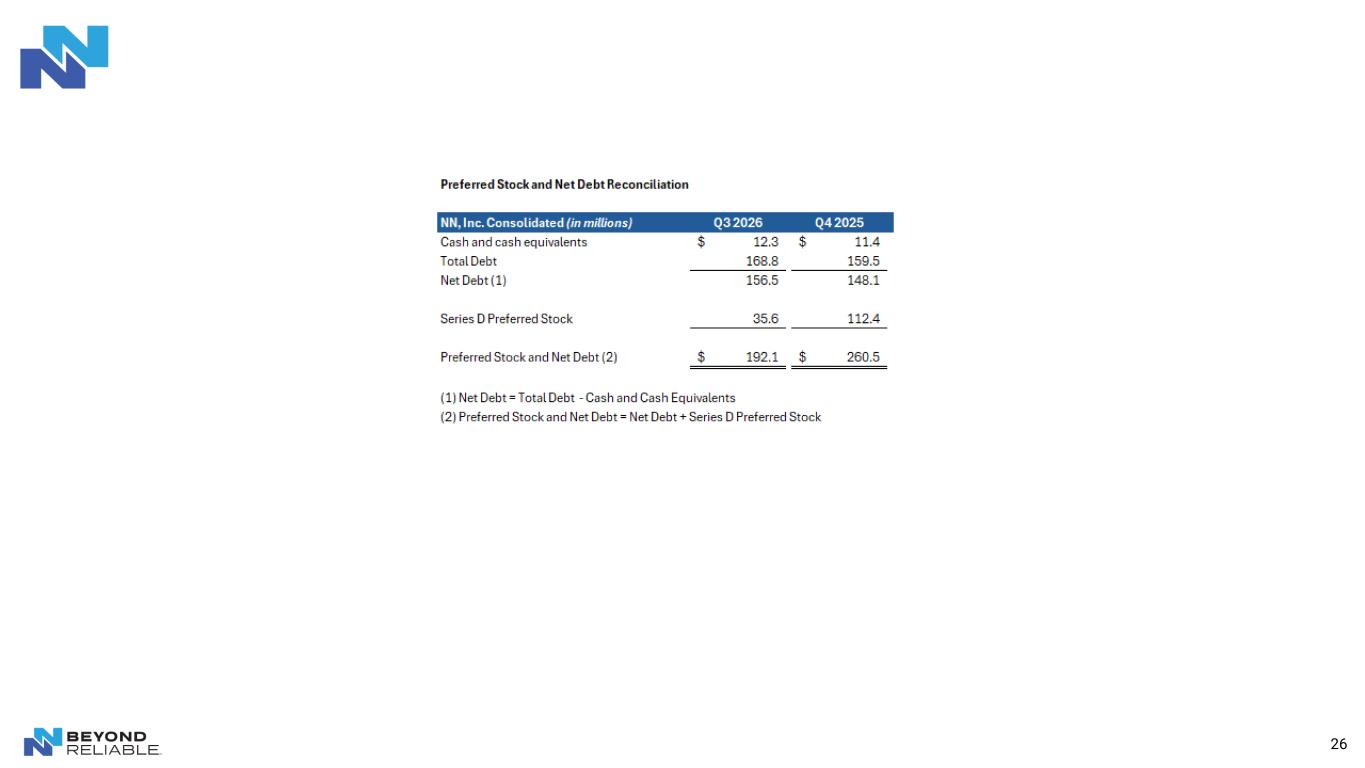
6 Resolved 5-Year-Old Balance Sheet Problem, Achieved Shareholder Alignment Adjusted EBITDA is up, Preferred Stock is Gone, Leverage is Corrected Significant Reduction in Net Leverage Eliminated Preferred Stock instrument, fixed obligation dating back to 2021 Adj EBITDA has grown significantly over the last 3 ½ years Next Step is to lower interest rates significantly Shareholder Alignment $160 million in equity investments over 3 separate transactions Alignment with value-creation plan amongst shareholders (*) Net Debt = Total debt - cash and cash equivalents (**) Proforma reflects Preferred Stock and Net Debt of $192M as of September 30, 2026 less $53M final redemption of series D preferred stock $261 million $139 million Year-End 2025 Q3 2026 Proforma Significant Reduction in Net Debt Significant Increase in Adjusted EBITDA Significant Reduction in Net Leverage
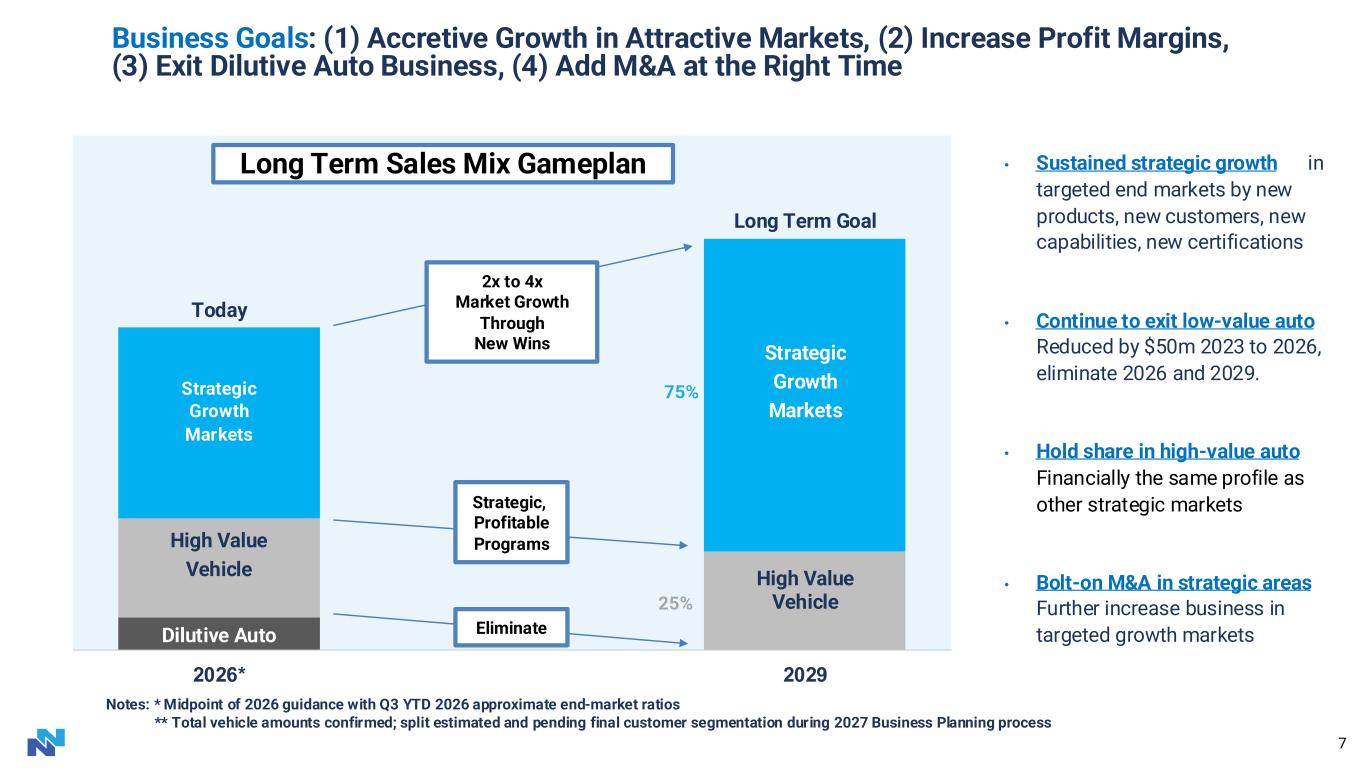
7 • Sustained strategic growth in targeted end markets by new products, new customers, new capabilities, new certifications • Continue to exit low-value auto Reduced by $50m 2023 to 2026, eliminate 2026 and 2029. • Hold share in high-value auto Financially the same profile as other strategic markets • Bolt-on M&A in strategic areas Further increase business in targeted growth marketsDilutive Auto High Value Vehicle High Value Vehicle Strategic Growth Markets Strategic Growth Markets Today Long Term Goal 2026* 2029 Long Term Sales Mix Gameplan Strategic, Profitable Programs Eliminate 2x to 4x Market Growth Through New Wins Notes: * Midpoint of 2026 guidance with Q3 YTD 2026 approximate end-market ratios ** Total vehicle amounts confirmed; split estimated and pending final customer segmentation during 2027 Business Planning process 75% 25% Business Goals: (1) Accretive Growth in Attractive Markets, (2) Increase Profit Margins, (3) Exit Dilutive Auto Business, (4) Add M&A at the Right Time
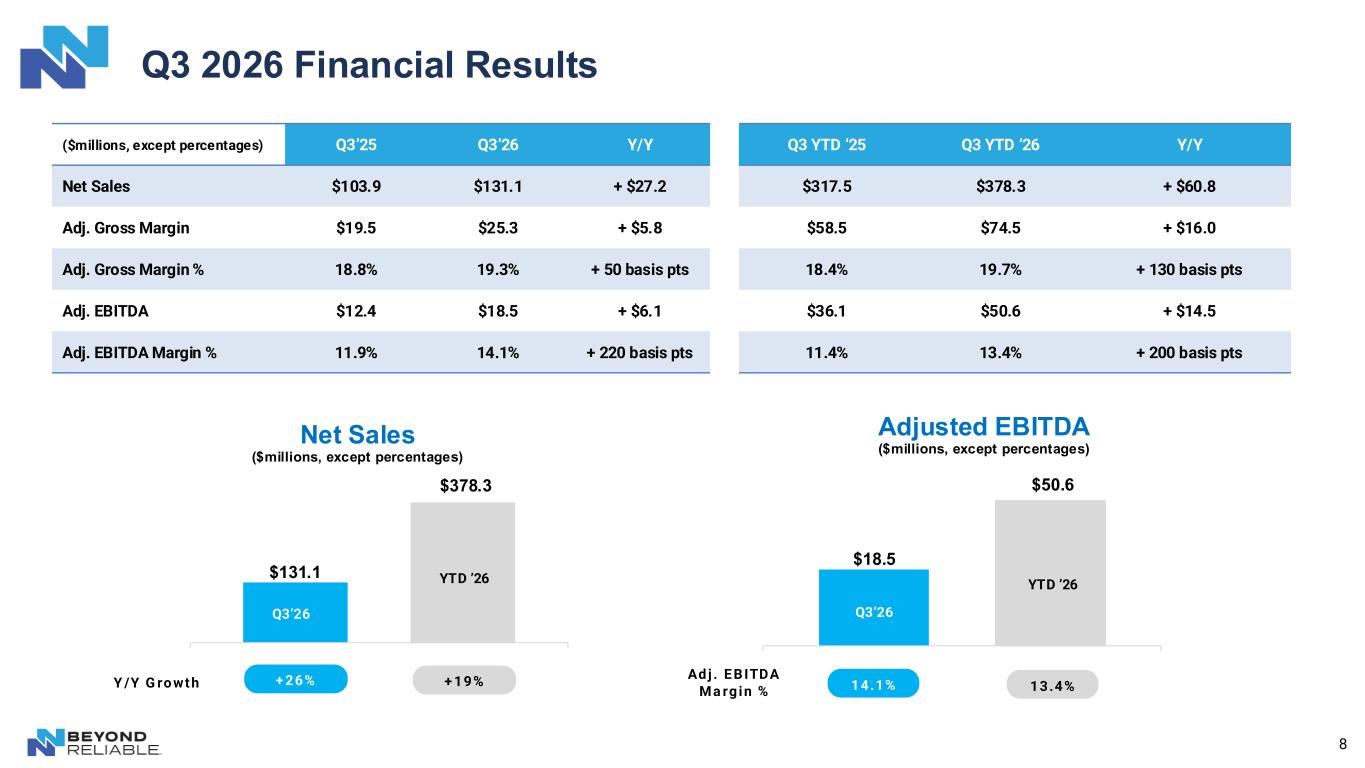
8 Q3 2026 Financial Results $18.5 $50.6 Adjusted EBITDA ($millions, except percentages) $131.1 $378.3 Net Sales ($millions, except percentages) ($millions, except percentages) Q3’25 Q3’26 Y/Y Q3 YTD ‘25 Q3 YTD ‘26 Y/Y Net Sales $103.9 $131.1 + $27.2 $317.5 $378.3 + $60.8 Adj. Gross Margin $19.5 $25.3 + $5.8 $58.5 $74.5 + $16.0 Adj. Gross Margin % 18.8% 19.3% + 50 basis pts 18.4% 19.7% + 130 basis pts Adj. EBITDA $12.4 $18.5 + $6.1 $36.1 $50.6 + $14.5 Adj. EBITDA Margin % 11.9% 14.1% + 220 basis pts 11.4% 13.4% + 200 basis pts + 26% + 19% 14.1% 13.4%Y /Y G ro wth Ad j . E B ITDA Ma rgin % Q3’26 Q3’26 YTD ’26 YTD ’26
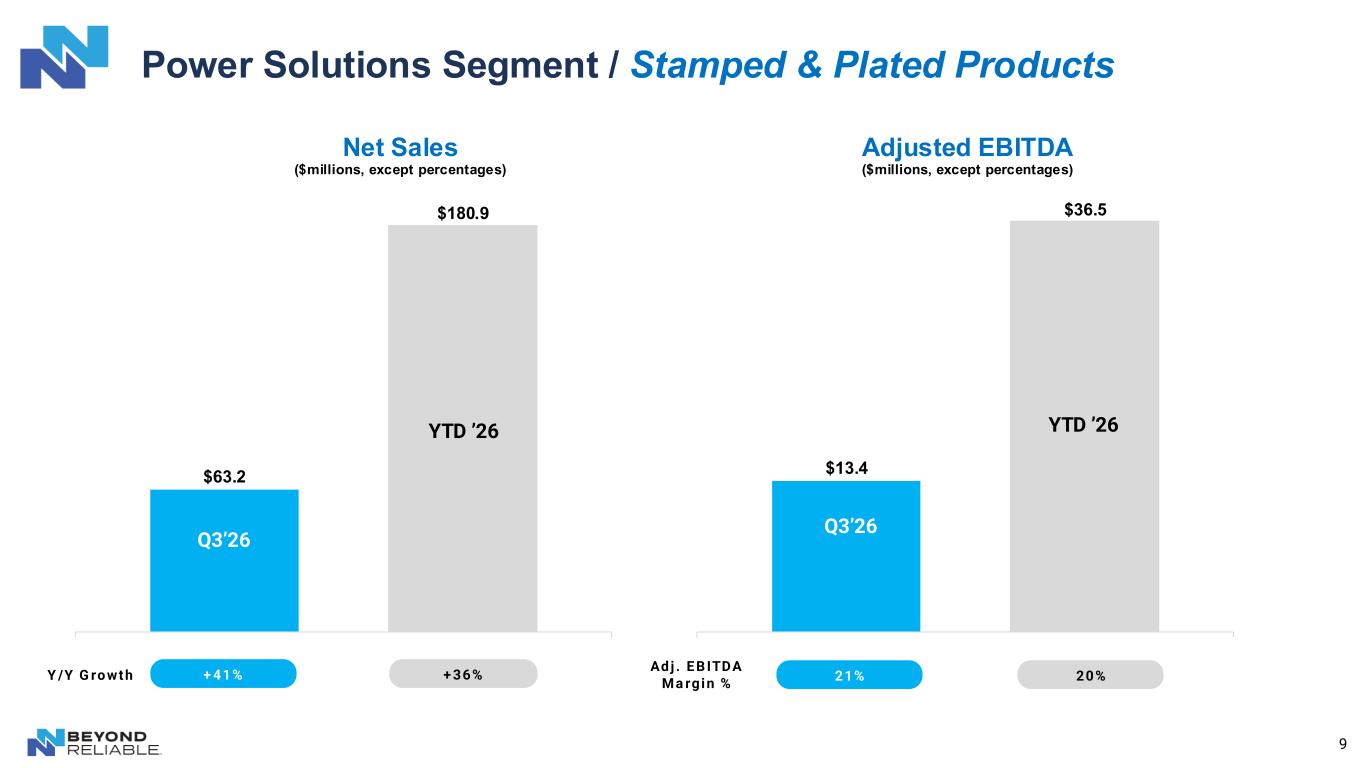
9 Power Solutions Segment / Stamped & Plated Products $63.2 $180.9 Net Sales ($millions, except percentages) + 41% + 36%Y /Y G ro wth $13.4 $36.5 Adjusted EBITDA ($millions, except percentages) Ad j . E B ITDA Ma rgin % 21% 20% Q3’26 Q3’26 YTD ’26 YTD ’26
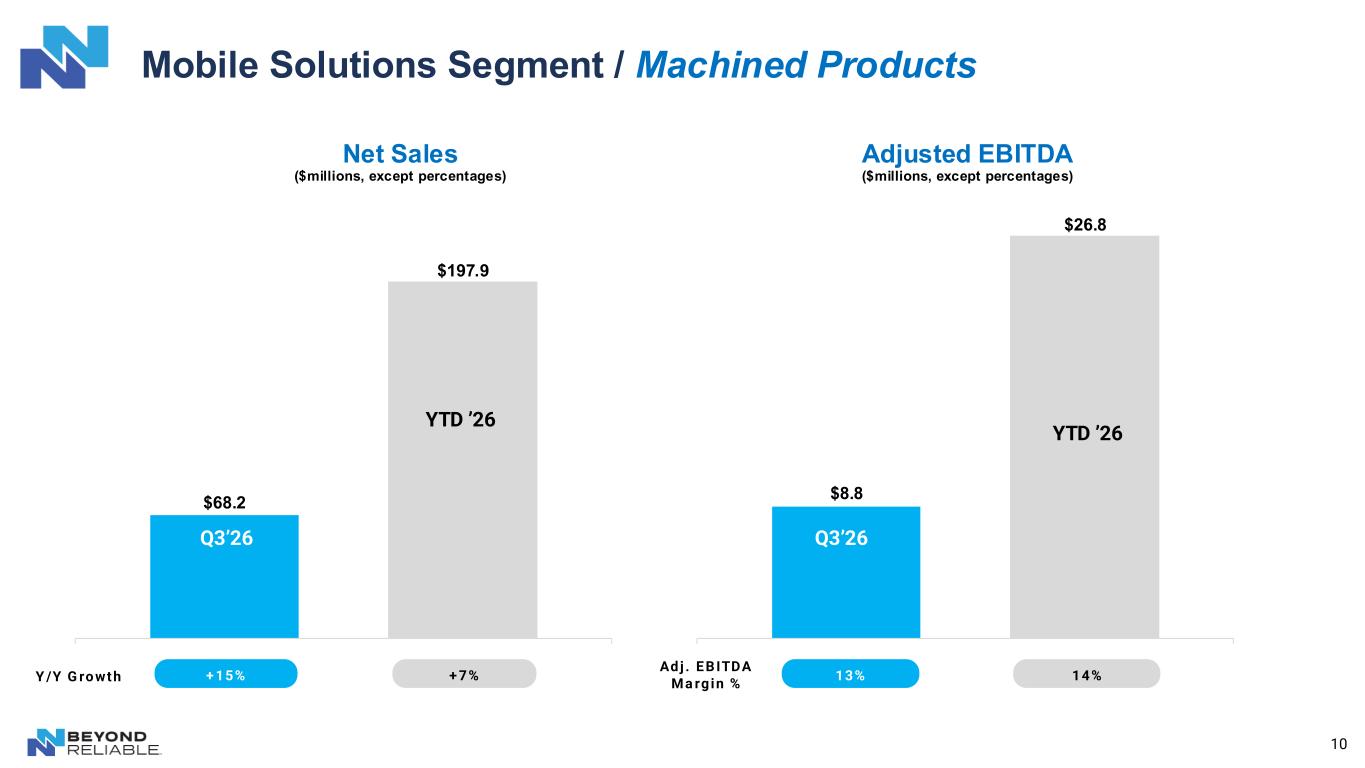
10 Mobile Solutions Segment / Machined Products $68.2 $197.9 Net Sales ($millions, except percentages) + 15% + 7%Y /Y G ro wth $8.8 $26.8 Adjusted EBITDA ($millions, except percentages) Ad j . E B ITDA Ma rg in % 13% 14% Q3’26 Q3’26 YTD ’26 YTD ’26
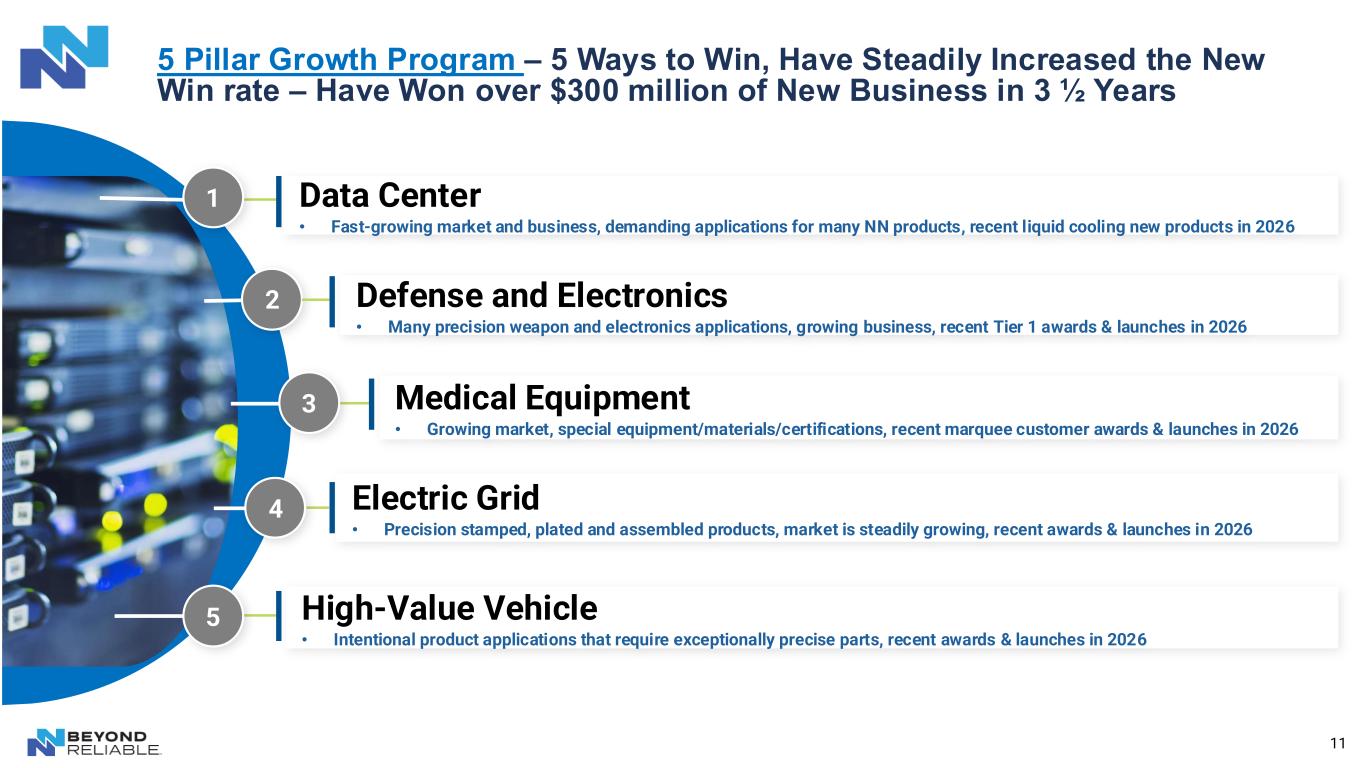
11 5 Pillar Growth Program – 5 Ways to Win, Have Steadily Increased the New Win rate – Have Won over $300 million of New Business in 3 ½ Years High-Value Vehicle • Intentional product applications that require exceptionally precise parts, recent awards & launches in 2026 Electric Grid • Precision stamped, plated and assembled products, market is steadily growing, recent awards & launches in 2026 2 Medical Equipment • Growing market, special equipment/materials/certifications, recent marquee customer awards & launches in 2026 3 Defense and Electronics • Many precision weapon and electronics applications, growing business, recent Tier 1 awards & launches in 2026 4 5 1 Data Center • Fast-growing market and business, demanding applications for many NN products, recent liquid cooling new products in 2026
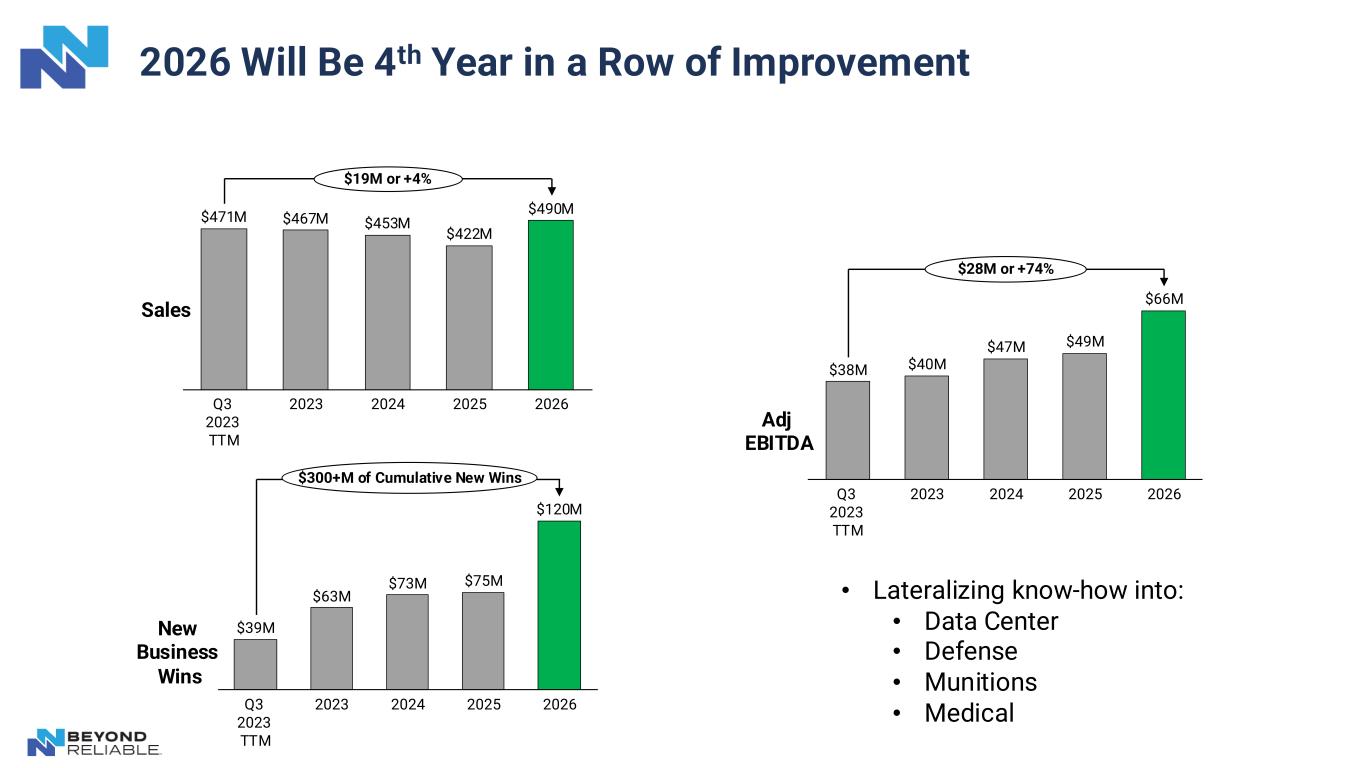
2026 Will Be 4th Year in a Row of Improvement $38M $40M $47M $49M $66M Q3 2023 TTM 2023 2024 2025 2026 Adj EBITDA $28M or +74% $471M $467M $453M $422M $490M Q3 2023 TTM 2023 2024 2025 2026 Sales $19M or +4% $39M $63M $73M $75M $120M Q3 2023 TTM 2023 2024 2025 2026 New Business Wins $300+M of Cumulative New Wins • Lateralizing know-how into: • Data Center • Defense • Munitions • Medical
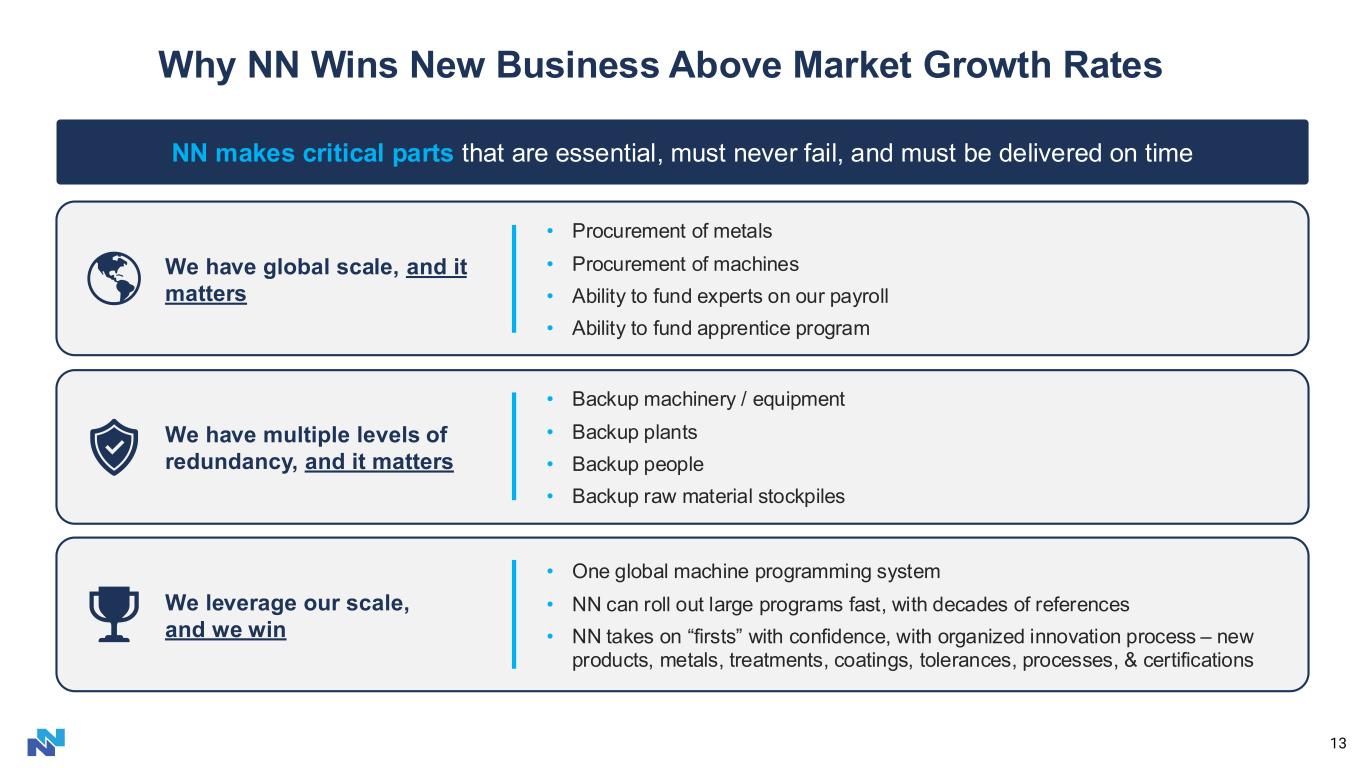
13 NN makes critical parts that are essential, must never fail, and must be delivered on time We have global scale, and it matters • Procurement of metals • Procurement of machines • Ability to fund experts on our payroll • Ability to fund apprentice program We have multiple levels of redundancy, and it matters • Backup machinery / equipment • Backup plants • Backup people • Backup raw material stockpiles We leverage our scale, and we win • One global machine programming system • NN can roll out large programs fast, with decades of references • NN takes on “firsts” with confidence, with organized innovation process – new products, metals, treatments, coatings, tolerances, processes, & certifications Why NN Wins New Business Above Market Growth Rates
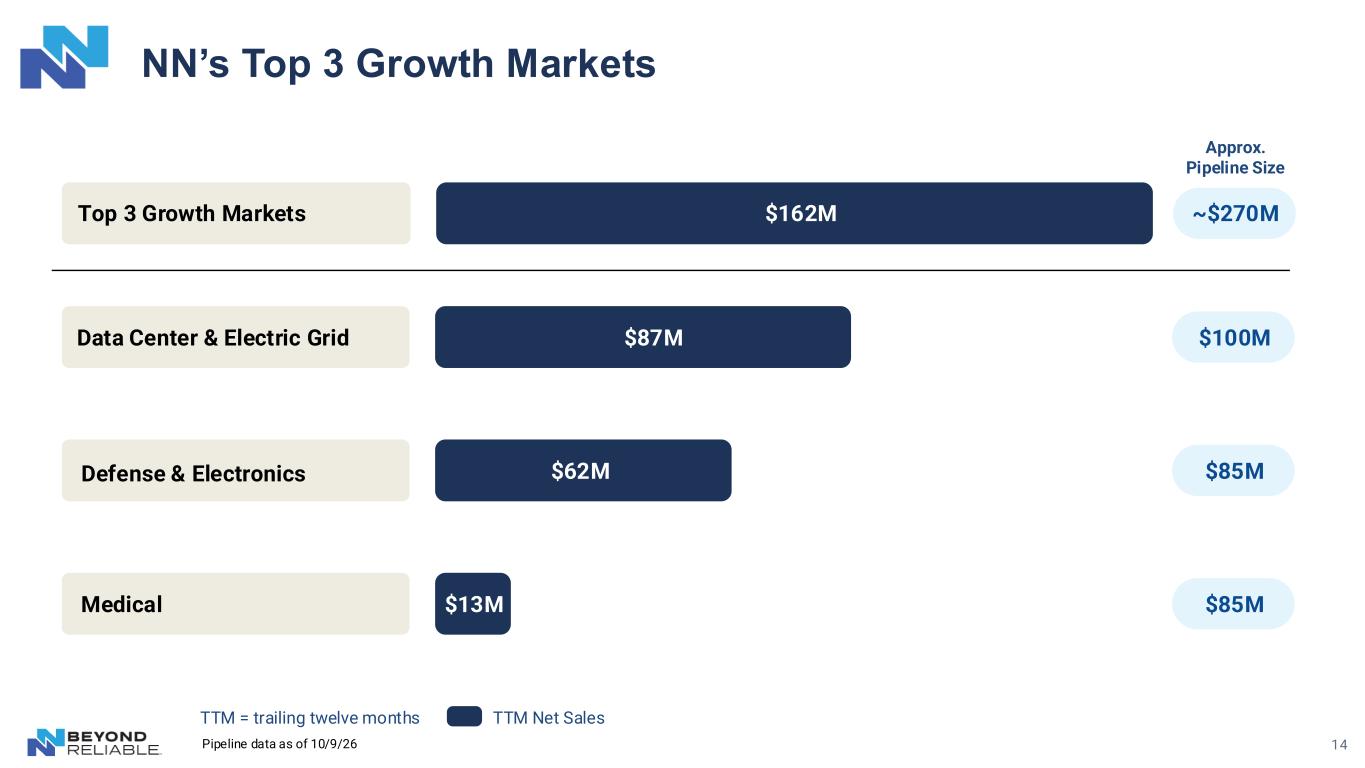
NN’s Top 3 Growth Markets TTM Net Sales Data Center & Electric Grid $87M Defense & Electronics $62M Medical $13M $100M $85M $85M Combined: $162M TTM Net Sales TTM = trailing twelve months 14 Top 3 Growth Markets $162M Approx. Pipeline Size ~$270M Pipeline data as of 10/9/26
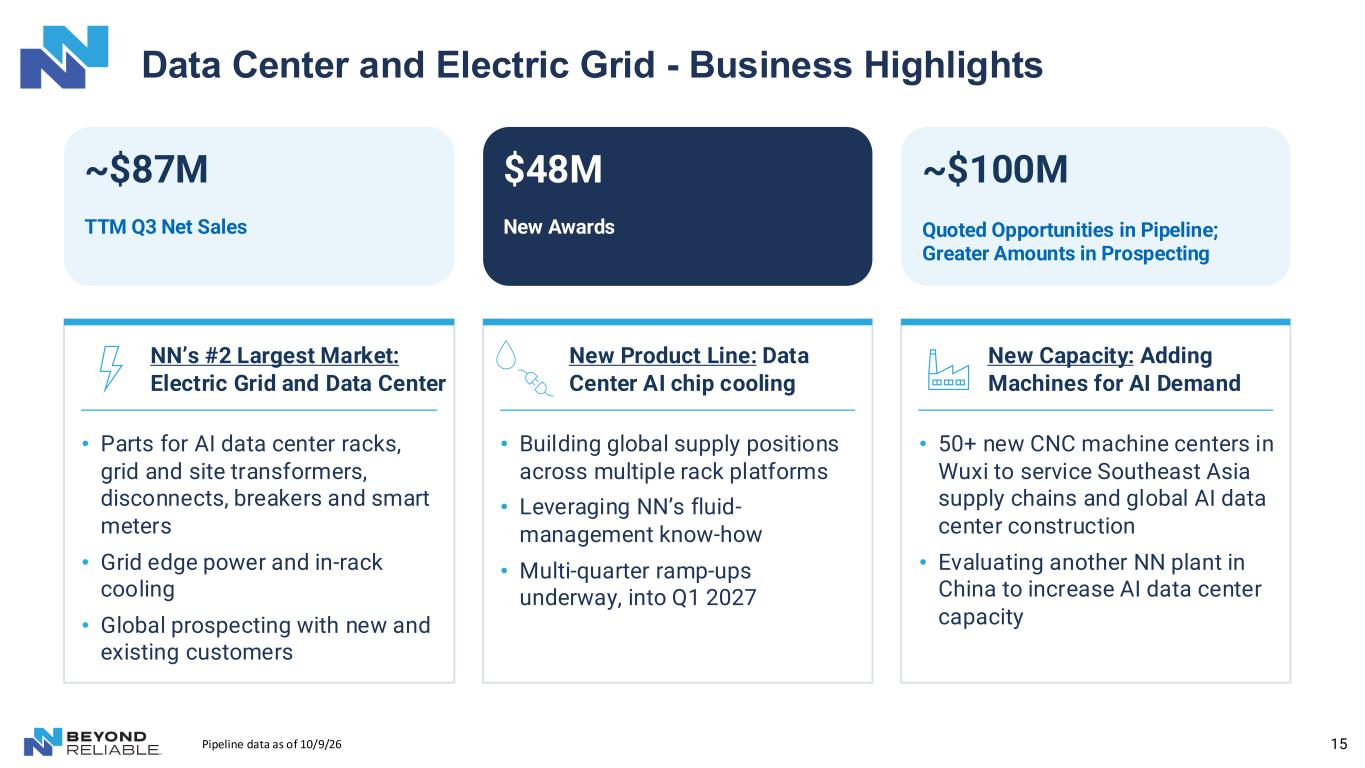
15 Data Center and Electric Grid - Business Highlights ~$87M TTM Q3 Net Sales NN’s #2 Largest Market: Electric Grid and Data Center $48M New Awards New Product Line: Data Center AI chip cooling ~$100M Quoted Opportunities in Pipeline; Greater Amounts in Prospecting New Capacity: Adding Machines for AI Demand • Parts for AI data center racks, grid and site transformers, disconnects, breakers and smart meters • Grid edge power and in-rack cooling • Global prospecting with new and existing customers • Building global supply positions across multiple rack platforms • Leveraging NN’s fluid- management know-how • Multi-quarter ramp-ups underway, into Q1 2027 • 50+ new CNC machine centers in Wuxi to service Southeast Asia supply chains and global AI data center construction • Evaluating another NN plant in China to increase AI data center capacity Pipeline data as of 10/9/26
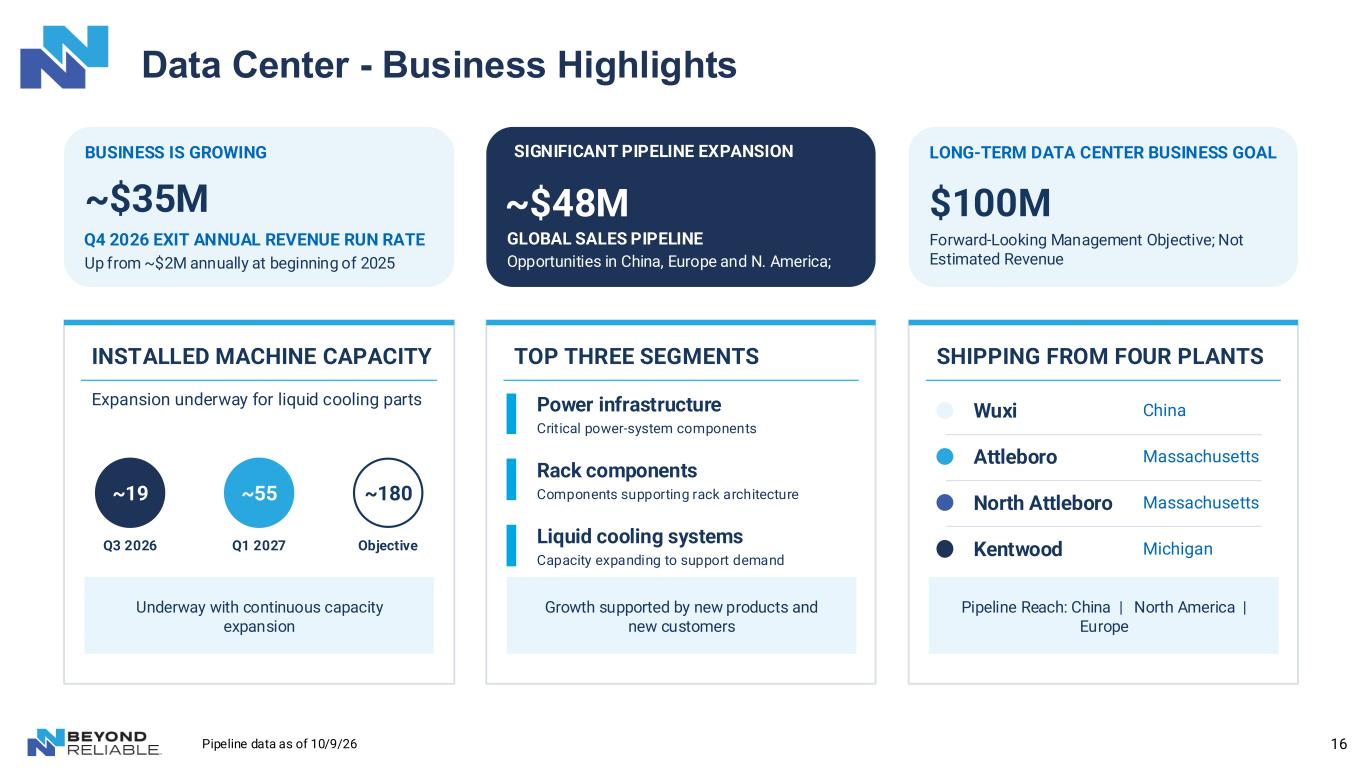
16 Data Center - Business Highlights ~$35M Q4 2026 EXIT ANNUAL REVENUE RUN RATE Up from ~$2M annually at beginning of 2025 INSTALLED MACHINE CAPACITY Expansion underway for liquid cooling parts Underway with continuous capacity expansion ~180 Objective ~19 Q3 2026 ~55 Q1 2027 ~$48M GLOBAL SALES PIPELINE Opportunities in China, Europe and N. America; TOP THREE SEGMENTS Growth supported by new products and new customers Power infrastructure Critical power-system components Rack components Components supporting rack architecture Liquid cooling systems Capacity expanding to support demand $100M LONG-TERM DATA CENTER BUSINESS GOAL Forward-Looking Management Objective; Not Estimated Revenue SHIPPING FROM FOUR PLANTS Pipeline Reach: China | North America | Europe Wuxi China Attleboro Massachusetts North Attleboro Massachusetts Kentwood Michigan BUSINESS IS GROWING SIGNIFICANT PIPELINE EXPANSION Pipeline data as of 10/9/26
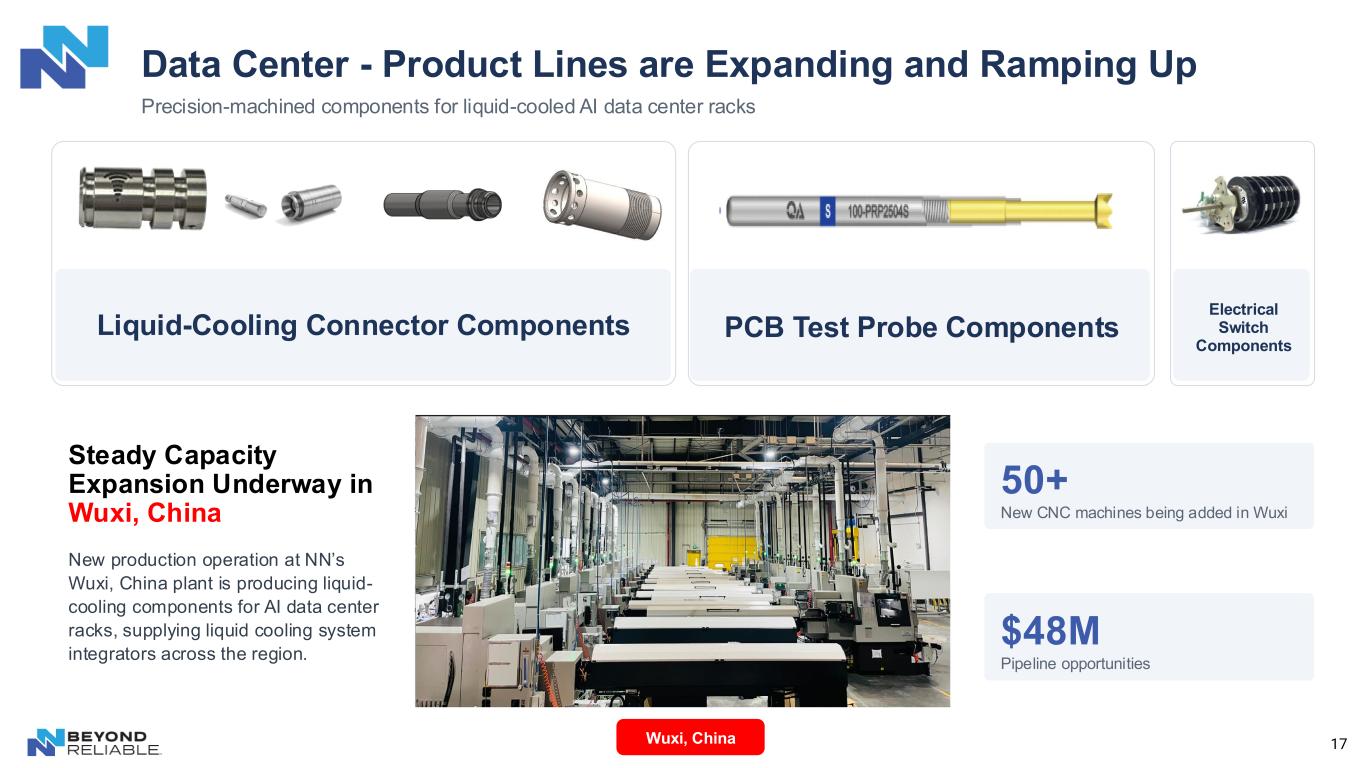
17 Data Center - Product Lines are Expanding and Ramping Up Precision-machined components for liquid-cooled AI data center racks Liquid-Cooling Connector Components Electrical Switch Components Wuxi, China Steady Capacity Expansion Underway in Wuxi, China New production operation at NN’s Wuxi, China plant is producing liquid- cooling components for AI data center racks, supplying liquid cooling system integrators across the region. 50+ New CNC machines being added in Wuxi $48M Pipeline opportunities PCB Test Probe Components
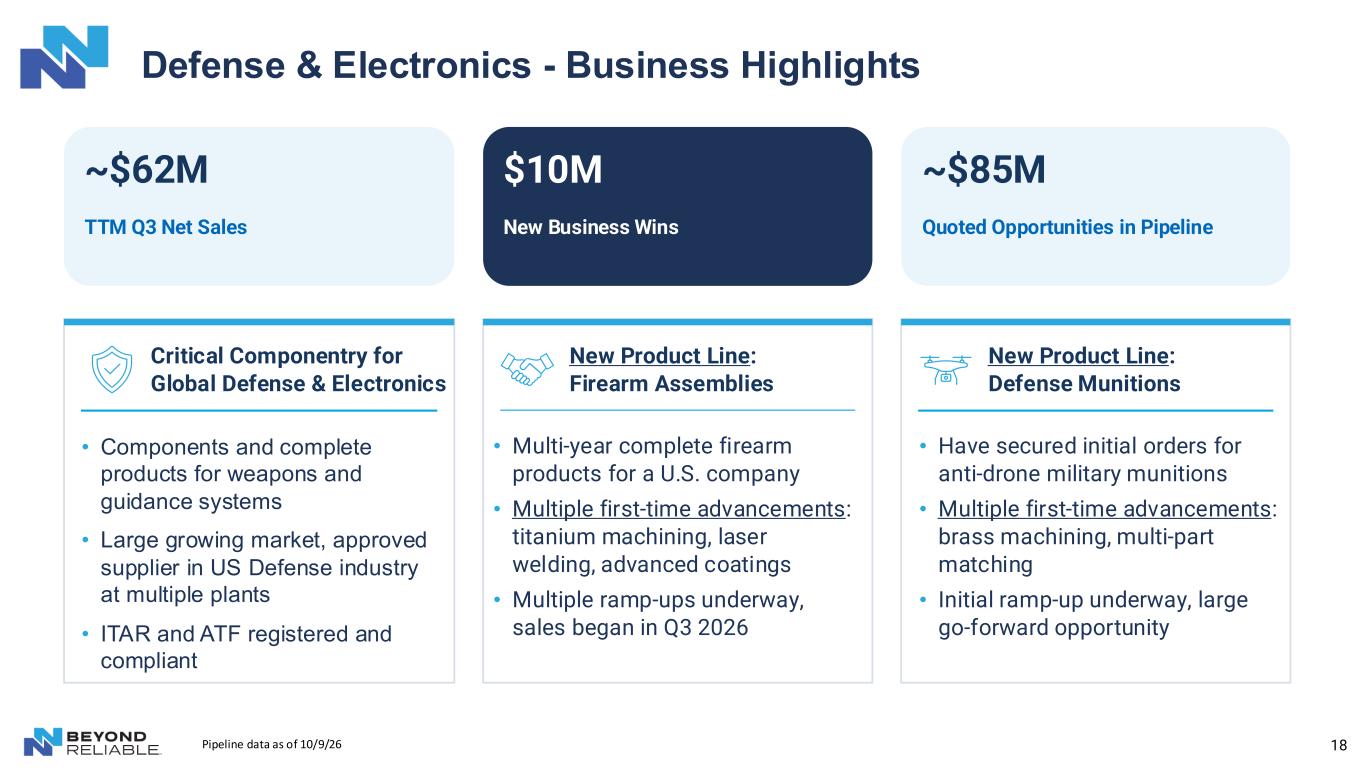
18 $10M New Business Wins New Product Line: Firearm Assemblies Defense & Electronics - Business Highlights ~$62M TTM Q3 Net Sales Critical Componentry for Global Defense & Electronics ~$85M Quoted Opportunities in Pipeline New Product Line: Defense Munitions • Components and complete products for weapons and guidance systems • Large growing market, approved supplier in US Defense industry at multiple plants • ITAR and ATF registered and compliant • Multi-year complete firearm products for a U.S. company • Multiple first-time advancements: titanium machining, laser welding, advanced coatings • Multiple ramp-ups underway, sales began in Q3 2026 • Have secured initial orders for anti-drone military munitions • Multiple first-time advancements: brass machining, multi-part matching • Initial ramp-up underway, large go-forward opportunity Pipeline data as of 10/9/26
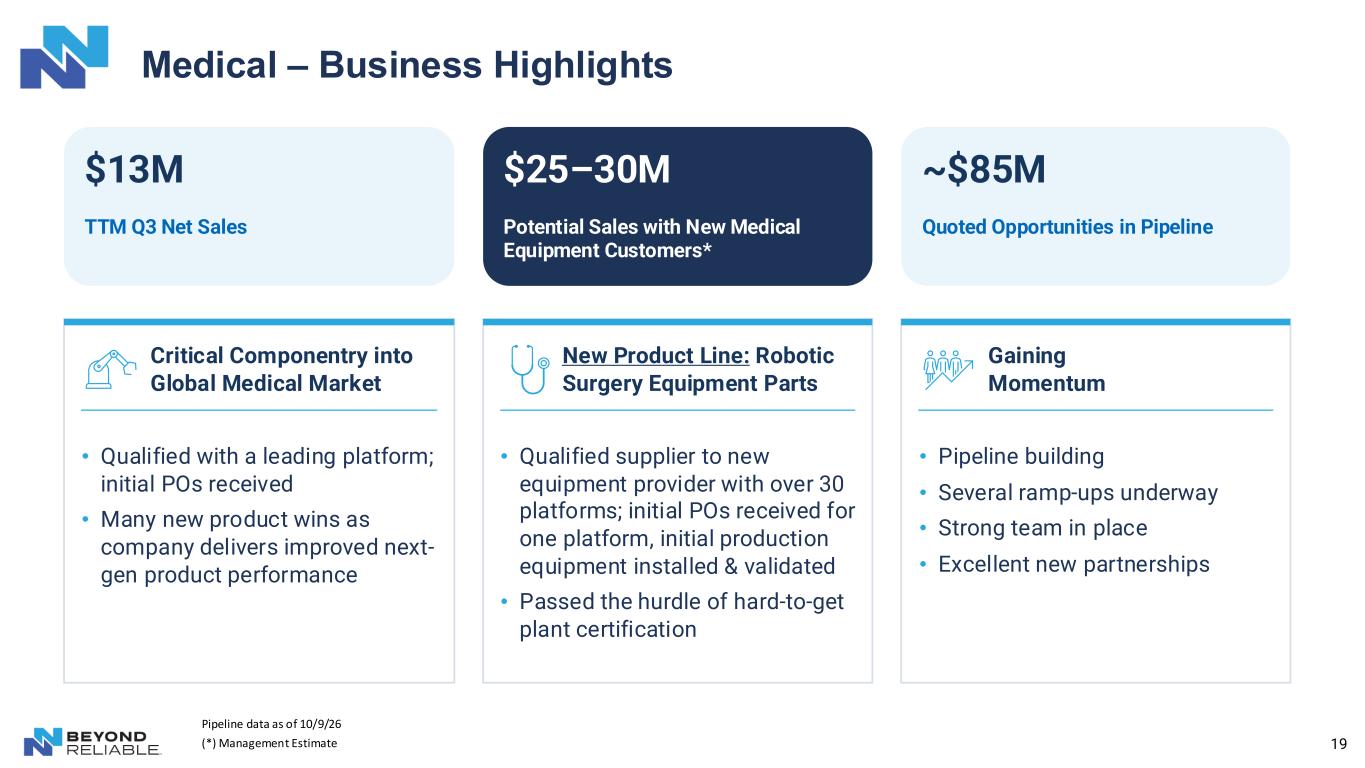
19 Medical – Business Highlights $13M TTM Q3 Net Sales Critical Componentry into Global Medical Market $25–30M Potential Sales with New Medical Equipment Customers* New Product Line: Robotic Surgery Equipment Parts ~$85M Quoted Opportunities in Pipeline Gaining Momentum • Qualified with a leading platform; initial POs received • Many new product wins as company delivers improved next- gen product performance • Qualified supplier to new equipment provider with over 30 platforms; initial POs received for one platform, initial production equipment installed & validated • Passed the hurdle of hard-to-get plant certification • Pipeline building • Several ramp-ups underway • Strong team in place • Excellent new partnerships Pipeline data as of 10/9/26 (*) Management Estimate
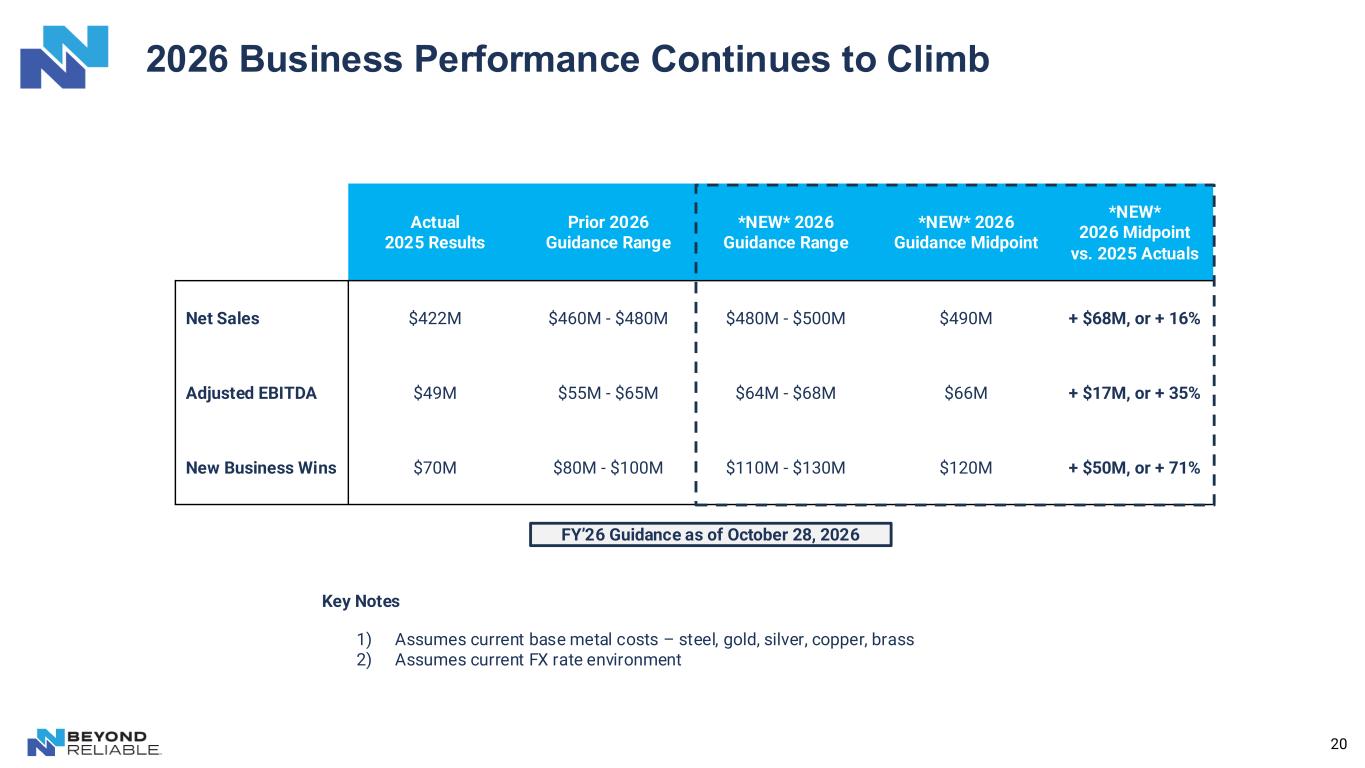
20 2026 Business Performance Continues to Climb Actual 2025 Results Prior 2026 Guidance Range *NEW* 2026 Guidance Range *NEW* 2026 Guidance Midpoint *NEW* 2026 Midpoint vs. 2025 Actuals Net Sales $422M $460M - $480M $480M - $500M $490M + $68M, or + 16% Adjusted EBITDA $49M $55M - $65M $64M - $68M $66M + $17M, or + 35% New Business Wins $70M $80M - $100M $110M - $130M $120M + $50M, or + 71% Key Notes 1) Assumes current base metal costs – steel, gold, silver, copper, brass 2) Assumes current FX rate environment FY’26 Guidance as of October 28, 2026
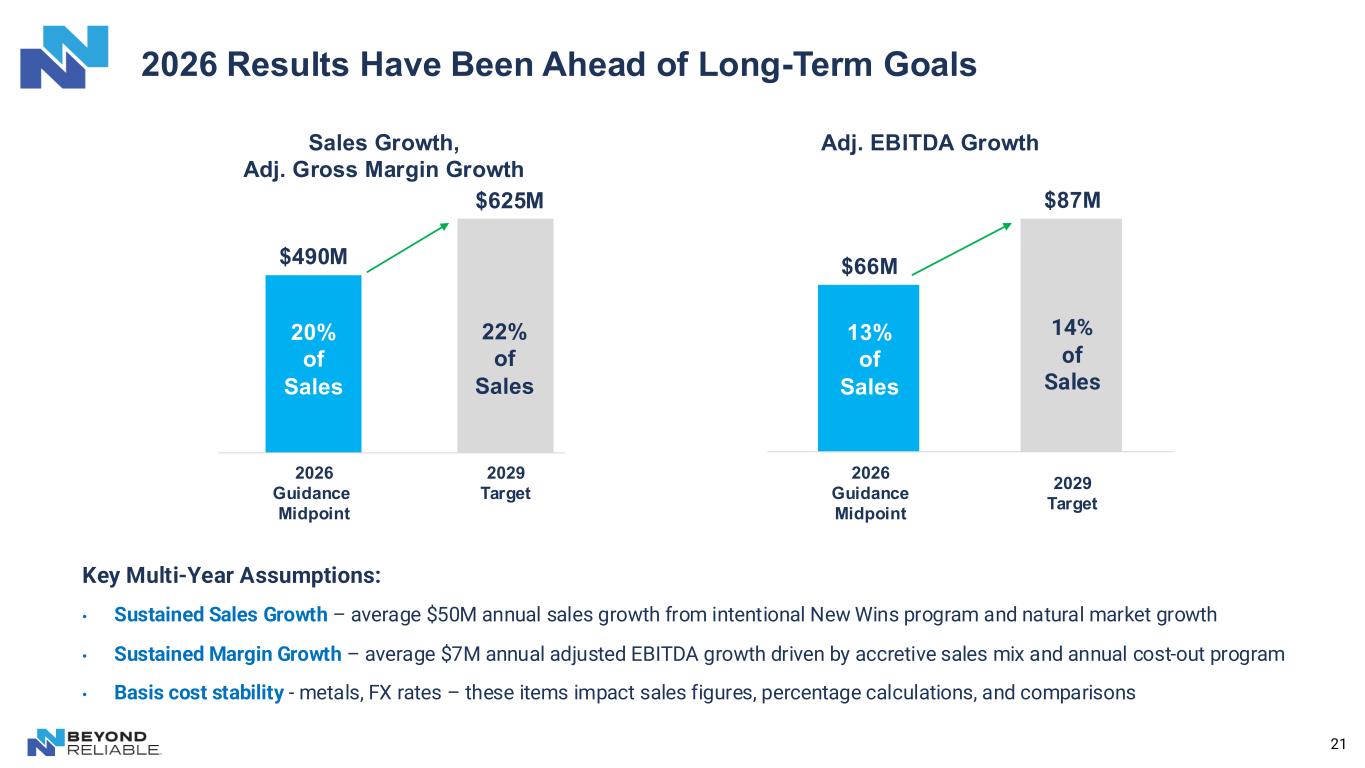
2026 Results Have Been Ahead of Long-Term Goals 21 Key Multi-Year Assumptions: • Sustained Sales Growth – average $50M annual sales growth from intentional New Wins program and natural market growth • Sustained Margin Growth – average $7M annual adjusted EBITDA growth driven by accretive sales mix and annual cost-out program • Basis cost stability - metals, FX rates – these items impact sales figures, percentage calculations, and comparisons $490M Sales Growth, Adj. Gross Margin Growth 20% of Sales 22% of Sales $66M $87M Adj. EBITDA Growth 13% of Sales 14% of Sales $625M 2029 Target Mid-Point 2029 Target 2026 Guidance Midpoint 2026 Guidance Midpoint
22 Appendix
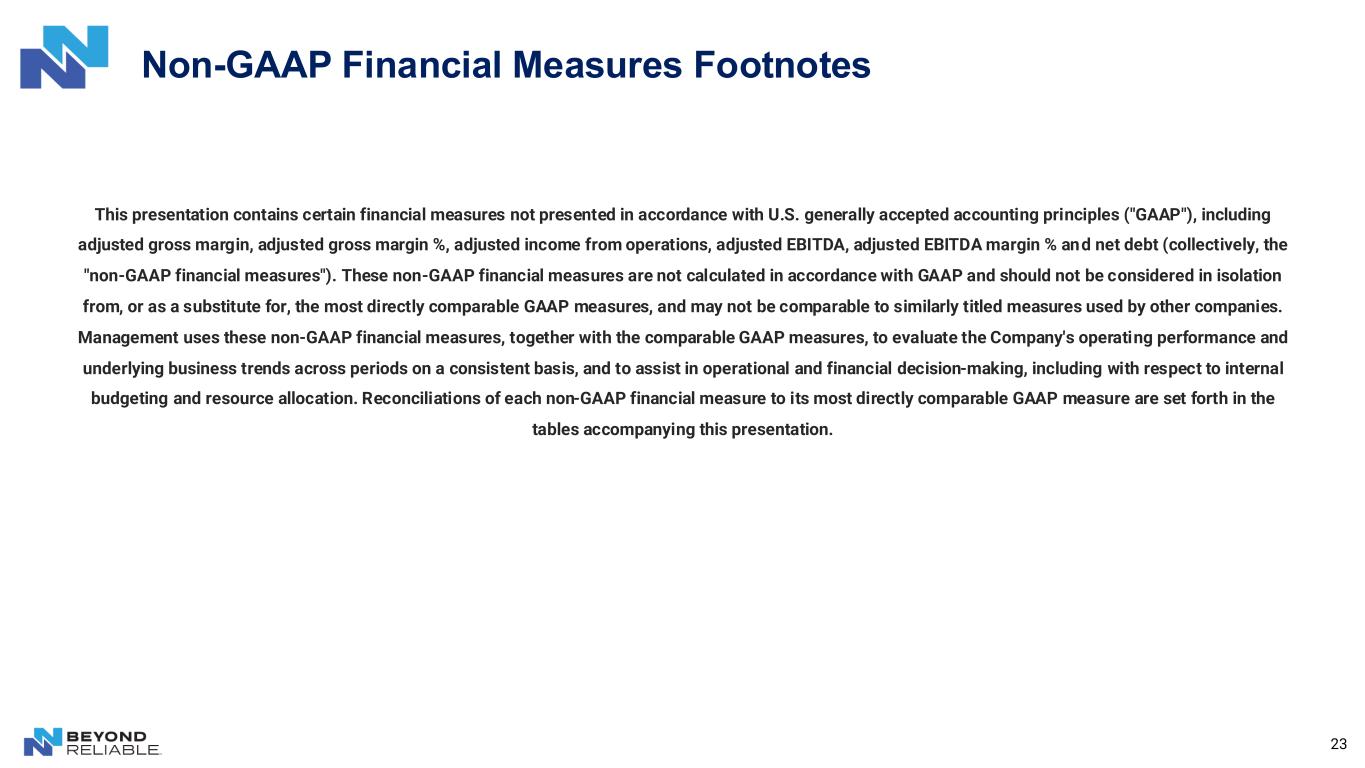
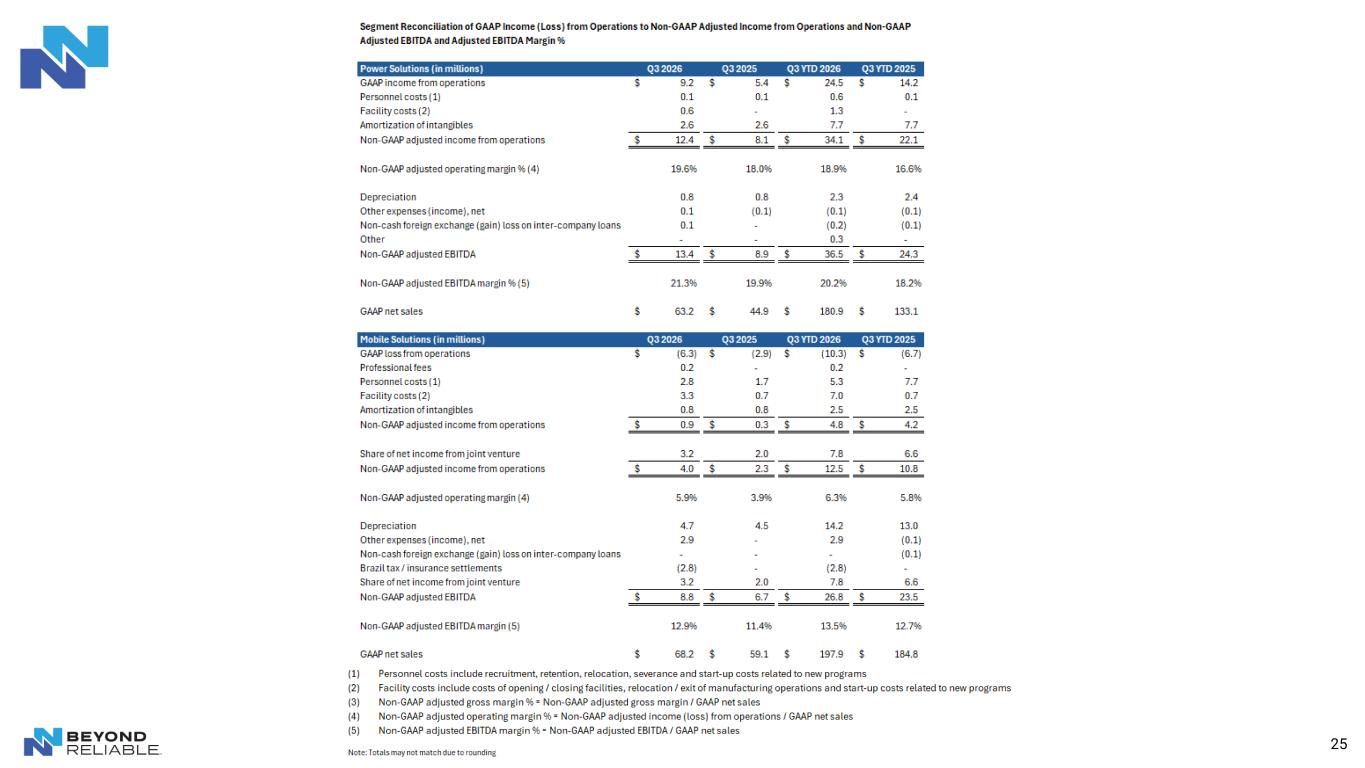
23 This presentation contains certain financial measures not presented in accordance with U.S. generally accepted accounting principles ("GAAP"), including adjusted gross margin, adjusted gross margin %, adjusted income from operations, adjusted EBITDA, adjusted EBITDA margin % and net debt (collectively, the "non-GAAP financial measures"). These non-GAAP financial measures are not calculated in accordance with GAAP and should not be considered in isolation from, or as a substitute for, the most directly comparable GAAP measures, and may not be comparable to similarly titled measures used by other companies. Management uses these non-GAAP financial measures, together with the comparable GAAP measures, to evaluate the Company's operating performance and underlying business trends across periods on a consistent basis, and to assist in operational and financial decision-making, including with respect to internal budgeting and resource allocation. Reconciliations of each non-GAAP financial measure to its most directly comparable GAAP measure are set forth in the tables accompanying this presentation. Non-GAAP Financial Measures Footnotes
24
25
26
27 Thank You