Q4 Fiscal 2026 Supplemental Information November 16, 2026
Forward-Looking Statements Certain information in this presentation constitutes forward-looking statements as contemplated by the Private Securities Litigation Reform Act of 1995. Such forward-looking statements include, but are not limited to, current views and estimates of our outlook for fiscal 2027, other future economic circumstances, industry conditions in domestic and international markets, our performance and financial results (e.g., debt levels, return on invested capital, value-added product growth, capital expenditures, tax rates, access to foreign markets and dividend policy). These forward-looking statements are subject to a number of factors and uncertainties that could cause our actual results and experiences to differ materially from anticipated results and expectations expressed in such forward-looking statements. We wish to caution readers not to place undue reliance on any forward-looking statements, which are expressly qualified in their entirety by this cautionary statement and speak only as of the date made. We undertake no obligation to update any forward-looking statements, whether as a result of new information, future events or otherwise. Among the factors that may cause actual results and experiences to differ from anticipated results and expectations expressed in such forward-looking statements are the following: (i) fluctuations in the cost and availability of inputs and raw materials, such as live cattle, live swine, feed grains (including corn and soybean meal) and energy; (ii) market conditions for finished products, including competition from other global and domestic food processors, supply and pricing of competing products and alternative proteins and demand for alternative proteins; (iii) outbreak of a livestock disease (such as African swine fever (ASF), highly pathogenic avian influenza (HPAI), New World screwworm or bovine spongiform encephalopathy (BSE)), which could have an adverse effect on livestock we own, the availability of livestock we purchase, consumer perception of certain protein products or our ability to conduct our operations; (iv) changes in consumer preference and diets and our ability to identify and react to consumer trends; (v) the effectiveness of our network optimization plan and other financial or operational optimization plans; (vi) access to, and inputs from, foreign markets together with foreign economic conditions, including currency fluctuations, import/export restrictions and foreign politics; (vii) risks associated with our failure to consummate favorable acquisition or divestiture transactions or integrate acquired businesses; (viii) significant marketing plan changes by large customers or loss of one or more large customers; (ix) effectiveness of innovation, advertising and marketing programs; (x) failure to maximize or assert our intellectual property rights; (xi) our ability to leverage brand value propositions; (xii) our effective use of artificial intelligence and other emerging technologies; (xiii) cyber attacks, other cyber incidents, security breaches or other disruptions of our information technology systems; (xiv) changes in availability and relative costs of labor and contract farmers and our ability to maintain good relationships with team members, labor unions, contract farmers and independent producers providing us livestock; (xv) adverse results from litigation or regulatory enforcement actions; (xvi) issues related to food safety, including costs resulting from product recalls, regulatory compliance and any related claims or litigation; (xvii) compliance with and changes to regulations and laws (both domestic and foreign), including changes in accounting standards, environmental laws, agricultural laws and occupational, health and safety laws; (xviii) the effect of climate change and any legal or regulatory response thereto; (xix) risks associated with our commodity purchasing and hedging activities; (xx) risks associated with leverage, including cost increases due to rising interest rates or changes in debt ratings or outlook; (xxi) impairment in the carrying value of our goodwill or indefinite life intangible assets; (xxii) effects related to changes in tax rates, valuation of deferred tax assets and liabilities or tax laws and their interpretation; (xxiii) volatility in capital markets or interest rates; (xxiv) the Tyson Limited Partnership’s ability to exercise significant control over the Company; (xxv) the effect of, or changes in, general economic conditions; (xxvi) natural disasters, fire, bioterrorism, armed conflicts, extreme weather, other unplanned disruptions or global pandemics; and (xxvii) the other risks and uncertainties detailed from time to time in our filings with the Securities and Exchange Commission, including those included under the captions "Risk Factors" and "Management's Discussion and Analysis of Financial Condition and Results of Operations" in our most recent Annual Report on Form 10-K and Quarterly reports on Form 10-Q. Non-GAAP Financial Measures This presentation contains the financial measures “Adjusted Sales” (due to the impact of an additional week in the fourth quarter of fiscal 2026), “EBITDA”, “Adjusted EBITDA”, “Adjusted EPS”, “Adjusted Operating Income”, “Adjusted Operating Margin”, “net debt to Adjusted EBITDA”, “Segment Operating Income (Loss), as adjusted”, “Corporate Expenses, as adjusted”, “Amortization, as adjusted” and “Free Cash Flow” which are not calculated in accordance with U.S. GAAP. A reconciliation of non-GAAP financial measures to the most directly comparable GAAP financial measure has been provided in the Appendix. Non-GAAP financial measures should be considered in addition to, but not as a substitute for, the Company's reported GAAP results.
Growth Fiscal 2026 adjusted operating income1 of $1.98 billion and adjusted EPS1 of $3.44, in line with our outlook, with Prepared Foods profit up 5.5%. Financial Strength $1.7 billion of free cash flow supported $1.1 billion of debt reduction, $1.1 billion returned to shareholders and a 2% dividend increase. Segment Performance Eighth consecutive quarter of Chicken volume growth; Prepared Foods grew profit and gained share. Controlling the Controllables Beef network actions are lowering costs amid continued cattle supply headwinds, setting up improvement in fiscal 2027. FY26 Key Messages 1 Adjusted operating income and Adjusted EPS are non-GAAP financial measures. Non-GAAP financial measures are explained and reconciled to the most directly comparable GAAP financial measure in the Appendix.
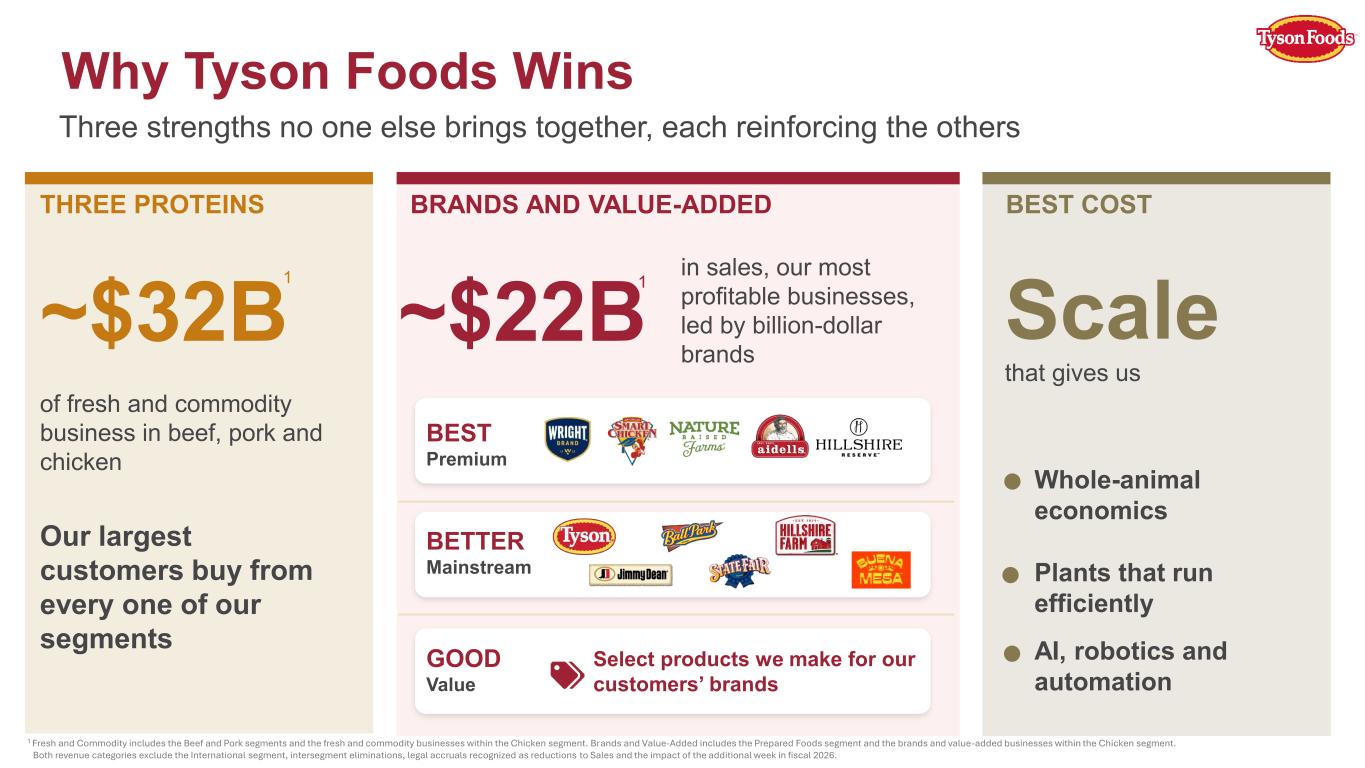
Why Tyson Foods Wins Three strengths no one else brings together, each reinforcing the others THREE PROTEINS ~$32B BRANDS AND VALUE-ADDED ~$22B BEST COST of fresh and commodity business in beef, pork and chicken Our largest customers buy from every one of our segments in sales, our most profitable businesses, led by billion-dollar brands BEST Premium BETTER Mainstream GOOD Value Select products we make for our customers’ brands Scale that gives us Whole-animal economics Plants that run efficiently AI, robotics and automation 1 Fresh and Commodity includes the Beef and Pork segments and the fresh and commodity businesses within the Chicken segment. Brands and Value-Added includes the Prepared Foods segment and the brands and value-added businesses within the Chicken segment. Both revenue categories exclude the International segment, intersegment eliminations, legal accruals recognized as reductions to Sales and the impact of the additional week in fiscal 2026. 1 1
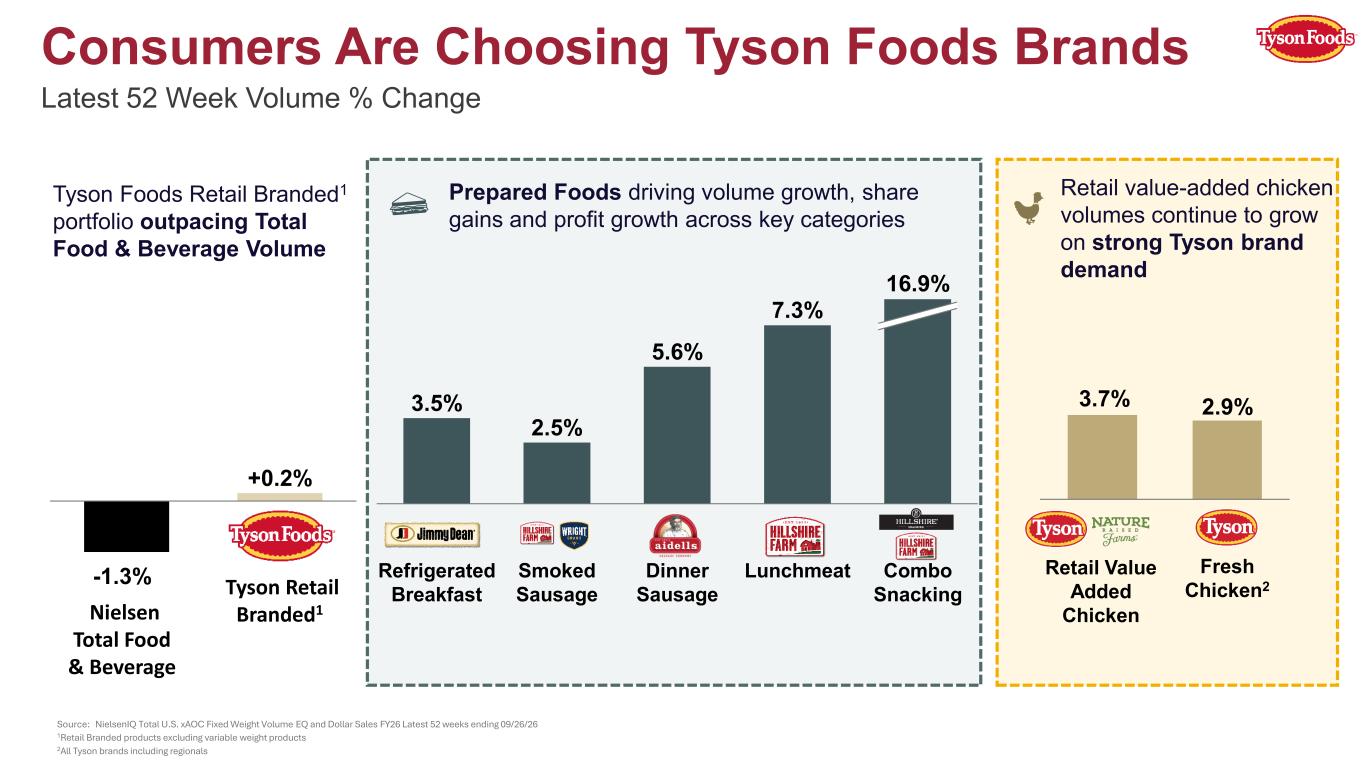
Latest 52 Week Volume % Change Source: NielsenIQ Total U.S. xAOC Fixed Weight Volume EQ and Dollar Sales FY26 Latest 52 weeks ending 09/26/26 1Retail Branded products excluding variable weight products 2All Tyson brands including regionals Consumers Are Choosing Tyson Foods Brands Nielsen Total Food & Beverage Tyson Retail Branded1 -1.3% +0.2% Tyson Foods Retail Branded1 portfolio outpacing Total Food & Beverage Volume Prepared Foods driving volume growth, share gains and profit growth across key categories Refrigerated Breakfast Smoked Sausage Dinner Sausage Lunchmeat Combo Snacking 3.5% 2.5% 5.6% 7.3% 16.9% Retail Value Added Chicken Fresh Chicken2 3.7% 2.9% Retail value-added chicken volumes continue to grow on strong Tyson brand demand
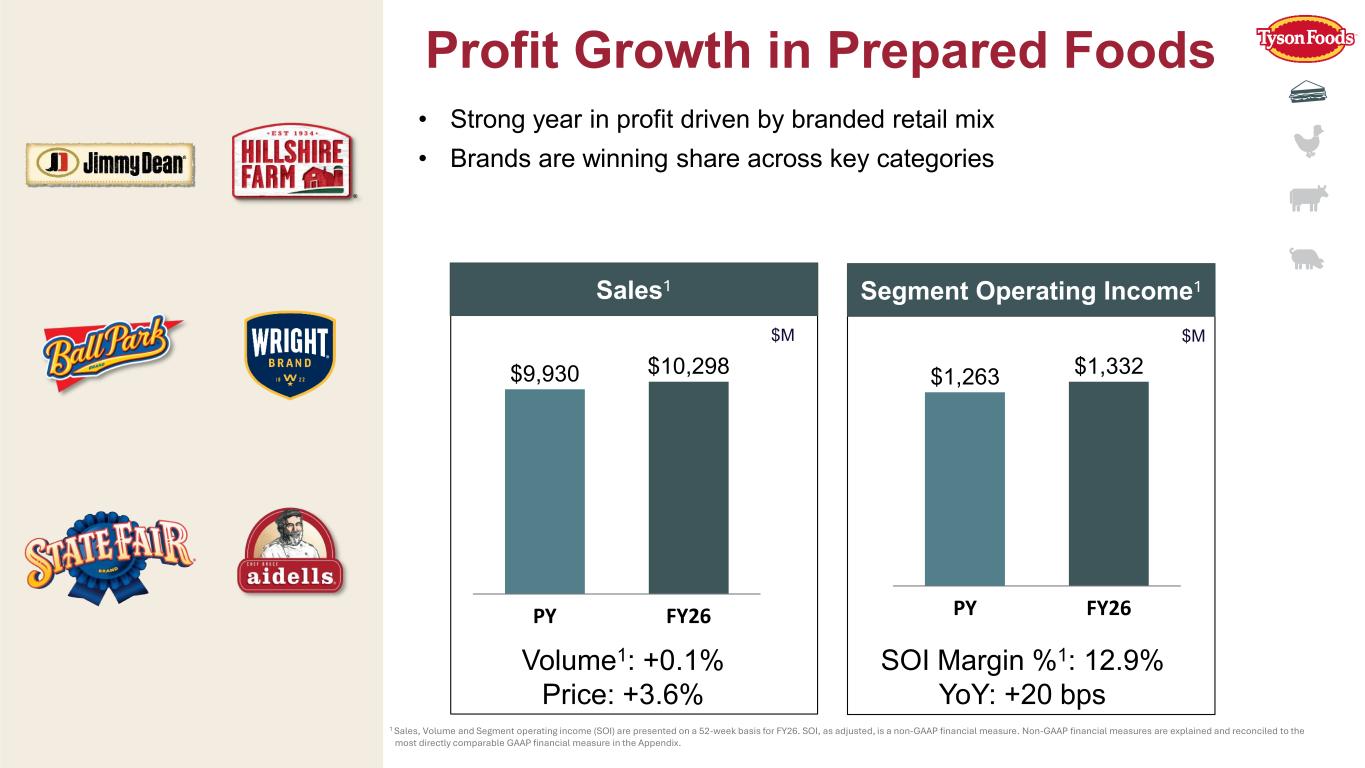
• Strong year in profit driven by branded retail mix • Brands are winning share across key categories 1 Sales, Volume and Segment operating income (SOI) are presented on a 52-week basis for FY26. SOI, as adjusted, is a non-GAAP financial measure. Non-GAAP financial measures are explained and reconciled to the most directly comparable GAAP financial measure in the Appendix. Volume1: +0.1% Price: +3.6% SOI Margin %1: 12.9% YoY: +20 bps PY FY26 $9,930 $10,298 PY FY26 $1,263 $1,332 $M $M Profit Growth in Prepared Foods Segment Operating Income1Sales1
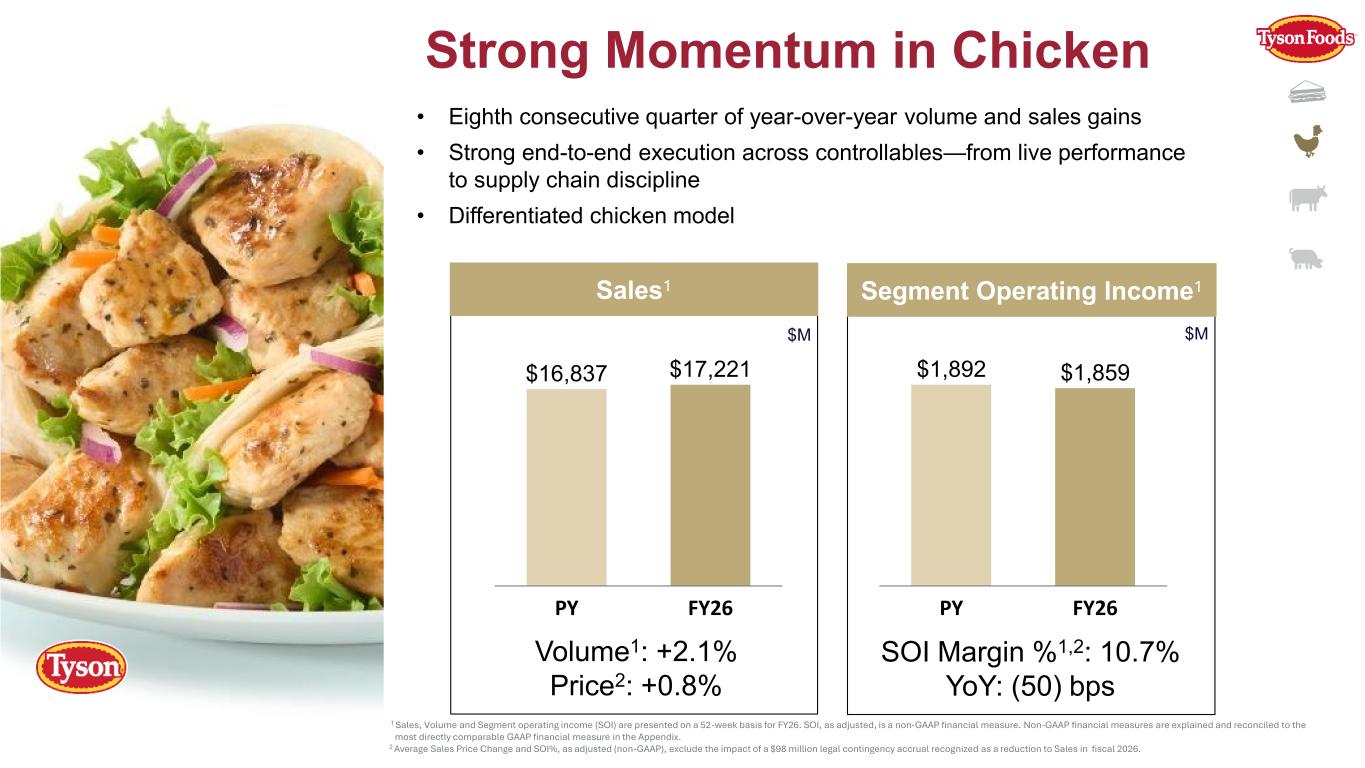
Strong Momentum in Chicken • Eighth consecutive quarter of year-over-year volume and sales gains • Strong end-to-end execution across controllables—from live performance to supply chain discipline • Differentiated chicken model Volume1: +2.1% Price2: +0.8% SOI Margin %1,2: 10.7% YoY: (50) bps PY FY26 $16,837 $17,221 PY FY26 $1,892 $1,859 $M 1 Sales, Volume and Segment operating income (SOI) are presented on a 52-week basis for FY26. SOI, as adjusted, is a non-GAAP financial measure. Non-GAAP financial measures are explained and reconciled to the most directly comparable GAAP financial measure in the Appendix. 2 Average Sales Price Change and SOI%, as adjusted (non-GAAP), exclude the impact of a $98 million legal contingency accrual recognized as a reduction to Sales in fiscal 2026. Segment Operating Income1Sales1 $M
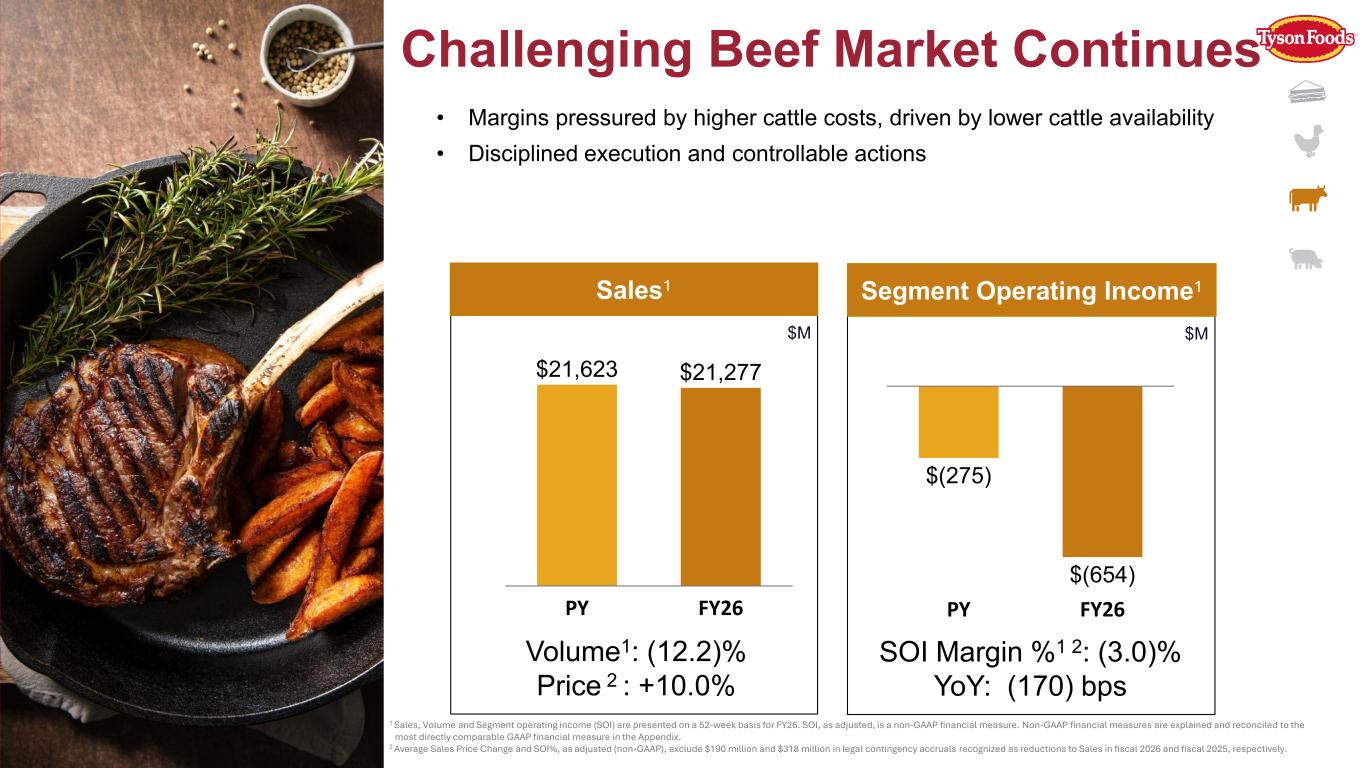
Challenging Beef Market Continues • Margins pressured by higher cattle costs, driven by lower cattle availability • Disciplined execution and controllable actions Volume1: (12.2)% Price 2 : +10.0% SOI Margin %1 2: (3.0)% YoY: (170) bps PY FY26 $21,623 $21,277 Segment Operating Income1Sales1 $M $M 1 Sales, Volume and Segment operating income (SOI) are presented on a 52-week basis for FY26. SOI, as adjusted, is a non-GAAP financial measure. Non-GAAP financial measures are explained and reconciled to the most directly comparable GAAP financial measure in the Appendix. 2 Average Sales Price Change and SOI%, as adjusted (non-GAAP), exclude $190 million and $318 million in legal contingency accruals recognized as reductions to Sales in fiscal 2026 and fiscal 2025, respectively. PY FY26 $(275) $(654)
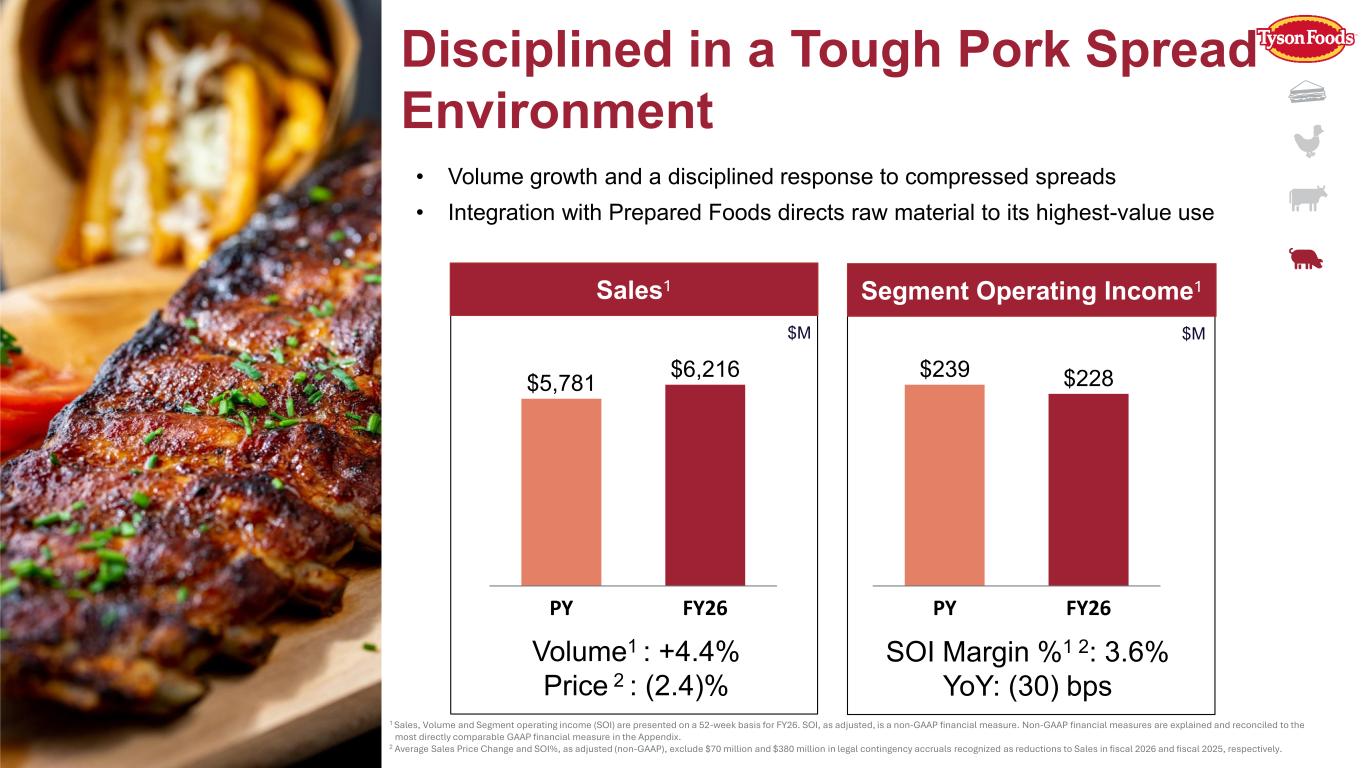
• Volume growth and a disciplined response to compressed spreads • Integration with Prepared Foods directs raw material to its highest-value use Volume1 : +4.4% Price 2 : (2.4)% SOI Margin %1 2: 3.6% YoY: (30) bps PY FY26 $5,781 $6,216 PY FY26 $239 $228 Sales1 $M $M 1 Sales, Volume and Segment operating income (SOI) are presented on a 52-week basis for FY26. SOI, as adjusted, is a non-GAAP financial measure. Non-GAAP financial measures are explained and reconciled to the most directly comparable GAAP financial measure in the Appendix. 2 Average Sales Price Change and SOI%, as adjusted (non-GAAP), exclude $70 million and $380 million in legal contingency accruals recognized as reductions to Sales in fiscal 2026 and fiscal 2025, respectively. Segment Operating Income1 Disciplined in a Tough Pork Spread Environment
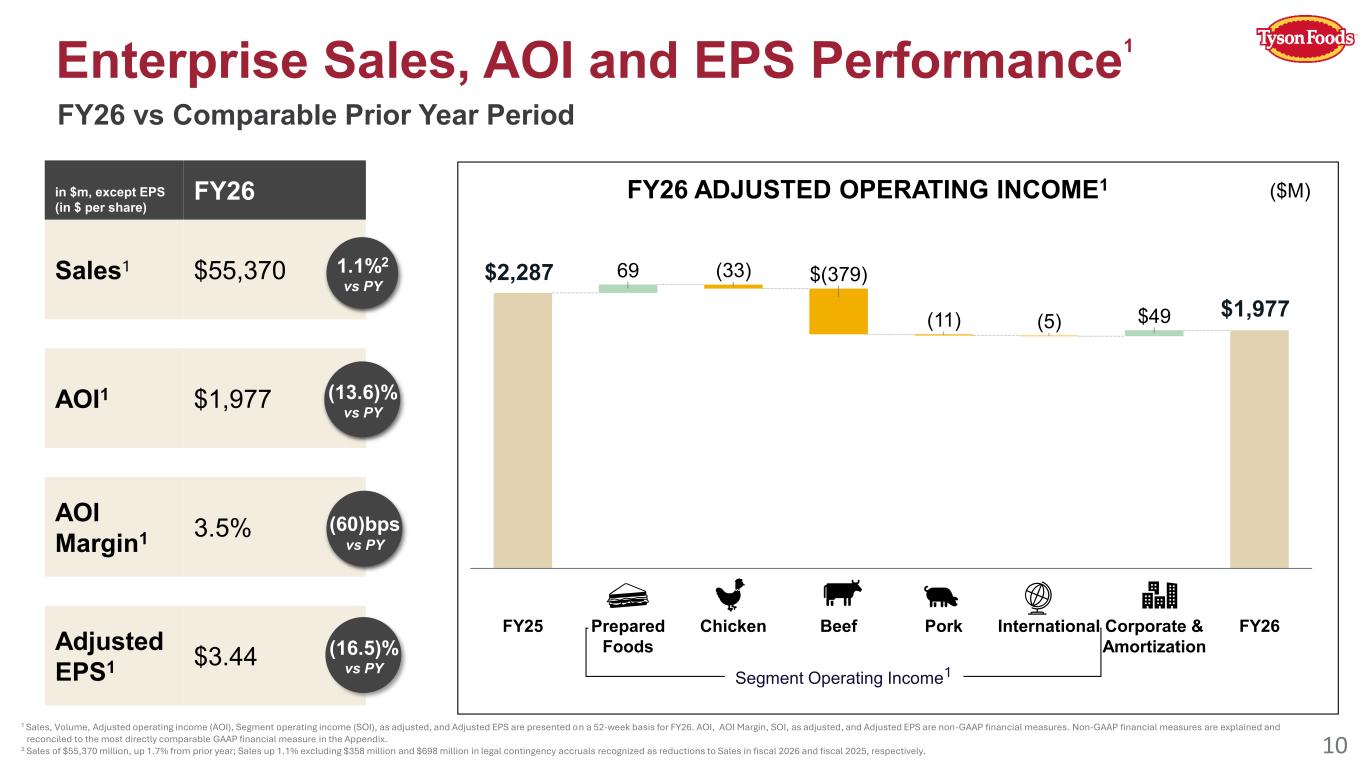
(33) (11) (5) FY25 $(379) Beef $49 Corporate & Amortization FY26Pork InternationalChickenPrepared Foods 69 FY26 ADJUSTED OPERATING INCOME1 1 Sales, Volume, Adjusted operating income (AOI), Segment operating income (SOI), as adjusted, and Adjusted EPS are presented on a 52-week basis for FY26. AOI, AOI Margin, SOI, as adjusted, and Adjusted EPS are non-GAAP financial measures. Non-GAAP financial measures are explained and reconciled to the most directly comparable GAAP financial measure in the Appendix. 2 Sales of $55,370 million, up 1.7% from prior year; Sales up 1.1% excluding $358 million and $698 million in legal contingency accruals recognized as reductions to Sales in fiscal 2026 and fiscal 2025, respectively. in $m, except EPS (in $ per share) FY26 Sales1 $55,370 AOI1 $1,977 AOI Margin1 3.5% Adjusted EPS1 $3.44 1.1%2 vs PY (13.6)% vs PY (16.5)% vs PY (60)bps vs PY FY26 vs Comparable Prior Year Period Enterprise Sales, AOI and EPS Performance 1 $1,977 Segment Operating Income1 ($M) $2,287 10
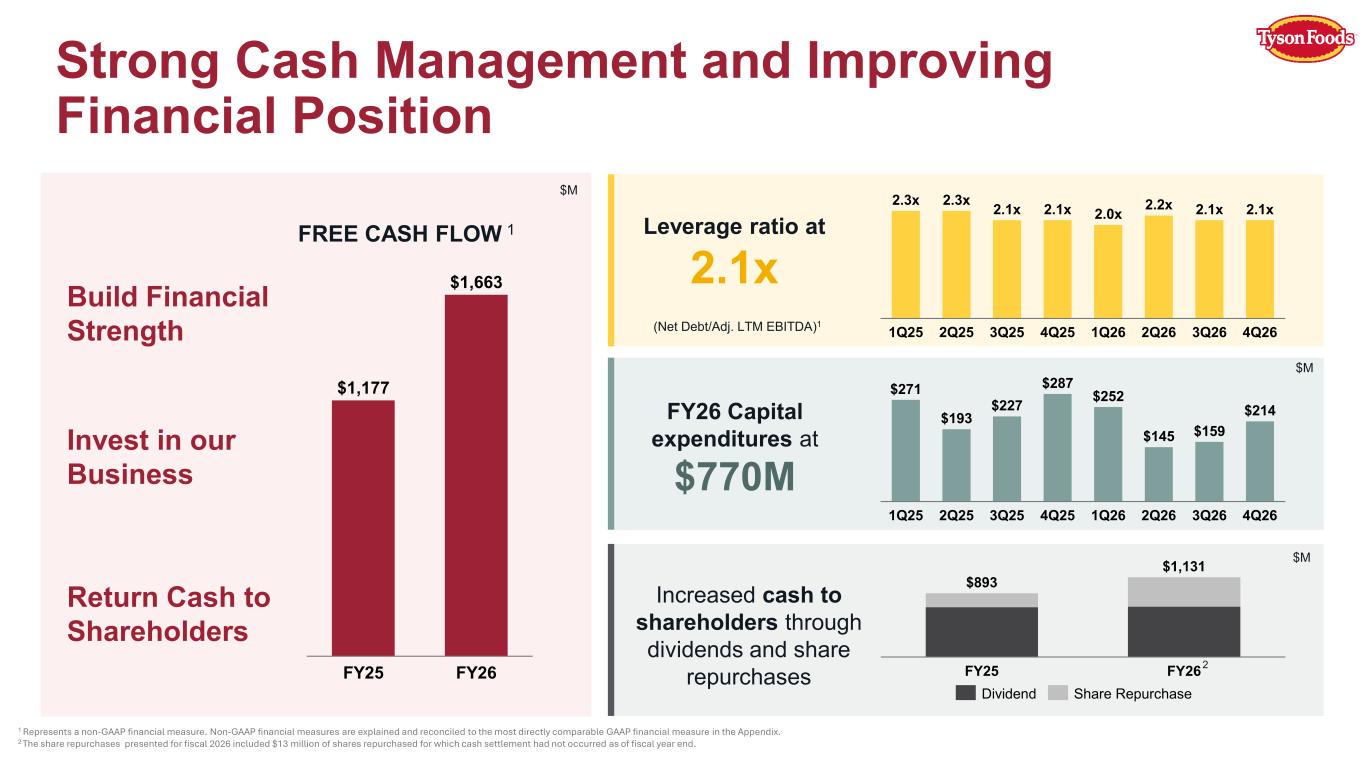
FREE CASH FLOW 1 (Net Debt/Adj. LTM EBITDA)1 $M 1 Represents a non-GAAP financial measure. Non-GAAP financial measures are explained and reconciled to the most directly comparable GAAP financial measure in the Appendix. 2 The share repurchases presented for fiscal 2026 included $13 million of shares repurchased for which cash settlement had not occurred as of fiscal year end. Build Financial Strength Invest in our Business Return Cash to Shareholders Strong Cash Management and Improving Financial Position Leverage ratio at 2.1x FY26 Capital expenditures at $770M Increased cash to shareholders through dividends and share repurchasesFY25 FY26 $1,177 $1,663 1Q25 2Q25 3Q25 4Q25 1Q26 2Q26 3Q26 4Q26 2.3x 2.3x 2.1x 2.1x 2.0x 2.2x 2.1x 2.1x 1Q25 2Q25 3Q25 4Q25 1Q26 2Q26 3Q26 4Q26 $271 $193 $227 $287 $252 $145 $159 $214 FY25 FY26 $893 $1,131 $M $M Dividend Share Repurchase 2
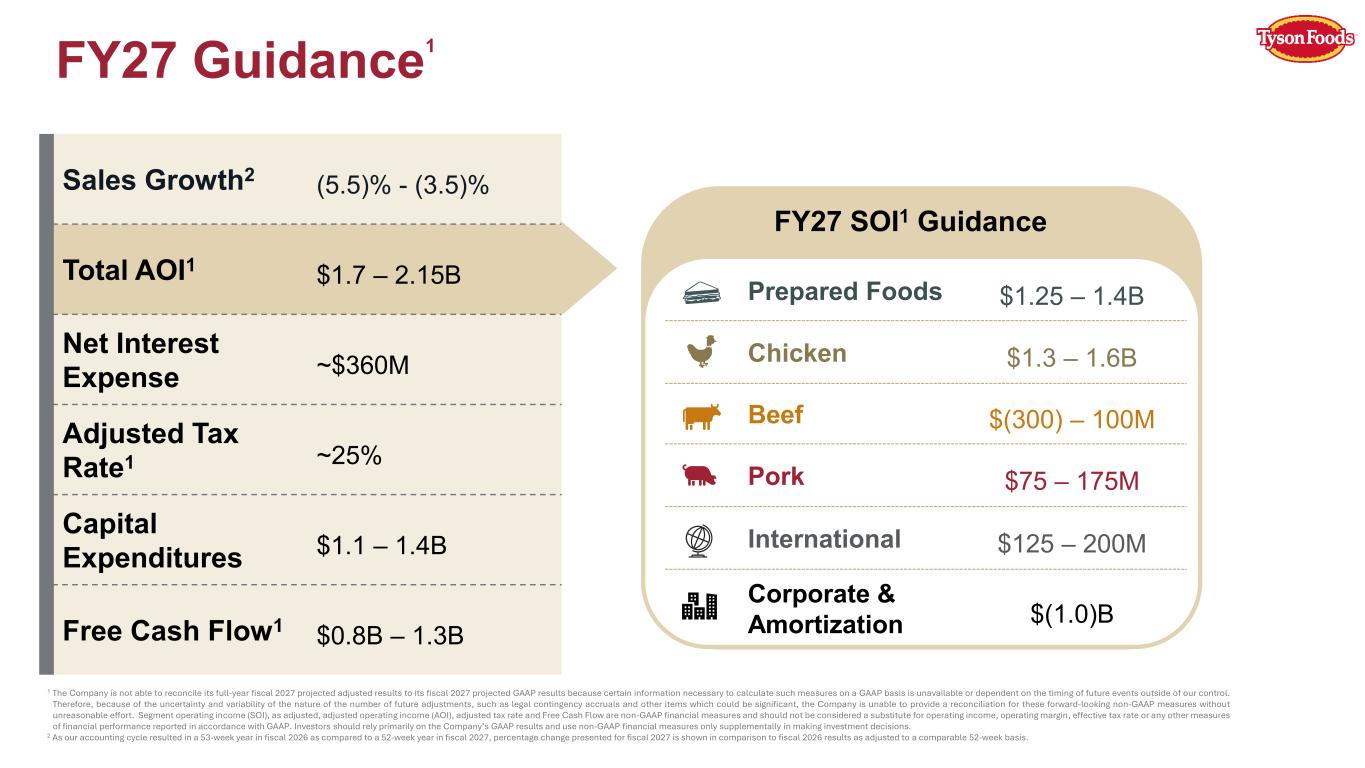
Sales Growth2 (5.5)% - (3.5)% Total AOI1 $1.7 – 2.15B Net Interest Expense ~$360M Adjusted Tax Rate1 ~25% Capital Expenditures $1.1 – 1.4B Free Cash Flow1 $0.8B – 1.3B FY27 Guidance 1 1 The Company is not able to reconcile its full-year fiscal 2027 projected adjusted results to its fiscal 2027 projected GAAP results because certain information necessary to calculate such measures on a GAAP basis is unavailable or dependent on the timing of future events outside of our control. Therefore, because of the uncertainty and variability of the nature of the number of future adjustments, such as legal contingency accruals and other items which could be significant, the Company is unable to provide a reconciliation for these forward-looking non-GAAP measures without unreasonable effort. Segment operating income (SOI), as adjusted, adjusted operating income (AOI), adjusted tax rate and Free Cash Flow are non-GAAP financial measures and should not be considered a substitute for operating income, operating margin, effective tax rate or any other measures of financial performance reported in accordance with GAAP. Investors should rely primarily on the Company’s GAAP results and use non-GAAP financial measures only supplementally in making investment decisions. 2 As our accounting cycle resulted in a 53-week year in fiscal 2026 as compared to a 52-week year in fiscal 2027, percentage change presented for fiscal 2027 is shown in comparison to fiscal 2026 results as adjusted to a comparable 52-week basis. FY27 SOI1 Guidance Prepared Foods $1.25 – 1.4B Chicken $1.3 – 1.6B Beef $(300) – 100M Pork $75 – 175M International $125 – 200M Corporate & Amortization $(1.0)B
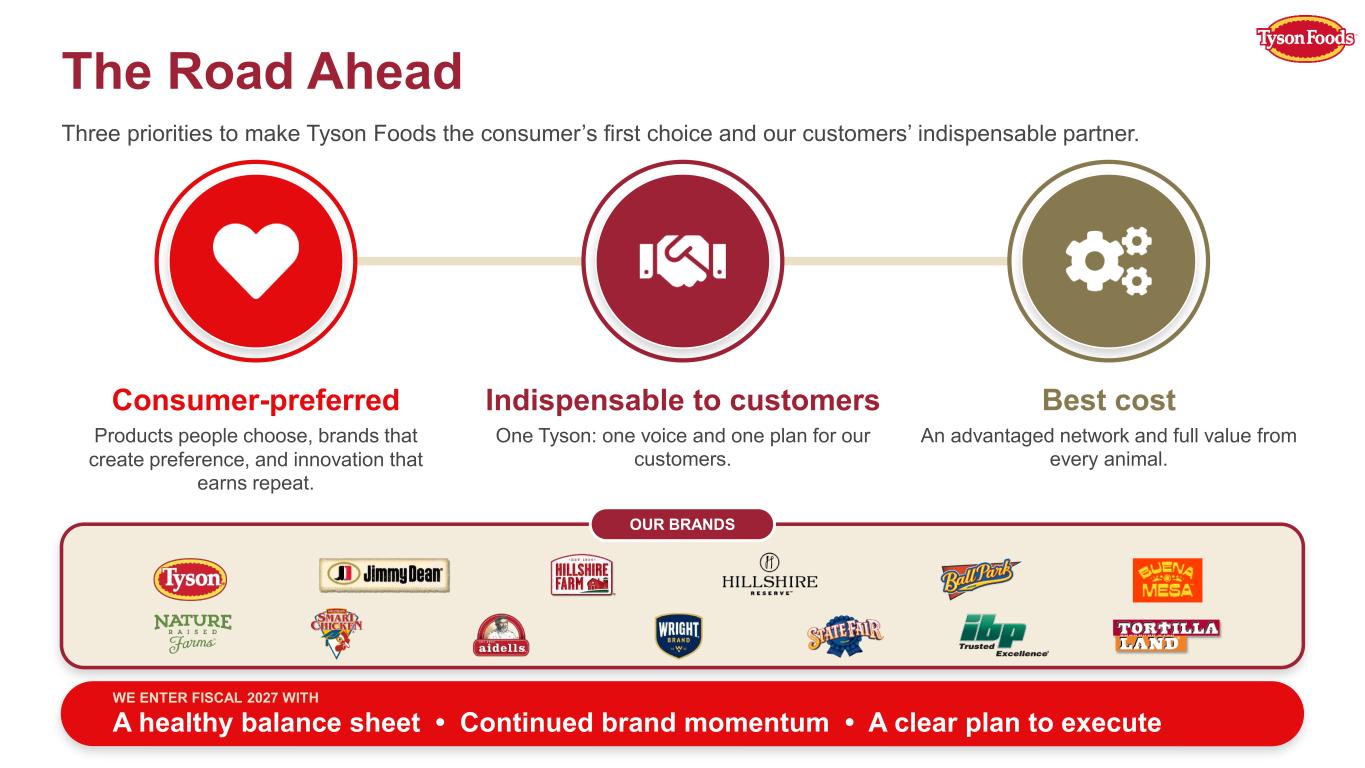
13 The Road Ahead Three priorities to make Tyson Foods the consumer’s first choice and our customers’ indispensable partner. Consumer-preferred Products people choose, brands that create preference, and innovation that earns repeat. Indispensable to customers One Tyson: one voice and one plan for our customers. Best cost An advantaged network and full value from every animal. OUR BRANDS WE ENTER FISCAL 2027 WITH A healthy balance sheet • Continued brand momentum • A clear plan to execute
Appendix
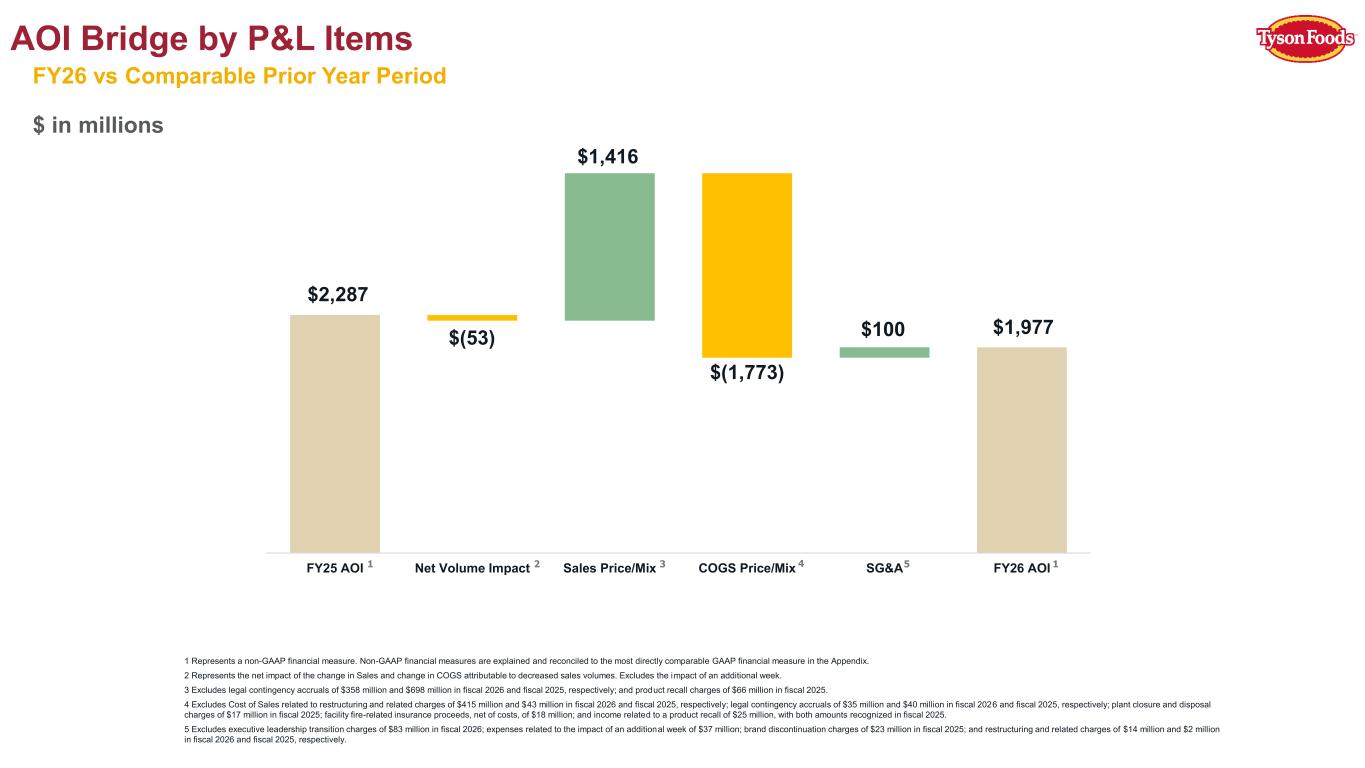
$ in millions $2,287 $1,977 $1,416 $100 $(53) $(1,773) FY25 AOI Net Volume Impact Sales Price/Mix COGS Price/Mix SG&A FY26 AOI2 4 5 AOI Bridge by P&L Items FY26 vs Comparable Prior Year Period 1 3 1 1 Represents a non-GAAP financial measure. Non-GAAP financial measures are explained and reconciled to the most directly comparable GAAP financial measure in the Appendix. 2 Represents the net impact of the change in Sales and change in COGS attributable to decreased sales volumes. Excludes the impact of an additional week. 3 Excludes legal contingency accruals of $358 million and $698 million in fiscal 2026 and fiscal 2025, respectively; and product recall charges of $66 million in fiscal 2025. 4 Excludes Cost of Sales related to restructuring and related charges of $415 million and $43 million in fiscal 2026 and fiscal 2025, respectively; legal contingency accruals of $35 million and $40 million in fiscal 2026 and fiscal 2025, respectively; plant closure and disposal charges of $17 million in fiscal 2025; facility fire-related insurance proceeds, net of costs, of $18 million; and income related to a product recall of $25 million, with both amounts recognized in fiscal 2025. 5 Excludes executive leadership transition charges of $83 million in fiscal 2026; expenses related to the impact of an additional week of $37 million; brand discontinuation charges of $23 million in fiscal 2025; and restructuring and related charges of $14 million and $2 million in fiscal 2026 and fiscal 2025, respectively.
Adjusted Sales (due to the impact of an additional week in the fourth quarter of fiscal 2026), Adjusted Operating Income (Loss), Adjusted Income before Income Taxes, Adjusted Income Tax Expense, Adjusted Net Income Attributable to Tyson and Adjusted EPS, EBITDA, Adjusted EBITDA, net debt to EBITDA, net debt to Adjusted EBITDA, Segment Operating Income (Loss), As Adjusted, Corporate Expenses, As Adjusted, Amortization, As Adjusted, and Free Cash Flow are presented as supplemental financial measures in the evaluation of our business that are not required by, or presented in accordance with GAAP. The non-GAAP financial measures are tools intended to assist our management and investors in comparing our performance on a consistent basis for purposes of business decision-making by removing the impact of certain items that management believes do not directly reflect our core operations on an ongoing basis. These non-GAAP measures should not be a substitute for their comparable GAAP financial measures. Investors should rely primarily on our GAAP results and use non-GAAP financial measures only supplementally in making investment decisions. We believe the presentation of these non-GAAP financial measures helps management and investors to assess our operating performance from period to period, including our ability to generate earnings sufficient to service our debt, enhances understanding of our financial performance and highlights operational trends. These measures are widely used by investors and rating agencies in the valuation, comparison, rating and investment recommendations of companies. Our calculation of non-GAAP measures may not be comparable to similarly titled measures reported by other companies and other companies may not define these non-GAAP financial measures in the same way, which may limit their usefulness as comparative measures. Definitions EBITDA is defined as net income (loss) before interest, income taxes, depreciation and amortization. Net debt to EBITDA (Adjusted EBITDA) represents the ratio of our debt, net of cash, cash equivalents and short-term investments, to EBITDA (and to Adjusted EBITDA). EBITDA, Adjusted EBITDA, net debt to EBITDA and net debt to Adjusted EBITDA are presented as supplemental financial measurements in the evaluation of our business. Adjusted EBITDA, Adjusted Operating Income (Loss), Adjusted Income before Income Taxes, Adjusted Income Tax Expense, Adjusted Net Income Attributable to Tyson and Adjusted EPS are defined as EBITDA, Operating Income (Loss), Income (Loss) before Income Taxes, Income Tax Expense (Benefit), Net Income (Loss) Attributable to Tyson and diluted earnings per share, respectively, excluding the impacts of any items that management believes do not directly reflect our core operations on an ongoing basis, as well as the impact of an additional week in fiscal 2026. Non-GAAP Financial Measures
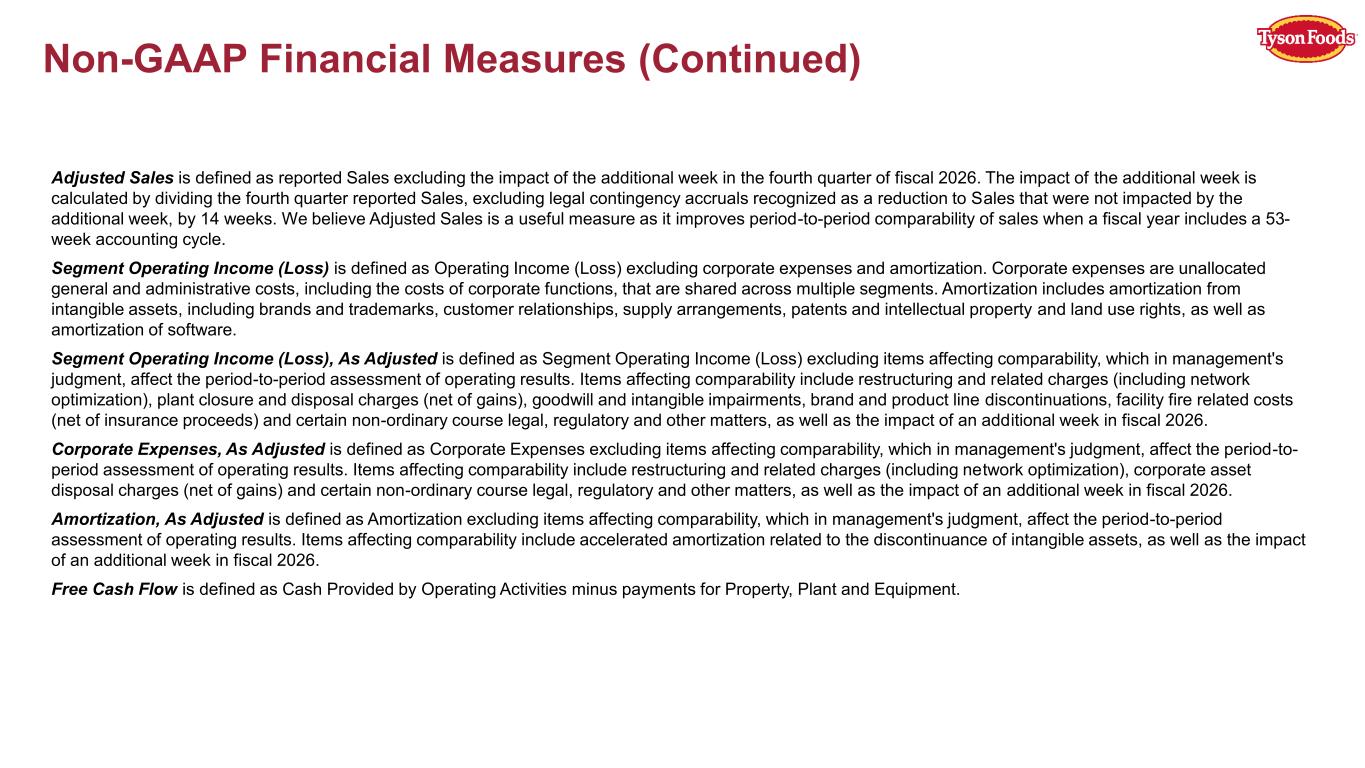
Adjusted Sales is defined as reported Sales excluding the impact of the additional week in the fourth quarter of fiscal 2026. The impact of the additional week is calculated by dividing the fourth quarter reported Sales, excluding legal contingency accruals recognized as a reduction to Sales that were not impacted by the additional week, by 14 weeks. We believe Adjusted Sales is a useful measure as it improves period-to-period comparability of sales when a fiscal year includes a 53- week accounting cycle. Segment Operating Income (Loss) is defined as Operating Income (Loss) excluding corporate expenses and amortization. Corporate expenses are unallocated general and administrative costs, including the costs of corporate functions, that are shared across multiple segments. Amortization includes amortization from intangible assets, including brands and trademarks, customer relationships, supply arrangements, patents and intellectual property and land use rights, as well as amortization of software. Segment Operating Income (Loss), As Adjusted is defined as Segment Operating Income (Loss) excluding items affecting comparability, which in management's judgment, affect the period-to-period assessment of operating results. Items affecting comparability include restructuring and related charges (including network optimization), plant closure and disposal charges (net of gains), goodwill and intangible impairments, brand and product line discontinuations, facility fire related costs (net of insurance proceeds) and certain non-ordinary course legal, regulatory and other matters, as well as the impact of an additional week in fiscal 2026. Corporate Expenses, As Adjusted is defined as Corporate Expenses excluding items affecting comparability, which in management's judgment, affect the period-to- period assessment of operating results. Items affecting comparability include restructuring and related charges (including network optimization), corporate asset disposal charges (net of gains) and certain non-ordinary course legal, regulatory and other matters, as well as the impact of an additional week in fiscal 2026. Amortization, As Adjusted is defined as Amortization excluding items affecting comparability, which in management's judgment, affect the period-to-period assessment of operating results. Items affecting comparability include accelerated amortization related to the discontinuance of intangible assets, as well as the impact of an additional week in fiscal 2026. Free Cash Flow is defined as Cash Provided by Operating Activities minus payments for Property, Plant and Equipment. Non-GAAP Financial Measures (Continued)
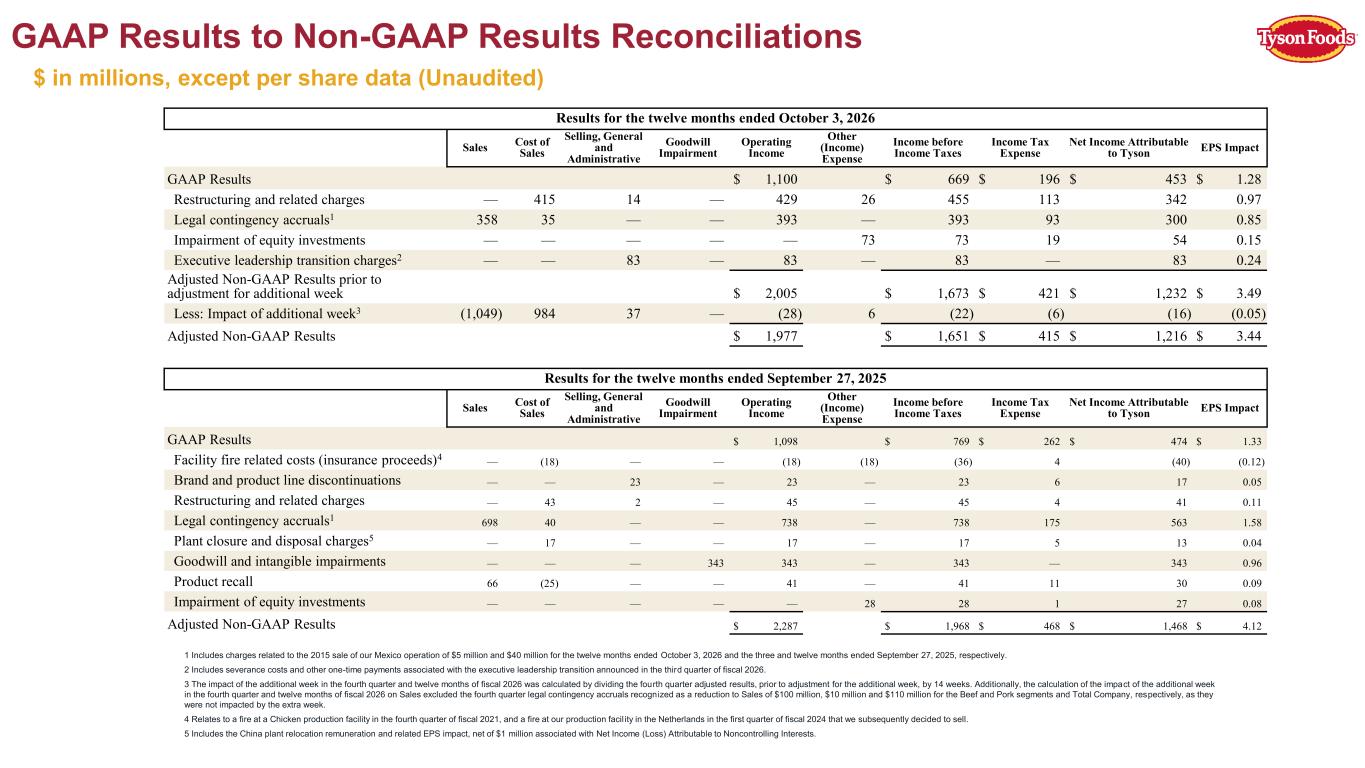
GAAP Results to Non-GAAP Results Reconciliations $ in millions, except per share data (Unaudited) 1 Includes charges related to the 2015 sale of our Mexico operation of $5 million and $40 million for the twelve months ended October 3, 2026 and the three and twelve months ended September 27, 2025, respectively. 2 Includes severance costs and other one-time payments associated with the executive leadership transition announced in the third quarter of fiscal 2026. 3 The impact of the additional week in the fourth quarter and twelve months of fiscal 2026 was calculated by dividing the fourth quarter adjusted results, prior to adjustment for the additional week, by 14 weeks. Additionally, the calculation of the impact of the additional week in the fourth quarter and twelve months of fiscal 2026 on Sales excluded the fourth quarter legal contingency accruals recognized as a reduction to Sales of $100 million, $10 million and $110 million for the Beef and Pork segments and Total Company, respectively, as they were not impacted by the extra week. 4 Relates to a fire at a Chicken production facility in the fourth quarter of fiscal 2021, and a fire at our production facil ity in the Netherlands in the first quarter of fiscal 2024 that we subsequently decided to sell. 5 Includes the China plant relocation remuneration and related EPS impact, net of $1 million associated with Net Income (Loss) Attributable to Noncontrolling Interests. Results for the twelve months ended October 3, 2026 Sales Cost of Sales Selling, General and Administrative Goodwill Impairment Operating Income Other (Income) Expense Income before Income Taxes Income Tax Expense Net Income Attributable to Tyson EPS Impact GAAP Results $ 1,100 $ 669 $ 196 $ 453 $ 1.28 Restructuring and related charges — 415 14 — 429 26 455 113 342 0.97 Legal contingency accruals1 358 35 — — 393 — 393 93 300 0.85 Impairment of equity investments — — — — — 73 73 19 54 0.15 Executive leadership transition charges2 — — 83 — 83 — 83 — 83 0.24 Adjusted Non-GAAP Results prior to adjustment for additional week $ 2,005 $ 1,673 $ 421 $ 1,232 $ 3.49 Less: Impact of additional week3 (1,049) 984 37 — (28) 6 (22) (6) (16) (0.05) Adjusted Non-GAAP Results $ 1,977 $ 1,651 $ 415 $ 1,216 $ 3.44 Results for the twelve months ended September 27, 2025 Sales Cost of Sales Selling, General and Administrative Goodwill Impairment Operating Income Other (Income) Expense Income before Income Taxes Income Tax Expense Net Income Attributable to Tyson EPS Impact GAAP Results $ 1,098 $ 769 $ 262 $ 474 $ 1.33 Facility fire related costs (insurance proceeds)4 — (18) — — (18) (18) (36) 4 (40) (0.12) Brand and product line discontinuations — — 23 — 23 — 23 6 17 0.05 Restructuring and related charges — 43 2 — 45 — 45 4 41 0.11 Legal contingency accruals1 698 40 — — 738 — 738 175 563 1.58 Plant closure and disposal charges5 — 17 — — 17 — 17 5 13 0.04 Goodwill and intangible impairments — — — 343 343 — 343 — 343 0.96 Product recall 66 (25) — — 41 — 41 11 30 0.09 Impairment of equity investments — — — — — 28 28 1 27 0.08 Adjusted Non-GAAP Results $ 2,287 $ 1,968 $ 468 $ 1,468 $ 4.12
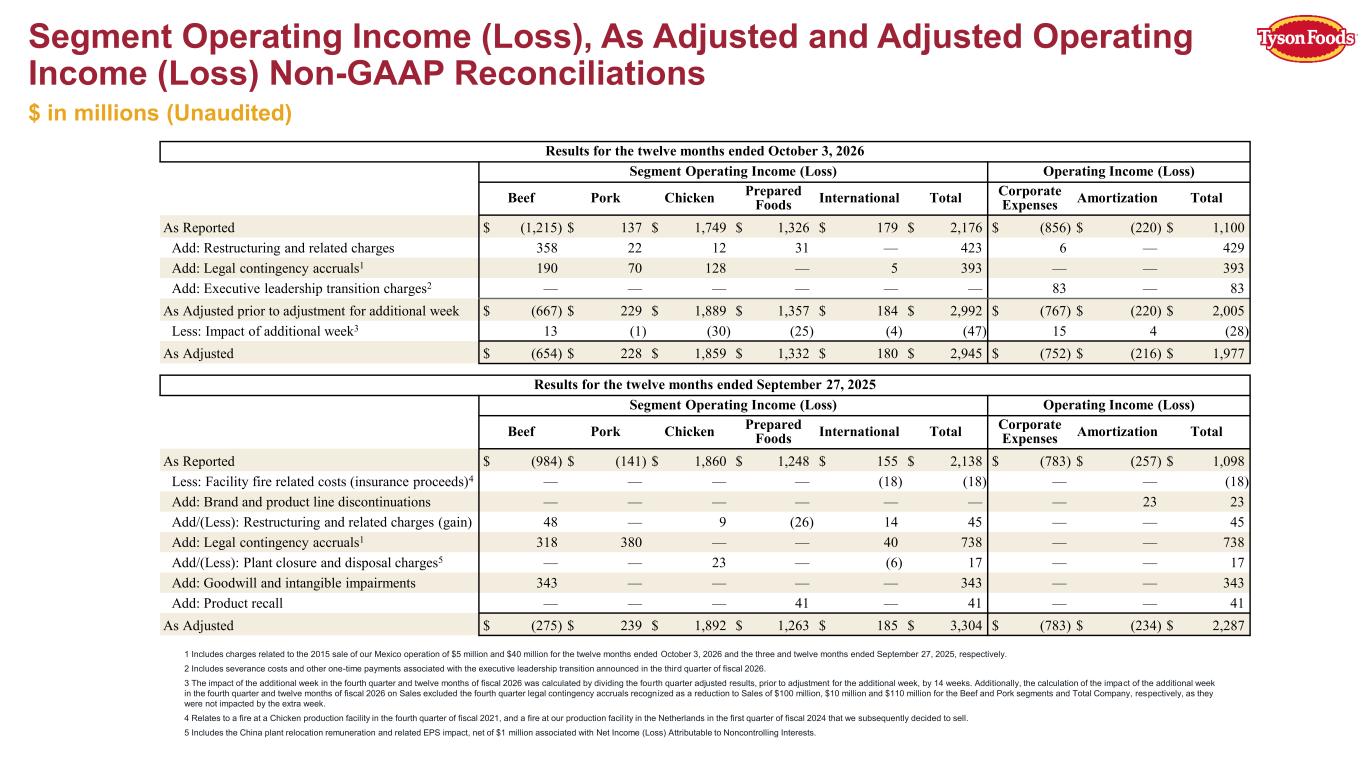
Segment Operating Income (Loss), As Adjusted and Adjusted Operating Income (Loss) Non-GAAP Reconciliations $ in millions (Unaudited) 1 Includes charges related to the 2015 sale of our Mexico operation of $5 million and $40 million for the twelve months ended October 3, 2026 and the three and twelve months ended September 27, 2025, respectively. 2 Includes severance costs and other one-time payments associated with the executive leadership transition announced in the third quarter of fiscal 2026. 3 The impact of the additional week in the fourth quarter and twelve months of fiscal 2026 was calculated by dividing the fourth quarter adjusted results, prior to adjustment for the additional week, by 14 weeks. Additionally, the calculation of the impact of the additional week in the fourth quarter and twelve months of fiscal 2026 on Sales excluded the fourth quarter legal contingency accruals recognized as a reduction to Sales of $100 million, $10 million and $110 million for the Beef and Pork segments and Total Company, respectively, as they were not impacted by the extra week. 4 Relates to a fire at a Chicken production facility in the fourth quarter of fiscal 2021, and a fire at our production facil ity in the Netherlands in the first quarter of fiscal 2024 that we subsequently decided to sell. 5 Includes the China plant relocation remuneration and related EPS impact, net of $1 million associated with Net Income (Loss) Attributable to Noncontrolling Interests. Results for the twelve months ended October 3, 2026 Segment Operating Income (Loss) Operating Income (Loss) Beef Pork Chicken Prepared Foods International Total Corporate Expenses Amortization Total As Reported $ (1,215) $ 137 $ 1,749 $ 1,326 $ 179 $ 2,176 $ (856) $ (220) $ 1,100 Add: Restructuring and related charges 358 22 12 31 — 423 6 — 429 Add: Legal contingency accruals1 190 70 128 — 5 393 — — 393 Add: Executive leadership transition charges2 — — — — — — 83 — 83 As Adjusted prior to adjustment for additional week $ (667) $ 229 $ 1,889 $ 1,357 $ 184 $ 2,992 $ (767) $ (220) $ 2,005 Less: Impact of additional week3 13 (1) (30) (25) (4) (47) 15 4 (28) As Adjusted $ (654) $ 228 $ 1,859 $ 1,332 $ 180 $ 2,945 $ (752) $ (216) $ 1,977 Results for the twelve months ended September 27, 2025 Segment Operating Income (Loss) Operating Income (Loss) Beef Pork Chicken Prepared Foods International Total Corporate Expenses Amortization Total As Reported $ (984) $ (141) $ 1,860 $ 1,248 $ 155 $ 2,138 $ (783) $ (257) $ 1,098 Less: Facility fire related costs (insurance proceeds)4 — — — — (18) (18) — — (18) Add: Brand and product line discontinuations — — — — — — — 23 23 Add/(Less): Restructuring and related charges (gain) 48 — 9 (26) 14 45 — — 45 Add: Legal contingency accruals1 318 380 — — 40 738 — — 738 Add/(Less): Plant closure and disposal charges5 — — 23 — (6) 17 — — 17 Add: Goodwill and intangible impairments 343 — — — — 343 — — 343 Add: Product recall — — — 41 — 41 — — 41 As Adjusted $ (275) $ 239 $ 1,892 $ 1,263 $ 185 $ 3,304 $ (783) $ (234) $ 2,287
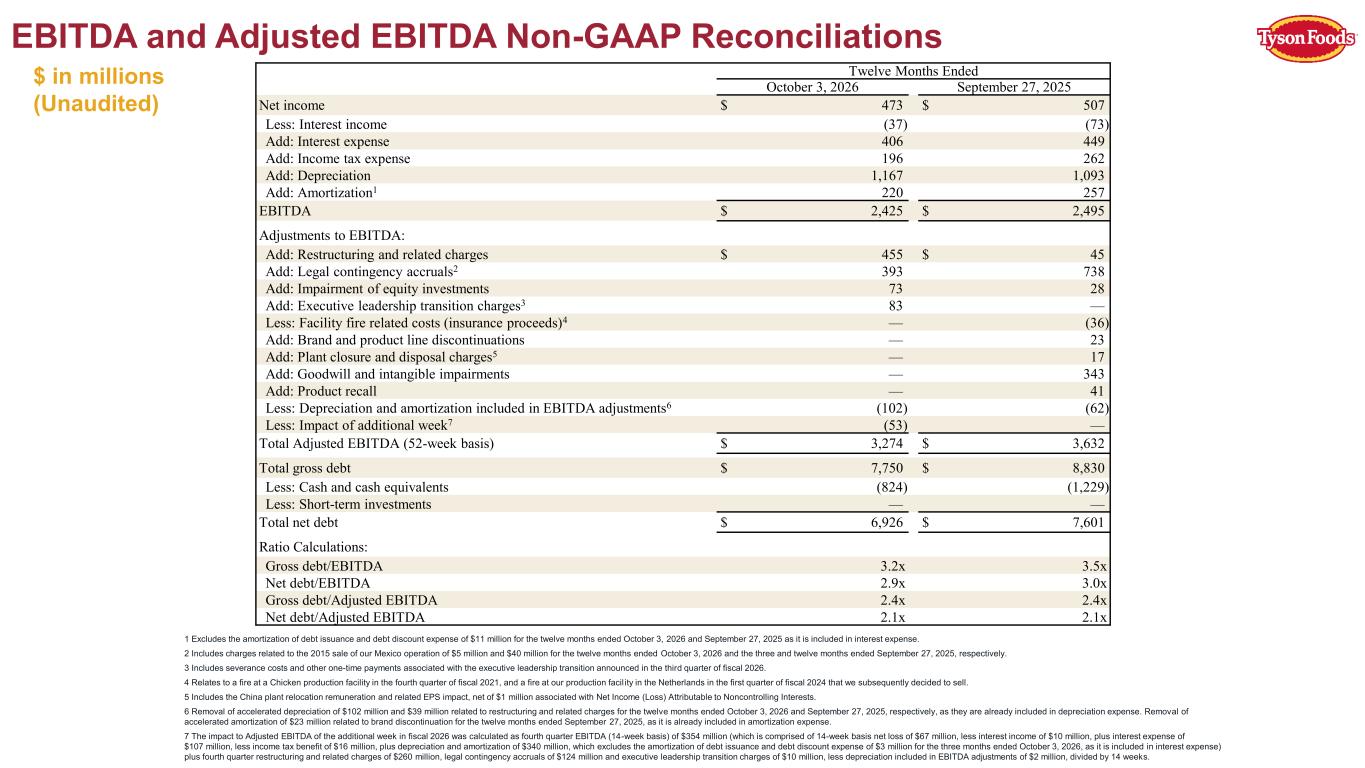
1 Excludes the amortization of debt issuance and debt discount expense of $11 million for the twelve months ended October 3, 2026 and September 27, 2025 as it is included in interest expense. 2 Includes charges related to the 2015 sale of our Mexico operation of $5 million and $40 million for the twelve months ended October 3, 2026 and the three and twelve months ended September 27, 2025, respectively. 3 Includes severance costs and other one-time payments associated with the executive leadership transition announced in the third quarter of fiscal 2026. 4 Relates to a fire at a Chicken production facility in the fourth quarter of fiscal 2021, and a fire at our production facil ity in the Netherlands in the first quarter of fiscal 2024 that we subsequently decided to sell. 5 Includes the China plant relocation remuneration and related EPS impact, net of $1 million associated with Net Income (Loss) Attributable to Noncontrolling Interests. 6 Removal of accelerated depreciation of $102 million and $39 million related to restructuring and related charges for the twelve months ended October 3, 2026 and September 27, 2025, respectively, as they are already included in depreciation expense. Removal of accelerated amortization of $23 million related to brand discontinuation for the twelve months ended September 27, 2025, as it is already included in amortization expense. 7 The impact to Adjusted EBITDA of the additional week in fiscal 2026 was calculated as fourth quarter EBITDA (14-week basis) of $354 million (which is comprised of 14-week basis net loss of $67 million, less interest income of $10 million, plus interest expense of $107 million, less income tax benefit of $16 million, plus depreciation and amortization of $340 million, which excludes the amortization of debt issuance and debt discount expense of $3 million for the three months ended October 3, 2026, as it is included in interest expense) plus fourth quarter restructuring and related charges of $260 million, legal contingency accruals of $124 million and executive leadership transition charges of $10 million, less depreciation included in EBITDA adjustments of $2 million, divided by 14 weeks. EBITDA and Adjusted EBITDA Non-GAAP Reconciliations $ in millions (Unaudited) Twelve Months Ended October 3, 2026 September 27, 2025 Net income $ 473 $ 507 Less: Interest income (37) (73) Add: Interest expense 406 449 Add: Income tax expense 196 262 Add: Depreciation 1,167 1,093 Add: Amortization1 220 257 EBITDA $ 2,425 $ 2,495 Adjustments to EBITDA: Add: Restructuring and related charges $ 455 $ 45 Add: Legal contingency accruals2 393 738 Add: Impairment of equity investments 73 28 Add: Executive leadership transition charges3 83 — Less: Facility fire related costs (insurance proceeds)4 — (36) Add: Brand and product line discontinuations — 23 Add: Plant closure and disposal charges5 — 17 Add: Goodwill and intangible impairments — 343 Add: Product recall — 41 Less: Depreciation and amortization included in EBITDA adjustments6 (102) (62) Less: Impact of additional week7 (53) — Total Adjusted EBITDA (52-week basis) $ 3,274 $ 3,632 Total gross debt $ 7,750 $ 8,830 Less: Cash and cash equivalents (824) (1,229) Less: Short-term investments — — Total net debt $ 6,926 $ 7,601 Ratio Calculations: Gross debt/EBITDA 3.2x 3.5x Net debt/EBITDA 2.9x 3.0x Gross debt/Adjusted EBITDA 2.4x 2.4x Net debt/Adjusted EBITDA 2.1x 2.1x
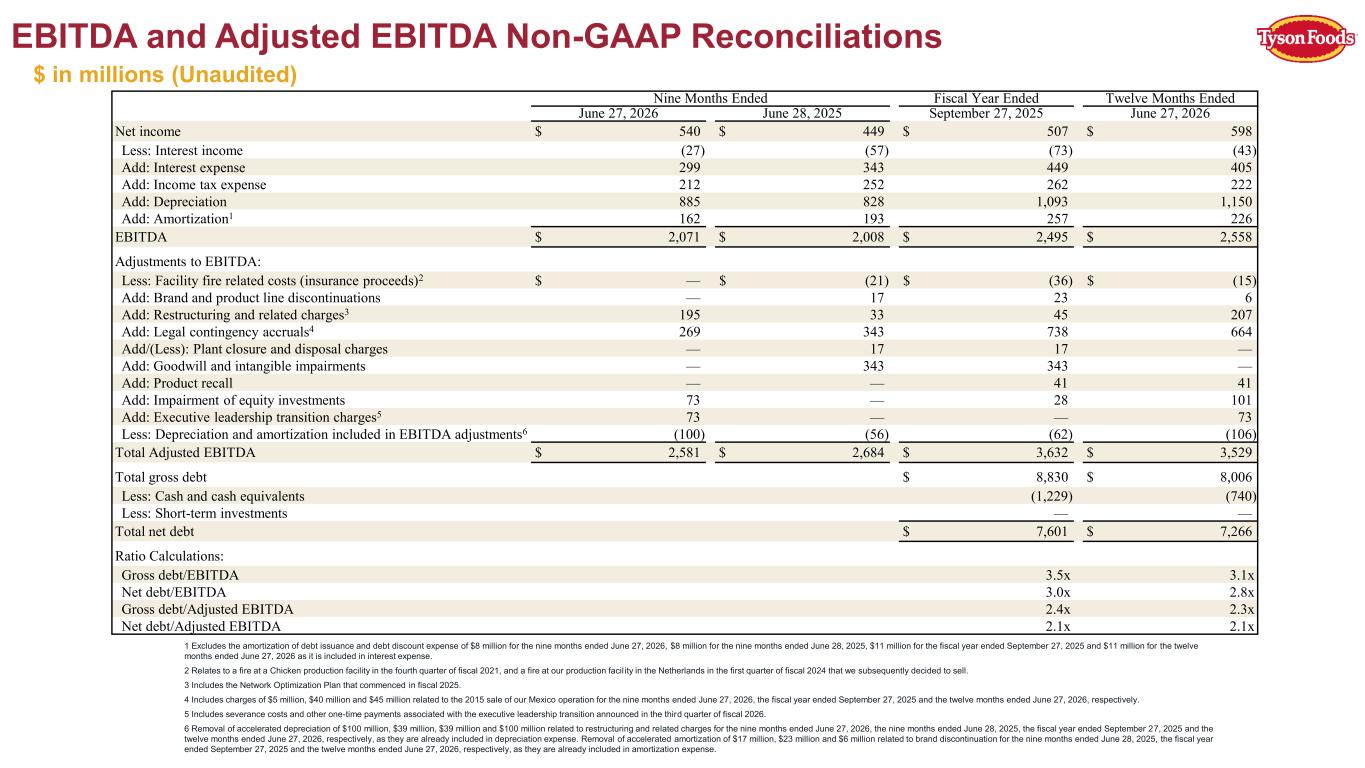
1 Excludes the amortization of debt issuance and debt discount expense of $8 million for the nine months ended June 27, 2026, $8 million for the nine months ended June 28, 2025, $11 million for the fiscal year ended September 27, 2025 and $11 million for the twelve months ended June 27, 2026 as it is included in interest expense. 2 Relates to a fire at a Chicken production facility in the fourth quarter of fiscal 2021, and a fire at our production facil ity in the Netherlands in the first quarter of fiscal 2024 that we subsequently decided to sell. 3 Includes the Network Optimization Plan that commenced in fiscal 2025. 4 Includes charges of $5 million, $40 million and $45 million related to the 2015 sale of our Mexico operation for the nine months ended June 27, 2026, the fiscal year ended September 27, 2025 and the twelve months ended June 27, 2026, respectively. 5 Includes severance costs and other one-time payments associated with the executive leadership transition announced in the third quarter of fiscal 2026. 6 Removal of accelerated depreciation of $100 million, $39 million, $39 million and $100 million related to restructuring and related charges for the nine months ended June 27, 2026, the nine months ended June 28, 2025, the fiscal year ended September 27, 2025 and the twelve months ended June 27, 2026, respectively, as they are already included in depreciation expense. Removal of accelerated amortization of $17 million, $23 million and $6 million related to brand discontinuation for the nine months ended June 28, 2025, the fiscal year ended September 27, 2025 and the twelve months ended June 27, 2026, respectively, as they are already included in amortization expense. EBITDA and Adjusted EBITDA Non-GAAP Reconciliations $ in millions (Unaudited) Nine Months Ended Fiscal Year Ended Twelve Months Ended June 27, 2026 June 28, 2025 September 27, 2025 June 27, 2026 Net income $ 540 $ 449 $ 507 $ 598 Less: Interest income (27) (57) (73) (43) Add: Interest expense 299 343 449 405 Add: Income tax expense 212 252 262 222 Add: Depreciation 885 828 1,093 1,150 Add: Amortization1 162 193 257 226 EBITDA $ 2,071 $ 2,008 $ 2,495 $ 2,558 Adjustments to EBITDA: Less: Facility fire related costs (insurance proceeds)2 $ — $ (21) $ (36) $ (15) Add: Brand and product line discontinuations — 17 23 6 Add: Restructuring and related charges3 195 33 45 207 Add: Legal contingency accruals4 269 343 738 664 Add/(Less): Plant closure and disposal charges — 17 17 — Add: Goodwill and intangible impairments — 343 343 — Add: Product recall — — 41 41 Add: Impairment of equity investments 73 — 28 101 Add: Executive leadership transition charges5 73 — — 73 Less: Depreciation and amortization included in EBITDA adjustments6 (100) (56) (62) (106) Total Adjusted EBITDA $ 2,581 $ 2,684 $ 3,632 $ 3,529 Total gross debt $ 8,830 $ 8,006 Less: Cash and cash equivalents (1,229) (740) Less: Short-term investments — — Total net debt $ 7,601 $ 7,266 Ratio Calculations: Gross debt/EBITDA 3.5x 3.1x Net debt/EBITDA 3.0x 2.8x Gross debt/Adjusted EBITDA 2.4x 2.3x Net debt/Adjusted EBITDA 2.1x 2.1x
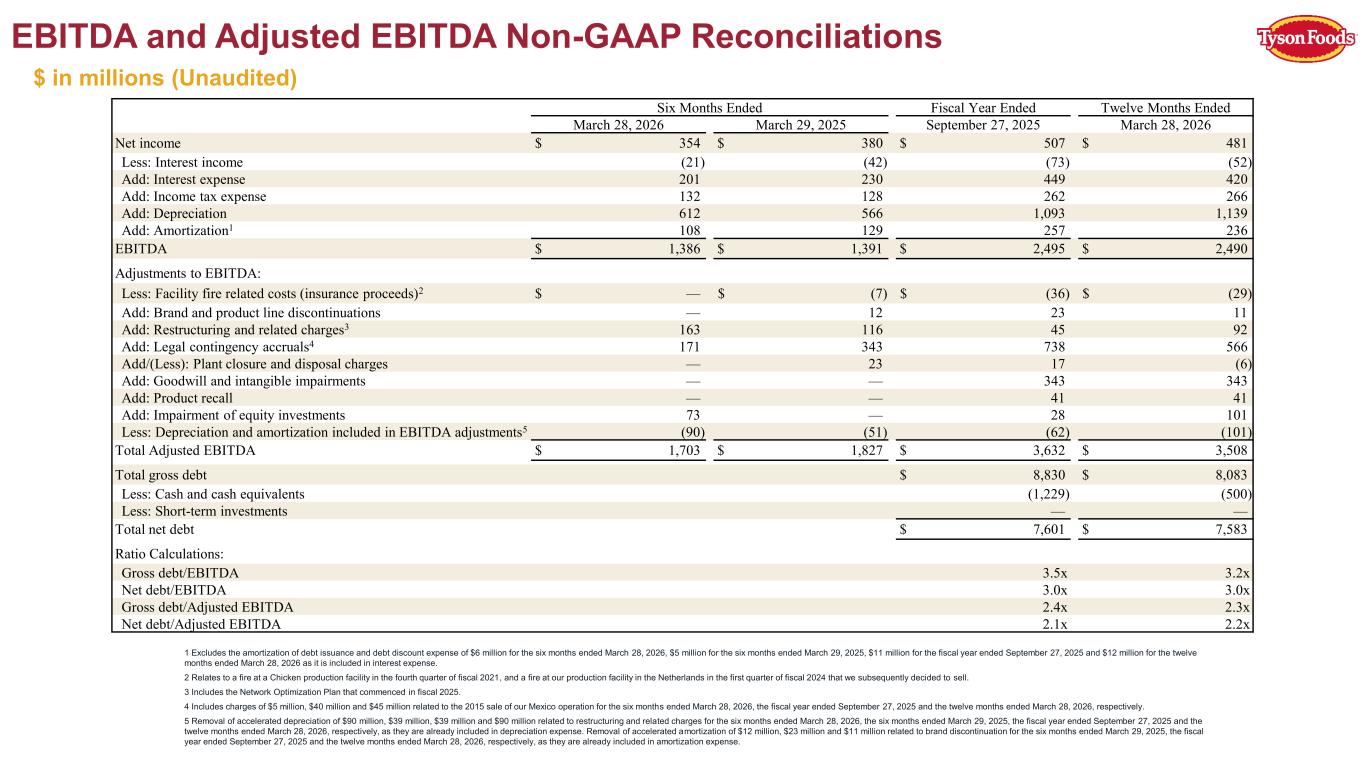
1 Excludes the amortization of debt issuance and debt discount expense of $6 million for the six months ended March 28, 2026, $5 million for the six months ended March 29, 2025, $11 million for the fiscal year ended September 27, 2025 and $12 million for the twelve months ended March 28, 2026 as it is included in interest expense. 2 Relates to a fire at a Chicken production facility in the fourth quarter of fiscal 2021, and a fire at our production facility in the Netherlands in the first quarter of fiscal 2024 that we subsequently decided to sell. 3 Includes the Network Optimization Plan that commenced in fiscal 2025. 4 Includes charges of $5 million, $40 million and $45 million related to the 2015 sale of our Mexico operation for the six months ended March 28, 2026, the fiscal year ended September 27, 2025 and the twelve months ended March 28, 2026, respectively. 5 Removal of accelerated depreciation of $90 million, $39 million, $39 million and $90 million related to restructuring and related charges for the six months ended March 28, 2026, the six months ended March 29, 2025, the fiscal year ended September 27, 2025 and the twelve months ended March 28, 2026, respectively, as they are already included in depreciation expense. Removal of accelerated amortization of $12 million, $23 million and $11 million related to brand discontinuation for the six months ended March 29, 2025, the fiscal year ended September 27, 2025 and the twelve months ended March 28, 2026, respectively, as they are already included in amortization expense. EBITDA and Adjusted EBITDA Non-GAAP Reconciliations $ in millions (Unaudited) Six Months Ended Fiscal Year Ended Twelve Months Ended March 28, 2026 March 29, 2025 September 27, 2025 March 28, 2026 Net income $ 354 $ 380 $ 507 $ 481 Less: Interest income (21) (42) (73) (52) Add: Interest expense 201 230 449 420 Add: Income tax expense 132 128 262 266 Add: Depreciation 612 566 1,093 1,139 Add: Amortization1 108 129 257 236 EBITDA $ 1,386 $ 1,391 $ 2,495 $ 2,490 Adjustments to EBITDA: Less: Facility fire related costs (insurance proceeds)2 $ — $ (7) $ (36) $ (29) Add: Brand and product line discontinuations — 12 23 11 Add: Restructuring and related charges3 163 116 45 92 Add: Legal contingency accruals4 171 343 738 566 Add/(Less): Plant closure and disposal charges — 23 17 (6) Add: Goodwill and intangible impairments — — 343 343 Add: Product recall — — 41 41 Add: Impairment of equity investments 73 — 28 101 Less: Depreciation and amortization included in EBITDA adjustments5 (90) (51) (62) (101) Total Adjusted EBITDA $ 1,703 $ 1,827 $ 3,632 $ 3,508 Total gross debt $ 8,830 $ 8,083 Less: Cash and cash equivalents (1,229) (500) Less: Short-term investments — — Total net debt $ 7,601 $ 7,583 Ratio Calculations: Gross debt/EBITDA 3.5x 3.2x Net debt/EBITDA 3.0x 3.0x Gross debt/Adjusted EBITDA 2.4x 2.3x Net debt/Adjusted EBITDA 2.1x 2.2x
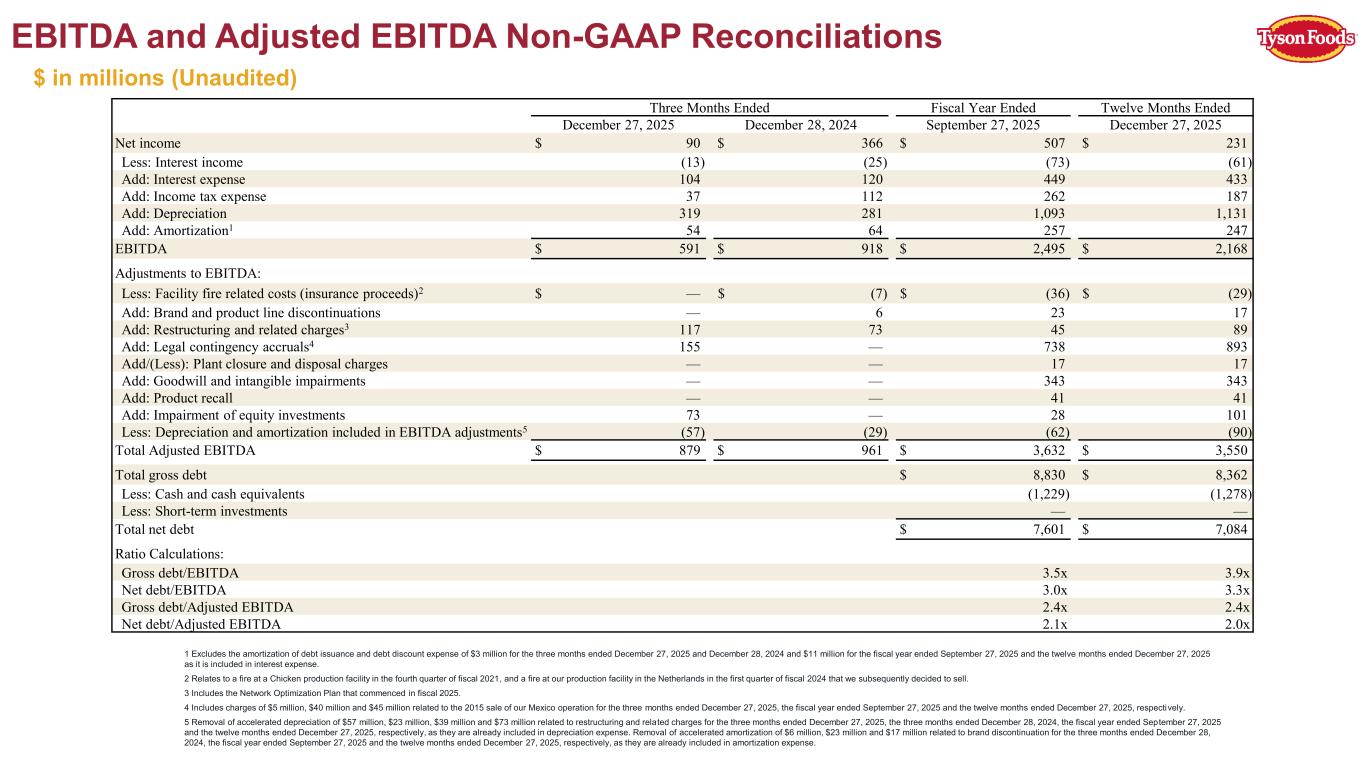
1 Excludes the amortization of debt issuance and debt discount expense of $3 million for the three months ended December 27, 2025 and December 28, 2024 and $11 million for the fiscal year ended September 27, 2025 and the twelve months ended December 27, 2025 as it is included in interest expense. 2 Relates to a fire at a Chicken production facility in the fourth quarter of fiscal 2021, and a fire at our production facility in the Netherlands in the first quarter of fiscal 2024 that we subsequently decided to sell. 3 Includes the Network Optimization Plan that commenced in fiscal 2025. 4 Includes charges of $5 million, $40 million and $45 million related to the 2015 sale of our Mexico operation for the three months ended December 27, 2025, the fiscal year ended September 27, 2025 and the twelve months ended December 27, 2025, respectively. 5 Removal of accelerated depreciation of $57 million, $23 million, $39 million and $73 million related to restructuring and related charges for the three months ended December 27, 2025, the three months ended December 28, 2024, the fiscal year ended September 27, 2025 and the twelve months ended December 27, 2025, respectively, as they are already included in depreciation expense. Removal of accelerated amortization of $6 million, $23 million and $17 million related to brand discontinuation for the three months ended December 28, 2024, the fiscal year ended September 27, 2025 and the twelve months ended December 27, 2025, respectively, as they are already included in amortization expense. EBITDA and Adjusted EBITDA Non-GAAP Reconciliations $ in millions (Unaudited) Three Months Ended Fiscal Year Ended Twelve Months Ended December 27, 2025 December 28, 2024 September 27, 2025 December 27, 2025 Net income $ 90 $ 366 $ 507 $ 231 Less: Interest income (13) (25) (73) (61) Add: Interest expense 104 120 449 433 Add: Income tax expense 37 112 262 187 Add: Depreciation 319 281 1,093 1,131 Add: Amortization1 54 64 257 247 EBITDA $ 591 $ 918 $ 2,495 $ 2,168 Adjustments to EBITDA: Less: Facility fire related costs (insurance proceeds)2 $ — $ (7) $ (36) $ (29) Add: Brand and product line discontinuations — 6 23 17 Add: Restructuring and related charges3 117 73 45 89 Add: Legal contingency accruals4 155 — 738 893 Add/(Less): Plant closure and disposal charges — — 17 17 Add: Goodwill and intangible impairments — — 343 343 Add: Product recall — — 41 41 Add: Impairment of equity investments 73 — 28 101 Less: Depreciation and amortization included in EBITDA adjustments5 (57) (29) (62) (90) Total Adjusted EBITDA $ 879 $ 961 $ 3,632 $ 3,550 Total gross debt $ 8,830 $ 8,362 Less: Cash and cash equivalents (1,229) (1,278) Less: Short-term investments — — Total net debt $ 7,601 $ 7,084 Ratio Calculations: Gross debt/EBITDA 3.5x 3.9x Net debt/EBITDA 3.0x 3.3x Gross debt/Adjusted EBITDA 2.4x 2.4x Net debt/Adjusted EBITDA 2.1x 2.0x
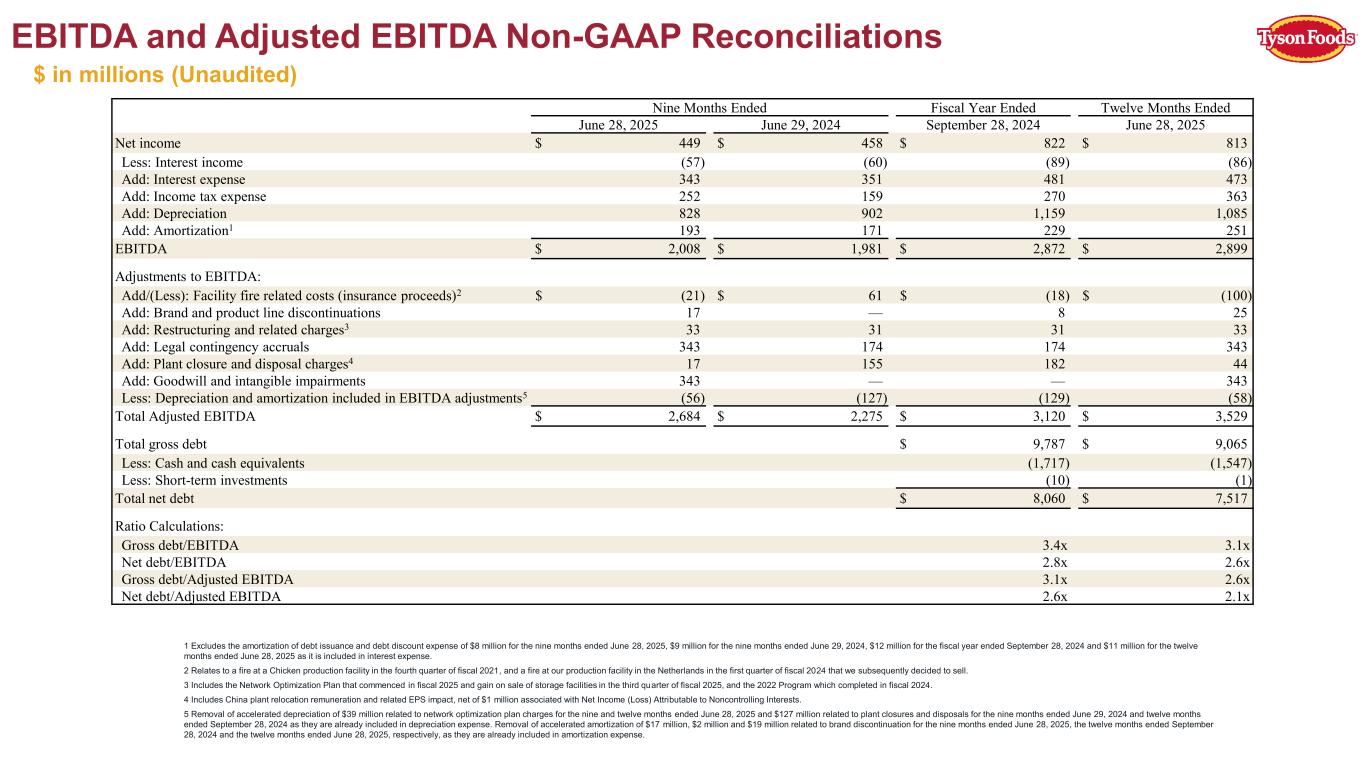
1 Excludes the amortization of debt issuance and debt discount expense of $8 million for the nine months ended June 28, 2025, $9 million for the nine months ended June 29, 2024, $12 million for the fiscal year ended September 28, 2024 and $11 million for the twelve months ended June 28, 2025 as it is included in interest expense. 2 Relates to a fire at a Chicken production facility in the fourth quarter of fiscal 2021, and a fire at our production facility in the Netherlands in the first quarter of fiscal 2024 that we subsequently decided to sell. 3 Includes the Network Optimization Plan that commenced in fiscal 2025 and gain on sale of storage facilities in the third quarter of fiscal 2025, and the 2022 Program which completed in fiscal 2024. 4 Includes China plant relocation remuneration and related EPS impact, net of $1 million associated with Net Income (Loss) Attributable to Noncontrolling Interests. 5 Removal of accelerated depreciation of $39 million related to network optimization plan charges for the nine and twelve months ended June 28, 2025 and $127 million related to plant closures and disposals for the nine months ended June 29, 2024 and twelve months ended September 28, 2024 as they are already included in depreciation expense. Removal of accelerated amortization of $17 million, $2 million and $19 million related to brand discontinuation for the nine months ended June 28, 2025, the twelve months ended September 28, 2024 and the twelve months ended June 28, 2025, respectively, as they are already included in amortization expense. EBITDA and Adjusted EBITDA Non-GAAP Reconciliations $ in millions (Unaudited) Nine Months Ended Fiscal Year Ended Twelve Months Ended June 28, 2025 June 29, 2024 September 28, 2024 June 28, 2025 Net income $ 449 $ 458 $ 822 $ 813 Less: Interest income (57) (60) (89) (86) Add: Interest expense 343 351 481 473 Add: Income tax expense 252 159 270 363 Add: Depreciation 828 902 1,159 1,085 Add: Amortization1 193 171 229 251 EBITDA $ 2,008 $ 1,981 $ 2,872 $ 2,899 Adjustments to EBITDA: Add/(Less): Facility fire related costs (insurance proceeds)2 $ (21) $ 61 $ (18) $ (100) Add: Brand and product line discontinuations 17 — 8 25 Add: Restructuring and related charges3 33 31 31 33 Add: Legal contingency accruals 343 174 174 343 Add: Plant closure and disposal charges4 17 155 182 44 Add: Goodwill and intangible impairments 343 — — 343 Less: Depreciation and amortization included in EBITDA adjustments5 (56) (127) (129) (58) Total Adjusted EBITDA $ 2,684 $ 2,275 $ 3,120 $ 3,529 Total gross debt $ 9,787 $ 9,065 Less: Cash and cash equivalents (1,717) (1,547) Less: Short-term investments (10) (1) Total net debt $ 8,060 $ 7,517 Ratio Calculations: Gross debt/EBITDA 3.4x 3.1x Net debt/EBITDA 2.8x 2.6x Gross debt/Adjusted EBITDA 3.1x 2.6x Net debt/Adjusted EBITDA 2.6x 2.1x
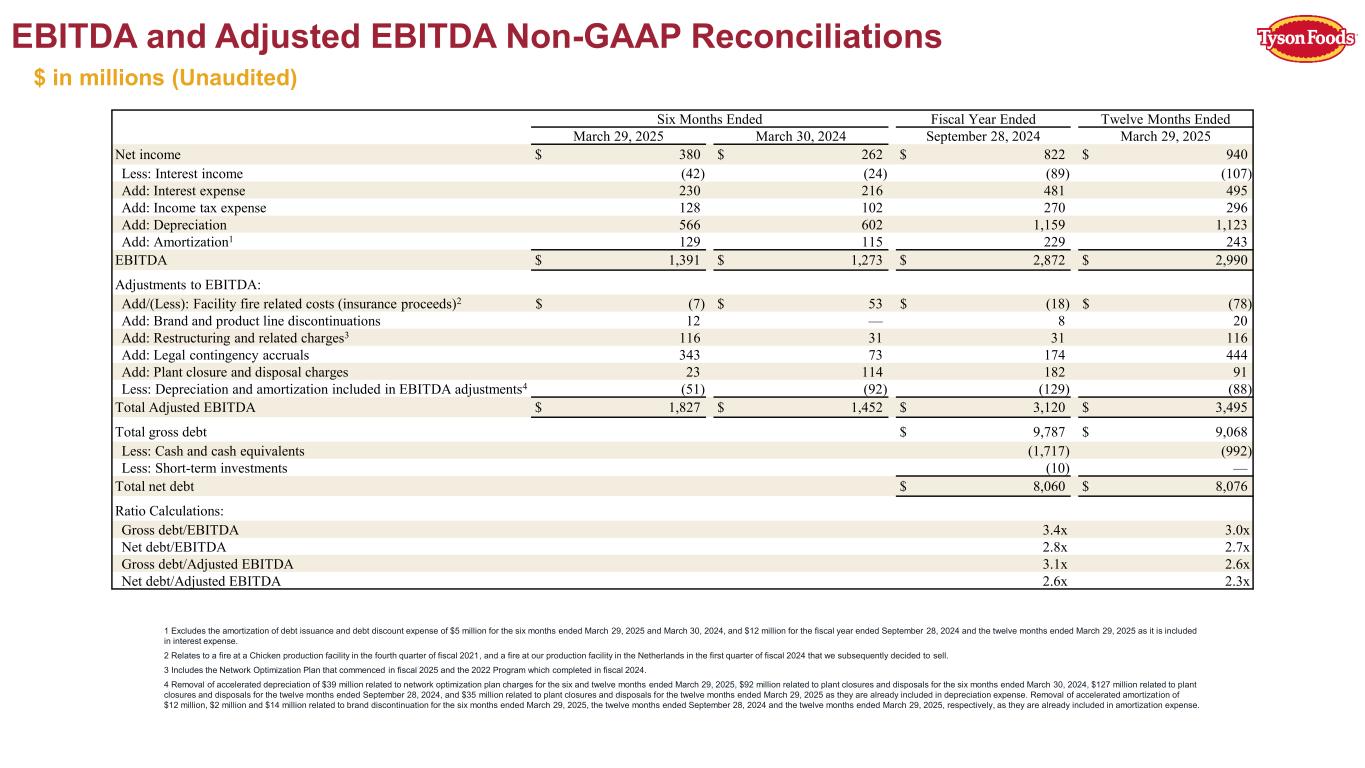
1 Excludes the amortization of debt issuance and debt discount expense of $5 million for the six months ended March 29, 2025 and March 30, 2024, and $12 million for the fiscal year ended September 28, 2024 and the twelve months ended March 29, 2025 as it is included in interest expense. 2 Relates to a fire at a Chicken production facility in the fourth quarter of fiscal 2021, and a fire at our production facility in the Netherlands in the first quarter of fiscal 2024 that we subsequently decided to sell. 3 Includes the Network Optimization Plan that commenced in fiscal 2025 and the 2022 Program which completed in fiscal 2024. 4 Removal of accelerated depreciation of $39 million related to network optimization plan charges for the six and twelve months ended March 29, 2025, $92 million related to plant closures and disposals for the six months ended March 30, 2024, $127 million related to plant closures and disposals for the twelve months ended September 28, 2024, and $35 million related to plant closures and disposals for the twelve months ended March 29, 2025 as they are already included in depreciation expense. Removal of accelerated amortization of $12 million, $2 million and $14 million related to brand discontinuation for the six months ended March 29, 2025, the twelve months ended September 28, 2024 and the twelve months ended March 29, 2025, respectively, as they are already included in amortization expense. EBITDA and Adjusted EBITDA Non-GAAP Reconciliations $ in millions (Unaudited) Six Months Ended Fiscal Year Ended Twelve Months Ended March 29, 2025 March 30, 2024 September 28, 2024 March 29, 2025 Net income $ 380 $ 262 $ 822 $ 940 Less: Interest income (42) (24) (89) (107) Add: Interest expense 230 216 481 495 Add: Income tax expense 128 102 270 296 Add: Depreciation 566 602 1,159 1,123 Add: Amortization1 129 115 229 243 EBITDA $ 1,391 $ 1,273 $ 2,872 $ 2,990 Adjustments to EBITDA: Add/(Less): Facility fire related costs (insurance proceeds)2 $ (7) $ 53 $ (18) $ (78) Add: Brand and product line discontinuations 12 — 8 20 Add: Restructuring and related charges3 116 31 31 116 Add: Legal contingency accruals 343 73 174 444 Add: Plant closure and disposal charges 23 114 182 91 Less: Depreciation and amortization included in EBITDA adjustments4 (51) (92) (129) (88) Total Adjusted EBITDA $ 1,827 $ 1,452 $ 3,120 $ 3,495 Total gross debt $ 9,787 $ 9,068 Less: Cash and cash equivalents (1,717) (992) Less: Short-term investments (10) — Total net debt $ 8,060 $ 8,076 Ratio Calculations: Gross debt/EBITDA 3.4x 3.0x Net debt/EBITDA 2.8x 2.7x Gross debt/Adjusted EBITDA 3.1x 2.6x Net debt/Adjusted EBITDA 2.6x 2.3x
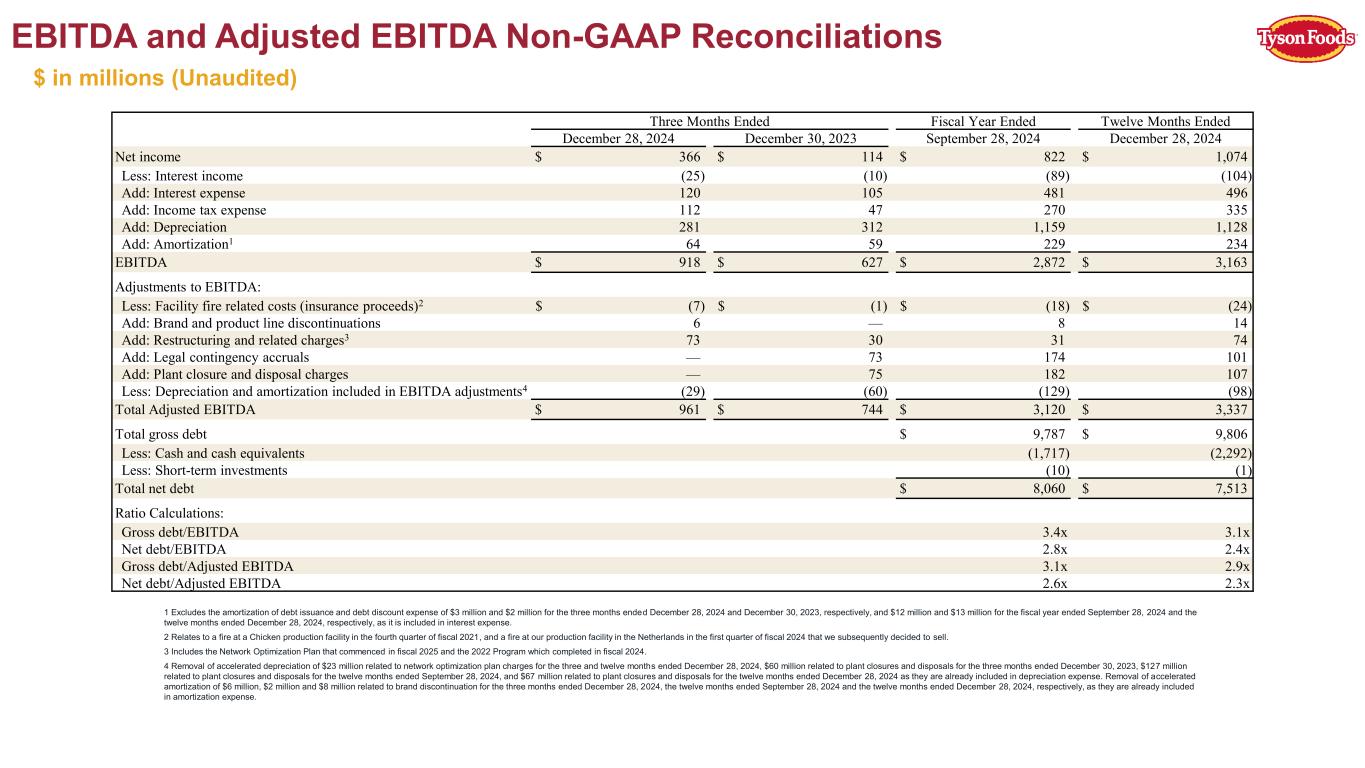
1 Excludes the amortization of debt issuance and debt discount expense of $3 million and $2 million for the three months ended December 28, 2024 and December 30, 2023, respectively, and $12 million and $13 million for the fiscal year ended September 28, 2024 and the twelve months ended December 28, 2024, respectively, as it is included in interest expense. 2 Relates to a fire at a Chicken production facility in the fourth quarter of fiscal 2021, and a fire at our production facility in the Netherlands in the first quarter of fiscal 2024 that we subsequently decided to sell. 3 Includes the Network Optimization Plan that commenced in fiscal 2025 and the 2022 Program which completed in fiscal 2024. 4 Removal of accelerated depreciation of $23 million related to network optimization plan charges for the three and twelve months ended December 28, 2024, $60 million related to plant closures and disposals for the three months ended December 30, 2023, $127 million related to plant closures and disposals for the twelve months ended September 28, 2024, and $67 million related to plant closures and disposals for the twelve months ended December 28, 2024 as they are already included in depreciation expense. Removal of accelerated amortization of $6 million, $2 million and $8 million related to brand discontinuation for the three months ended December 28, 2024, the twelve months ended September 28, 2024 and the twelve months ended December 28, 2024, respectively, as they are already included in amortization expense. EBITDA and Adjusted EBITDA Non-GAAP Reconciliations $ in millions (Unaudited) Three Months Ended Fiscal Year Ended Twelve Months Ended December 28, 2024 December 30, 2023 September 28, 2024 December 28, 2024 Net income $ 366 $ 114 $ 822 $ 1,074 Less: Interest income (25) (10) (89) (104) Add: Interest expense 120 105 481 496 Add: Income tax expense 112 47 270 335 Add: Depreciation 281 312 1,159 1,128 Add: Amortization1 64 59 229 234 EBITDA $ 918 $ 627 $ 2,872 $ 3,163 Adjustments to EBITDA: Less: Facility fire related costs (insurance proceeds)2 $ (7) $ (1) $ (18) $ (24) Add: Brand and product line discontinuations 6 — 8 14 Add: Restructuring and related charges3 73 30 31 74 Add: Legal contingency accruals — 73 174 101 Add: Plant closure and disposal charges — 75 182 107 Less: Depreciation and amortization included in EBITDA adjustments4 (29) (60) (129) (98) Total Adjusted EBITDA $ 961 $ 744 $ 3,120 $ 3,337 Total gross debt $ 9,787 $ 9,806 Less: Cash and cash equivalents (1,717) (2,292) Less: Short-term investments (10) (1) Total net debt $ 8,060 $ 7,513 Ratio Calculations: Gross debt/EBITDA 3.4x 3.1x Net debt/EBITDA 2.8x 2.4x Gross debt/Adjusted EBITDA 3.1x 2.9x Net debt/Adjusted EBITDA 2.6x 2.3x
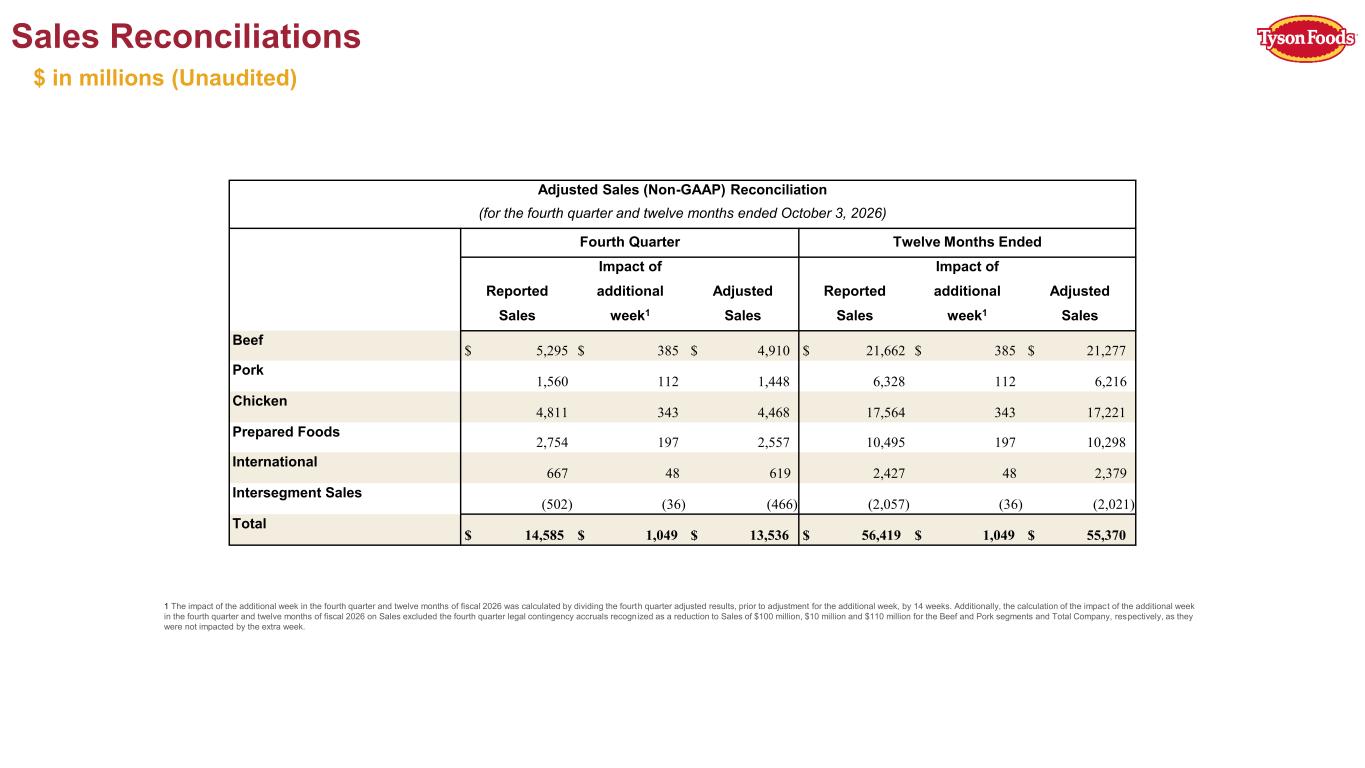
Sales Reconciliations $ in millions (Unaudited) Adjusted Sales (Non-GAAP) Reconciliation (for the fourth quarter and twelve months ended October 3, 2026) Fourth Quarter Twelve Months Ended Impact of Impact of Reported additional Adjusted Reported additional Adjusted Sales week1 Sales Sales week1 Sales Beef $ 5,295 $ 385 $ 4,910 $ 21,662 $ 385 $ 21,277 Pork 1,560 112 1,448 6,328 112 6,216 Chicken 4,811 343 4,468 17,564 343 17,221 Prepared Foods 2,754 197 2,557 10,495 197 10,298 International 667 48 619 2,427 48 2,379 Intersegment Sales (502) (36) (466) (2,057) (36) (2,021) Total $ 14,585 $ 1,049 $ 13,536 $ 56,419 $ 1,049 $ 55,370 1 The impact of the additional week in the fourth quarter and twelve months of fiscal 2026 was calculated by dividing the fourth quarter adjusted results, prior to adjustment for the additional week, by 14 weeks. Additionally, the calculation of the impact of the additional week in the fourth quarter and twelve months of fiscal 2026 on Sales excluded the fourth quarter legal contingency accruals recognized as a reduction to Sales of $100 million, $10 million and $110 million for the Beef and Pork segments and Total Company, respectively, as they were not impacted by the extra week.
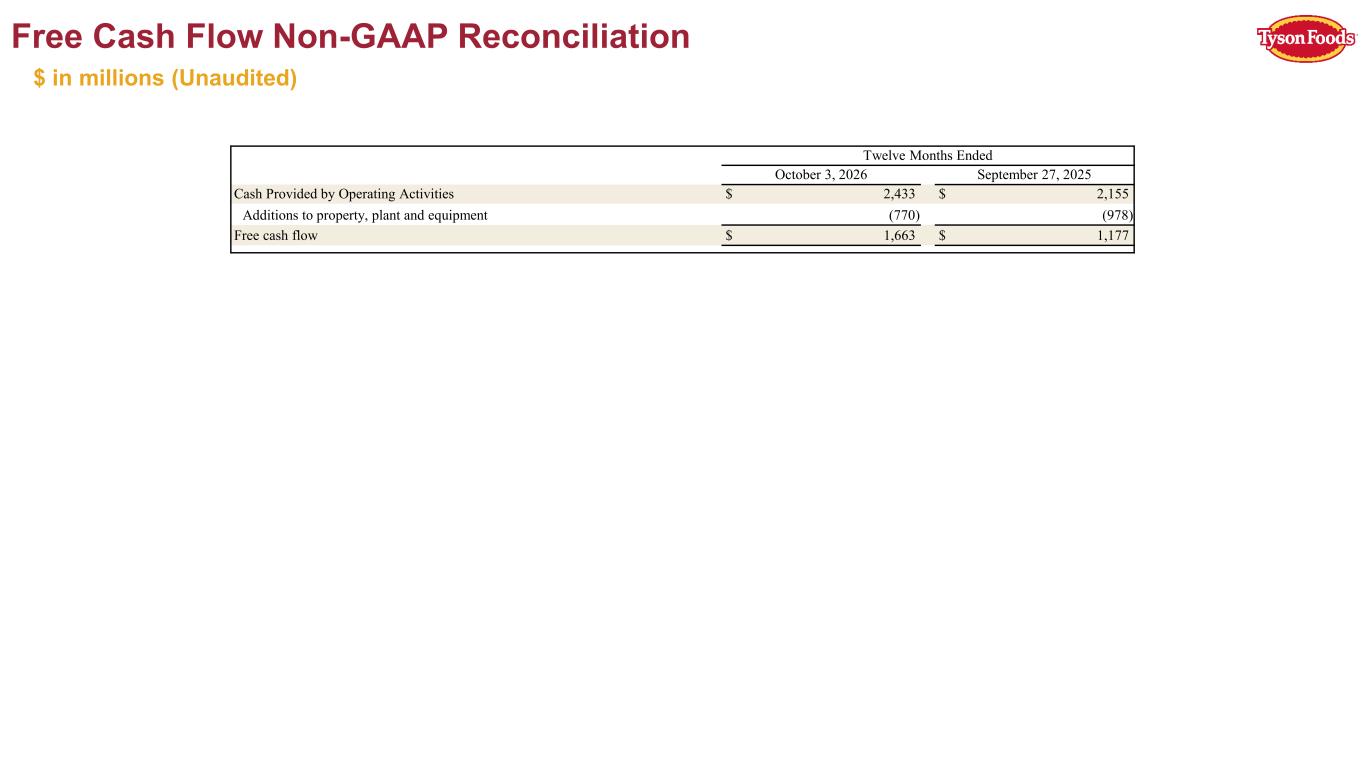
Free Cash Flow Non-GAAP Reconciliation $ in millions (Unaudited) Twelve Months Ended October 3, 2026 September 27, 2025 Cash Provided by Operating Activities $ 2,433 $ 2,155 Additions to property, plant and equipment (770) (978) Free cash flow $ 1,663 $ 1,177
Recast of Historical Segment Operating Income Historical segment recast financials are available on our IR website (https://ir.tyson.com), including quarterly reconciliations for fiscal years 2023–2025 from Segment Operating Income, as reported, to Operating Income, and from Segment Operating Income, as adjusted (non-GAAP), to Adjusted Operating Income (non-GAAP).