
Exhibit 99.2
November 2026 Lument Finance Trust Q3 2026 Earnings Supplemental
Disclaimer 2 This presentation contains forward - looking statements within the meaning of Section 27A of the Securities Act of 1933, as amended, and Section 21E of the Securities Exchange Act of 1934, as amended, which reflect the current views of Lument Finance Trust, Inc. (NYSE: LFT) (“LFT,” the “Company,” “we,” “our,” or “us”) with respect to, among other things, the Company’s operations and financial performance. You can identify these forward - looking statements by the use of words such as “outlook,” “indicator,” “believes,” “expects,” “potential,” “continues,” “may,” “will,” “should,” “seeks,” “approximately,” “predicts,” “projects,” “intends,” “plans,” “estimates,” or “anticipates,” or the negative version of these words or other comparable words or other statements that do not relate strictly to historical or factual matters. Such forward - looking statements are subject to various risks and uncertainties. Accordingly, there are or will be important factors that could cause actual outcomes or results to differ materially from those indicated in these statements. These factors include but are not limited to those described under the section entitled “Risk Factors” in its Annual Report on Form 10 - K for the year ended December 31, 2025 and Part II, Item 1A “Risk Factors” in the Company’s Quarterly Report on Form 10 - Q for the quarter ended June 30, 2026, which are available on the SEC’s website at www.sec.gov , and/or as disclosed in any subsequent filings. These factors should not be construed as exhaustive and should be read in conjunction with the other cautionary statements that are included in this presentation and in the filings. The forward - looking statements contained in this presentation speak only as of November 13, 2026. The Company assumes no obligation to update or supplement forward-looking statements that become untrue because of subsequent events or circumstances. This presentation includes non - GAAP financial measures, including Distributable Earnings. While we believe the non - GAAP information included in this presentation provides supplemental information to assist investors in analyzing our operating results and comparing our operating results with other peer issuers, these measures are not in accordance with GAAP, and they should not be considered a substitute for, or superior to, our financial information calculated in accordance with GAAP. Please refer to this presentation’s Appendix for a reconciliation of the non - GAAP financial measures included in this presentation to the most directly comparable financial measures prepared in accordance with GAAP.
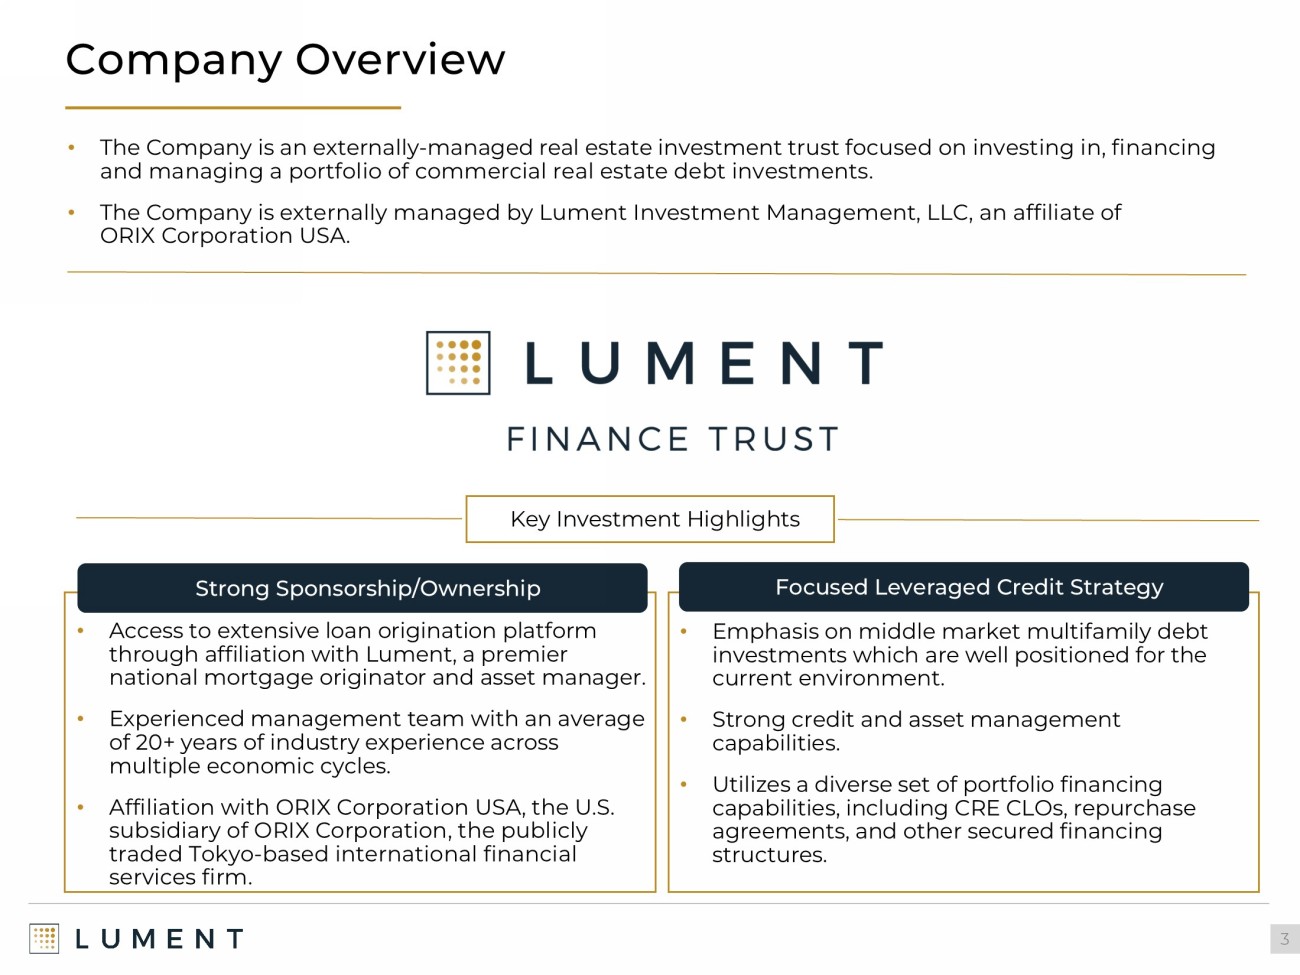
Company Overview 3 Key Investment Highlights Strong Sponsorship/Ownership • Access to extensive loan origination platform through affiliation with Lument, a premier national mortgage originator and asset manager. • Experienced management team with an average of 20+ years of industry experience across multiple economic cycles. • Affiliation with ORIX Corporation USA, the U.S. subsidiary of ORIX Corporation, the publicly traded Tokyo - based international financial services firm. • The Company is an externally - managed real estate investment trust focused on investing in, financing and managing a portfolio of commercial real estate debt investments. • The Company is externally managed by Lument Investment Management, LLC, an affiliate of ORIX Corporation USA. Focused Leveraged Credit Strategy • Emphasis on middle market multifamily debt investments which are well positioned for the current environment. • Strong credit and asset management capabilities. • Utilizes a diverse set of portfolio financing capabilities, including CRE CLOs, repurchase agreements, and other secured financing structures.
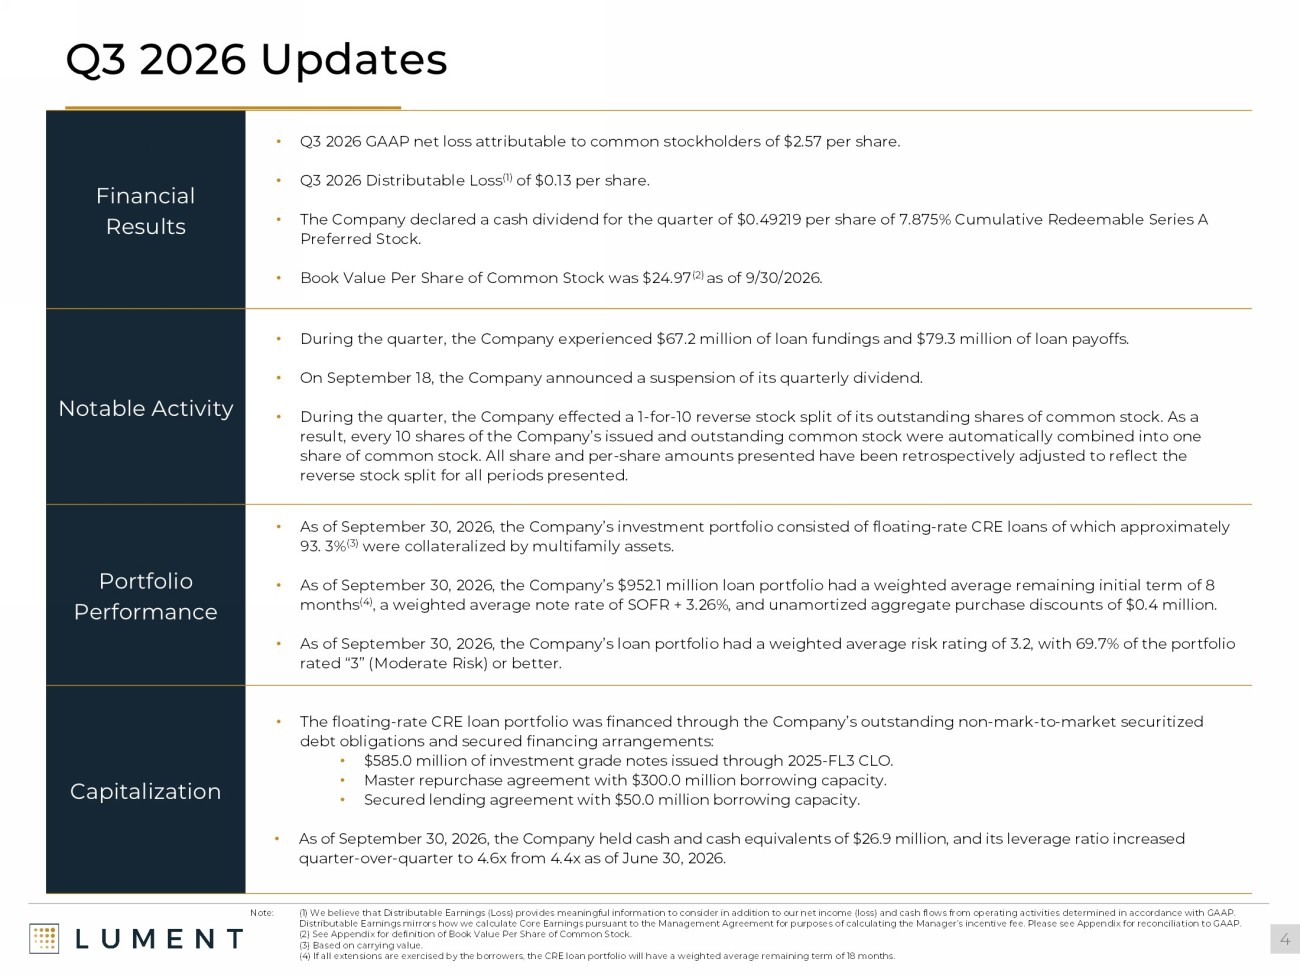
Q3 2026 Updates 4 Note: (1) We believe that Distributable Earnings (Loss) provides meaningful information to consider in addition to our net inco me (loss) and cash flows from operating activities determined in accordance with GAAP. Distributable Earnings mirrors how we calculate Core Earnings pursuant to the Management Agreement for purposes of calculatin g t he Manager’s incentive fee. Please see Appendix for reconciliation to GAAP. (2) See Appendix for definition of Book Value Per Share of Common Stock. (3) Based on carrying value. (4) If all extensions are exercised by the borrowers, the CRE loan portfolio will have a weighted average remaining term of 1 8 months. • Q3 2026 GAAP net loss attributable to common stockholders of $2.57 per share. • Q3 2026 Distributable Loss (1) of $0.13 per share. • The Company declared a cash dividend for the quarter of $0.49219 per share of 7.875% Cumulative Redeemable Series A Preferred Stock. • Book Value Per Share of Common Stock was $24.97 (2) as of 9/30/2026. Financial Results • During the quarter, the Company experienced $67.2 million of loan fundings and $79.3 million of loan payoffs. • On September 18, the Company announced a suspension of its quarterly dividend. • During the quarter, the Company effected a 1 - for - 10 reverse stock split of its outstanding shares of common stock. As a result, every 10 shares of the Company’s issued and outstanding common stock were automatically combined into one share of common stock. All share and per - share amounts presented have been retrospectively adjusted to reflect the reverse stock split for all periods presented. Notable Activity • As of September 30, 2026, the Company’s investment portfolio consisted of floating - rate CRE loans of which approximately 93. 3% (3) were collateralized by multifamily assets. • As of September 30, 2026, the Company’s $952.1 million loan portfolio had a weighted average remaining initial term of 8 months (4) , a weighted average note rate of SOFR + 3.26%, and unamortized aggregate purchase discounts of $0.4 million. • As of September 30, 2026, the Company’s loan portfolio had a weighted average risk rating of 3.2, with 69.7% of the portfolio rated “3” (Moderate Risk) or better. Portfolio Performance • The floating - rate CRE loan portfolio was financed through the Company’s outstanding non - mark - to - market securitized debt obligations and secured financing arrangements: • $585.0 million of investment grade notes issued through 2025 - FL3 CLO. • Master repurchase agreement with $300.0 million borrowing capacity. • Secured lending agreement with $50.0 million borrowing capacity. • As of September 30, 2026, the Company held cash and cash equivalents of $26.9 million, and its leverage ratio increased quarter - over - quarter to 4.6x from 4.4x as of June 30, 2026. Capitalization
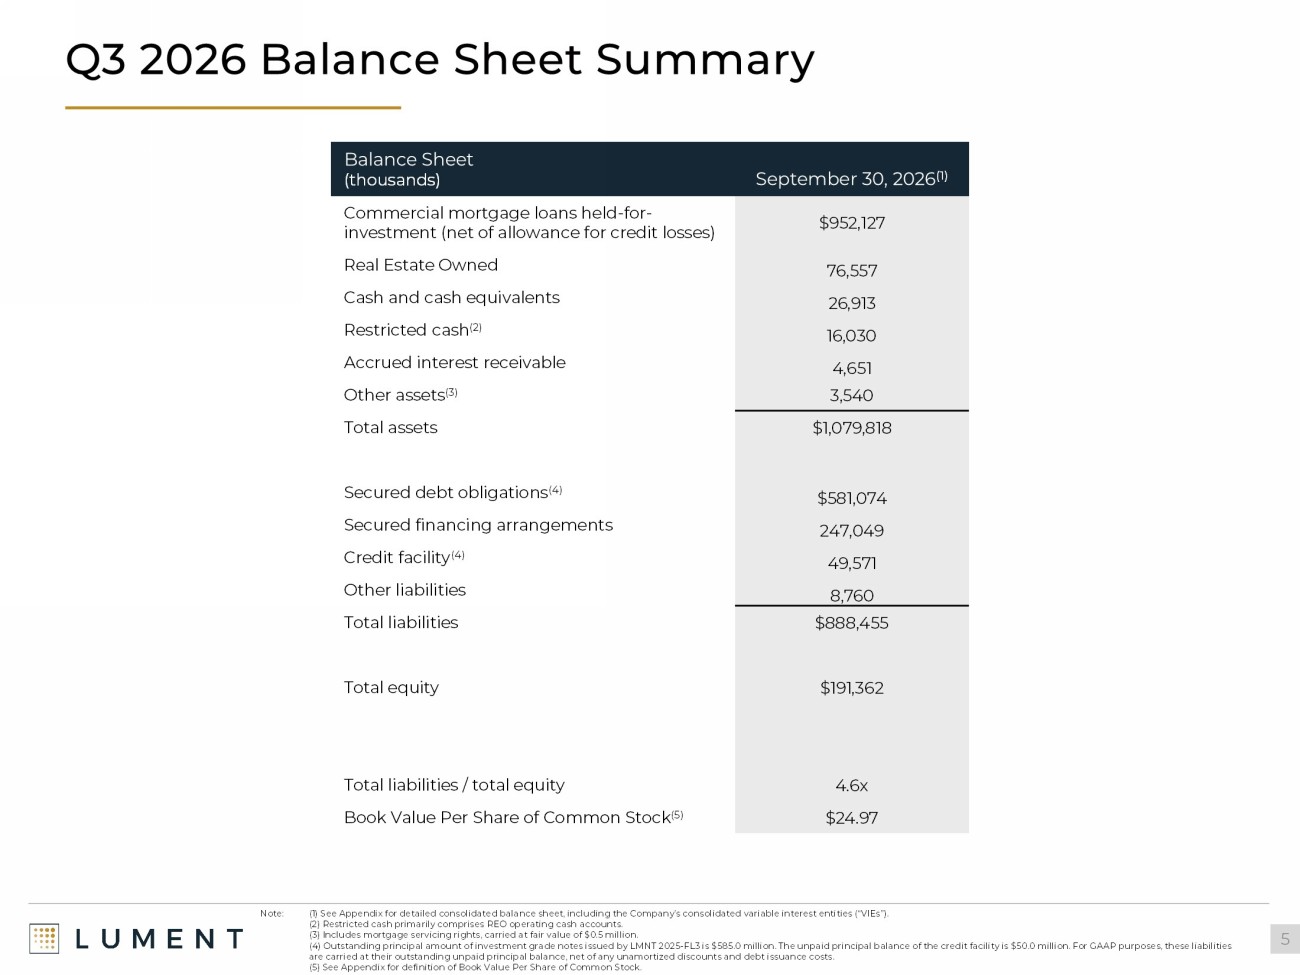
Q3 2026 Balance Sheet Summary 5 Note: (1) See Appendix for detailed consolidated balance sheet, including the Company’s consolidated variable interest entities (“VIEs”). (2) Restricted cash primarily comprises REO operating cash accounts. (3) Includes mortgage servicing rights, carried at fair value of $0.5 million. (4) Outstanding principal amount of investment grade notes issued by LMNT 2025 - FL3 is $585.0 million. The unpaid principal bala nce of the credit facility is $50.0 million. For GAAP purposes, these liabilities are carried at their outstanding unpaid principal balance, net of any unamortized discounts and debt issuance costs. (5) See Appendix for definition of Book Value Per Share of Common Stock. September 30, 2026 (1) Balance Sheet (thousands) $952,127 Commercial mortgage loans held - for - investment (net of allowance for credit losses) 76,557 Real Estate Owned 26,913 Cash and cash equivalents 16,030 Restricted cash (2) 4,651 Accrued interest receivable 3,540 Other assets (3) $1,079,818 Total assets $581,074 Secured debt obligations (4) 247,049 Secured financing arrangements 49,571 Credit facility (4) 8,760 Other liabilities $888,455 Total liabilities $191,362 Total equity 4.6x Total liabilities / total equity $24.97 Book Value Per Share of Common Stock (5)
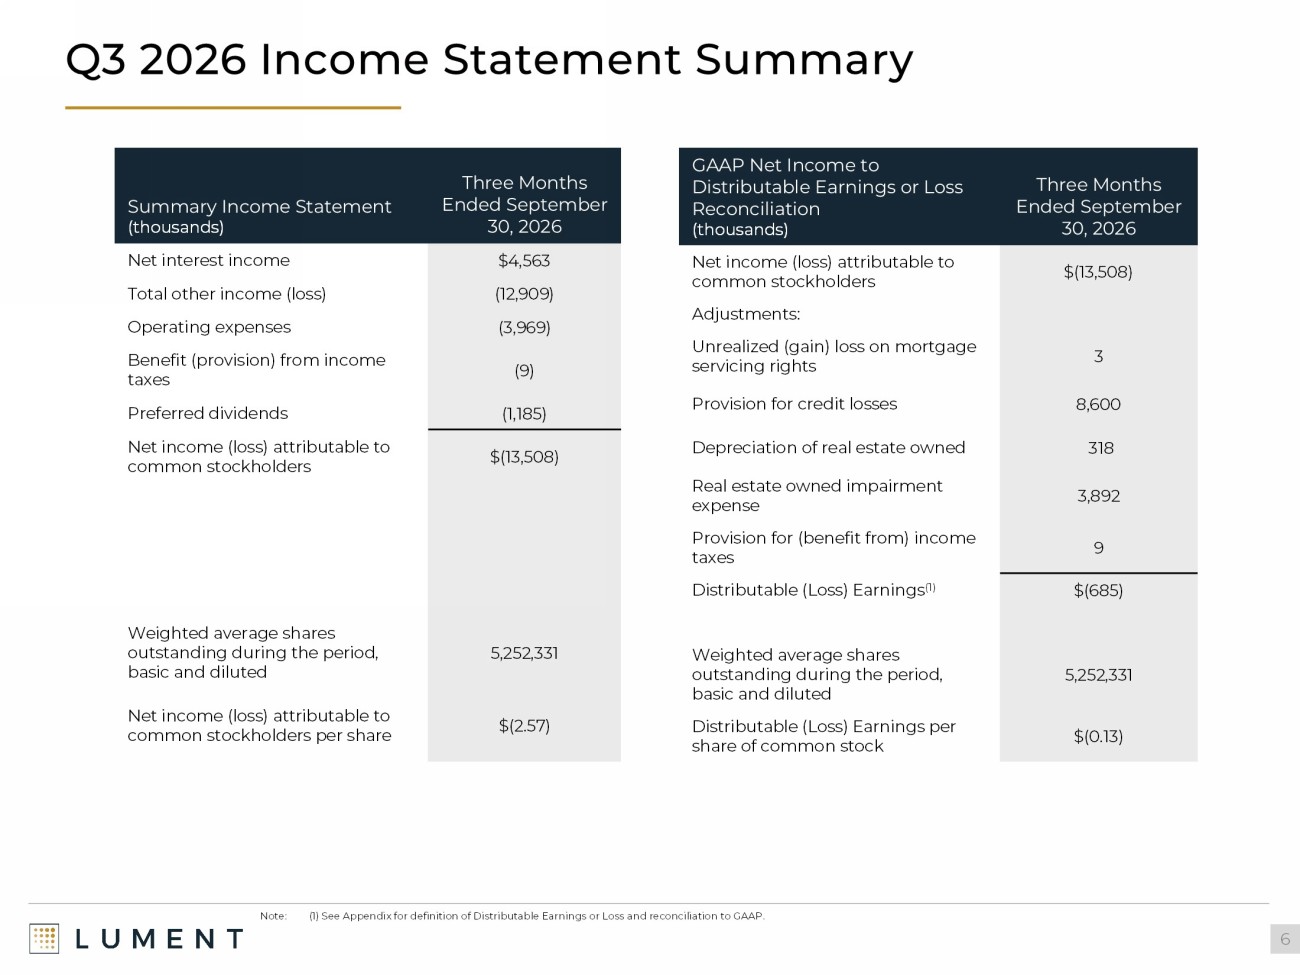
Q3 2026 Income Statement Summary 6 Three Months Ended September 30, 2026 Summary Income Statement (thousands) $4,563 Net interest income (12,909) Total other income (loss) (3,969) Operating expenses (9) Benefit (provision) from income taxes (1,185) Preferred dividends $(13,508) Net income (loss) attributable to common stockholders 5,252,331 Weighted average shares outstanding during the period, basic and diluted $(2.57) Net income (loss) attributable to common stockholders per share Note: (1) See Appendix for definition of Distributable Earnings or Loss and reconciliation to GAAP. Three Months Ended September 30, 2026 GAAP Net Income to Distributable Earnings or Loss Reconciliation (thousands) $(13,508) Net income (loss) attributable to common stockholders Adjustments: 3 Unrealized (gain) loss on mortgage servicing rights 8,600 Provision for credit losses 318 Depreciation of real estate owned 3,892 Real estate owned impairment expense 9 Provision for (benefit from) income taxes $(685) Distributable (Loss) Earnings (1) 5,252,331 Weighted average shares outstanding during the period, basic and diluted $(0.13) Distributable (Loss) Earnings per share of common stock
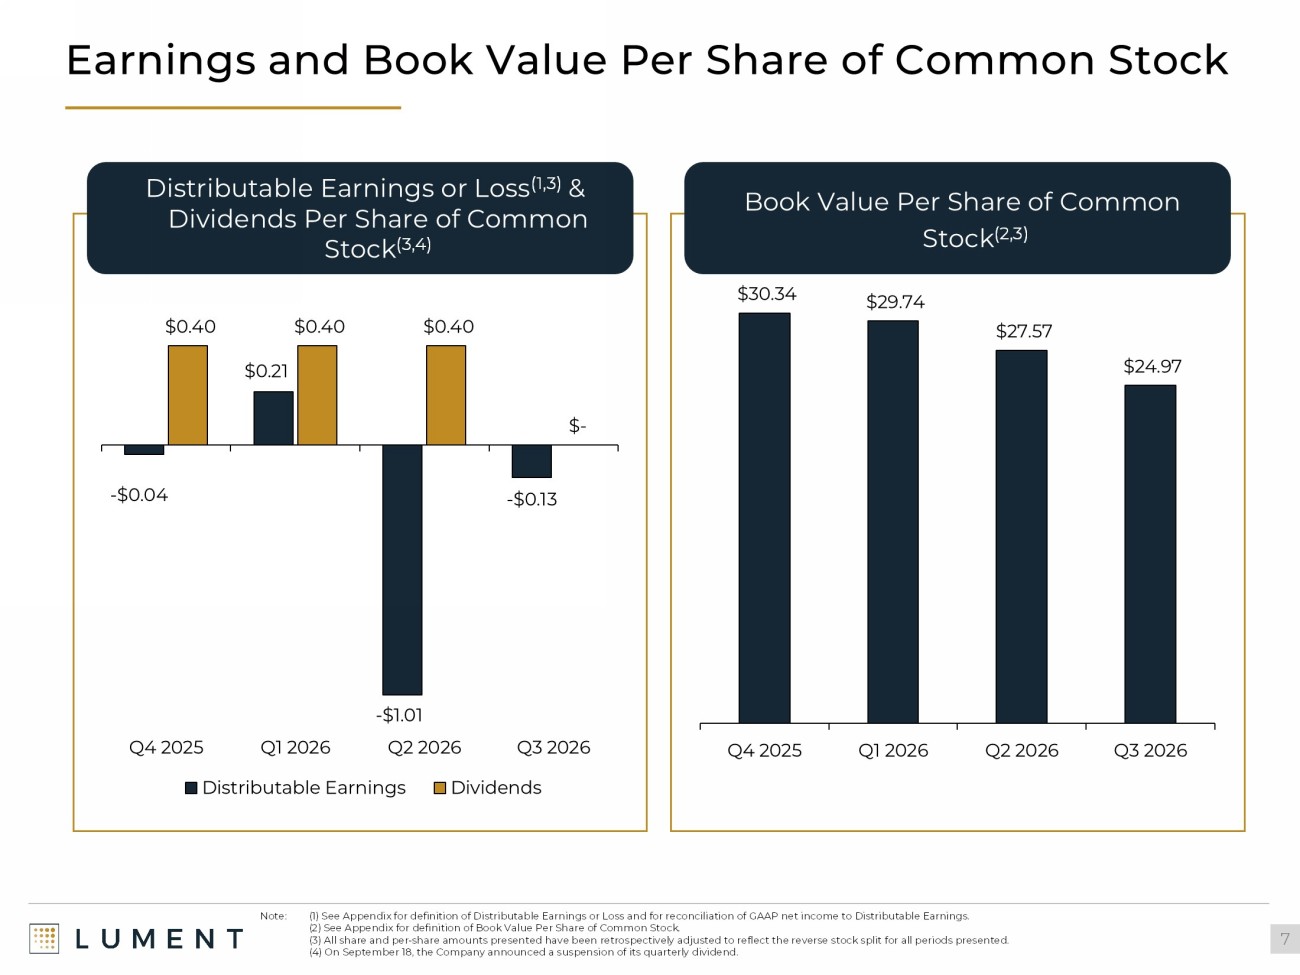
Earnings and Book Value Per Share of Common Stock 7 Note: (1) See Appendix for definition of Distributable Earnings or Loss and for reconciliation of GAAP net income to Distribut able Earnings. (2) See Appendix for definition of Book Value Per Share of Common Stock. (3) All share and per - share amounts presented have been retrospectively adjusted to reflect the reverse stock split for all per iods presented. (4) On September 18, the Company announced a suspension of its quarterly dividend. $30.34 $29.74 $27.57 $24.97 Q4 2025 Q1 2026 Q2 2026 Q3 2026 Distributable Earnings or Loss (1,3) & Dividends Per Share of Common Stock (3,4) Book Value Per Share of Common Stock (2,3) - $0.04 $0.21 - $1.01 - $0.13 $0.40 $0.40 $0.40 $ - Q4 2025 Q1 2026 Q2 2026 Q3 2026 Distributable Earnings Dividends
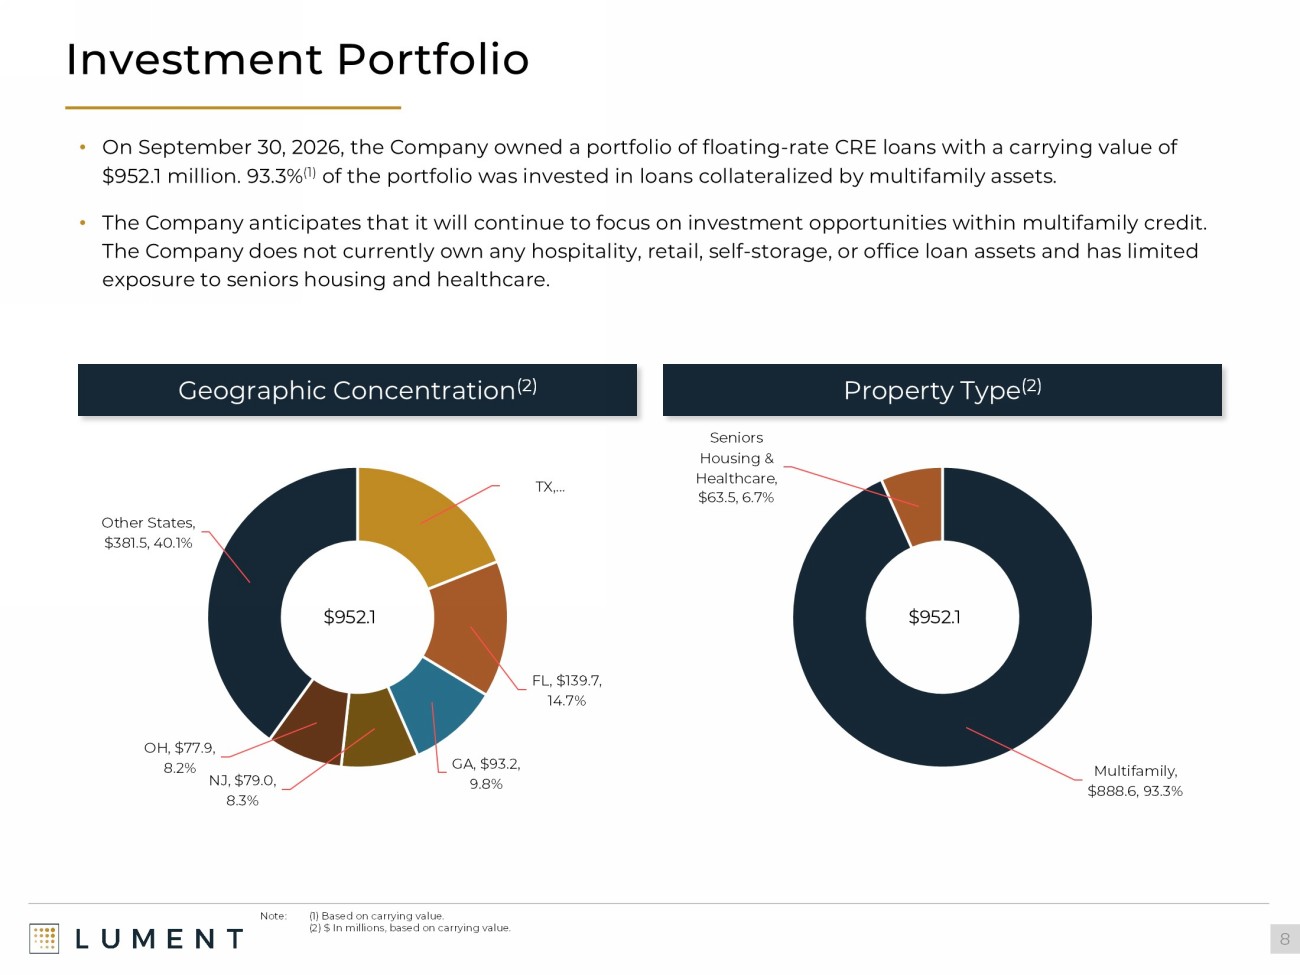
Investment Portfolio 8 Geographic Concentration (2) Multifamily , $888.6 , 93.3% Seniors Housing & Healthcare , $63.5 , 6.7% Property Type (2) $952.1 Note: (1) Based on carrying value. (2) $ In millions, based on carrying value. • On September 30, 2026, the Company owned a portfolio of floating - rate CRE loans with a carrying value of $952.1 million. 93.3% (1) of the portfolio was invested in loans collateralized by multifamily assets. • The Company anticipates that it will continue to focus on investment opportunities within multifamily credit. The Company does not currently own any hospitality, retail, self - storage, or office loan assets and has limited exposure to seniors housing and healthcare. TX , … FL , $139.7 , 14.7% GA , $93.2 , 9.8% NJ , $79.0 , 8.3% OH , $77.9 , 8.2% Other States , $381.5 , 40.1% $952.1
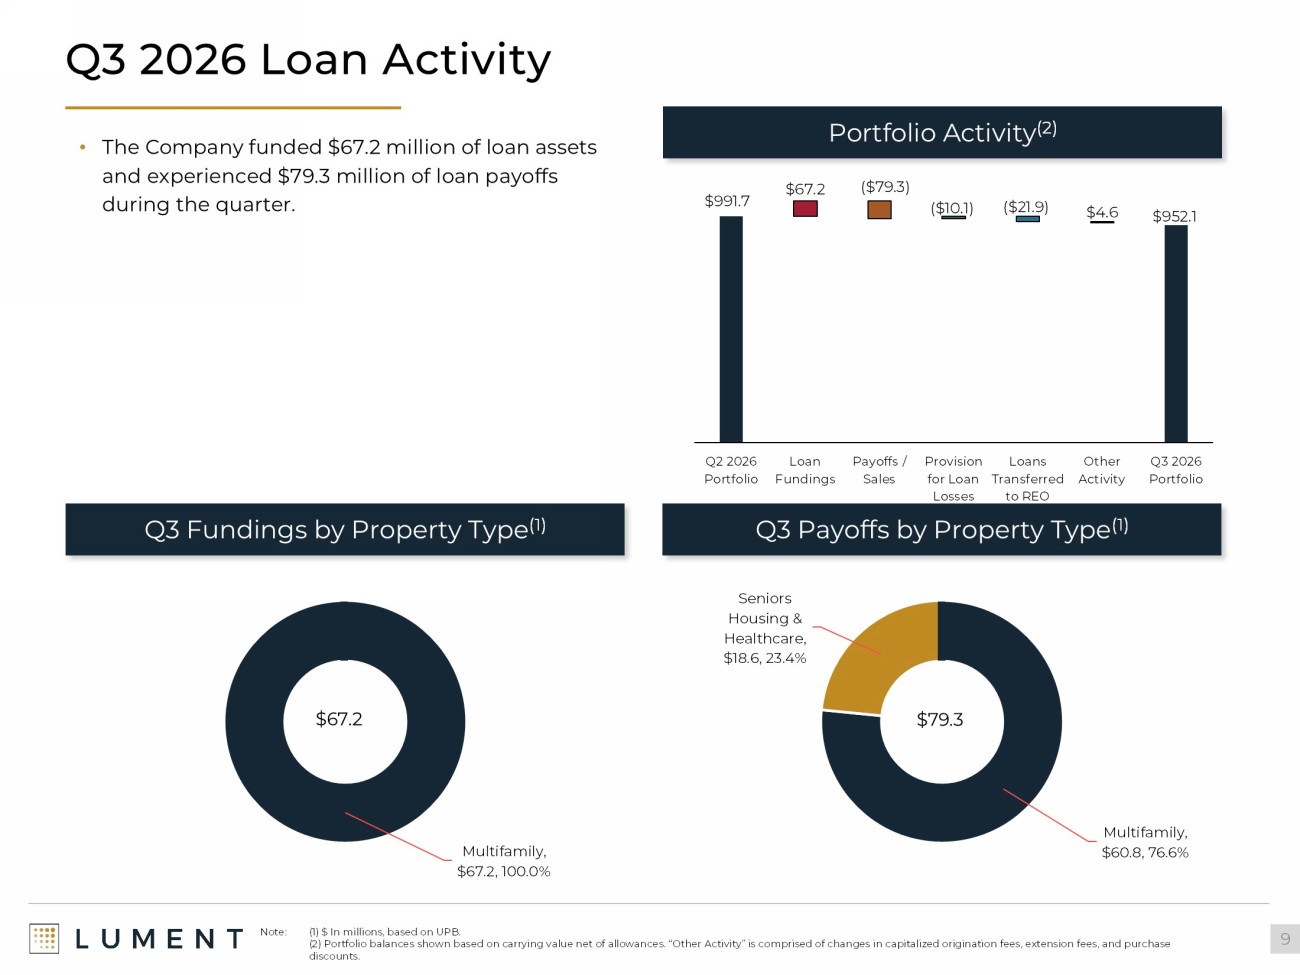
Q3 2026 Loan Activity 9 Multifamily , $60.8 , 76.6% Seniors Housing & Healthcare , $18.6 , 23.4% Q3 Payoffs by Property Type (1) $79.3 • The Company funded $67.2 million of loan assets and experienced $79.3 million of loan payoffs during the quarter. Note: (1) $ In millions, based on UPB. (2) Portfolio balances shown based on carrying value net of allowances. “Other Activity” is comprised of changes in capitaliz ed origination fees, extension fees, and purchase discounts. Portfolio Activity (2) Multifamily , $67.2 , 100.0% Q3 Fundings by Property Type (1) $67.2 $991.7 $67.2 ($79.3) ($10.1) ($21.9) $4.6 $952.1 Q2 2026 Portfolio Loan Fundings Payoffs / Sales Provision for Loan Losses Loans Transferred to REO Other Activity Q3 2026 Portfolio
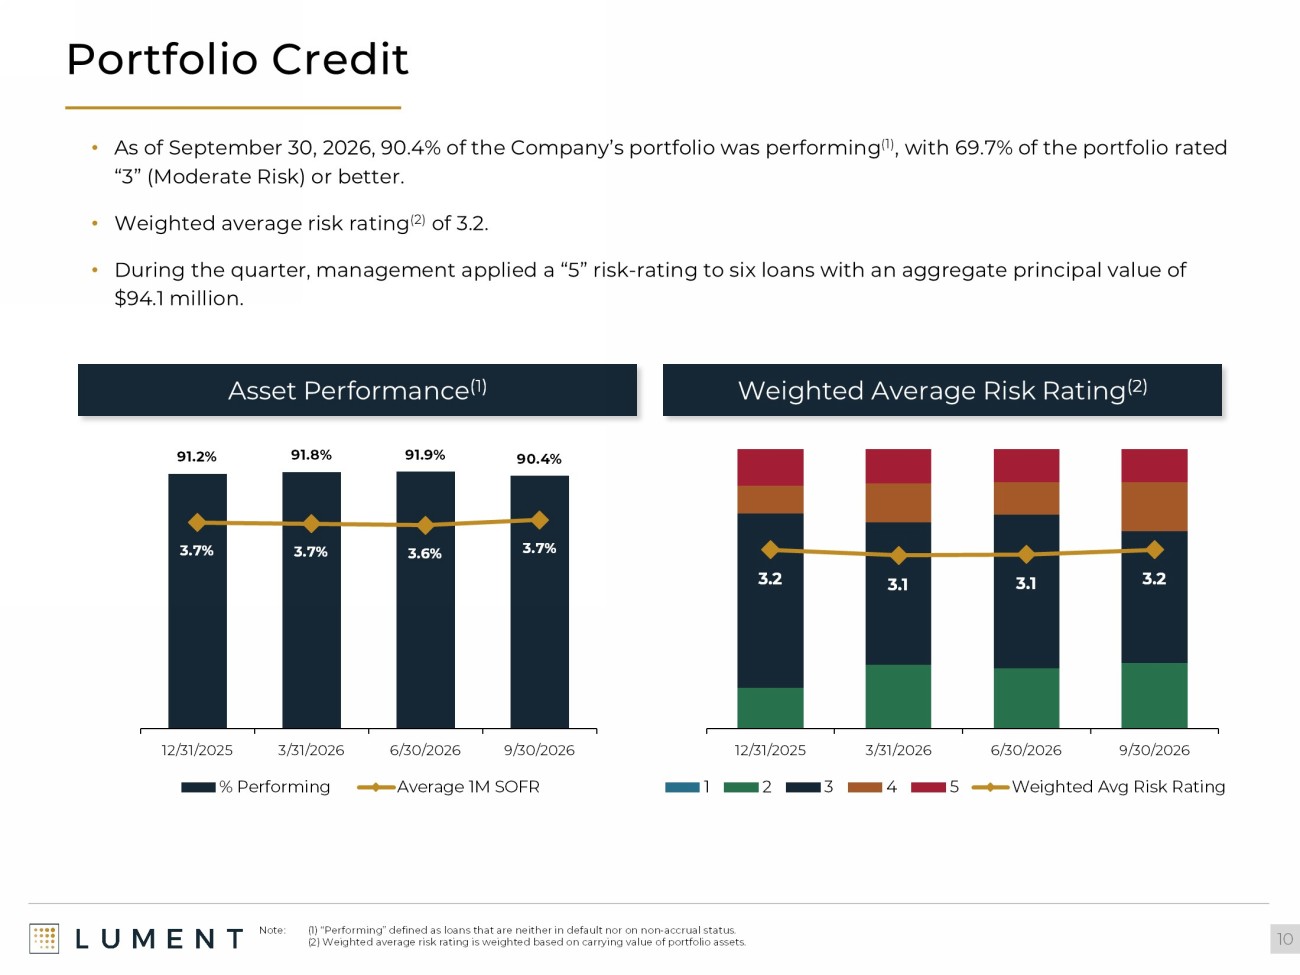
Portfolio Credit 10 • As of September 30, 2026, 90.4 % of the Company’s portfolio was performing (1) , with 69.7% of the portfolio rated “3” (Moderate Risk) or better. • Weighted average risk rating (2) of 3.2. • During the quarter, management applied a “5” risk - rating to six loans with an aggregate principal value of $94.1 million. Asset Performance (1) Weighted Average Risk Rating (2) Note: (1) “Performing” defined as loans that are neither in default nor on non - accrual status. (2) Weighted average risk rating is weighted based on carrying value of portfolio assets. 91.2% 91.8% 91.9% 90.4% 3.7% 3.7% 3.6% 3.7% 0.0% 1.0% 2.0% 3.0% 4.0% 5.0% 0.0% 20.0% 40.0% 60.0% 80.0% 100.0% 12/31/2025 3/31/2026 6/30/2026 9/30/2026 % Performing Average 1M SOFR 3.2 3.1 3.1 3.2 0 1 2 3 4 5 0% 20% 40% 60% 80% 100% 12/31/2025 3/31/2026 6/30/2026 9/30/2026 1 2 3 4 5 Weighted Avg Risk Rating
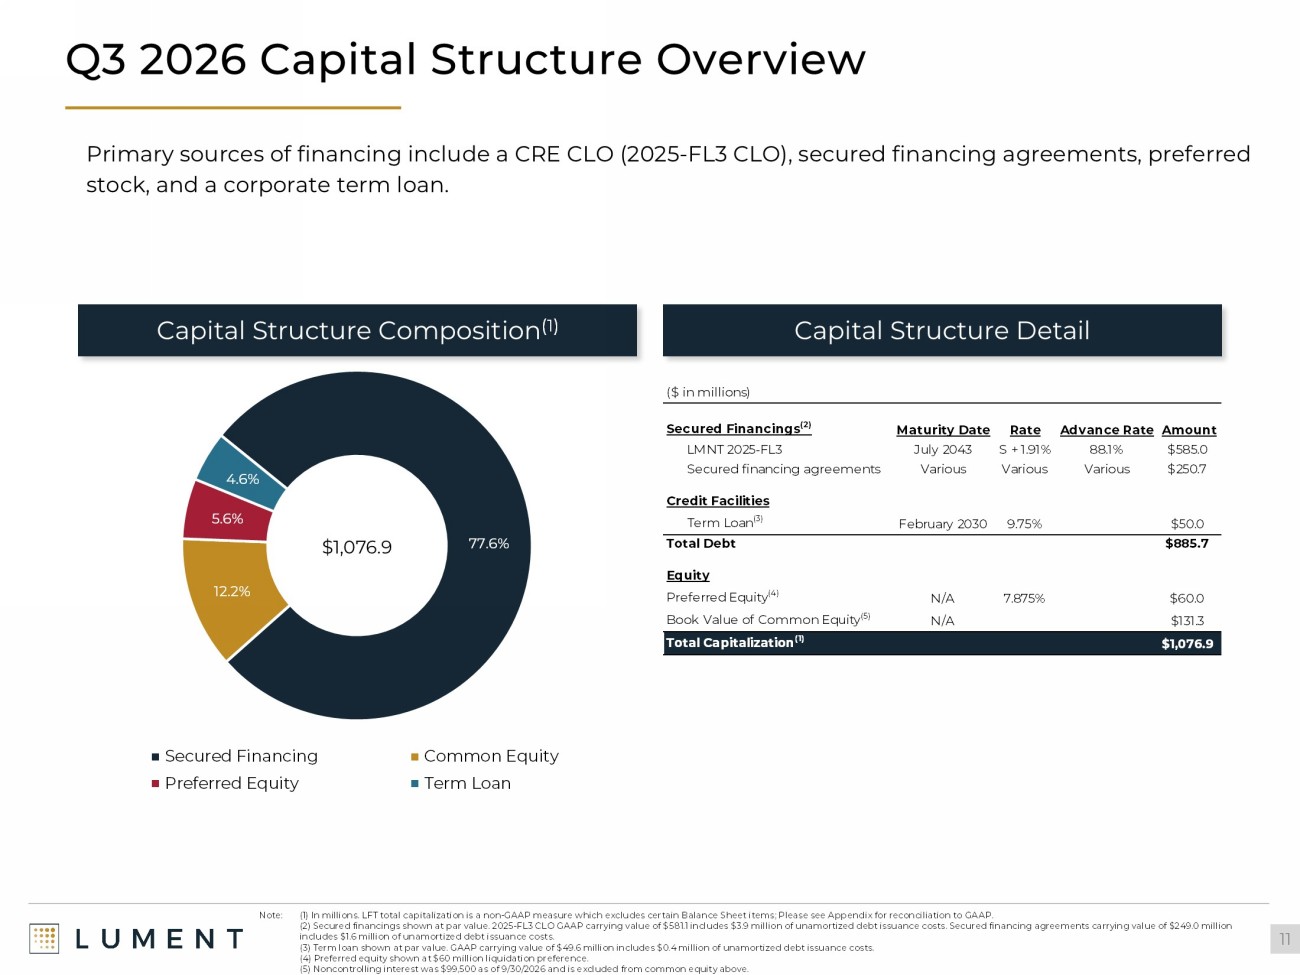
Note: (1) In millions. LFT total capitalization is a non - GAAP measure which excludes certain Balance Sheet items; Please see App endix for reconciliation to GAAP. (2) Secured financings shown at par value. 2025 - FL3 CLO GAAP carrying value of $581.1 includes $3.9 million of unamortized debt issuance costs. Secured financing agreements carrying value of $249.0 million includes $1.6 million of unamortized debt issuance costs. (3) Term loan shown at par value. GAAP carrying value of $49.6 million includes $0.4 million of unamortized debt issuance cos ts . (4) Preferred equity shown at $60 million liquidation preference. (5) Noncontrolling interest was $99,500 as of 9/30/2026 and is excluded from common equity above. 77.6% 12.2% 5.6% 4.6% Secured Financing Common Equity Preferred Equity Term Loan $1,076.9 Capital Structure Composition (1) Capital Structure Detail Q3 2026 Capital Structure Overview 11 Primary sources of financing include a CRE CLO (2025 - FL3 CLO), secured financing agreements, preferred stock, and a corporate term loan. ($ in millions) Secured Financings (2) Maturity Date Rate Advance RateAmount LMNT 2025-FL3 July 2043 S + 1.91% 88.1% $585.0 Secured financing agreements Various Various Various $250.7 Credit Facilities Term Loan (3) February 2030 9.75% $50.0 Total Debt $885.7 Equity Preferred Equity (4) N/A 7.875% $60.0 Book Value of Common Equity (5) N/A $131.3 Total Capitalization (1) $1,076.9
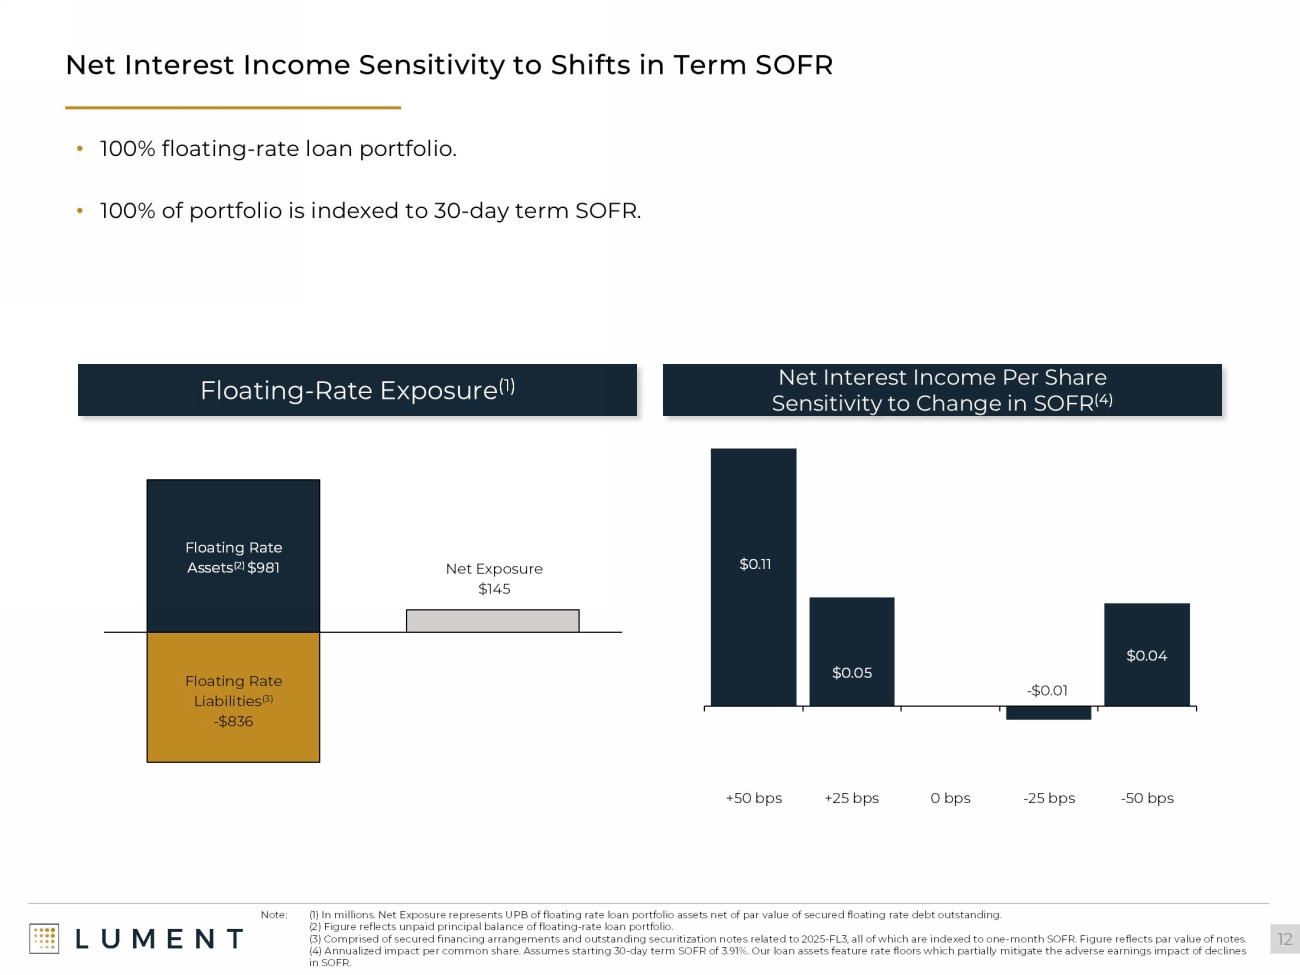
$0.11 $0.05 - $0.01 $0.04 +50 bps +25 bps 0 bps -25 bps -50 bps Net Interest Income Sensitivity to Shifts in Term SOFR 12 Floating Rate Assets (2) $981 Floating Rate Liabilities (3) - $836 Net Exposure $145 Floating - Rate Exposure (1) Net Interest Income Per Share Sensitivity to Change in SOFR (4) • 100% floating - rate loan portfolio. • 100% of portfolio is indexed to 30 - day term SOFR. Note: (1) In millions. Net Exposure represents UPB of floating rate loan portfolio assets net of par value of secured floating rate debt outstanding. (2) Figure reflects unpaid principal balance of floating - rate loan portfolio. (3) Comprised of secured financing arrangements and outstanding securitization notes related to 2025 - FL3, all of which are inde xed to one - month SOFR. Figure reflects par value of notes. (4) Annualized impact per common share. Assumes starting 30 - day term SOFR of 3.91%. Our loan assets feature rate floors which p artially mitigate the adverse earnings impact of declines in SOFR.

Appendix
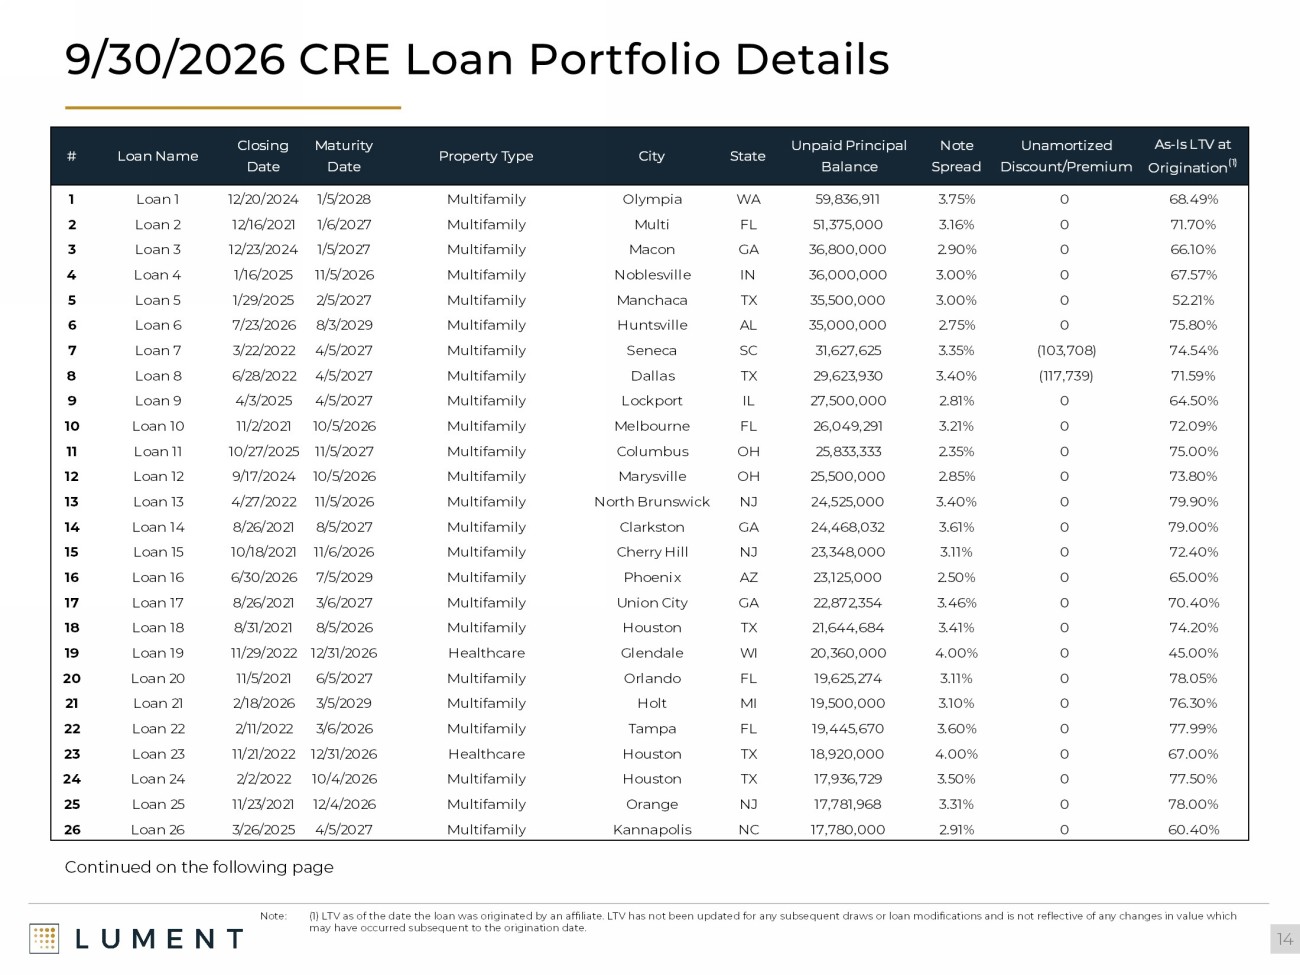
9/30/2026 CRE Loan Portfolio Details 14 Continued on the following page Note: (1) LTV as of the date the loan was originated by an affiliate. LTV has not been updated for any subsequent draws or loan modifications and is not reflective of any changes in value which may have occurred subsequent to the origination date. # Loan Name Closing Date Maturity Date Property Type City State Unpaid Principal Balance Note Spread Unamortized Discount/Premium As-Is LTV at Origination (1) 1 Loan 1 12/20/2024 1/5/2028 Multifamily Olympia WA 59,836,911 3.75% 0 68.49% 2 Loan 2 12/16/2021 1/6/2027 Multifamily Multi FL 51,375,000 3.16% 0 71.70% 3 Loan 3 12/23/2024 1/5/2027 Multifamily Macon GA 36,800,000 2.90% 0 66.10% 4 Loan 4 1/16/2025 11/5/2026 Multifamily Noblesville IN 36,000,000 3.00% 0 67.57% 5 Loan 5 1/29/2025 2/5/2027 Multifamily Manchaca TX 35,500,000 3.00% 0 52.21% 6 Loan 6 7/23/2026 8/3/2029 Multifamily Huntsville AL 35,000,000 2.75% 0 75.80% 7 Loan 7 3/22/2022 4/5/2027 Multifamily Seneca SC 31,627,625 3.35% (103,708) 74.54% 8 Loan 8 6/28/2022 4/5/2027 Multifamily Dallas TX 29,623,930 3.40% (117,739) 71.59% 9 Loan 9 4/3/2025 4/5/2027 Multifamily Lockport IL 27,500,000 2.81% 0 64.50% 10 Loan 10 11/2/2021 10/5/2026 Multifamily Melbourne FL 26,049,291 3.21% 0 72.09% 11 Loan 11 10/27/2025 11/5/2027 Multifamily Columbus OH 25,833,333 2.35% 0 75.00% 12 Loan 12 9/17/2024 10/5/2026 Multifamily Marysville OH 25,500,000 2.85% 0 73.80% 13 Loan 13 4/27/2022 11/5/2026 Multifamily North Brunswick NJ 24,525,000 3.40% 0 79.90% 14 Loan 14 8/26/2021 8/5/2027 Multifamily Clarkston GA 24,468,032 3.61% 0 79.00% 15 Loan 15 10/18/2021 11/6/2026 Multifamily Cherry Hill NJ 23,348,000 3.11% 0 72.40% 16 Loan 16 6/30/2026 7/5/2029 Multifamily Phoenix AZ 23,125,000 2.50% 0 65.00% 17 Loan 17 8/26/2021 3/6/2027 Multifamily Union City GA 22,872,354 3.46% 0 70.40% 18 Loan 18 8/31/2021 8/5/2026 Multifamily Houston TX 21,644,684 3.41% 0 74.20% 19 Loan 19 11/29/2022 12/31/2026 Healthcare Glendale WI 20,360,000 4.00% 0 45.00% 20 Loan 20 11/5/2021 6/5/2027 Multifamily Orlando FL 19,625,274 3.11% 0 78.05% 21 Loan 21 2/18/2026 3/5/2029 Multifamily Holt MI 19,500,000 3.10% 0 76.30% 22 Loan 22 2/11/2022 3/6/2026 Multifamily Tampa FL 19,445,670 3.60% 0 77.99% 23 Loan 23 11/21/2022 12/31/2026 Healthcare Houston TX 18,920,000 4.00% 0 67.00% 24 Loan 24 2/2/2022 10/4/2026 Multifamily Houston TX 17,936,729 3.50% 0 77.50% 25 Loan 25 11/23/2021 12/4/2026 Multifamily Orange NJ 17,781,968 3.31% 0 78.00% 26 Loan 26 3/26/2025 4/5/2027 Multifamily Kannapolis NC 17,780,000 2.91% 0 60.40%
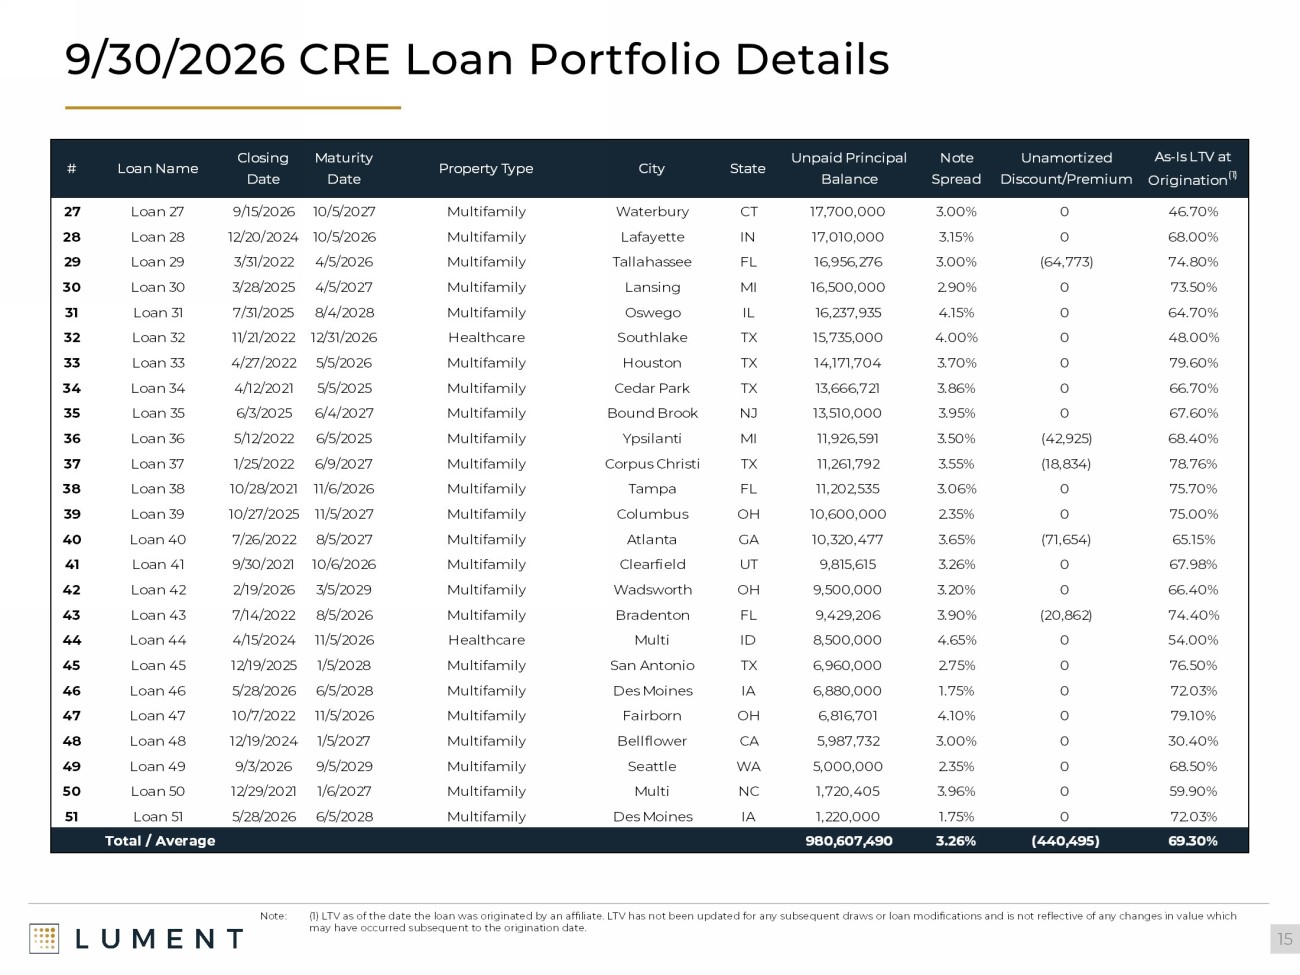
9/30/2026 CRE Loan Portfolio Details 15 Note: (1) LTV as of the date the loan was originated by an affiliate. LTV has not been updated for any subsequent draws or loan modifications and is not reflective of any changes in value which may have occurred subsequent to the origination date. # Loan Name Closing Date Maturity Date Property Type City State Unpaid Principal Balance Note Spread Unamortized Discount/Premium As-Is LTV at Origination (1) 27 Loan 27 9/15/2026 10/5/2027 Multifamily Waterbury CT 17,700,000 3.00% 0 46.70% 28 Loan 28 12/20/2024 10/5/2026 Multifamily Lafayette IN 17,010,000 3.15% 0 68.00% 29 Loan 29 3/31/2022 4/5/2026 Multifamily Tallahassee FL 16,956,276 3.00% (64,773) 74.80% 30 Loan 30 3/28/2025 4/5/2027 Multifamily Lansing MI 16,500,000 2.90% 0 73.50% 31 Loan 31 7/31/2025 8/4/2028 Multifamily Oswego IL 16,237,935 4.15% 0 64.70% 32 Loan 32 11/21/2022 12/31/2026 Healthcare Southlake TX 15,735,000 4.00% 0 48.00% 33 Loan 33 4/27/2022 5/5/2026 Multifamily Houston TX 14,171,704 3.70% 0 79.60% 34 Loan 34 4/12/2021 5/5/2025 Multifamily Cedar Park TX 13,666,721 3.86% 0 66.70% 35 Loan 35 6/3/2025 6/4/2027 Multifamily Bound Brook NJ 13,510,000 3.95% 0 67.60% 36 Loan 36 5/12/2022 6/5/2025 Multifamily Ypsilanti MI 11,926,591 3.50% (42,925) 68.40% 37 Loan 37 1/25/2022 6/9/2027 Multifamily Corpus Christi TX 11,261,792 3.55% (18,834) 78.76% 38 Loan 38 10/28/2021 11/6/2026 Multifamily Tampa FL 11,202,535 3.06% 0 75.70% 39 Loan 39 10/27/2025 11/5/2027 Multifamily Columbus OH 10,600,000 2.35% 0 75.00% 40 Loan 40 7/26/2022 8/5/2027 Multifamily Atlanta GA 10,320,477 3.65% (71,654) 65.15% 41 Loan 41 9/30/2021 10/6/2026 Multifamily Clearfield UT 9,815,615 3.26% 0 67.98% 42 Loan 42 2/19/2026 3/5/2029 Multifamily Wadsworth OH 9,500,000 3.20% 0 66.40% 43 Loan 43 7/14/2022 8/5/2026 Multifamily Bradenton FL 9,429,206 3.90% (20,862) 74.40% 44 Loan 44 4/15/2024 11/5/2026 Healthcare Multi ID 8,500,000 4.65% 0 54.00% 45 Loan 45 12/19/2025 1/5/2028 Multifamily San Antonio TX 6,960,000 2.75% 0 76.50% 46 Loan 46 5/28/2026 6/5/2028 Multifamily Des Moines IA 6,880,000 1.75% 0 72.03% 47 Loan 47 10/7/2022 11/5/2026 Multifamily Fairborn OH 6,816,701 4.10% 0 79.10% 48 Loan 48 12/19/2024 1/5/2027 Multifamily Bellflower CA 5,987,732 3.00% 0 30.40% 49 Loan 49 9/3/2026 9/5/2029 Multifamily Seattle WA 5,000,000 2.35% 0 68.50% 50 Loan 50 12/29/2021 1/6/2027 Multifamily Multi NC 1,720,405 3.96% 0 59.90% 51 Loan 51 5/28/2026 6/5/2028 Multifamily Des Moines IA 1,220,000 1.75% 0 72.03% Total / Average 980,607,490 3.26% (440,495) 69.30%
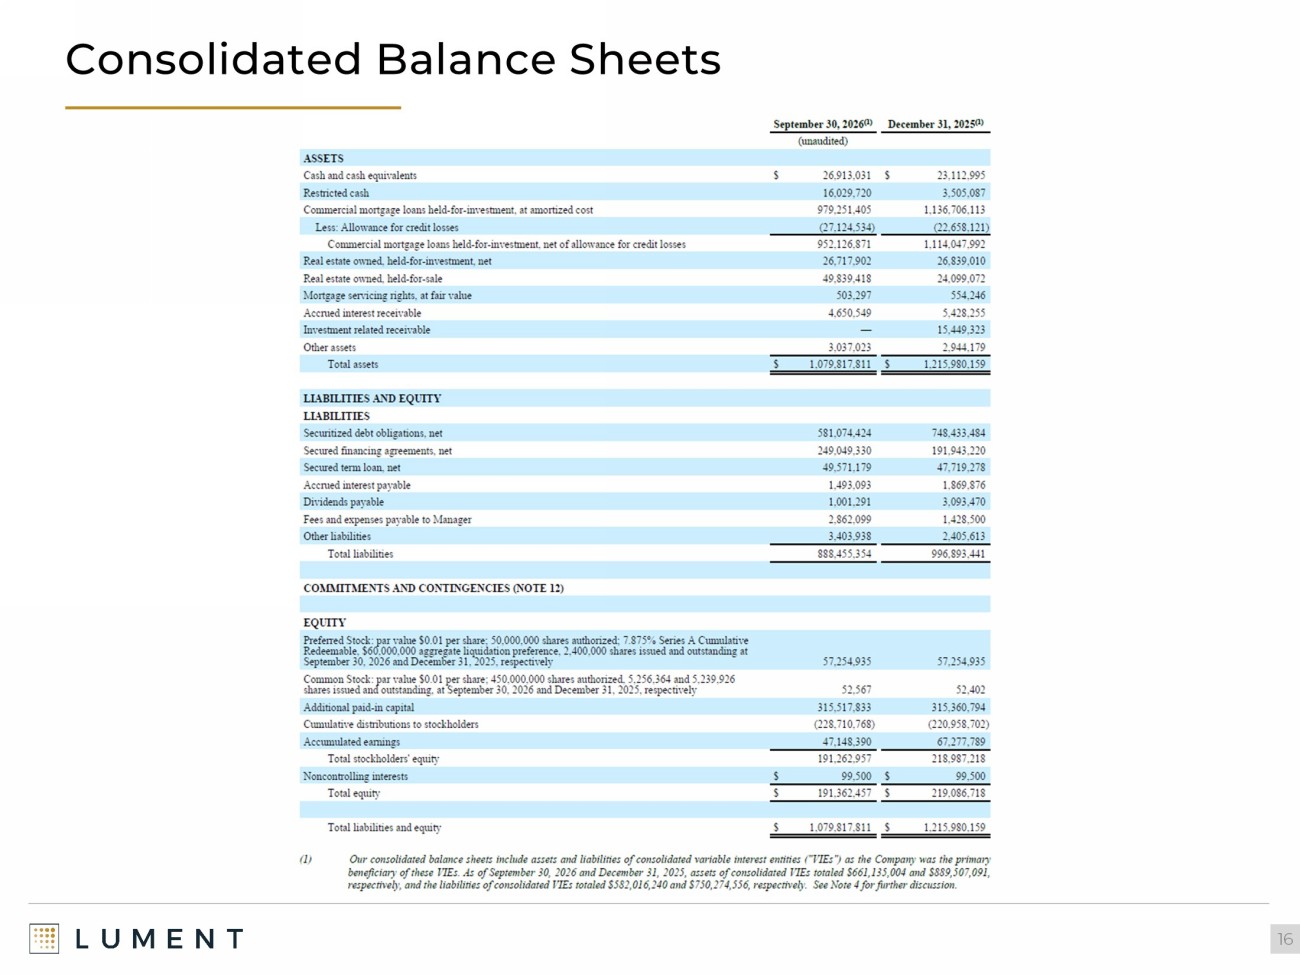
Consolidated Balance Sheets 16
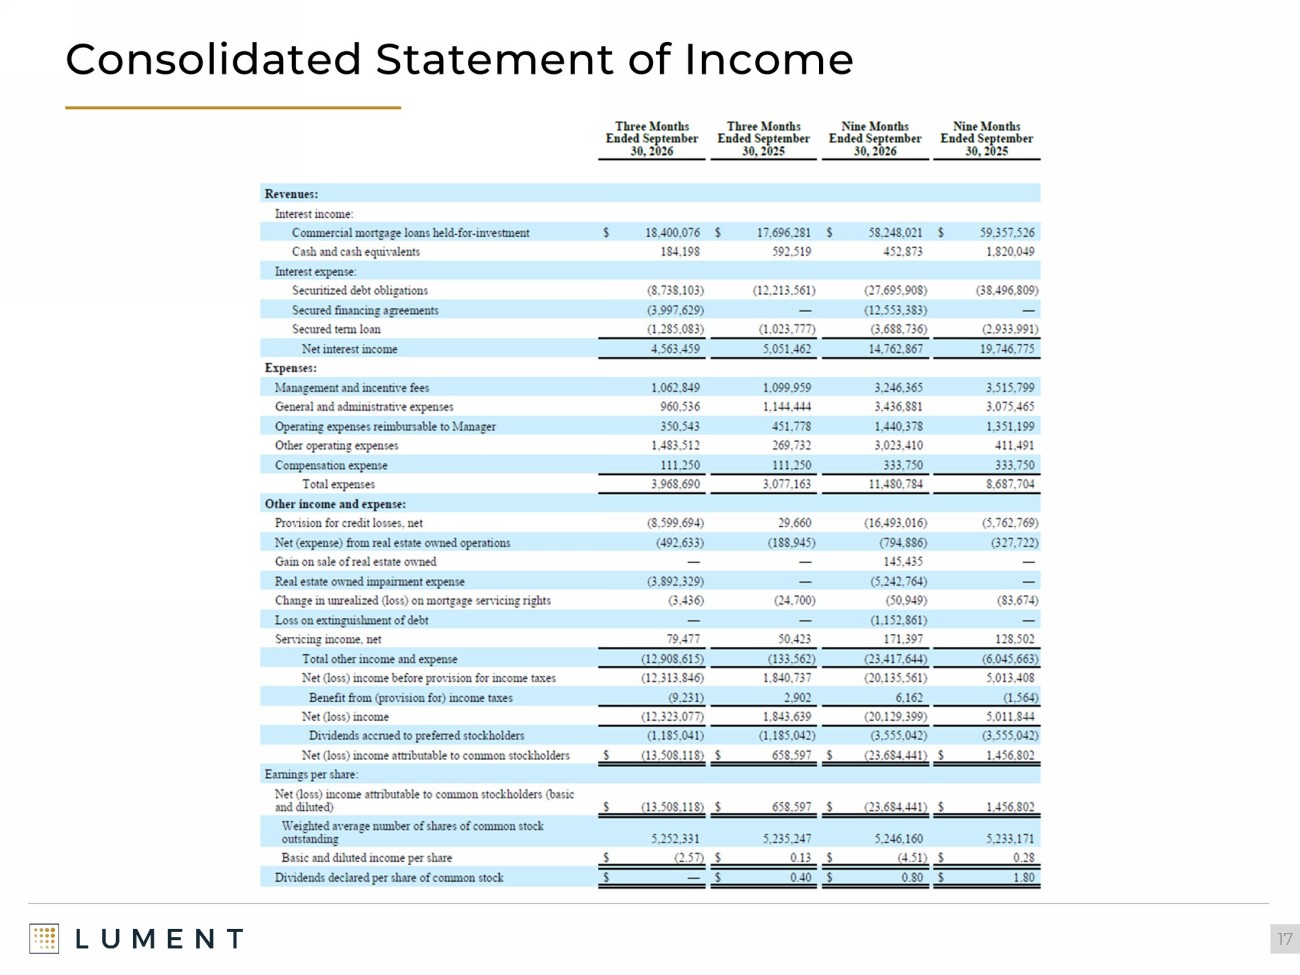
Consolidated Statement of Income 17
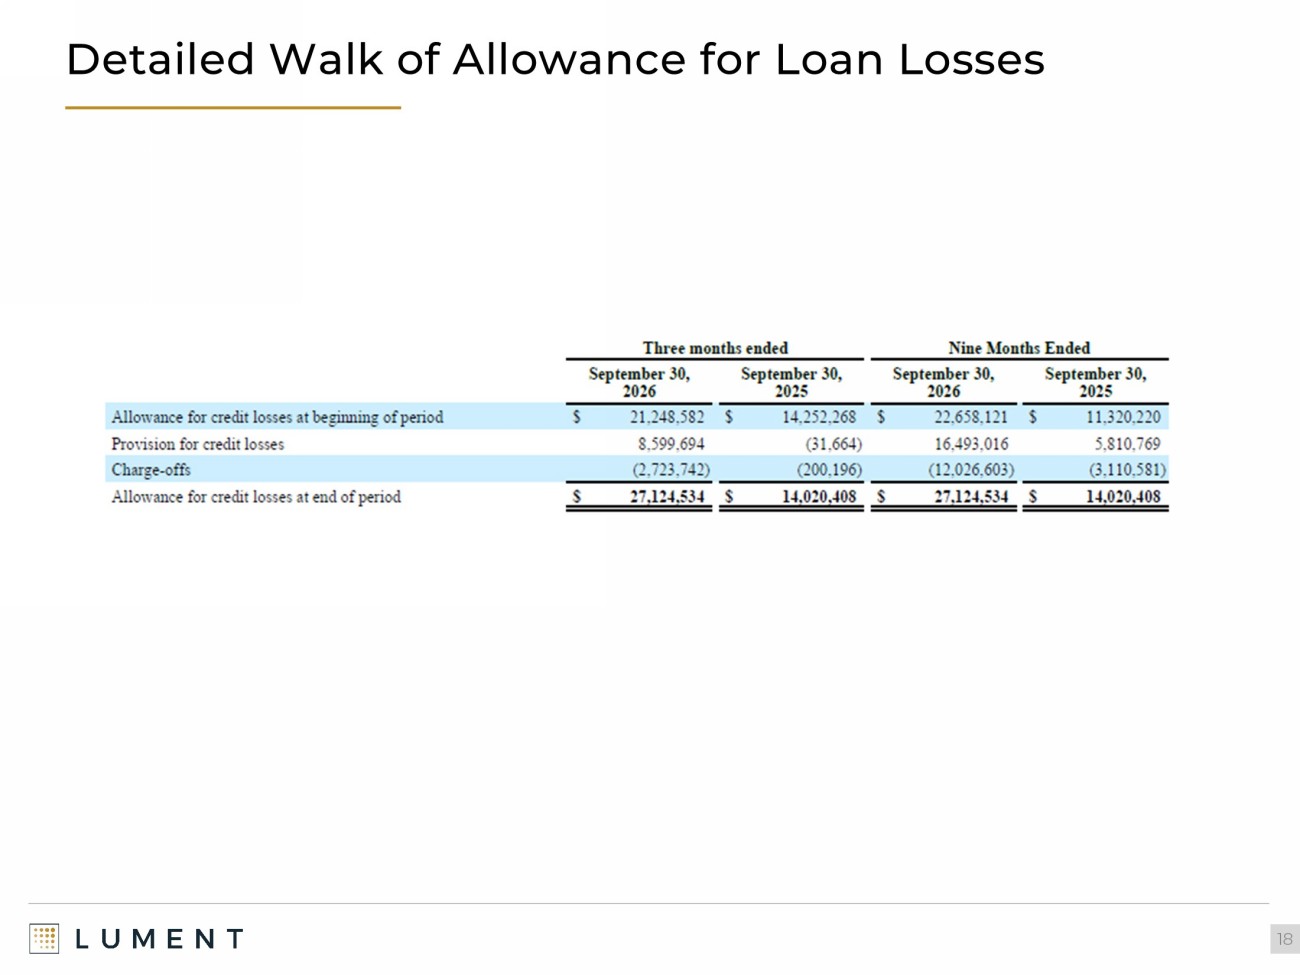
Detailed Walk of Allowance for Loan Losses 18
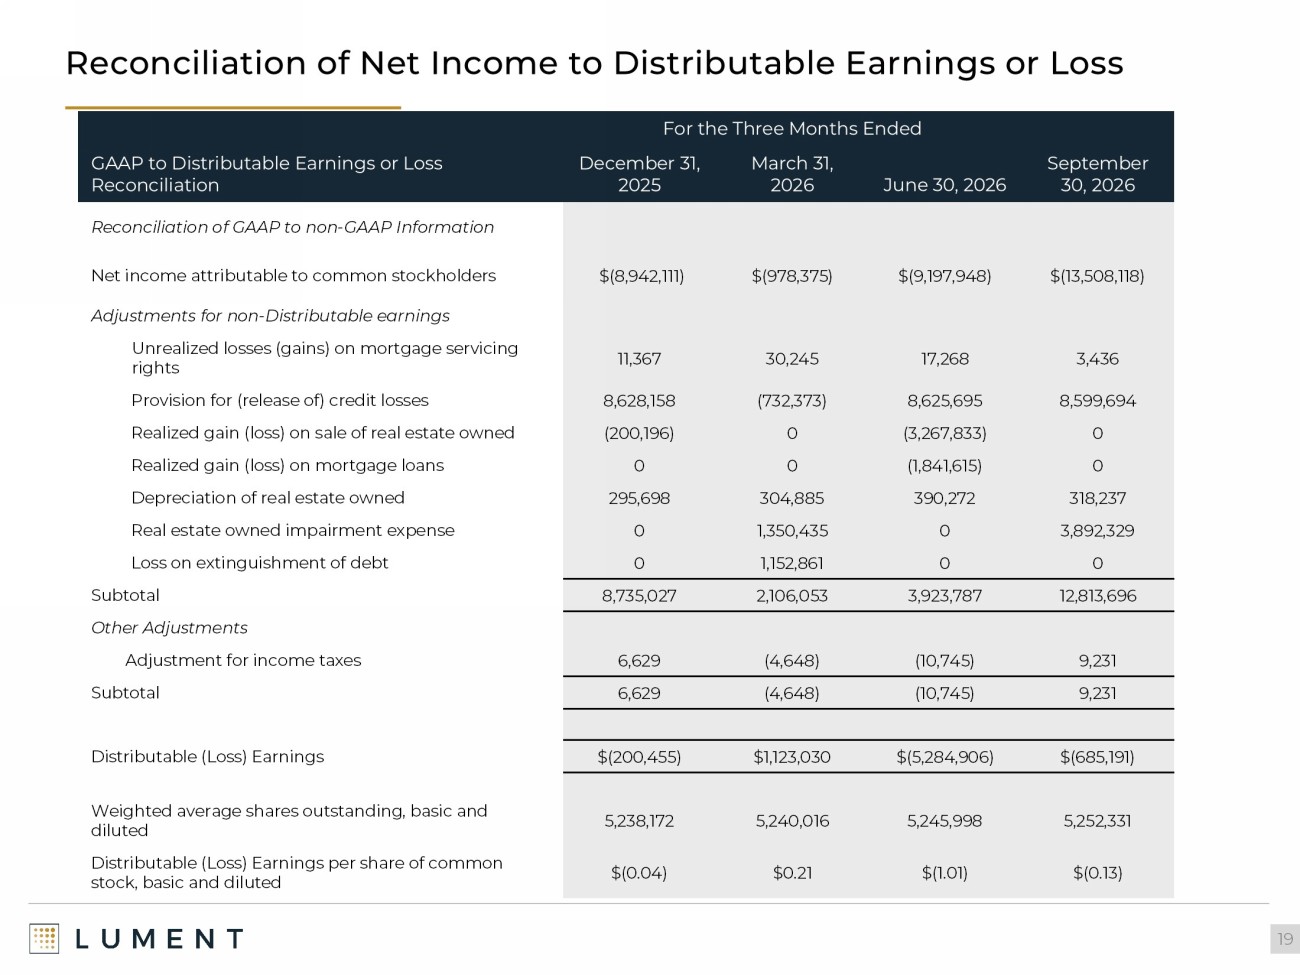
Reconciliation of Net Income to Distributable Earnings or Loss 19 For the Three Months Ended September 30, 2026 June 30, 2026 March 31, 2026 December 31, 2025 GAAP to Distributable Earnings or Loss Reconciliation Reconciliation of GAAP to non - GAAP Information $(13,508,118) $(9,197,948) $(978,375) $(8,942,111) Net income attributable to common stockholders Adjustments for non - Distributable earnings 3,436 17,268 30,245 11,367 Unrealized losses (gains) on mortgage servicing rights 8,599,694 8,625,695 (732,373) 8,628,158 Provision for (release of) credit losses 0 (3,267,833) 0 (200,196) Realized gain (loss) on sale of real estate owned 0 (1,841,615) 0 0 Realized gain (loss) on mortgage loans 318,237 390,272 304,885 295,698 Depreciation of real estate owned 3,892,329 0 1,350,435 0 Real estate owned impairment expense 0 0 1,152,861 0 Loss on extinguishment of debt 12,813,696 3,923,787 2,106,053 8,735,027 Subtotal Other Adjustments 9,231 (10,745) (4,648) 6,629 Adjustment for income taxes 9,231 (10,745) (4,648) 6,629 Subtotal $(685,191) $(5,284,906) $1,123,030 $(200,455) Distributable (Loss) Earnings 5,252,331 5,245,998 5,240,016 5,238,172 Weighted average shares outstanding, b asic and diluted $(0.13) $(1.01) $0.21 $(0.04) Distributable (Loss) Earnings per share of common stock , b asic and diluted
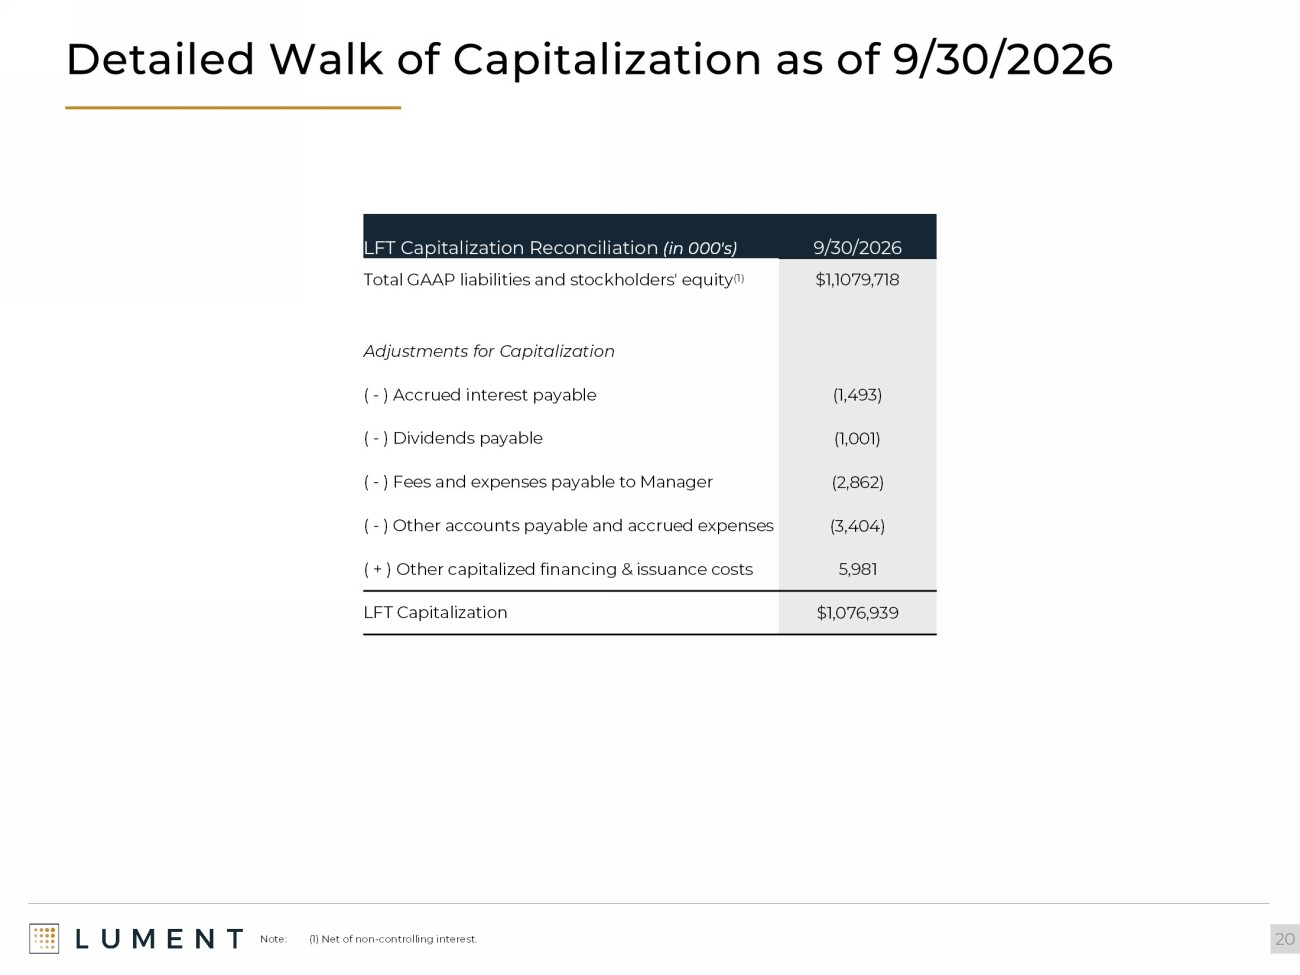
Detailed Walk of Capitalization as of 9/30/2026 20 9/30/2026 LFT Capitalization Reconciliation (in 000's) $1,1079,718 Total GAAP liabilities and stockholders' equity (1) Adjustments for Capitalization (1,493) ( - ) Accrued interest payable (1,001) ( - ) Dividends payable (2,862) ( - ) Fees and expenses payable to Manager (3,404) ( - ) Other accounts payable and accrued expenses 5,981 ( + ) Other capitalized financing & issuance costs $1,076,939 LFT Capitalization Note: (1) Net of non - controlling interest.
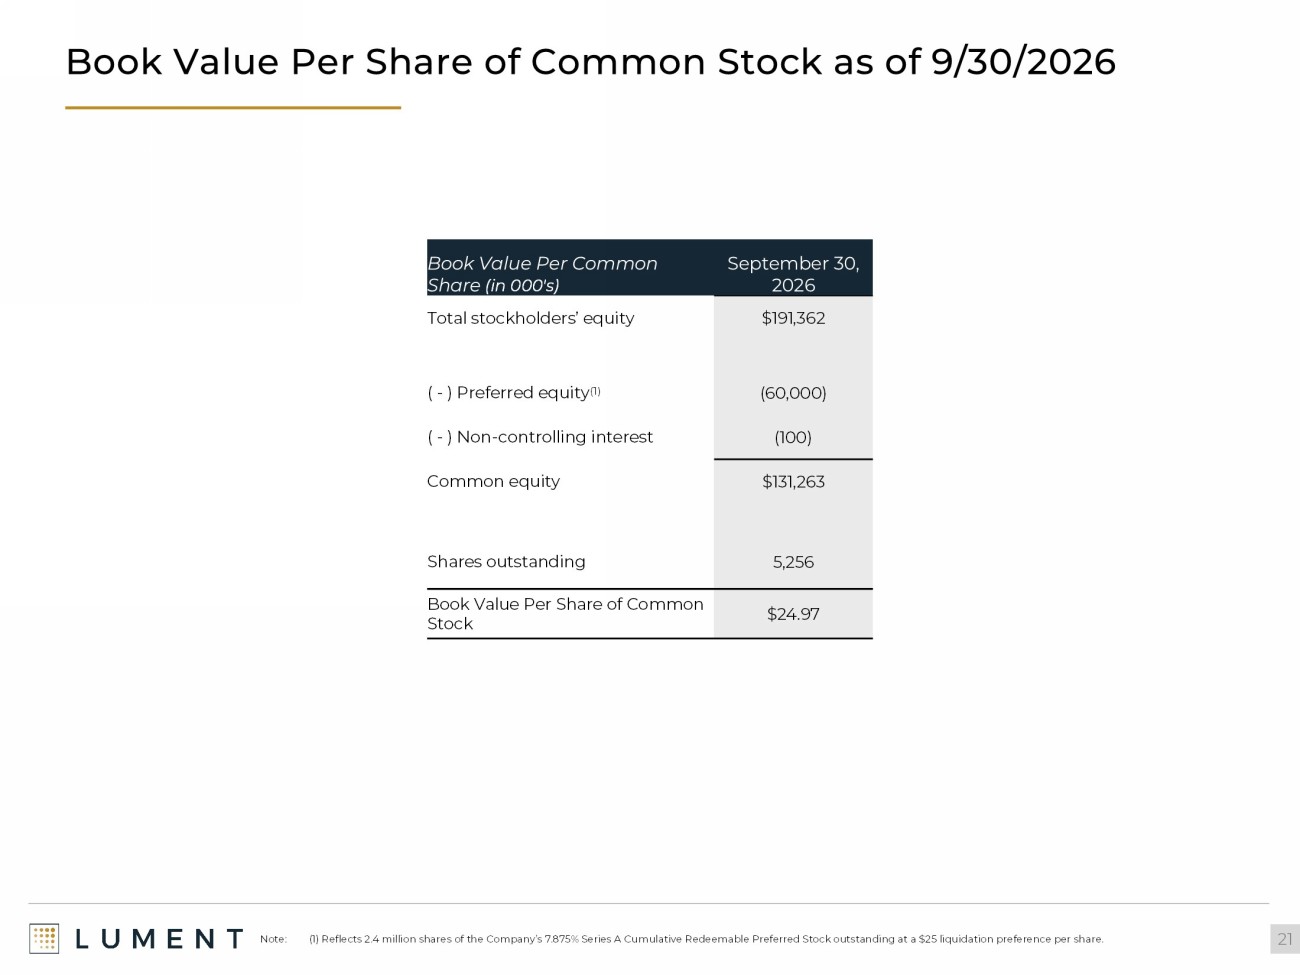
Book Value Per Share of Common Stock as of 9/30/2026 21 Note: (1) Reflects 2.4 million shares of the Company’s 7.875% Series A Cumulative Redeemable Preferred Stock outstanding at a $ 25 liquidation preference per share. September 30, 2026 Book Value Per Common Share (in 000's) $191,362 Total stockholders’ equity (60,000) ( - ) Preferred equity (1) (100) ( - ) Non - controlling interest $131,263 Common equity 5,256 Shares outstanding $24.97 Book Value Per Share of Common Stock
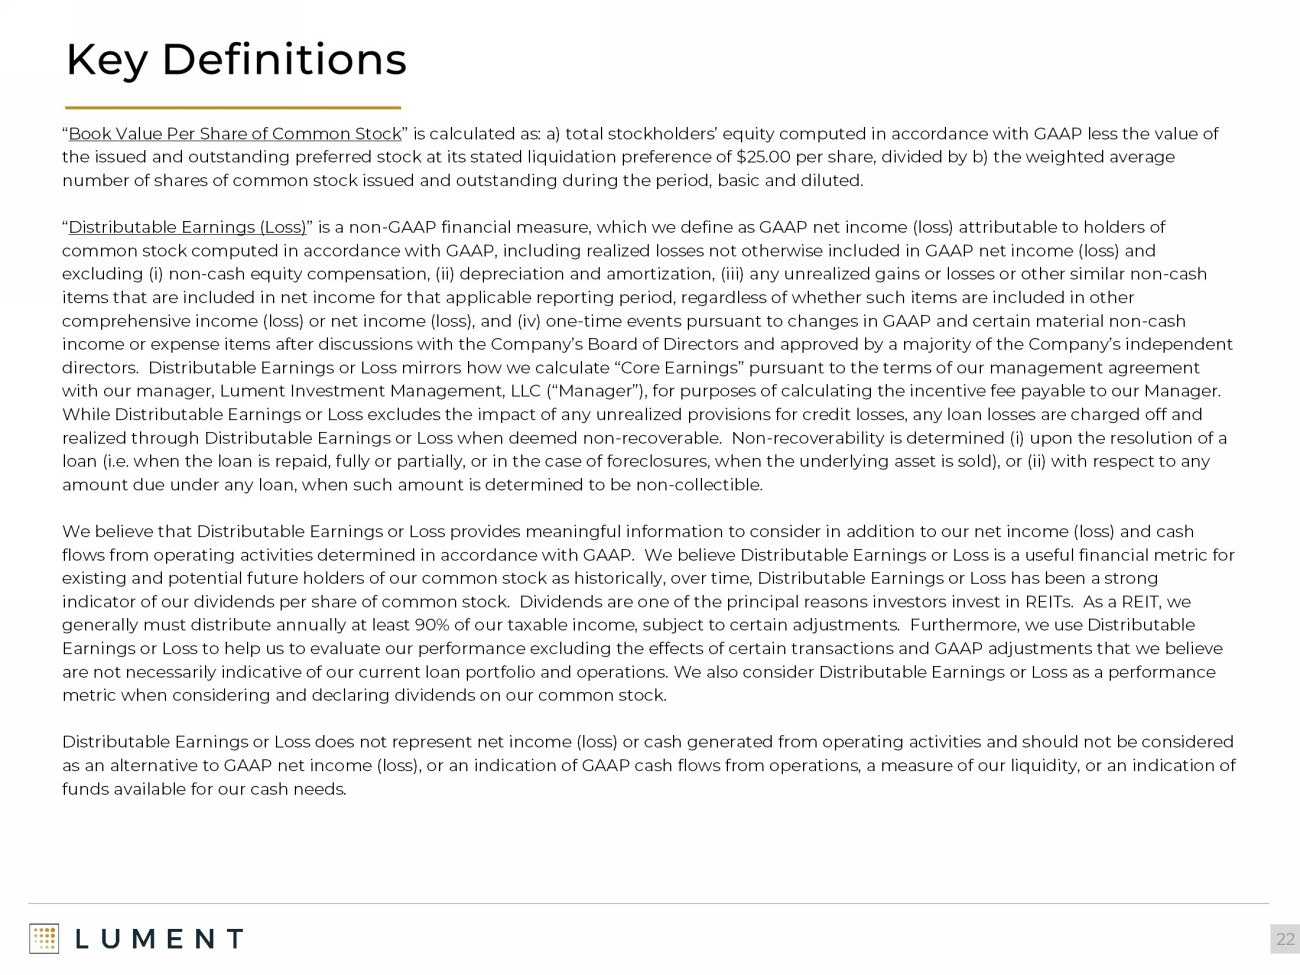
Key Definitions 22 “ Book Value Per Share of Common Stock ” is calculated as: a) total stockholders’ equity computed in accordance with GAAP less the value of the issued and outstanding preferred stock at its stated liquidation preference of $25.00 per share, divided by b) the weight ed average number of shares of common stock issued and outstanding during the period, basic and diluted. “ Distributable Earnings (Loss) ” is a non - GAAP financial measure, which we define as GAAP net income (loss) attributable to holders of common stock computed in accordance with GAAP, including realized losses not otherwise included in GAAP net income (loss) and excluding ( i ) non - cash equity compensation, (ii) depreciation and amortization, (iii) any unrealized gains or losses or other similar non - ca sh items that are included in net income for that applicable reporting period, regardless of whether such items are included in oth er comprehensive income (loss) or net income (loss), and (iv) one - time events pursuant to changes in GAAP and certain material non - cash income or expense items after discussions with the Company’s Board of Directors and approved by a majority of the Company’s i nde pendent directors. Distributable Earnings or Loss mirrors how we calculate “Core Earnings” pursuant to the terms of our management a gre ement with our manager, Lument Investment Management, LLC (“Manager”), for purposes of calculating the incentive fee payable to our Ma nager. While Distributable Earnings or Loss excludes the impact of any unrealized provisions for credit losses, any loan losses are cha rged off and realized through Distributable Earnings or Loss when deemed non - recoverable. Non - recoverability is determined ( i ) upon the resolution of a loan (i.e. when the loan is repaid, fully or partially, or in the case of foreclosures, when the underlying asset is sold), o r ( ii) with respect to any amount due under any loan, when such amount is determined to be non - collectible. We believe that Distributable Earnings or Loss provides meaningful information to consider in addition to our net income (los s) and cash flows from operating activities determined in accordance with GAAP. We believe Distributable Earnings or Loss is a useful fi nan cial metric for existing and potential future holders of our common stock as historically, over time, Distributable Earnings or Loss has been a strong indicator of our dividends per share of common stock. Dividends are one of the principal reasons investors invest in REITs. As a REIT, we generally must distribute annually at least 90% of our taxable income, subject to certain adjustments. Furthermore, we use D ist ributable Earnings or Loss to help us to evaluate our performance excluding the effects of certain transactions and GAAP adjustments th at we believe are not necessarily indicative of our current loan portfolio and operations. We also consider Distributable Earnings or Loss as a performance metric when considering and declaring dividends on our common stock. Distributable Earnings or Loss does not represent net income (loss) or cash generated from operating activities and should no t b e considered as an alternative to GAAP net income (loss), or an indication of GAAP cash flows from operations, a measure of our liquidity, or an indication of funds available for our cash needs.

November 2026