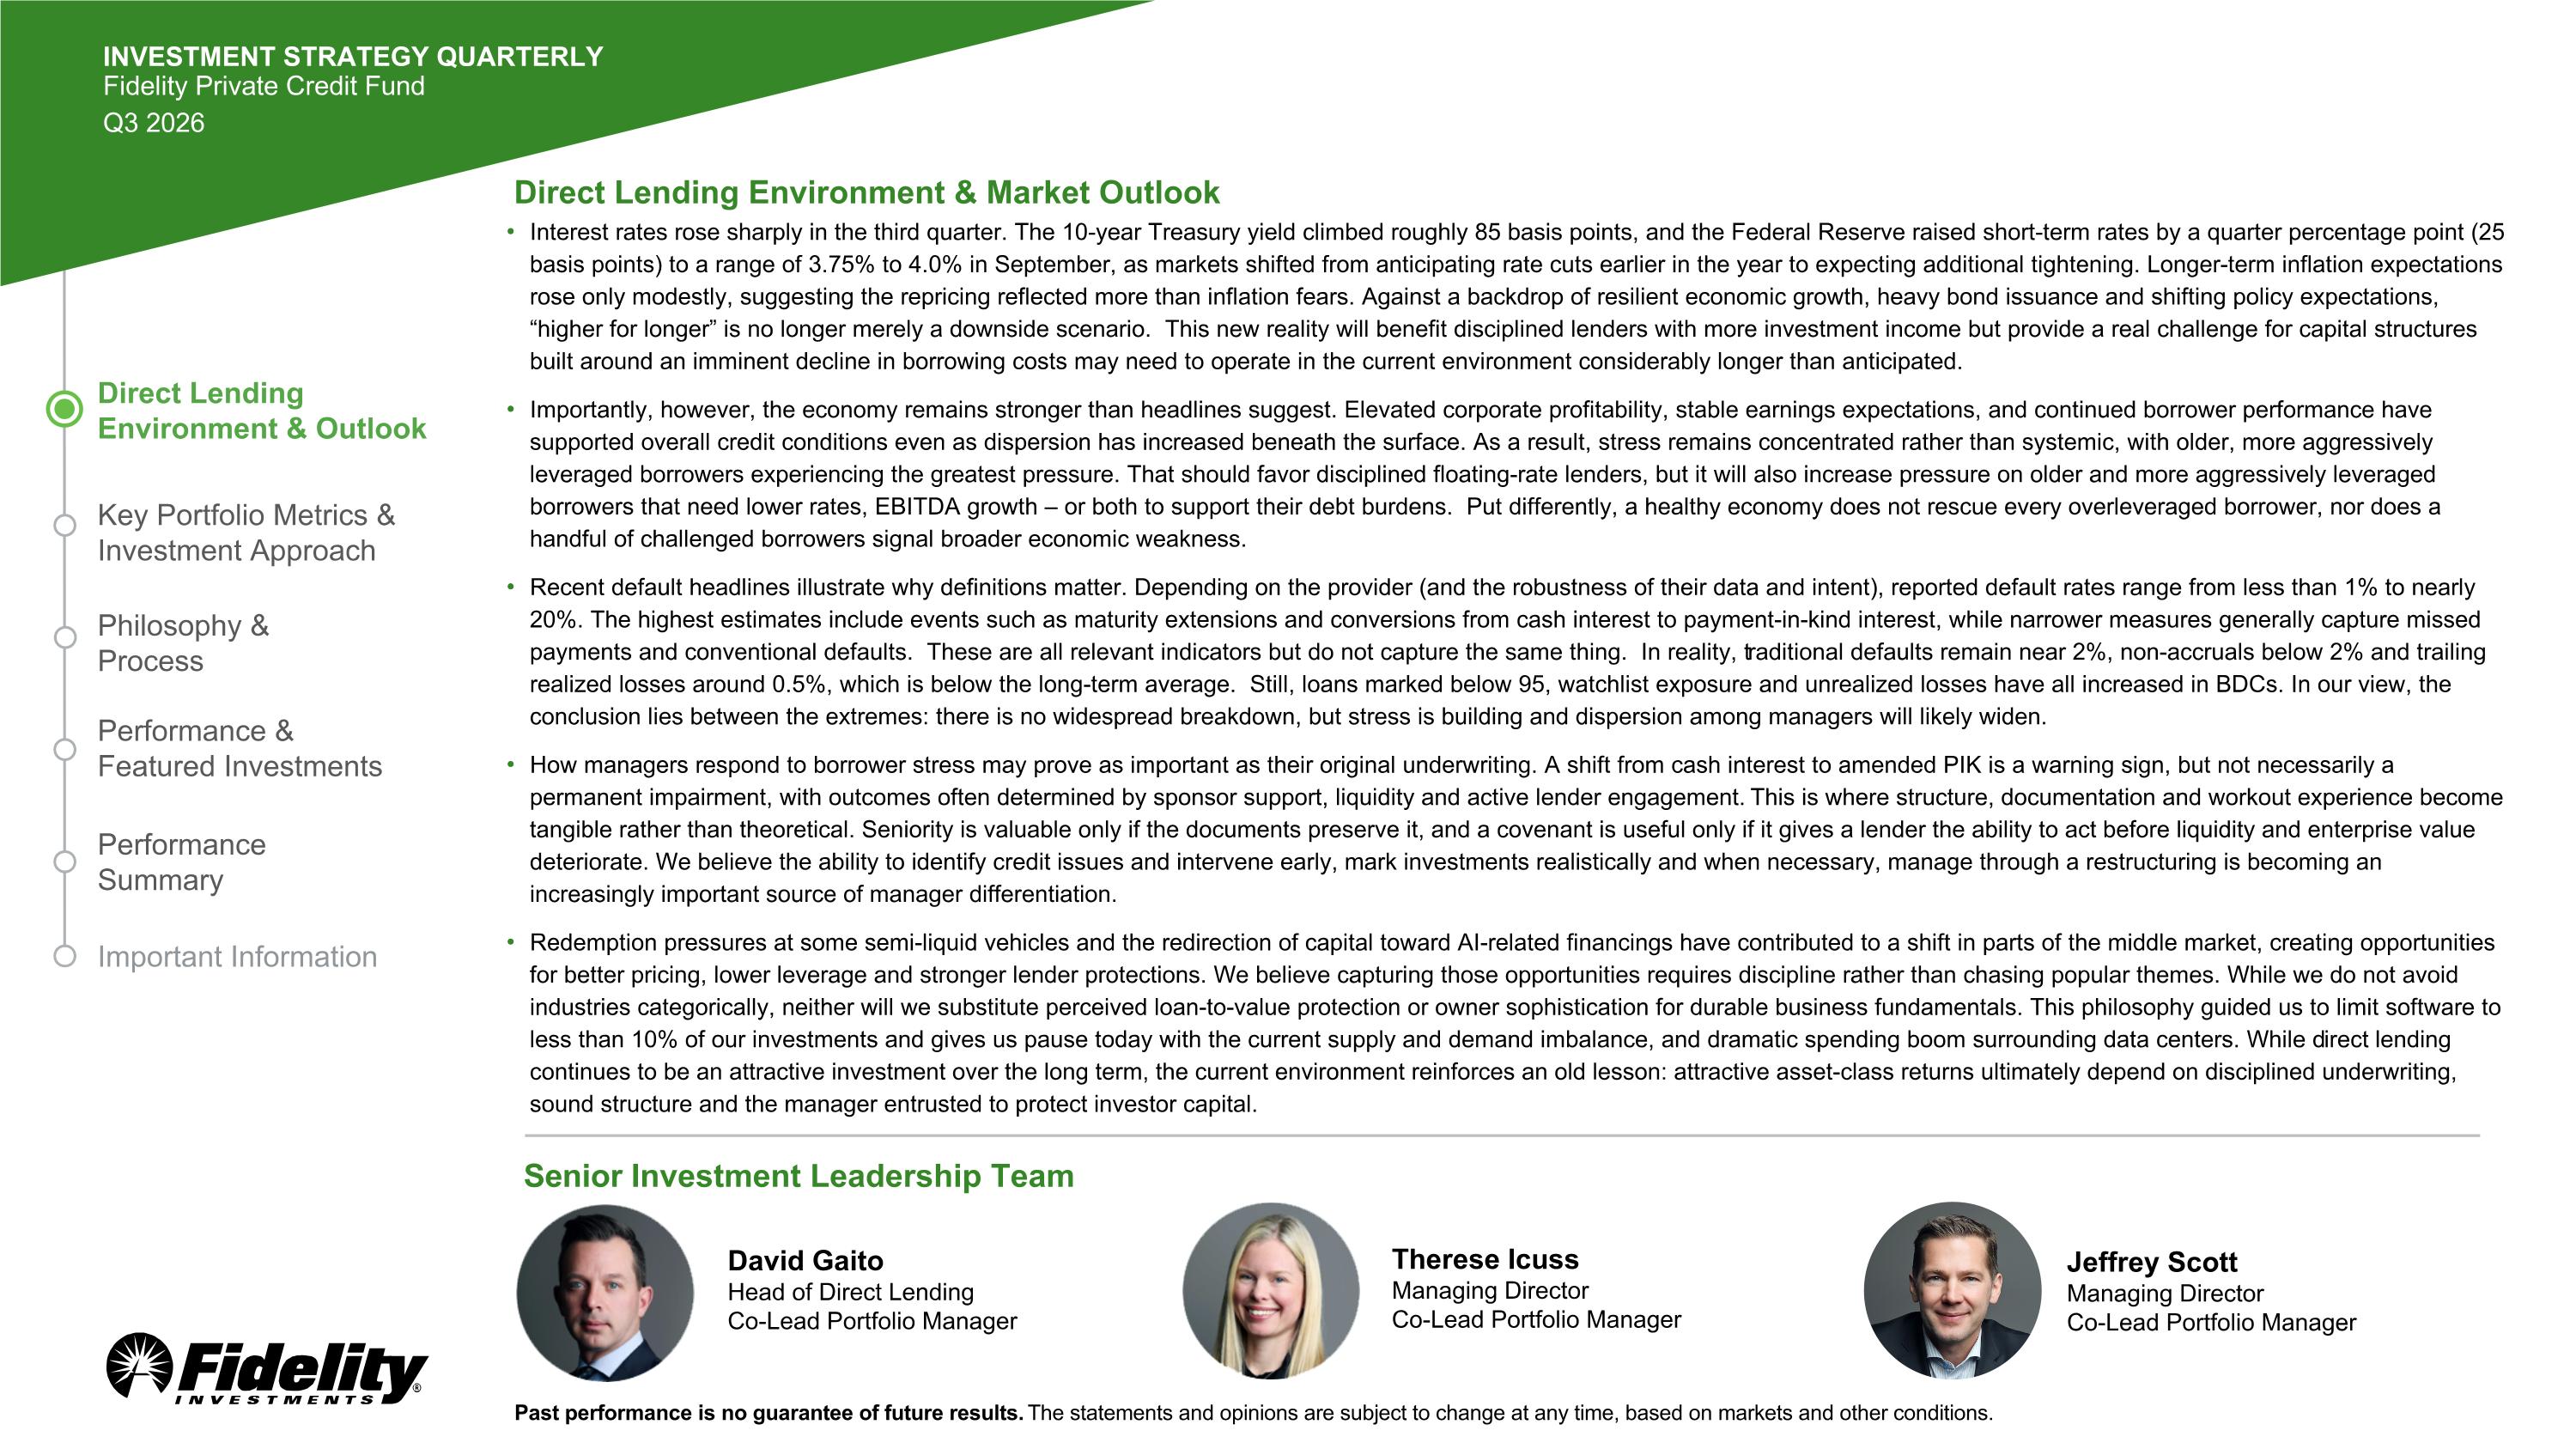
Key Portfolio Metrics & Investment Approach Philosophy & Process Performance & Featured Investments Direct Lending Environment & Outlook Performance Summary Important Information Direct Lending Environment & Market Outlook Interest rates rose sharply in the third quarter. The 10-year Treasury yield climbed roughly 85 basis points, and the Federal Reserve raised short-term rates by a quarter percentage point (25 basis points) to a range of 3.75% to 4.0% in September, as markets shifted from anticipating rate cuts earlier in the year to expecting additional tightening. Longer-term inflation expectations rose only modestly, suggesting the repricing reflected more than inflation fears. Against a backdrop of resilient economic growth, heavy bond issuance and shifting policy expectations, “higher for longer” is no longer merely a downside scenario. This new reality will benefit disciplined lenders with more investment income but provide a real challenge for capital structures built around an imminent decline in borrowing costs may need to operate in the current environment considerably longer than anticipated. Importantly, however, the economy remains stronger than headlines suggest. Elevated corporate profitability, stable earnings expectations, and continued borrower performance have supported overall credit conditions even as dispersion has increased beneath the surface. As a result, stress remains concentrated rather than systemic, with older, more aggressively leveraged borrowers experiencing the greatest pressure. That should favor disciplined floating-rate lenders, but it will also increase pressure on older and more aggressively leveraged borrowers that need lower rates, EBITDA growth – or both to support their debt burdens. Put differently, a healthy economy does not rescue every overleveraged borrower, nor does a handful of challenged borrowers signal broader economic weakness. Recent default headlines illustrate why definitions matter. Depending on the provider (and the robustness of their data and intent), reported default rates range from less than 1% to nearly 20%. The highest estimates include events such as maturity extensions and conversions from cash interest to payment-in-kind interest, while narrower measures generally capture missed payments and conventional defaults. These are all relevant indicators but do not capture the same thing. In reality, traditional defaults remain near 2%, non-accruals below 2% and trailing realized losses around 0.5%, which is below the long-term average. Still, loans marked below 95, watchlist exposure and unrealized losses have all increased in BDCs. In our view, the conclusion lies between the extremes: there is no widespread breakdown, but stress is building and dispersion among managers will likely widen. How managers respond to borrower stress may prove as important as their original underwriting. A shift from cash interest to amended PIK is a warning sign, but not necessarily a permanent impairment, with outcomes often determined by sponsor support, liquidity and active lender engagement. This is where structure, documentation and workout experience become tangible rather than theoretical. Seniority is valuable only if the documents preserve it, and a covenant is useful only if it gives a lender the ability to act before liquidity and enterprise value deteriorate. We believe the ability to identify credit issues and intervene early, mark investments realistically and when necessary, manage through a restructuring is becoming an increasingly important source of manager differentiation. Redemption pressures at some semi-liquid vehicles and the redirection of capital toward AI-related financings have contributed to a shift in parts of the middle market, creating opportunities for better pricing, lower leverage and stronger lender protections. We believe capturing those opportunities requires discipline rather than chasing popular themes. While we do not avoid industries categorically, neither will we substitute perceived loan-to-value protection or owner sophistication for durable business fundamentals. This philosophy guided us to limit software to less than 10% of our investments and gives us pause today with the current supply and demand imbalance, and dramatic spending boom surrounding data centers. While direct lending continues to be an attractive investment over the long term, the current environment reinforces an old lesson: attractive asset-class returns ultimately depend on disciplined underwriting, sound structure and the manager entrusted to protect investor capital. Senior Investment Leadership Team Therese Icuss Managing Director Co-Lead Portfolio Manager David Gaito Head of Direct Lending Co-Lead Portfolio Manager Past performance is no guarantee of future results. The statements and opinions are subject to change at any time, based on markets and other conditions. Jeffrey Scott Managing Director Co-Lead Portfolio Manager INVESTMENT STRATEGY QUARTERLY Fidelity Private Credit Fund Q3 2026
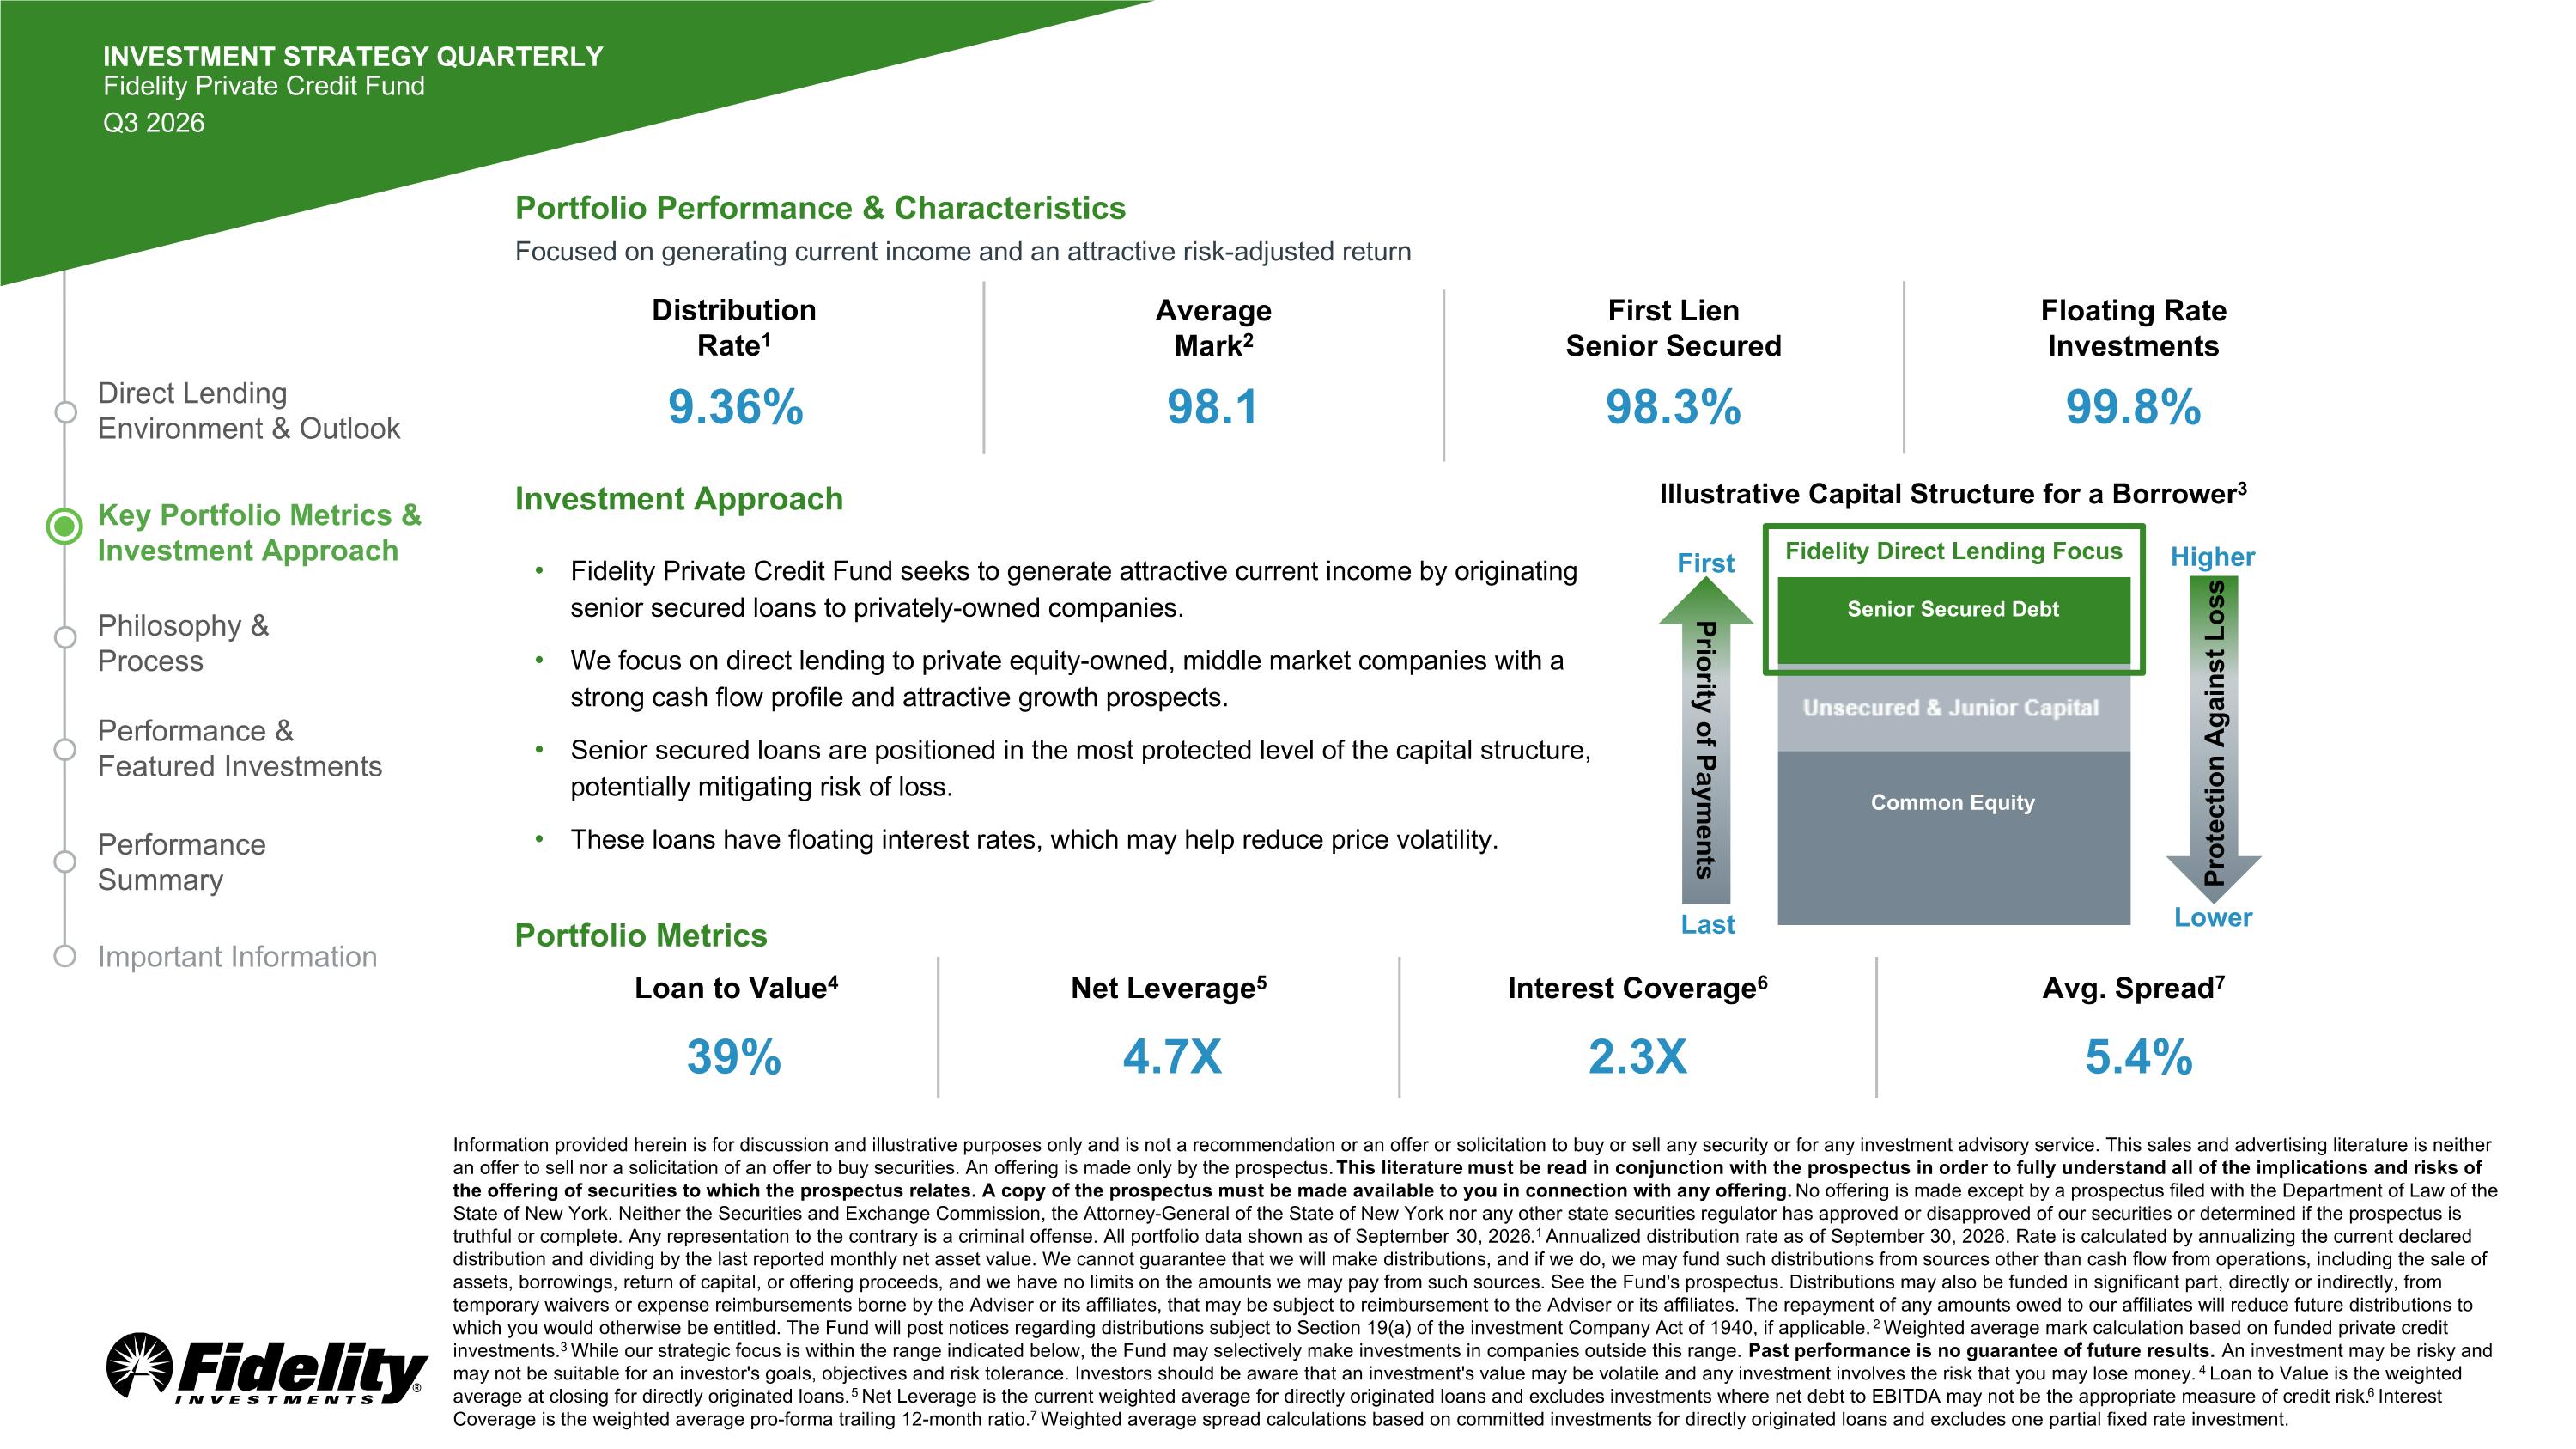
Portfolio Metrics Key Portfolio Metrics & Investment Approach Philosophy & Process Performance & Featured Investments Direct Lending Environment & Outlook Performance Summary Important Information INVESTMENT STRATEGY QUARTERLY Fidelity Private Credit Fund Q3 2026 Information provided herein is for discussion and illustrative purposes only and is not a recommendation or an offer or solicitation to buy or sell any security or for any investment advisory service. This sales and advertising literature is neither an offer to sell nor a solicitation of an offer to buy securities. An offering is made only by the prospectus. This literature must be read in conjunction with the prospectus in order to fully understand all of the implications and risks of the offering of securities to which the prospectus relates. A copy of the prospectus must be made available to you in connection with any offering. No offering is made except by a prospectus filed with the Department of Law of the State of New York. Neither the Securities and Exchange Commission, the Attorney-General of the State of New York nor any other state securities regulator has approved or disapproved of our securities or determined if the prospectus is truthful or complete. Any representation to the contrary is a criminal offense. All portfolio data shown as of September 30, 2026.1 Annualized distribution rate as of September 30, 2026. Rate is calculated by annualizing the current declared distribution and dividing by the last reported monthly net asset value. We cannot guarantee that we will make distributions, and if we do, we may fund such distributions from sources other than cash flow from operations, including the sale of assets, borrowings, return of capital, or offering proceeds, and we have no limits on the amounts we may pay from such sources. See the Fund's prospectus. Distributions may also be funded in significant part, directly or indirectly, from temporary waivers or expense reimbursements borne by the Adviser or its affiliates, that may be subject to reimbursement to the Adviser or its affiliates. The repayment of any amounts owed to our affiliates will reduce future distributions to which you would otherwise be entitled. The Fund will post notices regarding distributions subject to Section 19(a) of the investment Company Act of 1940, if applicable. 2 Weighted average mark calculation based on funded private credit investments.3 While our strategic focus is within the range indicated below, the Fund may selectively make investments in companies outside this range. Past performance is no guarantee of future results. An investment may be risky and may not be suitable for an investor's goals, objectives and risk tolerance. Investors should be aware that an investment's value may be volatile and any investment involves the risk that you may lose money. 4 Loan to Value is the weighted average at closing for directly originated loans. 5 Net Leverage is the current weighted average for directly originated loans and excludes investments where net debt to EBITDA may not be the appropriate measure of credit risk. 6 Interest Coverage is the weighted average pro-forma trailing 12-month ratio. 7 Weighted average spread calculations based on committed investments for directly originated loans and excludes one partial fixed rate investment. Fidelity Private Credit Fund seeks to generate attractive current income by originating senior secured loans to privately-owned companies. We focus on direct lending to private equity-owned, middle market companies with a strong cash flow profile and attractive growth prospects. Senior secured loans are positioned in the most protected level of the capital structure, potentially mitigating risk of loss. These loans have floating interest rates, which may help reduce price volatility. Investment Approach Senior Secured Debt Unsecured & Junior Capital Common Equity Illustrative Capital Structure for a Borrower3 Priority of Payments First Last Protection Against Loss Higher Lower Fidelity Direct Lending Focus Portfolio Performance & Characteristics Focused on generating current income and an attractive risk-adjusted return Loan to Value4 39% Net Leverage5 4.7X Interest Coverage6 2.3X Avg. Spread7 5.4% Distribution Rate1 9.36% First Lien Senior Secured 98.3% Floating Rate Investments 99.8% Average Mark2 98.1
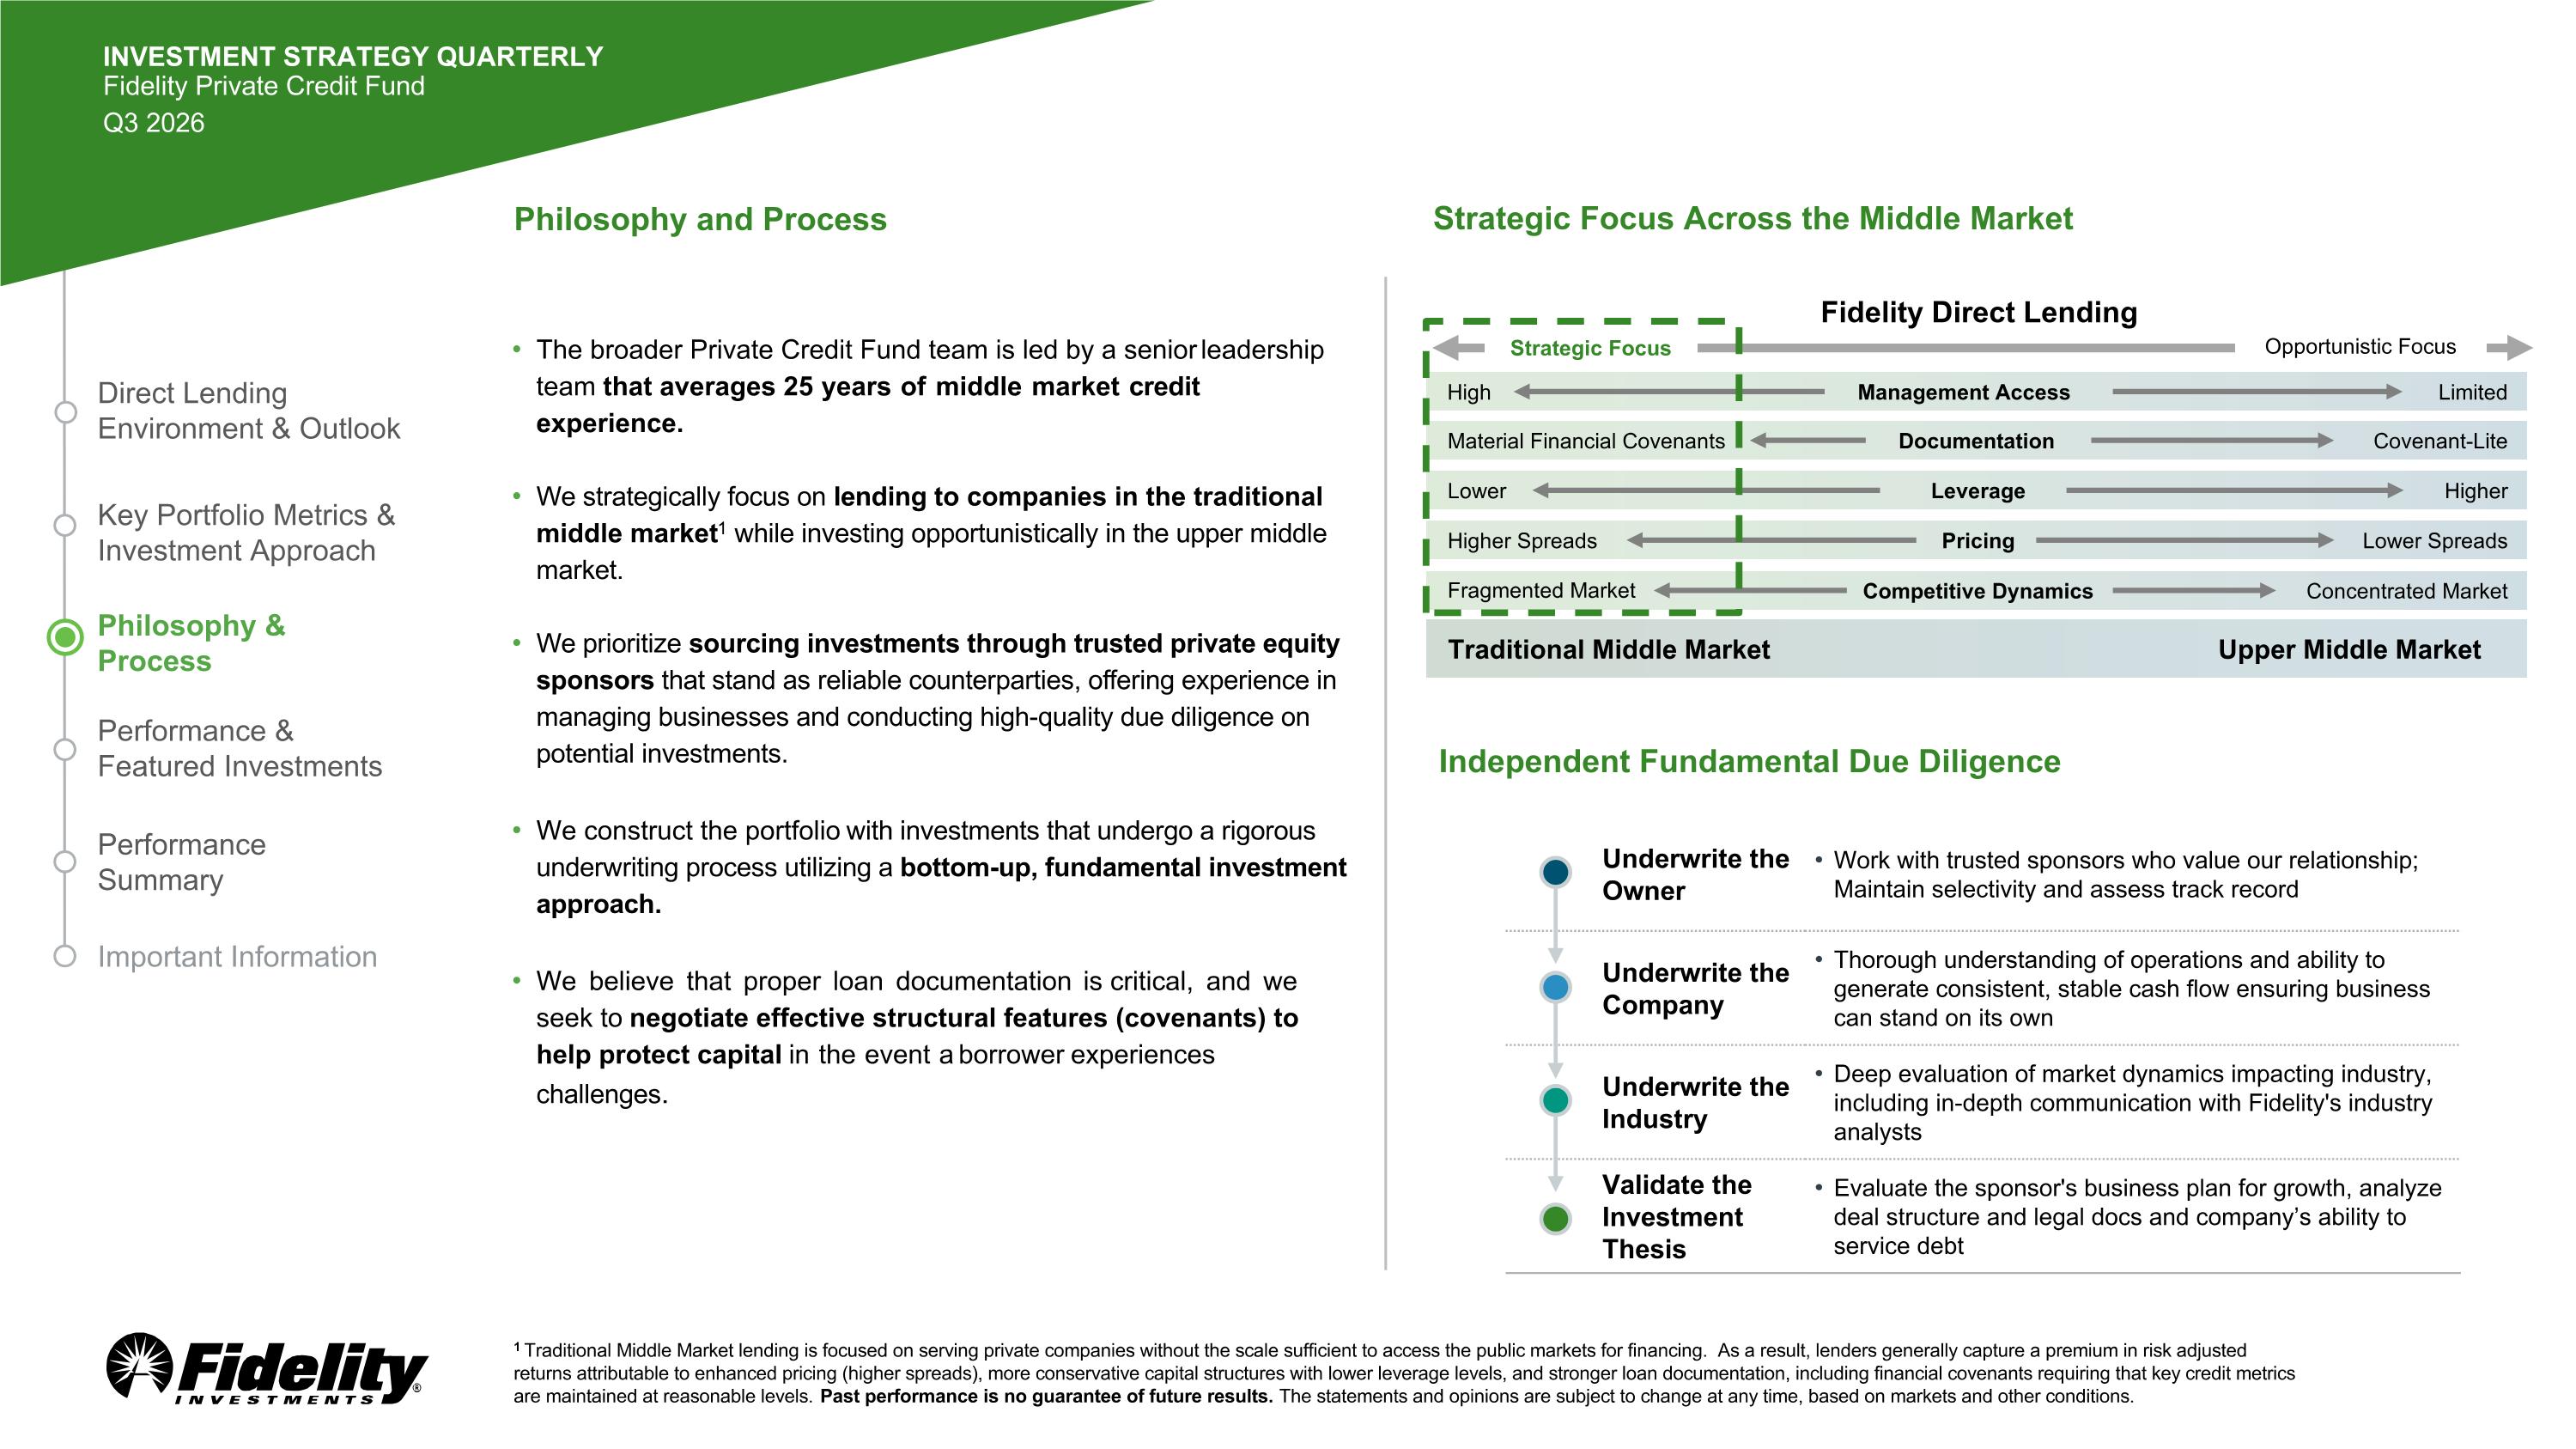
Key Portfolio Metrics & Investment Approach Philosophy & Process Performance & Featured Investments Direct Lending Environment & Outlook Performance Summary Important Information Philosophy and Process The broader Private Credit Fund team is led by a senior leadership team that averages 25 years of middle market credit experience. We strategically focus on lending to companies in the traditional middle market1 while investing opportunistically in the upper middle market. We prioritize sourcing investments through trusted private equity sponsors that stand as reliable counterparties, offering experience in managing businesses and conducting high-quality due diligence on potential investments. We construct the portfolio with investments that undergo a rigorous underwriting process utilizing a bottom-up, fundamental investment approach. We believe that proper loan documentation is critical, and we seek to negotiate effective structural features (covenants) to help protect capital in the event a borrower experiences challenges. 1 Traditional Middle Market lending is focused on serving private companies without the scale sufficient to access the public markets for financing. As a result, lenders generally capture a premium in risk adjusted returns attributable to enhanced pricing (higher spreads), more conservative capital structures with lower leverage levels, and stronger loan documentation, including financial covenants requiring that key credit metrics are maintained at reasonable levels. Past performance is no guarantee of future results. The statements and opinions are subject to change at any time, based on markets and other conditions. Independent Fundamental Due Diligence Underwrite the Owner Work with trusted sponsors who value our relationship; Maintain selectivity and assess track record Underwrite the Company Thorough understanding of operations and ability to generate consistent, stable cash flow ensuring business can stand on its own Underwrite the Industry Deep evaluation of market dynamics impacting industry, including in-depth communication with Fidelity's industry analysts Validate the Investment Thesis Evaluate the sponsor's business plan for growth, analyze deal structure and legal docs and company’s ability to service debt INVESTMENT STRATEGY QUARTERLY Fidelity Private Credit Fund Q3 2026 Strategic Focus Across the Middle Market Strategic Focus High Management Access Limited Material Financial Covenants Documentation Covenant-Lite Lower Leverage Higher Higher Spreads Pricing Lower Spreads Fragmented Market Competitive Dynamics Concentrated Market Traditional Middle Market Upper Middle Market Opportunistic Focus Fidelity Direct Lending
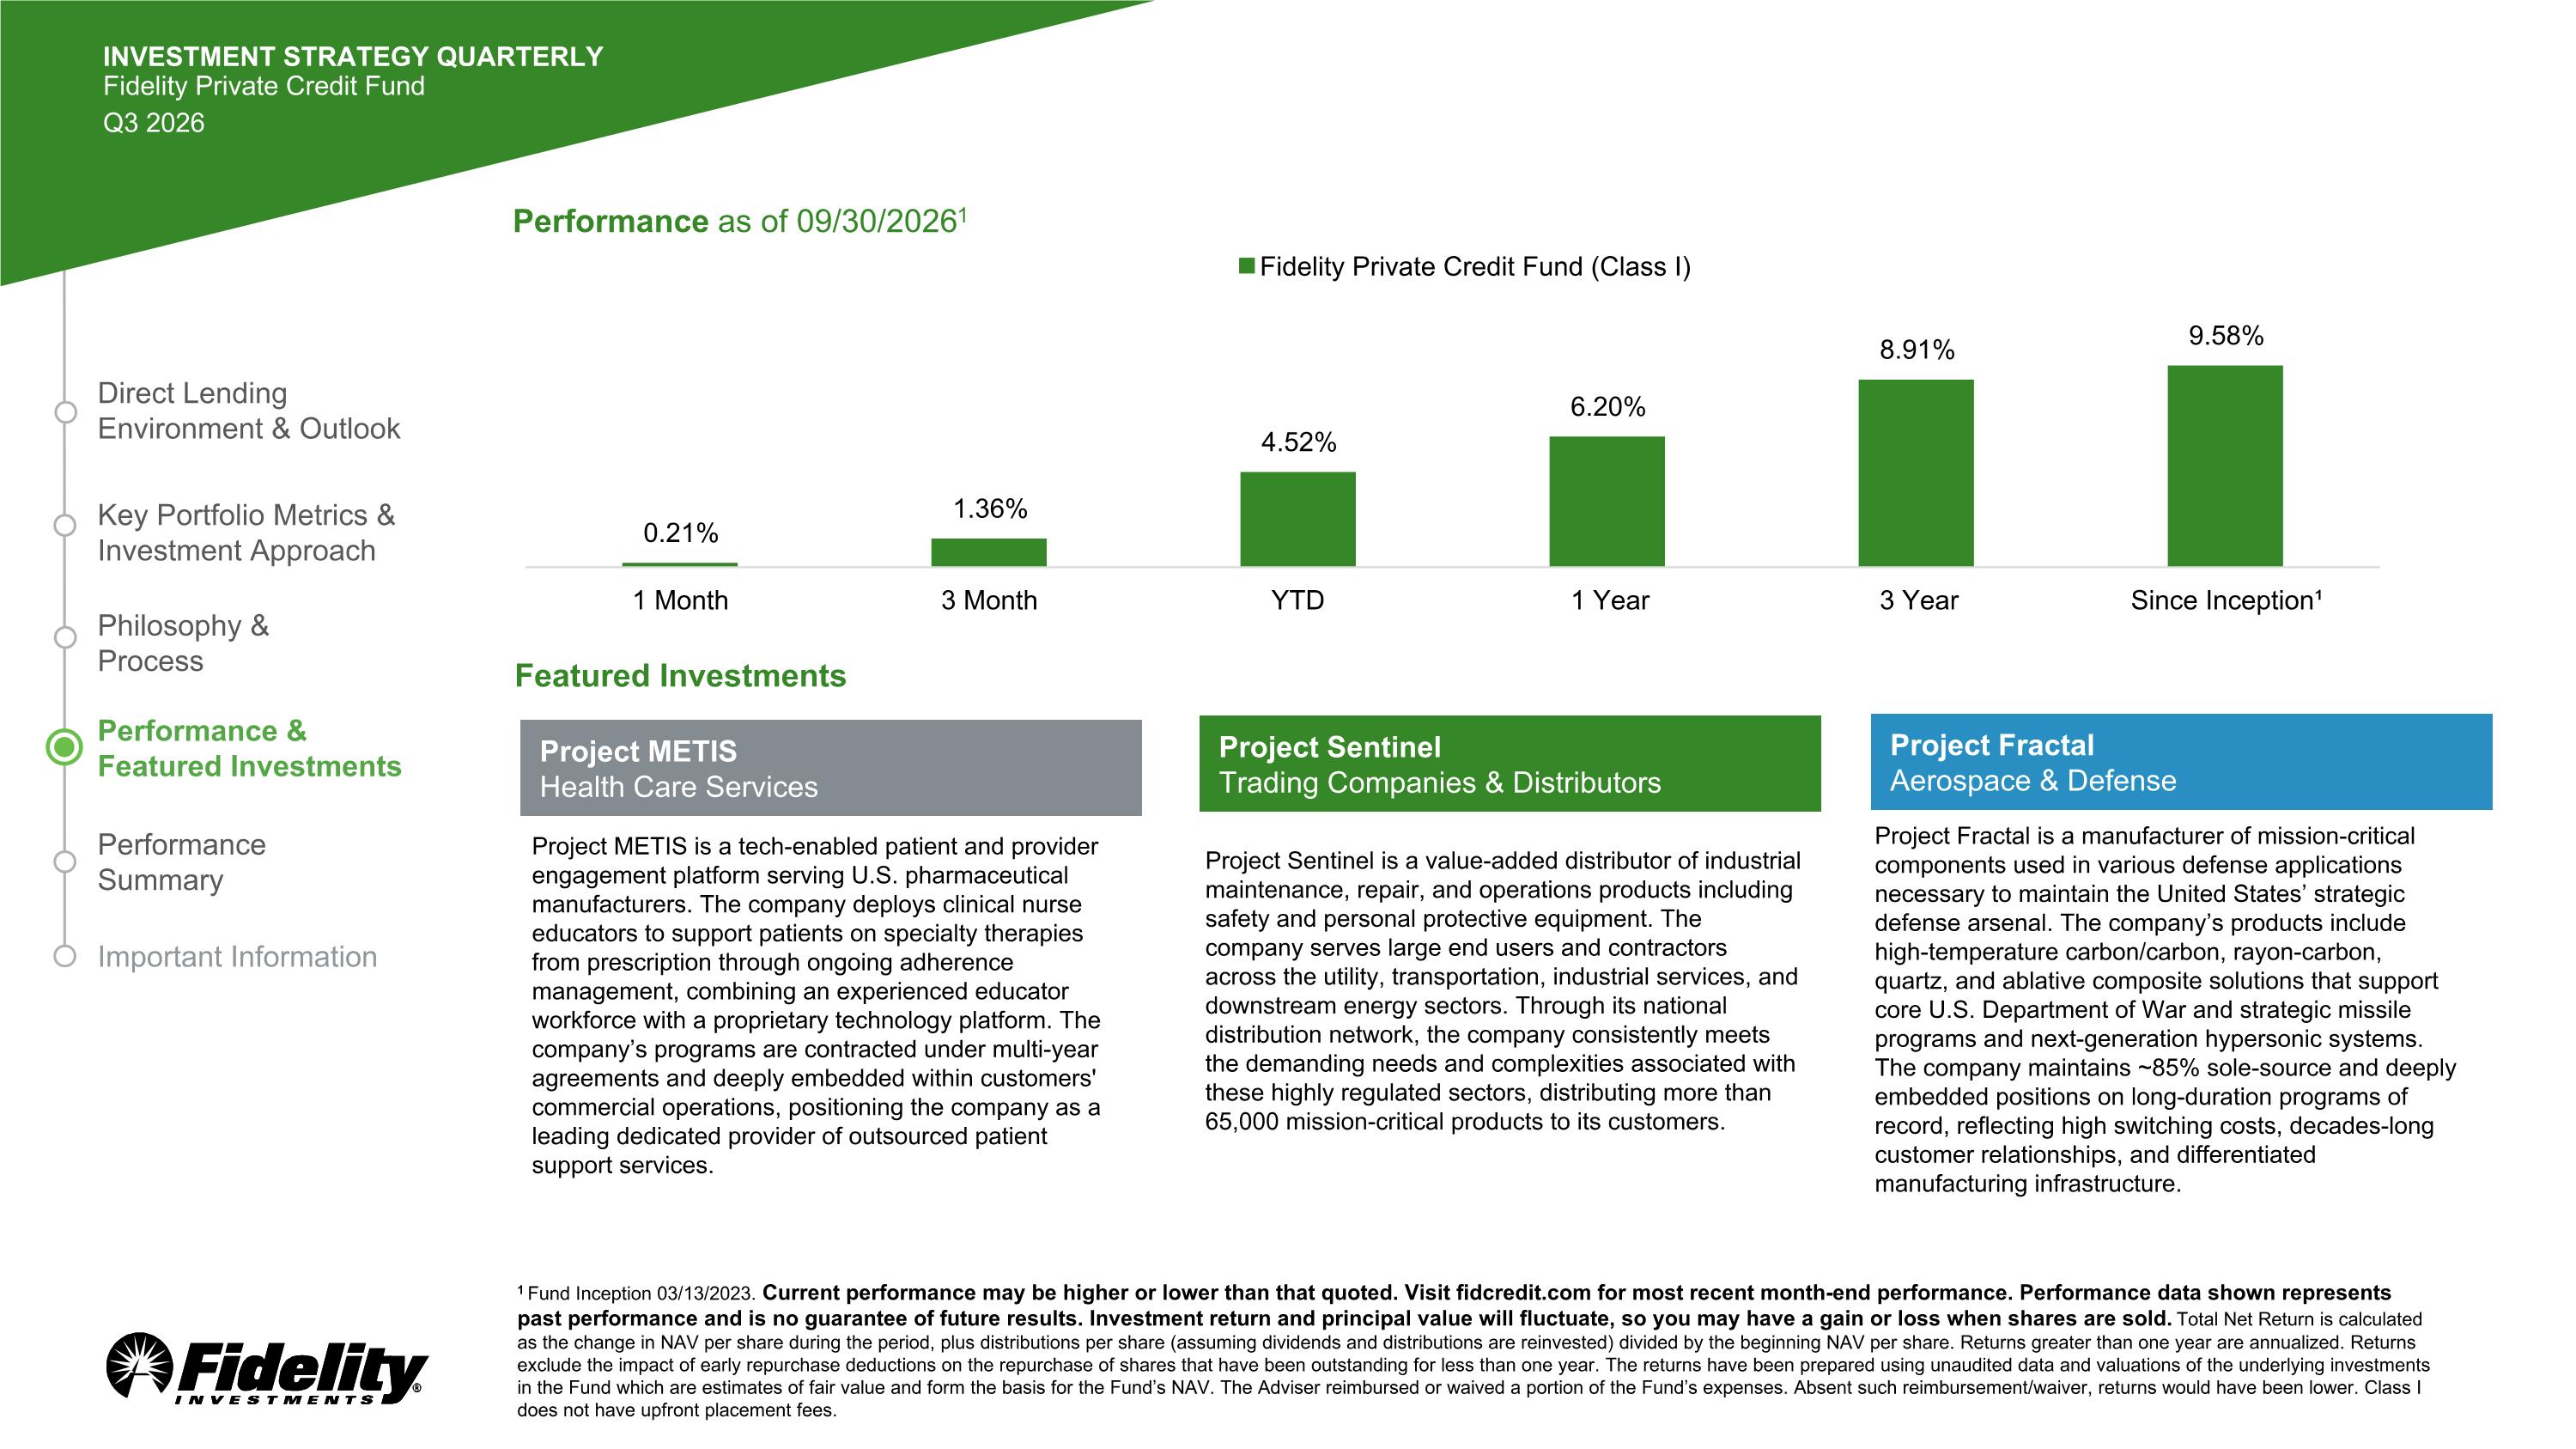
Key Portfolio Metrics & Investment Approach Philosophy & Process Performance & Featured Investments Direct Lending Environment & Outlook Performance Summary Important Information Performance as of 09/30/20261 1 Fund Inception 03/13/2023. Current performance may be higher or lower than that quoted. Visit fidcredit.com for most recent month-end performance. Performance data shown represents past performance and is no guarantee of future results. Investment return and principal value will fluctuate, so you may have a gain or loss when shares are sold. Total Net Return is calculated as the change in NAV per share during the period, plus distributions per share (assuming dividends and distributions are reinvested) divided by the beginning NAV per share. Returns greater than one year are annualized. Returns exclude the impact of early repurchase deductions on the repurchase of shares that have been outstanding for less than one year. The returns have been prepared using unaudited data and valuations of the underlying investments in the Fund which are estimates of fair value and form the basis for the Fund’s NAV. The Adviser reimbursed or waived a portion of the Fund’s expenses. Absent such reimbursement/waiver, returns would have been lower. Class I does not have upfront placement fees. INVESTMENT STRATEGY QUARTERLY Fidelity Private Credit Fund Q3 2026 Featured Investments Project Fractal is a manufacturer of mission-critical components used in various defense applications necessary to maintain the United States’ strategic defense arsenal. The company’s products include high-temperature carbon/carbon, rayon-carbon, quartz, and ablative composite solutions that support core U.S. Department of War and strategic missile programs and next-generation hypersonic systems. The company maintains ~85% sole-source and deeply embedded positions on long-duration programs of record, reflecting high switching costs, decades-long customer relationships, and differentiated manufacturing infrastructure. Project Fractal Aerospace & Defense Project METIS is a tech-enabled patient and provider engagement platform serving U.S. pharmaceutical manufacturers. The company deploys clinical nurse educators to support patients on specialty therapies from prescription through ongoing adherence management, combining an experienced educator workforce with a proprietary technology platform. The company’s programs are contracted under multi-year agreements and deeply embedded within customers' commercial operations, positioning the company as a leading dedicated provider of outsourced patient support services. Project METIS Health Care Services Project Sentinel is a value-added distributor of industrial maintenance, repair, and operations products including safety and personal protective equipment. The company serves large end users and contractors across the utility, transportation, industrial services, and downstream energy sectors. Through its national distribution network, the company consistently meets the demanding needs and complexities associated with these highly regulated sectors, distributing more than 65,000 mission-critical products to its customers. Project Sentinel Trading Companies & Distributors
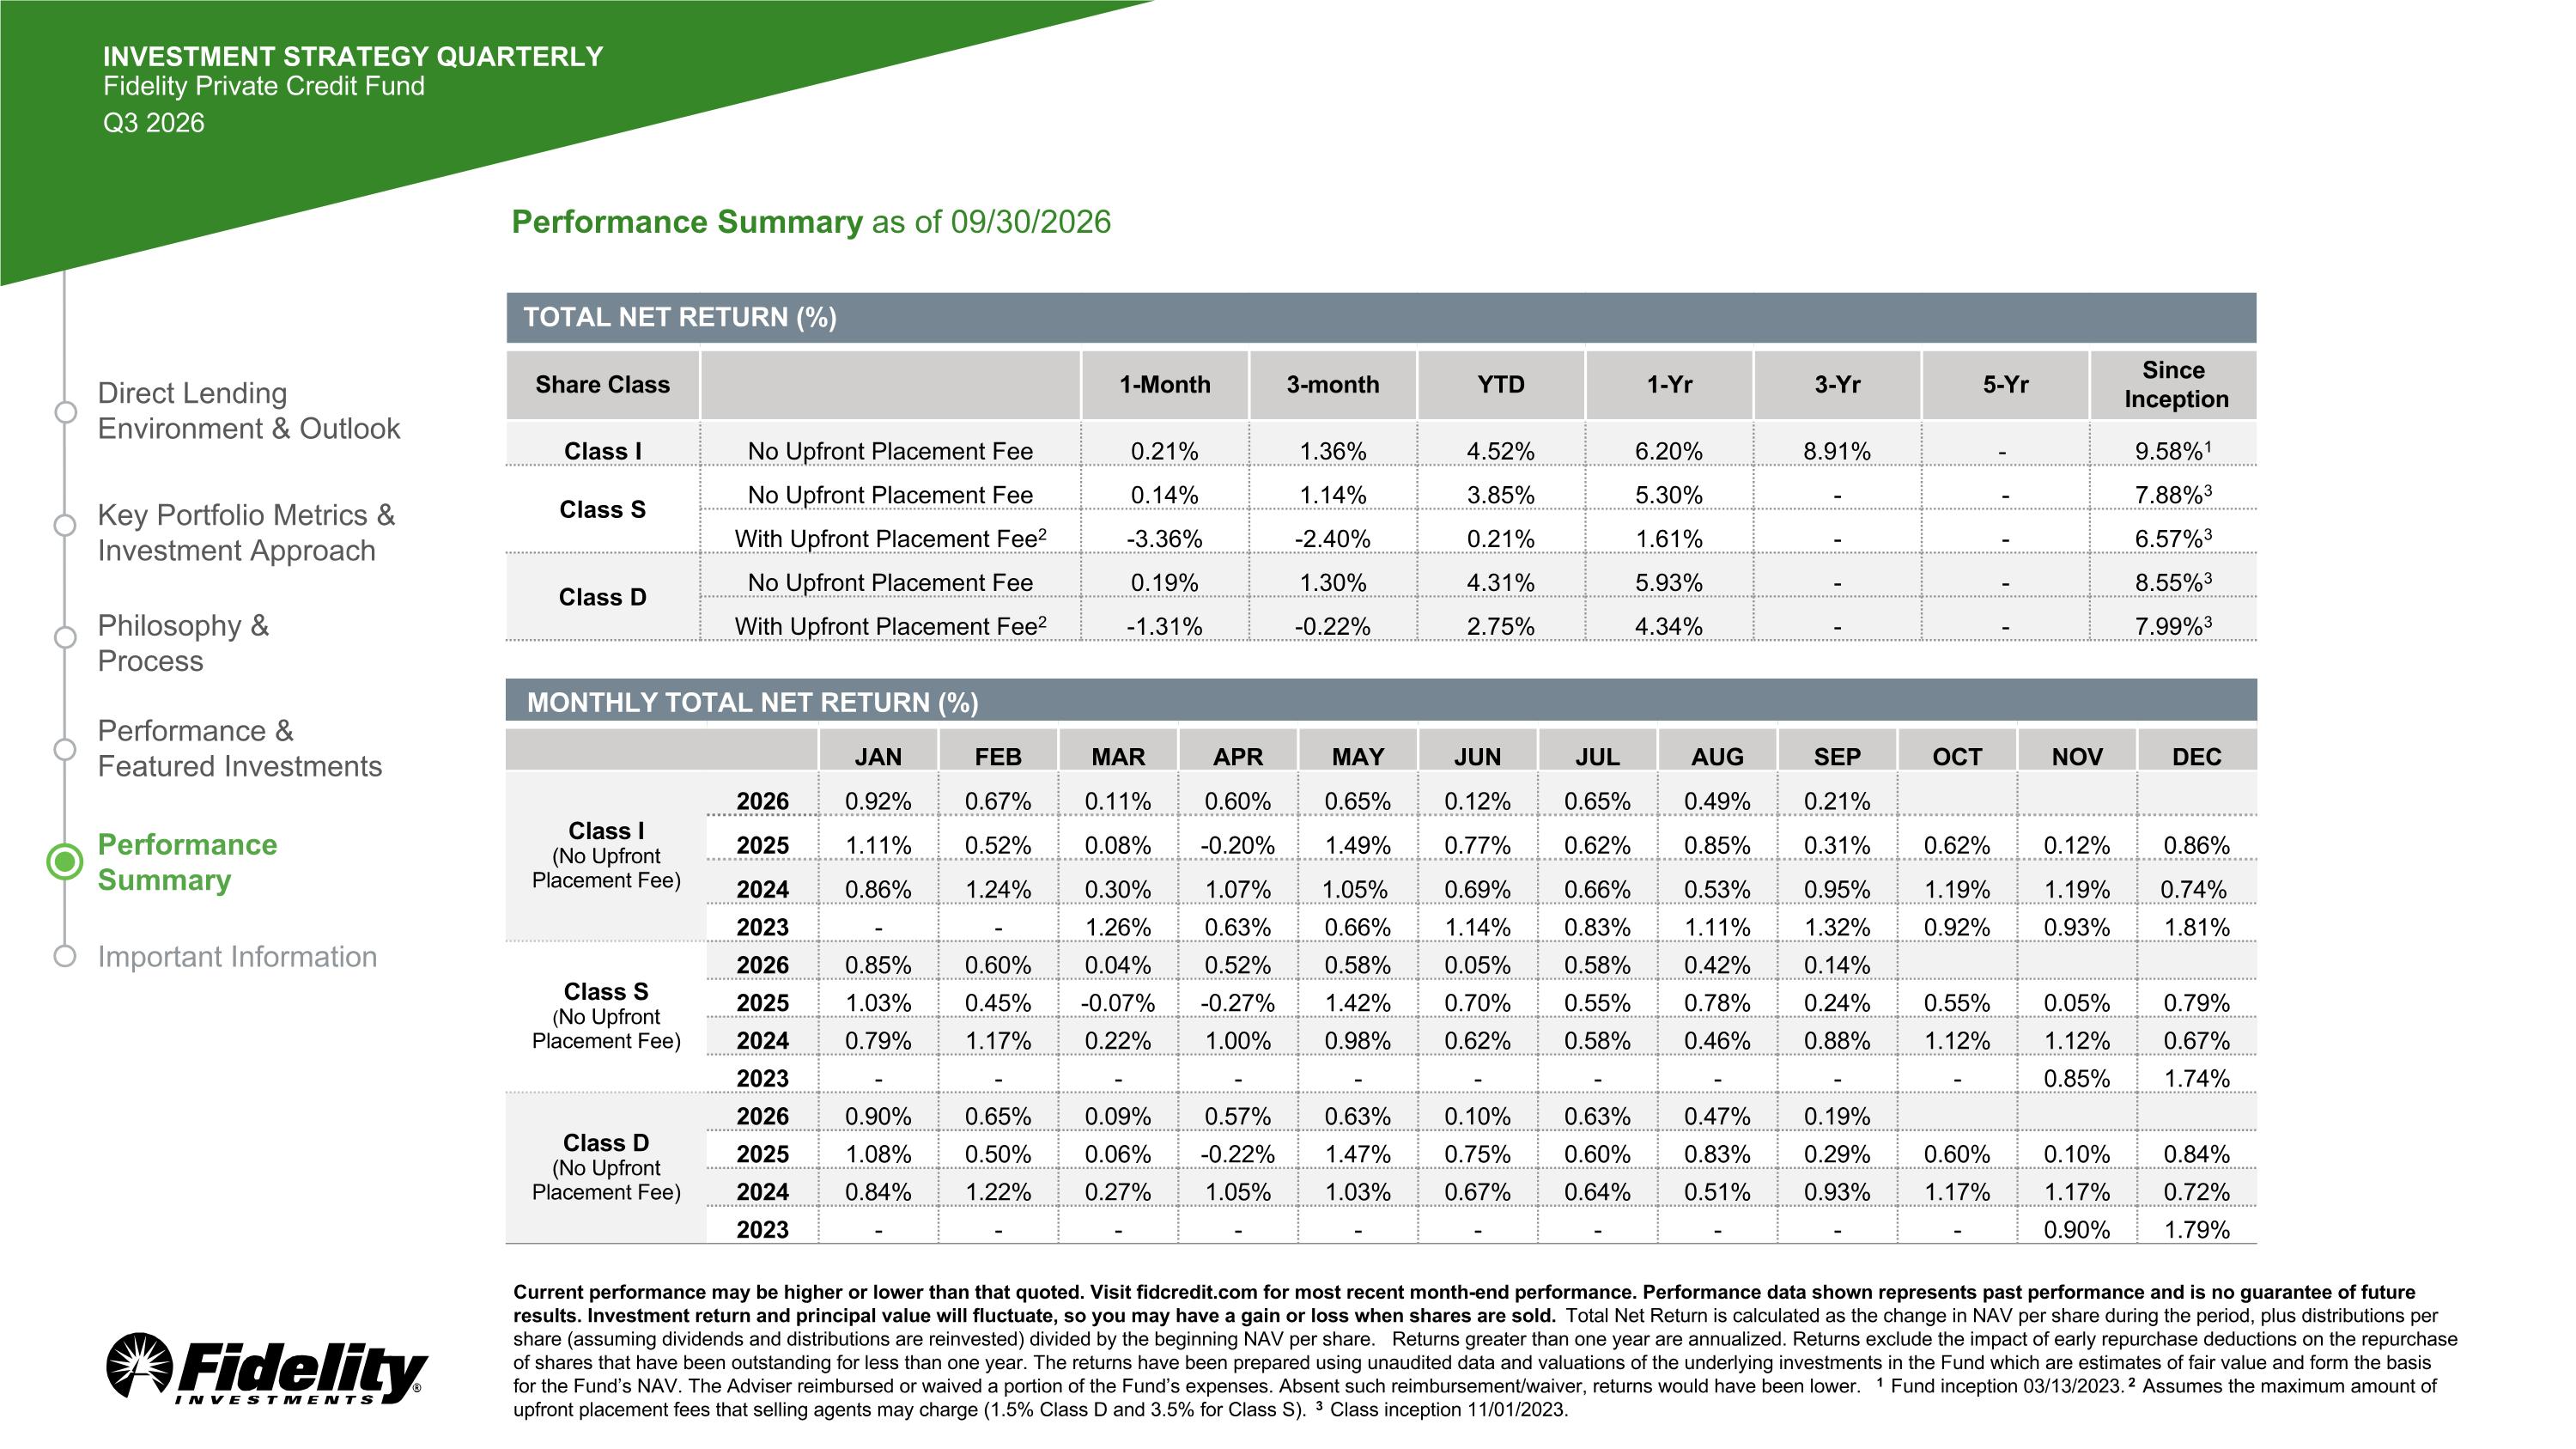
Key Portfolio Metrics & Investment Approach Philosophy & Process Performance & Featured Investments Direct Lending Environment & Outlook Performance Summary Important Information Performance Summary as of 09/30/2026 TOTAL NET RETURN (%) Share Class 1-Month 3-month YTD 1-Yr 3-Yr 5-Yr Since Inception Class I No Upfront Placement Fee 0.21% 1.36% 4.52% 6.20% 8.91% - 9.58%1 Class S No Upfront Placement Fee 0.14% 1.14% 3.85% 5.30% - - 7.88%3 With Upfront Placement Fee2 -3.36% -2.40% 0.21% 1.61% - - 6.57%3 Class D No Upfront Placement Fee 0.19% 1.30% 4.31% 5.93% - - 8.55%3 With Upfront Placement Fee2 -1.31% -0.22% 2.75% 4.34% - - 7.99%3 INVESTMENT STRATEGY QUARTERLY Fidelity Private Credit Fund Q3 2026 MONTHLY TOTAL NET RETURN (%) JAN FEB MAR APR MAY JUN JUL AUG SEP OCT NOV DEC Class I (No Upfront Placement Fee) 2026 0.92% 0.67% 0.11% 0.60% 0.65% 0.12% 0.65% 0.49% 0.21% 2025 1.11% 0.52% 0.08% -0.20% 1.49% 0.77% 0.62% 0.85% 0.31% 0.62% 0.12% 0.86% 2024 0.86% 1.24% 0.30% 1.07% 1.05% 0.69% 0.66% 0.53% 0.95% 1.19% 1.19% 0.74% 2023 - - 1.26% 0.63% 0.66% 1.14% 0.83% 1.11% 1.32% 0.92% 0.93% 1.81% Class S (No Upfront Placement Fee) 2026 0.85% 0.60% 0.04% 0.52% 0.58% 0.05% 0.58% 0.42% 0.14% 2025 1.03% 0.45% -0.07% -0.27% 1.42% 0.70% 0.55% 0.78% 0.24% 0.55% 0.05% 0.79% 2024 0.79% 1.17% 0.22% 1.00% 0.98% 0.62% 0.58% 0.46% 0.88% 1.12% 1.12% 0.67% 2023 - - - - - - - - - - 0.85% 1.74% Class D (No Upfront Placement Fee) 2026 0.90% 0.65% 0.09% 0.57% 0.63% 0.10% 0.63% 0.47% 0.19% 2025 1.08% 0.50% 0.06% -0.22% 1.47% 0.75% 0.60% 0.83% 0.29% 0.60% 0.10% 0.84% 2024 0.84% 1.22% 0.27% 1.05% 1.03% 0.67% 0.64% 0.51% 0.93% 1.17% 1.17% 0.72% 2023 - - - - - - - - - - 0.90% 1.79% Current performance may be higher or lower than that quoted. Visit fidcredit.com for most recent month-end performance. Performance data shown represents past performance and is no guarantee of future results. Investment return and principal value will fluctuate, so you may have a gain or loss when shares are sold.Total Net Return is calculated as the change in NAV per share during the period, plus distributions per share (assuming dividends and distributions are reinvested) divided by the beginning NAV per share. Returns greater than one year are annualized. Returns exclude the impact of early repurchase deductions on the repurchase of shares that have been outstanding for less than one year. The returns have been prepared using unaudited data and valuations of the underlying investments in the Fund which are estimates of fair value and form the basis for the Fund’s NAV. The Adviser reimbursed or waived a portion of the Fund’s expenses. Absent such reimbursement/waiver, returns would have been lower.1 Fund inception 03/13/2023.2 Assumes the maximum amount of upfront placement fees that selling agents may charge (1.5% Class D and 3.5% for Class S).3 Class inception 11/01/2023.
Key Portfolio Metrics & Investment Approach Philosophy & Process Performance & Featured Investments Direct Lending Environment & Outlook Performance Summary Important Information Important Information Unless otherwise expressly disclosed to you in writing, the information provided in this material is for educational purposes only. Any viewpoints expressed by Fidelity are not intended to be used as a primary basis for your investment decisions and are based on facts and circumstances at the point in time they are made and are not particular to you. Accordingly, nothing in this material constitutes impartial investment advice or advice in a fiduciary capacity, as defined or under the Employee Retirement Income Security Act of 1974 or the Internal Revenue Code of 1986, both as amended. Fidelity and its representatives may have a conflict of interest in the products or services mentioned in this material because they have a financial interest in the products or services and may receive compensation, directly or indirectly, in connection with the management, distribution, and/or servicing of these products or services, including Fidelity funds, certain third-party funds and products, and certain investment services. Before making any investment decisions, you should take into account all of the particular facts and circumstances of your or your client’s individual situation and reach out to an investment professional, if applicable. This material does not take into account a client’s particular investment objectives, financial situations, or needs and is not intended as a recommendation, offer, or solicitation for the purchase or sale of any product, security, or investment strategy. Nothing discussed or suggested in these materials should be construed as permission to supersede or circumvent any of your specific firm’s policies, procedures, rules, and guidelines. Views expressed are through the end of the period stated and do not necessarily represent the views of Fidelity, its affiliates, or any non-Fidelity entity distributing this material. Views are subject to change at any time based upon market or other conditions and Fidelity disclaims any responsibility to update such views. These views may not be relied on as investment advice and, because investment decisions for a Fidelity fund are based on numerous factors, may not be relied on as an indication of trading intent on behalf of any Fidelity fund. The securities mentioned are not necessarily holdings invested in by the portfolio manager(s) or FMR LLC. References to specific company securities should not be construed as recommendations or investment advice. In general, the bond market is volatile, and fixed income securities carry interest rate risk. (As interest rates rise, bond prices usually fall, and vice versa. This effect is usually more pronounced for longer-term securities.) Fixed income securities also carry inflation, credit, and default risks for both issuers and counterparties. Foreign securities are subject to interest rate, currency exchange rate, economic, and political risks, all of which are magnified in emerging markets. Lower-quality bonds can be more volatile and have greater risk of default than higher-quality bonds. The fund can invest in securities that may have a leveraging effect (such as derivatives and forward-settling securities) that may increase market exposure, magnify investment risks, and cause losses to be realized more quickly. Diversification does not ensure a profit or guarantee against a loss. Not NCUA or NCUSIF insured. May lose value. No credit union guarantee. © Morningstar, Inc. All rights reserved. The information contained herein: (1) is proprietary to Morningstar and/or its affiliates; (2) may not be copied or distributed; (3) is not warranted to be accurate, complete, or timely. Neither Morningstar nor its content providers are responsible for any damages or losses arising from any use of this information. Morningstar is a registered trademark of Morningstar, Inc. and is not affiliated with Fidelity Investments. Fidelity does not review the Morningstar data. For mutual fund performance information, you should check the fund’s current prospectus for the most up-to-date information concerning applicable loads, fees, and expenses. Fidelity Investments is an independent entity and is not affiliated with any non-Fidelity entities distributing this material. Third-party trademarks and service marks are the property of their respective owners. All other trademarks and service marks are the property of FMR LLC or an affiliated company. This material must be preceded or accompanied by a current Fund prospectus. Please read it carefully before investing. INVESTMENT STRATEGY QUARTERLY Fidelity Private Credit Fund Q3 2026
Fidelity Private Credit Fund is managed by Fidelity Diversifying Solutions LLC, a registered investment adviser, and is offered by Fidelity Distributors Company LLC (FDC LLC), a registered broker-dealer. Investing in our Common Shares involves a high degree of risk. Investors should review the offering documents, including the description of risk factors contained in the Fund’s Prospectus (the "Prospectus"), prior to making a decision to invest in the securities described herein. The Prospectus will include more complete descriptions of the risks described below as well as additional risks relating to, among other things, conflicts of interest and regulatory and tax matters. Any decision to invest in the securities described herein should be made after reviewing such Prospectus, conducting such investigations as the investor deems necessary and consulting the investor’s own legal, accounting, and tax advisors in order to make an independent determination of the suitability and consequences of an investment in the Fund. We have a limited operating history and there is no assurance that we will achieve our investment objective. An investment in our Common Shares may not be appropriate for all investors and is not designed to be a complete investment program. You should not expect to be able to sell your shares regardless of how we perform. You should consider that you may not have access to the money you invest for an extended period of time. We do not intend to list our shares on any securities exchange, and we do not expect a secondary market in our shares to develop. Because you may be unable to sell your shares, you will be unable to reduce your exposure in any market downturn. You should purchase these securities only if you can afford a complete loss of your investment. We have commenced a share repurchase program, but only a limited number of shares will be eligible for repurchase and repurchases will be subject to available liquidity and other significant restrictions. An investment in our Common Shares is not suitable for you if you need access to the money you invest. We cannot guarantee that we will make distributions, and if we do, we may fund such distributions from sources other than cash flow from operations, including, without limitation, the sale of assets, borrowings, return of capital or offering proceeds, and we have no limits on the amounts we may pay from such sources. We believe the likelihood that we pay distributions from sources other than cash flow from operations will be higher in the early stages of the offering. Distributions may also be funded in significant part, directly or indirectly, from temporary waivers or expense reimbursements borne by the Adviser or its affiliates, that may be subject to reimbursement to the Adviser or its affiliates. The repayment of any amounts owed to the Adviser or its affiliates will reduce future distributions to which you would otherwise be entitled. We use and expect to continue to use leverage, which will magnify the potential for loss on amounts invested in us. We qualify as an “emerging growth company” as defined in the Jumpstart Our Business Startups Act and we cannot be certain if the reduced disclosure requirements applicable to emerging growth companies will make our Common Shares less attractive to investors. We invest primarily in securities that are rated below investment grade by rating agencies or that would be rated below investment grade if they were rated. Below investment grade securities, which are often referred to as “junk,” have predominantly speculative characteristics with respect to the issuer’s capacity to pay interest and repay principal. They may also be illiquid and difficult to value. FIDELITY BROKERAGE SERVICES LLC, MEMBER NYSE/SIPC, 900 SALEM STREET, SMITHFIELD, RI 02917 FIDELITY DISTRIBUTORS COMPANY LLC, 900 SALEM STREET, SMITHFIELD, RI 02917 1140231.14.0 1.9912558.113 INVESTMENT STRATEGY QUARTERLY Fidelity Private Credit Fund Q3 2026 Risk Factors Not FDIC Insured May Lose Value No Bank Guarantee