Shareholder Report
Aug. 31, 2026
USD ($)
$ / shares
WHAT WERE THE FUND COSTS FOR THE PERIOD? (based on a hypothetical $10,000 investment)
|
Class Name
|
Costs of a $10,000 investment
|
Costs paid as a percentage of a $10,000 investment
|
|
Class I
|
$192
|
1.79%
|
HOW DID THE FUND PERFORM DURING THE PERIOD AND WHAT AFFECTED ITS PERFORMANCE?
The Fund saw positive performance over the Period. The Fund’s diversified trendfollowing sub-advisers were the primary source of positive performance at the trading style level.
At the market sector level, the Fund saw gains in metals, equities, energy and currencies. Gains in metals stemmed from longs in silver and gold, both of which saw strong price rallies through the end of January. In contrast, gains in equities occurred more steadily through the Period as momentum in technology and artificial intelligence-related stocks continued. Asian stock markets were a notable outperformer over the Period. Having detracted in the first six months of the Period, the energy sector saw strong gains from long positions from March onwards as escalating conflict in the Middle East and concerns for supplies through the Strait of Hormuz saw energy prices rise sharply. The currency sector saw smaller gains reported, with longs in the Mexican Peso and Australian Dollar and shorts in the Japanese Yen the strongest contributors.
The Fund saw losses in fixed income and agricultural commodities. Global bond yields generally rose over the window, but did so in a choppy manner which made it difficult for the Fund’s diversified trendfollowing sub-advisers to navigate at times. Trading in soybean, corn, cattle and coffee contracts also proved difficult for performance within agricultural commodities.
|
Top Contributors
|
|
|
↑
|
Metals
|
|
↑
|
Equities
|
|
↑
|
Energy
|
|
↑
|
Currencies
|
|
Top Detractors
|
|
|
↓
|
Fixed Income
|
|
↓
|
Agricultural Commodities
|
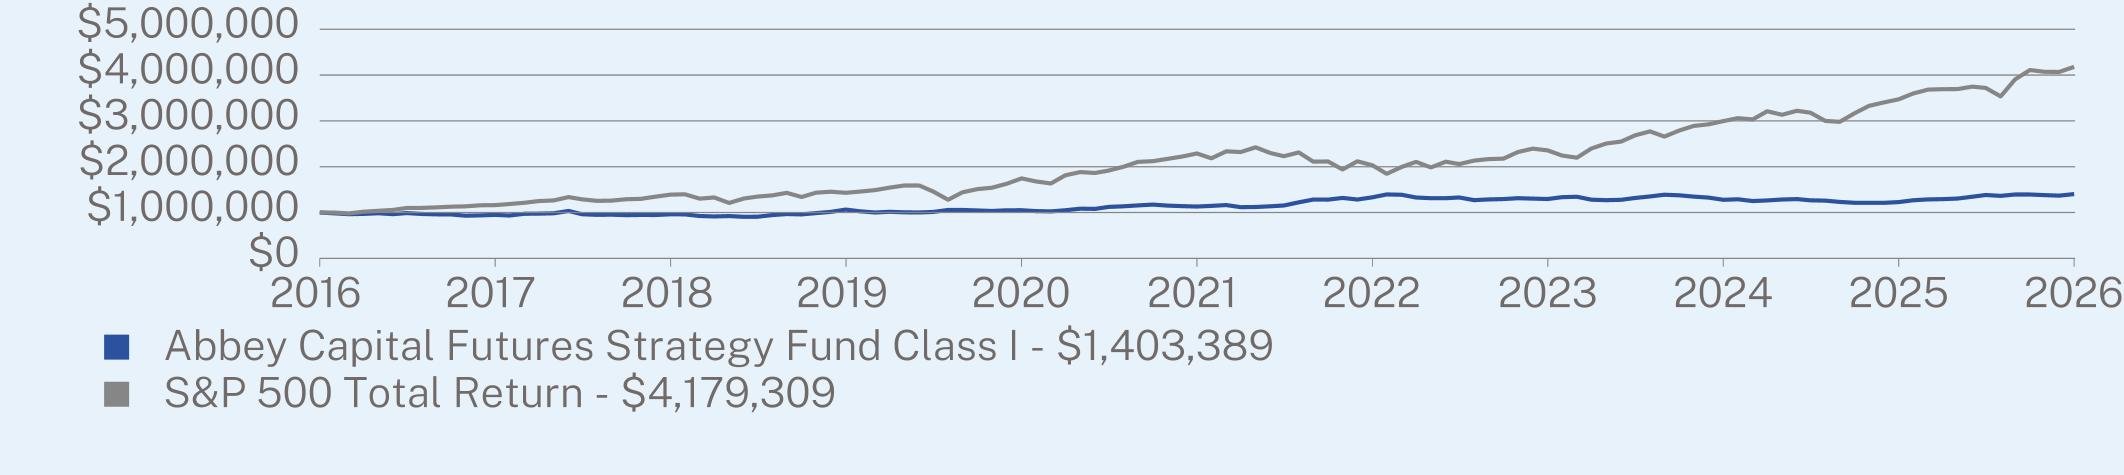
ANNUAL AVERAGE TOTAL RETURN (%)
|
|
1 Year
|
5 Year
|
10 Year
|
|
Class I
|
14.23
|
4.40
|
3.45
|
|
S&P 500 Total Return Index
|
20.38
|
12.79
|
15.37
|
Visit https://www.abbeycapital.com/abbey-capital-futures-strategy-fund for more recent performance information.
KEY FUND STATISTICS (as of August 31, 2026)
|
Net Assets
|
$2,642,628,499
|
|
Number of Holdings
|
1,708
|
|
Net Advisory Fee
|
$42,130,825
|
|
Portfolio Turnover (excludes derivatives)
|
0%
|
WHAT DID THE FUND INVEST IN? (as of August 31, 2026)
|
Market Group*
|
Risk Allocation (% of overall Value at Risk)
|
||
|
Agricultural Products
|
13.1%
|
||
|
Currency
|
|
12.8%
|
|
|
Energy
|
15.4%
|
||
|
Equity
|
|
23.0%
|
|
|
Fixed Income
|
29.4%
|
||
|
Metals
|
|
6.3%
|
|
|
Credit Breakdown
|
(% of Net Assets)
|
|
|
AA+1
|
74.4
|
%
|
|
A-12
|
7.0
|
%
|
|
A-13
|
8.3
|
%
|
|
A-24
|
10.3
|
%
|
|
A-25
|
0.4
|
%
|
WHAT WERE THE FUND COSTS FOR THE PERIOD? (based on a hypothetical $10,000 investment)
|
Class Name
|
Costs of a $10,000 investment
|
Costs paid as a percentage of a $10,000 investment
|
|
Class A
|
$218
|
2.04%
|
HOW DID THE FUND PERFORM DURING THE PERIOD AND WHAT AFFECTED ITS PERFORMANCE?
The Fund saw positive performance over the Period. The Fund’s diversified trendfollowing sub-advisers were the primary source of positive performance at the trading style level.
At the market sector level, the Fund saw gains in metals, equities, energy and currencies. Gains in metals stemmed from longs in silver and gold, both of which saw strong price rallies through the end of January. In contrast, gains in equities occurred more steadily through the Period as momentum in technology and artificial intelligence-related stocks continued. Asian stock markets were a notable outperformer over the Period. Having detracted in the first six months of the Period, the energy sector saw strong gains from long positions from March onwards as escalating conflict in the Middle East and concerns for supplies through the Strait of Hormuz saw energy prices rise sharply. The currency sector saw smaller gains reported, with longs in the Mexican Peso and Australian Dollar and shorts in the Japanese Yen the strongest contributors.
The Fund saw losses in fixed income and agricultural commodities. Global bond yields generally rose over the window, but did so in a choppy manner which made it difficult for the Fund’s diversified trendfollowing sub-advisers to navigate at times. Trading in soybean, corn, cattle and coffee contracts also proved difficult for performance within agricultural commodities.
|
Top Contributors
|
|
|
↑
|
Metals
|
|
↑
|
Equities
|
|
↑
|
Energy
|
|
↑
|
Currencies
|
|
Top Detractors
|
|
|
↓
|
Fixed Income
|
|
↓
|
Agricultural Commodities
|
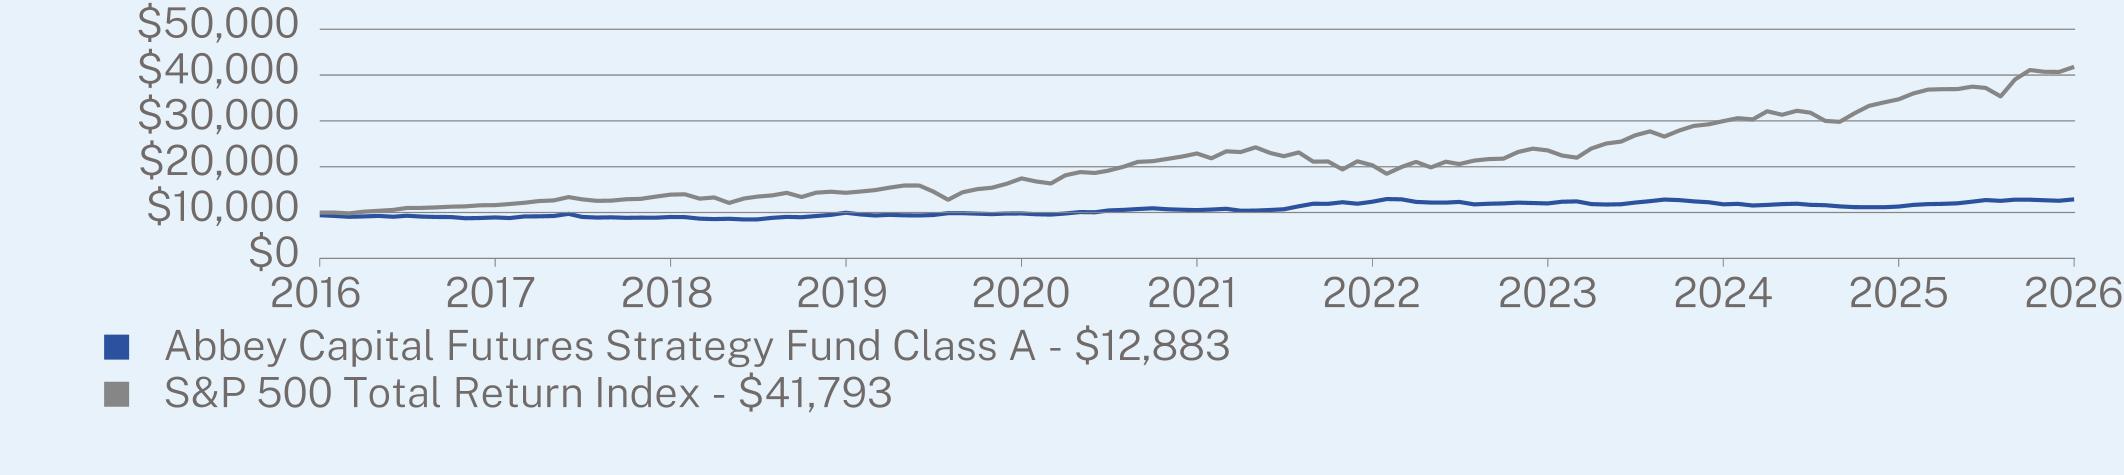
ANNUAL AVERAGE TOTAL RETURN (%)
|
|
1 Year
|
5 Year
|
10 Year
|
|
Class A (without sales charge)
|
13.86
|
4.11
|
3.18
|
|
Class A (with sales charge)
|
7.3
|
2.89
|
2.57
|
|
S&P 500 Total Return Index
|
20.38
|
12.79
|
15.37
|
Visit https://www.abbeycapital.com/abbey-capital-futures-strategy-fund for more recent performance information.
KEY FUND STATISTICS (as of August 31, 2026)
|
Net Assets
|
$2,642,628,499
|
|
Number of Holdings
|
1,708
|
|
Net Advisory Fee
|
$42,130,825
|
|
Portfolio Turnover (excludes derivatives)
|
0%
|
WHAT DID THE FUND INVEST IN? (as of August 31, 2026)
|
Market Group*
|
Risk Allocation (% of overall Value at Risk)
|
||
|
Agricultural Products
|
13.1%
|
||
|
Currency
|
|
12.8%
|
|
|
Energy
|
15.4%
|
||
|
Equity
|
|
23.0%
|
|
|
Fixed Income
|
29.4%
|
||
|
Metals
|
|
6.3%
|
|
|
Credit Breakdown
|
(% of Net Assets)
|
|
|
AA+1
|
74.4
|
%
|
|
A-12
|
7.0
|
%
|
|
A-13
|
8.3
|
%
|
|
A-24
|
10.3
|
%
|
|
A-25
|
0.4
|
%
|
WHAT WERE THE FUND COSTS FOR THE PERIOD? (based on a hypothetical $10,000 investment)
|
Class Name
|
Costs of a $10,000 investment
|
Costs paid as a percentage of a $10,000 investment
|
|
Class C
|
$297
|
2.79%
|
HOW DID THE FUND PERFORM DURING THE PERIOD AND WHAT AFFECTED ITS PERFORMANCE?
The Fund saw positive performance over the Period. The Fund’s diversified trendfollowing sub-advisers were the primary source of positive performance at the trading style level.
At the market sector level, the Fund saw gains in metals, equities, energy and currencies. Gains in metals stemmed from longs in silver and gold, both of which saw strong price rallies through the end of January. In contrast, gains in equities occurred more steadily through the Period as momentum in technology and artificial intelligence-related stocks continued. Asian stock markets were a notable outperformer over the Period. Having detracted in the first six months of the Period, the energy sector saw strong gains from long positions from March onwards as escalating conflict in the Middle East and concerns for supplies through the Strait of Hormuz saw energy prices rise sharply. The currency sector saw smaller gains reported, with longs in the Mexican Peso and Australian Dollar and shorts in the Japanese Yen the strongest contributors.
The Fund saw losses in fixed income and agricultural commodities. Global bond yields generally rose over the window, but did so in a choppy manner which made it difficult for the Fund’s diversified trendfollowing sub-advisers to navigate at times. Trading in soybean, corn, cattle and coffee contracts also proved difficult for performance within agricultural commodities.
|
Top Contributors
|
|
|
↑
|
Metals
|
|
↑
|
Equities
|
|
↑
|
Energy
|
|
↑
|
Currencies
|
|
Top Detractors
|
|
|
↓
|
Fixed Income
|
|
↓
|
Agricultural Commodities
|
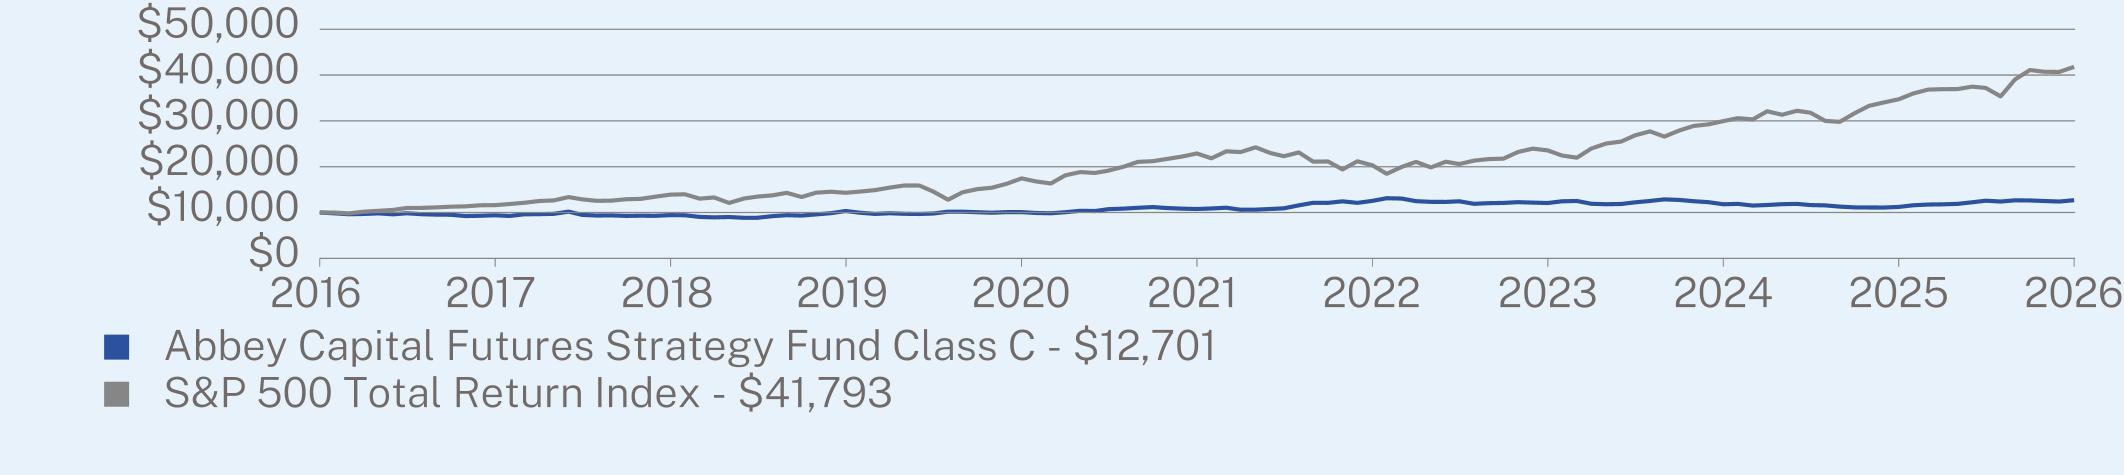
ANNUAL AVERAGE TOTAL RETURN (%)
|
|
1 Year
|
5 Year
|
10 Year
|
|
Class C (without contingent deferred sales charge)
|
13.1
|
3.35
|
2.42
|
|
Class C (with contingent deferred sales charge)
|
12.1
|
3.35
|
2.42
|
|
S&P 500 Total Return Index
|
20.38
|
12.79
|
15.37
|
Visit https://www.abbeycapital.com/abbey-capital-futures-strategy-fund for more recent performance information.
KEY FUND STATISTICS (as of August 31, 2026)
|
Net Assets
|
$2,642,628,499
|
|
Number of Holdings
|
1,708
|
|
Net Advisory Fee
|
$42,130,825
|
|
Portfolio Turnover (excludes derivatives)
|
0%
|
WHAT DID THE FUND INVEST IN? (as of August 31, 2026)
|
Market Group*
|
Risk Allocation (% of overall Value at Risk)
|
||
|
Agricultural Products
|
13.1%
|
||
|
Currency
|
|
12.8%
|
|
|
Energy
|
15.4%
|
||
|
Equity
|
|
23.0%
|
|
|
Fixed Income
|
29.4%
|
||
|
Metals
|
|
6.3%
|
|
|
Credit Breakdown
|
(% of Net Assets)
|
|
|
AA+1
|
74.4
|
%
|
|
A-12
|
7.0
|
%
|
|
A-13
|
8.3
|
%
|
|
A-24
|
10.3
|
%
|
|
A-25
|
0.4
|
%
|
WHAT WERE THE FUND COSTS FOR THE PERIOD? (based on a hypothetical $10,000 investment)
|
Class Name
|
Costs of a $10,000 investment
|
Costs paid as a percentage of a $10,000 investment
|
|
Class I
|
$202
|
1.79%
|
HOW DID THE FUND PERFORM DURING THE PERIOD AND WHAT AFFECTED ITS PERFORMANCE?
The Fund saw positive performance over the Period. The Fund’s managed futures and Long US Equity strategies both contributed to positive performance.
For the Managed Futures strategy, gains occurred in metals, equities, energy and currencies. Gains in metals stemmed from longs in silver and gold, both of which saw strong price rallies through the end of January. In contrast, gains in equities occurred more steadily through the Period as momentum in technology and artificial intelligence-related stocks continued. Asian stock markets were a notable outperformer over the Period. Having detracted in the first six months of the Period, the energy sector saw strong gains from long positions from March onwards as escalating conflict in the Middle East and concerns for supplies through the Strait of Hormuz saw energy prices rise sharply. Performance in currencies was also positive, while the Managed Futures strategy was negative in agricultural commodities and fixed income.
The Long US Equity strategy saw positive returns from its allocation to the S&P 500. US equity markets delivered strong gains over the Period, despite periods of elevated volatility. In the US, equities were supported by resilient corporate earnings, continued strength in AI and technology-related stocks and, particularly during late 2025, expectations for a dovish shift in monetary policy. Markets came under pressure during the first half of 2026 as geopolitical tensions, higher energy prices and renewed inflation concerns weighed on sentiment, before recovering as conditions stabilized. Technology stocks remained an important driver for positive S&P 500 performance, helping US equities finish the Period strongly.
|
Top Contributors
|
|
|
↑
|
Equity indices
|
|
↑
|
Metals
|
|
↑
|
Energy
|
|
↑
|
Currencies
|
|
Top Detractors
|
|
|
↓
|
Agricultural Commodities
|
|
↓
|
Fixed Income
|
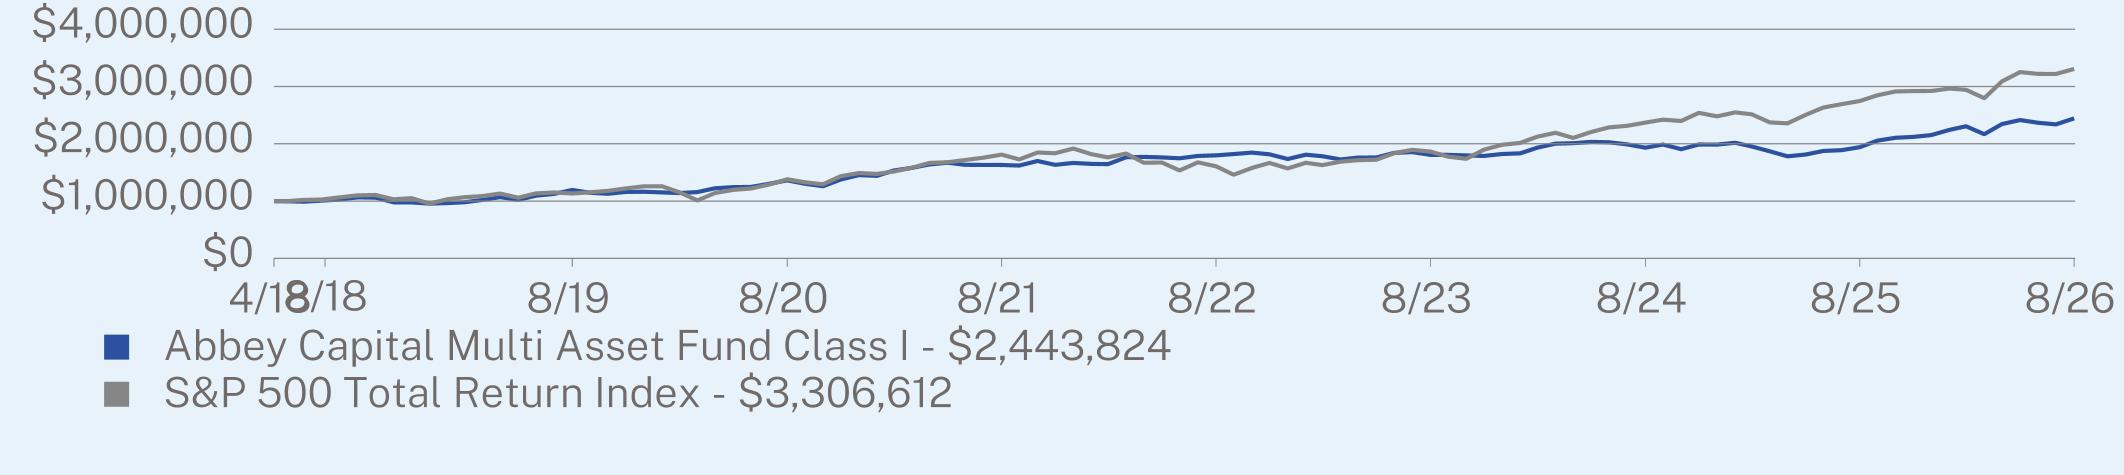
ANNUAL AVERAGE TOTAL RETURN (%)
|
|
1 Year
|
5 Year
|
Since Inception
(04/11/2018) |
|
Class I (without sales charge)
|
25.93
|
8.43
|
11.24
|
|
S&P 500 Total Return Index
|
20.38
|
12.79
|
15.32
|
Visit https://www.abbeycapital.com/products/mutual-funds/multi-asset-fund/ for more recent performance information.
KEY FUND STATISTICS (as of August 31, 2026)
|
Net Assets
|
$1,088,362,988
|
|
Number of Holdings
|
652
|
|
Net Advisory Fee
|
$16,349,832
|
|
Portfolio Turnover (excludes derivatives)
|
12%
|
WHAT DID THE FUND INVEST IN? (as of August 31, 2026)
|
Market Group*
|
Risk Allocation (% of overall Value at Risk)
|
||
|
Agricultural Products
|
10.4%
|
||
|
Currency
|
|
12.0%
|
|
|
Energy
|
11.1%
|
||
|
Equity
|
|
37.4%
|
|
|
Fixed Income
|
23.7%
|
||
|
Metals
|
|
5.4%
|
|
|
Credit Breakdown
|
(% of Net Assets)
|
|
|
AA+1
|
23.1
|
%
|
|
A-12
|
8.8
|
%
|
|
A-13
|
19.5
|
%
|
|
Not Applicable4
|
48.3
|
%
|
WHAT WERE THE FUND COSTS FOR THE PERIOD? (based on a hypothetical $10,000 investment)
|
Class Name
|
Costs of a $10,000 investment
|
Costs paid as a percentage of a $10,000 investment
|
|
Class A
|
$230
|
2.04%
|
HOW DID THE FUND PERFORM DURING THE PERIOD AND WHAT AFFECTED ITS PERFORMANCE?
The Fund saw positive performance over the Period. The Fund’s managed futures and Long US Equity strategies both contributed to positive performance.
For the Managed Futures strategy, gains occurred in metals, equities, energy and currencies. Gains in metals stemmed from longs in silver and gold, both of which saw strong price rallies through the end of January. In contrast, gains in equities occurred more steadily through the Period as momentum in technology and artificial intelligence-related stocks continued. Asian stock markets were a notable outperformer over the Period. Having detracted in the first six months of the Period, the energy sector saw strong gains from long positions from March onwards as escalating conflict in the Middle East and concerns for supplies through the Strait of Hormuz saw energy prices rise sharply. Performance in currencies was also positive, while the Managed Futures strategy was negative in agricultural commodities and fixed income.
The Long US Equity strategy saw positive returns from its allocation to the S&P 500. US equity markets delivered strong gains over the Period, despite periods of elevated volatility. In the US, equities were supported by resilient corporate earnings, continued strength in AI and technology-related stocks and, particularly during late 2025, expectations for a dovish shift in monetary policy. Markets came under pressure during the first half of 2026 as geopolitical tensions, higher energy prices and renewed inflation concerns weighed on sentiment, before recovering as conditions stabilized. Technology stocks remained an important driver for positive S&P 500 performance, helping US equities finish the Period strongly.
|
Top Contributors
|
|
|
↑
|
Equity indices
|
|
↑
|
Metals
|
|
↑
|
Energy
|
|
↑
|
Currencies
|
|
Top Detractors
|
|
|
↓
|
Agricultural Commodities
|
|
↓
|
Fixed Income
|
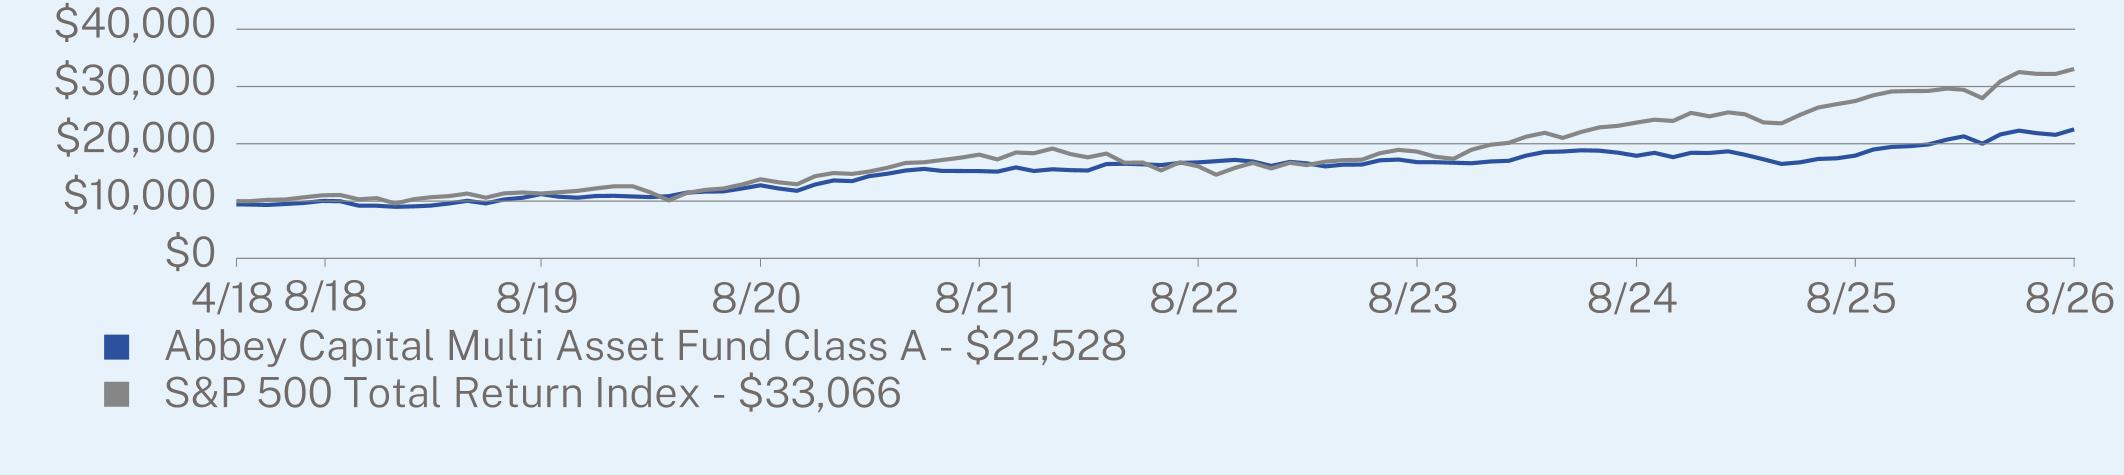
ANNUAL AVERAGE TOTAL RETURN (%)
|
|
1 Year
|
5 Year
|
Since Inception
(04/11/2018) |
|
Class A (without sales charge)1
|
25.55
|
8.13
|
10.94
|
|
Class A (with sales charge)1
|
18.34
|
6.86
|
10.16
|
|
S&P 500 Total Return Index
|
20.38
|
12.79
|
15.32
|
Visit https://www.abbeycapital.com/products/mutual-funds/multi-asset-fund/ for more recent performance information.
KEY FUND STATISTICS (as of August 31, 2026)
|
Net Assets
|
$1,088,362,988
|
|
Number of Holdings
|
652
|
|
Net Advisory Fee
|
$16,349,832
|
|
Portfolio Turnover (excludes derivatives)
|
12%
|
WHAT DID THE FUND INVEST IN? (as of August 31, 2026)
|
Market Group*
|
Risk Allocation (% of overall Value at Risk)
|
||
|
Agricultural Products
|
10.4%
|
||
|
Currency
|
|
12.0%
|
|
|
Energy
|
11.1%
|
||
|
Equity
|
|
37.4%
|
|
|
Fixed Income
|
23.7%
|
||
|
Metals
|
|
5.4%
|
|
|
Credit Breakdown
|
(% of Net Assets)
|
|
|
AA+1
|
23.1
|
%
|
|
A-12
|
8.8
|
%
|
|
A-13
|
19.5
|
%
|
|
Not Applicable4
|
48.3
|
%
|
WHAT WERE THE FUND COSTS FOR THE PERIOD? (based on a hypothetical $10,000 investment)
|
Class Name
|
Costs of a $10,000 investment
|
Costs paid as a percentage of a $10,000 investment
|
|
Class C
|
$313
|
2.79%
|
HOW DID THE FUND PERFORM DURING THE PERIOD AND WHAT AFFECTED ITS PERFORMANCE?
The Fund saw positive performance over the Period. The Fund’s managed futures and Long US Equity strategies both contributed to positive performance.
For the Managed Futures strategy, gains occurred in metals, equities, energy and currencies. Gains in metals stemmed from longs in silver and gold, both of which saw strong price rallies through the end of January. In contrast, gains in equities occurred more steadily through the Period as momentum in technology and artificial intelligence-related stocks continued. Asian stock markets were a notable outperformer over the Period. Having detracted in the first six months of the Period, the energy sector saw strong gains from long positions from March onwards as escalating conflict in the Middle East and concerns for supplies through the Strait of Hormuz saw energy prices rise sharply. Performance in currencies was also positive, while the Managed Futures strategy was negative in agricultural commodities and fixed income.
The Long US Equity strategy saw positive returns from its allocation to the S&P 500. US equity markets delivered strong gains over the Period, despite periods of elevated volatility. In the US, equities were supported by resilient corporate earnings, continued strength in AI and technology-related stocks and, particularly during late 2025, expectations for a dovish shift in monetary policy. Markets came under pressure during the first half of 2026 as geopolitical tensions, higher energy prices and renewed inflation concerns weighed on sentiment, before recovering as conditions stabilized. Technology stocks remained an important driver for positive S&P 500 performance, helping US equities finish the Period strongly.
|
Top Contributors
|
|
|
↑
|
Equity indices
|
|
↑
|
Metals
|
|
↑
|
Energy
|
|
↑
|
Currencies
|
|
Top Detractors
|
|
|
↓
|
Agricultural Commodities
|
|
↓
|
Fixed Income
|
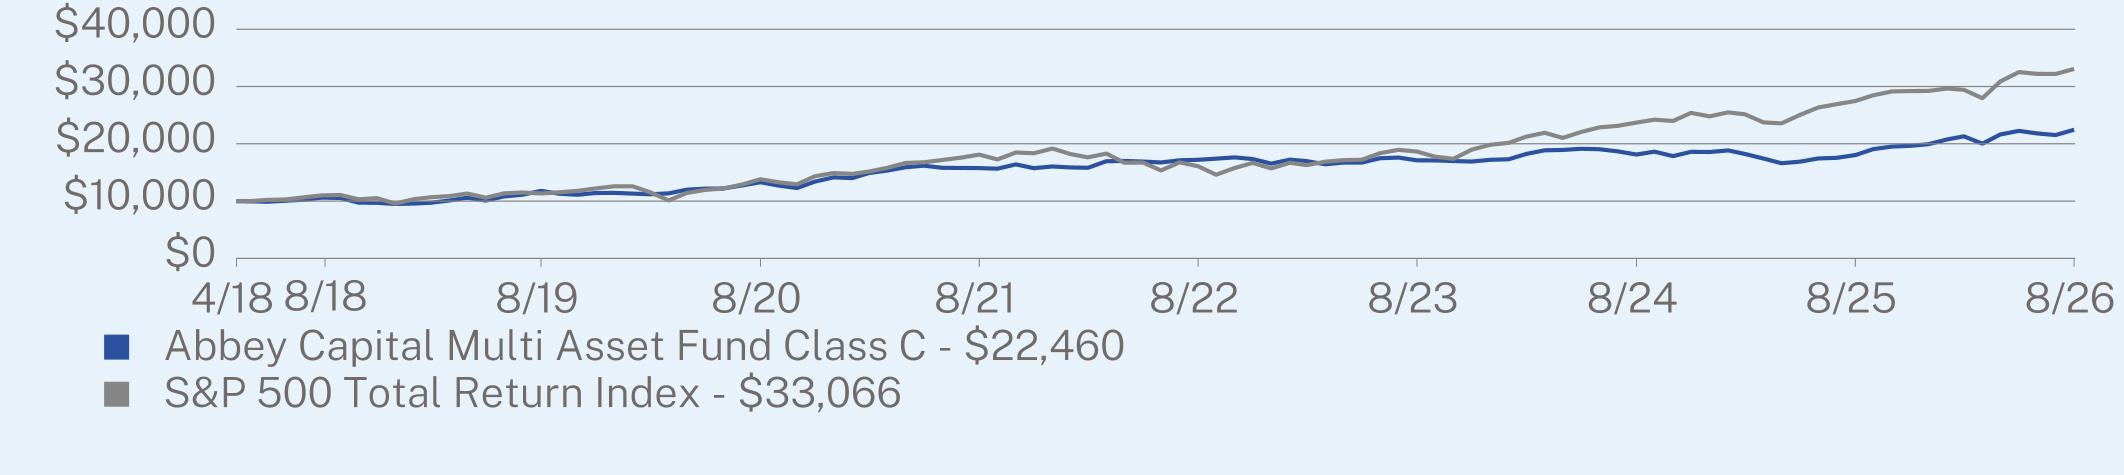
ANNUAL AVERAGE TOTAL RETURN (%)
|
|
1 Year
|
5 Year
|
Since Inception
(04/11/2018) |
|
Class C (without contingent deferred sales charge)1
|
24.56
|
7.34
|
10.12
|
|
Class C (with contingent deferred sales charge)1
|
23.56
|
7.34
|
10.12
|
|
S&P 500 Total Return Index
|
20.38
|
12.79
|
15.32
|
Visit https://www.abbeycapital.com/products/mutual-funds/multi-asset-fund/ for more recent performance information.
KEY FUND STATISTICS (as of August 31, 2026)
|
Net Assets
|
$1,088,362,988
|
|
Number of Holdings
|
652
|
|
Net Advisory Fee
|
$16,349,832
|
|
Portfolio Turnover (excludes derivatives)
|
12%
|
WHAT DID THE FUND INVEST IN? (as of August 31, 2026)
|
Market Group*
|
Risk Allocation (% of overall Value at Risk)
|
||
|
Agricultural Products
|
10.4%
|
||
|
Currency
|
|
12.0%
|
|
|
Energy
|
11.1%
|
||
|
Equity
|
|
37.4%
|
|
|
Fixed Income
|
23.7%
|
||
|
Metals
|
|
5.4%
|
|
|
Credit Breakdown
|
(% of Net Assets)
|
|
|
AA+1
|
23.1
|
%
|
|
A-12
|
8.8
|
%
|
|
A-13
|
19.5
|
%
|
|
Not Applicable4
|
48.3
|
%
|
WHAT WERE THE FUND COSTS FOR THE PAST YEAR? (based on a hypothetical $10,000 investment)
|
Fund Name
|
Costs of a $10,000 investment
|
Costs paid as a percentage of a $10,000 investment
|
|
Adara Smaller Companies Fund
|
$92
|
0.80%
|
HOW DID THE FUND PERFORM LAST YEAR AND WHAT AFFECTED ITS PERFORMANCE?
The Fund generated a return of 29.15% for the fiscal year ended August 31, 2026, and outperformed the Russell 2000 Total Return Index, which returned 26.46% over the Period. The Fund also outperformed the Russell 3000 Total Return Index which returned 20.10% over the Period.
The Fund’s allocation to microcap managers contributed to its outperformance over the Russell 2000 Total Return Index during the Period. Microcap stocks, as measured by the Russell Microcap Total Return Index, were up 37.67% for the Period.
The Fund’s allocation to smaller market cap stocks was a contributor to performance relative to the Russell 3000 Total Return Index, as small and microcap stocks outperformed large cap stocks during the Period.
The Fund’s assets were allocated to five underlying sub-advisers during the fiscal year: microcap managers Driehaus Capital Management, LLC (“Driehaus”) and Pacific Ridge Capital Partners, LLC (“Pacific Ridge”); small-cap managers Pier Capital, LLC (“Pier”) and River Road Asset Management, LLC (“River Road”); and tax-loss harvesting manager Aperio Group, LLC (“Aperio”).
Performance of the Fund’s sub-advisers for the fiscal year was led by Driehaus, with a return of +47.96%, followed in order by Pacific Ridge +34.20%, Aperio +25.98%, Pier +24.82% and River Road +5.60%.
As of August 31, 2026, the Fund’s assets were allocated 31% to Driehaus, followed by Pacific Ridge with 23%, Aperio with 18%, Pier with 14%, River Road with 13% and the remaining 1% in a cash sleeve.
|
Top Contributors
|
|
|
↑
|
Alto Neuroscience Inc
|
|
↑
|
Praxis Precision Medicines Inc Ordinary Shares
|
|
↑
|
Spyre Therapeutics Inc
|
|
↑
|
Twist Bioscience Corp
|
|
↑
|
Relay Therapeutics Inc Ordinary Shares
|
|
Top Detractors
|
|
|
↓
|
Vital Farms Inc Ordinary Share
|
|
↓
|
Coastal Financial Corp
|
|
↓
|
LendingTree Inc
|
|
↓
|
Paysafe Ltd Ordinary Shares
|
|
↓
|
PureCycle Technologies Inc Ordinary Shares
|
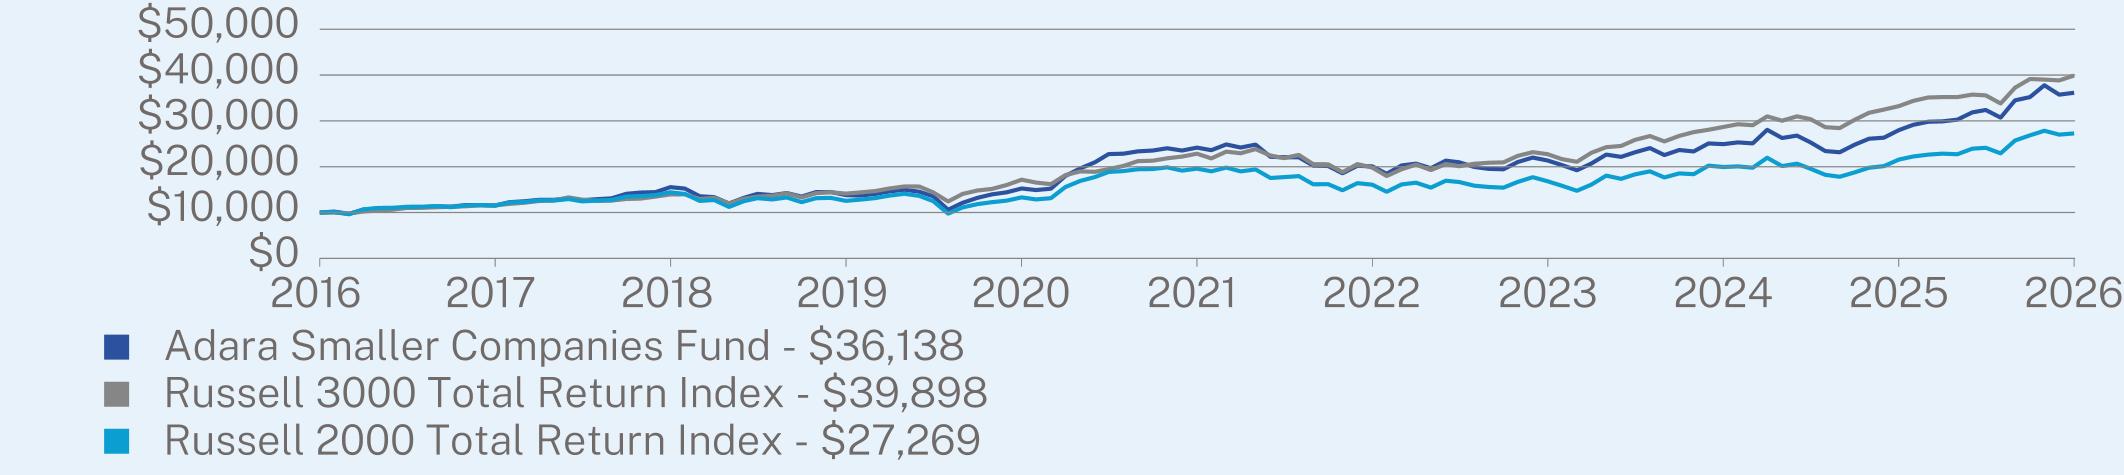
ANNUAL AVERAGE TOTAL RETURN (%)
|
|
1 Year
|
5 Year
|
10 Year
|
|
Adara Smaller Companies Fund
|
29.15
|
8.38
|
13.71
|
|
Russell 3000 Total Return Index
|
20.10
|
11.80
|
14.84
|
|
Russell 2000 Total Return Index
|
26.46
|
6.85
|
10.55
|
Visit https://rbbfund.com/additional-fund-information/ for more recent performance information.
Visit https://rbbfund.com/additional-fund-information/ for more recent performance information.
KEY FUND STATISTICS (as of August 31, 2026)
|
Net Assets
|
$847,245,699
|
|
Number of Holdings
|
622
|
|
Net Advisory Fee
|
$5,512,407
|
|
Portfolio Turnover
|
78%
|
WHAT DID THE FUND INVEST IN? (as of August 31, 2026)
|
Top 10 Holdings
|
(% of Net Assets)
|
|
|
Comfort Systems USA, Inc.
|
0.7
|
%
|
|
Definium Therapeutics, Inc.
|
0.7
|
%
|
|
Praxis Precision Medicines, Inc.
|
0.7
|
%
|
|
American Integrity Insurance Group, Inc.
|
0.7
|
%
|
|
Red Robin Gourmet Burgers, Inc.
|
0.7
|
%
|
|
CPI Card Group, Inc.
|
0.7
|
%
|
|
Carpenter Technology Corp.
|
0.7
|
%
|
|
CoreCivic, Inc.
|
0.7
|
%
|
|
American Public Education, Inc.
|
0.6
|
%
|
|
Spyre Therapeutics, Inc.
|
0.6
|
%
|
|
Top Sectors
|
(% of Net Assets)
|
|
|
Consumer, Non-cyclical
|
27.4
|
%
|
|
Financial
|
16.9
|
%
|
|
Industrial
|
16.5
|
%
|
|
Consumer, Cyclical
|
13.1
|
%
|
|
Technology
|
9.4
|
%
|
|
Energy
|
3.7
|
%
|
|
Communications
|
3.5
|
%
|
|
Basic Materials
|
2.2
|
%
|
|
Utilities
|
0.9
|
%
|
|
Cash & Other
|
6.4
|
%
|
WHAT WERE THE FUND COSTS FOR THE PAST YEAR? (based on a hypothetical $10,000 investment)
|
Fund Name
|
Costs of a $10,000 investment
|
Costs paid as a percentage of a $10,000 investment
|
|
Aquarius International Fund
|
$75
|
0.67%
|
HOW DID THE FUND PERFORM LAST YEAR AND WHAT AFFECTED ITS PERFORMANCE?
The Fund generated a return of 24.85% for the fiscal year ended August 31, 2026, and underperformed its benchmark MSCI AC World ex USA Gross Index, which returned 27.89% over the Period. The Fund’s security selection and underweight exposure to emerging market equities were major detractors from relative performance versus the benchmark.
Developed international equities, as measured by the MSCI EAFE Index, were up 22.19% for the Period. Emerging markets, as measured by the MSCI Emerging Markets Index, were up 39.66% for the Period. The U.S. Dollar Index strengthened by 1.69% in the Period.
The Fund ended the Period with four underlying sub-advisers: international developed markets managers Mawer Investment Management, Ltd. (“Mawer”) and Boston Partners Global Investors, Inc. (“Boston Partners”); emerging markets manager Driehaus Capital Management, LLC (“Driehaus”); and tax-loss harvesting manager Aperio Group, LLC (“Aperio”).
Returns for the underlying sub-advisers during the Period were Driehaus at +35.69%, followed by Boston Partners +27.98%, Aperio +25.26%, and Mawer +18.75%.
The proportions of Fund assets allocated to the Fund’s sub-advisers at the end of the Period were as follows: Boston Partners 34%, Mawer 31%, Driehaus 16%, Aperio 16%, and the remainder in a cash sleeve.
|
Top Contributors
|
|
|
↑
|
Kioxia Holdings Corp Ordinary Shares
|
|
↑
|
Samsung Electro-Mechanics Co Ltd
|
|
↑
|
Unimicron Technology Corp
|
|
↑
|
SK Square
|
|
↑
|
SK hynix Inc
|
|
Top Detractors
|
|
|
↓
|
Tencent Music Entertainment Group ADR
|
|
↓
|
China Conch Environment Protection Holdings Ltd
|
|
↓
|
WiseTech Global Ltd
|
|
↓
|
Cochlear Ltd
|
|
↓
|
Pop Mart International Group Ltd Ordinary Shares
|
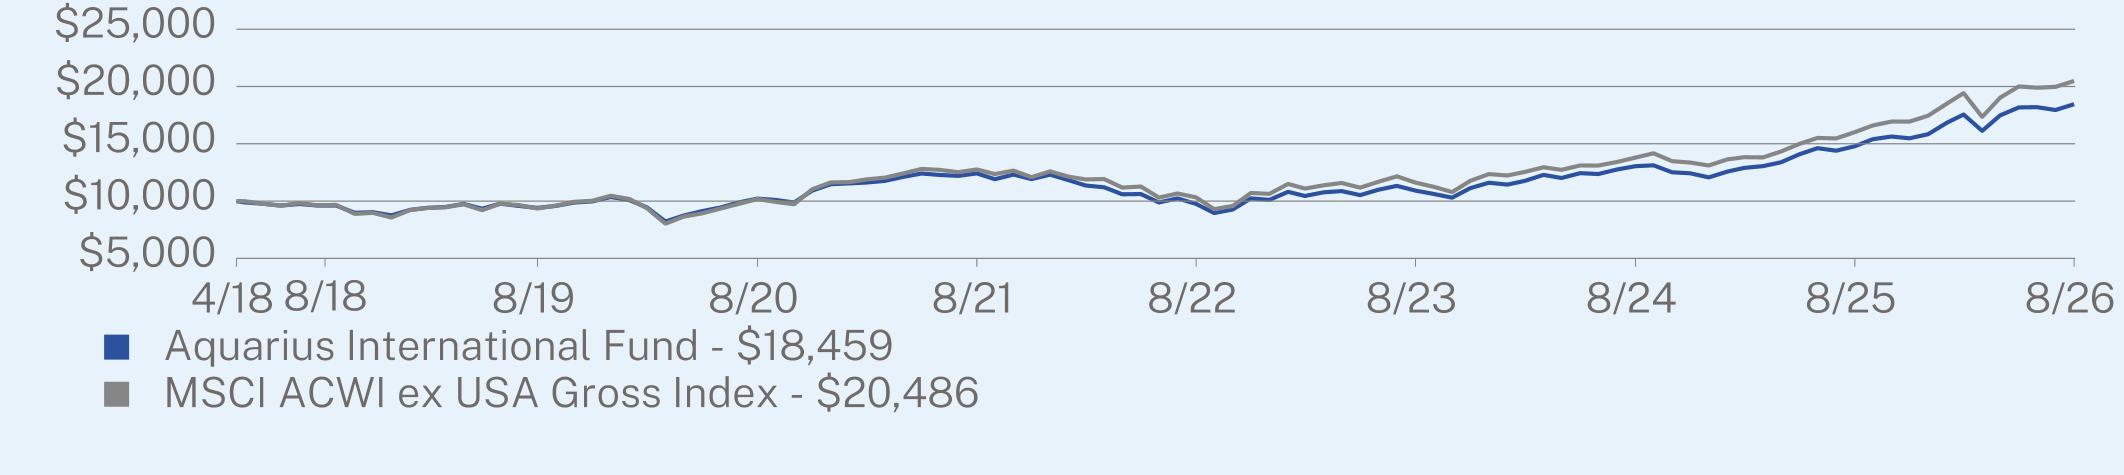
ANNUAL AVERAGE TOTAL RETURN (%)
|
|
1 Year
|
5 Year
|
Since Inception
(04/17/2018) |
|
Aquarius International Fund
|
24.85
|
8.25
|
7.60
|
|
MSCI ACWI ex USA Gross Index
|
27.89
|
9.93
|
8.94
|
Visit https://rbbfund.com/additional-fund-information/ for more recent performance information.
Visit https://rbbfund.com/additional-fund-information/ for more recent performance information.
KEY FUND STATISTICS (as of August 31, 2026)
|
Net Assets
|
$857,491,899
|
|
Number of Holdings
|
835
|
|
Net Advisory Fee
|
$3,959,556
|
|
Portfolio Turnover
|
72%
|
WHAT DID THE FUND INVEST IN? (as of August 31, 2026)
|
Top 10 Holdings
|
(% of Net Assets)
|
|
|
Samsung Electronics Co. Ltd.
|
3.3
|
%
|
|
Taiwan Semiconductor Manufacturing Co. Ltd.
|
3.0
|
%
|
|
SK hynix, Inc.
|
1.7
|
%
|
|
Taiwan Semiconductor Manufacturing Co. Ltd - ADR
|
1.4
|
%
|
|
Roche Holding AG
|
1.4
|
%
|
|
Tencent Holdings Ltd.
|
1.2
|
%
|
|
Hitachi Ltd.
|
1.1
|
%
|
|
Weir PLC
|
1.1
|
%
|
|
AIB Group PLC
|
1.0
|
%
|
|
ABN AMRO Bank NV
|
1.0
|
%
|
|
Top Sectors
|
(% of Net Assets)
|
|
|
Financial
|
22.2
|
%
|
|
Technology
|
16.8
|
%
|
|
Industrial
|
14.8
|
%
|
|
Consumer, Non-cyclical
|
12.5
|
%
|
|
Basic Materials
|
6.2
|
%
|
|
Energy
|
5.6
|
%
|
|
Communications
|
5.5
|
%
|
|
Consumer, Cyclical
|
5.1
|
%
|
|
Utilities
|
1.7
|
%
|
|
Cash & Other
|
9.6
|
%
|
WHAT WERE THE FUND COSTS FOR THE PERIOD? (based on a hypothetical $10,000 investment)
|
Class Name
|
Costs of a $10,000 investment
|
Costs paid as a percentage of a $10,000 investment
|
|
Institutional Class
|
$90
|
0.80%
|
HOW DID THE FUND PERFORM DURING THE PERIOD AND WHAT AFFECTED ITS PERFORMANCE?
For the Period, the Fund posted a gain and outperformed its broad-based securities market index, the Russell 3000 Index, but trailed the Russell 3000 Value Index during that time.
What factors influenced performance?
The U.S. economy continued to expand during the period, although a number of factors acted as headwinds. Consumer spending and the labor market both showed signs of vulnerability, while inflation remained somewhat higher than the Federal Reserve’s stated target; the new Chair of the Federal Reserve, Kevin Warsh, who began serving in this role in May of 2026, has repeatedly indicated that interest rates may need to be higher in order to lower inflation. Meanwhile, the war in Iran and the continued constraints on the global oil supply have created uncertainty for energy prices over the past six months. Against this backdrop, equities generally performed well, with a broadening out of participation as value stocks notched solid gains and artificial intelligence-related securities continued their rally, albeit with more volatility along the way.
The U.S. economy continued to expand during the period, although a number of factors acted as headwinds. Consumer spending and the labor market both showed signs of vulnerability, while inflation remained somewhat higher than the Federal Reserve’s stated target; the new Chair of the Federal Reserve, Kevin Warsh, who began serving in this role in May of 2026, has repeatedly indicated that interest rates may need to be higher in order to lower inflation. Meanwhile, the war in Iran and the continued constraints on the global oil supply have created uncertainty for energy prices over the past six months. Against this backdrop, equities generally performed well, with a broadening out of participation as value stocks notched solid gains and artificial intelligence-related securities continued their rally, albeit with more volatility along the way.
What were the top contributors and detractors?
Relative to the Russell 3000 Value Index, stock selection within Information Technology represented the biggest drag on performance; to a lesser degree, stock-picking in Health Care and Industrials also weighed on returns. The biggest positive contribution came from having no exposure to the Utilities sector; an underweight allocation to Consumer Staples and Real Estate made additional contributions to returns.
Relative to the Russell 3000 Value Index, stock selection within Information Technology represented the biggest drag on performance; to a lesser degree, stock-picking in Health Care and Industrials also weighed on returns. The biggest positive contribution came from having no exposure to the Utilities sector; an underweight allocation to Consumer Staples and Real Estate made additional contributions to returns.
How is the Fund currently positioned?
Compared with the Russell 3000 Value Index, the Fund held large overweight positions in the Financials, Information Technology, and Health Care sectors and a corresponding underweight in Consumer Discretionary; the Fund held no exposure to Real Estate and Utilities.
Compared with the Russell 3000 Value Index, the Fund held large overweight positions in the Financials, Information Technology, and Health Care sectors and a corresponding underweight in Consumer Discretionary; the Fund held no exposure to Real Estate and Utilities.
|
Top Contributors
|
|
|
↑
|
MICRON TECHNOLOGY, INC.
|
|
↑
|
FLEX LTD
|
|
↑
|
ALPHABET INC. CLASS A
|
|
↑
|
DELL TECHNOLOGIES, INC. CLASS C
|
|
↑
|
APPLIED MATERIALS, INC.
|
|
Top Detractors
|
|
|
↓
|
CHECK POINT SOFTWARE TECHNOLOGIES LTD.
|
|
↓
|
FERMI INC.
|
|
↓
|
COGNIZANT TECHNOLOGY SOLUTIONS
|
|
↓
|
META PLATFORMS INC CLASS A
|
|
↓
|
NVR, INC.
|
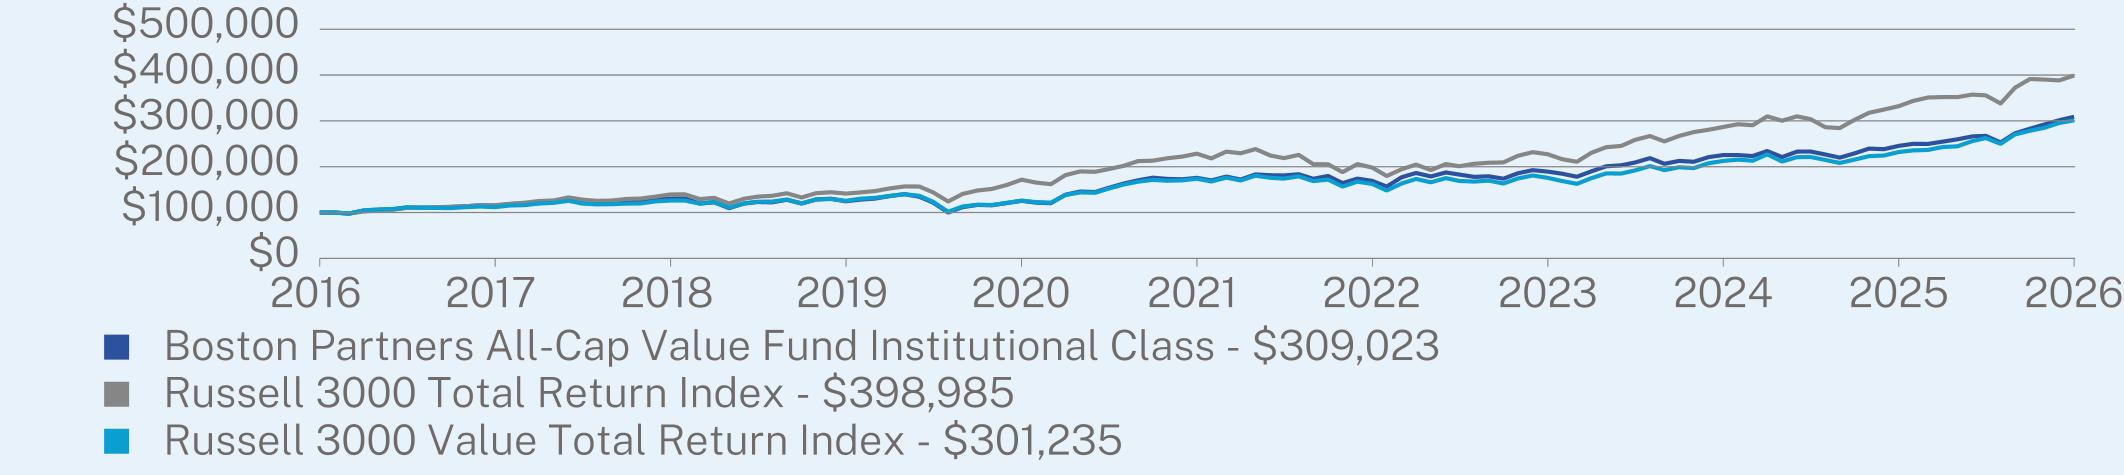
AVERAGE ANNUAL TOTAL RETURN (%)
|
|
1 Year
|
5 Year
|
10 Year
|
|
Institutional Class (without sales charge)
|
25.86
|
11.96
|
11.94
|
|
Russell 3000 Total Return Index
|
20.10
|
11.80
|
14.84
|
|
Russell 3000 Value Total Return Index
|
29.77
|
11.64
|
11.66
|
Visit https://www.bostonpartners.com/fund/bp-all-cap-value-fund-inst/ for more recent performance information.
KEY FUND STATISTICS (as of August 31, 2026)
|
Net Assets
|
$1,398,073,398
|
|
Number of Holdings
|
101
|
|
Net Advisory Fee
|
$8,575,260
|
|
Portfolio Turnover
|
36%
|
WHAT DID THE FUND INVEST IN? (as of August 31, 2026)
|
Top 10 Holdings
|
(% of Net Assets)
|
|
|
State Street SPDR S&P 500 ETF Trust
|
3.9
|
%
|
|
iShares Russell 1000 Value ETF
|
3.9
|
%
|
|
Microsoft Corp.
|
3.2
|
%
|
|
Bank of America Corp.
|
2.9
|
%
|
|
Corpay, Inc.
|
2.6
|
%
|
|
Alphabet, Inc.
|
2.5
|
%
|
|
Johnson & Johnson
|
2.4
|
%
|
|
JPMorgan Chase & Co.
|
2.0
|
%
|
|
Philip Morris International, Inc.
|
1.9
|
%
|
|
AbbVie, Inc.
|
1.9
|
%
|
|
Top Sectors†
|
(% of Net Assets)
|
|
|
Financials
|
27.7
|
%
|
|
Information Technology
|
19.5
|
%
|
|
Health Care
|
16.2
|
%
|
|
Industrials
|
10.2
|
%
|
|
Communication Services
|
4.8
|
%
|
|
Energy
|
4.0
|
%
|
|
Consumer Staples
|
3.2
|
%
|
|
Consumer Discretionary
|
2.8
|
%
|
|
Materials
|
1.0
|
%
|
|
Cash & Other
|
10.6
|
%
|
Changes to Fund’s Investment Objective or Goals
The Boston Partners All-Cap Value Fund seeks long-term growth of capital and outperformance of its benchmark net of fees.
CHANGES IN AND DISAGREEMENTS WITH ACCOUNTANTS
Effective May 14, 2025, the Fund’s independent registered public accounting firm has been changed from Ernst & Young LLP to Cohen & Company, Ltd.
WHAT WERE THE FUND COSTS FOR THE PERIOD? (based on a hypothetical $10,000 investment)
|
Class Name
|
Costs of a $10,000 investment
|
Costs paid as a percentage of a $10,000 investment
|
|
Investor Class
|
$118
|
1.05%
|
HOW DID THE FUND PERFORM DURING THE PERIOD AND WHAT AFFECTED ITS PERFORMANCE?
For the Period, the Fund posted a gain and outperformed its broad-based securities market index, the Russell 3000 Index, but trailed the Russell 3000 Value Index during that time.
What factors influenced performance?
The U.S. economy continued to expand during the period, although a number of factors acted as headwinds. Consumer spending and the labor market both showed signs of vulnerability, while inflation remained somewhat higher than the Federal Reserve’s stated target; the new Chair of the Federal Reserve, Kevin Warsh, who began serving in this role in May of 2026, has repeatedly indicated that interest rates may need to be higher in order to lower inflation. Meanwhile, the war in Iran and the continued constraints on the global oil supply have created uncertainty for energy prices over the past six months. Against this backdrop, equities generally performed well, with a broadening out of participation as value stocks notched solid gains and artificial intelligence-related securities continued their rally, albeit with more volatility along the way.
The U.S. economy continued to expand during the period, although a number of factors acted as headwinds. Consumer spending and the labor market both showed signs of vulnerability, while inflation remained somewhat higher than the Federal Reserve’s stated target; the new Chair of the Federal Reserve, Kevin Warsh, who began serving in this role in May of 2026, has repeatedly indicated that interest rates may need to be higher in order to lower inflation. Meanwhile, the war in Iran and the continued constraints on the global oil supply have created uncertainty for energy prices over the past six months. Against this backdrop, equities generally performed well, with a broadening out of participation as value stocks notched solid gains and artificial intelligence-related securities continued their rally, albeit with more volatility along the way.
What were the top contributors and detractors?
Relative to the Russell 3000 Value Index, stock selection within Information Technology represented the biggest drag on performance; to a lesser degree, stock-picking in Health Care and Industrials also weighed on returns. The biggest positive contribution came from having no exposure to the Utilities sector; an underweight allocation to Consumer Staples and Real Estate made additional contributions to returns.
Relative to the Russell 3000 Value Index, stock selection within Information Technology represented the biggest drag on performance; to a lesser degree, stock-picking in Health Care and Industrials also weighed on returns. The biggest positive contribution came from having no exposure to the Utilities sector; an underweight allocation to Consumer Staples and Real Estate made additional contributions to returns.
How is the Fund currently positioned?
Compared with the Russell 3000 Value Index, the Fund held large overweight positions in the Financials, Information Technology, and Health Care sectors and a corresponding underweight in Consumer Discretionary; the Fund held no exposure to Real Estate and Utilities.
Compared with the Russell 3000 Value Index, the Fund held large overweight positions in the Financials, Information Technology, and Health Care sectors and a corresponding underweight in Consumer Discretionary; the Fund held no exposure to Real Estate and Utilities.
|
Top Contributors
|
|
|
↑
|
MICRON TECHNOLOGY, INC.
|
|
↑
|
FLEX LTD
|
|
↑
|
ALPHABET INC. CLASS A
|
|
↑
|
DELL TECHNOLOGIES, INC. CLASS C
|
|
↑
|
APPLIED MATERIALS, INC.
|
|
Top Detractors
|
|
|
↓
|
CHECK POINT SOFTWARE TECHNOLOGIES LTD.
|
|
↓
|
FERMI INC.
|
|
↓
|
COGNIZANT TECHNOLOGY SOLUTIONS
|
|
↓
|
META PLATFORMS INC CLASS A
|
|
↓
|
NVR, INC.
|
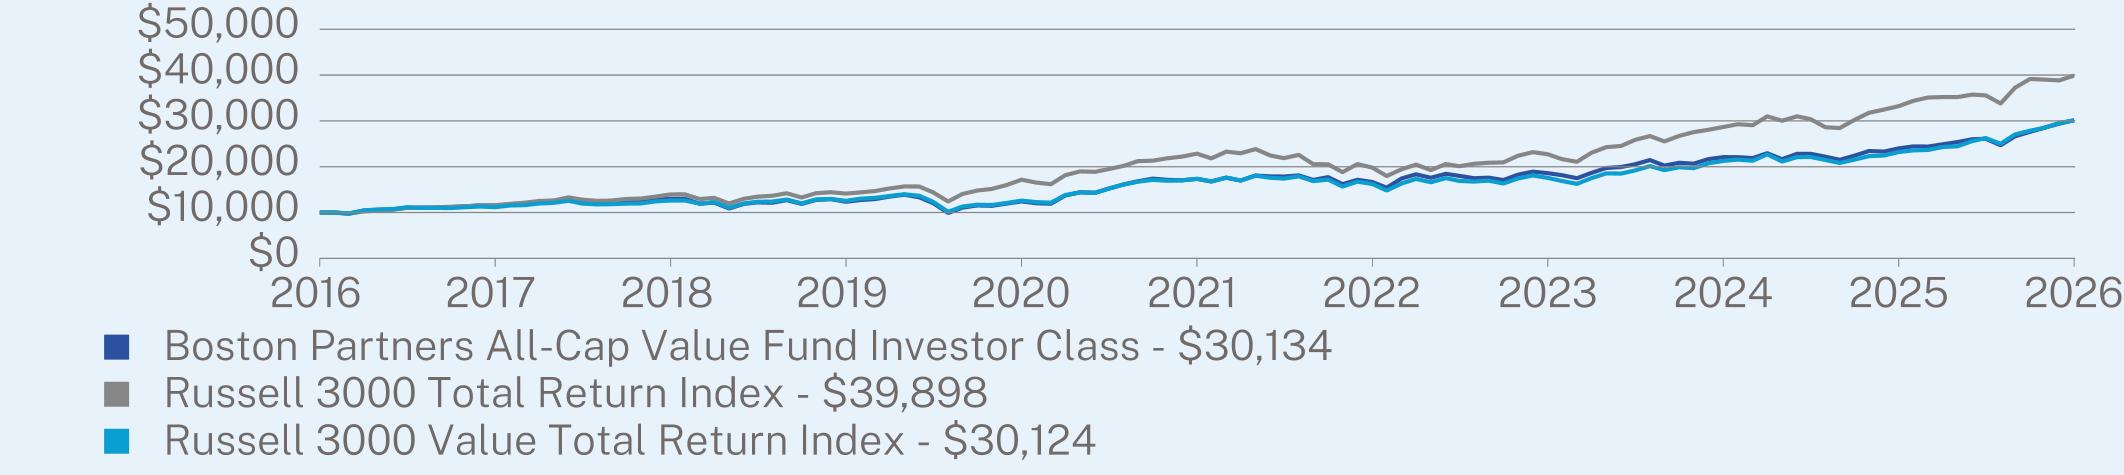
AVERAGE ANNUAL TOTAL RETURN (%)
|
|
1 Year
|
5 Year
|
10 Year
|
|
Investor Class
|
25.52
|
11.67
|
11.66
|
|
Russell 3000 Total Return Index
|
20.10
|
11.80
|
14.84
|
|
Russell 3000 Value Total Return Index
|
29.77
|
11.64
|
11.66
|
Visit https://www.bostonpartners.com/fund/bp-all-cap-value-fund/ for more recent performance information.
KEY FUND STATISTICS (as of August 31, 2026)
|
Net Assets
|
$1,398,073,398
|
|
Number of Holdings
|
101
|
|
Net Advisory Fee
|
$8,575,260
|
|
Portfolio Turnover
|
36%
|
WHAT DID THE FUND INVEST IN? (as of August 31, 2026)
|
Top 10 Holdings
|
(% of Net Assets)
|
|
|
State Street SPDR S&P 500 ETF Trust
|
3.9
|
%
|
|
iShares Russell 1000 Value ETF
|
3.9
|
%
|
|
Microsoft Corp.
|
3.2
|
%
|
|
Bank of America Corp.
|
2.9
|
%
|
|
Corpay, Inc.
|
2.6
|
%
|
|
Alphabet, Inc.
|
2.5
|
%
|
|
Johnson & Johnson
|
2.4
|
%
|
|
JPMorgan Chase & Co.
|
2.0
|
%
|
|
Philip Morris International, Inc.
|
1.9
|
%
|
|
AbbVie, Inc.
|
1.9
|
%
|
|
Top Sectors†
|
(% of Net Assets)
|
|
|
Financials
|
27.7
|
%
|
|
Information Technology
|
19.5
|
%
|
|
Health Care
|
16.2
|
%
|
|
Industrials
|
10.2
|
%
|
|
Communication Services
|
4.8
|
%
|
|
Energy
|
4.0
|
%
|
|
Consumer Staples
|
3.2
|
%
|
|
Consumer Discretionary
|
2.8
|
%
|
|
Materials
|
1.0
|
%
|
|
Cash & Other
|
10.6
|
%
|
Changes to Fund’s Investment Objective or Goals
The Boston Partners All-Cap Value Fund seeks long-term growth of capital and outperformance of its benchmark net of fees.
CHANGES IN AND DISAGREEMENTS WITH ACCOUNTANTS
Effective May 14, 2025, the Fund’s independent registered public accounting firm has been changed from Ernst & Young LLP to Cohen & Company, Ltd.
WHAT WERE THE FUND COSTS FOR THE PERIOD?* (based on a hypothetical $10,000 investment)
|
Class Name
|
Costs of a $10,000 investment
|
Costs paid as a percentage of a $10,000 investment
|
|
R6 Share Class
|
$12
|
0.73%**
|
HOW DID THE FUND PERFORM DURING THE PERIOD AND WHAT AFFECTED ITS PERFORMANCE?
For the Period, the Fund posted a gain and outperformed both its broad-based securities market index, the Russell 3000 Index, and the Russell 3000 Value Index during that time.
What factors influenced performance?
The U.S. economy continued to expand during the period, although a number of factors acted as headwinds. Consumer spending and the labor market both showed signs of vulnerability, while inflation remained somewhat higher than the Federal Reserve’s stated target; the new Chair of the Federal Reserve, Kevin Warsh, who began serving in this role in May of 2026, has repeatedly indicated that interest rates may need to be higher in order to lower inflation. Meanwhile, the war in Iran and the continued constraints on the global oil supply have created uncertainty for energy prices over the past six months. Against this backdrop, equities generally performed well, with a broadening out of participation as value stocks notched solid gains and artificial intelligence-related securities continued their rally, albeit with more volatility along the way.
The U.S. economy continued to expand during the period, although a number of factors acted as headwinds. Consumer spending and the labor market both showed signs of vulnerability, while inflation remained somewhat higher than the Federal Reserve’s stated target; the new Chair of the Federal Reserve, Kevin Warsh, who began serving in this role in May of 2026, has repeatedly indicated that interest rates may need to be higher in order to lower inflation. Meanwhile, the war in Iran and the continued constraints on the global oil supply have created uncertainty for energy prices over the past six months. Against this backdrop, equities generally performed well, with a broadening out of participation as value stocks notched solid gains and artificial intelligence-related securities continued their rally, albeit with more volatility along the way.
What were the top contributors and detractors?
Relative to the Russell 3000 Value Index, holdings in Industrials and Financials contributed the most results. Positioning in Information Technology and, to a lesser degree, Materials acted as a drag on relative returns.
Relative to the Russell 3000 Value Index, holdings in Industrials and Financials contributed the most results. Positioning in Information Technology and, to a lesser degree, Materials acted as a drag on relative returns.
How is the Fund currently positioned?
Compared with the Russell 3000 Value Index, the Fund held large overweight positions in the Financials, Information Technology, and Health Care sectors and a corresponding underweight in Consumer Discretionary; the Fund held no exposure to Real Estate and Utilities.
Compared with the Russell 3000 Value Index, the Fund held large overweight positions in the Financials, Information Technology, and Health Care sectors and a corresponding underweight in Consumer Discretionary; the Fund held no exposure to Real Estate and Utilities.
|
Top Contributors
|
|
|
↑
|
MICRON TECHNOLOGY, INC.
|
|
↑
|
FLEX LTD
|
|
↑
|
ALPHABET INC. CLASS A
|
|
↑
|
DELL TECHNOLOGIES, INC. CLASS C
|
|
↑
|
APPLIED MATERIALS, INC.
|
|
Top Detractors
|
|
|
↓
|
CHECK POINT SOFTWARE TECHNOLOGIES LTD.
|
|
↓
|
FERMI INC.
|
|
↓
|
COGNIZANT TECHNOLOGY SOLUTIONS
|
|
↓
|
META PLATFORMS INC CLASS A
|
|
↓
|
NVR, INC.
|
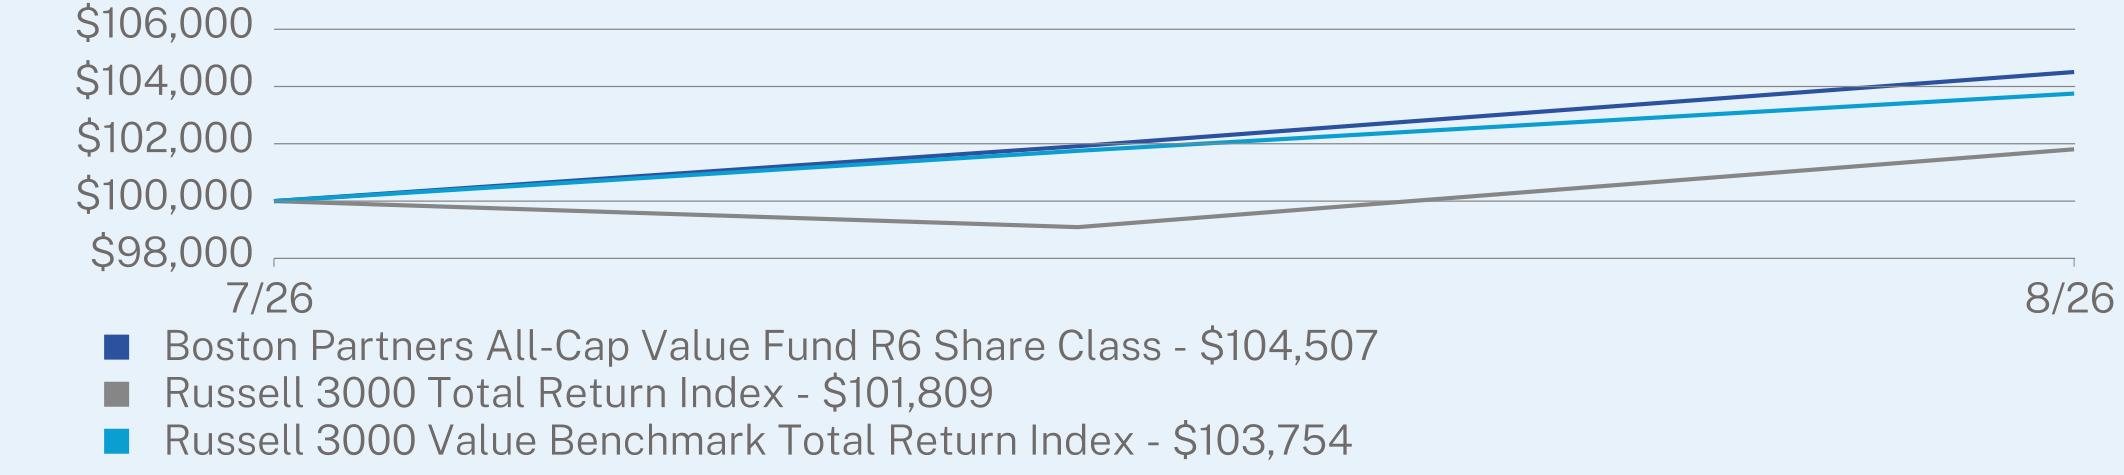
AVERAGE ANNUAL TOTAL RETURN (%)
|
|
Since Inception
(07/06/2026) |
|
R6 Share Class
|
4.51
|
|
Russell 3000 Total Return Index
|
1.81
|
|
Russell 3000 Value Benchmark Total Return Index
|
3.75
|
Visit https://www.bostonpartners.com/fund/bp-all-cap-value-fund-inst/ for more recent performance information.
KEY FUND STATISTICS (as of August 31, 2026)
|
Net Assets
|
$1,398,073,398
|
|
Number of Holdings
|
101
|
|
Net Advisory Fee
|
$8,575,260
|
|
Portfolio Turnover
|
36%
|
WHAT DID THE FUND INVEST IN? (as of August 31, 2026)
|
Top 10 Holdings
|
(% of Net Assets)
|
|
|
State Street SPDR S&P 500 ETF Trust
|
3.9
|
%
|
|
iShares Russell 1000 Value ETF
|
3.9
|
%
|
|
Microsoft Corp.
|
3.2
|
%
|
|
Bank of America Corp.
|
2.9
|
%
|
|
Corpay, Inc.
|
2.6
|
%
|
|
Alphabet, Inc.
|
2.5
|
%
|
|
Johnson & Johnson
|
2.4
|
%
|
|
JPMorgan Chase & Co.
|
2.0
|
%
|
|
Philip Morris International, Inc.
|
1.9
|
%
|
|
AbbVie, Inc.
|
1.9
|
%
|
|
Top Sectors†
|
(% of Net Assets)
|
|
|
Financials
|
27.7
|
%
|
|
Information Technology
|
19.5
|
%
|
|
Health Care
|
16.2
|
%
|
|
Industrials
|
10.2
|
%
|
|
Communication Services
|
4.8
|
%
|
|
Energy
|
4.0
|
%
|
|
Consumer Staples
|
3.2
|
%
|
|
Consumer Discretionary
|
2.8
|
%
|
|
Materials
|
1.0
|
%
|
|
Cash & Other
|
10.6
|
%
|
Changes to Fund’s Investment Objective or Goals
The Boston Partners All-Cap Value Fund seeks long-term growth of capital and outperformance of its benchmark net of fees.
CHANGES IN AND DISAGREEMENTS WITH ACCOUNTANTS
Effective May 14, 2025, the Fund’s independent registered public accounting firm has been changed from Ernst & Young LLP to Cohen & Company, Ltd.
WHAT WERE THE FUND COSTS FOR THE PERIOD? (based on a hypothetical $10,000 investment)
|
Class Name
|
Costs of a $10,000 investment
|
Costs paid as a percentage of a $10,000 investment
|
|
Institutional Class
|
$107
|
0.99%
|
HOW DID THE FUND PERFORM DURING THE PERIOD AND WHAT AFFECTED ITS PERFORMANCE?
For the Period, the Fund posted a gain, but underperformed both the Russell 2000 Value Index and its broad-based securities market index, the Russell 3000 Index.
What factors influenced performance?
The U.S. economy continued to expand during the period, although a number of factors acted as headwinds. Consumer spending and the labor market both showed signs of vulnerability, while inflation remained somewhat higher than the Federal Reserve’s stated target; the new Chair of the Federal Reserve, Kevin Warsh, who began serving in this role in May of 2026, has repeatedly indicated that interest rates may need to be higher in order to lower inflation. Meanwhile, the war in Iran and the continued constraints on the global oil supply have created uncertainty for energy prices over the past six months. Against this backdrop, equities generally performed well, with a broadening out of participation as value stocks notched solid gains and artificial intelligence-related securities continued their rally, albeit with frequent volatility along the way.
The U.S. economy continued to expand during the period, although a number of factors acted as headwinds. Consumer spending and the labor market both showed signs of vulnerability, while inflation remained somewhat higher than the Federal Reserve’s stated target; the new Chair of the Federal Reserve, Kevin Warsh, who began serving in this role in May of 2026, has repeatedly indicated that interest rates may need to be higher in order to lower inflation. Meanwhile, the war in Iran and the continued constraints on the global oil supply have created uncertainty for energy prices over the past six months. Against this backdrop, equities generally performed well, with a broadening out of participation as value stocks notched solid gains and artificial intelligence-related securities continued their rally, albeit with frequent volatility along the way.
What were the top contributors and detractors?
Relative to the Russell 2000 Value Index, holdings within Industrials and Information Technology represented the biggest drag on performance. The Fund’s significant underweight to Real Estate and Utilities was the biggest positive contributor to returns.
Relative to the Russell 2000 Value Index, holdings within Industrials and Information Technology represented the biggest drag on performance. The Fund’s significant underweight to Real Estate and Utilities was the biggest positive contributor to returns.
How is the Fund currently positioned?
Compared with the Russell 2000 Value Index, the Fund held large overweight positions in the Information Technology and Industrials sectors, with corresponding underweights in Real Estate, Utilities, and Health Care.
Compared with the Russell 2000 Value Index, the Fund held large overweight positions in the Information Technology and Industrials sectors, with corresponding underweights in Real Estate, Utilities, and Health Care.
|
Top Contributors
|
|
|
↑
|
PENGUIN SOLUTIONS INCORPORATION, INC.
|
|
↑
|
NATIONAL ENERGY SERVICES REUNITED
|
|
↑
|
BEL FUSE INC. CLASS B
|
|
↑
|
STONEX GROUP INC.
|
|
↑
|
FIRSTCASH HOLDINGS, INC.
|
|
Top Detractors
|
|
|
↓
|
GROUP 1 AUTOMOTIVE, INC.
|
|
↓
|
LEGALZOOM.COM, INC.
|
|
↓
|
JANUS INTERNATIONAL GROUP, INC
|
|
↓
|
MAGNITE, INC.
|
|
↓
|
UPWORK, INC.
|
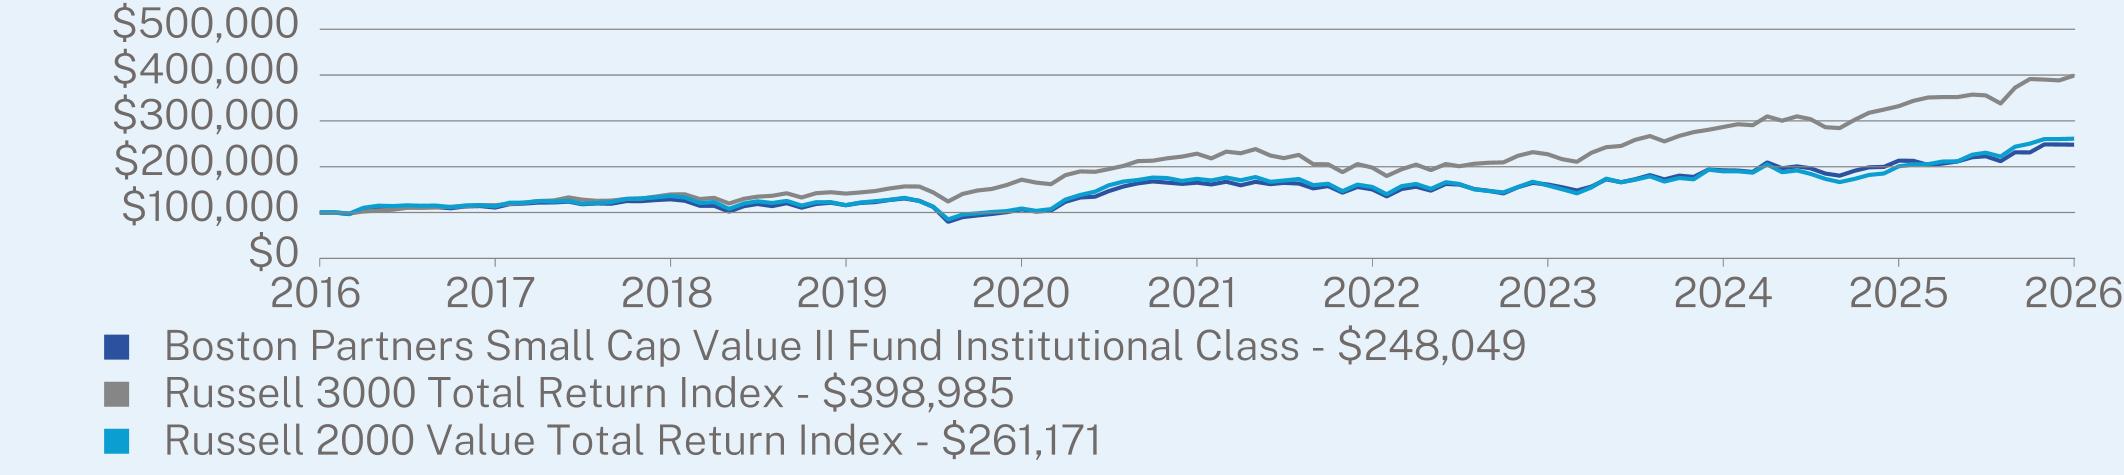
AVERAGE ANNUAL TOTAL RETURN (%)
|
|
1 Year
|
5 Year
|
10 Year
|
|
Institutional Class
|
16.34
|
8.47
|
9.51
|
|
Russell 3000 Total Return Index
|
20.10
|
11.80
|
14.84
|
|
Russell 2000 Value Total Return Index
|
29.95
|
8.52
|
10.08
|
Visit https://www.bostonpartners.com/fund/bp-small-cap-value-fund-ii-inst/ for more recent performance information.
KEY FUND STATISTICS (as of August 31, 2026)
|
Net Assets
|
$837,523,845
|
|
Number of Holdings
|
158
|
|
Net Advisory Fee
|
$6,314,871
|
|
Portfolio Turnover
|
85%
|
WHAT DID THE FUND INVEST IN? (as of August 31, 2026)
|
Top 10 Holdings
|
(% of Net Assets)
|
|
|
Federal Agricultural Mortgage Corp.
|
1.4
|
%
|
|
Bel Fuse, Inc.
|
1.3
|
%
|
|
Weatherford International PLC
|
1.3
|
%
|
|
Magnite, Inc.
|
1.2
|
%
|
|
Northeast Bank
|
1.2
|
%
|
|
Covista, Inc.
|
1.2
|
%
|
|
InterDigital, Inc.
|
1.1
|
%
|
|
National Energy Services Reunited Corp.
|
1.1
|
%
|
|
Nicolet Bankshares, Inc.
|
1.0
|
%
|
|
WEX, Inc.
|
1.0
|
%
|
|
Top Sectors†
|
(% of Net Assets)
|
|
|
Financials
|
27.1
|
%
|
|
Industrials
|
17.2
|
%
|
|
Information Technology
|
13.0
|
%
|
|
Consumer Discretionary
|
11.8
|
%
|
|
Energy
|
7.4
|
%
|
|
Health Care
|
7.1
|
%
|
|
Communication Services
|
4.5
|
%
|
|
Materials
|
4.2
|
%
|
|
Real Estate
|
2.7
|
%
|
|
Cash & Other
|
5.0
|
%
|
Changes to Fund’s Investment Objective or Goals
The Boston Partners Small Cap Value Fund II (the “Fund”) seeks long-term growth of capital and outperformance of its benchmark net of fees.
CHANGES IN AND DISAGREEMENTS WITH ACCOUNTANTS
Effective May 14, 2025, the Fund’s independent registered public accounting firm has been changed from Ernst & Young LLP to Cohen & Company, Ltd.
WHAT WERE THE FUND COSTS FOR THE PERIOD? (based on a hypothetical $10,000 investment)
|
Class Name
|
Costs of a $10,000 investment
|
Costs paid as a percentage of a $10,000 investment
|
|
Investor Class
|
$134
|
1.24%
|
HOW DID THE FUND PERFORM DURING THE PERIOD AND WHAT AFFECTED ITS PERFORMANCE?
For the Period, the Fund posted a gain, but underperformed both the Russell 2000 Value Index and its broad-based securities market index, the Russell 3000 Index.
What factors influenced performance?
The U.S. economy continued to expand during the period, although a number of factors acted as headwinds. Consumer spending and the labor market both showed signs of vulnerability, while inflation remained somewhat higher than the Federal Reserve’s stated target; the new Chair of the Federal Reserve, Kevin Warsh, who began serving in this role in May of 2026, has repeatedly indicated that interest rates may need to be higher in order to lower inflation. Meanwhile, the war in Iran and the continued constraints on the global oil supply have created uncertainty for energy prices over the past six months. Against this backdrop, equities generally performed well, with a broadening out of participation as value stocks notched solid gains and artificial intelligence-related securities continued their rally, albeit with frequent volatility along the way.
The U.S. economy continued to expand during the period, although a number of factors acted as headwinds. Consumer spending and the labor market both showed signs of vulnerability, while inflation remained somewhat higher than the Federal Reserve’s stated target; the new Chair of the Federal Reserve, Kevin Warsh, who began serving in this role in May of 2026, has repeatedly indicated that interest rates may need to be higher in order to lower inflation. Meanwhile, the war in Iran and the continued constraints on the global oil supply have created uncertainty for energy prices over the past six months. Against this backdrop, equities generally performed well, with a broadening out of participation as value stocks notched solid gains and artificial intelligence-related securities continued their rally, albeit with frequent volatility along the way.
What were the top contributors and detractors?
Relative to the Russell 2000 Value Index, holdings within Industrials and Information Technology represented the biggest drag on performance. The Fund’s significant underweight to Real Estate and Utilities was the biggest positive contributor to returns.
Relative to the Russell 2000 Value Index, holdings within Industrials and Information Technology represented the biggest drag on performance. The Fund’s significant underweight to Real Estate and Utilities was the biggest positive contributor to returns.
How is the Fund currently positioned?
Compared with the Russell 2000 Value Index, the Fund held large overweight positions in the Information Technology and Industrials sectors, with corresponding underweights in Real Estate, Utilities, and Health Care.
Compared with the Russell 2000 Value Index, the Fund held large overweight positions in the Information Technology and Industrials sectors, with corresponding underweights in Real Estate, Utilities, and Health Care.
|
Top Contributors
|
|
|
↑
|
PENGUIN SOLUTIONS INCORPORATION, INC.
|
|
↑
|
NATIONAL ENERGY SERVICES REUNITED
|
|
↑
|
BEL FUSE INC. CLASS B
|
|
↑
|
STONEX GROUP INC.
|
|
↑
|
FIRSTCASH HOLDINGS, INC.
|
|
Top Detractors
|
|
|
↓
|
GROUP 1 AUTOMOTIVE, INC.
|
|
↓
|
LEGALZOOM.COM, INC.
|
|
↓
|
JANUS INTERNATIONAL GROUP, INC
|
|
↓
|
MAGNITE, INC.
|
|
↓
|
UPWORK, INC.
|
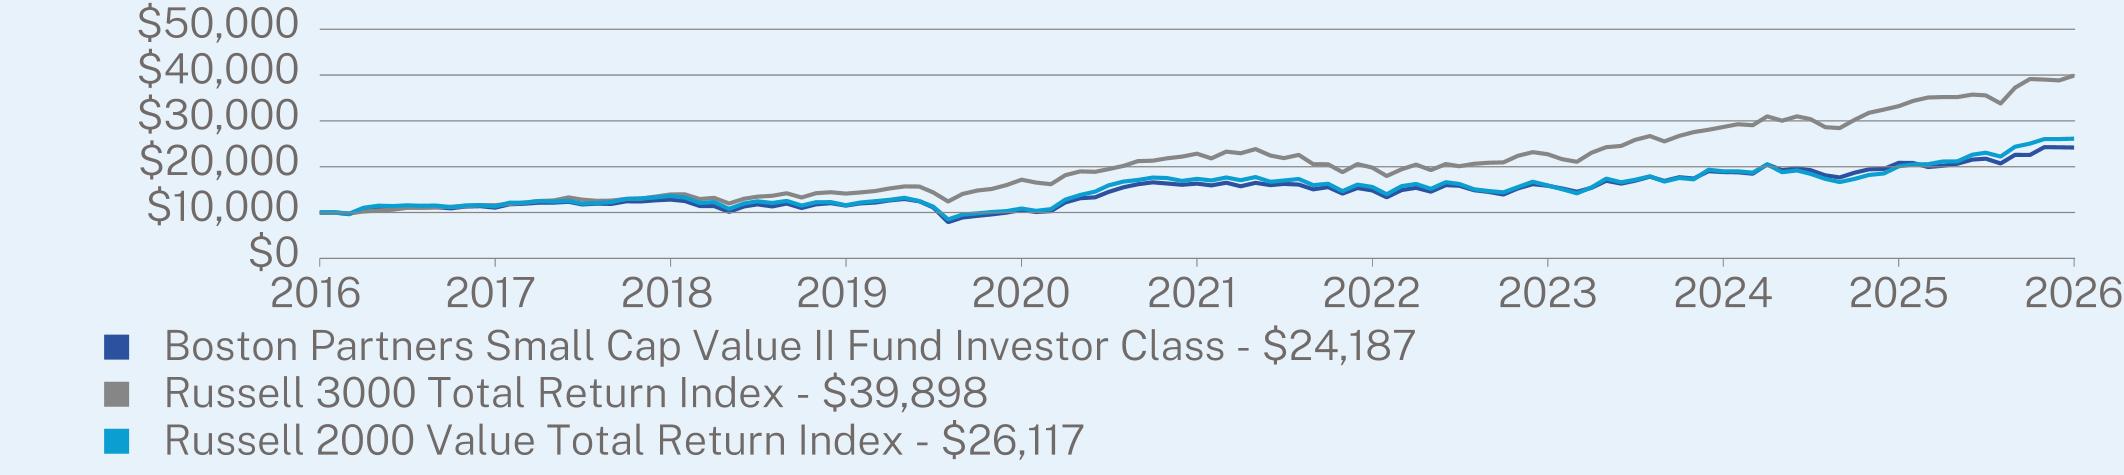
AVERAGE ANNUAL TOTAL RETURN (%)
|
|
1 Year
|
5 Year
|
10 Year
|
|
Investor Class
|
16.03
|
8.19
|
9.23
|
|
Russell 3000 Total Return Index
|
20.10
|
11.80
|
14.84
|
|
Russell 2000 Value Total Return Index
|
29.95
|
8.52
|
10.08
|
Visit https://www.bostonpartners.com/fund/bp-small-cap-value-fund-ii/ for more recent performance information.
KEY FUND STATISTICS (as of August 31, 2026)
|
Net Assets
|
$837,523,845
|
|
Number of Holdings
|
158
|
|
Net Advisory Fee
|
$6,314,871
|
|
Portfolio Turnover
|
85%
|
WHAT DID THE FUND INVEST IN? (as of August 31, 2026)
|
Top 10 Holdings
|
(% of Net Assets)
|
|
|
Federal Agricultural Mortgage Corp.
|
1.4
|
%
|
|
Bel Fuse, Inc.
|
1.3
|
%
|
|
Weatherford International PLC
|
1.3
|
%
|
|
Magnite, Inc.
|
1.2
|
%
|
|
Northeast Bank
|
1.2
|
%
|
|
Covista, Inc.
|
1.2
|
%
|
|
InterDigital, Inc.
|
1.1
|
%
|
|
National Energy Services Reunited Corp.
|
1.1
|
%
|
|
Nicolet Bankshares, Inc.
|
1.0
|
%
|
|
WEX, Inc.
|
1.0
|
%
|
|
Top Sectors†
|
(% of Net Assets)
|
|
|
Financials
|
27.1
|
%
|
|
Industrials
|
17.2
|
%
|
|
Information Technology
|
13.0
|
%
|
|
Consumer Discretionary
|
11.8
|
%
|
|
Energy
|
7.4
|
%
|
|
Health Care
|
7.1
|
%
|
|
Communication Services
|
4.5
|
%
|
|
Materials
|
4.2
|
%
|
|
Real Estate
|
2.7
|
%
|
|
Cash & Other
|
5.0
|
%
|
Changes to Fund’s Investment Objective or Goals
The Boston Partners Small Cap Value Fund II seeks long-term growth of capital and outperformance of its benchmark net of fees.
CHANGES IN AND DISAGREEMENTS WITH ACCOUNTANTS
Effective May 14, 2025, the Fund’s independent registered public accounting firm has been changed from Ernst & Young LLP to Cohen & Company, Ltd.
WHAT WERE THE FUND COSTS FOR THE PERIOD?* (based on a hypothetical $10,000 investment)
|
Class Name
|
Costs of a $10,000 investment
|
Costs paid as a percentage of a $10,000 investment
|
|
R6 Share Class
|
$14
|
0.92%**
|
HOW DID THE FUND PERFORM DURING THE PERIOD AND WHAT AFFECTED ITS PERFORMANCE?
For the Period, the Fund posted a gain, underperforming its broad-based securities market index, the Russell 3000 Index, but outperforming the Russell 2000 Value Index.
What factors influenced performance?
The U.S. economy continued to expand during the period, although a number of factors acted as headwinds. Consumer spending and the labor market both showed signs of vulnerability, while inflation remained somewhat higher than the Federal Reserve’s stated target; the new Chair of the Federal Reserve, Kevin Warsh, who began serving in this role in May of 2026, has repeatedly indicated that interest rates may need to be higher in order to lower inflation. Meanwhile, the war in Iran and the continued constraints on the global oil supply have created uncertainty for energy prices over the past six months. Against this backdrop, equities generally performed well, with a broadening out of participation as value stocks notched solid gains and artificial intelligence-related securities continued their rally, albeit with more volatility along the way.
The U.S. economy continued to expand during the period, although a number of factors acted as headwinds. Consumer spending and the labor market both showed signs of vulnerability, while inflation remained somewhat higher than the Federal Reserve’s stated target; the new Chair of the Federal Reserve, Kevin Warsh, who began serving in this role in May of 2026, has repeatedly indicated that interest rates may need to be higher in order to lower inflation. Meanwhile, the war in Iran and the continued constraints on the global oil supply have created uncertainty for energy prices over the past six months. Against this backdrop, equities generally performed well, with a broadening out of participation as value stocks notched solid gains and artificial intelligence-related securities continued their rally, albeit with more volatility along the way.
What were the top contributors and detractors?
Relative to the Russell 2000 Value Index, holding within Industrials and, to a lesser degree, Communication Services and Consumer Discretionary represented the biggest contributors to returns. Positioning in Information Technology and, to a more limited degree, Consumer Staples weighed on relative results.
Relative to the Russell 2000 Value Index, holding within Industrials and, to a lesser degree, Communication Services and Consumer Discretionary represented the biggest contributors to returns. Positioning in Information Technology and, to a more limited degree, Consumer Staples weighed on relative results.
How is the Fund currently positioned?
Compared with the Russell 2000 Value Index, the Fund held large overweight positions in the Information Technology and Industrials sectors, with corresponding underweights in Real Estate, Utilities, and Health Care.
Compared with the Russell 2000 Value Index, the Fund held large overweight positions in the Information Technology and Industrials sectors, with corresponding underweights in Real Estate, Utilities, and Health Care.
|
Top Contributors
|
|
|
↑
|
PENGUIN SOLUTIONS INCORPORATION, INC.
|
|
↑
|
NATIONAL ENERGY SERVICES REUNITED
|
|
↑
|
BEL FUSE INC. CLASS B
|
|
↑
|
STONEX GROUP INC.
|
|
↑
|
FIRSTCASH HOLDINGS, INC.
|
|
Top Detractors
|
|
|
↓
|
GROUP 1 AUTOMOTIVE, INC.
|
|
↓
|
LEGALZOOM.COM, INC.
|
|
↓
|
JANUS INTERNATIONAL GROUP, INC
|
|
↓
|
MAGNITE, INC.
|
|
↓
|
UPWORK, INC.
|
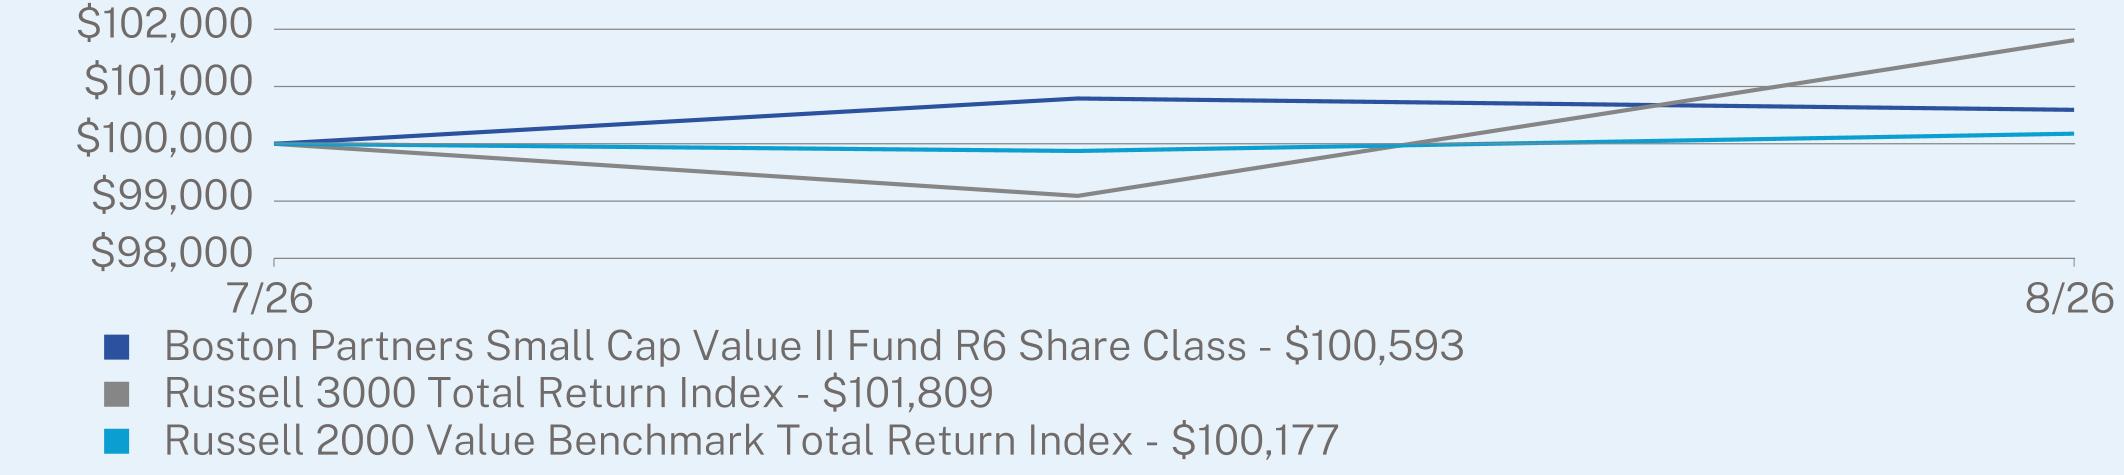
ANNUAL AVERAGE TOTAL RETURN (%)
|
|
Since Inception
(07/06/2026) |
|
R6 Share Class
|
0.59
|
|
Russell 3000 Total Return Index
|
1.81
|
|
Russell 2000 Value Benchmark Total Return Index
|
0.18
|
Visit https://www.bostonpartners.com/fund/bp-small-cap-value-fund-ii-inst/ for more recent performance information.
KEY FUND STATISTICS (as of August 31, 2026)
|
Net Assets
|
$837,523,845
|
|
Number of Holdings
|
158
|
|
Net Advisory Fee
|
$6,314,871
|
|
Portfolio Turnover
|
85%
|
WHAT DID THE FUND INVEST IN? (as of August 31, 2026)
|
Top 10 Holdings
|
(% of Net Assets)
|
|
|
Federal Agricultural Mortgage Corp.
|
1.4
|
%
|
|
Bel Fuse, Inc.
|
1.3
|
%
|
|
Weatherford International PLC
|
1.3
|
%
|
|
Magnite, Inc.
|
1.2
|
%
|
|
Northeast Bank
|
1.2
|
%
|
|
Covista, Inc.
|
1.2
|
%
|
|
InterDigital, Inc.
|
1.1
|
%
|
|
National Energy Services Reunited Corp.
|
1.1
|
%
|
|
Nicolet Bankshares, Inc.
|
1.0
|
%
|
|
WEX, Inc.
|
1.0
|
%
|
|
Top Sectors†
|
(% of Net Assets)
|
|
|
Financials
|
27.1
|
%
|
|
Industrials
|
17.2
|
%
|
|
Information Technology
|
13.0
|
%
|
|
Consumer Discretionary
|
11.8
|
%
|
|
Energy
|
7.4
|
%
|
|
Health Care
|
7.1
|
%
|
|
Communication Services
|
4.5
|
%
|
|
Materials
|
4.2
|
%
|
|
Real Estate
|
2.7
|
%
|
|
Cash & Other
|
5.0
|
%
|
Changes to Fund’s Investment Objective or Goals
The Boston Partners Small Cap Value Fund II seeks long-term growth of capital and outperformance of its benchmark net of fees.
CHANGES IN AND DISAGREEMENTS WITH ACCOUNTANTS
Effective May 14, 2025, the Fund’s independent registered public accounting firm has been changed from Ernst & Young LLP to Cohen & Company, Ltd.
WHAT WERE THE FUND COSTS FOR THE PERIOD? (based on a hypothetical $10,000 investment)
|
Class Name
|
Costs of a $10,000 investment
|
Costs paid as a percentage of a $10,000 investment
|
|
Institutional
|
$130
|
1.10%
|
HOW DID THE FUND PERFORM DURING THE PERIOD AND WHAT AFFECTED ITS PERFORMANCE?
For the Period, the Fund posted a gain and outperformed both the Russell 2000 Value Index and its broad-based securities market index, the Russell 3000 Index.
What factors influenced performance?
The U.S. economy continued to expand during the period, although a number of factors acted as headwinds. Consumer spending and the labor market both showed signs of vulnerability, while inflation remained somewhat higher than the Federal Reserve’s stated target; the new Chair of the Federal Reserve, Kevin Warsh, who began serving in this role in May of 2026, has repeatedly indicated that interest rates may need to be higher in order to lower inflation. Meanwhile, the war in Iran and the continued constraints on the global oil supply has created uncertainty for energy prices over the past six months. Against this backdrop, equities generally performed well, with a broadening out of participation as value stocks notched solid gains and artificial intelligence-related securities continued their rally, albeit with more volatility along the way.
The U.S. economy continued to expand during the period, although a number of factors acted as headwinds. Consumer spending and the labor market both showed signs of vulnerability, while inflation remained somewhat higher than the Federal Reserve’s stated target; the new Chair of the Federal Reserve, Kevin Warsh, who began serving in this role in May of 2026, has repeatedly indicated that interest rates may need to be higher in order to lower inflation. Meanwhile, the war in Iran and the continued constraints on the global oil supply has created uncertainty for energy prices over the past six months. Against this backdrop, equities generally performed well, with a broadening out of participation as value stocks notched solid gains and artificial intelligence-related securities continued their rally, albeit with more volatility along the way.
What were the top contributors and detractors?
Relative to the Russell 2000 Value Index, security selection within Communication Services and Industrials was the most significant contributor to relative results. Positioning within the Energy sector represented the biggest drag on performance, also due to selection.
Relative to the Russell 2000 Value Index, security selection within Communication Services and Industrials was the most significant contributor to relative results. Positioning within the Energy sector represented the biggest drag on performance, also due to selection.
How is the Fund currently positioned?
Compared with the Russell 2000 Value Index, the Fund held large overweight positions in the Information Technology, Materials, and Industrials sectors, and significant underweights in Financials and Consumer Discretionary, and held no exposure to Real Estate or Utilities.
Compared with the Russell 2000 Value Index, the Fund held large overweight positions in the Information Technology, Materials, and Industrials sectors, and significant underweights in Financials and Consumer Discretionary, and held no exposure to Real Estate or Utilities.
|
Top Contributors
|
|
|
↑
|
VIMEO, INC.
|
|
↑
|
SILICON MOTION TECHNOLOGY CORP. -ADR
|
|
↑
|
CAREDX, INC.
|
|
↑
|
THYSSENKRUPP AG
|
|
↑
|
ULTRA CLEAN HOLDINGS, INC.
|
|
Top Detractors
|
|
|
↓
|
NCR VOYIX CORPORATION
|
|
↓
|
DRIVEN BRANDS HOLDINGS, INC.
|
|
↓
|
PEGASYSTEMS INC.
|
|
↓
|
OPTION CARE HEALTH INC
|
|
↓
|
GROCERY OUTLET HOLDING CORP.
|
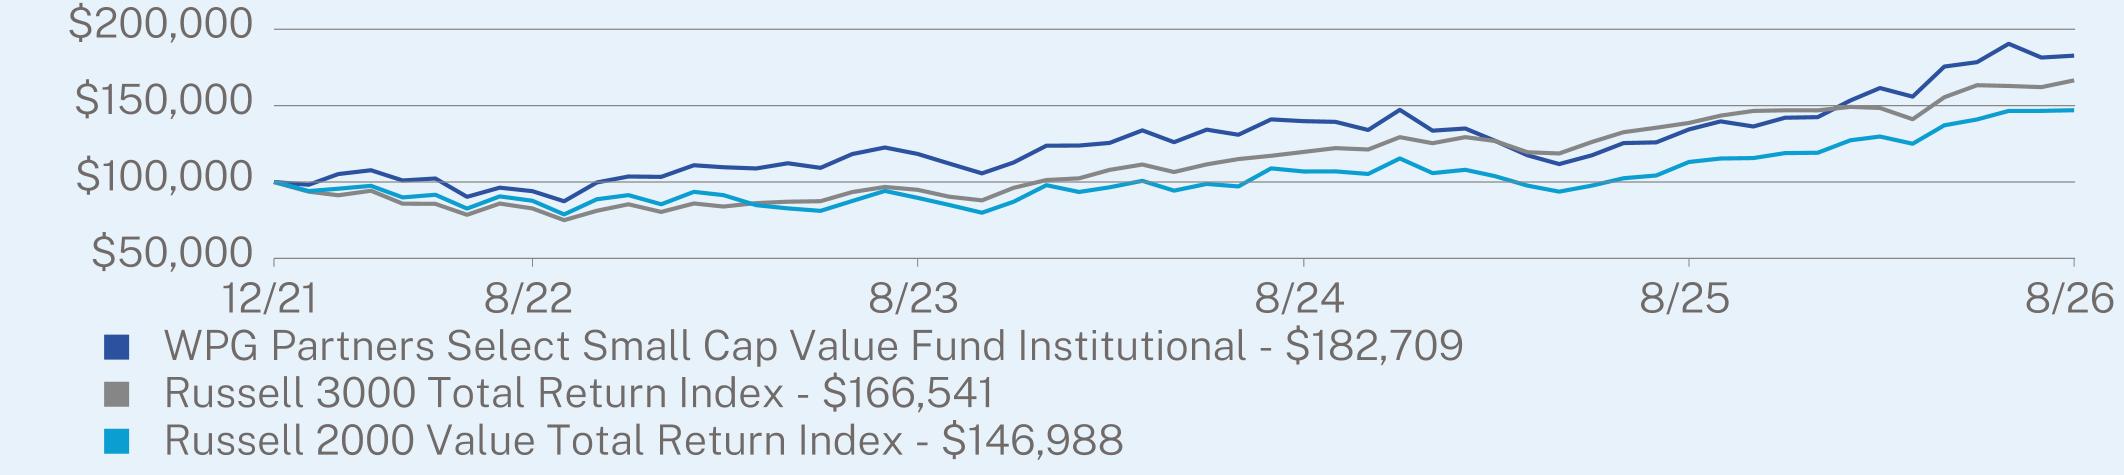
ANNUAL AVERAGE TOTAL RETURN (%)
|
|
1 Year
|
Since Inception
(12/29/2021) |
|
Institutional
|
35.91
|
13.77
|
|
Russell 3000 Total Return Index
|
20.10
|
11.54
|
|
Russell 2000 Value Total Return Index
|
29.95
|
8.60
|
Visit https://www.bostonpartners.com/affiliates/wpg-select-small-cap-value-fund/ for more recent performance information.
KEY FUND STATISTICS (as of August 31, 2026)
|
Net Assets
|
$249,481,836
|
|
Number of Holdings
|
47
|
|
Net Advisory Fee
|
$2,016,411
|
|
Portfolio Turnover
|
124%
|
WHAT DID THE FUND INVEST IN? (as of August 31, 2026)
|
Top 10 Holdings
|
(% of Net Assets)
|
|
|
ICON PLC
|
4.9
|
%
|
|
Teradata Corp.
|
4.4
|
%
|
|
Silicon Motion Technology Corp.
|
4.0
|
%
|
|
Liberty Energy, Inc.
|
3.7
|
%
|
|
thyssenkrupp AG
|
3.6
|
%
|
|
Regal Rexnord Corp.
|
3.5
|
%
|
|
Century Aluminum Co.
|
3.5
|
%
|
|
Ultra Clean Holdings, Inc.
|
3.5
|
%
|
|
PTC Therapeutics, Inc.
|
3.2
|
%
|
|
Littelfuse, Inc.
|
3.0
|
%
|
|
Top Sectors†
|
(% of Net Assets)
|
|
|
Industrials
|
20.6
|
%
|
|
Information Technology
|
18.2
|
%
|
|
Health Care
|
17.2
|
%
|
|
Materials
|
13.0
|
%
|
|
Financials
|
11.8
|
%
|
|
Energy
|
7.1
|
%
|
|
Communication Services
|
4.1
|
%
|
|
Consumer Discretionary
|
2.6
|
%
|
|
Consumer Staples
|
2.5
|
%
|
|
Cash & Other
|
2.9
|
%
|
Changes to Fund’s Investment Objective or Goals
The WPG Partners Select Small Cap Value Fund seeks long-term growth of capital and outperformance of its benchmark net of fees.
CHANGES IN AND DISAGREEMENTS WITH ACCOUNTANTS
Effective May 14, 2025, the Fund’s independent registered public accounting firm has been changed from Ernst & Young LLP to Cohen & Company, Ltd.
WHAT WERE THE FUND COSTS FOR THE PERIOD? (based on a hypothetical $10,000 investment)
|
Class Name
|
Costs of a $10,000 investment
|
Costs paid as a percentage of a $10,000 investment
|
|
Institutional
|
$123
|
1.10%
|
HOW DID THE FUND PERFORM DURING THE PERIOD AND WHAT AFFECTED ITS PERFORMANCE?
For the Period, the Fund posted a gain, outperforming its broad-based securities market index, the Russell 3000 Index, but trailing the Russell 2000 Value Index.
What factors influenced performance?
The U.S. economy continued to expand during the period, although a number of factors acted as headwinds. Consumer spending and the labor market both showed signs of vulnerability, while inflation remained somewhat higher than the Federal Reserve’s stated target; the new Chair of the Federal Reserve, Kevin Warsh, who began serving in this role in May of 2026, has repeatedly indicated that interest rates may need to be higher in order to lower inflation. Meanwhile, the war in Iran and the continued constraints on the global oil supply has created uncertainty for energy prices over the past six months. Against this backdrop, equities generally performed well, with a broadening out of participation as value stocks notched solid gains and artificial intelligence-related securities continued their rally, albeit with more volatility along the way.
The U.S. economy continued to expand during the period, although a number of factors acted as headwinds. Consumer spending and the labor market both showed signs of vulnerability, while inflation remained somewhat higher than the Federal Reserve’s stated target; the new Chair of the Federal Reserve, Kevin Warsh, who began serving in this role in May of 2026, has repeatedly indicated that interest rates may need to be higher in order to lower inflation. Meanwhile, the war in Iran and the continued constraints on the global oil supply has created uncertainty for energy prices over the past six months. Against this backdrop, equities generally performed well, with a broadening out of participation as value stocks notched solid gains and artificial intelligence-related securities continued their rally, albeit with more volatility along the way.
What were the top contributors and detractors?
Relative to the Russell 2000 Value Index, holdings within Health Care and, to a lesser degree, Consumer Staples and Consumer Discretionary were the most significant detractors from relative results, primarily due to security selection. Stock selection in Financials and Materials represented the most significant contribution to performance.
Relative to the Russell 2000 Value Index, holdings within Health Care and, to a lesser degree, Consumer Staples and Consumer Discretionary were the most significant detractors from relative results, primarily due to security selection. Stock selection in Financials and Materials represented the most significant contribution to performance.
How is the Fund currently positioned?
Compared with the Russell 2000 Value Index, the Fund held large overweight positions in the Materials, Information Technology, and Industrials sectors, and significant underweights in Financials, Real Estate, and Consumer Discretionary.
Compared with the Russell 2000 Value Index, the Fund held large overweight positions in the Materials, Information Technology, and Industrials sectors, and significant underweights in Financials, Real Estate, and Consumer Discretionary.
|
Top Contributors
|
|
|
↑
|
SILICON MOTION TECHNOLOGY CORP
|
|
↑
|
THYSSENKRUPP AG
|
|
↑
|
MYR GROUP INC.
|
|
↑
|
ULTRA CLEAN HOLDINGS, INC.
|
|
↑
|
ONTO INNOVATION, INC.
|
|
Top Detractors
|
|
|
↓
|
PHREESIA, INC.
|
|
↓
|
NCR VOYIX CORPORATION
|
|
↓
|
DRIVEN BRANDS HOLDINGS, INC.
|
|
↓
|
OPTION CARE HEALTH INC
|
|
↓
|
GROCERY OUTLET HOLDING CORP.
|
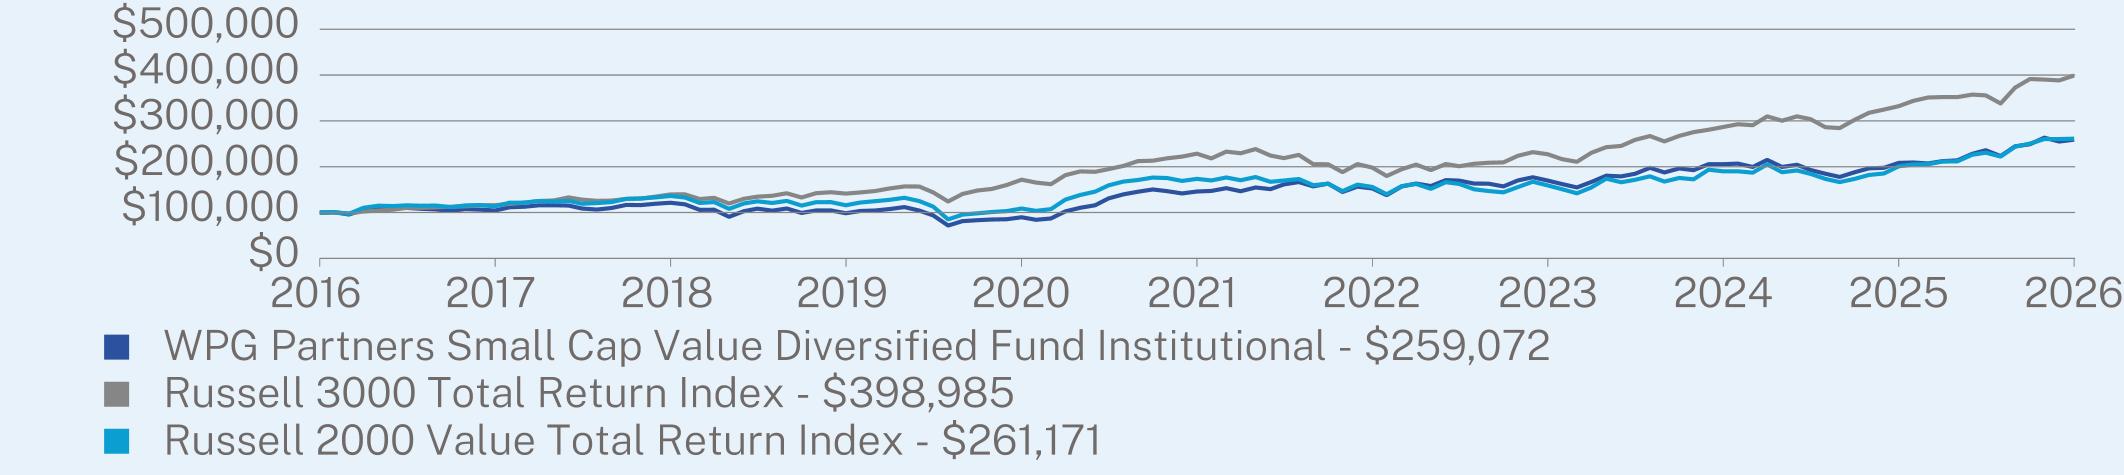
ANNUAL AVERAGE TOTAL RETURN (%)
|
|
1 Year
|
5 Year
|
10 Year
|
|
Institutional Class
|
24.32
|
12.16
|
9.99
|
|
Russell 3000 Total Return Index
|
20.10
|
11.80
|
14.84
|
|
Russell 2000 Value Total Return Index
|
29.95
|
8.52
|
10.08
|
Visit https://www.bostonpartners.com/affiliates/wpg-small-cap-value-diversified-fund/ for more recent performance information.
KEY FUND STATISTICS (as of August 31, 2026)
|
Net Assets
|
$37,678,247
|
|
Number of Holdings
|
99
|
|
Net Advisory Fee
|
$265,681
|
|
Portfolio Turnover
|
99%
|
WHAT DID THE FUND INVEST IN? (as of August 31, 2026)
|
Top 10 Holdings
|
(% of Net Assets)
|
|
|
Teradata Corp.
|
2.8
|
%
|
|
Silicon Motion Technology Corp.
|
2.7
|
%
|
|
thyssenkrupp AG
|
2.5
|
%
|
|
ICON PLC
|
2.5
|
%
|
|
WesBanco, Inc.
|
2.3
|
%
|
|
PTC Therapeutics, Inc.
|
2.2
|
%
|
|
Enterprise Financial Services Corp.
|
2.1
|
%
|
|
BGC Group, Inc.
|
2.1
|
%
|
|
Ultra Clean Holdings, Inc.
|
2.1
|
%
|
|
Liberty Energy, Inc.
|
1.9
|
%
|
|
Top Sectors†
|
(% of Net Assets)
|
|
|
Financials
|
20.1
|
%
|
|
Industrials
|
18.5
|
%
|
|
Information Technology
|
13.4
|
%
|
|
Health Care
|
12.0
|
%
|
|
Materials
|
11.0
|
%
|
|
Energy
|
7.2
|
%
|
|
Consumer Discretionary
|
5.3
|
%
|
|
Utilities
|
2.8
|
%
|
|
Real Estate
|
2.5
|
%
|
|
Cash & Other
|
7.2
|
%
|
Changes to Fund’s Investment Objective or Goals
The WPG Partners Small Cap Value Diversified Fund seeks long-term growth of capital and outperformance of its benchmark net of fees.
Changes to Fund’s Portfolio Manager or Portfolio Management Team
As of June 30, 2026, Mr. Shuster no longer serves as a portfolio manager on the Fund.
CHANGES IN AND DISAGREEMENTS WITH ACCOUNTANTS
Effective May 14, 2025, the Fund’s independent registered public accounting firm has been changed from Ernst & Young LLP to Cohen & Company, Ltd.
WHAT WERE THE FUND COSTS FOR THE PERIOD? (based on a hypothetical $10,000 investment)
|
Class Name
|
Costs of a $10,000 investment
|
Costs paid as a percentage of a $10,000 investment
|
|
Institutional Class
|
$106
|
0.95%
|
HOW DID THE FUND PERFORM DURING THE PERIOD AND WHAT AFFECTED ITS PERFORMANCE?
For the Period, the Fund posted a gain and outperformed its benchmark index, the MSCI World Index, while slightly trailing its secondary index, the MSCI World Value Net Total Return Index.
What factors influenced performance?
Global economic growth continued during the period, although a number of factors acted as headwinds. In the United States, consumer spending and the labor market both showed signs of vulnerability, while inflation remained above the Federal Reserve’s stated target; the new Chair of the Federal Reserve, Kevin Warsh, who began serving in this role in May of 2026, signaled at August’s Jackson Hole symposium that interest rates might need to move higher if progress on prices stalled. The hawkish turn was not confined to the United States: The European Central Bank struck a firmer tone as markets began pricing a September rate hike, and the Bank of Japan continued along its tightening path, pushing sovereign yields to cycle highs in Germany and multi-decade highs in Japan. Meanwhile, the war in Iran and the continued constraints on the global oil supply created uncertainty for energy prices through the second half of the period. Against this backdrop, global equities generally performed well, with a broadening out of participation as value stocks notched solid gains and artificial intelligence-related securities extended their rally, albeit with more volatility along the way.
Global economic growth continued during the period, although a number of factors acted as headwinds. In the United States, consumer spending and the labor market both showed signs of vulnerability, while inflation remained above the Federal Reserve’s stated target; the new Chair of the Federal Reserve, Kevin Warsh, who began serving in this role in May of 2026, signaled at August’s Jackson Hole symposium that interest rates might need to move higher if progress on prices stalled. The hawkish turn was not confined to the United States: The European Central Bank struck a firmer tone as markets began pricing a September rate hike, and the Bank of Japan continued along its tightening path, pushing sovereign yields to cycle highs in Germany and multi-decade highs in Japan. Meanwhile, the war in Iran and the continued constraints on the global oil supply created uncertainty for energy prices through the second half of the period. Against this backdrop, global equities generally performed well, with a broadening out of participation as value stocks notched solid gains and artificial intelligence-related securities extended their rally, albeit with more volatility along the way.
What were the top contributors and detractors?
Relative to the MSCI World Index, stock selection in the Financials sector was the main contributor to the Fund’s outperformance; positioning in Energy and Consumer Discretionary also added value. The Fund’s underweight to Information Technology was the biggest detractor, while stock picking in Industrials and Health Care also weighed on returns.
Relative to the MSCI World Index, stock selection in the Financials sector was the main contributor to the Fund’s outperformance; positioning in Energy and Consumer Discretionary also added value. The Fund’s underweight to Information Technology was the biggest detractor, while stock picking in Industrials and Health Care also weighed on returns.
How is the Fund currently positioned?
Compared with the MSCI World Index, the Fund’s largest sector overweights at the end of the period were Financials and Energy. The Fund’s most significant underweights were to Information Technology and, to a lesser degree, Communication Services and Consumer Discretionary.
Compared with the MSCI World Index, the Fund’s largest sector overweights at the end of the period were Financials and Energy. The Fund’s most significant underweights were to Information Technology and, to a lesser degree, Communication Services and Consumer Discretionary.
|
Top Contributors
|
|
|
↑
|
RENESAS ELECTRONICS CORPORATIO
|
|
↑
|
BANCO BILBAO VIZCAYA ARGENTARI
|
|
↑
|
AIB GROUP PLC
|
|
↑
|
GLENCORE PLC
|
|
↑
|
ING GROEP N.V.
|
|
Top Detractors
|
|
|
↓
|
CHECK POINT SOFTWARE TECHNOLOG
|
|
↓
|
SUGI HOLDINGS CO., LTD.
|
|
↓
|
EPAM SYSTEMS, INC.
|
|
↓
|
ICON PLC
|
|
↓
|
NOVO NORDISK A/S CLASS B
|
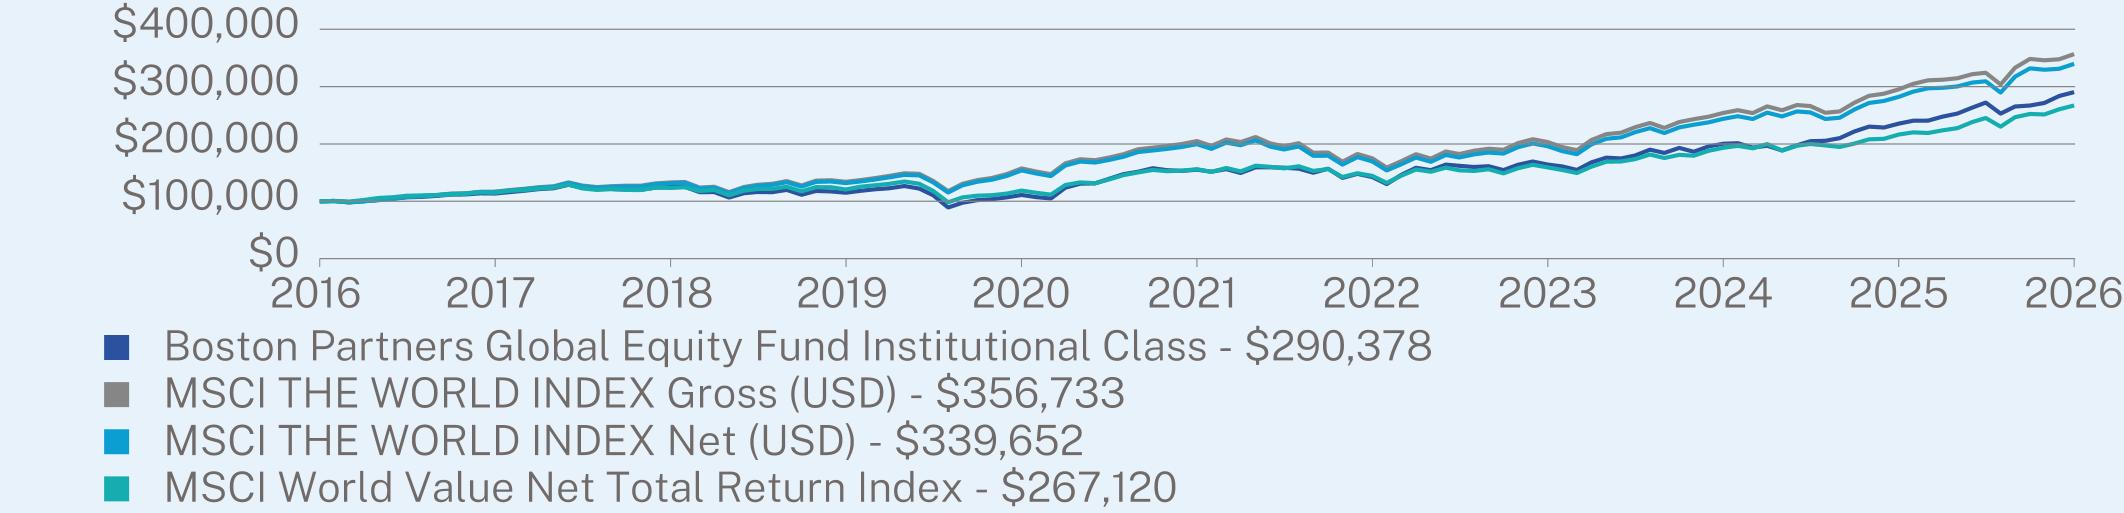
AVERAGE ANNUAL TOTAL RETURN (%)
|
|
1 Year
|
5 Year
|
10 Year
|
|
Institutional Class (without sales charge)
|
23.33
|
13.36
|
11.25
|
|
MSCI THE WORLD INDEX Gross (USD)
|
20.83
|
11.71
|
13.56
|
|
MSCI THE WORLD INDEX Net (USD)
|
20.37
|
11.21
|
13.01
|
|
MSCI World Value Net Total Return Index
|
23.41
|
11.36
|
10.32
|
Visit https://www.bostonpartners.com/fund/bp-global-equity-fund/ for more recent performance information.
KEY FUND STATISTICS (as of August 31, 2026)
|
Net Assets
|
$338,593,905
|
|
Number of Holdings
|
119
|
|
Net Advisory Fee
|
$2,238,274
|
|
Portfolio Turnover
|
68%
|
WHAT DID THE FUND INVEST IN? (as of August 31, 2026)
|
Top 10 Holdings
|
(% of Net Assets)
|
|
|
Banco Bilbao Vizcaya Argentaria SA
|
1.7
|
%
|
|
NatWest Group PLC
|
1.5
|
%
|
|
ING Groep NV
|
1.5
|
%
|
|
Rexel SA
|
1.4
|
%
|
|
Labcorp Holdings, Inc.
|
1.4
|
%
|
|
Nordea Bank Abp
|
1.4
|
%
|
|
Galp Energia SGPS SA
|
1.4
|
%
|
|
Gen Digital, Inc.
|
1.3
|
%
|
|
ABN AMRO Bank NV
|
1.3
|
%
|
|
TotalEnergies SE
|
1.3
|
%
|
|
Top Sectors†
|
(% of Net Assets)
|
|
|
Financials
|
26.3
|
%
|
|
Industrials
|
16.2
|
%
|
|
Health Care
|
14.8
|
%
|
|
Energy
|
11.1
|
%
|
|
Consumer Staples
|
8.1
|
%
|
|
Information Technology
|
6.2
|
%
|
|
Materials
|
5.8
|
%
|
|
Consumer Discretionary
|
5.4
|
%
|
|
Communication Services
|
4.2
|
%
|
|
Cash & Other
|
1.9
|
%
|
Changes to Fund’s Investment Objective or Goals
The Boston Partners Global Equity Fund seeks long-term growth of capital and outperformance of its benchmark net of fees.
CHANGES IN AND DISAGREEMENTS WITH ACCOUNTANTS
Effective May 14, 2025, the Fund’s independent registered public accounting firm has been changed from Ernst & Young LLP to Cohen & Company, Ltd.
WHAT WERE THE FUND COSTS FOR THE PERIOD?* (based on a hypothetical $10,000 investment)
|
Class Name
|
Costs of a $10,000 investment
|
Costs paid as a percentage of a $10,000 investment
|
|
R6 Share Class
|
$14
|
0.88%**
|
HOW DID THE FUND PERFORM DURING THE PERIOD AND WHAT AFFECTED ITS PERFORMANCE?
For the Period, the Fund posted a gain and outperformed its benchmark index, the MSCI World Index, while slightly trailing its secondary index, the MSCI World Value Net Total Return Index.
What factors influenced performance?
Global economic growth continued during the period, although a number of factors acted as headwinds. In the United States, consumer spending and the labor market both showed signs of vulnerability, while inflation remained above the Federal Reserve’s stated target; the new Chair of the Federal Reserve, Kevin Warsh, who began serving in this role in May of 2026, signaled at August’s Jackson Hole symposium that interest rates might need to move higher if progress on prices stalled. The hawkish turn was not confined to the United States: The European Central Bank struck a firmer tone as markets began pricing a September rate hike, and the Bank of Japan continued along its tightening path, pushing sovereign yields to cycle highs in Germany and multi-decade highs in Japan. Meanwhile, the war in Iran and the continued constraints on the global oil supply created uncertainty for energy prices through the second half of the period. Against this backdrop, global equities generally performed well, with a broadening out of participation as value stocks notched solid gains and artificial intelligence-related securities extended their rally, albeit with more volatility along the way.
Global economic growth continued during the period, although a number of factors acted as headwinds. In the United States, consumer spending and the labor market both showed signs of vulnerability, while inflation remained above the Federal Reserve’s stated target; the new Chair of the Federal Reserve, Kevin Warsh, who began serving in this role in May of 2026, signaled at August’s Jackson Hole symposium that interest rates might need to move higher if progress on prices stalled. The hawkish turn was not confined to the United States: The European Central Bank struck a firmer tone as markets began pricing a September rate hike, and the Bank of Japan continued along its tightening path, pushing sovereign yields to cycle highs in Germany and multi-decade highs in Japan. Meanwhile, the war in Iran and the continued constraints on the global oil supply created uncertainty for energy prices through the second half of the period. Against this backdrop, global equities generally performed well, with a broadening out of participation as value stocks notched solid gains and artificial intelligence-related securities extended their rally, albeit with more volatility along the way.
What were the top contributors and detractors?
Relative to the MSCI World Index, positioning in Financials and Energy contributed the most to results. Industrials was the only sector where positioning acted as a meaningful detractor from returns versus the index.
Relative to the MSCI World Index, positioning in Financials and Energy contributed the most to results. Industrials was the only sector where positioning acted as a meaningful detractor from returns versus the index.
How is the Fund currently positioned?
Compared with the MSCI World Index, the Fund’s largest sector overweights at the end of the period were Financials and Energy. The Fund’s most significant underweights were to Information Technology and, to a lesser degree, Communication Services and Consumer Discretionary.
Compared with the MSCI World Index, the Fund’s largest sector overweights at the end of the period were Financials and Energy. The Fund’s most significant underweights were to Information Technology and, to a lesser degree, Communication Services and Consumer Discretionary.
|
Top Contributors
|
|
|
↑
|
RENESAS ELECTRONICS CORPORATIO
|
|
↑
|
BANCO BILBAO VIZCAYA ARGENTARI
|
|
↑
|
AIB GROUP PLC
|
|
↑
|
GLENCORE PLC
|
|
↑
|
ING GROEP N.V.
|
|
Top Detractors
|
|
|
↓
|
CHECK POINT SOFTWARE TECHNOLOG
|
|
↓
|
SUGI HOLDINGS CO., LTD.
|
|
↓
|
EPAM SYSTEMS, INC.
|
|
↓
|
ICON PLC
|
|
↓
|
NOVO NORDISK A/S CLASS B
|
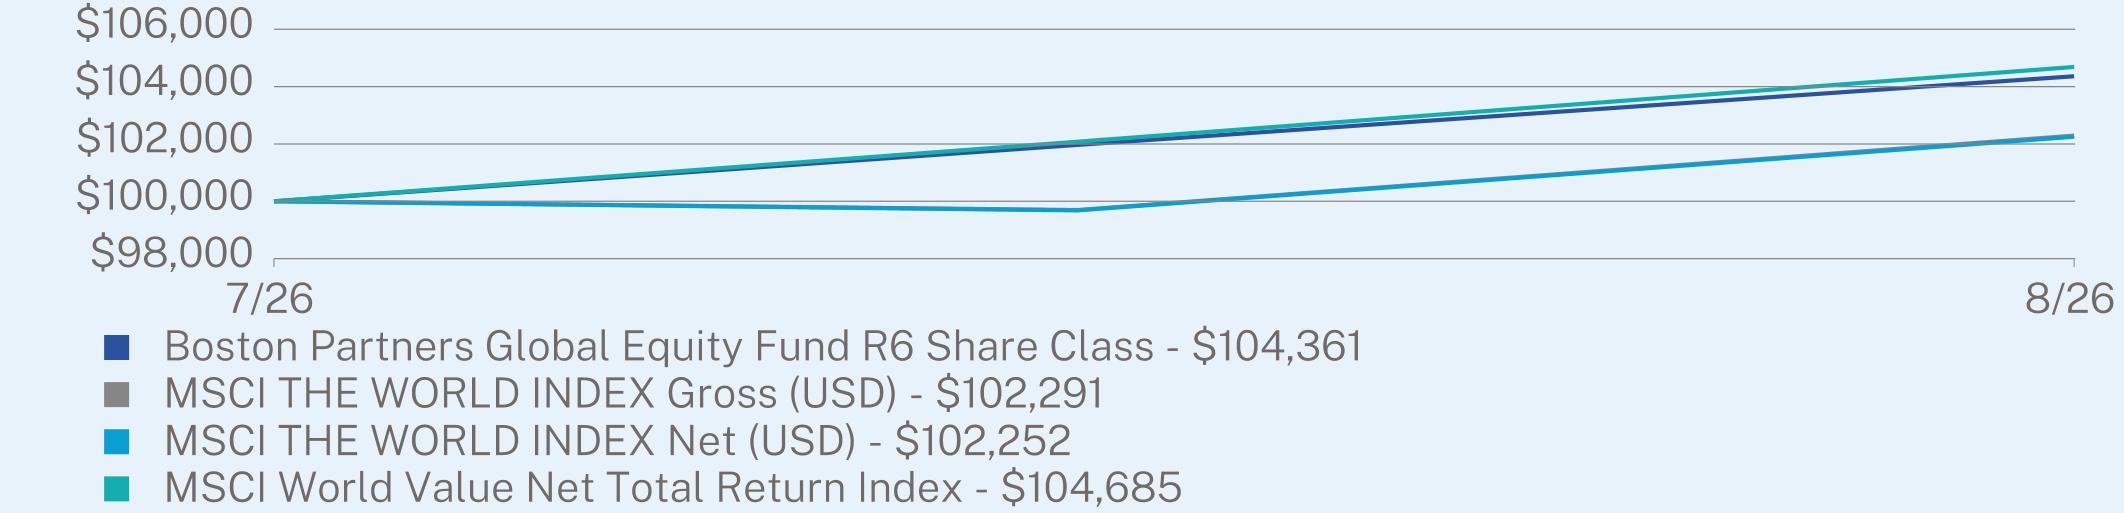
AVERAGE ANNUAL TOTAL RETURN (%)
|
|
Since Inception
(07/06/2026) |
|
R6 Share Class
|
4.36
|
|
MSCI THE WORLD INDEX Gross (USD)
|
2.29
|
|
MSCI THE WORLD INDEX Net (USD)
|
2.25
|
|
MSCI World Value Net Total Return Index
|
4.68
|
Visit https://www.bostonpartners.com/fund/bp-global-equity-fund/ for more recent performance information.
KEY FUND STATISTICS (as of August 31, 2026)
|
Net Assets
|
$338,593,905
|
|
Number of Holdings
|
119
|
|
Net Advisory Fee
|
$2,238,274
|
|
Portfolio Turnover
|
68%
|
WHAT DID THE FUND INVEST IN? (as of August 31, 2026)
|
Top 10 Holdings
|
(% of Net Assets)
|
|
|
Banco Bilbao Vizcaya Argentaria SA
|
1.7
|
%
|
|
NatWest Group PLC
|
1.5
|
%
|
|
ING Groep NV
|
1.5
|
%
|
|
Rexel SA
|
1.4
|
%
|
|
Labcorp Holdings, Inc.
|
1.4
|
%
|
|
Nordea Bank Abp
|
1.4
|
%
|
|
Galp Energia SGPS SA
|
1.4
|
%
|
|
Gen Digital, Inc.
|
1.3
|
%
|
|
ABN AMRO Bank NV
|
1.3
|
%
|
|
TotalEnergies SE
|
1.3
|
%
|
|
Top Sectors†
|
(% of Net Assets)
|
|
|
Financials
|
26.3
|
%
|
|
Industrials
|
16.2
|
%
|
|
Health Care
|
14.8
|
%
|
|
Energy
|
11.1
|
%
|
|
Consumer Staples
|
8.1
|
%
|
|
Information Technology
|
6.2
|
%
|
|
Materials
|
5.8
|
%
|
|
Consumer Discretionary
|
5.4
|
%
|
|
Communication Services
|
4.2
|
%
|
|
Cash & Other
|
1.9
|
%
|
Changes to Fund’s Investment Objective or Goals
The Boston Partners Global Equity Fund seeks long-term growth of capital and outperformance of its benchmark net of fees.
CHANGES IN AND DISAGREEMENTS WITH ACCOUNTANTS
Effective May 14, 2025, the Fund’s independent registered public accounting firm has been changed from Ernst & Young LLP to Cohen & Company, Ltd.
WHAT WERE THE FUND COSTS FOR THE PERIOD? (based on a hypothetical $10,000 investment)
|
Class Name
|
Costs of a $10,000 investment
|
Costs paid as a percentage of a $10,000 investment
|
|
Institutional Class
|
$235
|
2.00%
|
HOW DID THE FUND PERFORM DURING THE PERIOD AND WHAT AFFECTED ITS PERFORMANCE?
For the Period, the Fund posted a gain and outperformed its benchmark index, the S&P 500 Index.
What factors influenced performance?
The U.S. economy continued to expand during the period, although a number of factors acted as headwinds. Consumer spending and the labor market both showed signs of vulnerability, while inflation remained somewhat higher than the Federal Reserve’s stated target; the new Chair of the Federal Reserve, Kevin Warsh, who began serving in this role in May of 2026, has repeatedly indicated that interest rates may need to be higher in order to lower inflation. Meanwhile, the war in Iran and the continued constraints on the global oil supply has created uncertainty for energy prices over the past six months. Against this backdrop, equities generally performed well, with a broadening out of participation as value stocks notched solid gains and artificial intelligence-related securities continued their rally, albeit with more volatility along the way.
The U.S. economy continued to expand during the period, although a number of factors acted as headwinds. Consumer spending and the labor market both showed signs of vulnerability, while inflation remained somewhat higher than the Federal Reserve’s stated target; the new Chair of the Federal Reserve, Kevin Warsh, who began serving in this role in May of 2026, has repeatedly indicated that interest rates may need to be higher in order to lower inflation. Meanwhile, the war in Iran and the continued constraints on the global oil supply has created uncertainty for energy prices over the past six months. Against this backdrop, equities generally performed well, with a broadening out of participation as value stocks notched solid gains and artificial intelligence-related securities continued their rally, albeit with more volatility along the way.
What were the top contributors and detractors?
Relative to the S&P 500 Index, stock selection in the Information Technology, Financials, and Materials sectors generally led contributions to the Fund’s outperformance during the year; its short positioning in Consumer Discretionary also added value. Short positions in Information Technology, Communication Services, and Energy generally held back results versus the benchmark.
Relative to the S&P 500 Index, stock selection in the Information Technology, Financials, and Materials sectors generally led contributions to the Fund’s outperformance during the year; its short positioning in Consumer Discretionary also added value. Short positions in Information Technology, Communication Services, and Energy generally held back results versus the benchmark.
How is the Fund currently positioned?
Compared with the S&P 500 Index, the Fund’s largest net overweight sector at the end of the period was Financials; Materials and Health Care were also overweights, but to a much smaller degree. The Fund’s largest net underweights were to Information Technology and, to a lesser degree, Energy and Communication Services.
Compared with the S&P 500 Index, the Fund’s largest net overweight sector at the end of the period was Financials; Materials and Health Care were also overweights, but to a much smaller degree. The Fund’s largest net underweights were to Information Technology and, to a lesser degree, Energy and Communication Services.
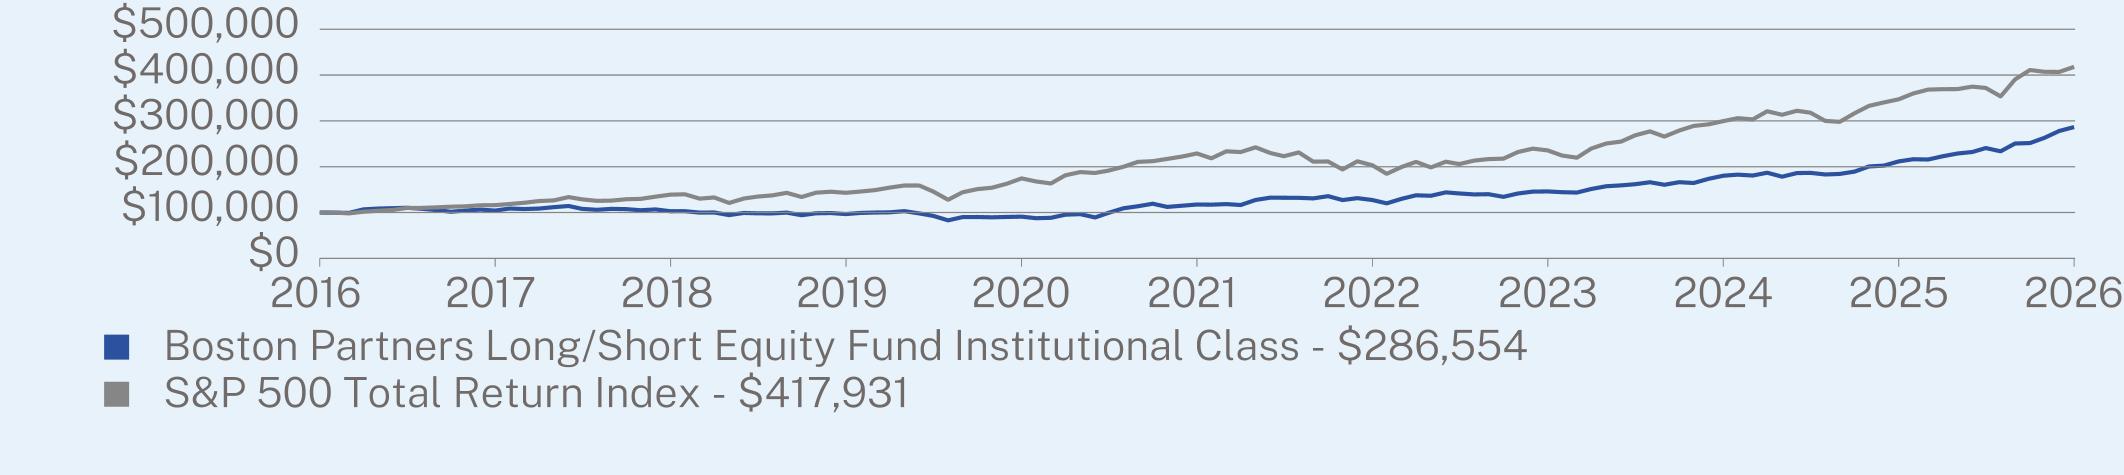
AVERAGE ANNUAL TOTAL RETURN (%)
|
|
1 Year
|
5 Year
|
10 Year
|
|
Institutional Class
|
35.38
|
19.51
|
11.10
|
|
S&P 500 Total Return Index
|
20.38
|
12.79
|
15.37
|
Visit https://www.bostonpartners.com/fund/bp-long-short-equity-fund-inst/ for more recent performance information.
KEY FUND STATISTICS (as of August 31, 2026)
|
Net Assets
|
$268,455,038
|
|
Number of Holdings
|
207
|
|
Net Advisory Fee
|
$1,990,657
|
|
Portfolio Turnover
|
69%
|
WHAT DID THE FUND INVEST IN? (as of August 31, 2026)
|
Top 10 Holdings
|
(% of Net Assets)
|
|
|
Alphabet, Inc.
|
2.6
|
%
|
|
Galliford Try Holdings PLC
|
2.3
|
%
|
|
Marex Group Ltd.
|
2.0
|
%
|
|
BGC Group, Inc.
|
2.0
|
%
|
|
Tenet Healthcare Corp.
|
1.9
|
%
|
|
Hamilton Insurance Group Ltd.
|
1.9
|
%
|
|
Meta Platforms, Inc.
|
1.9
|
%
|
|
Dell Technologies, Inc.
|
1.9
|
%
|
|
Samsung Electronics Co. Ltd.
|
1.7
|
%
|
|
Acadian Asset Management, Inc.
|
1.7
|
%
|
|
Top Sectors†
|
(% of Net Assets)
|
|
|
Financials
|
28.9
|
%
|
|
Information Technology
|
14.9
|
%
|
|
Health Care
|
10.6
|
%
|
|
Consumer Discretionary
|
6.0
|
%
|
|
Communication Services
|
5.3
|
%
|
|
Industrials
|
4.1
|
%
|
|
Materials
|
3.8
|
%
|
|
Consumer Staples
|
2.0
|
%
|
|
Real Estate
|
1.8
|
%
|
|
Cash & Other
|
22.6
|
%
|
Changes to Fund’s Investment Objective or Goals
The Boston Partners Long/Short Equity Fund seeks long-term growth of capital with reduced exposure to general equity market risk.
Changes to Shareholder Fees
Effective March 1, 2026, the management fee for the Long/Short Equity Fund was reduced from 2.25% to 1.60%, and the expense cap for the Institutional Class was reduced from 1.96% to 1.70%. The net expense ratio for the Institutional Class for the fiscal year ended August 31, 2026, was 1.80%.
CHANGES IN AND DISAGREEMENTS WITH ACCOUNTANTS
Effective May 14, 2025, the Fund’s independent registered public accounting firm has been changed from Ernst & Young LLP to Cohen & Company, Ltd.
WHAT WERE THE FUND COSTS FOR THE PERIOD? (based on a hypothetical $10,000 investment)
|
Class Name
|
Costs of a $10,000 investment
|
Costs paid as a percentage of a $10,000 investment
|
|
Investor Class
|
$265
|
2.26%
|
HOW DID THE FUND PERFORM DURING THE PERIOD AND WHAT AFFECTED ITS PERFORMANCE?
For the Period, the Fund posted a gain and outperformed its benchmark index, the S&P 500 Index.
What factors influenced performance?
The U.S. economy continued to expand during the period, although a number of factors acted as headwinds. Consumer spending and the labor market both showed signs of vulnerability, while inflation remained somewhat higher than the Federal Reserve’s stated target; the new Chair of the Federal Reserve, Kevin Warsh, who began serving in this role in May of 2026, has repeatedly indicated that interest rates may need to be higher in order to lower inflation. Meanwhile, the war in Iran and the continued constraints on the global oil supply has created uncertainty for energy prices over the past six months. Against this backdrop, equities generally performed well, with a broadening out of participation as value stocks notched solid gains and artificial intelligence-related securities continued their rally, albeit with more volatility along the way.
The U.S. economy continued to expand during the period, although a number of factors acted as headwinds. Consumer spending and the labor market both showed signs of vulnerability, while inflation remained somewhat higher than the Federal Reserve’s stated target; the new Chair of the Federal Reserve, Kevin Warsh, who began serving in this role in May of 2026, has repeatedly indicated that interest rates may need to be higher in order to lower inflation. Meanwhile, the war in Iran and the continued constraints on the global oil supply has created uncertainty for energy prices over the past six months. Against this backdrop, equities generally performed well, with a broadening out of participation as value stocks notched solid gains and artificial intelligence-related securities continued their rally, albeit with more volatility along the way.
What were the top contributors and detractors?
Relative to the S&P 500 Index, stock selection in the Information Technology, Financials, and Materials sectors generally led contributions to the Fund’s outperformance during the year; its short positioning in Consumer Discretionary also added value. Short positions in Information Technology, Communication Services, and Energy generally held back results versus the benchmark.
Relative to the S&P 500 Index, stock selection in the Information Technology, Financials, and Materials sectors generally led contributions to the Fund’s outperformance during the year; its short positioning in Consumer Discretionary also added value. Short positions in Information Technology, Communication Services, and Energy generally held back results versus the benchmark.
How is the Fund currently positioned?
Compared with the S&P 500 Index, the Fund’s largest net overweight sector at the end of the period was Financials; Materials and Health Care were also overweights, but to a much smaller degree. The Fund’s largest net underweights were to Information Technology and, to a lesser degree, Energy and Communication Services.
Compared with the S&P 500 Index, the Fund’s largest net overweight sector at the end of the period was Financials; Materials and Health Care were also overweights, but to a much smaller degree. The Fund’s largest net underweights were to Information Technology and, to a lesser degree, Energy and Communication Services.
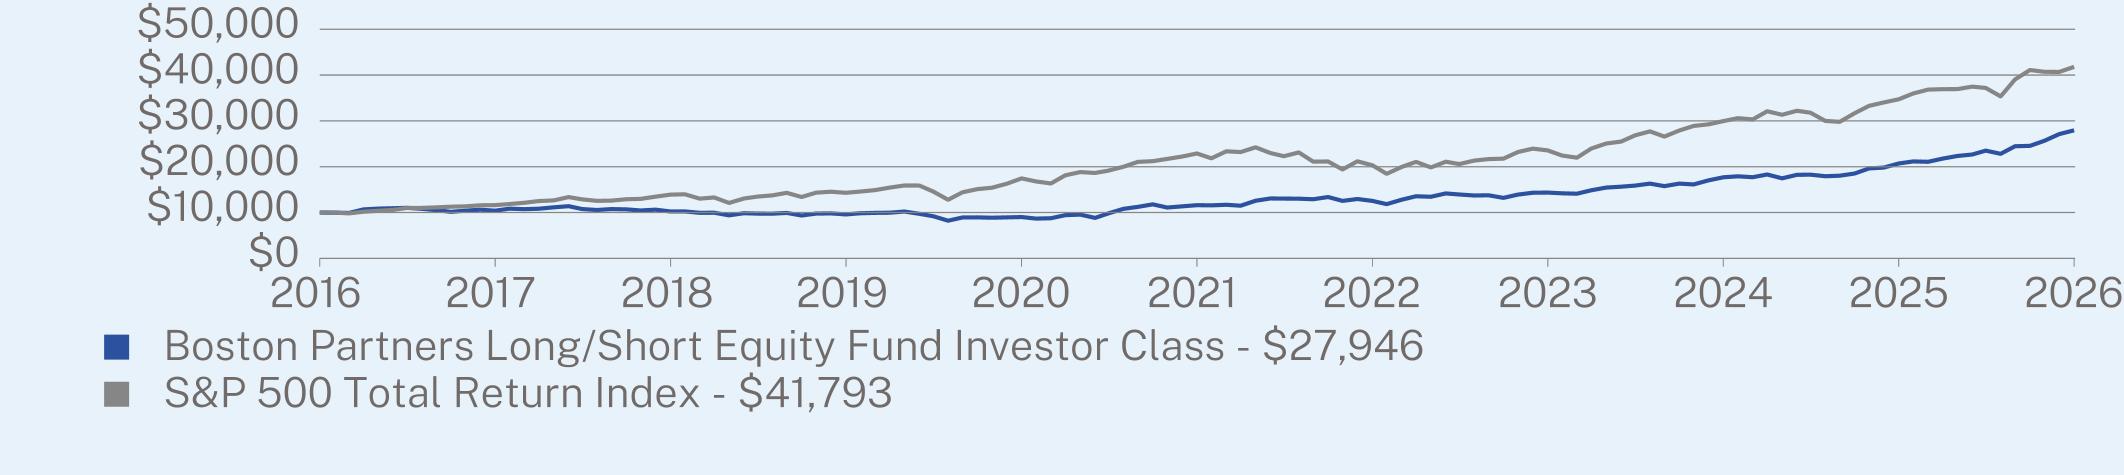
AVERAGE ANNUAL TOTAL RETURN (%)
|
|
1 Year
|
5 Year
|
10 Year
|
|
Investor Class
|
34.91
|
19.21
|
10.82
|
|
S&P 500 Total Return Index
|
20.38
|
12.79
|
15.37
|
Visit https://www.bostonpartners.com/fund/bp-long-short-equity-fund/ for more recent performance information.
KEY FUND STATISTICS (as of August 31, 2026)
|
Net Assets
|
$268,455,038
|
|
Number of Holdings
|
207
|
|
Net Advisory Fee
|
$1,990,657
|
|
Portfolio Turnover
|
69%
|
WHAT DID THE FUND INVEST IN? (as of August 31, 2026)
|
Top 10 Holdings
|
(% of Net Assets)
|
|
|
Alphabet, Inc.
|
2.6
|
%
|
|
Galliford Try Holdings PLC
|
2.3
|
%
|
|
Marex Group Ltd.
|
2.0
|
%
|
|
BGC Group, Inc.
|
2.0
|
%
|
|
Tenet Healthcare Corp.
|
1.9
|
%
|
|
Hamilton Insurance Group Ltd.
|
1.9
|
%
|
|
Meta Platforms, Inc.
|
1.9
|
%
|
|
Dell Technologies, Inc.
|
1.9
|
%
|
|
Samsung Electronics Co. Ltd.
|
1.7
|
%
|
|
Acadian Asset Management, Inc.
|
1.7
|
%
|
|
Top Sectors†
|
(% of Net Assets)
|
|
|
Financials
|
28.9
|
%
|
|
Information Technology
|
14.9
|
%
|
|
Health Care
|
10.6
|
%
|
|
Consumer Discretionary
|
6.0
|
%
|
|
Communication Services
|
5.3
|
%
|
|
Industrials
|
4.1
|
%
|
|
Materials
|
3.8
|
%
|
|
Consumer Staples
|
2.0
|
%
|
|
Real Estate
|
1.8
|
%
|
|
Cash & Other
|
22.6
|
%
|
Changes to Fund’s Investment Objective or Goals
The Boston Partners Long/Short Equity Fund seeks long-term growth of capital with reduced exposure to general equity market risk.
Changes to Shareholder Fees
Effective March 1, 2026, the management fee for the Long/Short Equity Fund was reduced from 2.25% to 1.60%, and the expense cap for the Investor Class was reduced from 2.21% to 1.95%. The net expense ratio for the Investor Class for the fiscal year ended August 31, 2026, was 2.05%.
CHANGES IN AND DISAGREEMENTS WITH ACCOUNTANTS
Effective May 14, 2025, the Fund’s independent registered public accounting firm has been changed from Ernst & Young LLP to Cohen & Company, Ltd.
WHAT WERE THE FUND COSTS FOR THE PERIOD? (based on a hypothetical $10,000 investment)
|
Class Name
|
Costs of a $10,000 investment
|
Costs paid as a percentage of a $10,000 investment
|
|
Institutional Class
|
$187
|
1.75%
|
HOW DID THE FUND PERFORM DURING THE PERIOD AND WHAT AFFECTED ITS PERFORMANCE?
For the Period, the Fund posted a gain but underperformed its benchmark, the S&P 500 Index.
What factors influenced performance?
The U.S. economy continued to expand during the period, although a number of factors acted as headwinds. Consumer spending and the labor market both showed signs of vulnerability, while inflation remained somewhat higher than the Federal Reserve’s stated target; the new Chair of the Federal Reserve, Kevin Warsh, who began serving in this role in May of 2026, has repeatedly indicated that interest rates may need to be higher in order to lower inflation. Meanwhile, the war in Iran and the continued constraints on the global oil supply has created uncertainty for energy prices over the past six months. Against this backdrop, equities generally performed well, with a broadening out of participation as value stocks notched solid gains and artificial intelligence-related securities continued their rally, albeit with more volatility along the way.
The U.S. economy continued to expand during the period, although a number of factors acted as headwinds. Consumer spending and the labor market both showed signs of vulnerability, while inflation remained somewhat higher than the Federal Reserve’s stated target; the new Chair of the Federal Reserve, Kevin Warsh, who began serving in this role in May of 2026, has repeatedly indicated that interest rates may need to be higher in order to lower inflation. Meanwhile, the war in Iran and the continued constraints on the global oil supply has created uncertainty for energy prices over the past six months. Against this backdrop, equities generally performed well, with a broadening out of participation as value stocks notched solid gains and artificial intelligence-related securities continued their rally, albeit with more volatility along the way.
What were the top contributors and detractors?
Relative to the S&P 500 Index, the Fund’s long positioning within Industrials detracted from relative performance as did its short positions in both Industrials and Information Technology. Long positions in Information Technology, Financials, and Materials all added value.
Relative to the S&P 500 Index, the Fund’s long positioning within Industrials detracted from relative performance as did its short positions in both Industrials and Information Technology. Long positions in Information Technology, Financials, and Materials all added value.
How is the Fund currently positioned?
Compared with the S&P 500 Index, the Fund’s largest net exposures at the end of the period were in Industrials and Utilities. The Fund’s smallest net exposures were in Information Technology and Communication Services.
Compared with the S&P 500 Index, the Fund’s largest net exposures at the end of the period were in Industrials and Utilities. The Fund’s smallest net exposures were in Information Technology and Communication Services.
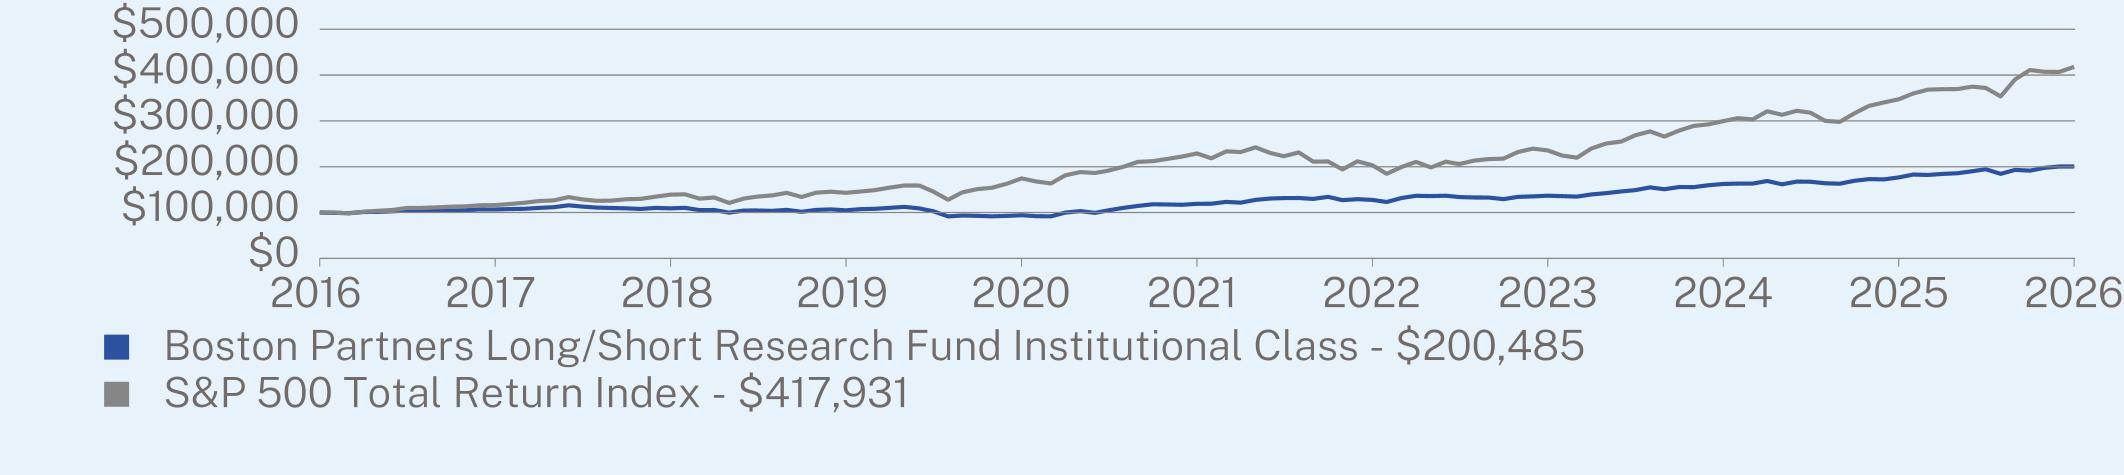
AVERAGE ANNUAL TOTAL RETURN (%)
|
|
1 Year
|
5 Year
|
10 Year
|
|
Institutional Class
|
13.47
|
10.98
|
7.20
|
|
S&P 500 Total Return Index
|
20.38
|
12.79
|
15.37
|
Visit https://www.bostonpartners.com/fund/bp-ls-research-fund-inst/ for more recent performance information.
KEY FUND STATISTICS (as of August 31, 2026)
|
Net Assets
|
$625,209,897
|
|
Number of Holdings
|
419
|
|
Net Advisory Fee
|
$7,248,408
|
|
Portfolio Turnover
|
58%
|
WHAT DID THE FUND INVEST IN? (as of August 31, 2026)
|
Top 10 Holdings
|
(% of Net Assets)
|
|
|
JPMorgan Chase & Co.
|
1.4
|
%
|
|
Frontdoor, Inc.
|
1.2
|
%
|
|
NVIDIA Corp.
|
1.2
|
%
|
|
Wells Fargo & Co.
|
1.1
|
%
|
|
Brink’s Co.
|
1.1
|
%
|
|
Bank of America Corp.
|
1.1
|
%
|
|
AbbVie, Inc.
|
1.1
|
%
|
|
L3Harris Technologies, Inc.
|
1.0
|
%
|
|
UnitedHealth Group, Inc.
|
1.0
|
%
|
|
Booking Holdings, Inc.
|
1.0
|
%
|
|
Top Sectors†
|
(% of Net Assets)
|
|
|
Industrials
|
17.2
|
%
|
|
Financials
|
16.4
|
%
|
|
Information Technology
|
12.1
|
%
|
|
Health Care
|
9.6
|
%
|
|
Consumer Discretionary
|
7.1
|
%
|
|
Utilities
|
4.6
|
%
|
|
Consumer Staples
|
3.6
|
%
|
|
Communication Services
|
2.5
|
%
|
|
Materials
|
2.4
|
%
|
|
Cash & Other
|
24.5
|
%
|
Changes to Fund’s Investment Objective or Goals
The Boston Partners Long/Short Research Fund seeks long-term growth of capital with reduced exposure to general equity market risk.
CHANGES IN AND DISAGREEMENTS WITH ACCOUNTANTS
Effective May 14, 2025, the Fund’s independent registered public accounting firm has been changed from Ernst & Young LLP to Cohen & Company, Ltd.
WHAT WERE THE FUND COSTS FOR THE PERIOD? (based on a hypothetical $10,000 investment)
|
Class Name
|
Costs of a $10,000 investment
|
Costs paid as a percentage of a $10,000 investment
|
|
Investor Class
|
$213
|
2.00%
|
HOW DID THE FUND PERFORM DURING THE PERIOD AND WHAT AFFECTED ITS PERFORMANCE?
For the Period, the Fund posted a gain but underperformed its benchmark, the S&P 500 Index.
What factors influenced performance?
The U.S. economy continued to expand during the period, although a number of factors acted as headwinds. Consumer spending and the labor market both showed signs of vulnerability, while inflation remained somewhat higher than the Federal Reserve’s stated target; the new Chair of the Federal Reserve, Kevin Warsh, who began serving in this role in May of 2026, has repeatedly indicated that interest rates may need to be higher in order to lower inflation. Meanwhile, the war in Iran and the continued constraints on the global oil supply has created uncertainty for energy prices over the past six months. Against this backdrop, equities generally performed well, with a broadening out of participation as value stocks notched solid gains and artificial intelligence-related securities continued their rally, albeit with more volatility along the way.
The U.S. economy continued to expand during the period, although a number of factors acted as headwinds. Consumer spending and the labor market both showed signs of vulnerability, while inflation remained somewhat higher than the Federal Reserve’s stated target; the new Chair of the Federal Reserve, Kevin Warsh, who began serving in this role in May of 2026, has repeatedly indicated that interest rates may need to be higher in order to lower inflation. Meanwhile, the war in Iran and the continued constraints on the global oil supply has created uncertainty for energy prices over the past six months. Against this backdrop, equities generally performed well, with a broadening out of participation as value stocks notched solid gains and artificial intelligence-related securities continued their rally, albeit with more volatility along the way.
What were the top contributors and detractors?
Relative to the S&P 500 Index, the Fund’s long positioning within Industrials detracted from relative performance as did its short positions in both Industrials and Information Technology. Long positions in Information Technology, Financials, and Materials all added value.
Relative to the S&P 500 Index, the Fund’s long positioning within Industrials detracted from relative performance as did its short positions in both Industrials and Information Technology. Long positions in Information Technology, Financials, and Materials all added value.
How is the Fund currently positioned?
Compared with the S&P 500 Index, the Fund’s largest net exposures at the end of the period were in Industrials and Utilities. The Fund’s smallest net exposures were in Information Technology and Communication Services.
Compared with the S&P 500 Index, the Fund’s largest net exposures at the end of the period were in Industrials and Utilities. The Fund’s smallest net exposures were in Information Technology and Communication Services.
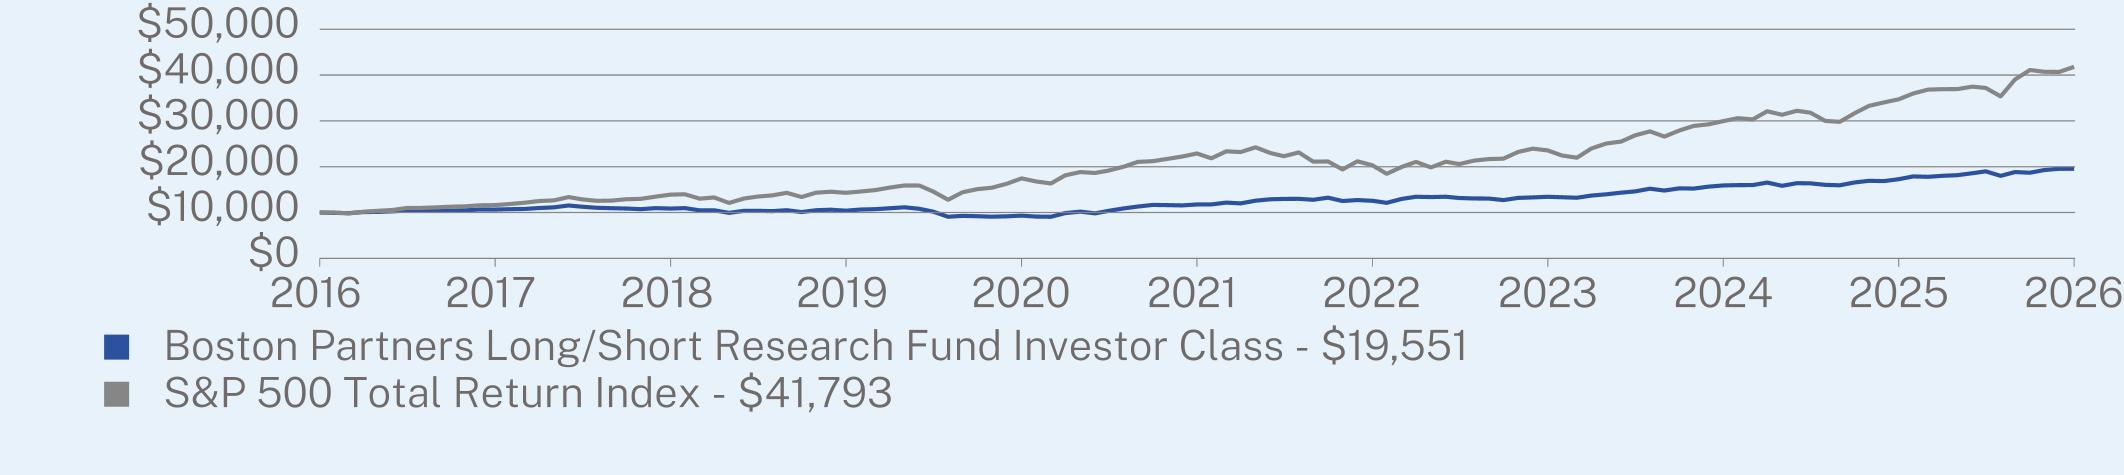
AVERAGE ANNUAL TOTAL RETURN (%)
|
|
1 Year
|
5 Year
|
10 Year
|
|
Investor Class
|
13.12
|
10.69
|
6.93
|
|
S&P 500 Total Return Index
|
20.38
|
12.79
|
15.37
|
Visit https://www.bostonpartners.com/fund/bp-ls-research-fund/ for more recent performance information.
KEY FUND STATISTICS (as of August 31, 2026)
|
Net Assets
|
$625,209,897
|
|
Number of Holdings
|
419
|
|
Net Advisory Fee
|
$7,248,408
|
|
Portfolio Turnover
|
58%
|
WHAT DID THE FUND INVEST IN? (as of August 31, 2026)
|
Top 10 Holdings
|
(% of Net Assets)
|
|
|
JPMorgan Chase & Co.
|
1.4
|
%
|
|
Frontdoor, Inc.
|
1.2
|
%
|
|
NVIDIA Corp.
|
1.2
|
%
|
|
Wells Fargo & Co.
|
1.1
|
%
|
|
Brink’s Co.
|
1.1
|
%
|
|
Bank of America Corp.
|
1.1
|
%
|
|
AbbVie, Inc.
|
1.1
|
%
|
|
L3Harris Technologies, Inc.
|
1.0
|
%
|
|
UnitedHealth Group, Inc.
|
1.0
|
%
|
|
Booking Holdings, Inc.
|
1.0
|
%
|
|
Top Sectors†
|
(% of Net Assets)
|
|
|
Industrials
|
17.2
|
%
|
|
Financials
|
16.4
|
%
|
|
Information Technology
|
12.1
|
%
|
|
Health Care
|
9.6
|
%
|
|
Consumer Discretionary
|
7.1
|
%
|
|
Utilities
|
4.6
|
%
|
|
Consumer Staples
|
3.6
|
%
|
|
Communication Services
|
2.5
|
%
|
|
Materials
|
2.4
|
%
|
|
Cash & Other
|
24.5
|
%
|
Changes to Fund’s Investment Objective or Goals
The Boston Partners Long/Short Research Fund seeks long-term growth of capital with reduced exposure to general equity market risk.
CHANGES IN AND DISAGREEMENTS WITH ACCOUNTANTS
Effective May 14, 2025, the Fund’s independent registered public accounting firm has been changed from Ernst & Young LLP to Cohen & Company, Ltd.
WHAT WERE THE FUND COSTS FOR THE PAST YEAR? (based on a hypothetical $10,000 investment)
|
Class Name
|
Costs of a $10,000 investment
|
Costs paid as a percentage of a $10,000 investment
|
|
Class A
|
$209
|
2.00%
|
HOW DID THE FUND PERFORM DURING THE PERIOD AND WHAT AFFECTED ITS PERFORMANCE?
The Fund produced net gains during the Period, underperforming the benchmark SG CTA Index which returned +18.41% over the same period.
The exposures affecting performance included gains in commodity and equity index futures alongside foreign exchange forwards and losses in fixed income futures. The Fund’s positioning was dynamic during the Period; it maintained a net long positioning in equity index and commodity futures for the majority of the Period and held varied positioning in fixed income futures and foreign exchange forwards.
From a strategy perspective, the Fund trades a variety of systematic models which are grouped into momentum, quant macro, and short-term. Momentum strategies were the most profitable during the Period, with gains in equity indices, commodities, and foreign exchange; and losses in fixed income. Short-term strategies posted modest losses, as gains in commodities and foreign exchange were more than offset by losses in equity indices and fixed income. Finally, quant macro strategies were also not profitable, posting losses in fixed income and equity indices and some partially offsetting gains in commodities and foreign exchange.
Overall, the Fund performed well in a dynamic market environment defined by persistent geopolitical risks, continued tariff and inflation concerns, and varying artificial intelligence expectations. We continue to focus on making ongoing improvements to the portfolio and look forward to the opportunities to come.
|
Top Contributors
|
|
|
↑
|
London Gas Oil Futures +3.5%
|
|
↑
|
Gold Futures +2.1%
|
|
↑
|
Norwegian Krone Forwards +1.7%
|
|
↑
|
FTSE Taiwan Index Futures +1.3%
|
|
↑
|
Silver Futures +1.2%
|
|
Top Detractors
|
|
|
↓
|
Japanese Yen Forwards -2.4%
|
|
↓
|
Canadian 10-Year Bond Futures -2.2%
|
|
↓
|
Japanese 10-Year Bond Futures -2.2%
|
|
↓
|
U.S. 10-Year Treasury Note Futures -1.1%
|
|
↓
|
United Kingdom 3-Month SONIA Futures -1.1%
|
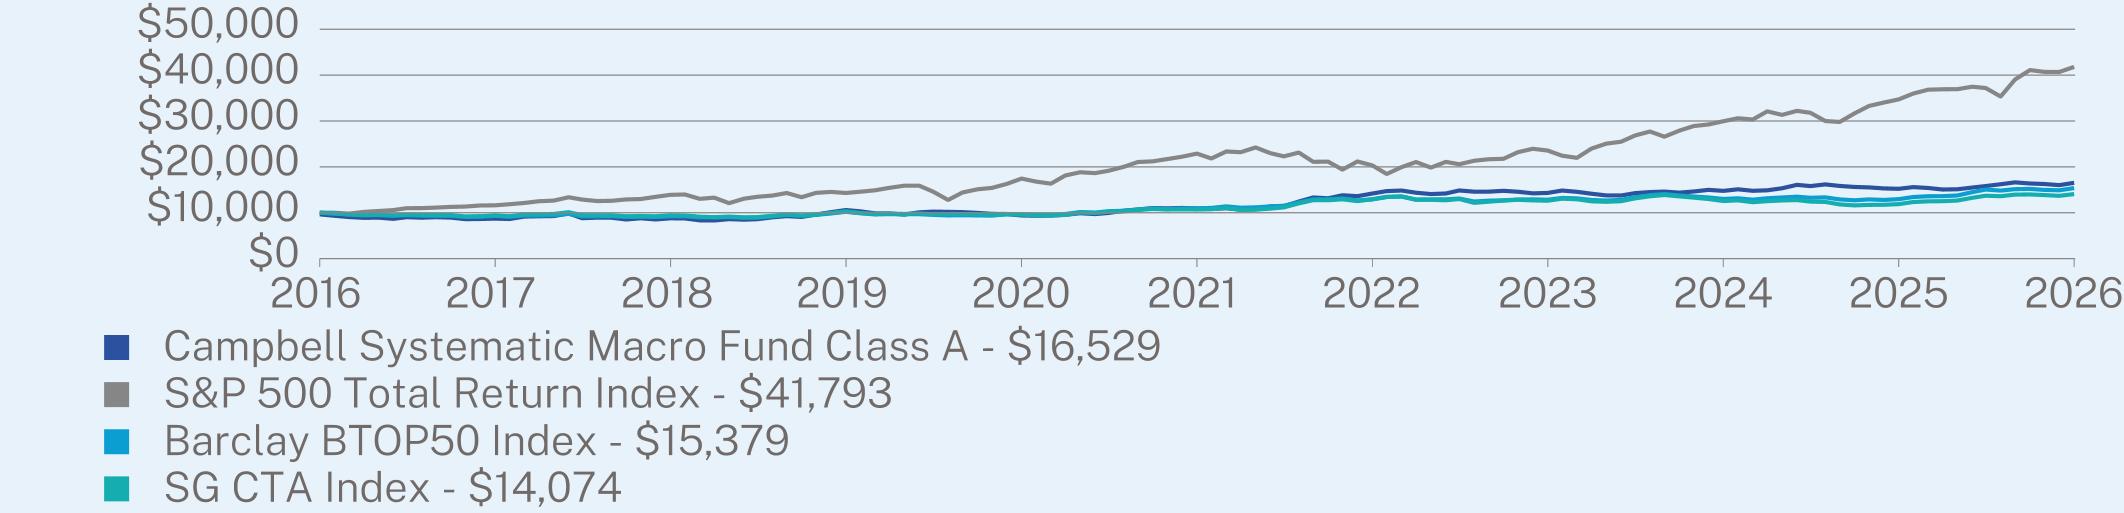
AVERAGE ANNUAL TOTAL RETURN (%)
|
|
1 Year
|
5 Year
|
10 Year
|
|
Class A (without sales charge)**
|
8.55
|
8.64
|
5.53
|
|
Class A (with sales charge)**
|
4.72
|
7.86
|
5.15
|
|
S&P 500 Total Return Index
|
20.38
|
12.79
|
15.37
|
|
Barclay BTOP50 Index
|
18.28
|
6.91
|
4.31
|
|
SG CTA Index
|
18.41
|
5.58
|
3.46
|
Visit https://www.campbell.com/systematicmacro for more recent performance information.
KEY FUND STATISTICS (as of August 31, 2026)
|
Net Assets
|
$2,286,027,905
|
|
Number of Holdings
|
240
|
|
Net Advisory Fee
|
$33,469,612
|
|
Portfolio Turnover (excludes derivatives)
|
0%
|
WHAT DID THE FUND INVEST IN? (as of August 31, 2026)
|
Top 10 Holdings*
|
(% of net assets)
|
|
|
United States Treasury Bill
|
70.3
|
%
|
|
Euro-Bund (Short)
|
0.5
|
%
|
|
NOK/USD FWD 20260916
|
0.4
|
%
|
|
CHF/USD FWD 20260916
|
0.3
|
%
|
|
Low Sulphur Gas Oil
|
0.3
|
%
|
|
Australian Government 3 Year Bonds (Short)
|
0.3
|
%
|
|
SEK/USD FWD 20260916
|
0.3
|
%
|
|
NY Harbor ULSD
|
0.2
|
%
|
|
AUD/USD FWD 20260916
|
0.2
|
%
|
|
SGX FTSE Taiwan Index
|
0.1
|
%
|
|
Component Risk Allocation (includes derivatives)**(% of portfolio risk)
|
||
|
Equities
|
34.3
|
%
|
|
Fixed Income
|
24.7
|
%
|
|
Commodities
|
23.6
|
%
|
|
Currencies
|
17.4
|
%
|
Changes to Shareholder Fees (fees paid directly from your investment):
Effective July 1, 2026, Campbell updated its Amended and Restated Expense Limitation and Reimbursement Agreement to waive Acquired Fund Fees and Expenses until at least December 31, 2027. Fund materials were supplemented accordingly.
Changes to Fund’s Investment Adviser or Sub Adviser:
Effective March 30, 2026, Campbell promoted Philippe Pradel to Chief Compliance Officer and Deputy General Counsel. Tom Lloyd, who has served as Campbell’s General Counsel for over 20 years, and Chief Compliance Officer for most of that period, will remain as General Counsel.
As of May 14, 2025, the Fund engaged the services of independent registered public accounting firm PricewaterhouseCoopers LLP, replacing Ernst & Young LLP.
WHAT WERE THE FUND COSTS FOR THE PAST YEAR? (based on a hypothetical $10,000 investment)
|
Class Name
|
Costs of a $10,000 investment
|
Costs paid as a percentage of a $10,000 investment
|
|
Class C
|
$286
|
2.75%
|
HOW DID THE FUND PERFORM DURING THE PERIOD AND WHAT AFFECTED ITS PERFORMANCE?
The Fund produced net gains during the Period, underperforming the benchmark SG CTA Index which returned +18.41% over the same period.
The exposures affecting performance included gains in commodity and equity index futures alongside foreign exchange forwards and losses in fixed income futures. The Fund’s positioning was dynamic during the Period; it maintained a net long positioning in equity index and commodity futures for the majority of the Period and held varied positioning in fixed income futures and foreign exchange forwards.
From a strategy perspective, the Fund trades a variety of systematic models which are grouped into momentum, quant macro, and short-term. Momentum strategies were the most profitable during the Period, with gains in equity indices, commodities, and foreign exchange; and losses in fixed income. Short-term strategies posted modest losses, as gains in commodities and foreign exchange were more than offset by losses in equity indices and fixed income. Finally, quant macro strategies were also not profitable, posting losses in fixed income and equity indices and some partially offsetting gains in commodities and foreign exchange.
Overall, the Fund performed well in a dynamic market environment defined by persistent geopolitical risks, continued tariff and inflation concerns, and varying artificial intelligence expectations. We continue to focus on making ongoing improvements to the portfolio and look forward to the opportunities to come.
|
Top Contributors
|
|
|
↑
|
London Gas Oil Futures +3.5%
|
|
↑
|
Gold Futures +2.1%
|
|
↑
|
Norwegian Krone Forwards +1.7%
|
|
↑
|
FTSE Taiwan Index Futures +1.3%
|
|
↑
|
Silver Futures +1.2%
|
|
Top Detractors
|
|
|
↓
|
Japanese Yen Forwards -2.4%
|
|
↓
|
Canadian 10-Year Bond Futures -2.2%
|
|
↓
|
Japanese 10-Year Bond Futures -2.2%
|
|
↓
|
U.S. 10-Year Treasury Note Futures -1.1%
|
|
↓
|
United Kingdom 3-Month SONIA Futures -1.1%
|
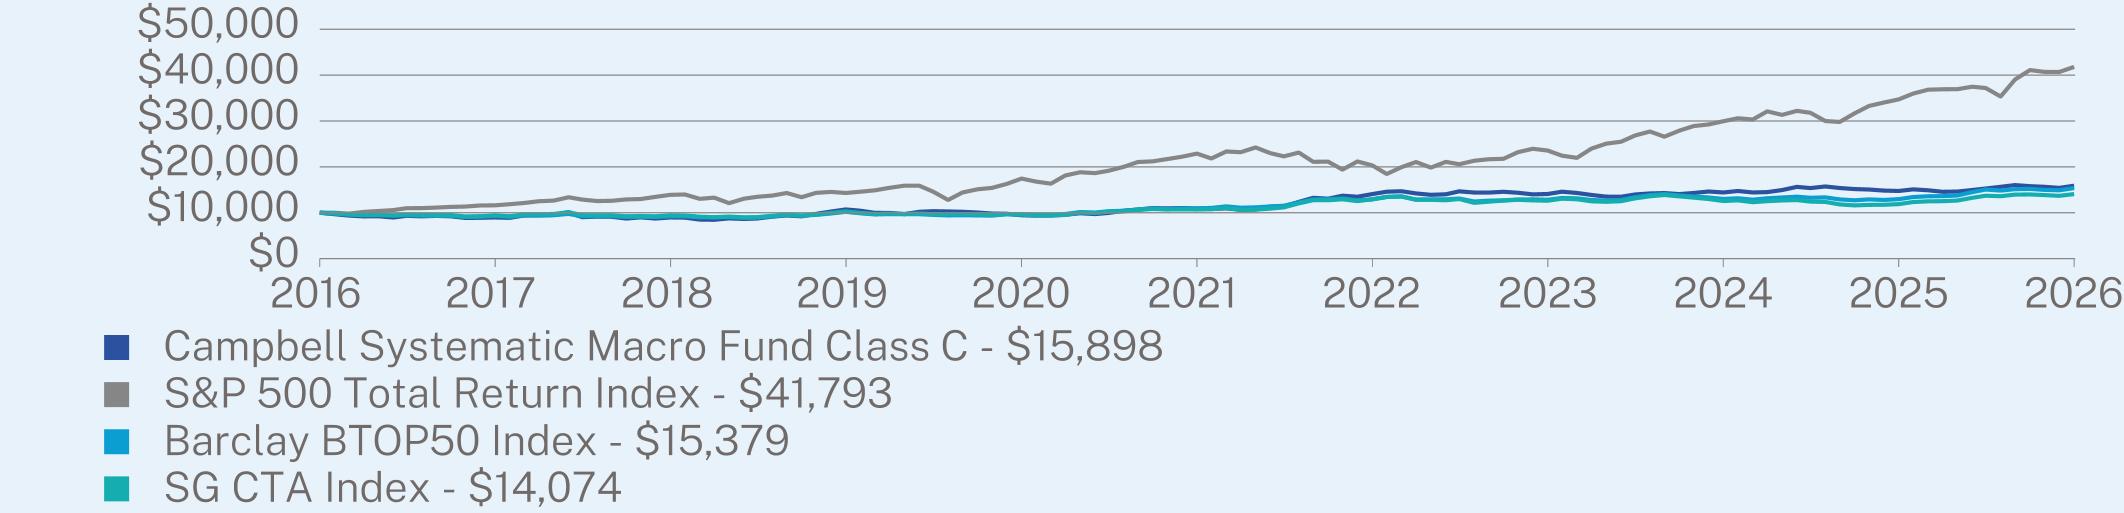
AVERAGE ANNUAL TOTAL RETURN (%)
|
|
1 Year
|
5 Year
|
10 Year
|
|
Class C (without sales charge)**
|
7.77
|
7.81
|
4.74
|
|
Class C (with sales charge)**
|
6.77
|
7.81
|
4.74
|
|
S&P 500 Total Return Index
|
20.38
|
12.79
|
15.37
|
|
Barclay BTOP50 Index
|
18.28
|
6.91
|
4.31
|
|
SG CTA Index
|
18.41
|
5.58
|
3.46
|
Visit https://www.campbell.com/systematicmacro for more recent performance information.
KEY FUND STATISTICS (as of August 31, 2026)
|
Net Assets
|
$2,286,027,905
|
|
Number of Holdings
|
240
|
|
Net Advisory Fee
|
$33,469,612
|
|
Portfolio Turnover (excludes derivatives)
|
0%
|
WHAT DID THE FUND INVEST IN? (as of August 31, 2026)
|
Top 10 Holdings*
|
(% of net assets)
|
|
|
United States Treasury Bill
|
70.3
|
%
|
|
Euro-Bund (Short)
|
0.5
|
%
|
|
NOK/USD FWD 20260916
|
0.4
|
%
|
|
CHF/USD FWD 20260916
|
0.3
|
%
|
|
Low Sulphur Gas Oil
|
0.3
|
%
|
|
Australian Government 3 Year Bonds (Short)
|
0.3
|
%
|
|
SEK/USD FWD 20260916
|
0.3
|
%
|
|
NY Harbor ULSD
|
0.2
|
%
|
|
AUD/USD FWD 20260916
|
0.2
|
%
|
|
SGX FTSE Taiwan Index
|
0.1
|
%
|
|
Component Risk Allocation (includes derivatives)**(% of portfolio risk)
|
||
|
Equities
|
34.3
|
%
|
|
Fixed Income
|
24.7
|
%
|
|
Commodities
|
23.6
|
%
|
|
Currencies
|
17.4
|
%
|
Changes to Shareholder Fees (fees paid directly from your investment):
Effective July 1, 2026, Campbell updated its Amended and Restated Expense Limitation and Reimbursement Agreement to waive Acquired Fund Fees and Expenses until at least December 31, 2027. Fund materials were supplemented accordingly.
Changes to Fund’s Investment Adviser or Sub Adviser:
Effective March 30, 2026, Campbell promoted Philippe Pradel to Chief Compliance Officer and Deputy General Counsel. Tom Lloyd, who has served as Campbell’s General Counsel for over 20 years, and Chief Compliance Officer for most of that period, will remain as General Counsel.
As of May 14, 2025, the Fund engaged the services of independent registered public accounting firm PricewaterhouseCoopers LLP, replacing Ernst & Young LLP.
WHAT WERE THE FUND COSTS FOR THE PAST YEAR? (based on a hypothetical $10,000 investment)
|
Class Name
|
Costs of a $10,000 investment
|
Costs paid as a percentage of a $10,000 investment
|
|
Class I
|
$183
|
1.75%
|
HOW DID THE FUND PERFORM DURING THE PERIOD AND WHAT AFFECTED ITS PERFORMANCE?
The Fund produced net gains during the Period, underperforming the benchmark SG CTA Index which returned +18.41% over the same period.
The exposures affecting performance included gains in commodity and equity index futures alongside foreign exchange forwards and losses in fixed income futures. The Fund’s positioning was dynamic during the Period; it maintained a net long positioning in equity index and commodity futures for the majority of the Period and held varied positioning in fixed income futures and foreign exchange forwards.
From a strategy perspective, the Fund trades a variety of systematic models which are grouped into momentum, quant macro, and short-term. Momentum strategies were the most profitable during the Period, with gains in equity indices, commodities, and foreign exchange; and losses in fixed income. Short-term strategies posted modest losses, as gains in commodities and foreign exchange were more than offset by losses in equity indices and fixed income. Finally, quant macro strategies were also not profitable, posting losses in fixed income and equity indices and some partially offsetting gains in commodities and foreign exchange.
Overall, the Fund performed well in a dynamic market environment defined by persistent geopolitical risks, continued tariff and inflation concerns, and varying artificial intelligence expectations. We continue to focus on making ongoing improvements to the portfolio and look forward to the opportunities to come.
|
Top Contributors
|
|
|
↑
|
London Gas Oil Futures +3.5%
|
|
↑
|
Gold Futures +2.1%
|
|
↑
|
Norwegian Krone Forwards +1.7%
|
|
↑
|
FTSE Taiwan Index Futures +1.3%
|
|
↑
|
Silver Futures +1.2%
|
|
Top Detractors
|
|
|
↓
|
Japanese Yen Forwards -2.4%
|
|
↓
|
Canadian 10-Year Bond Futures -2.2%
|
|
↓
|
Japanese 10-Year Bond Futures -2.2%
|
|
↓
|
U.S. 10-Year Treasury Note Futures -1.1%
|
|
↓
|
United Kingdom 3-Month SONIA Futures -1.1%
|
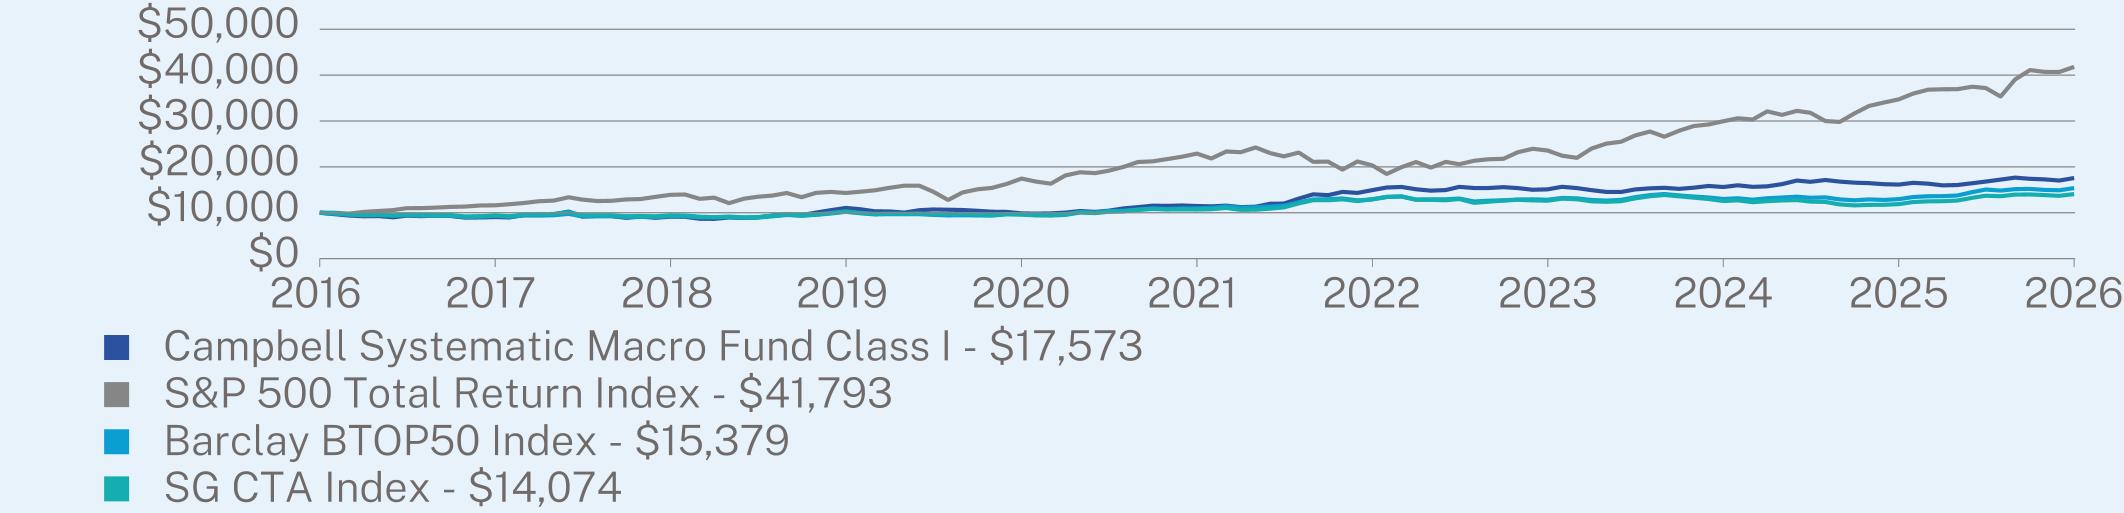
AVERAGE ANNUAL TOTAL RETURN (%)
|
|
1 Year
|
5 Year
|
10 Year
|
|
Class I (without sales charge)**
|
8.85
|
8.90
|
5.80
|
|
S&P 500 Total Return Index
|
20.38
|
12.79
|
15.37
|
|
Barclay BTOP50 Index
|
18.28
|
6.91
|
4.31
|
|
SG CTA Index
|
18.41
|
5.58
|
3.46
|
Visit https://www.campbell.com/systematicmacro for more recent performance information.
KEY FUND STATISTICS (as of August 31, 2026)
|
Net Assets
|
$2,286,027,905
|
|
Number of Holdings
|
240
|
|
Net Advisory Fee
|
$33,469,612
|
|
Portfolio Turnover (excludes derivatives)
|
0%
|
WHAT DID THE FUND INVEST IN? (as of August 31, 2026)
|
Top 10 Holdings*
|
(% of net assets)
|
|
|
United States Treasury Bill
|
70.3
|
%
|
|
Euro-Bund (Short)
|
0.5
|
%
|
|
NOK/USD FWD 20260916
|
0.4
|
%
|
|
CHF/USD FWD 20260916
|
0.3
|
%
|
|
Low Sulphur Gas Oil
|
0.3
|
%
|
|
Australian Government 3 Year Bonds (Short)
|
0.3
|
%
|
|
SEK/USD FWD 20260916
|
0.3
|
%
|
|
NY Harbor ULSD
|
0.2
|
%
|
|
AUD/USD FWD 20260916
|
0.2
|
%
|
|
SGX FTSE Taiwan Index
|
0.1
|
%
|
|
Component Risk Allocation (includes derivatives)**(% of portfolio risk)
|
||
|
Equities
|
34.3
|
%
|
|
Fixed Income
|
24.7
|
%
|
|
Commodities
|
23.6
|
%
|
|
Currencies
|
17.4
|
%
|
Changes to Shareholder Fees (fees paid directly from your investment):
Effective July 1, 2026, Campbell updated its Amended and Restated Expense Limitation and Reimbursement Agreement to waive Acquired Fund Fees and Expenses until at least December 31, 2027. Fund materials were supplemented accordingly.
Changes to Fund’s Investment Adviser or Sub Adviser:
Effective March 30, 2026, Campbell promoted Philippe Pradel to Chief Compliance Officer and Deputy General Counsel. Tom Lloyd, who has served as Campbell’s General Counsel for over 20 years, and Chief Compliance Officer for most of that period, will remain as General Counsel.
As of May 14, 2025, the Fund engaged the services of independent registered public accounting firm PricewaterhouseCoopers LLP, replacing Ernst & Young LLP.
WHAT WERE THE FUND COSTS FOR THE CURRENT REPORTING PERIOD? * (based on a hypothetical $10,000 investment)
|
Class Name
|
Costs of a $10,000 investment*
|
Costs paid as a percentage of a $10,000 investment**
|
|
Class A
|
$32
|
0.94%
|
HOW DID THE FUND PERFORM DURING THE CURRENT REPORTING PERIOD AND WHAT AFFECTED ITS PERFORMANCE?
For the trailing four-month period 5/1/2026 – 8/31/2026, the Emerald Growth Fund trailed the Russell 2000 Growth benchmark.
WHAT FACTORS INFLUENCED PERFORMANCE
Surging Treasury yields, rising energy prices, persistent inflation, competition for credit, geopolitics and another bout of AI angst dominated the market narrative over the trailing period. At the sector level, performance was most challenged within the energy, financial, consumer discretionary, technology and healthcare sectors which detracted from return. These sources of weakness more than offset relative outperformance within the basic materials, industrials, and telecommunications sectors.
The energy sector was the largest detractor to performance as the Fund’s exposure to those companies within the oil equipment and services industry that are solving bottleneck problems for data centers by providing behind the meter power generation and water solutions were a headwind to performance. At the same time, the upward pressure on bond yields and elevated rate-hike expectations were notable headwinds for the rate-sensitive areas of the market and the Fund’s performance within the financials and consumer discretionary sectors. At the industry level, these challenges were most acute within the asset management, consumer lending, banking, specialty retail and apparel industries, which detracted from return. Holdings and positioning within the technology and healthcare sectors also detracted from the Fund’s performance for the period. At the industry level, the challenges were most pronounced within the computer services, semiconductor, and biotechnology industries which were the greatest sources of relative underperformance.
Partially offsetting the above was stock selection driven relative outperformance within the basic materials, industrials and telecommunications sectors. Within these sectors, holdings within the diversified chemicals, aerospace and telecommunications equipment industries were the largest positive contributors to performance.
Partially offsetting the above was stock selection driven relative outperformance within the basic materials, industrials and telecommunications sectors. Within these sectors, holdings within the diversified chemicals, aerospace and telecommunications equipment industries were the largest positive contributors to performance.
As of the end of August, 2026, the Fund held the largest overweight positions in the financials, technology, industrials, telecommunications, and consumer discretionary sectors.
POSITIONING
|
Top Contributors
|
|
|
↑
|
Bloom Energy (BE)
|
|
↑
|
Lumentum Holdings Inc. (LITE)
|
|
↑
|
TTM Technologies Inc. (TTMI)
|
|
Top Detractors
|
|
|
↓
|
Vital Farms, Inc. (VITL)
|
|
↓
|
Varonis Systems, Inc. (VRNS)
|
|
↓
|
Ollie’s Bargain Outlet Holdings (OLLI)
|
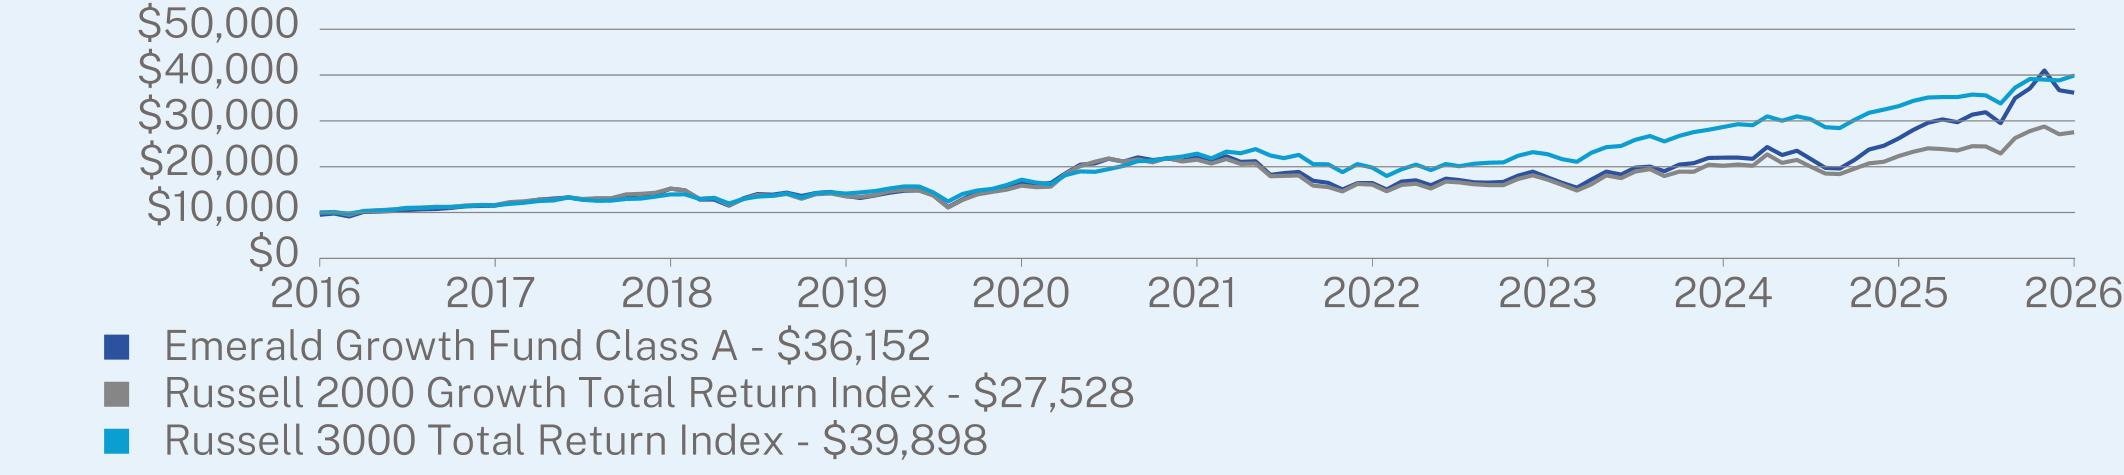
Average Annual TOTAL RETURN (%)
|
|
5/01/2026- 8/31/2026
|
1 Year
|
5 Year
|
10 Year
|
|
Class A (without sales charge)
|
3.40
|
38.01
|
10.38
|
14.27
|
|
Class A (with sales charge)
|
-1.51
|
31.44
|
9.31
|
13.71
|
|
Russell 2000 Growth Total Return Index
|
4.88
|
23.25
|
5.04
|
10.66
|
|
Russell 3000 Total Return Index
|
7.12
|
20.10
|
11.80
|
14.84
|
KEY FUND STATISTICS (as of August 31, 2026)
|
Net Assets
|
$1,438,012,686
|
|
Number of Holdings
|
126
|
|
Net Advisory Fee
|
$2,583,167
|
|
Portfolio Turnover
|
31%
|
WHAT DID THE FUND INVEST IN? (as of August 31, 2026)
|
Top Sectors
|
(% of Net Assets)
|
|
|
Health Care
|
20.5
|
%
|
|
Industrials
|
19.3
|
%
|
|
Technology
|
18.1
|
%
|
|
Consumer Discretionary
|
12.0
|
%
|
|
Financials
|
10.5
|
%
|
|
Exchange Traded Funds
|
6.4
|
%
|
|
Energy
|
3.4
|
%
|
|
Basic Materials
|
2.6
|
%
|
|
Telecommunications
|
2.6
|
%
|
|
Cash & Other
|
4.6
|
%
|
|
Top 10 Holdings
|
(% of Net Assets)
|
|
|
F/m Emerald Life Sciences Innovation ETF
|
6.4
|
%
|
|
Travere Therapeutics, Inc.
|
2.1
|
%
|
|
InterDigital, Inc.
|
2.1
|
%
|
|
AAR Corp.
|
1.9
|
%
|
|
VSE Corp.
|
1.8
|
%
|
|
Sensient Technologies Corp.
|
1.7
|
%
|
|
Corcept Therapeutics, Inc.
|
1.6
|
%
|
|
Axos Financial, Inc.
|
1.5
|
%
|
|
Mercury Systems, Inc.
|
1.5
|
%
|
|
CECO Environmental Corp.
|
1.4
|
%
|
Material Fund Changes
This is a summary of certain changes to the Fund since May 1, 2026. For more complete information, you may review the Fund’s prospectus dated August 31, 2026, which is available at https://www.teamemeraldfunds.com/emerald-growth-fund/or upon request by contacting the Fund at 1-855-828-9909.
Effective as of the close of business on June 5, 2026, the Predecessor Fund was reorganized into the Fund in a tax-free reorganization. The Fund commenced investment operations on June 8, 2026, and is the successor to the Predecessor Fund. Performance and accounting history prior to the closing of the Reorganization is that of the Predecessor Fund.
During the Current Reporting Period, the Fund changed its fiscal year end from April 30 to August 31.
WHAT WERE THE FUND COSTS FOR THE CURRENT REPORTING PERIOD? * (based on a hypothetical $10,000 investment)
|
Class Name
|
Costs of a $10,000 investment*
|
Costs paid as a percentage of a $10,000 investment**
|
|
Class C
|
$56
|
1.63%
|
HOW DID THE FUND PERFORM DURING THE CURRENT REPORTING PERIOD AND WHAT AFFECTED ITS PERFORMANCE?
For the trailing four-month period 5/1/2026 – 8/31/2026, the Emerald Growth Fund trailed the Russell 2000 Growth benchmark.
WHAT FACTORS INFLUENCED PERFORMANCE
Surging Treasury yields, rising energy prices, persistent inflation, competition for credit, geopolitics and another bout of AI angst dominated the market narrative over the trailing period. At the sector level, performance was most challenged within the energy, financial, consumer discretionary, technology and healthcare sectors which detracted from return. These sources of weakness more than offset relative outperformance within the basic materials, industrials, and telecommunications sectors.
The energy sector was the largest detractor to performance as the Fund’s exposure to those companies within the oil equipment and services industry that are solving bottleneck problems for data centers by providing behind the meter power generation and water solutions were a headwind to performance. At the same time, the upward pressure on bond yields and elevated rate-hike expectations were notable headwinds for the rate-sensitive areas of the market and the Fund’s performance within the financials and consumer discretionary sectors. At the industry level, these challenges were most acute within the asset management, consumer lending, banking, specialty retail and apparel industries, which detracted from return. Holdings and positioning within the technology and healthcare sectors also detracted from the Fund’s performance for the period. At the industry level, the challenges were most pronounced within the computer services, semiconductor, and biotechnology industries which were the greatest sources of relative underperformance.
Partially offsetting the above was stock selection driven relative outperformance within the basic materials, industrials and telecommunications sectors. Within these sectors, holdings within the diversified chemicals, aerospace and telecommunications equipment industries were the largest positive contributors to performance.
Partially offsetting the above was stock selection driven relative outperformance within the basic materials, industrials and telecommunications sectors. Within these sectors, holdings within the diversified chemicals, aerospace and telecommunications equipment industries were the largest positive contributors to performance.
As of the end of August, 2026, the Fund held the largest overweight positions in the financials, technology, industrials, telecommunications, and consumer discretionary sectors.
POSITIONING
|
Top Contributors
|
|
|
↑
|
Bloom Energy (BE)
|
|
↑
|
Lumentum Holdings Inc. (LITE)
|
|
↑
|
TTM Technologies Inc. (TTMI)
|
|
Top Detractors
|
|
|
↓
|
Vital Farms, Inc. (VITL)
|
|
↓
|
Varonis Systems, Inc. (VRNS)
|
|
↓
|
Ollie’s Bargain Outlet Holdings (OLLI)
|
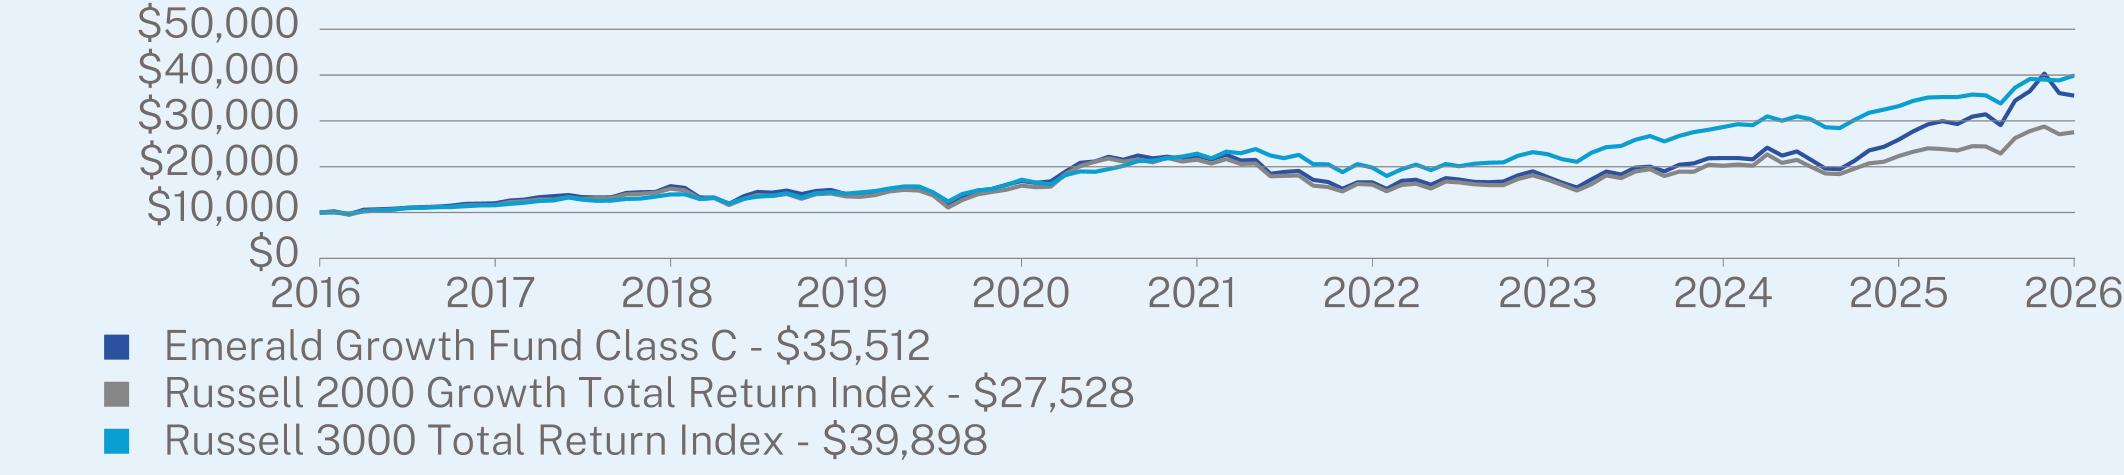
Average Annual TOTAL RETURN (%)
|
|
5/01/2026- 8/31/2026
|
1 Year
|
5 Year
|
10 Year
|
|
Class C (without sales charge)
|
3.19
|
36.99
|
9.63
|
13.51
|
|
Class C (with sales charge)
|
2.56
|
36.21
|
9.63
|
13.51
|
|
Russell 2000 Growth Total Return Index
|
4.88
|
23.25
|
5.04
|
10.66
|
|
Russell 3000 Total Return Index
|
7.12
|
20.10
|
11.80
|
14.84
|
Visit https://www.teamemeraldfunds.com/emerald-growth-fund/ for more recent performance information.
KEY FUND STATISTICS (as of August 31, 2026)
|
Net Assets
|
$1,438,012,686
|
|
Number of Holdings
|
126
|
|
Net Advisory Fee
|
$2,583,167
|
|
Portfolio Turnover
|
31%
|
WHAT DID THE FUND INVEST IN? (as of August 31, 2026)
|
Top Sectors
|
(% of Net Assets)
|
|
|
Health Care
|
20.5
|
%
|
|
Industrials
|
19.3
|
%
|
|
Technology
|
18.1
|
%
|
|
Consumer Discretionary
|
12.0
|
%
|
|
Financials
|
10.5
|
%
|
|
Exchange Traded Funds
|
6.4
|
%
|
|
Energy
|
3.4
|
%
|
|
Basic Materials
|
2.6
|
%
|
|
Telecommunications
|
2.6
|
%
|
|
Cash & Other
|
4.6
|
%
|
|
Top 10 Holdings
|
(% of Net Assets)
|
|
|
F/m Emerald Life Sciences Innovation ETF
|
6.4
|
%
|
|
Travere Therapeutics, Inc.
|
2.1
|
%
|
|
InterDigital, Inc.
|
2.1
|
%
|
|
AAR Corp.
|
1.9
|
%
|
|
VSE Corp.
|
1.8
|
%
|
|
Sensient Technologies Corp.
|
1.7
|
%
|
|
Corcept Therapeutics, Inc.
|
1.6
|
%
|
|
Axos Financial, Inc.
|
1.5
|
%
|
|
Mercury Systems, Inc.
|
1.5
|
%
|
|
CECO Environmental Corp.
|
1.4
|
%
|
Material Fund Changes
This is a summary of certain changes to the Fund since May 1, 2026. For more complete information, you may review the Fund’s prospectus dated August 31, 2026, which is available at https://www.teamemeraldfunds.com/emerald-growth-fund/or upon request by contacting the Fund at 1-855-828-9909.
Effective as of the close of business on June 5, 2026, the Predecessor Fund was reorganized into the Fund in a tax-free reorganization. The Fund commenced investment operations on June 8, 2026, and is the successor to the Predecessor Fund. Performance and accounting history prior to the closing of the Reorganization is that of the Predecessor Fund.
During the Current Reporting Period, the Fund changed its fiscal year end from April 30 to August 31.
WHAT WERE THE FUND COSTS FOR THE CURRENT REPORTING PERIOD? * (based on a hypothetical $10,000 investment)
|
Class Name
|
Costs of a $10,000 investment*
|
Costs paid as a percentage of a $10,000 investment**
|
|
Institutional Class
|
$20
|
0.59%
|
HOW DID THE FUND PERFORM DURING THE CURRENT REPORTING PERIOD AND WHAT AFFECTED ITS PERFORMANCE?
For the trailing four-month period 5/1/2026 – 8/31/2026, the Emerald Growth Fund trailed the Russell 2000 Growth benchmark.
WHAT FACTORS INFLUENCED PERFORMANCE
Surging Treasury yields, rising energy prices, persistent inflation, competition for credit, geopolitics and another bout of AI angst dominated the market narrative over the trailing period. At the sector level, performance was most challenged within the energy, financial, consumer discretionary, technology and healthcare sectors which detracted from return. These sources of weakness more than offset relative outperformance within the basic materials, industrials, and telecommunications sectors.
The energy sector was the largest detractor to performance as the Fund’s exposure to those companies within the oil equipment and services industry that are solving bottleneck problems for data centers by providing behind the meter power generation and water solutions were a headwind to performance. At the same time, the upward pressure on bond yields and elevated rate-hike expectations were notable headwinds for the rate-sensitive areas of the market and the Fund’s performance within the financials and consumer discretionary sectors. At the industry level, these challenges were most acute within the asset management, consumer lending, banking, specialty retail and apparel industries, which detracted from return. Holdings and positioning within the technology and healthcare sectors also detracted from the Fund’s performance for the period. At the industry level, the challenges were most pronounced within the computer services, semiconductor, and biotechnology industries which were the greatest sources of relative underperformance.
Partially offsetting the above was stock selection driven relative outperformance within the basic materials, industrials and telecommunications sectors. Within these sectors, holdings within the diversified chemicals, aerospace and telecommunications equipment industries were the largest positive contributors to performance.
Partially offsetting the above was stock selection driven relative outperformance within the basic materials, industrials and telecommunications sectors. Within these sectors, holdings within the diversified chemicals, aerospace and telecommunications equipment industries were the largest positive contributors to performance.
As of the end of August, 2026, the Fund held the largest overweight positions in the financials, technology, industrials, telecommunications, and consumer discretionary sectors.
|
Top Contributors
|
|
|
↑
|
Bloom Energy (BE)
|
|
↑
|
Lumentum Holdings Inc. (LITE)
|
|
↑
|
TTM Technologies Inc. (TTMI)
|
|
Top Detractors
|
|
|
↓
|
Vital Farms, Inc. (VITL)
|
|
↓
|
Varonis Systems, Inc. (VRNS)
|
|
↓
|
Ollie’s Bargain Outlet Holdings (OLLI)
|
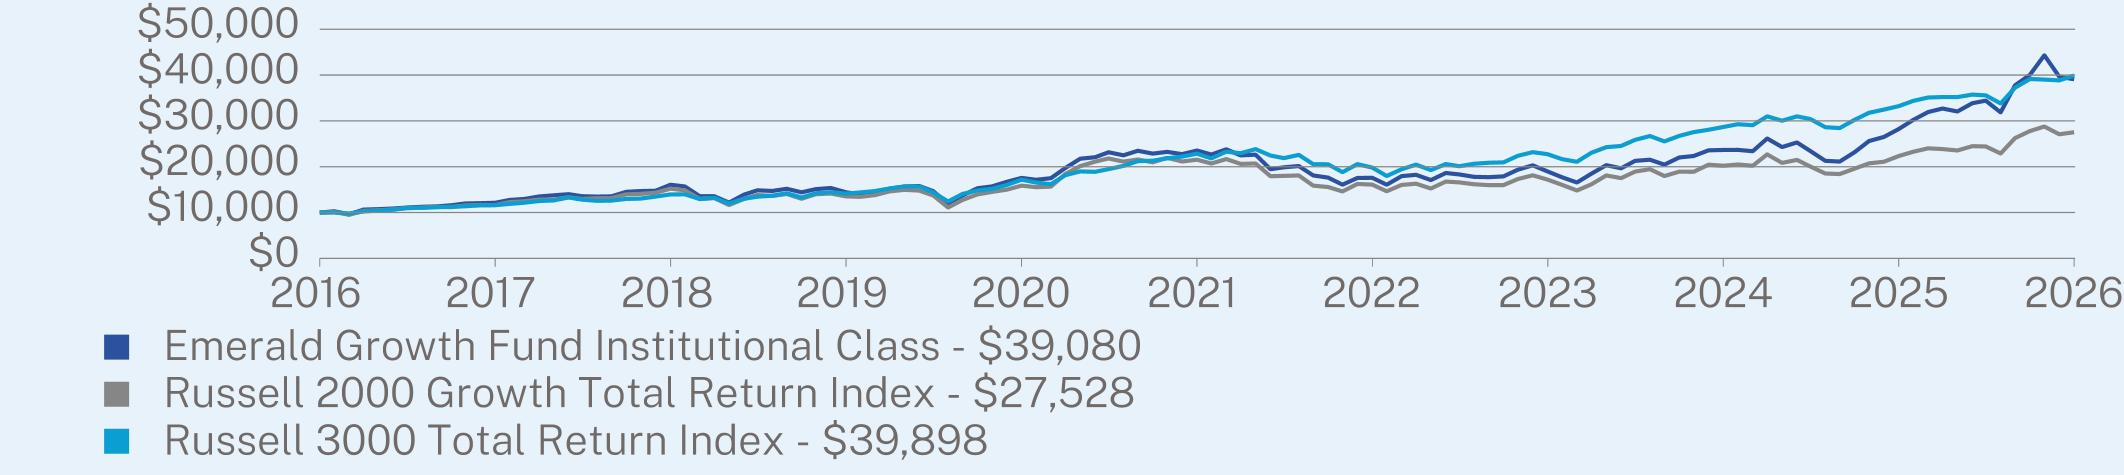
Average Annual TOTAL RETURN (%)
|
|
5/01/2026- 8/31/2026
|
1 Year
|
5 Year
|
10 Year
|
|
Institutional Class (without sales charge)
|
3.52
|
38.42
|
10.67
|
14.60
|
|
Russell 2000 Growth Total Return Index
|
4.88
|
23.25
|
5.04
|
10.66
|
|
Russell 3000 Total Return Index
|
7.12
|
20.10
|
11.80
|
14.84
|
Visit https://www.teamemeraldfunds.com/emerald-growth-fund/ for more recent performance information.
KEY FUND STATISTICS (as of August 31, 2026)
|
Net Assets
|
$1,438,012,686
|
|
Number of Holdings
|
126
|
|
Net Advisory Fee
|
$2,583,167
|
|
Portfolio Turnover
|
31%
|
WHAT DID THE FUND INVEST IN? (as of August 31, 2026)
|
Top Sectors
|
(% of Net Assets)
|
|
|
Health Care
|
20.5
|
%
|
|
Industrials
|
19.3
|
%
|
|
Technology
|
18.1
|
%
|
|
Consumer Discretionary
|
12.0
|
%
|
|
Financials
|
10.5
|
%
|
|
Exchange Traded Funds
|
6.4
|
%
|
|
Energy
|
3.4
|
%
|
|
Basic Materials
|
2.6
|
%
|
|
Telecommunications
|
2.6
|
%
|
|
Cash & Other
|
4.6
|
%
|
|
Top 10 Holdings
|
(% of Net Assets)
|
|
|
F/m Emerald Life Sciences Innovation ETF
|
6.4
|
%
|
|
Travere Therapeutics, Inc.
|
2.1
|
%
|
|
InterDigital, Inc.
|
2.1
|
%
|
|
AAR Corp.
|
1.9
|
%
|
|
VSE Corp.
|
1.8
|
%
|
|
Sensient Technologies Corp.
|
1.7
|
%
|
|
Corcept Therapeutics, Inc.
|
1.6
|
%
|
|
Axos Financial, Inc.
|
1.5
|
%
|
|
Mercury Systems, Inc.
|
1.5
|
%
|
|
CECO Environmental Corp.
|
1.4
|
%
|
Material Fund Changes
This is a summary of certain changes to the Fund since May 1, 2026. For more complete information, you may review the Fund’s prospectus dated August 31, 2026, which is available at https://www.teamemeraldfunds.com/emerald-growth-fund/or upon request by contacting the Fund at 1-855-828-9909.
Effective as of the close of business on June 5, 2026, the Predecessor Fund was reorganized into the Fund in a tax-free reorganization. The Fund commenced investment operations on June 8, 2026, and is the successor to the Predecessor Fund. Performance and accounting history prior to the closing of the Reorganization is that of the Predecessor Fund.
During the Current Reporting Period, the Fund changed its fiscal year end from April 30 to August 31.
WHAT WERE THE FUND COSTS FOR THE CURRENT REPORTING PERIOD? * (based on a hypothetical $10,000 investment)
|
Class Name
|
Costs of a $10,000 investment*
|
Costs paid as a percentage of a $10,000 investment**
|
|
Investor Class
|
$31
|
0.90%
|
HOW DID THE FUND PERFORM DURING THE CURRENT REPORTING PERIOD AND WHAT AFFECTED ITS PERFORMANCE?
For the trailing four-month period 5/1/2026 – 8/31/2026, the Emerald Growth Fund trailed the Russell 2000 Growth benchmark.
WHAT FACTORS INFLUENCED PERFORMANCE
Surging Treasury yields, rising energy prices, persistent inflation, competition for credit, geopolitics and another bout of AI angst dominated the market narrative over the trailing period. At the sector level, performance was most challenged within the energy, financial, consumer discretionary, technology and healthcare sectors which detracted from return. These sources of weakness more than offset relative outperformance within the basic materials, industrials, and telecommunications sectors.
The energy sector was the largest detractor to performance as the Fund’s exposure to those companies within the oil equipment and services industry that are solving bottleneck problems for data centers by providing behind the meter power generation and water solutions were a headwind to performance. At the same time, the upward pressure on bond yields and elevated rate-hike expectations were notable headwinds for the rate-sensitive areas of the market and the Fund’s performance within the financials and consumer discretionary sectors. At the industry level, these challenges were most acute within the asset management, consumer lending, banking, specialty retail and apparel industries, which detracted from return. Holdings and positioning within the technology and healthcare sectors also detracted from the Fund’s performance for the period. At the industry level, the challenges were most pronounced within the computer services, semiconductor, and biotechnology industries which were the greatest sources of relative underperformance.
Partially offsetting the above was stock selection driven relative outperformance within the basic materials, industrials and telecommunications sectors. Within these sectors, holdings within the diversified chemicals, aerospace and telecommunications equipment industries were the largest positive contributors to performance.
Partially offsetting the above was stock selection driven relative outperformance within the basic materials, industrials and telecommunications sectors. Within these sectors, holdings within the diversified chemicals, aerospace and telecommunications equipment industries were the largest positive contributors to performance.
As of the end of August, 2026, the Fund held the largest overweight positions in the financials, technology, industrials, telecommunications, and consumer discretionary sectors.
POSITIONING
|
Top Contributors
|
|
|
↑
|
Bloom Energy (BE)
|
|
↑
|
Lumentum Holdings Inc. (LITE)
|
|
↑
|
TTM Technologies Inc. (TTMI)
|
|
Top Detractors
|
|
|
↓
|
Vital Farms, Inc. (VITL)
|
|
↓
|
Varonis Systems, Inc. (VRNS)
|
|
↓
|
Ollie’s Bargain Outlet Holdings (OLLI)
|
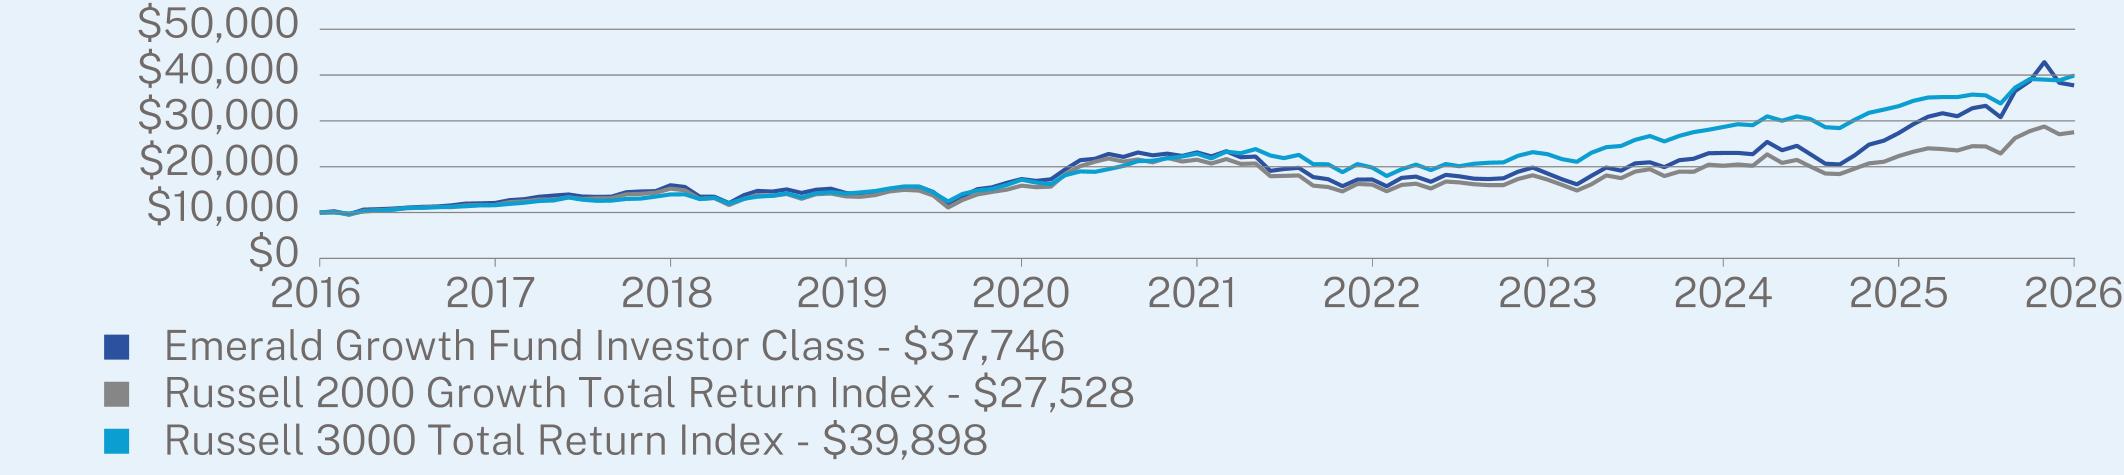
Average Annual TOTAL RETURN (%)
|
|
5/01/2026- 8/31/2026
|
1 Year
|
5 Year
|
10 Year
|
|
Investor Class (without sales charge)
|
3.42
|
37.99
|
10.30
|
14.21
|
|
Russell 2000 Growth Total Return Index
|
4.88
|
23.25
|
5.04
|
10.66
|
|
Russell 3000 Total Return Index
|
7.12
|
20.10
|
11.80
|
14.84
|
Visit https://www.teamemeraldfunds.com/emerald-growth-fund/ for more recent performance information.
KEY FUND STATISTICS (as of August 31, 2026)
|
Net Assets
|
$1,438,012,686
|
|
Number of Holdings
|
126
|
|
Net Advisory Fee
|
$2,583,167
|
|
Portfolio Turnover
|
31%
|
WHAT DID THE FUND INVEST IN? (as of August 31, 2026)
|
Top Sectors
|
(% of Net Assets)
|
|
|
Health Care
|
20.5
|
%
|
|
Industrials
|
19.3
|
%
|
|
Technology
|
18.1
|
%
|
|
Consumer Discretionary
|
12.0
|
%
|
|
Financials
|
10.5
|
%
|
|
Exchange Traded Funds
|
6.4
|
%
|
|
Energy
|
3.4
|
%
|
|
Basic Materials
|
2.6
|
%
|
|
Telecommunications
|
2.6
|
%
|
|
Cash & Other
|
4.6
|
%
|
|
Top 10 Holdings
|
(% of Net Assets)
|
|
|
F/m Emerald Life Sciences Innovation ETF
|
6.4
|
%
|
|
Travere Therapeutics, Inc.
|
2.1
|
%
|
|
InterDigital, Inc.
|
2.1
|
%
|
|
AAR Corp.
|
1.9
|
%
|
|
VSE Corp.
|
1.8
|
%
|
|
Sensient Technologies Corp.
|
1.7
|
%
|
|
Corcept Therapeutics, Inc.
|
1.6
|
%
|
|
Axos Financial, Inc.
|
1.5
|
%
|
|
Mercury Systems, Inc.
|
1.5
|
%
|
|
CECO Environmental Corp.
|
1.4
|
%
|
Material Fund Changes
This is a summary of certain changes to the Fund since May 1, 2026. For more complete information, you may review the Fund’s prospectus dated August 31, 2026, which is available at https://www.teamemeraldfunds.com/emerald-growth-fund/or upon request by contacting the Fund at 1-855-828-9909.
Effective as of the close of business on June 5, 2026, the Predecessor Fund was reorganized into the Fund in a tax-free reorganization. The Fund commenced investment operations on June 8, 2026, and is the successor to the Predecessor Fund. Performance and accounting history prior to the closing of the Reorganization is that of the Predecessor Fund.
During the Current Reporting Period, the Fund changed its fiscal year end from April 30 to August 31.
WHAT WERE THE FUND COSTS FOR THE PERIOD? (based on a hypothetical $10,000 investment)
|
Fund Name
|
Costs of a $10,000 investment
|
Costs paid as a percentage of a $10,000 investment
|
|
F/m US Treasury 3 Month Bill Fund - ETF Class Shares
|
$15
|
0.15%
|
HOW DID THE FUND PERFORM DURING THE PERIOD AND WHAT AFFECTED ITS PERFORMANCE?
The investment objective of the Fund is to seek investment results that correspond (before fees and expenses) generally to the price and yield performance of the Bloomberg US Treasury Bellwether 3M Total Return USD Unhedged Index (the “Index”). The Fund performed well for the year, returning 3.77% versus the Index’s return of 3.79%. The Fund’s securities lending program has generated additional income and mitigated the cost of running the Fund.
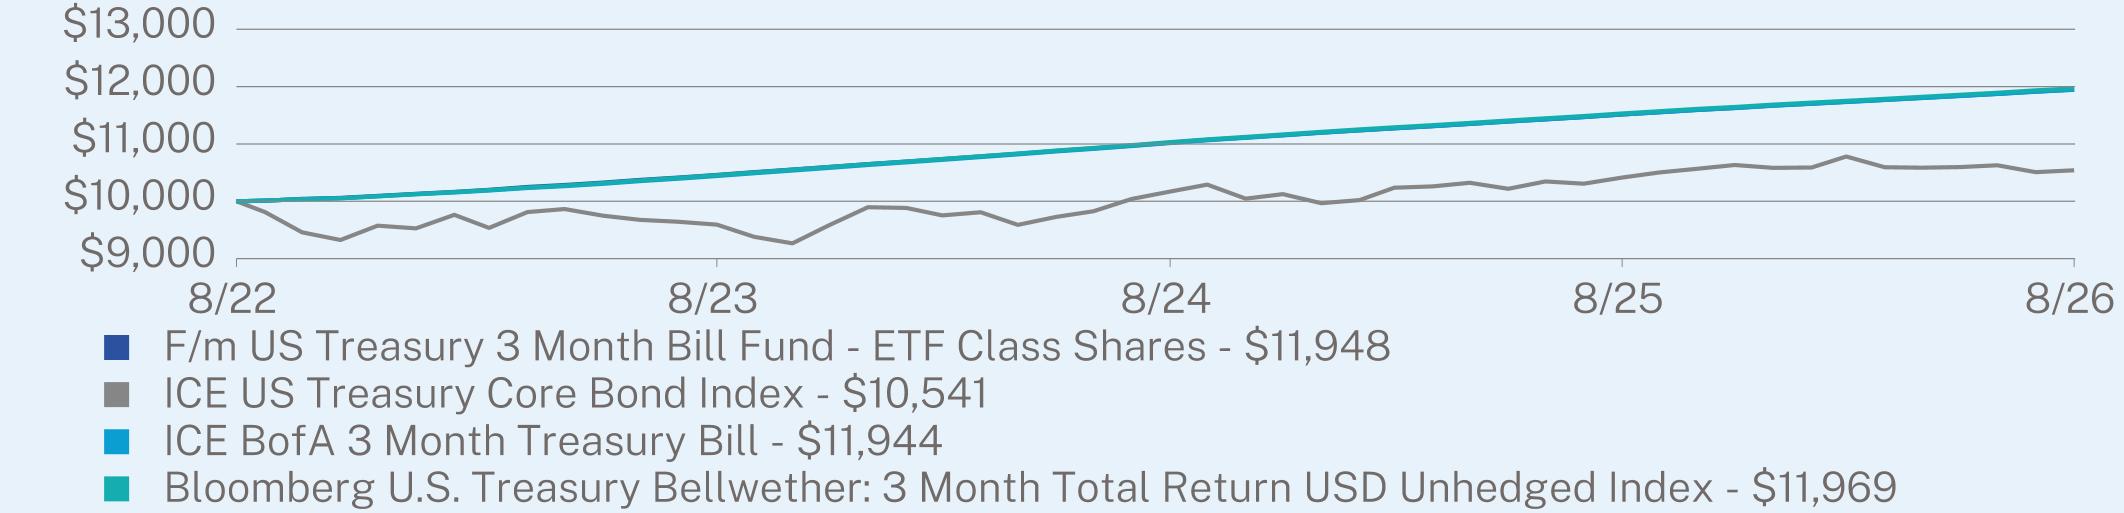
ANNUAL AVERAGE TOTAL RETURN (%)
|
|
1 Year
|
Since Inception
(08/08/2022) |
|
F/m US Treasury 3 Month Bill Fund - ETF Class Shares
|
3.77
|
4.48
|
|
ICE US Treasury Core Bond Index
|
1.21
|
1.30
|
|
ICE BofA 3 Month Treasury Bill
|
3.74
|
4.47
|
|
Bloomberg U.S. Treasury Bellwether: 3 Month Total Return USD Unhedged Index
|
3.79
|
4.52
|
Visit https://www.fminvest.com/tbil for more recent performance information.
KEY FUND STATISTICS (as of August 31, 2026)
|
Net Assets
|
$7,193,791,413
|
|
Number of Holdings
|
2
|
|
Net Advisory Fee
|
$10,061,182
|
|
Portfolio Turnover
|
0%
|
|
30-Day SEC Yield
|
3.62%
|
|
30-Day SEC Yield Unsubsidized
|
3.62%
|
WHAT DID THE FUND INVEST IN? (as of August 31, 2026)
|
Top 10 Holdings
|
(% of Net Assets)
|
|
|
United States Treasury Bill
|
100.0
|
%
|
|
Top Sectors
|
(% of Net Assets)
|
|
|
Government
|
100.0
|
%
|
Material Fund Changes:
Effective February 11, 2026, the Fund converted to a multi-class fund structure and its name changed to the F/m US Treasury 3 Month Bill Fund. The Fund now offers an exchange-traded class of shares (ETF Class Shares) that are listed and traded on a national securities exchange, as well as a mutual fund class of shares (Institutional Class Shares) that operate as a traditional mutual fund. The two share classes are offered through separate prospectuses. The ETF Class Shares, unlike the Institutional Class Shares, are not individually redeemable. The ticker for the ETF Class Shares remains Nasdaq: TBIL.
WHAT WERE THE FUND COSTS FOR THE PERIOD? (based on a hypothetical $10,000 investment)
|
Fund Name
|
Costs of a $10,000 investment
|
Costs paid as a percentage of a $10,000 investment
|
|
F/m US Treasury 6 Month Bill ETF
|
$15
|
0.15%
|
HOW DID THE FUND PERFORM DURING THE PERIOD AND WHAT AFFECTED ITS PERFORMANCE?
The investment objective of the Fund is to seek investment results that correspond (before fees and expenses) generally to the price and yield performance of the Bloomberg US Treasury Bellwether 6M Total Return USD Unhedged Index (the “Index”). The Fund performed well for the year, returning 3.73% versus the Index’s return of 3.79%. Dividends represented most of the return, with the price returning -0.34% for the year. The securities Fund’s lending program has generated additional income and mitigated the cost of running the Fund.
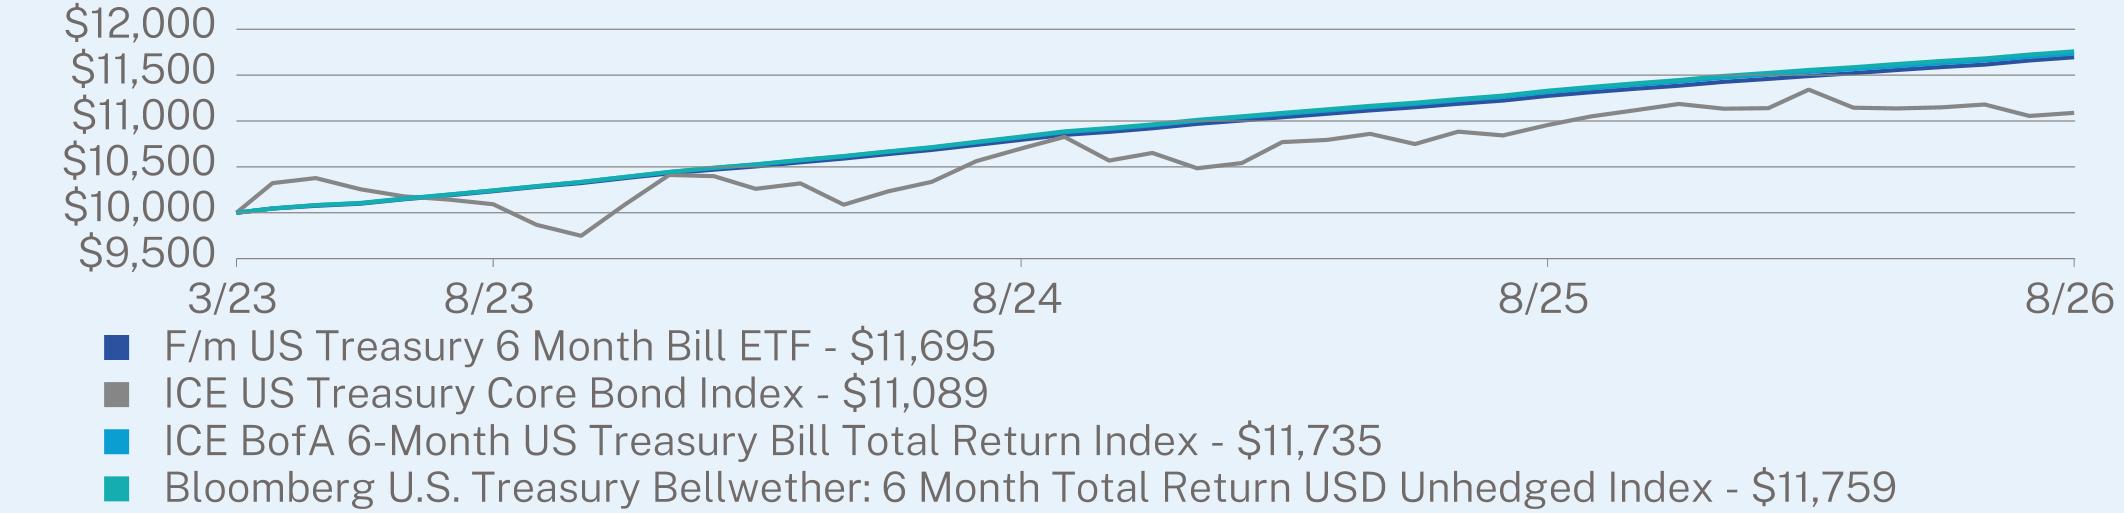
ANNUAL AVERAGE TOTAL RETURN (%)
|
|
1 Year
|
Since Inception
(03/06/2023) |
|
F/m US Treasury 6 Month Bill ETF
|
3.73
|
4.59
|
|
ICE US Treasury Core Bond Index
|
1.21
|
3.01
|
|
ICE BofA 6-Month US Treasury Bill Total Return Index
|
3.71
|
4.69
|
|
Bloomberg U.S. Treasury Bellwether: 6 Month Total Return USD Unhedged Index
|
3.79
|
4.76
|
Visit https://www.fminvest.com/xbil for more recent performance information.
KEY FUND STATISTICS (as of August 31, 2026)
|
Net Assets
|
$747,586,380
|
|
Number of Holdings
|
2
|
|
Net Advisory Fee
|
$1,152,345
|
|
Portfolio Turnover
|
0%
|
|
30-Day SEC Yield
|
3.76%
|
|
30-Day SEC Yield Unsubsidized
|
3.76%
|
WHAT DID THE FUND INVEST IN? (as of August 31, 2026)
|
Top 10 Holdings
|
(% of Net Assets)
|
|
|
United States Treasury Bill
|
100.0
|
%
|
|
Top Sectors
|
(% of Net Assets)
|
|
|
Government
|
100.0
|
%
|
WHAT WERE THE FUND COSTS FOR THE PERIOD? (based on a hypothetical $10,000 investment)
|
Fund Name
|
Costs of a $10,000 investment
|
Costs paid as a percentage of a $10,000 investment
|
|
F/m US Treasury 12 Month Bill ETF
|
$15
|
0.15%
|
HOW DID THE FUND PERFORM DURING THE PERIOD AND WHAT AFFECTED ITS PERFORMANCE?
The investment objective of the Fund is to seek investment results that correspond (before fees and expenses) generally to the price and yield performance of Bloomberg US Treasury Bellwether 1Y Total Return USD Unhedged Index (the “Index”). The Fund performed well for the year, returning 3.41% versus the Index’s return of 3.53%. Dividends represented the majority of the returns, with the price returning -0.56% for the year. The Fund’s securities lending program has generated additional income and mitigated the cost of running the Fund.
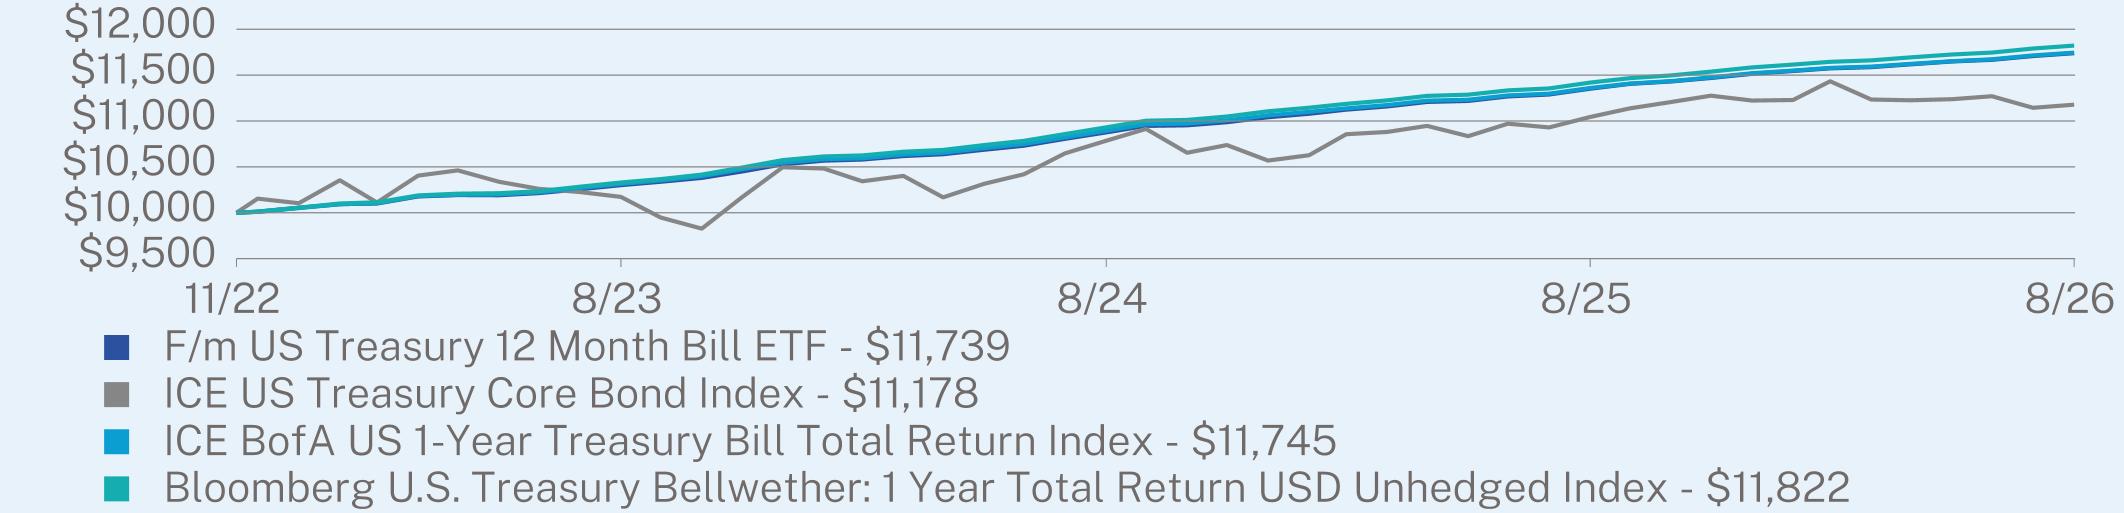
ANNUAL AVERAGE TOTAL RETURN (%)
|
|
1 Year
|
Since Inception
(11/14/2022) |
|
F/m US Treasury 12 Month Bill ETF
|
3.41
|
4.31
|
|
ICE US Treasury Core Bond Index
|
1.21
|
2.98
|
|
ICE BofA US 1-Year Treasury Bill Total Return Index
|
3.38
|
4.33
|
|
Bloomberg U.S. Treasury Bellwether: 1 Year Total Return USD Unhedged Index
|
3.53
|
4.51
|
Visit https://www.fminvest.com/obil for more recent performance information.
KEY FUND STATISTICS (as of August 31, 2026)
|
Net Assets
|
$309,919,521
|
|
Number of Holdings
|
1
|
|
Net Advisory Fee
|
$459,096
|
|
Portfolio Turnover
|
0%
|
|
30-Day SEC Yield
|
3.92%
|
|
30-Day SEC Yield Unsubsidized
|
3.92%
|
WHAT DID THE FUND INVEST IN? (as of August 31, 2026)
|
Top 10 Holdings
|
(% of Net Assets)
|
|
|
United States Treasury Bill
|
100.0
|
%
|
|
Top Sectors
|
(% of Net Assets)
|
|
|
Government
|
100.0
|
%
|
WHAT WERE THE FUND COSTS FOR THE PERIOD? (based on a hypothetical $10,000 investment)
|
Fund Name
|
Costs of a $10,000 investment
|
Costs paid as a percentage of a $10,000 investment
|
|
F/m US Treasury 2 Year Note ETF
|
$15
|
0.15%
|
HOW DID THE FUND PERFORM DURING THE PERIOD AND WHAT AFFECTED ITS PERFORMANCE?
The investment objective of the Fund is to seek investment results that correspond (before fees and expenses) generally to the price and yield performance of the Bloomberg US Treasury Bellwether 2Y Total Return USD Unhedged Index (the “Index”). The Fund performed well for the year, returning 2.18% versus the Index’s return of 2.30%. Dividends represented the majority of the return, with the price returning -1.67% for the year. The Fund’s securities lending program has generated additional income and mitigated the cost of running the Fund.
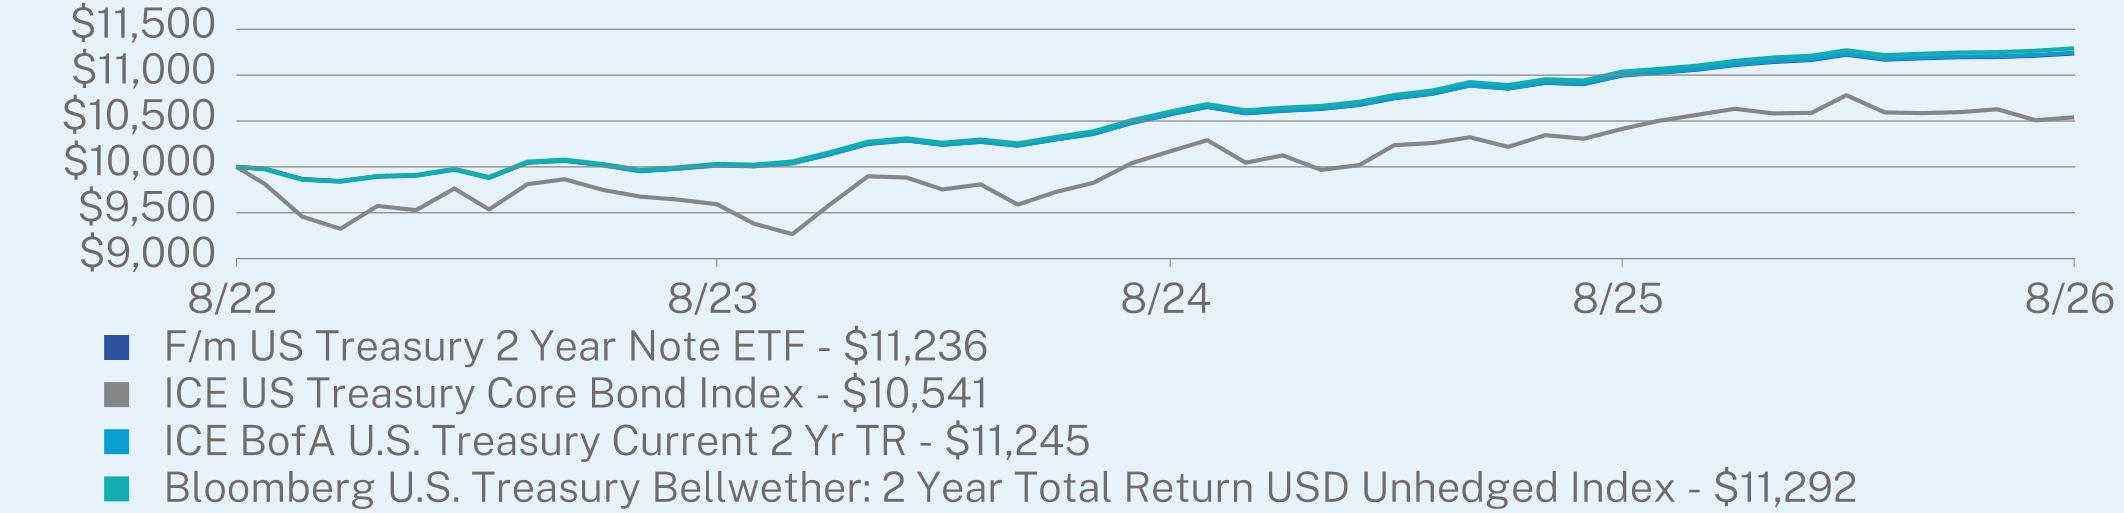
ANNUAL AVERAGE TOTAL RETURN (%)
|
|
1 Year
|
Since Inception
(08/08/2022) |
|
F/m US Treasury 2 Year Note ETF
|
2.18
|
2.91
|
|
ICE US Treasury Core Bond Index
|
1.21
|
1.30
|
|
ICE BofA U.S. Treasury Current 2 Yr TR
|
2.22
|
2.93
|
|
Bloomberg U.S. Treasury Bellwether: 2 Year Total Return USD Unhedged Index
|
2.30
|
3.03
|
Visit https://www.fminvest.com/utwo for more recent performance information.
KEY FUND STATISTICS (as of August 31, 2026)
|
Net Assets
|
$491,622,042
|
|
Number of Holdings
|
1
|
|
Net Advisory Fee
|
$632,675
|
|
Portfolio Turnover
|
1,204%
|
|
30-Day SEC Yield
|
4.17%
|
|
30-Day SEC Yield Unsubsidized
|
4.17%
|
WHAT DID THE FUND INVEST IN? (as of August 31, 2026)
|
Top 10 Holdings
|
(% of Net Assets)
|
|
|
United States Treasury Note/Bond
|
100.0
|
%
|
|
Top Sectors
|
(% of Net Assets)
|
|
|
Government
|
100.0
|
%
|
WHAT WERE THE FUND COSTS FOR THE PERIOD? (based on a hypothetical $10,000 investment)
|
Fund Name
|
Costs of a $10,000 investment
|
Costs paid as a percentage of a $10,000 investment
|
|
F/m US Treasury 3 Year Note ETF
|
$15
|
0.15%
|
HOW DID THE FUND PERFORM DURING THE PERIOD AND WHAT AFFECTED ITS PERFORMANCE?
The investment objective of the Fund is to seek investment results that correspond (before fees and expenses) generally to the price and yield performance of the Bloomberg US Treasury Bellwether 3Y Total Return USD Unhedged Index (the “Index”). The Fund performed well for the year, returning 1.35% versus the Index’s return of 1.54%. Dividends represented the majority of the return, with the price returning -2.43% for the year.
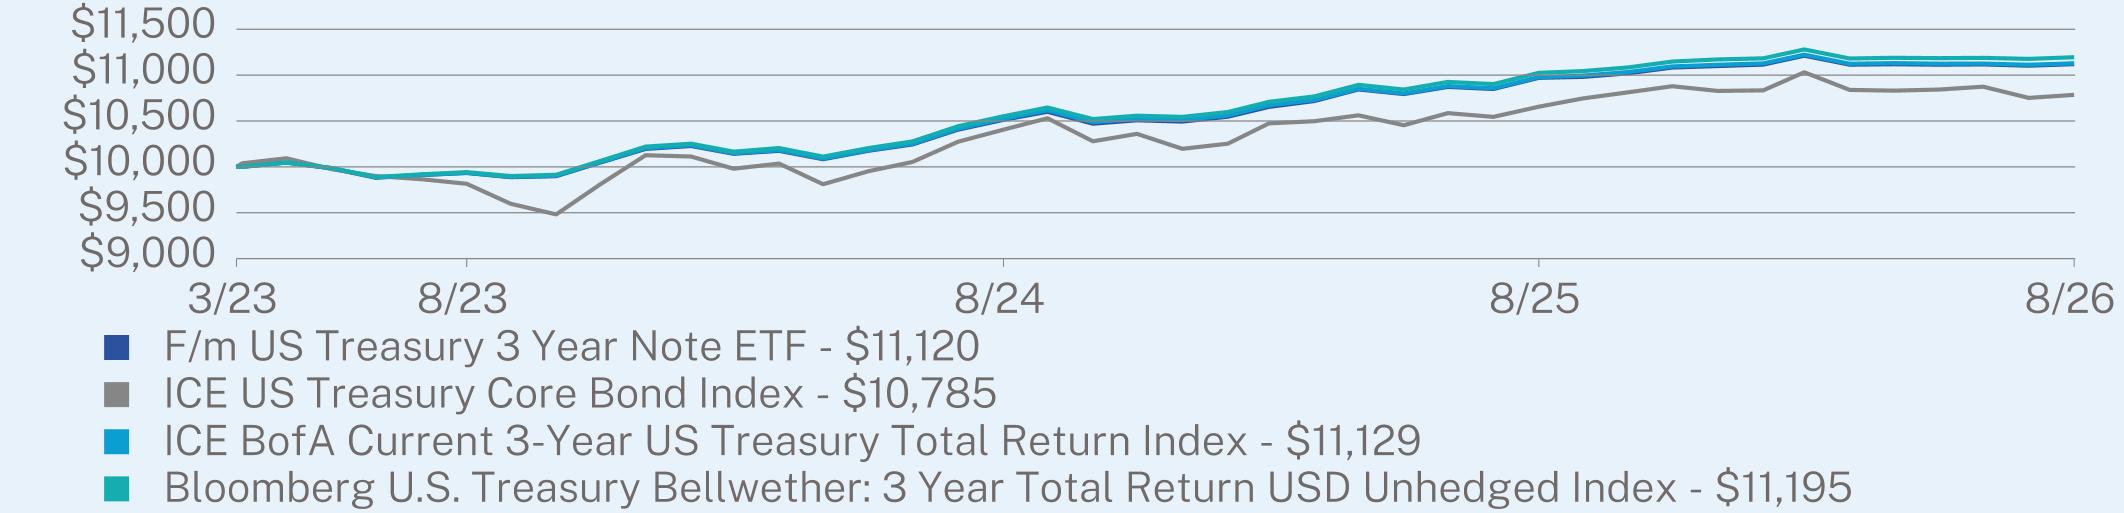
ANNUAL AVERAGE TOTAL RETURN (%)
|
|
1 Year
|
Since Inception
(03/27/2023) |
|
F/m US Treasury 3 Year Note ETF
|
1.35
|
3.14
|
|
ICE US Treasury Core Bond Index
|
1.21
|
2.23
|
|
ICE BofA Current 3-Year US Treasury Total Return Index
|
1.37
|
3.17
|
|
Bloomberg U.S. Treasury Bellwether: 3 Year Total Return USD Unhedged Index
|
1.54
|
3.34
|
Visit https://www.fminvest.com/utre for more recent performance information.
KEY FUND STATISTICS (as of August 31, 2026)
|
Net Assets
|
$10,719,768
|
|
Number of Holdings
|
1
|
|
Net Advisory Fee
|
$15,435
|
|
Portfolio Turnover
|
1,123%
|
|
30-Day SEC Yield
|
4.20%
|
|
30-Day SEC Yield Unsubsidized
|
4.20%
|
WHAT DID THE FUND INVEST IN? (as of August 31, 2026)
|
Top 10 Holdings
|
(% of Net Assets)
|
|
|
United States Treasury Note/Bond
|
99.8
|
%
|
|
Top Sectors
|
(% of Net Assets)
|
|
|
Government
|
99.8
|
%
|
|
Cash & Other
|
0.2
|
%
|
WHAT WERE THE FUND COSTS FOR THE PERIOD? (based on a hypothetical $10,000 investment)
|
Fund Name
|
Costs of a $10,000 investment
|
Costs paid as a percentage of a $10,000 investment
|
|
F/m US Treasury 5 Year Note ETF
|
$15
|
0.15%
|
HOW DID THE FUND PERFORM DURING THE PERIOD AND WHAT AFFECTED ITS PERFORMANCE?
The investment objective of the Fund is to seek investment results that correspond (before fees and expenses) generally to the price and yield performance of the Bloomberg US Treasury Bellwether 5Y Total Return Index Unhedged USD Index (the “Index”). The Fund performed well in a challenging rate environment, returning 0.14% versus the Index’s return of 0.33%. Dividends represented the majority of the returns, with the price returning -3.68% for the year. The Fund’s securities lending program has generated additional income and mitigated the cost of running the Fund.
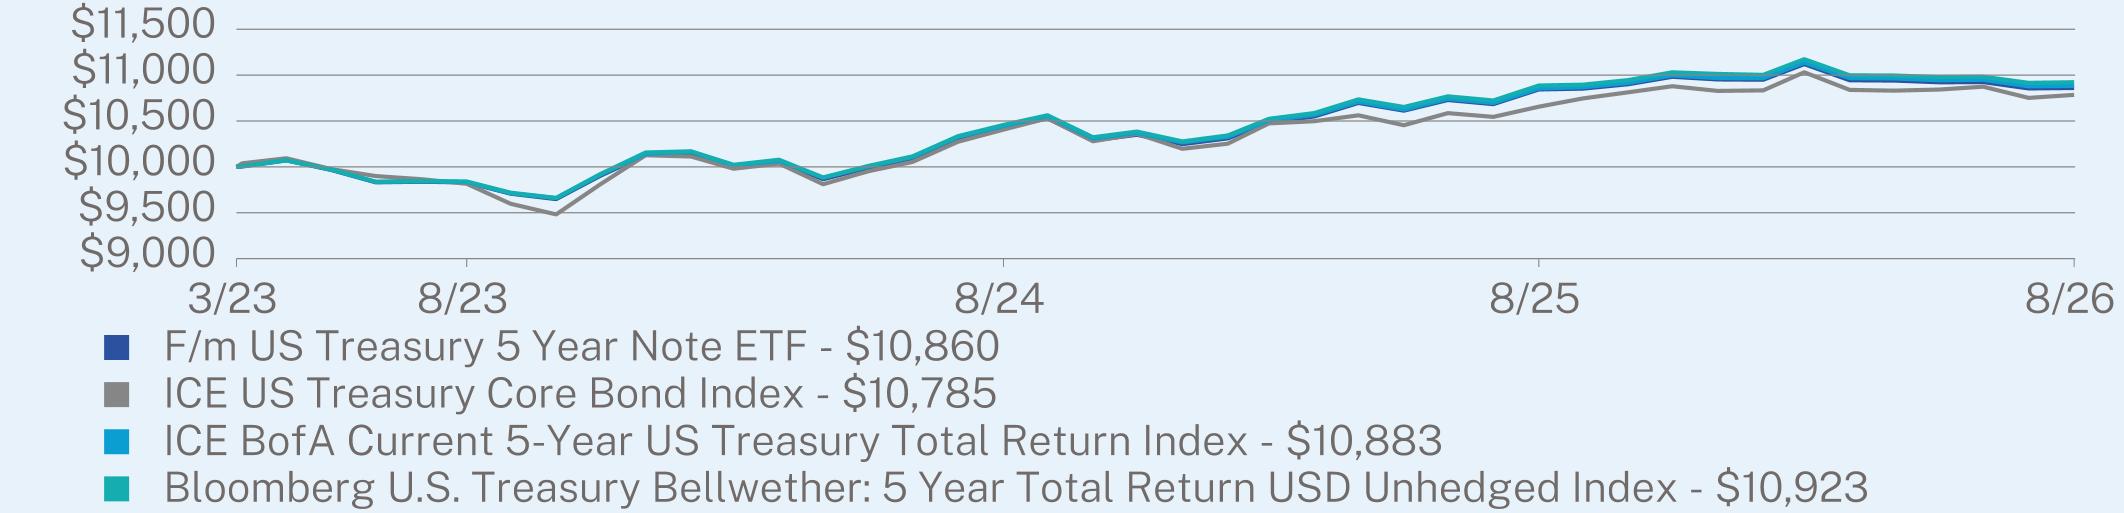
ANNUAL AVERAGE TOTAL RETURN (%)
|
|
1 Year
|
Since Inception
(03/27/2023) |
|
F/m US Treasury 5 Year Note ETF
|
0.14
|
2.43
|
|
ICE US Treasury Core Bond Index
|
1.21
|
2.23
|
|
ICE BofA Current 5-Year US Treasury Total Return Index
|
0.25
|
2.50
|
|
Bloomberg U.S. Treasury Bellwether: 5 Year Total Return USD Unhedged Index
|
0.33
|
2.61
|
Visit https://www.fminvest.com/ufiv for more recent performance information.
KEY FUND STATISTICS (as of August 31, 2026)
|
Net Assets
|
$30,486,349
|
|
Number of Holdings
|
1
|
|
Net Advisory Fee
|
$45,785
|
|
Portfolio Turnover
|
1,090%
|
|
30-Day SEC Yield
|
4.31%
|
|
30-Day SEC Yield Unsubsidized
|
4.31%
|
WHAT DID THE FUND INVEST IN? (as of August 31, 2026)
|
Top 10 Holdings
|
(% of Net Assets)
|
|
|
United States Treasury Note/Bond
|
100.0
|
%
|
|
Top Sectors
|
(% of Net Assets)
|
|
|
Government
|
100.0
|
%
|
WHAT WERE THE FUND COSTS FOR THE PERIOD? (based on a hypothetical $10,000 investment)
|
Fund Name
|
Costs of a $10,000 investment
|
Costs paid as a percentage of a $10,000 investment
|
|
F/m US Treasury 7 Year Note ETF
|
$15
|
0.15%
|
HOW DID THE FUND PERFORM DURING THE PERIOD AND WHAT AFFECTED ITS PERFORMANCE?
The investment objective of the Fund is to seek investment results that correspond (before fees and expenses) generally to the price and yield performance of the Bloomberg US Treasury Bellwether 7Y Total Return USD Unhedged Index (the “Index”). The Fund performed well in a challenging rate environment, returning 0.08% versus the Index’s return of 0.24%. Dividends represented the majority of the returns, with the price returning -3.93% for the year. The Fund’s securities lending program has generated additional income and mitigated the cost of running the Fund.
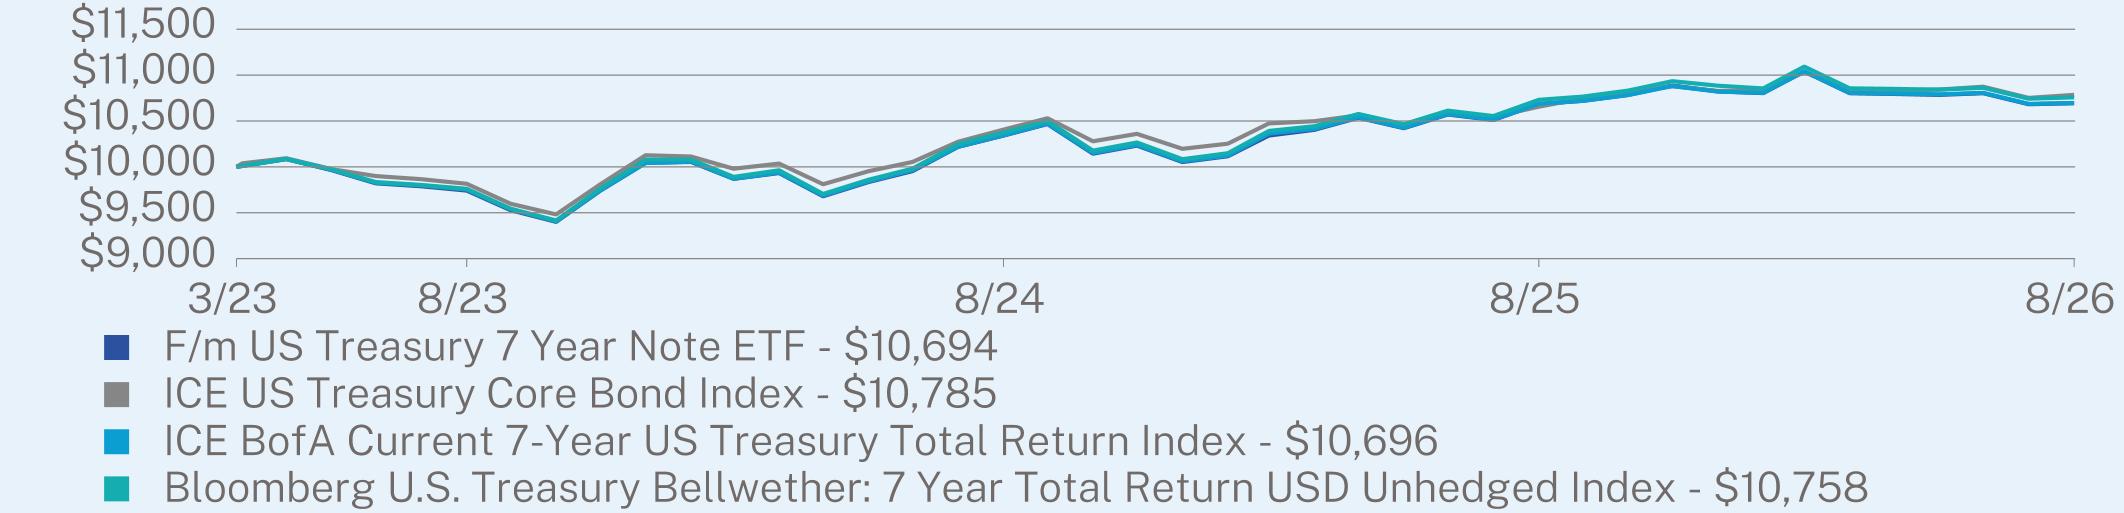
ANNUAL AVERAGE TOTAL RETURN (%)
|
|
1 Year
|
Since Inception
(03/27/2023) |
|
F/m US Treasury 7 Year Note ETF
|
0.08
|
1.98
|
|
ICE US Treasury Core Bond Index
|
1.21
|
2.23
|
|
ICE BofA Current 7-Year US Treasury Total Return Index
|
0.08
|
1.98
|
|
Bloomberg U.S. Treasury Bellwether: 7 Year Total Return USD Unhedged Index
|
0.24
|
2.15
|
Visit https://www.fminvest.com/usvn for more recent performance information.
KEY FUND STATISTICS (as of August 31, 2026)
|
Net Assets
|
$7,018,852
|
|
Number of Holdings
|
1
|
|
Net Advisory Fee
|
$12,457
|
|
Portfolio Turnover
|
1,090%
|
|
30-Day SEC Yield
|
4.45%
|
|
30-Day SEC Yield Unsubsidized
|
4.45%
|
WHAT DID THE FUND INVEST IN? (as of August 31, 2026)
|
Top 10 Holdings
|
(% of Net Assets)
|
|
|
United States Treasury Note/Bond
|
100.0
|
%
|
|
Top Sectors
|
(% of Net Assets)
|
|
|
Government
|
100.0
|
%
|
WHAT WERE THE FUND COSTS FOR THE PERIOD? (based on a hypothetical $10,000 investment)
|
Fund Name
|
Costs of a $10,000 investment
|
Costs paid as a percentage of a $10,000 investment
|
|
F/m US Treasury 10 Year Note ETF
|
$15
|
0.15%
|
HOW DID THE FUND PERFORM DURING THE PERIOD AND WHAT AFFECTED ITS PERFORMANCE?
The investment objective of the Fund is to seek investment results that correspond (before fees and expenses) generally to the price and yield performance of the Bloomberg US Treasury Bellwether 10Y Total Return USD Unhedged Index (the “Index”). The Fund performed well in a challenging rate environment, returning 0.28% versus the Index’s return of 0.34%. Dividends represented the majority of the returns, with the price returning -3.99% for the year. The Fund’s securities lending program has generated additional income and mitigated the cost of running the Fund.
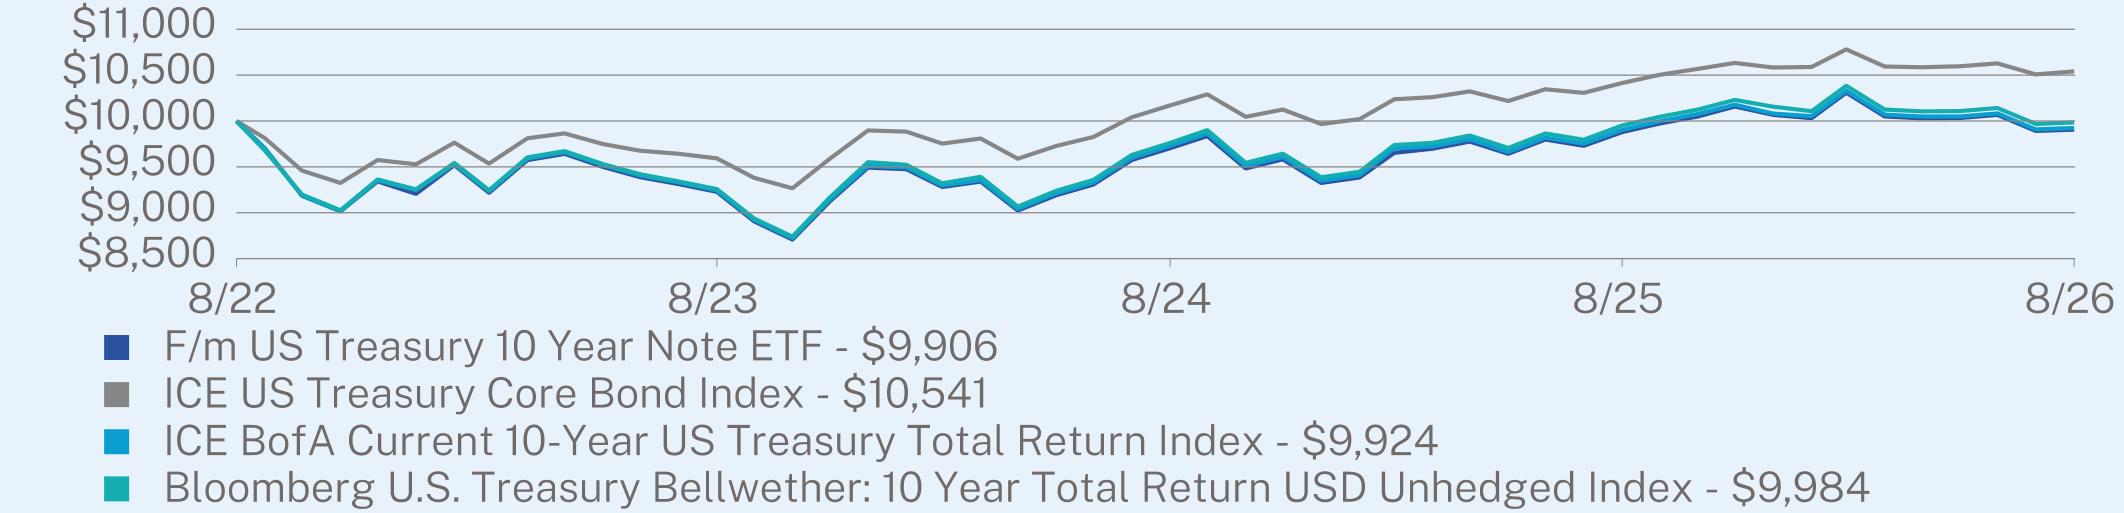
ANNUAL AVERAGE TOTAL RETURN (%)
|
|
1 Year
|
Since Inception
(08/08/2022) |
|
F/m US Treasury 10 Year Note ETF
|
0.28
|
-0.23
|
|
ICE US Treasury Core Bond Index
|
1.21
|
1.30
|
|
ICE BofA Current 10-Year US Treasury Total Return Index
|
0.20
|
-0.19
|
|
Bloomberg U.S. Treasury Bellwether: 10 Year Total Return USD Unhedged Index
|
0.34
|
-0.04
|
Visit https://www.fminvest.com/uten for more recent performance information.
KEY FUND STATISTICS (as of August 31, 2026)
|
Net Assets
|
$267,528,390
|
|
Number of Holdings
|
1
|
|
Net Advisory Fee
|
$400,836
|
|
Portfolio Turnover
|
423%
|
|
30-Day SEC Yield
|
4.61%
|
|
30-Day SEC Yield Unsubsidized
|
4.61%
|
WHAT DID THE FUND INVEST IN? (as of August 31, 2026)
|
Top 10 Holdings
|
(% of Net Assets)
|
|
|
United States Treasury Note/Bond
|
99.8
|
%
|
|
Top Sectors
|
(% of Net Assets)
|
|
|
Government
|
99.8
|
%
|
|
Cash & Other
|
0.2
|
%
|
WHAT WERE THE FUND COSTS FOR THE PERIOD? (based on a hypothetical $10,000 investment)
|
Fund Name
|
Costs of a $10,000 investment
|
Costs paid as a percentage of a $10,000 investment
|
|
F/m US Treasury 20 Year Bond ETF
|
$15
|
0.15%
|
HOW DID THE FUND PERFORM DURING THE PERIOD AND WHAT AFFECTED ITS PERFORMANCE?
The investment objective of the Fund is to seek investment results that correspond (before fees and expenses) generally to the price and yield performance of the Bloomberg US Treasury Bellwether 20Y Total Return USD Unhedged Index (the “Index”). The Fund performed well in a challenging rate environment, returning –0.21% versus the Index’s return of -0.09%. Dividends represented the majority of the return, with the price returning -5.07% for the year. The Fund’s securities lending program has generated additional income and mitigated the cost of running the Fund.
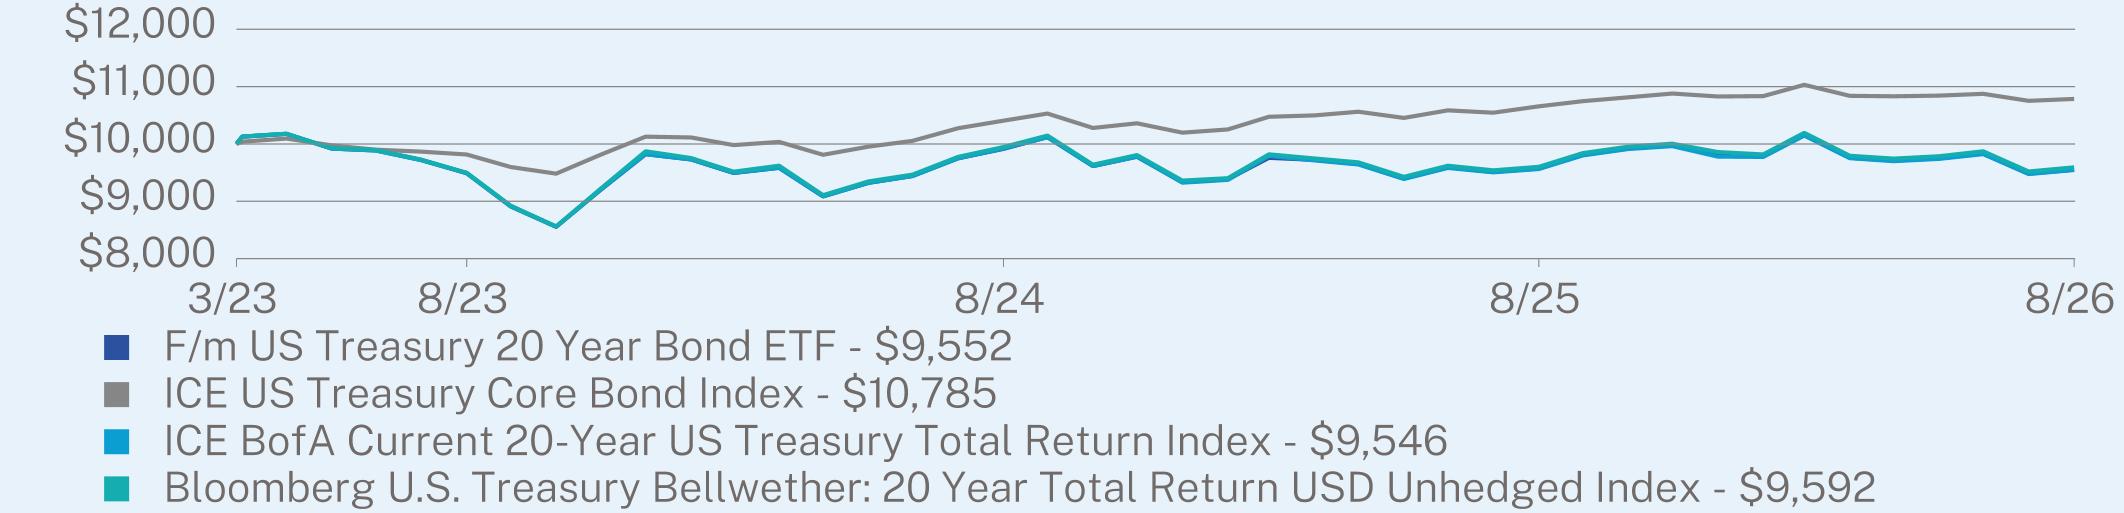
ANNUAL AVERAGE TOTAL RETURN (%)
|
|
1 Year
|
Since Inception
(03/27/2023) |
|
F/m US Treasury 20 Year Bond ETF
|
-0.21
|
-1.33
|
|
ICE US Treasury Core Bond Index
|
1.21
|
2.23
|
|
ICE BofA Current 20-Year US Treasury Total Return Index
|
-0.18
|
-1.35
|
|
Bloomberg U.S. Treasury Bellwether: 20 Year Total Return USD Unhedged Index
|
-0.09
|
-1.21
|
Visit https://www.fminvest.com/utwy for more recent performance information.
KEY FUND STATISTICS (as of August 31, 2026)
|
Net Assets
|
$8,221,422
|
|
Number of Holdings
|
1
|
|
Net Advisory Fee
|
$13,175
|
|
Portfolio Turnover
|
390%
|
|
30-Day SEC Yield
|
5.15%
|
|
30-Day SEC Yield Unsubsidized
|
5.15%
|
WHAT DID THE FUND INVEST IN? (as of August 31, 2026)
|
Top 10 Holdings
|
(% of Net Assets)
|
|
|
United States Treasury Note/Bond
|
99.7
|
%
|
|
Top Sectors
|
(% of Net Assets)
|
|
|
Government
|
99.7
|
%
|
|
Cash & Other
|
0.3
|
%
|
WHAT WERE THE FUND COSTS FOR THE PERIOD? (based on a hypothetical $10,000 investment)
|
Fund Name
|
Costs of a $10,000 investment
|
Costs paid as a percentage of a $10,000 investment
|
|
F/m US Treasury 30 Year Bond ETF
|
$15
|
0.15%
|
HOW DID THE FUND PERFORM DURING THE PERIOD AND WHAT AFFECTED ITS PERFORMANCE?
The investment objective of the Fund is to seek investment results that correspond (before fees and expenses) generally to the price and yield performance of the Bloomberg US Treasury Bellwether 30Y Total Return USD Unhedged Index (the “Index”). The Fund performed well in a challenging rate environment, returning -0.39% versus the Index’s return of -0.17%. Dividends represented the majority of the return, with the price returning -5.22% for the year. The Fund’s securities lending program has generated additional income and mitigated the cost of running the Fund.
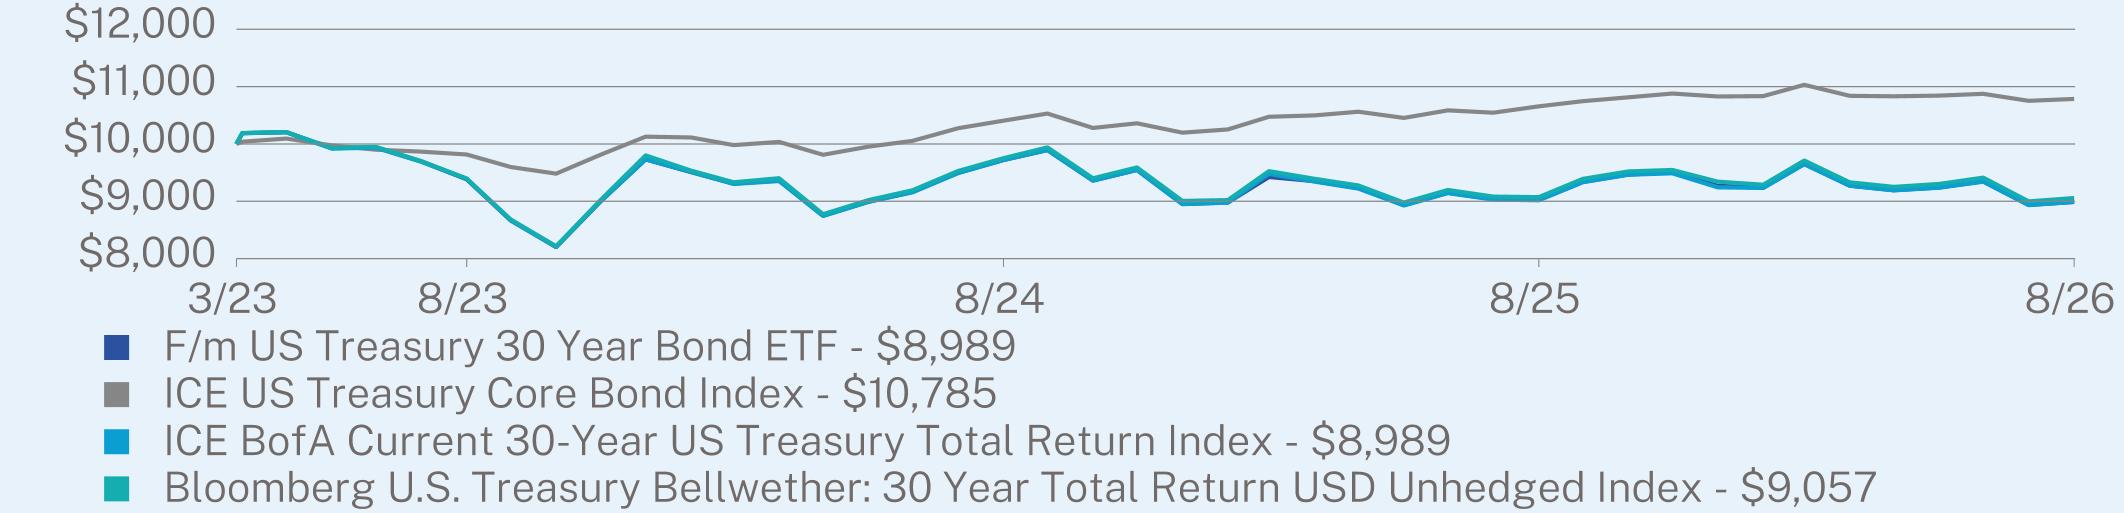
ANNUAL AVERAGE TOTAL RETURN (%)
|
|
1 Year
|
Since Inception
(03/27/2023) |
|
F/m US Treasury 30 Year Bond ETF
|
-0.39
|
-3.06
|
|
ICE US Treasury Core Bond Index
|
1.21
|
2.23
|
|
ICE BofA Current 30-Year US Treasury Total Return Index
|
-0.33
|
-3.06
|
|
Bloomberg U.S. Treasury Bellwether: 30 Year Total Return USD Unhedged Index
|
-0.17
|
-2.85
|
Visit https://www.fminvest.com/uthy for more recent performance information.
KEY FUND STATISTICS (as of August 31, 2026)
|
Net Assets
|
$192,938,385
|
|
Number of Holdings
|
1
|
|
Net Advisory Fee
|
$84,336
|
|
Portfolio Turnover
|
435%
|
|
30-Day SEC Yield
|
5.15%
|
|
30-Day SEC Yield Unsubsidized
|
5.15%
|
WHAT DID THE FUND INVEST IN? (as of August 31, 2026)
|
Top 10 Holdings
|
(% of Net Assets)
|
|
|
United States Treasury Note/Bond
|
99.8
|
%
|
|
Top Sectors
|
(% of Net Assets)
|
|
|
Government
|
99.8
|
%
|
|
Cash & Other
|
0.2
|
%
|
WHAT WERE THE FUND COSTS FOR THE PAST YEAR? (based on a hypothetical $10,000 investment)
|
Fund Name
|
Costs of a $10,000 investment
|
Costs paid as a percentage of a $10,000 investment
|
|
F/m 2-Year Investment Grade Corporate Bond ETF
|
$15
|
0.15%
|
HOW DID THE FUND PERFORM LAST YEAR AND WHAT AFFECTED ITS PERFORMANCE?
The Fund seeks to track the investments of an index composed of U.S. dollar denominated, investment-grade corporate bonds, as represented by the Bloomberg US Liquid Corporate 2 Year Maturity Index (the “Index”). The Fund invests in a representative sample of securities included in the Index that collectively has an investment profile similar to the Index. Due to the use of representative sampling, the Fund may or may not hold all of the securities that are included in the Index. The Fund had decent performance for the year, returning 3.18% versus the Index at 3.48%. Dividends represented all of the return, with the price return detracting -1.26% for the year.
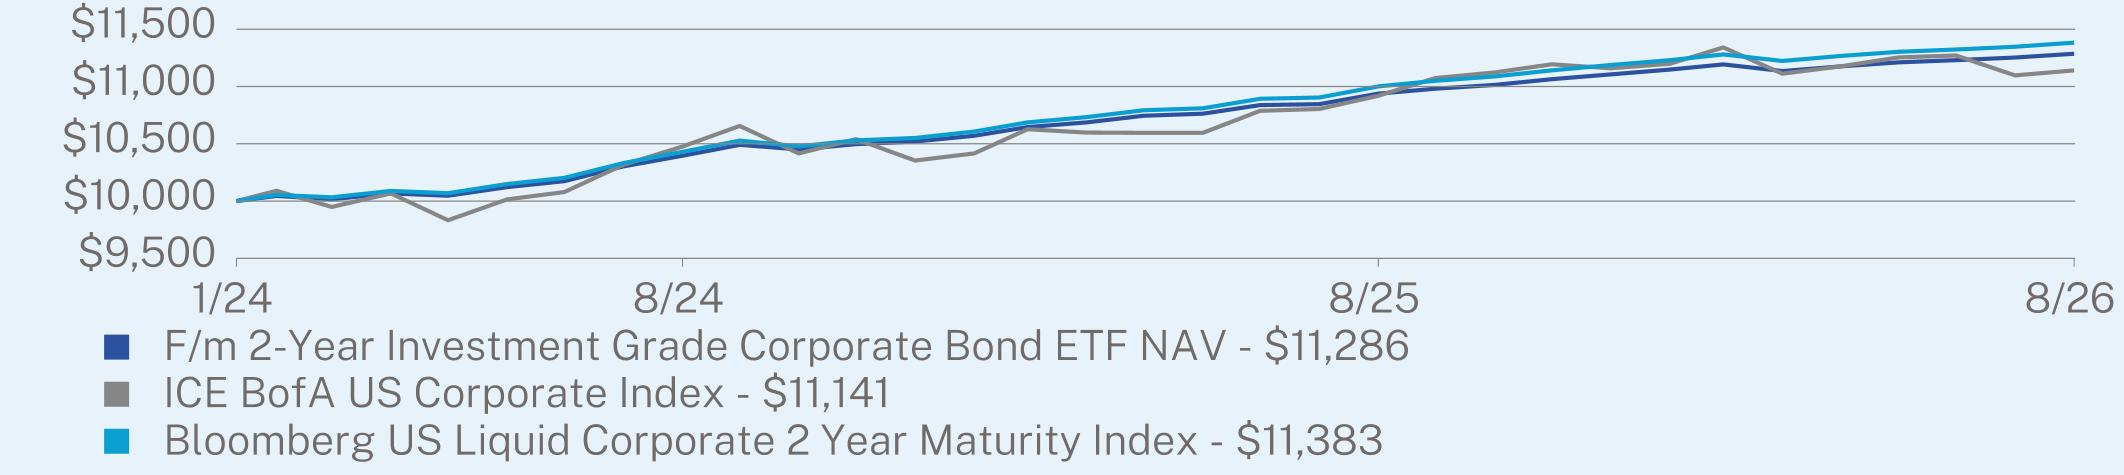
ANNUAL AVERAGE TOTAL RETURN (%)
|
|
1 Year
|
Since Inception
(01/10/2024) |
|
F/m 2-Year Investment Grade Corporate Bond ETF NAV
|
3.18
|
4.69
|
|
ICE BofA US Corporate Index
|
2.03
|
4.18
|
|
Bloomberg US Liquid Corporate 2 Year Maturity Index
|
3.48
|
5.03
|
Visit https://www.fminvest.com/ztwo for more recent performance information.
KEY FUND STATISTICS (as of August 31, 2026)
|
Net Assets
|
$18,077,171
|
|
Number of Holdings
|
453
|
|
Net Advisory Fee
|
$28,623
|
|
Portfolio Turnover
|
72%
|
|
30-Day SEC Yield
|
4.63%
|
|
30-Day SEC Yield Unsubsidized
|
4.63%
|
WHAT DID THE FUND INVEST IN? (as of August 31, 2026)
|
Top 10 Holdings
|
(% of Net Assets)
|
|
|
DuPont de Nemours, Inc.
|
0.2
|
%
|
|
Fox Corp.
|
0.2
|
%
|
|
Kroger Co.
|
0.2
|
%
|
|
Digital Realty Trust LP
|
0.2
|
%
|
|
QUALCOMM, Inc.
|
0.2
|
%
|
|
PepsiCo, Inc.
|
0.2
|
%
|
|
Targa Resources Corp.
|
0.2
|
%
|
|
Ventas Realty LP
|
0.2
|
%
|
|
CubeSmart LP
|
0.2
|
%
|
|
John Deere Capital Corp.
|
0.2
|
%
|
|
Top Sectors
|
(% of Net Assets)
|
|
|
Financials
|
31.7
|
%
|
|
Industrials
|
11.2
|
%
|
|
Utilities
|
9.8
|
%
|
|
Health Care
|
8.8
|
%
|
|
Technology
|
8.1
|
%
|
|
Consumer Discretionary
|
7.3
|
%
|
|
Consumer Staples
|
7.2
|
%
|
|
Energy
|
6.2
|
%
|
|
Materials
|
5.5
|
%
|
|
Cash & Other
|
4.2
|
%
|
WHAT WERE THE FUND COSTS FOR THE PAST YEAR? (based on a hypothetical $10,000 investment)
|
Fund Name
|
Costs of a $10,000 investment
|
Costs paid as a percentage of a $10,000 investment
|
|
F/m 3-Year Investment Grade Corporate Bond ETF
|
$15
|
0.15%
|
HOW DID THE FUND PERFORM LAST YEAR AND WHAT AFFECTED ITS PERFORMANCE?
The Fund seeks to track the investments of an index composed of U.S. dollar denominated, investment-grade corporate bonds, as represented by the Bloomberg US Liquid Corporate 3 Year Maturity Index (the “Index”). The Fund invests in a representative sample of securities included in the Index that collectively has an investment profile similar to the Index. Due to the use of representative sampling, the Fund may or may not hold all of the securities that are included in the Index. The Fund had decent performance for the year, returning 2.63% versus the Index at 2.89%. Dividends represented all of the positive return, with the price return detracting -2.01% for the year.
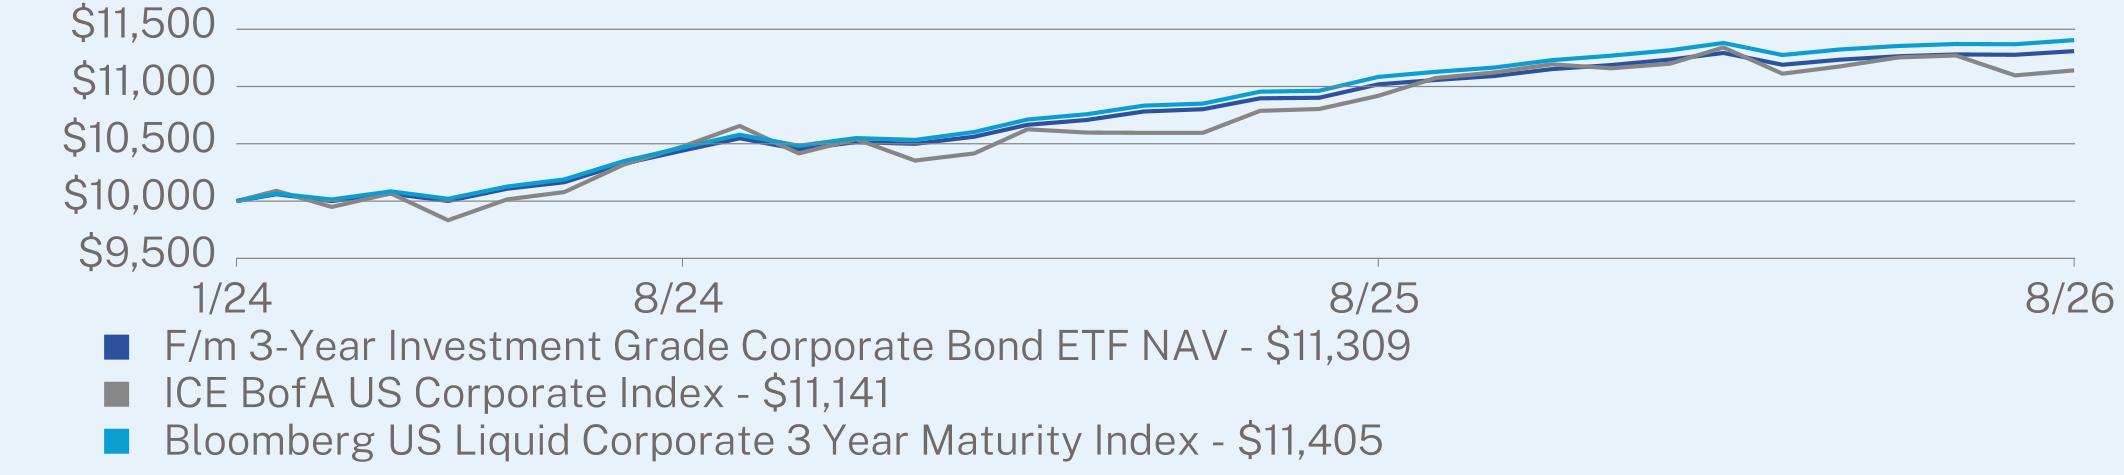
ANNUAL AVERAGE TOTAL RETURN (%)
|
|
1 Year
|
Since Inception
(01/10/2024) |
|
F/m 3-Year Investment Grade Corporate Bond ETF NAV
|
2.63
|
4.77
|
|
ICE BofA US Corporate Index
|
2.03
|
4.18
|
|
Bloomberg US Liquid Corporate 3 Year Maturity Index
|
2.89
|
5.10
|
Visit https://www.fminvest.com/ztre for more recent performance information.
KEY FUND STATISTICS (as of August 31, 2026)
|
Net Assets
|
$42,237,651
|
|
Number of Holdings
|
476
|
|
Net Advisory Fee
|
$60,671
|
|
Portfolio Turnover
|
88%
|
|
30-Day SEC Yield
|
4.84%
|
|
30-Day SEC Yield Unsubsidized
|
4.84%
|
WHAT DID THE FUND INVEST IN? (as of August 31, 2026)
|
Top 10 Holdings
|
(% of Net Assets)
|
|
|
Las Vegas Sands Corp.
|
0.2
|
%
|
|
Kinder Morgan, Inc.
|
0.2
|
%
|
|
Diamondback Energy, Inc.
|
0.2
|
%
|
|
NLG Global Funding
|
0.2
|
%
|
|
Juniper Networks, Inc.
|
0.2
|
%
|
|
Blackstone Holdings Finance Co. LLC
|
0.2
|
%
|
|
Canadian Imperial Bank of Commerce
|
0.2
|
%
|
|
Lincoln Financial Global Funding
|
0.2
|
%
|
|
AS Mileage Plan IP Ltd.
|
0.2
|
%
|
|
Jefferies Financial Group, Inc.
|
0.2
|
%
|
|
Top Sectors
|
(% of Net Assets)
|
|
|
Financials
|
33.5
|
%
|
|
Industrials
|
10.2
|
%
|
|
Energy
|
8.7
|
%
|
|
Technology
|
8.7
|
%
|
|
Consumer Discretionary
|
8.4
|
%
|
|
Health Care
|
8.5
|
%
|
|
Utilities
|
8.3
|
%
|
|
Consumer Staples
|
5.0
|
%
|
|
Materials
|
4.2
|
%
|
|
Communications
|
3.5
|
%
|
|
Cash & Other
|
1.0
|
%
|
WHAT WERE THE FUND COSTS FOR THE PAST YEAR? (based on a hypothetical $10,000 investment)
|
Fund Name
|
Costs of a $10,000 investment
|
Costs paid as a percentage of a $10,000 investment
|
|
F/m 10-Year Investment Grade Corporate Bond ETF
|
$15
|
0.15%
|
HOW DID THE FUND PERFORM LAST YEAR AND WHAT AFFECTED ITS PERFORMANCE?
The Fund seeks to track the investments of an index composed of U.S. dollar denominated, investment-grade corporate bonds, as represented by the Bloomberg US Liquid Corporate 10 Year Maturity Index (the “Index”). The Fund invests in a representative sample of securities included in the Index that collectively have an investment profile similar to the Index. Due to the use of representative sampling, the Fund may or may not hold all of the securities that are included in the Index. The Fund had decent performance for the year, returning 2.13% versus the Index at 2.14%. Dividends represented all of the positive return, with the price return detracting –3.20% for the year.
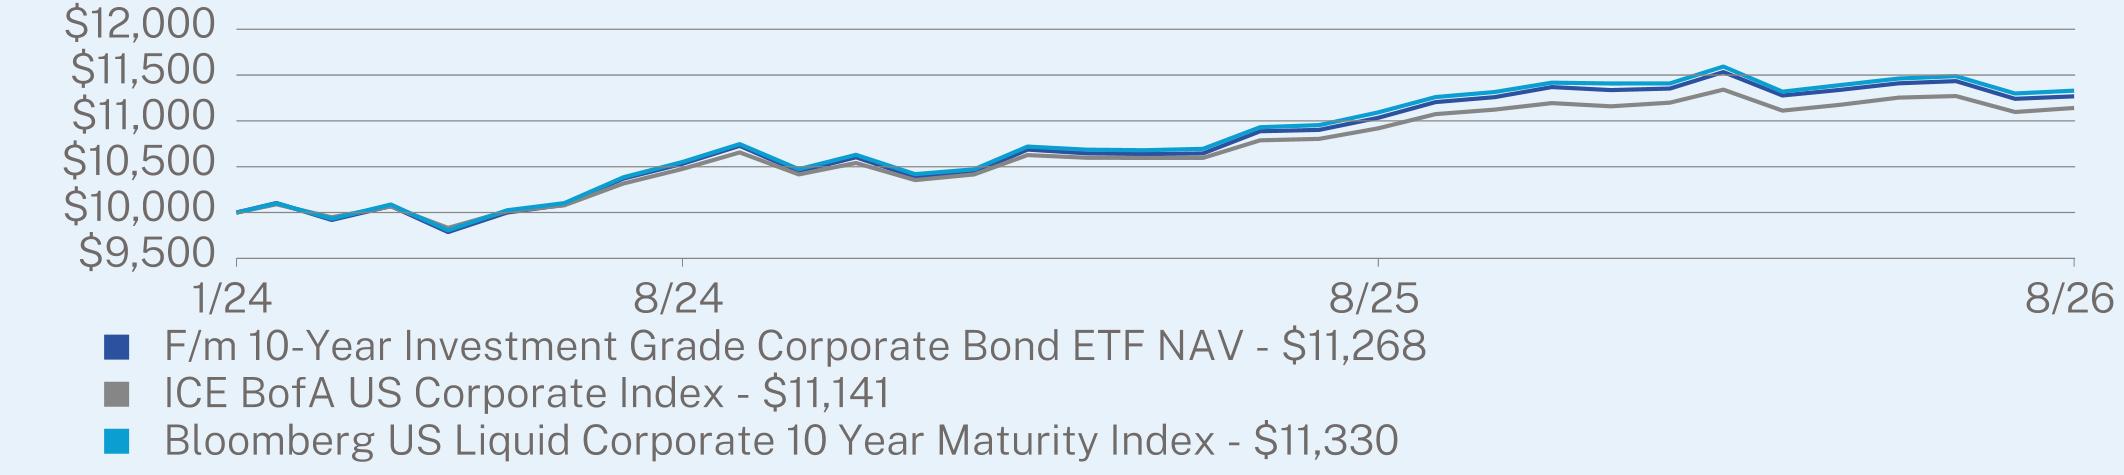
ANNUAL AVERAGE TOTAL RETURN (%)
|
|
1 Year
|
Since Inception
(01/10/2024) |
|
F/m 10-Year Investment Grade Corporate Bond ETF NAV
|
2.13
|
4.62
|
|
ICE BofA US Corporate Index
|
2.03
|
4.18
|
|
Bloomberg US Liquid Corporate 10 Year Maturity Index
|
2.14
|
4.84
|
Visit https://www.fminvest.com/zten for more recent performance information.
KEY FUND STATISTICS (as of August 31, 2026)
|
Net Assets
|
$29,540,519
|
|
Number of Holdings
|
244
|
|
Net Advisory Fee
|
$44,250
|
|
Portfolio Turnover
|
160%
|
|
30-Day SEC Yield
|
5.59%
|
|
30-Day SEC Yield Unsubsidized
|
5.59%
|
WHAT DID THE FUND INVEST IN? (as of August 31, 2026)
|
Top 10 Holdings
|
(% of Net Assets)
|
|
|
Kinder Morgan, Inc.
|
0.4
|
%
|
|
Accenture Capital, Inc.
|
0.4
|
%
|
|
Caterpillar, Inc.
|
0.4
|
%
|
|
PNC Financial Services Group, Inc.
|
0.4
|
%
|
|
Principal Financial Group, Inc.
|
0.4
|
%
|
|
Home Depot, Inc.
|
0.4
|
%
|
|
HEICO Corp.
|
0.4
|
%
|
|
Western Midstream Operating LP
|
0.4
|
%
|
|
Travelers Cos., Inc.
|
0.4
|
%
|
|
Plains All American Pipeline LP / PAA Finance Corp.
|
0.4
|
%
|
|
Top Sectors
|
(% of Net Assets)
|
|
|
Financials
|
26.2
|
%
|
|
Utilities
|
14.1
|
%
|
|
Industrials
|
11.3
|
%
|
|
Energy
|
10.5
|
%
|
|
Technology
|
7.7
|
%
|
|
Communications
|
7.3
|
%
|
|
Health Care
|
6.8
|
%
|
|
Materials
|
6.1
|
%
|
|
Consumer Staples
|
4.9
|
%
|
|
Cash & Other
|
5.1
|
%
|
WHAT WERE THE FUND COSTS FOR THE PERIOD? (based on a hypothetical $10,000 investment)
|
Class Name
|
Costs of a $10,000 investment
|
Costs paid as a percentage of a $10,000 investment
|
|
Institutional Class
|
$60
|
0.60%
|
HOW DID THE FUND PERFORM LAST YEAR AND WHAT AFFECTED ITS PERFORMANCE?
During the Period, the Fund underperformed its index as yield curve positioning and technology-related issues detracted from the Fund’s performance. For the fiscal year, the Fund gained 1.29% and the Bloomberg Aggregate Bond Index added 1.89% on a total return basis. A flatter yield curve proved detrimental as the Fund had underweighted longer maturity bonds. The Fund’s focus on spread product, with its overweight positions in mortgage-backed securities, asset-backed securities, and corporate bonds, aided performance over the fiscal year due to the increased income and strong performance of these sectors. Having started the year with a duration slightly below that of the index, the Fund was able to minimize the impact of higher US Treasury yields in the intermediate and longer maturities.
As the year progressed, intermediate yields better reflected inflationary risks and Fund duration was extended to approximately match that of the index. Energy prices and the AI buildout have sparked inflationary concerns, prompting increased calls for rate hikes. Real yields, however, are compensating investors for this risk, thus providing support for duration approximating that of the index. Although yield spreads are narrow by historic standards, underlying fundamentals remain supportive and should reduce risks from both corporate bonds and securitized products.
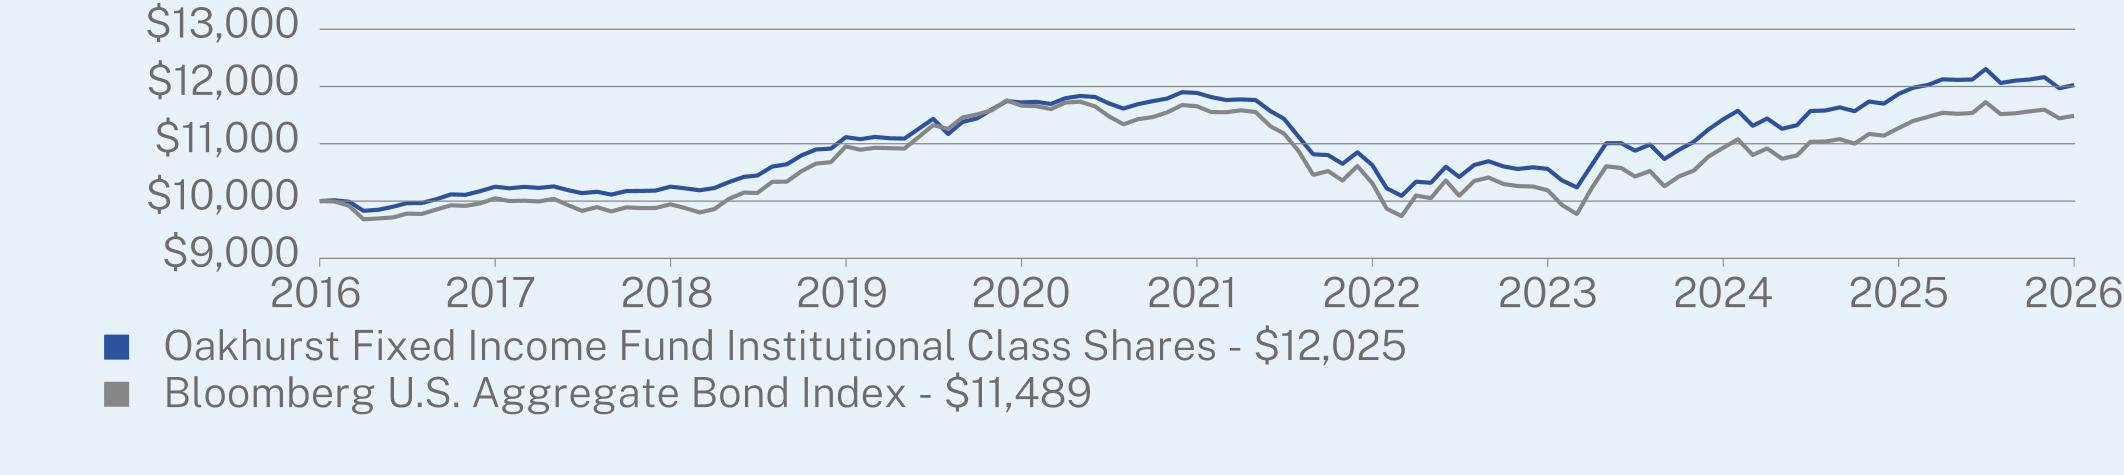
ANNUAL AVERAGE TOTAL RETURN (%)
|
|
1 Year
|
5 Year
|
10 Year
|
|
Institutional Class Shares (without sales charge)
|
1.29
|
0.23
|
1.86
|
|
Bloomberg U.S. Aggregate Bond Index
|
1.89
|
-0.29
|
1.40
|
Visit https://www.fminvest.com/mutual-funds/ohfix/ for more recent performance information.
KEY FUND STATISTICS (as of August 31, 2026)
|
Net Assets
|
$99,804,852
|
|
Number of Holdings
|
140
|
|
Net Advisory Fee
|
$371,750
|
|
Portfolio Turnover
|
80%
|
WHAT DID THE FUND INVEST IN? (as of August 31, 2026)
|
Top 10 Holdings
|
(% of Net Assets)
|
|
|
United States Treasury Note/Bond
|
24.6
|
%
|
|
Federal Home Loan Mortgage Corp.
|
14.2
|
%
|
|
Federal National Mortgage Association
|
11.7
|
%
|
|
Government National Mortgage Association
|
2.0
|
%
|
|
Westlake Automobile Receivables Trust
|
1.1
|
%
|
|
Tennessee Valley Authority
|
1.1
|
%
|
|
Taco Bell Corp.
|
1.0
|
%
|
|
QTS Issuer ABS I LLC
|
1.0
|
%
|
|
DB Master Finance Parent LLC
|
1.0
|
%
|
|
RCKT Mortgage Trust
|
0.9
|
%
|
|
Top Sectors
|
(% of Net Assets)
|
|
|
Mortgage Securities
|
35.8
|
%
|
|
Government
|
26.4
|
%
|
|
Financials
|
9.1
|
%
|
|
Asset Backed Securities
|
6.3
|
%
|
|
Technology
|
5.6
|
%
|
|
Utilities
|
3.8
|
%
|
|
Energy
|
3.3
|
%
|
|
Consumer Discretionary
|
2.8
|
%
|
|
Communications
|
2.5
|
%
|
|
Cash & Other
|
4.4
|
%
|
WHAT WERE THE FUND COSTS FOR THE PAST YEAR? (based on a hypothetical $10,000 investment)
|
Fund Name
|
Costs of a $10,000 investment
|
Costs paid as a percentage of a $10,000 investment
|
|
F/m Opportunistic Income ETF
|
$40
|
0.39%
|
HOW DID THE FUND PERFORM LAST YEAR AND WHAT AFFECTED ITS PERFORMANCE?
The Fund performed well for the fiscal year ending 8/31/26, generating a return of 3.32% versus a gain of 1.89% for the Bloomberg U.S. Aggregate Bond Index. Fund performance benefitted from meaningful overweight allocations to corporate bonds, mortgage-backed securities, and asset-backed securities. The additional yield from these sectors contributed to the Fund’s outperformance, with a narrowing of yield spreads enabling them to produce better performance than government debt. A tactical move into municipal bonds added value, as did the allocation to the F/m High Yield 100 ETF (ZTOP). The Fund maintained a duration longer than that of the index during the fiscal year. While this interest rate positioning detracted from performance, the yield curve exposure, namely an overweight to intermediate bonds, lessened the impact from higher rates as the yield curve flattened. Overall security selection proved beneficial to the Fund’s fiscal year performance, though some technology-related holdings underperformed the broader market.
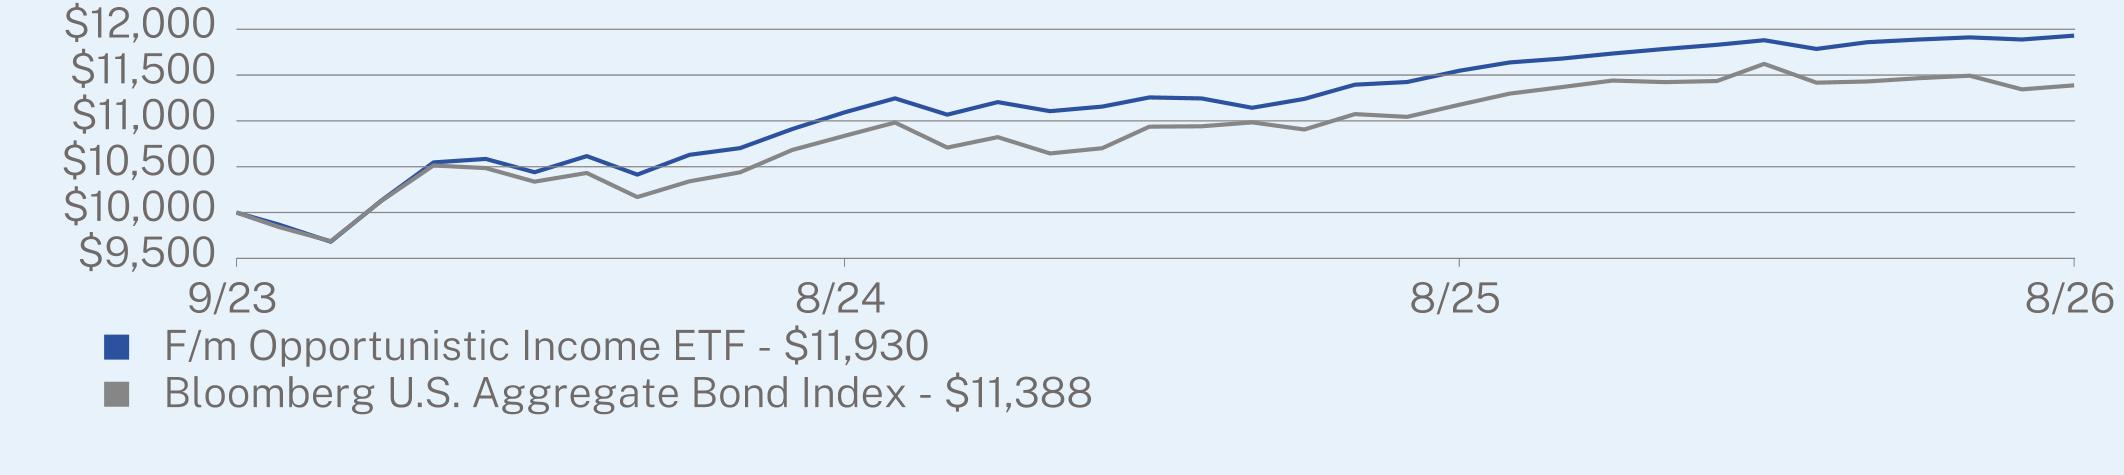
ANNUAL AVERAGE TOTAL RETURN (%)
|
|
1 Year
|
Since Inception
(09/05/2023) |
|
F/m Opportunistic Income ETF
|
3.32
|
6.08
|
|
Bloomberg U.S. Aggregate Bond Index
|
1.89
|
4.44
|
Visit https://www.fminvest.com/etfs/zhog-fm-opportunistic-income-etf for more recent performance information.
KEY FUND STATISTICS (as of August 31, 2026)
|
Net Assets
|
$46,250,968
|
|
Number of Holdings
|
61
|
|
Net Advisory Fee
|
$172,445
|
|
Portfolio Turnover
|
191%
|
|
30-Day SEC Yield
|
5.19%
|
|
30-Day SEC Yield Unsubsidized
|
5.19%
|
WHAT DID THE FUND INVEST IN? (as of August 31, 2026)
|
Top 10 Holdings
|
(% of Net Assets)
|
|
|
United States Treasury Note/Bond
|
15.9
|
%
|
|
F/m 3-Year Investment Grade Corporate Bond ETF
|
10.4
|
%
|
|
F/m High Yield 100 ETF
|
9.8
|
%
|
|
Federal National Mortgage Association
|
4.6
|
%
|
|
JP Morgan Mortgage Trust
|
3.4
|
%
|
|
Government National Mortgage Association
|
4.2
|
%
|
|
Provident Funding Mortgage Trust
|
3.6
|
%
|
|
Chase Mortgage Finance Corp.
|
2.9
|
%
|
|
Sequoia Mortgage Trust
|
2.8
|
%
|
|
WaMu Mortgage Pass Through Certificates
|
2.6
|
%
|
|
Top Sectors
|
(% of Net Assets)
|
|
|
Mortgage Securities
|
34.2
|
%
|
|
Government
|
15.9
|
%
|
|
Financials
|
8.2
|
%
|
|
Asset Backed Securities
|
5.6
|
%
|
|
Energy
|
4.6
|
%
|
|
Utilities
|
3.3
|
%
|
|
Health Care
|
1.8
|
%
|
|
Consumer Discretionary
|
1.7
|
%
|
|
Information Technology
|
1.4
|
%
|
|
Cash & Other
|
23.3
|
%
|
WHAT WERE THE FUND COSTS FOR THE PAST YEAR? (based on a hypothetical $10,000 investment)
|
Class Name
|
Costs of a $10,000 investment
|
Costs paid as a percentage of a $10,000 investment
|
|
Institutional Class
|
$100
|
0.90%
|
HOW DID THE FUND PERFORM LAST YEAR AND WHAT AFFECTED ITS PERFORMANCE?
For the fiscal year ended August 31, 2026, the Emerald Large Cap Focused Fund’s Institutional Class Shares outpaced the Russell 1000 Growth Index (the Index), returning 22.26% net of fees versus 10.56% for the Index. Our disciplined quantACTIVe process, which pairs fundamental acceleration (FScore) and momentum (MScore) signals with bottom-up judgment were a tailwind to performance over the fiscal year.
The path to that result was not linear. The Fund opened the year ahead of the Index in September 2025, then trailed in the fourth quarter of 2025 and the first quarter of 2026, when its concentrated technology exposure weighed on relative returns. It outpaced sharply in the second quarter of 2026, returning 28.29% against 16.60% for the Index. Our adherence to the process through the drawdown positioned the portfolio to capture the rebound.
Stock selection was the largest driver of the portfolio’s outperformance for the fiscal year, supported by a positive allocation effect. At the sector level, the portfolio exhibited strong relative outperformance from holdings within the information technology, consumer discretionary and consumer staples sectors, along with favorable allocation from an underweight to financials and real estate. The positive contribution from the aforementioned more than offset relative underperformance from stock selection within the industrials, materials, utilities and communication services sectors, as well as allocation headwinds from underweights to health care and energy and the portfolio’s cash and short-term Treasury position in a rising market.
The information technology sector was the portfolio’s largest positive contributor to return, driven by stock selection and an overweight position within the semiconductor, software and communications equipment industries. Thematically, companies positioned to benefit from AI-related data center capital spending, including accelerator and GPU designers, high-speed connectivity silicon, and memory and storage suppliers, were a strong tailwind to relative performance. Within software, strength in cybersecurity and data analytics platforms more than offset weakness in workflow software. Holdings within the communications equipment industry also contributed positively, as AI-driven capital expenditures provided a strong boost to companies supplying networking switches, lasers and optical components for datacenter applications. Our overweight to technology hardware, storage and peripherals was additive, although our holdings lagged the industry’s strongest memory and storage names.
Holdings within the consumer discretionary sector also contributed positively to performance, driven primarily by stock selection. At the industry level, the portfolio experienced its most significant relative outperformance within household durables and broadline retail, which more than offset weakness in footwear and apparel. In consumer staples, stock selection within food and convenience retail added to relative returns. Within communication services, a position in advertising technology partially offset weakness elsewhere in the sector.
The industrials sector was the largest detractor from relative performance, driven by stock selection in aerospace and defense, electrical equipment tied to power infrastructure, and air freight and logistics. Holdings within the entertainment
and interactive media industries weighed on communication services, while specialty chemicals and copper holdings detracted within materials, more than offsetting a positive contribution from steel. Electric utility positions and capital markets holdings in financials also detracted. Finally, the portfolio’s limited exposure to health care, where pharmaceutical and biotechnology shares rallied, and to energy were headwinds to relative performance.
|
Top Detractors
|
|
|
↓
|
Meta Platforms, Inc.
|
|
↓
|
Netflix, Inc.
|
|
↓
|
ServiceNow, Inc.
|
|
Top Contributors
|
|
|
↑
|
Advanced Micro Devices, Inc.
|
|
↑
|
Astera Labs, Inc.
|
|
↑
|
Apple, Inc.
|
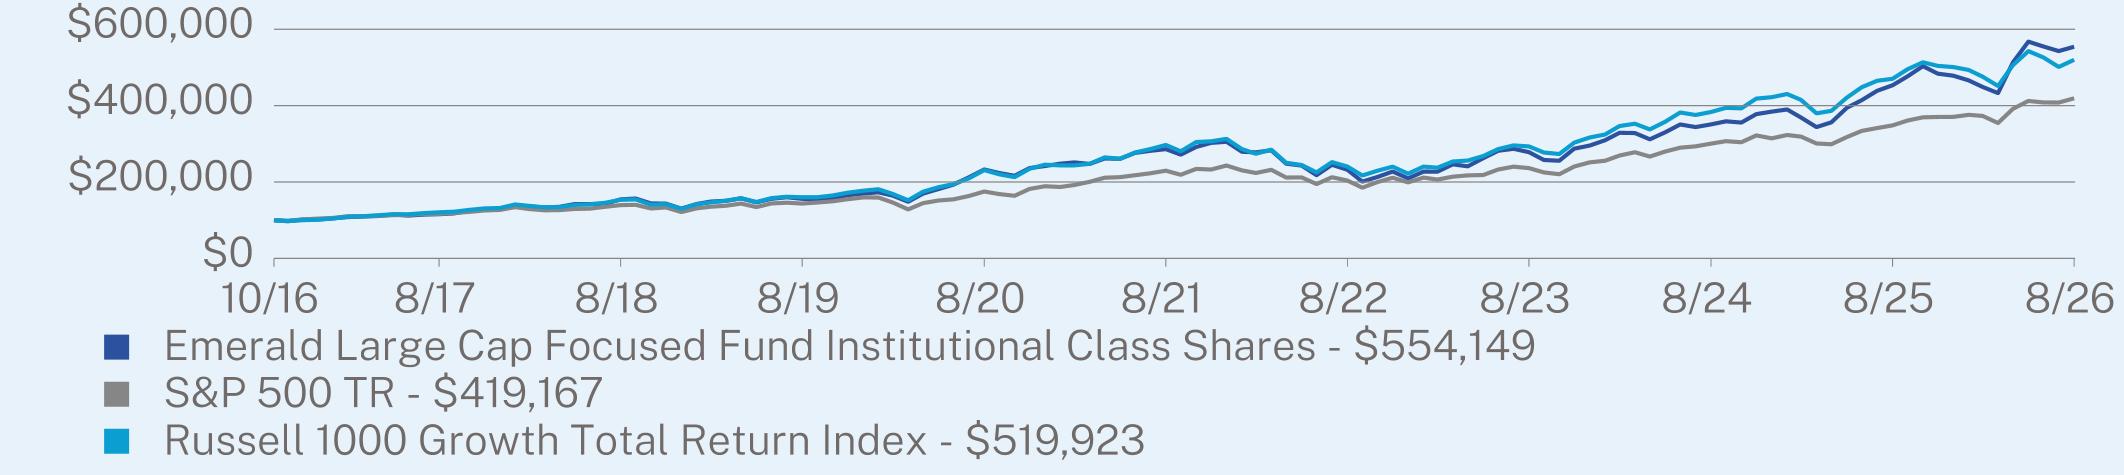
ANNUAL AVERAGE TOTAL RETURN (%)
|
|
1 Year
|
5 Year
|
Since Inception
(10/03/2016) |
|
Institutional Class Shares (without sales charge)
|
22.26
|
14.14
|
18.86
|
|
S&P 500 TR
|
20.38
|
12.79
|
15.56
|
|
Russell 1000 Growth Total Return Index
|
10.56
|
11.85
|
18.10
|
Visit https://www.fminvest.com/mutual-funds/iafmx-iaflx-fm-investments-large-cap-focused-funds for more recent performance information.
KEY FUND STATISTICS (as of August 31, 2026)
|
Net Assets
|
$96,788,768
|
|
Number of Holdings
|
22
|
|
Net Advisory Fee
|
$496,041
|
|
Portfolio Turnover
|
136%
|
WHAT DID THE FUND INVEST IN? (as of August 31, 2026)
|
Top 10 Issuers
|
(% of Net Assets)
|
|
|
Apple, Inc.
|
13.9
|
%
|
|
NVIDIA Corp.
|
11.4
|
%
|
|
First American Treasury Obligations Fund
|
6.4
|
%
|
|
Microsoft Corp.
|
5.8
|
%
|
|
Advanced Micro Devices, Inc.
|
5.4
|
%
|
|
Broadcom, Inc.
|
4.8
|
%
|
|
SharkNinja, Inc.
|
4.5
|
%
|
|
Lumentum Holdings, Inc.
|
4.4
|
%
|
|
Duke Energy Corp.
|
4.0
|
%
|
|
Arista Networks, Inc.
|
3.8
|
%
|
|
Top Sectors
|
(% of Net Assets)
|
|
|
Information Technology
|
50.1
|
%
|
|
Technology
|
11.4
|
%
|
|
Aerospace & Defense
|
4.6
|
%
|
|
Home & Office Products
|
4.5
|
%
|
|
Energy
|
4.0
|
%
|
|
Communication Services
|
3.8
|
%
|
|
Consumer Discretionary
|
3.7
|
%
|
|
Apparel & Textile Products
|
3.5
|
%
|
|
Cash & Other
|
14.4
|
%
|
Material Fund Changes:
This is a summary of certain changes to the Fund since September 1, 2025. For more complete information, you may review the Fund’s prospectus dated December 31, 2025, as amended which is available at https://www.fminvest.com/mutual-funds/iafmx-iaflx-fm-investments-large-cap-focused-funds or upon request by contacting the Fund at 1-800-292-6775.
Effective July 24, 2026, F/m Investments LLC and Emerald Mutual Fund Advisers Trust became co-advisers of the Fund. Prior to July 24, 2026, F/m Investments LLC was the sole adviser to the Fund.
Effective July 24, 2026, F/m Investments LLC and Emerald Mutual Fund Advisers Trust became co-advisers of the Fund. Prior to July 24, 2026, F/m Investments LLC was the sole adviser to the Fund.
Effective August 31, 2026, the Fund changed its name from F/m Investments Large Cap Focused Fund to Emerald Large Cap Focused Fund.
WHAT WERE THE FUND COSTS FOR THE PAST YEAR? (based on a hypothetical $10,000 investment)
|
Class Name
|
Costs of a $10,000 investment
|
Costs paid as a percentage of a $10,000 investment
|
|
Investor Class
|
$128
|
1.15%
|
HOW DID THE FUND PERFORM LAST YEAR AND WHAT AFFECTED ITS PERFORMANCE?
For the fiscal year ended August 31, 2026, the Emerald Large Cap Focused Fund’s Investor Class Shares outpaced the Russell 1000 Growth Index (the “Index”), returning 21.93% net of fees versus 10.56% for the Index. Our disciplined quantACTIVe process, which pairs fundamental acceleration (FScore) and momentum (MScore) signals with bottom-up judgment were a tailwind to performance over the fiscal year.
The path to that result was not linear. The Fund opened the year ahead of the Index in September 2025, then trailed in the fourth quarter of 2025 and the first quarter of 2026, when its concentrated technology exposure weighed on relative returns. It outpaced sharply in the second quarter of 2026, returning 28.28% against 16.60% for the Index. Our adherence to the process through the drawdown positioned the portfolio to capture the rebound.
Stock selection was the largest driver of the portfolio’s outperformance for the fiscal year, supported by a positive allocation effect. At the sector level, the portfolio exhibited strong relative outperformance from holdings within the information technology, consumer discretionary and consumer staples sectors, along with favorable allocation from an underweight to financials and real estate. The positive contribution from the aforementioned more than offset relative underperformance from stock selection within the industrials, materials, utilities and communication services sectors, as well as allocation headwinds from underweights to health care and energy and the portfolio’s cash and short-term Treasury position in a rising market.
The information technology sector was the portfolio’s largest positive contributor to return, driven by stock selection and an overweight position within the semiconductor, software and communications equipment industries. Thematically, companies positioned to benefit from AI-related data center capital spending, including accelerator and GPU designers, high-speed connectivity silicon, and memory and storage suppliers, were a strong tailwind to relative performance. Within software, strength in cybersecurity and data analytics platforms more than offset weakness in workflow software. Holdings within the communications equipment industry also contributed positively, as AI-driven capital expenditures provided a strong boost to companies supplying networking switches, lasers and optical components for datacenter applications. Our overweight to technology hardware, storage and peripherals was additive, although our holdings lagged the industry’s strongest memory and storage names.
Holdings within the consumer discretionary sector also contributed positively to performance, driven primarily by stock selection. At the industry level, the portfolio experienced its most significant relative outperformance within household durables and broadline retail, which more than offset weakness in footwear and apparel. In consumer staples, stock selection within food and convenience retail added to relative returns. Within communication services, a position in advertising technology partially offset weakness elsewhere in the sector.
The industrials sector was the largest detractor from relative performance, driven by stock selection in aerospace and defense, electrical equipment tied to power infrastructure, and air freight and logistics. Holdings within the entertainment
and interactive media industries weighed on communication services, while specialty chemicals and copper holdings detracted within materials, more than offsetting a positive contribution from steel. Electric utility positions and capital markets holdings in financials also detracted. Finally, the portfolio’s limited exposure to health care, where pharmaceutical and biotechnology shares rallied, and to energy were headwinds to relative performance.
|
Top Detractors
|
|
|
↓
|
Meta Platforms, Inc.
|
|
↓
|
Netflix, Inc.
|
|
↓
|
ServiceNow, Inc.
|
|
Top Contributors
|
|
|
↑
|
Advanced Micro Devices, Inc.
|
|
↑
|
Astera Labs, Inc.
|
|
↑
|
Apple, Inc.
|
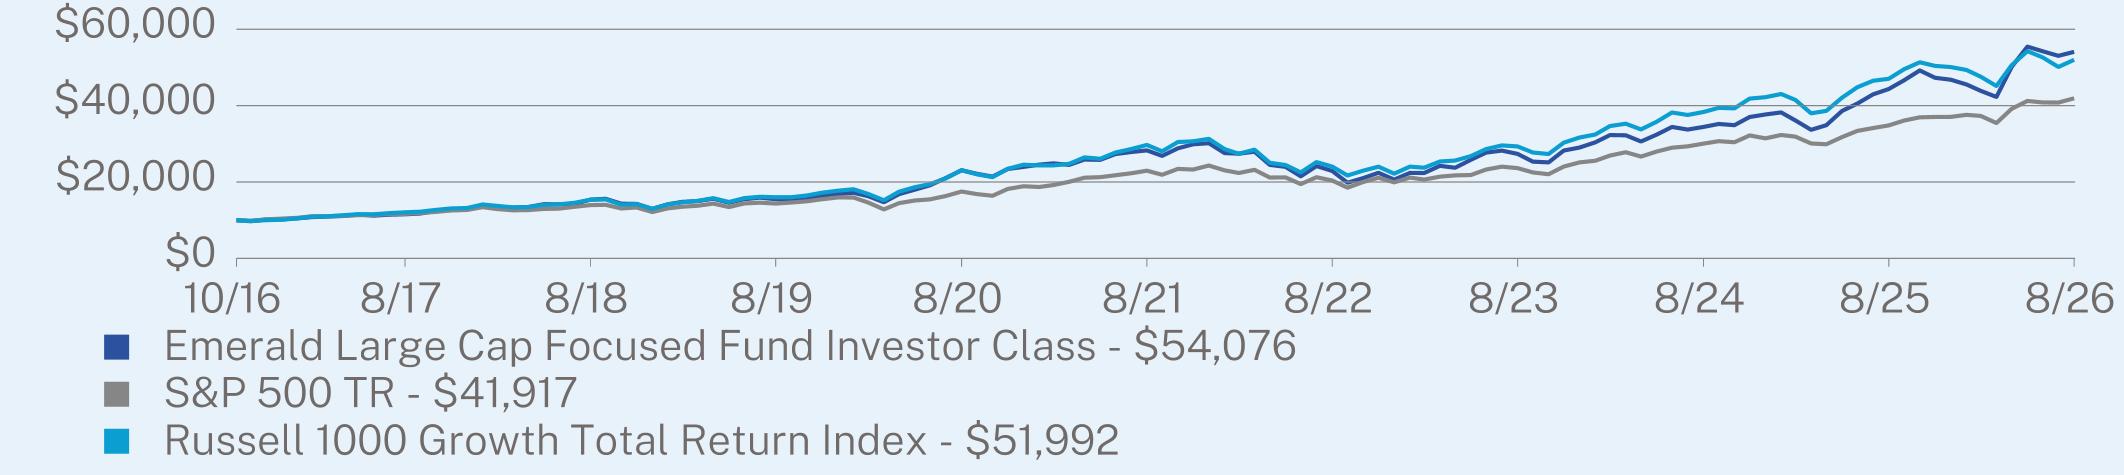
ANNUAL AVERAGE TOTAL RETURN (%)
|
|
1 Year
|
5 Year
|
Since Inception
(10/03/2016) |
|
Investor Class (without sales charge)
|
21.93
|
13.85
|
18.57
|
|
S&P 500 TR
|
20.38
|
12.79
|
15.56
|
|
Russell 1000 Growth Total Return Index
|
10.56
|
11.85
|
18.10
|
Visit https://www.fminvest.com/mutual-funds/iafmx-iaflx-fm-investments-large-cap-focused-funds for more recent performance information.
KEY FUND STATISTICS (as of August 31, 2026)
|
Net Assets
|
$96,788,768
|
|
Number of Holdings
|
22
|
|
Net Advisory Fee
|
$496,041
|
|
Portfolio Turnover
|
136%
|
WHAT DID THE FUND INVEST IN? (as of August 31, 2026)
|
Top 10 Issuers
|
(% of Net Assets)
|
|
|
Apple, Inc.
|
13.9
|
%
|
|
NVIDIA Corp.
|
11.4
|
%
|
|
First American Treasury Obligations Fund
|
6.4
|
%
|
|
Microsoft Corp.
|
5.8
|
%
|
|
Advanced Micro Devices, Inc.
|
5.4
|
%
|
|
Broadcom, Inc.
|
4.8
|
%
|
|
SharkNinja, Inc.
|
4.5
|
%
|
|
Lumentum Holdings, Inc.
|
4.4
|
%
|
|
Duke Energy Corp.
|
4.0
|
%
|
|
Arista Networks, Inc.
|
3.8
|
%
|
|
Top Sectors
|
(% of Net Assets)
|
|
|
Information Technology
|
50.1
|
%
|
|
Technology
|
11.4
|
%
|
|
Aerospace & Defense
|
4.6
|
%
|
|
Home & Office Products
|
4.5
|
%
|
|
Energy
|
4.0
|
%
|
|
Communication Services
|
3.8
|
%
|
|
Consumer Discretionary
|
3.7
|
%
|
|
Apparel & Textile Products
|
3.5
|
%
|
|
Cash & Other
|
14.4
|
%
|
Material Fund Changes:
This is a summary of certain changes to the Fund since September 1, 2025. For more complete information, you may review the Fund’s prospectus dated December 31, 2025, as amended which is available at https://www.fminvest.com/mutual-funds/iafmx-iaflx-fm-investments-large-cap-focused-funds or upon request by contacting the Fund at 1-800-292-6775.
Effective July 24, 2026, F/m Investments LLC and Emerald Mutual Fund Advisers Trust became co-advisers of the Fund. Prior to July 24, 2026, F/m Investments LLC was the sole adviser to the Fund.
Effective July 24, 2026, F/m Investments LLC and Emerald Mutual Fund Advisers Trust became co-advisers of the Fund. Prior to July 24, 2026, F/m Investments LLC was the sole adviser to the Fund.
Effective August 31, 2026, the Fund changed its name from F/m Investments Large Cap Focused Fund to Emerald Large Cap Focused Fund.
WHAT WERE THE FUND COSTS FOR THE PAST YEAR? (based on a hypothetical $10,000 investment)
|
Fund Name
|
Costs of a $10,000 investment
|
Costs paid as a percentage of a $10,000 investment
|
|
F/m Emerald Life Sciences Innovation ETF
|
$71
|
0.54%
|
HOW DID THE FUND PERFORM LAST YEAR AND WHAT AFFECTED ITS PERFORMANCE?
The Fund’s total return for the twelve months ended August 31, 2026 was 64.32% at NAV, materially outpacing the benchmark Russell 3000 Health Care Index’s total return of 28.58%.
WHAT FACTORS INFLUENCED PERFORMANCE?
The healthcare sector outperformed the broader market, with the healthcare sector of the Russell 3000 Index gaining 28.58% as compared to the Russell 3000 Index which returned 20.10%. The biotechnology industry led performance, with the biotechnology industry of the Russell 3000 (+66.18%) posting the strongest absolute returns within the sector. A strong biotech M&A backdrop, more stability at the FDA, a robust clinical catalyst pipeline, encouraging clinical progress, a solid pace of novel drug approvals by the FDA, and the ongoing successful commercialization of recently approved drugs have collectively contributed to the improving sentiment.
The Fund’s outperformance was driven by a combination of strong stock selection and the portfolio’s relative overweight position to the biotechnology industry, which represented approximately 58.87% of the portfolio for the period. The Fund’s portfolio benefited from clinical development progress, new drug approvals by the FDA, and the continued strong pace of M&A for therapeutics companies. The strong performance of the portfolio’s molecular diagnostic holdings held inside of the biotechnology industry also contributed to the portfolio’s relative outperformance. Holdings and positioning within the medical equipment and healthcare services industries, which represented 17.67% and 3.08% respectively, of the portfolio on average for the period also contributed positively to performance.
|
Top Contributors
|
|
|
↑
|
Travere Therapeutics, Inc. (TVTX)
|
|
↑
|
Cogent Biosciences, Inc. (COGT)
|
|
↑
|
Spyre Therapeutics, Inc. (SYRE)
|
|
Top Detractors
|
|
|
↓
|
Soleno Therapeutics Inc. (SLNO)
|
|
↓
|
TransMedics Group, Inc. (TMDX)
|
|
↓
|
Wave Life Sciences, Inc. (WVE)
|
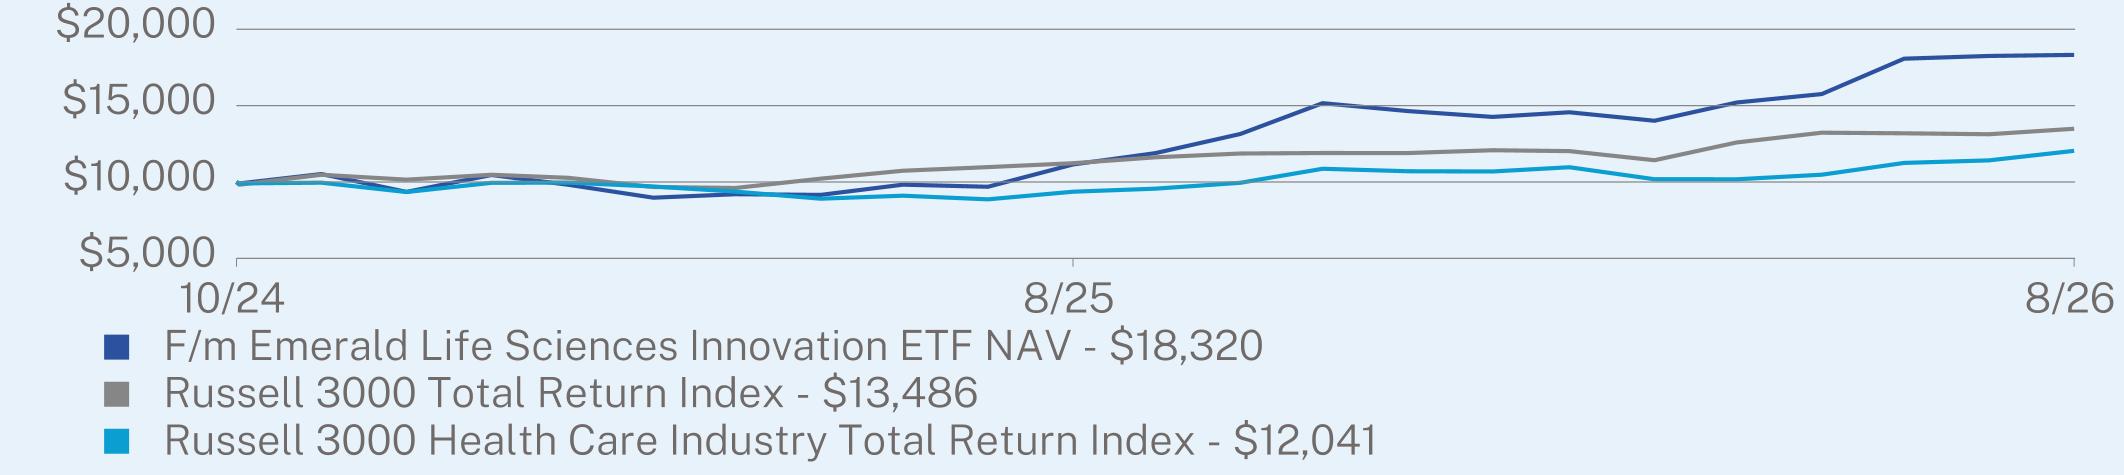
ANNUAL AVERAGE TOTAL RETURN (%)
|
|
1 Year
|
Since Inception
(10/30/2024) |
|
F/m Emerald Life Sciences Innovation ETF NAV
|
64.32
|
39.07
|
|
Russell 3000 Total Return Index
|
20.10
|
17.70
|
|
Russell 3000 Health Care Industry Total Return Index
|
28.58
|
10.65
|
Visit https://www.emeraldetfs.com/lfsc/ for more recent performance information.
KEY FUND STATISTICS (as of August 31, 2026)
|
Net Assets
|
$126,274,717
|
|
Number of Holdings
|
38
|
|
Net Advisory Fee
|
$520,610
|
|
Portfolio Turnover
|
24%
|
WHAT DID THE FUND INVEST IN? (as of August 31, 2026)
|
Top 10 Holdings
|
(% of Net Assets)
|
|
|
Travere Therapeutics, Inc.
|
8.7
|
%
|
|
Corcept Therapeutics, Inc.
|
6.7
|
%
|
|
Spyre Therapeutics, Inc.
|
6.7
|
%
|
|
LivaNova PLC
|
6.6
|
%
|
|
Cogent Biosciences, Inc.
|
6.5
|
%
|
|
Mirum Pharmaceuticals, Inc.
|
4.3
|
%
|
|
BillionToOne, Inc.
|
3.9
|
%
|
|
Guardant Health, Inc.
|
3.8
|
%
|
|
Cytokinetics, Inc.
|
3.5
|
%
|
|
United Therapeutics Corp.
|
3.3
|
%
|
|
Top Sectors
|
(% of Net Assets)
|
|
|
Health Care
|
99.6
|
%
|
|
Cash & Other
|
0.4
|
%
|
WHAT WERE THE FUND COSTS FOR THE PAST YEAR? (based on a hypothetical $10,000 investment)
|
Fund Name
|
Costs of a $10,000 investment
|
Costs paid as a percentage of a $10,000 investment
|
|
F/m Ultrashort Treasury Inflation-Protected Security (TIPS) ETF
|
$17
|
0.17%
|
HOW DID THE FUND PERFORM LAST YEAR AND WHAT AFFECTED ITS PERFORMANCE?
The investment objective of the Fund is to seek investment results that correspond (before fees and expenses) generally to the price and yield performance of the Bloomberg U.S. Ultrashort TIPS 1-13 Months Total Return Unhedged USD Index (the “Index”). The Fund returned 3.81% for the year, versus the Index’s return of 30.66%. Dividends represented the majority of the returns, with the price returning -0.30% for the year.
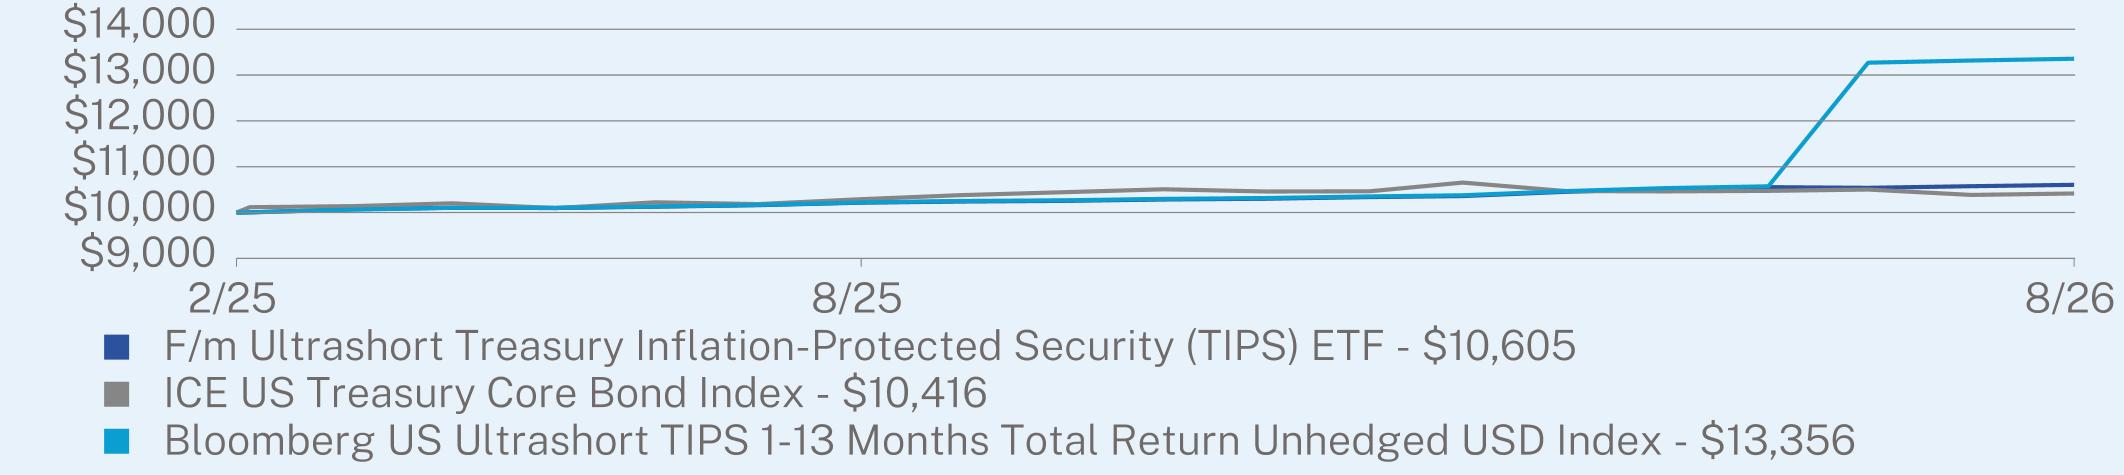
ANNUAL AVERAGE TOTAL RETURN (%)
|
|
1 Year
|
Since Inception
(02/24/2025) |
|
F/m Ultrashort Treasury Inflation-Protected Security (TIPS) ETF
|
3.81
|
3.95
|
|
ICE US Treasury Core Bond Index
|
1.21
|
2.73
|
|
Bloomberg US Ultrashort TIPS 1-13 Months Total Return Unhedged USD Index
|
30.66
|
21.05
|
Visit https://www.fminvest.com/rbil for more recent performance information.
KEY FUND STATISTICS (as of August 31, 2026)
|
Net Assets
|
$152,901,139
|
|
Number of Holdings
|
5
|
|
Net Advisory Fee
|
$141,393
|
|
Portfolio Turnover
|
90%
|
|
30-Day SEC Yield
|
-1.03
|
|
30-Day SEC Yield Unsubsidized
|
-1.03
|
WHAT DID THE FUND INVEST IN? (as of August 31, 2026)
|
Top Sectors
|
(% of Net Assets)
|
|
|
Government
|
99.9
|
%
|
|
Cash & Other
|
0.1
|
%
|
|
Top 10 Holdings
|
(% of Net Assets)
|
|
|
United States Treasury Inflation Indexed Bonds
|
99.9
|
%
|
Material Fund Changes:
This is a summary of certain changes to the Fund since September 1, 2025. For more complete information, you may review the Fund’s prospectus dated December 31, 2025, as amended which is available at https://www.fminvest.com/rbil or upon request by contacting the Fund at 1-800-617-0004.
Reduction of the Fund’s Unitary Management Fee:
Effective September 15, 2025, F/m Investments LLC, the Fund’s investment adviser, reduced the Fund’s unitary management fee from 0.25% to 0.17%.
This report describes changes to the Fund that occurred during the reporting period.
WHAT WERE THE FUND COSTS FOR THE PAST YEAR? (based on a hypothetical $10,000 investment)
|
Fund Name
|
Costs of a $10,000 investment
|
Costs paid as a percentage of a $10,000 investment
|
|
F/m Compoundr High Yield Bond ETF
|
$27
|
0.27%
|
HOW DID THE FUND PERFORM LAST YEAR AND WHAT AFFECTED ITS PERFORMANCE?
The Fund seeks investment results that correspond (before fees and expenses) generally to the price and yield performance of the Nasdaq Compoundr High Yield Corporate Bond Index (the “Index”). The Index is designed to reflect the total return of the U.S. High Yield Bond market. The Fund tracks the Index while seeking to minimize or eliminate distributions. For the trailing twelve-month (TTM) period ended August 31, 2026, the Fund returned 2.96% based on NAV and generated a cumulative return of 3.75% since its inception on August 11, 2025. For the fiscal year, interest rates rose with the yield to maturity of the 5-Year US Treasury rising from 3.72% to 4.50% in the period. This created a drag on our performance (prices fall as yields rise), but the income of the fund and stable credit spreads helped offset this headwind.
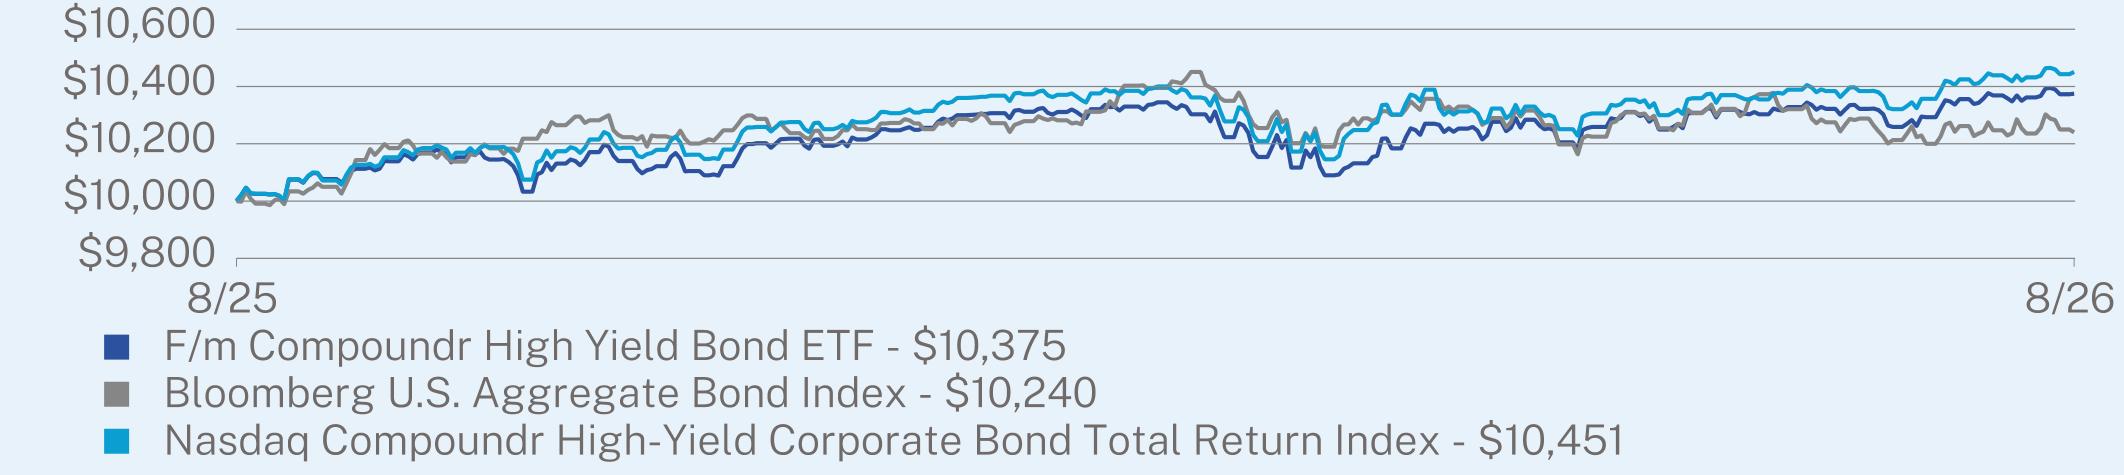
ANNUAL AVERAGE TOTAL RETURN (%)
|
|
1 Year
|
Since Inception
(08/11/2025) |
|
F/m Compoundr High Yield Bond ETF
|
2.96
|
3.55
|
|
Bloomberg U.S. Aggregate Bond Index
|
1.89
|
2.27
|
|
Nasdaq Compoundr High-Yield Corporate Bond Total Return Index
|
3.76
|
4.27
|
Visit https://www.fminvest.com/etfs/cphy-fm-compoundr-high-yield-etf for more recent performance information.
KEY FUND STATISTICS (as of August 31, 2026)
|
Net Assets
|
$3,371,880
|
|
Number of Holdings
|
1
|
|
Net Advisory Fee
|
$9,294
|
|
Portfolio Turnover
|
347%
|
WHAT DID THE FUND INVEST IN? (as of August 31, 2026)
|
Top Sectors
|
(% of Net Assets)
|
|
|
Exchange Traded Funds
|
99.8
|
%
|
|
Cash & Other
|
0.2
|
%
|
|
Top 10 Holdings
|
(% of Net Assets)
|
|
|
Invesco BulletShares 2030 High Yield Corporate Bond ETF
|
99.8
|
%
|
|
Cash & Other
|
0.2
|
%
|
Changes to Shareholder Fees:
From September 1, 2025 to February 20, 2026, the Fund compensated the Adviser with a unitary management fee for its services at an annual rate of 0.49% of the Fund’s average daily net assets. Effective as of October 1, 2025 and through February 20, 2026, the Adviser contractually agreed to waive 0.24% of the advisory fee for the Fund. Effective February 20, 2026, a permanent advisory fee reduction was implemented for the Fund, reducing the unitary management fee to an annual rate of 0.25% of the Fund’s average daily net assets.
This report describes changes to the Fund that occurred during the reporting period.
WHAT WERE THE FUND COSTS FOR THE PAST YEAR? (based on a hypothetical $10,000 investment)
|
Fund Name
|
Costs of a $10,000 investment
|
Costs paid as a percentage of a $10,000 investment
|
|
F/m Compoundr U.S. Aggregate Bond ETF
|
$25
|
0.25%
|
HOW DID THE FUND PERFORM LAST YEAR AND WHAT AFFECTED ITS PERFORMANCE?
The Fund seeks investment results that correspond (before fees and expenses) generally to the price and yield performance of the Nasdaq Compoundr U.S. Aggregate Bond Index (the “Index”). The Index is designed to reflect the total return of the U.S. Aggregate Bond market. The Fund tracks the Index while seeking to minimize or eliminate distributions. For the trailing twelve-month (TTM) period ended August 31, 2026, the Fund returned 1.12% based on NAV and generated a cumulative return of 1.56% since its inception on August 11, 2025. For the fiscal year, interest rates rose with the yield to maturity of the 10-Year US Treasury rising from 4.23% to 4.75% in the period. This created a drag on our performance (prices fall as yields rise), but the income of the fund and stable credit spreads helped offset this headwind.
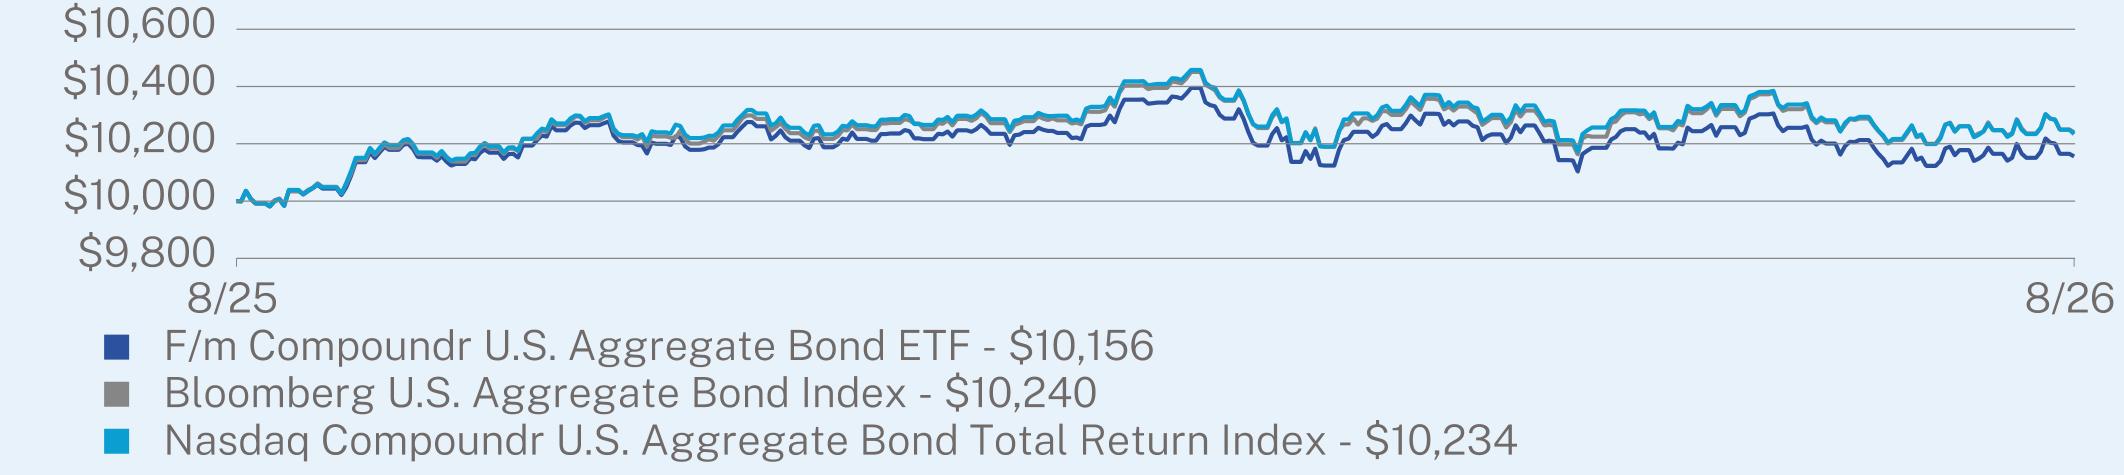
ANNUAL AVERAGE TOTAL RETURN (%)
|
|
1 Year
|
Since Inception
(08/11/2025) |
|
F/m Compoundr U.S. Aggregate Bond ETF
|
1.12
|
1.48
|
|
Bloomberg U.S. Aggregate Bond Index
|
1.89
|
2.27
|
|
Nasdaq Compoundr U.S. Aggregate Bond Total Return Index
|
1.86
|
2.22
|
Visit https://www.fminvest.com/etfs/cpag-fm-compoundr-us-aggregate-bond-etf for more recent performance information.
KEY FUND STATISTICS (as of August 31, 2026)
|
Net Assets
|
$150,314,172
|
|
Number of Holdings
|
1
|
|
Net Advisory Fee
|
$223,176
|
|
Portfolio Turnover
|
161%
|
WHAT DID THE FUND INVEST IN? (as of August 31, 2026)
|
Top Sectors
|
(% of Net Assets)
|
|
|
Exchange Traded Funds
|
99.9
|
%
|
|
Cash & Other
|
0.1
|
%
|
|
Top 10 Holdings
|
(% of Net Assets)
|
|
|
Dimensional Core Fixed Income ETF
|
99.9
|
%
|
|
Cash & Other
|
0.1
|
%
|
Changes to Shareholder Fees:
From September 1, 2025 to February 20, 2026 the Fund compensated the Adviser with a unitary management fee for its services at an annual rate of 0.39% of the average daily net assets of the Fund. Effective as of October 1, 2025 and through February 20, 2026, the Adviser contractually agreed to waive 0.14% of the advisory fee for the Fund. Effective February 20, 2026, a permanent advisory fee reduction was implemented for the Fund, reducing the unitary management fee to an annual rate of 0.25% of the Fund’s average daily net assets.
WHAT WERE THE FUND COSTS FOR THE PAST YEAR? (based on a hypothetical $10,000 investment)
|
Fund Name
|
Costs of a $10,000 investment
|
Costs paid as a percentage of a $10,000 investment
|
|
F/m High Yield 100 ETF
|
$40
|
0.39%
|
HOW DID THE FUND PERFORM LAST YEAR AND WHAT AFFECTED ITS PERFORMANCE?
The Fund seeks to track the investments of an index composed of U.S. dollar denominated, below investment-grade corporate bonds, as represented by the Bloomberg U.S. High Yield Top 100 Quality Select Equal Weighted Index (the “Index”). For the trailing twelve-month (TTM) period ended August 31, 2026, the Fund returned 4.59% based on NAV and generated a cumulative return of 11.16% since its inception on April 14, 2025. High yield market conditions during the period were influenced by changes in government bond yields and geopolitical developments. During the TTM period, performance benefited from the carry generated by the Fund’s exposure to higher-coupon bonds, while favorable corporate credit fundamentals and technical conditions in the high yield market also contributed to performance. The Fund returned 0.90% in August 2026. As of August 31, 2026, the Fund’s option-adjusted spread (OAS) was 214 basis points, compared with a TTM high of 293 basis points on March 30, 2026. The Fund’s 30-Day SEC Yield was 6.39%, while its yield to worst (YTW) was 6.82%. The Fund’s portfolio construction emphasizes larger high yield corporate issuers and higher-coupon bonds, with a focus on senior securities that have higher priority in an issuer’s capital structure. Larger issuers may have greater operational scale, broader access to capital markets and other sources of financing, and more diversified businesses. The combination of higher capital structure priority and the financial flexibility of larger issuers may provide greater resilience to the Fund across a range of market and economic conditions, although there can be no assurance that it will do so.
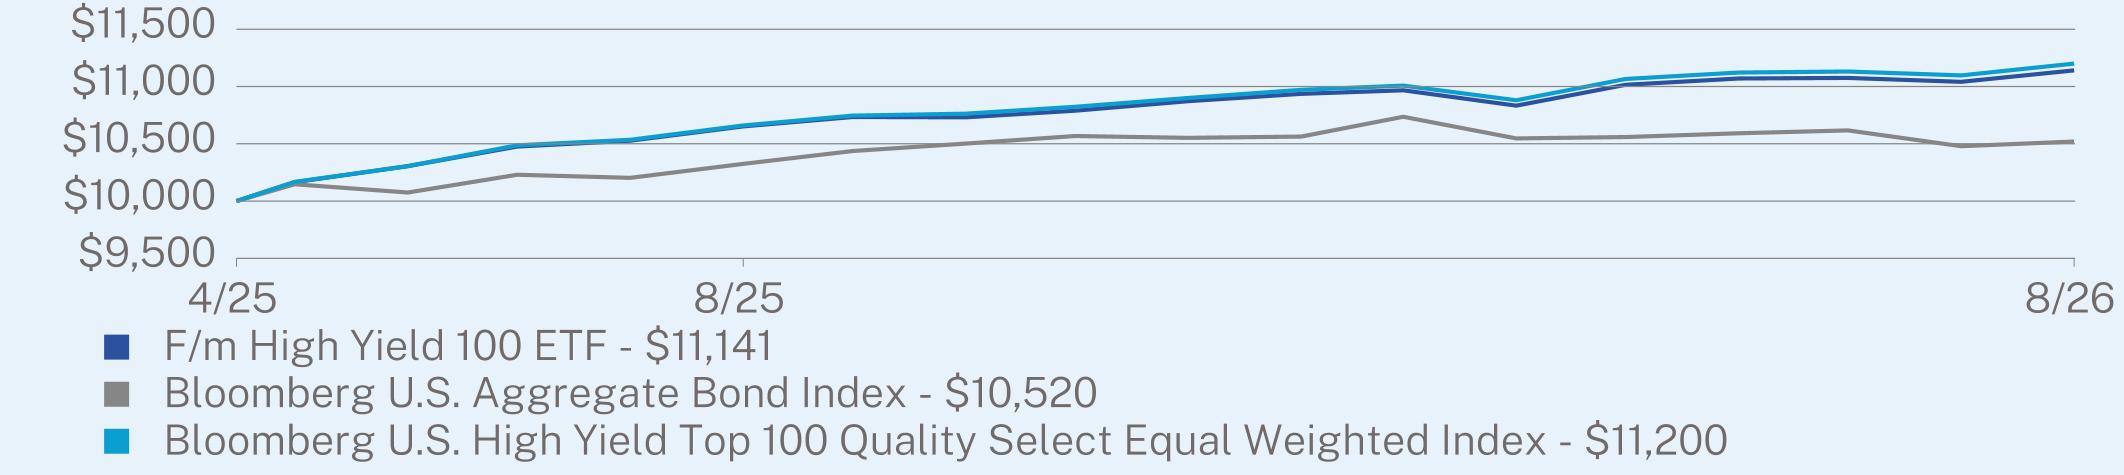
ANNUAL AVERAGE TOTAL RETURN (%)
|
|
1 Year
|
Since Inception
(04/14/2025) |
|
F/m High Yield 100 ETF
|
4.59
|
8.14
|
|
Bloomberg U.S. Aggregate Bond Index
|
1.89
|
3.74
|
|
Bloomberg U.S. High Yield Top 100 Quality Select Equal Weighted Index
|
5.07
|
8.55
|
Visit https://www.fminvest.com/ztop for more recent performance information.
KEY FUND STATISTICS (as of August 31, 2026)
|
Net Assets
|
$15,935,273
|
|
Number of Holdings
|
101
|
|
Net Advisory Fee
|
$67,760
|
|
Portfolio Turnover
|
43%
|
|
30-Day SEC Yield
|
6.39%
|
|
30-Day SEC Yield Unsubsidized
|
6.39%
|
WHAT DID THE FUND INVEST IN? (as of August 31, 2026)
|
Top Sectors
|
(% of Net Assets)
|
|
|
Communications
|
21.2
|
%
|
|
Consumer Discretionary
|
18.7
|
%
|
|
Financials
|
14.8
|
%
|
|
Materials
|
9.9
|
%
|
|
Energy
|
9.8
|
%
|
|
Health Care
|
8.0
|
%
|
|
Industrials
|
6.8
|
%
|
|
Technology
|
3.9
|
%
|
|
Utilities
|
3.0
|
%
|
|
Cash & Other
|
3.9
|
%
|
|
Top 10 Holdings
|
(% of Net Assets)
|
|
|
Olympus Water US Holding Corp.
|
1.0
|
%
|
|
Discovery Communications LLC
|
1.0
|
%
|
|
Acrisure LLC / Acrisure Finance, Inc.
|
1.0
|
%
|
|
Cleveland-Cliffs, Inc.
|
1.0
|
%
|
|
ZF North America Capital, Inc.
|
1.0
|
%
|
|
Directv Financing LLC / Directv Financing Co.-Obligor, Inc.
|
1.0
|
%
|
|
XPLR Infrastructure Operating Partners LP
|
1.0
|
%
|
|
Wynn Macau Ltd.
|
1.0
|
%
|
|
1011778 BC ULC / New Red Finance, Inc.
|
1.0
|
%
|
|
Herc Holdings, Inc.
|
1.0
|
%
|
WHAT WERE THE FUND COSTS FOR THE PERIOD? (based on a hypothetical $10,000 investment)
|
Class Name
|
Costs of a $10,000 investment*
|
Costs paid as a percentage of a $10,000 investment**
|
|
Institutional Class
|
$8
|
0.15%
|
HOW DID THE FUND PERFORM DURING THE PERIOD AND WHAT AFFECTED ITS PERFORMANCE?
The Institutional Class shares of the Fund were incepted on February 11, 2026. The investment objective of the Fund is to seek investment results that correspond (before fees and expenses) generally to the price and yield performance of the Bloomberg US Treasury Bellwether 3M Total Return USD Unhedged Index (the “Index”). Since inception of the Institutional Class shares of the Fund, the Fund has performed well, returning 2.00% versus the Index’s return of 2.02%. Dividends represented the majority of the returns, with the price returning -0.11%. The Fund’s securities lending program has generated additional income and mitigated the cost of running the Fund.
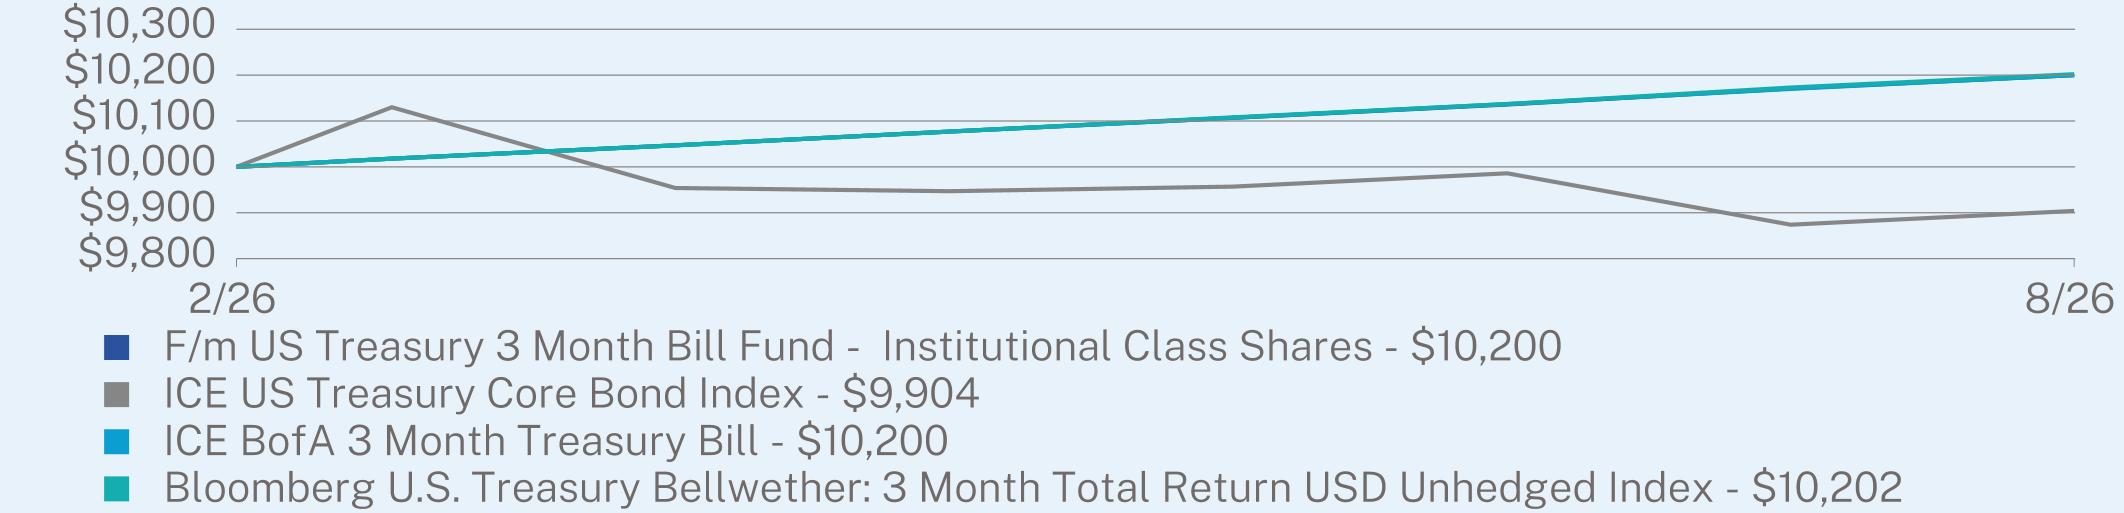
ANNUAL AVERAGE TOTAL RETURN (%)
|
|
Since Share Class Inception
(02/11/2026) |
|
Institutional Class Shares (without sales charge)
|
2.00
|
|
ICE US Treasury Core Bond Index
|
-0.96
|
|
ICE BofA 3 Month Treasury Bill
|
2.00
|
|
Bloomberg U.S. Treasury Bellwether: 3 Month Total Return USD Unhedged Index
|
2.02
|
Visit https://www.fminvest.com/mutual-funds/tbfmx-fm-us-treasury-3-month-bill-fund for more recent performance information.
KEY FUND STATISTICS (as of August 31, 2026)
|
Net Assets
|
$7,193,791,413
|
|
Number of Holdings
|
2
|
|
Net Advisory Fee
|
$10,061,182
|
|
Portfolio Turnover
|
0%
|
|
30-Day SEC Yield
|
3.62%
|
|
30-Day SEC Yield Unsubsidized
|
3.62%
|
WHAT DID THE FUND INVEST IN? (as of August 31, 2026)
|
Top 10 Holdings
|
(% of Net Assets)
|
|
|
United States Treasury Bill
|
100.0
|
%
|
|
Top Sectors
|
(% of Net Assets)
|
|
|
Government
|
100.0
|
%
|
Effective February 11, 2026, the Fund converted to a multi-class fund structure and its name changed to the F/m US Treasury 3 Month Bill Fund. The Fund now offers an exchange-traded class of shares (ETF Class Shares) that are listed and traded on a national securities exchange, as well as a mutual fund class of shares (Institutional Class Shares) that operate as a traditional mutual fund. The two share classes are offered through separate prospectuses. The ETF Class Shares, unlike the Institutional Class Shares, are not individually redeemable.
WHAT WERE THE FUND COSTS FOR THE CURRENT REPORTING PERIOD? (based on a hypothetical $10,000 investment)
|
Fund Name
|
Costs of a $10,000 investment*
|
Costs paid as a percentage of a $10,000 investment**
|
|
F/m Ultrashort Tax-Free Municipal ETF
|
$28
|
0.30%
|
HOW DID THE FUND PERFORM DURING THE CURRENT REPORTING PERIOD AND WHAT AFFECTED ITS PERFORMANCE?
The Fund was incepted on September 29, 2025. The investment objective of the Fund is to seek investment results that correspond (before fees and expenses) generally to the price and yield performance of the Bloomberg Municipal Bond Currently Callable Index. The Fund outperformed the Bloomberg Municipal Bond Total Return Index by 134 basis points for the current reporting period. The primary reason for the outperformance was the limited principal loss of the Fund compared to the principal depreciation of the Bloomberg Municipal Bond Total Return Index. The Fund underperformed the Bloomberg Municipal Bond Currently Callable Index by 59 basis points for the current reporting period. The primary reason for the underperformance was the underweighting of bonds callable in 60-90 days. The Fund’s overweight in bonds callable in 30 days or less limited the slight principal appreciation of the short-term market.
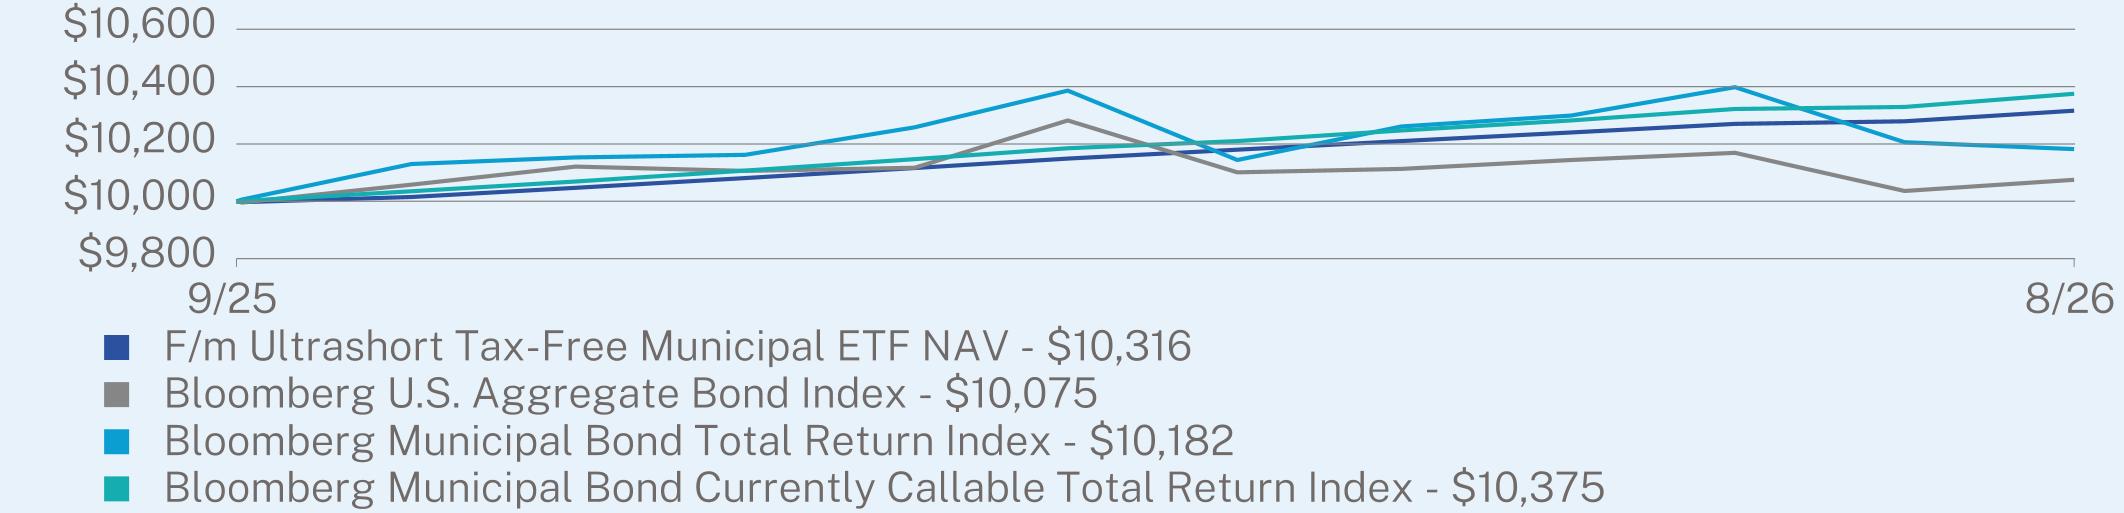
ANNUAL AVERAGE TOTAL RETURN (%)
|
|
Since Inception
(09/29/2025) |
|
F/m Ultrashort Tax-Free Municipal ETF NAV
|
3.16
|
|
Bloomberg U.S. Aggregate Bond Index
|
0.75
|
|
Bloomberg Municipal Bond Total Return Index
|
1.82
|
|
Bloomberg Municipal Bond Currently Callable Total Return Index
|
3.75
|
Visit https://www.fminvest.com/zmun for more recent performance information.
KEY FUND STATISTICS (as of August 31, 2026)
|
Net Assets
|
$34,453,426
|
|
Number of Holdings
|
172
|
|
Net Advisory Fee
|
$50,862
|
|
Portfolio Turnover
|
88%
|
|
30-Day SEC Yield
|
2.79%
|
|
30-Day SEC Yield Unsubsidized
|
2.79%
|
WHAT DID THE FUND INVEST IN? (as of August 31, 2026)
|
Top 10 Holdings
|
(% of Net Assets)
|
|
|
New York State Dormitory Authority
|
5.9
|
%
|
|
State of California
|
3.9
|
%
|
|
California Health Facilities Financing Authority
|
3.4
|
%
|
|
Indiana Finance Authority
|
3.0
|
%
|
|
South Dakota Health & Educational Facilities Authority
|
2.9
|
%
|
|
Commonwealth of Pennsylvania
|
2.8
|
%
|
|
Wisconsin Health & Educational Facilities Authority
|
2.7
|
%
|
|
Illinois Finance Authority
|
2.2
|
%
|
|
University of Kentucky
|
2.1
|
%
|
|
Lincoln County Consolidated School District No 207 Davenport
|
2.1
|
%
|
|
Top Sectors
|
(% of Net Assets)
|
|
|
US Municipal
|
98.6
|
%
|
|
Cash & Other
|
1.4
|
%
|
WHAT WERE THE FUND COSTS FOR THE CURRENT REPORTING PERIOD? (based on a hypothetical $10,000 investment)
|
Fund Name
|
Costs of a $10,000 investment*
|
Costs paid as a percentage of a $10,000 investment**
|
|
F/m Accumulator Ultrashort U.S. Treasury Fund
|
$3
|
0.15%
|
HOW DID THE FUND PERFORM DURING THE CURRENT REPORTING PERIOD AND WHAT AFFECTED ITS PERFORMANCE?
The Fund commenced investment operations on June 10, 2026. The investment objective of the Fund is to generate total return through exposure to U.S. Treasury securities with remaining maturities between zero (0) to twelve (12) months while minimizing dividend and/or distribution payments. The Fund performed well since inception, returning 0.75% versus the Bloomberg U.S. Aggregate Bond Index, which returned -0.23%. The Fund did not generate sufficient net investment income to require a distribution during the current reporting period.
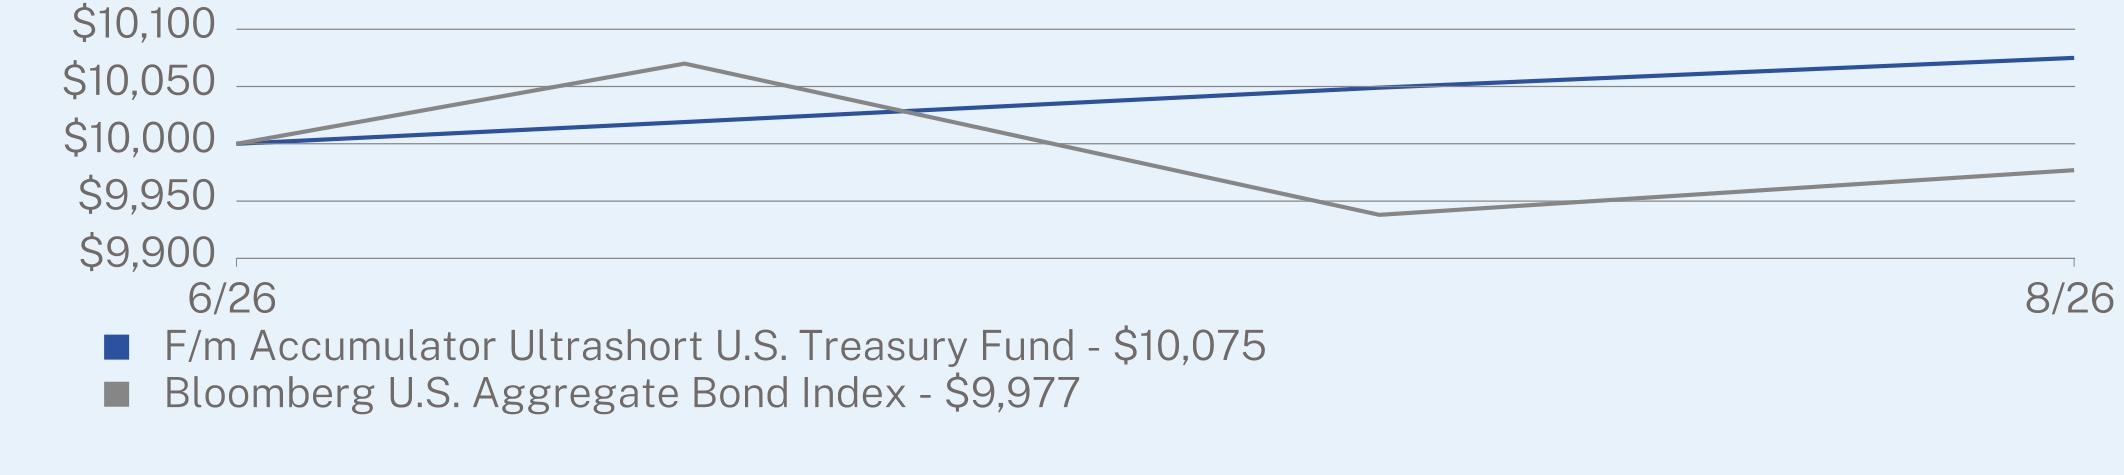
ANNUAL AVERAGE TOTAL RETURN (%)
|
|
Since Inception
(06/10/2026) |
|
F/m Accumulator Ultrashort U.S. Treasury Fund
|
0.75
|
|
Bloomberg U.S. Aggregate Bond Index
|
-0.23
|
Visit https://www.fminvest.com/sgva for more recent performance information.
KEY FUND STATISTICS (as of August 31, 2026)
|
Net Assets
|
$265,980,673
|
|
Number of Holdings
|
1
|
|
Net Advisory Fee
|
$55,829
|
|
Portfolio Turnover
|
0%
|
|
30-Day SEC Yield
|
3.26%
|
|
30-Day SEC Yield Unsubsidized
|
3.26%
|
WHAT DID THE FUND INVEST IN? (as of August 31, 2026)
|
Top Sectors
|
(% of Net Assets)
|
|
|
Exchange Traded Funds
|
100.0
|
%
|
|
Top 10 Holdings
|
(% of Net Assets)
|
|
|
Invesco Short Term Treasury ETF
|
100.0
|
%
|
WHAT WERE THE FUND COSTS FOR THE PERIOD? (based on a hypothetical $10,000 investment)
|
Fund Name
|
Costs of a $10,000 investment*
|
Costs paid as a percentage of a $10,000 investment**
|
|
F/m Emerald Special Situations ETF
|
$30
|
0.89%
|
HOW DID THE FUND PERFORM DURING THE CURRENT REPORTING PERIOD AND WHAT AFFECTED ITS PERFORMANCE?
For the period from May 1, 2026 through August 31, 2026, the Fund returned 1.84%, trailing the Russell 3000 Index’s (the “Index”) 7.12% return by roughly 528 basis points, giving back a portion of the Fund’s calendar year-to-date outperformance. The Fund is built as a semi-concentrated portfolio meant to deliver returns that are uncorrelated to the broad market. During the period, much of the index’s gain came from large-cap technology stocks. That sector alone accounted for about 4.3 percentage points of the Index’s return, and the Fund held less than half of the Index’s technology weight. Even so, the gap versus the index came mainly from how individual holdings performed in a handful of concentrated segments, not from the Fund’s sector weightings. That pattern is what we expect from a portfolio built around company-specific opportunities rather than index exposures.
WHAT FACTORS INFLUENCED PERFORMANCE?
Health Care was the strongest driver of returns. It was one of the Fund’s largest overweights, and holdings meaningfully outperformed the Index’s Health Care names. Within Technology, software holdings outperformed, which helped offset weakness elsewhere in the sector. Utilities, mainly gas distribution, also added value, as did telecommunications equipment, insurance holdings within Financials, and Consumer Staples.
A broad devaluation in companies tied to artificial intelligence and to aerospace and defense weighed heavily on results. Both groups had performed strongly coming into the period, and both saw meaningful multiple compression as investors questioned the durability and timing of related spending. The Fund’s AI exposure reaches well beyond Technology into the physical infrastructure behind the buildout, including energy and power equipment, data center climate control, engineering and construction services, and specialized machinery. That broad reach meant the pullback was felt across several sectors. In Energy, holdings in oil equipment and services and in renewable energy equipment underperformed sharply. Within Technology, semiconductor and production technology equipment holdings lagged their benchmark counterparts.
Industrials was the largest detractor relative to the Index: the Fund’s holdings declined while the Index’s Industrials names posted modest gains. Both themes were at work here. Defense, one of the Fund’s largest segment exposures, meaningfully underperformed, and aerospace holdings also lagged. Positions in engineering and contracting, building climate control, construction, and specialty machinery, many of them closely tied to AI infrastructure, underperformed as well.
Despite the shortfall versus the Index for this abbreviated period, we remain confident in the long-term fundamentals behind the portfolio’s key positions. The Fund’s concentrated, low-correlation design means its returns will at times diverge sharply from the broad market, in both directions. This period was a clear example: strong results in Health Care and software were outweighed by a sentiment-driven pullback in AI-related and aerospace/defense names. We continue
to assess each position on its individual merits and see the recent dislocation in several of these segments as a potential source of future opportunity.
|
Top Contributors
|
|
|
↑
|
Lumentum Holdings, Inc.
|
|
↑
|
Bloom Energy Corporation Class A
|
|
↑
|
Credo Technology Group Holding Ltd.
|
|
Top Detractors
|
|
|
↓
|
Genius Sports Limited
|
|
↓
|
Sable Offshore Corp.
|
|
↓
|
AeroVironment, Inc.
|
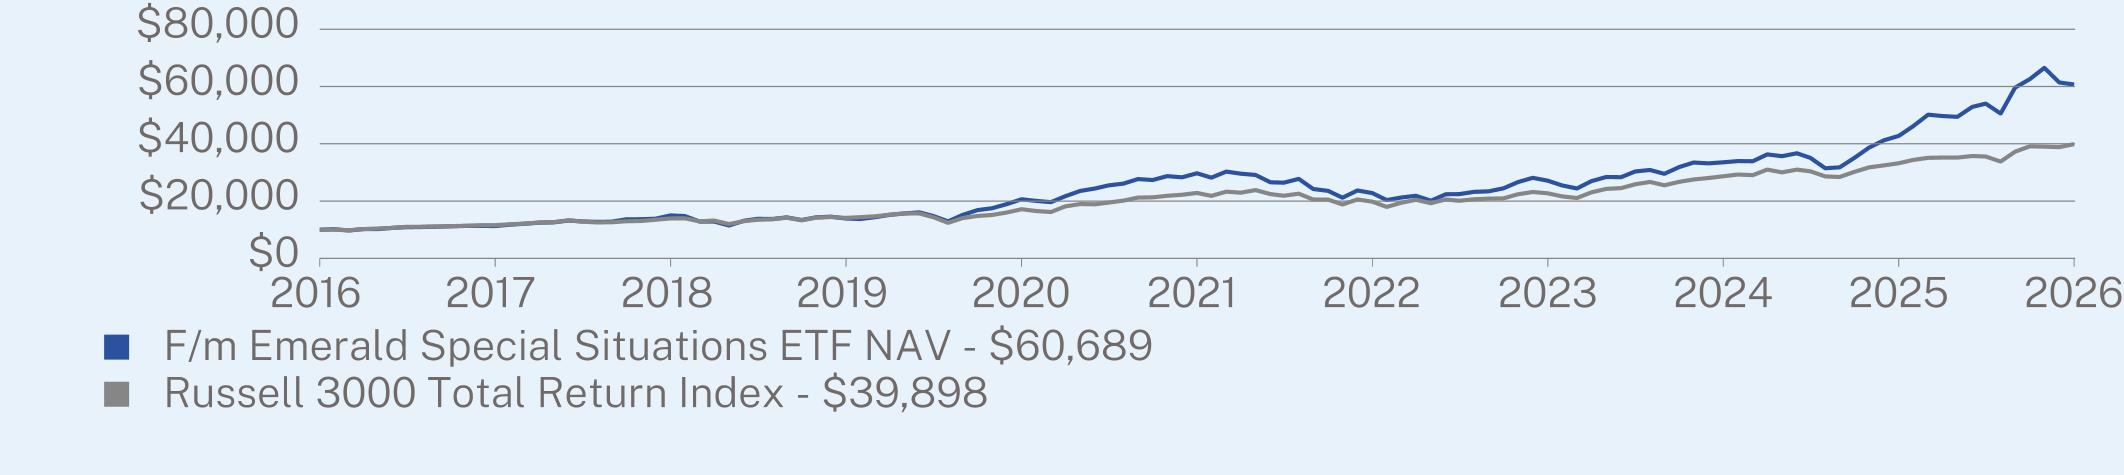
ANNUAL AVERAGE TOTAL RETURN (%)
|
|
5/1/2026- 8/31/2026
|
1 Year
|
5 Year
|
10 Year
|
|
F/m Emerald Special Situations ETF NAV
|
1.84
|
41.91
|
15.36
|
19.76
|
|
Russell 3000 Total Return Index
|
7.12
|
20.10
|
11.80
|
14.84
|
Visit https://www.emeraldetfs.com/spit/ for more recent performance information.*
KEY FUND STATISTICS (as of August 31, 2026)
|
Net Assets
|
$33,924,444
|
|
Number of Holdings
|
44
|
|
Net Advisory Fee
|
$97,361
|
|
Portfolio Turnover
|
81%
|
WHAT DID THE FUND INVEST IN? (as of August 31, 2026)
|
Top Sectors
|
(% of Net Assets)
|
|
|
Health Care
|
26.7
|
%
|
|
Technology
|
18.6
|
%
|
|
Industrials
|
18.1
|
%
|
|
Consumer Discretionary
|
11.1
|
%
|
|
Energy
|
8.8
|
%
|
|
Financials
|
4.5
|
%
|
|
Utilities
|
3.1
|
%
|
|
Exchange Traded Funds
|
2.9
|
%
|
|
Telecommunications
|
2.7
|
%
|
|
Consumer Staples
|
2.4
|
%
|
|
Top 10 Holdings
|
(% of Net Assets)
|
|
|
Corcept Therapeutics, Inc.
|
5.4
|
%
|
|
TETRA Technologies, Inc.
|
4.3
|
%
|
|
Amazon.com, Inc.
|
3.8
|
%
|
|
Guardant Health, Inc.
|
3.6
|
%
|
|
Travere Therapeutics, Inc.
|
3.2
|
%
|
|
LivaNova PLC
|
3.2
|
%
|
|
Excelerate Energy, Inc.
|
3.2
|
%
|
|
Credo Technology Group Holding Ltd.
|
3.0
|
%
|
|
F/m Ultrashort Treasury Inflation-Protected Security (TIPS) ETF
|
2.9
|
%
|
|
Arlo Technologies, Inc.
|
2.7
|
%
|
Material Fund Changes
This is a summary of certain changes to the Fund since May 1, 2026. For more complete information, you may review the Fund’s prospectus dated August 31, 2026, which is available at https://www.emeraldetfs.com/spit/. or upon request by contacting the Fund at 1-800-617-0004.
During the Period, the Fund changed its fiscal year end from April 30 to August 31.
https://funddocs.filepoint.com/matsonmoney. You can also request this information by contacting us at 513-204-8000.
WHAT WERE THE FUND COSTS FOR THE PERIOD? (based on a hypothetical $10,000 investment)
|
Class Name
|
Costs of a $10,000 investment
|
Costs paid as a percentage of a $10,000 investment
|
|
Institutional Class
|
$56
|
0.49%
|
HOW DID THE FUND PERFORM DURING THE PERIOD AND WHAT AFFECTED ITS PERFORMANCE?
For the Period, the Fund provided a total return of 27.14% at net asset value. This compares with a return of 20.10% during the Period for the Fund’s benchmark, the Russell 3000® Total Return Index.
As a result of the Fund’s diversified investment approach, performance principally was determined by broad structural trends in equity markets rather than the behavior of a limited number of stocks. Among the most important factors explaining differences in the performance of diversified equity funds, like the Fund, are the size and value/growth characteristics of the underlying fund holdings. Size is measured by market capitalization and “value” classification is a function of stock price relative to one or more fundamental characteristics.
U.S. small cap stocks performed better than U.S. large cap stocks during the Period. The S&P 500® Index returned 20.38%, the Russell 2500® Index returned 25.54%, and the Russell 2000® Index returned 26.46%. Furthermore, for the Period, the Russell 1000® Value Index returned 29.72%, while the Russell 2000® Value returned 29.95% for the Period.
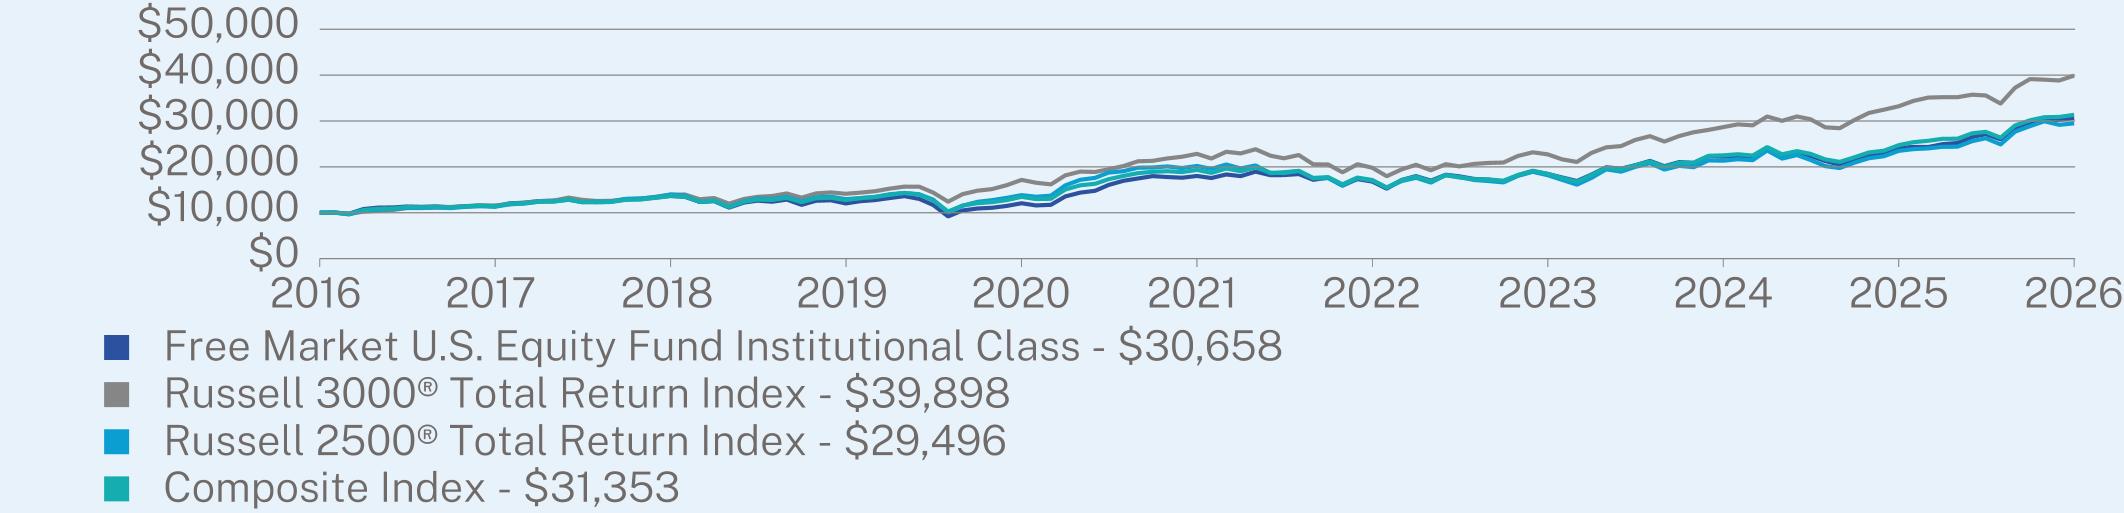
ANNUAL AVERAGE TOTAL RETURN (%)
|
|
1 Year
|
5 Year
|
10 Year
|
|
Free Market U.S. Equity Fund
|
27.14
|
11.21
|
11.85
|
|
Russell 3000® Total Return Index1
|
20.10
|
11.80
|
14.84
|
|
Russell 2500® Total Return Index
|
25.54
|
7.87
|
11.42
|
|
Composite Index2
|
26.71
|
10.16
|
12.11
|
Visit https://funddocs.filepoint.com/matsonmoney for more recent performance information.
KEY FUND STATISTICS (as of August 31, 2026)
|
Net Assets
|
$5,934,917,498
|
|
Number of Holdings
|
9
|
|
Net Advisory Fee
|
$23,922,097
|
|
Portfolio Turnover
|
3%
|
WHAT DID THE FUND INVEST IN? (as of August 31, 2026)
|
Top 10 Holdings
|
(% of Net Assets)
|
|
|
DFA U.S. Small Cap Value Portfolio - Institutional Class
|
24.9
|
%
|
|
Dimensional U.S. Large Cap Value Portfolio III - Institutional Class
|
17.6
|
%
|
|
DFA U.S. Small Cap Portfolio - Institutional Class
|
14.8
|
%
|
|
DFA U.S. Micro Cap Portfolio - Institutional Class
|
14.8
|
%
|
|
iShares Core S&P 500 ETF
|
9.6
|
%
|
|
iShares MSCI USA Value Factor ETF
|
7.3
|
%
|
|
U.S. Large Cap Value Series
|
5.7
|
%
|
|
DFA U.S. Large Company Portfolio - Institutional Class
|
5.3
|
%
|
|
Top Sectors
|
(% of Net Assets)
|
|
|
US Large Cap Equity
|
45.5
|
%
|
|
US Small Cap Equity
|
39.7
|
%
|
|
US Micro Cap Equity
|
14.8
|
%
|
|
Short Term and other Net Assets
|
0.1
|
%
|
WHAT WERE THE FUND COSTS FOR THE PERIOD? (based on a hypothetical $10,000 investment)
|
Class Name
|
Costs of a $10,000 investment
|
Costs paid as a percentage of a $10,000 investment
|
|
Institutional Class
|
$61
|
0.53%
|
HOW DID THE FUND PERFORM DURING THE PERIOD AND WHAT AFFECTED ITS PERFORMANCE?
For the Period, the Fund provided a total return of 29.05% at net asset value. This compares with a return of 22.35% over the same period for the Fund’s benchmark, the MSCI World (ex USA) Index, which captures large and mid-cap representation across 22 of 23 Developed Markets (DM) countries excluding the U.S.
As a result of the Fund’s diversified investment approach, performance principally was determined by broad structural trends in global equity markets rather than the behavior of a limited number of stocks. Among the most important factors explaining differences in the behavior of diversified international equity funds, like the Fund, are company size and company value/growth characteristics of the underlying fund holdings and broad exposure to emerging market equities.
International value stocks fared better than international growth stocks during the Period. The MSCI EAFE Value Index increased by 28.49%, while the MSCI EAFE Small Cap Value Index returned 21.48% and the MSCI Emerging Markets Index returned 39.25%. Furthermore, the MSCI EAFE Small Cap Index returned 18.85% for the Period, while the MSCI EAFE Index returned 21.62% for the same period.
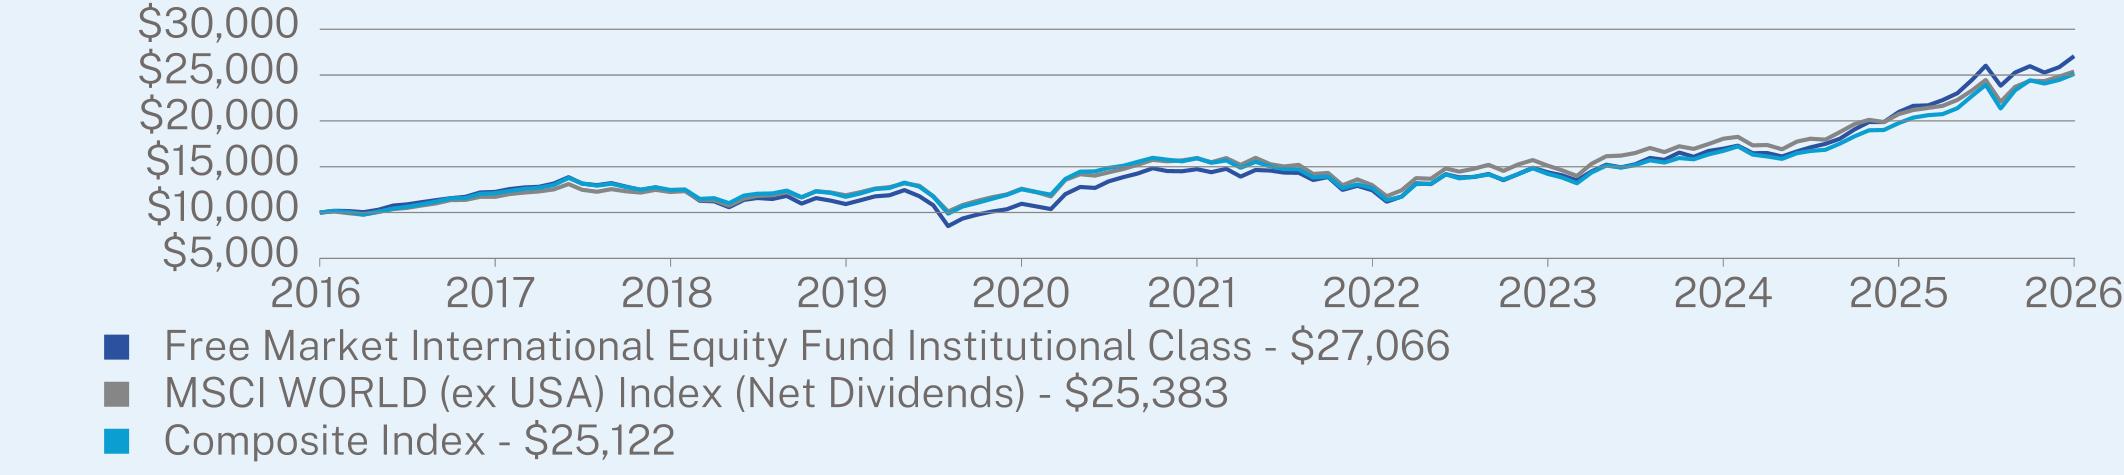
ANNUAL AVERAGE TOTAL RETURN (%)
|
|
1 Year
|
5 Year
|
10 Year
|
|
Free Market International Equity Fund
|
29.05
|
12.93
|
10.47
|
|
MSCI WORLD (ex USA) Index (Net Dividends)
|
22.35
|
9.75
|
9.76
|
|
Composite Index1
|
27.11
|
9.55
|
9.65
|
Visit https://funddocs.filepoint.com/matsonmoney for more recent performance information.
KEY FUND STATISTICS (as of August 31, 2026)
|
Net Assets
|
$4,655,249,007
|
|
Number of Holdings
|
9
|
|
Net Advisory Fee
|
$20,187,270
|
|
Portfolio Turnover
|
6%
|
WHAT DID THE FUND INVEST IN? (as of August 31, 2026)
|
Top 10 Holdings
|
(% of Net Assets)
|
|
|
DFA International Small Cap Value Portfolio - Institutional Class
|
40.7
|
%
|
|
DFA International Value Portfolio III - Institutional Class
|
17.3
|
%
|
|
International Value Series
|
12.6
|
%
|
|
Dimensional International Small Cap ETF
|
9.8
|
%
|
|
iShares Core MSCI Emerging Markets ETF
|
5.2
|
%
|
|
DFA Emerging Markets Value Portfolio - Institutional Class
|
4.8
|
%
|
|
iShares Core MSCI EAFE ETF
|
4.8
|
%
|
|
DFA Emerging Markets Small Cap Portfolio - Institutional Class
|
4.8
|
%
|
|
Top Sectors
|
(% of Net Assets)
|
|
|
Developed Small
|
50.5
|
%
|
|
Developed Large
|
34.7
|
%
|
|
Emerging Large
|
10.0
|
%
|
|
Emerging Small
|
4.8
|
%
|
|
Short Term and other Net Assets
|
0.1
|
%
|
https://funddocs.filepoint.com/matsonmoney/. You can also request this information by contacting us at 513-204-8000.
WHAT WERE THE FUND COSTS FOR THE PERIOD? (based on a hypothetical $10,000 investment)
|
Class Name
|
Costs of a $10,000 investment
|
Costs paid as a percentage of a $10,000 investment
|
|
Institutional Class
|
$55
|
0.54%
|
HOW DID THE FUND PERFORM DURING THE PERIOD AND WHAT AFFECTED ITS PERFORMANCE?
For the Period, the Fund returned 2.20%. This compares with a return of 1.89% over the same period for the Fund’s benchmark, the Bloomberg U.S. Aggregate Bond Index.
The Fund focuses on assets that invest in high quality and shorter-term government and corporate fixed income assets, both in the U.S. as well as international.
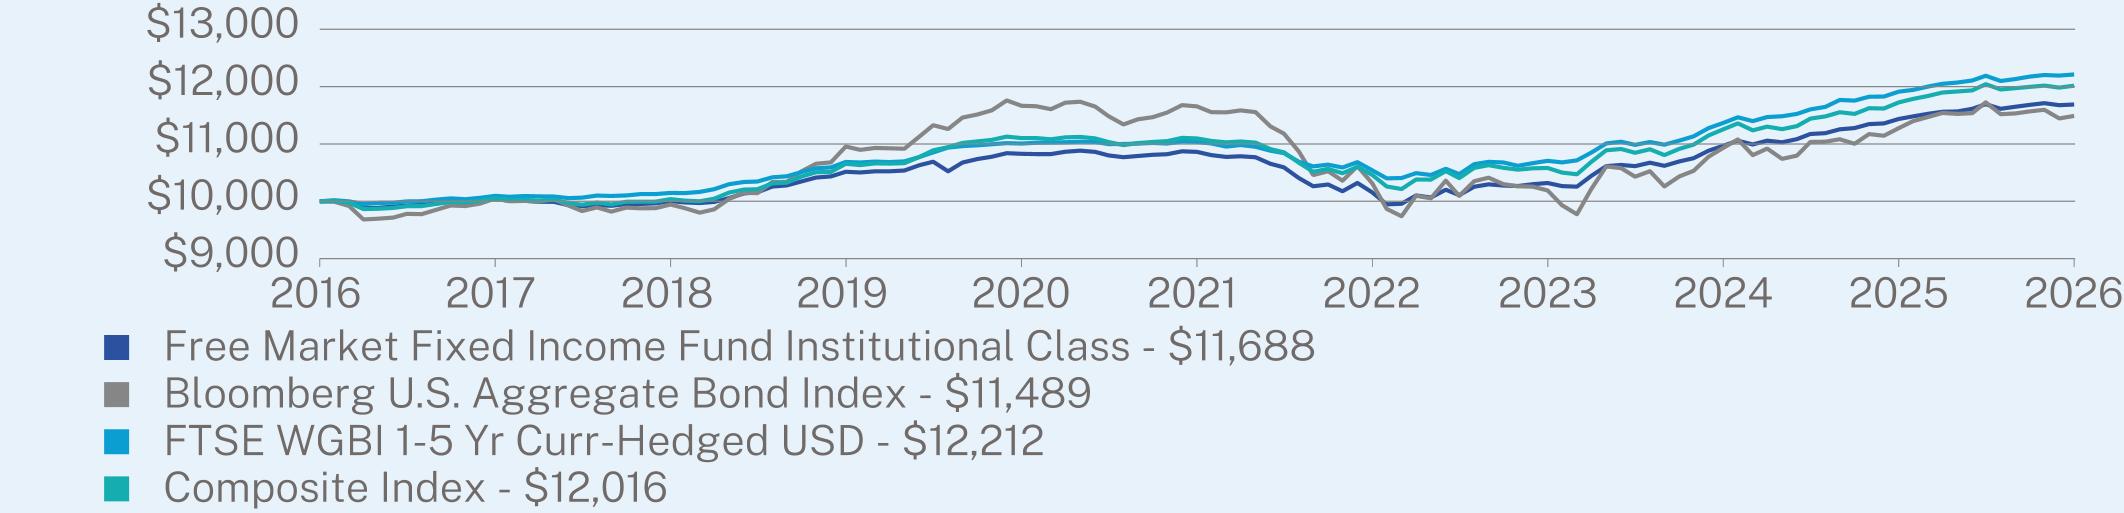
ANNUAL AVERAGE TOTAL RETURN (%)
|
|
1 Year
|
5 Year
|
10 Year
|
|
Free Market Fixed Income Fund
|
2.20
|
1.48
|
1.57
|
|
Bloomberg U.S. Aggregate Bond Index1
|
1.89
|
-0.29
|
1.40
|
|
FTSE World Government Bond Index 1-5 Yr Curr-Hedged USD
|
2.52
|
2.05
|
2.02
|
|
Composite Index2
|
2.48
|
1.61
|
1.85
|
Visit https://funddocs.filepoint.com/matsonmoney/ for more recent performance information.
KEY FUND STATISTICS (as of August 31, 2026)
|
Net Assets
|
$3,440,678,361
|
|
Number of Holdings
|
9
|
|
Net Advisory Fee
|
$15,767,984
|
|
Portfolio Turnover
|
0%
|
WHAT DID THE FUND INVEST IN? (as of August 31, 2026)
|
Top 10 Holdings
|
(% of Net Assets)
|
|
|
DFA Two-Year Global Fixed Income Portfolio - Institutional Class
|
25.0
|
%
|
|
iShares 1-5 Year Investment Grade Corporate Bond ETF
|
24.0
|
%
|
|
iShares Core International Aggregate Bond ETF
|
15.0
|
%
|
|
DFA One-Year Fixed Income Portfolio - Institutional Class
|
14.5
|
%
|
|
DFA Intermediate Government Fixed Income Portfolio - Institutional Class
|
6.0
|
%
|
|
iShares 5-10 Year Investment Grade Corporate Bond ETF
|
6.0
|
%
|
|
Dimensional Inflation-Protected Securities ETF
|
5.0
|
%
|
|
DFA Short-Term Government Portfolio - Institutional Class
|
4.0
|
%
|
|
Top Sectors
|
(% of Net Assets)
|
|
|
Global
|
40.0
|
%
|
|
US Corporate
|
30.0
|
%
|
|
US Government
|
10.0
|
%
|
|
Inflation Protection
|
5.0
|
%
|
|
Short Term and other Net Assets
|
15.0
|
%
|
WHAT WERE THE FUND COSTS FOR THE PERIOD? (based on a hypothetical $10,000 investment)
|
Class Name
|
Costs of a $10,000 investment
|
Costs paid as a percentage of a $10,000 investment
|
|
Institutional Class
|
$76
|
0.68%
|
HOW DID THE FUND PERFORM DURING THE PERIOD AND WHAT AFFECTED ITS PERFORMANCE?
For the Period, the Fund provided a total return of 24.03% at net asset value. This compares with a return of 20.10% over the same period for the Fund’s benchmark, the Russell 3000® Total Return Index.
As a result of the Fund’s diversified investment approach, performance principally was determined by broad structural trends in equity markets rather than the behavior of a limited number of stocks. Among the most important factors explaining differences in the performance of diversified equity funds, like the Fund, are the size and value/growth characteristics of the underlying fund holdings. Size is measured by market capitalization and “value” classification is a function of stock price relative to one or more fundamental characteristics.
U.S. small cap stocks performed better than U.S. large cap stocks during the Period. The S&P 500® Index returned 20.38%, the Russell 2500® Total Return Index returned 25.54%, and the Russell 2000® Index returned 26.46%. Furthermore, for the same time period, the Russell 1000® Value Index returned 29.72% while the Russell 2000® Value returned 29.95% for the twelve months ended August 31, 2026.
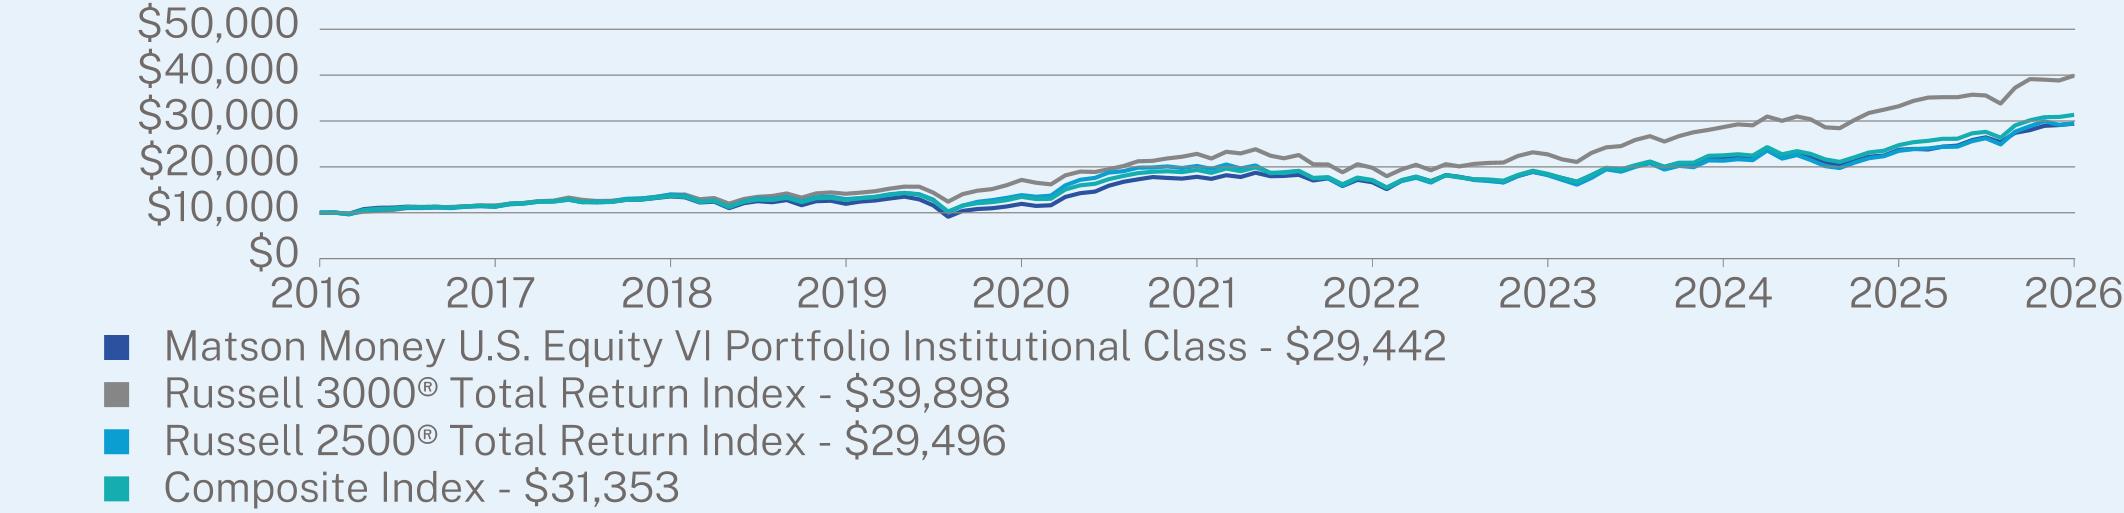
ANNUAL AVERAGE TOTAL RETURN (%)
|
|
1 Year
|
5 Year
|
10 Year
|
|
Matson Money U.S. Equity VI Portfolio
|
24.03
|
10.54
|
11.40
|
|
Russell 3000® Total Return Index1
|
20.10
|
11.80
|
14.84
|
|
Russell 2500® Total Return Index
|
25.54
|
7.87
|
11.42
|
|
Composite Index2
|
26.71
|
10.16
|
12.11
|
Visit https://funddocs.filepoint.com/matsonmoney for more recent performance information.
KEY FUND STATISTICS (as of August 31, 2026)
|
Net Assets
|
$30,804,219
|
|
Number of Holdings
|
8
|
|
Net Advisory Fee
|
$149,873
|
|
Portfolio Turnover
|
3%
|
WHAT DID THE FUND INVEST IN? (as of August 31, 2026)
|
Top 10 Holdings
|
(% of Net Assets)
|
|
|
DFA U.S. Large Cap Value Portfolio III - Class Institutional
|
26.2
|
%
|
|
DFA VA U.S. Targeted Value Portfolio
|
15.0
|
%
|
|
DFA U.S. Small Cap Portfolio - Class Institutional
|
14.9
|
%
|
|
DFA U.S. Micro Cap Portfolio - Class Institutional
|
14.9
|
%
|
|
DFA U.S. Large Company Portfolio - Class Institutional
|
14.2
|
%
|
|
DFA U.S. Small Cap Value Portfolio - Class Institutional
|
10.0
|
%
|
|
DFA VA U.S. Large Value Portfolio
|
4.0
|
%
|
|
Top Sectors
|
(% of Net Assets)
|
|
|
US Large Cap Equity
|
44.5
|
%
|
|
US Small Cap Equity
|
40.1
|
%
|
|
US Micro Cap Equity
|
14.9
|
%
|
|
Short Term and other Net Assets
|
0.6
|
%
|
WHAT WERE THE FUND COSTS FOR THE PERIOD? (based on a hypothetical $10,000 investment)
|
Class Name
|
Costs of a $10,000 investment
|
Costs paid as a percentage of a $10,000 investment
|
|
Institutional Class
|
$83
|
0.73%
|
HOW DID THE FUND PERFORM DURING THE PERIOD AND WHAT AFFECTED ITS PERFORMANCE?
For the Period, the Fund provided a total return of 27.64% at net asset value. This compares with a return of 22.35% over the same period for the Fund’s benchmark, the MSCI World (ex USA) Index, which captures large and mid-cap representation across 22 of 23 Developed Markets (DM) countries excluding the U.S.
As a result of the Fund’s diversified investment approach, performance principally was determined by broad structural trends in global equity markets rather than the behavior of a limited number of stocks. Among the most important factors explaining differences in the behavior of diversified international equity funds, like the Fund, are company size and company value/growth characteristics of the underlying fund holdings and broad exposure to emerging market equities.
International value stocks fared better than international growth stocks during the Period. The MSCI EAFE Value Index increased by 28.49%, while the MSCI EAFE Small Cap Value Index returned 21.48% and the MSCI Emerging Markets Index returned 39.25%. Furthermore, the MSCI EAFE Small Cap Index returned 18.85% for the Period, while the MSCI EAFE Index returned 21.62% for the Period.
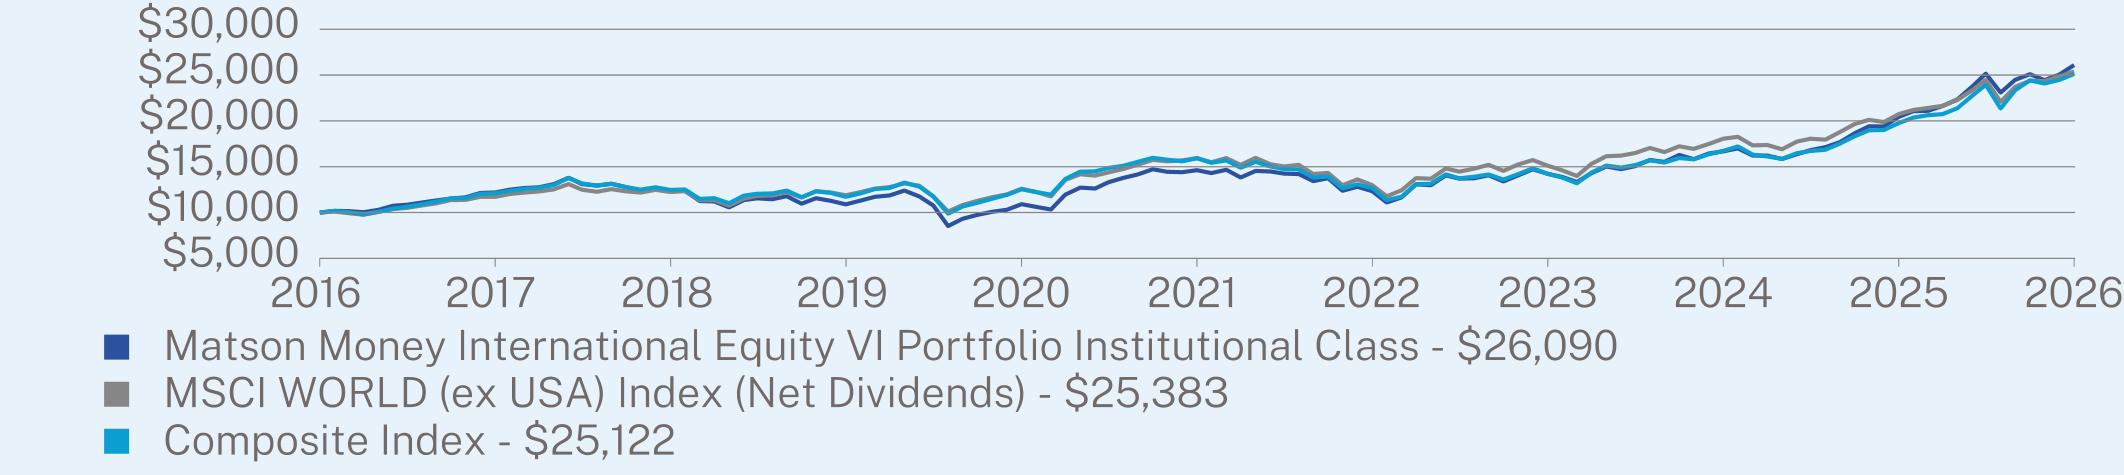
ANNUAL AVERAGE TOTAL RETURN (%)
|
|
1 Year
|
5 Year
|
10 Year
|
|
Matson Money International Equity VI Portfolio
|
27.64
|
12.28
|
10.06
|
|
MSCI WORLD (ex USA) Index (Net Dividends)
|
22.35
|
9.75
|
9.76
|
|
Composite Index1
|
27.11
|
9.55
|
9.65
|
Visit https://funddocs.filepoint.com/matsonmoney for more recent performance information.
KEY FUND STATISTICS (as of August 31, 2026)
|
Net Assets
|
$24,246,212
|
|
Number of Holdings
|
9
|
|
Net Advisory Fee
|
$115,887
|
|
Portfolio Turnover
|
7%
|
WHAT DID THE FUND INVEST IN? (as of August 31, 2026)
|
Top 10 Holdings
|
(% of Net Assets)
|
|
|
DFA International Value Portfolio III - Class Institutional
|
30.0
|
%
|
|
DFA International Small Cap Value Portfolio - Class Institutional
|
28.2
|
%
|
|
DFA VA International Small Portfolio
|
17.1
|
%
|
|
DFA VA International Value Portfolio
|
5.1
|
%
|
|
iShares Core MSCI Emerging Markets ETF
|
5.1
|
%
|
|
DFA Emerging Markets Value Portfolio - Class Institutional
|
4.9
|
%
|
|
DFA Emerging Markets Small Cap Portfolio - Class Institutional
|
4.9
|
%
|
|
iShares Core MSCI EAFE ETF
|
3.9
|
%
|
|
Top Sectors
|
(% of Net Assets)
|
|
|
Developed Small
|
45.4
|
%
|
|
Developed Large
|
39.1
|
%
|
|
Emerging Large
|
10.0
|
%
|
|
Emerging Small
|
4.9
|
%
|
|
Short Term and other Net Assets
|
0.8
|
%
|
WHAT WERE THE FUND COSTS FOR THE PERIOD? (based on a hypothetical $10,000 investment)
|
Class Name
|
Costs of a $10,000 investment
|
Costs paid as a percentage of a $10,000 investment
|
|
Institutional Class
|
$73
|
0.72%
|
HOW DID THE FUND PERFORM DURING THE PERIOD AND WHAT AFFECTED ITS PERFORMANCE?
For the Period, the Fund returned 2.03%. This compares with a return of 1.89% over the same period for the Fund’s benchmark, the Bloomberg U.S. Aggregate Bond Index.
The Fund focuses on assets that invest in high quality and shorter-term government and corporate fixed income assets, both in the U.S. as well as international.
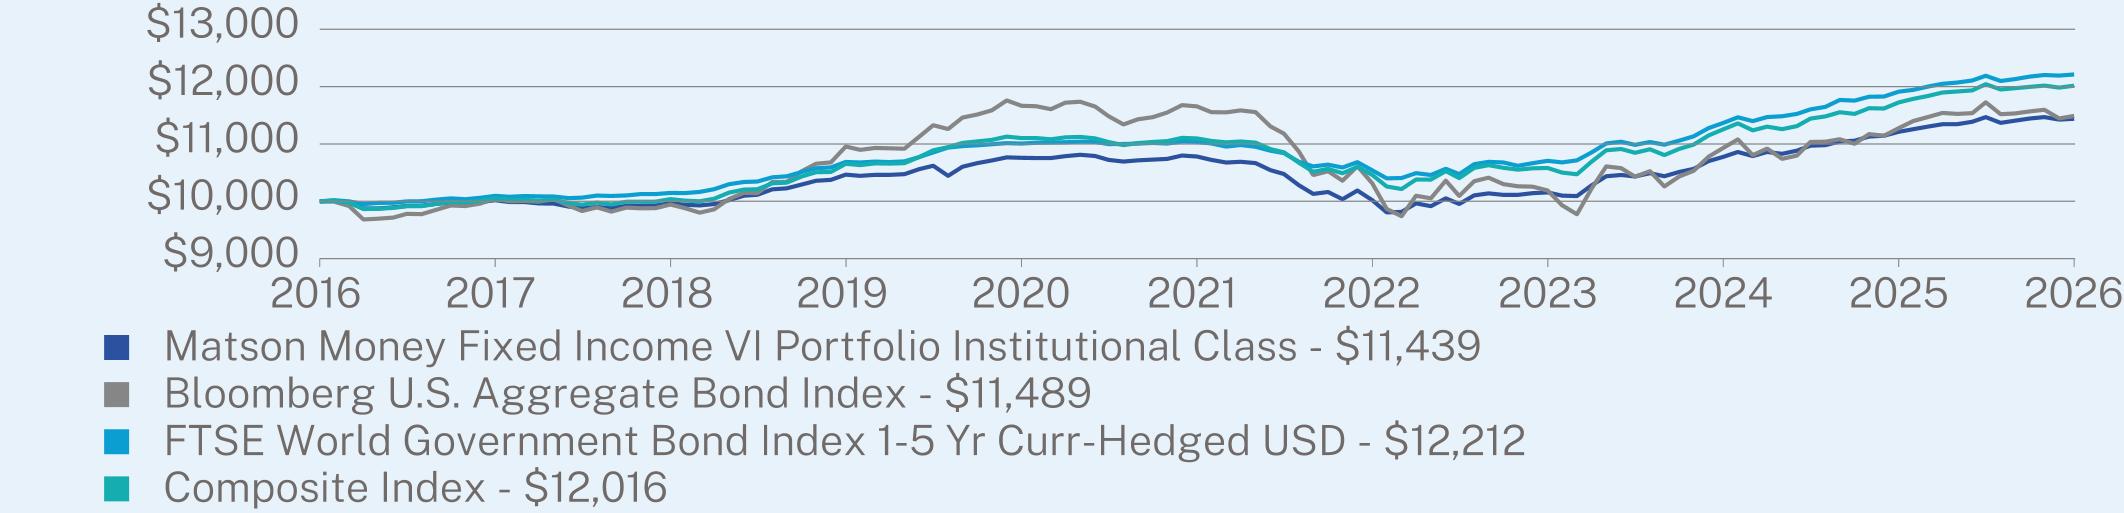
ANNUAL AVERAGE TOTAL RETURN (%)
|
|
1 Year
|
5 Year
|
10 Year
|
|
Matson Money Fixed Income VI Portfolio
|
2.03
|
1.19
|
1.35
|
|
Bloomberg U.S. Aggregate Bond Index1
|
1.89
|
-0.29
|
1.40
|
|
FTSE World Government Bond Index 1-5 Yr Curr-Hedged USD
|
2.52
|
2.05
|
2.02
|
|
Composite Index2
|
2.48
|
1.61
|
1.85
|
Visit https://funddocs.filepoint.com/matsonmoney for more recent performance information.
KEY FUND STATISTICS (as of August 31, 2026)
|
Net Assets
|
$26,440,309
|
|
Number of Holdings
|
11
|
|
Net Advisory Fee
|
$128,995
|
|
Portfolio Turnover
|
9%
|
WHAT DID THE FUND INVEST IN? (as of August 31, 2026)
|
Top 10 Holdings
|
(% of Net Assets)
|
|
|
iShares 1-5 Year Investment Grade Corporate Bond ETF
|
24.1
|
%
|
|
DFA Two-Year Global Fixed Income Portfolio - Institutional Class
|
15.1
|
%
|
|
iShares Core International Aggregate Bond ETF
|
15.0
|
%
|
|
DFA One-Year Fixed Income Portfolio - Institutional Class
|
11.5
|
%
|
|
VA Global Bond Portfolio
|
10.0
|
%
|
|
iShares 5-10 Year Investment Grade Corporate Bond ETF
|
6.0
|
%
|
|
DFA Intermediate Government Fixed Income Portfolio - Institutional Class
|
6.0
|
%
|
|
Dimensional Inflation-Protected Securities ETF
|
5.0
|
%
|
|
DFA Short-Term Government Portfolio - Institutional Class
|
4.0
|
%
|
|
VA Short-Term Fixed Income Portfolio
|
2.0
|
%
|
|
Top Sectors
|
(% of Net Assets)
|
|
|
Global
|
40.2
|
%
|
|
US Corporate
|
30.1
|
%
|
|
US Government
|
10.0
|
%
|
|
Inflation Protected
|
5.0
|
%
|
|
Short Term and other Net Assets
|
14.8
|
%
|
This report describes changes to the Fund that occurred during the reporting period.
WHAT WERE THE FUND COSTS FOR THE PERIOD? (based on a hypothetical $10,000 investment)
|
Fund Name
|
Costs of a $10,000 investment
|
Costs paid as a percentage of a $10,000 investment
|
|
Motley Fool Global Opportunities ETF
|
$86
|
0.85%
|
HOW DID THE FUND PERFORM DURING THE PERIOD AND WHAT AFFECTED ITS PERFORMANCE?
For the Period, the Fund underperformed its benchmark, the FTSE Global All Cap Net Tax Index (the “Benchmark”). Both the Fund and the Benchmark had positive absolute returns in the Period.
WHAT FACTORS INFLUENCED PERFORMANCE?
With a global Fund holding fewer than 50 companies, individual stock selection was a primary driver of performance. On an absolute basis, the Fund had positive returns. On a relative basis, however, the Fund was unable to close the gap from missing out on a portion of the largest artificial intelligence winners, while also missing the Energy sector performance that was triggered by the conflict in Iran. While the majority of the Fund’s holdings generated positive returns, only about one third of the Fund’s average weight was in positions that outperformed the benchmark. On an absolute basis, our best-contributing sector was Information Technology, while the worst drag came from Health Care. Looking at the Fund on a relative basis changes the story entirely. Our lack of investment in Utilities was the largest relative positive. But the Information Technology sector flipped from our largest positive contributor to the largest negative relative contribution.
As long-term business-focused investors, we accept that the performance of our holdings – even when positive – will fall short of the benchmark at times. This kind of variance is inherent in equity investing, and our process remains unchanged. Our investment decisions are solely focused on owning what we believe to be high-quality businesses with attractive long-term outlooks. The Fund’s resulting portfolio characteristics, such as being underweight the Information Technology and Energy sectors and overweight the Industrials sector at period end, are byproducts of this bottom-up stock selection. The Fund’s Active Share of 94.5% further reflects this commitment to active management.
|
Top Contributors
|
|
|
↑
|
Alphabet Inc.
|
|
↑
|
International Container Terminal Services, Inc.
|
|
↑
|
Taiwan Semiconductor Manufacturing Company Limited
|
|
Top Detractors
|
|
|
↓
|
Nintendo Co., Ltd.
|
|
↓
|
Axon Enterprise, Inc.
|
|
↓
|
ICON Public Limited Company
|
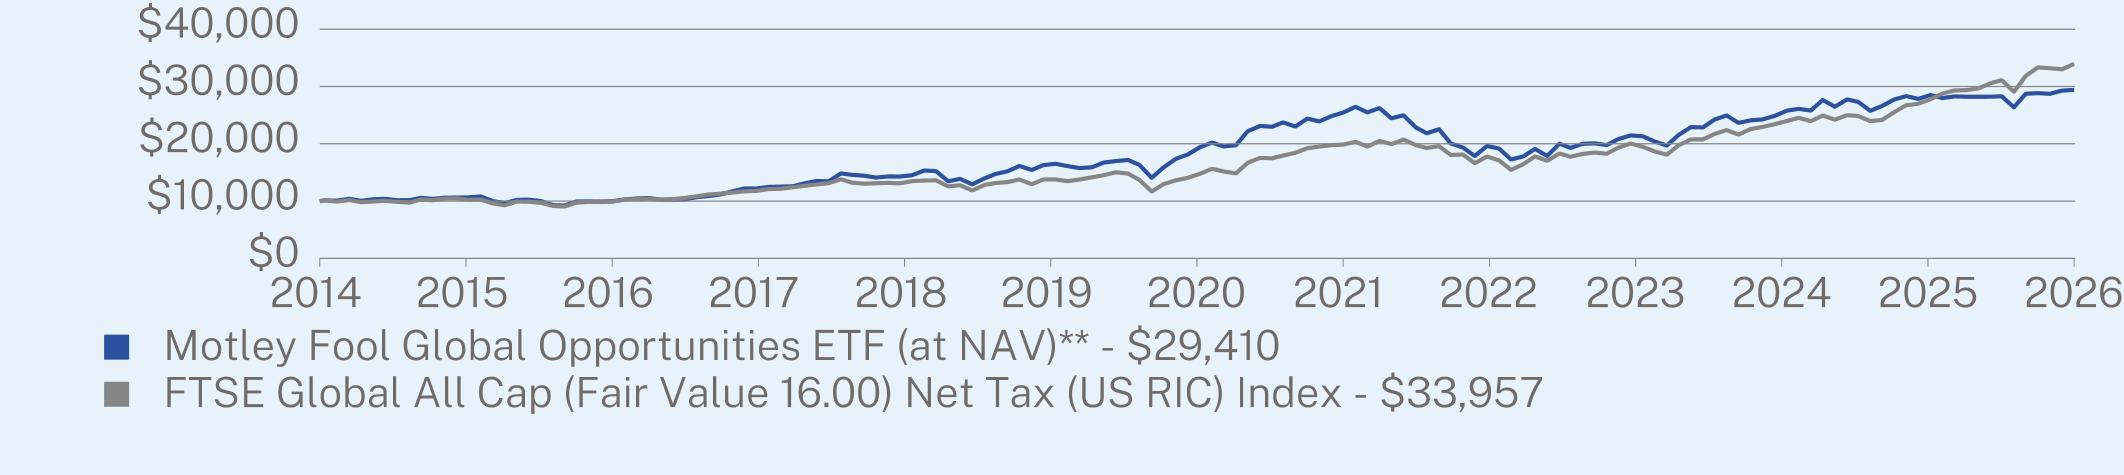
AVERAGE ANNUAL TOTAL RETURN (%)
|
|
1 Year
|
5 Year
|
10 Year
|
|
Motley Fool Global Opportunities ETF (at NAV)**
|
3.15
|
2.14
|
10.89
|
|
FTSE Global All Cap (Fair Value 16.00) Net Tax (US RIC) Index
|
22.24
|
10.79
|
12.62
|
Visit https://fooletfs.com/our-funds for more recent performance information.
KEY FUND STATISTICS (as of August 31, 2026)
|
Net Assets
|
$352,295,007
|
|
Number of Holdings
|
42
|
|
Net Advisory Fee
|
$3,115,011
|
|
Portfolio Turnover
|
2%
|
|
30-Day SEC Yield
|
0.65%
|
|
30-Day SEC Yield Unsubsidized
|
0.65%
|
WHAT DID THE FUND INVEST IN? (as of August 31, 2026)
|
Top 10 Holdings
|
(% of Net Assets)
|
|
|
Alphabet, Inc.
|
7.2
|
%
|
|
International Container Terminal Services, Inc.
|
6.5
|
%
|
|
Amazon.com, Inc.
|
6.5
|
%
|
|
Mastercard, Inc.
|
4.4
|
%
|
|
Taiwan Semiconductor Manufacturing Co. Ltd.
|
4.3
|
%
|
|
Nintendo Co. Ltd.
|
3.7
|
%
|
|
Waste Connections, Inc.
|
3.7
|
%
|
|
StoneX Group, Inc.
|
3.6
|
%
|
|
Costco Wholesale Corp.
|
3.4
|
%
|
|
Equinix, Inc.
|
3.2
|
%
|
|
Top Sectors
|
(% of Net Assets)
|
|
|
Industrials
|
23.4
|
%
|
|
Financials
|
16.4
|
%
|
|
Communication Services
|
13.7
|
%
|
|
Information Technology
|
11.1
|
%
|
|
Consumer Discretionary
|
11.0
|
%
|
|
Health Care
|
7.1
|
%
|
|
Real Estate
|
6.5
|
%
|
|
Consumer Staples
|
5.2
|
%
|
|
Materials
|
2.1
|
%
|
|
Cash & Other
|
3.5
|
%
|
Changes to Fund’s Portfolio Manager or Portfolio Management Team during the Period:
William H. Mann III and Shelby McFaddin, CFA were added as named portfolio managers to the Fund as of December 31, 2025.
This report describes changes to the Fund that occurred during the reporting period.
WHAT WERE THE FUND COSTS FOR THE PERIOD? (based on a hypothetical $10,000 investment)
|
Fund Name
|
Costs of a $10,000 investment
|
Costs paid as a percentage of a $10,000 investment
|
|
Motley Fool Mid Cap Growth ETF
|
$81
|
0.85%
|
HOW DID THE FUND PERFORM DURING THE PERIOD AND WHAT AFFECTED ITS PERFORMANCE?
For the Period, the Fund underperformed its benchmark, the Russell Midcap Growth Total Return Index (the “Benchmark”). Both the Fund and the Benchmark had negative absolute returns in the period.
WHAT FACTORS INFLUENCED PERFORMANCE?
The Fund saw divergent returns from its relatively limited number of holdings. While some individual companies performed very well, their positive contributions were weighed down by a significant number of detractors. Across the portfolio, Health Care was the only sector where more positions had gains than losses. Five sectors outperformed the Benchmark while six underperformed; but the magnitude of the losing investments drove performance. On a relative basis, the Fund’s investments in Health Care did the best, and the avoidance of the Communication Services sector was also relatively helpful. On the other hand, despite carrying a similar sector weight to the Benchmark, the Fund’s investments in the Industrials and Information Technology sector were ultimately responsible for the Fund’s underperformance.
Despite this mixed performance from individual holdings, the Fund’s strategy remains unchanged. We continue to manage a focused portfolio, holding a selective number of companies that we believe offer high prospects for capital appreciation over a longer period. This approach is evident in the Fund’s structure, which ended the period with an Active Share just below 90%, over 45% of the Fund’s assets in the top ten holdings, and the allocation to just four sectors—Industrials, Health Care, Information Technology, and Health Care—representing more than 85% of Fund assets at period end.
|
Top Contributors
|
|
|
↑
|
StoneX Group Inc.
|
|
↑
|
Datadog, Inc.
|
|
↑
|
DexCom, Inc.
|
|
Top Detractors
|
|
|
↓
|
Wingstop Inc.
|
|
↓
|
QXO, Inc.
|
|
↓
|
HubSpot, Inc.
|
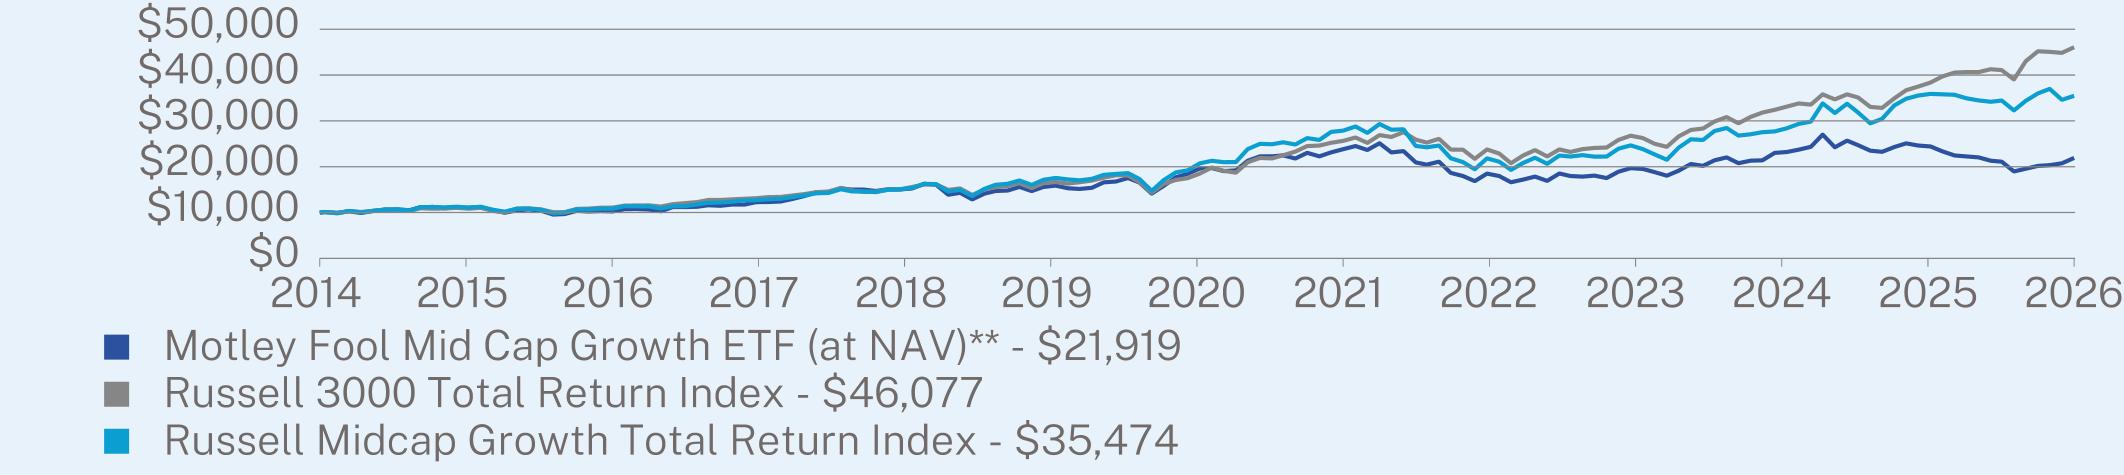
AVERAGE ANNUAL TOTAL RETURN (%)
|
|
1 Year
|
5 Year
|
10 Year
|
|
Motley Fool Mid Cap Growth ETF (at NAV)**
|
-10.26
|
-2.21
|
7.37
|
|
Russell 3000 Total Return Index
|
20.10
|
11.80
|
14.84
|
|
Russell Midcap Growth Total Return Index
|
-1.16
|
4.27
|
12.06
|
Visit https://fooletfs.com/our-funds for more recent performance information.
KEY FUND STATISTICS (as of August 31, 2026)
|
Net Assets
|
$119,226,669
|
|
Number of Holdings
|
33
|
|
Net Advisory Fee
|
$1,138,656
|
|
Portfolio Turnover
|
39%
|
|
30-Day SEC Yield
|
-0.27%
|
|
30-Day SEC Yield Unsubsidized
|
-0.27%
|
WHAT DID THE FUND INVEST IN? (as of August 31, 2026)
|
Top 10 Holdings
|
(% of Net Assets)
|
|
|
DexCom, Inc.
|
5.9
|
%
|
|
Guidewire Software, Inc.
|
5.7
|
%
|
|
HealthEquity, Inc.
|
5.0
|
%
|
|
MongoDB, Inc.
|
4.5
|
%
|
|
Toast, Inc.
|
4.5
|
%
|
|
Axon Enterprise, Inc.
|
4.5
|
%
|
|
Tyler Technologies, Inc.
|
4.3
|
%
|
|
Broadridge Financial Solutions, Inc.
|
4.3
|
%
|
|
GXO Logistics, Inc.
|
4.0
|
%
|
|
Brown & Brown, Inc.
|
3.9
|
%
|
|
Top Sectors
|
(% of Net Assets)
|
|
|
Information Technology
|
26.4
|
%
|
|
Industrials
|
22.9
|
%
|
|
Health Care
|
21.3
|
%
|
|
Financials
|
16.2
|
%
|
|
Real Estate
|
3.9
|
%
|
|
Consumer Discretionary
|
3.1
|
%
|
|
Consumer Staples
|
2.1
|
%
|
|
Cash & Other
|
4.1
|
%
|
Changes to Fund’s Portfolio Manager or Portfolio Management Team during the Period:
T.J. Piggott, CFA was added as a named portfolio manager to the Fund as of December 31, 2025.
WHAT WERE THE FUND COSTS FOR THE PERIOD? (based on a hypothetical $10,000 investment)
|
Fund Name
|
Costs of a $10,000 investment
|
Costs paid as a percentage of a $10,000 investment
|
|
Motley Fool 100 Index ETF
|
$55
|
0.50%
|
HOW DID THE FUND PERFORM DURING THE PERIOD AND WHAT AFFECTED ITS PERFORMANCE?
For the Period, despite significantly positive performance, the Fund underperformed its benchmark, the S&P 500 Total Return Index (the “Benchmark”), while closely tracking its underlying index, the Motley Fool 100 Index.
WHAT FACTORS INFLUENCED PERFORMANCE?
Market leadership was unusually narrow during the Period. The artificial intelligence-optimism trade dominated, with the best industry performance turned in from Semiconductors, Communications Equipment, and Electronic Equipment and Hardware. The Media, Airlines, and Consumer Services industries performed the worst. Among style factors, larger capitalization and price momentum were rewarded, and profitability was the weakest factor of the Period.
The Fund’s concentration in the largest technology companies placed it close to that leadership, though it did not hold a few semiconductor companies in the proportion the market rewarded. On an absolute basis, Information Technology was the largest positive sector contributor in the Fund, while Materials was the largest drag. Relative to its Benchmark, Information Technology remained the largest contributor, while Communication Services was the largest detractor.
|
Top Contributors
|
|
|
↑
|
Alphabet Inc.
|
|
↑
|
Apple Inc.
|
|
↑
|
NVIDIA Corp.
|
|
Top Detractors
|
|
|
↓
|
Meta Platforms, Inc.
|
|
↓
|
Netflix, Inc.
|
|
↓
|
Intuit Inc.
|
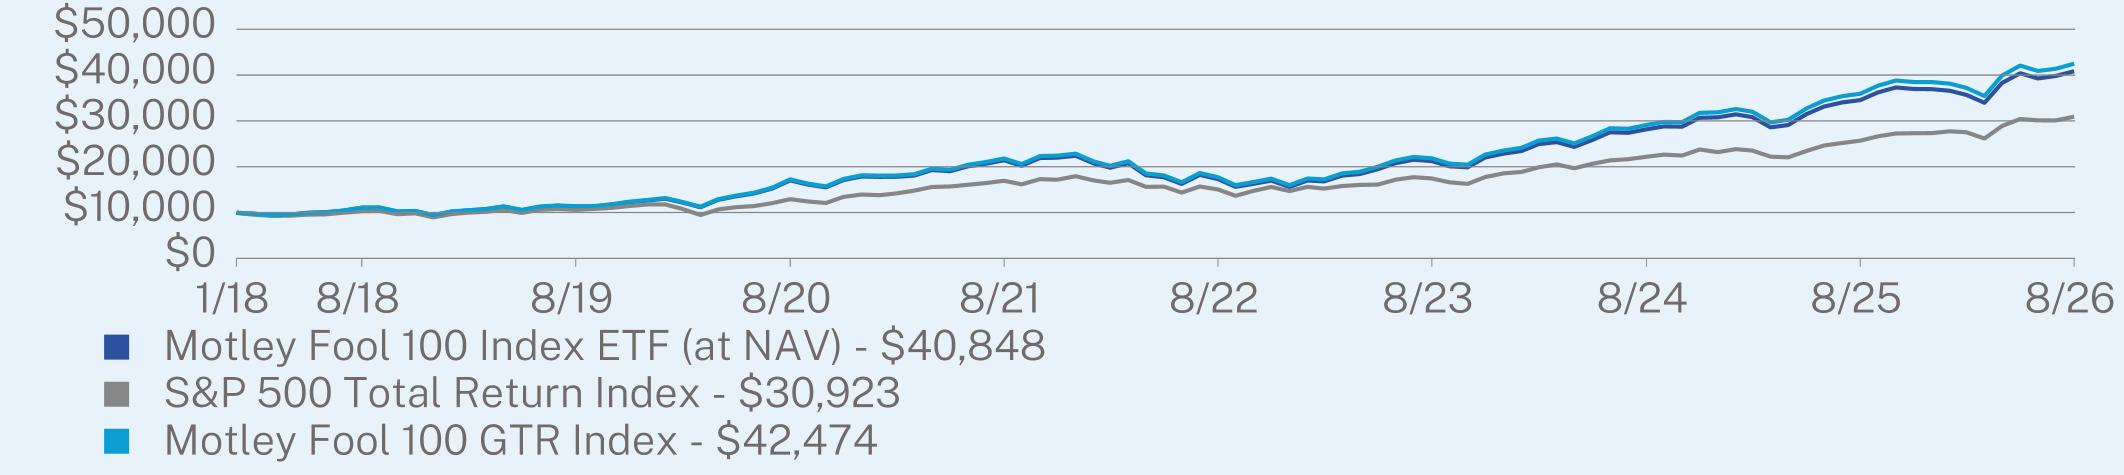
AVERAGE ANNUAL TOTAL RETURN (%)
|
|
1 Year
|
5 Year
|
Since Inception
(01/29/2018) |
|
Motley Fool 100 Index ETF at NAV
|
18.30
|
13.79
|
17.81
|
|
S&P 500 Total Return Index
|
20.38
|
12.79
|
14.05
|
|
Motley Fool 100 GTR Index
|
18.24
|
14.27
|
18.35
|
Visit https://fooletfs.com/our-funds for more recent performance information.
KEY FUND STATISTICS (as of August 31, 2026)
|
Net Assets
|
$2,088,342,851
|
|
Number of Holdings
|
102
|
|
Net Advisory Fee
|
$9,600,245
|
|
Portfolio Turnover
|
44%
|
|
30-Day SEC Yield
|
0.15%
|
|
30-Day SEC Yield Unsubsidized
|
0.15%
|
WHAT DID THE FUND INVEST IN? (as of August 31, 2026)
|
Top 10 Holdings
|
(% of Net Assets)
|
|
|
NVIDIA Corp.
|
10.9
|
%
|
|
Apple, Inc.
|
9.4
|
%
|
|
Alphabet, Inc.
|
8.3
|
%
|
|
Microsoft Corp.
|
7.9
|
%
|
|
Amazon.com, Inc.
|
5.7
|
%
|
|
Berkshire Hathaway, Inc.
|
3.7
|
%
|
|
Broadcom, Inc.
|
3.7
|
%
|
|
JPMorgan Chase & Co.
|
3.3
|
%
|
|
Walmart, Inc.
|
2.9
|
%
|
|
Advanced Micro Devices, Inc.
|
2.7
|
%
|
|
Top Sectors
|
(% of Net Assets)
|
|
|
Information Technology
|
45.0
|
%
|
|
Financials
|
14.3
|
%
|
|
Communication Services
|
13.6
|
%
|
|
Consumer Discretionary
|
10.6
|
%
|
|
Consumer Staples
|
4.8
|
%
|
|
Health Care
|
4.2
|
%
|
|
Industrials
|
3.9
|
%
|
|
Energy
|
1.6
|
%
|
|
Real Estate
|
1.0
|
%
|
|
Cash & Other
|
1.0
|
%
|
Changes to Fund’s Portfolio Manager or Portfolio Management Team during the Period:
William H. Mann III was added as a named portfolio manager to the Fund as of December 31, 2025.
This report describes changes to the Fund that occurred during the reporting period.
WHAT WERE THE FUND COSTS FOR THE PERIOD? (based on a hypothetical $10,000 investment)
|
Fund Name
|
Costs of a $10,000 investment
|
Costs paid as a percentage of a $10,000 investment
|
|
Motley Fool Small-Cap Growth ETF
|
$85
|
0.85%
|
HOW DID THE FUND PERFORM DURING THE PERIOD AND WHAT AFFECTED ITS PERFORMANCE?
For the Period, the Fund underperformed its benchmark, the Russell 2000 Growth Total Return Index (the “Benchmark”). The composition of the Fund makes performance in any given year much different from its Benchmark, driven by a portfolio typically holding less than 40 companies and with an Active Share over 96.5% at the end of the Period.
WHAT FACTORS INFLUENCED PERFORMANCE?
The Fund’s focused strategy, where a small number of companies are held, means that the performance of individual holdings has an outsized impact. This dynamic was clearly illustrated during the Period, as the Fund’s focus worked both for and against returns. On the positive side, seven companies contributed more than a full percentage point to the Fund’s absolute return during the Period. Unfortunately, six companies each contributed more than a percentage point of losses to the Fund. Looking at sectors, the absolute best performance came from Information Technology. Notably, most of this upside was delivered by a single company, SiTime Corporation, that more than doubled. The worst absolute sector contribution was Industrials. Again, the sector performance was dominated by a single company: in this case Verra Mobility Corporation shed more than 80% of its value. Relative to the Benchmark these two sectors remained the best- and worst-performing for the Fund.
This focused approach is a core part of the Fund’s strategy, which is evident in its portfolio structure. At the end of the Period, for instance, the Fund’s top ten holdings represented more than 43% of its assets. The sector allocation was similarly focused, with just four sectors – Industrials, Information Technology, Financials, and Health Care – averaging more than 80% of Fund assets during the Period. We intend to maintain this relatively focused portfolio, with the goal of selecting holdings that we believe offer high prospects for capital appreciation.
|
Top Contributors
|
|
|
↑
|
SiTime Corporation
|
|
↑
|
StoneX Group Inc.
|
|
↑
|
Ultra Clean Holdings, Inc.
|
|
Top Detractors
|
|
|
↓
|
Verra Mobility Corporation
|
|
↓
|
Alphatec Holdings, Inc.
|
|
↓
|
Toast, Inc.
|
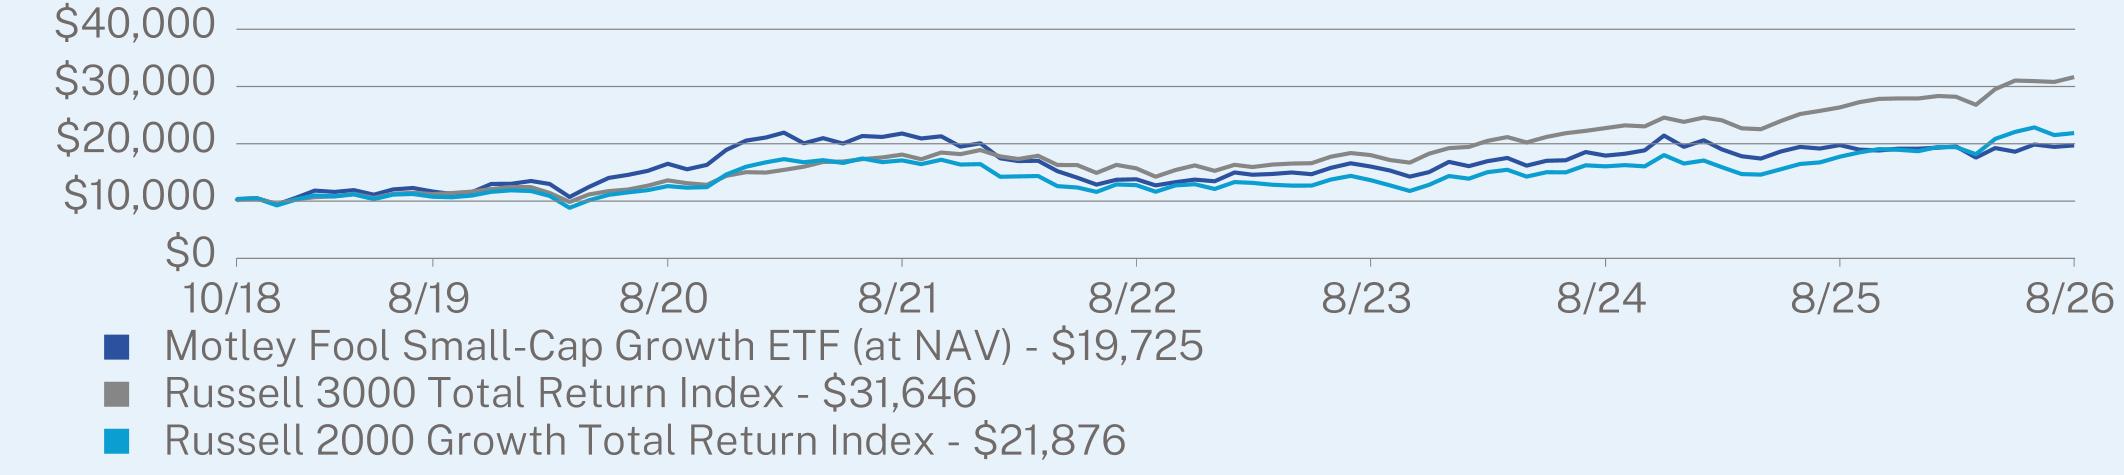
AVERAGE ANNUAL TOTAL RETURN (%)
|
|
1 Year
|
5 Year
|
Since Inception
(10/29/2018) |
|
Motley Fool Small-Cap Growth ETF (at NAV)
|
-0.28
|
-1.98
|
9.05
|
|
Russell 3000 Total Return Index
|
20.10
|
11.80
|
15.83
|
|
Russell 2000 Growth Total Return Index
|
23.25
|
5.04
|
10.50
|
Visit https://fooletfs.com/our-funds for more recent performance information.
KEY FUND STATISTICS (as of August 31, 2026)
|
Net Assets
|
$57,357,178
|
|
Number of Holdings
|
34
|
|
Net Advisory Fee
|
$565,291
|
|
Portfolio Turnover
|
45%
|
|
30-Day SEC Yield
|
0.23%
|
|
30-Day SEC Yield Unsubsidized
|
0.23%
|
WHAT DID THE FUND INVEST IN? (as of August 31, 2026)
|
Top 10 Holdings
|
(% of Net Assets)
|
|
|
Q2 Holdings, Inc.
|
5.3
|
%
|
|
StoneX Group, Inc.
|
4.8
|
%
|
|
Herc Holdings, Inc.
|
4.4
|
%
|
|
Goosehead Insurance, Inc.
|
4.3
|
%
|
|
HealthEquity, Inc.
|
4.3
|
%
|
|
Northern Oil & Gas, Inc.
|
4.3
|
%
|
|
UFP Technologies, Inc.
|
4.2
|
%
|
|
Alphatec Holdings, Inc.
|
4.0
|
%
|
|
Toast, Inc.
|
3.9
|
%
|
|
GXO Logistics, Inc.
|
3.9
|
%
|
|
Top Sectors
|
(% of Net Assets)
|
|
|
Health Care
|
20.3
|
%
|
|
Financials
|
18.5
|
%
|
|
Industrials
|
18.3
|
%
|
|
Information Technology
|
16.6
|
%
|
|
Consumer Discretionary
|
8.5
|
%
|
|
Real Estate
|
5.0
|
%
|
|
Energy
|
4.3
|
%
|
|
Materials
|
2.2
|
%
|
|
Cash & Other
|
6.3
|
%
|
WHAT WERE THE FUND COSTS FOR THE PERIOD? (based on a hypothetical $10,000 investment)
|
Fund Name
|
Costs of a $10,000 investment
|
Costs paid as a percentage of a $10,000 investment
|
|
Motley Fool Capital Efficiency 100 Index ETF
|
$52
|
0.50%
|
HOW DID THE FUND PERFORM DURING THE PERIOD AND WHAT AFFECTED ITS PERFORMANCE?
For the Period, despite positive absolute returns, the Fund underperformed its benchmark, the S&P 500 Total Return Index (the “S&P 500”). The Fund closely tracked its underlying index, the Motley Fool Capital Efficiency 100 Index.
WHAT FACTORS INFLUENCED PERFORMANCE?
Market leadership was unusually narrow over the Period. The artificial intelligence-optimism trade dominated, with the best industry performance turned in from Semiconductors, Communications Equipment, and Electronic Equipment and Hardware. The Media, Airlines, and Consumer Services industries performed the worst. Among style factors, larger capitalization and price momentum were rewarded, and profitability was the weakest factor of the Period.
The Fund screens for capital efficiency, which puts extra weight into that profitability style factor, working directly against the strategy over the Period. This factor-tilted weighting resulted in an unusual circumstance during a year dominated by market-cap weighted technology companies: On an absolute basis, Information Technology was the largest positive sector contributor, but relative to the S&P 500, that same sector was the largest drag. On the other side of the ledger, the worst absolute performance came from the Communications Services sector, while the largest benchmark-relative positive contribution came from our underweight exposure to Utilities.
|
Top Contributors
|
|
|
↑
|
Lam Reseach Corporation
|
|
↑
|
Alphabet Inc.
|
|
↑
|
Apple Inc.
|
|
Top Detractors
|
|
|
↓
|
Netflix, Inc.
|
|
↓
|
Microsoft Corporation
|
|
↓
|
Meta Platforms, Inc.
|
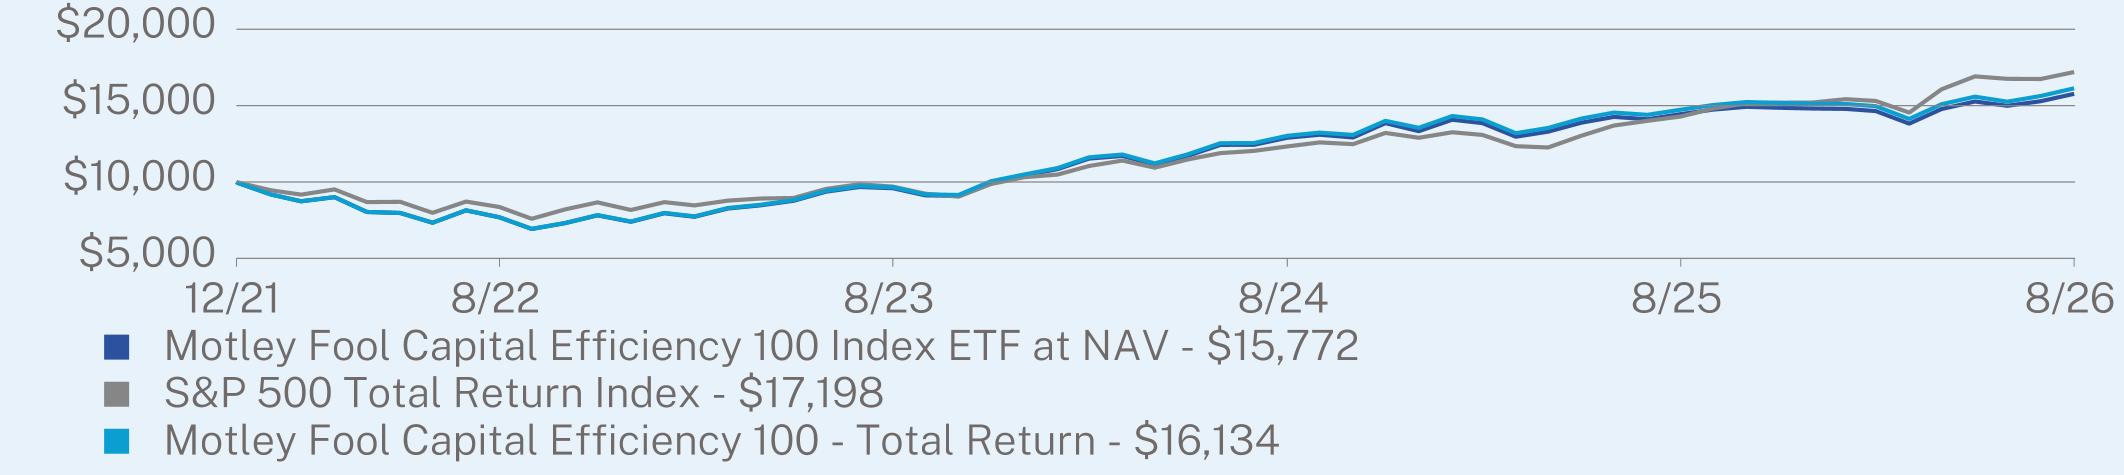
AVERAGE ANNUAL TOTAL RETURN (%)
|
|
1 Year
|
Since Inception
(12/30/2021) |
|
Motley Fool Capital Efficiency 100 Index ETF (at NAV)
|
9.20
|
10.25
|
|
S&P 500 Total Return Index
|
20.38
|
12.32
|
|
Motley Fool Capital Efficiency 100 - Total Return Index
|
9.50
|
10.79
|
Visit https://fooletfs.com/our-funds for more recent performance information.
KEY FUND STATISTICS (as of August 31, 2026)
|
Net Assets
|
$78,399,154
|
|
Number of Holdings
|
100
|
|
Net Advisory Fee
|
$451,830
|
|
Portfolio Turnover
|
41%
|
|
30-Day SEC Yield
|
0.11%
|
|
30-Day SEC Yield Unsubsidized
|
0.11%
|
WHAT DID THE FUND INVEST IN? (as of August 31, 2026)
|
Top 10 Holdings
|
(% of Net Assets)
|
|
|
Mastercard, Inc.
|
5.6
|
%
|
|
Visa, Inc.
|
5.2
|
%
|
|
Amazon.com, Inc.
|
5.0
|
%
|
|
NVIDIA Corp.
|
4.9
|
%
|
|
Apple, Inc.
|
4.8
|
%
|
|
Meta Platforms, Inc.
|
4.6
|
%
|
|
Costco Wholesale Corp.
|
4.5
|
%
|
|
Alphabet, Inc.
|
4.3
|
%
|
|
Netflix, Inc.
|
4.1
|
%
|
|
Walmart, Inc.
|
4.0
|
%
|
|
Top Sectors
|
(% of Net Assets)
|
|
|
Information Technology
|
28.6
|
%
|
|
Consumer Discretionary
|
16.3
|
%
|
|
Communication Services
|
14.0
|
%
|
|
Consumer Staples
|
11.0
|
%
|
|
Financials
|
10.9
|
%
|
|
Health Care
|
10.1
|
%
|
|
Industrials
|
6.6
|
%
|
|
Materials
|
2.1
|
%
|
|
Real Estate
|
0.2
|
%
|
|
Cash & Other
|
0.2
|
%
|
Changes to Fund’s Portfolio Manager or Portfolio Management Team during the Period:
William H. Mann III was added as a named portfolio manager to the Fund as of December 31, 2025.
This report describes changes to the Fund that occurred during the reporting period.
WHAT WERE THE FUND COSTS FOR THE PERIOD? (based on a hypothetical $10,000 investment)
|
Fund Name
|
Costs of a $10,000 investment
|
Costs paid as a percentage of a $10,000 investment
|
|
Motley Fool Next Index ETF
|
$54
|
0.50%
|
HOW DID THE FUND PERFORM DURING THE PERIOD AND WHAT AFFECTED ITS PERFORMANCE?
For the Period, the Fund outperformed its benchmark, the Russell Midcap Growth Total Return Index (the “Benchmark”). The Fund closely tracked its underlying index, the Motley Fool Next Index.
WHAT FACTORS INFLUENCED PERFORMANCE?
While the midcap space is not leveraged to a handful of megacap tech companies like the large-cap indices happen to be, the artificial intelligence-optimism trade still drove a large amount of performance variance across industries. Additionally, much of our positive variance versus the Benchmark can be attributed to Biotechnology stocks during the Period. On the other hand, consumer-facing companies generally had a rough go of it. Among style factors, several pure “Growth” factors underperformed “Value” stocks during the Period. Relative to the Benchmark, this helped, since the holdings of this Fund are less driven by statistical growth factors than by qualitative assessment.
On an absolute basis, the best sector contributor for the Fund was Health Care. In fact, the Health Care and Information Technology sectors combined to contribute more than 100% of the Fund’s total return for the Period. Worst on an absolute basis was Consumer Discretionary, followed by Real Estate. Relative to the Benchmark, the top contributors remained the same while Energy, or specifically our lack of exposure to it, was the largest drag.
|
Top Contributors
|
|
|
↑
|
Astera Labs, Inc.
|
|
↑
|
Moderna, Inc.
|
|
↑
|
Coherent Corp.
|
|
Top Detractors
|
|
|
↓
|
Tractor Supply Company
|
|
↓
|
Insulet Corporation
|
|
↓
|
HubSpot, Inc.
|
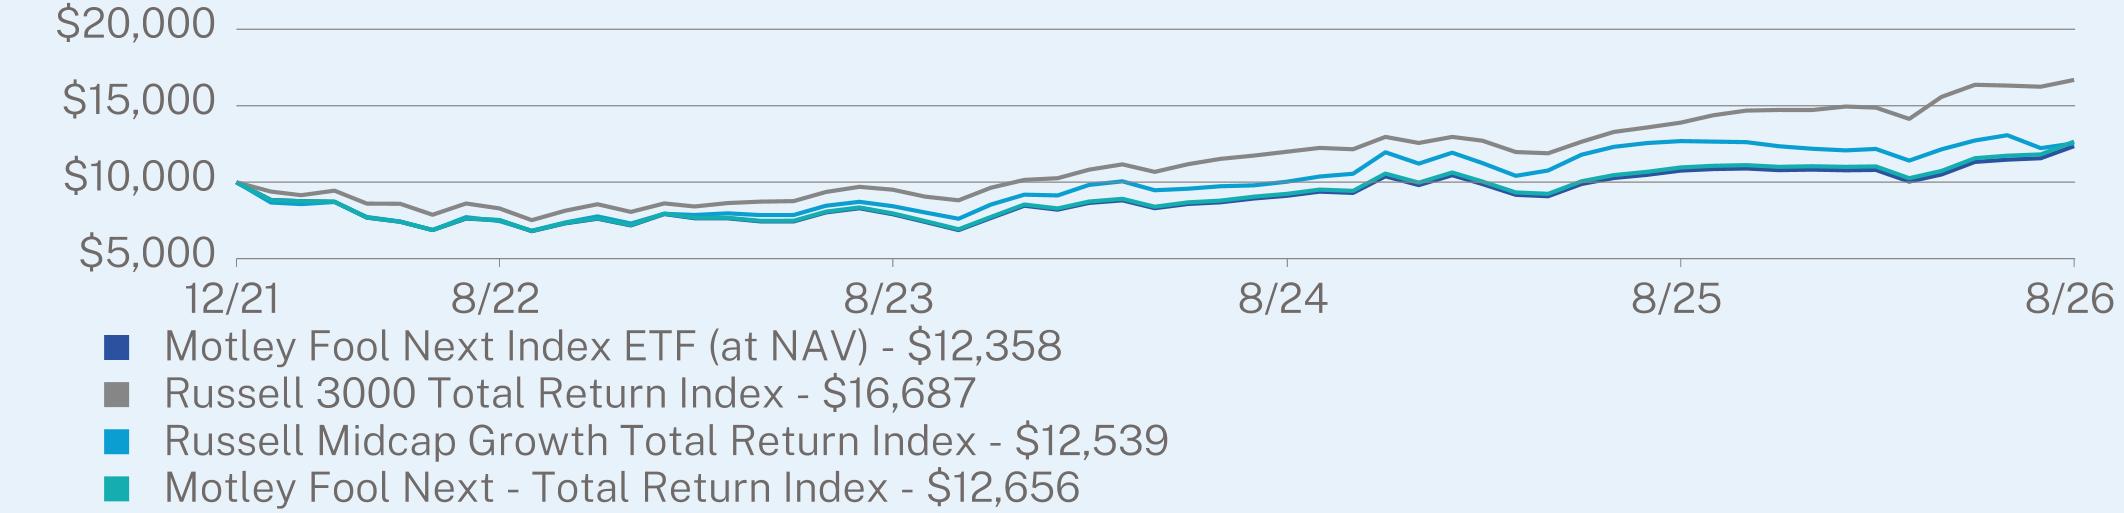
AVERAGE ANNUAL TOTAL RETURN (%)
|
|
1 Year
|
Since Inception
(12/30/2021) |
|
Motley Fool Next Index ETF (at NAV)
|
14.88
|
4.64
|
|
Russell 3000 Total Return Index
|
20.10
|
11.59
|
|
Russell Midcap Growth Total Return Index
|
-1.16
|
4.97
|
|
Motley Fool Next - Total Return Index
|
15.42
|
5.18
|
Visit https://fooletfs.com/our-funds for more recent performance information.
KEY FUND STATISTICS (as of August 31, 2026)
|
Net Assets
|
$35,049,479
|
|
Number of Holdings
|
197
|
|
Net Advisory Fee
|
$163,915
|
|
Portfolio Turnover
|
42%
|
|
30-Day SEC Yield
|
0.01%
|
|
30-Day SEC Yield Unsubsidized
|
0.01%
|
WHAT DID THE FUND INVEST IN? (as of August 31, 2026)
|
Top 10 Holdings
|
(% of Net Assets)
|
|
|
Moderna, Inc.
|
2.6
|
%
|
|
Workday, Inc.
|
2.2
|
%
|
|
Veeva Systems, Inc.
|
2.0
|
%
|
|
MongoDB, Inc.
|
1.6
|
%
|
|
DexCom, Inc.
|
1.6
|
%
|
|
Cognizant Technology Solutions Corp.
|
1.5
|
%
|
|
ResMed, Inc.
|
1.5
|
%
|
|
Twilio, Inc.
|
1.5
|
%
|
|
EQT Corp.
|
1.5
|
%
|
|
Cboe Global Markets, Inc.
|
1.5
|
%
|
|
Top Sectors
|
(% of Net Assets)
|
|
|
Information Technology
|
26.1
|
%
|
|
Health Care
|
23.9
|
%
|
|
Industrials
|
14.9
|
%
|
|
Consumer Discretionary
|
13.5
|
%
|
|
Financials
|
9.7
|
%
|
|
Consumer Staples
|
3.9
|
%
|
|
Communication Services
|
3.1
|
%
|
|
Real Estate
|
1.7
|
%
|
|
Energy
|
1.5
|
%
|
|
Cash & Other
|
1.7
|
%
|
Changes to Fund’s Portfolio Manager or Portfolio Management Team during the Period:
William H. Mann III was added as a named portfolio manager to the Fund as of December 31, 2025.
WHAT WERE THE FUND COSTS FOR THE PERIOD?* (based on a hypothetical $10,000 investment)
|
Fund Name
|
Costs of a $10,000 investment
|
Costs paid as a percentage of a $10,000 investment**
|
|
Motley Fool Momentum Factor ETF
|
$38
|
0.50%
|
HOW DID THE FUND PERFORM DURING THE PERIOD AND WHAT AFFECTED ITS PERFORMANCE?
For the Period, the Fund underperformed its benchmark, the S&P 500. The Fund closely tracked its underlying index, the Motley Fool Momentum Index.
WHAT FACTORS INFLUENCED PERFORMANCE?
Market leadership was unusually narrow over the Period. The artificial intelligence-optimism trade dominated, with the best industry performance turned in from Semiconductors, Communications Equipment, and Electronic Equipment and Hardware. While the Fund had significant investments in Semiconductors, it was underweight with other tech hardware industries. And while the AI trade provided positive value for much of the period, it declined sharply in July, primarily when weighted by momentum. Among style factors, the Fund’s focus on momentum meant a higher exposure to factors that underperformed the broad market, most notably beta and long-term trends.
On an absolute basis, the Information Technology sector was the best performer. Accounting for more than 40% of the Fund on average during the Period, this sector was responsible for more than the entirety of the Fund’s return during the Period, with the remaining sectors providing negative performance. The largest drag to performance was the Communications Services sector. On a relative basis, the best- and worst-performing sectors remained the same.
|
Top Contributors
|
|
|
↑
|
Advanced Micro Devices, Inc.
|
|
↑
|
Intel Corporation
|
|
↑
|
Lam Research Corporation
|
|
Top Detractors
|
|
|
↓
|
AppLovin Corporation
|
|
↓
|
Astera Labs, Inc.
|
|
↓
|
Roblox Corporation
|
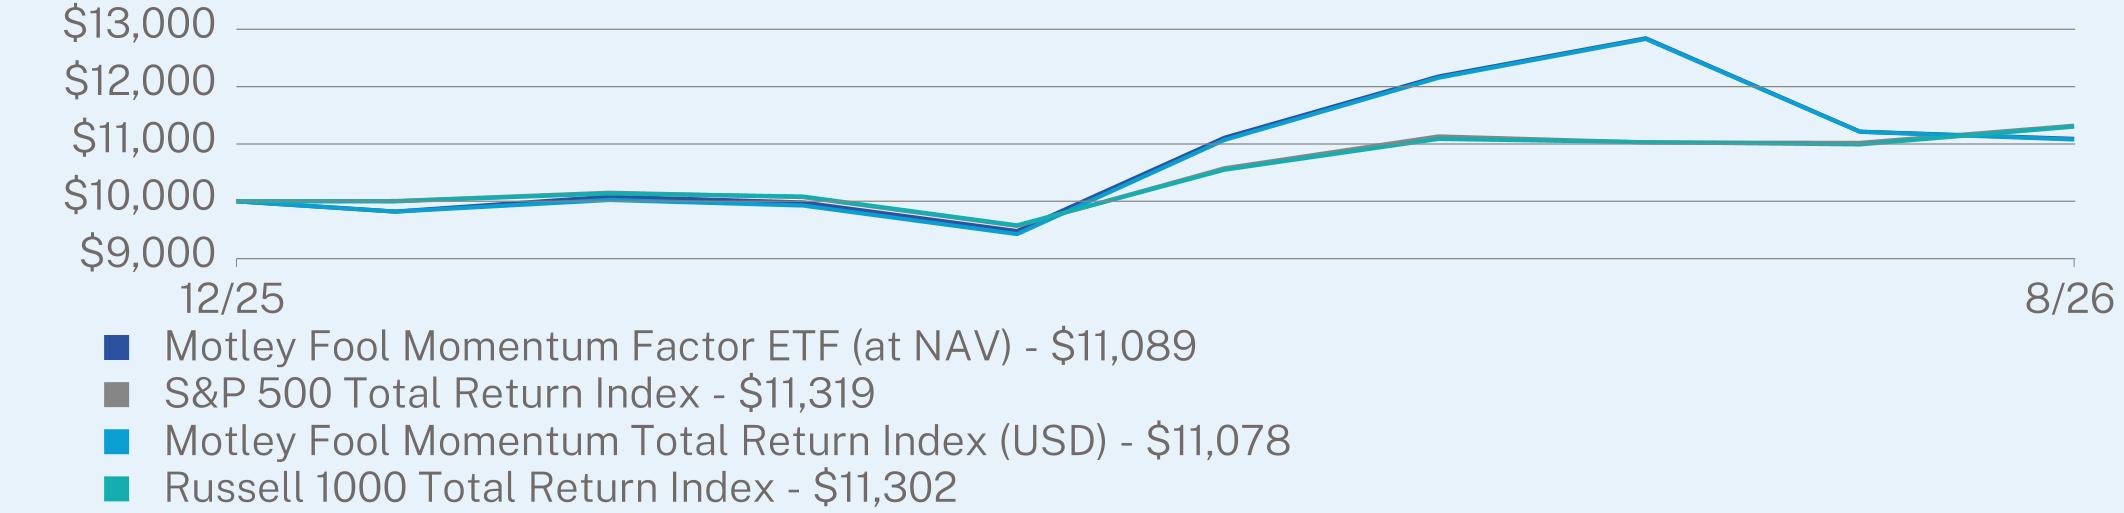
AVERAGE ANNUAL TOTAL RETURN (%)
|
|
Since Inception
(12/08/2025) |
|
Motley Fool Momentum Factor ETF (at NAV)
|
10.89
|
|
S&P 500 Total Return Index
|
13.19
|
|
Motley Fool Momentum Total Return Index (USD)
|
10.78
|
|
Russell 1000 Total Return Index
|
13.02
|
Visit https://fooletfs.com/our-funds for more recent performance information.
KEY FUND STATISTICS (as of August 31, 2026)
|
Net Assets
|
$12,862,860
|
|
Number of Holdings
|
72
|
|
Net Advisory Fee
|
$28,706
|
|
Portfolio Turnover
|
100%
|
|
30-Day SEC Yield
|
0.14%
|
|
30-Day SEC Yield Unsubsidized
|
0.14%
|
WHAT DID THE FUND INVEST IN? (as of August 31, 2026)
|
Top 10 Holdings
|
(% of Net Assets)
|
|
|
ExxonMobil Holdings Corp.
|
6.4
|
%
|
|
NVIDIA Corp.
|
5.9
|
%
|
|
Alphabet, Inc.
|
5.2
|
%
|
|
Broadcom, Inc.
|
5.2
|
%
|
|
Gloldman Sachs Grou, Inc.
|
5.1
|
%
|
|
Advanced Micro Devices, Inc.
|
4.7
|
%
|
|
Lam Research Corp.
|
4.2
|
%
|
|
Comfort Systems USA, Inc.
|
4.0
|
%
|
|
Corning, Inc.
|
3.9
|
%
|
|
Palo Alto Networks, Inc.
|
3.7
|
%
|
|
Top Sectors
|
(% of Net Assets)
|
|
|
Information Technology
|
50.0
|
%
|
|
Industrials
|
18.0
|
%
|
|
Financials
|
6.6
|
%
|
|
Communication Services
|
6.5
|
%
|
|
Energy
|
6.4
|
%
|
|
Health Care
|
5.3
|
%
|
|
Consumer Discretionary
|
3.1
|
%
|
|
Consumer Staples
|
2.6
|
%
|
|
Real Estate
|
0.8
|
%
|
|
Cash & Other
|
0.7
|
%
|
WHAT WERE THE FUND COSTS FOR THE PERIOD?* (based on a hypothetical $10,000 investment)
|
Fund Name
|
Costs of a $10,000 investment
|
Costs paid as a percentage of a $10,000 investment**
|
|
Motley Fool Value Factor ETF
|
$39
|
0.50%
|
HOW DID THE FUND PERFORM DURING THE PERIOD AND WHAT AFFECTED ITS PERFORMANCE?
From the Fund’s commencement of operations through the Period, the Fund underperformed its benchmark, the Russell 1000 Value Index (the “Benchmark”). The Fund closely tracked its underlying index, the Motley Fool Value Index (the “Index”).
WHAT FACTORS INFLUENCED PERFORMANCE?
Market leadership was unusually narrow over the Period. The artificial intelligence-optimism trade dominated. Stylistically, statistical value stocks performed much better than statistical growth stocks over the period. At the same time, style factors that are typically defined to assess company quality as opposed to value, for example earnings quality and profitability factors, performed worse than pure value factors such as earnings multiples and dividend yield. This acted as a drag on Fund performance versus the Benchmark, given the Index’s differentiated calculation of the value factor.
The Fund’s factor-tilted weighting resulted in an unusual circumstance during a year dominated by market-cap weighted technology companies: On an absolute basis, Information Technology was the largest positive sector contributor, but relative to its Benchmark, that same sector was the largest drag. While no other sector came close to delivering the same relative underperformance, several sectors contributed similar positive amounts on an absolute basis, led by the Health Care and Industrials sectors. On a relative basis, the best-performing sector was Industrials, while the worst absolute performance came from Communication Services.
|
Top Contributors
|
|
|
↑
|
FedEx Corporation
|
|
↑
|
Salesforce, Inc.
|
|
↑
|
CVS Health Corporation
|
|
Top Detractors
|
|
|
↓
|
Nike, Inc.
|
|
↓
|
Adobe Inc.
|
|
↓
|
HCA Healthcare, Inc.
|
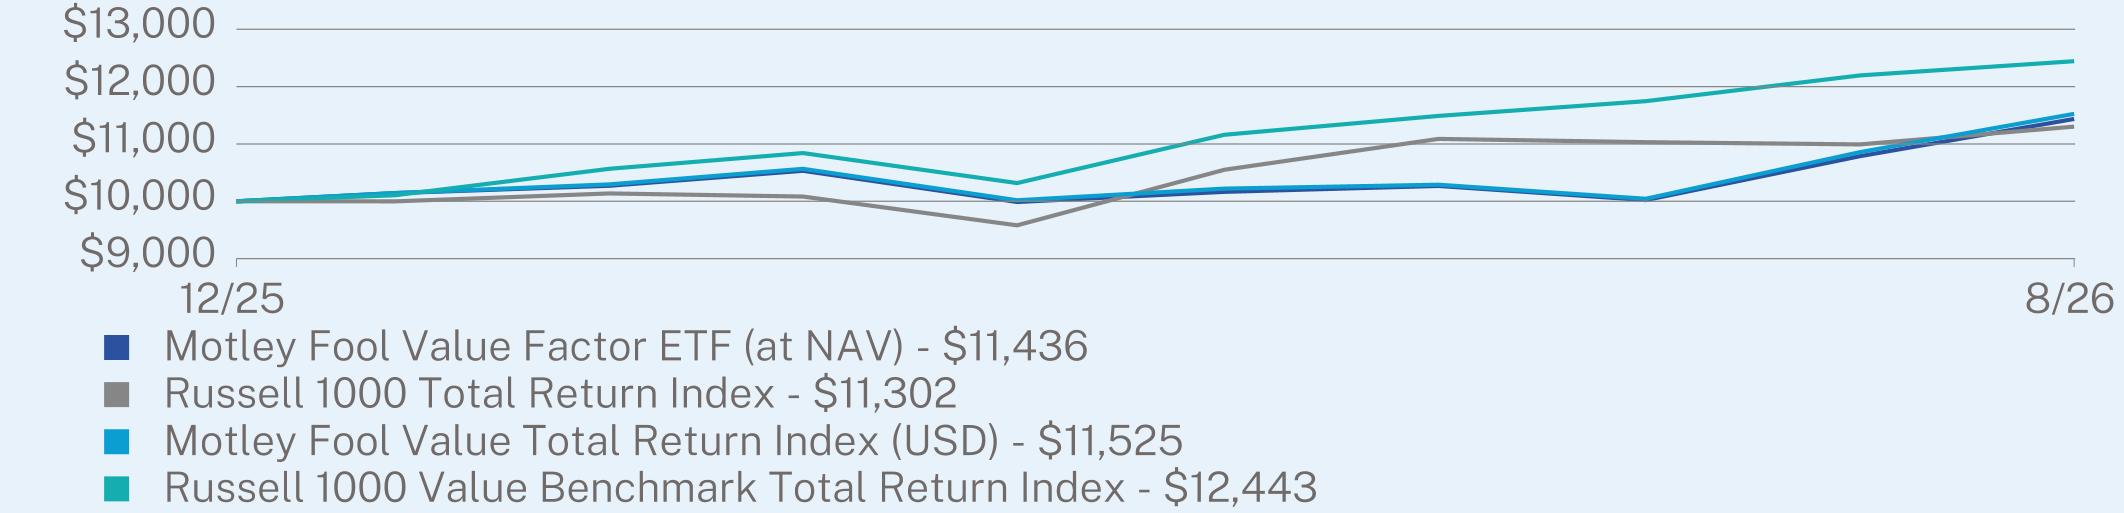
AVERAGE ANNUAL TOTAL RETURN (%)
|
|
Since Inception
(12/08/2025) |
|
Motley Fool Value Factor ETF (at NAV)
|
14.36
|
|
Russell 1000 Total Return Index
|
13.02
|
|
Motley Fool Value Total Return Index (USD)
|
15.25
|
|
Russell 1000 Value Benchmark Total Return Index
|
24.43
|
Visit https://fooletfs.com/our-funds for more recent performance information.
KEY FUND STATISTICS (as of August 31, 2026)
|
Net Assets
|
$7,319,190
|
|
Number of Holdings
|
101
|
|
Net Advisory Fee
|
$20,959
|
|
Portfolio Turnover
|
72%
|
|
30-Day SEC Yield
|
0.96%
|
|
30-Day SEC Yield Unsubsidized
|
0.96%
|
WHAT DID THE FUND INVEST IN? (as of August 31, 2026)
|
Top 10 Holdings
|
(% of Net Assets)
|
|
|
Salesforce, Inc.
|
7.1
|
%
|
|
Chevron Corp.
|
4.9
|
%
|
|
Bristol-Myers Squibb Co.
|
4.9
|
%
|
|
ExxonMobil Holdings Corp.
|
4.9
|
%
|
|
Adobe Systems, Inc.
|
4.7
|
%
|
|
Capital One Financial Corp.
|
4.4
|
%
|
|
Walt Disney Co.
|
4.3
|
%
|
|
T-Mobile US, Inc.
|
4.1
|
%
|
|
CVS Health Corp.
|
3.9
|
%
|
|
Booking Holdings, Inc.
|
3.4
|
%
|
|
Top Sectors
|
(% of Net Assets)
|
|
|
Information Technology
|
23.7
|
%
|
|
Health Care
|
15.9
|
%
|
|
Financials
|
14.5
|
%
|
|
Consumer Discretionary
|
14.3
|
%
|
|
Energy
|
11.4
|
%
|
|
Connunication Services
|
9.8
|
%
|
|
Industrials
|
5.0
|
%
|
|
Consumer Staples
|
3.1
|
%
|
|
Real Estate
|
1.3
|
%
|
|
Cash & Other
|
1.0
|
%
|
WHAT WERE THE FUND COSTS FOR THE PERIOD?* (based on a hypothetical $10,000 investment)
|
Fund Name
|
Costs of a $10,000 investment
|
Costs paid as a percentage of a $10,000 investment**
|
|
Motley Fool Innovative Growth Factor ETF
|
$38
|
0.50%
|
HOW DID THE FUND PERFORM DURING THE PERIOD AND WHAT AFFECTED ITS PERFORMANCE?
For the Period, the Fund outperformed its benchmark, the Russell 1000 Growth Index (the “Benchmark”). The Fund closely tracked its underlying index, the Motley Fool Innovative Growth Index.
WHAT FACTORS INFLUENCED PERFORMANCE?
Market leadership was unusually narrow over the Period. The artificial intelligence-optimism trade dominated, with the best industry performance turned in from Semiconductors, Communications Equipment, and Electronic Equipment and Hardware. In fact looking beyond the Information Technology sector, the remaining performance for both the Fund and the Benchmark was meaningfully negative. Stylistically, statistical growth stocks performed much worse than statistical value stocks over the period. This helped Fund performance versus the Benchmark, given our index’s differentiated calculation of the growth factor.
On an absolute basis, the Information Technology sector was the best performer. With an average weight around 35% of the Fund, this sector was essentially responsible for the entirety of the Fund’s return during the Period, with the remaining sectors canceling each other out. The largest drag to performance was the Communications Services sector. On a relative basis, the best- and worst-performing sectors remained the same. Information Technology remained at the top despite an underweight allocation relative to the Benchmark, while Communications Services remained at the bottom.
|
Top Contributors
|
|
|
↑
|
Lam Research Corporation
|
|
↑
|
Chevron Corporation
|
|
↑
|
CrowdStrike Holdings, Inc.
|
|
Top Detractors
|
|
|
↓
|
AppLovin Corporation
|
|
↓
|
Alnylam Pharmaceuticals, Inc.
|
|
↓
|
Netflix, Inc.
|
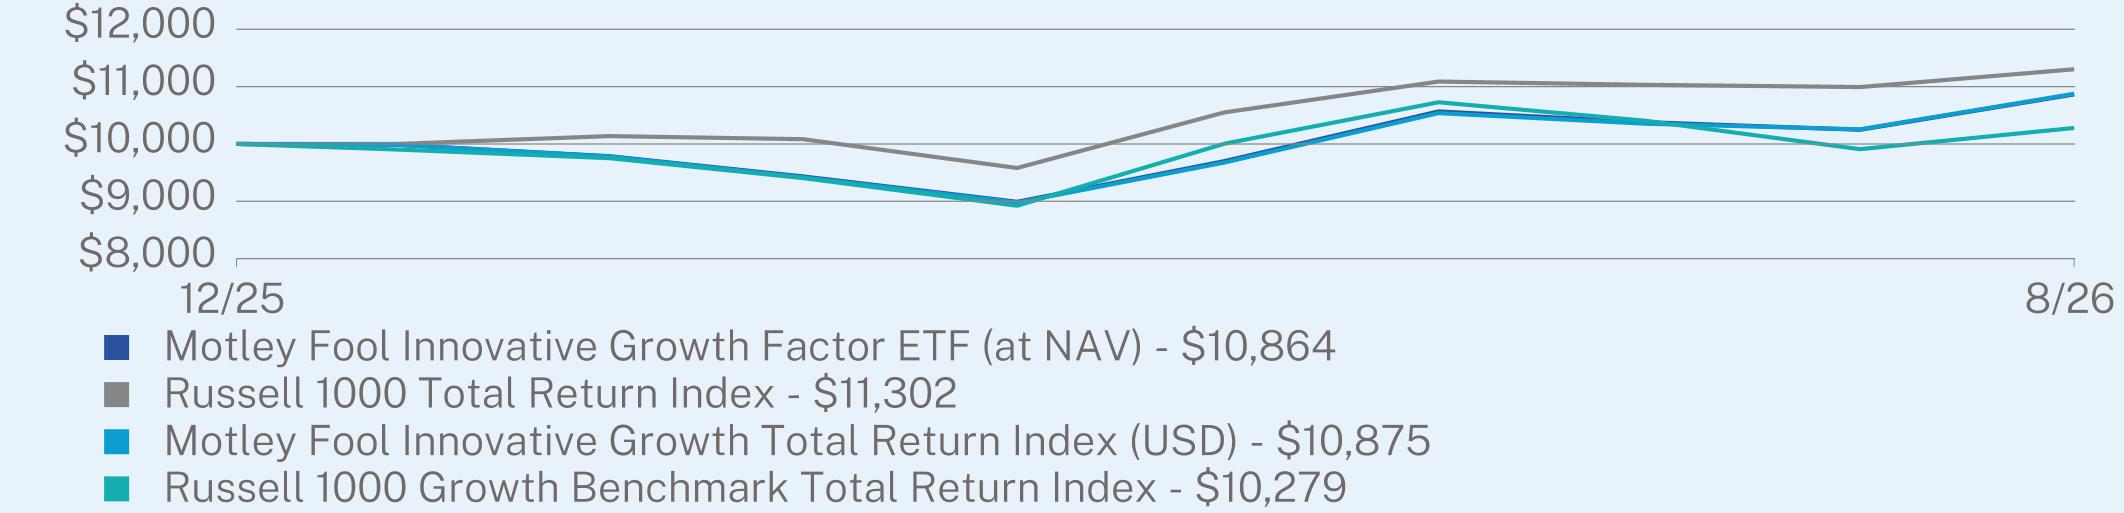
AVERAGE ANNUAL TOTAL RETURN (%)
|
|
Since Inception
(12/08/2025) |
|
Motley Fool Innovative Growth Factor ETF (at NAV)
|
8.64
|
|
Russell 1000 Total Return Index
|
13.02
|
|
Motley Fool Innovative Growth Total Return Index (USD)
|
8.75
|
|
Russell 1000 Growth Benchmark Total Return Index
|
2.79
|
Visit https://fooletfs.com/our-funds for more recent performance information.
KEY FUND STATISTICS (as of August 31, 2026)
|
Net Assets
|
$11,733,206
|
|
Number of Holdings
|
100
|
|
Net Advisory Fee
|
$28,610
|
|
Portfolio Turnover
|
104%
|
|
30-Day SEC Yield
|
-0.03%
|
|
30-Day SEC Yield Unsubsidized
|
-0.03%
|
WHAT DID THE FUND INVEST IN? (as of August 31, 2026)
|
Top 10 Holdings
|
(% of Net Assets)
|
|
|
Netflix, Inc.
|
5.0
|
%
|
|
NVIDIA Corp.
|
4.8
|
%
|
|
Apple, Inc.
|
4.8
|
%
|
|
Meta Platforms, Inc.
|
4.8
|
%
|
|
Crowdstrike Holdings, Inc.
|
4.6
|
%
|
|
Alphabet, Inc.
|
4.4
|
%
|
|
Snowflake, Inc.
|
4.3
|
%
|
|
Uber Technologies, Inc.
|
3.5
|
%
|
|
Adobe Systems, Inc.
|
3.5
|
%
|
|
Gilead Sciences, Inc.
|
3.5
|
%
|
|
Top Sectors
|
(% of Net Assets)
|
|
|
Information Technology
|
44.2
|
%
|
|
Communication Services
|
16.1
|
%
|
|
Health Care
|
15.4
|
%
|
|
Consumer Discretionary
|
12.3
|
%
|
|
Industrials
|
6.7
|
%
|
|
Utilities
|
2.0
|
%
|
|
Consumer Staples
|
1.2
|
%
|
|
Energy
|
0.8
|
%
|
|
Financials
|
0.6
|
%
|
|
Cash & Other
|
0.7
|
%
|
WHAT WERE THE FUND COSTS FOR THE PAST YEAR? (based on a hypothetical $10,000 investment)
|
Fund Name
|
Costs of a $10,000 investment
|
Costs paid as a percentage of a $10,000 investment
|
|
SGI US Large Cap Core ETF
|
$97
|
0.85%
|
HOW DID THE FUND PERFORM LAST YEAR AND WHAT AFFECTED ITS PERFORMANCE?
US stocks achieved strong gains during the Period, reflecting enormous positive sentiment for artificial intelligence companies, a relatively strong economy, and upward revised earnings estimates. However, due to investors’ lack of interest in defensive low volatility stocks, they significantly lagged the overall stock market.
Strong security selection was the primary reason for the significant outperformance relative to the benchmark during the Period. Security selection in the Information Technology sector led by Micron Technology, Roper Technologies, and Motorola Solutions significantly contributed to relative performance. Additionally, security selection in the Health Care sector led by Merck, Regeneron Pharmaceuticals, and United Therapeutics all contributed to the relative performance of the Fund.
In contrast, stock selection in the Industrials sector detracted from relative performance. In particular, Automatic Data Processing, Paychex, and Cummins Inc. all dropped during the Period and hurt relative performance.
The Fund is actively managed therefore notable changes in absolute positioning during the Period include an increase in exposure to Information Technology, Financials, and Utilities sectors and a decrease in exposure to Consumer Staples and Industrials sectors.
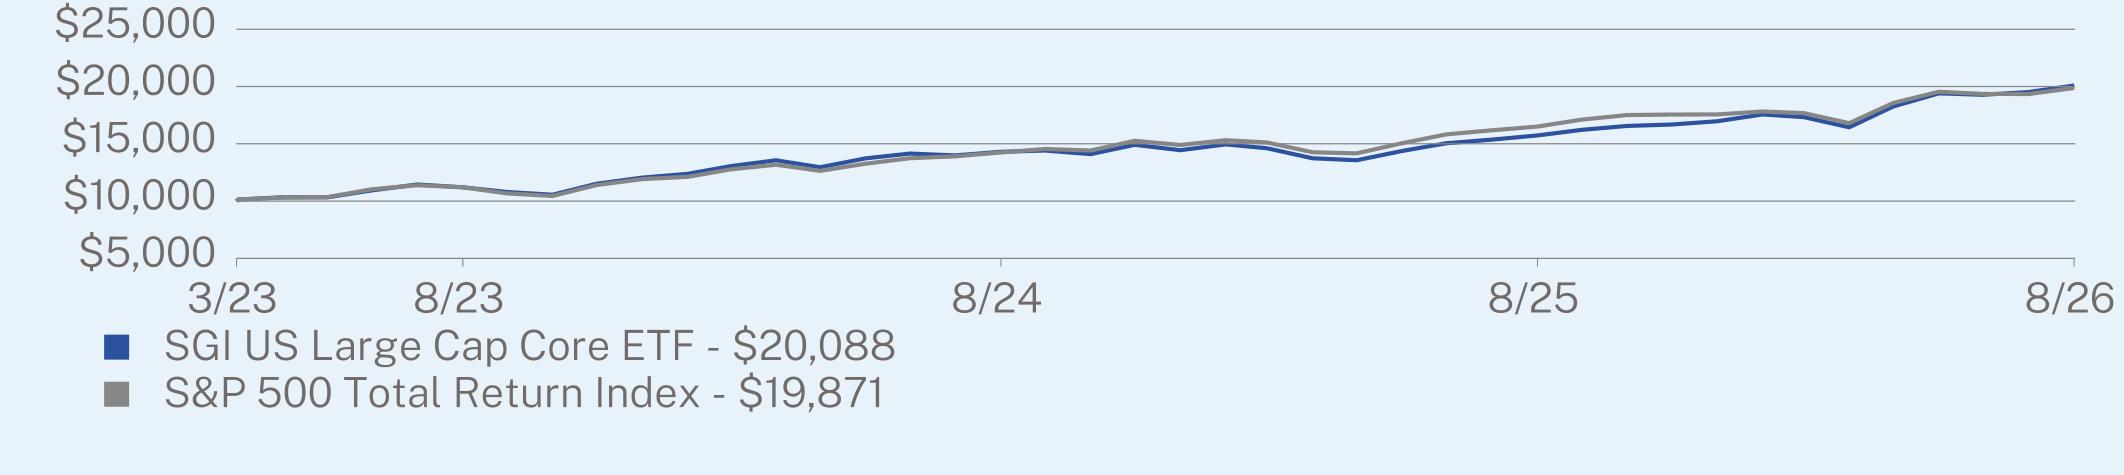
ANNUAL AVERAGE TOTAL RETURN (%)
|
|
1 Year
|
Since Inception
(03/30/2023) |
|
SGI US Large Cap Core ETF
|
27.69
|
22.61
|
|
S&P 500 Total Return Index
|
20.38
|
22.22
|
Visit https://sgiam.com/literature/ for more recent performance information.
KEY FUND STATISTICS (as of August 31, 2026)
|
Net Assets
|
$212,213,161
|
|
Number of Holdings
|
142
|
|
Net Advisory Fee
|
$1,272,104
|
|
Portfolio Turnover
|
97%
|
|
30-Day SEC Yield
|
0.04%
|
|
30-Day SEC Yield Unsubsidized
|
0.04%
|
WHAT DID THE FUND INVEST IN? (as of August 31, 2026)
|
Top Holdings
|
(% of Net Assets)
|
|
NVIDIA Corp.
|
8.1%
|
|
Apple, Inc.
|
6.8%
|
|
Alphabet, Inc.
|
6.1%
|
|
Microsoft Corp.
|
5.8%
|
|
Amazon.com, Inc.
|
4.2%
|
|
Broadcom, Inc.
|
2.6%
|
|
Meta Platforms, Inc.
|
2.3%
|
|
Micron Technology, Inc.
|
2.1%
|
|
JPMorgan Chase & Co.
|
1.8%
|
|
Eli Lilly & Co.
|
1.7%
|
|
Top Sectors
|
(% of Net Assets)
|
|
Technology
|
35.2%
|
|
Financial
|
17.8%
|
|
Communications
|
17.3%
|
|
Consumer, Non-cyclical
|
12.8%
|
|
Consumer, Cyclical
|
6.0%
|
|
Industrial
|
4.3%
|
|
Energy
|
3.5%
|
|
Basic Materials
|
1.6%
|
|
Utilities
|
1.3%
|
|
Cash & Other
|
0.2%
|
CHANGES IN AND DISAGREEMENTS WITH ACCOUNTANTS
The Auditor has been changed from Ernst & Young LLP to Tait, Weller, & Baker, LLP.
WHAT WERE THE FUND COSTS FOR THE PAST YEAR? (based on a hypothetical $10,000 investment)
|
Fund Name
|
Costs of a $10,000 investment
|
Costs paid as a percentage of a $10,000 investment
|
|
SGI Dynamic Tactical ETF
|
$101
|
0.95%
|
HOW DID THE FUND PERFORM LAST YEAR AND WHAT AFFECTED ITS PERFORMANCE?
US stocks achieved strong gains during the Period, reflecting enormous positive sentiment for artificial intelligence companies, a relatively strong economy, and upward revised earnings estimates. International stocks from developed markets achieved slightly better results, while in aggregate bonds performed poorly with returns of less than 2%, and cash had modest positive returns.
Allocation to stocks, both domestic and international, and gold was the primary reason for the outperformance relative to the benchmark. The top contributing fund allocations that benefitted relative returns were SGI U.S. Large Cap Core Fund, Vanguard Information Technology ETF, and SPDR Gold Shares.
All of our exposure to fixed income funds and cash hurt relative performance as those asset classes underperformed during the Period. The bottom contributing fund allocations that hurt relative returns were iShares MSCI USA Momentum Factor ETF, iShares Treasury Fund, and WisdomTree Floating Rate Fund.
The Fund is actively managed therefore notable changes in absolute positioning during the Period include an increase in exposure to Vanguard Information Technology ETF, iShares U.S.Real Estate ETF, and iShares Core S&P Mid-Cap ETF. These changes were funded by a decrease in exposure to iShares MSCI USA Momentum ETF, iShares U.S. Large Cap Core Fund, and SGI Enhanced Core ETF.
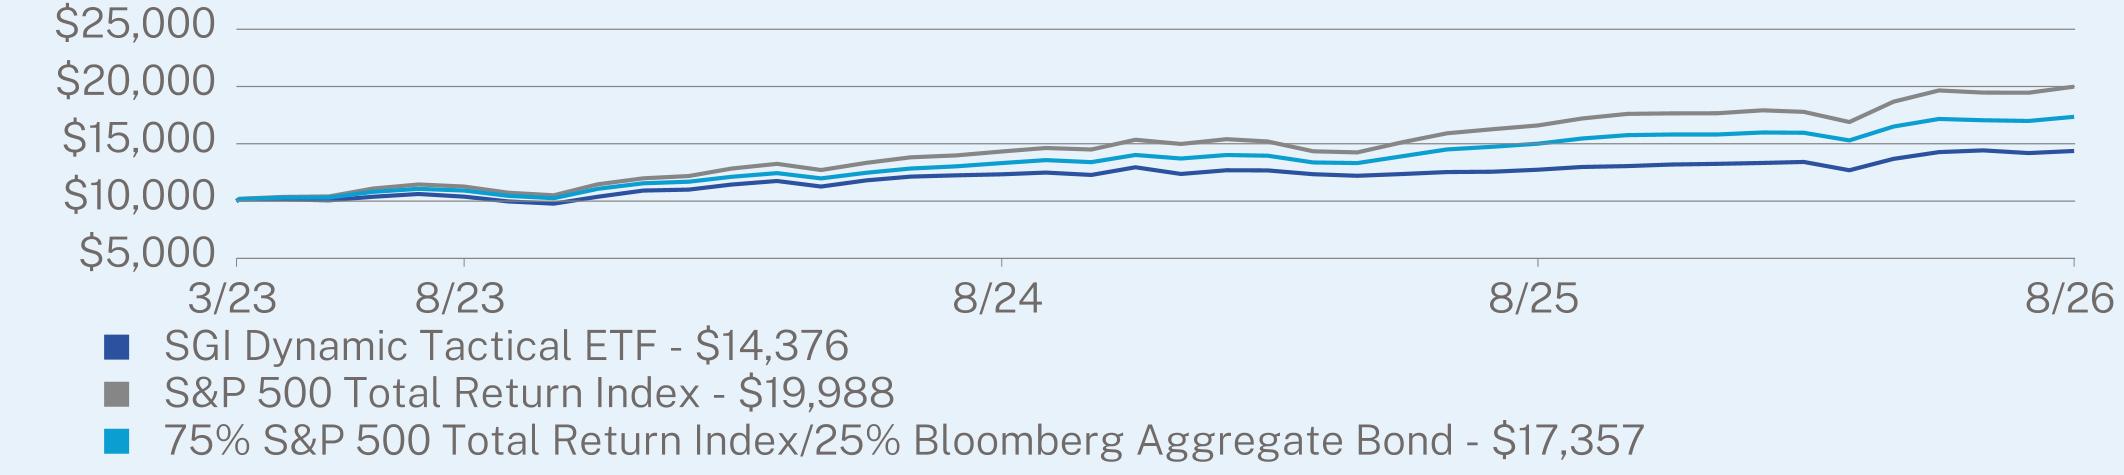
ANNUAL AVERAGE TOTAL RETURN (%)
|
|
1 Year
|
Since Inception
(03/29/2023) |
|
SGI Dynamic Tactical ETF
|
12.85
|
11.18
|
|
S&P 500 Total Return Index
|
20.38
|
22.41
|
|
75% S&P 500 Total Return Index/25% Bloomberg Aggregate Bond
|
15.63
|
17.47
|
Visit https://sgiam.com/literature/ for more recent performance information.
KEY FUND STATISTICS (as of August 31, 2026)
|
Net Assets
|
$107,994,248
|
|
Number of Holdings
|
9
|
|
Net Advisory Fee
|
$787,813
|
|
Portfolio Turnover
|
76%
|
|
30-Day SEC Yield
|
0.88%
|
|
30-Day SEC Yield Unsubsidized
|
0.88%
|
WHAT DID THE FUND INVEST IN? (as of August 31, 2026)
|
Top Holdings
|
(% of Net Assets)
|
|
SGI U.S. Large Cap Core ETF
|
20.9%
|
|
Vanguard Information Technology ETF
|
10.1%
|
|
iShares MSCI USA Momentum Factor ETF
|
9.1%
|
|
iShares Core S&P Mid-Cap ETF
|
8.5%
|
|
iShares U.S. Real Estate ETF
|
8.0%
|
|
Vanguard Total International Stock ETF
|
3.1%
|
|
Schwab International Equity ETF
|
2.9%
|
|
iShares MSCI ACWI ex U.S. ETF
|
2.9%
|
|
Top Sector
|
(% of Net Assets)
|
|
Technology
|
25.8%
|
|
Real Estate
|
9.1 %
|
|
Financials
|
6.8%
|
|
Industrials
|
6.2%
|
|
Healthcare
|
4.8%
|
|
Consumer Discretionary
|
3.4%
|
|
Communication Services
|
3.1%
|
|
Energy
|
2.2%
|
|
Consumer Staples
|
1.8%
|
|
Materials
|
1.5%
|
|
Utilities
|
0.7%
|
|
Cash & Other
|
34.6%
|
CHANGES IN AND DISAGREEMENTS WITH ACCOUNTANTS
The Auditor has been changed from Ernst & Young LLP to Tait, Weller, & Baker, LLP.
WHAT WERE THE FUND COSTS FOR THE PAST YEAR? (based on a hypothetical $10,000 investment)
|
Class Name
|
Costs of a $10,000 investment
|
Costs paid as a percentage of a $10,000 investment
|
|
Class I
|
$108
|
0.98%
|
HOW DID THE FUND PERFORM LAST YEAR AND WHAT AFFECTED ITS PERFORMANCE?
US stocks achieved strong gains during the Period, reflecting enormous positive sentiment for artificial intelligence companies, a relatively strong economy, and upward revised earnings estimates.
Strong security selection was the primary reason for the significant outperformance relative to the benchmark during the Period. Security selection in the Information Technology sector led by Micron Technology, Lam Research, and Sandisk significantly contributed to relative performance. Additionally, security selection in the Health Care and Materials sectors both benefited the fund’s relative performance. Health Care sector top contributors were led by Merck, Regeneron Pharmaceuticals, and Eli Lilly. Materials sector top contributors were led by Freeport-McMoran and Newmont.
In contrast, stock selection in the Industrials sector detracted from relative performance. In particular, Automatic Data Processing, Paychex, and Axon Enterprise all fell during the Period and hurt relative performance.
The Fund is actively managed therefore notable changes in absolute positioning during the Period include an increase in exposure to Information Technology, Financials, and Health Care sectors and a decrease in exposure to Consumer Staples and Communications Services sectors.
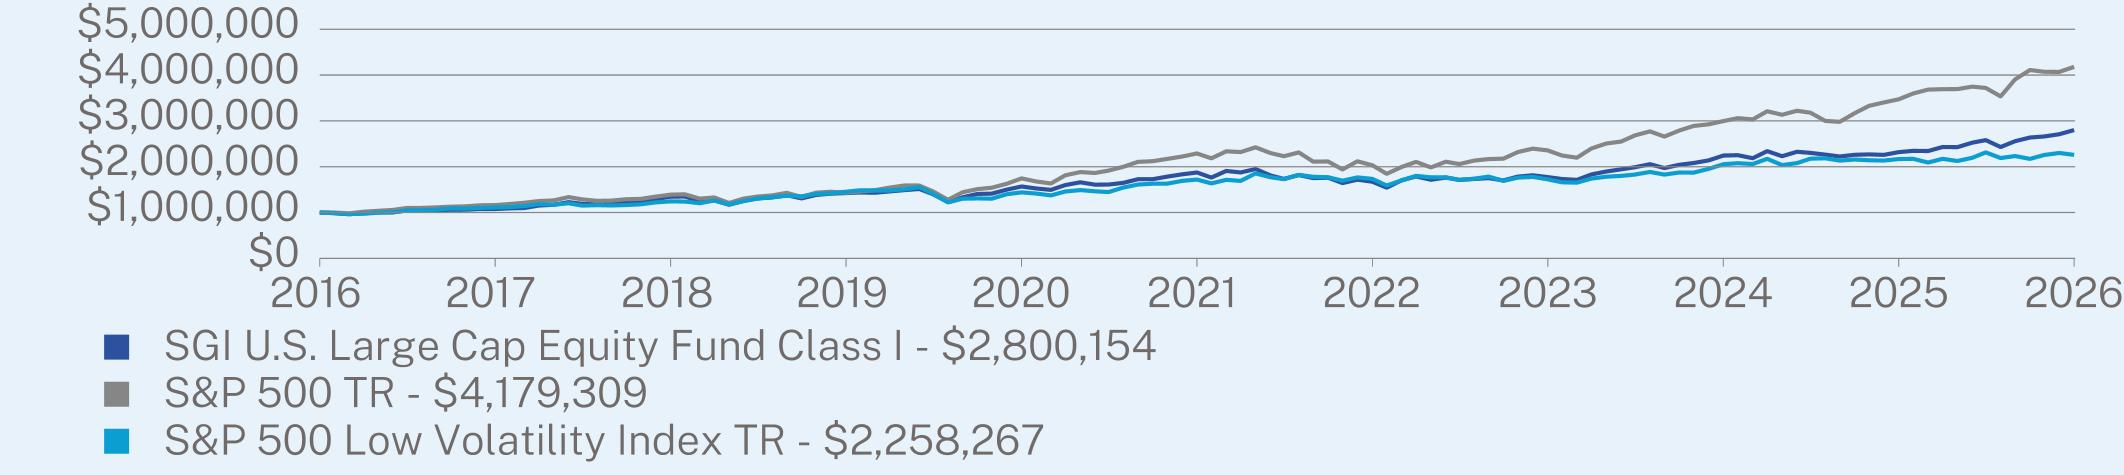
ANNUAL AVERAGE TOTAL RETURN (%)
|
|
1 Year
|
5 Year
|
10 Year
|
|
Class I (without sales charge)
|
20.78
|
8.36
|
10.85
|
|
S&P 500 Total Return Index
|
20.38
|
12.79
|
15.37
|
|
S&P 500 Low Volatility Index Total Return Index
|
4.17
|
5.59
|
8.49
|
Visit https://sgiam.com/literature/ for more recent performance information.
KEY FUND STATISTICS (as of August 31, 2026)
|
Net Assets
|
$199,366,236
|
|
Number of Holdings
|
103
|
|
Net Advisory Fee
|
$1,446,231
|
|
Portfolio Turnover
|
113%
|
|
30-Day SEC Yield
|
0.27%
|
|
30-Day SEC Yield Unsubsidized
|
0.29%
|
WHAT DID THE FUND INVEST IN? (as of August 31, 2026)
|
Top Holdings
|
(% of Net Assets)
|
|
|
NVIDIA Corp.
|
3.7
|
%
|
|
Bank of New York Mellon Corp.
|
3.3
|
%
|
|
Microsoft Corp.
|
3.1
|
%
|
|
Alphabet, Inc.
|
3.1
|
%
|
|
Incyte Corp.
|
3.0
|
%
|
|
Consolidated Edison, Inc.
|
3.0
|
%
|
|
Colgate-Palmolive Co.
|
3.0
|
%
|
|
Micron Technology, Inc.
|
2.7
|
%
|
|
State Street Corp.
|
2.6
|
%
|
|
Palantir Technologies, Inc.
|
2.6
|
%
|
|
Top Sectors
|
(% of Net Assets)
|
|
|
Consumer, Non-cyclical
|
22.8
|
%
|
|
Financial
|
22.4
|
%
|
|
Technology
|
18.7
|
%
|
|
Utilities
|
13.2
|
%
|
|
Communications
|
10.4
|
%
|
|
Consumer, Cyclical
|
4.5
|
%
|
|
Basic Materials
|
3.4
|
%
|
|
Energy
|
2.3
|
%
|
|
Industrial
|
2.1
|
%
|
|
Cash & Other
|
0.2
|
%
|
CHANGES IN AND DISAGREEMENTS WITH ACCOUNTANTS
The Auditor has been changed from Ernst & Young LLP to Tait, Weller, & Baker, LLP.
WHAT WERE THE FUND COSTS FOR THE PAST YEAR? (based on a hypothetical $10,000 investment)
|
Class Name
|
Costs of a $10,000 investment
|
Costs paid as a percentage of a $10,000 investment
|
|
Class A
|
$136
|
1.23%
|
HOW DID THE FUND PERFORM LAST YEAR AND WHAT AFFECTED ITS PERFORMANCE?
US stocks achieved strong gains during the Period, reflecting enormous positive sentiment for artificial intelligence companies, a relatively strong economy, and upward revised earnings estimates.
Strong security selection was the primary reason for the outperformance relative to the benchmark during the Period. Security selection in the Information Technology sector led by Micron Technology, Lam Research, and Sandisk significantly contributed to relative performance. Additionally, security selection in the Health Care and Materials sectors both benefited the Fund’s relative performance. Health Care sector top contributors were led by Merck, Regeneron Pharmaceuticals, and Eli Lilly. Materials sector top contributors were led by Freeport-McMoran and Newmont.
In contrast, stock selection in the Industrials sector detracted from relative performance. In particular, Automatic Data Processing, Paychex, and Axon Enterprise all fell during the Period and hurt relative performance.
The Fund is actively managed therefore notable changes in absolute positioning during the Period include an increase in exposure to Information Technology, Financials, and Health Care sectors and a decrease in exposure to Consumer Staples and Communications Services sectors.
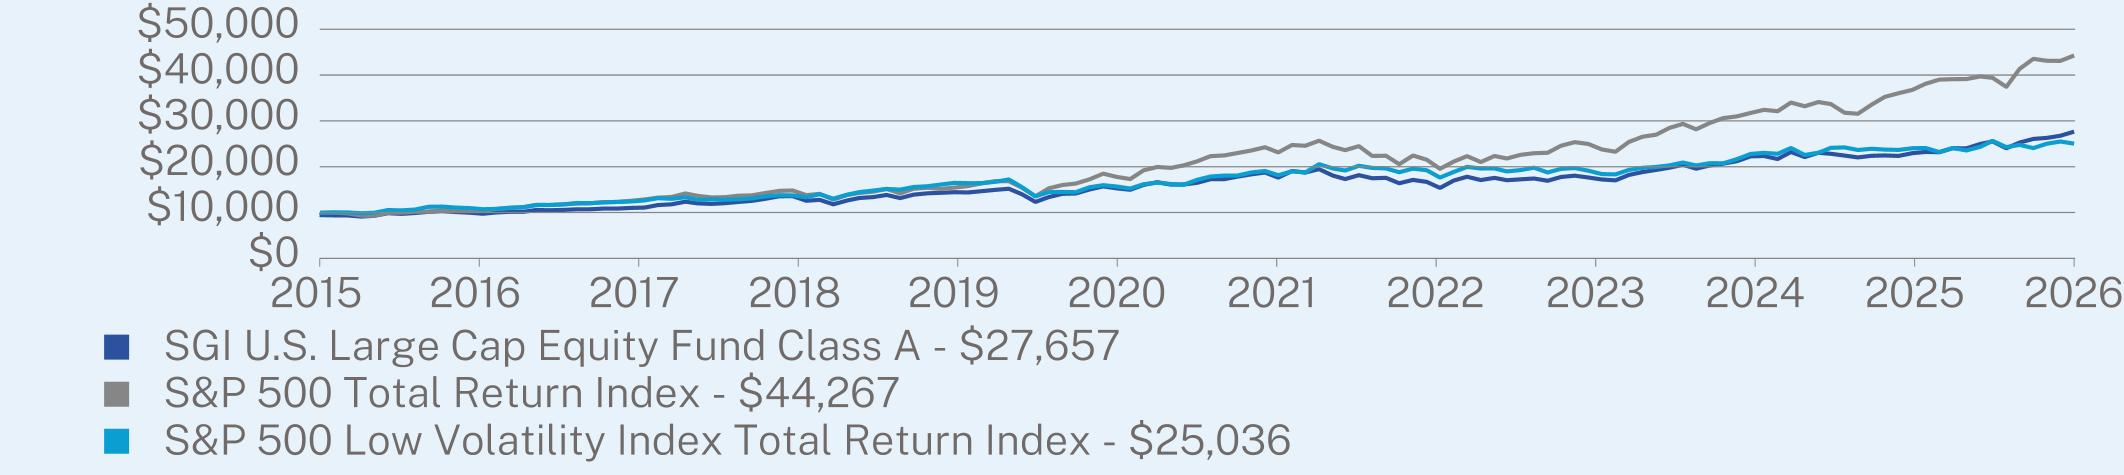
ANNUAL AVERAGE TOTAL RETURN (%)
|
|
1 Year
|
5 Year
|
10 Year
|
|
Class A (without sales charge)
|
20.45
|
8.10
|
10.58
|
|
Class A (with sales charge)
|
14.10
|
6.94
|
9.99
|
|
S&P 500 Total Return Index
|
20.38
|
12.79
|
15.37
|
|
S&P 500 Low Volatility Index Total Return Index
|
4.17
|
5.59
|
8.49
|
Visit https://sgiam.com/literature/ for more recent performance information.
KEY FUND STATISTICS (as of August 31, 2026)
|
Net Assets
|
$199,366,236
|
|
Number of Holdings
|
103
|
|
Net Advisory Fee
|
$1,446,231
|
|
Portfolio Turnover
|
113%
|
|
30-Day SEC Yield
|
0.02%
|
|
30-Day SEC Yield Unsubsidized
|
0.04%
|
WHAT DID THE FUND INVEST IN? (as of August 31, 2026)
|
Top Holdings
|
(% of Net Assets)
|
|
|
NVIDIA Corp.
|
3.7
|
%
|
|
Bank of New York Mellon Corp.
|
3.3
|
%
|
|
Microsoft Corp.
|
3.1
|
%
|
|
Alphabet, Inc.
|
3.1
|
%
|
|
Incyte Corp.
|
3.0
|
%
|
|
Consolidated Edison, Inc.
|
3.0
|
%
|
|
Colgate-Palmolive Co.
|
3.0
|
%
|
|
Micron Technology, Inc.
|
2.7
|
%
|
|
State Street Corp.
|
2.6
|
%
|
|
Palantir Technologies, Inc.
|
2.6
|
%
|
|
Top Sectors
|
(% of Net Assets)
|
|
|
Consumer, Non-cyclical
|
22.8
|
%
|
|
Financial
|
22.4
|
%
|
|
Technology
|
18.7
|
%
|
|
Utilities
|
13.2
|
%
|
|
Communications
|
10.4
|
%
|
|
Consumer, Cyclical
|
4.5
|
%
|
|
Basic Materials
|
3.4
|
%
|
|
Energy
|
2.3
|
%
|
|
Industrial
|
2.1
|
%
|
|
Cash & Other
|
0.2
|
%
|
WHAT WERE THE FUND COSTS FOR THE PAST YEAR? (based on a hypothetical $10,000 investment)
|
Class Name
|
Costs of a $10,000 investment
|
Costs paid as a percentage of a $10,000 investment
|
|
Class C
|
$217
|
1.98%
|
HOW DID THE FUND PERFORM LAST YEAR AND WHAT AFFECTED ITS PERFORMANCE?
US stocks achieved strong gains during the Period, reflecting enormous positive sentiment for artificial intelligence companies, a relatively strong economy, and upward revised earnings estimates.
Strong security selection was the primary reason for the significant outperformance relative to the benchmark during the Period. Security selection in the Information Technology sector led by Micron Technology, Lam Research, and Sandisk significantly contributed to relative performance. Additionally, security selection in the Health Care and Materials sectors both benefited the fund’s relative performance. Health Care sector top contributors were led by Merck, Regeneron Pharmaceuticals, and Eli Lilly. Materials sector top contributors were led by Freeport-McMoran and Newmont.
In contrast, stock selection in the Industrials sector detracted from relative performance. In particular, Automatic Data Processing, Paychex, and Axon Enterprise all fell during the Period and hurt relative performance.
The Fund is actively managed therefore notable changes in absolute positioning during the Period include an increase in exposure to Information Technology, Financials, and Health Care sectors and a decrease in exposure to Consumer Staples and Communications Services sectors.
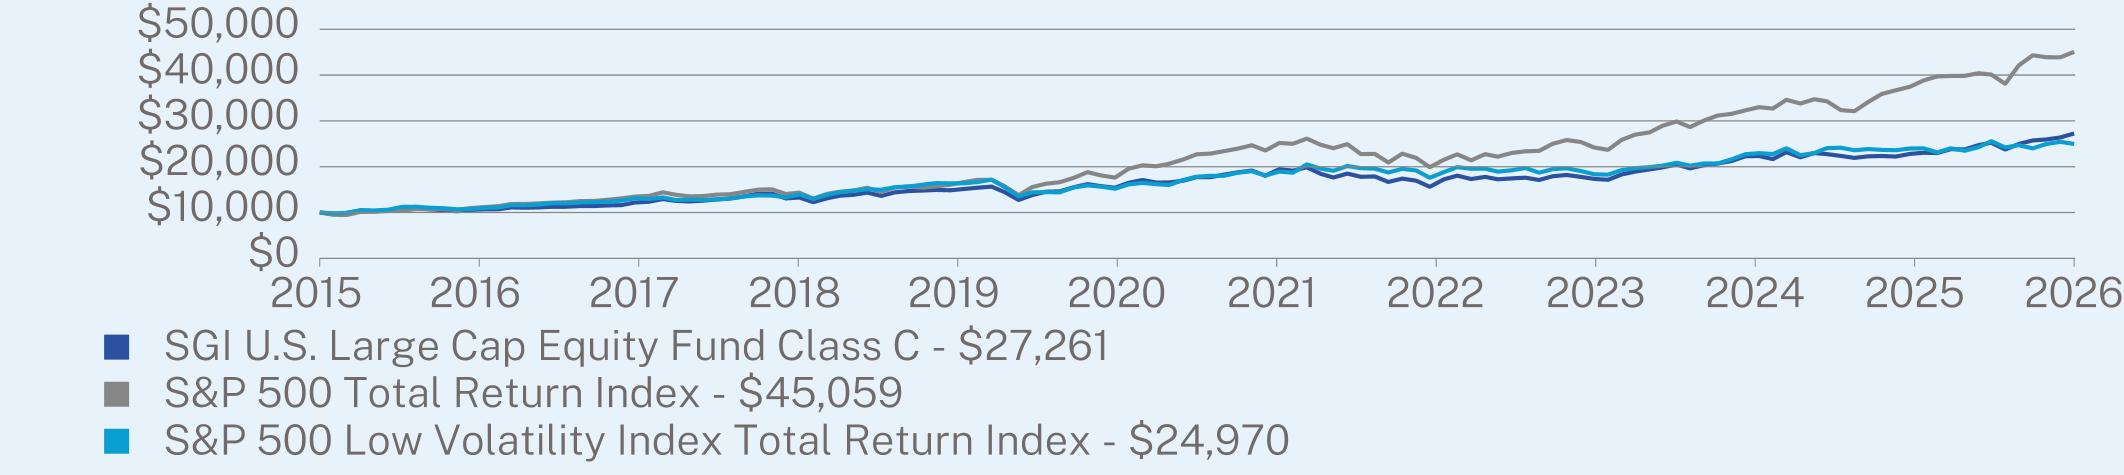
ANNUAL AVERAGE TOTAL RETURN (%)
|
|
1 Year
|
5 Year
|
10 Year
|
|
Class C (without sales charge)
|
19.61
|
7.30
|
9.81
|
|
S&P 500 Total Return Index
|
20.38
|
12.79
|
15.37
|
|
S&P 500 Low Volatility Index Total Return Index
|
4.17
|
5.59
|
8.49
|
Visit https://sgiam.com/literature/ for more recent performance information.
KEY FUND STATISTICS (as of August 31, 2026)
|
Net Assets
|
$199,366,236
|
|
Number of Holdings
|
103
|
|
Net Advisory Fee
|
$1,446,231
|
|
Portfolio Turnover
|
113%
|
|
30-Day SEC Yield
|
-0.71%
|
|
30-Day SEC Yield Unsubsidized
|
-0.69%
|
WHAT DID THE FUND INVEST IN? (as of August 31, 2026)
|
Top Holdings
|
(% of Net Assets)
|
|
|
NVIDIA Corp.
|
3.7
|
%
|
|
Bank of New York Mellon Corp.
|
3.3
|
%
|
|
Microsoft Corp.
|
3.1
|
%
|
|
Alphabet, Inc.
|
3.1
|
%
|
|
Incyte Corp.
|
3.0
|
%
|
|
Consolidated Edison, Inc.
|
3.0
|
%
|
|
Colgate-Palmolive Co.
|
3.0
|
%
|
|
Micron Technology, Inc.
|
2.7
|
%
|
|
State Street Corp.
|
2.6
|
%
|
|
Palantir Technologies, Inc.
|
2.6
|
%
|
|
Top Sectors
|
(% of Net Assets)
|
|
|
Consumer, Non-cyclical
|
22.8
|
%
|
|
Financial
|
22.4
|
%
|
|
Technology
|
18.7
|
%
|
|
Utilities
|
13.2
|
%
|
|
Communications
|
10.4
|
%
|
|
Consumer, Cyclical
|
4.5
|
%
|
|
Basic Materials
|
3.4
|
%
|
|
Energy
|
2.3
|
%
|
|
Industrial
|
2.1
|
%
|
|
Cash & Other
|
0.2
|
%
|
CHANGES IN AND DISAGREEMENTS WITH ACCOUNTANTS
The Auditor has been changed from Ernst & Young LLP to Tait, Weller, & Baker, LLP.
WHAT WERE THE FUND COSTS FOR THE PAST YEAR? (based on a hypothetical $10,000 investment)
|
Class Name
|
Costs of a $10,000 investment
|
Costs paid as a percentage of a $10,000 investment
|
|
Class I
|
$93
|
0.84%
|
HOW DID THE FUND PERFORM LAST YEAR AND WHAT AFFECTED ITS PERFORMANCE?
US stocks achieved strong gains during the Period, reflecting enormous positive sentiment for artificial intelligence companies, a relatively strong economy, and upward revised earnings estimates. International stocks achieved even better results than US stocks. However, due to investors’ lack of interest in defensive minimum volatility stocks both in the US and internationally, they significantly lagged the overall stock market.
Strong security selection was the primary reason for the significant outperformance relative to the MSCI ACWI Total Return Index (USD) during the Period. Security selection in the Information Technology sector led by Micron Technology, United Microelectronics, and Taiwan Semiconductor significantly contributed to relative performance. Additionally, security selection in the Consumer Staples sector led by Monster Beverage and Coca-Cola contributed to the Fund’s relative performance.
In contrast, stock selection in the Communications Services sector detracted from relative performance. In particular, Tencent Holdings, T-Mobile, and Deutsche Telekom all fell during the Period and hurt relative performance.
The Fund is actively managed therefore notable changes in absolute positioning during the Period include an increase in exposure to the Information Technology sector and emerging markets stocks and a decrease in exposure to Consumer Staples and Industrials sectors.
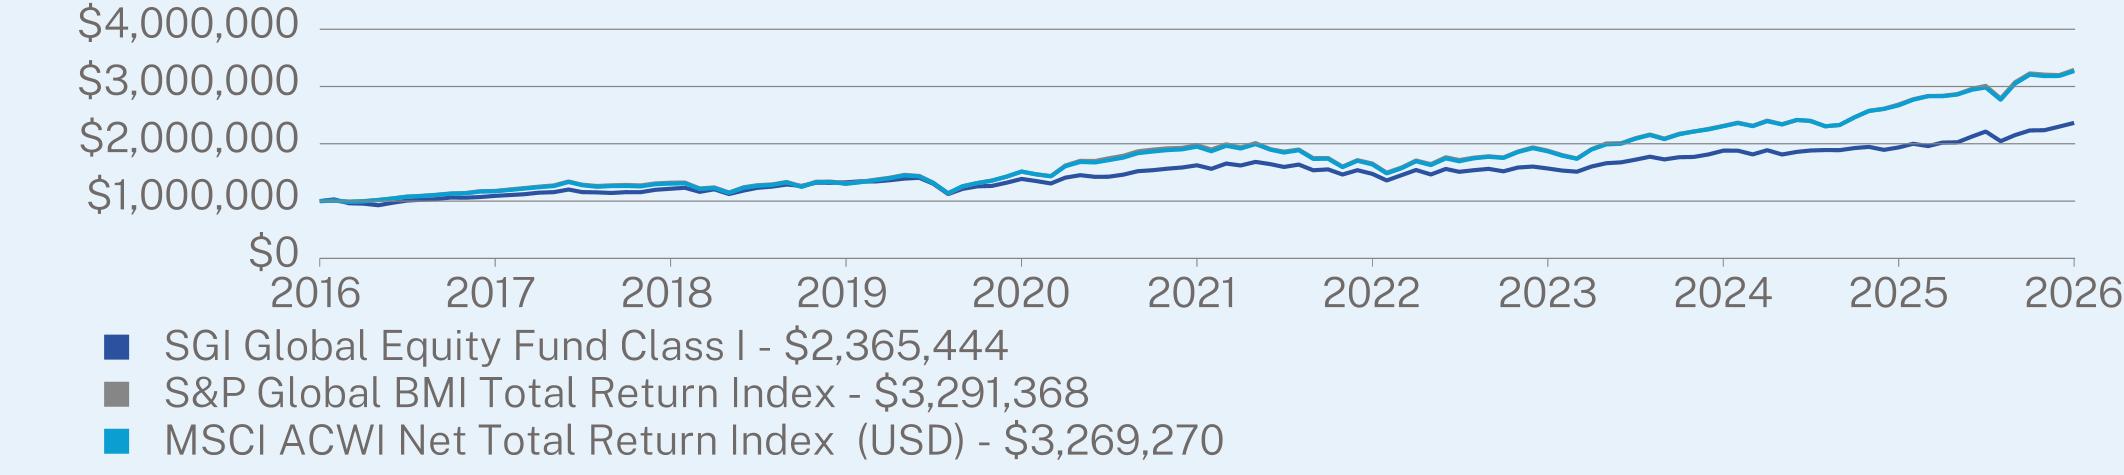
ANNUAL AVERAGE TOTAL RETURN (%)
|
|
1 Year
|
5 Year
|
10 Year
|
|
Class I (without sales charge)
|
22.09
|
7.80
|
8.99
|
|
S&P Global BMI Total Return Index
|
22.49
|
10.72
|
12.65
|
|
MSCI ACWI Net Total Return Index (USD)
|
22.35
|
10.88
|
12.58
|
Visit https://sgiam.com/literature/ for more recent performance information.
KEY FUND STATISTICS (as of August 31, 2026)
|
Net Assets
|
$76,411,599
|
|
Number of Holdings
|
127
|
|
Net Advisory Fee
|
$450,022
|
|
Portfolio Turnover
|
112%
|
|
30-Day SEC Yield
|
1.27%
|
|
30-Day SEC Yield Unsubsidized
|
1.18%
|
WHAT DID THE FUND INVEST IN? (as of August 31, 2026)
|
Top Holdings
|
(% of Net Assets)
|
|
|
Microsoft Corp.
|
3.5
|
%
|
|
Vanguard Emerging Markets ex-China ETF
|
3.0
|
%
|
|
iShares Core MSCI Emerging Markets ETF
|
2.9
|
%
|
|
Vanguard FTSE Emerging Markets ETF
|
2.8
|
%
|
|
Colgate-Palmolive Co.
|
2.7
|
%
|
|
Taiwan Semiconductor Manufacturing Co. Ltd.
|
2.5
|
%
|
|
Monster Beverage Corp.
|
2.4
|
%
|
|
BNP Paribas SA
|
2.2
|
%
|
|
Regeneron Pharmaceuticals, Inc.
|
2.1
|
%
|
|
Berkshire Hathaway, Inc.
|
2.0
|
%
|
|
Top Sectors
|
(% of Net Assets)
|
|
|
Consumer, Non-cyclical
|
25.1
|
%
|
|
Technology
|
14.8
|
%
|
|
Financial
|
14.6
|
%
|
|
Communications
|
13.1
|
%
|
|
Utilities
|
7.4
|
%
|
|
Industrial
|
4.8
|
%
|
|
Consumer, Cyclical
|
4.6
|
%
|
|
Energy
|
4.0
|
%
|
|
Basic Materials
|
2.2
|
%
|
|
Cash & Other
|
9.4
|
%
|
CHANGES IN AND DISAGREEMENTS WITH ACCOUNTANTS
The Auditor has been changed from Ernst & Young LLP to Tait, Weller, & Baker, LLP.
WHAT WERE THE FUND COSTS FOR THE PAST YEAR? (based on a hypothetical $10,000 investment)
|
Class Name
|
Costs of a $10,000 investment
|
Costs paid as a percentage of a $10,000 investment
|
|
Class I
|
$139
|
1.23%
|
HOW DID THE FUND PERFORM LAST YEAR AND WHAT AFFECTED ITS PERFORMANCE?
US small cap stocks achieved strong gains during the Peiord, reflecting enormous positive sentiment for artificial intelligence related companies, a relatively strong economy, and upward revised earnings estimates. Small cap stocks outperformed large cap stocks in the US.
The Fund performed roughly in line with the two major small cap indexes, slightly outperforming the S&P 600 Small Cap Index and slightly underperforming to the benchmark. The primary return generators for the strong overall performance were both security selection and sector allocation.
Strong security selection in the Information Technology sector contributed the most to total returns led by semiconductor stocks Maxlinear, Sandisk, and Kulicke & Soffa Industries.
In contrast, two sector allocation decisions hurt relative performance of the Fund. Underweighting the Health Care sector and overweighting the Consumer Discretionary sector both hurt relative performance. Additionally, security selection in the Health Care sector led by Privia Health Group, Phreesia, and Phibro Animal Health all had negative returns during the Period which hurt performance.
The Fund is actively managed therefore notable changes in absolute positioning during the Period include an increase in exposure to the Financials sector and a decrease in exposure to Utilities and Industrials sectors.
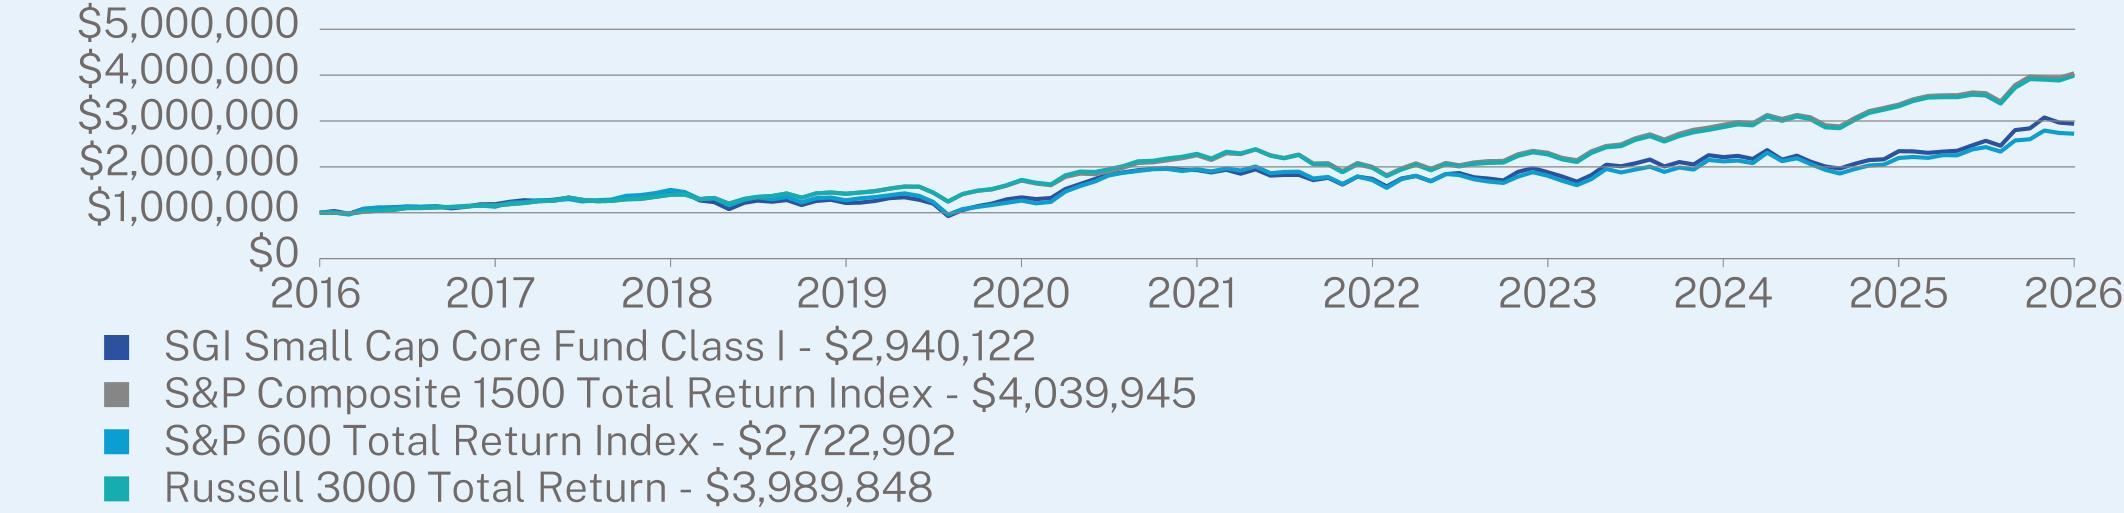
ANNUAL AVERAGE TOTAL RETURN (%)
|
|
1 Year
|
5 Year
|
10 Year
|
|
Class I (without sales charge)
|
25.51
|
8.77
|
11.39
|
|
S&P Composite 1500 Total Return Index
|
20.31
|
12.39
|
14.98
|
|
S&P 600 Total Return Index
|
24.08
|
6.92
|
10.54
|
|
Russell 3000 Total Return
|
20.10
|
11.80
|
14.84
|
Visit https://sgiam.com/literature/ for more recent performance information.
KEY FUND STATISTICS (as of August 31, 2026)
|
Net Assets
|
$136,348,035
|
|
Number of Holdings
|
212
|
|
Net Advisory Fee
|
$1,242,148
|
|
Portfolio Turnover
|
127%
|
|
30-Day SEC Yield
|
0.19%
|
|
30-Day SEC Yield Unsubsidized
|
0.26%
|
WHAT DID THE FUND INVEST IN? (as of August 31, 2026)
|
Top Holdings
|
(% of Net Assets)
|
|
|
iShares Core S&P Small-Cap ETF
|
1.8
|
%
|
|
Vanguard Russell 2000 ETF
|
1.6
|
%
|
|
Vanguard S&P 500 ETF
|
1.6
|
%
|
|
SPS Commerce, Inc.
|
1.5
|
%
|
|
Matson, Inc.
|
1.3
|
%
|
|
Virtu Financial, Inc.
|
1.3
|
%
|
|
Corcept Therapeutics, Inc.
|
1.2
|
%
|
|
Jackson Financial, Inc.
|
1.2
|
%
|
|
Acadian Asset Management, Inc.
|
1.1
|
%
|
|
Alarm.com Holdings, Inc.
|
1.1
|
%
|
|
Top Sectors
|
(% of Net Assets)
|
|
|
Financial
|
25.4
|
%
|
|
Industrial
|
17.5
|
%
|
|
Consumer, Non-cyclical
|
15.4
|
%
|
|
Consumer, Cyclical
|
9.9
|
%
|
|
Technology
|
7.1
|
%
|
|
Communications
|
6.2
|
%
|
|
Energy
|
4.4
|
%
|
|
Basic Materials
|
4.3
|
%
|
|
Utilities
|
1.7
|
%
|
|
Cash & Other
|
8.1
|
%
|
CHANGES IN AND DISAGREEMENTS WITH ACCOUNTANTS
The Auditor has been changed from Ernst & Young LLP to Tait, Weller, & Baker, LLP.
WHAT WERE THE FUND COSTS FOR THE PAST YEAR? (based on a hypothetical $10,000 investment)
|
Class Name
|
Costs of a $10,000 investment
|
Costs paid as a percentage of a $10,000 investment
|
|
Class I
|
$119
|
1.07%
|
HOW DID THE FUND PERFORM LAST YEAR AND WHAT AFFECTED ITS PERFORMANCE?
US stocks achieved strong gains during the Period, reflecting enormous positive sentiment for artificial intelligence companies, a relatively strong economy, and upward revised earnings estimates. International stocks from developed markets achieved slightly better results, and cash had modest positive returns.
Fund selection was the primary reason for the outperformance relative to the blended benchmark. Many of our selected funds outperformed their benchmarks and exposure to emerging markets stocks also benefited performance.
Our minimal cash exposure hurt relative performance as cash underperformed stocks during the Period.
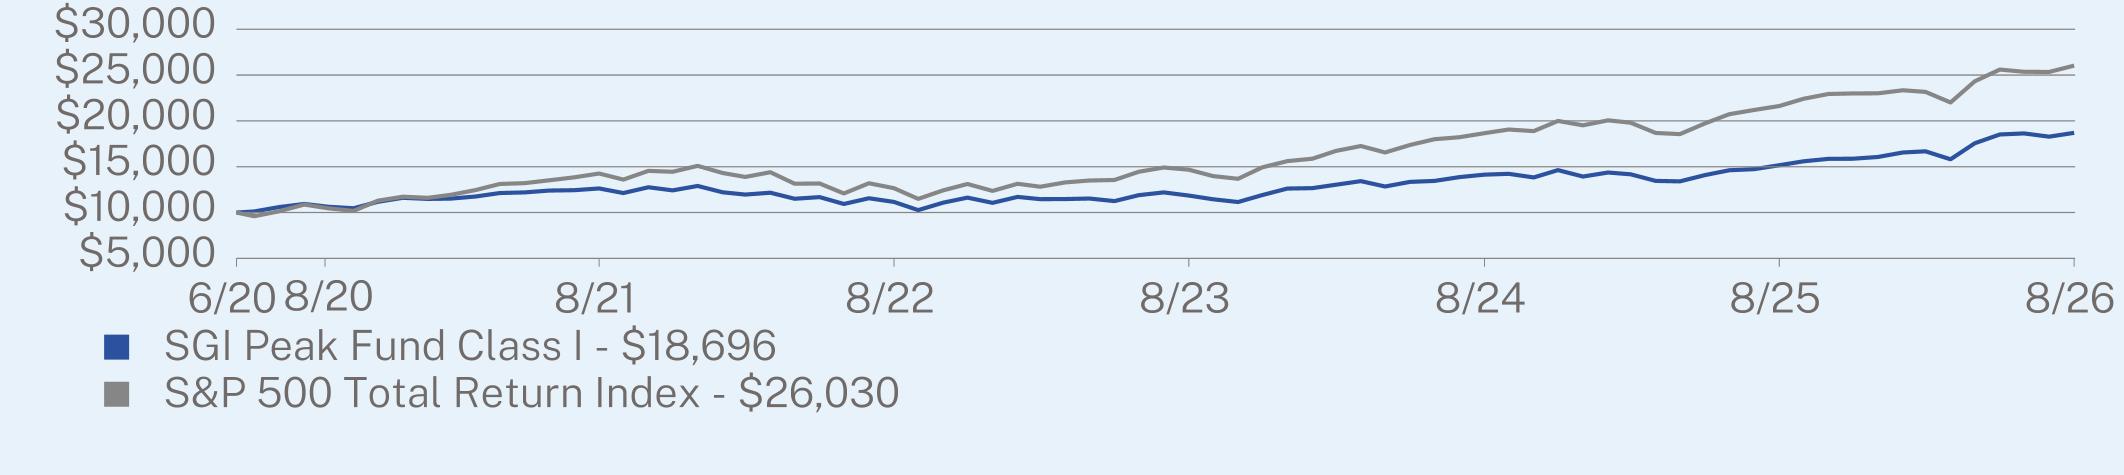
ANNUAL AVERAGE TOTAL RETURN (%)
|
|
1 Year
|
5 Year
|
Since Inception
(06/08/2020) |
|
Class I (without sales charge)
|
23.29
|
8.16
|
10.57
|
|
S&P 500 Total Return Index
|
20.38
|
12.79
|
16.60
|
Visit https://sgiam.com/literature/ for more recent performance information.
KEY FUND STATISTICS (as of August 31, 2026)
|
Net Assets
|
$76,480,816
|
|
Number of Holdings
|
12
|
|
Net Advisory Fee
|
$510,423
|
|
Portfolio Turnover
|
36%
|
|
30-Day SEC Yield
|
-0.70%
|
|
30-Day SEC Yield Unsubsidized
|
-0.70%
|
WHAT DID THE FUND INVEST IN? (as of August 31, 2026)
|
Top Holdings
|
(% of Net Assets)
|
|
|
SGI U.S. Large Cap Core ETF
|
24.7
|
%
|
|
SGI Enhanced Nasdaq-100 ETF
|
20.0
|
%
|
|
SGI Small Cap Core Fund
|
11.4
|
%
|
|
SGI Dynamic Tactical ETF
|
9.6
|
%
|
|
SGI Enhanced Market Leaders ETF
|
6.0
|
%
|
|
SGI Enhanced Global Income ETF
|
4.9
|
%
|
|
State Street SPDR Portfolio Emerging Markets ETF
|
4.0
|
%
|
|
Vanguard FTSE Emerging Markets ETF
|
3.9
|
%
|
|
Vanguard FTSE Developed Markets ETF
|
3.9
|
%
|
|
Invesco S&P 500 Equal Weight ETF
|
3.9
|
%
|
|
Top Sectors
|
(% of Net Assets)
|
|
|
Technology
|
31.9
|
%
|
|
Financials
|
13.5
|
%
|
|
Consumer Discretionary
|
8.5
|
%
|
|
Industrials
|
8.4
|
%
|
|
Communication Services
|
7.8
|
%
|
|
Healthcare
|
7.5
|
%
|
|
Consumer Staples
|
4.4
|
%
|
|
Energy
|
3.3
|
%
|
|
Materials
|
2.9
|
%
|
|
Real Estate
|
2.8
|
%
|
|
Utilities
|
1.8
|
%
|
|
Cash & Other
|
7.2
|
%
|
CHANGES IN AND DISAGREEMENTS WITH ACCOUNTANTS
The Auditor has been changed from Ernst & Young LLP to Tait, Weller, & Baker, LLP.
WHAT WERE THE FUND COSTS FOR THE PAST YEAR? (based on a hypothetical $10,000 investment)
|
Class Name
|
Costs of a $10,000 investment
|
Costs paid as a percentage of a $10,000 investment
|
|
Class I
|
$119
|
1.10%
|
HOW DID THE FUND PERFORM LAST YEAR AND WHAT AFFECTED ITS PERFORMANCE?
US stocks achieved strong gains during the Period, reflecting enormous positive sentiment for artificial intelligence companies, a relatively strong economy, and upward revised earnings estimates. International stocks from developed markets achieved slightly better results, while in aggregate bonds performed poorly with returns of less than 2%, and cash had modest positive returns.
Allocation was the primary reason for the outperformance relative to the blended benchmark. Overweighting stocks, both domestic and international, contributed to relative outperformance. Fund selection also benefitted relative returns as many of our selected funds outperformed their benchmarks.
All of our exposure to fixed income funds and cash hurt relative performance as those asset classes underperformed stocks during the Period.
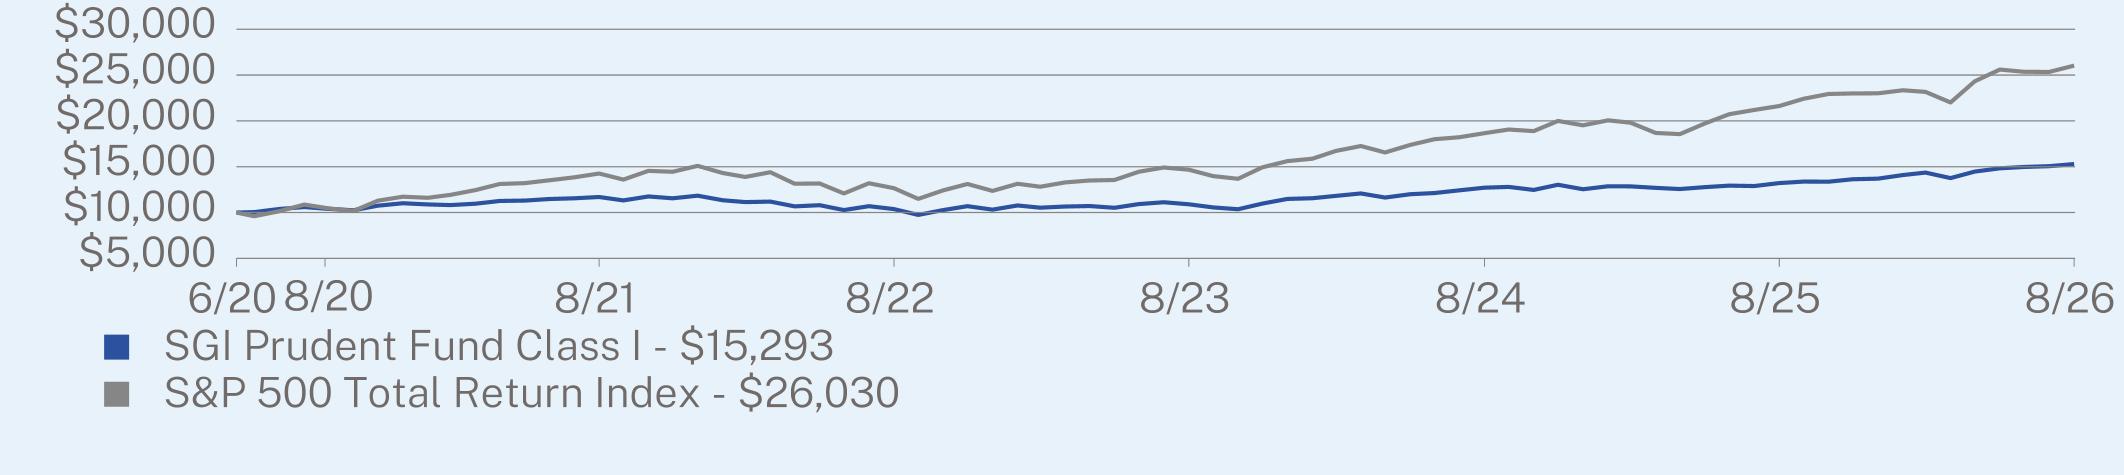
ANNUAL AVERAGE TOTAL RETURN (%)
|
|
1 Year
|
5 Year
|
Since Inception
(06/08/2020) |
|
Class I (without sales charge)
|
15.71
|
5.51
|
7.06
|
|
S&P 500 Total Return Index
|
20.38
|
12.79
|
16.60
|
Visit https://sgiam.com/literature/ for more recent performance information.
KEY FUND STATISTICS (as of August 31, 2026)
|
Net Assets
|
$53,058,953
|
|
Number of Holdings
|
15
|
|
Net Advisory Fee
|
$366,560
|
|
Portfolio Turnover
|
36%
|
|
30-Day SEC Yield
|
0.00%
|
|
30-Day SEC Yield Unsubsidized
|
0.00%
|
WHAT DID THE FUND INVEST IN? (as of August 31, 2026)
|
Top Holdings
|
(% of Net Assets)
|
|
|
SGI U.S. Large Cap Equity Fund
|
25.2
|
%
|
|
SGI U.S. Large Cap Core ETF
|
10.5
|
%
|
|
SGI Enhanced Global Income ETF
|
10.3
|
%
|
|
SGI Dynamic Tactical ETF
|
9.9
|
%
|
|
SGI Enhanced Core ETF
|
9.6
|
%
|
|
SGI Global Equity Fund
|
9.1
|
%
|
|
SGI Small Cap Core Fund
|
7.8
|
%
|
|
iShares 7-10 Year Treasury Bond ETF
|
7.7
|
%
|
|
Vanguard 0-3 Month Treasury Bill ETF
|
1.9
|
%
|
|
Vanguard Short-Term Inflation-Protected Securities ETF
|
1.9
|
%
|
|
Top Sectors
|
(% of Net Assets)
|
|
|
Fixed Income
|
17.3
|
%
|
|
Technology
|
16.2
|
%
|
|
Financials
|
13.9
|
%
|
|
Healthcare
|
9.3
|
%
|
|
Utilities
|
4.9
|
%
|
|
Industrials
|
4.7
|
%
|
|
Consumer Staples
|
4.5
|
%
|
|
Communication Services
|
4.3
|
%
|
|
Consumer Discretionary
|
3.7
|
%
|
|
Energy
|
3.0
|
%
|
|
Real Estate
|
2.3
|
%
|
|
Materials
|
2.2
|
%
|
|
Cash & Other
|
13.7
|
%
|
CHANGES IN AND DISAGREEMENTS WITH ACCOUNTANTS
The Auditor has been changed from Ernst & Young LLP to Tait, Weller, & Baker, LLP.
WHAT WERE THE FUND COSTS FOR THE PAST YEAR? (based on a hypothetical $10,000 investment)
|
Fund Name
|
Costs of a $10,000 investment
|
Costs paid as a percentage of a $10,000 investment
|
|
SGI Enhanced Core ETF
|
$101
|
0.98%
|
HOW DID THE FUND PERFORM LAST YEAR AND WHAT AFFECTED ITS PERFORMANCE?
Initially, during the first four months of the Period, short-term interest rates fell, however they increased somewhat during the latter eight months of the Period in response to inflationary pressures due to unsustainable deficit spending and the US/Iran war. This environment supported attractive yields in money market instruments, providing a strong foundation for the Fund’s collateral holdings. The Fund seeks to enhance income utilizing short-dated, extremely low-delta options (“0DTE” options).
The primary contributor to the Fund’s results was the steady income contributions from its money market collateral. Additionally, the incremental premium income derived from its Zero Days to Expatriation options overlay added to total returns. By systematically writing extremely low-delta, short-term options, the Fund generated consistent premium income while maintaining a conservative risk profile and limited directional exposure.
The enhanced income strategy effectively complemented the stability of the money market collateral, allowing the Fund to deliver attractive income results with a disciplined, risk-managed approach.
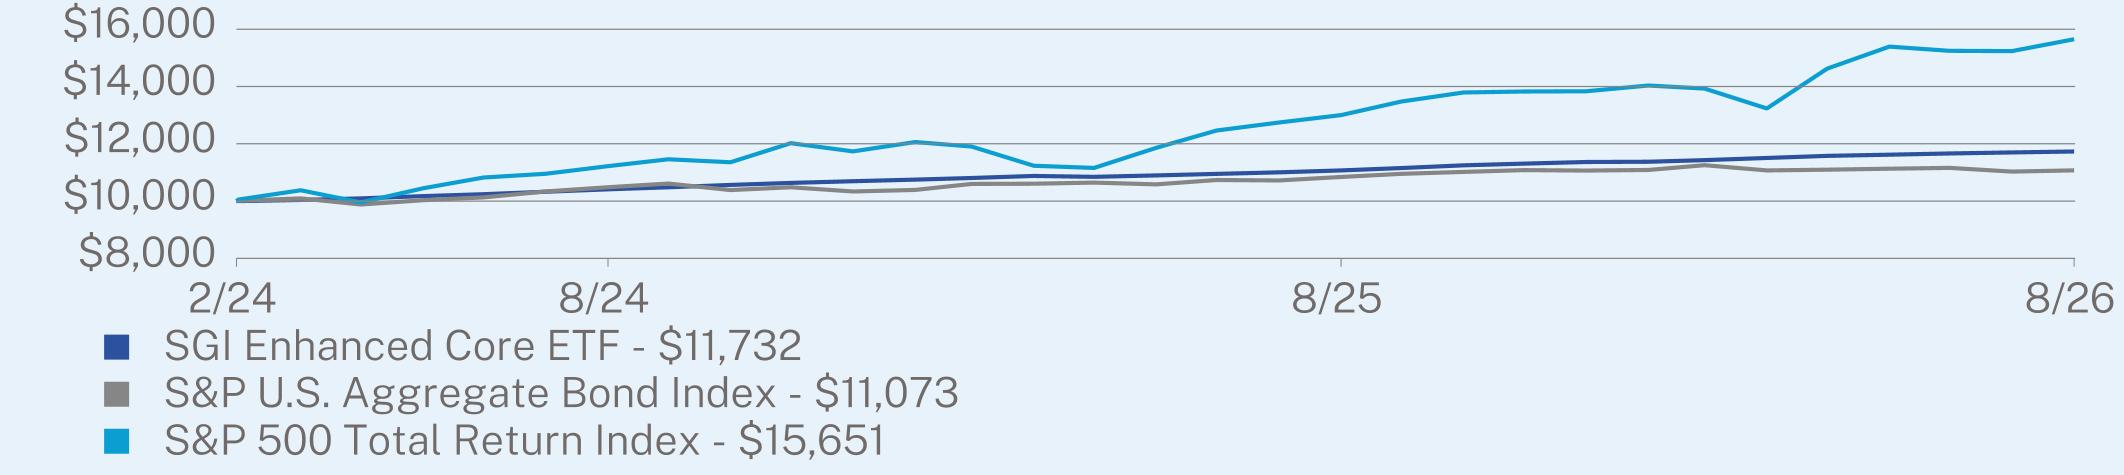
ANNUAL AVERAGE TOTAL RETURN (%)
|
|
1 Year
|
Since Inception
(02/28/2024) |
|
SGI Enhanced Core ETF
|
5.98
|
6.58
|
|
S&P U.S. Aggregate Bond Index
|
2.13
|
4.15
|
|
S&P 500 Total Return Index
|
20.38
|
19.57
|
Visit https://sgiam.com/literature/ for more recent performance information.
KEY FUND STATISTICS (as of August 31, 2026)
|
Net Assets
|
$305,788,122
|
|
Number of Holdings
|
8
|
|
Net Advisory Fee
|
$3,354,947
|
|
Portfolio Turnover
|
0%
|
|
30-Day SEC Yield
|
2.89%
|
|
30-Day SEC Yield Unsubsidized
|
2.89%
|
WHAT DID THE FUND INVEST IN? (as of August 31, 2026)
|
Top Holdings
|
(% of Net Assets)
|
|
Vanguard Federal Money Market Fund
|
42.4%
|
|
Vanguard Treasury Money Market Fund
|
41.9%
|
|
North Capital Treasury Money Market Fund
|
8.4%
|
|
PIMCO Government Money Market Fund
|
2.9%
|
|
Fidelity Government Cash Reserves
|
2.5%
|
|
First American Government Obligations Fund
|
1.0%
|
|
T Rowe Price US Treasury Money Fund, Inc.
|
0.0%
|
|
S&P 500 Index (Short)
|
0.0%
|
|
Top Sectors
|
(% of Net Assets)
|
|
Cash & Other
|
100.0%
|
CHANGES IN AND DISAGREEMENTS WITH ACCOUNTANTS
The Auditor has been changed from Ernst & Young LLP to Tait, Weller, & Baker, LLP.
WHAT WERE THE FUND COSTS FOR THE PAST YEAR? (based on a hypothetical $10,000 investment)
|
Fund Name
|
Costs of a $10,000 investment
|
Costs paid as a percentage of a $10,000 investment
|
|
SGI Enhanced Global Income ETF
|
$112
|
0.98%
|
HOW DID THE FUND PERFORM LAST YEAR AND WHAT AFFECTED ITS PERFORMANCE?
US stocks achieved strong gains during the Period, reflecting enormous positive sentiment for artificial intelligence companies, a relatively strong economy, and upward revised earnings estimates. International stocks achieved even better results than US stocks.
Strong security selection was the primary reason for the significant outperformance relative to the benchmark during the Period. Security selection in the Financials sector led by international bank stocks Banco Bilbao Vizcaya Argentaria SA, DBS Group Holdings, Banco Santander, and Societe Generale contributed the most to relative performance. Security selection in both the Health Care and Consumer Discretionary sectors also added to relative performance. Health Care sector stocks were led by strong returns from Merck and Bristol-Myers Squibb. Consumer Discretionary sector was led by strong returns from Magna International.
Additionally, incremental premium income derived from the Fund’s Zero Days to Expiration options overlay added to total returns. By systematically writing extremely low-delta, short-term options, the Fund generated consistent premium income while maintaining a conservative risk profile and limited directional exposure.
In contrast, stock selection in the Information Technology sector detracted from relative performance. In particular, Qualcomm, Taiwan Semiconductor, and Accenture PLC all underperformed during the Period and hurt relative performance.
The Fund is actively managed therefore notable changes in absolute positioning during the Period include an increase in exposure to Financials, Health Care, and Energy sectors and a decrease in exposure to Consumer Discretionary, Communications Services, and Industrials sectors.
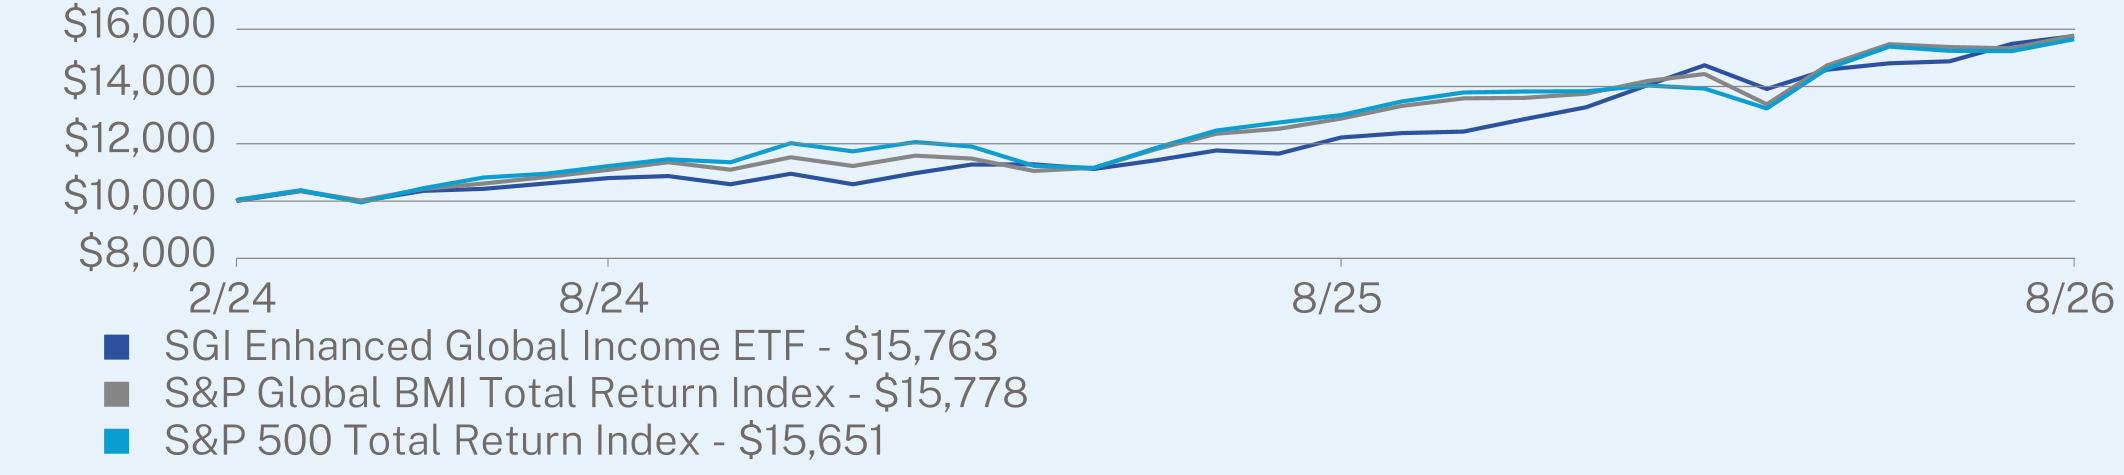
ANNUAL AVERAGE TOTAL RETURN (%)
|
|
1 Year
|
Since Inception
(02/28/2024) |
|
SGI Enhanced Global Income ETF
|
29.00
|
19.91
|
|
S&P Global BMI Total Return Index
|
22.49
|
19.95
|
|
S&P 500 Total Return Index
|
20.38
|
19.57
|
Visit https://sgiam.com/literature/ for more recent performance information.
KEY FUND STATISTICS (as of August 31, 2026)
|
Net Assets
|
$106,420,516
|
|
Number of Holdings
|
133
|
|
Net Advisory Fee
|
$875,061
|
|
Portfolio Turnover
|
85%
|
|
30-Day SEC Yield
|
2.52%
|
|
30-Day SEC Yield Unsubsidized
|
2.52%
|
WHAT DID THE FUND INVEST IN? (as of August 31, 2026)
|
Top Holdings
|
(% of Net Assets)
|
|
iShares Emerging Markets Dividend ETF
|
3.1%
|
|
WisdomTree Emerging Markets High Dividend Fund
|
3.1%
|
|
iShares Core MSCI Emerging Markets ETF
|
2.9%
|
|
JPMorgan Chase & Co.
|
2.8%
|
|
BNP Paribas SA
|
2.2%
|
|
Banco Bilbao Vizcaya Argentaria SA
|
2.2%
|
|
Bank of America Corp.
|
2.1%
|
|
Colgate-Palmolive Co.
|
1.9%
|
|
PepsiCo, Inc.
|
1.8%
|
|
Top Sectors
|
(% of Net Assets)
|
|
Financial
|
31.0%
|
|
Consumer, Non-cyclical
|
20.7%
|
|
Energy
|
9.5%
|
|
Industrial
|
8.3%
|
|
Consumer, Cyclical
|
6.1%
|
|
Technology
|
4.9%
|
|
Utilities
|
4.9%
|
|
Basic Materials
|
3.2%
|
|
Communications
|
1.9%
|
|
Cash & Other
|
9.5%
|
CHANGES IN AND DISAGREEMENTS WITH ACCOUNTANTS
The Auditor has been changed from Ernst & Young LLP to Tait, Weller, & Baker, LLP.
WHAT WERE THE FUND COSTS FOR THE PAST YEAR? (based on a hypothetical $10,000 investment)
|
Fund Name
|
Costs of a $10,000 investment
|
Costs paid as a percentage of a $10,000 investment
|
|
SGI Enhanced Nasdaq-100 ETF
|
$157
|
1.38%
|
HOW DID THE FUND PERFORM LAST YEAR AND WHAT AFFECTED ITS PERFORMANCE?
US stocks achieved strong gains during the Period, reflecting enormous positive sentiment for artificial intelligence companies, a relatively strong economy, and upward revised earnings estimates. These factors drove the strong performance of the stocks within the Nasdaq-100 Index.
The options overlay was the primary reason for the outperformance relative to the Nasdaq-100 Index during the Period. Incremental premium income derived from the Fund’s Zero Days to Expiration options overlay added to total returns. By systematically writing extremely low-delta, short-term options, the Fund generated consistent premium income. The options overlay is actively managed.
In contrast, using futures contracts for Nasdaq-100 exposure and holding cash collateral did not fully replicate the returns on the underlying stock index, which modestly hurt relative returns.
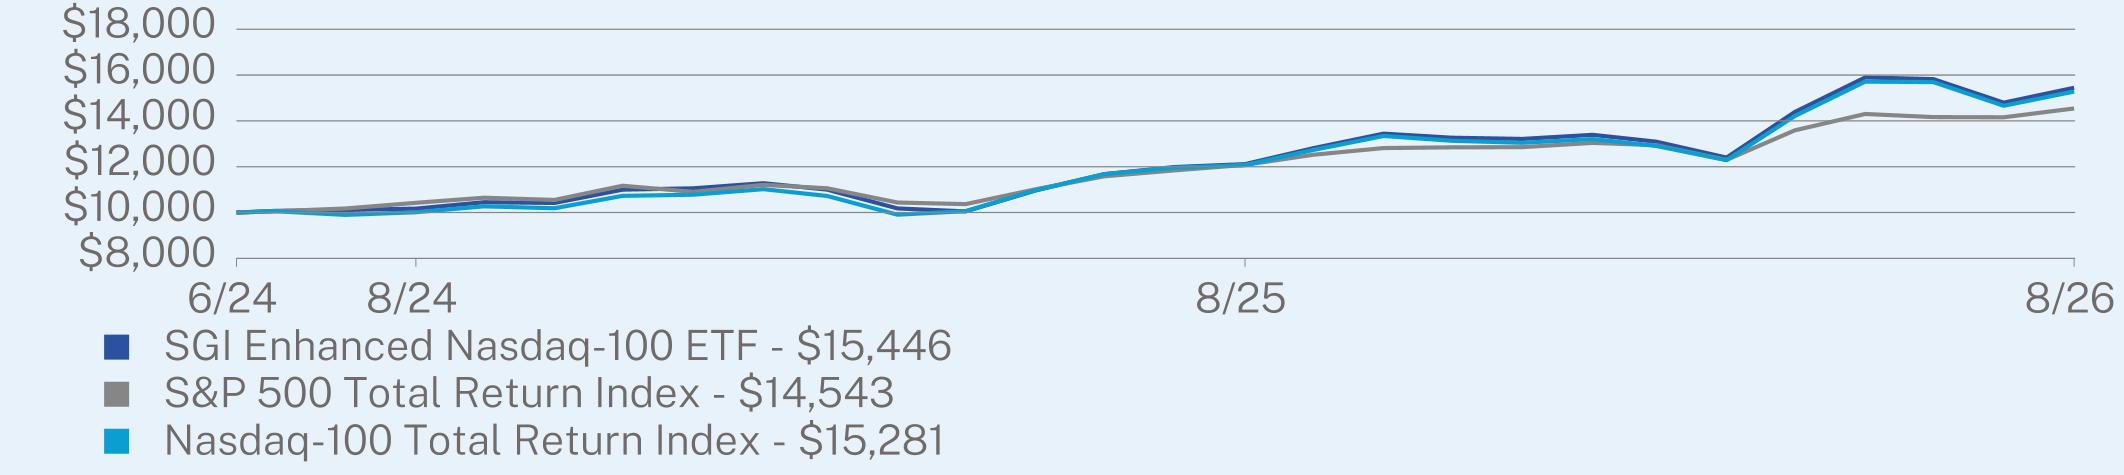
ANNUAL AVERAGE TOTAL RETURN (%)
|
|
1 Year
|
Since Inception
(06/13/2024) |
|
SGI Enhanced Nasdaq-100 ETF
|
27.52
|
21.67
|
|
S&P 500 Total Return Index
|
20.38
|
18.41
|
|
Nasdaq-100 Total Return Index
|
26.61
|
21.08
|
Visit https://sgiam.com/literature/ for more recent performance information.
KEY FUND STATISTICS (as of August 31, 2026)
|
Net Assets
|
$81,888,961
|
|
Number of Holdings
|
7
|
|
Net Advisory Fee
|
$654,329
|
|
Portfolio Turnover
|
75%
|
|
30-Day SEC Yield
|
0.36%
|
|
30-Day SEC Yield Unsubsidized
|
0.36%
|
WHAT DID THE FUND INVEST IN? (as of August 31, 2026)
|
Top Holdings
|
(% of Net Assets)
|
|
United States Treasury Bill
|
60.1%
|
|
Invesco QQQ Trust Series 1
|
2.6%
|
|
Micro E-Mini Nasdaq 100 Future Mar 2026
|
0.0%
|
|
S&P 500 Index (Short)
|
0.0%
|
|
Nasdaq 100 Index
|
-4.3%
|
|
Top Sectors
|
(% of Net Assets)
|
|
Technology
|
58.5%
|
|
Communication Services
|
13.7%
|
|
Consumer Discretionary
|
11.1%
|
|
Consumer Staples
|
6.2%
|
|
Healthcare
|
4.0%
|
|
Industrials
|
3.6%
|
|
Utilities
|
1.1%
|
|
Materials
|
1.0%
|
|
Energy
|
0.5%
|
|
Financial Services
|
0.2%
|
|
Cash & Other
|
0.1%
|
CHANGES IN AND DISAGREEMENTS WITH ACCOUNTANTS
The Auditor has been changed from Ernst & Young LLP to Tait, Weller, & Baker, LLP.
WHAT WERE THE FUND COSTS FOR THE PAST YEAR? (based on a hypothetical $10,000 investment)
|
Fund Name
|
Costs of a $10,000 investment
|
Costs paid as a percentage of a $10,000 investment
|
|
SGI Enhanced Market Leaders ETF
|
$73
|
0.66%
|
HOW DID THE FUND PERFORM LAST YEAR AND WHAT AFFECTED ITS PERFORMANCE?
US stocks achieved strong gains during the Period, reflecting enormous positive sentiment for artificial intelligence companies, a relatively strong economy, and upward revised earnings estimates. These factors drove the strong performance of the stocks within the S&P 100 Index.
Security selection was the primary reason for the outperformance relative to the S&P 100 Index during the Period. The top contributing companies to the Fund’s returns were Alphabet, Intel, and Micron Technology. Microsoft did not participate in the technology stock rally during the Period and was the largest drag on relative performance. In addition, both Meta Platforms and Home Depot dropped during the Period which hurt relative performance.
Additionally, the actively managed options overlay strategy produced incremental premium income that somewhat added to total returns. Notable changes in absolute positioning during the Period include an increase in exposure to Information Technology and Communications Services sectors and a decrease in exposure to Health Care, Financials, and Consumer Staples sectors.
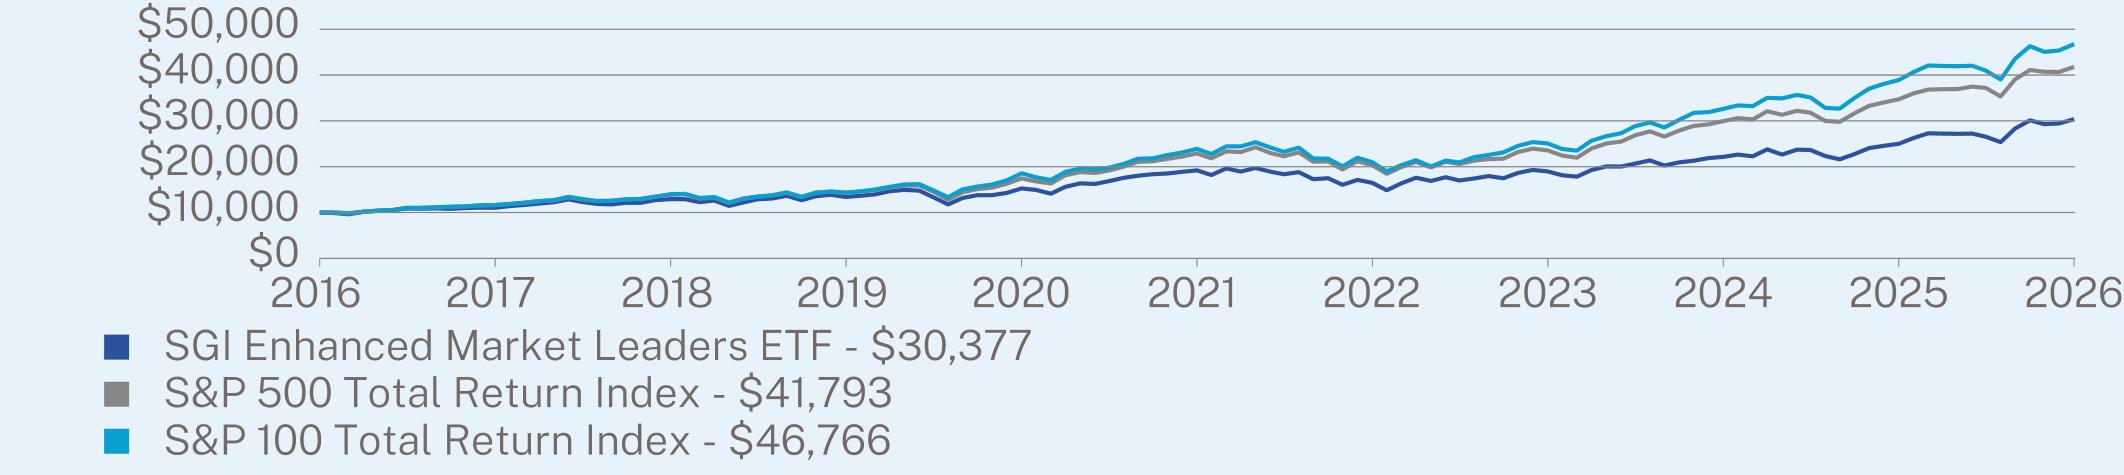
ANNUAL AVERAGE TOTAL RETURN (%)
|
|
1 Year
|
5 Year
|
10 Year
|
|
SGI Enhanced Market Leaders ETF
|
21.48
|
9.61
|
11.75
|
|
S&P 500 Total Return Index
|
20.38
|
12.79
|
15.37
|
|
S&P 100 Total Return Index
|
20.18
|
14.36
|
16.68
|
Visit https://sgiam.com/literature/ for more recent performance information.
KEY FUND STATISTICS (as of August 31, 2026)
|
Net Assets
|
$253,702,796
|
|
Number of Holdings
|
113
|
|
Net Advisory Fee
|
$1,082,349
|
|
Portfolio Turnover
|
42%
|
|
30-Day SEC Yield
|
0.61%
|
|
30-Day SEC Yield Unsubsidized
|
0.61%
|
WHAT DID THE FUND INVEST IN? (as of August 31, 2026)
|
Top Holdings
|
(% of Net Assets)
|
|
NVIDIA Corp.
|
11.1%
|
|
Apple, Inc.
|
9.7%
|
|
Microsoft Corp.
|
7.8%
|
|
Alphabet, Inc.
|
7.6%
|
|
Amazon.com, Inc.
|
5.3%
|
|
Broadcom, Inc.
|
3.7%
|
|
Meta Platforms, Inc.
|
2.6%
|
|
Micron Technology Inc.
|
2.3%
|
|
Tesla, Inc.
|
2.2%
|
|
JPMorgan Chase & Co.
|
2.0%
|
|
Top Sectors
|
(% of Net Assets)
|
|
Information Technology
|
43.9%
|
|
Communication Services
|
12.5%
|
|
Financials
|
11.1%
|
|
Consumer Discretionary
|
9.6%
|
|
Health Care
|
8.8%
|
|
Industrials
|
5.2%
|
|
Consumer Staples
|
4.6%
|
|
Energy
|
2.4%
|
|
Utilities
|
0.7%
|
|
Cash & Other
|
1.2%
|
CHANGES IN AND DISAGREEMENTS WITH ACCOUNTANTS
The Auditor has been changed from Ernst & Young LLP to Tait, Weller, & Baker, LLP.
| [1] |
|
||
| [2] |
|
||
| [3] |
|
||
| [4] |
|
||
| [5] |
|
||
| [6] |
|
||
| [7] |
|
||
| [8] |
|
||
| [9] |
|
||
| [10] |
|
||
| [11] |
|
||
| [12] |
|
||
| [13] |
|
||
| [14] |
|
||
| [15] |
|
||
| [16] |
|
||
| [17] |
|
||
| [18] |
|
||
| [19] |
|
||
| [20] |
|
||
| [21] |
|
||
| [22] |
|
||
| [23] |
|
||
| [24] |
|
||
| [25] |
|
||
| [26] |
|
||
| [27] |
|
||
| [28] |
|
||
| [29] |
|
||
| [30] |
|
||
| [31] |
|
||
| [32] |
|
||
| [33] |
|
||
| [34] |
|
||
| [35] |
|
||
| [36] |
|
||
| [37] |
|
||
| [38] |
|
||
| [39] |
|
||
| [40] |
|
||
| [41] |
|
||
| [42] |
|
||
| [43] |
|
||
| [44] |
|
||
| [45] |
|
||
| [46] |
|
||
| [47] |
|
||
| [48] |
|
||
| [49] |
|
||
| [50] |
|
||
| [51] |
|
||
| [52] |
|
||
| [53] |
|
||
| [54] |
|
||
| [55] |
|
||
| [56] |
|
||
| [57] |
|
||
| [58] |
|
||
| [59] |
|
||
| [60] |
|
||
| [61] |
|
||
| [62] |
|
||
| [63] |
|
||
| [64] |
|
||
| [65] |
|
||
| [66] |
|
||
| [67] |
|
||
| [68] |
|
||
| [69] |
|
||
| [70] |
|
||
| [71] |
|
||
| [72] |
|
||
| [73] |
|
||
| [74] |
|
||
| [75] |
|
||
| [76] |
|
||
| [77] |
|
||
| [78] |
|
||
| [79] |
|
||
| [80] |
|
||
| [81] |
|
||
| [82] |
|
||
| [83] |
|
||
| [84] |
|
||
| [85] |
|
||
| [86] |
|
||
| [87] |
|
||
| [88] |
|
||
| [89] |
|
||
| [90] |
|
||
| [91] |
|
||
| [92] |
|
||
| [93] |
|
||
| [94] |
|
||
| [95] |
|
||
| [96] |
|
||
| [97] |
|
||
| [98] |
|
||
| [99] |
|