The Fund seeks to maximize both current income and total return, consistent with prudent investment and principal protection management.
Below are the fees and expenses that you would pay if you buy, hold, and sell ETF Class shares of the Fund. You may pay other fees, such as brokerage commissions and other fees to financial intermediaries, which are not reflected in the table and example below.
Shareholder Fees (fees paid directly from your investment) |
None. |
ETF | ||
Management fees | 0.28% | |
Total Other Expenses | 0.09% | |
Shareholder Service Plan fees | None | |
Other expenses1 | 0.09% | |
Total Annual Fund Operating Expenses | 0.37% | |
Less: Fee waivers and/or expense reimbursements2 | 0.06% | |
Total Annual Fund Operating Expenses after fee waivers and/or | 0.31% | |
1 The ETF Class shares of the Fund are new, so the “Other Expenses” shown for the class are based on anticipated fees and expenses for the first full fiscal year.
2 Harris Associates L.P. (the “Adviser”) has contractually undertaken to waive and/or reimburse certain fees and expenses of the ETF Class so that the total annual operating expenses (excluding taxes, interest, all commissions and other normal charges incident to the purchase and sale of portfolio securities, and extraordinary charges such as litigation costs, but including fees paid to the Adviser) (“annual operating expenses”) of the ETF Class are limited to 0.31% of average net assets. This undertaking lasts until January 27, 2028 and may only be modified by mutual agreement of the parties that, with respect to the Trust, includes a majority vote of the “non-interested” Trustees of the Trust. The Fund has agreed that the ETF Class will repay the Adviser for fees and expenses waived or reimbursed for the class provided that repayment does not cause annual operating expenses to exceed 0.31% of the class’s average net assets, or to exceed any lower limit in effect at the time of recoupment (the “Repayment Provision”). Any such repayment must be made within three fiscal years after the year in which the Adviser incurred the expense.
The Example is intended to help you compare the cost of investing in the Fund’s ETF Class shares with the cost of investing in other mutual funds. The
Example assumes that you invest $10,000 for the time periods indicated and then redeem all of your ETF Class shares at the end of those periods. The Example also assumes that your investment has a 5% return each year and that the Fund’s operating expenses were those reflected in the table, inclusive of any fee waivers and/or expense reimbursements.
ETF | |||||
1 Year | $ | 32 | |||
3 Years | 113 | ||||
5 Years | 202 | ||||
10 Years | 462 | ||||
The Fund pays transaction costs, such as commissions, when it buys and sells securities (or “turns over” its portfolio). A higher portfolio turnover rate may indicate higher transaction costs and may result in higher taxes when Fund shares are held in a taxable account. These costs, which are not reflected in Annual Fund Operating Expenses or in the Example, affect the Fund’s performance. During the fiscal year ended September 30, 2025, the Fund’s portfolio turnover rate was 144% of the average value of its portfolio.
The Fund invests primarily in a diversified portfolio of bonds and other fixed-income securities. These include, but are not limited to, investment grade corporate bonds; U.S. or non-U.S.-government and government-related obligations (such as, U.S. treasury securities); below investment-grade corporate bonds; agency and non-agency mortgage backed-securities; asset-backed securities; senior loans (such as, leveraged loans, bank loans, covenant lite loans, and/or floating rate loans); assignments; restricted securities (e.g., Rule 144A securities); and other fixed and floating rate instruments. Under normal market conditions, the Fund invests at least 80% of its net assets (plus borrowings made for investment purposes) in bonds and other fixed-income securities, and other investments that the Adviser believes have similar economic characteristics, including other investment companies that provide investment exposure to such securities. The Adviser may shift the level of these allocations among the different bond and other fixed-income asset classes depending on market conditions.
Under normal market conditions, the Fund invests at least 25% of its assets in investment-grade fixed-income securities and may invest up to 35% of its assets in below investment-grade fixed-income securities (commonly known as “high-yield” or “junk bonds”). The Fund considers fixed-income securities to be investment-grade if, at the time of investment, they are rated Baa3 or higher by Moody’s Investors Service (“Moody’s”), BBB- or higher by S&P Global Ratings (“S&P”) or Fitch Ratings, Inc., or equivalently rated by any other nationally recognized statistical rating organization (“NRSRO”). The Fund considers
fixed‑income securities to be below investment-grade if, at the time of investment, they are rated Ba1 or lower by Moody’s, BB+ or lower by S&P or Fitch, or equivalently rated by any NRSRO. If all three NRSROs provide a rating, the Adviser assigns the middle rating of Moody’s, S&P and Fitch. When a rating is available from only two agencies, the lower rating is used; if only one agency rates a bond, that rating is assigned. The Fund may also invest in unrated fixed income securities. If the Adviser determines that an unrated fixed income security is of similar quality to a rated below investment grade security (rated Ba1 or lower by Moody’s, BB+ or lower by S&P or Fitch), the Adviser will consider such unrated fixed income security to be below investment grade. If the Adviser determines that an unrated fixed income security is of similar quality to a rated investment grade security (rated Baa3 or higher by Moody’s, or BBB- or higher by S&P or Fitch), the Adviser will consider such unrated fixed income security to be investment grade. The Fund invests in senior loans that are typically rated below investment-grade and to bear interest at a floating rate that periodically resets. The Fund may also invest up to 10% of its net assets in defaulted corporate securities.
In seeking to achieve the objectives of the Fund, the Adviser may purchase securities on a when-issued basis and purchase or sell delayed-delivery securities. In addition, the Fund may invest in fixed income securities structured as fixed rate debt; floating rate debt; and debt that may not pay interest at the time of issuance. The Fund may also invest in inverse floaters, as well as interest-only and principal-only securities.
The Fund will prioritize differentiation through bottom-up, single-security selection across the major fixed income asset classes with a secondary focus on top-down asset allocation and interest rate and duration management. When selecting individual securities, the Adviser uses a bottom-up approach and seeks relative price appreciation by selecting securities the Adviser believes to be undervalued based on research and fundamental analysis and by making gradual adjustment in the average duration of the Fund’s portfolio. The Adviser’s investment strategy is a bottom-up process that first looks for opportunities by focusing on an individual issuer’s default risk pricing and then incorporates top-down considerations such as interest rate forecasting, curve selection, and other macros factors.
The Adviser utilizes an investment approach that considers a quantitative valuation model combined with a qualitative ratings framework. The Fund’s portfolio selection process uses a ranking structure with a defined “buy” and “sell” discipline that allocates investments among a list of approved issuers and considers an individual investment’s risk reward profile, legal structure, and/or downside risk, among other factors. The Adviser actively manages the portfolio’s asset class exposure using a top-down view of sector fundamentals. The Adviser rotates Fund portfolio assets among sectors in various markets in an effort to maximize return.
Under normal market conditions, the Adviser seeks to maintain an investment portfolio with a weighted average effective duration of no less than two years and no more than eight years. The duration of the Fund’s portfolio may vary
materially from its target, from time to time, and there is no assurance that the duration of the Fund’s portfolio will meet its target.
The Fund may hold cash or short-term debt securities from time to time and for temporary defensive purposes.
The Fund may invest in derivative instruments, such as futures, forwards (including forward foreign currency contracts), and swap agreements (including credit default swaps, interest rate swaps, and total return swaps), for a variety of purposes, including, but not limited to, managing the Fund’s duration or its exposure to fixed income securities with different maturities, currencies, interest rates, individual issuers, or sectors. The Fund may also use options, including, but not limited to, buying and selling (writing) put and call options on individual stocks and indexes, when such use is desirable because of tax or other considerations.
In deciding which fixed income securities to buy and sell, the Adviser attempts to emphasize securities issued by companies with strong fundamentals and relatively limited anticipated volatility. These securities are selected with the same bottom-up investment process that underpins all of the Oakmark funds. The Fund uses a value investment philosophy in selecting its securities. This value investment philosophy, in the context of fixed-income securities, is based upon the belief that, over time, a company’s credit default risk will converge with the Adviser’s estimate of the credit default risk associated with a company’s intrinsic value. By “intrinsic value,” the Adviser means its estimate of the value a knowledgeable buyer would pay to acquire the entire business. The Adviser believes that investing in securities that have credit risk priced significantly below what it believes the company’s intrinsic value implies, allows the best opportunity to achieve the Fund’s investment objective.
In an effort to achieve its goal, the Fund may engage in active and frequent trading. The Fund’s investment objective may be changed without shareholder approval. The Fund will not alter its policy to invest at least 80% of its net assets (plus borrowings made for investment purposes) in bonds and other fixed-income securities, and other investments that the Adviser believes have similar economic characteristics, including other investment companies that provide investment exposure to such securities, without providing shareholders at least 60 days’ notice. This test is applied at the time the Fund invests; later percentage changes caused by a change in Fund assets, market values or company circumstances will not require the Fund to dispose of a holding.
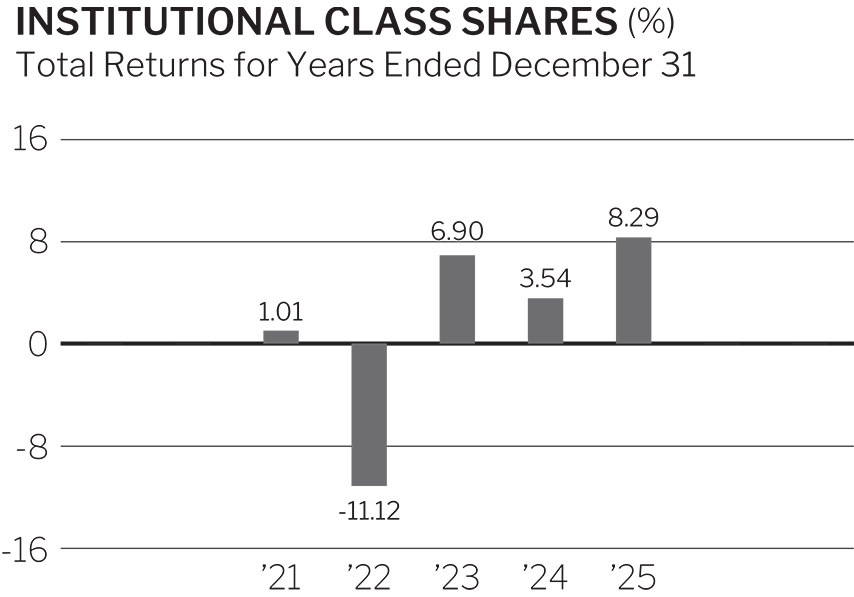
The bar chart and performance table below can help you evaluate the potential risk and reward of investing in the Fund by showing changes in the performance
of the Fund. The ETF Class shares of the Fund are a new class of shares for which performance information is not available, and therefore, for periods prior to the inception of the ETF Class shares, the bar chart and performance table show changes in the performance of the Fund’s Institutional Class shares from year to year. Returns of the ETF Class shares of the Fund may vary from the returns of the Institutional Class shares due to differences in expenses. The Fund’s past performance (before and after taxes), as provided by the bar chart and performance table that follow, is not an indication of how the Fund will perform in the future. The performance table illustrates the volatility of the Fund’s historical returns over various lengths of time and shows how the Fund’s average annual returns compare with those of a broad measure of market performance. The index, which is described in “Descriptions of Indices” in the prospectus, has characteristics relevant to the Fund’s investment strategy. The Fund’s Institutional Class commenced operations on June 10, 2020. Updated performance information is available on Oakmark.com or by calling 1‑800‑458‑7452.
Since 2020, the highest and lowest quarterly returns for the Fund’s Institutional Class Shares were: • Highest quarterly return: 7.1%, during the quarter ended December 31, 2023 • Lowest quarterly return: ‑5.7%, during the quarter ended June 30, 2022 • Year-to-date performance as of September 30, 2026: -1.4% |
|
Since 2020, the highest and lowest quarterly returns for the Fund’s Institutional Class Shares were: • Highest quarterly return: 7.1%, during the quarter ended December 31, 2023
• Lowest quarterly return: ‑5.7%, during the quarter ended June 30, 2022
• Year-to-date performance as of September 30, 2026: -1.4%
|
Bond Fund | 1 Year | 5 Years | Since | |
Institutional Class* | ||||
Return before taxes | 8.29% | 1.48% | 2.21% | |
Return after taxes on distributions | 6.14% | ‑0.23% | 0.57% | |
Return after taxes on distributions | 4.87% | 0.38% | 0.97% | |
Bloomberg U.S. Aggregate | 7.30% | ‑0.36% | ‑0.02% | |
+ As of December 31, 2025, the ETF Class Shares of the Fund had not yet commenced operations. Performance shown is from the Fund’s Institutional Class shares, which is a mutual fund class of shares and not offered in this Prospectus. Returns for the ETF Class shares and Institutional Class shares may vary due to differences in their expenses. Performance has not been adjusted to reflect the lower expenses of ETF Class shares. ETF Class shares would have had returns similar to, but potentially higher than, Institutional Class shares due to the fact that ETF Class shares represent interests in the same portfolio as Institutional Class shares but are subject to lower expenses.
**** Bloomberg U.S. Aggregate Bond Index since inception return is calculated using 06/10/2020, which is the date the Fund commenced operations.
After-tax returns are calculated using the historical highest individual federal marginal income tax rates and do not reflect the impact of state and local taxes. Actual after-tax returns depend on an investor’s tax situation and may differ from those shown. After-tax returns shown are not relevant to investors who hold their shares through tax-deferred arrangements, such as 401(k) plans, qualified plans, education savings accounts or individual retirement accounts. In some cases, the after-tax returns may exceed the return before taxes due to an assumed tax benefit from any losses on a sale of Fund shares at the end of the measurement period.