Exhibit 99.1
MANAGEMENT’S DISCUSSION AND ANALYSIS OF
FINANCIAL CONDITION AND RESULTS OF OPERATIONS
The following discussion and analysis of our financial condition and results of operations should be read in conjunction with our consolidated financial statements and related notes thereto. In addition to historical consolidated financial information, the following discussion contains forward-looking statements that reflect our plans, estimates, and beliefs that involve risks and uncertainties. As a result of many important factors, our actual results and the timing of events may differ materially from those anticipated in these forward-looking statements. All amounts included herein with respect to the six months ended June 30, 2026 and 2025 are derived from our unaudited condensed consolidated financial statements in this filing. Our financial statements have been prepared in accordance with U.S. Generally Accepted Accounting Principles, or U.S. GAAP.
Throughout this report, unless the context indicates otherwise, any references to “Mingteng International,” “we,” “us,” “our Company,” “the Company,” and “our” are to Mingteng International Corporation Inc., a Cayman Islands holding company, and when describing Mingteng International’s consolidated financial information for the six months ended June 30, 2026 and the fiscal years December 31, 2025, also includes Mingteng International’s subsidiaries. References to “PRC Subsidiaries” refer to Mingteng International’s subsidiaries established under the laws of the People’s Republic of China. Unless otherwise indicated, in this annual report, references to:
| ● | “China” or the “PRC” refers to the People’s Republic of China. | |
| ● | “Class A Ordinary Shares” refers to the Class A ordinary shares of Mingteng International with par value $0.00005 per share. | |
| ● | “Class B Ordinary Shares” refers collectively to the Class B ordinary shares of Mingteng International with par value $0.00005 per share. | |
| ● | “Ordinary Shares” refers collectively to the Class A ordinary shares and Class B ordinary shares of Mingteng International with par value $0.00005 per share. | |
| ● | “RMB” refers to Renminbi, the legal currency of the PRC. | |
| ● | “U.S. dollars,” “$” and “USD” refers to the legal currency of the United States. | |
| ● | “Mingteng HK” refers to Mingteng International Hong Kong Group Limited, an entity incorporated under the laws and regulations in Hong Kong and a wholly owned subsidiary of Mingteng International. | |
| ● | “Ningteng WFOE” refers to Wuxi Ningteng Intelligent Manufacturing Co., Ltd., a limited liability company organized under the laws of the PRC and a wholly owned subsidiary of Mingteng HK. | |
| ● | “WFOE” refers to a wholly foreign-owned enterprise. | |
| ● | “Wuxi Mingteng Mould” refers to Wuxi Mingteng Mould Technology Co., Ltd., a limited liability company organized under the laws of the PRC and a wholly owned subsidiary of Ningteng WFOE. |
Overview
We are a holding company incorporated in the Cayman Islands with operations conducted in China by our PRC subsidiary, Wuxi Mingteng Mould, incorporated in the PRC. We are an automotive mold developer and supplier in China. Wuxi Mingteng Mould was established in December 2015, focusing on molds used in auto parts. We are committed to providing customers with comprehensive and personalized mold services, covering mold design and development, mold production, assembly, testing, repair and after-sales service.
We provide a wide variety of products. Our main products are casting molds for turbocharger systems, braking systems, steering and differential system, and other automotive system parts.
We also produce molds for new energy electric vehicle motor drive systems, battery pack systems, and engineering hydraulic components, which are widely used in automobiles, construction machinery and other manufacturing industries.
Our production plant is located in Wuxi, China. We use technologically advanced procedures and equipment to produce molds. We use a mold manufacturing processing center, which allocates different machines to manufacture according to the size of the mold and the shape of the accessories. Our mold development and production process are supported by our research and development (“R&D”) team (including experts such as foundry technologists and mold designers), using advanced Computer Aided Design (“CAD”), Computer Aided Manufacturing (“CAM”) and software technologies to analyze feasibility and validity of mold designs and specifications. Our quality and capability have obtained the 2019 Jiangsu High-tech Enterprise Certification (extended to 2028) and ISO9001:2015 certification.
In order to improve our technical level and service quality, we are committed to developing and producing molds through technological innovation. We believe that the design and quality of our molds are extremely important to the accuracy and efficiency of our customers’ manufacturing processes. Our existing technical team consists of 19 people, all with professional knowledge in casting, machining, and automation. They analyze customers’ casting and processing technology, propose solutions and improvement suggestions to customers to enhance the efficiency and safety of their products. In addition, we believe our research and patents in the field of automotive casting molds have earned us recognition from our customers, and we have registered 26 authorized utility model and invention patents in China.
We are a supplier to a number of Chinese listed companies and have established long-term business relationships with leading major customers in the automobile parts manufacturing industry, most of whom have more than 5 years of business relationship with us. Our customers include Kehua Holding Co., Ltd. (ticker: 603161), Wuxi Lihu Booster Technology Co., Ltd. (ticker: 300694), and Wuxi Best Precision Machinery Co., Ltd. (ticker: 300580). Our close relationships with these major customers demonstrate our strengths in technical capabilities, service reputation and product quality.
Our revenue mainly comes from customized mold production, mold repair and machining services. The revenue derived from customized mold production accounted for 64.3% and 69.1% of our total revenue for the six months ended June 30, 2026 and 2025, respectively. The revenue derived from mold repair accounted for 5.4% and 9.3% of our total revenue for the six months ended June 30, 2026 and 2025, respectively. The revenue derived from machining services accounted for 30.3% and 21.6% of our total revenue for the six months ended June 30, 2026 and 2025, respectively.
2
Our organization
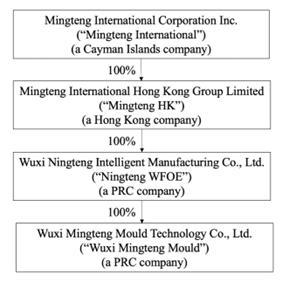
The following chart shows our current corporate structure:
Mingteng International was incorporated under the laws of the Cayman Islands on September 20, 2021, as an exempt company with limited liability.
Mingteng International owns a 100% equity interest in Mingteng HK, an entity incorporated on November 4, 2021, in accordance with the laws and regulations in Hong Kong. Mingteng HK is a holding company and is not actively engaged in any business.
Ningteng WFOE was incorporated on September 6, 2022, under the laws of the PRC. Ningteng WOFE is a wholly owned subsidiary of Mingteng HK and is not actively engaged in any business.
Wuxi Mingteng Mould is a limited liability company incorporated on December 15, 2015, under the laws of the PRC. Wuxi Mingteng Mould is a wholly owned subsidiary of Ningteng WFOE and is our operating entity. Wuxi Mingteng Mould is primarily engaged in providing clients with comprehensive and personalized mold services and solutions in the PRC, including mold design and development; mold production, repair, testing and adjustment.
Recent Developments
Change in Class B Ordinary Shares Voting Rights and Share Capital
On May 29, 2026, the Company held a meeting of the holders of Class A Ordinary Shares, and the holders of Class A Ordinary Shares approved the variation of the rights attaching to the Class A Ordinary Shares arising from the proposed increase in the voting rights of the Class B Ordinary Shares and the adoption of the Fourth Amended and Restated Memorandum and Articles of Association. At the subsequent annual general meeting held on the same date, the shareholders approved (i) an increase in the voting rights attached to the Class B Ordinary Shares, (ii) a reduction in the par value of the Company’s ordinary shares, (iii) an increase in the Company’s authorized share capital, and (iv) the adoption of the Fourth Amended and Restated Memorandum and Articles of Association reflecting such changes.
3
June 2026 Registered Direct Offering
On June 9, 2026, we entered into a securities purchase agreement with certain institutional investors pursuant to which we agreed to issue and sell, in a registered direct offering, (i) an aggregate of 501,834 Class A Ordinary Shares at an offering price of US$2.00 per Class A Ordinary Share, and (ii) pre-funded warrants to purchase up to an aggregate of 629,170 Class A Ordinary Shares (the “Pre-Funded Warrants”) at an offering price of US$1.99995 per Pre-Funded Warrant, which equals the offering price per Class A Ordinary Share minus the exercise price of US$0.00005 per share of the Pre-Funded Warrants. The offering was made pursuant to our registration statement on Form F-3 (File No. 333-287843), initially filed with the SEC with and declared effective on November 18, 2025, the base prospectus included therein and a prospectus supplement dated June 10, 2026.
The offering was closed on June 10, 2026. We received gross proceeds of approximately US$2.26 million, before deducting placement agent fees and other offering expenses. All of the Pre-Funded Warrants were exercised in full on June 9, 2026, and we issued an aggregate of 629,170 Class A Ordinary Shares upon their exercise on June 10, 2026. We intend to use the proceeds from the offering for working capital and general corporate purposes.
Termination of the ATM Agreement
On December 4, 2025, we entered into a sales agreement (the “Sales Agreement”) with AC Sunshine Securities LLC, as sales agent, pursuant to which we may offer and sell from time to time, in “at the market” offerings, Class A Ordinary Shares having an aggregate offering price of up to US$100,000,000. The offering under the Company’s effective shelf registration statement on Form F-3 (File No. 333-287843) and the related prospectus supplement dated December 8, 2025.
As of June 8, 2026, we had issued and sold an aggregate of 222,568,877 Class A Ordinary Shares under the Sales Agreement, and received gross proceeds of approximately US$20.6 million. After paying the sales agent a commission of 3.5% of the gross proceeds and certain other offering expenses, we received net proceeds of approximately US$18.0 million. The Sales Agreement was terminated as of June 8, 2026. We intend to use the net proceeds from the offering for general corporate purposes, including working capital, business development initiatives and capital expenditures.
June 2026 Registered Direct Offering and Concurrent Private Placement
On June 17, 2026, we entered into a securities purchase agreement with certain institutional investors pursuant to which we agreed to issue and sell, in a registered direct offering, (i) an aggregate of 457,355 Class A Ordinary Shares at an offering price of US$2.00 per Class A Ordinary Share, and (ii) pre-funded warrants to purchase up to an aggregate of 1,022,645 Class A Ordinary Shares (the “June 2026 Pre-Funded Warrants”) at an offering price of US$1.99995 per June 2026 Pre-Funded Warrant, which equals the offering price per Class A Ordinary Share minus the exercise price of US$0.00005 per share of the June 2026 Pre-Funded Warrants. The registered direct offering was made pursuant to our registration statement on Form F-3 (File No. 333-287843), initially filed with the SEC and declared effective on November 18, 2025, the base prospectus included therein and a prospectus supplement dated June 17, 2026. In a concurrent private placement, we also agreed to issue and sell to the same investors unregistered warrants to purchase up to an aggregate of 1,480,000 Class A Ordinary Shares (the “Private Warrants”) at an exercise price of US$2.00 per Class A Ordinary Share. The Private Warrants are exercisable upon issuance and will expire eighteen months from the date of issuance. The Private Warrants were issued pursuant to the exemption from registration provided by Section 4(a)(2) of the Securities Act and/or Regulation D promulgated thereunder.
The registered direct offering and the concurrent private placement closed on June 18, 2026. We received gross proceeds of approximately US$2.96 million, before deducting placement agent fees and other offering expenses. We intend to use the proceeds from these offerings for working capital and general corporate purposes.
Waiver Agreement and Registration Rights Agreement
On June 29, 2026, we entered into a waiver agreement (the “Waiver Agreement”) and a registration rights agreement (the “Registration Rights Agreement”) with certain investors who had purchased Class A Ordinary Shares from us under a securities purchase agreement dated April 13, 2026 (the “April 2026 SPA”), which closed on April 17, 2026. Under the April 2026 SPA, the Class A Ordinary Shares purchased by these investors were subject to a lock-up restriction for a period of 180 days following the closing. Pursuant to the Waiver Agreement, we waived this lock-up restriction effective as of June 29, 2026. The waiver applies solely to the contractual lock-up restriction under the April 2026 SPA, and any transfer or resale of these Class A Ordinary Shares remains subject to applicable securities laws, including Rule 144 and Regulation S under the Securities Act.
4
Pursuant to the Registration Rights Agreement, we were required to file with the SEC, on or prior to the date that is 180 calendar days following June 29, 2026, a registration statement on Form F-1 or Form F-3, as applicable, covering the resale of the Class A Ordinary Shares purchased under the April 2026 SPA that are not then registered on an effective registration statement.
Such resale registration statement on Firm F-1 was filed on July 20, 2026 and was declared effective on August 3, 2026.
Factors Affecting Our Results of Operations
Changes in the availability, quality and cost of key raw materials, transportation and other necessary supplies or services
Our raw materials consist primarily of steel plates and casting. The cost of raw materials represents a significant portion of our total cost of revenues.
Raw material costs represent 32.3% and 28.3% of our total cost of revenues for the six months ended June 30, 2026 and 2025, respectively.
We are exposed to fluctuations in the prices of raw materials, transportation, and other necessary supplies or services due to factors beyond our control, such as policies, inflation, and changes in the supply and demand for such relevant raw materials. We may not be able to offset the price increases by increasing our product prices, in which case our margins would decline, and our financial condition and results of operations could be materially and adversely affected. In addition, if we significantly increase the prices of our products, we may lose our competitive advantage. This in turn could result in a loss of sales and customers. In either case, our business, financial condition, and results of operations could be materially and adversely affected.
Our business is dependent on certain major customers and changes or difficulties in our relationships with our major customers may harm our business and financial results.
For the six months ended June 30, 2026 and 2025, ten major customers accounted for approximately 82.2% and 80.3% of our total sales, respectively. Any decrease in sales to these major customers may negatively impact on our operations and cash flows if we fail to increase its sales to other customers.
As of June 30, 2026 and December 31, 2025, ten major customers accounted for approximately 75.6% and 80.3% of our accounts receivable balance, separately.
If we cannot maintain long-term relationships with our major customers or replace major customers from period to period with equivalent customers, the loss may negatively impact our business, financial condition, and results of operations. If our customer base decreases, we may not be able to generate sufficient revenue to cover our increased costs and expenses. As a result, our business and results of operations may be materially and adversely affected.
Our business is related to the development of upstream and downstream industries.
Mold production is closely related to the development of upstream and downstream industries. With the gradual saturation of the Chinese automotive market, the production of molds related to auto parts may be affected.
Results of Operations
Comparison of Results of Operations for the Six Months Ended June 30, 2026 and 2025
The following table summarizes our results of unaudited operations for the six months ended June 30, 2026 and 2025, respectively, and provides information regarding the dollar and percentage increase or (decrease) during such periods.
5
(UNAUDITED)
| For the Six Months Ended June 30, | ||||||||||||||||||||||||
| 2026 | 2025 | Variance | ||||||||||||||||||||||
| Amount | % of revenue | Amount | % of revenue | Amount | % | |||||||||||||||||||
| Revenues | $ | 5,508,131 | 100.0 | % | $ | 5,261,469 | 100.0 | % | $ | 246,662 | 4.7 | % | ||||||||||||
| Cost of revenues | (4,964,045 | ) | (90.1 | )% | (3,793,049 | ) | (72.1 | )% | (1,170,996 | ) | 30.9 | % | ||||||||||||
| Gross profit | 544,086 | 9.9 | % | 1,468,420 | 27.9 | % | (924,334 | ) | (62.9 | )% | ||||||||||||||
| Operating expenses: | ||||||||||||||||||||||||
| Selling expenses | (226,705 | ) | (4.1 | )% | (53,764 | ) | (1.0 | )% | (172,941 | ) | 321.7 | % | ||||||||||||
| General and administrative expenses | (2,870,661 | ) | (52.1 | )% | (1,003,686 | ) | (19.1 | )% | (1,866,975 | ) | 186.0 | % | ||||||||||||
| Research and development expenses | (4,894,698 | ) | (88.9 | )% | (409,623 | ) | (7.8 | )% | (4,485,075 | ) | 1094.9 | % | ||||||||||||
| Total operating expenses | (7,992,064 | ) | (145.1 | )% | (1,467,073 | ) | (27.9 | )% | (6,524,991 | ) | 444.8 | % | ||||||||||||
| (Loss) income from operations | (7,447,978 | ) | (135.2 | )% | 1,347 | 0.0 | % | (7,449,325 | ) | (553,030.8 | )% | |||||||||||||
| Other income (expenses): | ||||||||||||||||||||||||
| Government subsidies | 57,595 | 1.0 | % | 64,728 | 1.2 | % | (7,133 | ) | (11.0 | )% | ||||||||||||||
| Interest income | 1,068 | 0.0 | % | 688 | 0.0 | % | 380 | 55.2 | % | |||||||||||||||
| Interest expense | (29,254 | ) | (0.5 | )% | (22,518 | ) | (0.4 | )% | (6,736 | ) | 29.9 | % | ||||||||||||
| Other-Than-Temporary Impairment | - | - | % | (1,356,618 | ) | (25.8 | )% | 1,356,618 | (100.0 | )% | ||||||||||||||
| Other (expenses) income, net | (7,104 | ) | (0.1 | )% | 16,812 | 0.3 | % | (23,916 | ) | (142.3 | )% | |||||||||||||
| Total other income(expenses), net | 22,305 | 0.4 | % | (1,296,908 | ) | (24.6 | )% | 1,319,213 | (101.7 | )% | ||||||||||||||
| Loss before income taxes | (7,425,673 | ) | (134.8 | )% | (1,295,561 | ) | (24.6 | )% | (6,130,112 | ) | 473.2 | % | ||||||||||||
| Benefit from (Provision for) income taxes | 29,178 | 0.5 | % | (61,212 | ) | (1.2 | )% | 90,390 | (147.7 | )% | ||||||||||||||
| Net loss | $ | (7,396,495 | ) | (134.3 | )% | $ | (1,356,773 | ) | $ | (25.8 | )% | $ | (6,039,722 | ) | 445.2 | % | ||||||||
6
Revenue
Currently, we have three revenue streams: mold production, mold repair and machining services.
Total revenue for the six months ended June 30, 2026 increased by $246,662, or 4.7%, to $5,508,131 from $5,261,469 for the same period in 2025.
The following table sets forth the breakdown of our unaudited revenue for the six months ended June 30, 2026 and 2025, respectively:
(UNAUDITED)
| For the Six Months Ended June 30, | ||||||||||||||||||||||||
| 2026 | 2025 | Variance | ||||||||||||||||||||||
| Amount | % | Amount | % | Amount | % | |||||||||||||||||||
| Mold production | $ | 3,543,601 | 64.3 | % | $ | 3,634,475 | 69.1 | % | $ | (90,874 | ) | (2.5 | )% | |||||||||||
| Mold repair | 296,763 | 5.4 | % | 491,454 | 9.3 | % | (194,691 | ) | (39.6 | )% | ||||||||||||||
| Machining services | 1,667,767 | 30.3 | % | 1,135,540 | 21.6 | % | 532,227 | 46.9 | % | |||||||||||||||
| Total | $ | 5,508,131 | 100.0 | % | $ | 5,261,469 | 100.0 | % | $ | 246,662 | 4.7 | % | ||||||||||||
Revenues from mold production. Revenues from mold production accounted for 64.3% and 69.1% of our total revenues for the six months ended June 30, 2026 and 2025, respectively. Revenue from mold production decreased by $90,874, or 2.5% from $3,634,475 for the six months ended June 30, 2025 to $3,543,601 for the same period in 2026. The decrease was primarily due to a reduction in average selling prices resulting from intensified market competition. Although we experienced an increase in sales volume, the price reduction outpaced the volume growth, leading to a net decrease in total revenue. We will continue to monitor market conditions and will adjust our pricing strategy as appropriate.
Revenues from mold repair. Revenues from mold repair accounted for 5.4% and 9.3% of our total revenues for the six months ended June 30, 2026 and 2025, respectively. Revenues from mold repair decreased by $194,691, or 39.6% from $491,454 for the six months ended June 30, 2025 to $296,763 for the same period in 2026. The decrease was primarily attributable to a decline in both sales volume and average selling prices, driven by intensified market competition and softened customer demand during the period.
Revenues from machining services. Revenues from machining services accounted for 30.3% and 21.6% of our total revenues for the six months ended June 30, 2026 and 2025, respectively. Revenues from machining services have significantly increased by $532,227, or 46.9% from $1,135,540 for the six months ended June 30, 2025 to $1,667,767 for the same period in 2026. The increase was primarily driven by higher sales volume resulting from growing customer demand. Kehua Holding Co., Ltd. and Suzhou Lvkon Transmission Technology Co., Ltd. are our major customers in machine services.
Cost of Revenues
The following table sets forth the breakdown of our unaudited cost of revenue for the six months ended June 30, 2026 and 2025, respectively:
(UNAUDITED)
| For the Six Months Ended June 30, | ||||||||||||||||||||||||
| 2026 | 2025 | Variance | ||||||||||||||||||||||
| Amount | % | Amount | % | Amount | % | |||||||||||||||||||
| Mold production | $ | 3,220,198 | 64.9 | % | $ | 2,704,880 | 71.3 | % | $ | 515,318 | 19.1 | % | ||||||||||||
| Mold repair | 279,912 | 5.6 | % | 215,256 | 5.7 | % | 64,656 | 30.0 | % | |||||||||||||||
| Machining services | 1,463,935 | 29.5 | % | 872,913 | 23.0 | % | 591,022 | 67.7 | % | |||||||||||||||
| Total | $ | 4,964,045 | 100.0 | % | $ | 3,793,049 | 100.0 | % | $ | 1,170,996 | 30.9 | % | ||||||||||||
7
The cost of revenues increased by $1,170,996, or 30.9%, to $4,964,045 for the six months ended June 30, 2026, from $3,793,049 for the same period in 2025. cost of revenues mainly comes from raw material costs, manufacturing costs and labor costs.
The total revenue has increased by 4.7%, but the total cost of revenue has increased by 30.9%, the reasons for the cost increase much more than revenue are as follows:
Firstly, due to the increase in order volume, the material costs increased by $499,053 from $1,080,316 for the six months ended June 30, 2025 to $1,579,369 for the same period in 2026.
Secondly, in order to promote the future development of machining services and expand production capacity, we hired more production labor for the six months ended June 30, 2026, which led to an increase in labor cost of $211,887 compared with the same period in 2025.
Lastly, the increase in the manufacturing cost by $345,413 compared with the same period for the six months ended June 30, 2026. In order to pursue the future development of the aluminum alloy pressure casting mold business and machining service and expand production capacity, the total investment of production machinery and equipment for the six months ended June 30, 2026 and 2025 was $501,250 and $118,899, respectively, resulting in an increase in depreciation expense which allocated to production costs of $108,880. The depreciation expense has increased to $338,665 for the six months ended June 30, 2026 compared with $229,785 for the six months ended June 30, 2025. In addition, leasing cost increased by $201,731 for the six months ended June 30, 2026, primarily due to the relocation of our production facilities.
Gross Profit
Total gross profit was $544,086 for the six months ended June 30, 2026, a decrease of $924,334 from $1,468,420 for the same period in 2025. Gross profit margin declined by 18.0%, to 9.9% for the six months ended June 30, 2026, from 27.9% for the same period in 2025.
Our gross profit and gross profit margin by product types were as follows:
(UNAUDITED)
| For the Six Months Ended June 30, | ||||||||||||||||||||||||
| 2026 | 2025 | Variance | ||||||||||||||||||||||
| Gross profit | Margin % | Gross profit | Margin % | Gross profit | Margin % | |||||||||||||||||||
| Mold production | $ | 323,403 | 9.1 | % | $ | 929,595 | 25.6 | % | $ | (606,192 | ) | (65.2 | )% | |||||||||||
| Mold repair | 16,851 | 5.7 | % | 276,198 | 56.2 | % | (259,347 | ) | (93.9 | )% | ||||||||||||||
| Machining services | 203,832 | 12.2 | % | 262,627 | 23.1 | % | (58,795 | ) | (22.4 | )% | ||||||||||||||
| Total | $ | 544,086 | 9.9 | % | $ | 1,468,420 | 27.9 | % | $ | (924,334 | ) | (62.9 | )% | |||||||||||
Gross profit for mold production decreased by $606,192 to $323,403 for the six months ended June 30, 2026, as compared to $929,595 for the same period in 2025. The manufacturing costs, labor costs and the depreciation expense collocated to cost of sales all increased due to expanded production scale, which resulted in increase in total cost of sales. Costs increased at a greater rate than the increase in revenue for the six months ended June 30, 2026 compared with the same period in 2025, which led to the decrease in gross profit and gross profit margin. Mold production is the main source of revenue of us, due to an increase in order volume in the first half of 2026 compared to the first half of 2025, the total cost of sales increased by 19.1% which adversely affected the profit margin of mold production business. Due to the fact that mold production remains the main source of revenue for us, the increase in manufacturing costs and labor costs absorption was the largest. As the mold production industry market competition intensifies, we reduced the selling price of our products to maintain our competitive advantage despite rising product costs, which resulted in a decline in gross profit.
8
Gross profit for mold repair decreased by $259,347 to $16,851 for the six months ended June 30, 2026, as compared to $276,198 for the same period in 2025. similar to the mold production, affected by market conditions, we have had no choice but to lower our selling prices. Furthermore, the growth in fixed costs has resulted in a substantial decrease in gross profit.
Gross profit for machining services decreased by $58,795 to $203,832 for the six months ended June 30, 2026, as compared to $262,627 for the same in 2025. The decrease in the gross profit was mainly due to the growth in fixed costs and higher raw material costs.
Operating Expenses
(UNAUDITED)
| For the Six Months Ended June 30, | ||||||||||||||||||||||||
| 2026 | 2025 | Variance | ||||||||||||||||||||||
| Amount | % | Amount | % | Amount | % | |||||||||||||||||||
| Selling expenses | $ | 226,705 | 2.8 | % | $ | 53,764 | 3.7 | % | $ | 172,941 | 321.7 | % | ||||||||||||
| General and administrative expenses | 2,870,661 | 36.0 | % | 1,003,686 | 68.4 | % | 1,866,975 | 186.0 | % | |||||||||||||||
| Research and development expenses | 4,894,698 | 61.2 | % | 409,623 | 27.9 | % | 4,485,075 | 1,094.9 | % | |||||||||||||||
| Total operating expenses | $ | 7,992,064 | 100.0 | % | $ | 1,467,073 | 100.0 | % | $ | 6,524,991 | 444.8 | % | ||||||||||||
Selling Expenses
Selling expenses were $226,705 for the six months ended June 30, 2026, an increase of $172,941, or 321.7%, from $53,764 for the same period in 2025. This increase is mainly attributable to the a) in the second half of 2025, the Company entered into an agreement with third-party companies, pursuant to which the third-party companies introduced clients to the Company and charged referral fees, resulting in an increase of $155,197 in related expenses; b) business entertainment expenses increased by $13,581 for the six months ended June 30, 2026 compared with the same period in 2025.
General and Administrative Expenses
Our general and administrative expenses were $2,870,661 for the six months ended June 30, 2026, an increase of $1,866,975 or 186.0%, from $1,003,686 for the same period in 2025. The increase was mainly due to the a) an increase of share-based compensation $1,459,200 to personnel engaged in general and administrative functions; b) increase of consulting fee for the six months ended June 30, 2026 by $358,872 compared with the same period in 2025.
Research and Development Expenses
Research and development expenses increased by $4,485,075, or 1,094.9%, to $4,894,698 for the six months ended June 30, 2026, from $409,623 for the same period in 2025. This increase was mainly attributable to newly added R&D projects entrusted to third-party companies, with an increase of $4,553,800.
9
Other income
Government subsidies
We receive various government subsidies from time to time, such as the “The High-Tech Enterprise Cultivation Award” and “Technology Development Support Grant.”, we cannot predict the likelihood or amount of any future subsidies.
For the six months ended June 30, 2026, government subsidies were $57,595. For the same period in 2025, government subsidies were $64,728.
Interest income
For the six months ended June 30, 2026, interest income was $1,068, increased by $380 as compared with the same period in 2025, interest income was $688. This is mainly due to the increase in average bank deposits during the six months ended June 30, 2026 compared to the same period in 2025.
Interest expense
For the six months ended June 30, 2026, interest expense was $29,254. For the same period in 2025, interest expense was $22,518, the increase of $6,736 mainly due to the increase in average bank loans for the six months ended June 30, 2026 compared with the same period in 2025.
Other-than-temporary impairment
For the six months ended June 30, 2026, we recorded an other-than-temporary impairment of nil compared to $1,356,618 for the same period in 2025. This impairment was due to the fact that the original agreed investment and operation plan was no longer executed by the executives of Planty Holding Limited (“Planty”), which indicated a severe and sustained adverse impact on Planty’s expected profitability, and management therefore determined that the fair value of the investment in Planty should be written down to nil.
Other (expenses) income, net
For the six months ended June 30, 2026, other expenses, net was $7,104. For the same period in 2025, other income, net was $16,812, a decrease of $23,916 or 142.3%.
Benefit from (provision for) Income Taxes
Our benefit from income taxes was $29,178 for the six months ended June 30, 2026, a decrease of $90,390, or 147.7% from provision for income taxes was $61,212 for the same period in 2025. The decrease was mainly due to the decrease in pre-tax profits.
Under the Enterprise Income Tax (“EIT”) Law of the PRC, domestic enterprises are usually subject to a unified 25% EIT rate while preferential tax rates, tax holidays, and even tax exemptions may be granted on a case-by-case basis. The PRC tax authorities grant preferential tax treatment to High and New Technology Enterprises (“HNTEs”). Under this preferential tax treatment, HNTEs are entitled to an income tax rate of 15%, subject to a requirement that they re-apply for HNTE status every three years. Since Wuxi Mingteng Mould was approved as an HNTE in December 2019, Wuxi Mingteng Mould is entitled to a reduced income tax rate of 15% beginning December 2019 and is able to enjoy the reduced income tax rate through December 2022. In November 2022, Wuxi Mingteng Mould reapplied to obtain the recognition of HNTE and the preferential rate of 15% was extended to November 2025. In November 2025, Wuxi Mingteng Mould reapplied and obtained the recognition of HNTE and the preferential rate of 15% was extended to November 2028.
10
Net Loss
As a result of the foregoing, our net loss for the six months ended June 30, 2026 was $7,396,495, and for the same period in 2025, the net loss was $1,356,773.
Liquidity and Capital Resources
As of June 30, 2026 and December 31, 2025, we had cash and cash equivalents of $6,289,189 and $1,452,992, respectively.
Our main sources of operating funds are from equity financing and external borrowings, and we are confident they are sufficient to sustain our operations after the offering.
Working Capital
Total working capital as of June 30, 2026 amounted to $13,064,464 compared to $1,554,211 as of December 31, 2025. The current assets increase mainly due to the increase in cash and cash equivalents of $4,836,197, short-term investments of $1,851,123, advance to supplier of $5,155,761, and other receivables of $1,783,212. Current liabilities amounted to $10,418,914 as of June 30, 2026 as compared to $8,301,487 as of December 31, 2025. This increase in liabilities was attributable mainly to the increases in short-term loans of $1,513,751, and accounts payable of $745,151.
Capital Needs
Our capital needs include our daily operating needs and capital expenditure. With the uncertainty of the current market our management believes it is necessary to enhance the collection of outstanding accounts receivable and other receivables and to be cautious on operational decisions and project selection. We review the accounts receivable on a periodic basis and make general and specific allowances when there is doubt as to the recoverability of individual balances. Our management is confident in the collection of account receivables and other receivables.
Cash Flows Analysis
Six Months Ended June 30, 2026 Compared to Six Months Ended June 30, 2025
The following table sets forth a summary of our unaudited cash flows for the periods indicated:
(UNAUDITED)
| For the Six Months Ended June 30, | ||||||||
| 2026 | 2025 | |||||||
| Net cash used in operating activities | $ | (9,402,072 | ) | $ | (227,053 | ) | ||
| Net cash used in investing activities | (9,929,944 | ) | (295,389 | ) | ||||
| Net cash provided by financing activities | 24,128,130 | 190,000 | ||||||
| Effect of foreign exchange rate on cash and cash equivalents | 40,083 | 6,932 | ||||||
| Net increase (decrease) in cash and cash equivalents | 4,836,197 | (325,510 | ) | |||||
| Cash and cash equivalents at the beginning of the period | 1,452,992 | 2,080,715 | ||||||
| Cash and cash equivalents at the end of the period | $ | 6,289,189 | $ | 1,755,205 | ||||
Operating Activities
Net cash used in operating activities amounted to $9,402,072 for the six months ended June 30, 2026. It was primarily due to a) a net loss of $7,396,495, adjusted by depreciation of $398,296, b) amortization of intangible assets and right-of-use assets of $203,660, c) share-based compensation expenses of $1,459,200, d) deferred income tax benefits of $29,178, e) provision for credit losses of $24,400, f) provision for contract costs impairment of $7,465. g) increase in other receivables-bank acceptance notes of $561,116, h) decrease in account receivable of $844,750, i) increase in advances to suppliers of $5,150,578, j) decrease in other receivables of $20,562, k) increase in inventories of $122,678 due to the expansion of order volume, l) increase in accounts payable of $1,025,251, m) decrease in advance from customers of $15,751, n) increase in payroll payable of $58,258 due to the social security and public housing funding, and the salary for independent directors, etc.
11
Net cash used in operating activities amounted to $227,053 for the six months ended June 30, 2025. It was primarily due to a) a net loss of $1,356,773, adjusted by depreciation of $282,373, b) amortization of intangible assets and right-of-use assets of $17,867, c) deferred income tax of $6,493, d) provision for credit losses of $3,907, e) impairment loss on long-term investment of $1,356,618, f) provision for contract costs impairment of $13,165. g) increase in other receivables-bank acceptance notes of $726,008, h) decrease in account receivable of $245,175, i) decrease in advances to suppliers of $47,880, j) increase in inventories of $295,816 due to the expansion of order volume, k) increase in accounts payable of $102,825, l) decrease in advance from customers of $214,530, m) increase in payroll payable of $192,941 due to the social security and public housing funding, and the salary for independent directors, n) increase in other payable of $49,182 due to the unpaid fees, etc.
Investing Activities
Net cash used in investing activities amounted to $9,929,944 for the six months ended June 30, 2026. It was primarily due to a) purchase of property and equipment amount of $781,362, b) purchases of intangible assets amount of $63,867, c) purchase short-term investments of $2,983,966, d) maturities of short-term investments of $1,165,925, e) interest-free loan to third parties of $2,266,674; f) prepayment for equity subscription of $1,000,000; g) prepayment for acquisition related deposits of $4,500,000; h) repayment of interest-free loan to third parties of $500,000.
Net cash used in investing activities amounted to $295,389 for the six months ended June 30, 2025. It was primarily due to purchase of property and equipment.
Financing Activities
Net cash provided by financing activities was $24,128,130 for the six months ended June 30, 2026. During the first half of 2026, we received net proceeds from short-term loans of $1,450,708, cash receipts from equity issuance, net of issuance cost of $22,777,422, repayments of third party loans of $100,000.
Net cash provided by financing activities was $190,000 for the six months ended June 30, 2025. During the first half of 2025, we received proceeds from third party loans of $190,000.
Loan Facilities
On February 21, 2024, we renewed the unsecured short-term loan agreement with Bank of Jiangsu with principal amount of RMB 10 million (approximately $1.4 million), with an annual interest rate of 2.95%. The maturity date of the loan is February 20, 2025.
On February 18, 2025, we entered into an additional secured short-term loan agreement with Bank of Jiangsu with principal amount of RMB 10 million (approximately $1.4 million), with an annual interest rate of 3.30%. The maturity date of the loan is February 17, 2026.
On December 18, 2025, Wuxi Mingteng Mould entered into a short-term loan agreement with Bank of Jiangsu with principal amount of approximately $1.4 million, with an annual interest rate of 2.30% and maturity date as of December 17, 2026
On January 14, 2026, Wuxi Mingteng Mould received a short-term loan of approximately $0.71 million from China Merchants Bank with the initial loan interest rate of 2.25%. The interest rate is a floating rate based on LPR, reduced by 75 basis points, with a repricing period of three months. The maturity date of the loan is January 14, 2027.
On March 5, 2026, Wuxi Mingteng Mould received a short-term loan of approximately $0.71 million from China CITIC Bank with the initial loan interest rate of 2.4%. The maturity date of the loan is March 5, 2027.
12
Contingencies
From time to time, we may be subject to certain legal proceedings, claims and disputes that arise in the ordinary course of business. Amounts accrued, as well as the total amount of possible losses with respect to such matters, individually and in the aggregate, are not deemed to be material to the consolidated financial statements. As of June 30, 2026, we have no outstanding litigation.
Off-Balance Sheet Arrangements
We have not entered into any financial guarantees or other commitments to guarantee the payment obligations of any third parties. In addition, we have not entered into any derivative contracts that are indexed to our own shares and classified as shareholders’ equity, or that are not reflected in our financial statements. Furthermore, we do not have any retained or contingent interest in assets transferred to an unconsolidated entity that serves as credit, liquidity or market risk support to such entity. Moreover, we do not have any variable interest in an unconsolidated entity that provides financing, liquidity, market risk or credit support to us or engages in leasing, hedging or research and development services with us.
Inflation
Inflationary factors, such as increases in the cost of raw materials, personnel and overhead costs, could impair our operating results. Although we do not believe that inflation has had a material impact on our financial position or results of operations to date, a high rate of inflation in the future may have an adverse effect on our ability to maintain current levels of gross margin and operating expenses if the revenues from our products do not increase with such increased costs. We source key materials from third parties located in China. Although China has not experienced significant inflation and thus inflation has not had a material impact on our results of operations, we cannot provide any assurances that we will not be affected in the future by higher rates of inflation in mainland China. Sustained or rising inflation may result in increased costs to us in obtaining supplies of key materials to produce our products. If we explore the international market in the future, inflation may affect us by increasing our cost of labor and freight costs for our exported products. As a result, our results of operations may be adversely impacted.
Our plan to mitigate inflationary pressures are as follows: 1) control the growth of external costs by locking in prices and buying in bulk; 2) consider user experience and profitability, strengthen communication with customers, and adjust our pricing strategy to meet cost increases; and 3) strengthen internal management and technology research, to improve production efficiency and reducing the waste of production resources.
Supply Chain Analysis
For the six months ended June 30, 2026, two suppliers accounted for approximately 39.3% and 30.6% of the total purchases. For the six months ended June 30, 2025, two suppliers accounted for approximately 13.3%, and 10.3% of the total purchases.
The raw materials used in production are mainly universal, such as steel and castings, which are highly replaceable and have a wide range of procurement sources. Therefore, we do not have nor anticipate a major dependence on suppliers, and the loss of some suppliers will not have a significant impact on our production.
Seasonality
The nature of our business does not appear to be affected by seasonal variations.
Critical Accounting Policies.
We prepare our consolidated financial statements in accordance with U.S. GAAP. These accounting principles require us to make judgments, estimates and assumptions on the reported amounts of assets and liabilities at the end of each fiscal period, and the reported amounts of revenues and expenses during each fiscal period. We continually evaluate these judgments and estimates based on our own historical experience, knowledge and assessment of current business and other conditions, our expectations regarding the future based on available information and assumptions that we believe to be reasonable.
13
The selection of critical accounting policies, the judgments and other uncertainties affecting the application of those policies and the sensitivity of reported results to changes in conditions and assumptions are factors that should be considered when reviewing our financial statements. We believe the following accounting policies involve the most significant judgments and estimates used in the preparation of our consolidated financial statements.
Fair value of financial instruments
Fair value is the price that would be received from selling an asset or paid to transfer a liability in an orderly transaction between market participants at the measurement date. When determining the fair value measurements for assets and liabilities required or permitted to be recorded at fair value, we consider the principal or most advantageous market in which it would transact, and it considers assumptions that market participants would use when pricing the asset or liability.
Authoritative literature provides a fair value hierarchy that requires an entity to maximize the use of observable inputs and minimize the use of unobservable inputs when measuring fair value. A financial instrument’s categorization within the fair value hierarchy is based upon the lowest level of input that is significant to the fair value measurement. We follow ASC subtopic 820-10, Fair Value Measurements and Disclosures, which establishes a three-tier fair value hierarchy, and prioritizes the inputs used in measuring fair value as follows:
| ● | Level 1 - inputs to the valuation methodology are quoted prices (unadjusted) for identical assets or liabilities in active markets. |
| ● | Level 2 - inputs to the valuation methodology include quoted prices for similar assets and liabilities in active markets, quoted market prices for identical or similar assets in markets that are not active, inputs other than quoted prices that are observable, and inputs derived from or corroborated by observable market data. |
| ● | Level 3 - inputs to the valuation methodology are unobservable. |
ASC 820 describes three main approaches to measuring the fair value of assets and liabilities: (1) market approach; (2) income approach and (3) cost approach. The market approach uses prices and other relevant information generated from market transactions involving identical or comparable assets or liabilities. The income approach uses valuation techniques to convert future amounts to a single present value amount. The measurement is based on the value indicated by current market expectations about those future amounts. The cost approach is based on the amount that would currently be required to replace an asset.
Unless otherwise disclosed, the fair value of our financial instruments including cash and cash equivalents, accounts receivable, bank acceptance notes, other receivables, short-term loans, accounts payable, other payables, and amounts due to related parties approximate their recorded values due to their short-term maturities. The fair value of longer-term leases approximates their recorded values as their stated interest rates approximate the rates currently available.
Our non-financial assets, such as property and equipment and intangible assets would be measured at fair value only if they were determined to be impaired. When there is impairment of equity investments accounted for under the measurement alternative, the non-recurring fair value measurements are measured at the date of impairment. Estimating the fair value of the equity investment without observable market prices is highly judgmental due to the subjectivity of the unobservable inputs (level 3) used in the valuation methodologies used to determine fair value.
Leases
We account for leases following FASB ASC 842, Leases (“Topic 842”). We lease properties from property owners. In evaluating whether an agreement constitutes a lease. We review the contractual terms to determine which party obtains both the economic benefits and control of the assets at the inception of the contract. We categorize leases with contractual terms longer than twelve months as either operating or finance lease at the commencement date of a lease.
14
We recognize a lease liability for future fixed lease payments and a right-of-use (“ROU”) asset representing the right to use the underlying asset for the lease term. The lease term is based on the non-cancellable term of the lease and may contain options to extend the lease when it is reasonably certain that we will exercise the option. Lease liabilities are recognized at commencement date based on the present value of fixed lease payments over the lease term using the rate implicit in the lease, if available, or our incremental borrowing rate. As its leases do not provide an implicit borrowing rate, we use an incremental borrowing rate based on the estimated rate of interest for collateralized borrowing over a similar term of the lease payments at the commencement date. Current maturities of operating lease liabilities are classified as operating lease liabilities, current in our unaudited consolidated balance sheets. Most leases have initial terms ranging from 1 to 3 years. Besides, our lease payments are fixed. Lease expense for fixed lease payments is recognized on a straight-line basis over the lease term. Our lease agreements do not contain any significant residual value guarantees or restricted covenants. The ROU assets are measured at the amount of the lease liabilities with adjustments, if applicable, for lease prepayments made prior to or at lease commencement, initial direct costs incurred by us, deferred rent and lease incentives. We evaluate the carrying value of ROU assets if there are indicators of impairment and review the recoverability of the related asset group.
We reassess of a contract is or contains a leasing arrangement and re-measures ROU assets and liabilities upon modification of the contract. We will derecognize ROU assets and liabilities, with a difference recognized in the income statement on the contract termination.
Operating leases are included in operating lease right-of-use (“ROU”) assets, current portion of lease liabilities, and non-current portion of lease liabilities, on our unaudited consolidated balance sheets.
Revenue recognition
We account for revenue recognition under FASB ASC 606, Revenue from Contracts with Customers (“ASC 606”). In accordance with FASB ASC 606, Revenue from Contracts with Customers, we recognized revenue to represent the transfer of products or services to customers in an amount that reflects the consideration to which we expect to be entitled in such exchange. This will require us to identify contractual performance obligations and determine whether revenue should be recognized at a point in time or over time, based on when control of the product or the benefit of the services transfers to the customer. Under the guidance of ASC 606, we are required to (a) identify the contract with a customer, (b) identify the performance obligations in the contract, (c) determine the transaction price, (d) allocate the transaction price to the performance obligations in the contract and (e) recognize revenue when (or as) we satisfy our performance obligations.
Our main business income is divided into three categories, one is mold production, that is, contracts are signed to sell molds widely used in automobiles, valves, water pumps and other industries according to the customer’s needs. Second is mold repair, which provides customers with mold repair service, or provides sales of mold components. Last is providing customers with machining services, using our remaining capacity to provide customers with external processing services. Revenues represent the amount of consideration that we are entitled to in exchange for the transfer of promised goods or services in the ordinary course of our activities and is recorded net of value-added tax (“VAT”). Consistent with the criteria of ASC 606, we recognize revenue when the performance obligation in a contract is satisfied by transferring the control of promised goods or services to the customer. We elect to account for shipping and handling activities as a fulfillment cost rather than as a separate performance obligation, of which was expensed as incurred and amounted to $58,850 and $37,430 for the six months ended June 30, 2026 and 2025, respectively.
Mold Production:
We sign contracts with customers and provide products according to the sales contract or sales list. The clients check the quantity and quality of products received and then issue confirmation as proof of payment. Certain clients may also test the finished products as part of the confirmation process. Revenue is recognized when we receive the confirmation of product acceptance.
15
We provide design and production services according to the sales contract or lists. Then we transport the finished products when clients give their order.
The design services are inseparable from project sales. A mold production contract may include two or more machine components, but all components are customized according to customer requirements. These components need to be combined under the guidance of design plans to produce qualified products to meet the needs of clients. Therefore, these services are highly interdependent and are never transferred to the customer on their own. Customers do not have the option to purchase these services separately principally due to the customization of each project. Accordingly, these services are not considered separate performance obligations, and no revenue is associated with these services under FASB ASC 606 until the point in time when the project is complete and delivered, and client confirmation is received.
We provide maintenance services and according to the contracts the clients do not have the option to purchase these services separately. The promised warranty does not provide the clients with a service in addition to the assurance that the product complies with agreed-upon contract specifications and is considered an assurance warranty. The maintenance services and the warranty are not considered separate performance obligations, and no revenue is associated with these services under ASC 606. Historically, we have not experienced material costs for quality assurance and, therefore, do not believe an accrual for these costs is necessary.
Mold Repair:
We sign contracts with customers and provide repair services according to the contract or list and charge a certain fee. Revenue is recognized only after the repair service has passed the customer’s inspection.
Machining Services:
We sign contracts with customers and provide machining services and charge a certain fee. We identify the fulfillment of its obligation when transferring the product and getting confirmation from customers to issue the VAT invoice at which time revenue is recognized.
Contract Balances
We classify its right to consideration in exchange for services or products transferred to a customer as either a receivable or a contract asset. A receivable is a right to consideration that is unconditional as compared to a contract asset which is a right to consideration that is conditional upon factors other than the passage of time. We recognize accounts receivable in its consolidated balance sheets when it performs a service in advance of receiving consideration and it has the unconditional right to receive consideration. A contract asset is recorded when we have transferred services or products to the customer before payment is received or is due, and the right to consideration is conditional on future performance or other factors in the contract. As of June 30, 2026 and December 31, 2025, we had no contract assets.
We capitalized incremental costs incurred to fulfill contracts that (1) relate directly to the contract, (2) are expected to generate resources that will be used to satisfy the performance obligation under the contract, and (3) are expected to be recovered through revenue generated under the contract. The compensation expenses of workforce hired and depreciation of certain equipment and overheads for the purpose of providing certain machining services are considered incremental costs to fulfill the contracts. These contract costs are recorded as cost of revenues upon the recognition of the related revenues. Provisions for estimated losses, if any, on uncompleted contracts are recorded in the period in which such losses become probable based on the current contract estimates. As of June 30, 2026 and December 31, 2025, we had deferred contract costs of $90,722 and $49,763, respectively. Impairment for contract costs amounted to $7,465 and 13,165 for the six months ended June 30, 2026 and 2025, respectively
Contract liabilities are recognized if we receive consideration prior to satisfying the performance obligations, which are customer advances. The consideration received from customers related to the remaining arrangements are included in advance from customer balance.
16
As of June 30, 2026 and December 31, 2025, advance from customers amounted to $95,882 and $108,356, respectively. During the six months ended June 30, 2026 and 2025, the Company recognized revenue that were previously deferred as contract liabilities amounted to $91,629, and $501,285, respectively.
Current expected credit losses
On January 1, 2023, we adopted ASC 326, Financial Instruments-Credit Losses, which requires recognition of allowances upon origination or acquisition of financial assets at an estimate of expected credit losses over the contractual term of the financial assets (the current expected credit loss or the “CECL” model) using the modified retrospective transition method.
Our financial assets subject to the CECL model mainly include accounts receivable, bank acceptance notes and other receivables and deposits in other assets, non-current.
For accounts receivable and bank acceptance notes, we estimate the loss rate based on historical experience, the age of the receivable balances, credit quality of its customers, current economic conditions, reasonable and supportable forecasts of future economic conditions, and other factors that may affect its ability to collect from customers. For other receivables and other assets, non-current, we review other receivables and other assets, non-current on a periodic basis and makes allowances on an individual basis when there is doubt as to the collectability. Receivables are written off after all collection efforts have been exhausted.
For the six months ended June 30, 2026 and 2025, allowance of credit losses made by the Company were mainly generated from accounts receivable.
Long-term investment
Our equity investments without readily determinable fair value are a long-term investment in an unlisted company. For equity securities without readily determinable fair value and do not qualify for the existing practical expedient in ASC Topic 820, Fair Value Measurements and Disclosures (“ASC 820”) to estimate fair value using the net asset value per share (or its equivalent) of the investment, we elected to use the measurement alternative under ASC 321, Investments — Equity Securities (“ASC 321”) to measure those investments at cost, less any impairment, plus or minus changes resulting from observable price changes in orderly transactions for identical or similar investments of the same issuer, if any. These investments are measured at fair value on a nonrecurring basis when an orderly transaction for identical or similar investments of the same issuer was identified or when there are events or changes in circumstances that may have a significant adverse effect. The non-recurring fair value measurements to the carrying amount of an investment usually requires management to estimate a price adjustment for the different rights and obligations between a similar instrument of the same issuer with an observable price change in an orderly transaction and the investment held by us. The valuation methodologies involved require management to use the observable transaction price at the transaction date and other unobservable inputs (level 3).
We make a qualitative assessment of whether the equity investments are impaired at each reporting date. If a qualitative assessment indicates that the investment is impaired, we estimate the investment’s fair value in accordance with the principles of ASC 820. If the fair value is less than the investment’s carrying value, we recognize an impairment loss in the statements of operations and comprehensive income (loss) equal to the difference between the carrying value and fair value.
Income taxes
Mingteng International’s subsidiaries in the PRC and Hong Kong are subject to the income laws of the PRC and Hong Kong. No taxable income was generated outside the PRC for the six months ended June 30, 2026 and 2025. Current income taxes are provided on the basis of net (loss) income for financial reporting purposes and adjusted for income and expense items which are not assessable or deductible for income tax purposes, in accordance with the regulations of the relevant tax jurisdictions. Deferred income taxes are provided using the asset and liability method. Under this method, deferred income tax assets and liabilities are recognized for the tax effects of temporary differences and are determined by applying enacted statutory tax rates that will be in effect in the period in which the temporary differences are expected to reverse to the temporary differences between the financial statements’ carrying amounts and the tax bases of assets and liabilities. Deferred tax assets and liabilities are offset if there is a legally enforceable right to offset deferred tax liabilities and assets, and they relate to income taxes levied by the same tax authority on the same taxable entity.
17
A valuation allowance is provided to reduce the amount of deferred tax assets if based on the weight of available evidence, it is more-likely-than-not that some portion, or all, of the deferred income tax assets will not be realized. The effect on deferred income taxes arising from a change in tax rates is recognized in the unaudited consolidated statements of comprehensive income (loss) in the period of change.
We apply a “more likely than not” recognition threshold in the evaluation of uncertain tax positions. We recognize the benefit of a tax position in its consolidated financial statements if the tax position is “more likely than not” to prevail based on the facts and technical merits of the position. Tax positions that meet the “more likely than not” recognition threshold are measured at the largest amount of tax benefit that has a greater than fifty percent likelihood of being realized upon settlement. Unrecognized tax benefits may be affected by changes in interpretation of laws, rulings of tax authorities, tax audits, and expiry of statutory limitations. In addition, changes in facts, circumstances and new information may require us to adjust the recognition and measurement estimates with regard to individual tax positions. Accordingly, unrecognized tax benefits are periodically reviewed and reassessed. Adjustments, if required, are recorded in our consolidated financial statements in the period in which the change that necessities the adjustments occur. The ultimate outcome for a particular tax position may not be determined with certainty prior to the conclusion of a tax audit and, in certain circumstances, a tax appeal or litigation process. We record interest and penalties related to unrecognized tax benefits (if any) in interest expenses and general and administrative expenses, respectively. As of June 30, 2026 and December 31, 2025, we did not have any significant unrecognized uncertain tax positions.
Recent accounting pronouncements
We are an “emerging growth company” (“EGC”) as defined in the Jumpstart Our Business Startups Act of 2012 (the “JOBS Act”). Under the JOBS Act, EGC can delay adopting new or revised accounting standards issued subsequent to the enactment of the JOBS Act until such time as those standards apply to private companies. The financial statements may therefore not be comparable to those of companies that comply with such new or revised accounting standards.
Recent Accounting Pronouncements Adopted
In July 2025, the FASB issued ASU 2025-05, “Financial Instruments — Credit Losses (Topic 326)”. Measurement of Credit Losses for Accounts Receivables and Contract Assets, which provides all entities with practical expedient of developing reasonable and supportable forecasts as part of estimating excepted credit losses, that assumes that current conditions as of the balance sheet date do not change for the remaining life of the asset. ASU 2025-05 is effective for annual reporting periods beginning after December 15, 2025, and interim reporting periods within those annual reporting periods. Early adoption is permitted in both interim and annual reporting periods in which financial statements have not yet been issued or made available for issuance. We adopted this ASU on a prospective basis effective January 1, 2026, the adoption of this guidance did not have a material impact on our unaudited interim condensed consolidated financial statements and related disclosures.
18
Recent Accounting Pronouncements Issued but not yet Adopted
In December 2023, the FASB issued ASU 2023-09 “Income Taxes (Topics 740): Improvements to Income Tax Disclosures” ASU 2023-09 expands existing income tax disclosures for rate reconciliations by requiring disclosure of certain specific categories and additional reconciling items that meet quantitative thresholds and expands disclosures for income taxes paid by requiring disaggregation by certain jurisdictions. For public business entities, the amendments in this update are effective for annual periods beginning after December 15, 2024. For entities other than public business entities, the amendments are effective for annual periods beginning after December 15, 2025. Early adoption is permitted for annual financial statements that have not yet been issued or made available for issuance. We are currently evaluating the impact of adopting the standard and does not expect that the adoption of this guidance will have a material impact on its financial position, results of operations and cash flows.
In November 2024, the FASB issued ASU 2024-03, “Reporting Comprehensive Income — Expense Disaggregation Disclosures”, which focuses on improving the disclosures about a public business entity’s expenses and addresses requests from investors for more detailed information about the types of expenses (including purchases of inventory, employee compensation, depreciation, amortization, and depletion) in commonly presented expense captions (such as cost of sales, SG&A, and research and development). The amendments in this update should be applied either (1) prospectively to financial statements issued for reporting periods after the effective date of this update or (2) retrospectively to any or all prior periods presented in the financial statements. In January 2025, the FASB issued ASU 2025-01, “Income Statement — Reporting Comprehensive Income—Expense Disaggregation Disclosures”. The amendment in ASU 2025-01 amends the effective date of ASC 2024-03 to clarify that all public business entities are required to adopt the guidance in annual reporting periods beginning after December 15, 2026, and interim periods within annual reporting periods beginning after December 15, 2027. Early adoption is permitted. We are currently evaluating the impact of this amendment and does not expect that the adoption of this guidance will have a material impact on its financial position, results of operations and cash flows.
We do not believe other recently issued but not yet effective accounting standards, if currently adopted, would have a material effect on our consolidated financial position, statements of operations and comprehensive income (loss) and cash flows.
19