Results Conference Call 3Q26
1 Disclaimer and Forward-Looking Statement This presentation may contain forward-looking statements within the meaning of federal securities law that are subject to risks and uncertainties. These statements are only predictions based upon our current expectations and projections about possible or assumed future results of our business, financial condition, results of operations, liquidity, plans and objectives. In some cases, you can identify forward-looking statements by terminology such as “believe,” “may,” “estimate,” “continue,” “anticipate,” “intend,” “should,” “plan,” “expect,” “predict,” “potential,” “seek,” “forecast,” or the negative of these terms or other similar expressions. The forward-looking statements are based on the information currently available to us. There are important factors that could cause our actual results, level of activity, performance or achievements to differ materially from the results, level of activity, performance or achievements expressed or implied by the forward-looking statements, including, among others things: changes in general economic, political, governmental and business conditions globally and in Argentina, changes in inflation rates, fluctuations in the exchange rate of the peso, the level of construction generally, changes in cement demand and prices, changes in raw material and energy prices, changes in business strategy and various other factors. You should not rely upon forward-looking statements as predictions of future events. Although we believe in good faith that the expectations reflected in the forward-looking statements are reasonable, we cannot guarantee that future results, levels of activity, performance and events and circumstances reflected in the forward-looking statements will be achieved or will occur. Any or all of Loma Negra’s forward-looking statements in this release may turn out to be wrong. You should consider these forward-looking statements in light of other factors discussed under the heading “Risk Factors” in Company’s Annual Report on Form 20-F, as well as periodic filings made on Form 6-K, which are filed with or furnished to the United States Securities and Exchange Commission. Except as required by law, we undertake no obligation to update publicly any forward-looking statements for any reason after the date of this release to conform these statements to actual results or to changes in our expectations. The Company presented some figures converted from Argentine pesos to U.S. dollars for comparison purposes. The exchange rate used to convert Pesos to U.S. dollars was the reference exchange rate (Communication “A” 3500) reported by the Central Bank for U.S. dollars. The information presented in U.S. dollars is for the convenience of the reader only. Certain figures included in this report have been subject to rounding adjustments. Accordingly, figures shown as totals in certain tables may not be arithmetic aggregations of the figures presented in previous quarters. Note: Loma Negra’s financial information has been prepared in accordance with the Argentine Securities Commission (Comisión Nacional de Valores-CNV) and with International Financial Reporting Standards. Following the categorization of Argentina as a country with a three-year cumulative inflation rate greater than 100%, the country is considered highly inflationary in accordance with IFRS. Consequently, starting July 1, 2018, the Company is reporting results applying IFRS rule IAS 29. IAS 29 requires that results of operations in hyperinflationary economies are reported as if these economies were highly inflationary as of January 1, 2018, and thus year-to-date, together with comparable results, should be restated adjusting for the change in general purchasing power of the local currency, using official indices. For comparison purposes and a better understanding of our underlying performance, in addition to presenting ‘As Reported’ results, we are also disclosing selected figures as previously reported excluding rule IAS 29. Additional information in connection with the application of rule IAS 29 can be found in our earnings report.
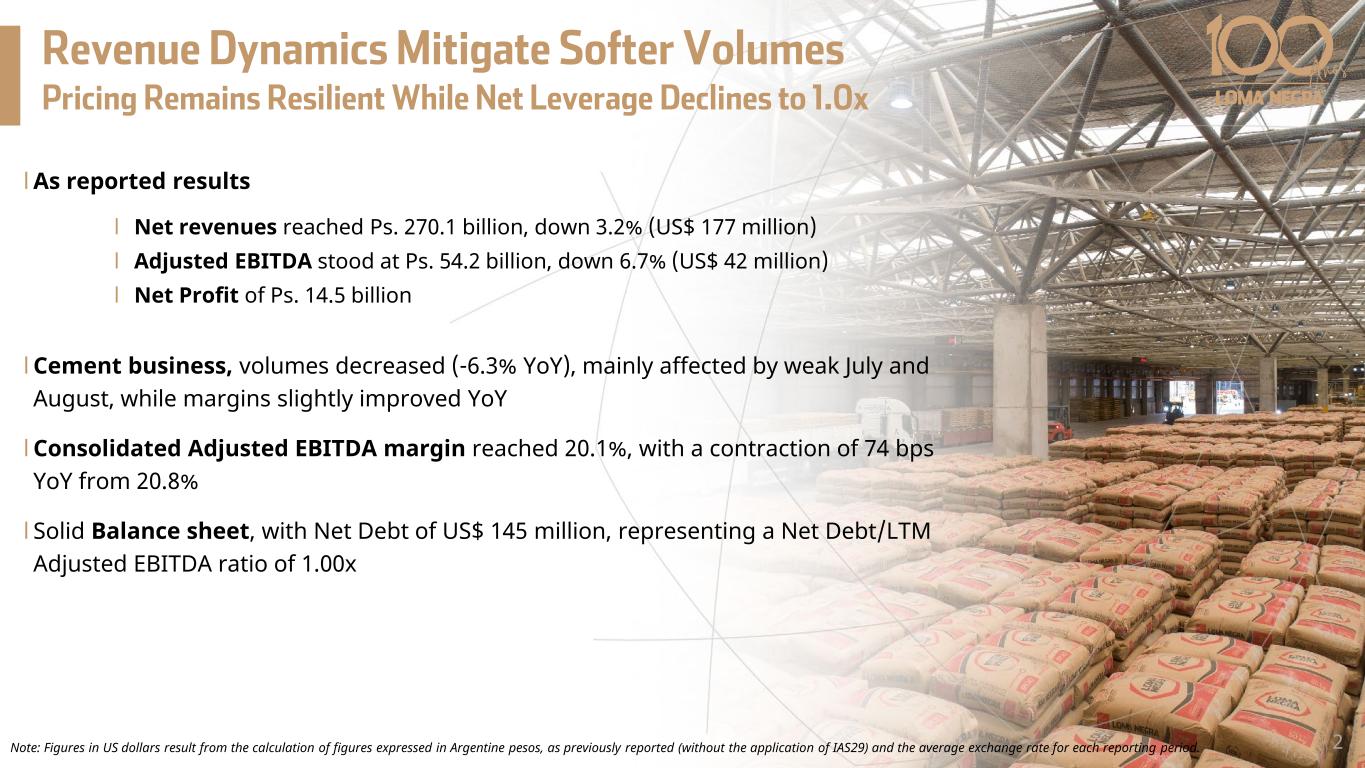
Revenue Dynamics Mitigate Softer Volumes Pricing Remains Resilient While Net Leverage Declines to 1.0x l As reported results l Net revenues reached Ps. 270.1 billion, down 3.2% (US$ 177 million) l Adjusted EBITDA stood at Ps. 54.2 billion, down 6.7% (US$ 42 million) l Net Profit of Ps. 14.5 billion l Cement business, volumes decreased (-6.3% YoY), mainly affected by weak July and August, while margins slightly improved YoY l Consolidated Adjusted EBITDA margin reached 20.1%, with a contraction of 74 bps YoY from 20.8% l Solid Balance sheet, with Net Debt of US$ 145 million, representing a Net Debt/LTM Adjusted EBITDA ratio of 1.00x Note: Figures in US dollars result from the calculation of figures expressed in Argentine pesos, as previously reported (without the application of IAS29) and the average exchange rate for each reporting period. 2
Macro & Industry context Revenues and Volumes
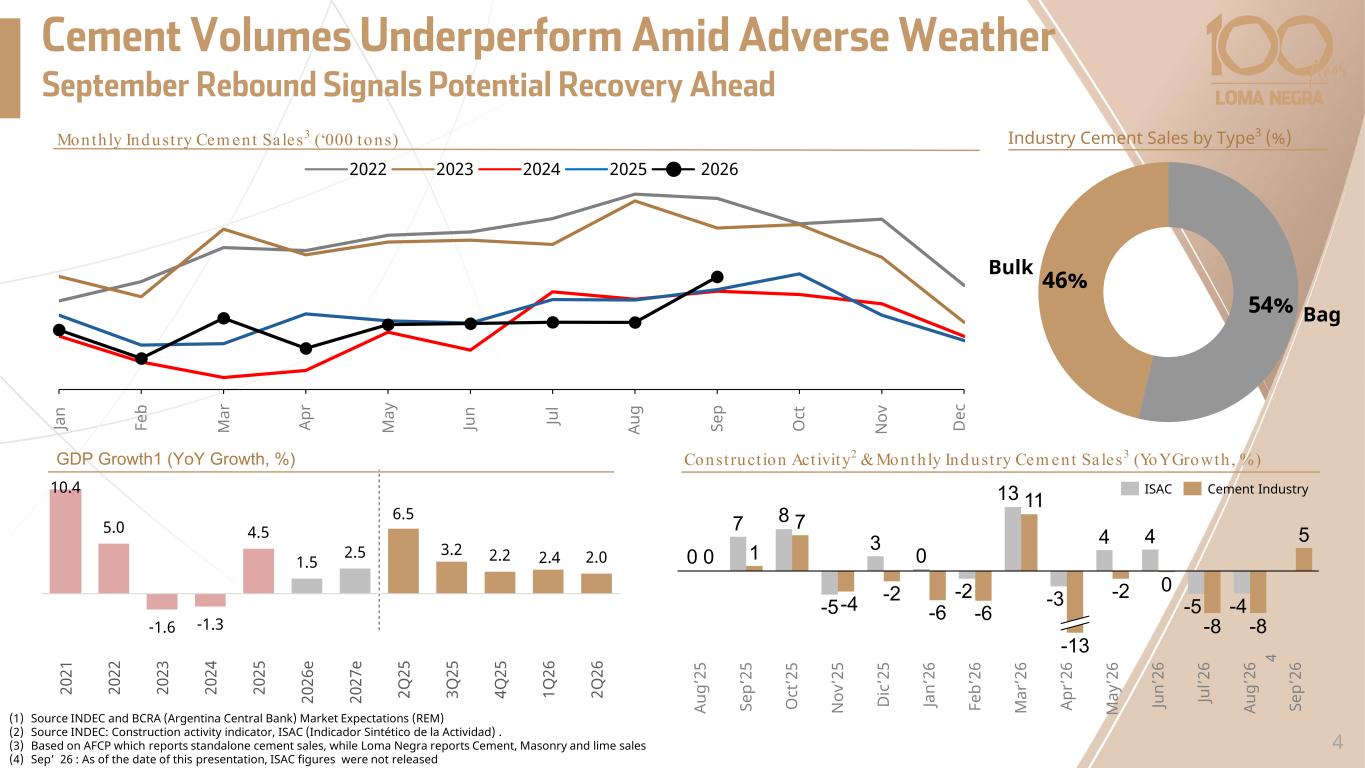
Cement Volumes Underperform Amid Adverse Weather September Rebound Signals Potential Recovery Ahead 10.4 5.0 -1.6 -1.3 4.5 1.5 2.5 6.5 3.2 2.2 2.4 2.0 20 21 20 22 20 23 20 24 20 25 20 26 e 20 27 e 2Q 25 3Q 25 4Q 25 1Q 26 2Q 26 Ap r Fe b Ja n M ar M ay N ovJu n Au g D ec Se p O ct 202620232022 2025 GDP Growth1 (YoY Growth, %) Monthly Industry Cem ent Sa les3 (‘000 tons) 2024 Ju l Industry Cement Sales by Type3 (%) Construct ion Act ivity2 & Month ly Industry Cem ent Sa les3 (YoY Growth , %) (1) Source INDEC and BCRA (Argentina Central Bank) Market Expectations (REM) (2) Source INDEC: Construction activity indicator, ISAC (Indicador Sintético de la Actividad) . (3) Based on AFCP which reports standalone cement sales, while Loma Negra reports Cement, Masonry and lime sales (4) Sep’ 26 : As of the date of this presentation, ISAC figures were not released 54% 46% Bag Bulk 4 7 8 -5 3 0 -2 13 -3 4 4 -5 -4 1 7 -4 -2 -6 -6 11 -2 0 -8 -8 5 Au g’ 25 Se p’ 25 O ct ’2 5 N ov ’2 5 D ic ’2 5 Ja n’ 26 Fe b’ 26 M ar ’2 6 Ap r’ 26 M ay ’2 6 Ju n’ 26 Ju l’2 6 Au g’ 26 Se p’ 26 0 0 -13 ISAC Cement Industry 4
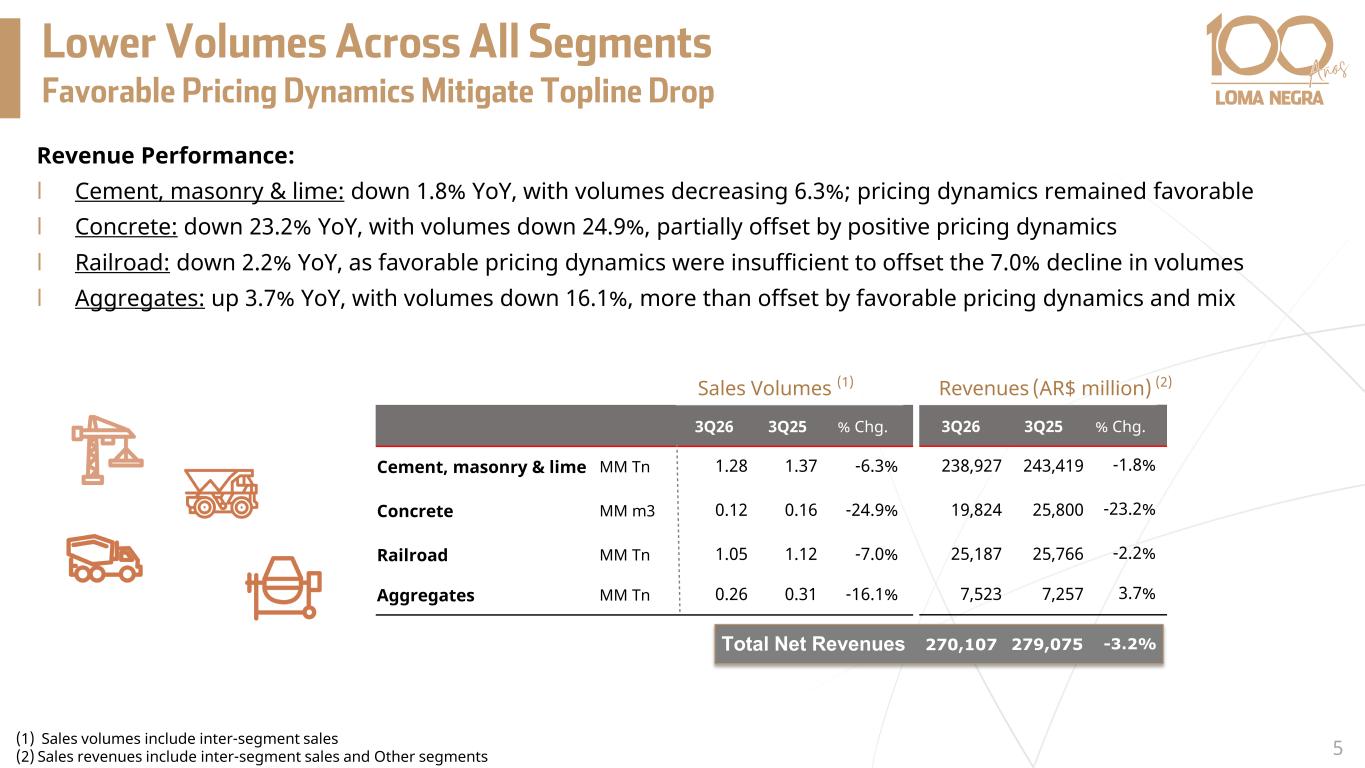
Lower Volumes Across All Segments Favorable Pricing Dynamics Mitigate Topline Drop Revenue Performance: l Cement, masonry & lime: down 1.8% YoY, with volumes decreasing 6.3%; pricing dynamics remained favorable l Concrete: down 23.2% YoY, with volumes down 24.9%, partially offset by positive pricing dynamics l Railroad: down 2.2% YoY, as favorable pricing dynamics were insufficient to offset the 7.0% decline in volumes l Aggregates: up 3.7% YoY, with volumes down 16.1%, more than offset by favorable pricing dynamics and mix 3Q26 3Q25 % Chg. Cement, masonry & lime MM Tn 1.28 1.37 -6.3% Concrete MM m3 0.12 0.16 -24.9% Railroad MM Tn 1.05 1.12 -7.0% Aggregates MM Tn 0.26 0.31 -16.1% 3Q26 3Q25 % Chg. 238,927 243,419 -1.8% 19,824 25,800 -23.2% 25,187 25,766 -2.2% 7,523 7,257 3.7% Sales Volumes (1) Revenues (AR$ million) (2) (1) Sales volumes include inter-segment sales (2) Sales revenues include inter-segment sales and Other segments 5 Total Net Revenues 270,107 279,075 -3.2%

Business Performance
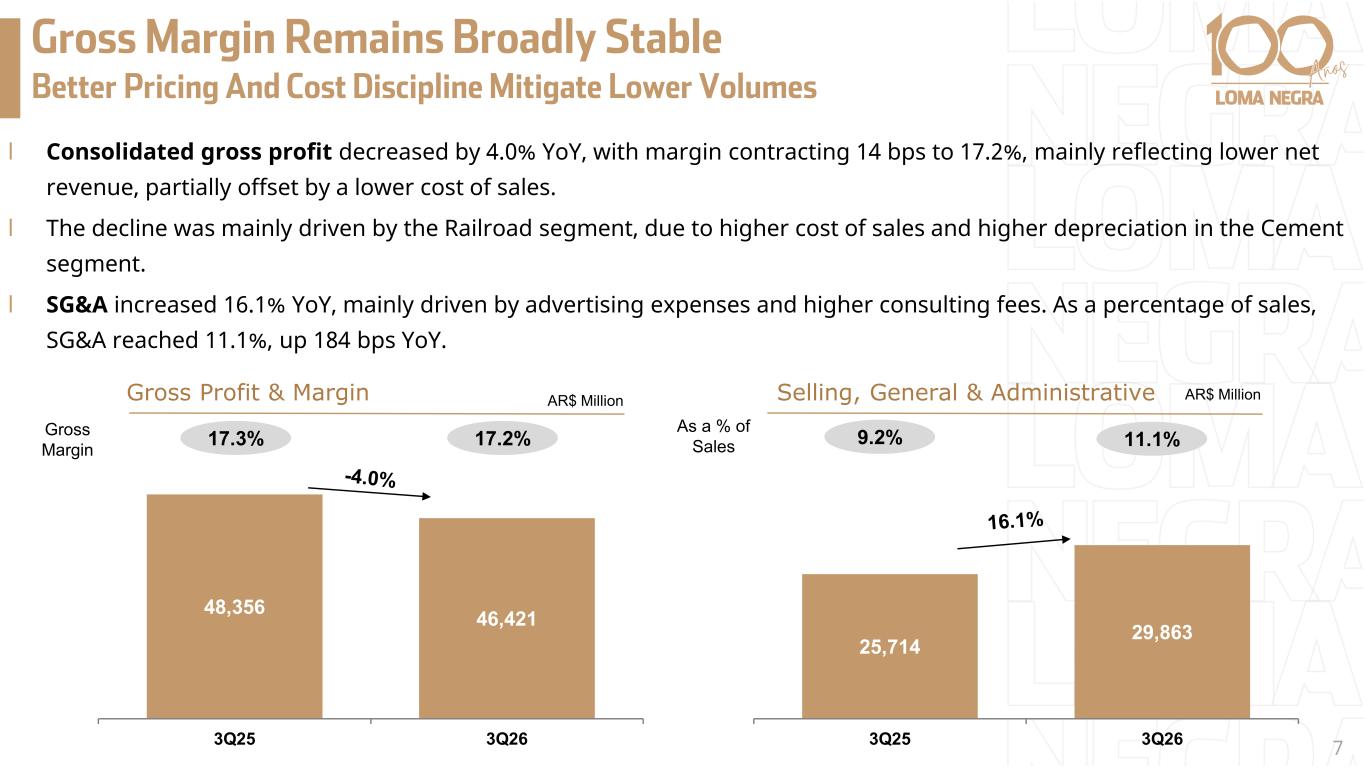
Gross Margin Remains Broadly Stable Better Pricing And Cost Discipline Mitigate Lower Volumes l Consolidated gross profit decreased by 4.0% YoY, with margin contracting 14 bps to 17.2%, mainly reflecting lower net revenue, partially offset by a lower cost of sales. l The decline was mainly driven by the Railroad segment, due to higher cost of sales and higher depreciation in the Cement segment. l SG&A increased 16.1% YoY, mainly driven by advertising expenses and higher consulting fees. As a percentage of sales, SG&A reached 11.1%, up 184 bps YoY. 48,356 46,421 3Q25 3Q26 Gross Profit & Margin 25,714 29,863 3Q25 3Q26 Selling, General & Administrative As a % of Sales AR$ Million AR$ Million Gross Margin 17.3% 9.2% 7 17.2% 11.1%
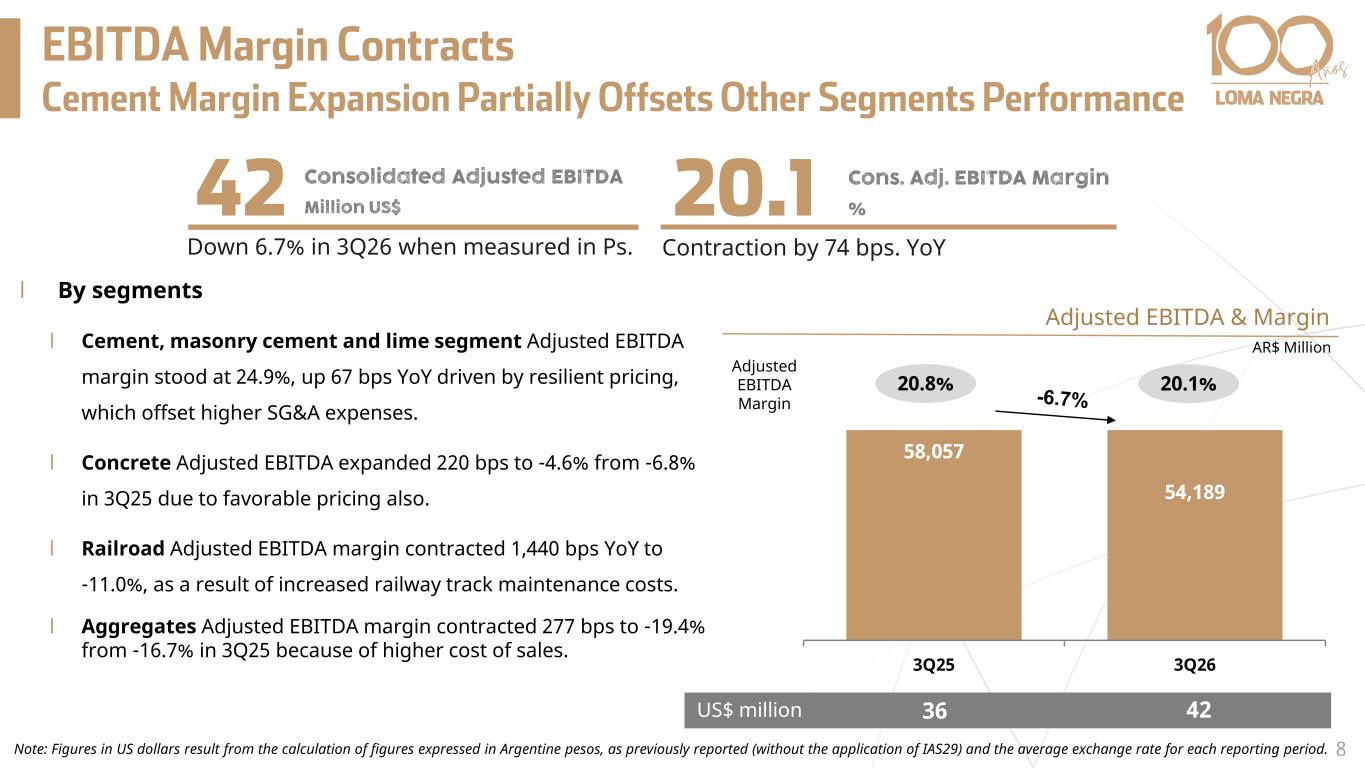
58,057 54,189 3Q25 3Q26 l By segments l Cement, masonry cement and lime segment Adjusted EBITDA margin stood at 24.9%, up 67 bps YoY driven by resilient pricing, which offset higher SG&A expenses. l Concrete Adjusted EBITDA expanded 220 bps to -4.6% from -6.8% in 3Q25 due to favorable pricing also. l Railroad Adjusted EBITDA margin contracted 1,440 bps YoY to -11.0%, as a result of increased railway track maintenance costs. l Aggregates Adjusted EBITDA margin contracted 277 bps to -19.4% from -16.7% in 3Q25 because of higher cost of sales. Adjusted EBITDA & Margin AR$ Million US$ million Adjusted EBITDA Margin 20.8% 36 Note: Figures in US dollars result from the calculation of figures expressed in Argentine pesos, as previously reported (without the application of IAS29) and the average exchange rate for each reporting period. 8 20.1% 42 EBITDA Margin Contracts Cement Margin Expansion Partially Offsets Other Segments Performance Down 6.7% in 3Q26 when measured in Ps. 42 20.1Consolidated Adjusted EBITDA Million US$ Cons. Adj. EBITDA Margin % Contraction by 74 bps. YoY
Bottom line & Financial performance
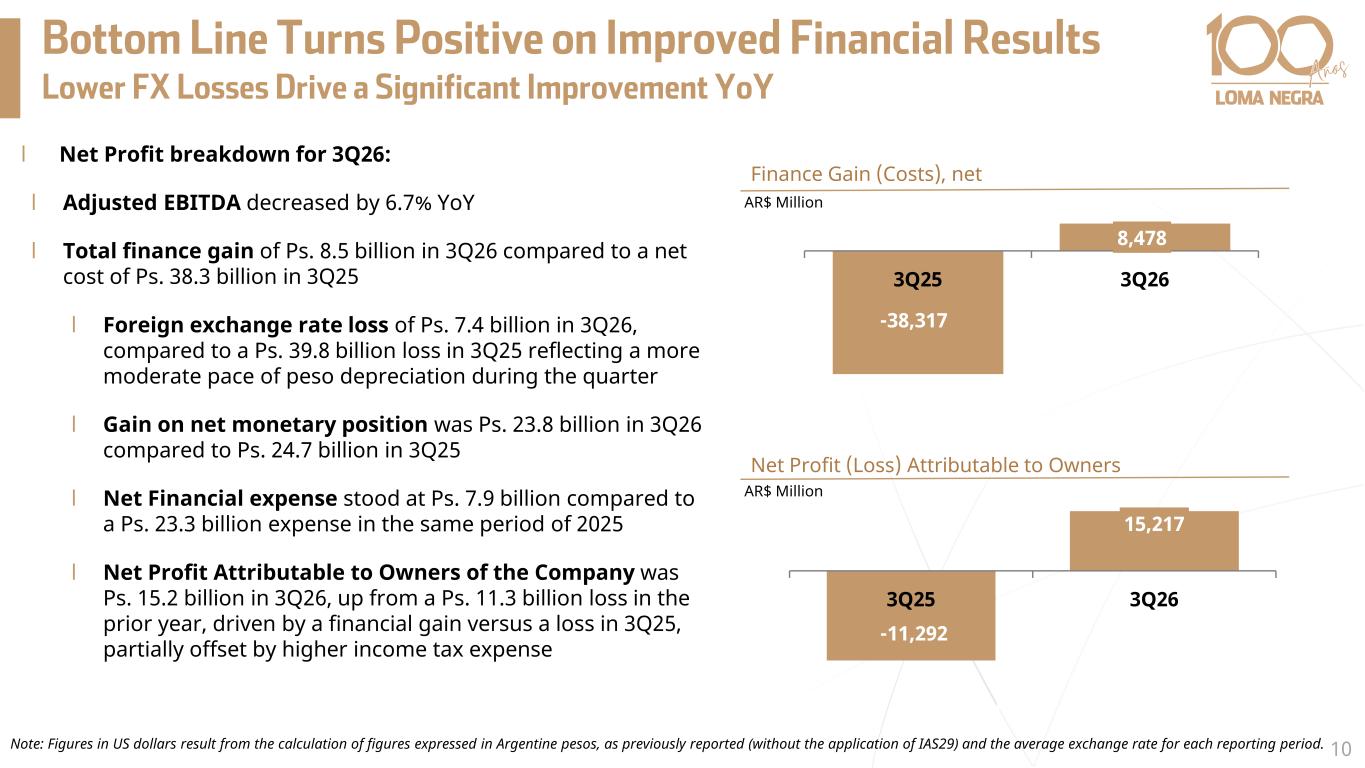
l Net Profit breakdown for 3Q26: l Adjusted EBITDA decreased by 6.7% YoY l Total finance gain of Ps. 8.5 billion in 3Q26 compared to a net cost of Ps. 38.3 billion in 3Q25 l Foreign exchange rate loss of Ps. 7.4 billion in 3Q26, compared to a Ps. 39.8 billion loss in 3Q25 reflecting a more moderate pace of peso depreciation during the quarter l Gain on net monetary position was Ps. 23.8 billion in 3Q26 compared to Ps. 24.7 billion in 3Q25 l Net Financial expense stood at Ps. 7.9 billion compared to a Ps. 23.3 billion expense in the same period of 2025 l Net Profit Attributable to Owners of the Company was Ps. 15.2 billion in 3Q26, up from a Ps. 11.3 billion loss in the prior year, driven by a financial gain versus a loss in 3Q25, partially offset by higher income tax expense -11,292 15,217 3Q25 3Q26 Net Profit (Loss) Attributable to Owners AR$ Million -38,317 8,478 3Q25 3Q26 Finance Gain (Costs), net AR$ Million Note: Figures in US dollars result from the calculation of figures expressed in Argentine pesos, as previously reported (without the application of IAS29) and the average exchange rate for each reporting period. 10 Bottom Line Turns Positive on Improved Financial Results Lower FX Losses Drive a Significant Improvement YoY
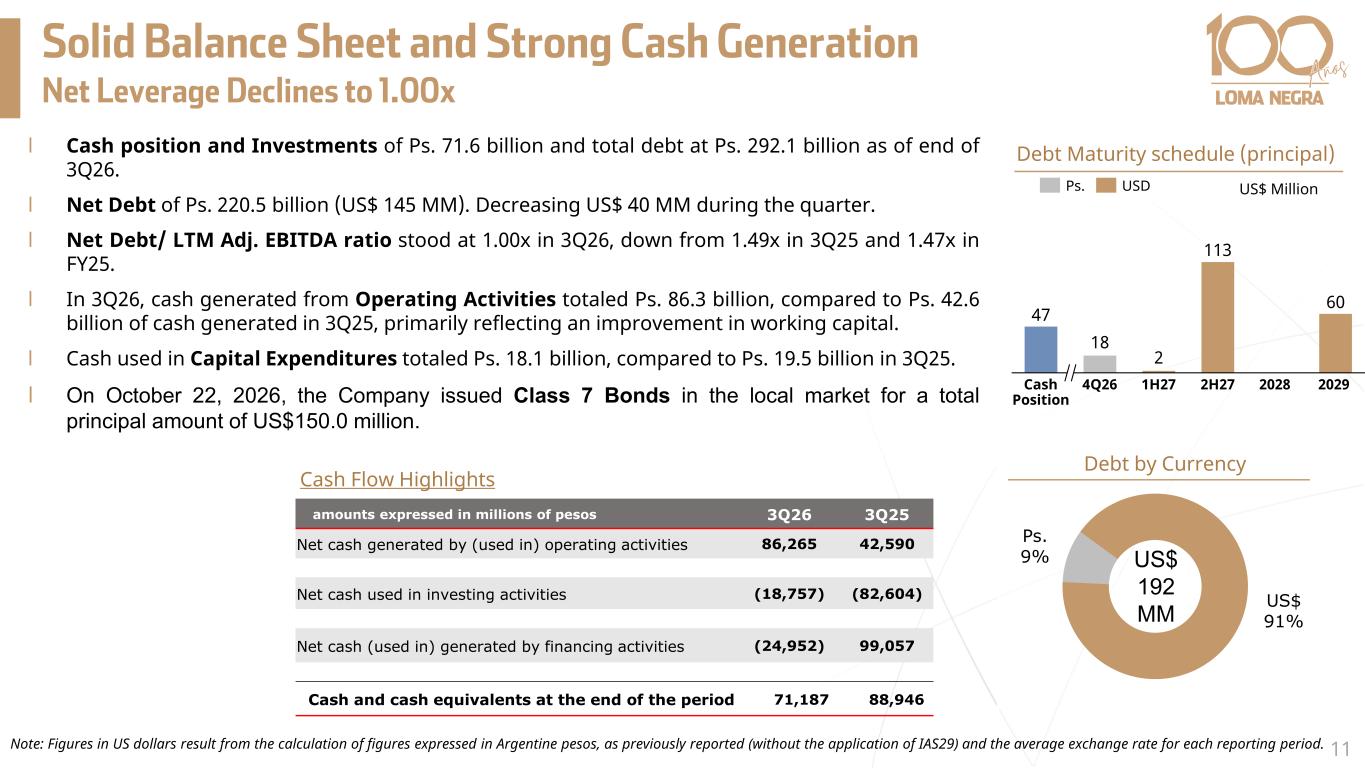
49 Note: Figures in US dollars result from the calculation of figures expressed in Argentine pesos, as previously reported (without the application of IAS29) and the average exchange rate for each reporting period. l Cash position and Investments of Ps. 71.6 billion and total debt at Ps. 292.1 billion as of end of 3Q26. l Net Debt of Ps. 220.5 billion (US$ 145 MM). Decreasing US$ 40 MM during the quarter. l Net Debt/ LTM Adj. EBITDA ratio stood at 1.00x in 3Q26, down from 1.49x in 3Q25 and 1.47x in FY25. l In 3Q26, cash generated from Operating Activities totaled Ps. 86.3 billion, compared to Ps. 42.6 billion of cash generated in 3Q25, primarily reflecting an improvement in working capital. l Cash used in Capital Expenditures totaled Ps. 18.1 billion, compared to Ps. 19.5 billion in 3Q25. l On October 22, 2026, the Company issued Class 7 Bonds in the local market for a total principal amount of US$150.0 million. US$ 91% Ps. 9% Debt by Currency Debt Maturity schedule (principal) US$ Million 47 113 60 Cash Position 4Q26 1H27 2H27 2028 2029 18 2 Ps. USD US$ 192 MM 11 Solid Balance Sheet and Strong Cash Generation Net Leverage Declines to 1.00x Cash Flow Highlights amounts expressed in millions of pesos 3Q26 3Q25 Net cash generated by (used in) operating activities 86,265 42,590 Net cash used in investing activities (18,757) (82,604) Net cash (used in) generated by financing activities (24,952) 99,057 Cash and cash equivalents at the end of the period 71,187 88,946

Outlook
Outlook 2026 l Volumes during this quarter came in below initial expectations largely affected by weather conditions. l RIGI-approved projects together with other infrastructure projects, real wage recovery, and improved credit access could support volumes in the near future. l Top line was partially supported by favorable pricing dynamics amid lower volumes, while continued cost discipline helped protect profitability. l The issuance of a new US$ 150 million Bond in October reaffirmes our strong financial position and further improves our debt profile. 13

Financial Tables
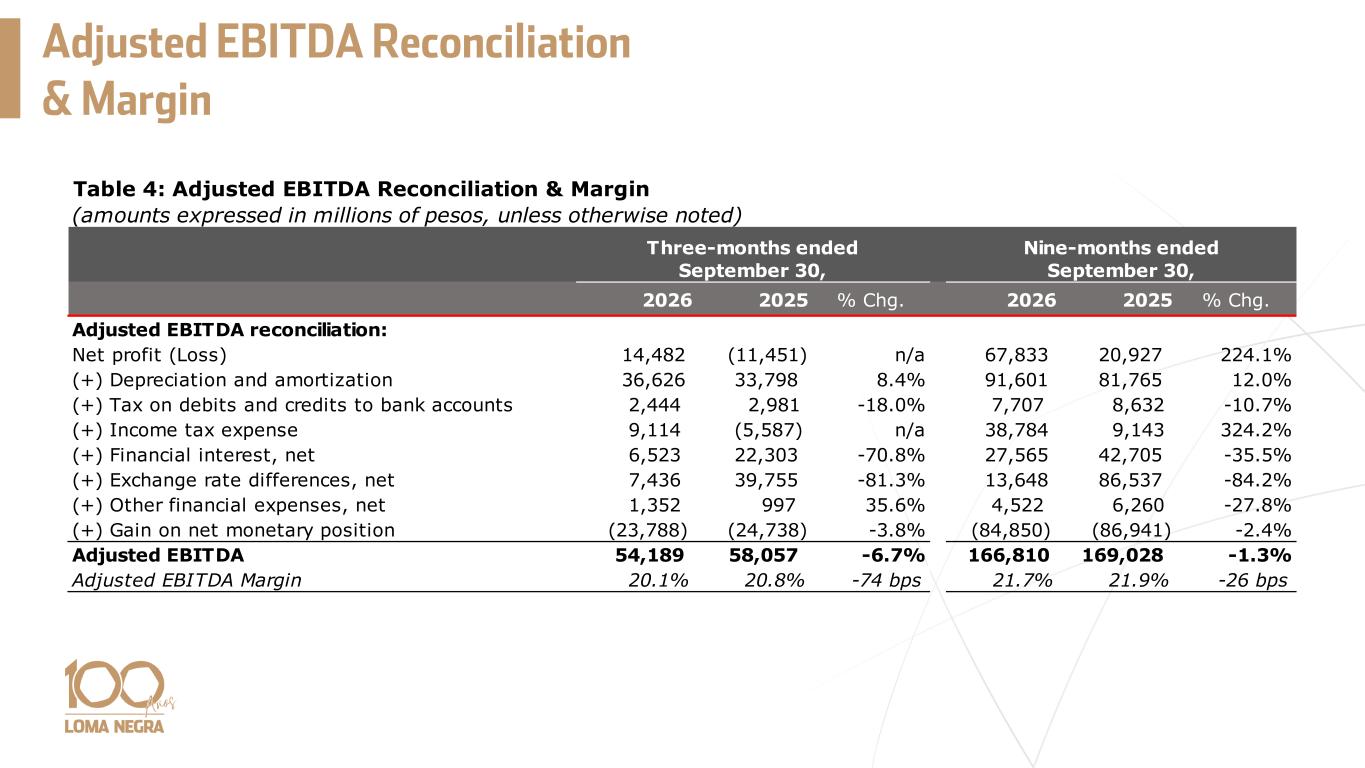
Adjusted EBITDA Reconciliation & Margin Table 4: Adjusted EBITDA Reconciliation & Margin (amounts expressed in millions of pesos, unless otherwise noted) 2026 2025 % Chg. 2026 2025 % Chg. Adjusted EBITDA reconciliation: Net profit (Loss) 14,482 (11,451) n/a 67,833 20,927 224.1% (+) Depreciation and amortization 36,626 33,798 8.4% 91,601 81,765 12.0% (+) Tax on debits and credits to bank accounts 2,444 2,981 -18.0% 7,707 8,632 -10.7% (+) Income tax expense 9,114 (5,587) n/a 38,784 9,143 324.2% (+) Financial interest, net 6,523 22,303 -70.8% 27,565 42,705 -35.5% (+) Exchange rate differences, net 7,436 39,755 -81.3% 13,648 86,537 -84.2% (+) Other financial expenses, net 1,352 997 35.6% 4,522 6,260 -27.8% (+) Gain on net monetary position (23,788) (24,738) -3.8% (84,850) (86,941) -2.4% Adjusted EBITDA 54,189 58,057 -6.7% 166,810 169,028 -1.3% Adjusted EBITDA Margin 20.1% 20.8% -74 bps 21.7% 21.9% -26 bps Three-months ended September 30, Nine-months ended September 30,
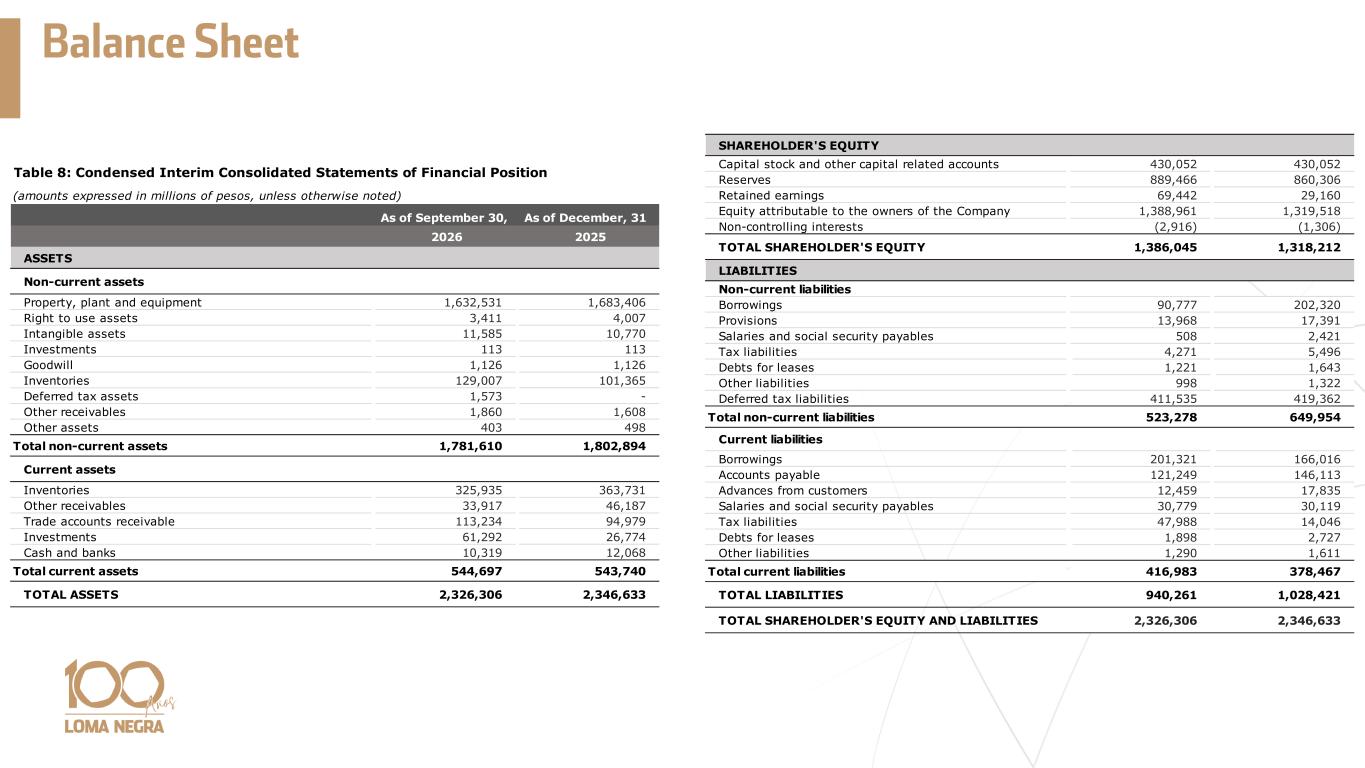
Balance Sheet As of September 30, As of December, 31 2026 2025 ASSETS Non-current assets Property, plant and equipment 1,632,531 1,683,406 Right to use assets 3,411 4,007 Intangible assets 11,585 10,770 Investments 113 113 Goodwill 1,126 1,126 Inventories 129,007 101,365 Deferred tax assets 1,573 - Other receivables 1,860 1,608 Other assets 403 498 Total non-current assets 1,781,610 1,802,894 Current assets Inventories 325,935 363,731 Other receivables 33,917 46,187 Trade accounts receivable 113,234 94,979 Investments 61,292 26,774 Cash and banks 10,319 12,068 Total current assets 544,697 543,740 TOTAL ASSETS 2,326,306 2,346,633 Table 8: Condensed Interim Consolidated Statements of Financial Position (amounts expressed in millions of pesos, unless otherwise noted) SHAREHOLDER'S EQUITY Capital stock and other capital related accounts 430,052 430,052 Reserves 889,466 860,306 Retained earnings 69,442 29,160 Equity attributable to the owners of the Company 1,388,961 1,319,518 Non-controlling interests (2,916) (1,306) TOTAL SHAREHOLDER'S EQUITY 1,386,045 1,318,212 LIABILITIES Non-current liabilities Borrowings 90,777 202,320 Provisions 13,968 17,391 Salaries and social security payables 508 2,421 Tax liabilities 4,271 5,496 Debts for leases 1,221 1,643 Other liabilities 998 1,322 Deferred tax liabilities 411,535 419,362 Total non-current liabilities 523,278 649,954 Current liabilities Borrowings 201,321 166,016 Accounts payable 121,249 146,113 Advances from customers 12,459 17,835 Salaries and social security payables 30,779 30,119 Tax liabilities 47,988 14,046 Debts for leases 1,898 2,727 Other liabilities 1,290 1,611 Total current liabilities 416,983 378,467 TOTAL LIABILITIES 940,261 1,028,421 TOTAL SHAREHOLDER'S EQUITY AND LIABILITIES 2,326,306 2,346,633
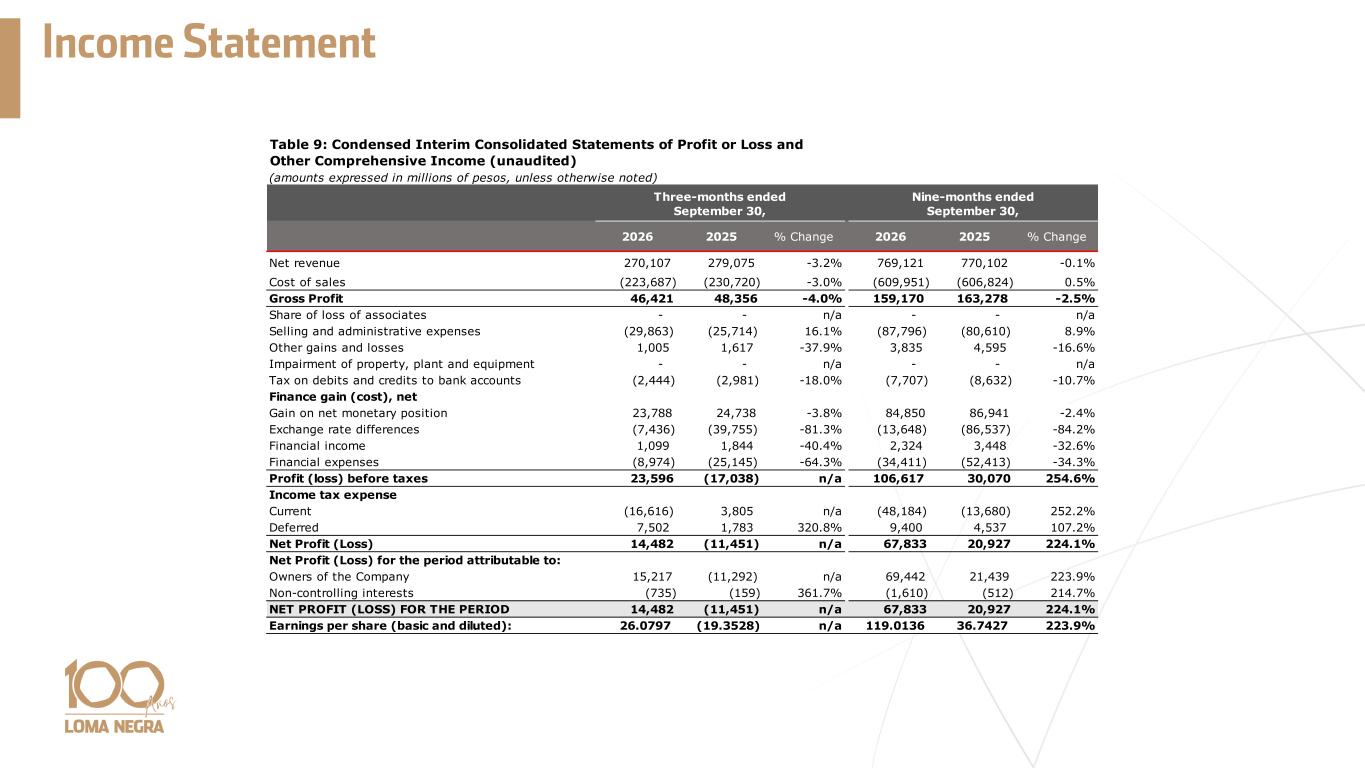
Income Statement (amounts expressed in millions of pesos, unless otherwise noted) 2026 2025 % Change 2026 2025 % Change Net revenue 270,107 279,075 -3.2% 769,121 770,102 -0.1% Cost of sales (223,687) (230,720) -3.0% (609,951) (606,824) 0.5% Gross Profit 46,421 48,356 -4.0% 159,170 163,278 -2.5% Share of loss of associates - - n/a - - n/a Selling and administrative expenses (29,863) (25,714) 16.1% (87,796) (80,610) 8.9% Other gains and losses 1,005 1,617 -37.9% 3,835 4,595 -16.6% Impairment of property, plant and equipment - - n/a - - n/a Tax on debits and credits to bank accounts (2,444) (2,981) -18.0% (7,707) (8,632) -10.7% Finance gain (cost), net Gain on net monetary position 23,788 24,738 -3.8% 84,850 86,941 -2.4% Exchange rate differences (7,436) (39,755) -81.3% (13,648) (86,537) -84.2% Financial income 1,099 1,844 -40.4% 2,324 3,448 -32.6% Financial expenses (8,974) (25,145) -64.3% (34,411) (52,413) -34.3% Profit (loss) before taxes 23,596 (17,038) n/a 106,617 30,070 254.6% Income tax expense Current (16,616) 3,805 n/a (48,184) (13,680) 252.2% Deferred 7,502 1,783 320.8% 9,400 4,537 107.2% Net Profit (Loss) 14,482 (11,451) n/a 67,833 20,927 224.1% Net Profit (Loss) for the period attributable to: Owners of the Company 15,217 (11,292) n/a 69,442 21,439 223.9% Non-controlling interests (735) (159) 361.7% (1,610) (512) 214.7% NET PROFIT (LOSS) FOR THE PERIOD 14,482 (11,451) n/a 67,833 20,927 224.1% Earnings per share (basic and diluted): 26.0797 (19.3528) n/a 119.0136 36.7427 223.9% Table 9: Condensed Interim Consolidated Statements of Profit or Loss and Other Comprehensive Income (unaudited) Three-months ended September 30, Nine-months ended September 30,
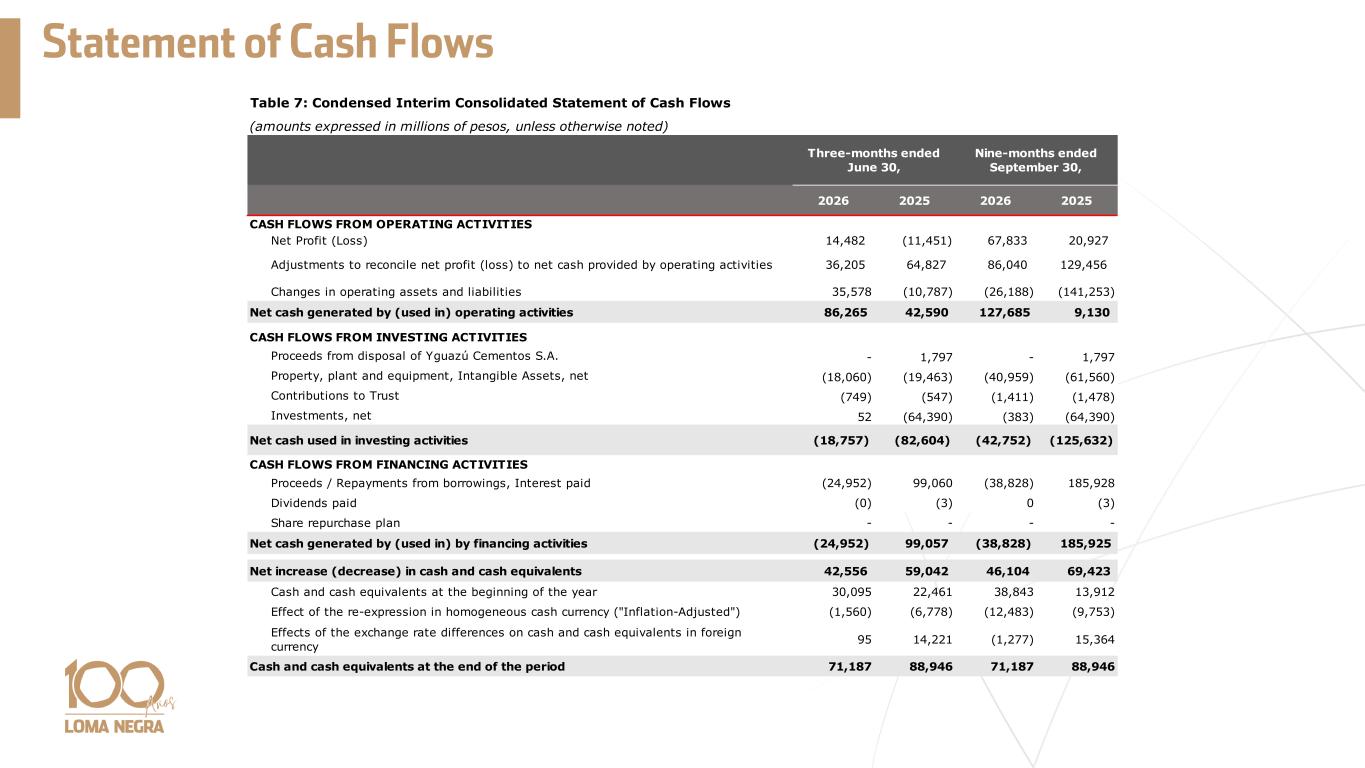
Statement of Cash Flows Table 7: Condensed Interim Consolidated Statement of Cash Flows (amounts expressed in millions of pesos, unless otherwise noted) 2026 2025 2026 2025 CASH FLOWS FROM OPERATING ACTIVITIES Net Profit (Loss) 14,482 (11,451) 67,833 20,927 Adjustments to reconcile net profit (loss) to net cash provided by operating activities 36,205 64,827 86,040 129,456 Changes in operating assets and liabilities 35,578 (10,787) (26,188) (141,253) Net cash generated by (used in) operating activities 86,265 42,590 127,685 9,130 CASH FLOWS FROM INVESTING ACTIVITIES Proceeds from disposal of Yguazú Cementos S.A. - 1,797 - 1,797 Property, plant and equipment, Intangible Assets, net (18,060) (19,463) (40,959) (61,560) Contributions to Trust (749) (547) (1,411) (1,478) Investments, net 52 (64,390) (383) (64,390) Net cash used in investing activities (18,757) (82,604) (42,752) (125,632) CASH FLOWS FROM FINANCING ACTIVITIES Proceeds / Repayments from borrowings, Interest paid (24,952) 99,060 (38,828) 185,928 Dividends paid (0) (3) 0 (3) Share repurchase plan - - - - Net cash generated by (used in) by financing activities (24,952) 99,057 (38,828) 185,925 Net increase (decrease) in cash and cash equivalents 42,556 59,042 46,104 69,423 Cash and cash equivalents at the beginning of the year 30,095 22,461 38,843 13,912 Effect of the re-expression in homogeneous cash currency ("Inflation-Adjusted") (1,560) (6,778) (12,483) (9,753) Effects of the exchange rate differences on cash and cash equivalents in foreign currency 95 14,221 (1,277) 15,364 Cash and cash equivalents at the end of the period 71,187 88,946 71,187 88,946 Nine-months ended September 30, Three-months ended June 30,

IR Contact Thank you! Marcos I. Gradin Chief Financial Officer and Investor Relations Diego M. Jalón Head of Investor Relations investorrelations@lomanegra.com