
Notes to Investors FORWARD-LOOKING STATEMENTS. Selected statements in this presentation constitute “forward-looking statements,” as that term is used in the Private Securities Litigation Reform Act of 1995 (the “Act”). Worthington Enterprises, Inc. (the “company” or “Worthington”) wishes to take advantage of the safe harbor provisions included in the Act. Forward-looking statements reflect the company’s current expectations, estimates or projections concerning future results or events. These statements are often identified by the use of forward-looking words or phrases such as “believe,” “expect,” “anticipate,” “may,” “could,” “should,” “would,” “intend,” “plan,” “will,” “likely,” “estimate,” “project,” “position,” “strategy,” “target,” “aim,” “seek,” “foresee” and similar words or phrases. These forward-looking statements include, without limitation, statements relating to: future or expected cash positions, liquidity and ability to access financial markets and capital; outlook, strategy or business plans; future or expected performance, growth, demand, financial condition or other financial measures; pricing trends for raw materials and finished goods; additions to product lines and opportunities to participate in new markets; anticipated working capital needs, capital expenditures and asset sales; anticipated improvements and efficiencies in costs, operations, sales, inventory management, sourcing and the supply chain; the ability to make acquisitions, form joint ventures and consolidate operations and the projected timing, benefits and costs related thereto; expectations for the economy and markets; expectations for shareholder value; effects of pandemics and widespread health crises; and other non-historical matters. Because they are based on beliefs, estimates and assumptions, forward-looking statements are inherently subject to risks and uncertainties that could cause actual results to differ materially from those projected. Any number of factors could affect actual results, including, without limitation, those that follow: the effect of conditions in national and worldwide financial markets, including inflation, increases in interest rates and economic recession, and with respect to the ability of financial institutions to provide capital; the impact of tariffs, the adoption of trade restrictions affecting the company’s products or suppliers, a U.S. withdrawal from or significant renegotiation of trade agreements, the occurrence of trade wars, the closing of border crossings, and other changes in trade regulations or relationships; changing oil prices and/or supply; product demand and pricing; changes in product mix, product substitution and market acceptance of the company’s products; volatility or fluctuations in the pricing, quality or availability of raw materials (particularly steel), supplies, transportation, utilities, labor and other items required by operations; effects of sourcing and supply chain constraints; the outcome of adverse claims experience with respect to workers’ compensation, product recalls or product liability, casualty events or other matters; effects of facility closures and the consolidation of operations; the effect of financial difficulties, consolidation and other changes within the steel, automotive, construction and other industries in which the company participates; failure to maintain appropriate levels of inventories; financial difficulties (including bankruptcy filings) of original equipment manufacturers, end-users and customers, suppliers, joint venture partners and others with whom the company does business; the ability to realize targeted expense reductions from headcount reductions, facility closures and other cost reduction efforts; the ability to realize cost savings and operational, sales and sourcing improvements and efficiencies, and other expected benefits from transformation initiatives, on a timely basis; the overall success of, and the ability to integrate, newly-acquired businesses and joint ventures, maintain and develop their customers, and achieve synergies and other expected benefits and cost savings therefrom; capacity levels and efficiencies, within facilities, within major product markets and within the industries in which the company participates as a whole; the effect of disruption in the business of suppliers, customers, facilities and shipping operations due to adverse weather, casualty events, equipment breakdowns, labor shortages, interruption in utility services, civil unrest, international conflicts, terrorist activities or other causes; changes in customer demand, inventories, spending patterns, product choices, and supplier choices; risks associated with doing business internationally, including economic, political and social instability, foreign currency exchange rate exposure and the acceptance of the company’s products in global markets; the ability to improve and maintain processes and business practices to keep pace with the economic, competitive and technological environment; the effect of inflation, interest rate increases and economic recession, which may negatively impact the company’s operations and financial results; deviation of actual results from estimates and/or assumptions used by the company in the application of its significant accounting policies; the level of imports and import prices in the company’s markets; the impact of environmental laws and regulations or the actions of the U.S. Environmental Protection Agency or similar regulators which increase costs or limit the company’s ability to use or sell certain products; the impact of increasing environmental, greenhouse gas emission and sustainability regulations or considerations; the impact of judicial rulings and governmental regulations, both in the U.S. and abroad, including those adopted by the U.S. Securities and Exchange Commission (“SEC”) and other governmental agencies as contemplated by the Coronavirus Aid, Relief and Economic Security (CARES) Act, the Consolidated Appropriations Act, 2021, the American Rescue Plan Act of 2021, and the Dodd-Frank Wall Street Reform and Consumer Protection Act of 2010; the effect of healthcare laws in the U.S. and potential changes for such laws, which may increase the company’s healthcare and other costs and negatively impact the company’s operations and financial results; the effect of tax laws in the U.S. and potential changes for such laws, which may increase the company’s costs and negatively impact its operations and financial results; cyber security risks; the effects of privacy and information security laws and standards; and other risks described from time to time in the company’s filings with the SEC, including those described in “Part I — Item 1A. — Risk Factors” of the company’s Annual Report on Form 10-K for the fiscal year ended May 31, 2026, and its subsequent filings with the SEC. Forward-looking statements should be construed in the light of such risks. It is impossible to predict or identify all potential risk factors. Consequently, readers should not consider the foregoing list to be a complete set of all potential risks and uncertainties. Readers are cautioned not to place undue reliance on any forward-looking statements, which speak only as of the date made, which was November 10, 2026. The company does not undertake, and hereby disclaims, any obligation to update any forward-looking statements, whether as a result of new information, future developments or otherwise, except as required by applicable law.
Notes to Investors NON-GAAP MEASURES. These materials include certain financial measures that are not calculated and presented in accordance with accounting principles generally accepted in the United States (“GAAP”). Non-GAAP financial measures typically exclude items that management believes are not reflective of, and thus should not be included when evaluating the performance of the company’s ongoing operations. Management uses these non-GAAP financial measures to evaluate ongoing performance, engage in financial and operational planning, and determine incentive compensation. Management believes these non-GAAP financial measures provide useful supplemental information regarding the performance of the company’s ongoing operations and should not be considered as an alternative to the comparable GAAP financial measure. Additionally, management believes these non-GAAP financial measures allow for meaningful comparisons and analysis of trends in the company’s businesses and enables investors to evaluate operations and future prospects in the same manner as management. Beginning in the third quarter of fiscal 2026, the company updated its definitions of adjusted EBITDA to exclude the acquisition-related amortization of inventory step-up charges. Prior periods have been recast for comparability. The following provides an explanation of each non-GAAP financial measure presented in these materials: Adjusted net earnings is defined as net earnings attributable to controlling interest excluding the after-tax effect of the excluded items outlined below. Adjusted EBITDA is the measure by which management evaluates segment performance and overall profitability. EBITDA is defined as earnings before interest, taxes, depreciation, and amortization. Adjusted EBITDA excludes additional items including, but not limited to, those listed below, as well as other items that management believes are not reflective of, and thus should not be included when evaluating the performance of ongoing operations. Adjusted EBITDA also excludes stock-based compensation due to its non-cash nature, which is consistent with how management assesses operating performance and determines incentive compensation. At the segment level, adjusted EBITDA includes expense allocations for centralized corporate back-office functions that exist to support the day-to-day business operations. Public company and other governance costs are held at the corporate level within the unallocated corporate and other category. Adjusted EBITDA margin is calculated by dividing adjusted EBITDA by net sales. Adjusted return on assets (“ROA”) is used by the company to assess how efficiently it generates earnings from the operating assets employed in its businesses. The company defines adjusted return on assets as modified adjusted EBITDA divided by investment. Modified adjusted EBITDA is adjusted EBITDA for the fiscal year or trailing twelve months (“TTM”), less estimated maintenance capital expenditures for the same period. Investment is total assets, excluding cash and cash equivalents, goodwill, other intangible assets, operating lease assets and other assets, plus accumulated depreciation, less accounts payable, accrued compensation, contributions to employee benefit plans and related taxes, other accrued items, and dividends payable, each as of the end of the applicable period. Free cash flow is a liquidity measure that is used by the company to assess its ability to generate cash beyond what is required for its business operations. The company defines free cash flow as net cash flows from operating activities less investment in property, plant, and equipment (i.e. capital expenditures). Free cash flow conversion is used by the company to measure how much of its adjusted net earnings attributable to controlling interest is converted into cash. The company defines free cash flow conversion as free cash flow divided by adjusted net earnings. Net debt to TTM adjusted EBITDA (“Net Leverage”) is used by the company as a measure of leverage. Net debt is calculated by subtracting cash and cash equivalents from total debt (defined as the aggregate of short-term borrowings, current maturities of long-term debt and long-term debt) the sum of which is divided by TTM adjusted EBITDA. Total Enterprise Value (“TEV”) is defined as market capitalization plus net debt. Capital expenditures excluding modernization projects is defined as investment in property, plant and equipment less spending on facility modernization projects. Management believes it helps investors evaluate the ongoing level of capital investment required by the business. Capital expenditures as a percentage of net sales is presented as the comparable ratio using the most directly comparable GAAP measure.
Notes to Investors EXCLUSIONS FROM NON-GAAP FINANCIAL MEASURES Management believes it is useful to exclude the following items from its non-GAAP financial measures for its own and investors’ assessment of the business for the reasons identified below. Additionally, management may exclude other items from non-GAAP financial measures that do not occur in the ordinary course of our ongoing business operations and note them in the reconciliation from net earnings from continuing operations to the non-GAAP financial measure adjusted EBITDA from continuing operations. Amortization of inventory step-up represents the increase in inventory fair value associated with our acquisitions. The increase in inventory fair value is amortized to cost of sales over the period that the related inventory is sold. The amortization of inventory step-up is excluded because it is a non-cash expense that is not indicative of ongoing operating results. Impairment charges are excluded because they do not occur in the ordinary course of our ongoing business operations, are inherently unpredictable in timing and amount, and are non-cash, which management believes facilitates the comparison of historical, current and forecasted financial results. Restructuring activities consist of established programs that are intended to fundamentally change our operations, and as such are excluded from our non-GAAP financial measures. Our restructuring programs may include closing or consolidating production facilities or moving manufacturing of a product to another location, realignment of the management structure of a business unit in response to changing market conditions or general rationalization of headcount. Our restructuring activities generally give rise to employee-related costs, such as severance pay, and facility-related costs, such as exit costs and gains or losses on asset disposals but may include other incremental costs associated with our restructuring activities. Restructuring and other expense, net, may also include other discrete items included in operating income but incremental to our normal business activities. These items are excluded because they are not indicative of the ongoing operations of our underlying business. Separation costs, which consist of direct and incremental costs incurred in connection with the completed separation of our steel processing business (the “Separation”) are excluded as they are discrete in nature and are not expected to occur in periods following the Separation. These costs include fees paid to third-party advisors, such as investment banking, audit and other advisory services as well as direct and incremental costs associated with the Separation of shared corporate functions. Results in fiscal 2024 also include incremental compensation expense associated with the modification of unvested short and long-term incentive compensation awards, as required under the employee matters agreement executed in conjunction with the Separation. Non-cash gains (losses) in miscellaneous expense are excluded due to their non-cash nature and the fact that they do not occur in the normal course of business and may obscure analysis of trends and financial performance. Loss on extinguishment of debt is excluded because it does not occur in the normal course of business and may obscure analysis of trends and financial performance. Additionally, the amount and frequency of this type of charge is not consistent and is significantly impacted by the timing and size of debt extinguishment transactions. Corporate costs eliminated at Separation reflect certain corporate overhead costs that no longer exist post-Separation. These costs were included in continuing operations as they represent general corporate overhead that was historically allocated to our former steel processing business but did not meet the requirements to be presented as discontinued operations. Pension settlement charges are excluded due to their non-cash nature and the fact that they do not occur in the normal course of business and may obscure analysis of trends and financial performance. These transactions typically result from the transfer of all or a portion of the total projected benefit obligation to third-party insurance companies. Discrete tax effects of Separation are charges to income tax expense primarily related to non-deductible transaction costs. They are excluded because they are discrete in nature and not expected to occur in periods following the Separation. Discrete (gain) loss in equity income is excluded because it does not occur in the normal course of business and is inherently unpredictable in timing and amount.

Improving everyday life by elevating spaces and experiences
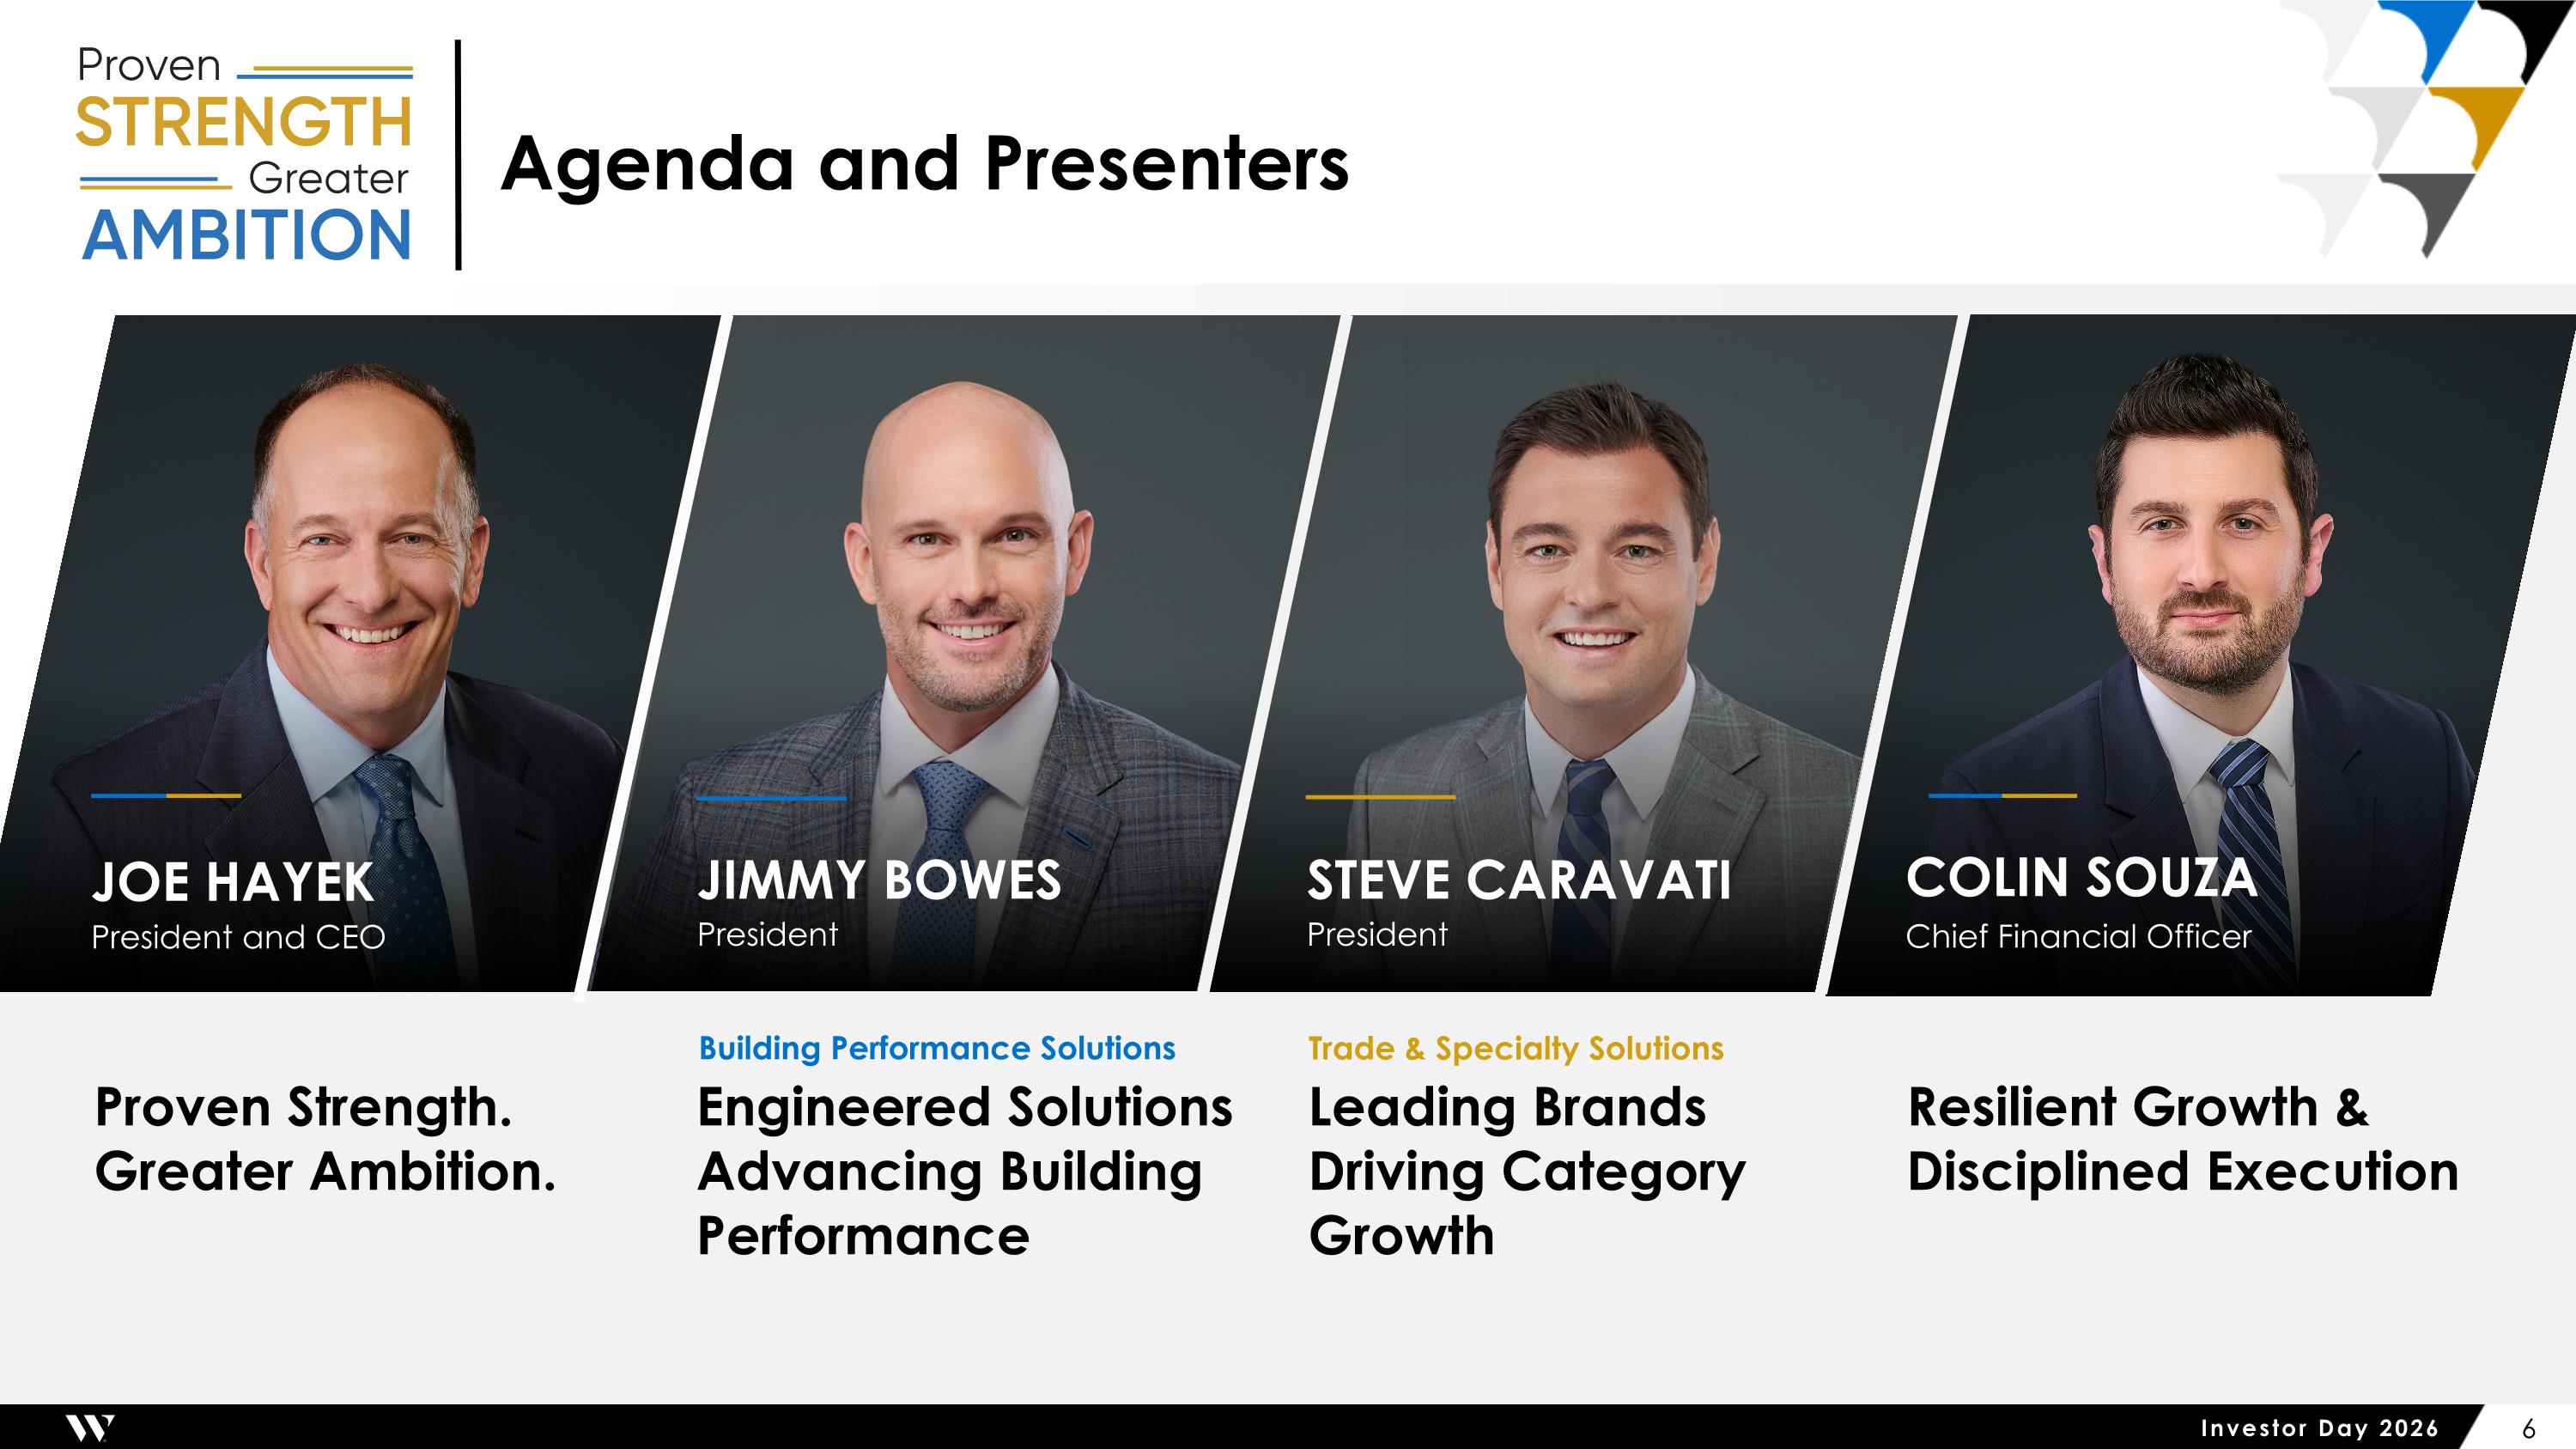
Agenda and Presenters Resilient Growth & Disciplined Execution Engineered Solutions Advancing Building Performance Proven Strength. Greater Ambition. Leading Brands Driving Category Growth Building Performance Solutions Trade & Specialty Solutions JIMMY BOWES President STEVE CARAVATI President COLIN SOUZA Chief Financial Officer JOE HAYEK President and CEO
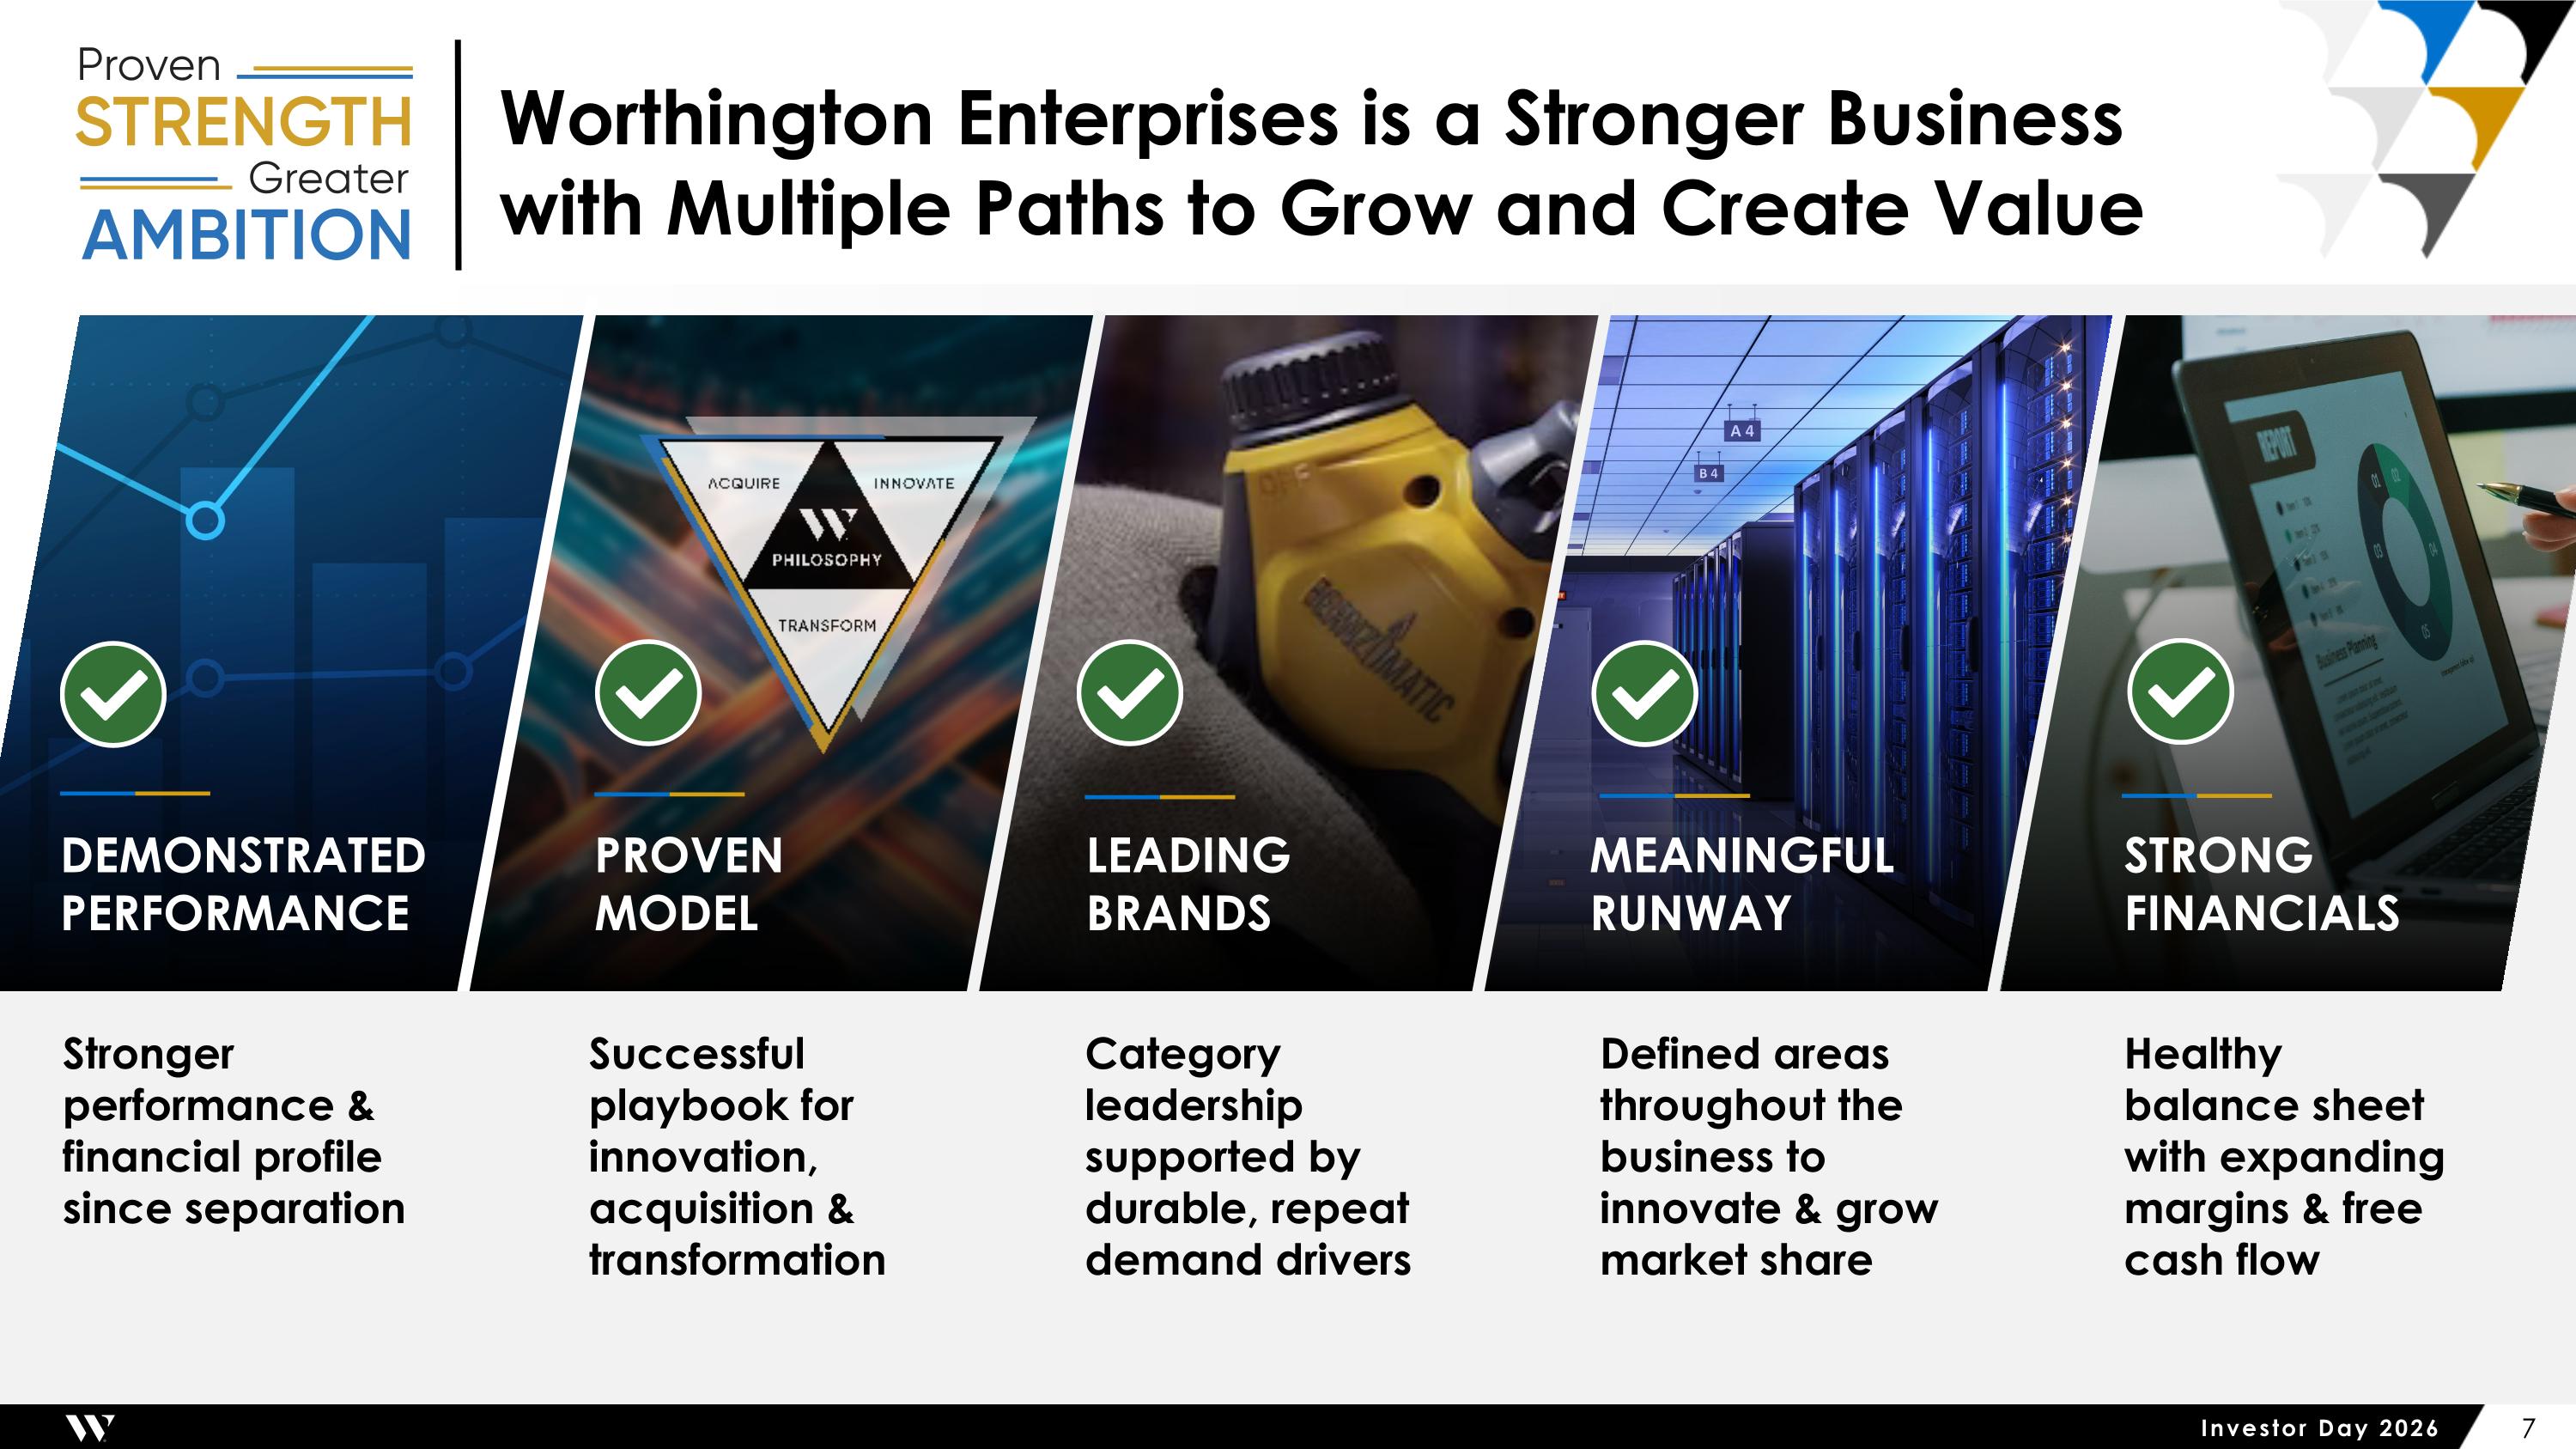
Worthington Enterprises is a Stronger Business with Multiple Paths to Grow and Create Value Stronger performance & financial profile since separation DEMONSTRATED PERFORMANCE Successful playbook for innovation, acquisition & transformation PROVEN MODEL Category leadership supported by durable, repeat demand drivers LEADING BRANDS Defined areas throughout the business to innovate & grow market share MEANINGFUL RUNWAY Healthy balance sheet with expanding margins & free cash flow STRONG FINANCIALS
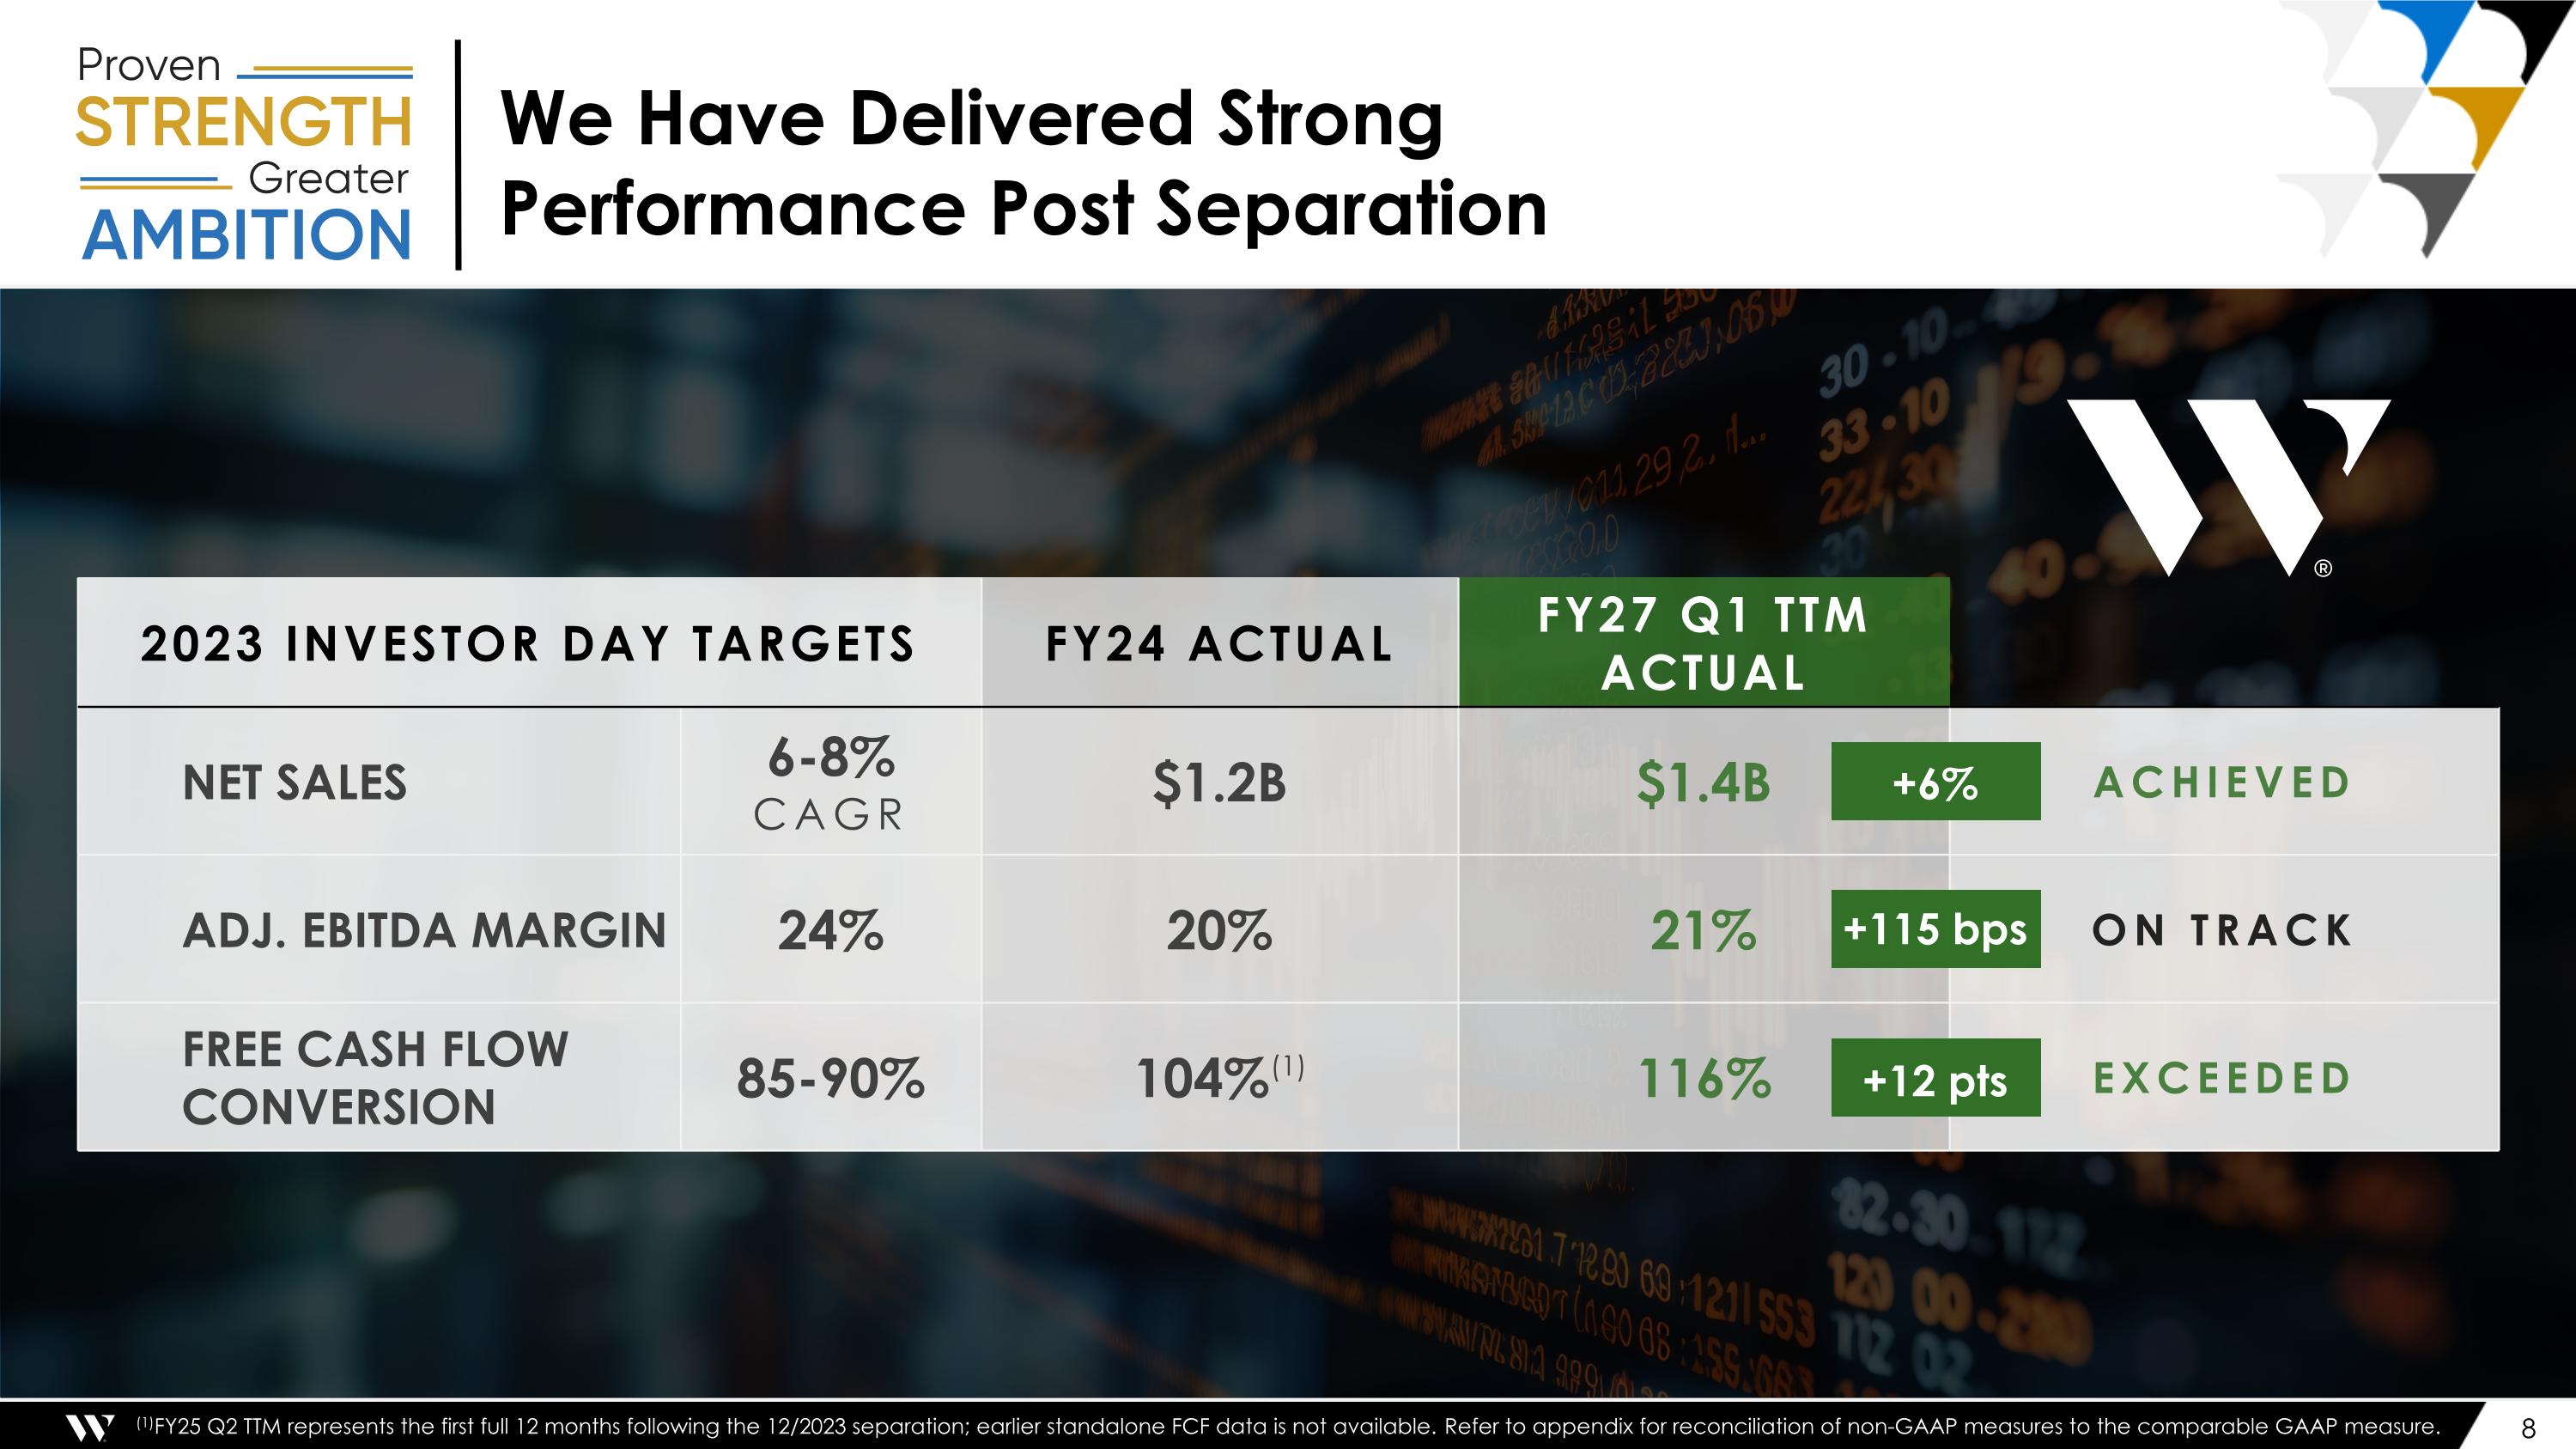
We Have Delivered Strong Performance Post Separation 2023 INVESTOR DAY TARGETS 2023 INVESTOR DAY TARGETS FY24 ACTUAL FY27 Q1 TTM ACTUAL Net Sales 6-8% CAGR $1.2B $1.4B ACHIEVED Adj. Ebitda Margin 24% 20% 21% ON TRACK Free Cash Flow Conversion 85-90% 104%(1) 116% EXCEEDED +6% +6% +115 bps +12 pts (1)FY25 Q2 TTM represents the first full 12 months following the 12/2023 separation; earlier standalone FCF data is not available. Refer to appendix for reconciliation of non-GAAP measures to the comparable GAAP measure.
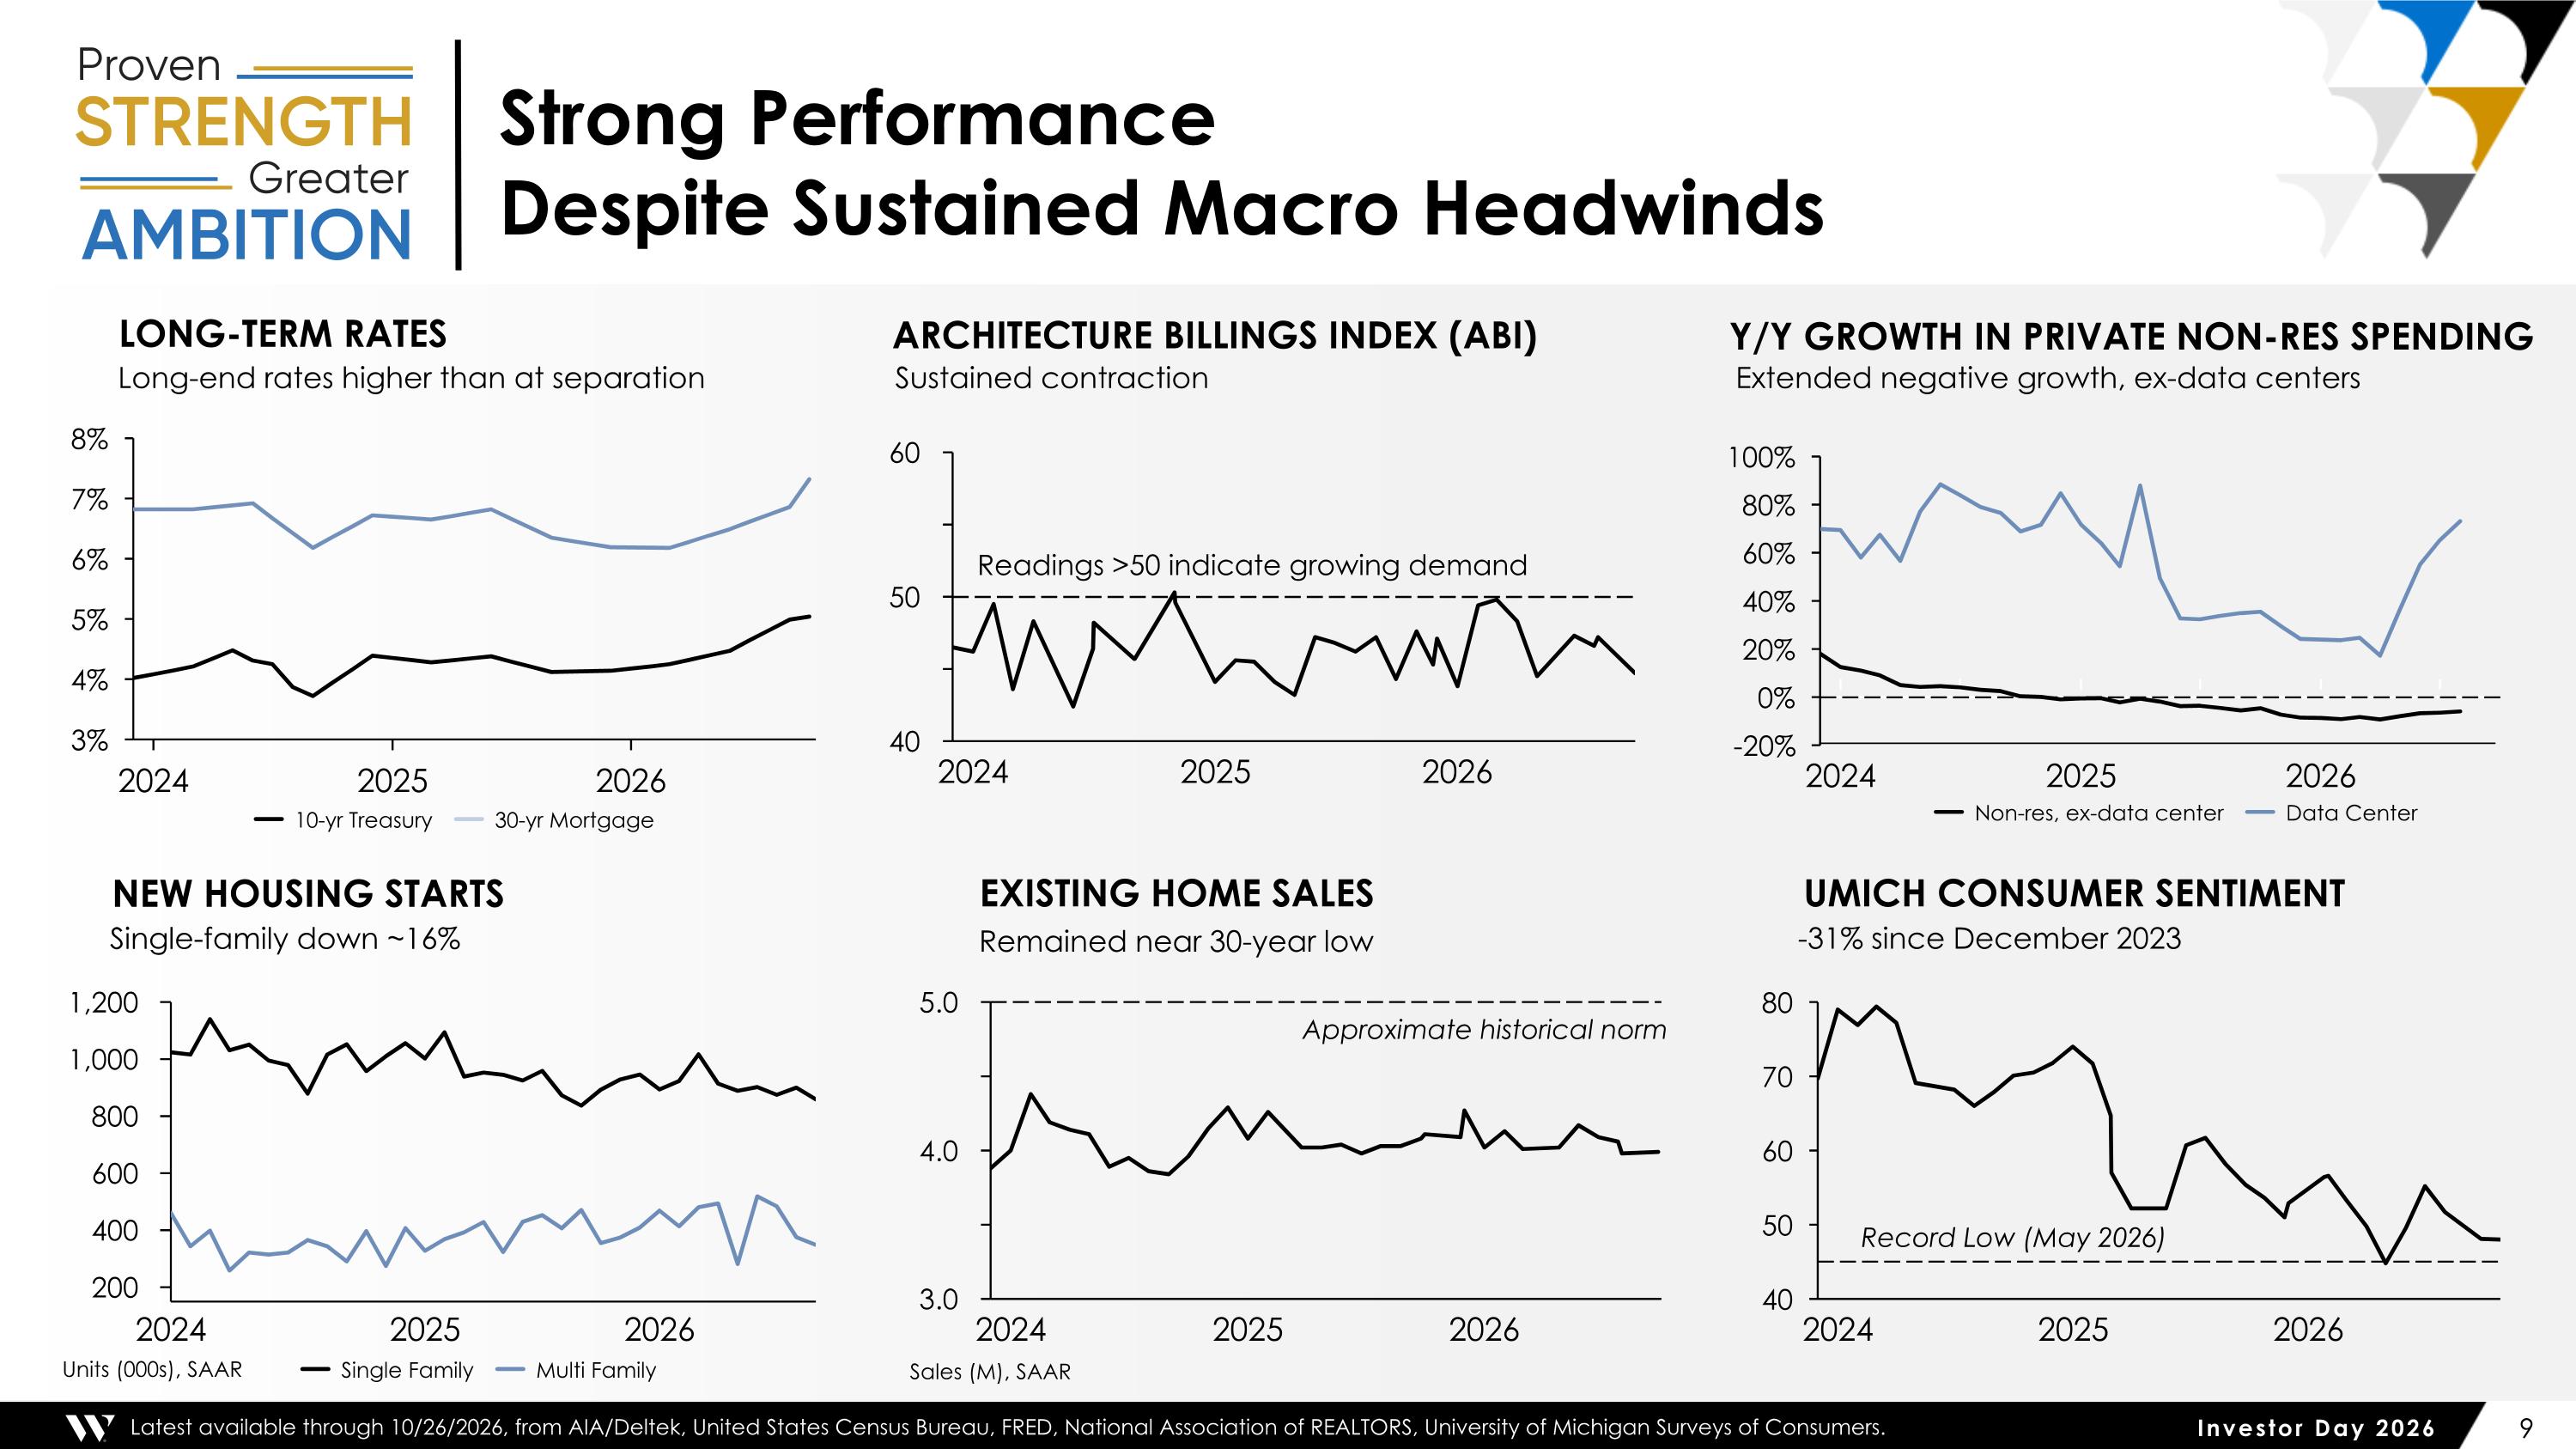
Strong Performance Despite Sustained Macro Headwinds 2024 2025 2026 ARCHITECTURE BILLINGS INDEX (ABI) Y/Y GROWTH IN PRIVATE NON-RES SPENDING Latest available through 10/26/2026, from AIA/Deltek, United States Census Bureau, FRED, National Association of REALTORS, University of Michigan Surveys of Consumers. Sales (M), SAAR 2024 2025 2026 2024 2025 2026 UMICH CONSUMER SENTIMENT EXISTING HOME SALES LONG-TERM RATES 10-yr Treasury 30-yr Mortgage 2024 2025 2026 40 50 60 Readings >50 indicate growing demand Sustained contraction Extended negative growth, ex-data centers 2024 2025 2026 3.0 4.0 5.0 Approximate historical norm Record Low (May 2026) -31% since December 2023 Remained near 30-year low Long-end rates higher than at separation Units (000s), SAAR 200 400 600 800 1,000 1,200 2024 2025 2026 NEW HOUSING STARTS Single-family down ~16% Single Family Multi Family Non-res, ex-data center Data Center

Worthington Enterprises designs and manufactures essential solutions that improve everyday life across building, trade and specialty applications.
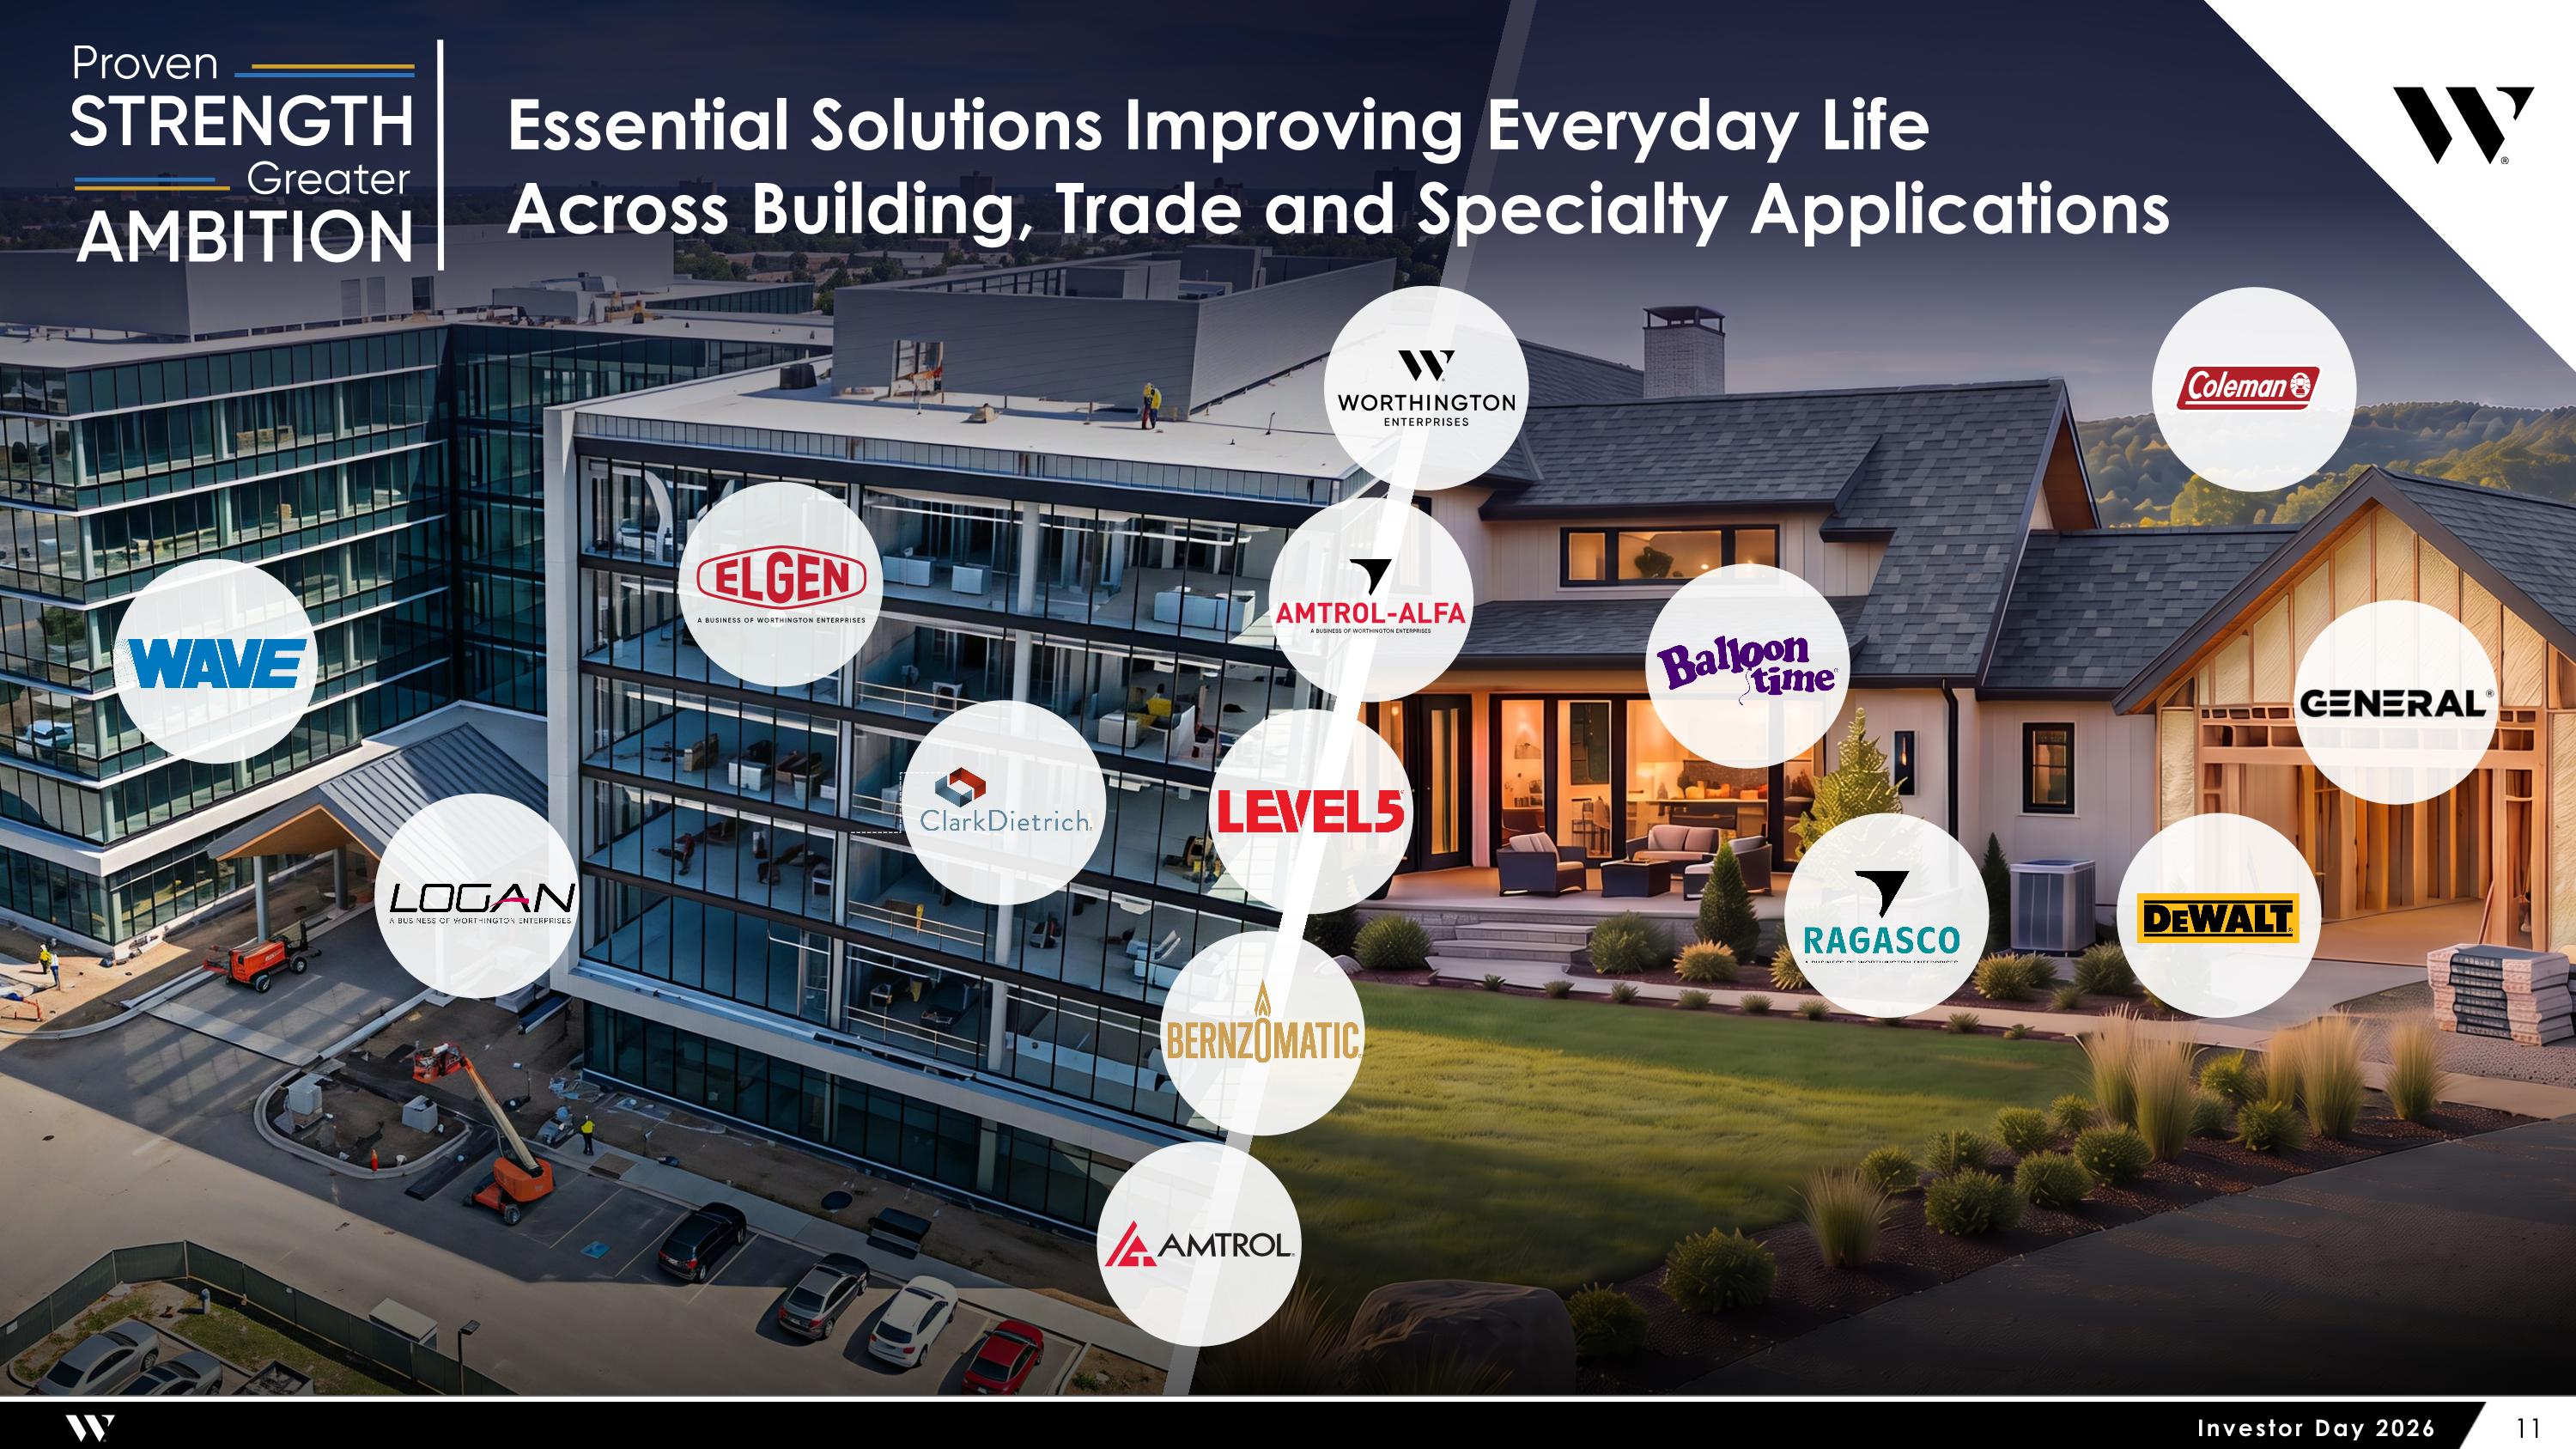
Essential Solutions Improving Everyday Life Across Building, Trade and Specialty Applications
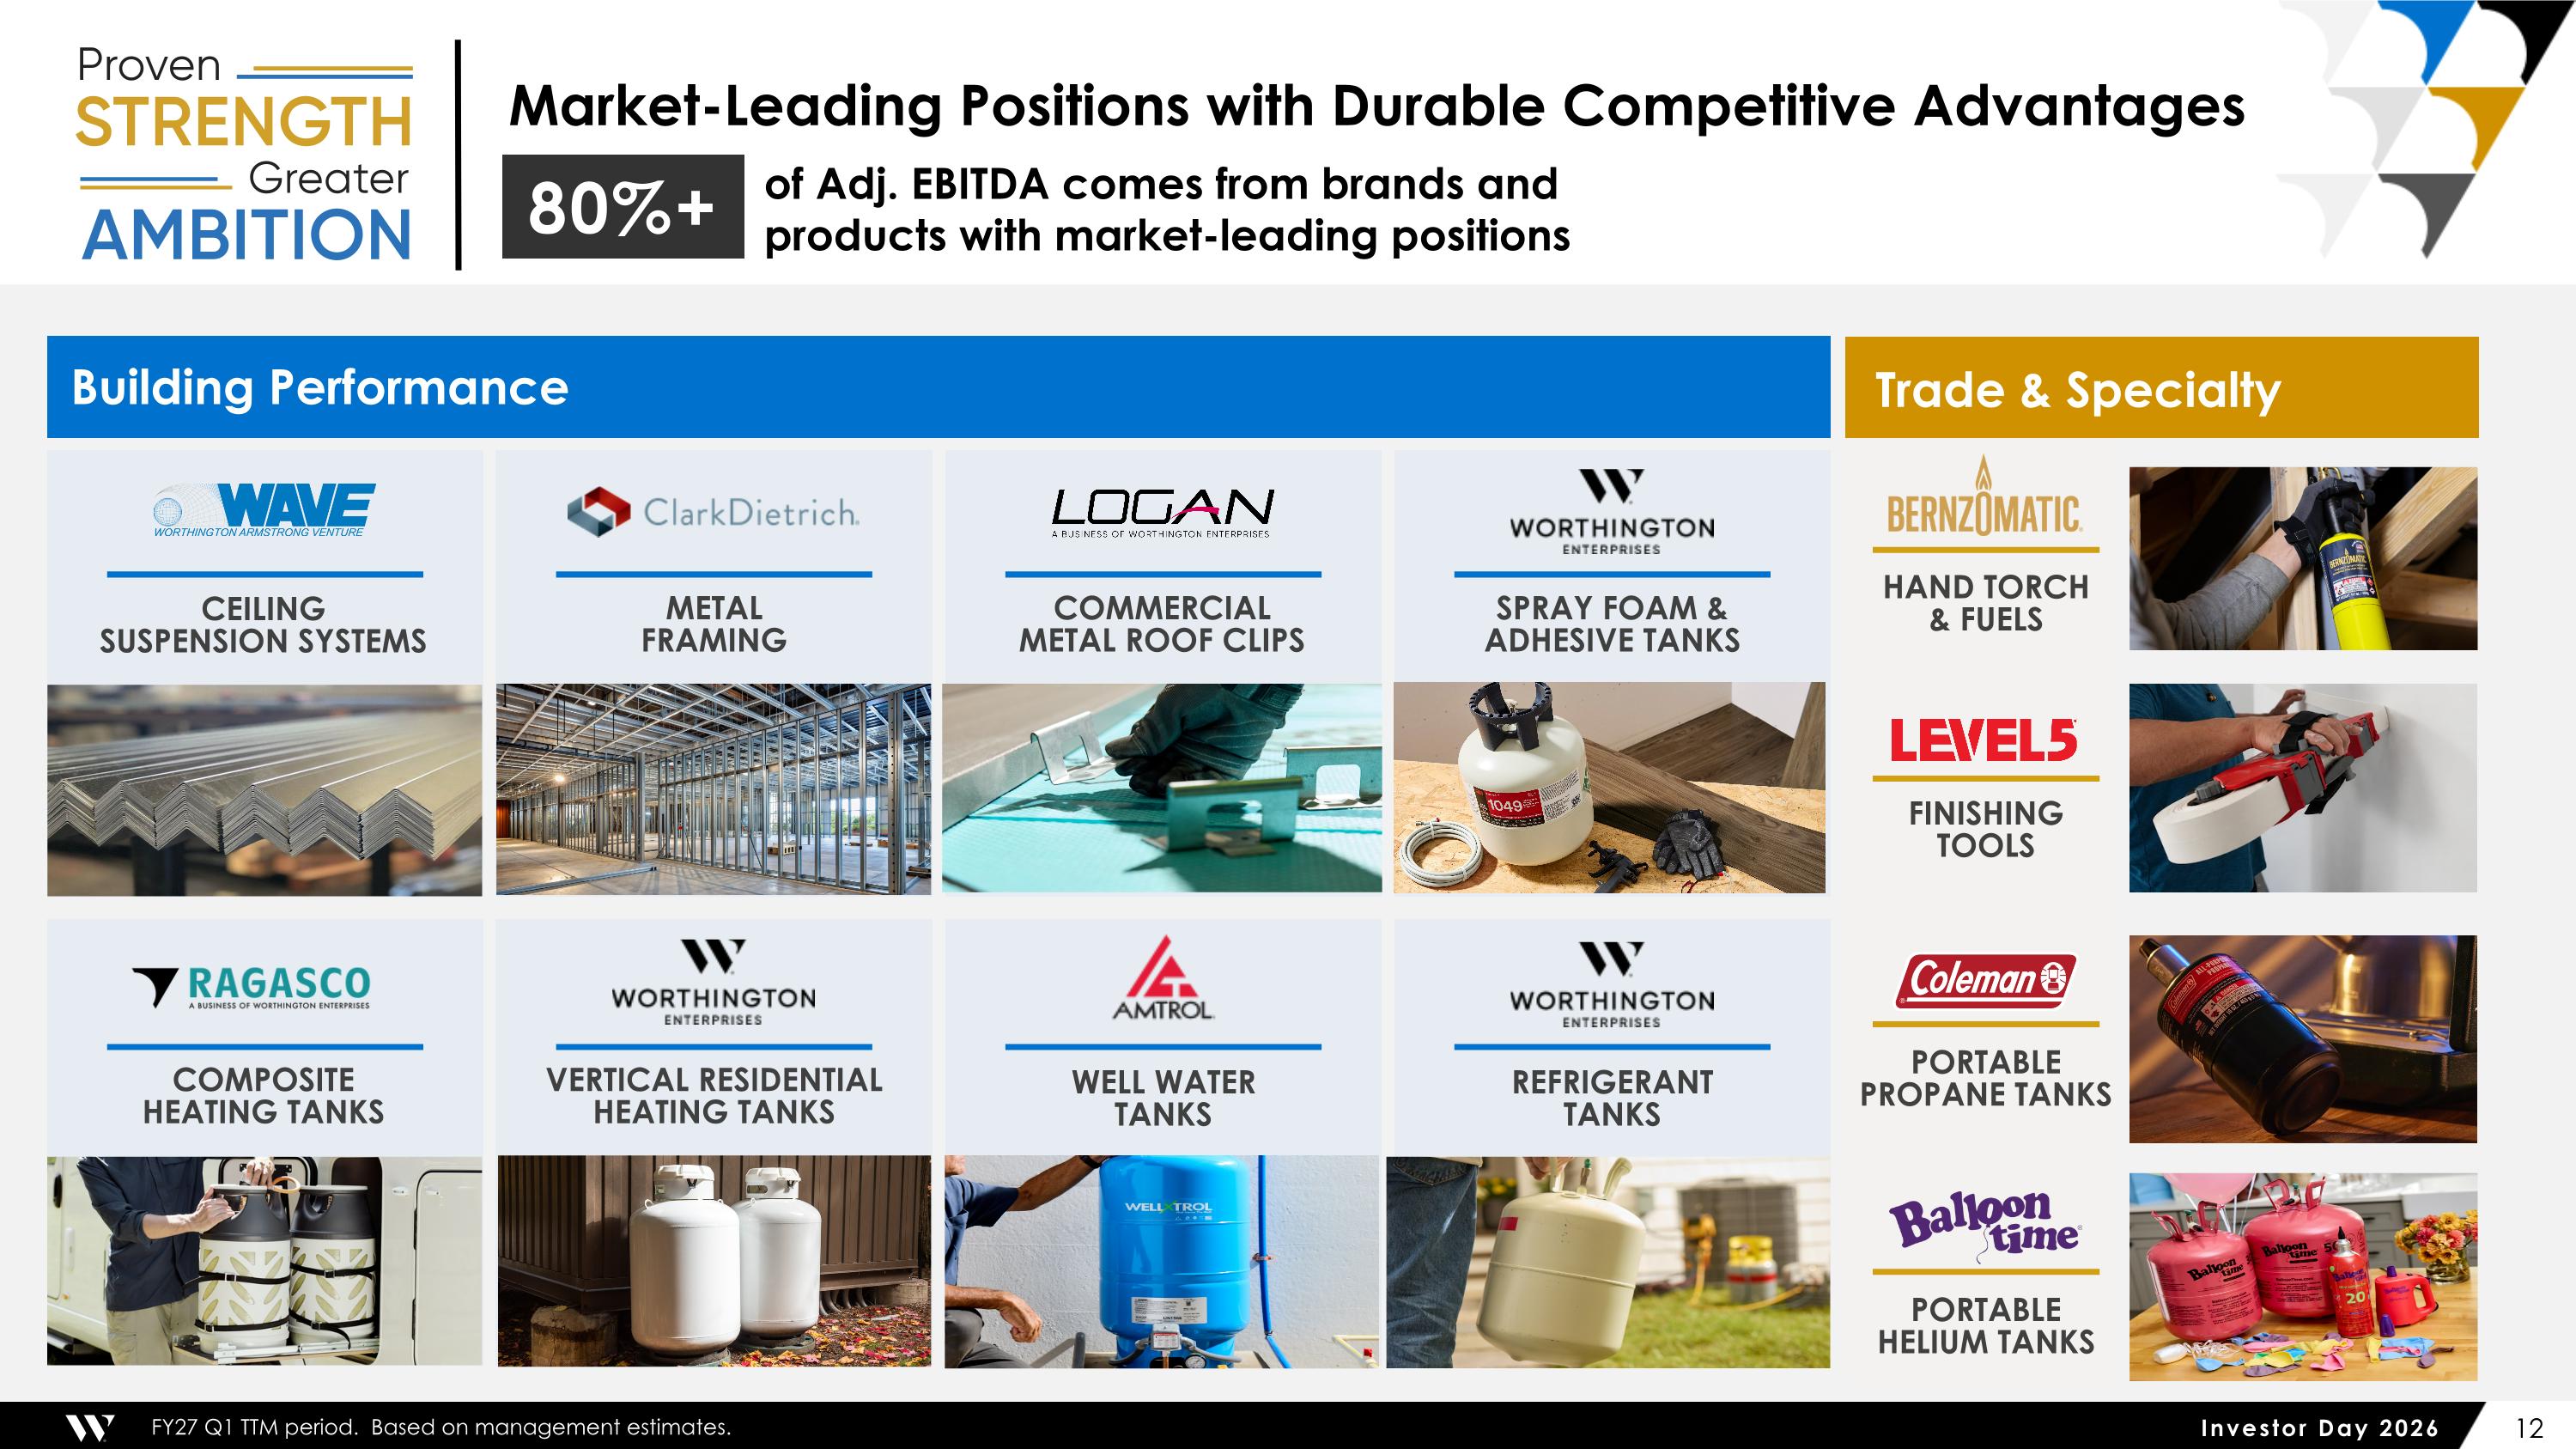
Market-Leading Positions with Durable Competitive Advantages of Adj. EBITDA comes from brands and products with market-leading positions HAND TORCH & FUELS PORTABLE PROPANE TANKS PORTABLE HELIUM TANKS 80%+ FY27 Q1 TTM period. Based on management estimates. COMPOSITE HEATING TANKS WELL WATER TANKS SPRAY FOAM & ADHESIVE TANKS COMMERCIAL METAL ROOF CLIPS REFRIGERANT TANKS VERTICAL RESIDENTIAL HEATING TANKS CEILING SUSPENSION SYSTEMS METAL FRAMING Building Performance Trade & Specialty FINISHING TOOLS
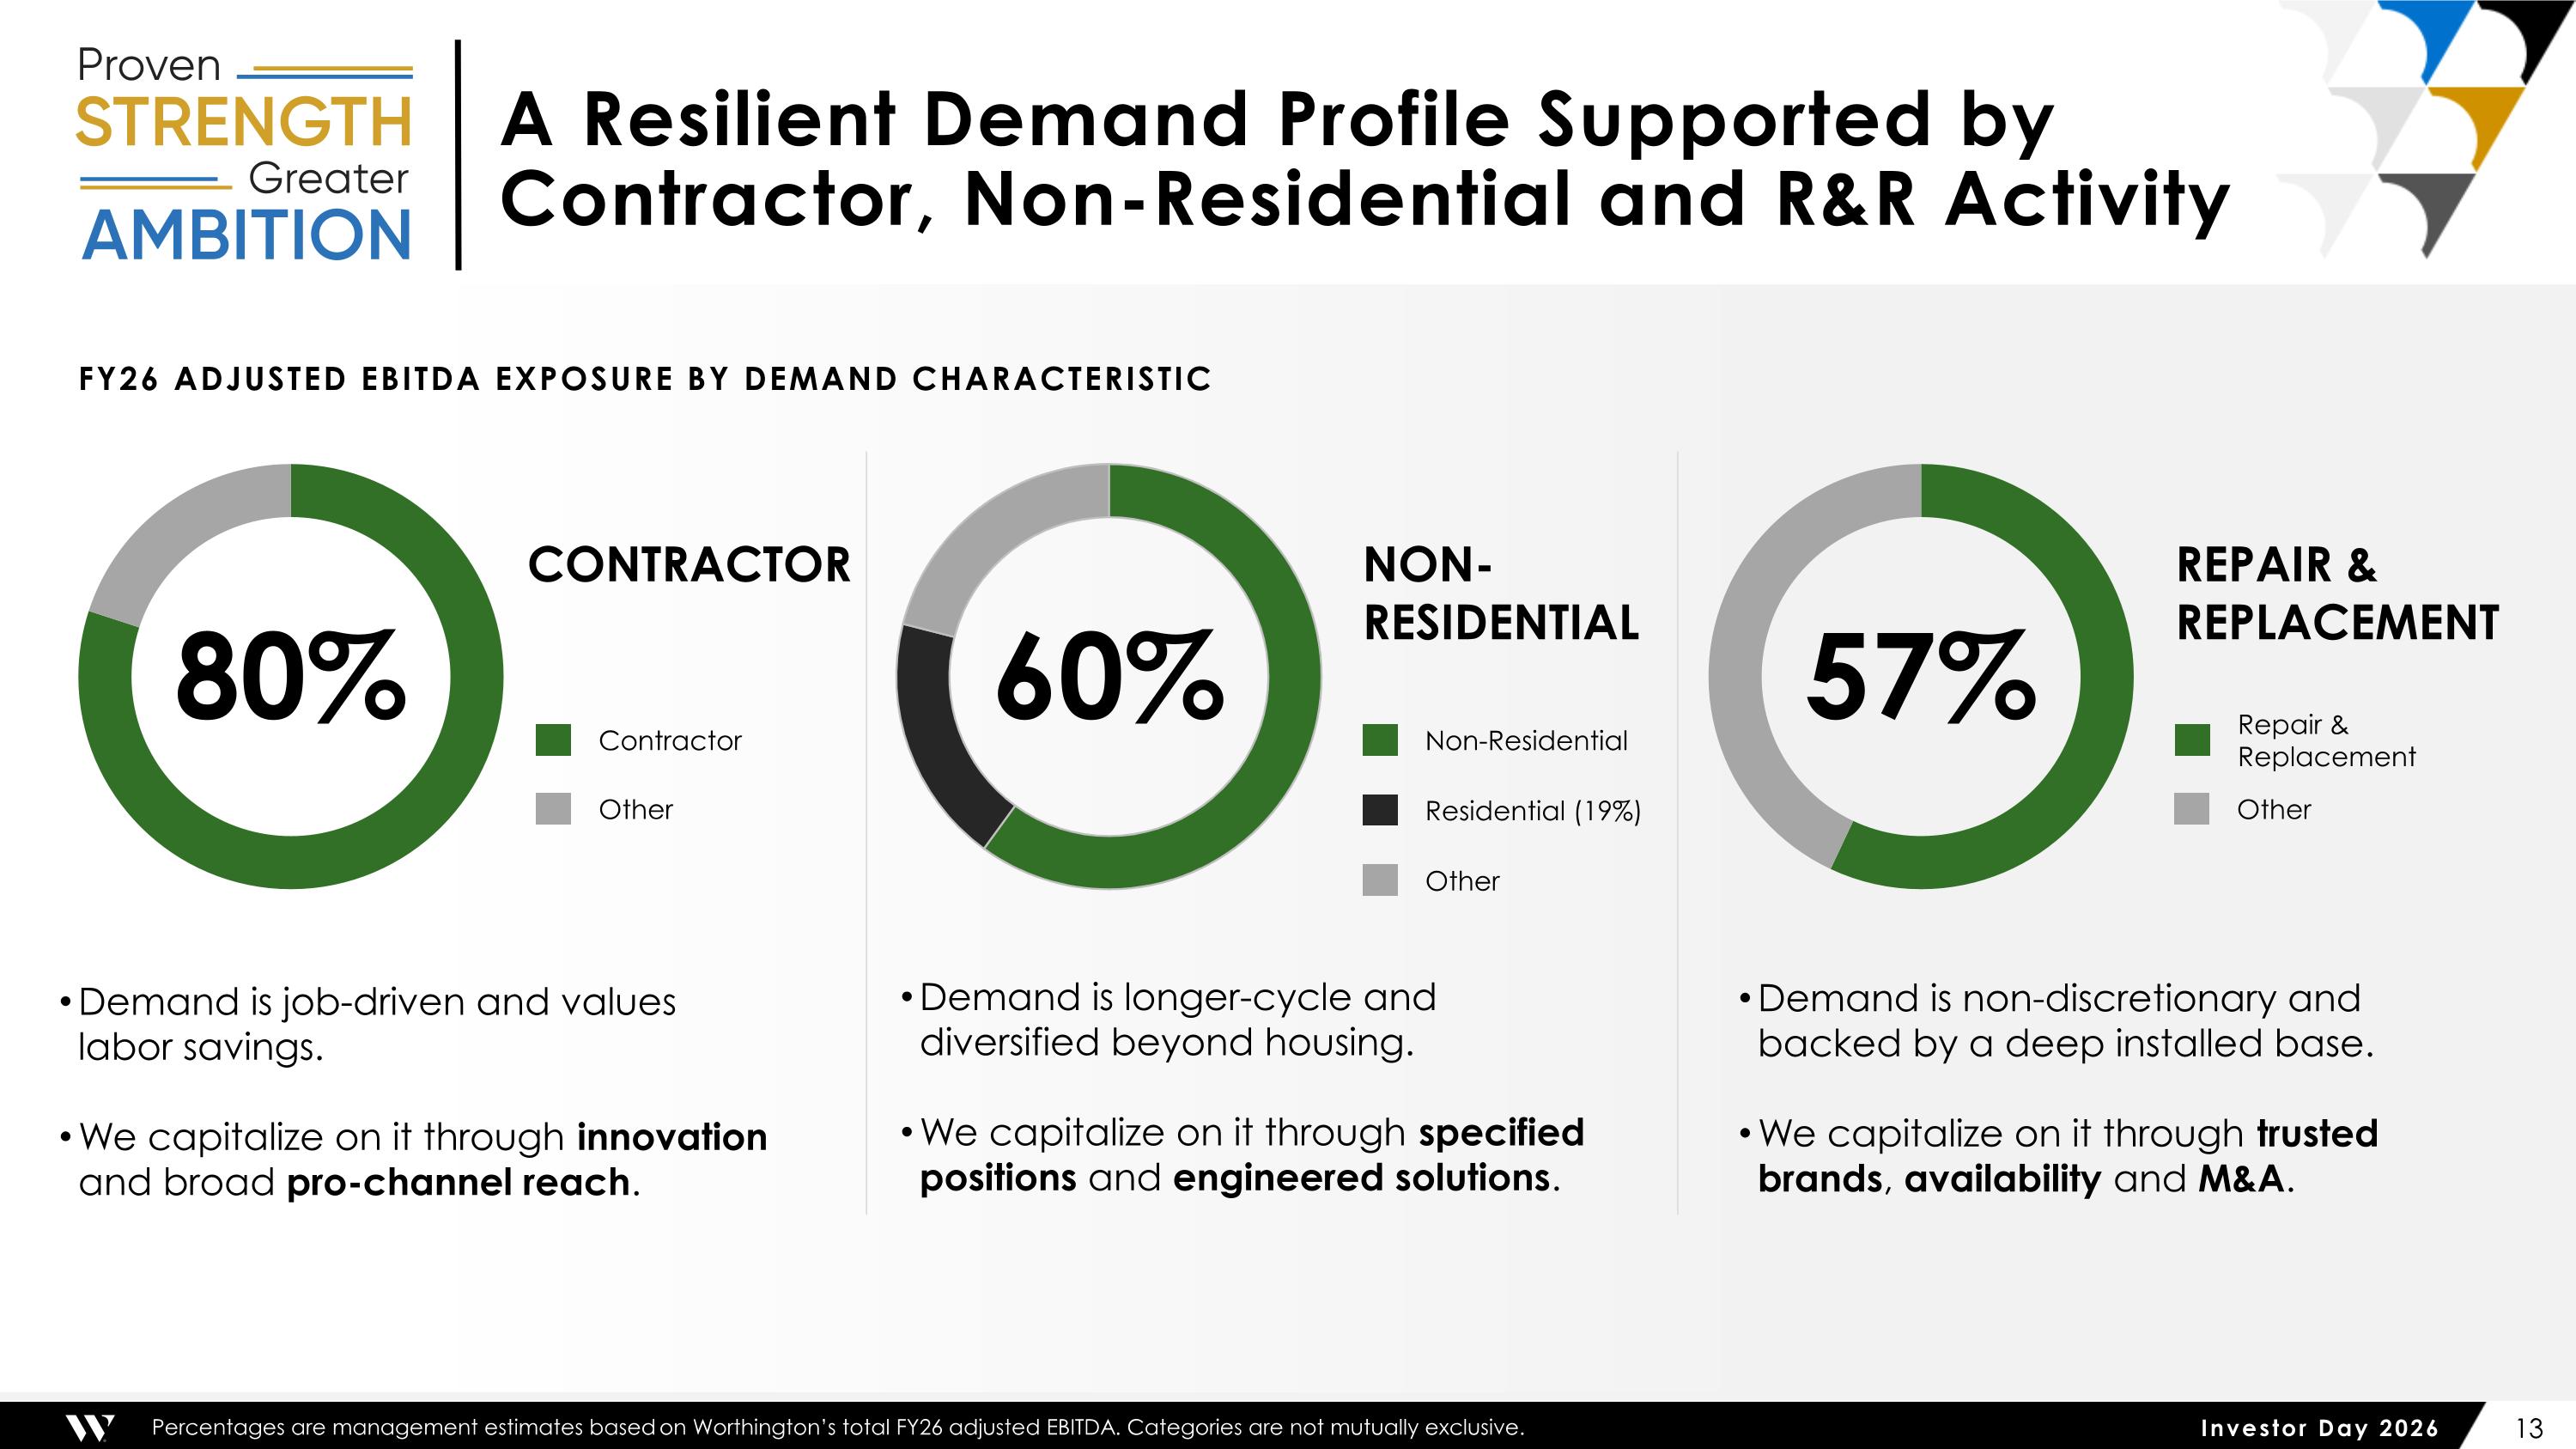
A Resilient Demand Profile Supported by Contractor, Non-Residential and R&R Activity NON-RESIDENTIAL Demand is longer-cycle and diversified beyond housing. We capitalize on it through specified positions and engineered solutions. 60% CONTRACTOR Demand is job-driven and values labor savings. We capitalize on it through innovation and broad pro-channel reach. 80% REPAIR & REPLACEMENT Demand is non-discretionary and backed by a deep installed base. We capitalize on it through trusted brands, availability and M&A. 57% Percentages are management estimates based on Worthington’s total FY26 adjusted EBITDA. Categories are not mutually exclusive. FY26 Adjusted EBITDA exposure by demand characteristic Non-Residential Residential (19%) Other Other Contractor Repair & Replacement Other
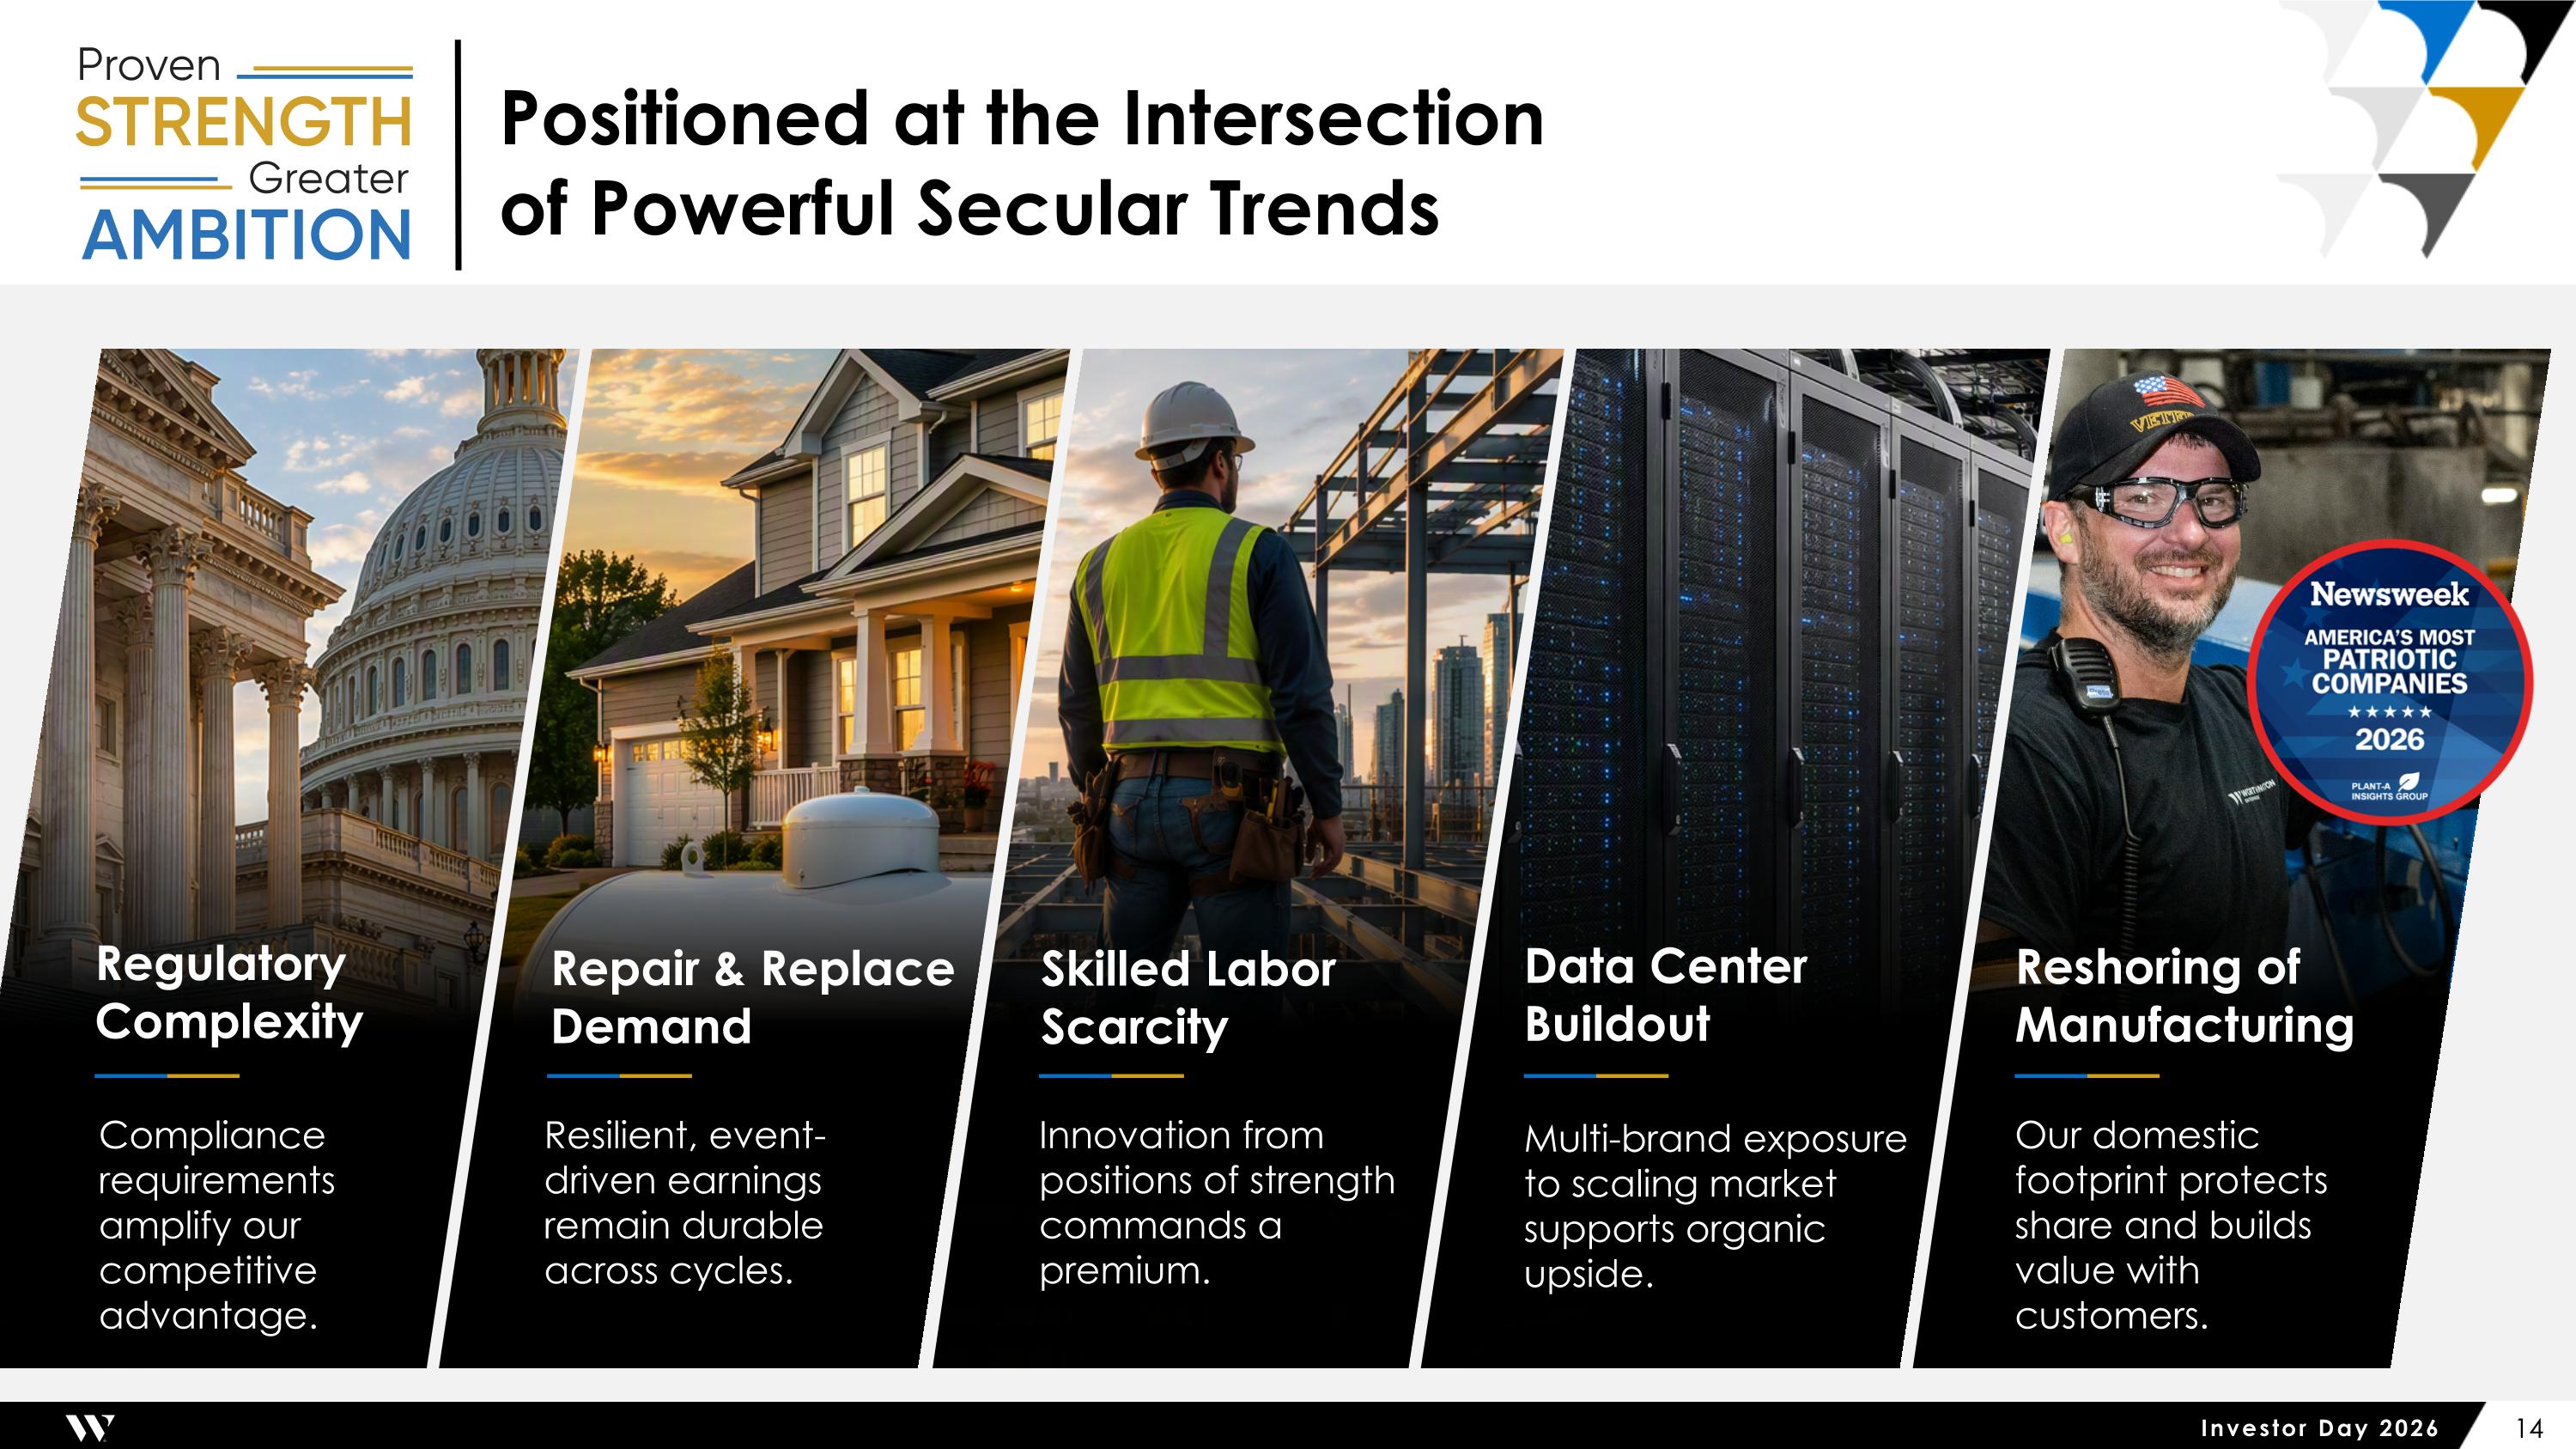
Positioned at the Intersection of Powerful Secular Trends Regulatory Complexity Compliance requirements amplify our competitive advantage. Repair & Replace Demand Resilient, event-driven earnings remain durable across cycles. Skilled Labor Scarcity Innovation from positions of strength commands a premium. Data Center Buildout Multi-brand exposure to scaling market supports organic upside. Reshoring of Manufacturing Our domestic footprint protects share and builds value with customers.

Creating Competitive Advantage THE Worthington BUSINESS SYSTEM

We Maintain an Empowered, Performance-Based Culture that Fuels Growth
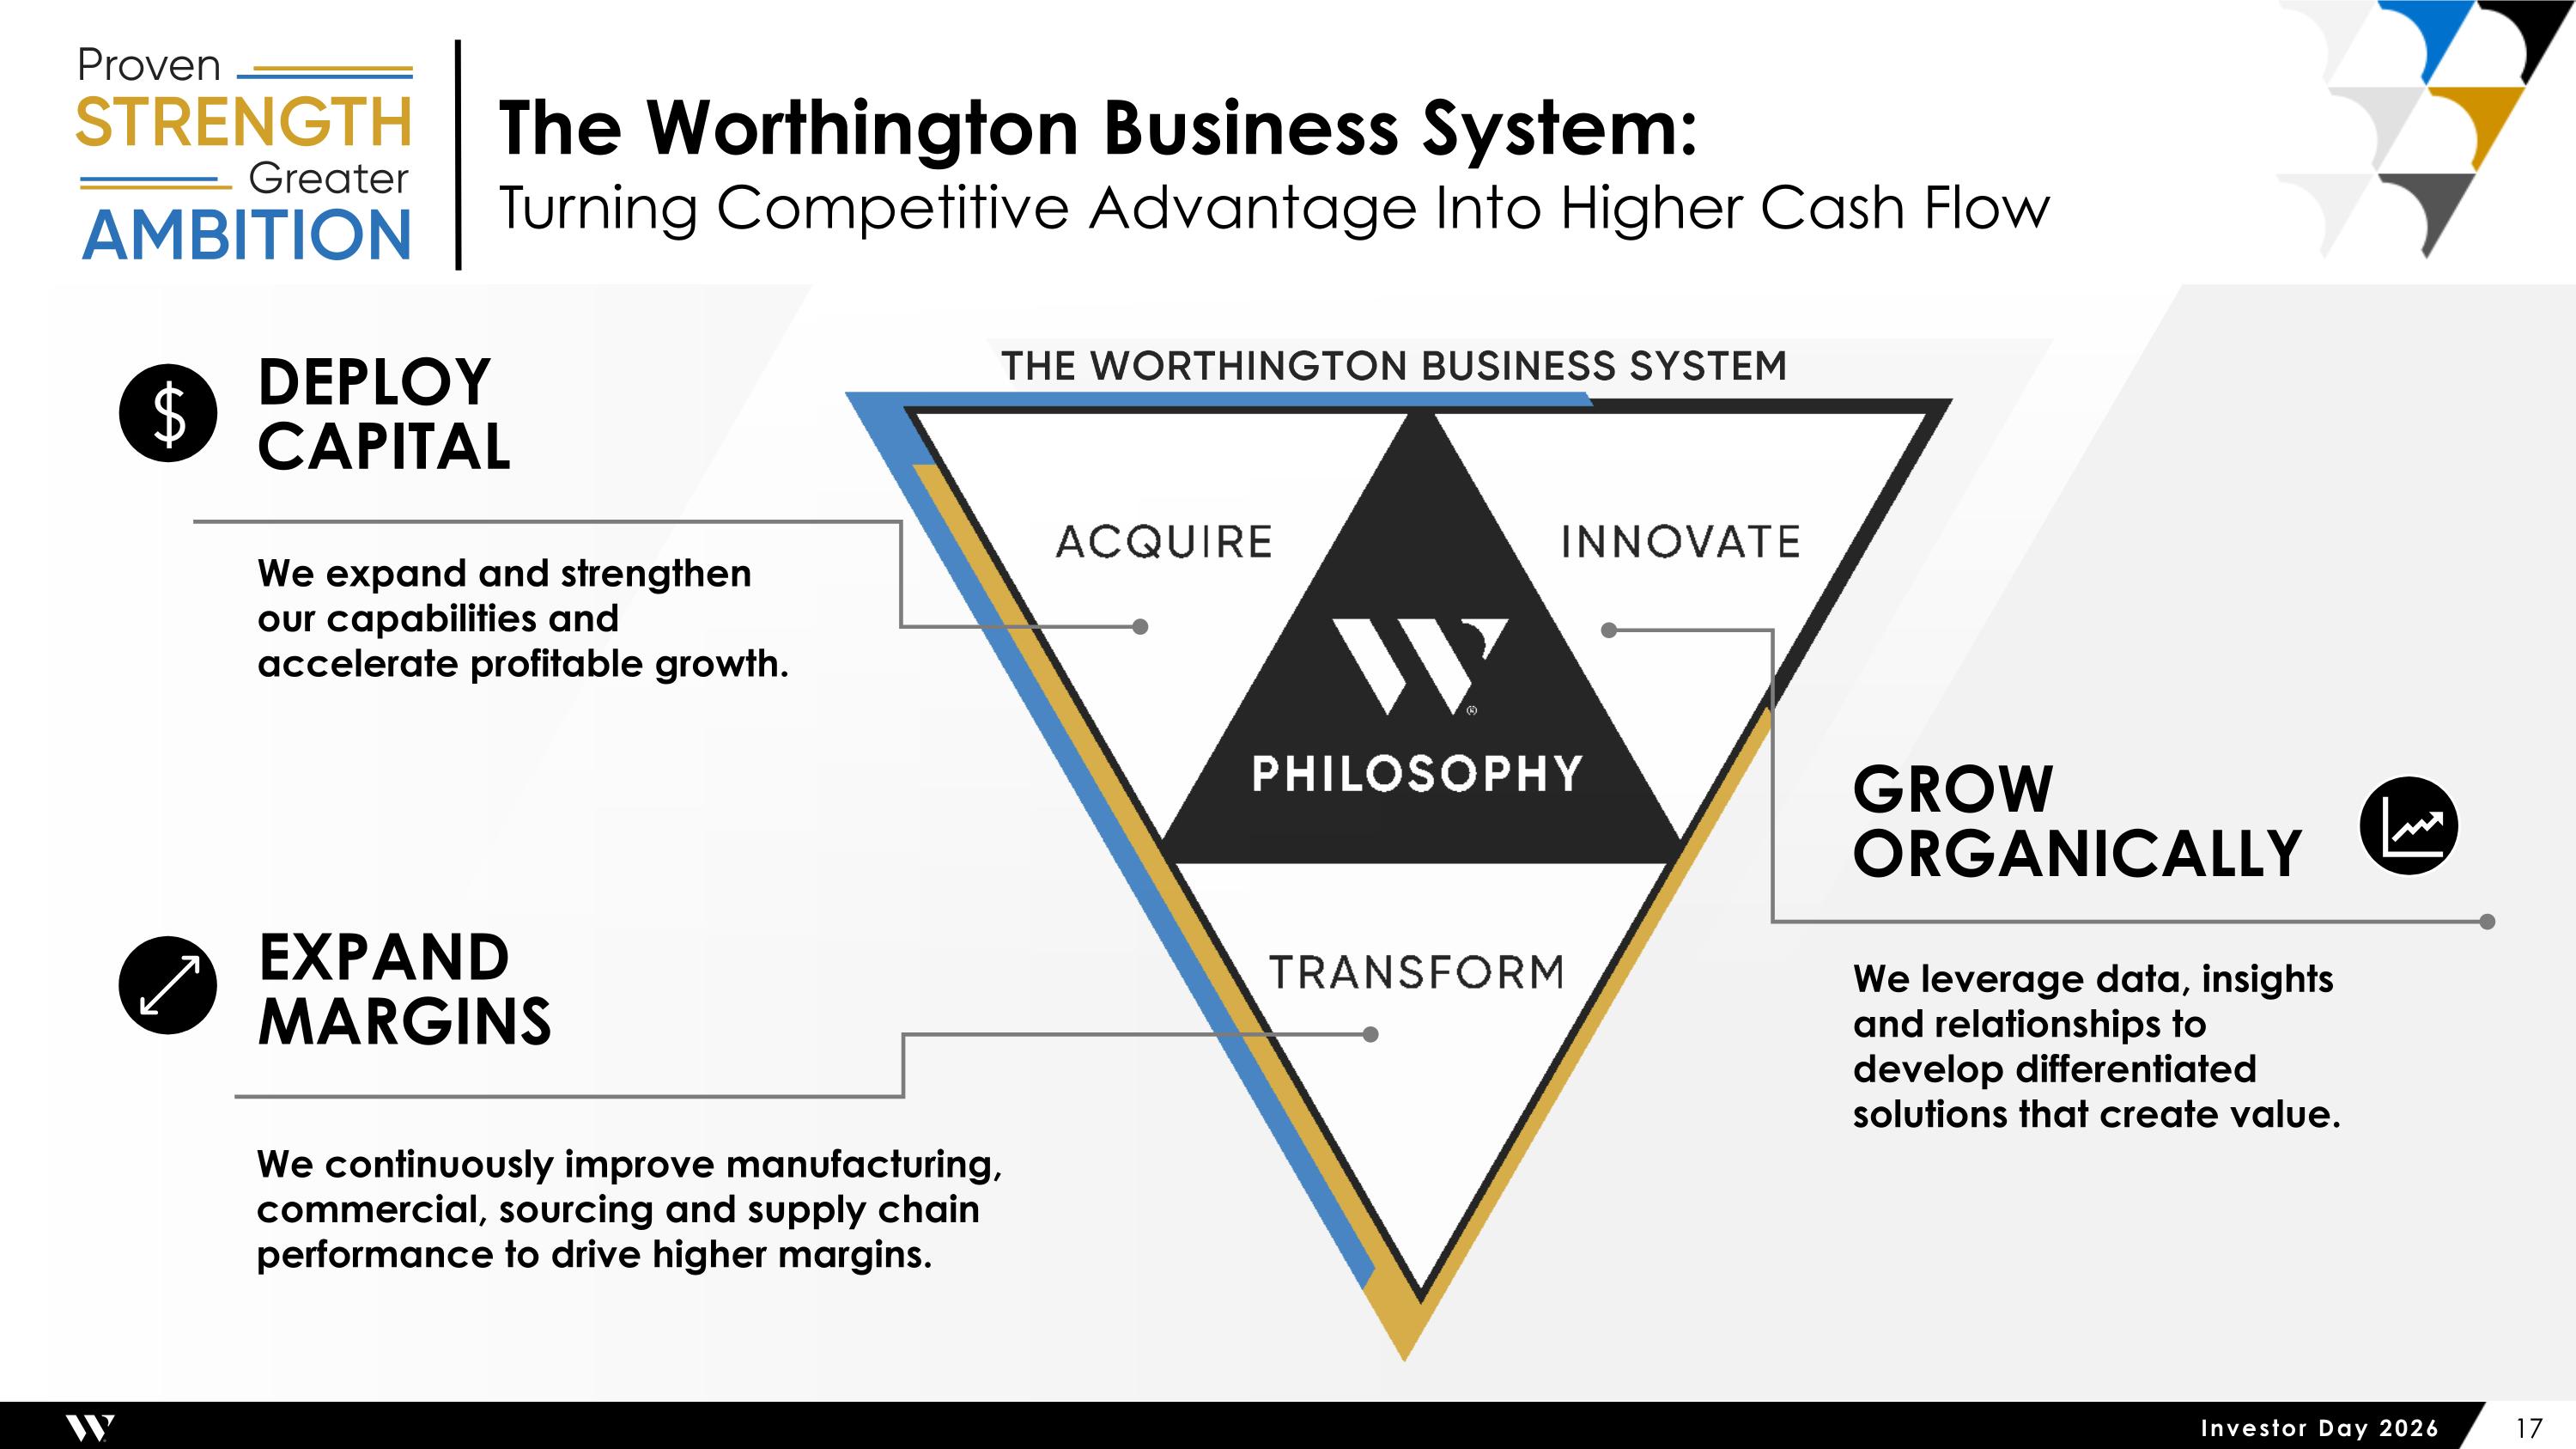
The Worthington Business System: Turning Competitive Advantage Into Higher Cash Flow We leverage data, insights and relationships to develop differentiated solutions that create value. We continuously improve manufacturing, commercial, sourcing and supply chain performance to drive higher margins. We expand and strengthen our capabilities and accelerate profitable growth. GROW ORGANICALLY EXPAND MARGINS DEPLOY CAPITAL
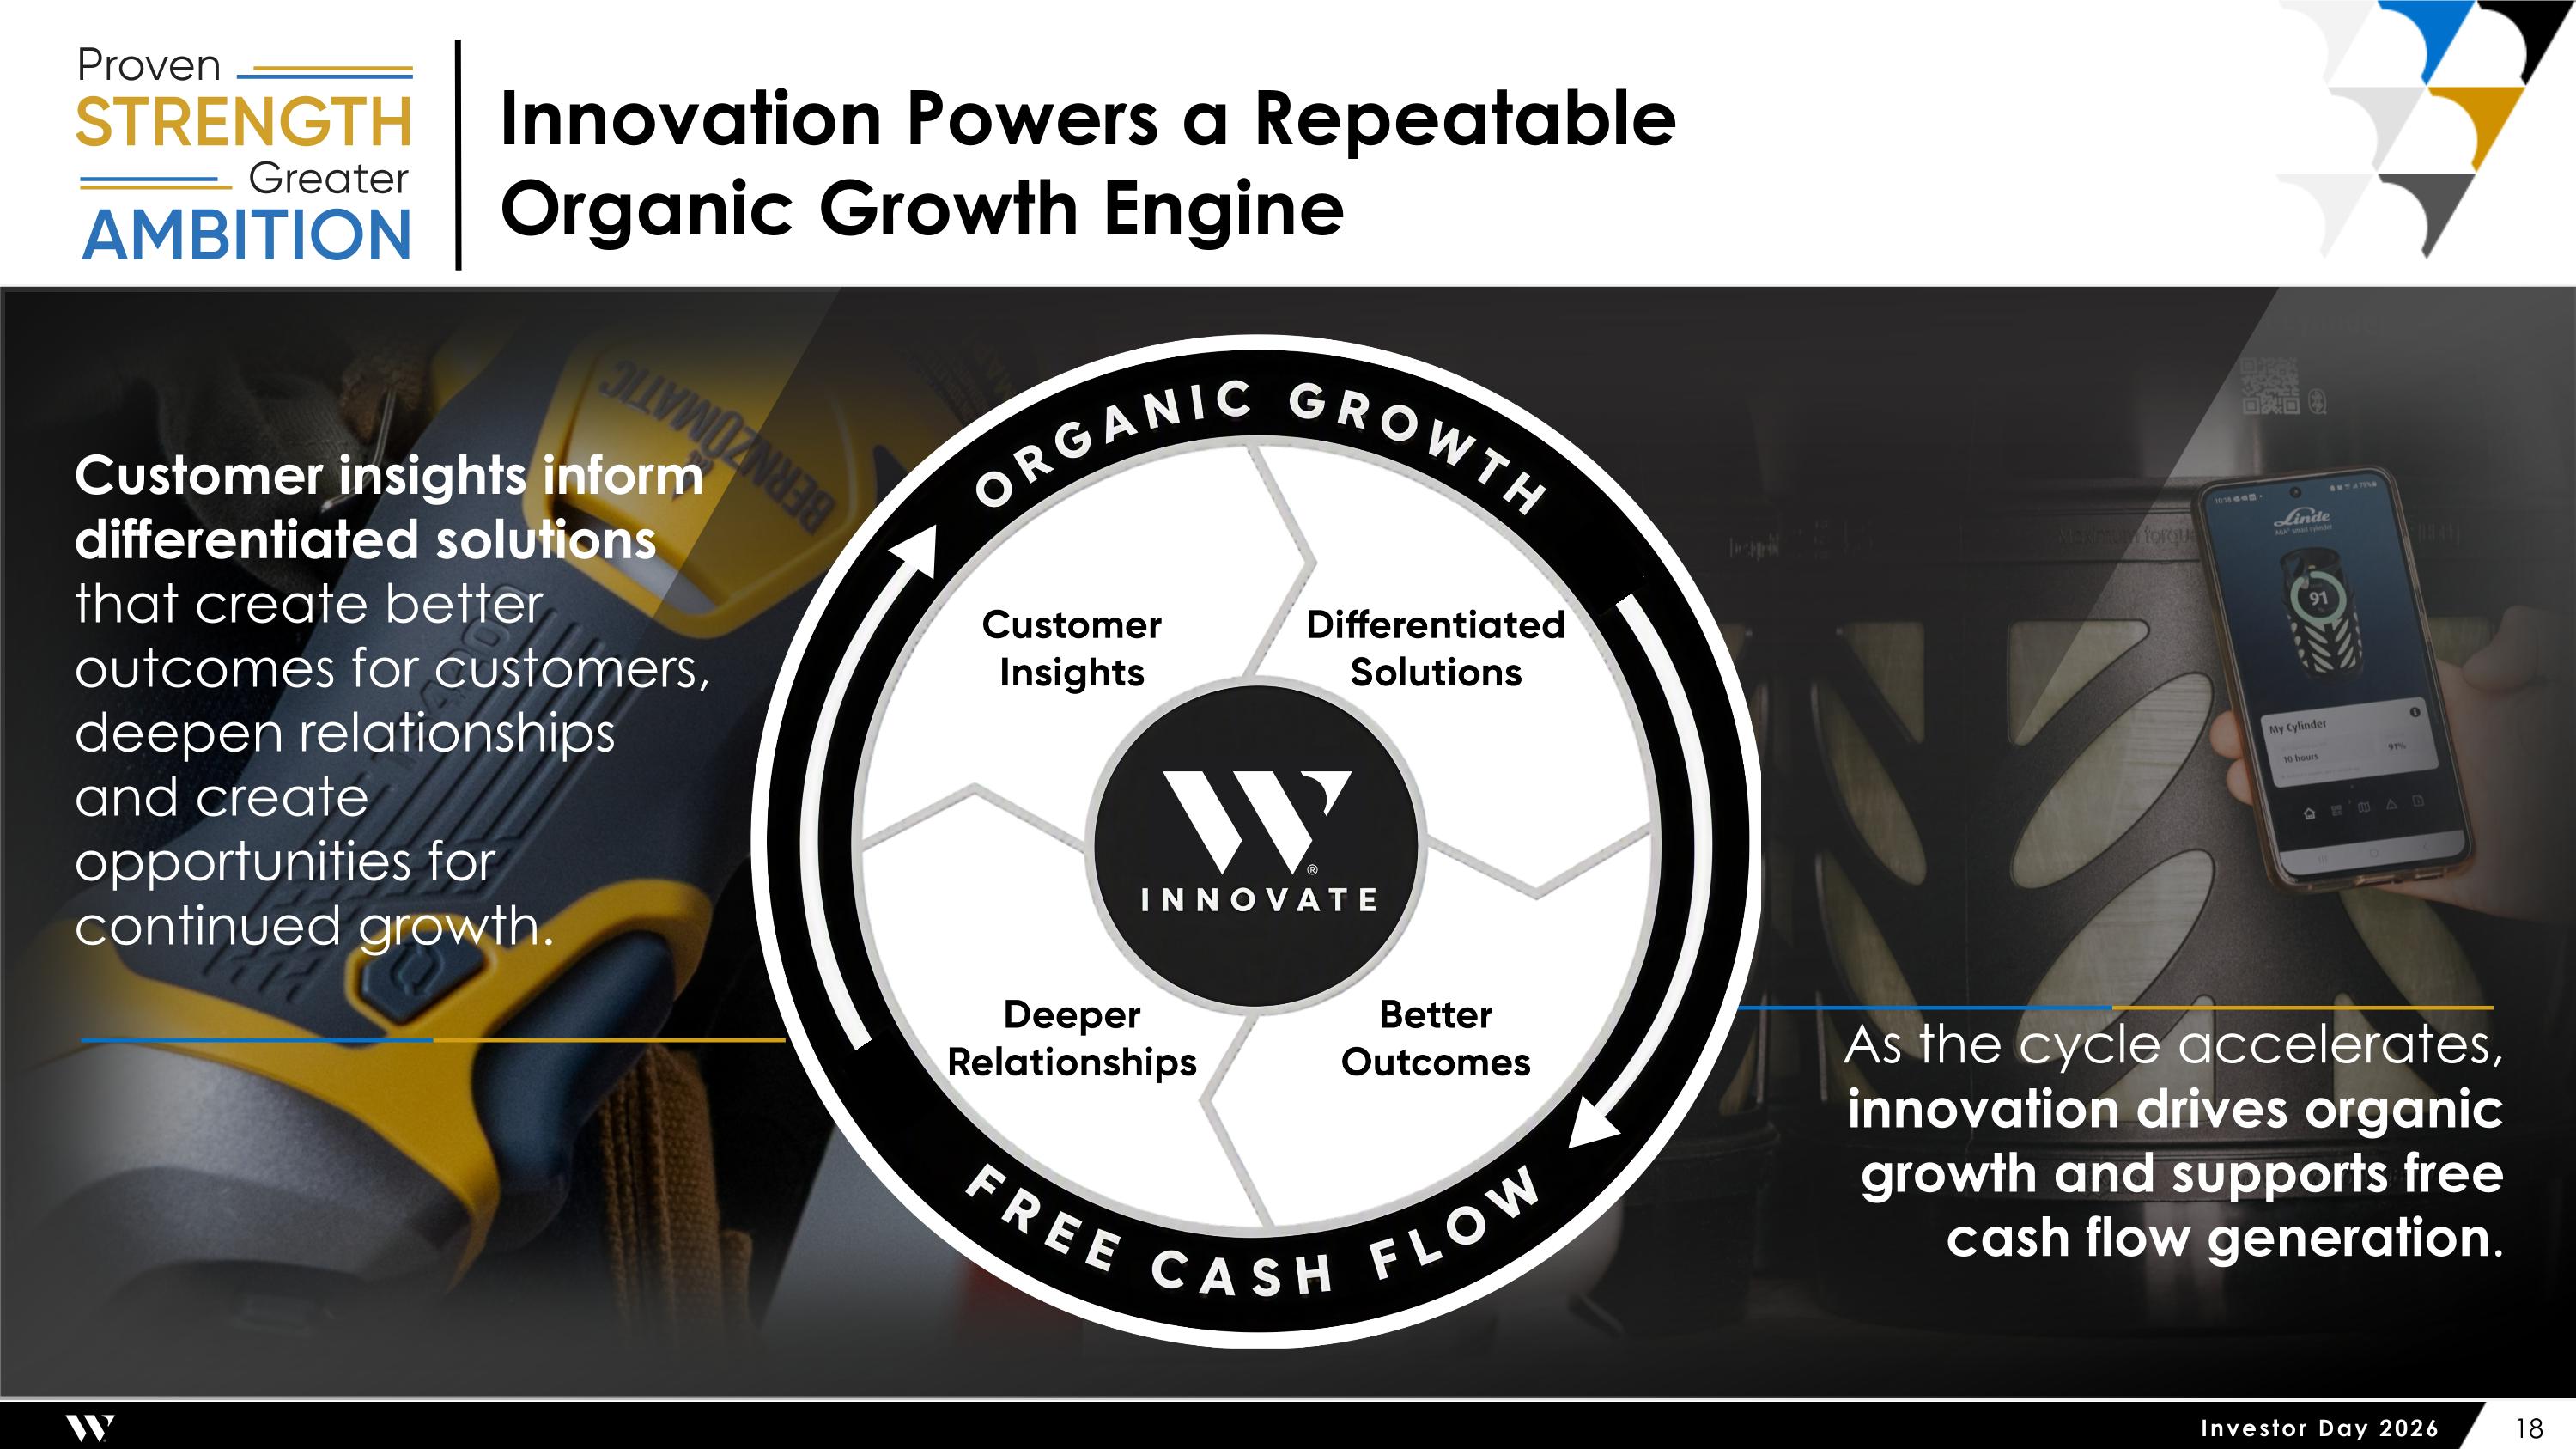
Innovation Powers a Repeatable Organic Growth Engine Customer insights inform differentiated solutions that create better outcomes for customers, deepen relationships and create opportunities for continued growth. As the cycle accelerates, innovation drives organic growth and supports free cash flow generation.
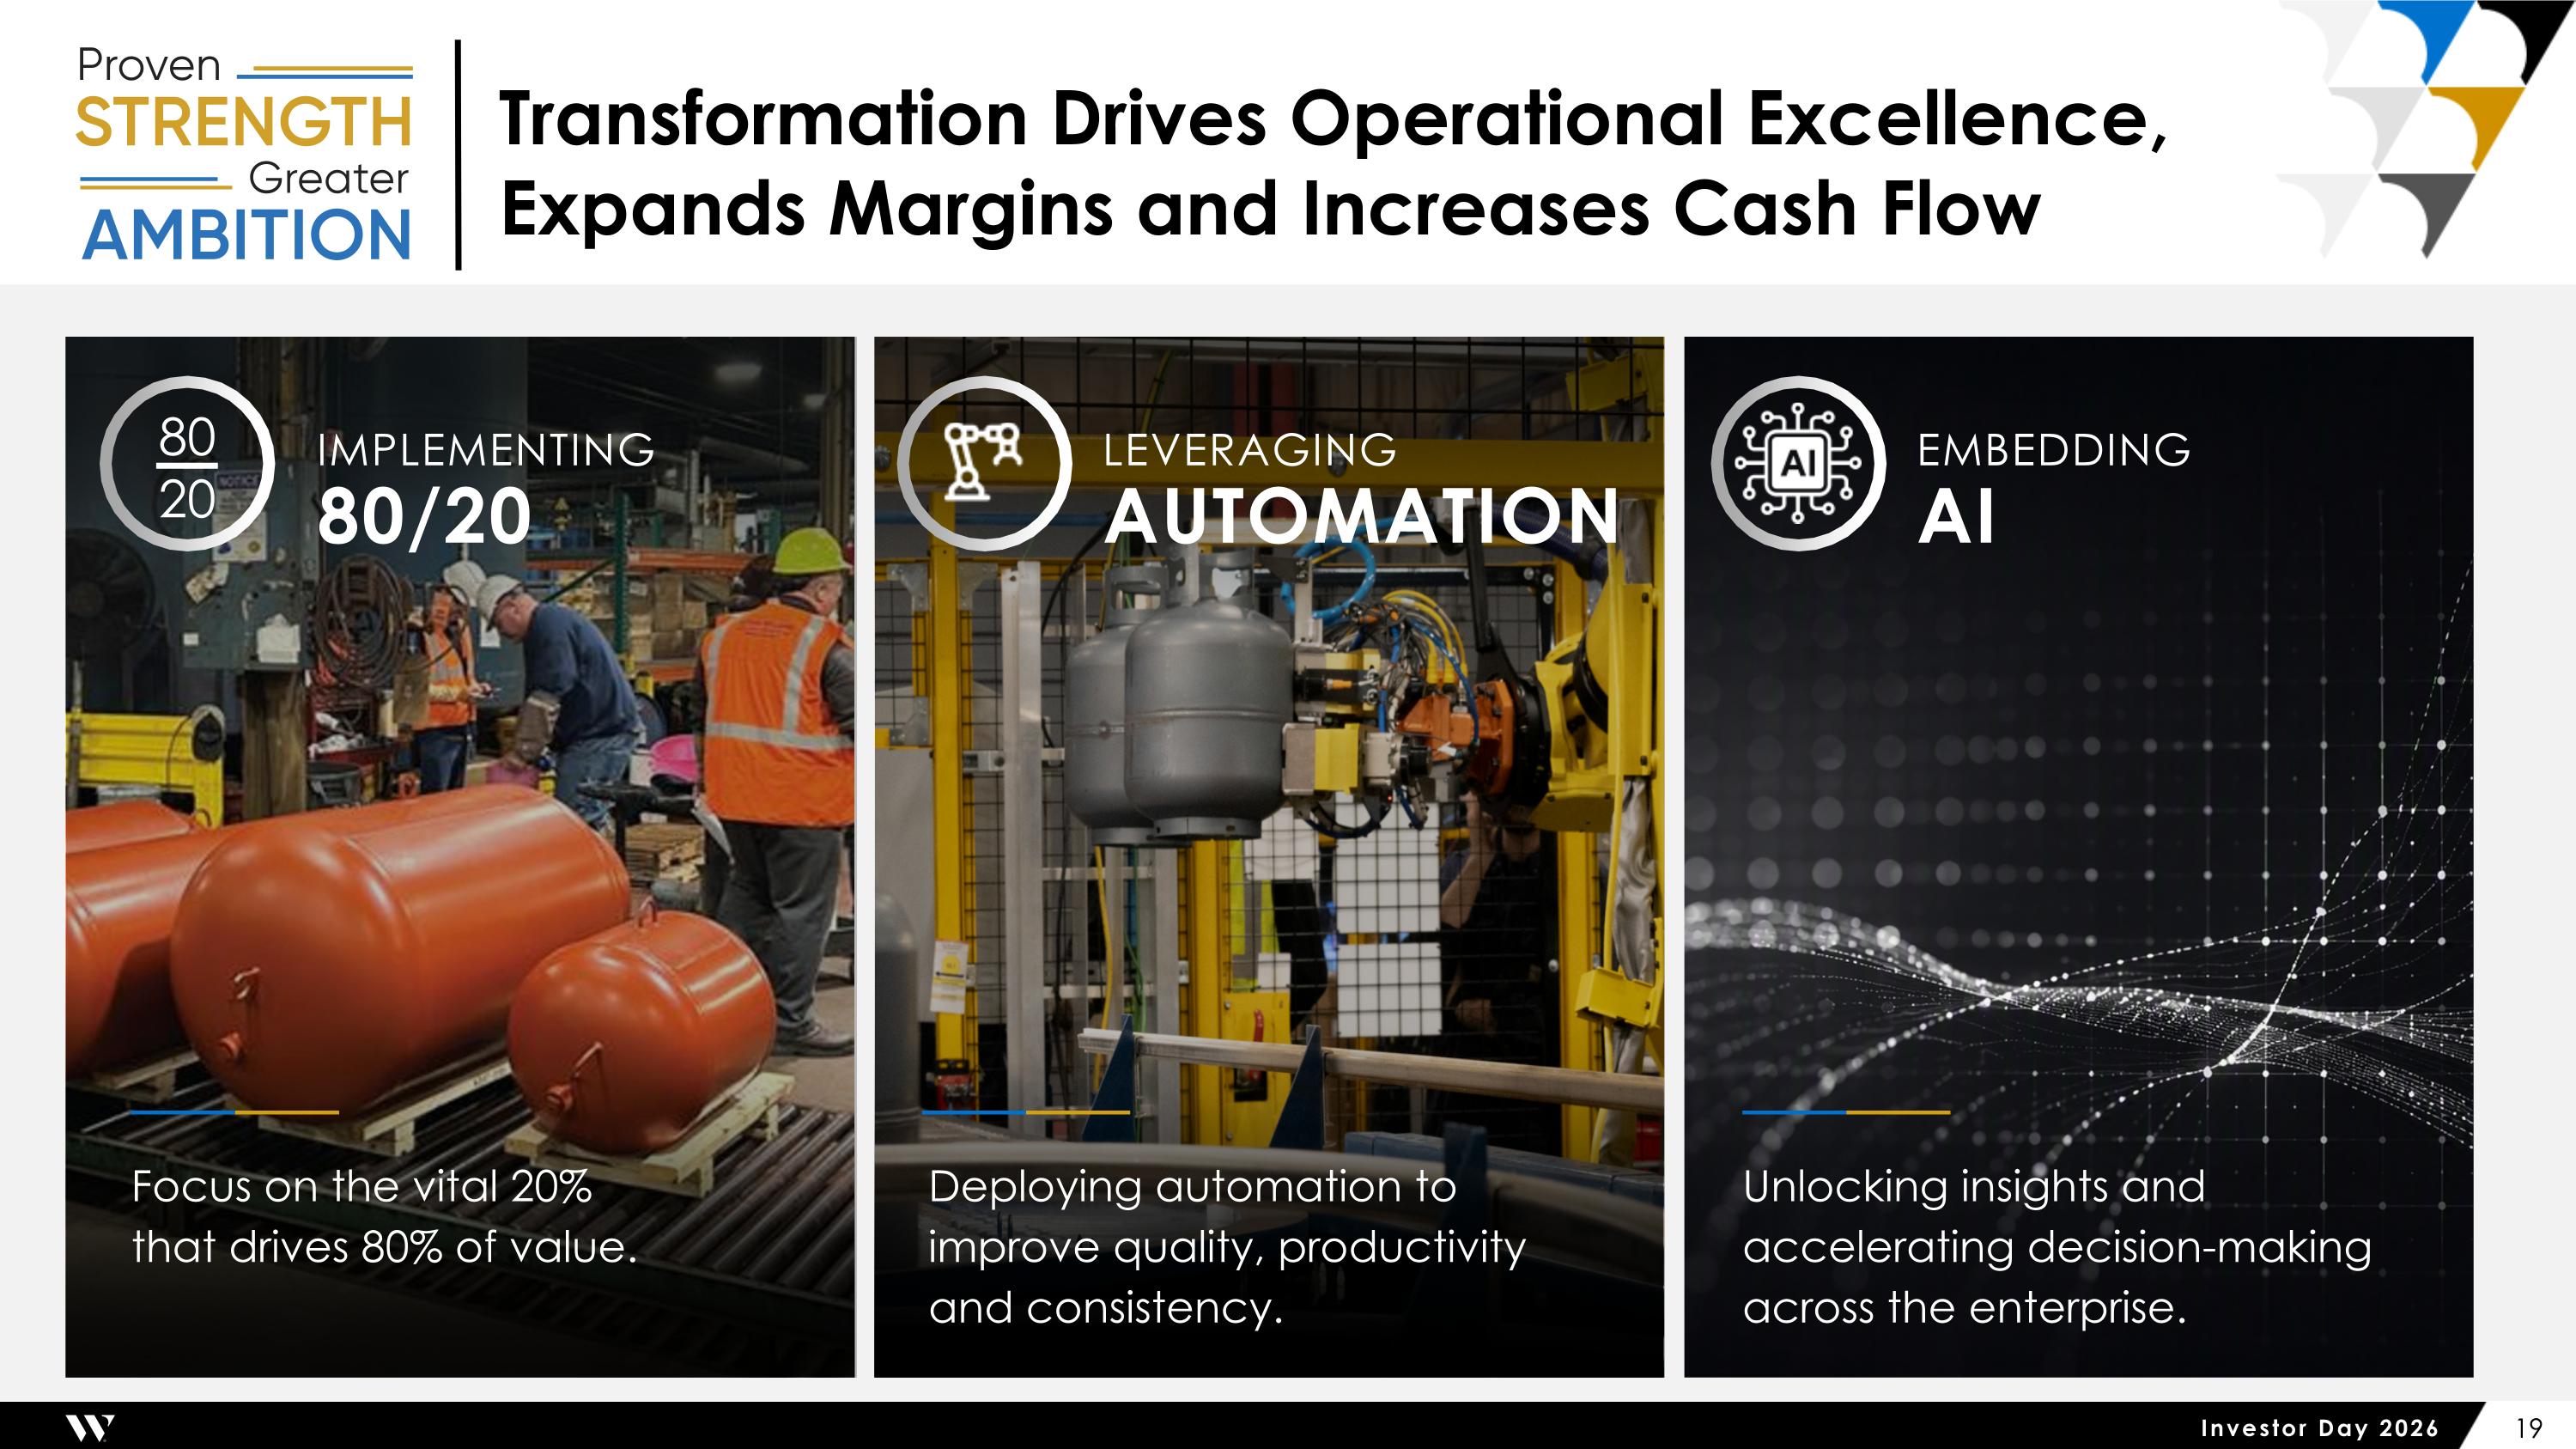
Transformation Drives Operational Excellence, Expands Margins and Increases Cash Flow LEVERAGING AUTOMATION IMPLEMENTING 80/20 EMBEDDING AI 80 20 Focus on the vital 20% that drives 80% of value. Deploying automation to improve quality, productivity and consistency. Unlocking insights and accelerating decision-making across the enterprise.
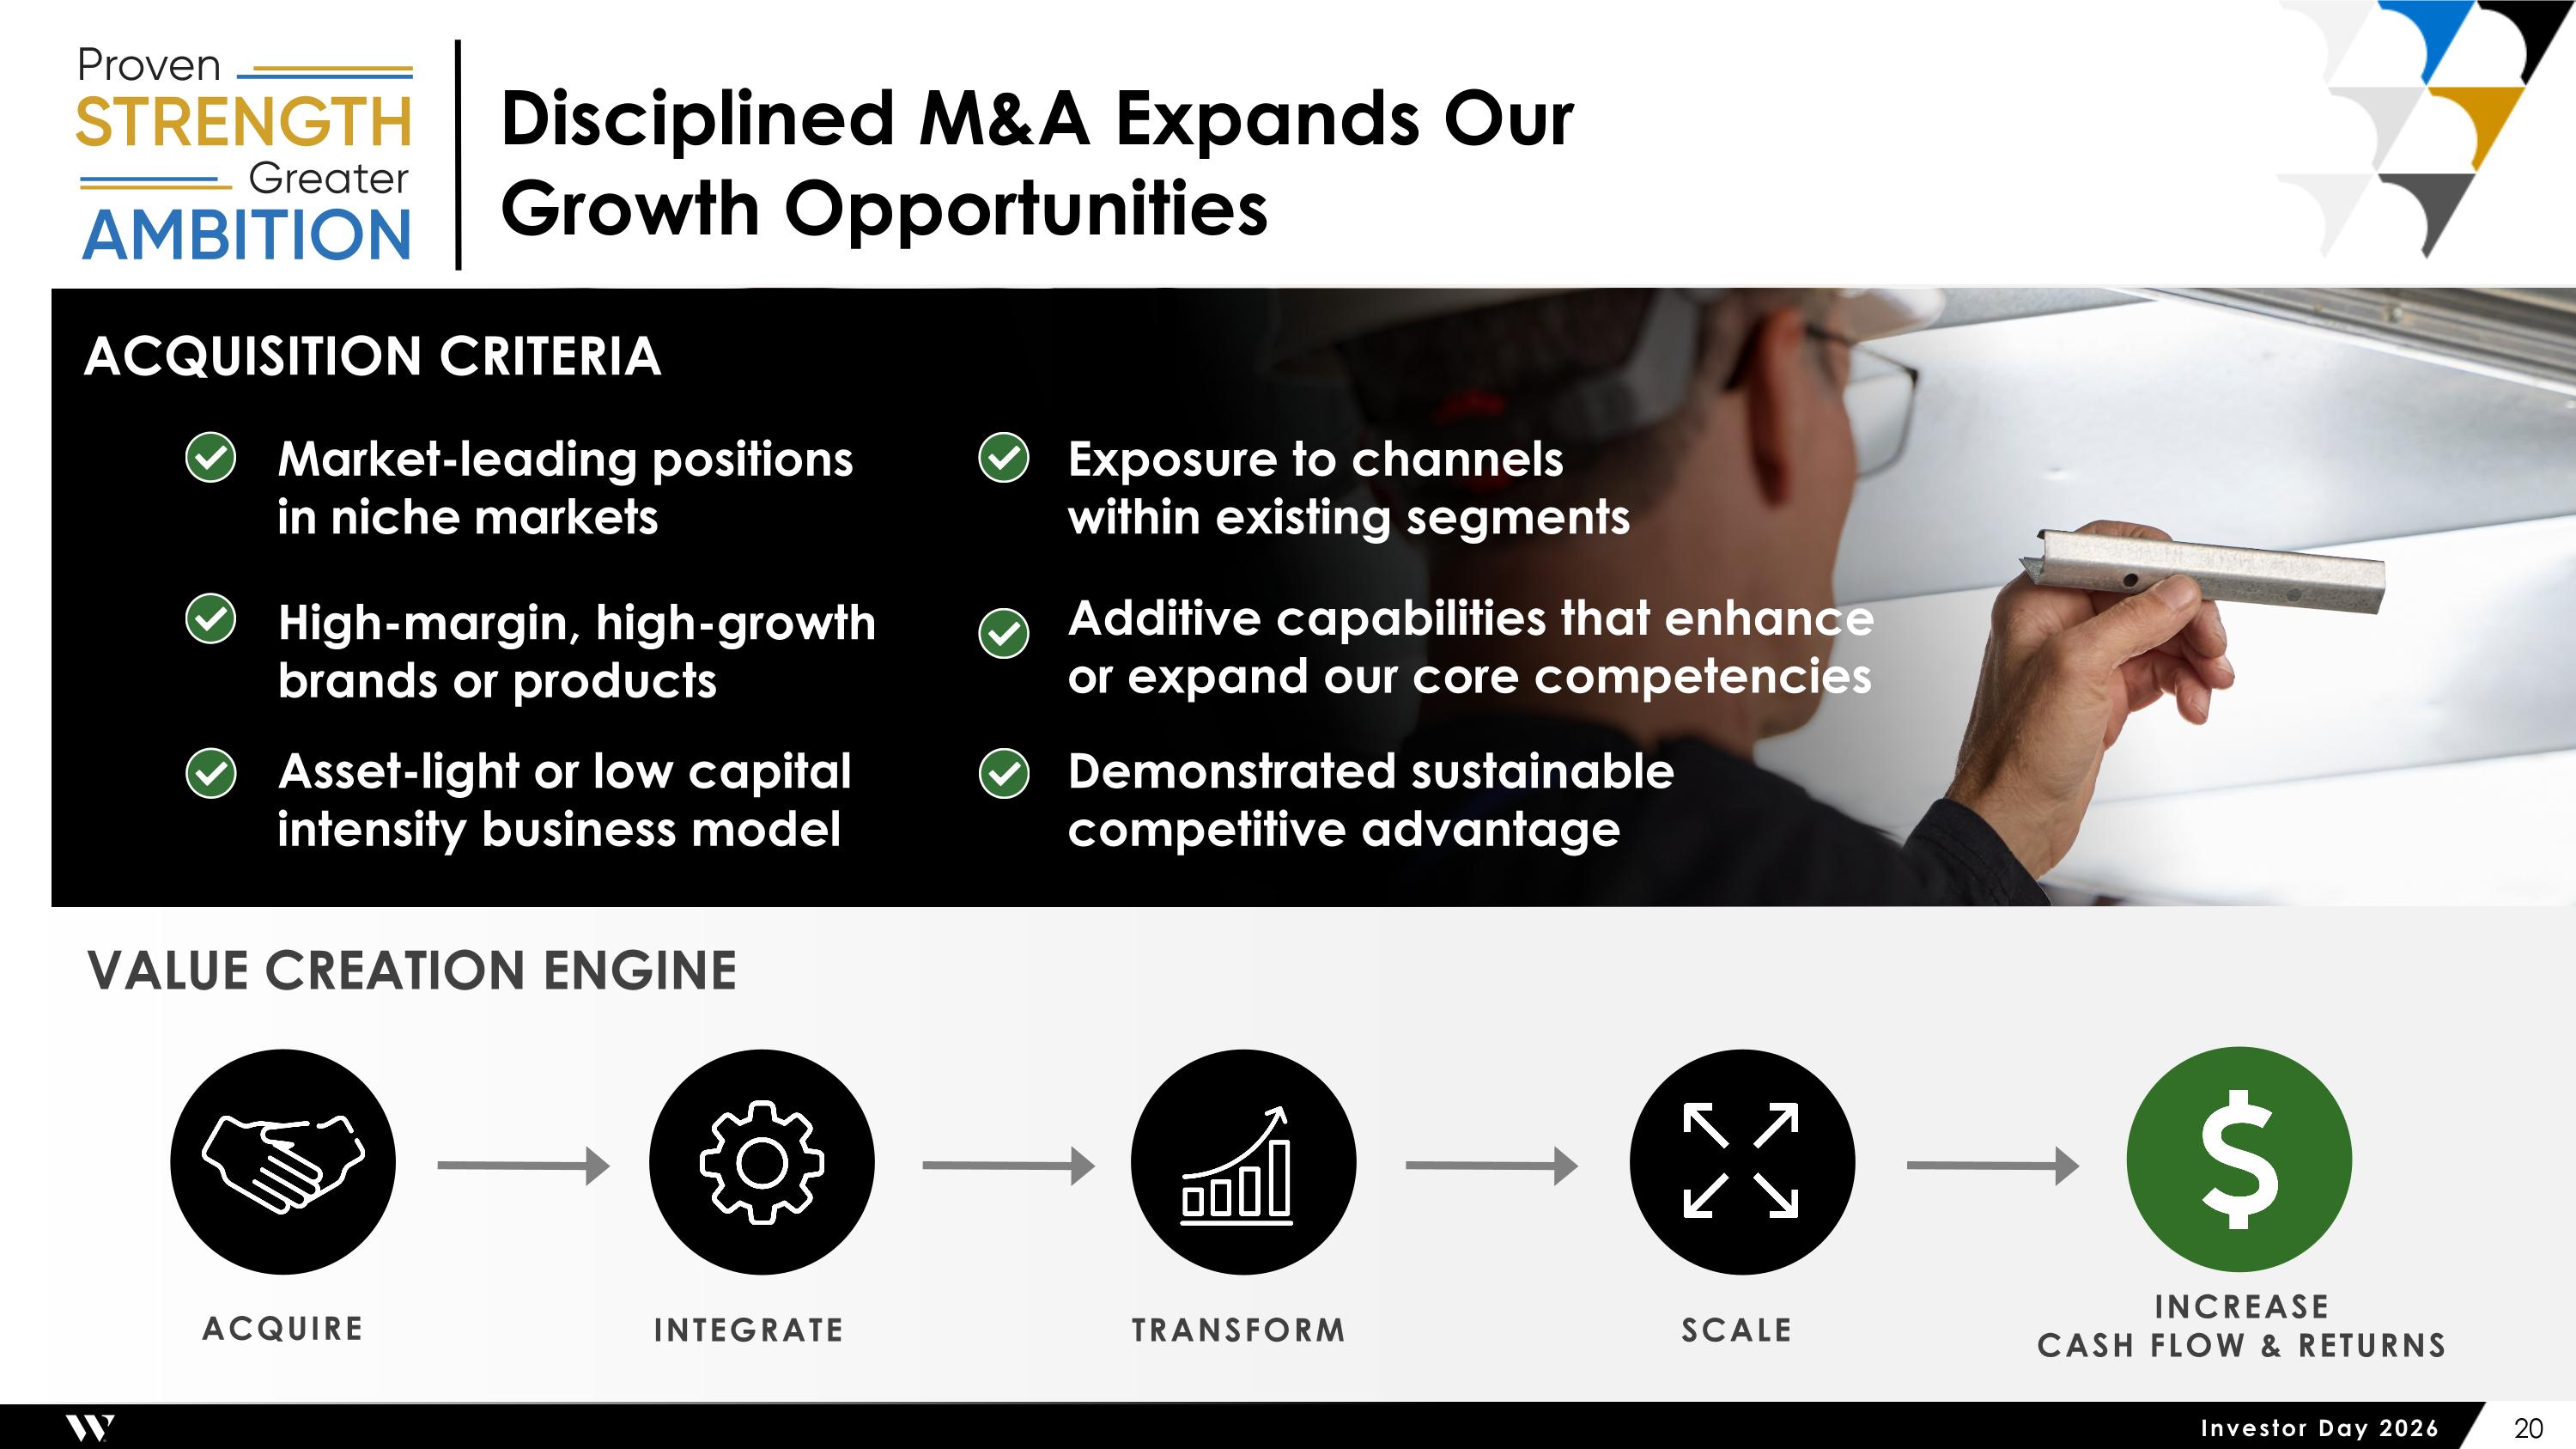
Disciplined M&A Expands Our Growth Opportunities ACQUISITION CRITERIA VALUE CREATION ENGINE Market-leading positions in niche markets High-margin, high-growth brands or products Asset-light or low capital intensity business model Exposure to channels within existing segments Additive capabilities that enhance or expand our core competencies Demonstrated sustainable competitive advantage ACQUIRE INTEGRATE TRANSFORM SCALE INCREASE CASH FLOW & RETURNS
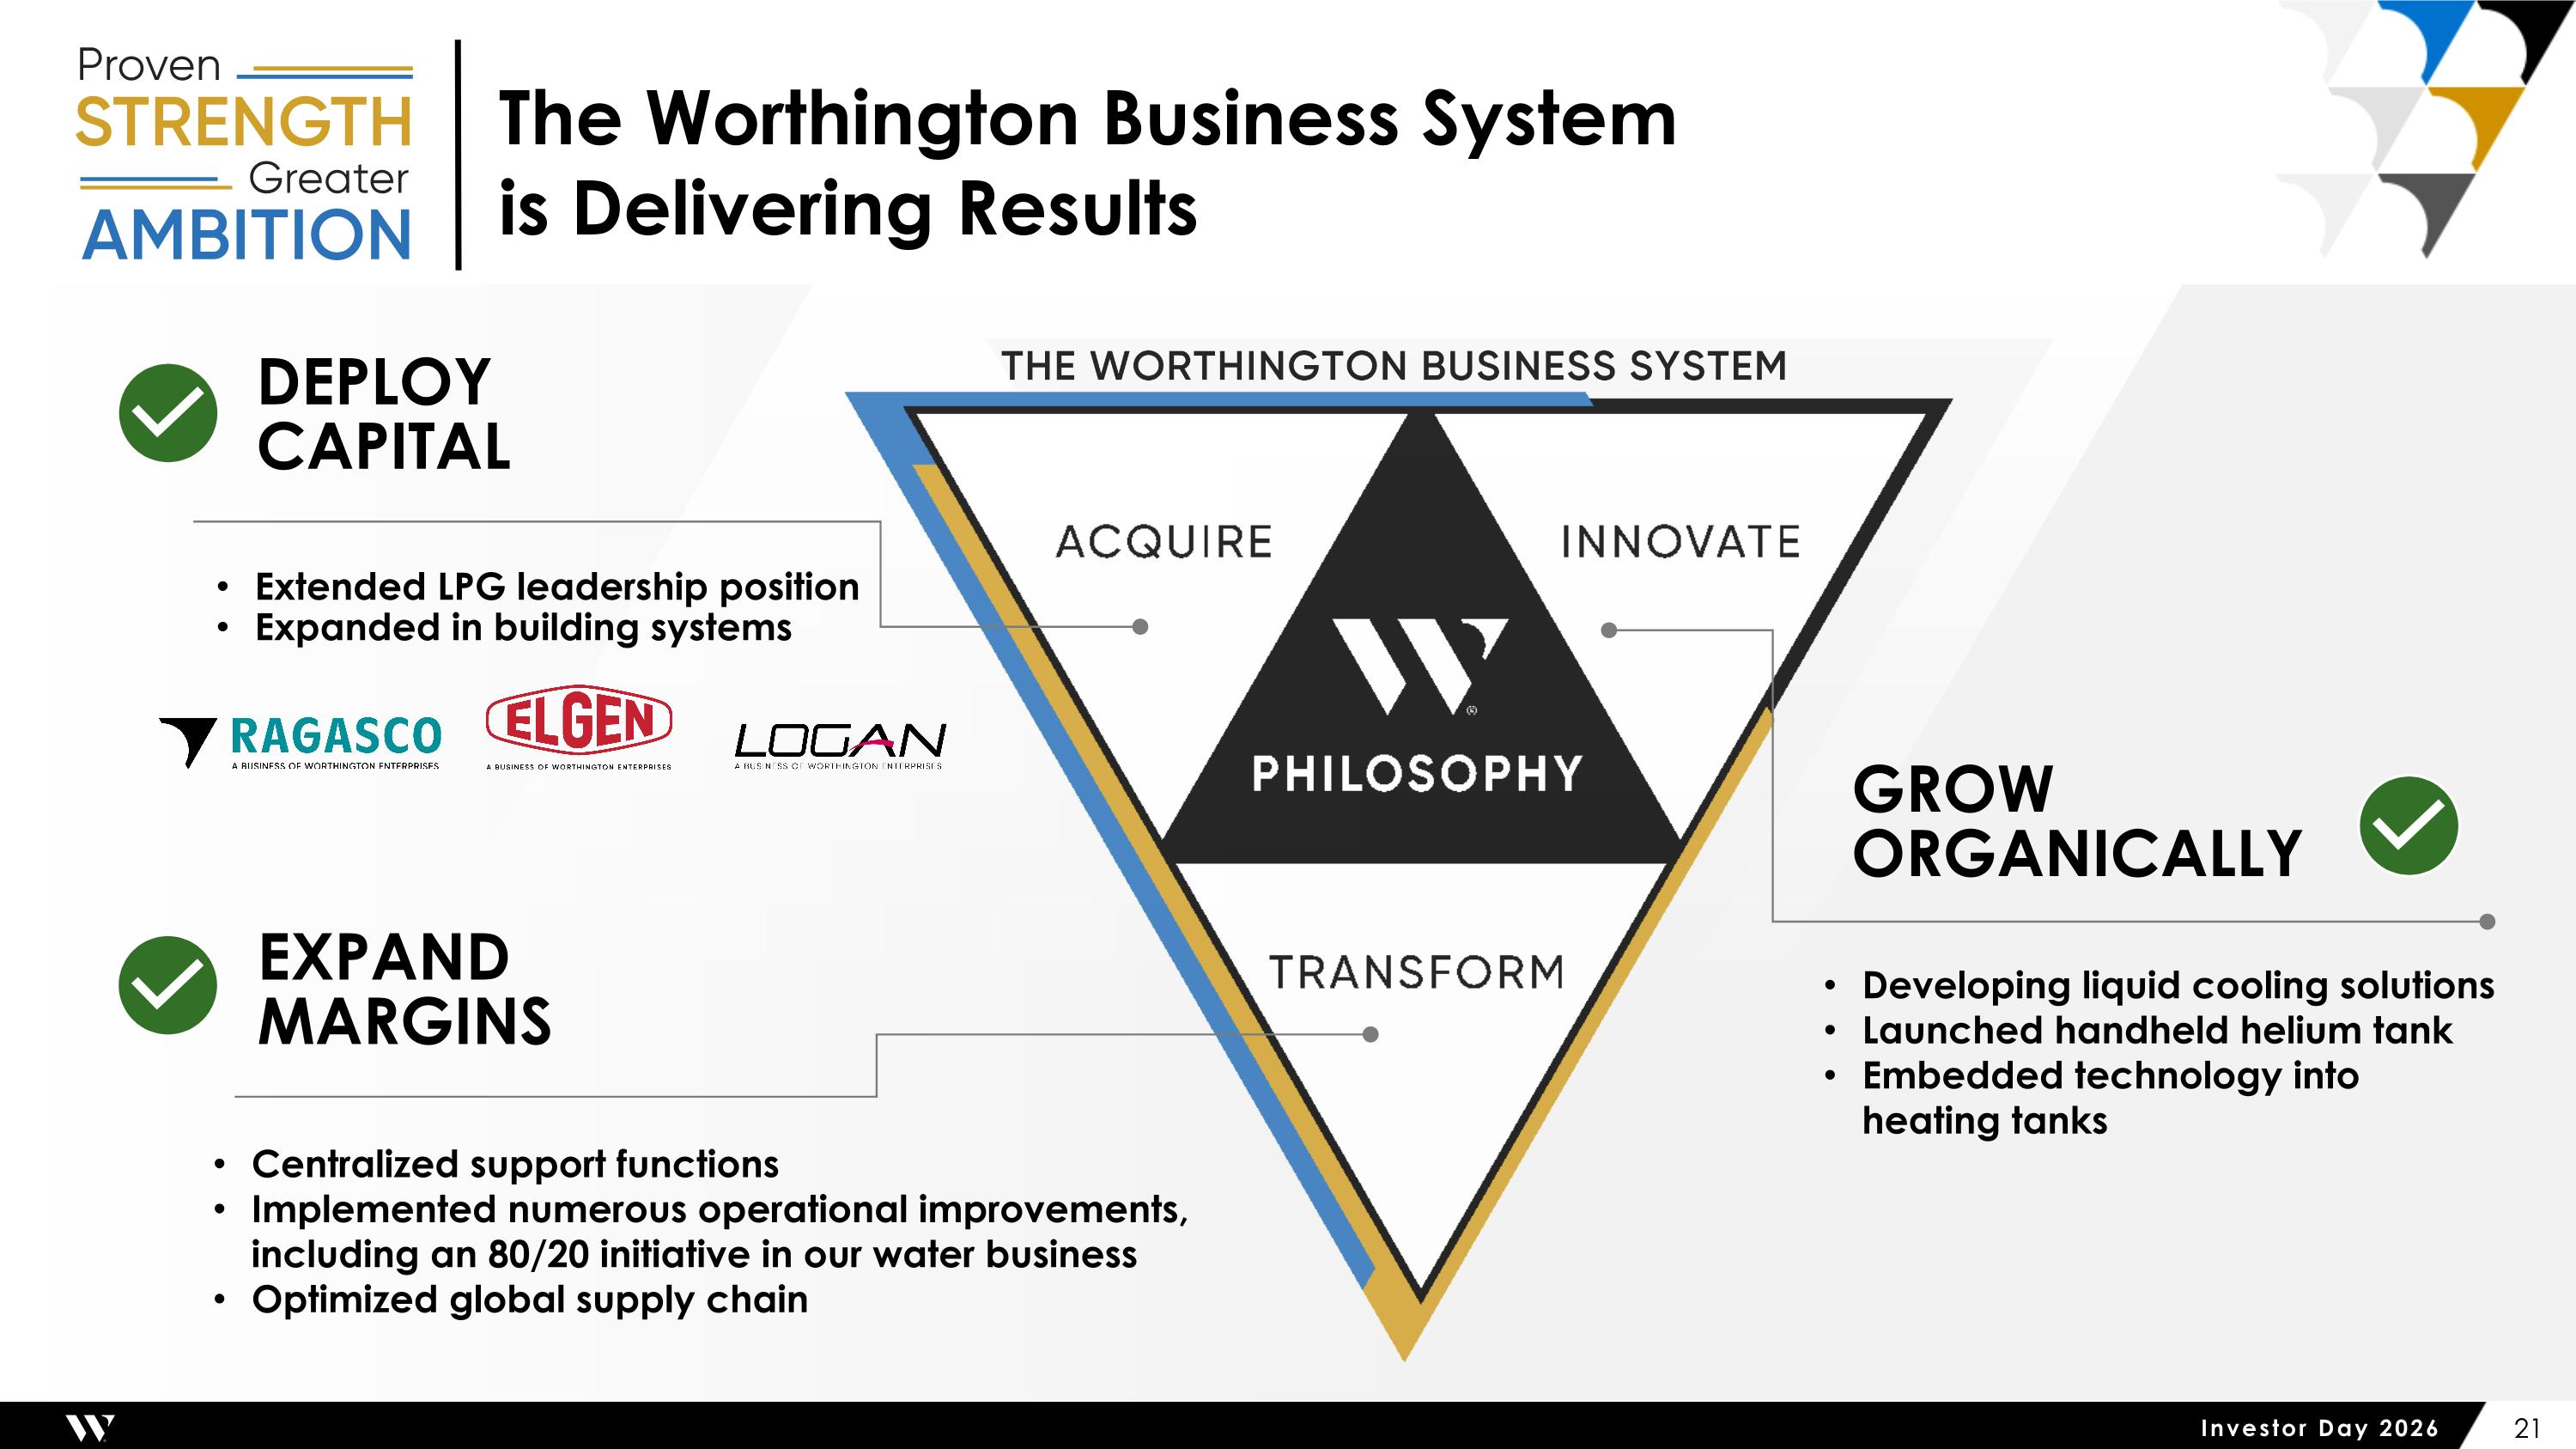
The Worthington Business System is Delivering Results Developing liquid cooling solutions Launched handheld helium tank Embedded technology into heating tanks Centralized support functions Implemented numerous operational improvements, including an 80/20 initiative in our water business Optimized global supply chain Extended LPG leadership position Expanded in building systems DEPLOY CAPITAL GROW ORGANICALLY EXPAND MARGINS
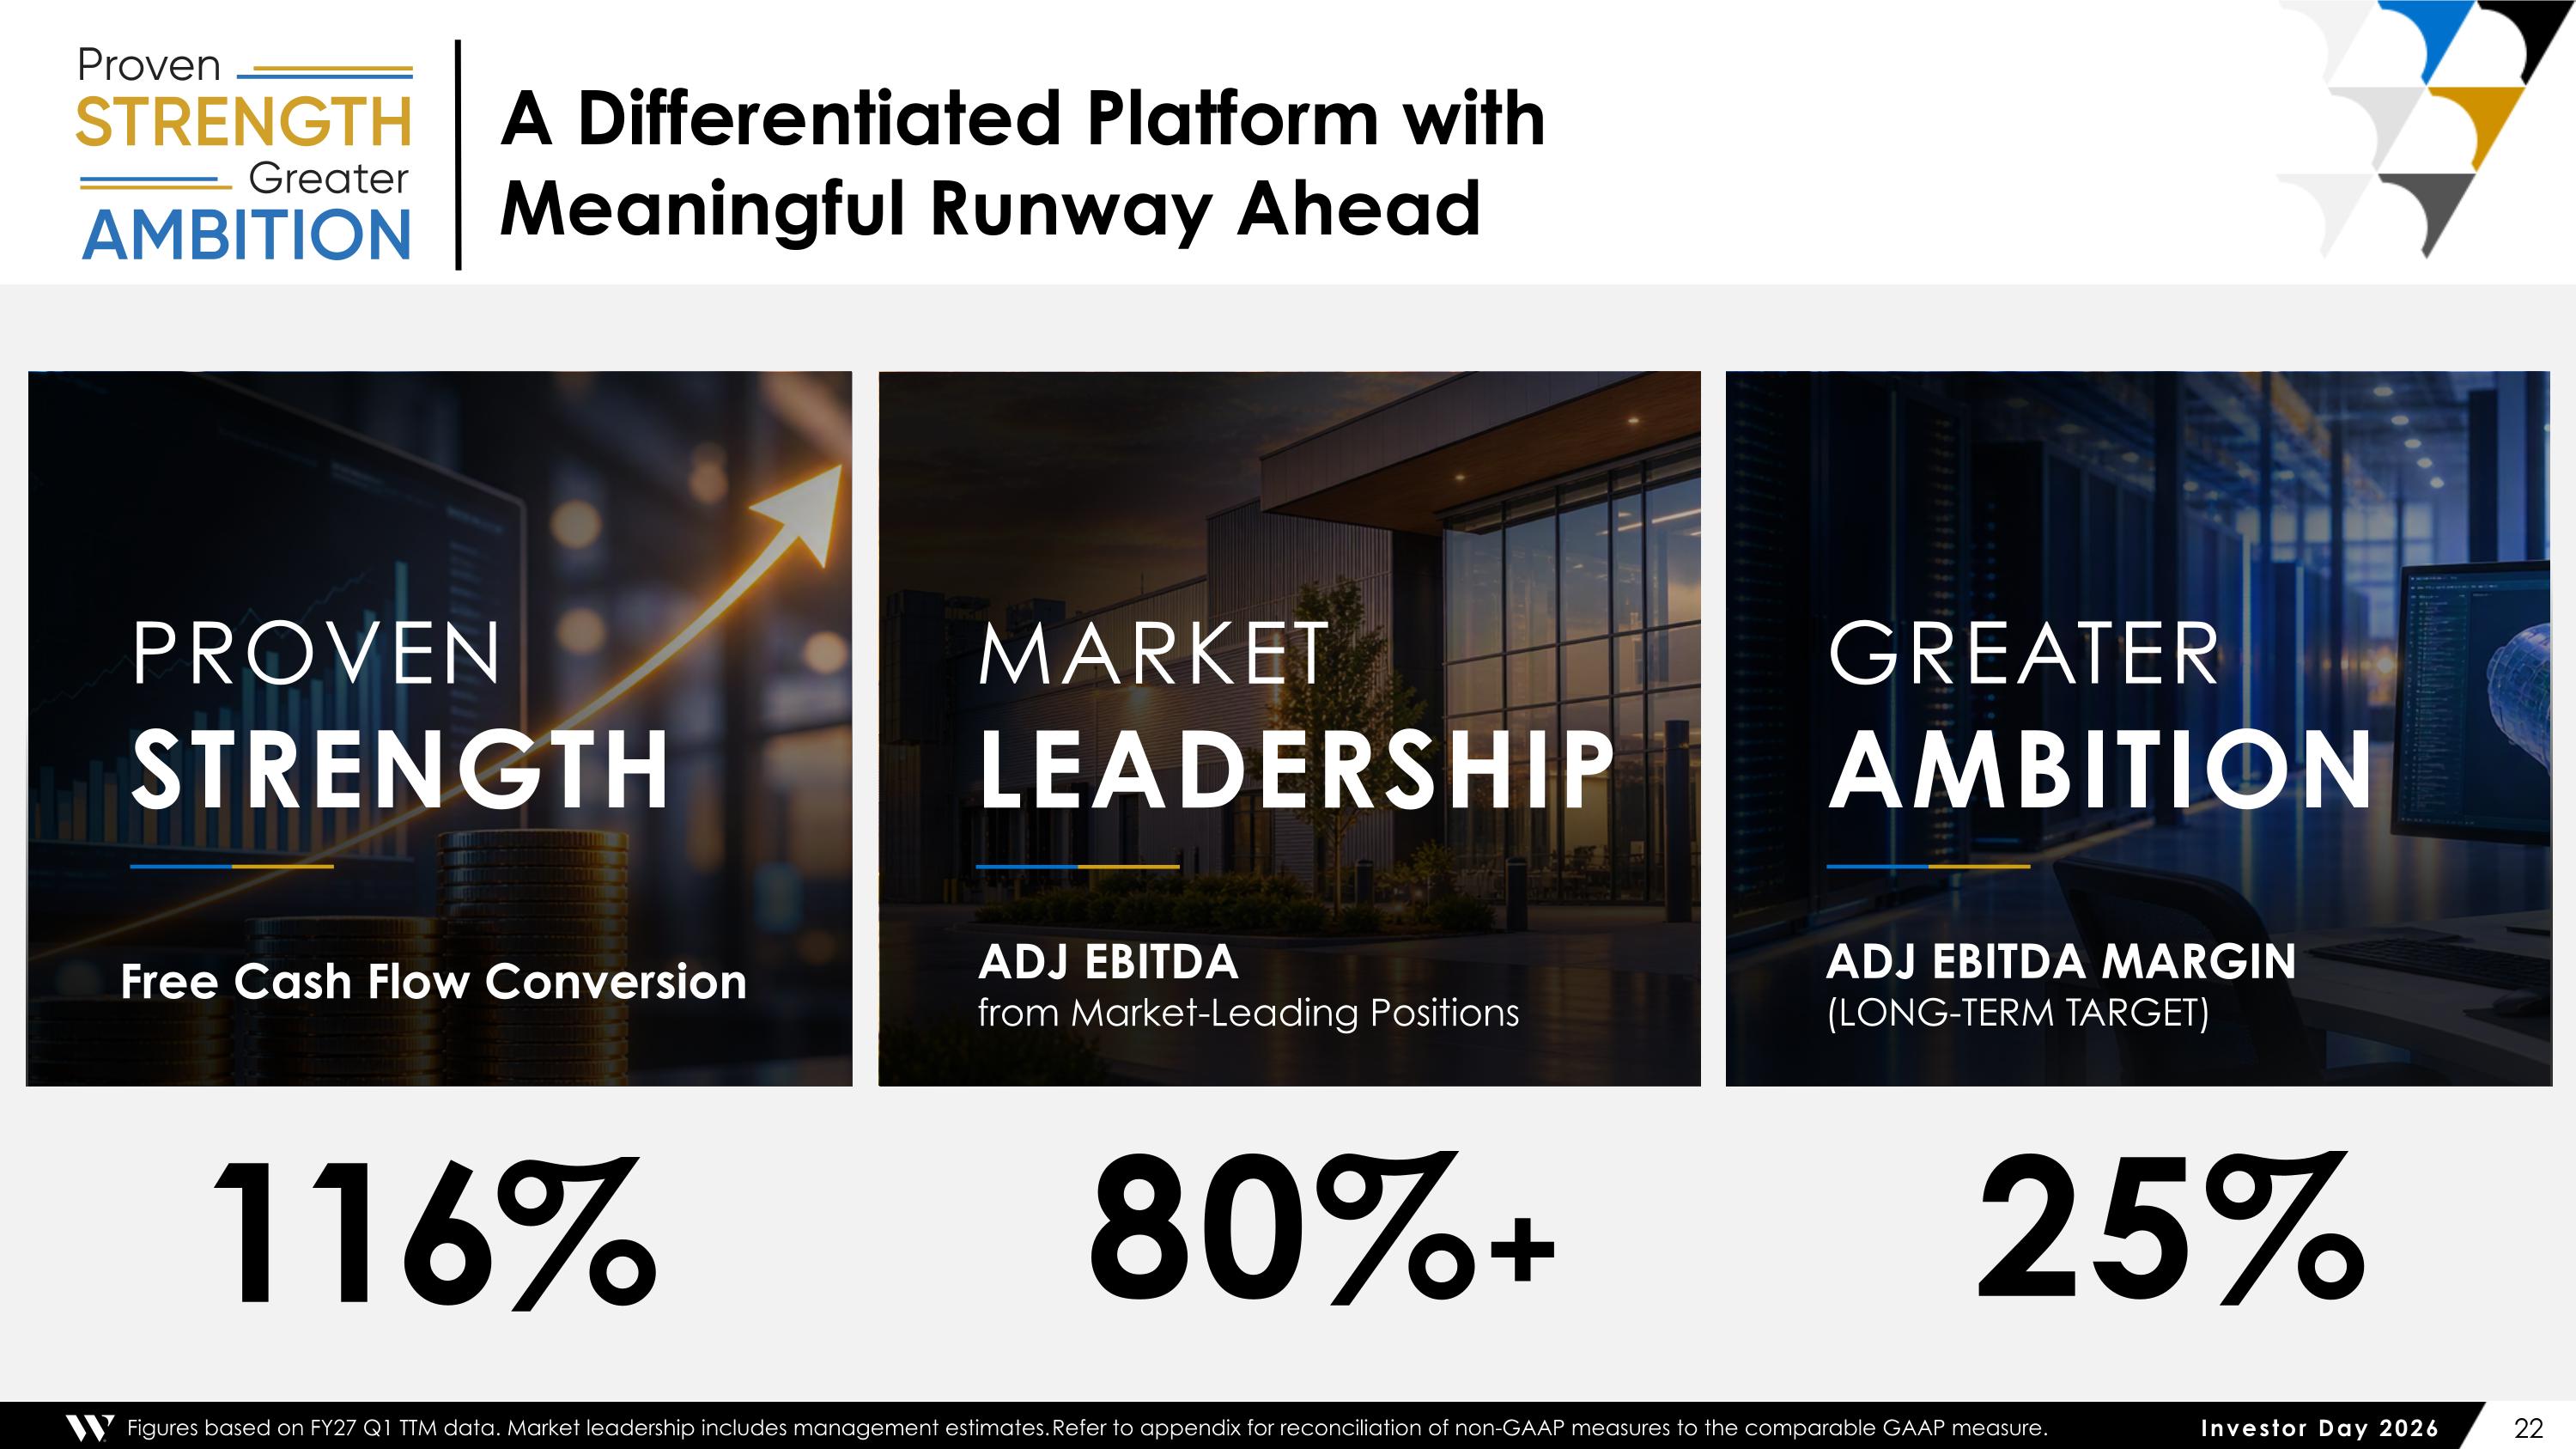
MARKET LEADERSHIP ADJ EBITDA from Market-Leading Positions A Differentiated Platform with Meaningful Runway Ahead PROVEN STRENGTH Free Cash Flow Conversion GREATER AMBITION ADJ EBITDA MARGIN (LONG-TERM TARGET) Figures based on FY27 Q1 TTM data. Market leadership includes management estimates. Refer to appendix for reconciliation of non-GAAP measures to the comparable GAAP measure. 116% 80%+ 25%

Building Performance Solutions
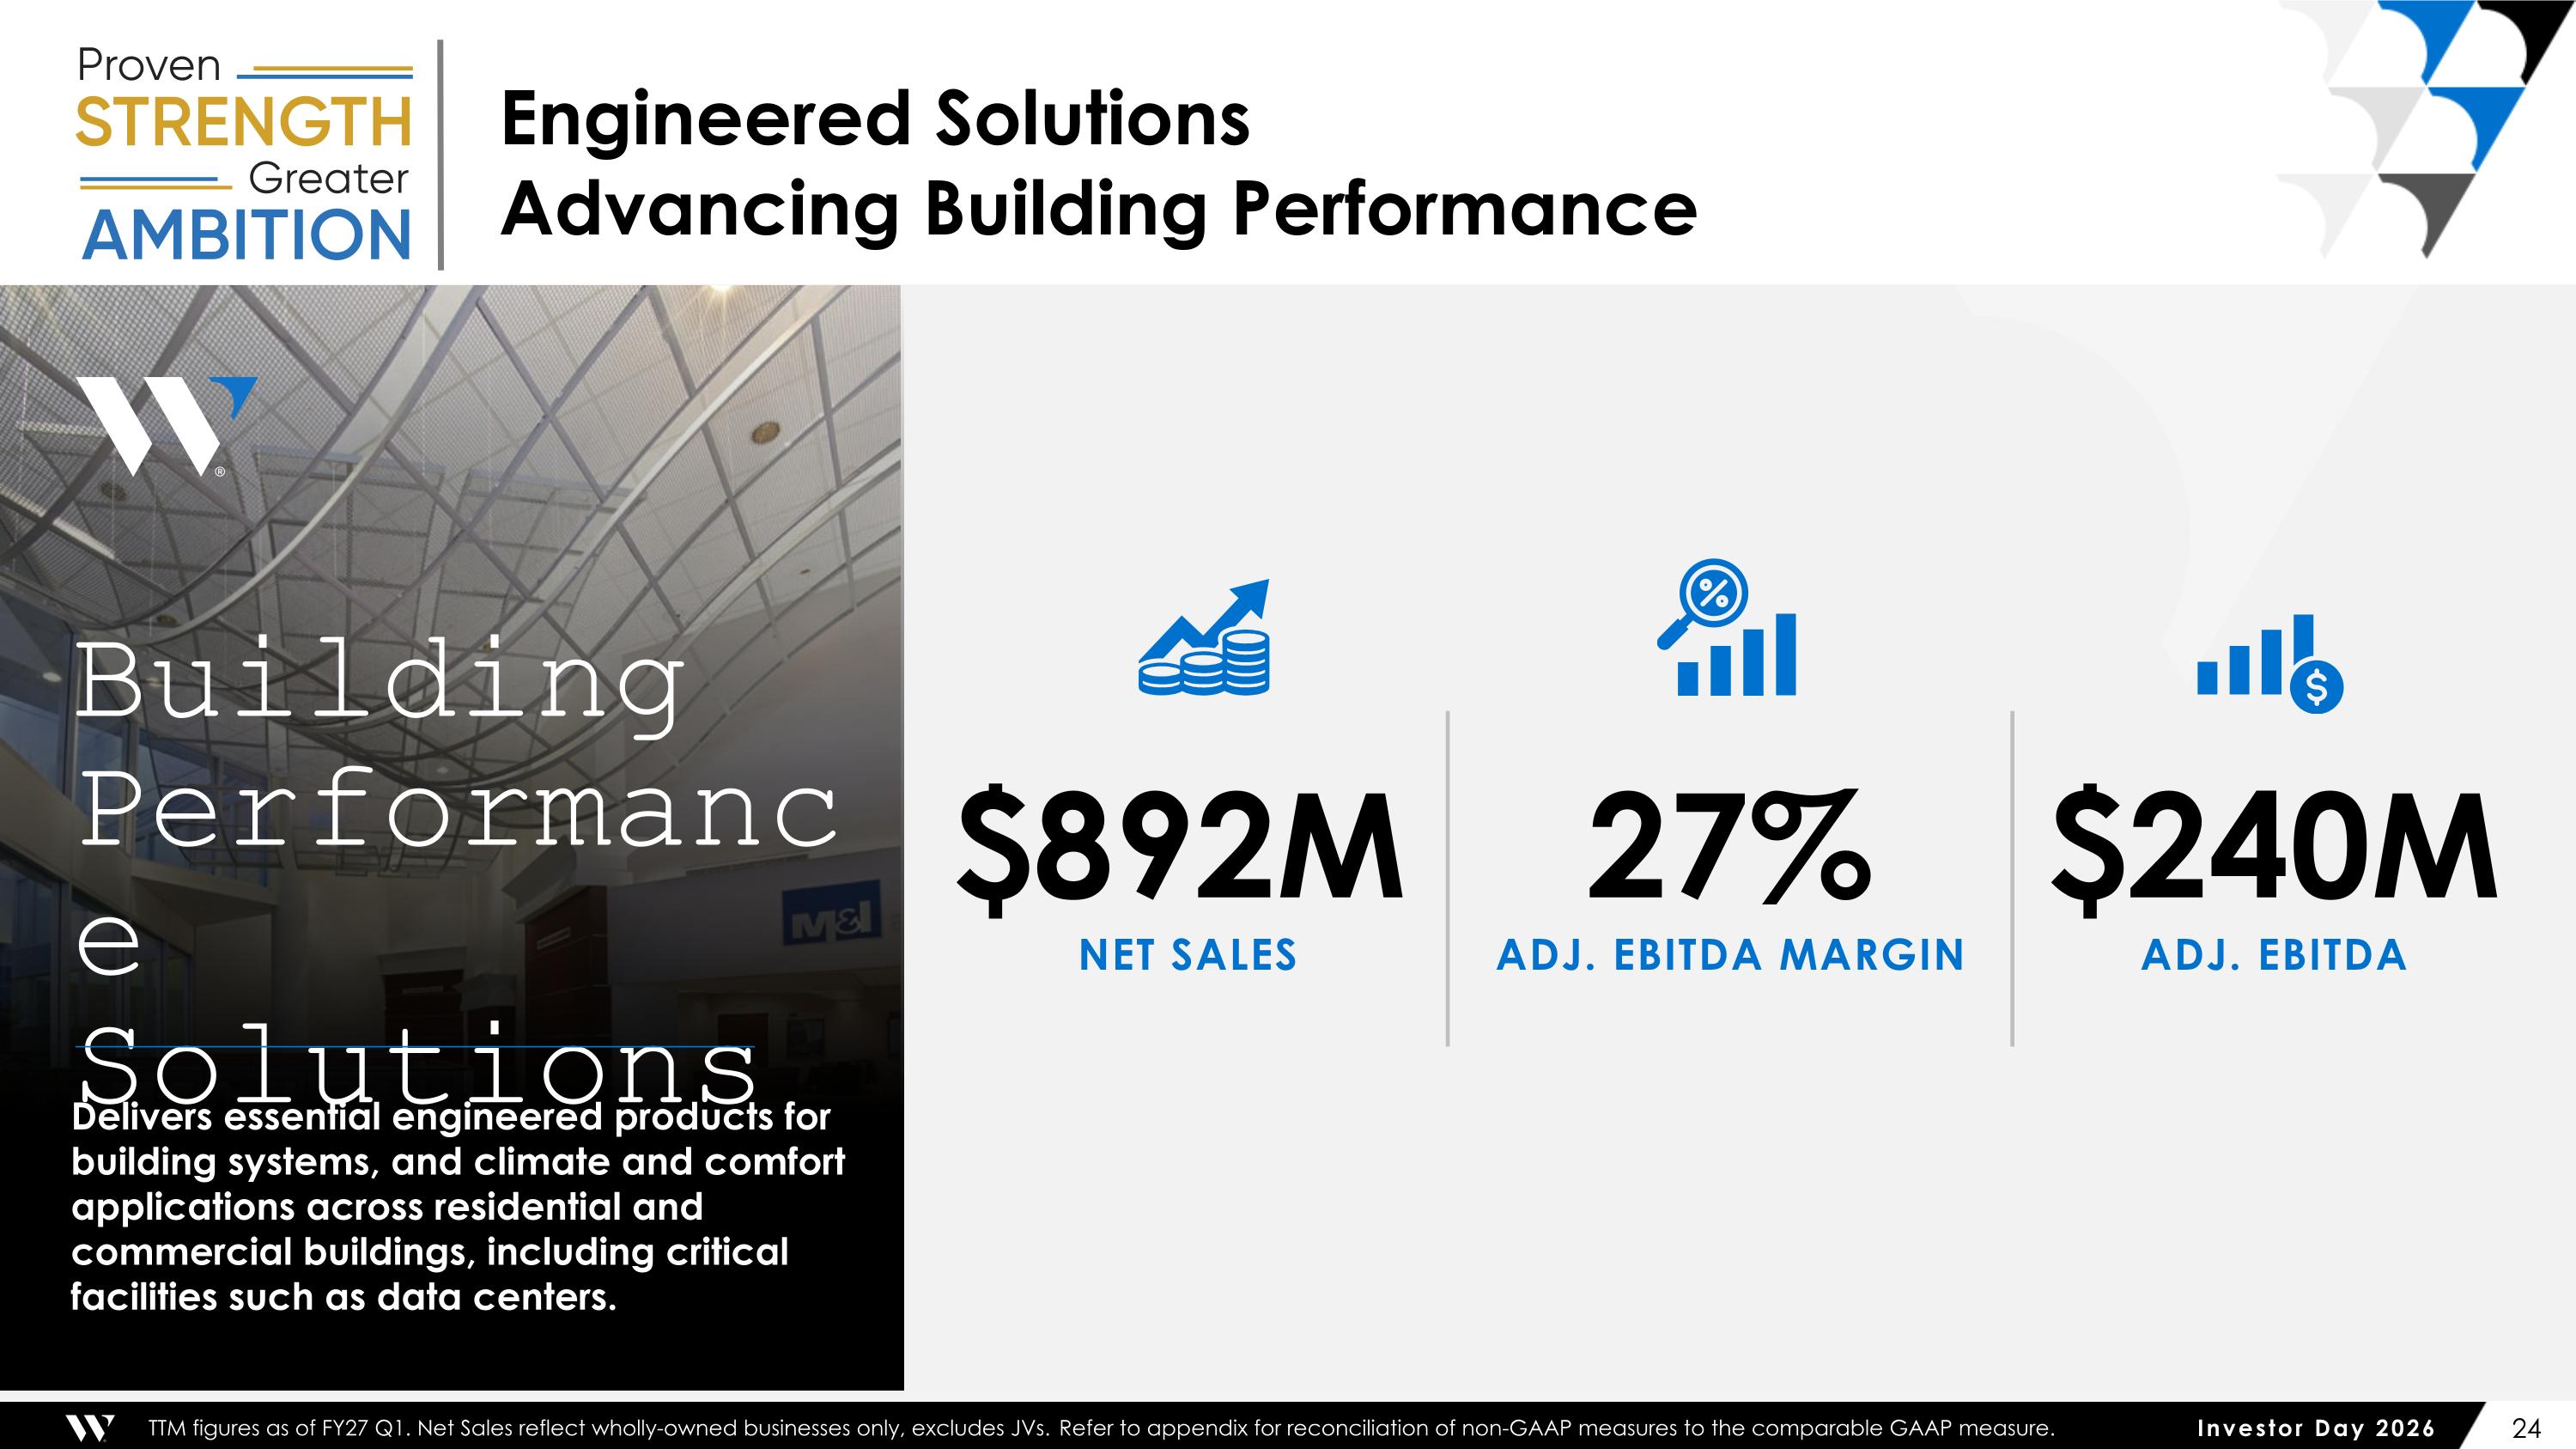
Engineered Solutions Advancing Building Performance TTM figures as of FY27 Q1. Net Sales reflect wholly-owned businesses only, excludes JVs. Refer to appendix for reconciliation of non-GAAP measures to the comparable GAAP measure. 27% ADJ. EBITDA MARGIN $240M ADJ. EBITDA $892M NET SALES Building Performance Solutions Delivers essential engineered products for building systems, and climate and comfort applications across residential and commercial buildings, including critical facilities such as data centers.
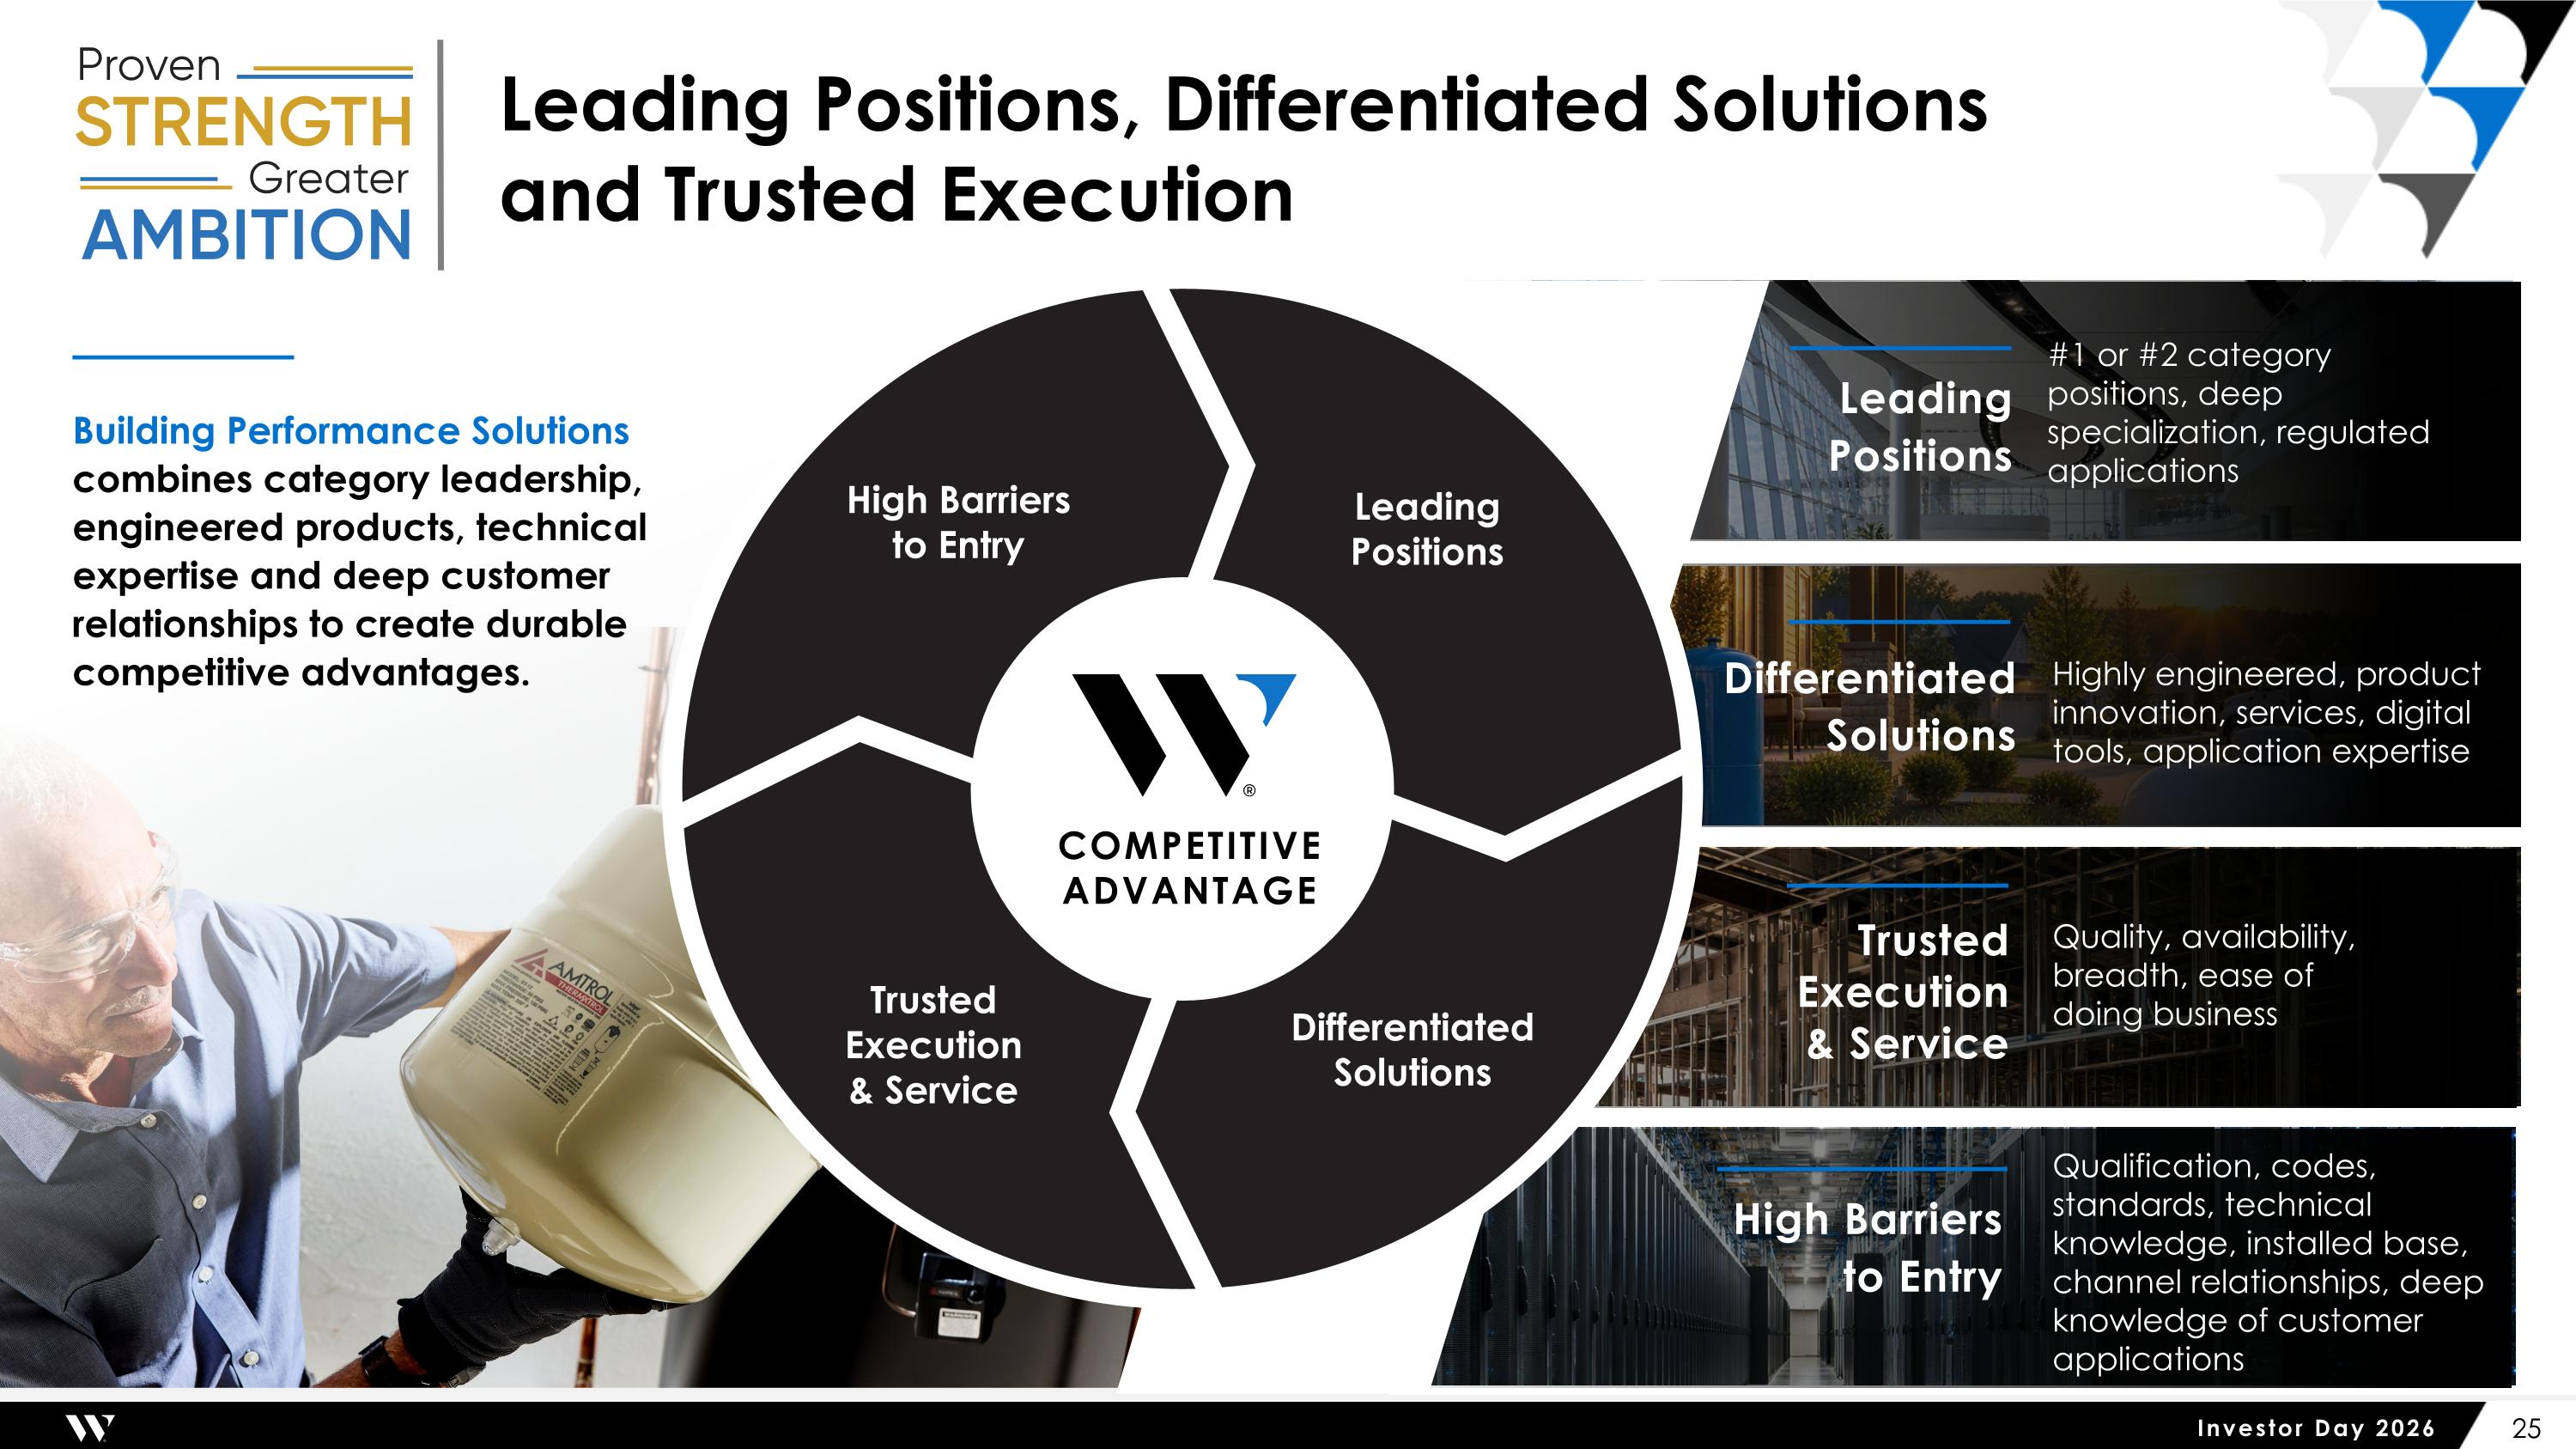
Leading Positions, Differentiated Solutions and Trusted Execution Leading Positions Differentiated Solutions Building Performance Solutions combines category leadership, engineered products, technical expertise and deep customer relationships to create durable competitive advantages. High Barriers to Entry Leading Positions COMPETITIVE ADVANTAGE Trusted Execution & Service Differentiated Solutions #1 or #2 category positions, deep specialization, regulated applications Highly engineered, product innovation, services, digital tools, application expertise Trusted Execution & Service Quality, availability, breadth, ease of doing business High Barriers to Entry Qualification, codes, standards, technical knowledge, installed base, channel relationships, deep knowledge of customer applications
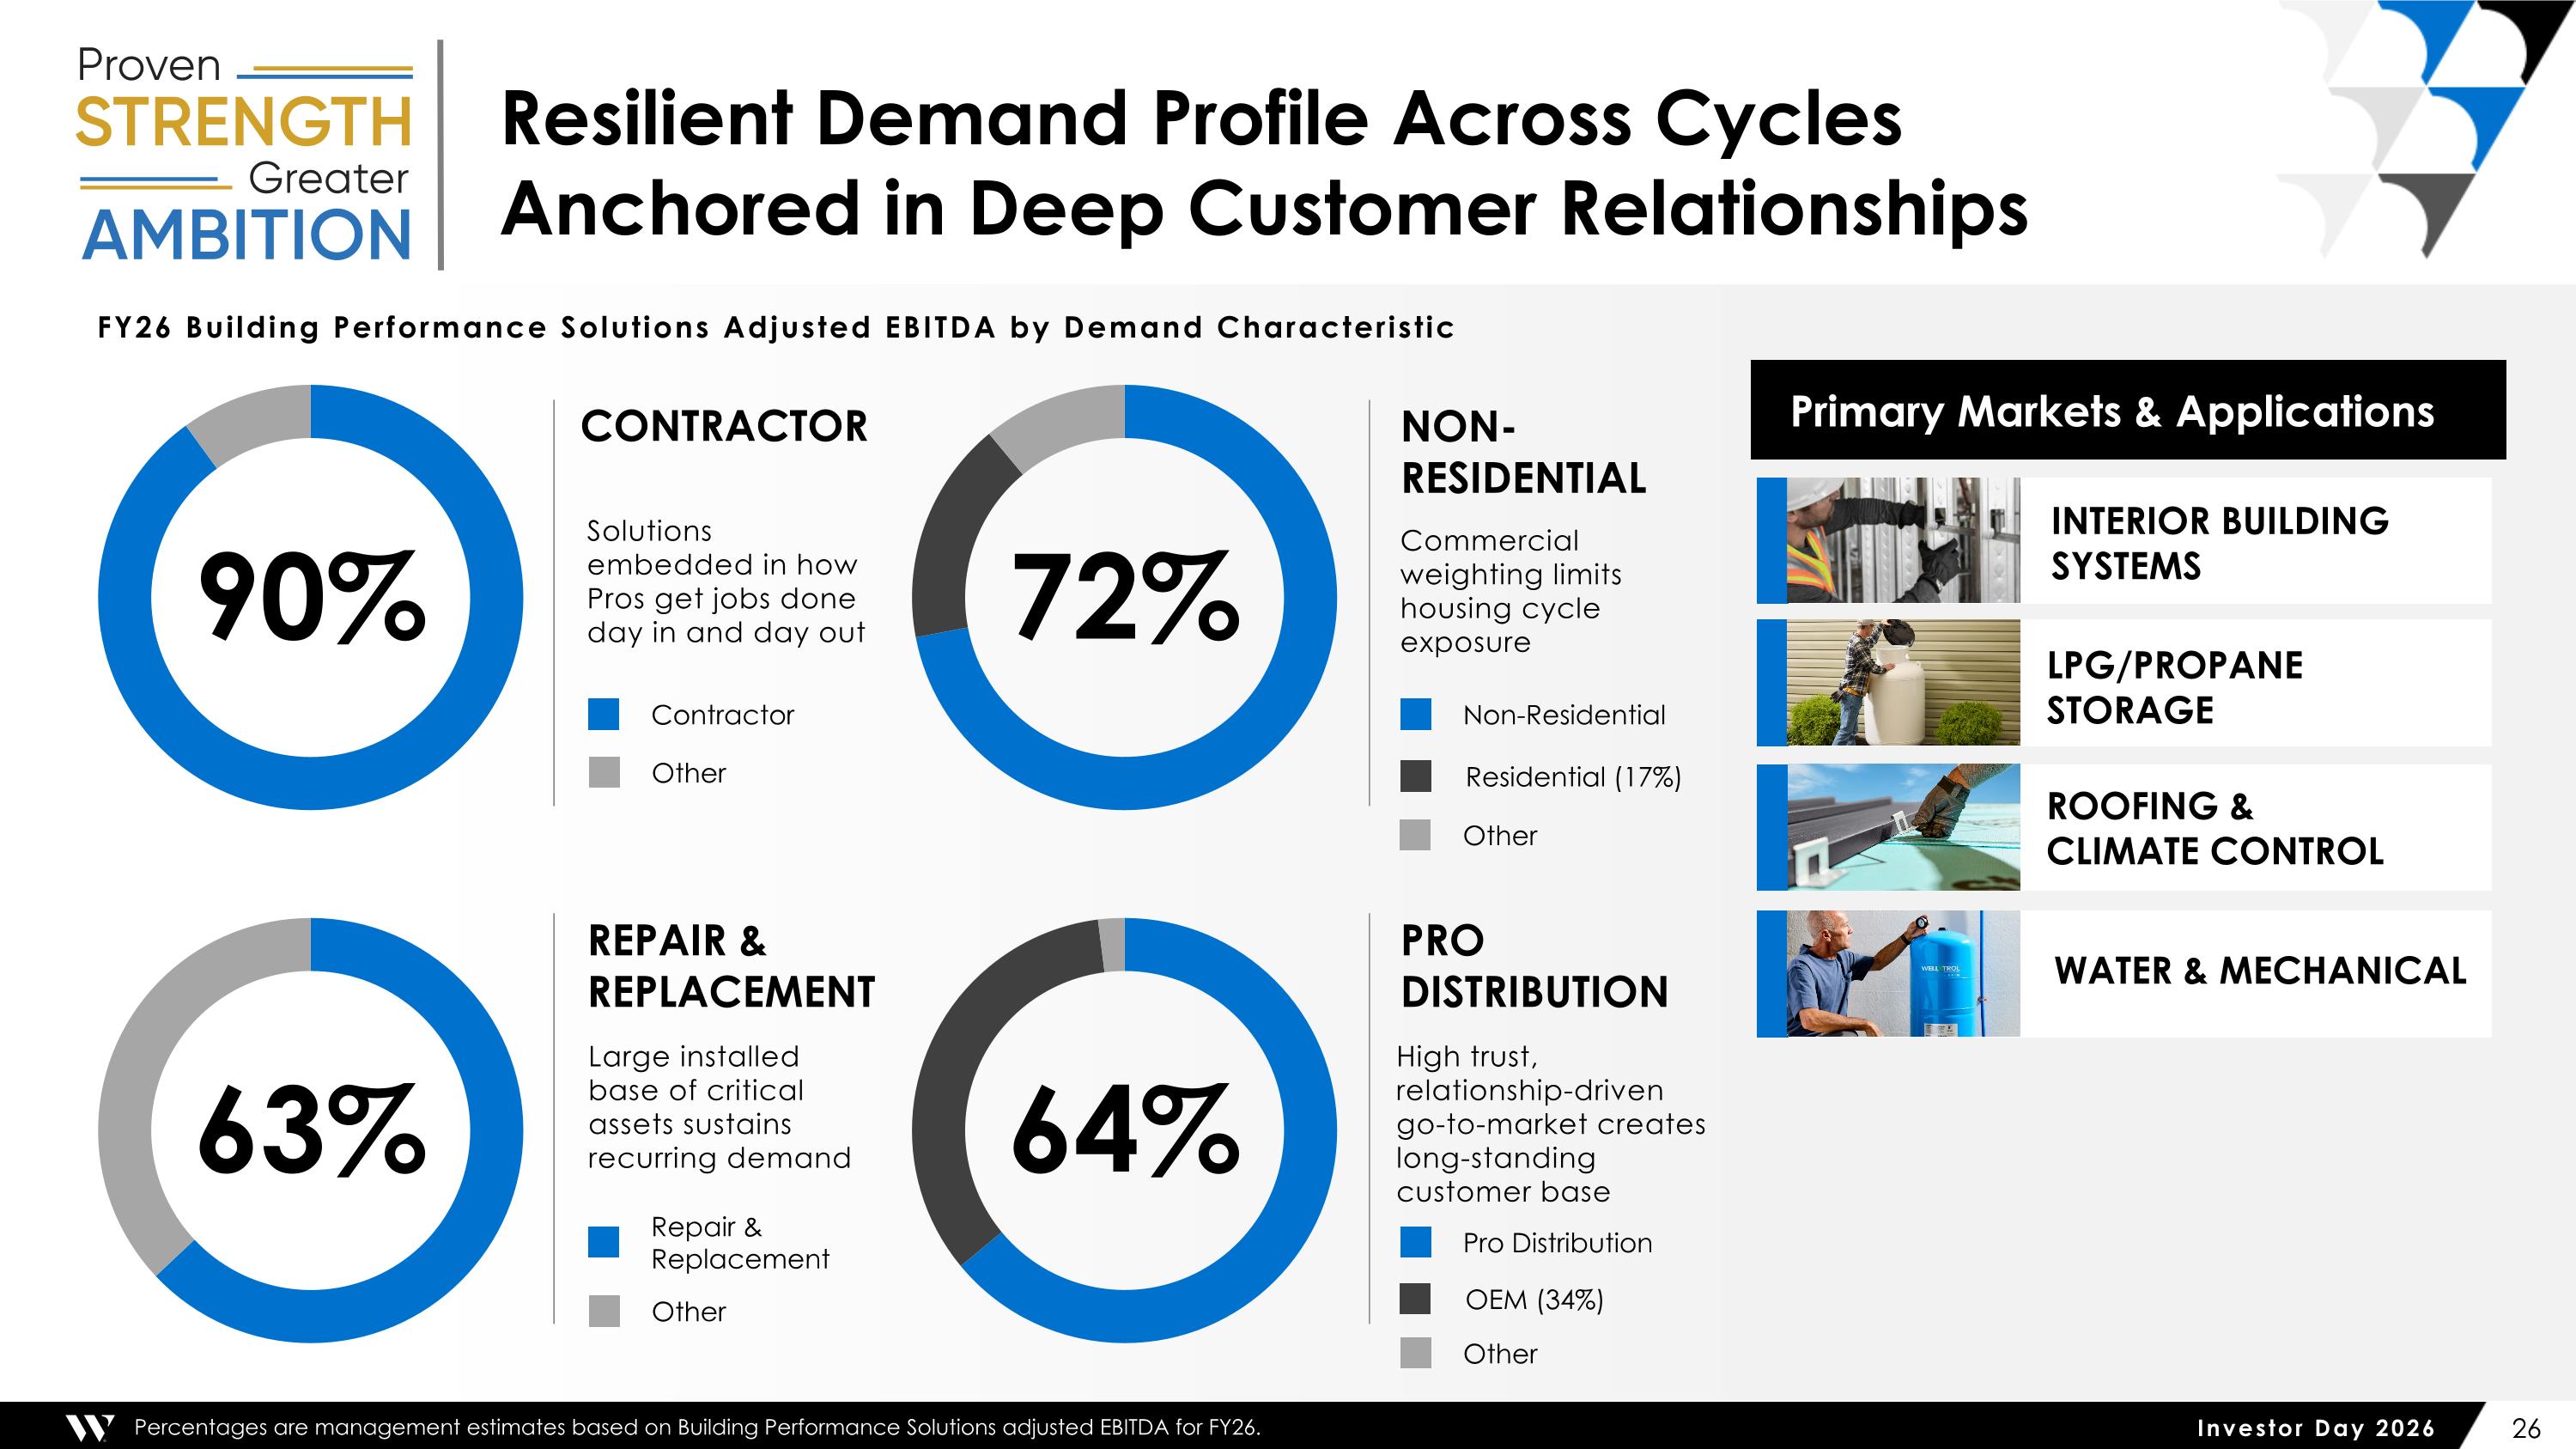
Resilient Demand Profile Across Cycles Anchored in Deep Customer Relationships NON-RESIDENTIAL 72% CONTRACTOR Solutions embedded in how Pros get jobs done day in and day out 90% PRO DISTRIBUTION 64% REPAIR & REPLACEMENT High trust, relationship-driven go-to-market creates long-standing customer base Large installed base of critical assets sustains recurring demand 63% Primary Markets & Applications Percentages are management estimates based on Building Performance Solutions adjusted EBITDA for FY26. Commercial weighting limits housing cycle exposure Water & mechanical Roofing & climate control Interior building Systems LPG/PROPANE storage FY26 Building Performance Solutions Adjusted EBITDA by Demand Characteristic Non-Residential Residential (17%) Contractor Repair & Replacement Pro Distribution OEM (34%) Other Other Other Other
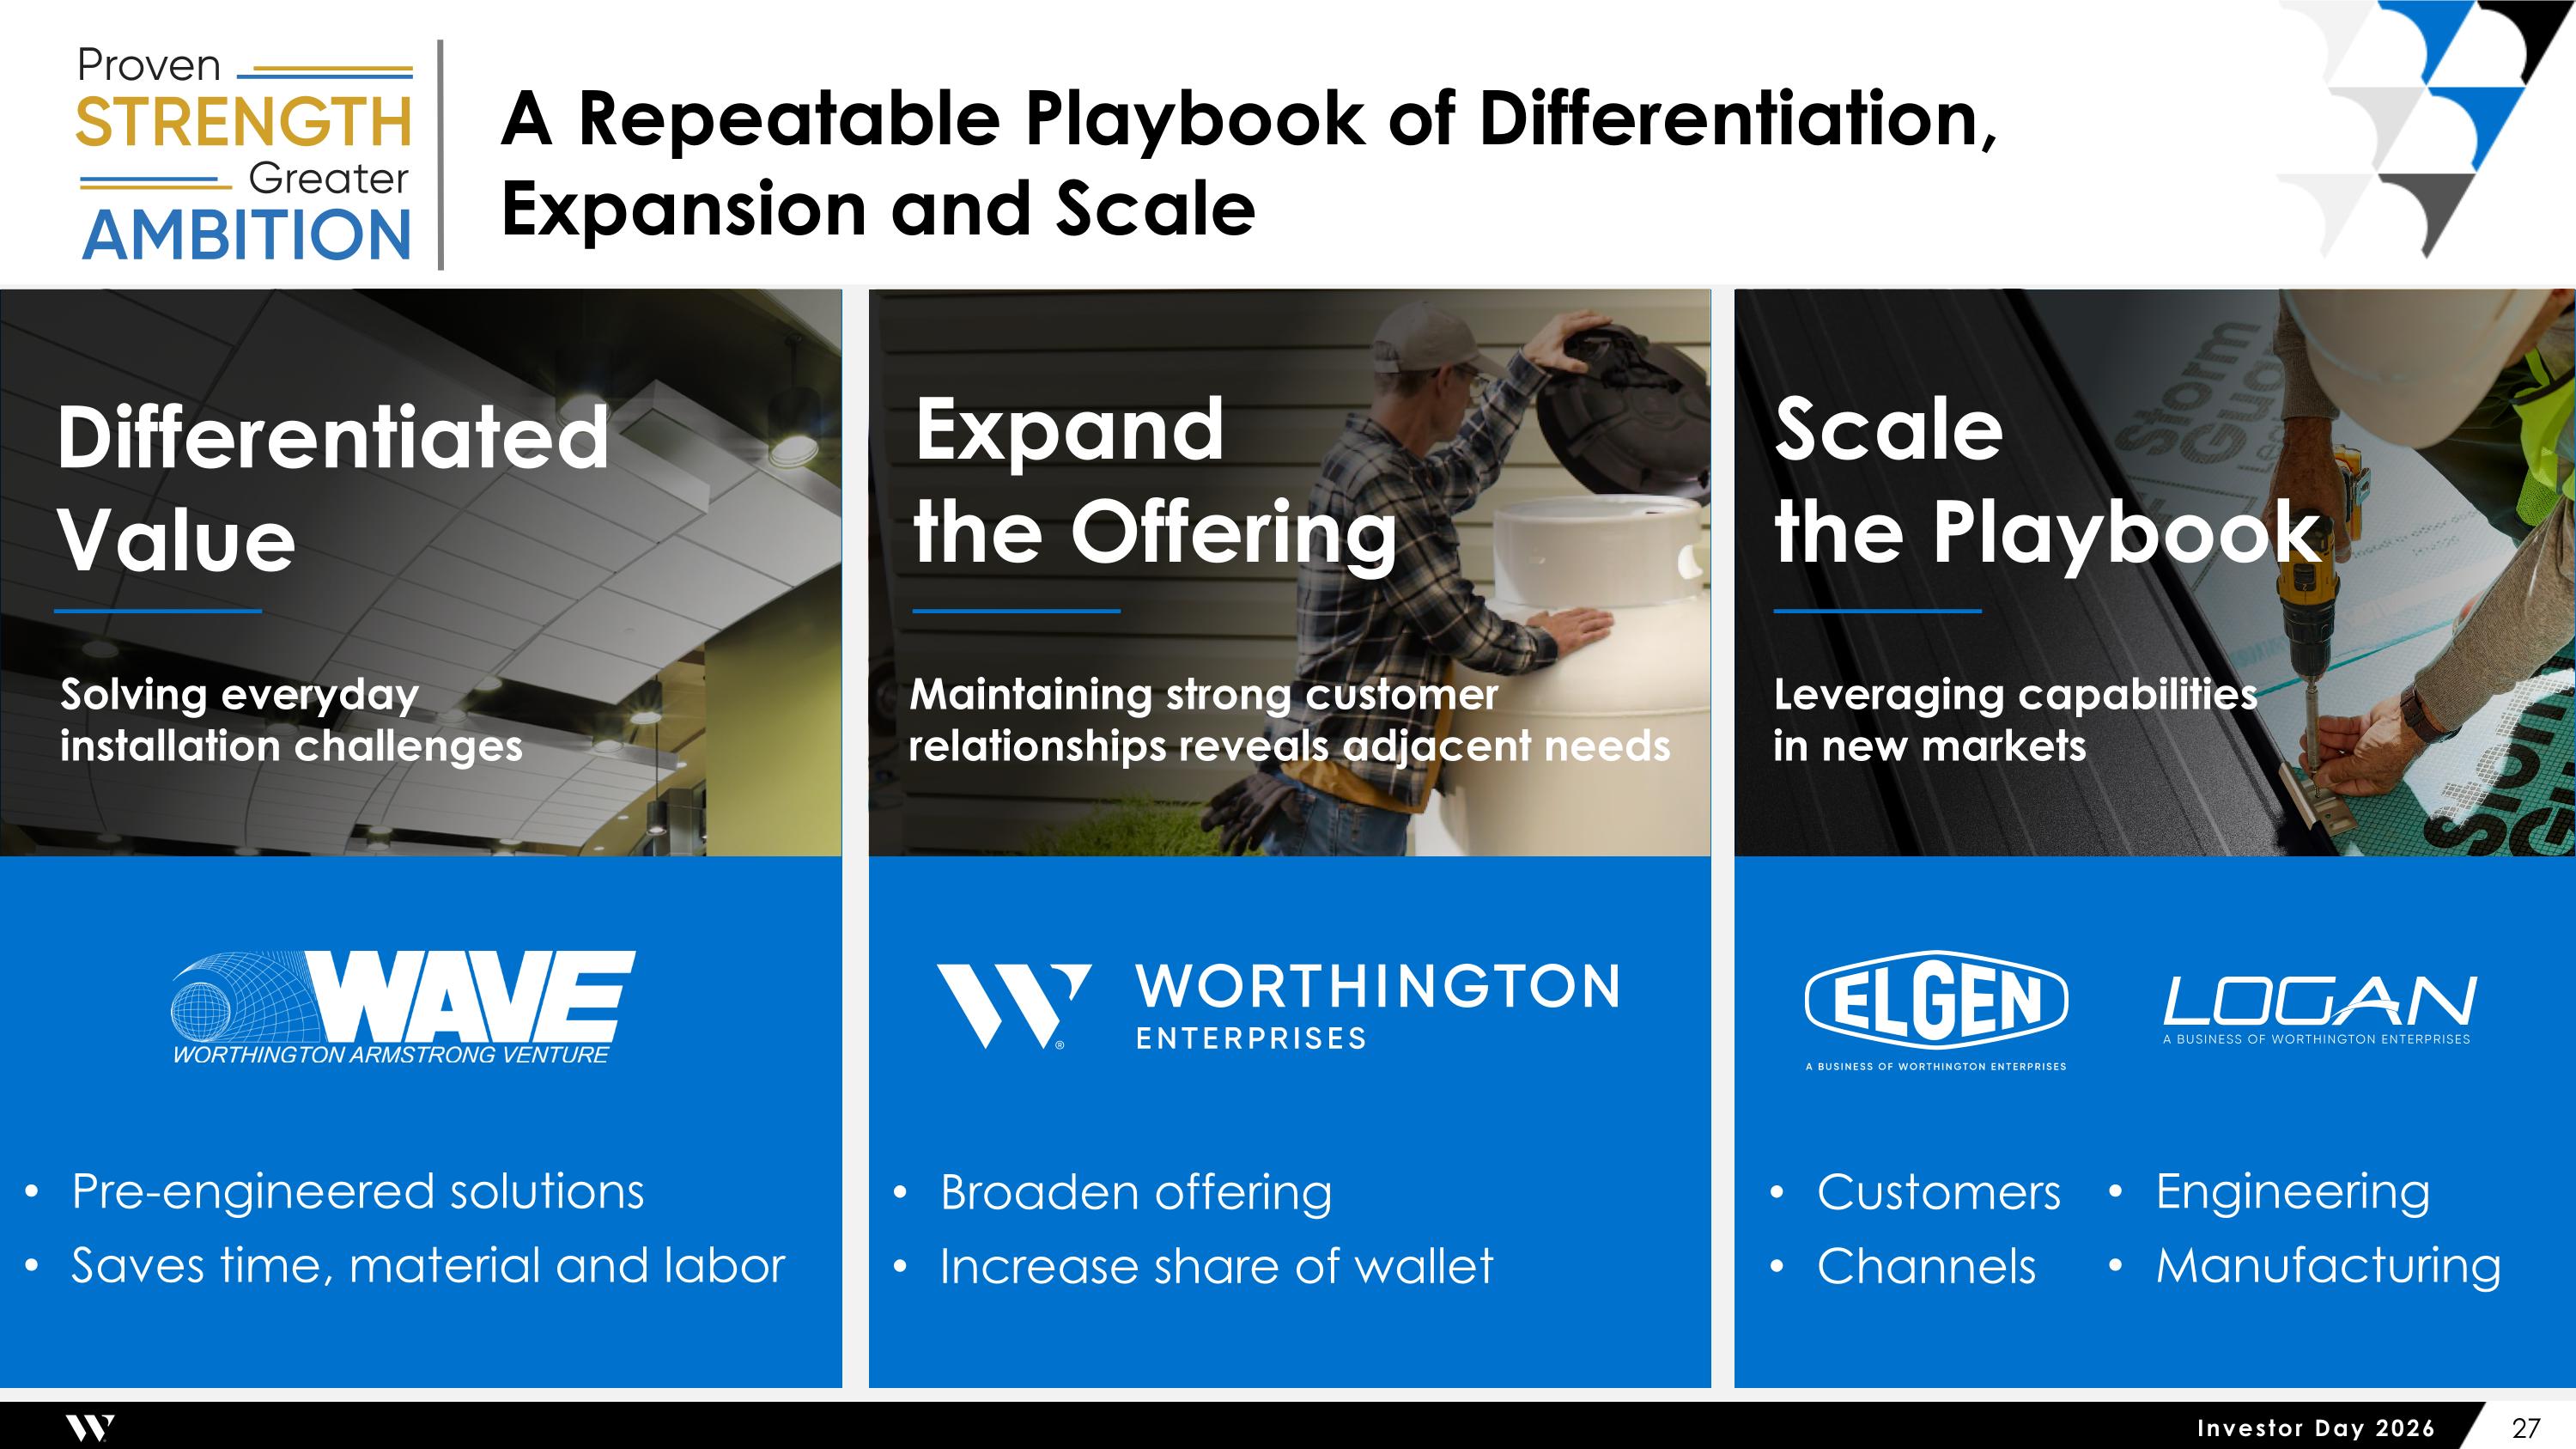
A Repeatable Playbook of Differentiation, Expansion and Scale Differentiated Value Expand the Offering Broaden offering Increase share of wallet Customers Channels Engineering Manufacturing Solving everyday installation challenges Maintaining strong customer relationships reveals adjacent needs Leveraging capabilities in new markets Scale the Playbook Pre-engineered solutions Saves time, material and labor
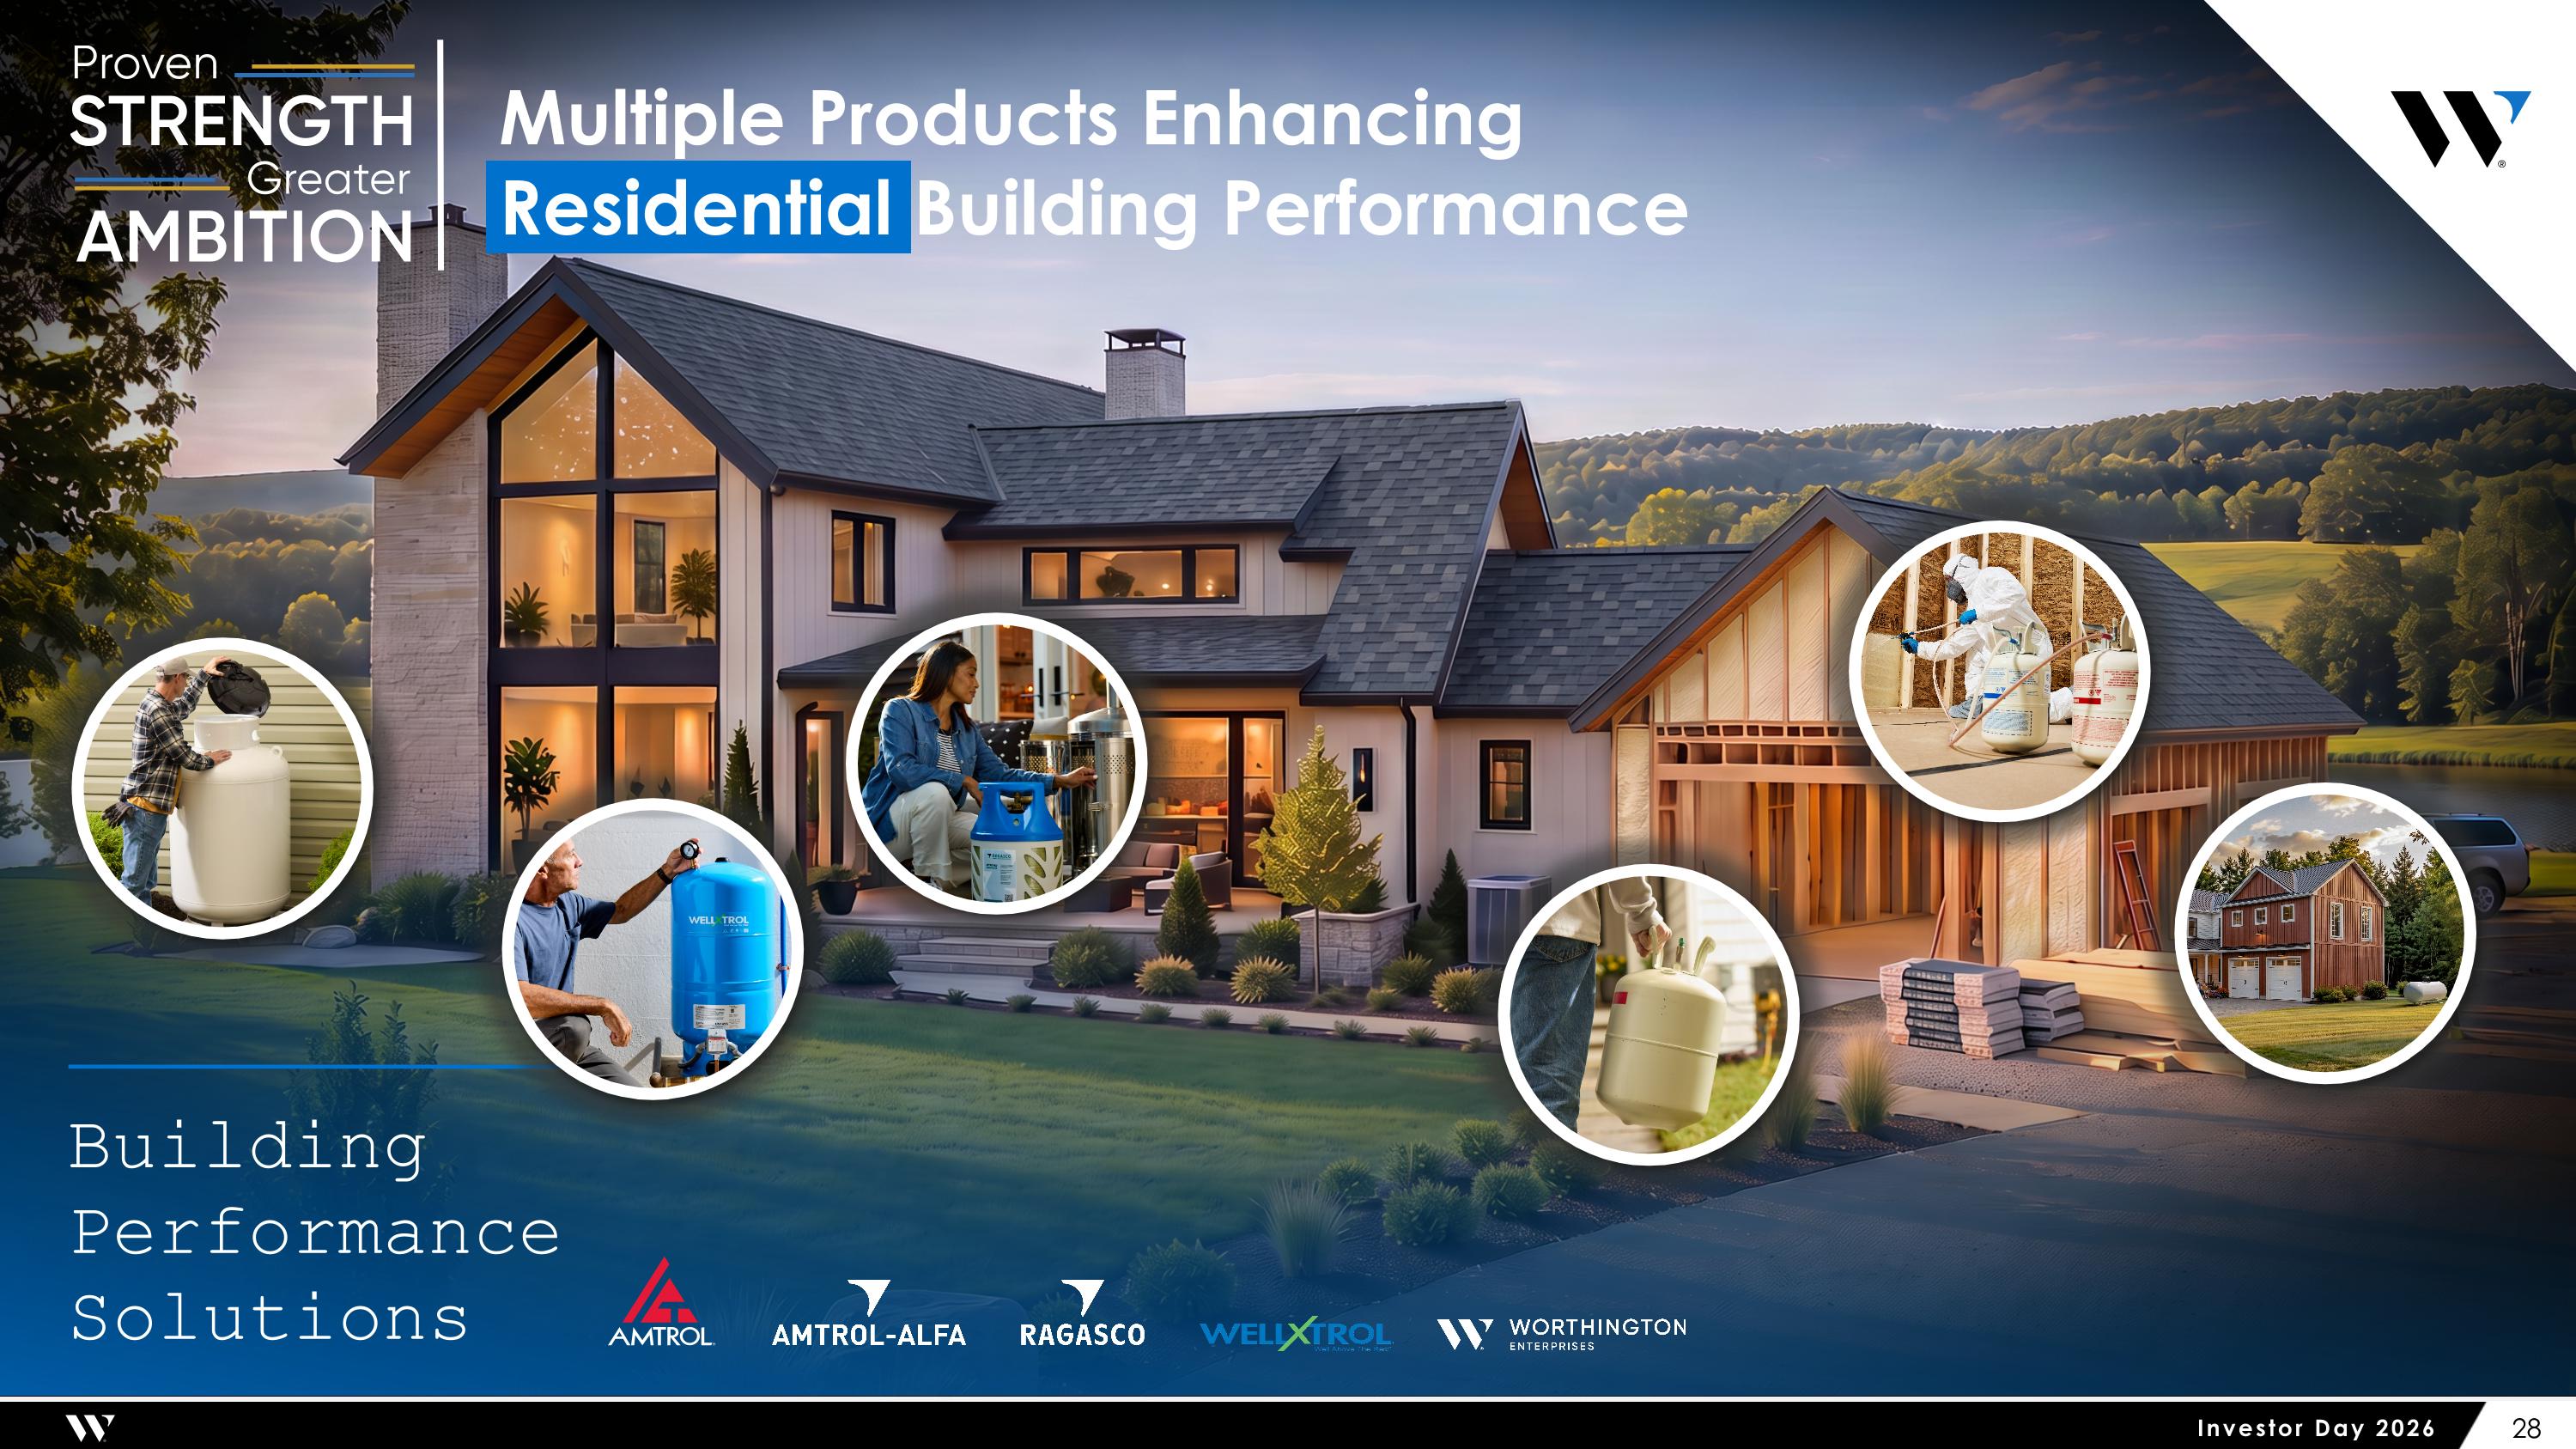
Multiple Products Enhancing Residential Building Performance Building Performance Solutions
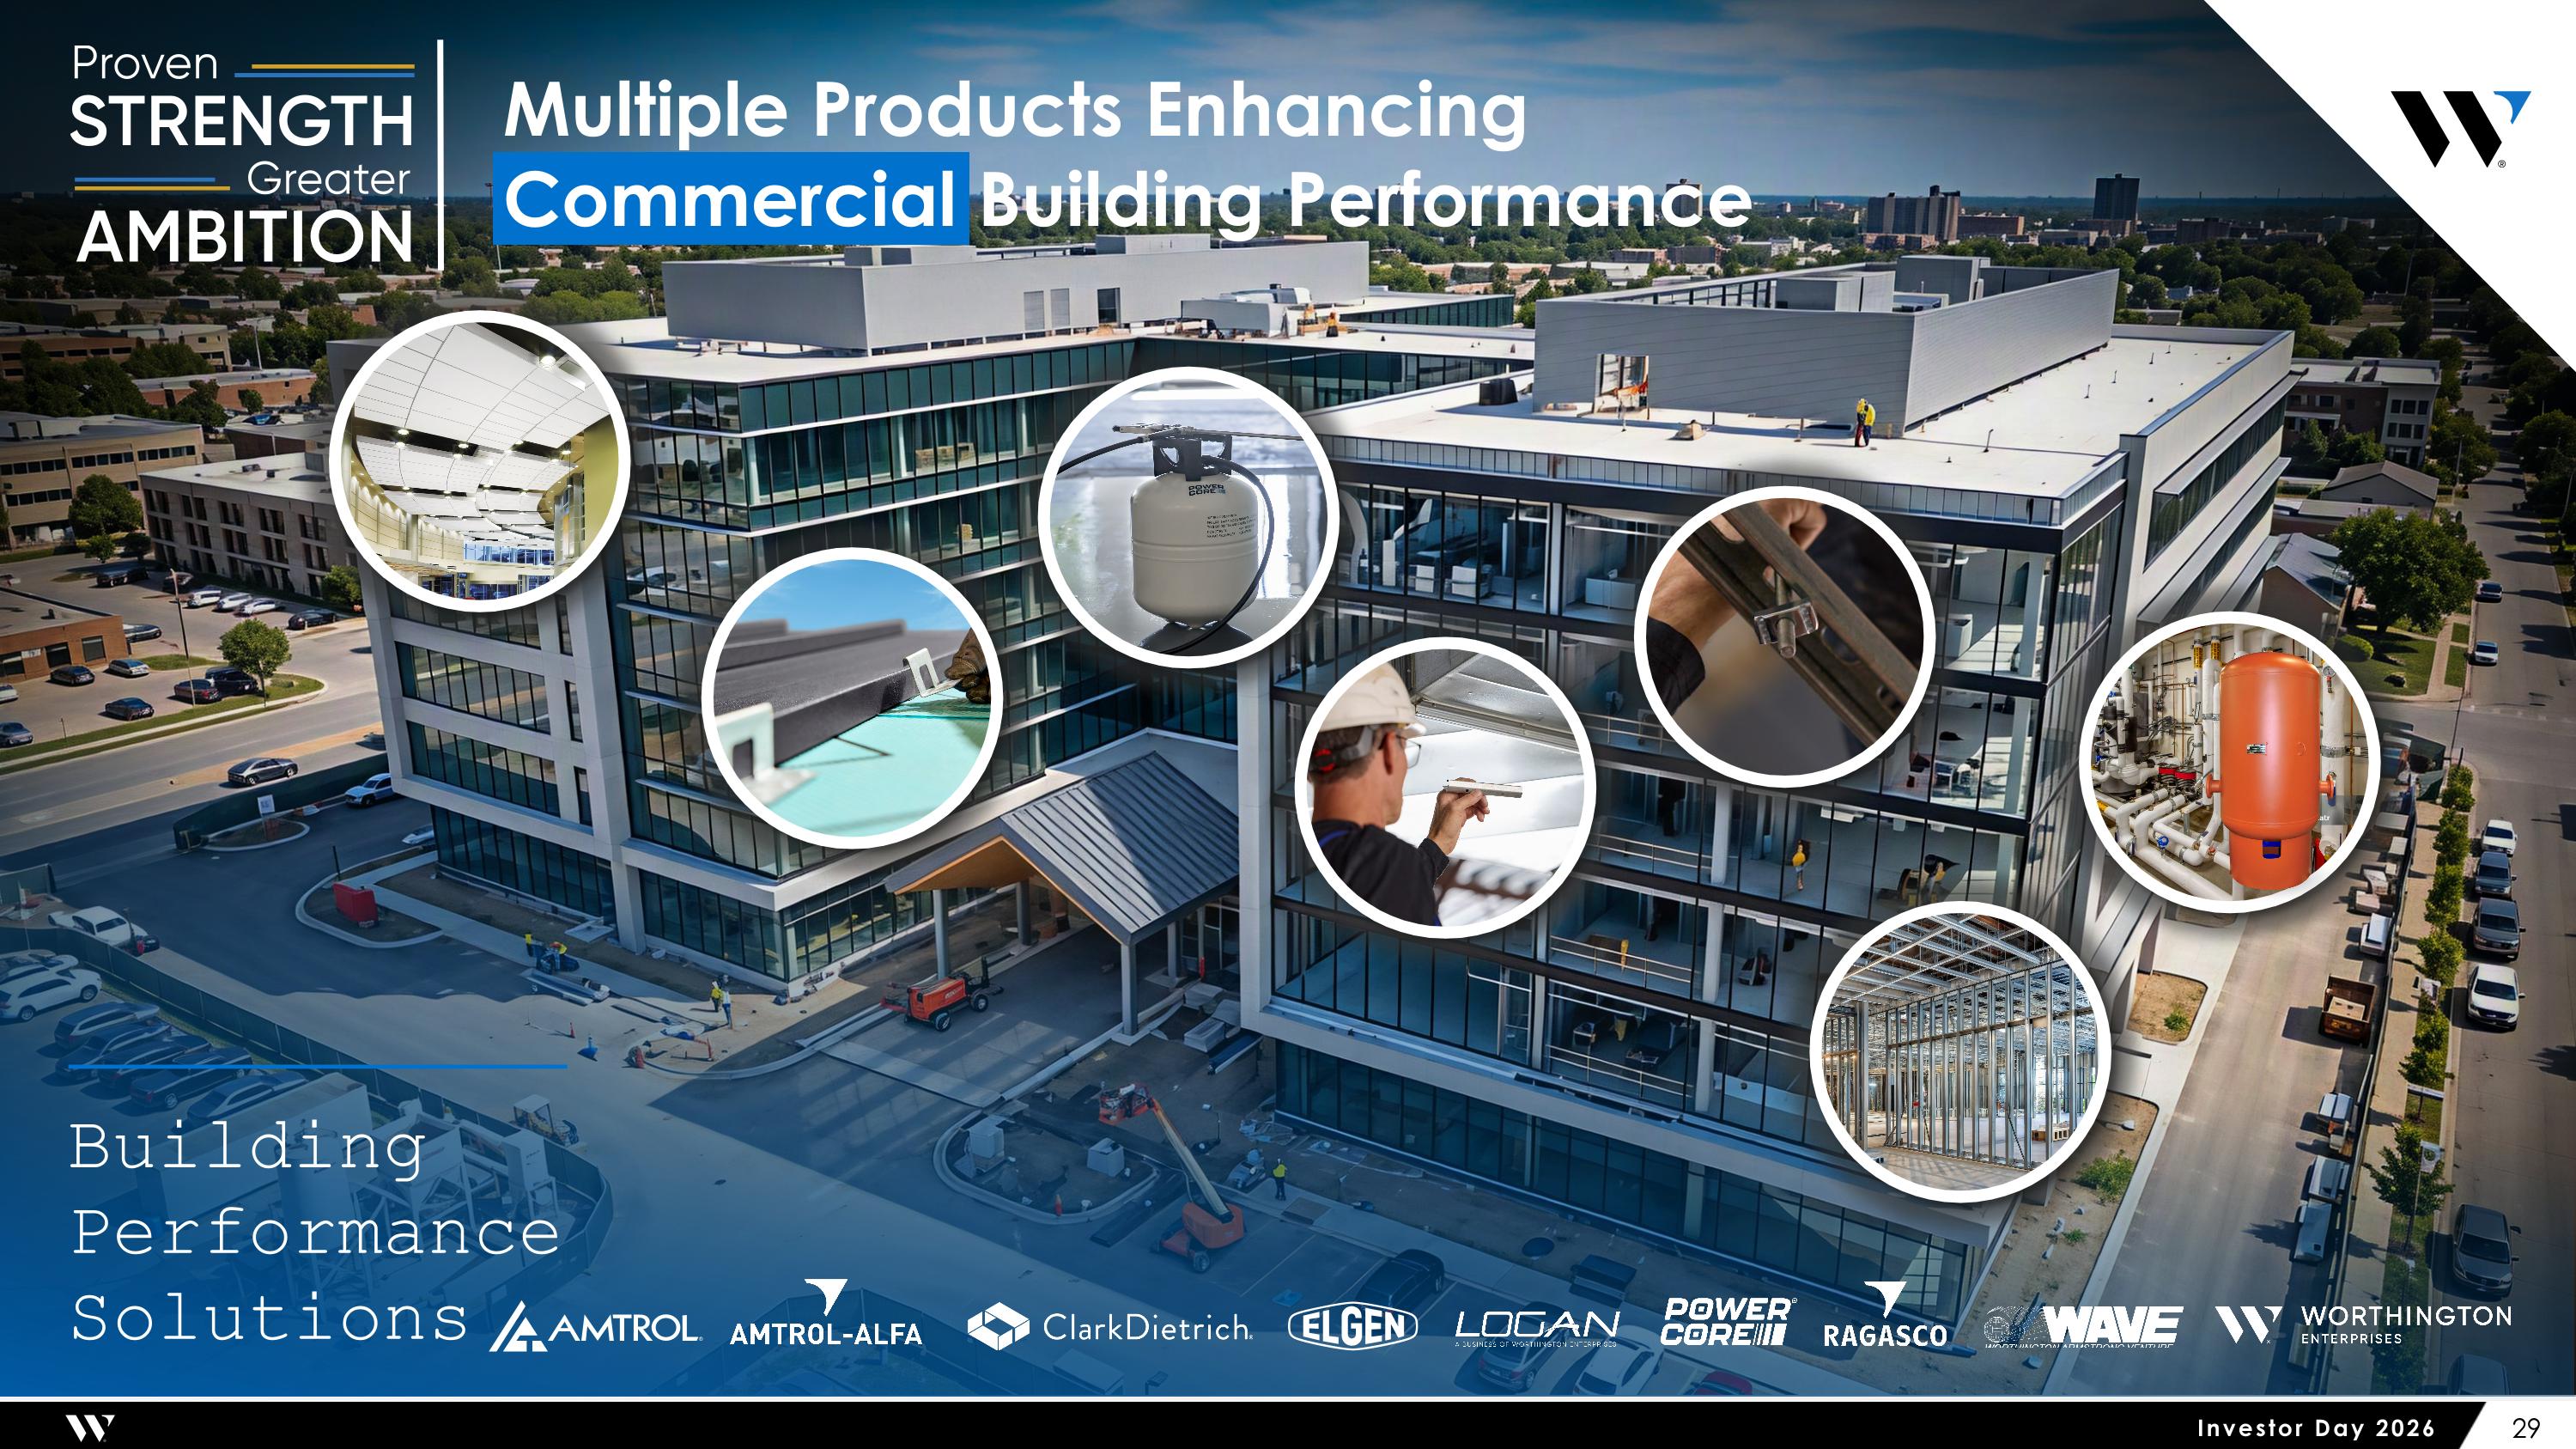
Multiple Products Enhancing Commercial Building Performance Building Performance Solutions
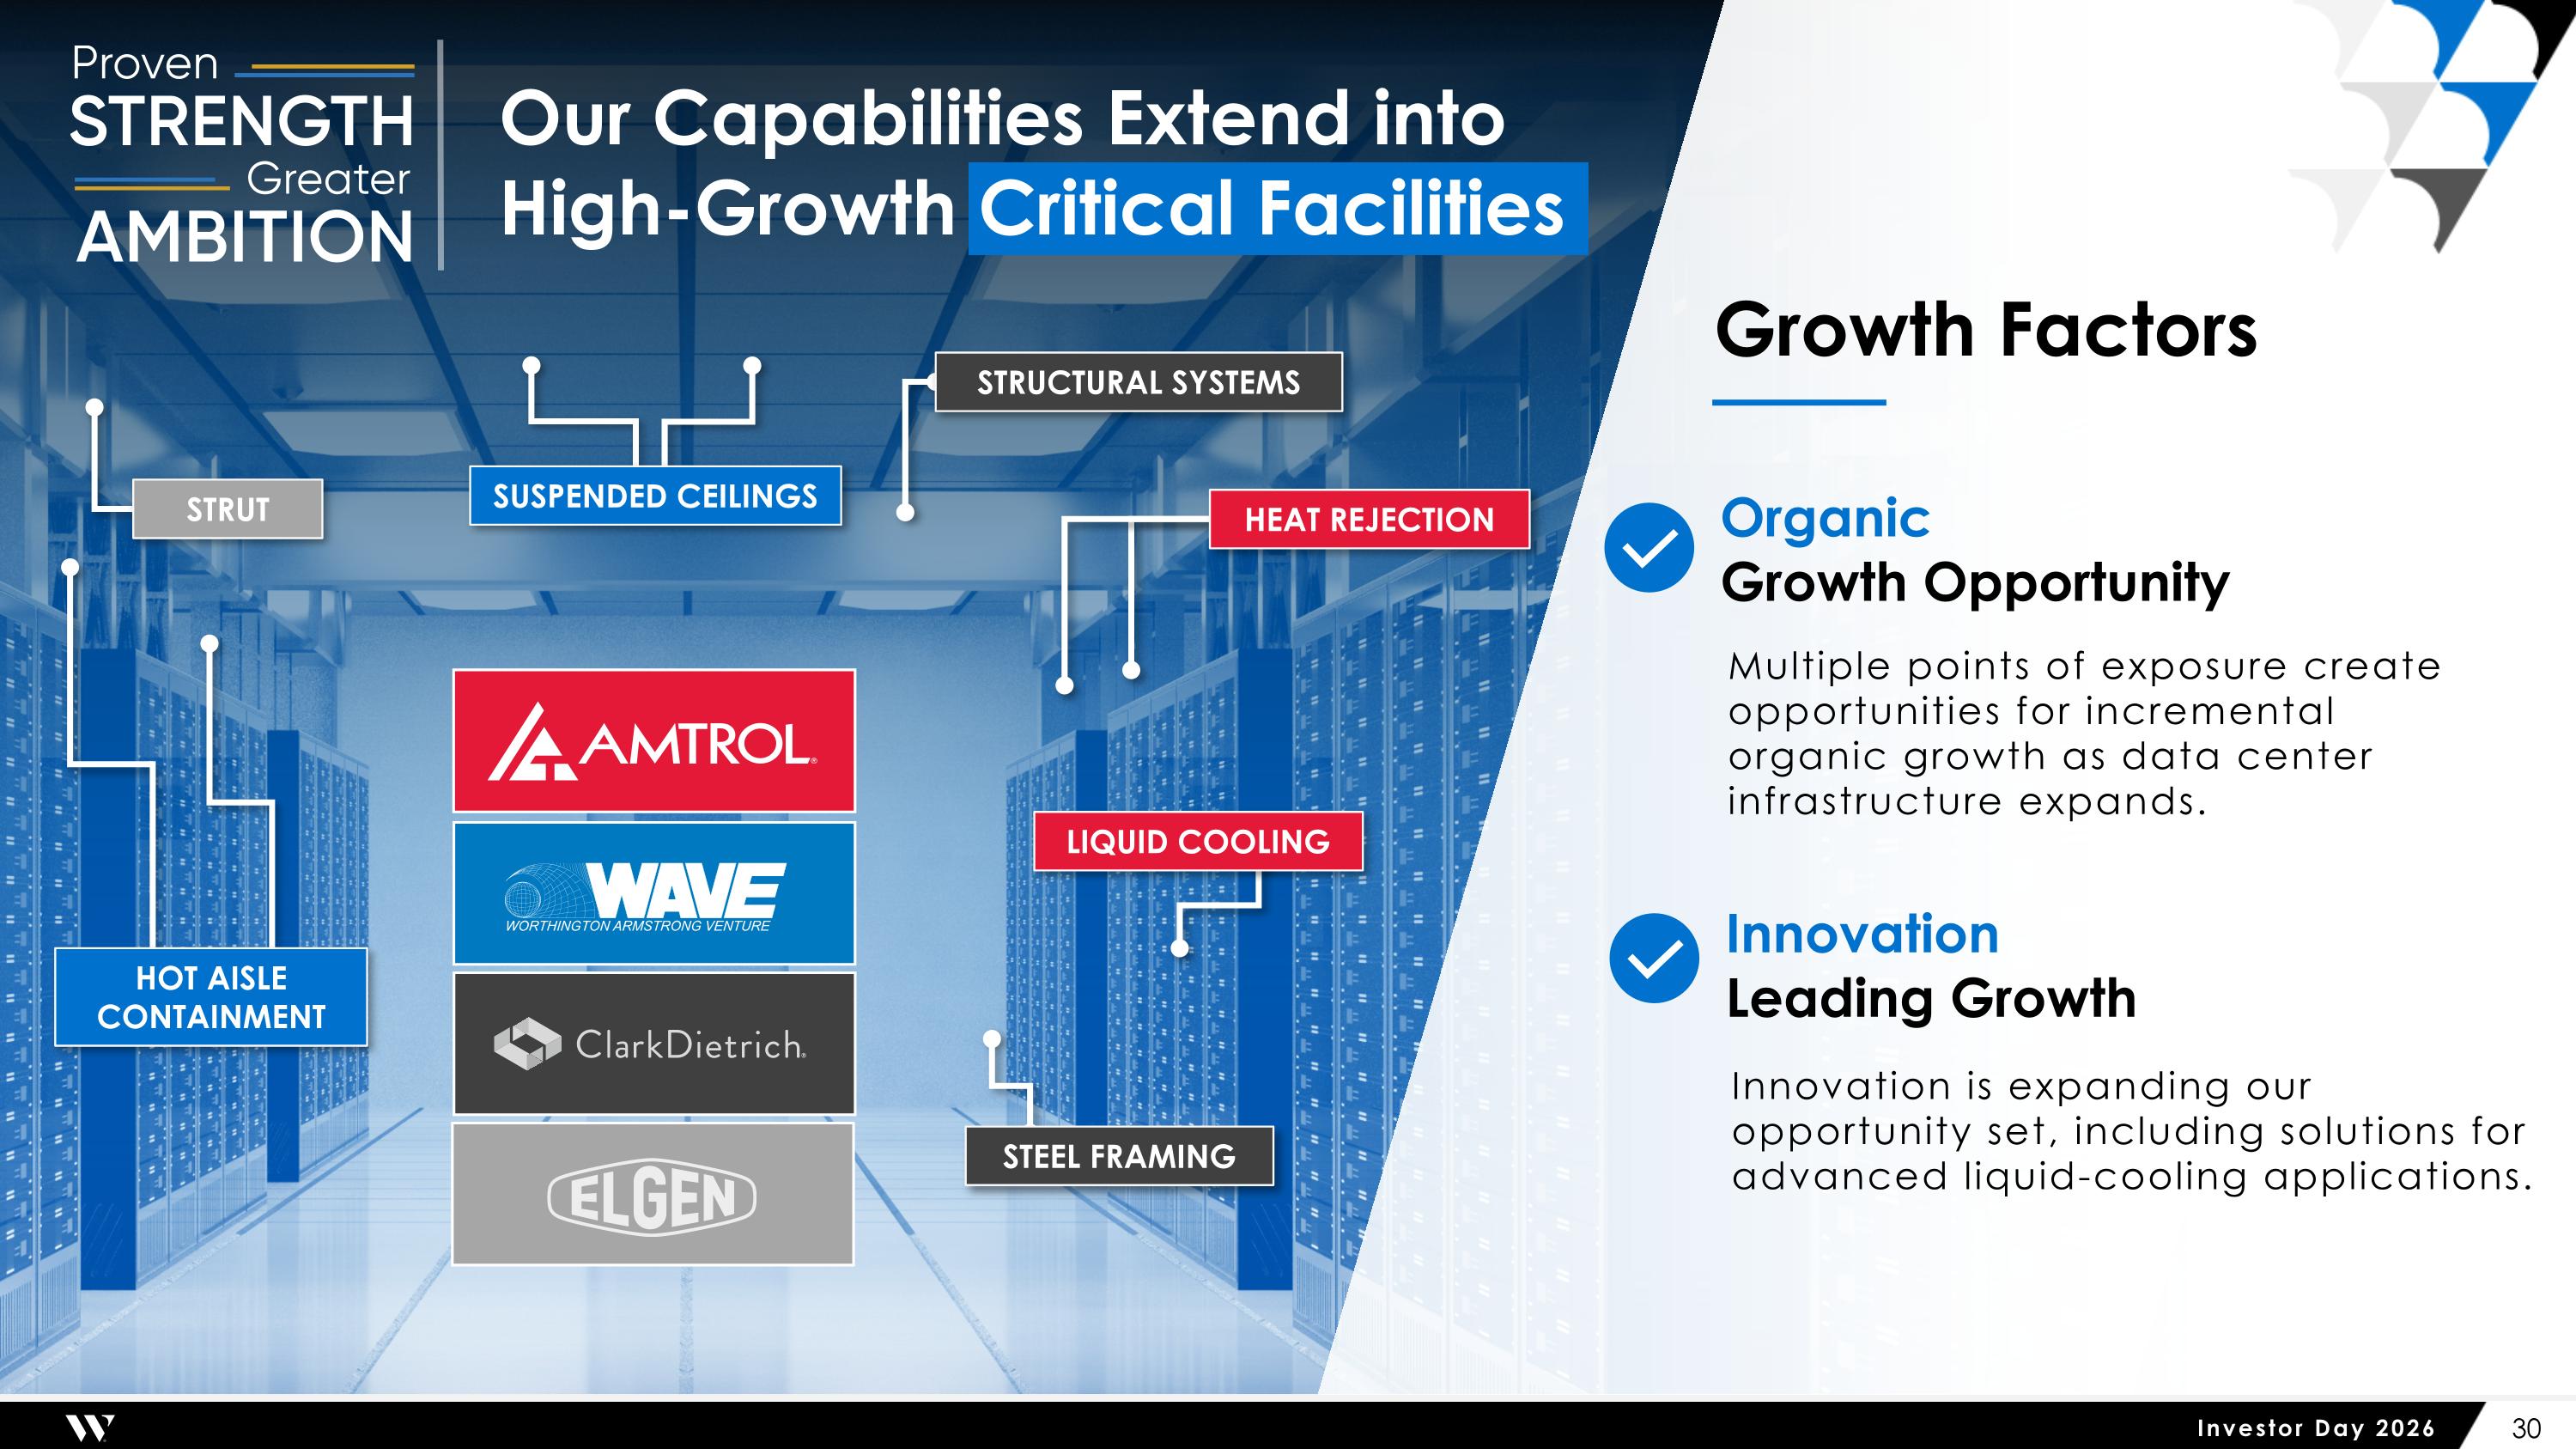
Our Capabilities Extend into High-Growth Critical Facilities SUSPENDED CEILINGS HOT AISLE CONTAINMENT STRUT STRUCTURAL SYSTEMS HEAT REJECTION LIQUID COOLING STEEL FRAMING Growth Factors Innovation is expanding our opportunity set, including solutions for advanced liquid-cooling applications. Innovation Leading Growth Organic Growth Opportunity Multiple points of exposure create opportunities for incremental organic growth as data center infrastructure expands.

The Worthington Business System: How We Build Durable Value Building Performance Solutions
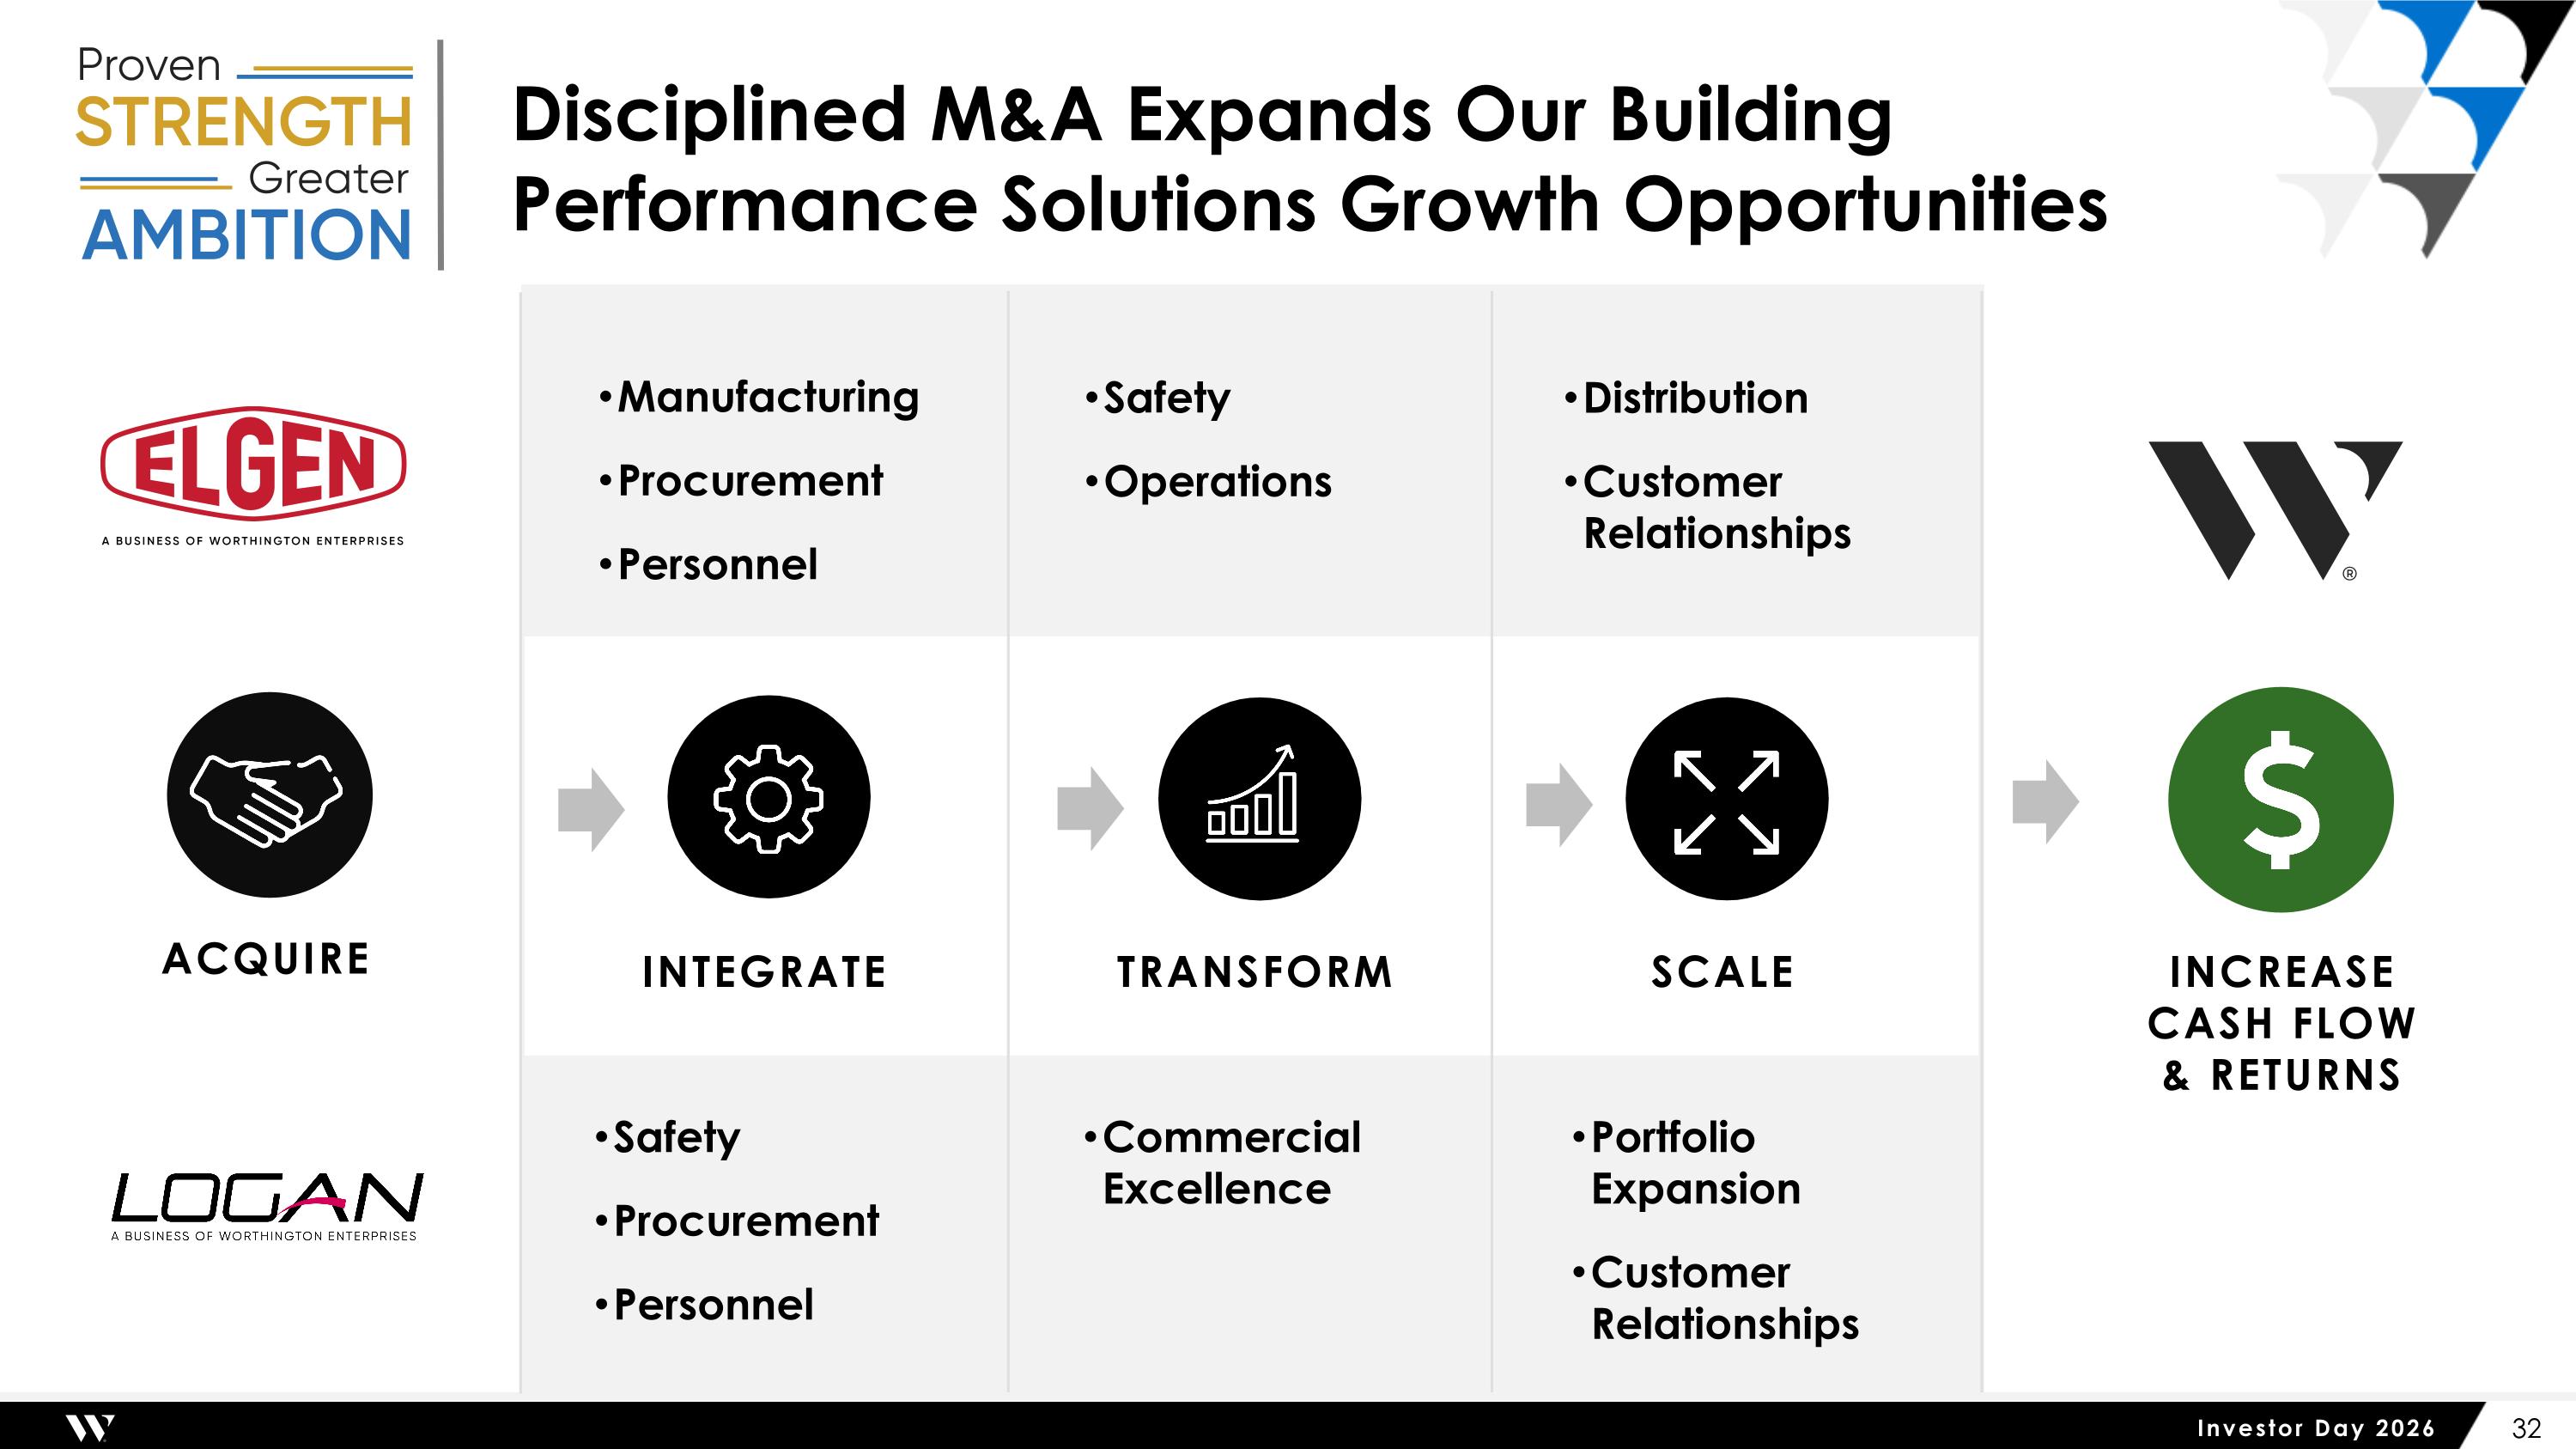
INCREASE CASH FLOW & RETURNS Disciplined M&A Expands Our Building Performance Solutions Growth Opportunities ACQUIRE INTEGRATE TRANSFORM SCALE Manufacturing Procurement Personnel Safety Procurement Personnel Commercial Excellence Portfolio Expansion Customer Relationships Safety Operations Distribution Customer Relationships
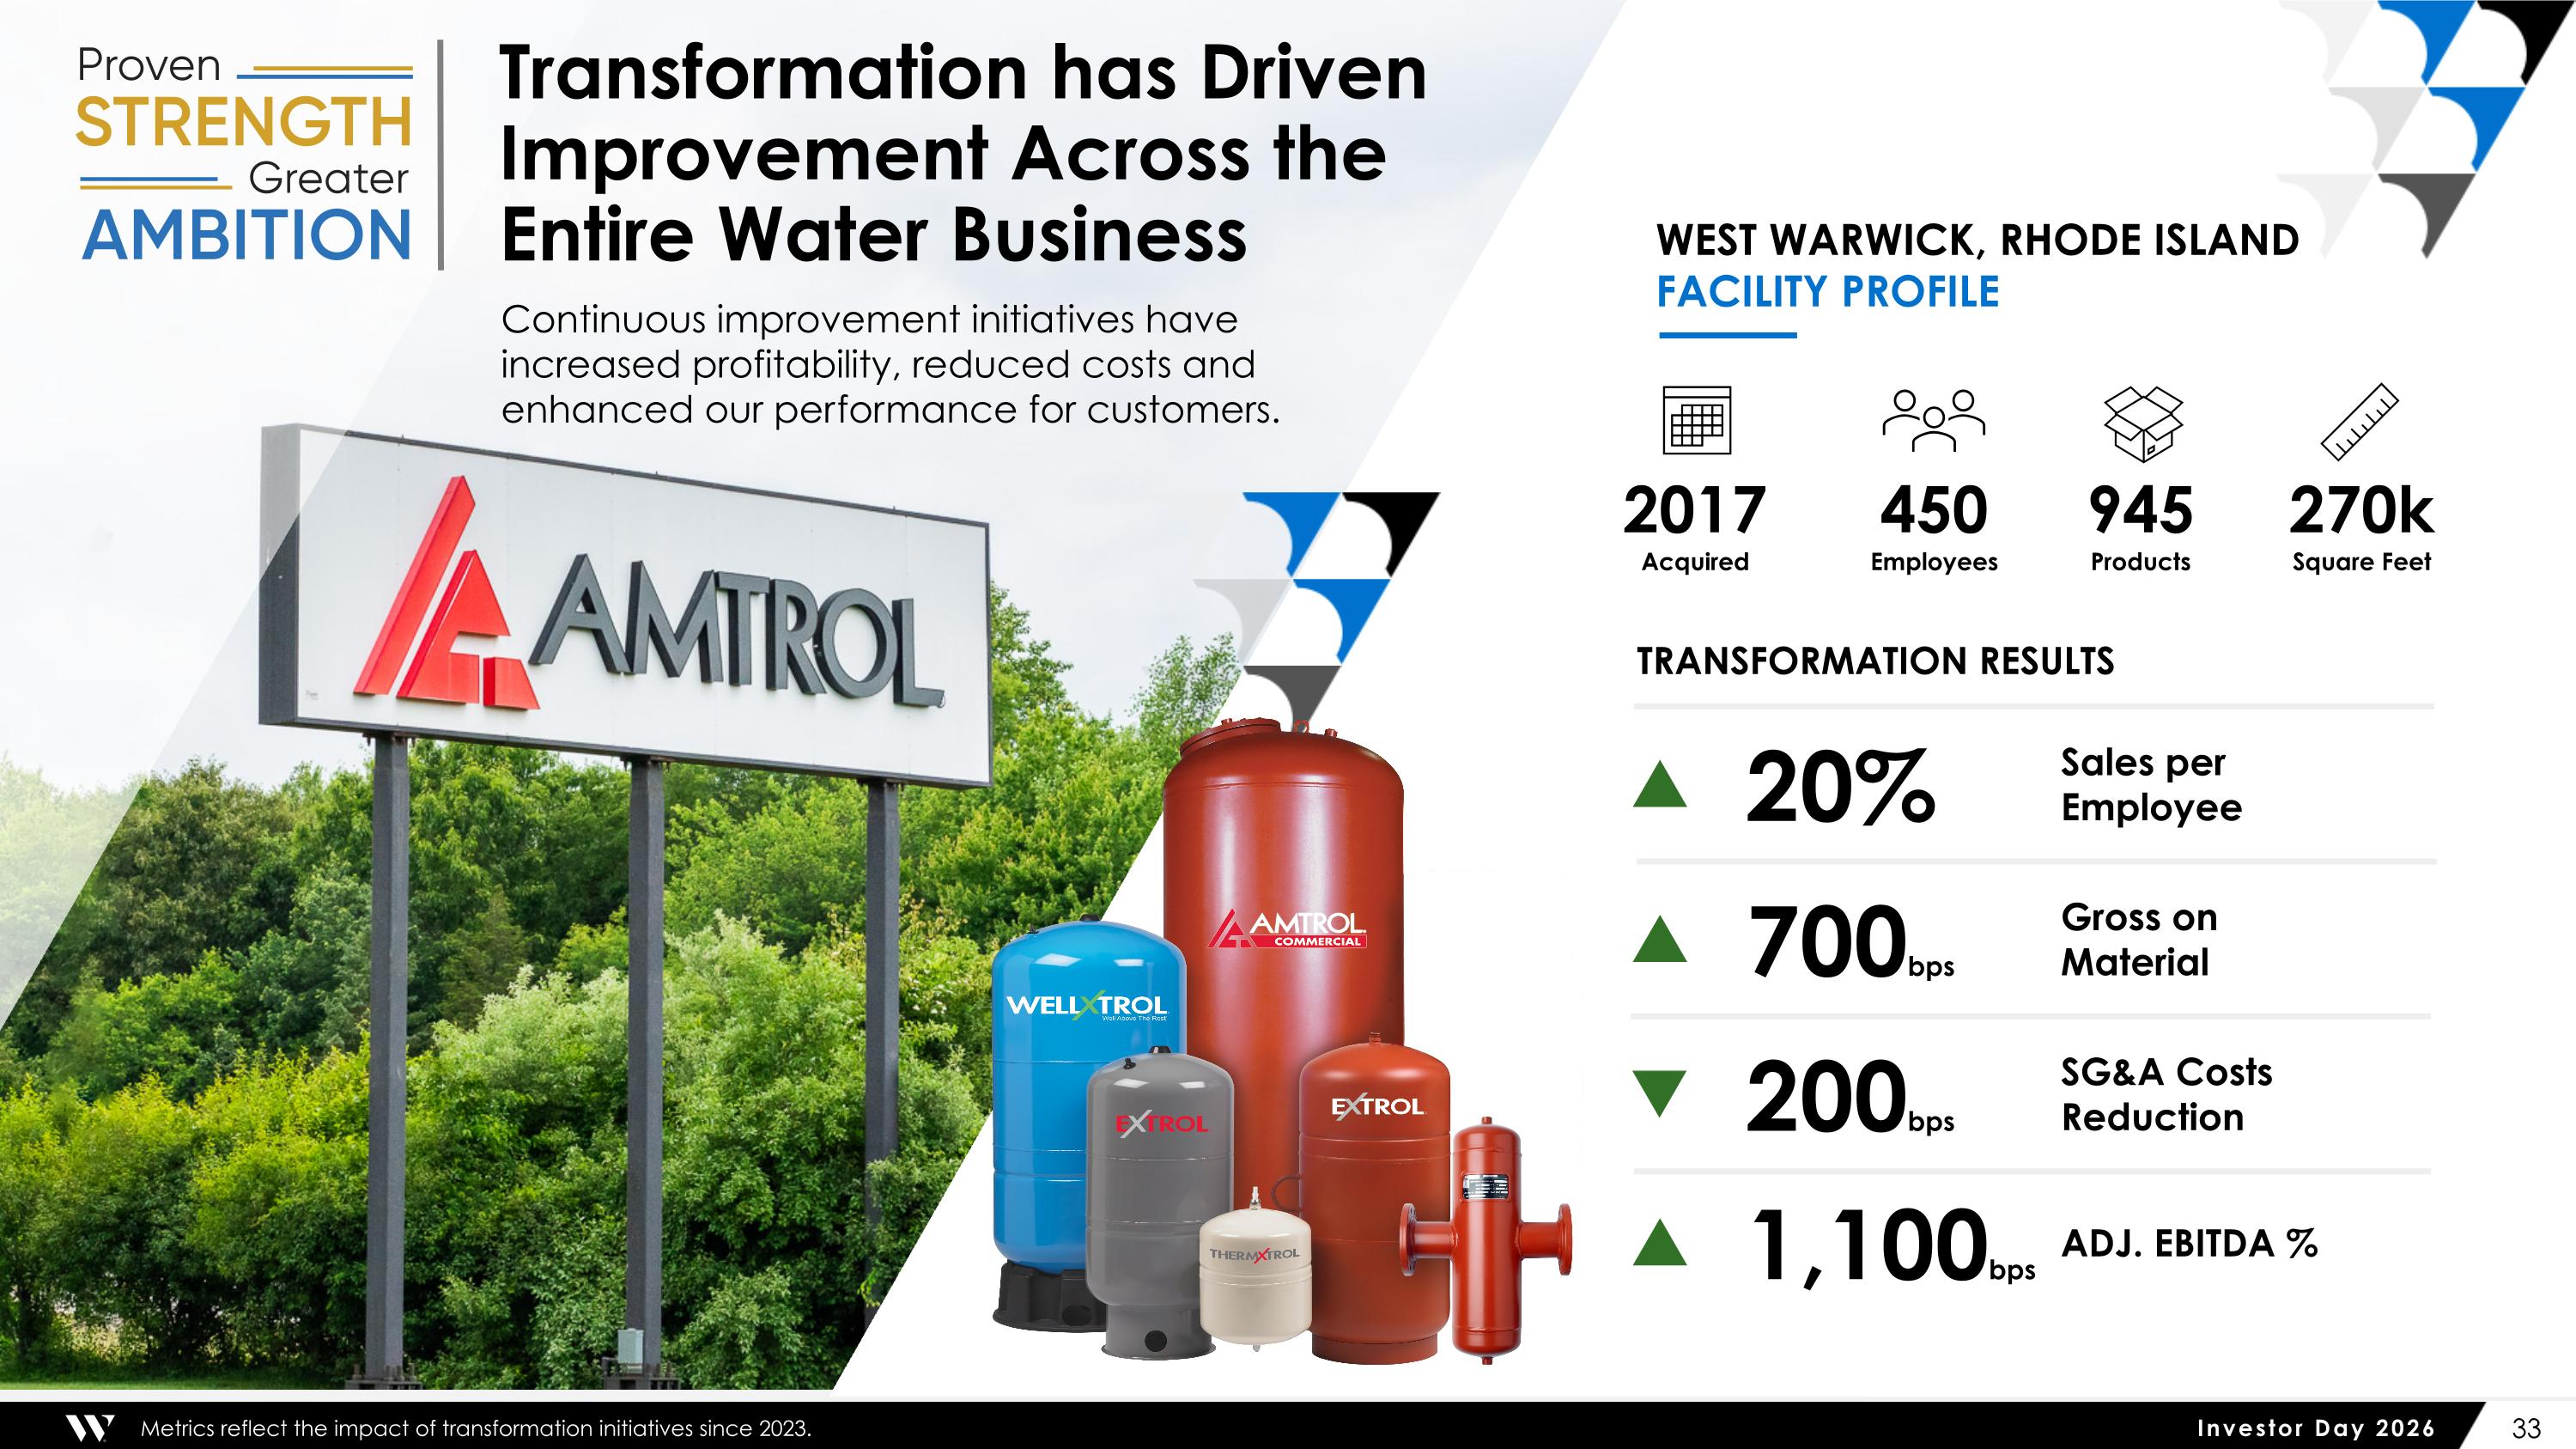
Metrics reflect the impact of transformation initiatives since 2023. TRANSFORMATION RESULTS WEST WARWICK, RHODE ISLAND FACILITY PROFILE Transformation has Driven Improvement Across the Entire Water Business Continuous improvement initiatives have increased profitability, reduced costs and enhanced our performance for customers. 20% Sales per Employee ▲ 700bps Gross on Material ▲ 200bps SG&A Costs Reduction ▲ 1,100bps ADJ. EBITDA % ▲ 450 Employees 2017 Acquired 945 Products 270k Square Feet
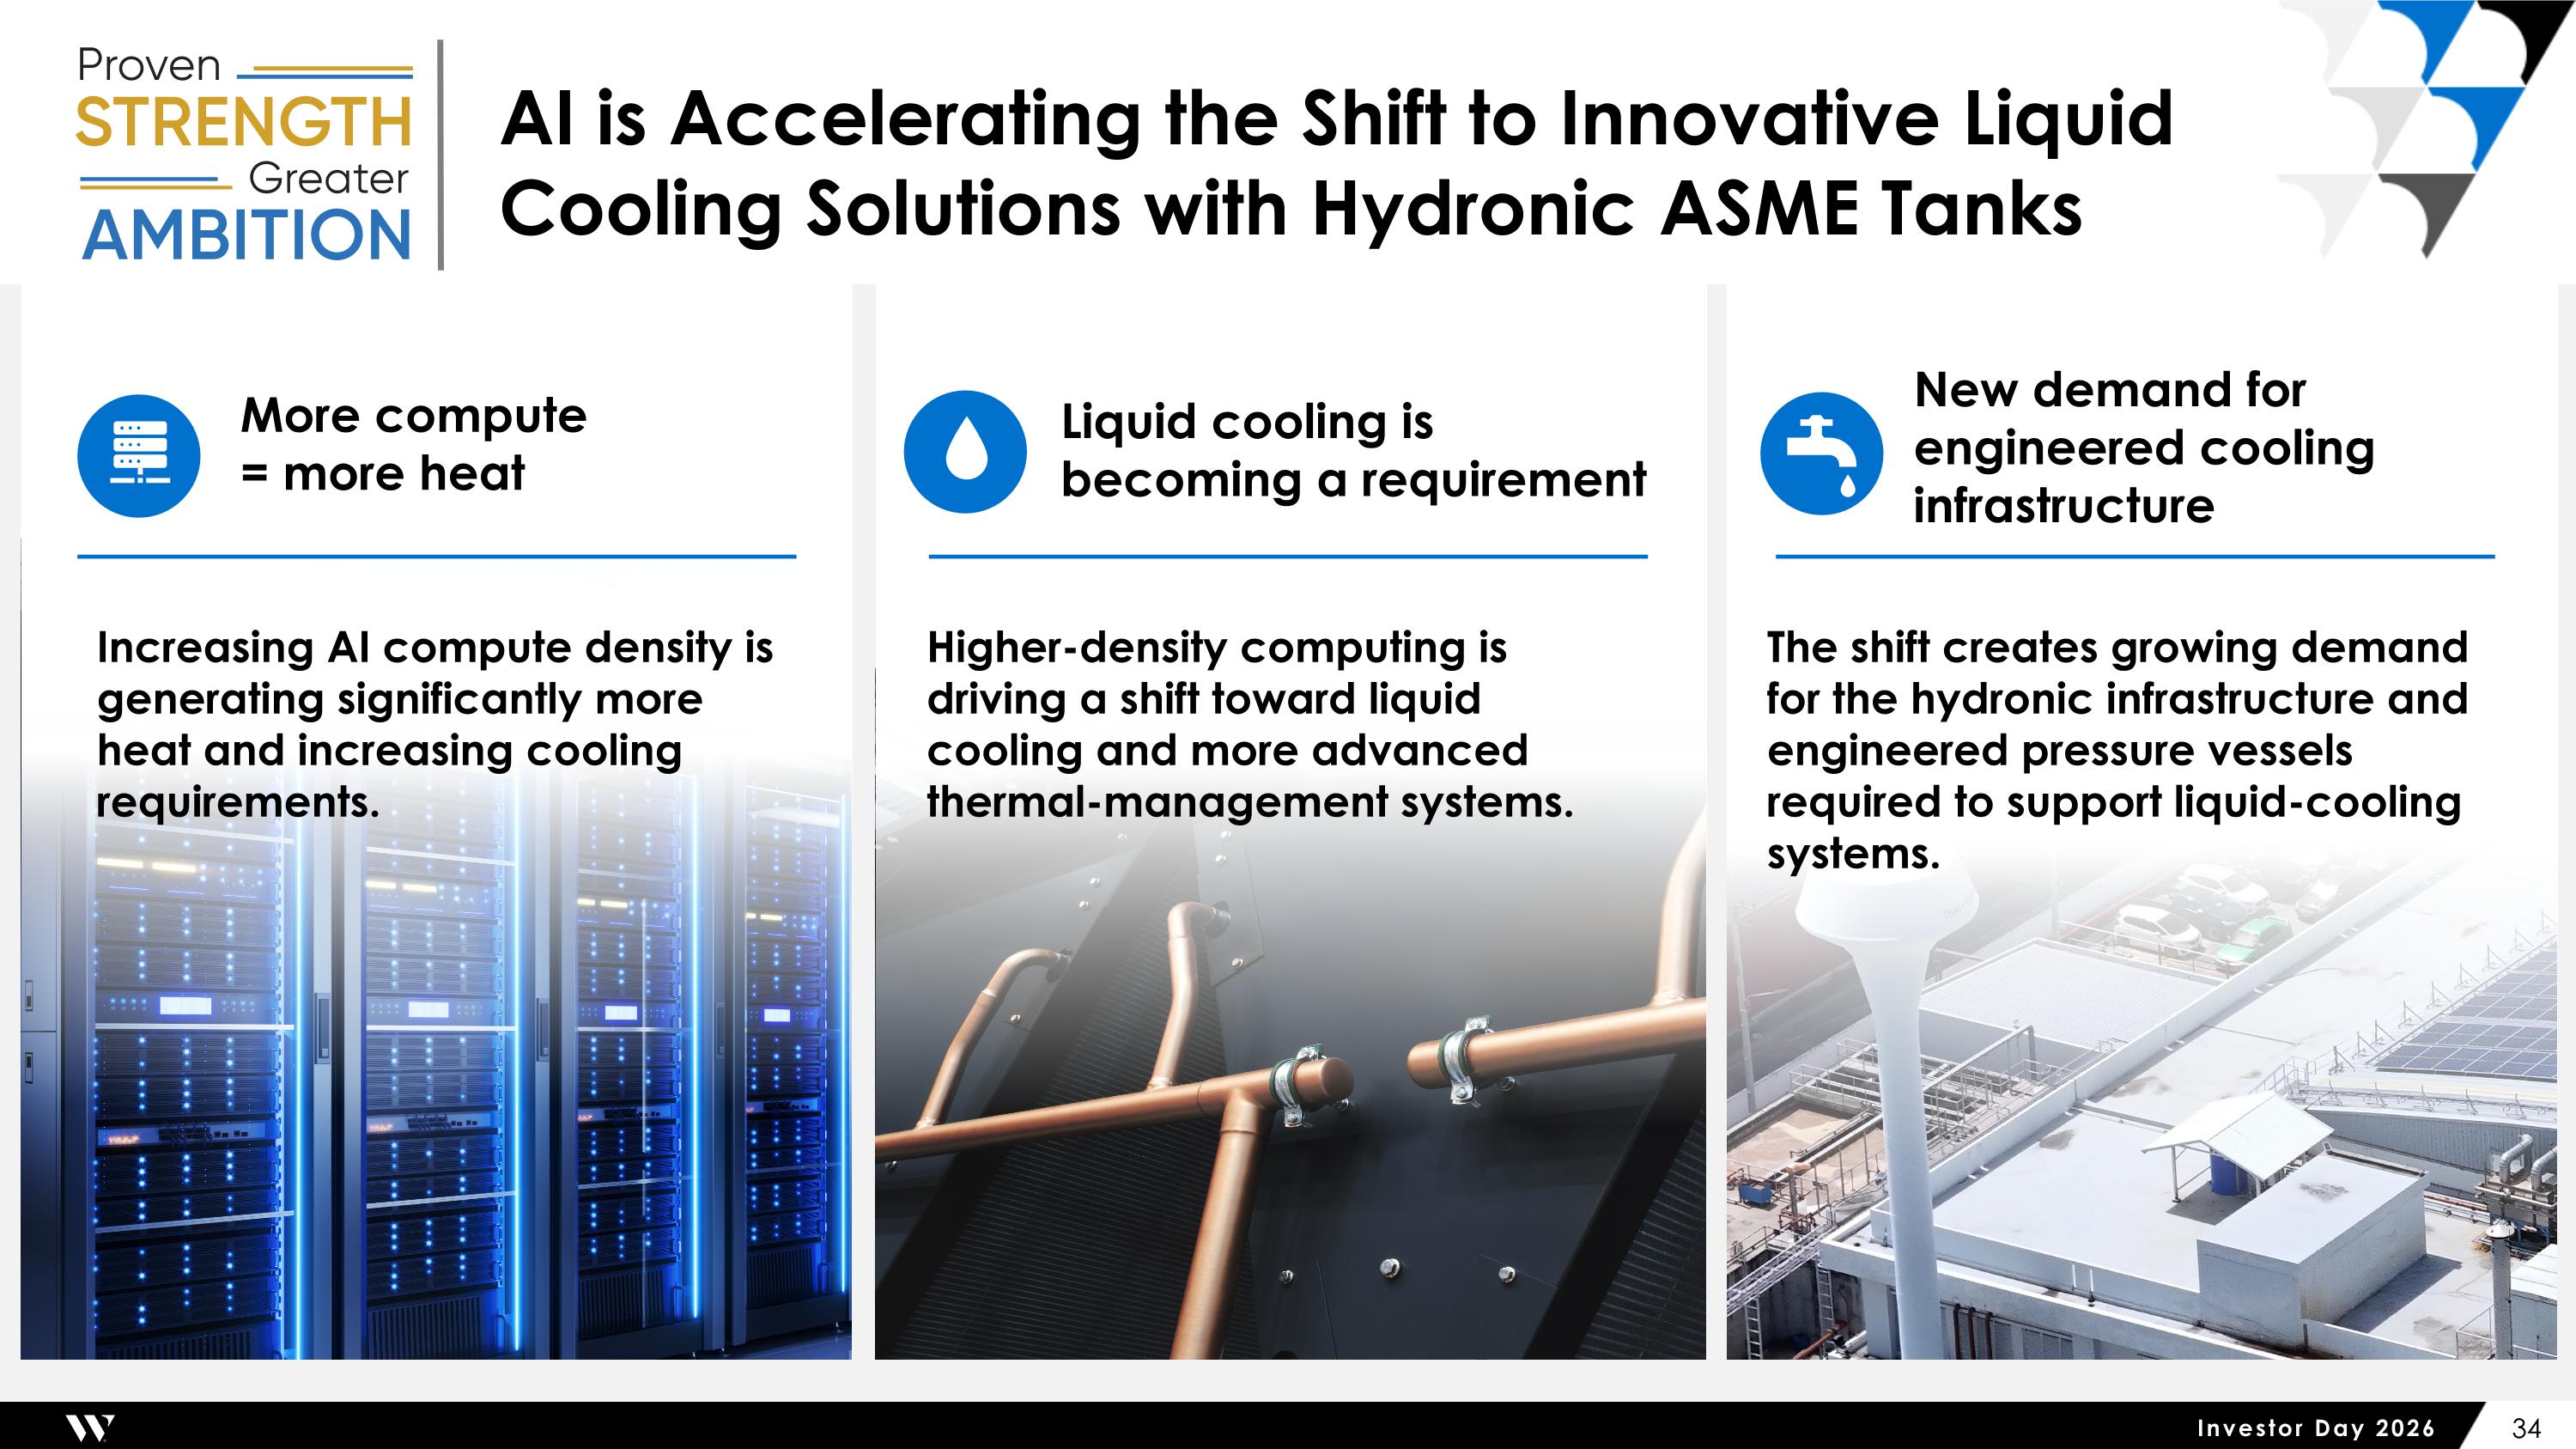
AI is Accelerating the Shift to Innovative Liquid Cooling Solutions with Hydronic ASME Tanks Increasing AI compute density is generating significantly more heat and increasing cooling requirements. Higher-density computing is driving a shift toward liquid cooling and more advanced thermal-management systems. The shift creates growing demand for the hydronic infrastructure and engineered pressure vessels required to support liquid-cooling systems. More compute = more heat Liquid cooling is becoming a requirement New demand for engineered cooling infrastructure
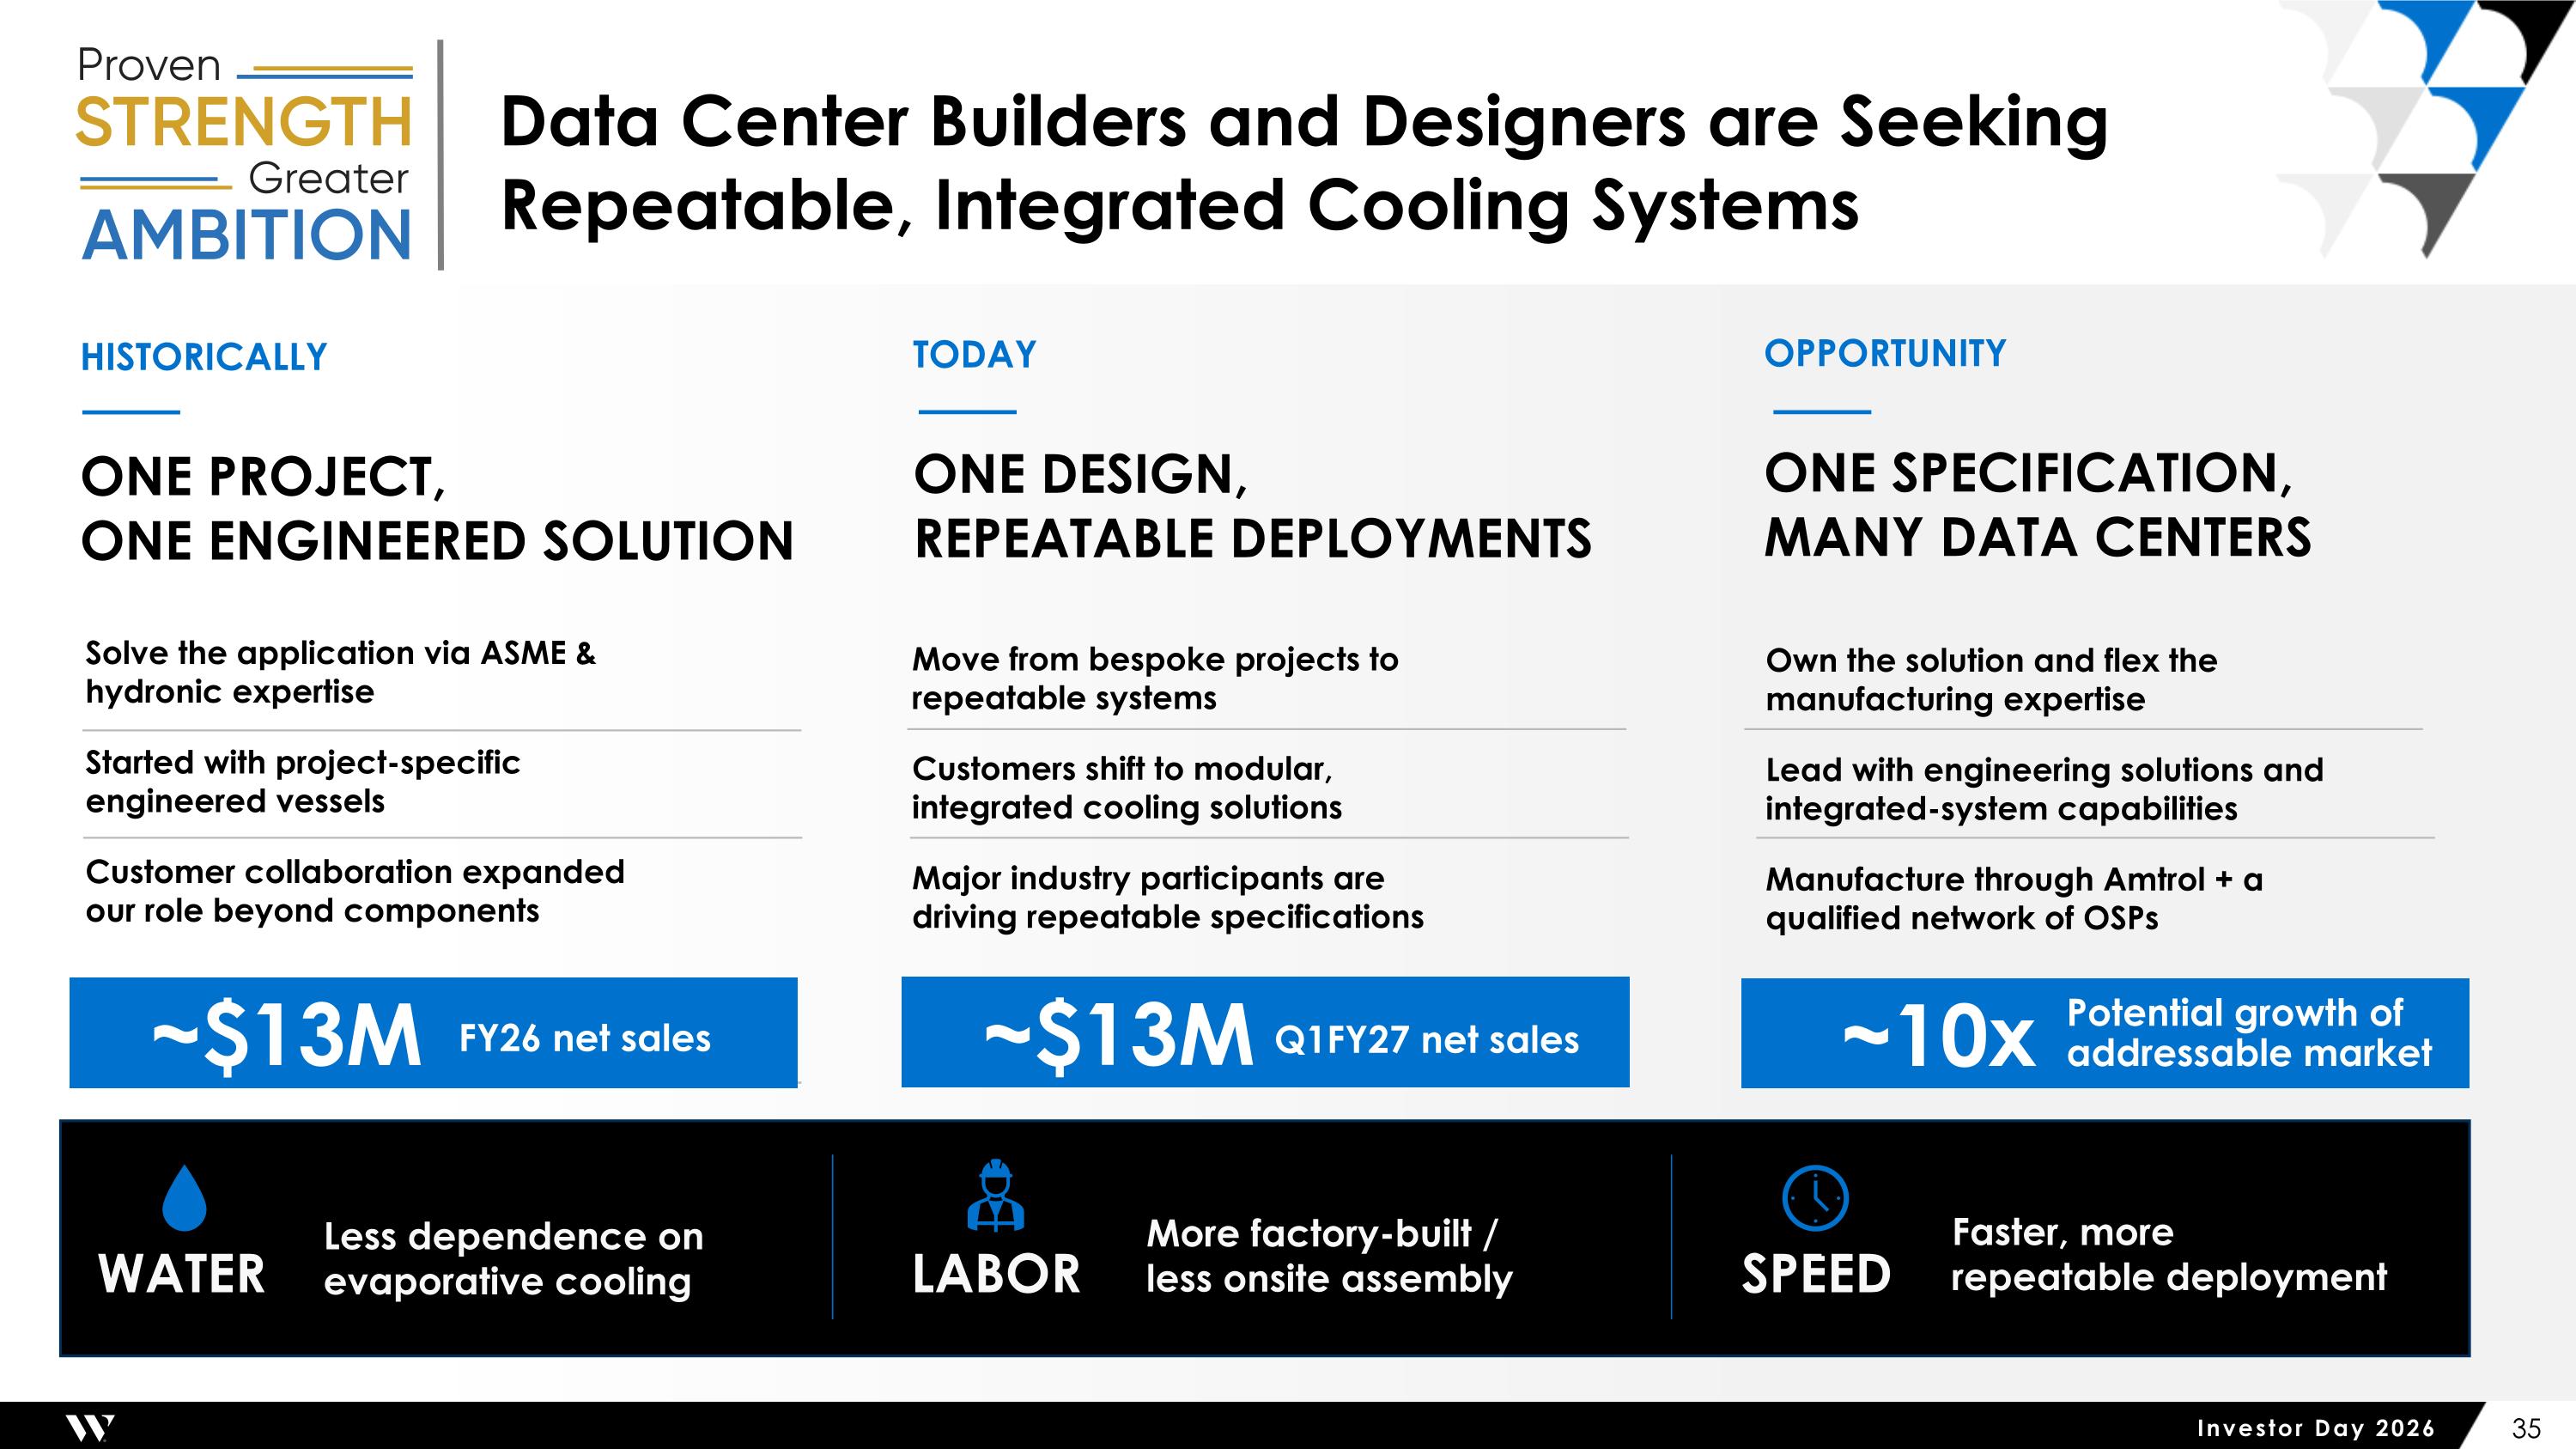
Data Center Builders and Designers are Seeking Repeatable, Integrated Cooling Systems ~$13M FY26 net sales HISTORICALLY ONE PROJECT, ONE ENGINEERED SOLUTION TODAY ONE DESIGN, REPEATABLE DEPLOYMENTS OPPORTUNITY ONE SPECIFICATION, MANY DATA CENTERS More factory-built / less onsite assembly LABOR Faster, more repeatable deployment SPEED Less dependence on evaporative cooling WATER Solve the application via ASME & hydronic expertise Started with project-specific engineered vessels Customer collaboration expanded our role beyond components Move from bespoke projects to repeatable systems Customers shift to modular, integrated cooling solutions Major industry participants are driving repeatable specifications Own the solution and flex the manufacturing expertise Lead with engineering solutions and integrated-system capabilities Manufacture through Amtrol + a qualified network of OSPs ~$13M FY26 net sales ~$13M Q1FY27 net sales ~10x Potential growth of addressable market
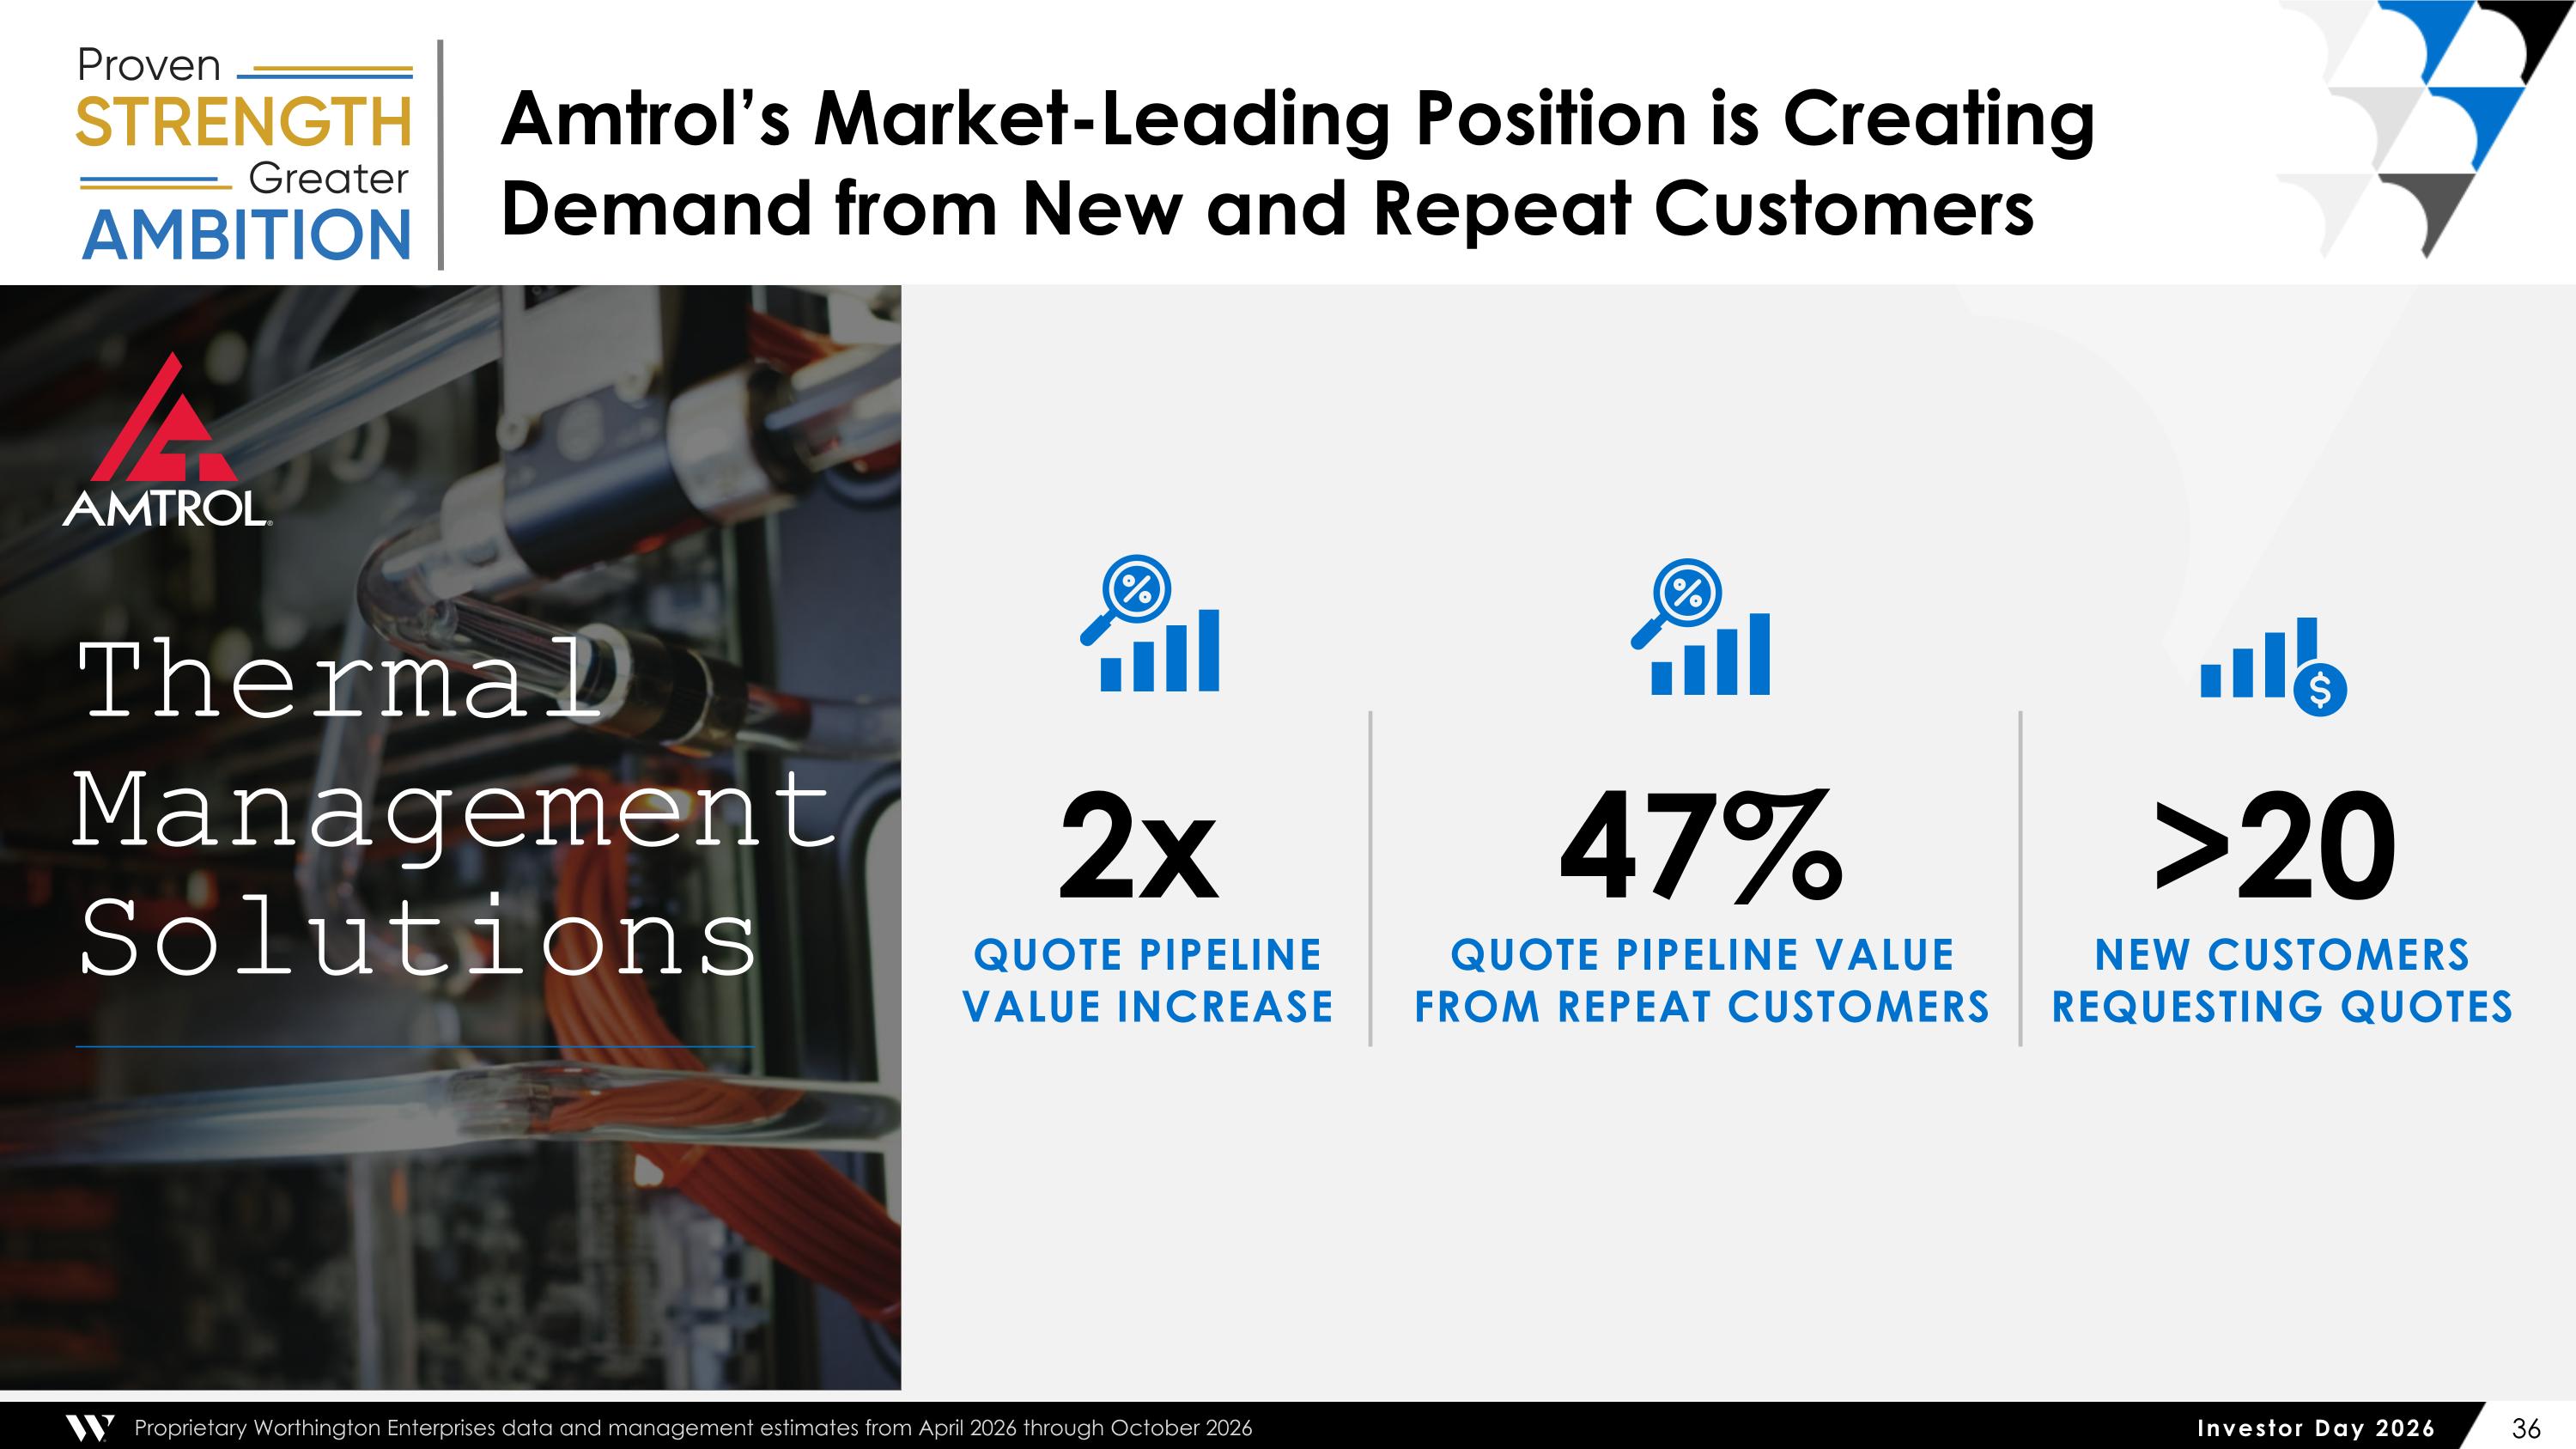
Amtrol’s Market-Leading Position is Creating Demand from New and Repeat Customers 47% QUOTE PIPELINE VALUE FROM REPEAT CUSTOMERS >20 NEW CUSTOMERS REQUESTING QUOTES 2x QUOTE PIPELINE VALUE INCREASE Thermal Management Solutions Proprietary Worthington Enterprises data and management estimates from April 2026 through October 2026
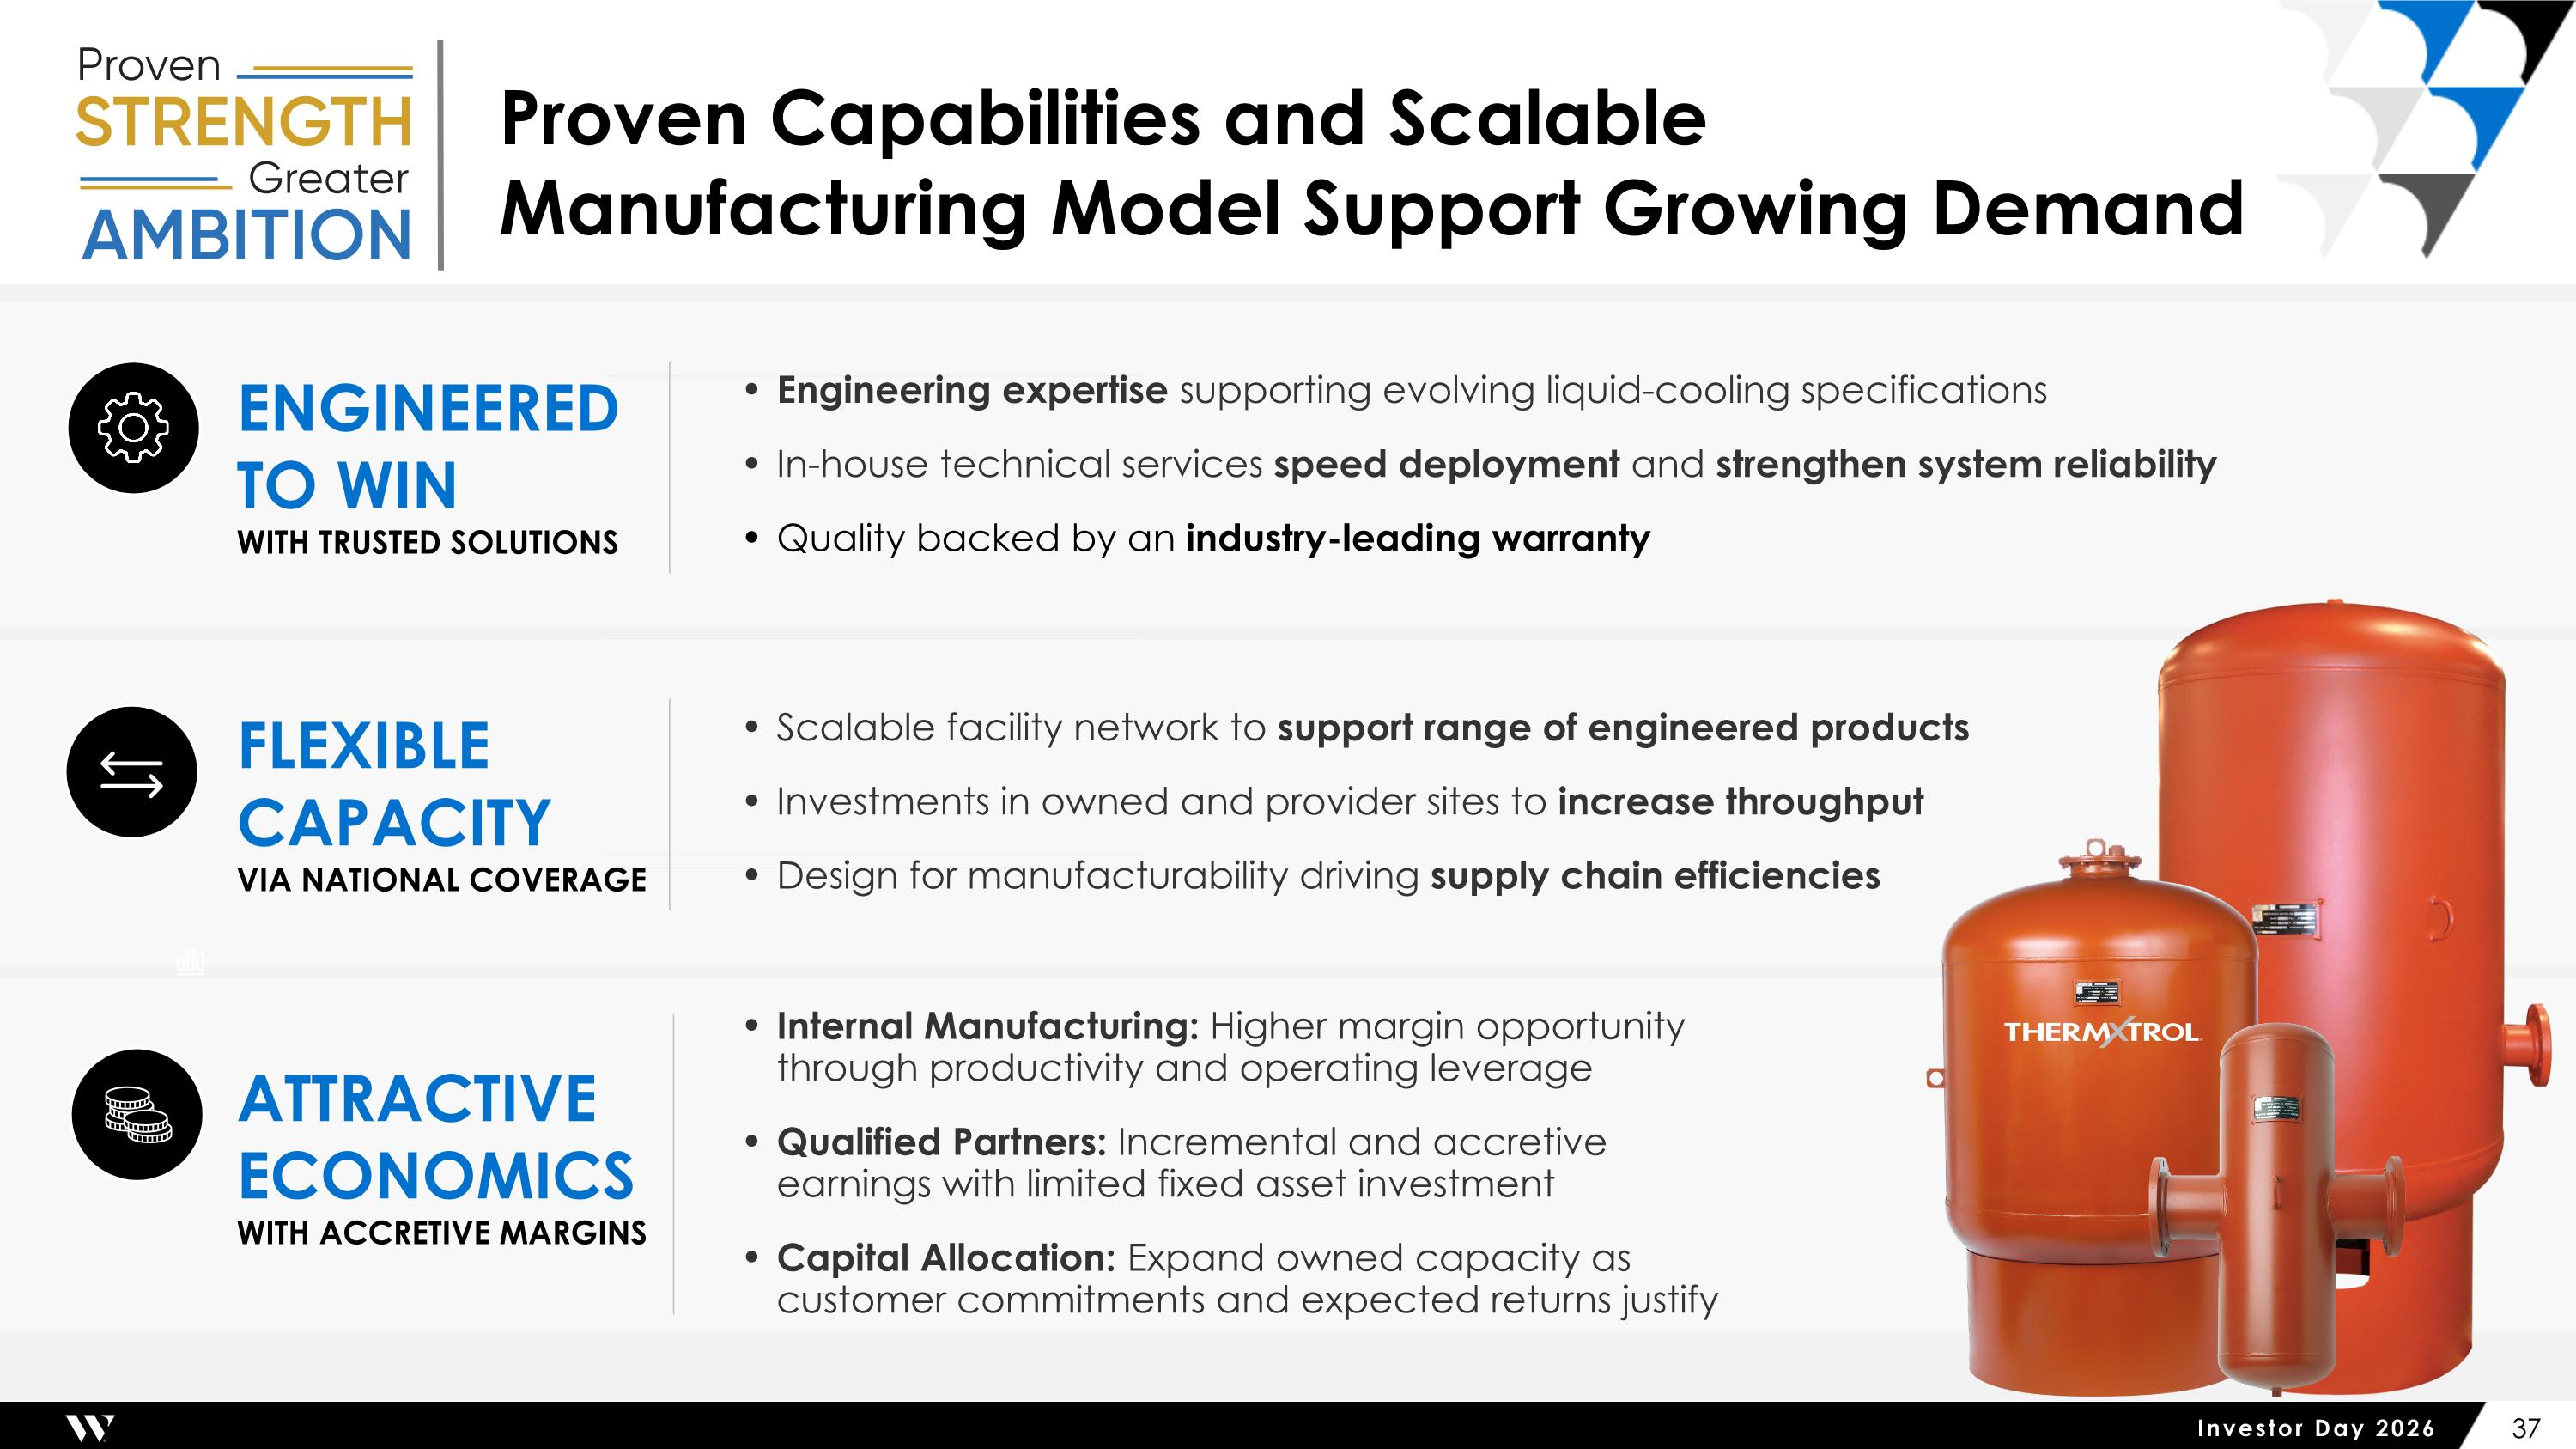
ENGINEERED TO WIN WITH TRUSTED SOLUTIONS Engineering expertise supporting evolving liquid-cooling specifications In-house technical services speed deployment and strengthen system reliability Quality backed by an industry-leading warranty FLEXIBLE CAPACITY VIA NATIONAL COVERAGE Scalable facility network to support range of engineered products Investments in owned and provider sites to increase throughput Design for manufacturability driving supply chain efficiencies Internal Manufacturing: Higher margin opportunity through productivity and operating leverage Qualified Partners: Incremental and accretive earnings with limited fixed asset investment Capital Allocation: Expand owned capacity as customer commitments and expected returns justify ATTRACTIVE ECONOMICS WITH ACCRETIVE MARGINS Proven Capabilities and Scalable Manufacturing Model Support Growing Demand
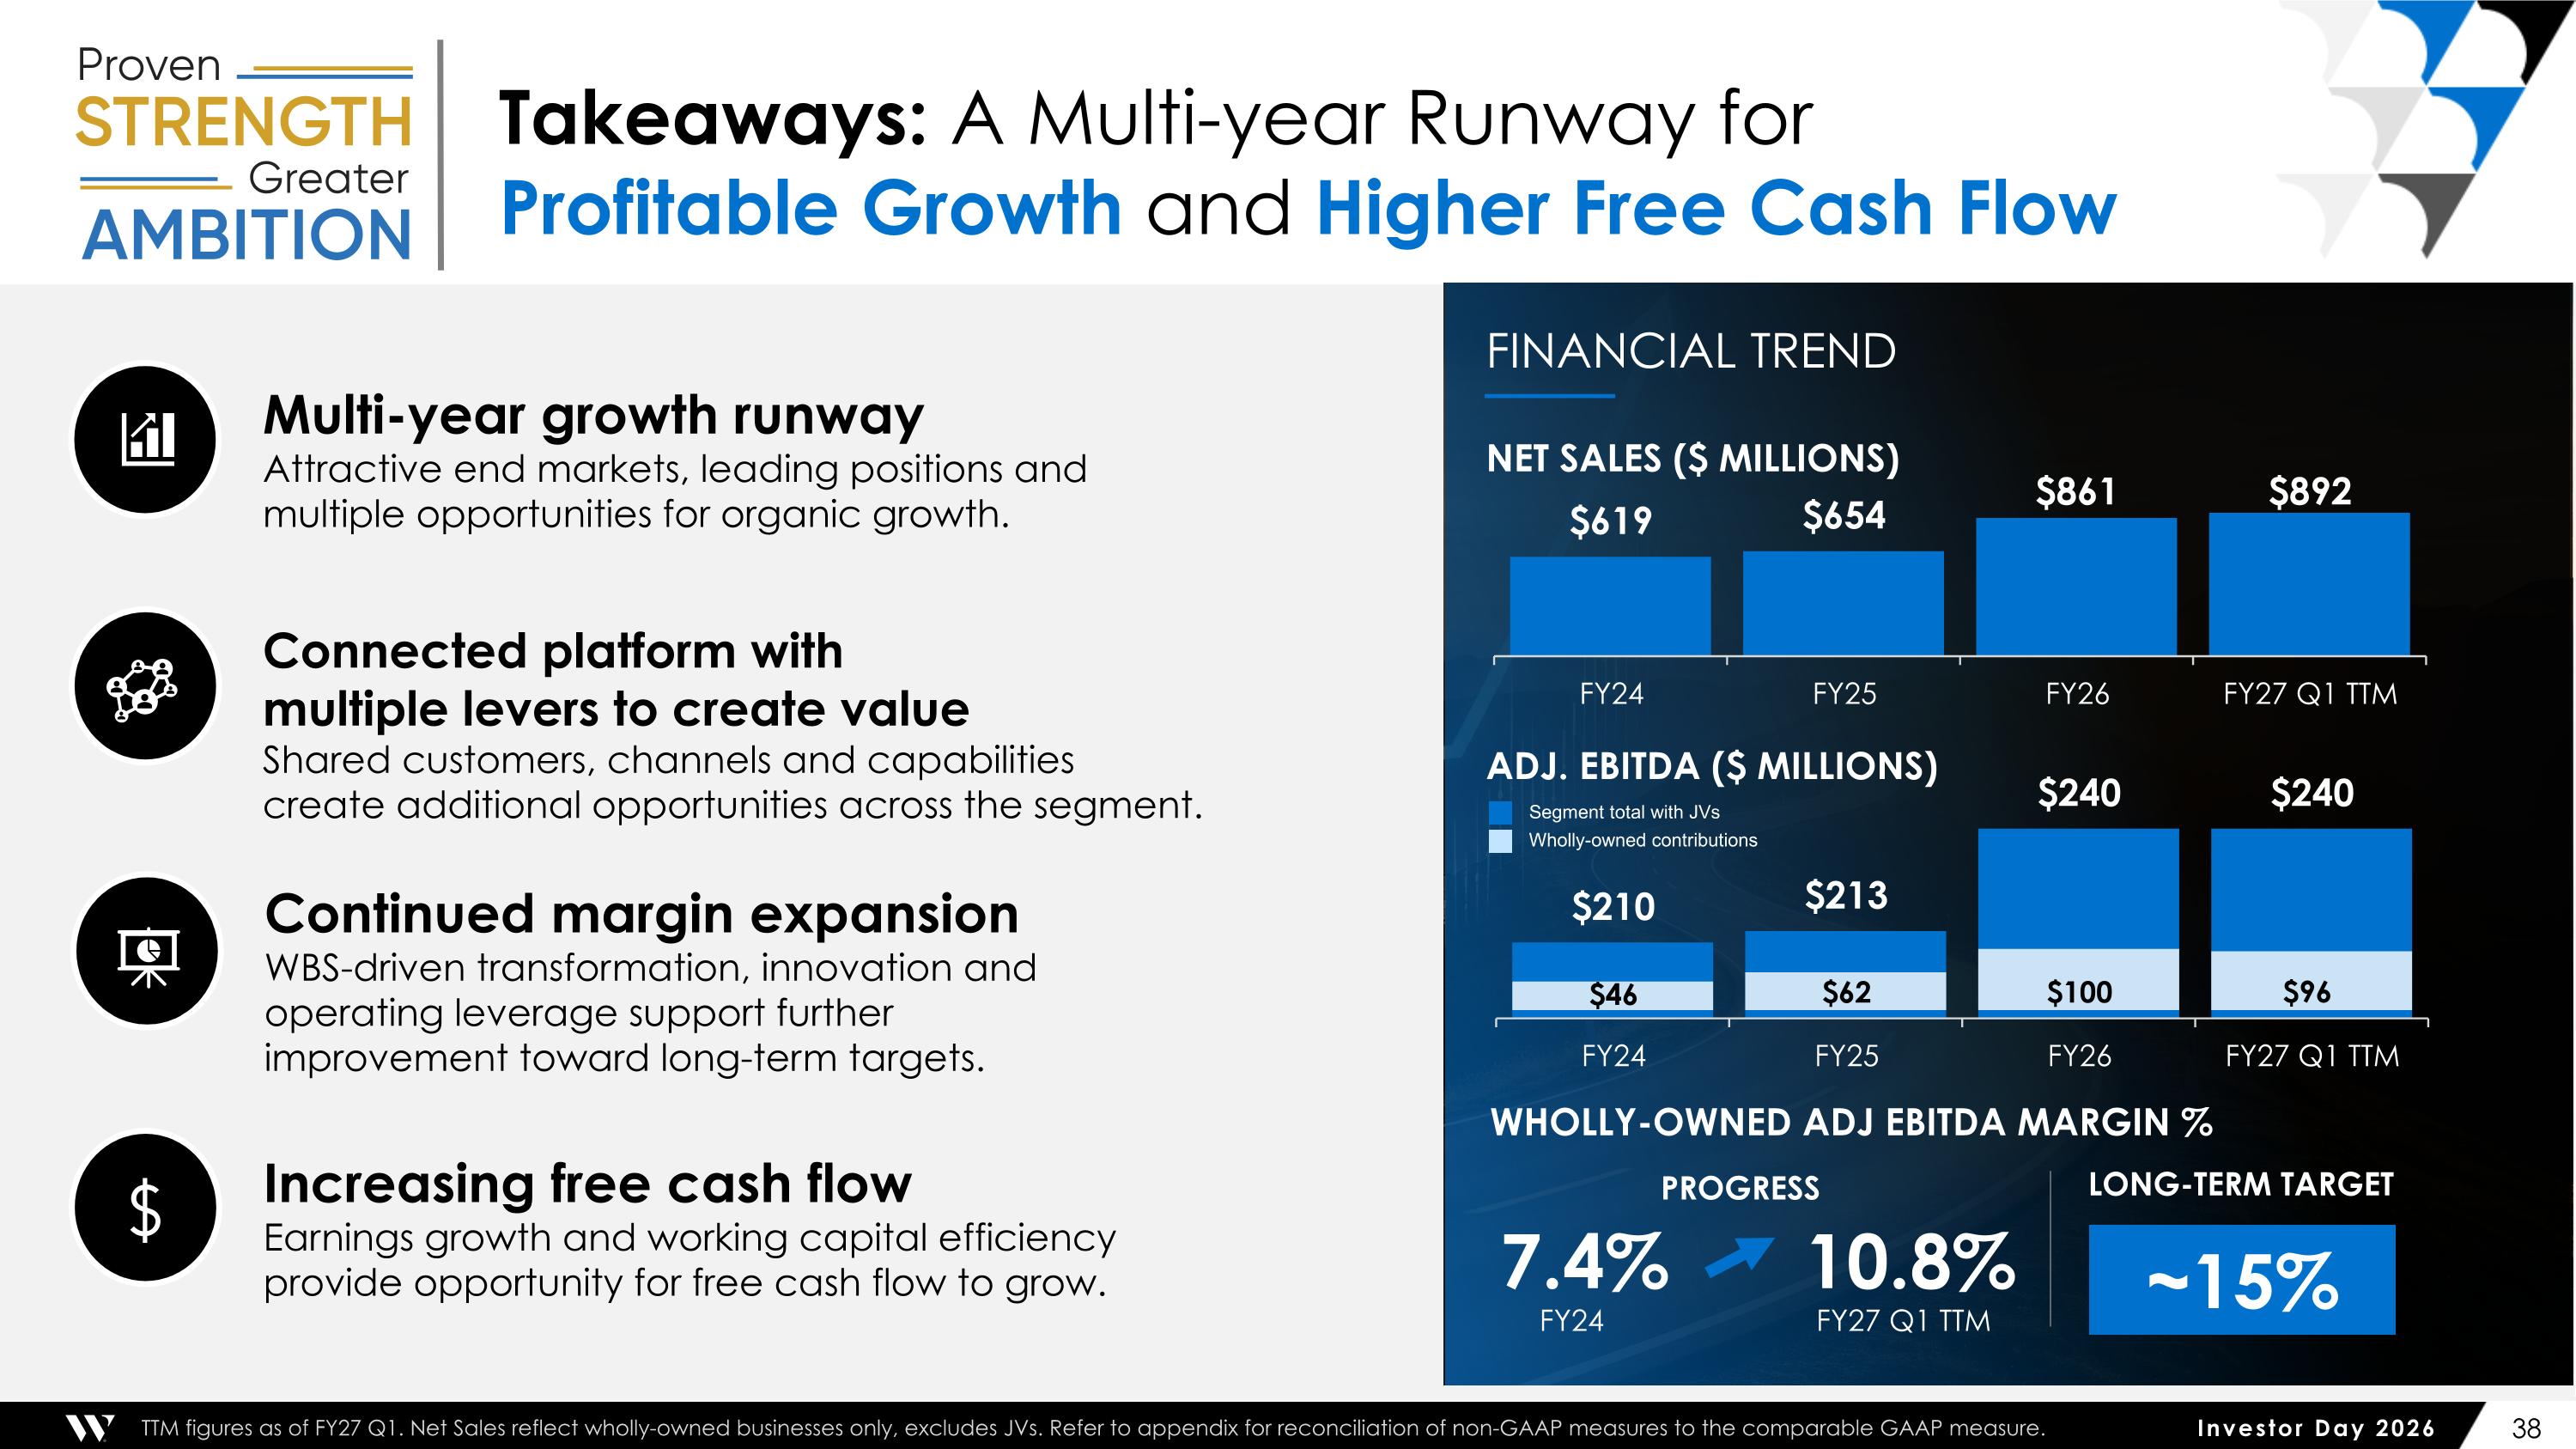
Takeaways: A Multi-year Runway for Profitable Growth and Higher Free Cash Flow Wholly-owned contributions Segment total with JVs TTM figures as of FY27 Q1. Net Sales reflect wholly-owned businesses only, excludes JVs. Refer to appendix for reconciliation of non-GAAP measures to the comparable GAAP measure. FINANCIAL TREND Multi-year growth runway Attractive end markets, leading positions and multiple opportunities for organic growth. Continued margin expansion WBS-driven transformation, innovation and operating leverage support further improvement toward long-term targets. Increasing free cash flow Earnings growth and working capital efficiency provide opportunity for free cash flow to grow. Connected platform with multiple levers to create value Shared customers, channels and capabilities create additional opportunities across the segment. ⚙ Shades 4095DA Charts Only 7FB8E6 A8CEEE Adj. EBITDA ($ Millions) wholly-owned Adj EBITDA Margin % NET SALES ($ MILLIONS) 7.4% FY24 FY27 Q1 TTM LONG-TERM TARGET ~15% 10.8% PROGRESS

Trade & Specialty Solutions
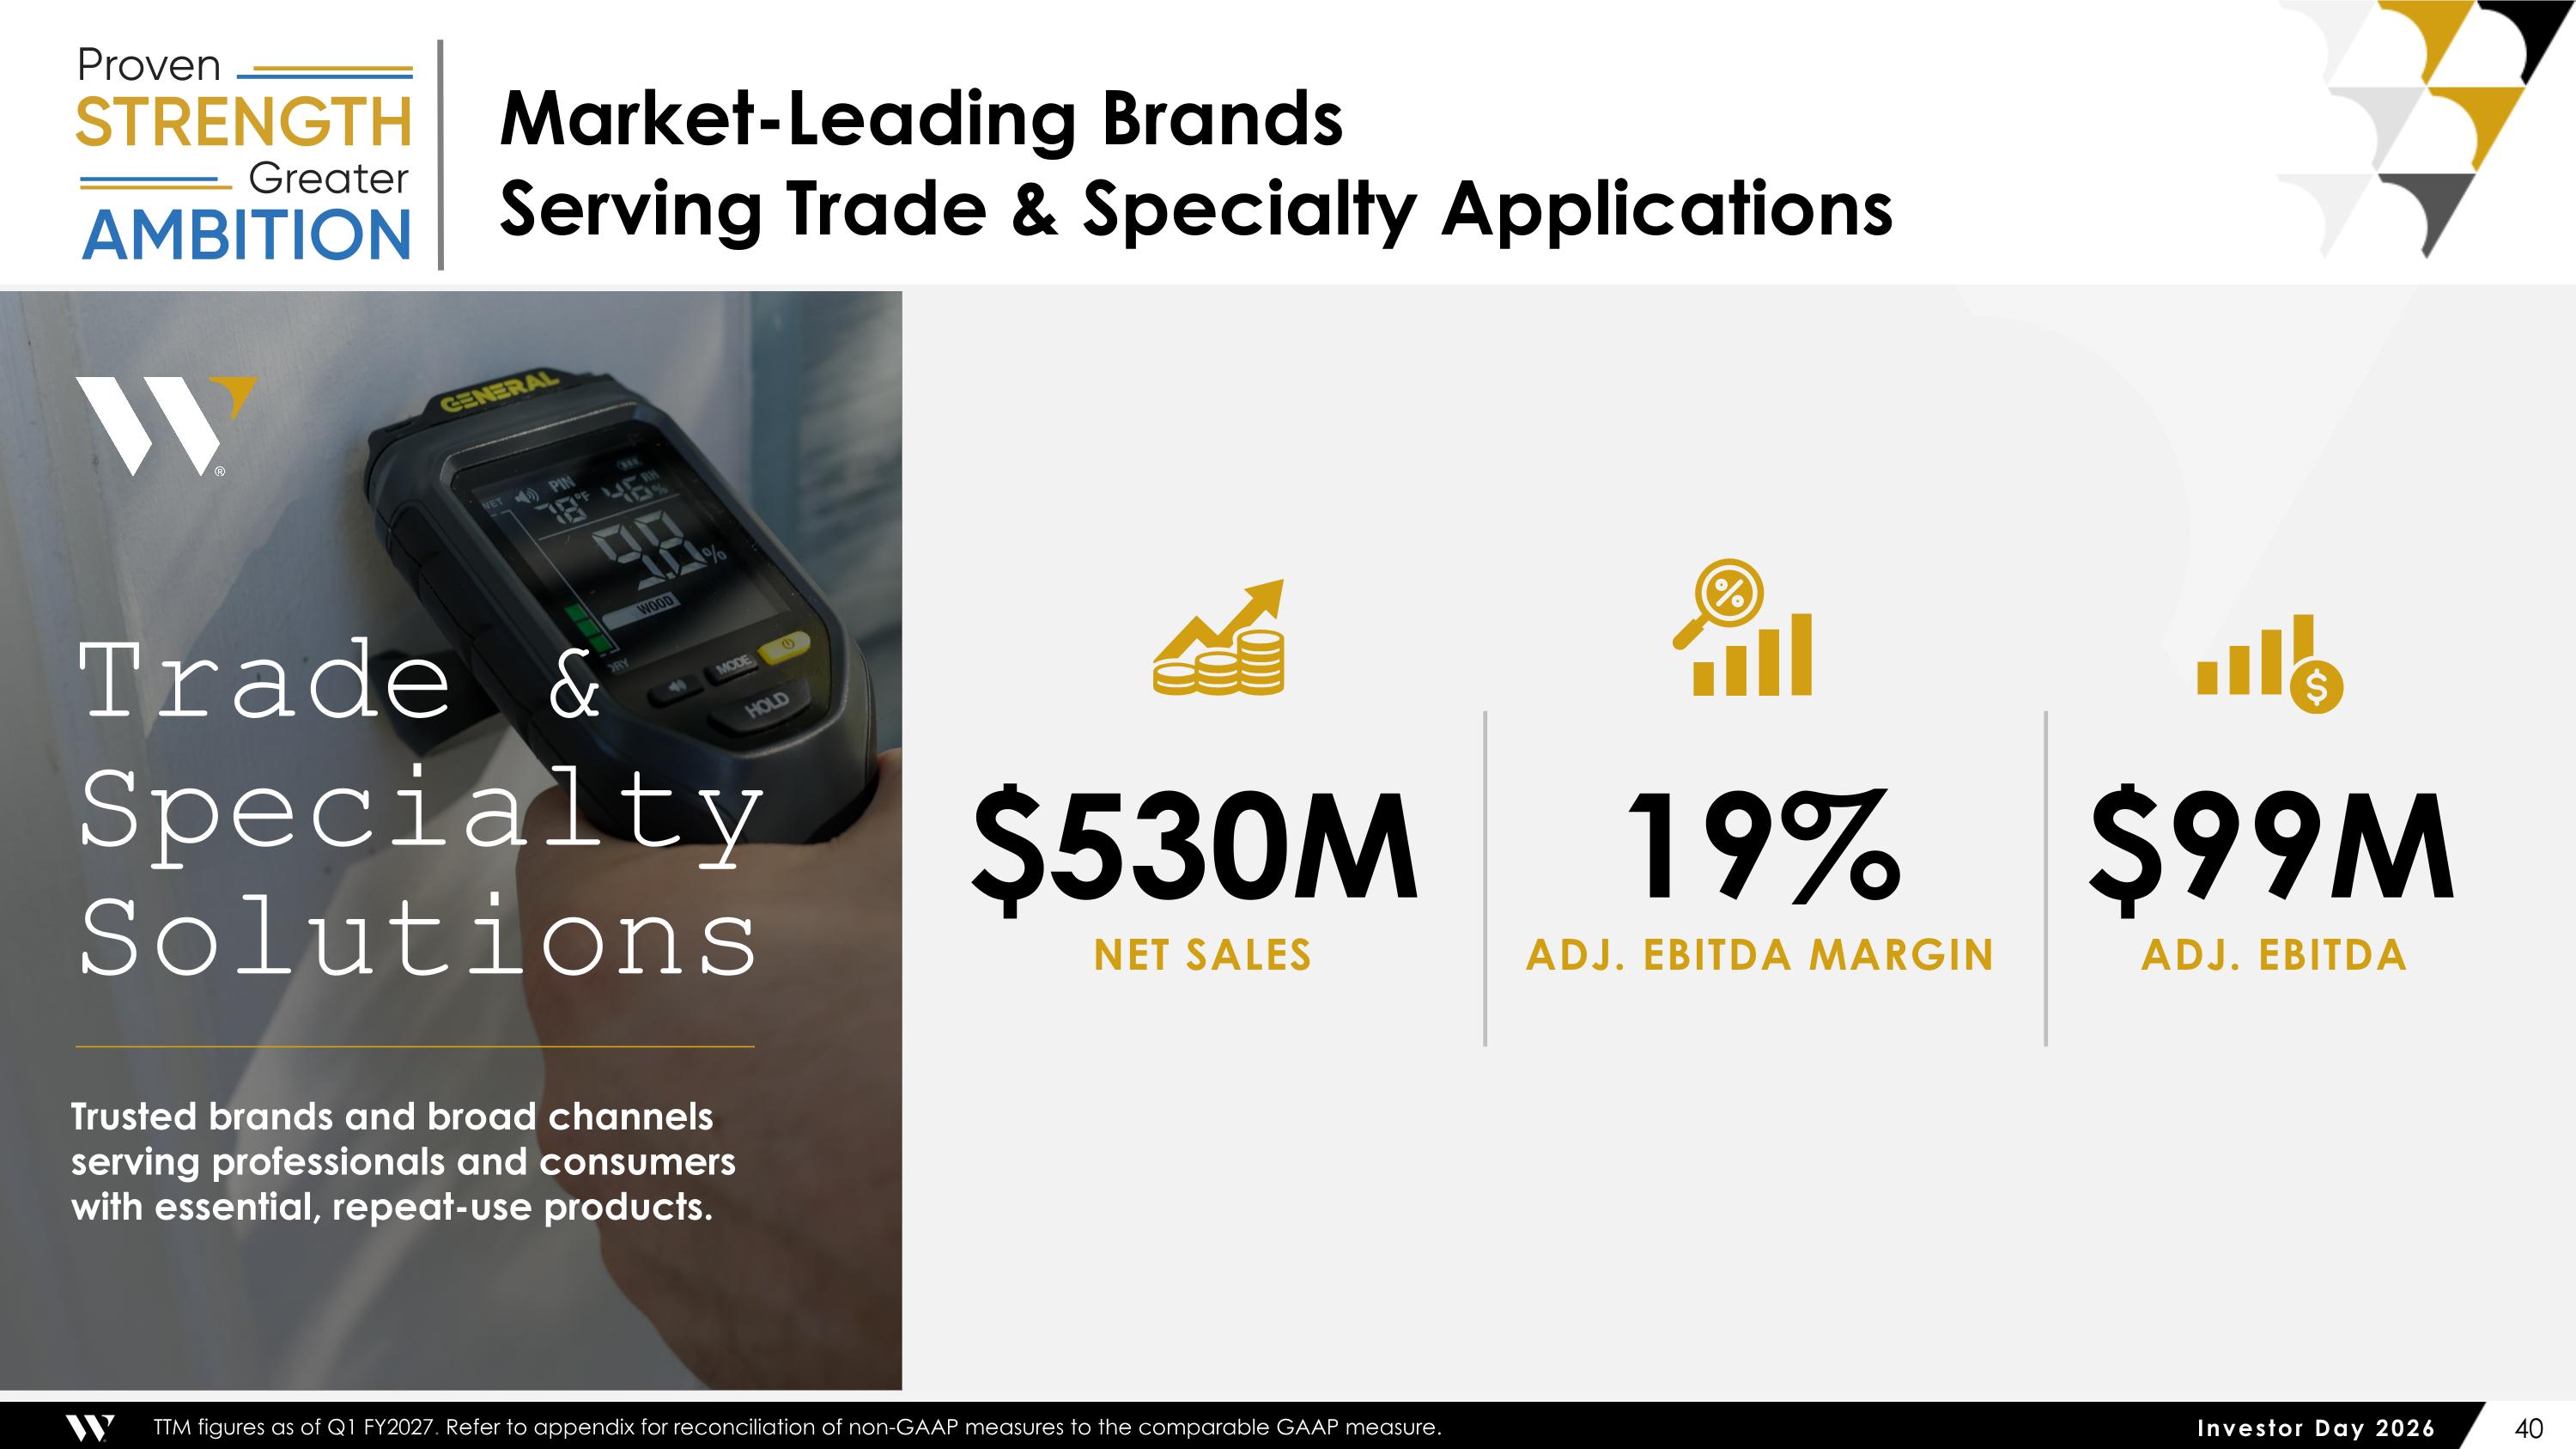
Market-Leading Brands Serving Trade & Specialty Applications TTM figures as of Q1 FY2027. Refer to appendix for reconciliation of non-GAAP measures to the comparable GAAP measure. $530M NET SALES 19% ADJ. EBITDA MARGIN $99M ADJ. EBITDA Trusted brands and broad channels serving professionals and consumers with essential, repeat-use products. Trade & Specialty Solutions
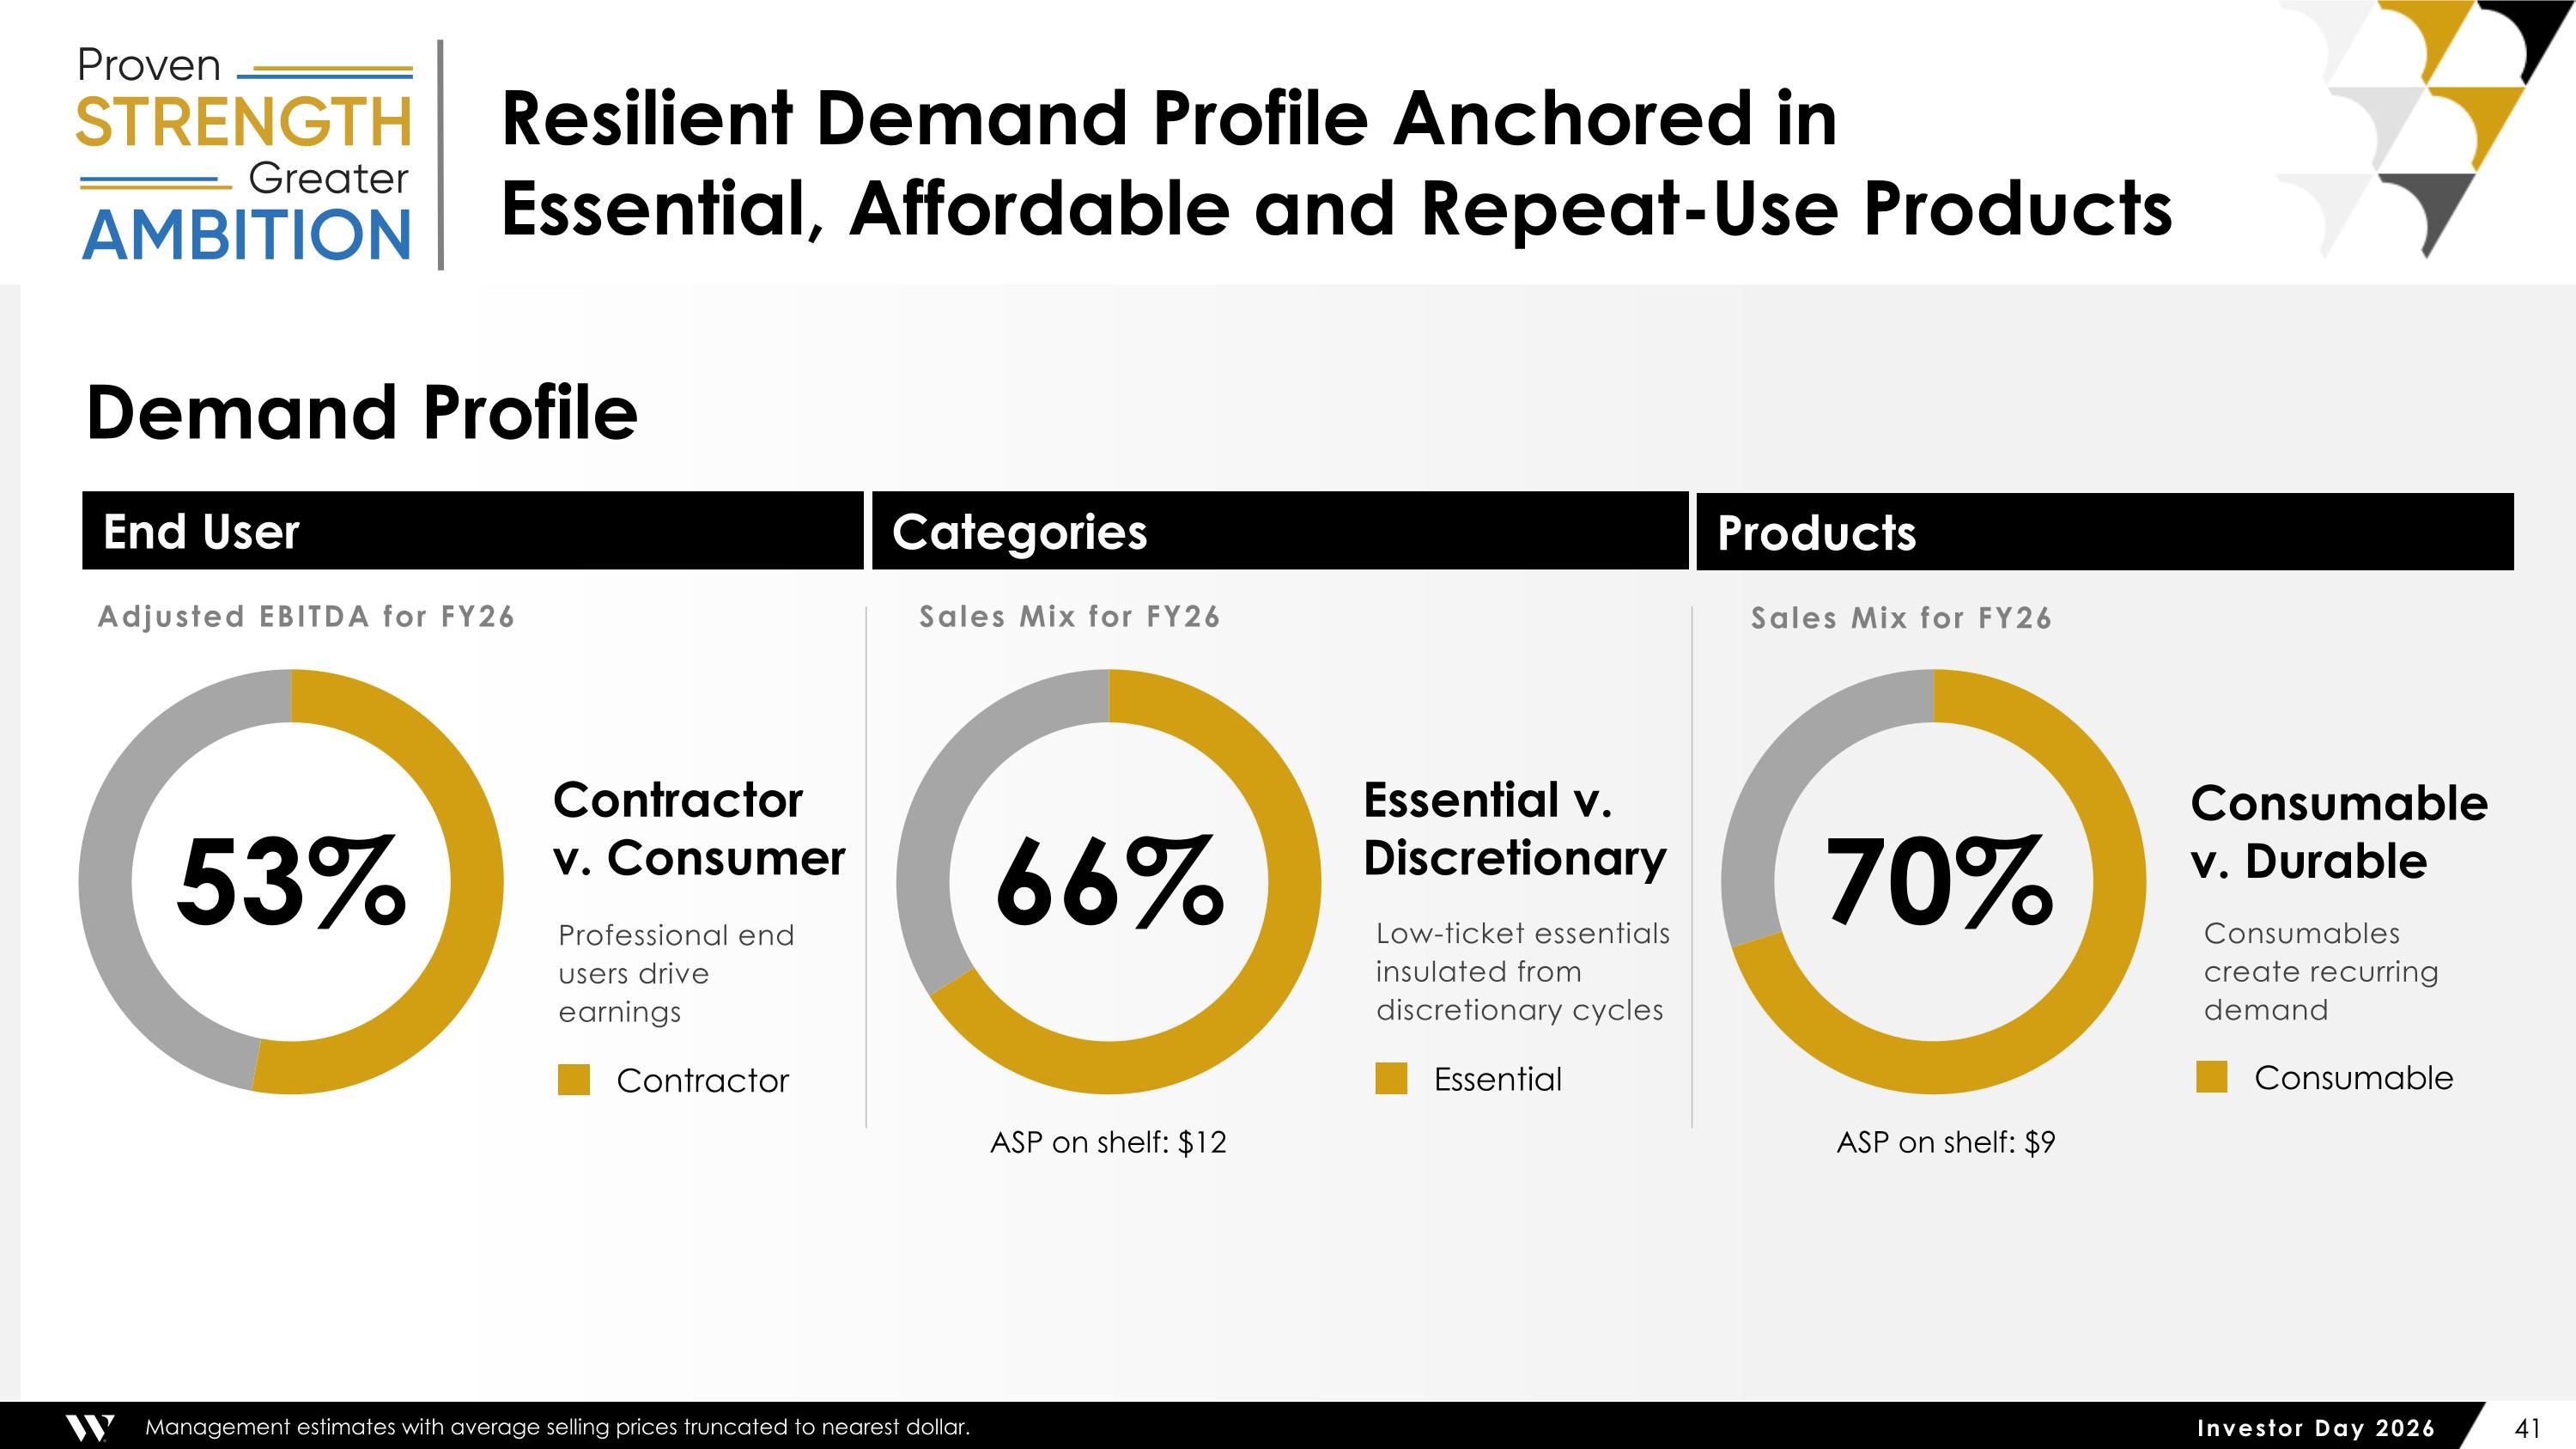
Resilient Demand Profile Anchored in Essential, Affordable and Repeat-Use Products Essential v. Discretionary Low-ticket essentials insulated from discretionary cycles 66% Contractor v. Consumer Professional end users drive earnings 53% Consumable v. Durable Consumables create recurring demand 70% End User ASP on shelf: $12 ASP on shelf: $9 Contractor Essential Consumable Categories Products Demand Profile Management estimates with average selling prices truncated to nearest dollar. Adjusted EBITDA for FY26 Sales Mix for FY26 Sales Mix for FY26
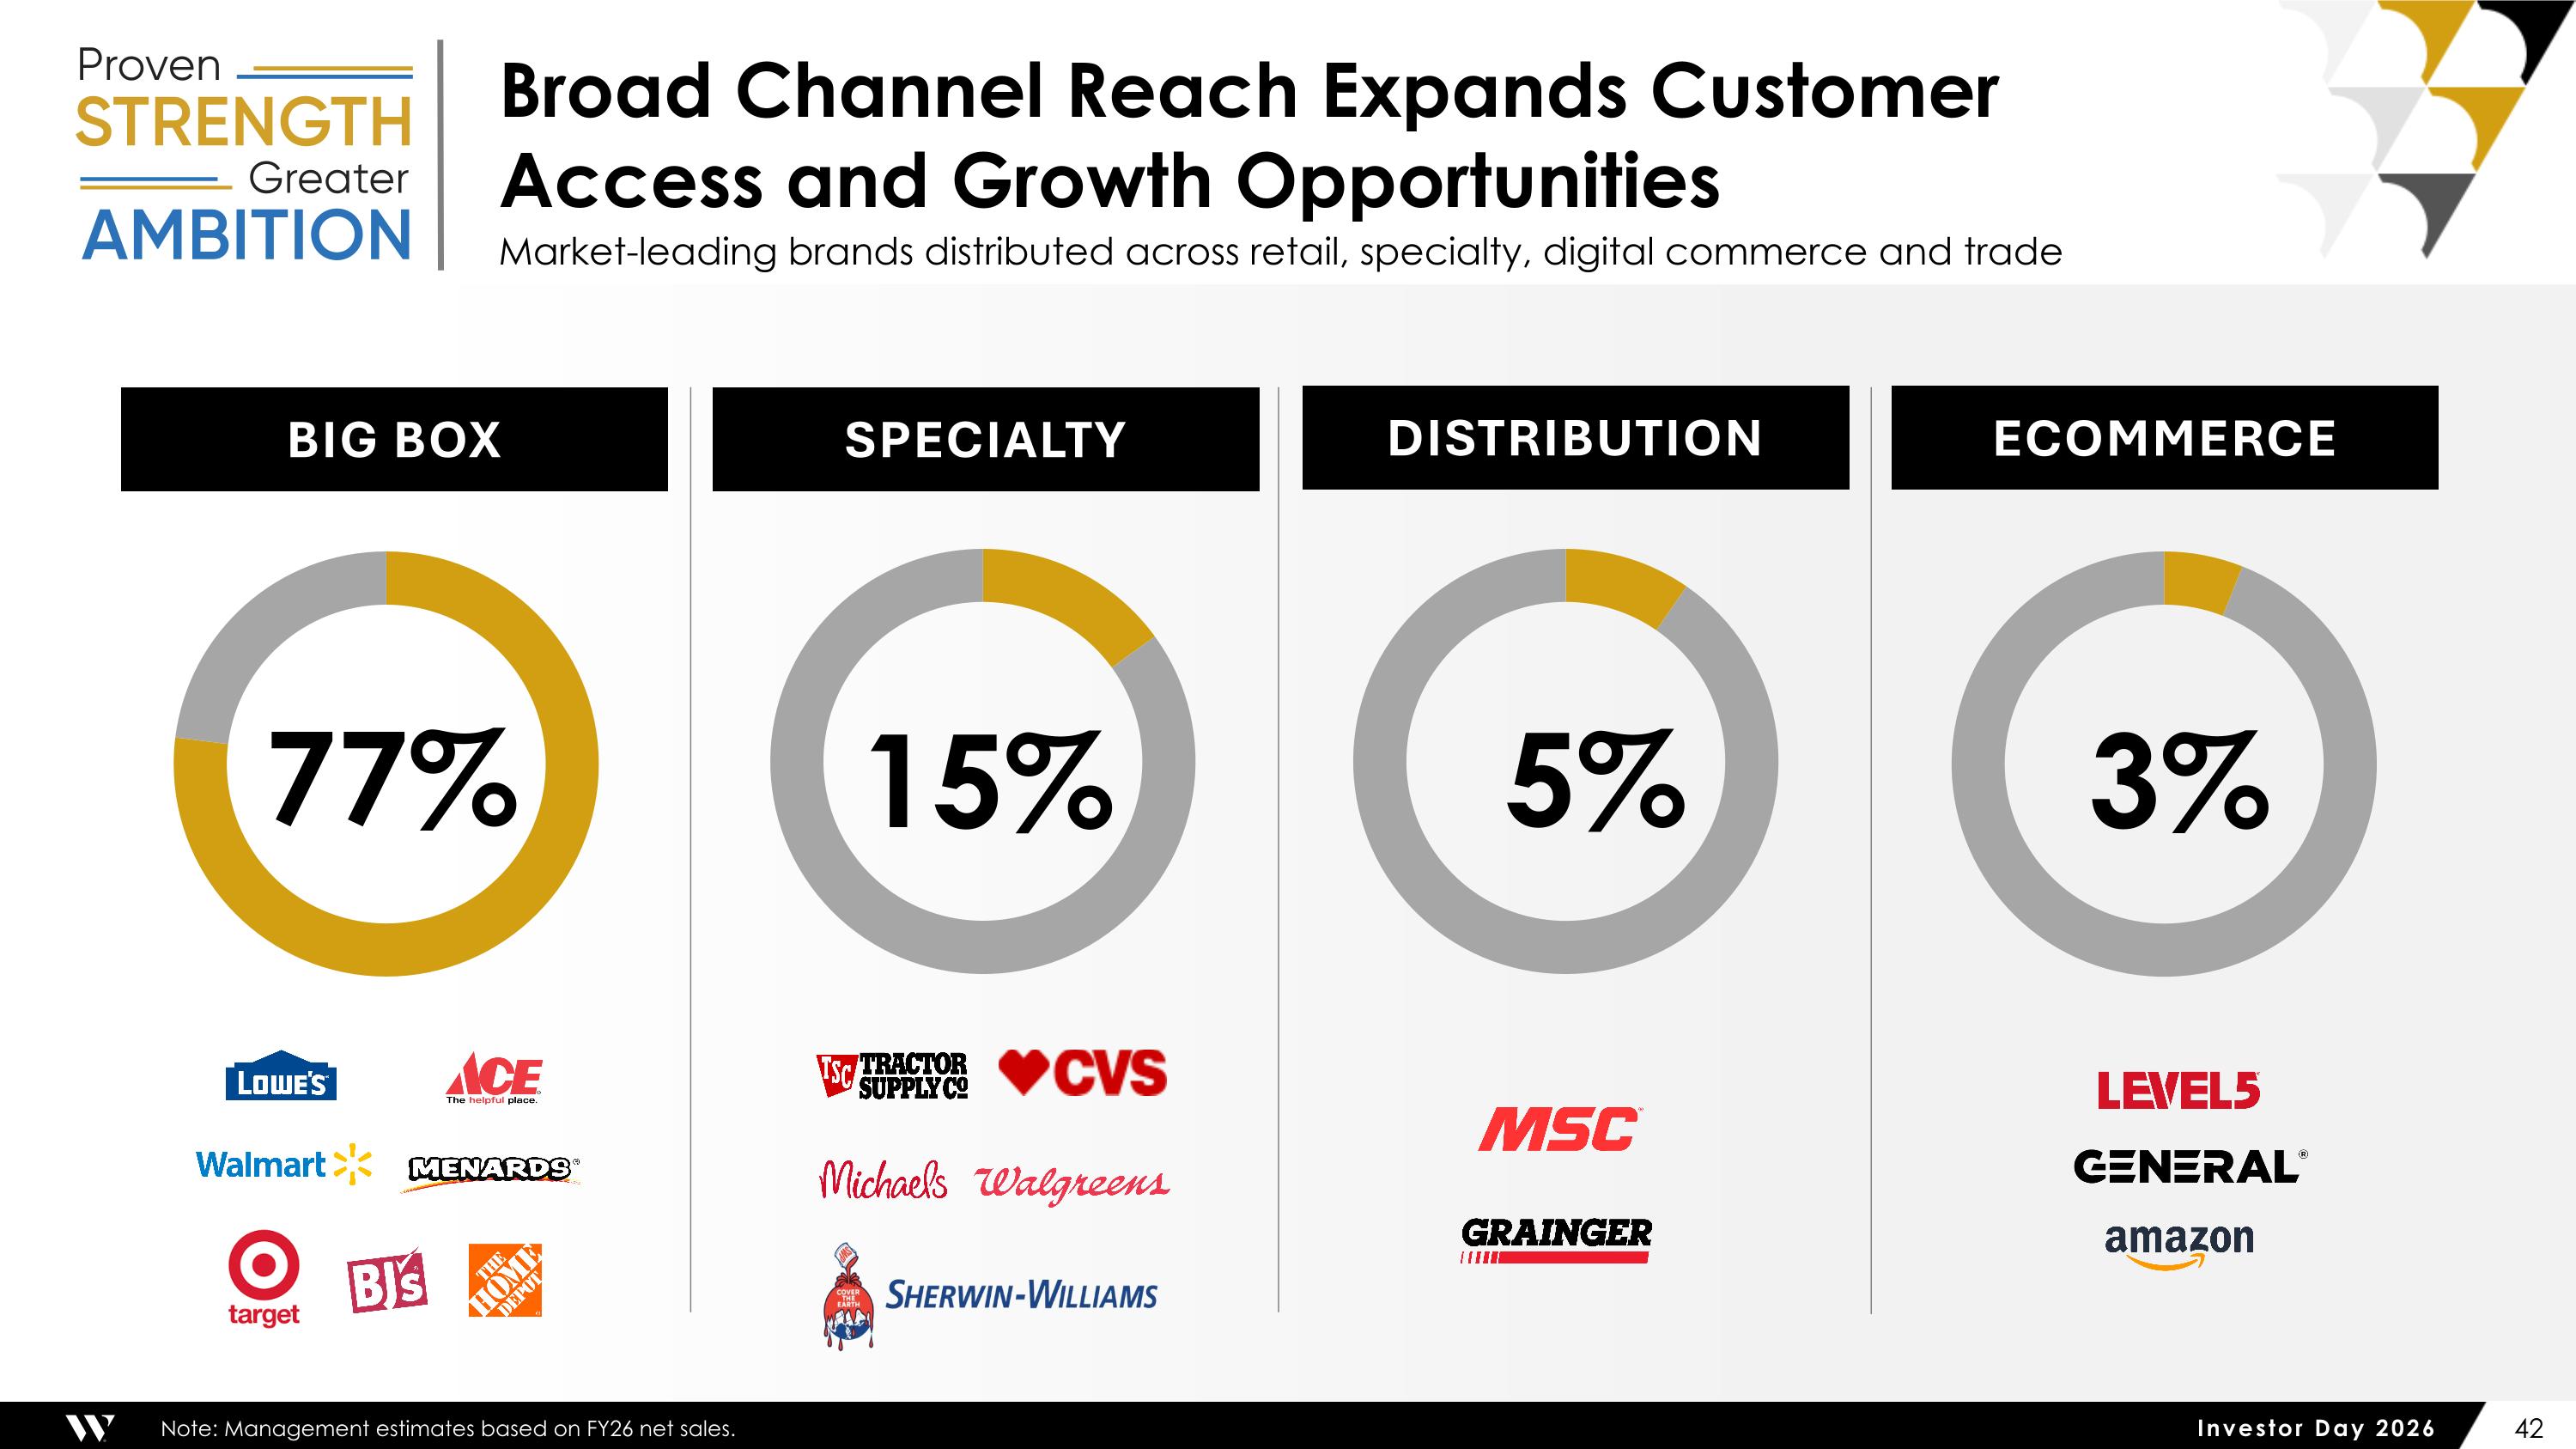
BIG BOX SPECIALTY DISTRIBUTION Ecommerce 77% 15% 5% 3% Broad Channel Reach Expands Customer Access and Growth Opportunities Market-leading brands distributed across retail, specialty, digital commerce and trade Note: Management estimates based on FY26 net sales.

Designing and Manufacturing Reliable and Trusted Solutions for Professionals and Consumers Trade & Specialty Solutions

The Worthington Business System Turning Innovation & Transformation into a Competitive Advantage Trade & Specialty Solutions
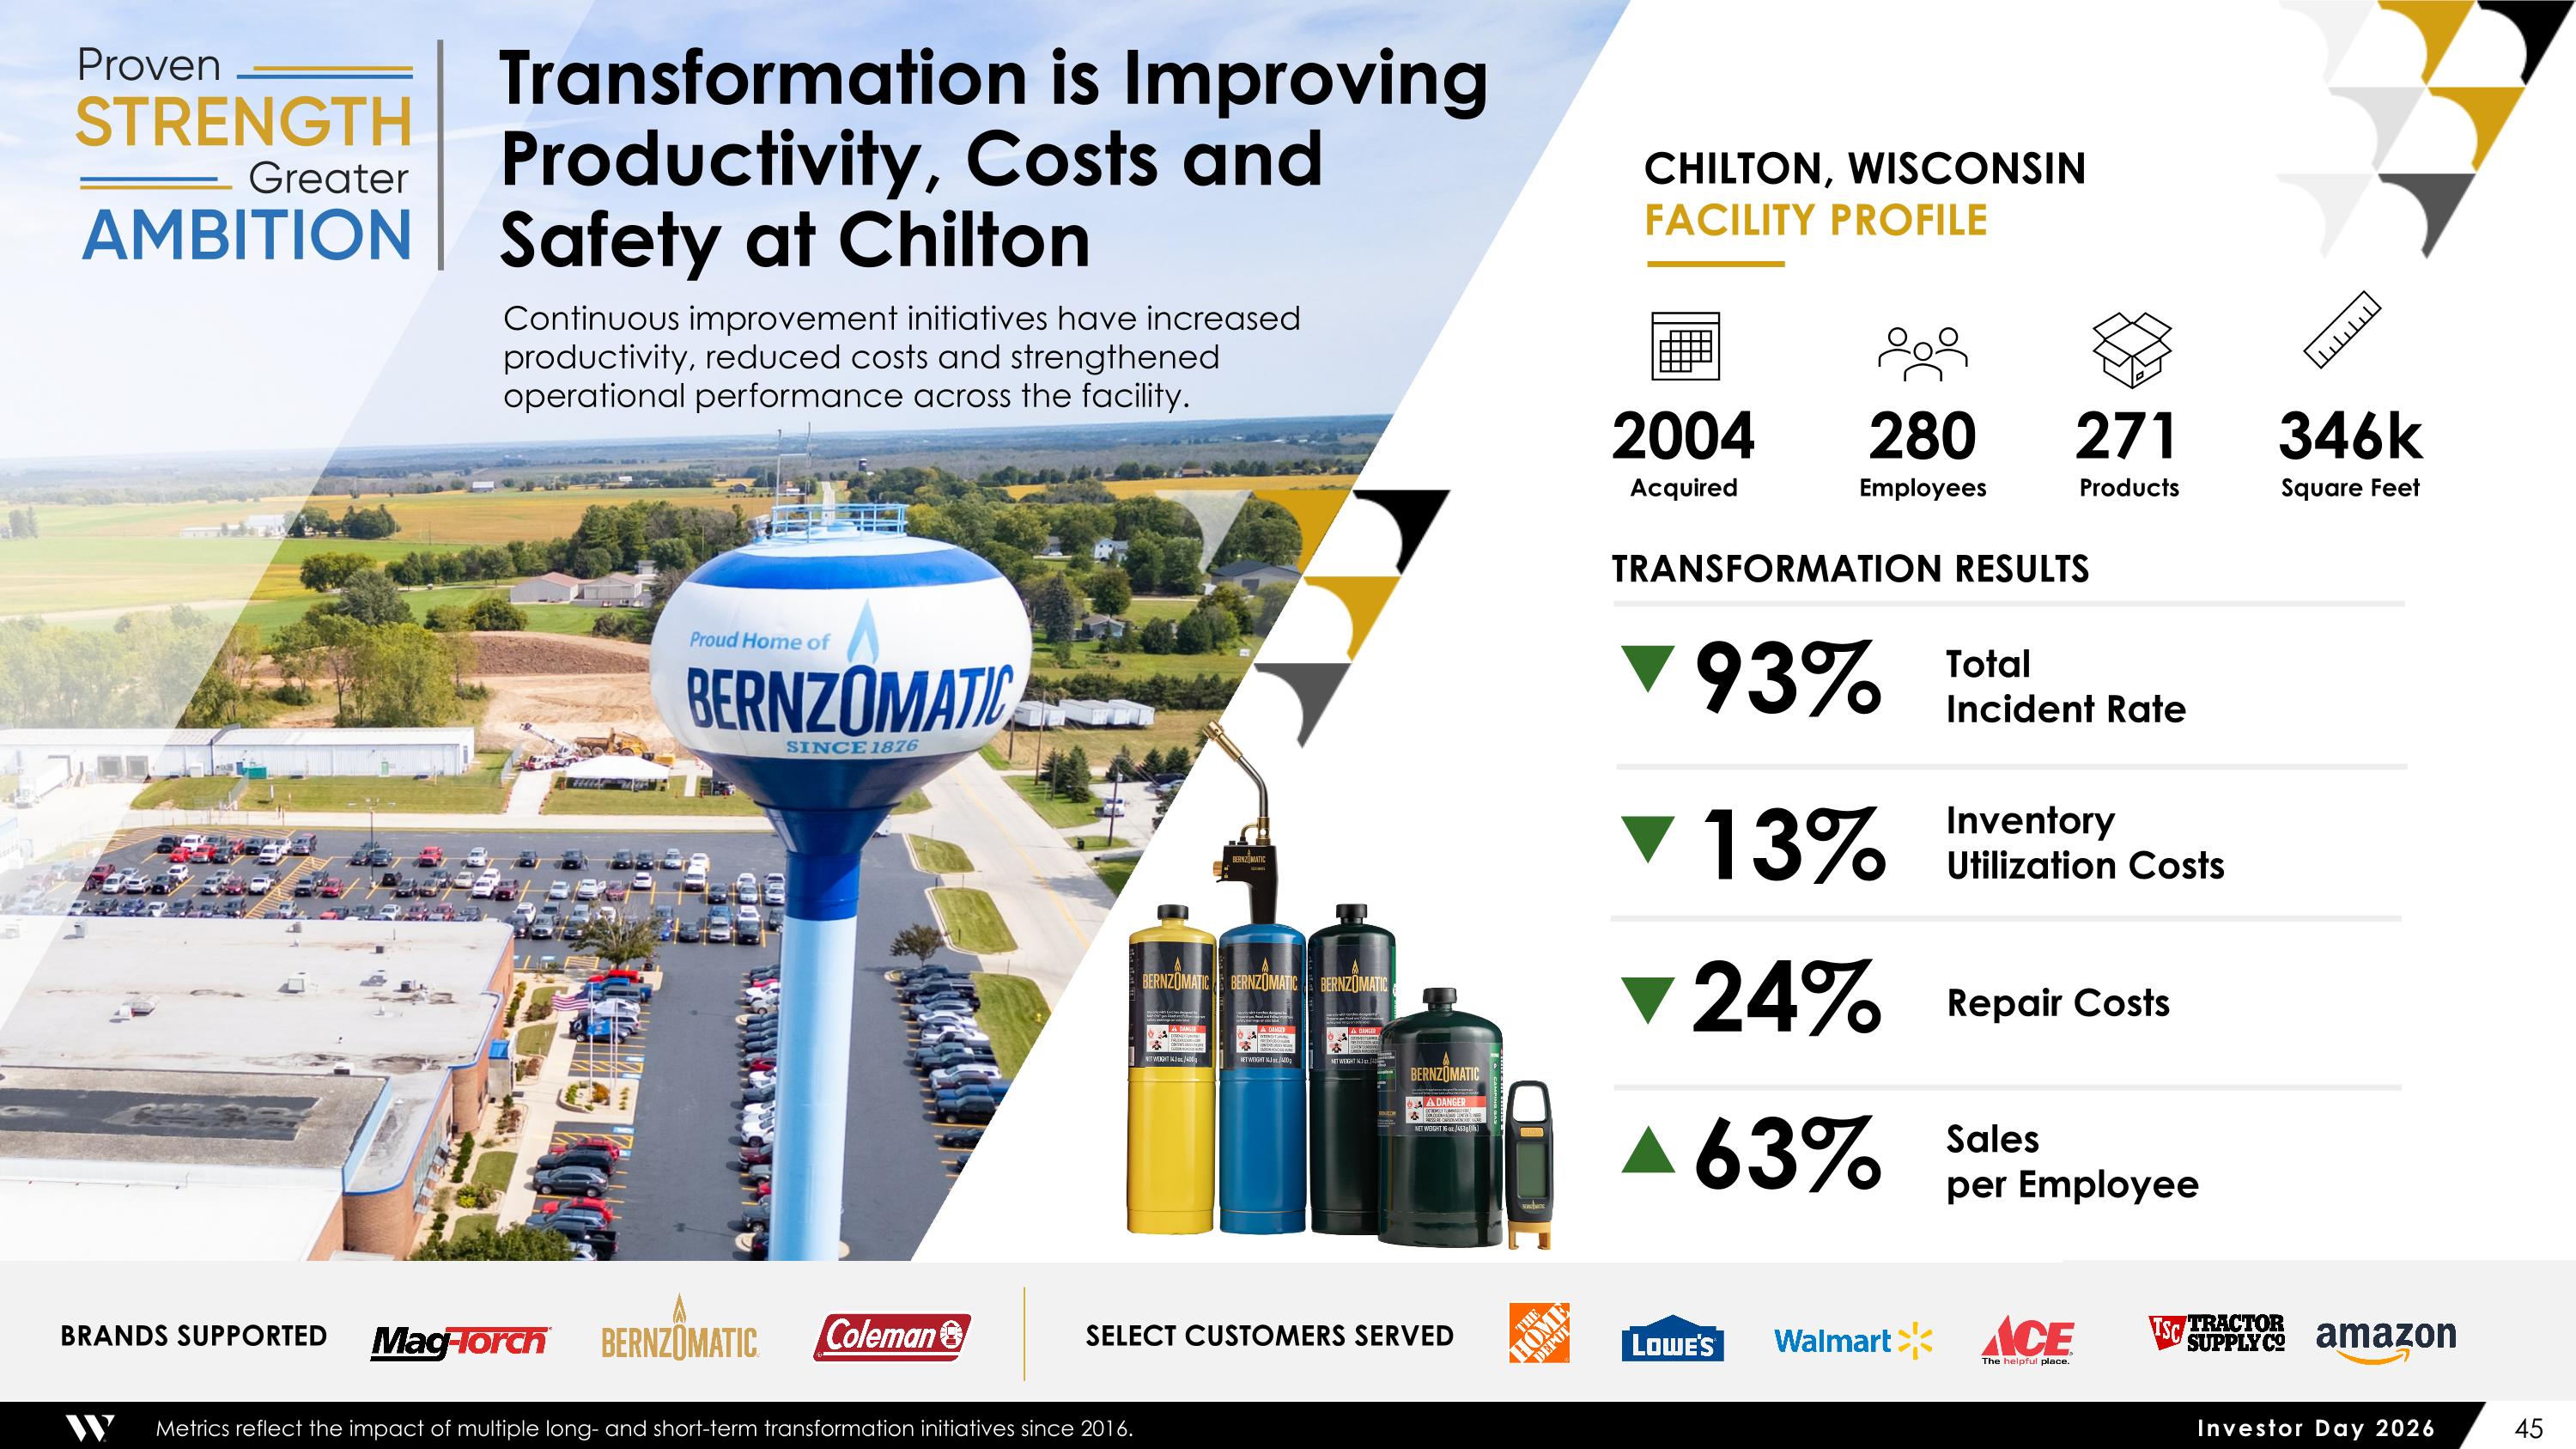
BRANDS SUPPORTED SELECT CUSTOMERS SERVED Metrics reflect the impact of multiple long- and short-term transformation initiatives since 2016. TRANSFORMATION RESULTS 13% Inventory Utilization Costs 280 Employees 2004 Acquired 271 Products 346k Square Feet CHILTON, WISCONSIN FACILITY PROFILE Transformation is Improving Productivity, Costs and Safety at Chilton Continuous improvement initiatives have increased productivity, reduced costs and strengthened operational performance across the facility. 93% Total Incident Rate ▲ ▲ 24% Repair Costs ▲ 63% Sales per Employee ▲
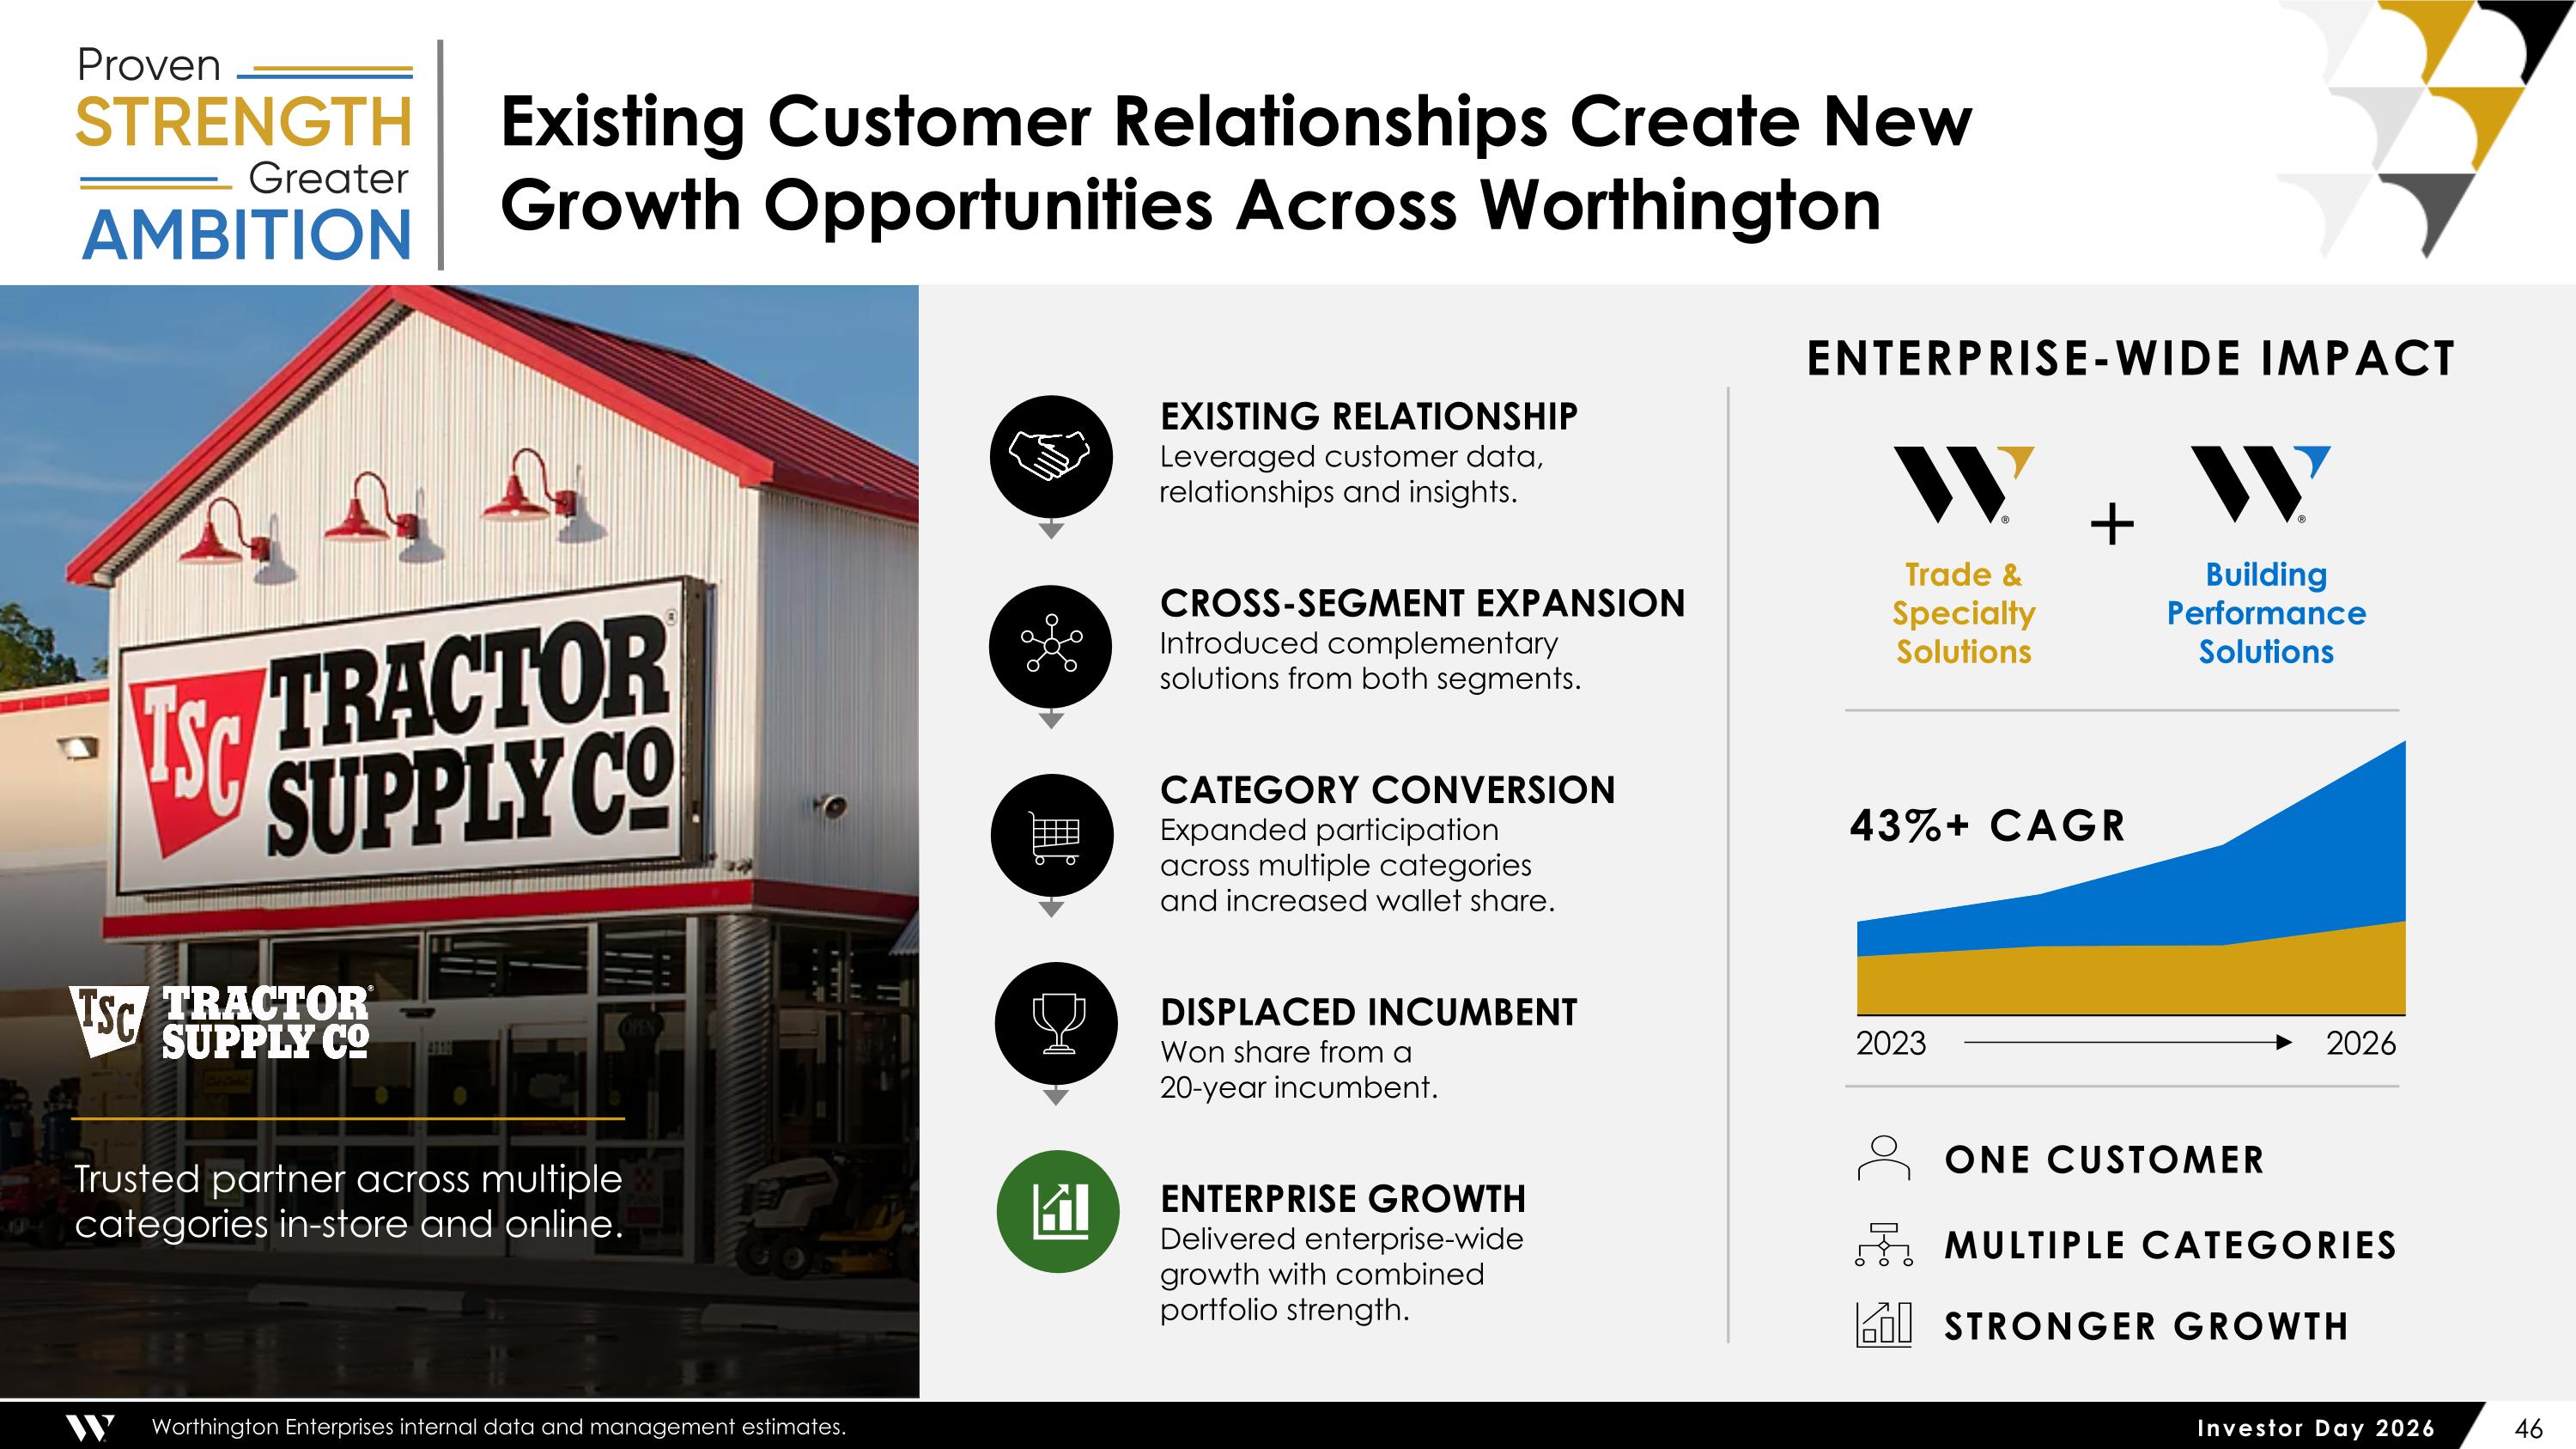
Existing Customer Relationships Create New Growth Opportunities Across Worthington ENTERPRISE-WIDE IMPACT Building Performance Solutions Trade & Specialty Solutions + ONE CUSTOMER MULTIPLE CATEGORIES STRONGER GROWTH EXISTING RELATIONSHIP Leveraged customer data, relationships and insights. CROSS-SEGMENT EXPANSION Introduced complementary solutions from both segments. CATEGORY CONVERSION Expanded participation across multiple categories and increased wallet share. DISPLACED INCUMBENT Won share from a 20-year incumbent. ENTERPRISE GROWTH Delivered enterprise-wide growth with combined portfolio strength. Trusted partner across multiple categories in-store and online. 2023 2026 43%+ CAGR Worthington Enterprises internal data and management estimates.
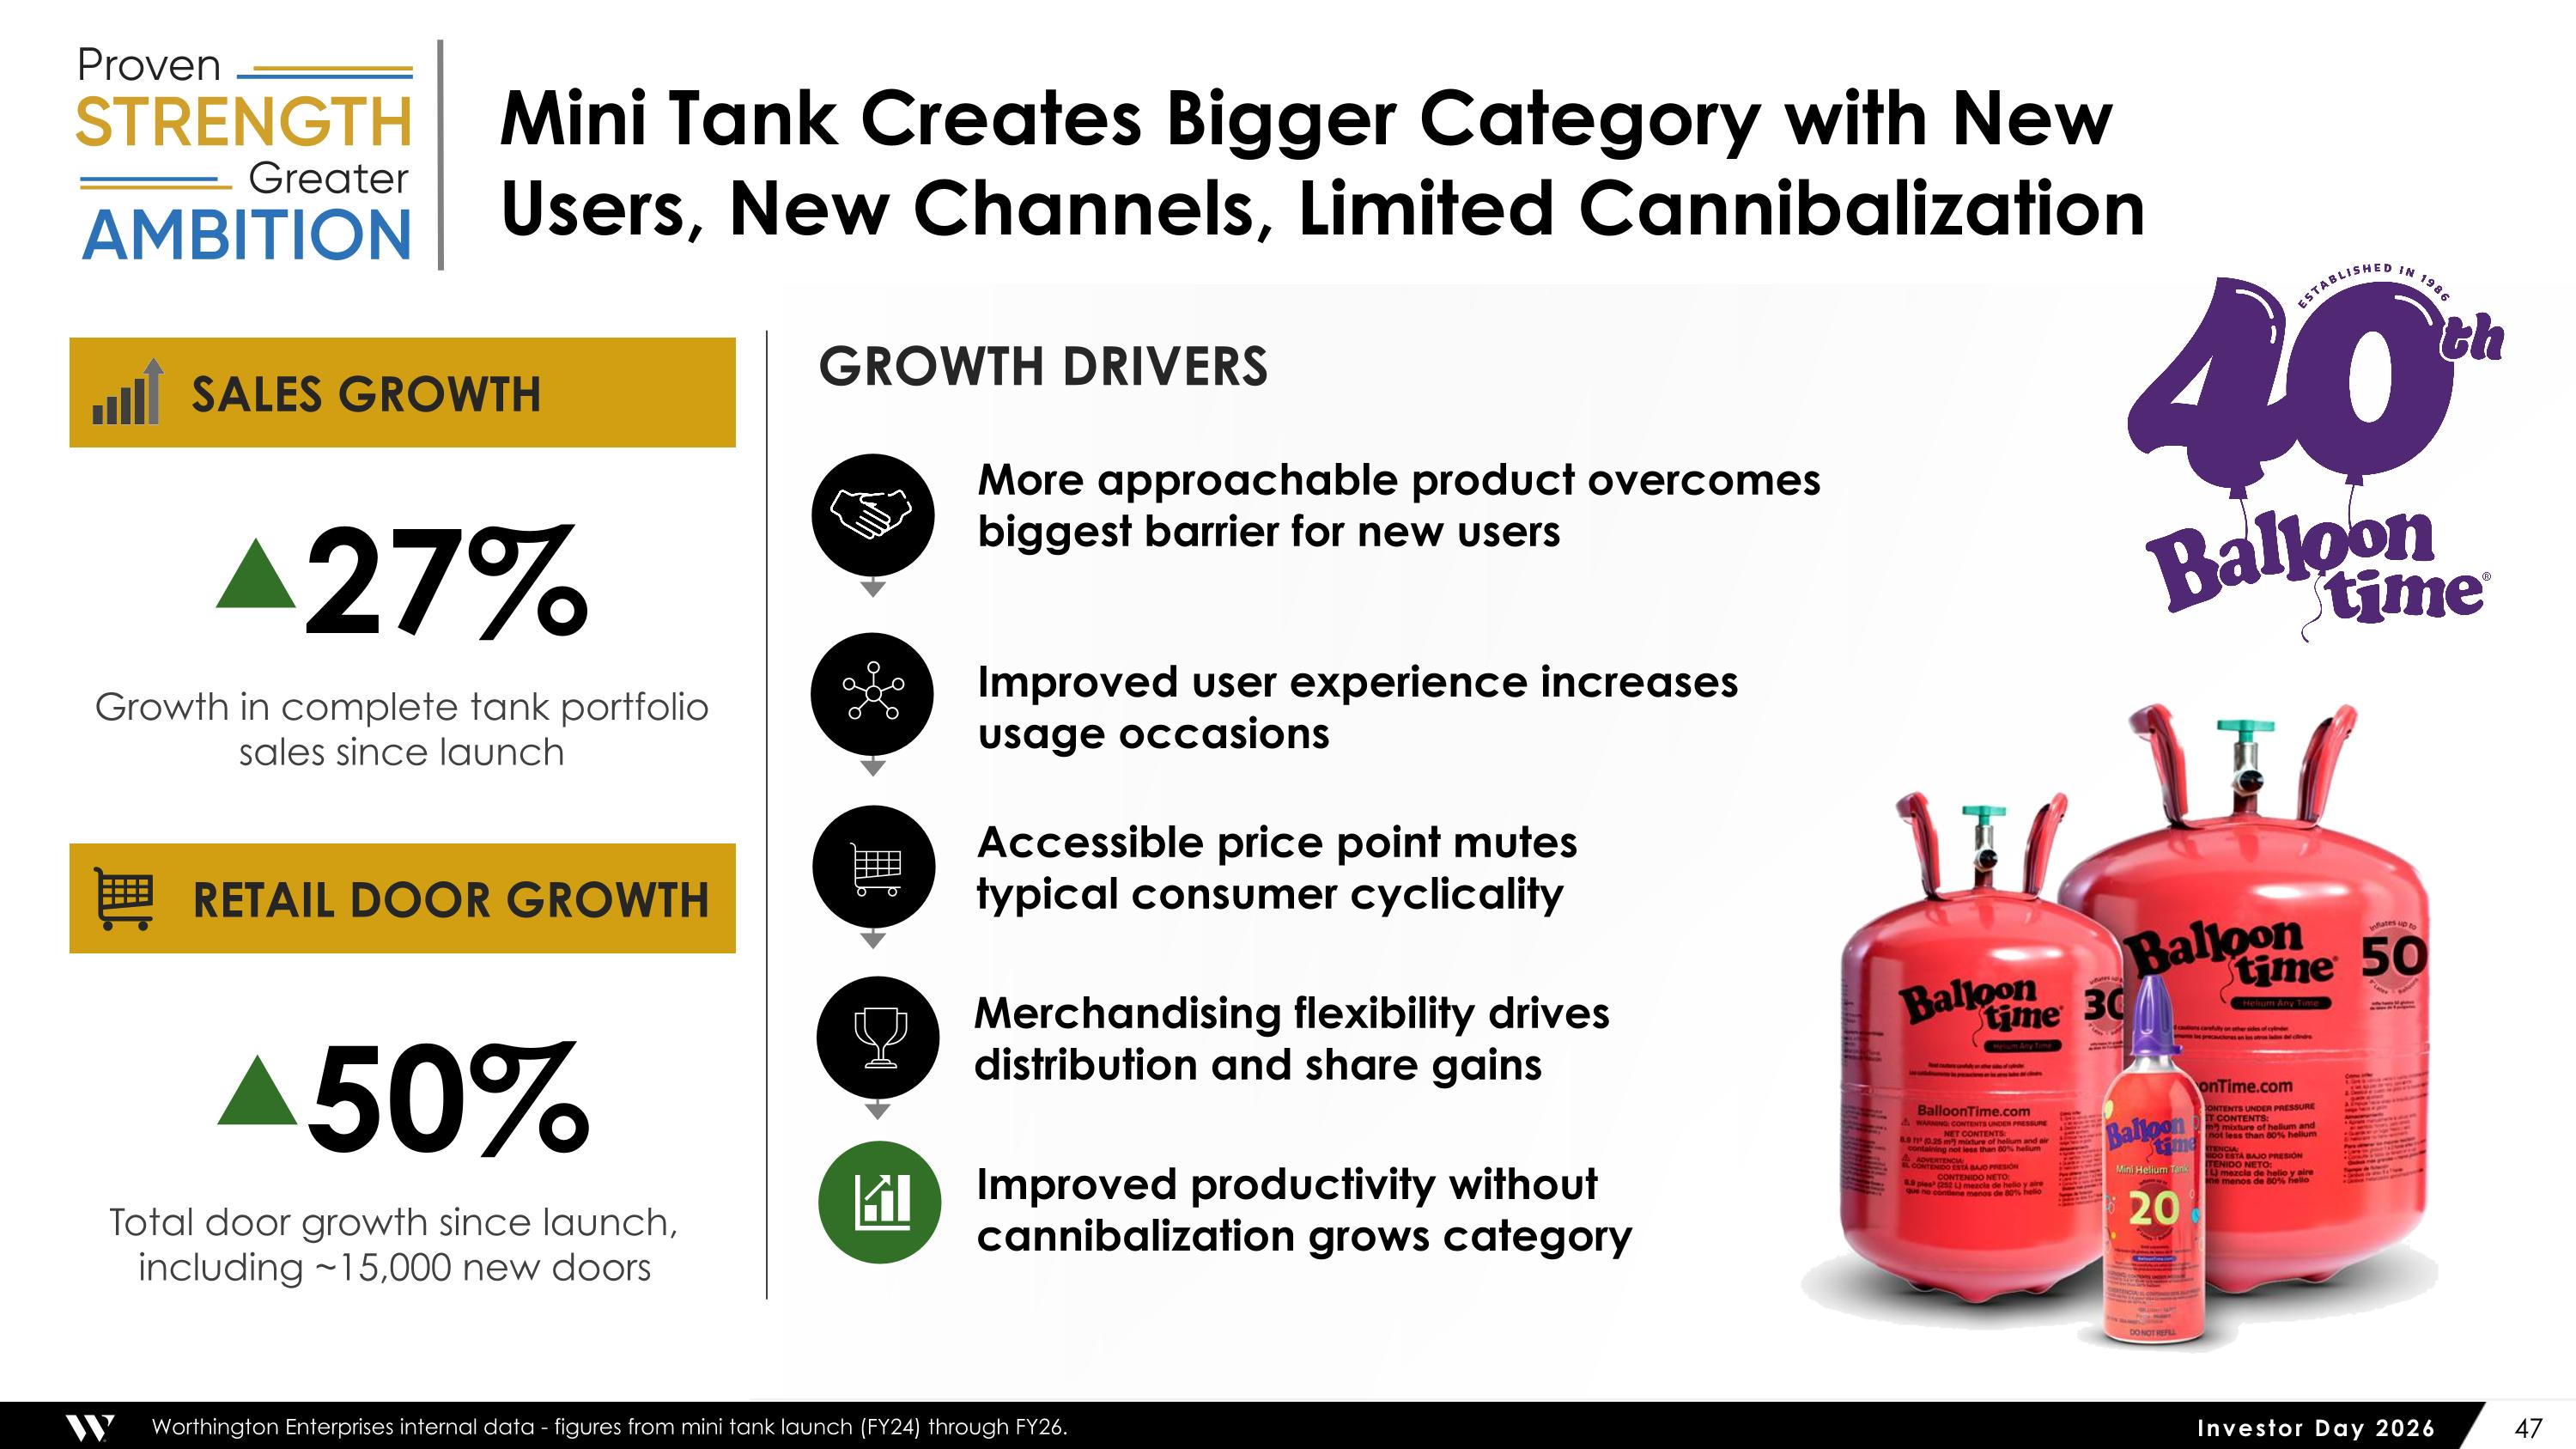
Mini Tank Creates Bigger Category with New Users, New Channels, Limited Cannibalization ▲50% Total door growth since launch, including ~15,000 new doors ▲27% Growth in complete tank portfolio sales since launch SALES GROWTH RETAIL DOOR GROWTH GROWTH DRIVERS More approachable product overcomes biggest barrier for new users Improved user experience increases usage occasions Accessible price point mutes typical consumer cyclicality Merchandising flexibility drives distribution and share gains Improved productivity without cannibalization grows category Worthington Enterprises internal data - figures from mini tank launch (FY24) through FY26.
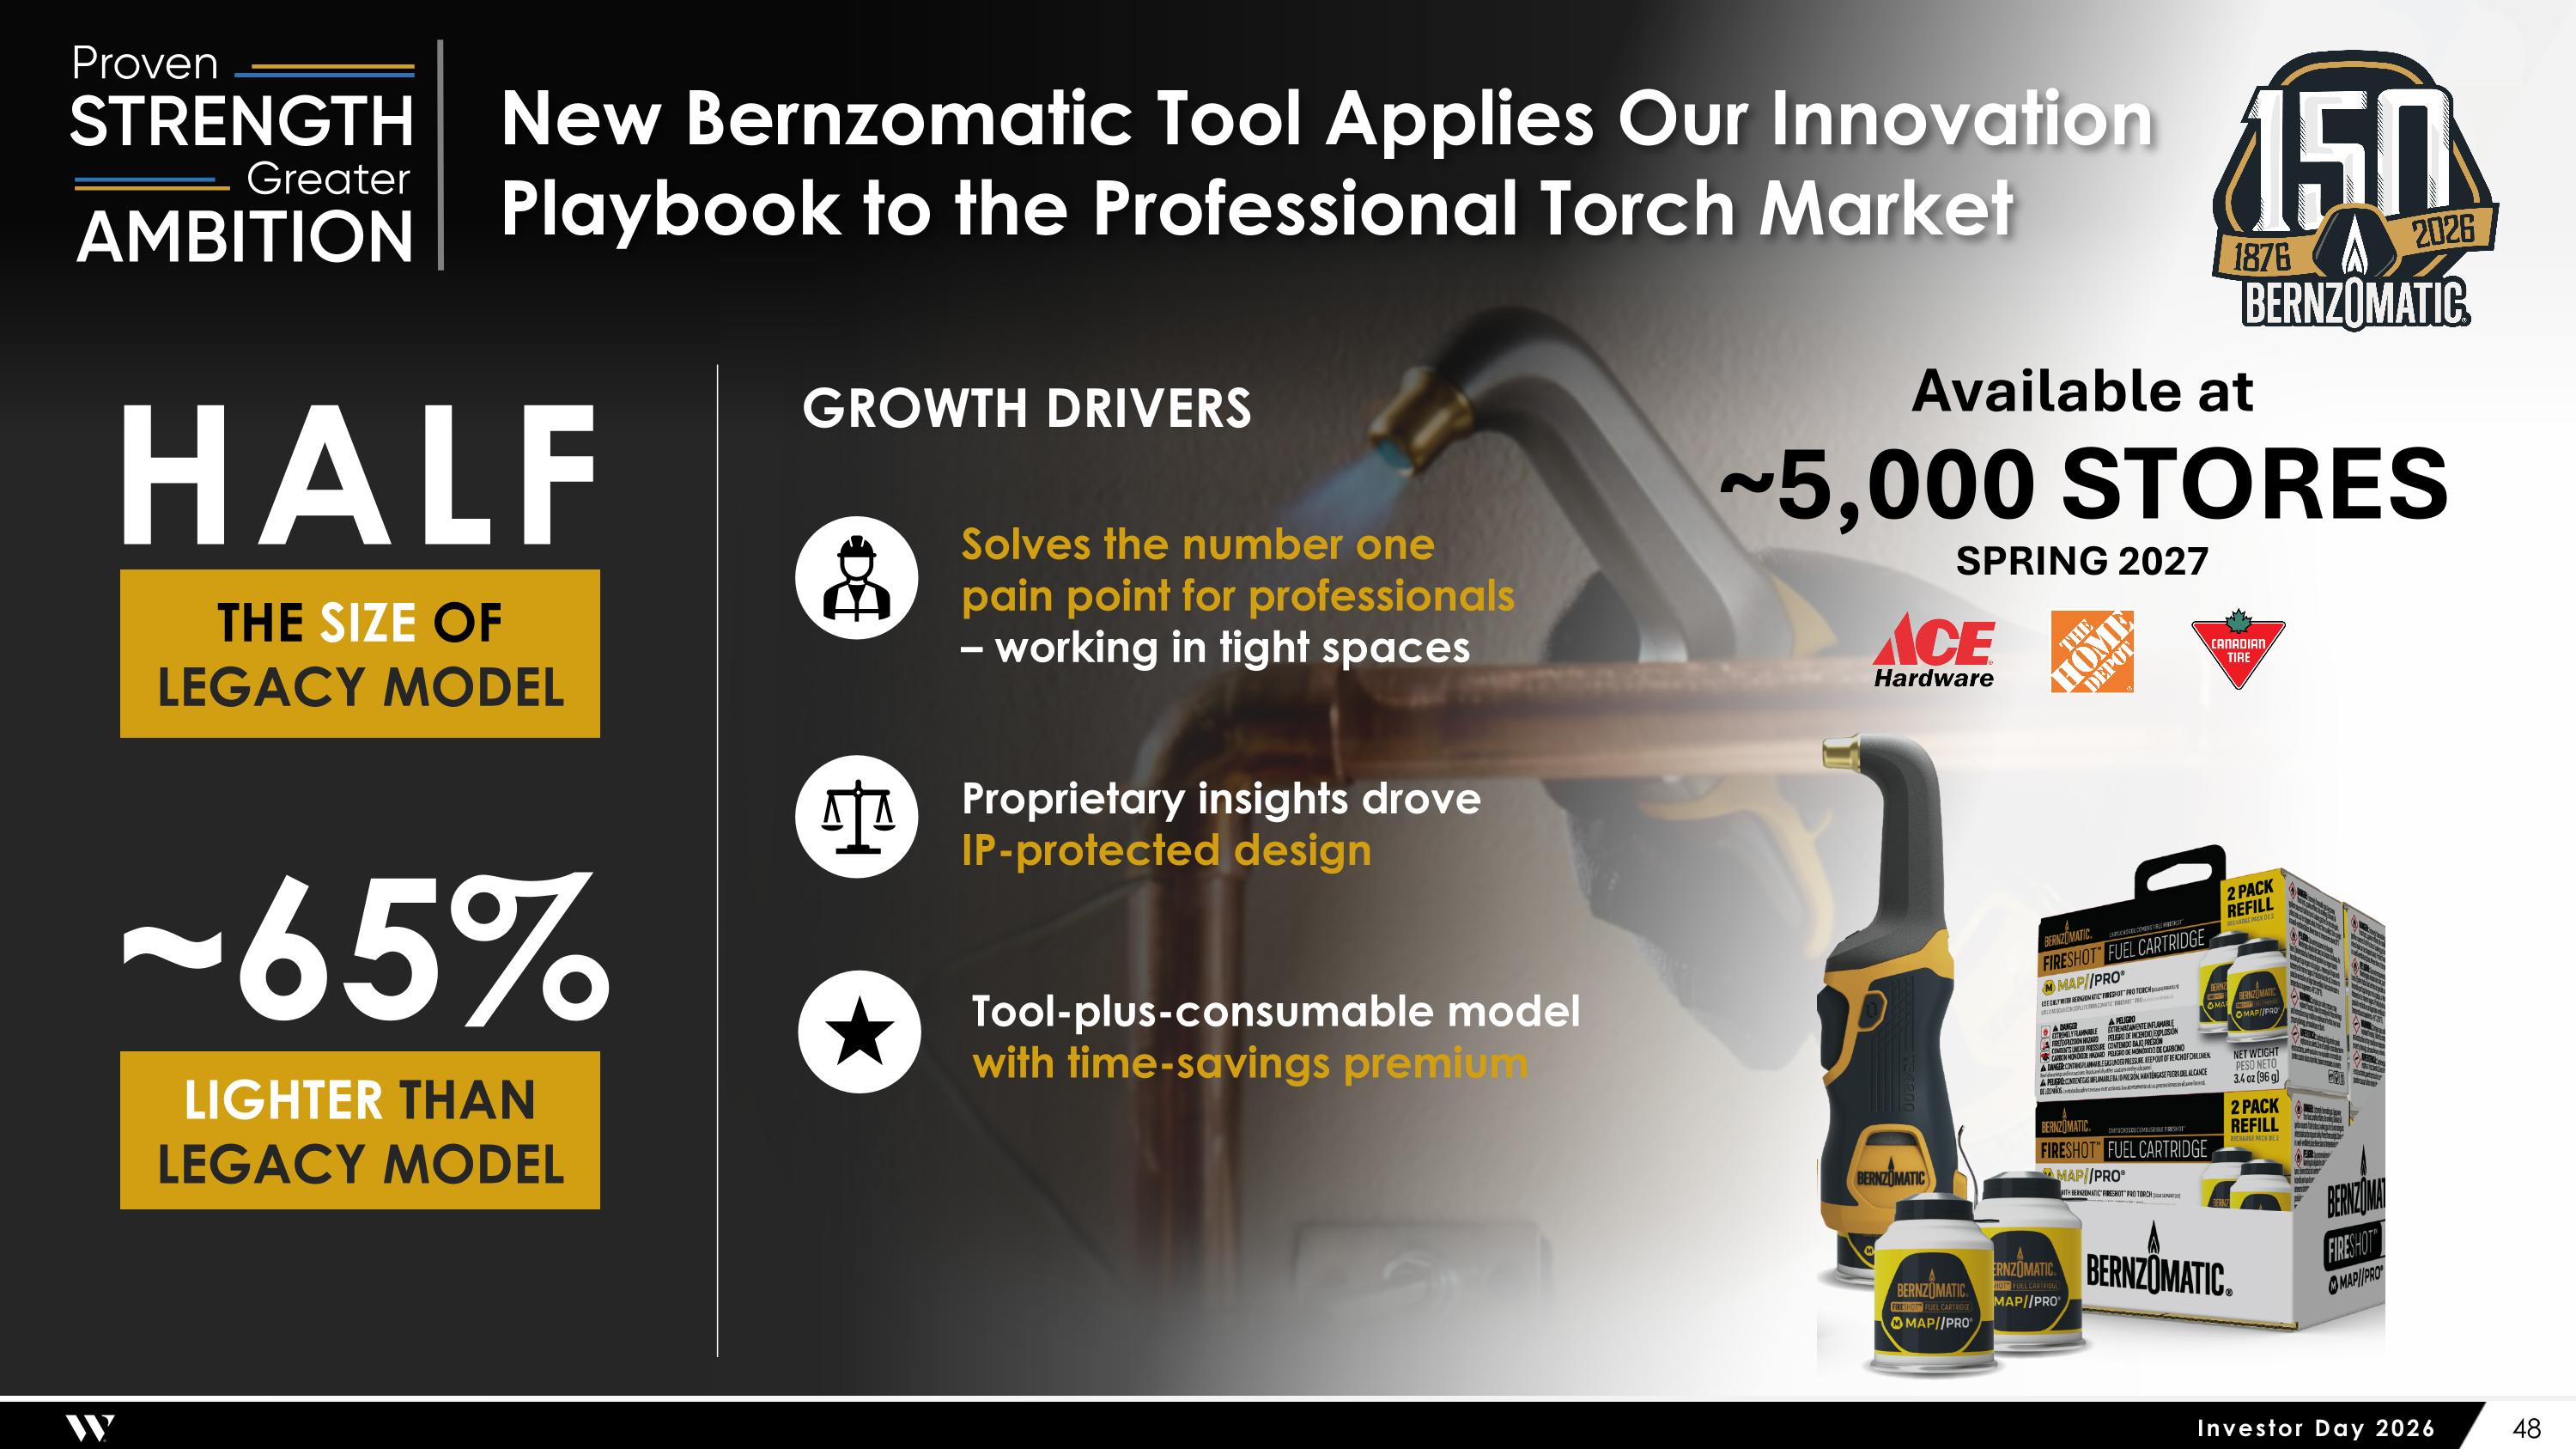
THE SIZE OF LEGACY MODEL HALF LIGHTER THAN LEGACY MODEL ~65% GROWTH DRIVERS Solves the number one pain point for professionals – working in tight spaces Proprietary insights drove IP-protected design Tool-plus-consumable model with time-savings premium New Bernzomatic Tool Applies Our Innovation Playbook to the Professional Torch Market Available at ~5,000 STORES SPRING 2027
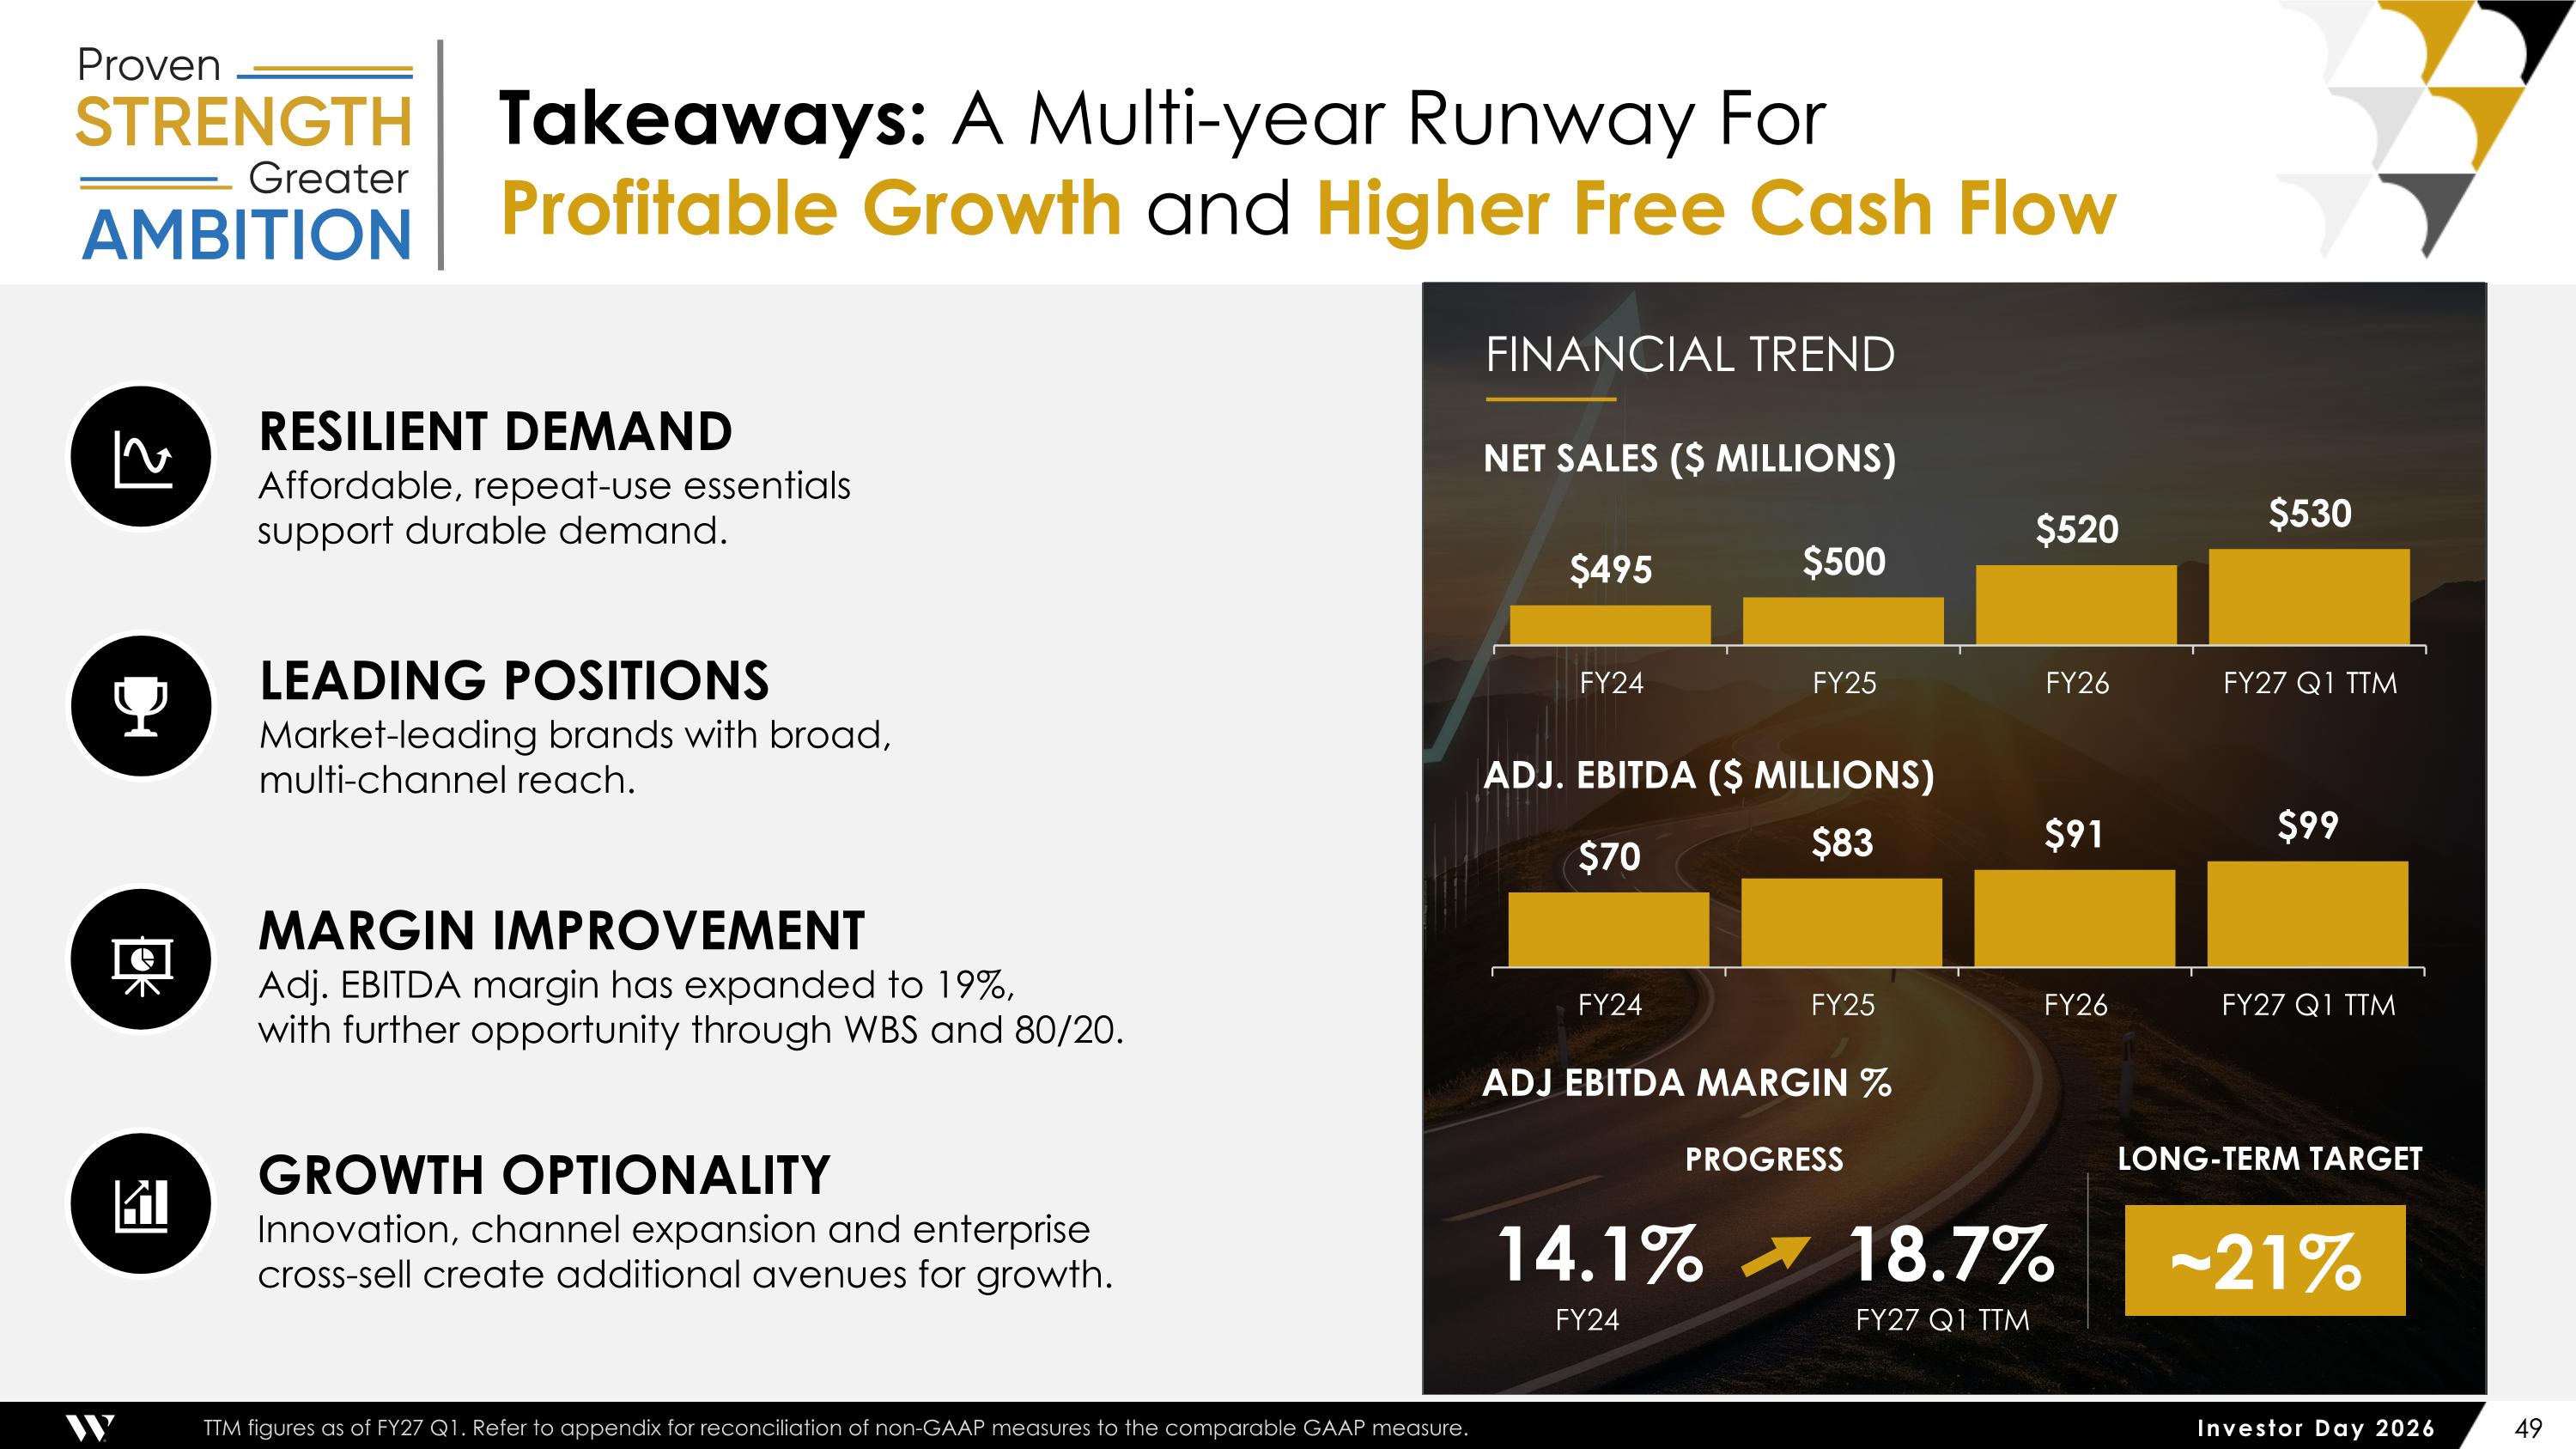
Takeaways: A Multi-year Runway For Profitable Growth and Higher Free Cash Flow FINANCIAL TREND RESILIENT DEMAND Affordable, repeat-use essentials support durable demand. LEADING POSITIONS Market-leading brands with broad, multi-channel reach. MARGIN IMPROVEMENT Adj. EBITDA margin has expanded to 19%, with further opportunity through WBS and 80/20. GROWTH OPTIONALITY Innovation, channel expansion and enterprise cross-sell create additional avenues for growth. Adj. EBITDA ($ Millions) Adj EBITDA Margin % NET SALES ($ MILLIONS) 14.1% FY24 FY27 Q1 TTM LONG-TERM TARGET ~21% 18.7% PROGRESS TTM figures as of FY27 Q1. Refer to appendix for reconciliation of non-GAAP measures to the comparable GAAP measure.
Resilient Growth & Disciplined Execution Accelerating Financial Performance
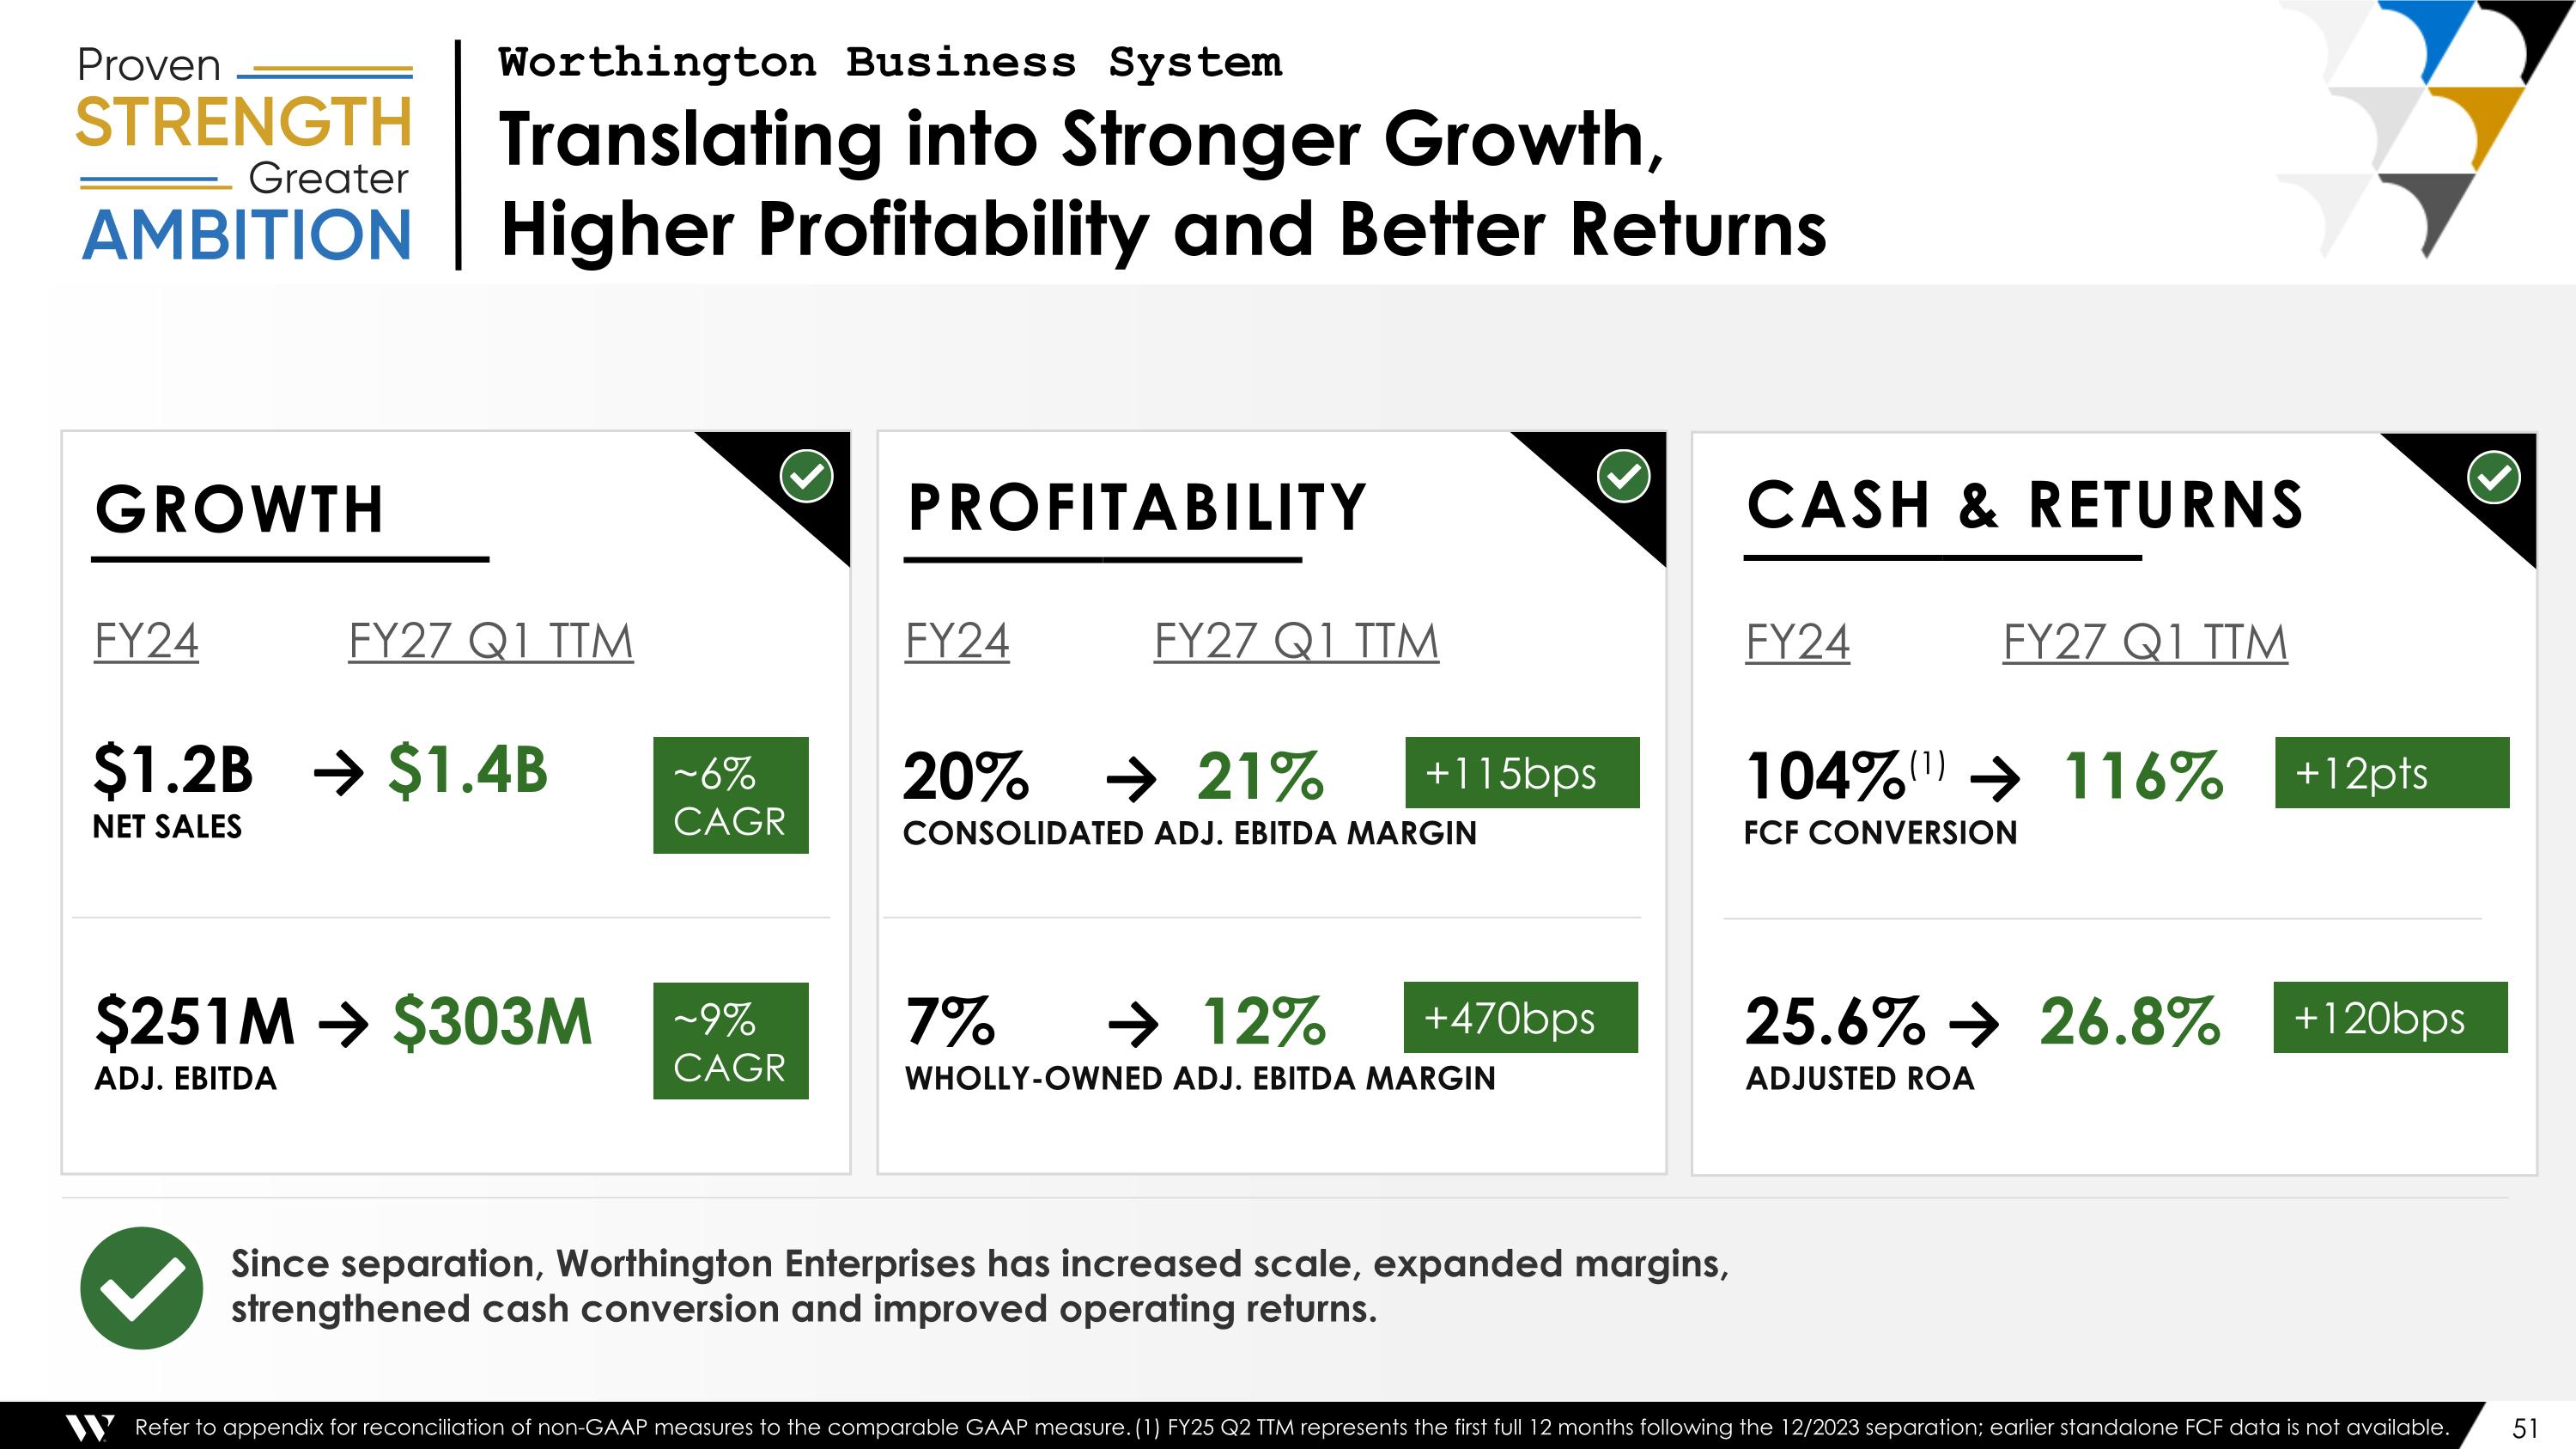
Worthington Business System Translating into Stronger Growth, Higher Profitability and Better Returns Since separation, Worthington Enterprises has increased scale, expanded margins, strengthened cash conversion and improved operating returns. GROWTH $1.2B → $1.4B Net Sales $251M → $303M ADJ. EBITDA ~6% CAGR ~9% CAGR FY24 FY27 Q1 TTM PROFITABILITY 20% → 21% CONSOLIDATED ADJ. EBITDA MARGIN 7% → 12% WHOLLY-OWNED ADJ. EBITDA MARGIN +115bps FY24 FY27 Q1 TTM +470bps CASH & RETURNS 104%(1) → 116% FCF CONVERSION 25.6% → 26.8% ADJUSTED ROA +12pts FY24 FY27 Q1 TTM +120bps Refer to appendix for reconciliation of non-GAAP measures to the comparable GAAP measure. (1) FY25 Q2 TTM represents the first full 12 months following the 12/2023 separation; earlier standalone FCF data is not available.
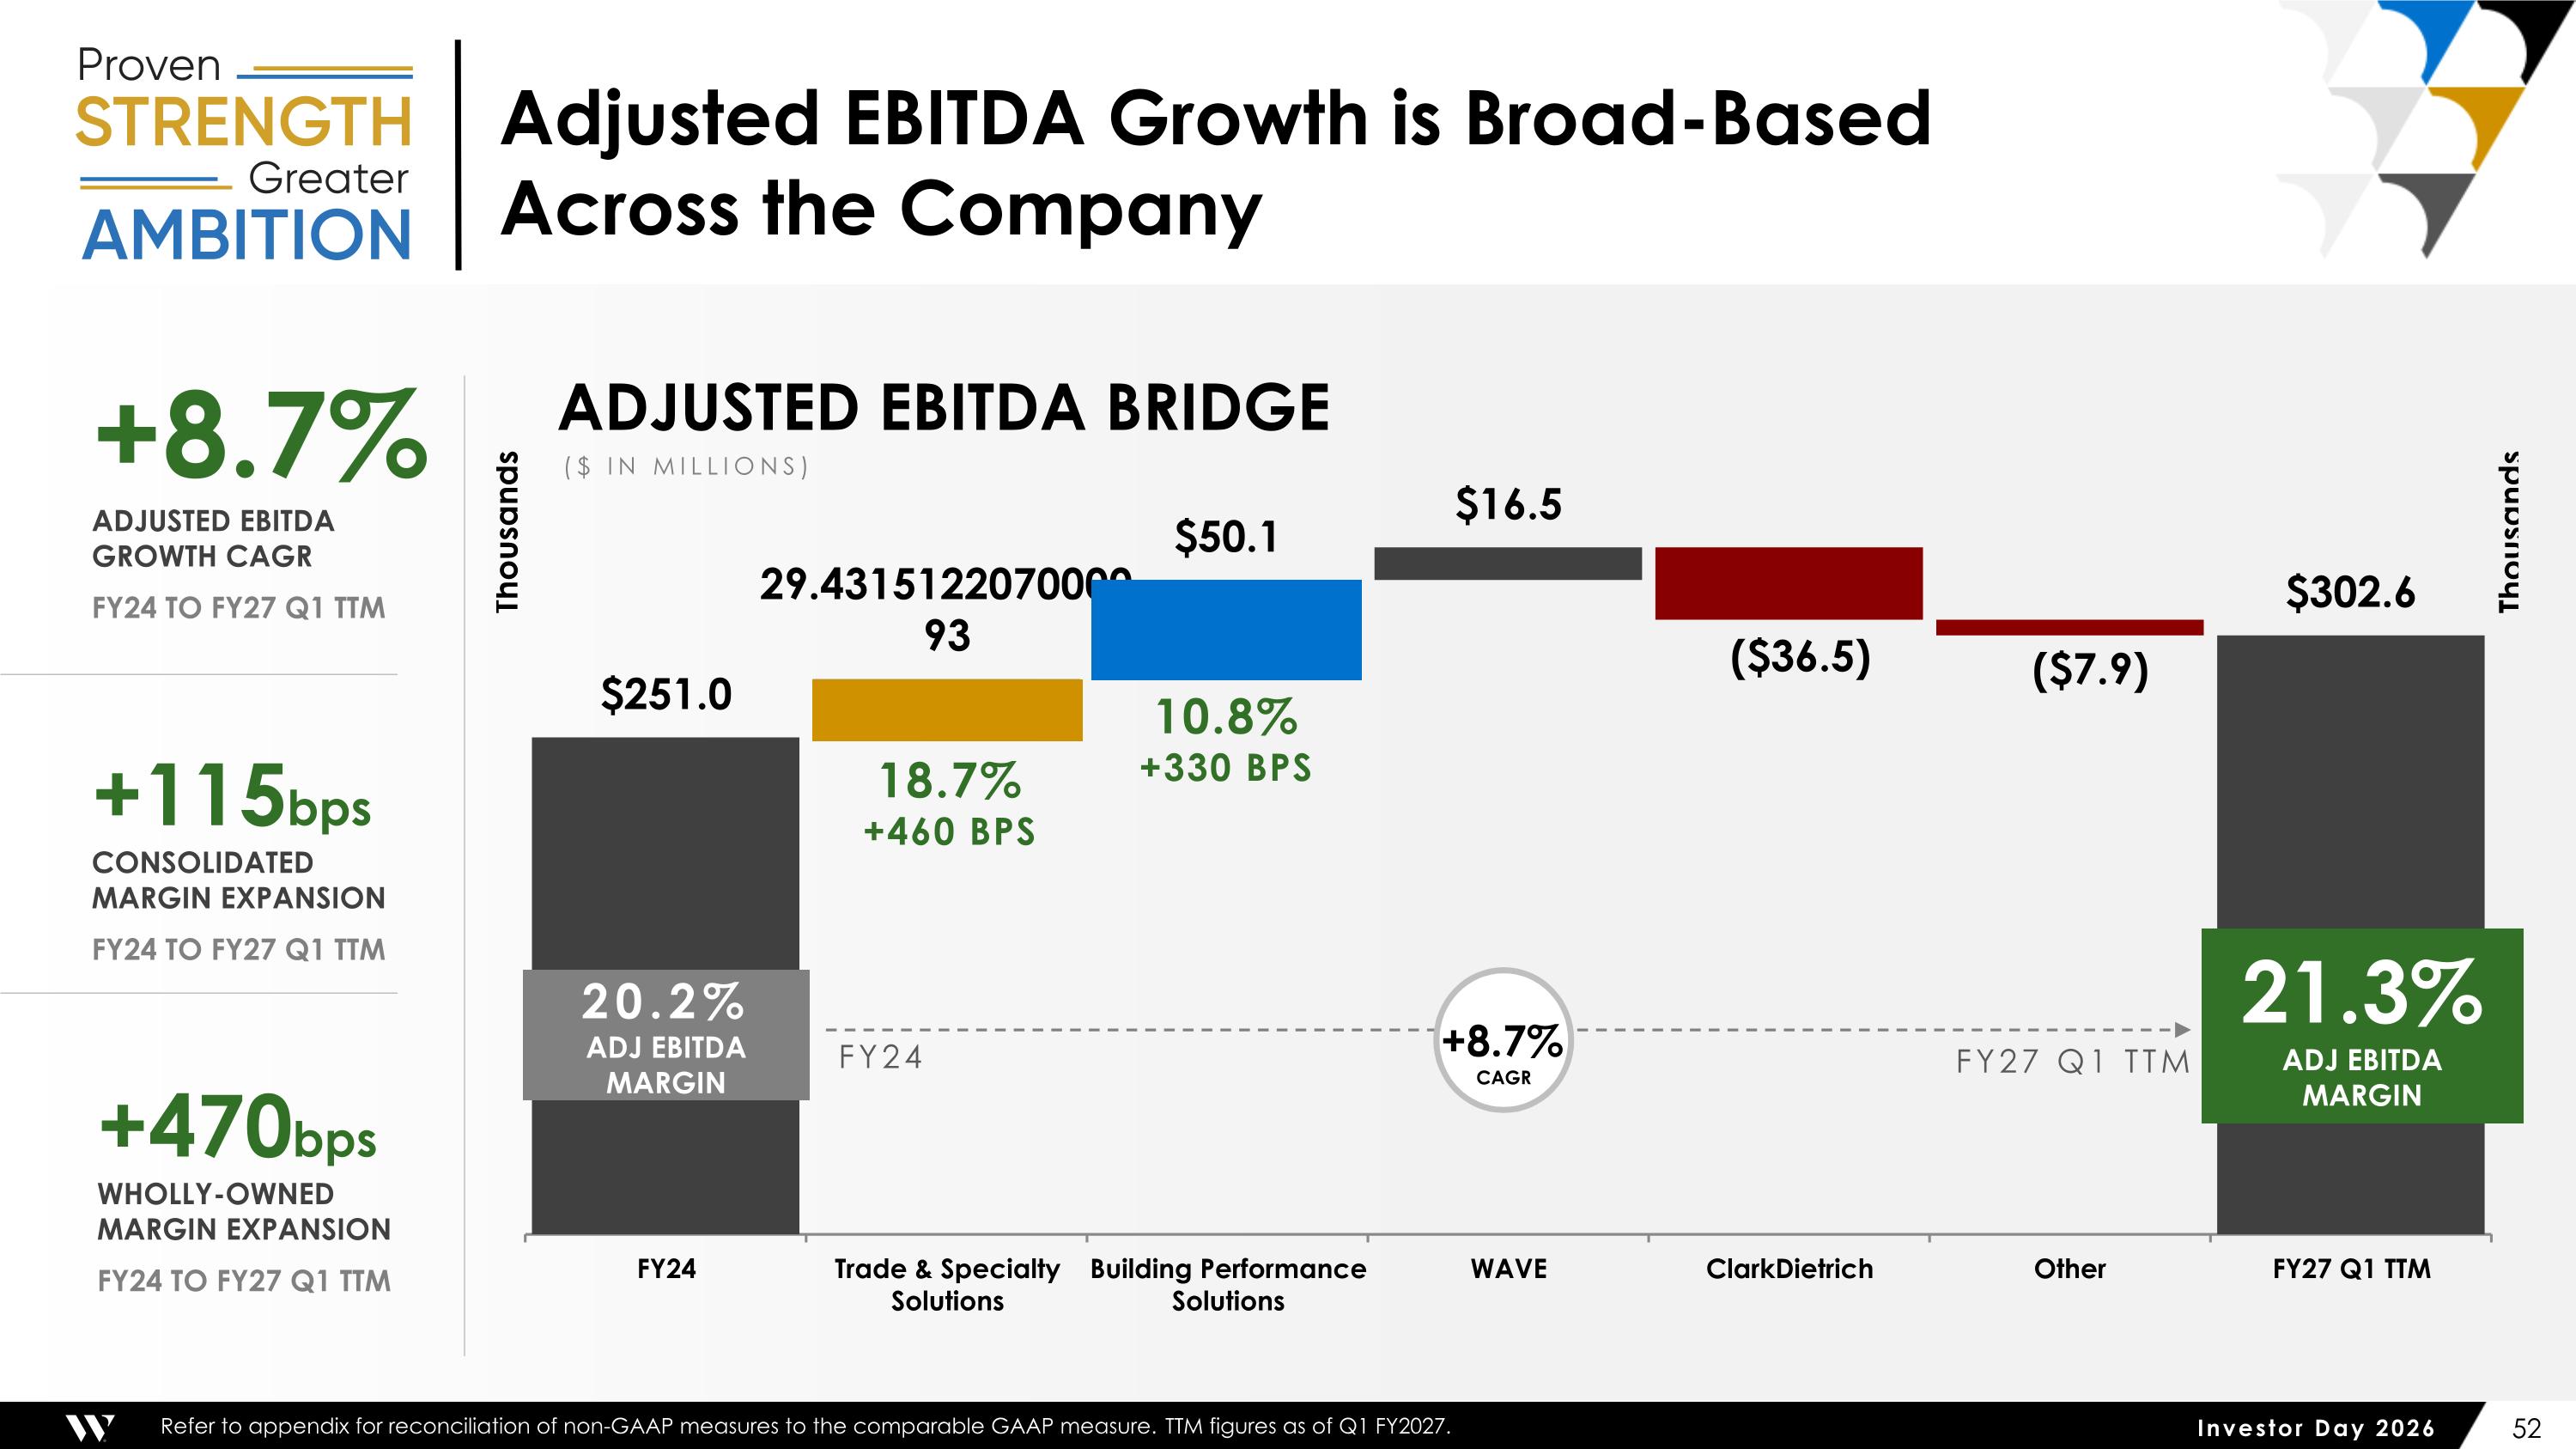
Adjusted EBITDA Growth is Broad-Based Across the Company +8.7% ADJUSTED EBITDA GROWTH CAGR FY24 to FY27 Q1 TTM +115bps Consolidated Margin Expansion FY24 to FY27 Q1 TTM +470bps WHOLLY-OWNED Margin Expansion FY24 to FY27 Q1 TTM 18.7% +460 BPS 10.8% +330 BPS +8.7% FY27 Q1 TTM FY24 21.3% Adj EBITDA MARGIN 20.2% ADJ EBITDA MARGIN Adjusted EBITDA Bridge ($ IN MILLIONS) CAGR Refer to appendix for reconciliation of non-GAAP measures to the comparable GAAP measure. TTM figures as of Q1 FY2027.
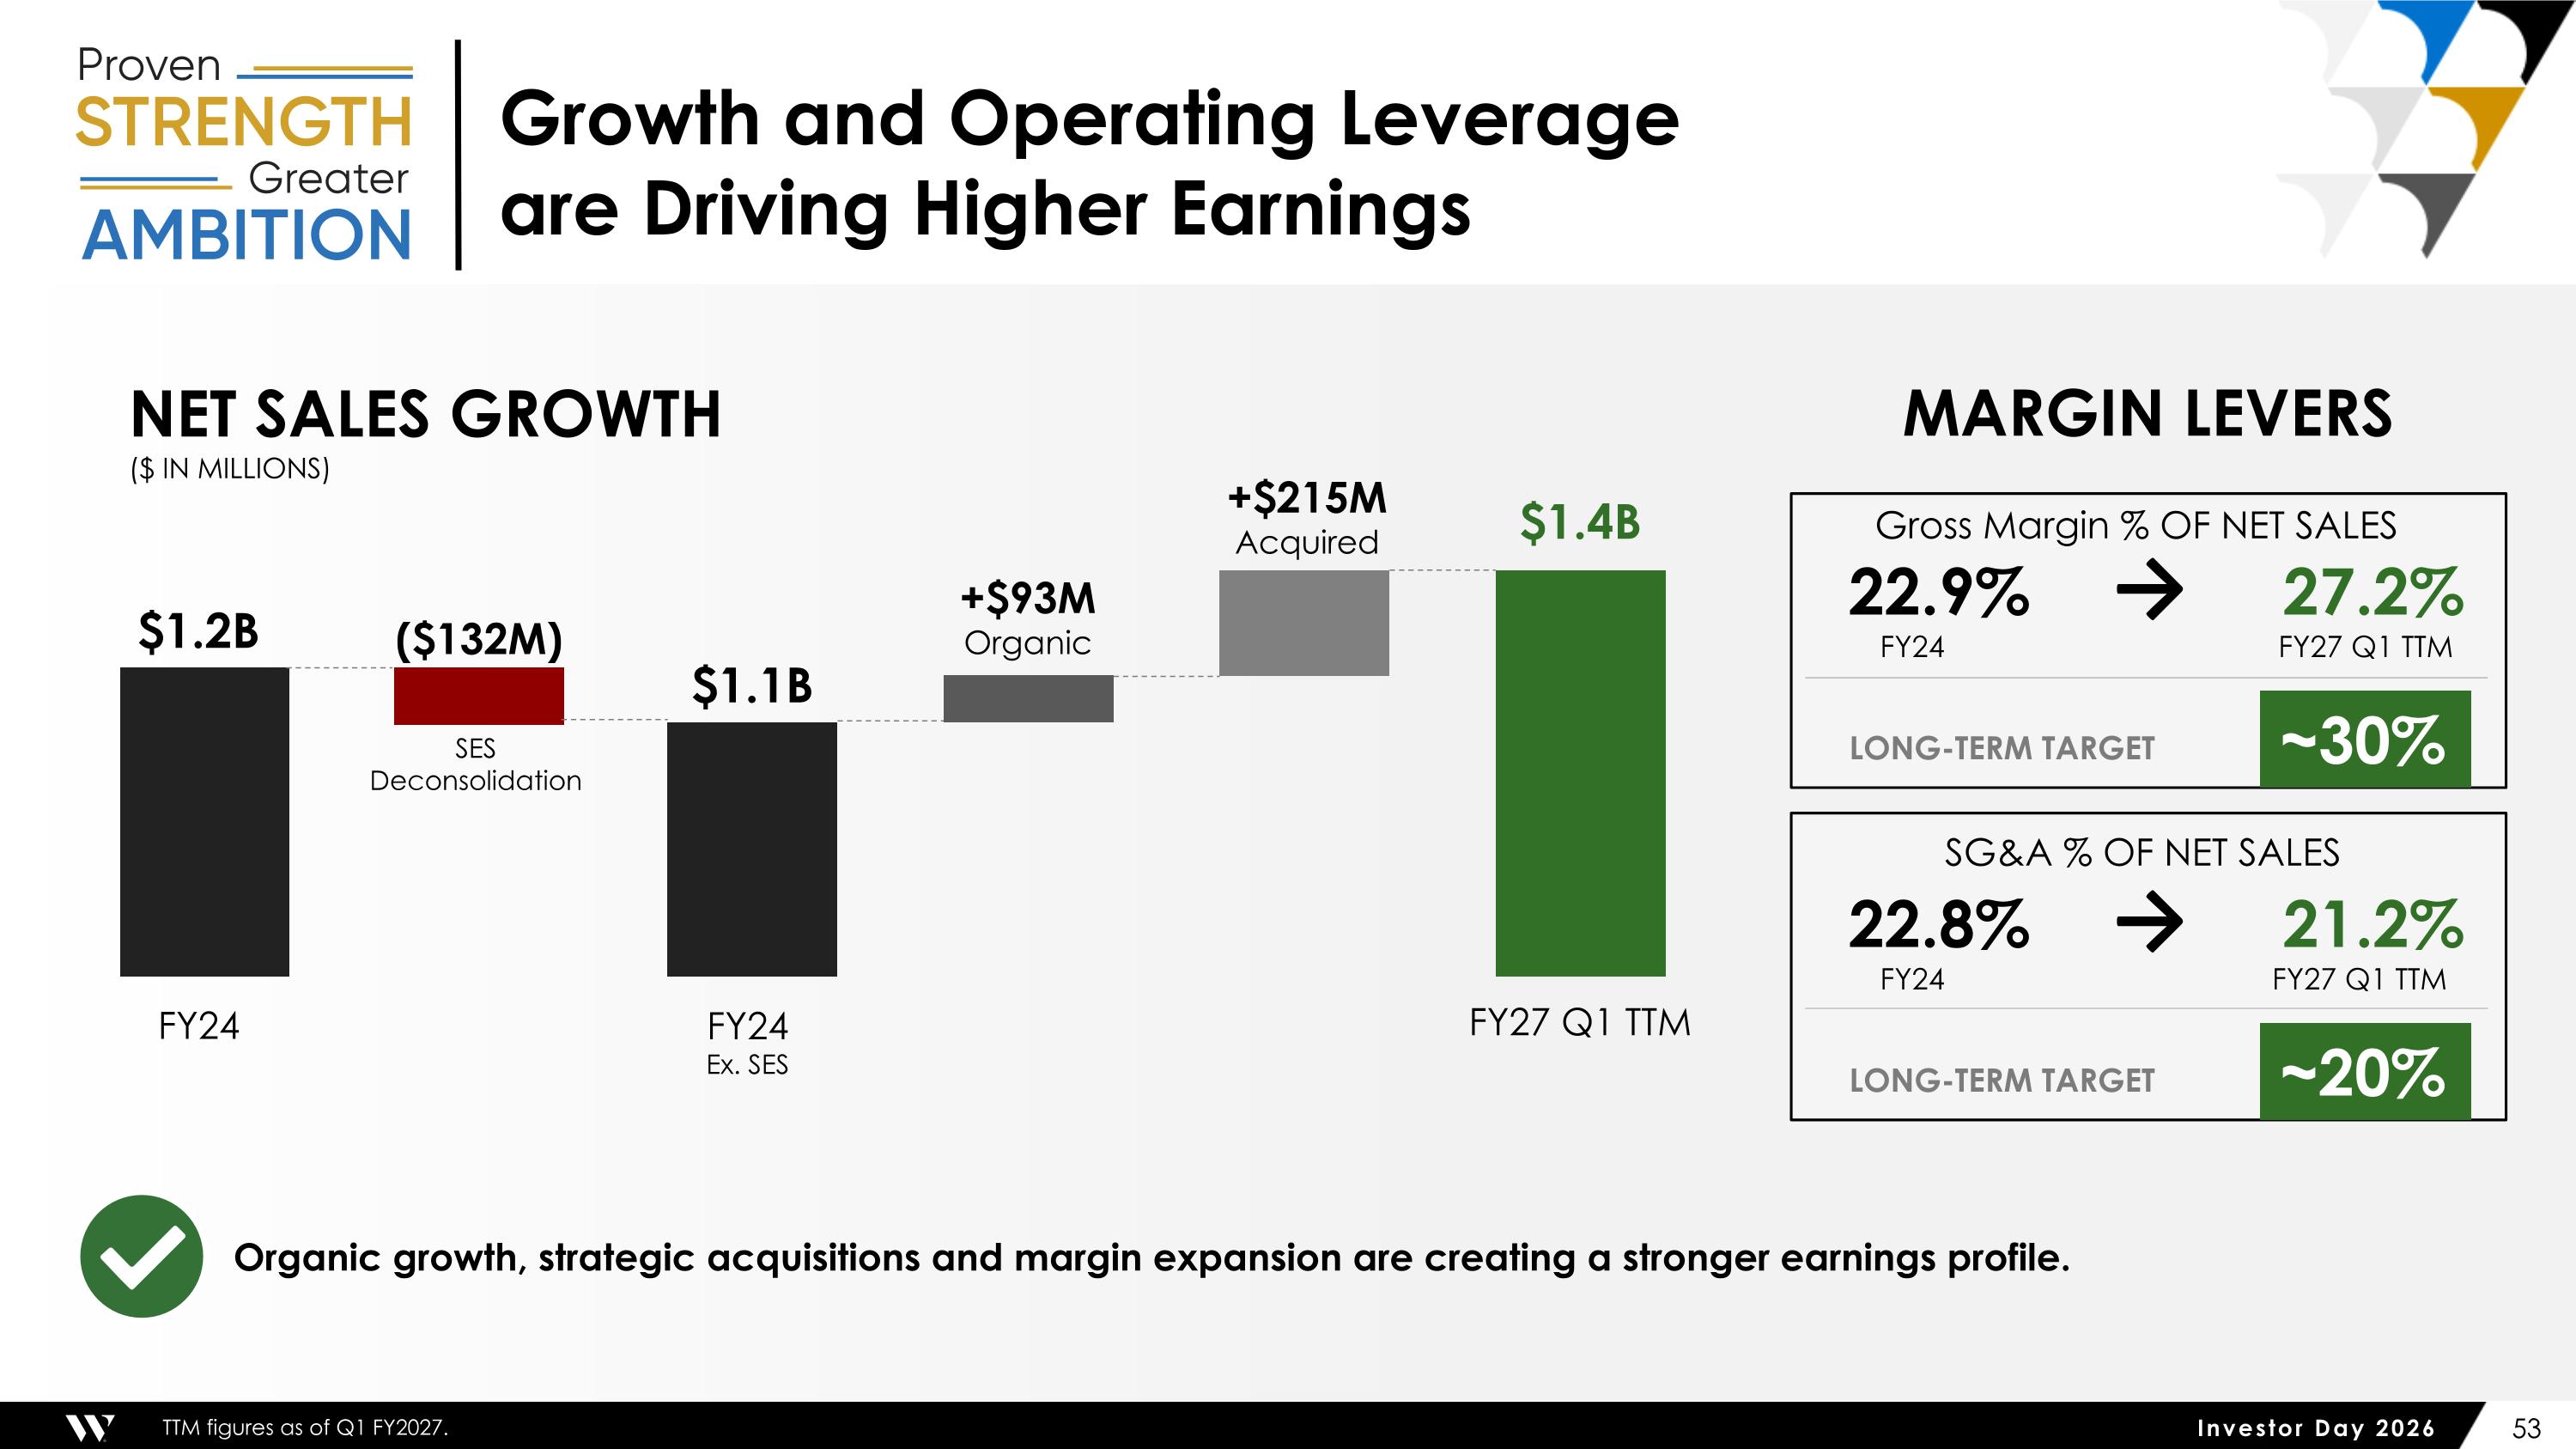
Growth and Operating Leverage are Driving Higher Earnings NET SALES GROWTH ($ IN MILLIONS) Organic growth, strategic acquisitions and margin expansion are creating a stronger earnings profile. SG&A % OF NET SALES 22.8% → 21.2% FY24 FY27 Q1 TTM LONG-TERM TARGET ~20% MARGIN LEVERS 22.9% → 27.2% FY24 FY27 Q1 TTM LONG-TERM TARGET ~30% TTM figures as of Q1 FY2027. Gross Margin % OF NET SALES $1.1B +$93M Organic +$215M Acquired $1.4B FY24 Ex. SES FY27 Q1 TTM $1.2B ($132M) SES Deconsolidation FY24
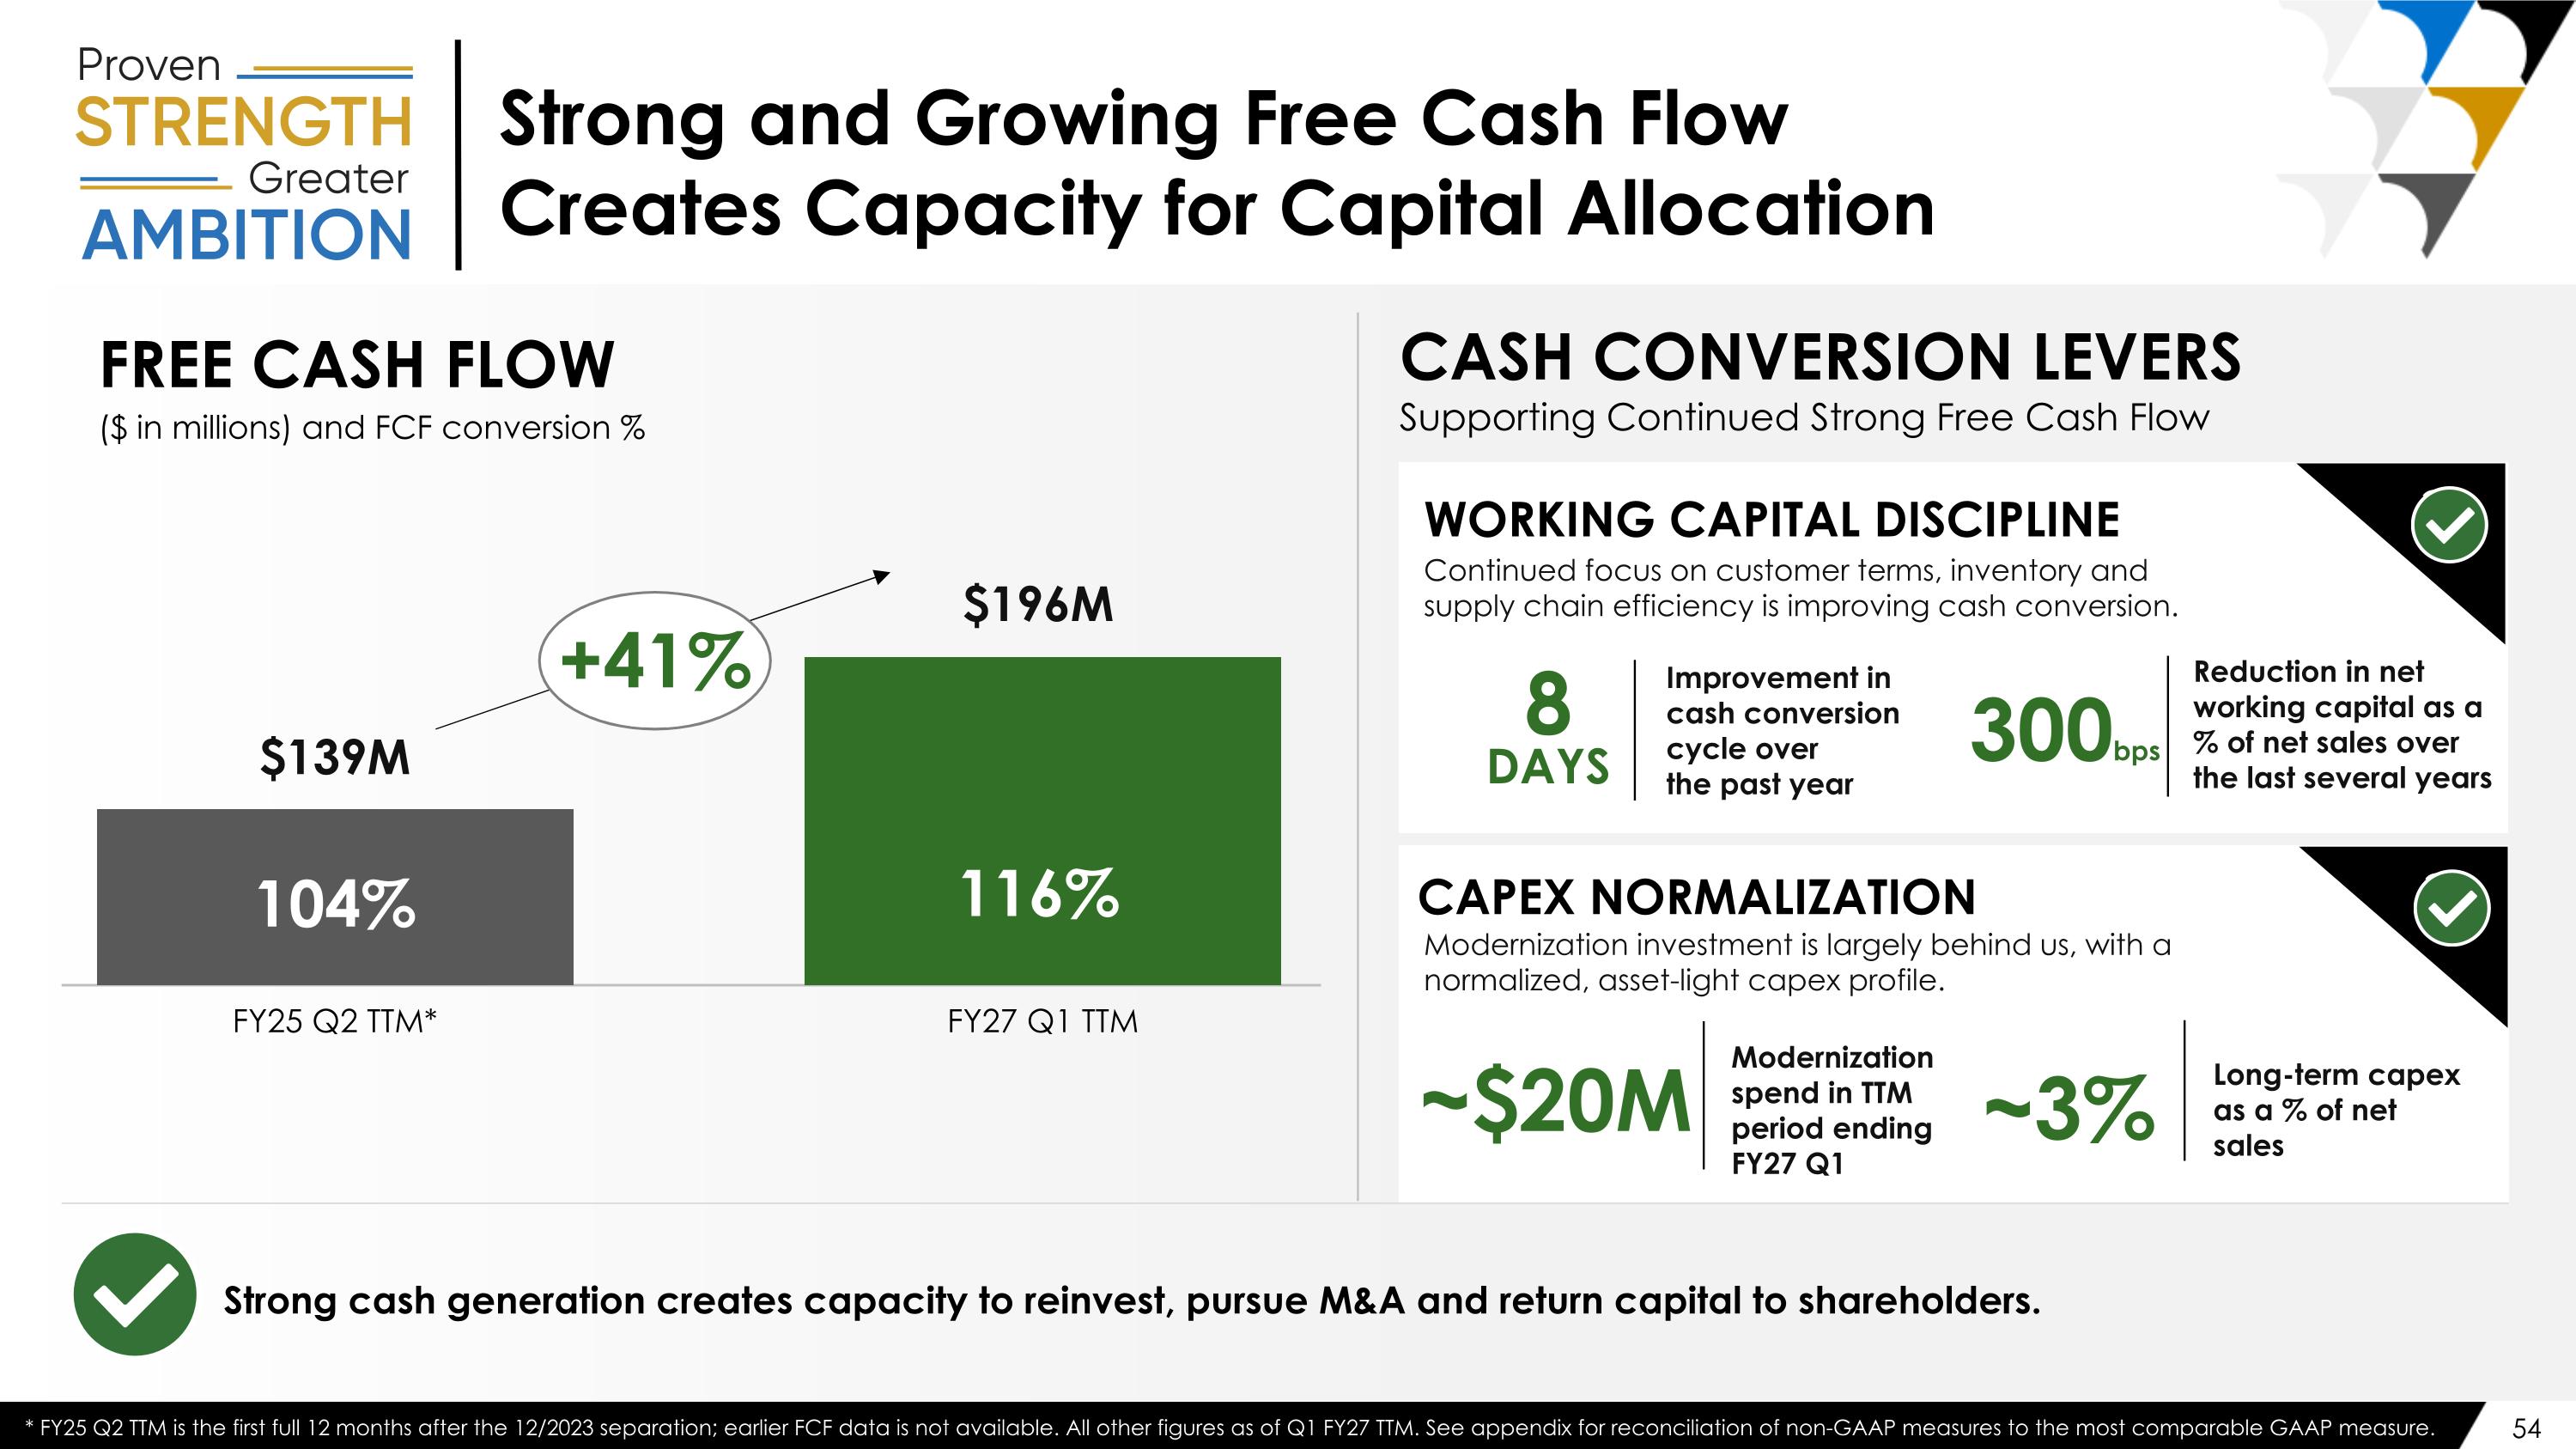
Strong and Growing Free Cash Flow Creates Capacity for Capital Allocation FREE CASH FLOW ($ in millions) and FCF conversion % Strong cash generation creates capacity to reinvest, pursue M&A and return capital to shareholders. CASH CONVERSION LEVERS Supporting Continued Strong Free Cash Flow CAPEX NORMALIZATION Modernization investment is largely behind us, with a normalized, asset-light capex profile. 300bps WORKING CAPITAL DISCIPLINE 8 DAYS Continued focus on customer terms, inventory and supply chain efficiency is improving cash conversion. $139M $196M FY25 Q2 TTM* FY27 Q1 TTM 104% +41% 116% Improvement in cash conversion cycle over the past year Reduction in net working capital as a % of net sales over the last several years Modernization spend in TTM period ending FY27 Q1 ~$20M Long-term capex as a % of net sales ~3% c c * FY25 Q2 TTM is the first full 12 months after the 12/2023 separation; earlier FCF data is not available. All other figures as of Q1 FY27 TTM. See appendix for reconciliation of non-GAAP measures to the most comparable GAAP measure.
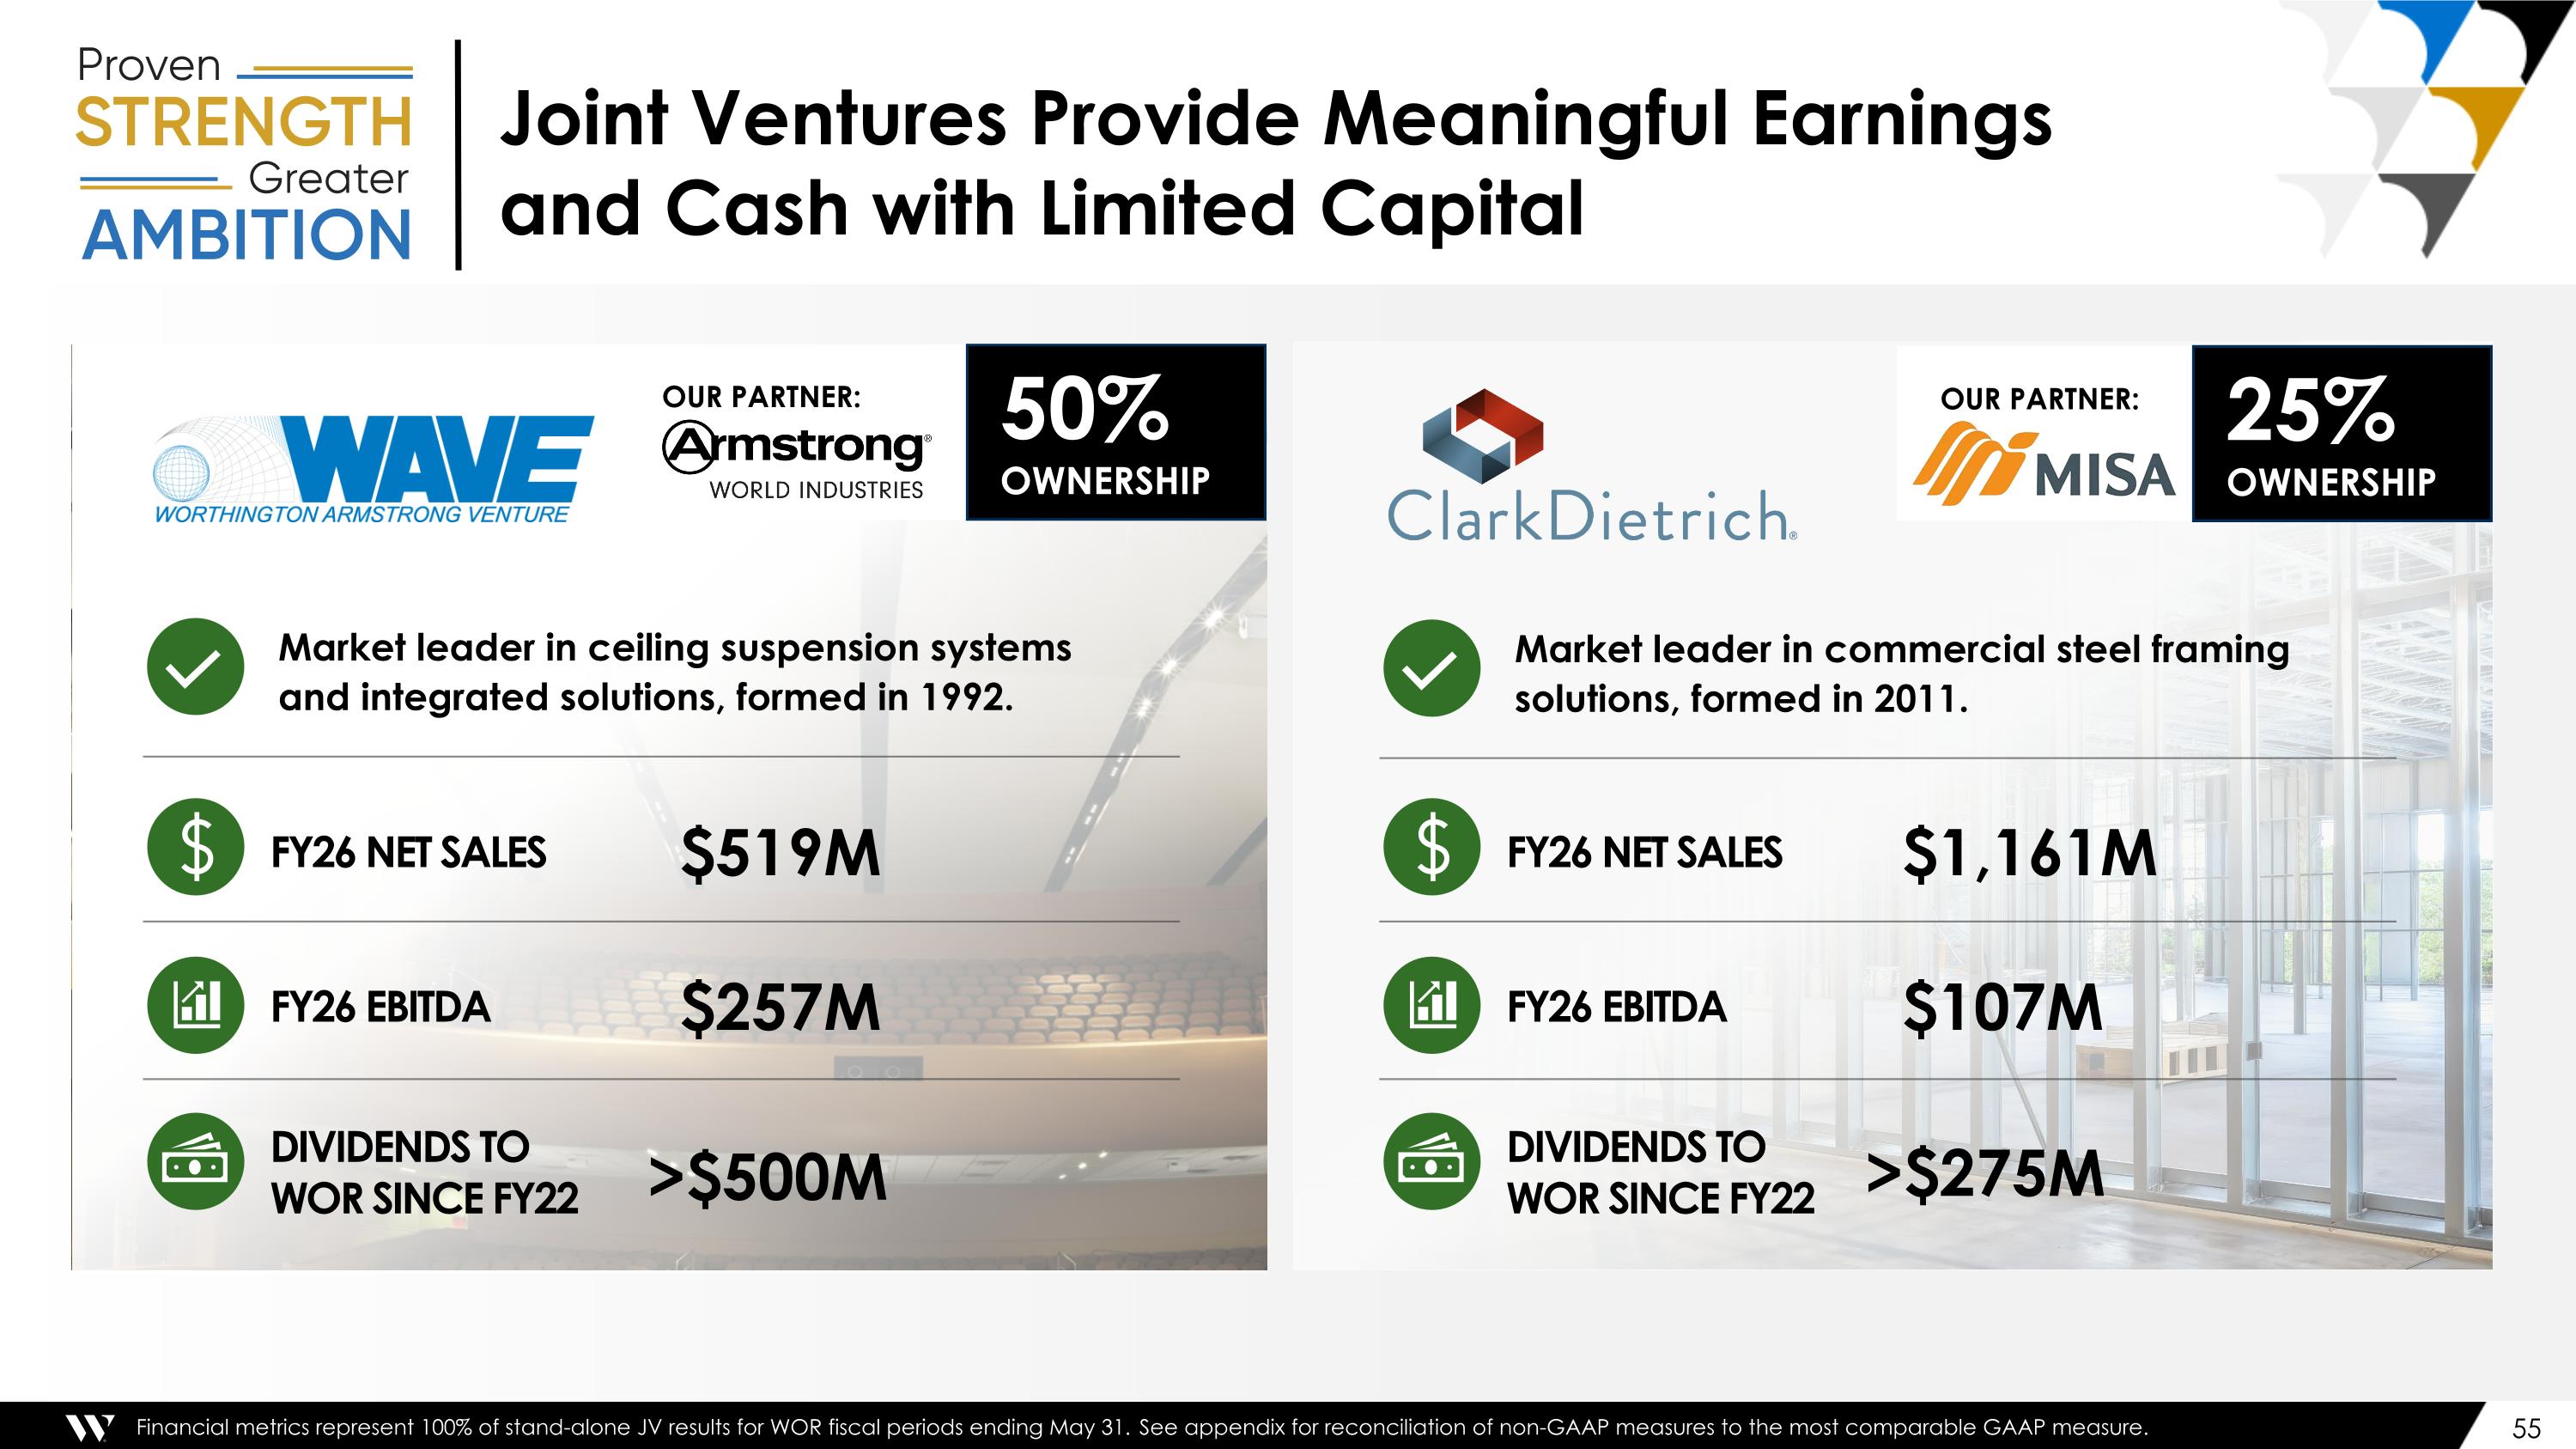
Joint Ventures Provide Meaningful Earnings and Cash with Limited Capital OUR PARTNER: 50% OWNERSHIP Market leader in ceiling suspension systems and integrated solutions, formed in 1992. OUR PARTNER: FY26 NET SALES $519M FY26 EBITDA $257M DIVIDENDS TO WOR SINCE FY22 >$500M FY26 NET SALES $1,161M FY26 EBITDA $107M DIVIDENDS TO WOR SINCE FY22 >$275M Market leader in commercial steel framing solutions, formed in 2011. 25% OWNERSHIP Financial metrics represent 100% of stand-alone JV results for WOR fiscal periods ending May 31. See appendix for reconciliation of non-GAAP measures to the most comparable GAAP measure.
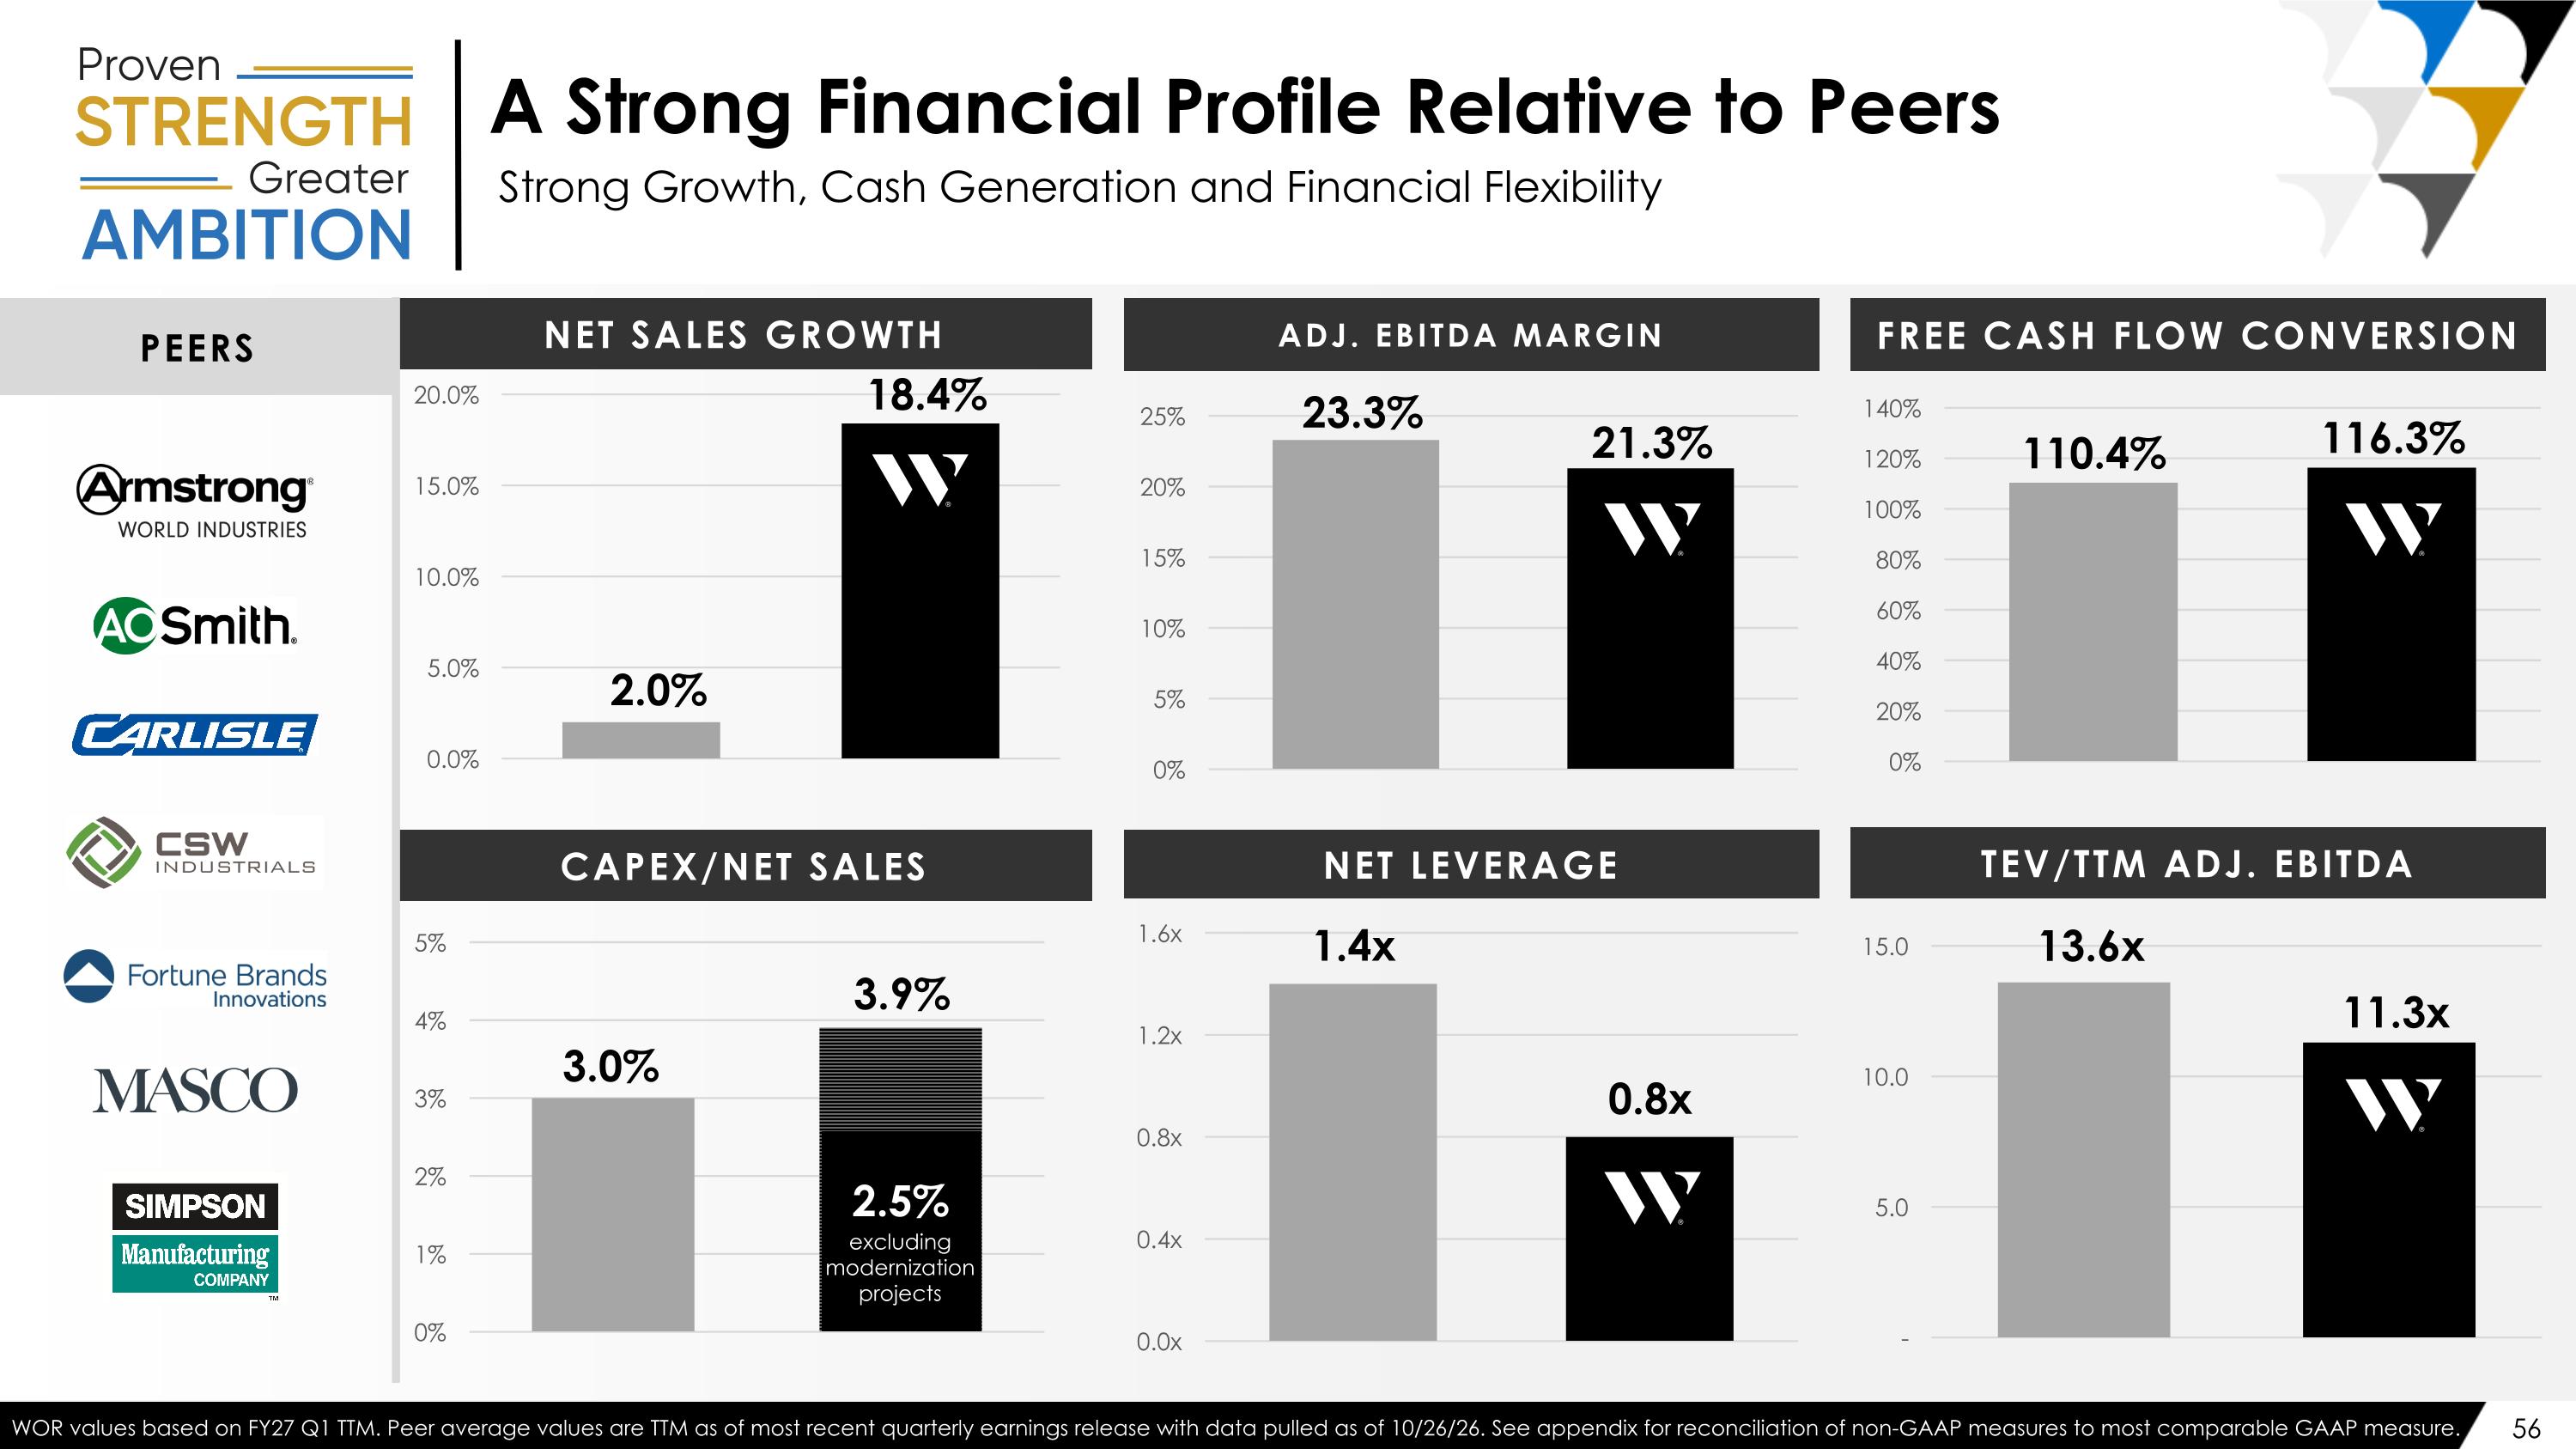
A Strong Financial Profile Relative to Peers Strong Growth, Cash Generation and Financial Flexibility PEERS FREE CASH FLOW CONVERSION CAPEX/NET SALES NET SALES GROWTH excluding modernization projects 21.3% 116.3% 11.3x 2.5% 3.9% 23.3% 110.4% 13.6x WOR values based on FY27 Q1 TTM. Peer average values are TTM as of most recent quarterly earnings release with data pulled as of 10/26/26. See appendix for reconciliation of non-GAAP measures to most comparable GAAP measure. 3.0% ADJ. EBITDA MARGIN TEV/TTM ADJ. EBITDA NET LEVERAGE 2.0% 18.4%

Capital Allocation Focused on Long-Term Value Creation
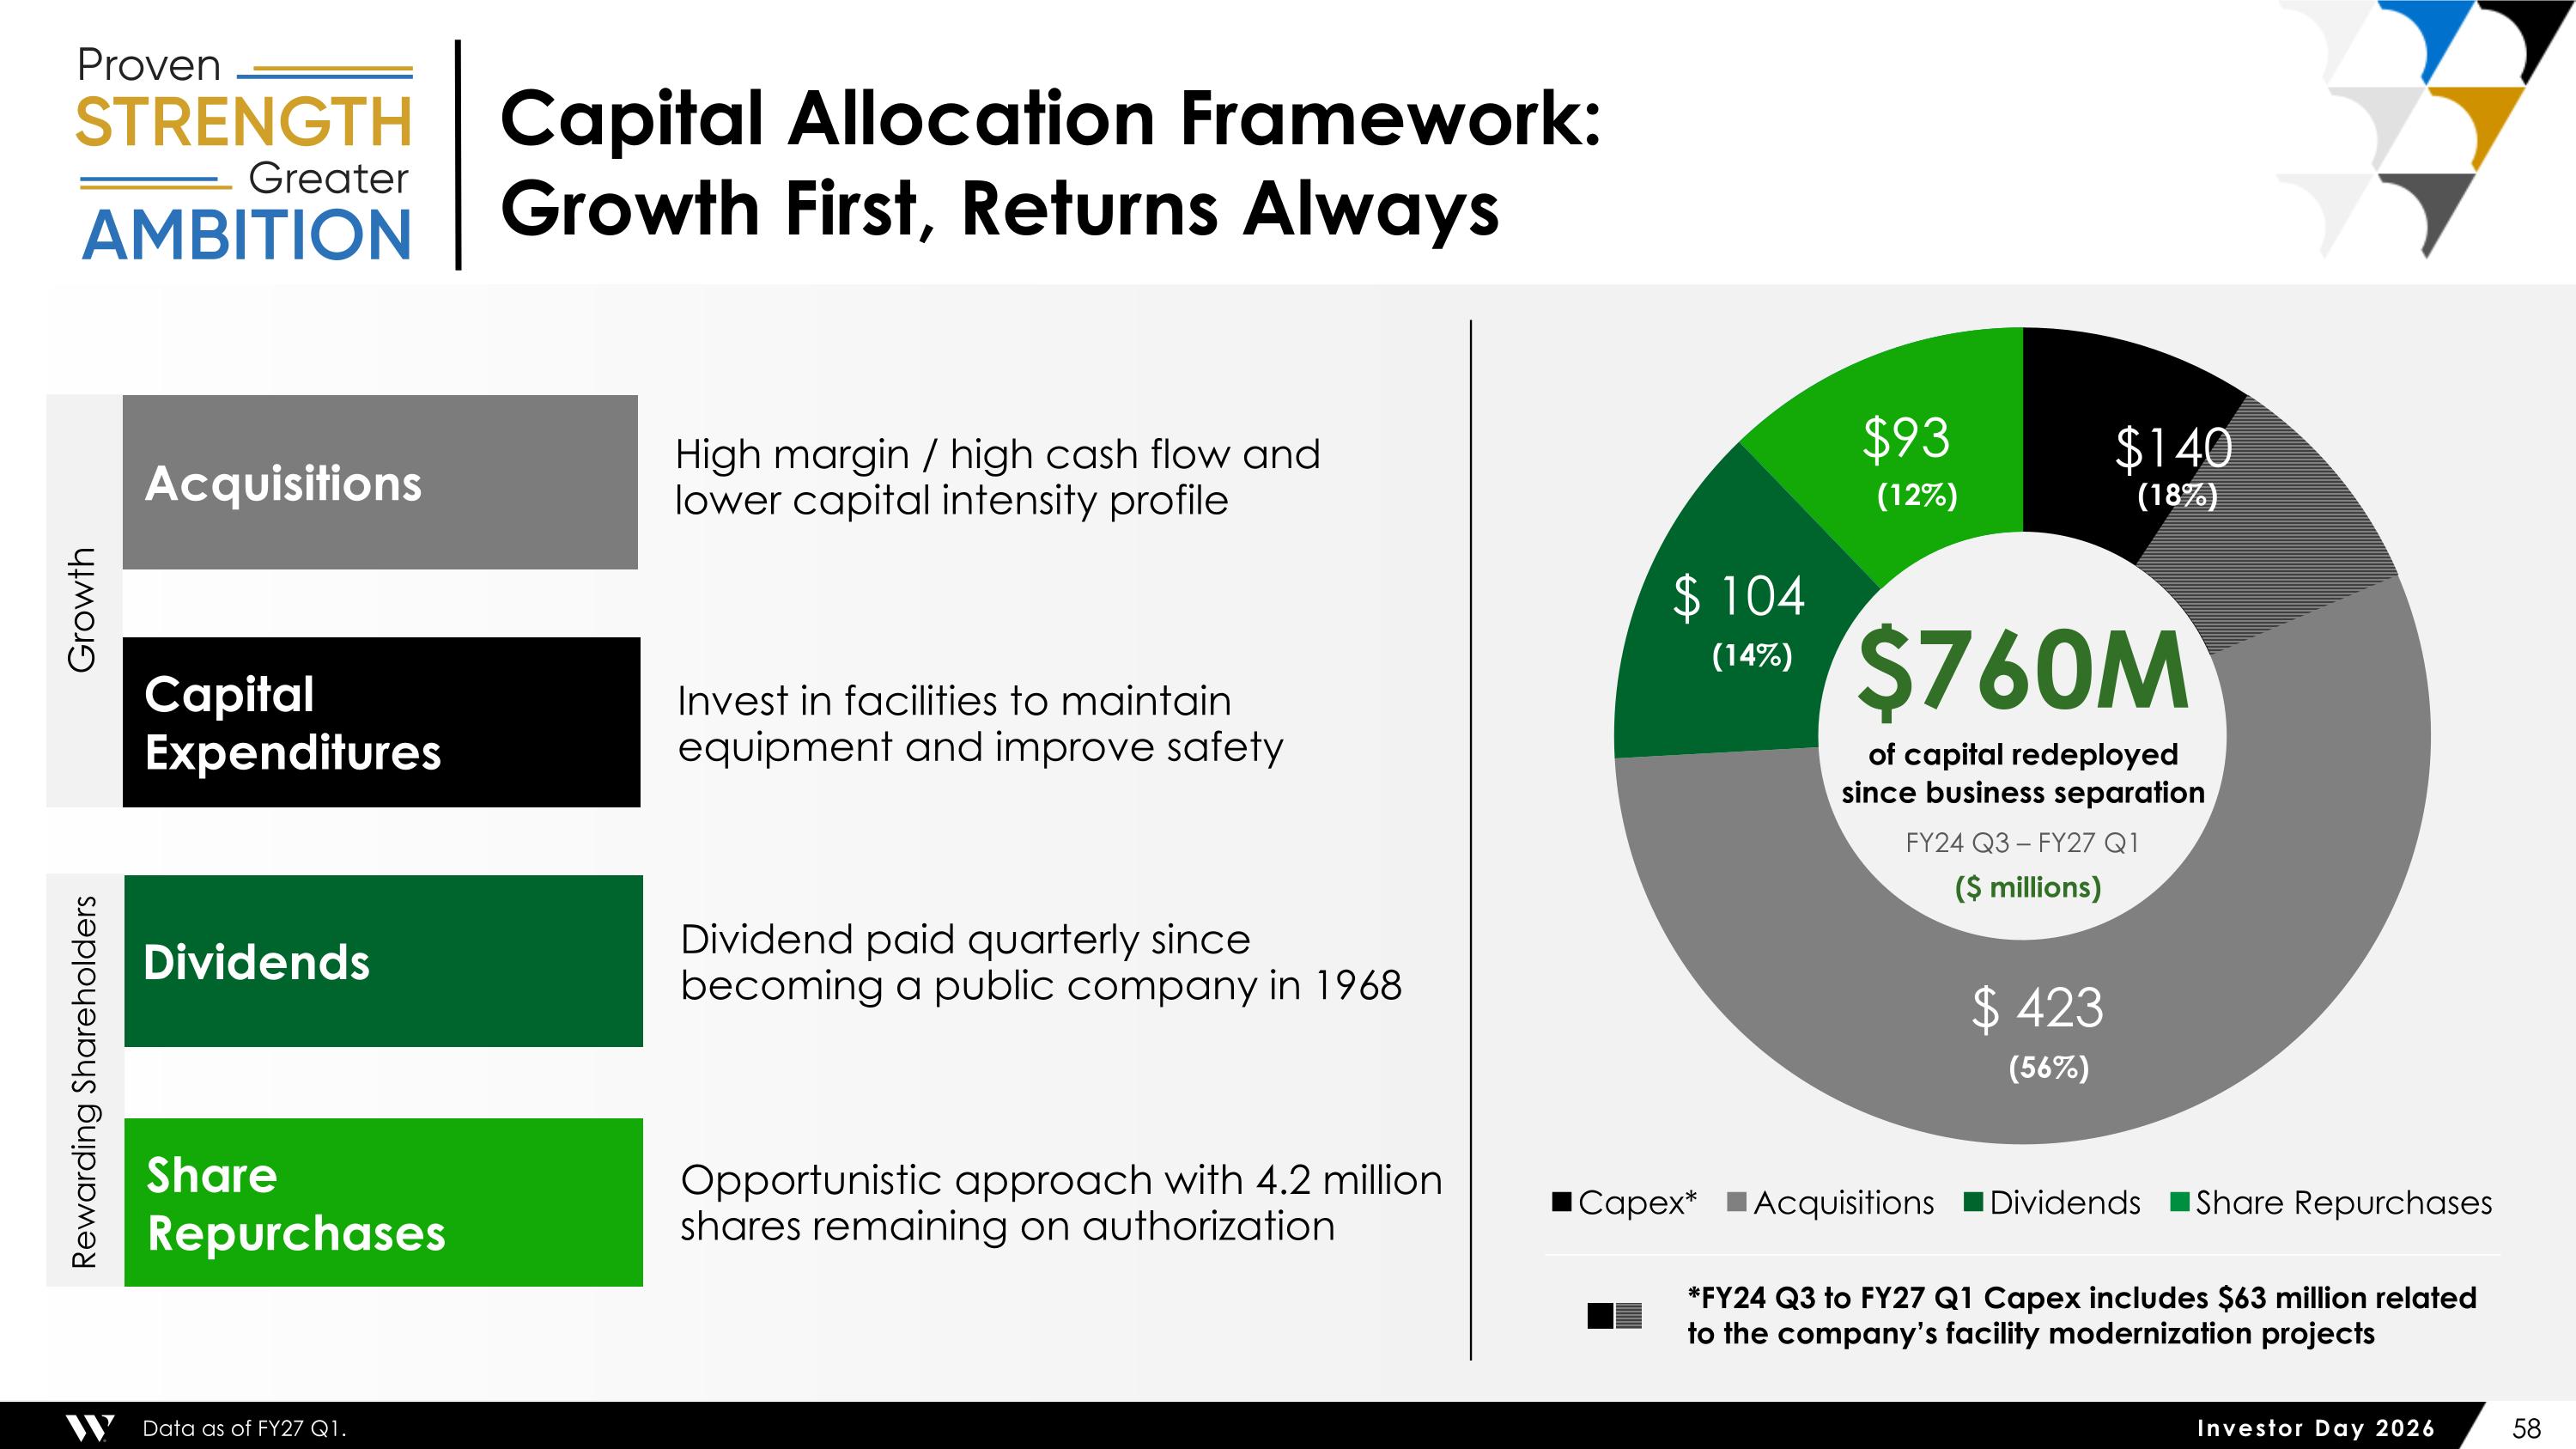
(18%) (56%) (12%) (14%) Capital Allocation Framework: Growth First, Returns Always Invest in facilities to maintain equipment and improve safety ($ millions) *FY24 Q3 to FY27 Q1 Capex includes $63 million related to the company’s facility modernization projects Capital Expenditures Acquisitions Dividends Share Repurchases High margin / high cash flow and lower capital intensity profile Dividend paid quarterly since becoming a public company in 1968 Opportunistic approach with 4.2 million shares remaining on authorization Rewarding Shareholders Growth $760M of capital redeployed since business separation FY24 Q3 – FY27 Q1 $140 Data as of FY27 Q1. $93
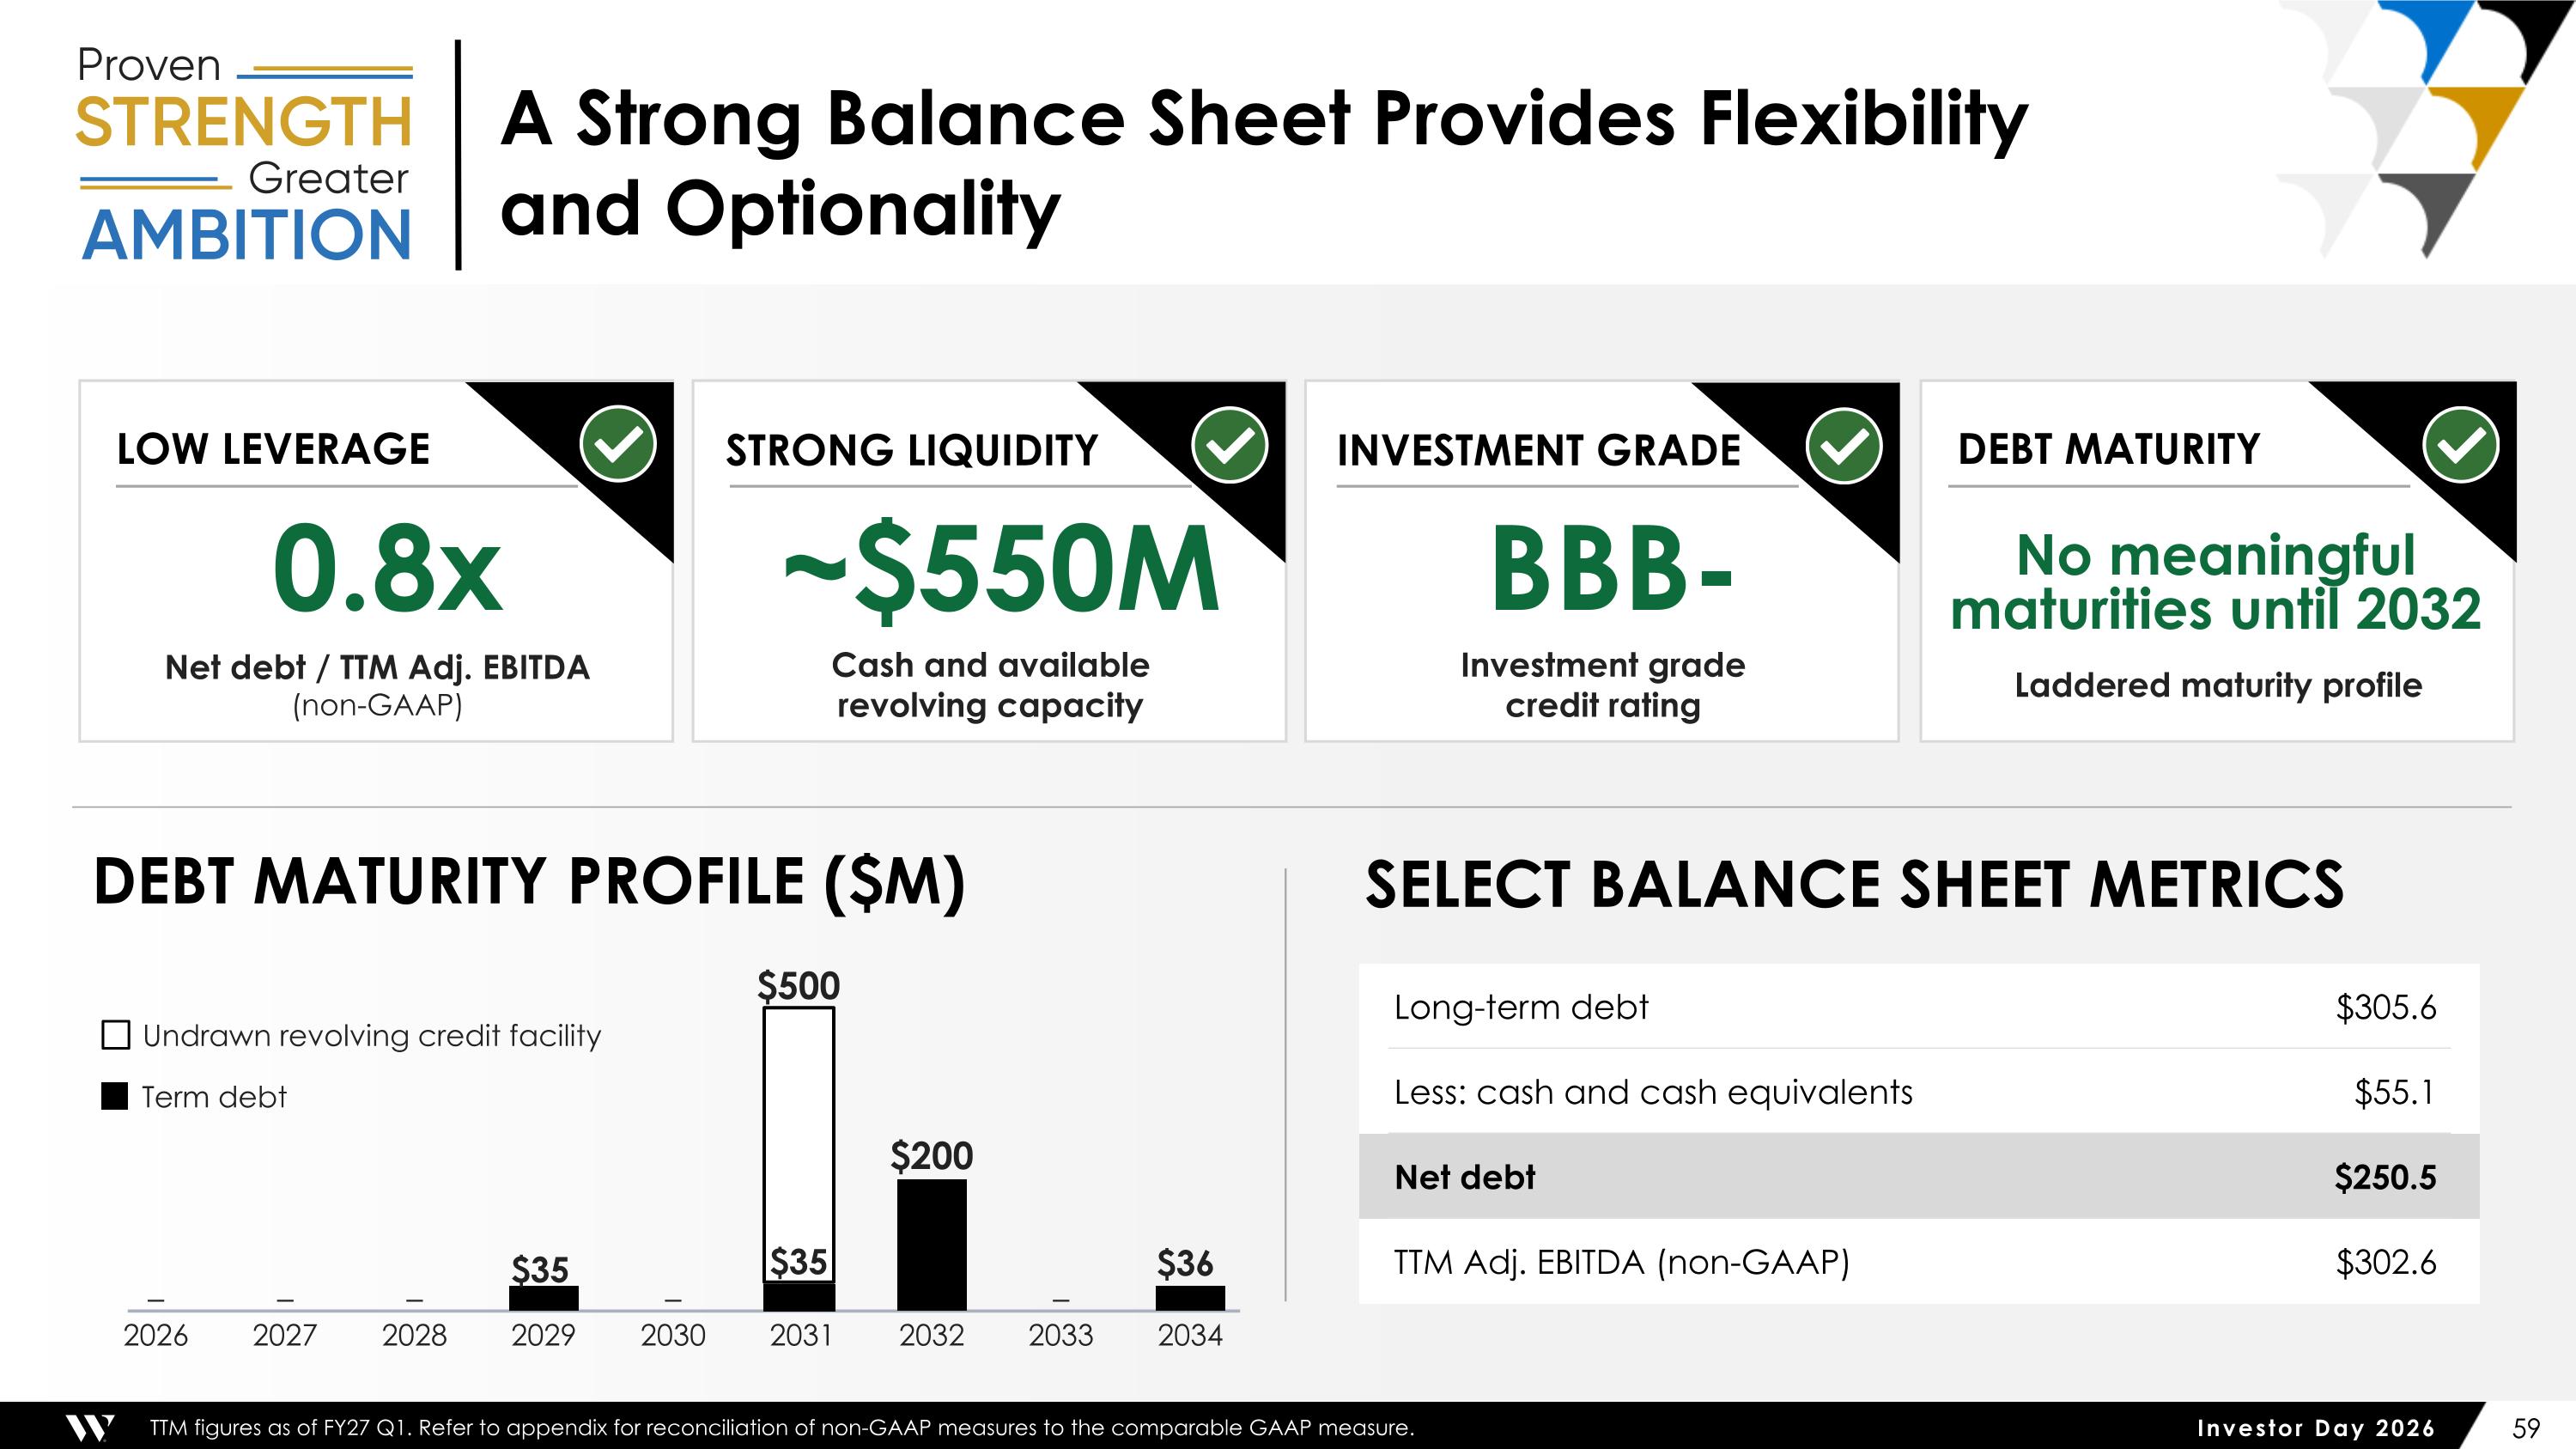
A Strong Balance Sheet Provides Flexibility and Optionality Undrawn revolving credit facility Term debt 2026 – 2027 – 2028 – 2029 $35 2030 – 2031 $500 2032 $200 2033 – 2034 $36 DEBT MATURITY PROFILE ($M) Long-term debt $305.6 Less: cash and cash equivalents $55.1 Net debt $250.5 TTM Adj. EBITDA (non-GAAP) $302.6 SELECT BALANCE SHEET METRICS LOW LEVERAGE 0.8x Net debt / TTM Adj. EBITDA (non-GAAP) STRONG LIQUIDITY ~$550M Cash and available revolving capacity INVESTMENT GRADE BBB- Investment grade credit rating DEBT MATURITY No meaningful maturities until 2032 Laddered maturity profile $35 TTM figures as of FY27 Q1. Refer to appendix for reconciliation of non-GAAP measures to the comparable GAAP measure.
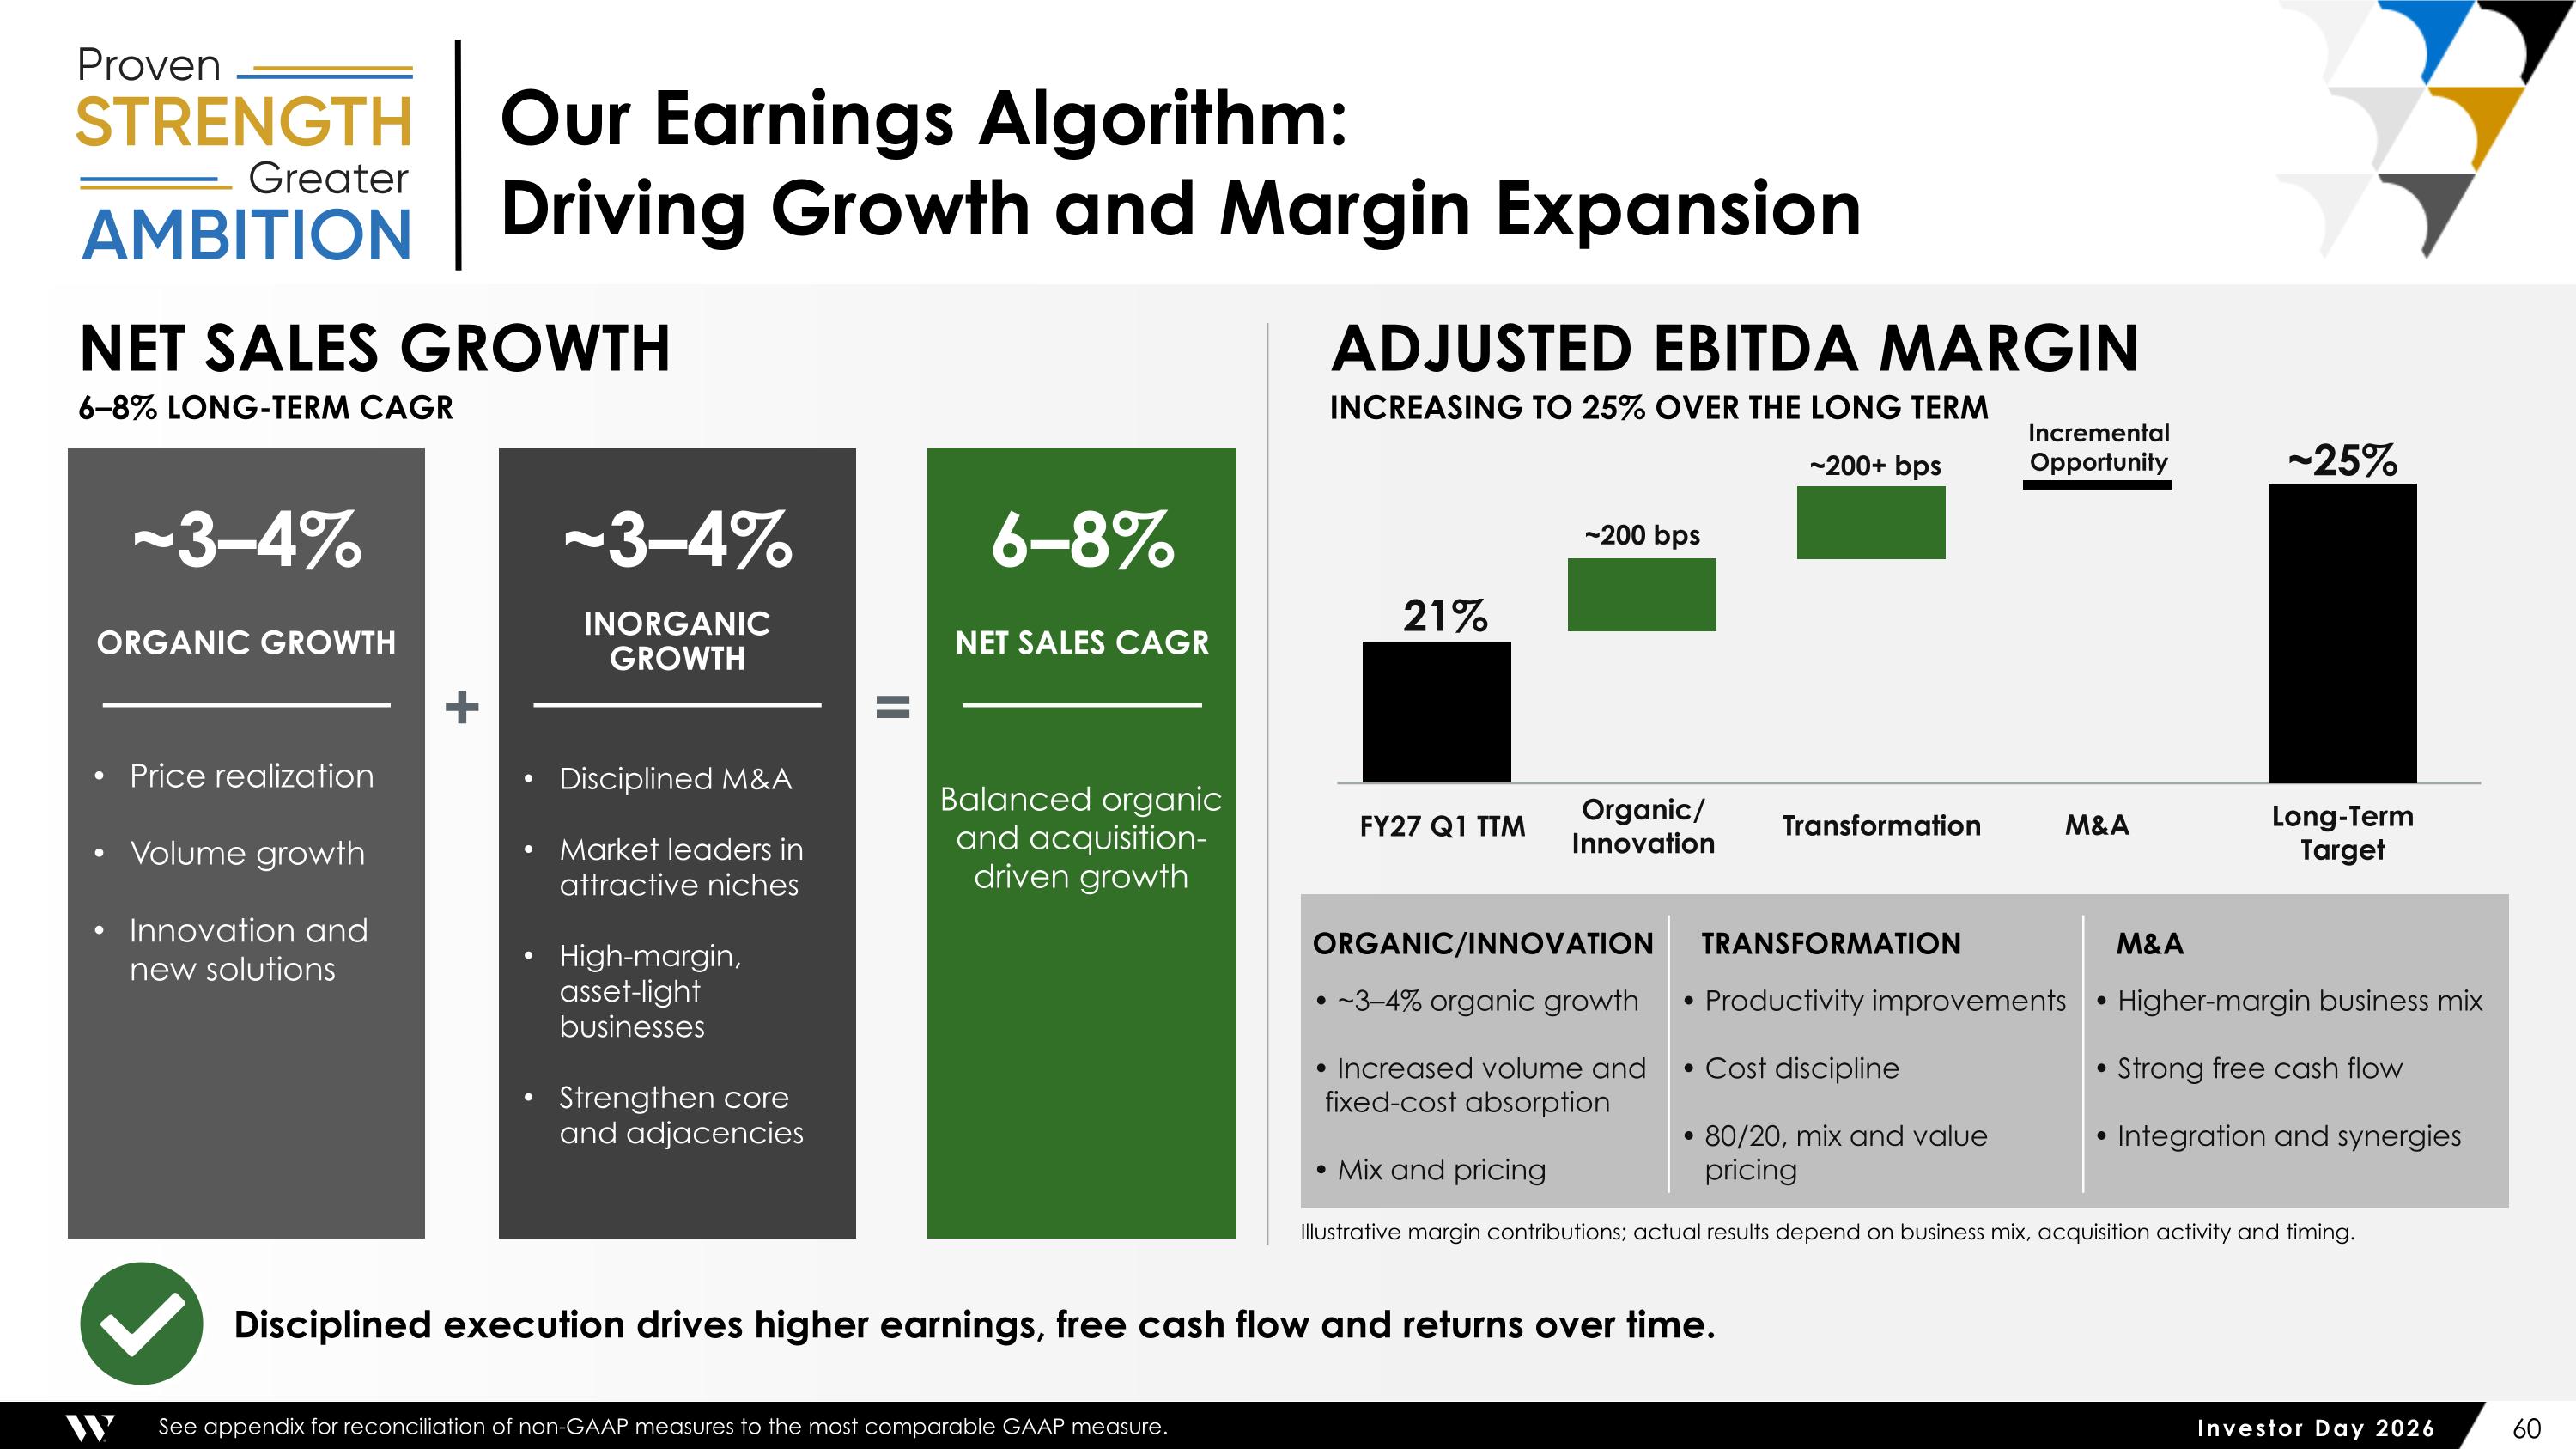
Our Earnings Algorithm: Driving Growth and Margin Expansion NET SALES GROWTH 6–8% LONG-TERM CAGR ADJUSTED EBITDA MARGIN INCREASING TO 25% OVER THE LONG TERM ~3–4% ORGANIC GROWTH Price realization Volume growth Innovation and new solutions ~3–4% INORGANIC GROWTH 6–8% NET SALES CAGR Balanced organic and acquisition-driven growth + = 21% ~200 bps ~200+ bps Incremental Opportunity ~25% FY27 Q1 TTM Organic/ Innovation Transformation M&A Long-Term Target ORGANIC/INNOVATION • ~3–4% organic growth • Increased volume and fixed-cost absorption • Mix and pricing TRANSFORMATION • Productivity improvements • Cost discipline • 80/20, mix and value pricing M&A • Higher-margin business mix • Strong free cash flow • Integration and synergies Illustrative margin contributions; actual results depend on business mix, acquisition activity and timing. Disciplined M&A Market leaders in attractive niches High-margin, asset-light businesses Strengthen core and adjacencies Disciplined execution drives higher earnings, free cash flow and returns over time. See appendix for reconciliation of non-GAAP measures to the most comparable GAAP measure.
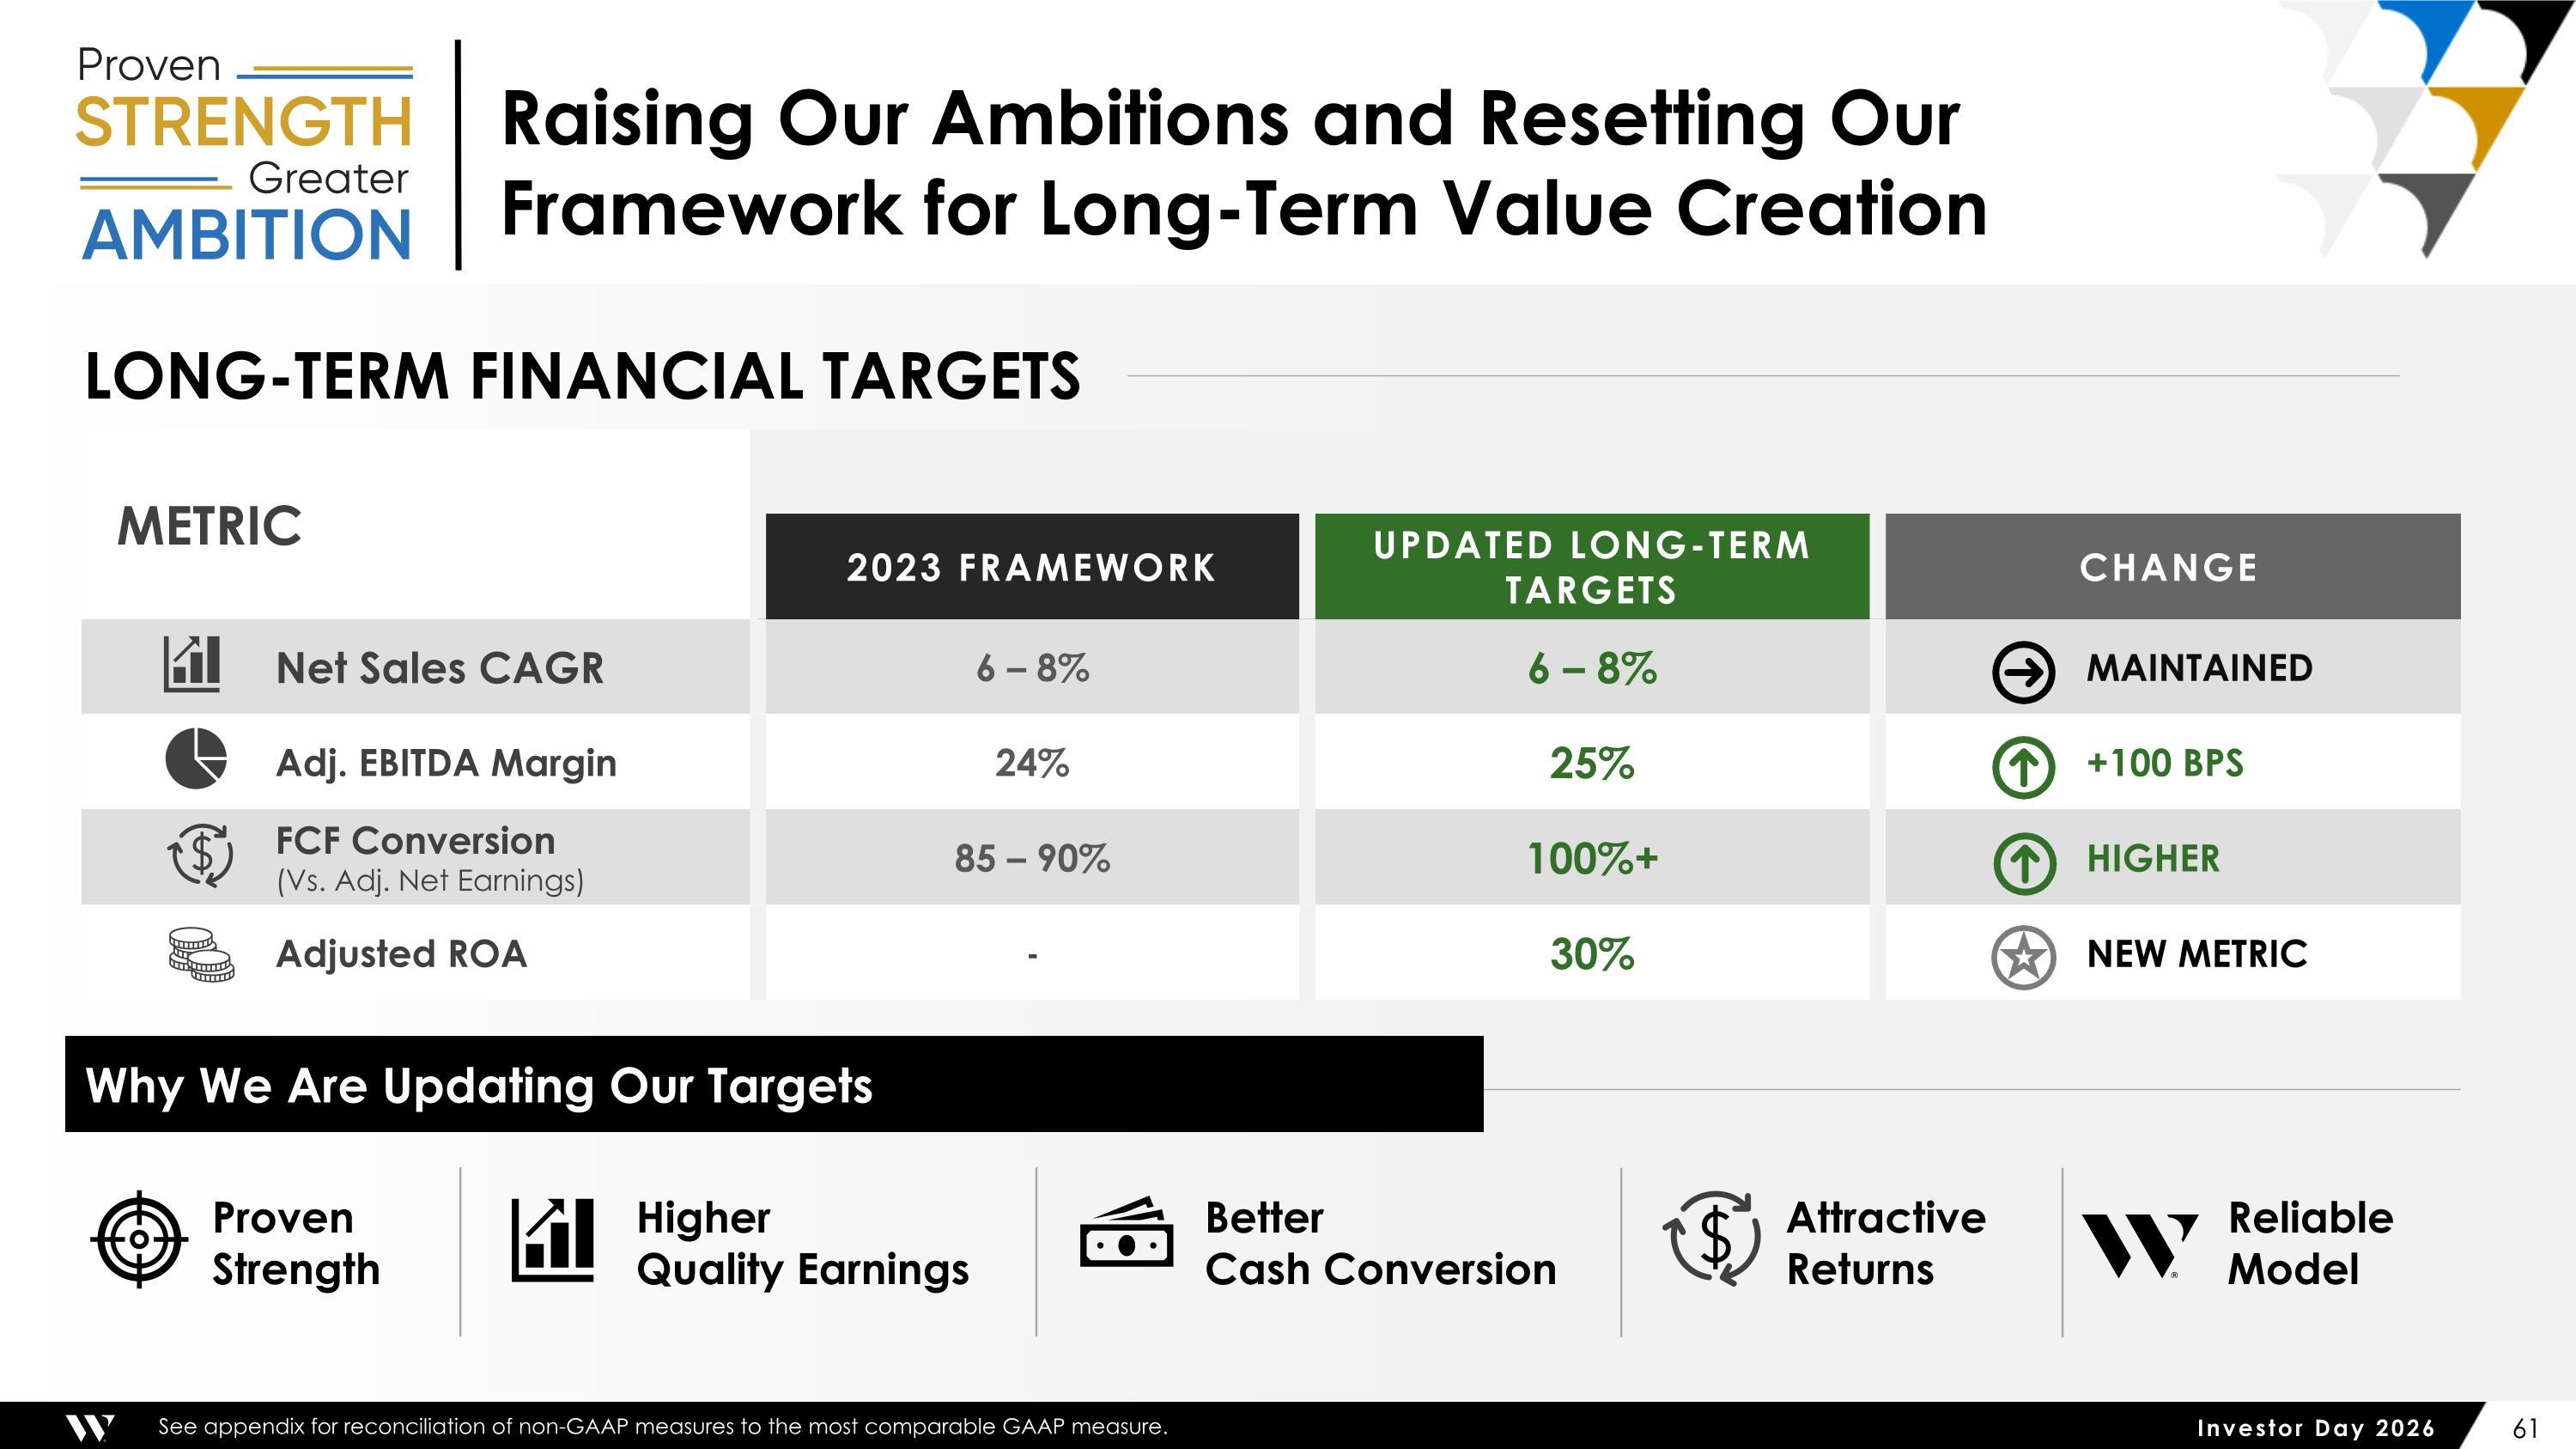
Raising Our Ambitions and Resetting Our Framework for Long-Term Value Creation METRIC 2023 FRAMEWORK UPDATED LONG-TERM TARGETS CHANGE Net Sales CAGR 6 – 8% 6 – 8% MAINTAINED Adj. EBITDA Margin 24% 25% +100 BPS FCF Conversion (Vs. Adj. Net Earnings) 85 – 90% 100%+ HIGHER Adjusted ROA - 30% NEW METRIC Higher Quality Earnings Proven Strength Better Cash Conversion Attractive Returns Reliable Model Why We Are Updating Our Targets LONG-TERM FINANCIAL TARGETS See appendix for reconciliation of non-GAAP measures to the most comparable GAAP measure.

Closing Remarks
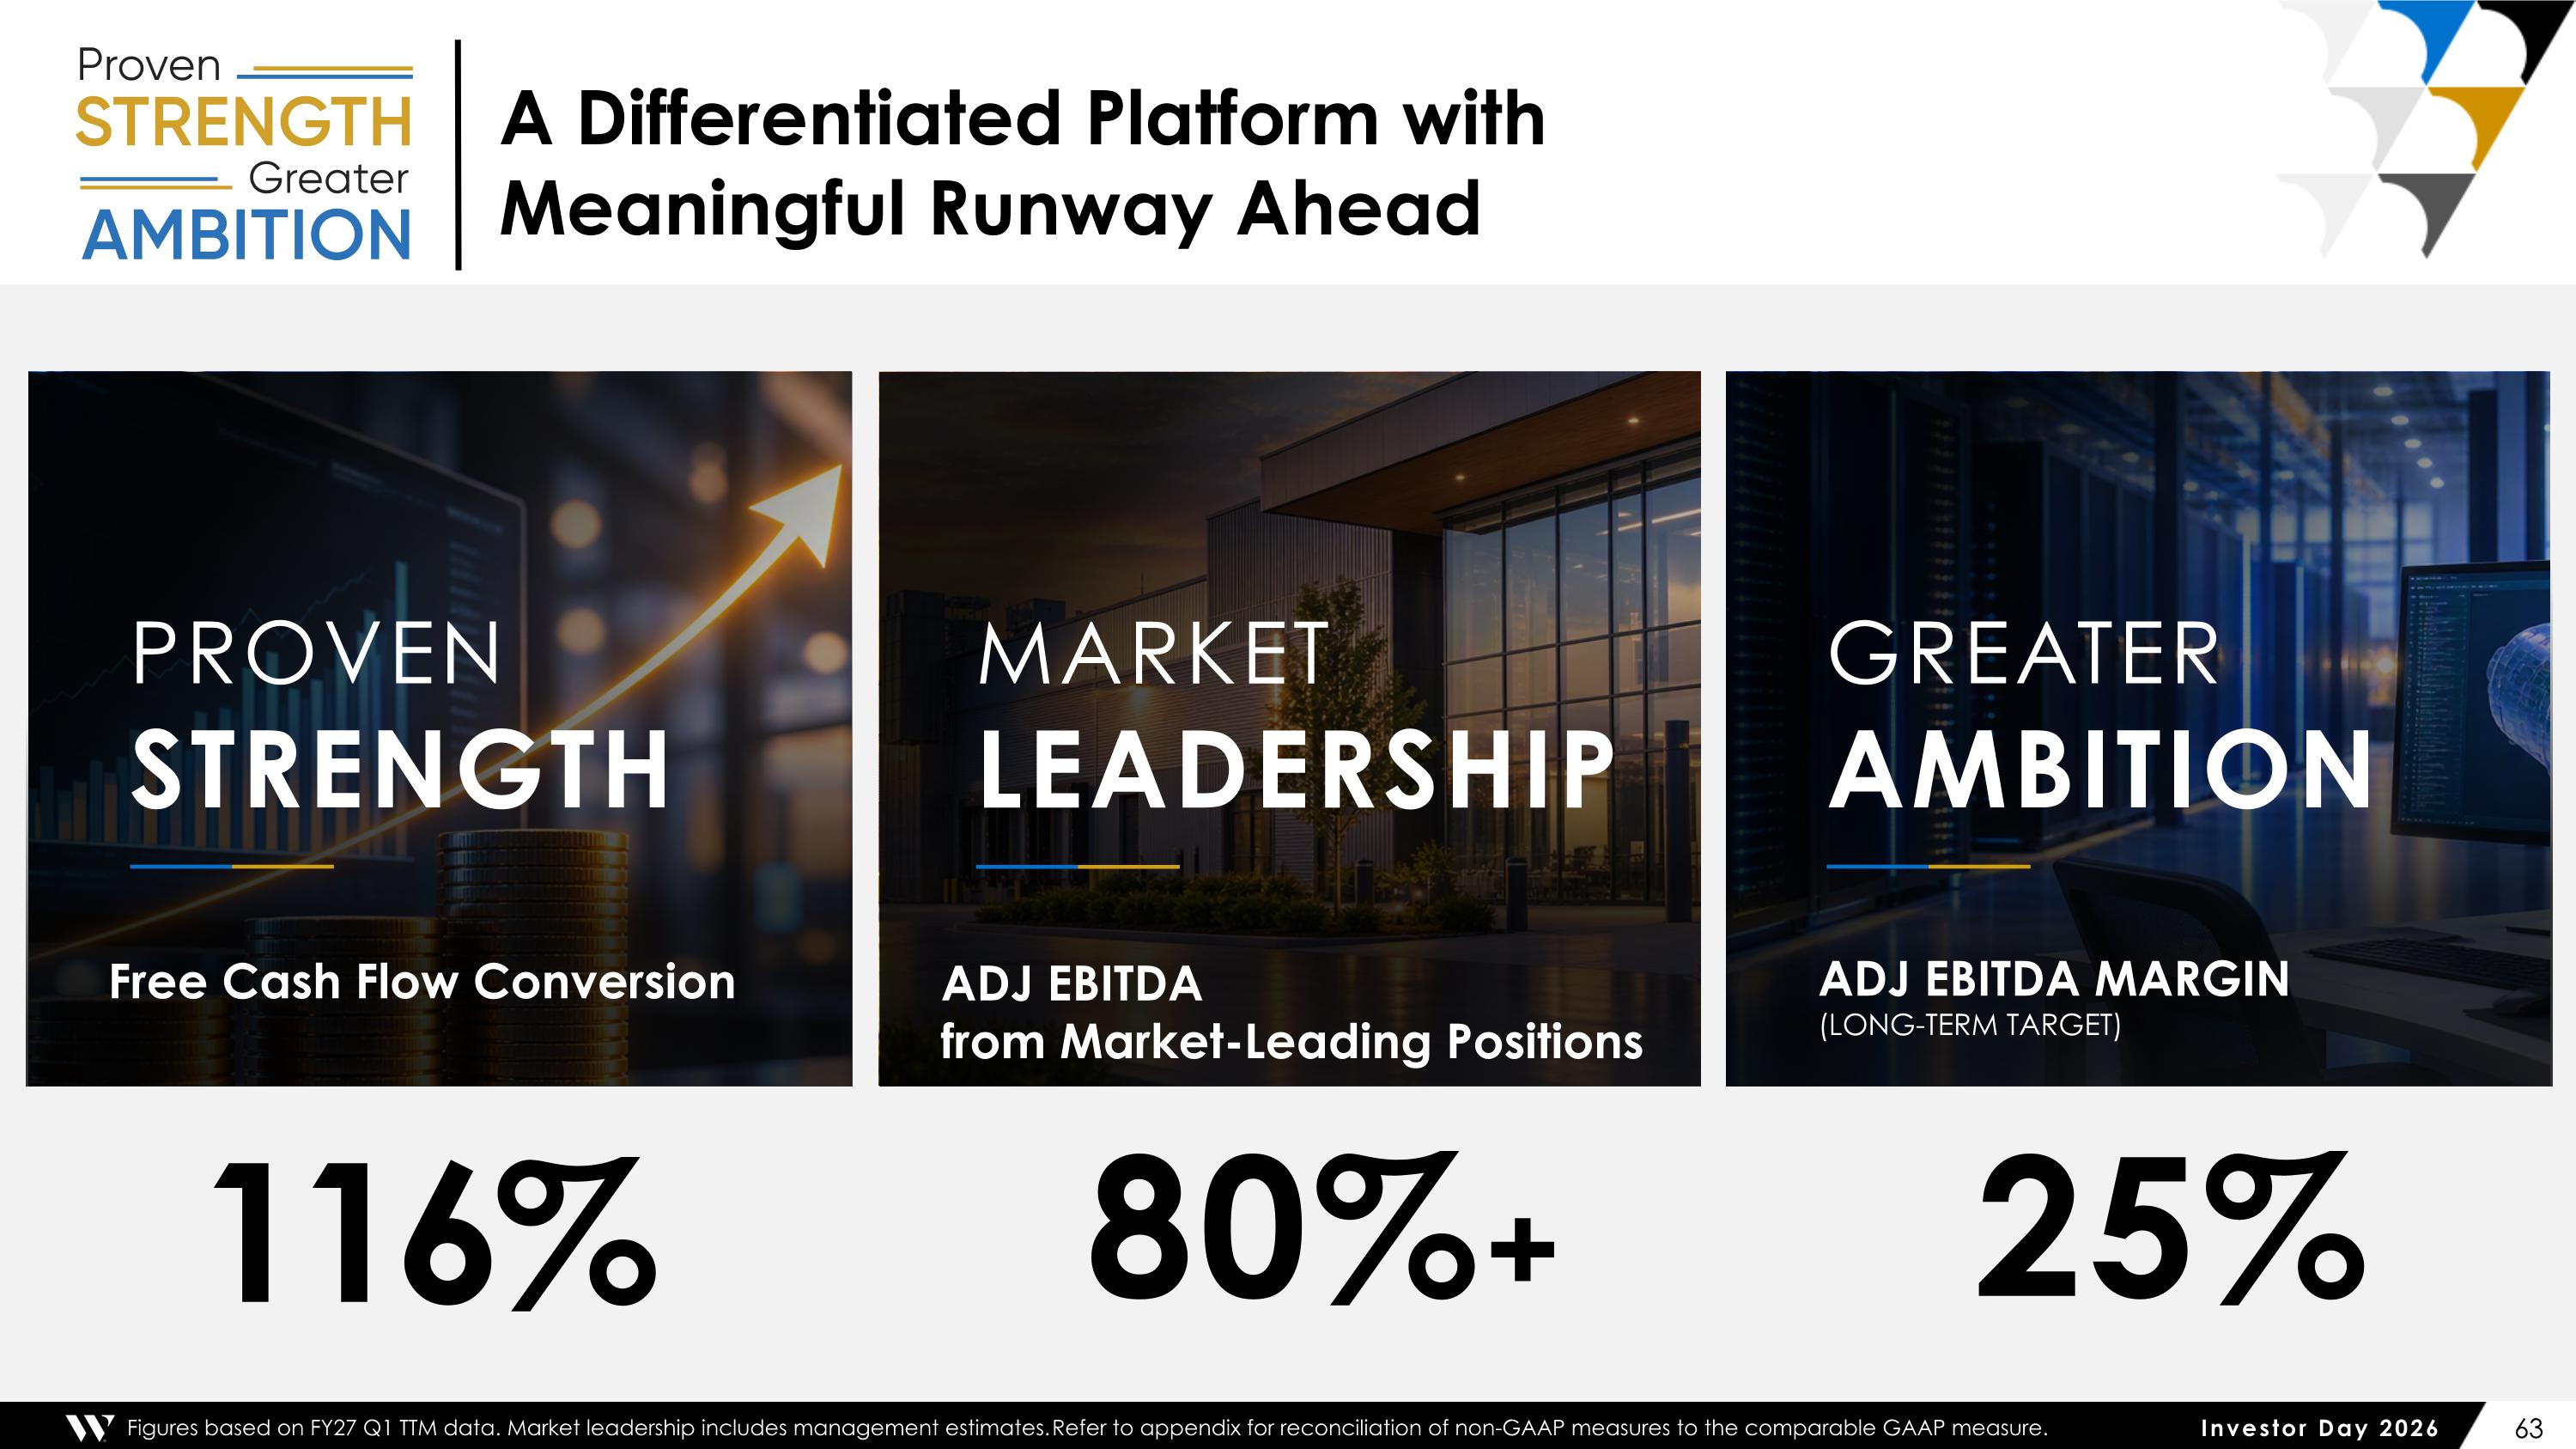
MARKET LEADERSHIP ADJ EBITDA from Market-Leading Positions A Differentiated Platform with Meaningful Runway Ahead PROVEN STRENGTH Free Cash Flow Conversion GREATER AMBITION ADJ EBITDA MARGIN (LONG-TERM TARGET) Figures based on FY27 Q1 TTM data. Market leadership includes management estimates. Refer to appendix for reconciliation of non-GAAP measures to the comparable GAAP measure. 116% 80%+ 25%
Appendix & Reconciliation of Non-GAAP Measures
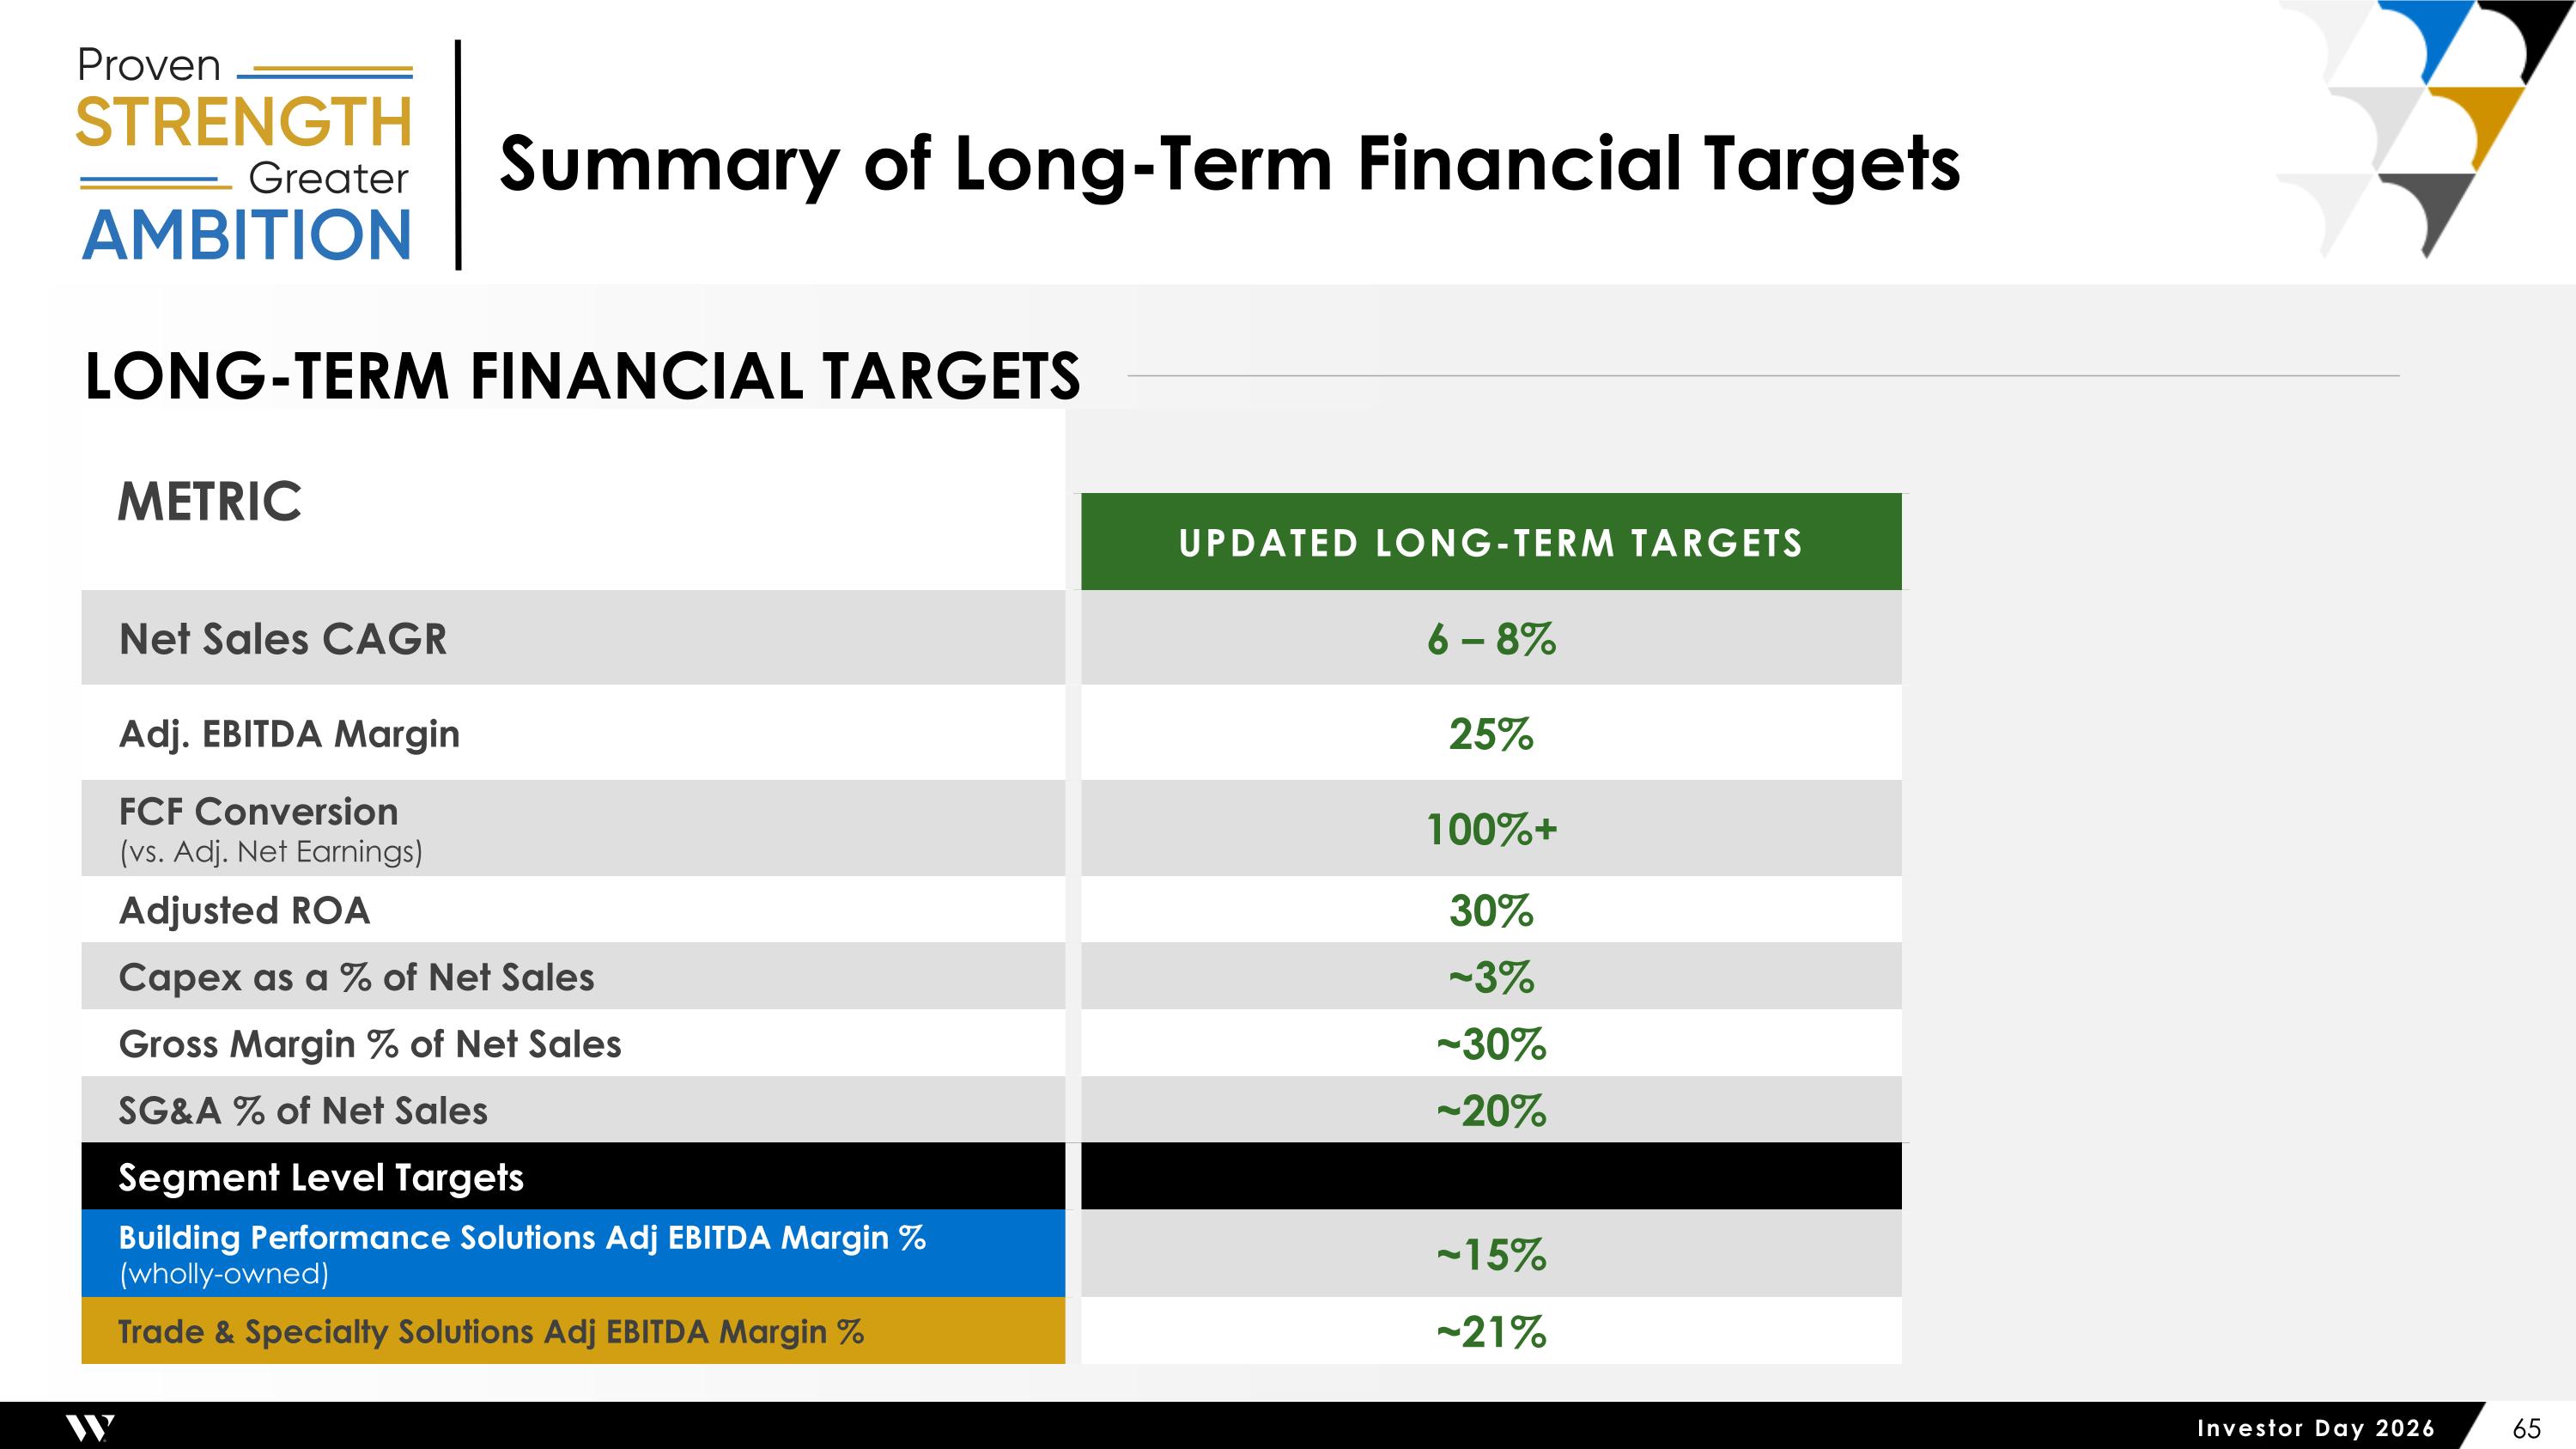
Summary of Long-Term Financial Targets METRIC UPDATED LONG-TERM TARGETS Net Sales CAGR 6 – 8% Adj. EBITDA Margin 25% FCF Conversion (vs. Adj. Net Earnings) 100%+ Adjusted ROA 30% Capex as a % of Net Sales ~3% Gross Margin % of Net Sales ~30% SG&A % of Net Sales ~20% Segment Level Targets Building Performance Solutions Adj EBITDA Margin % (wholly-owned) ~15% Trade & Specialty Solutions Adj EBITDA Margin % ~21% LONG-TERM FINANCIAL TARGETS
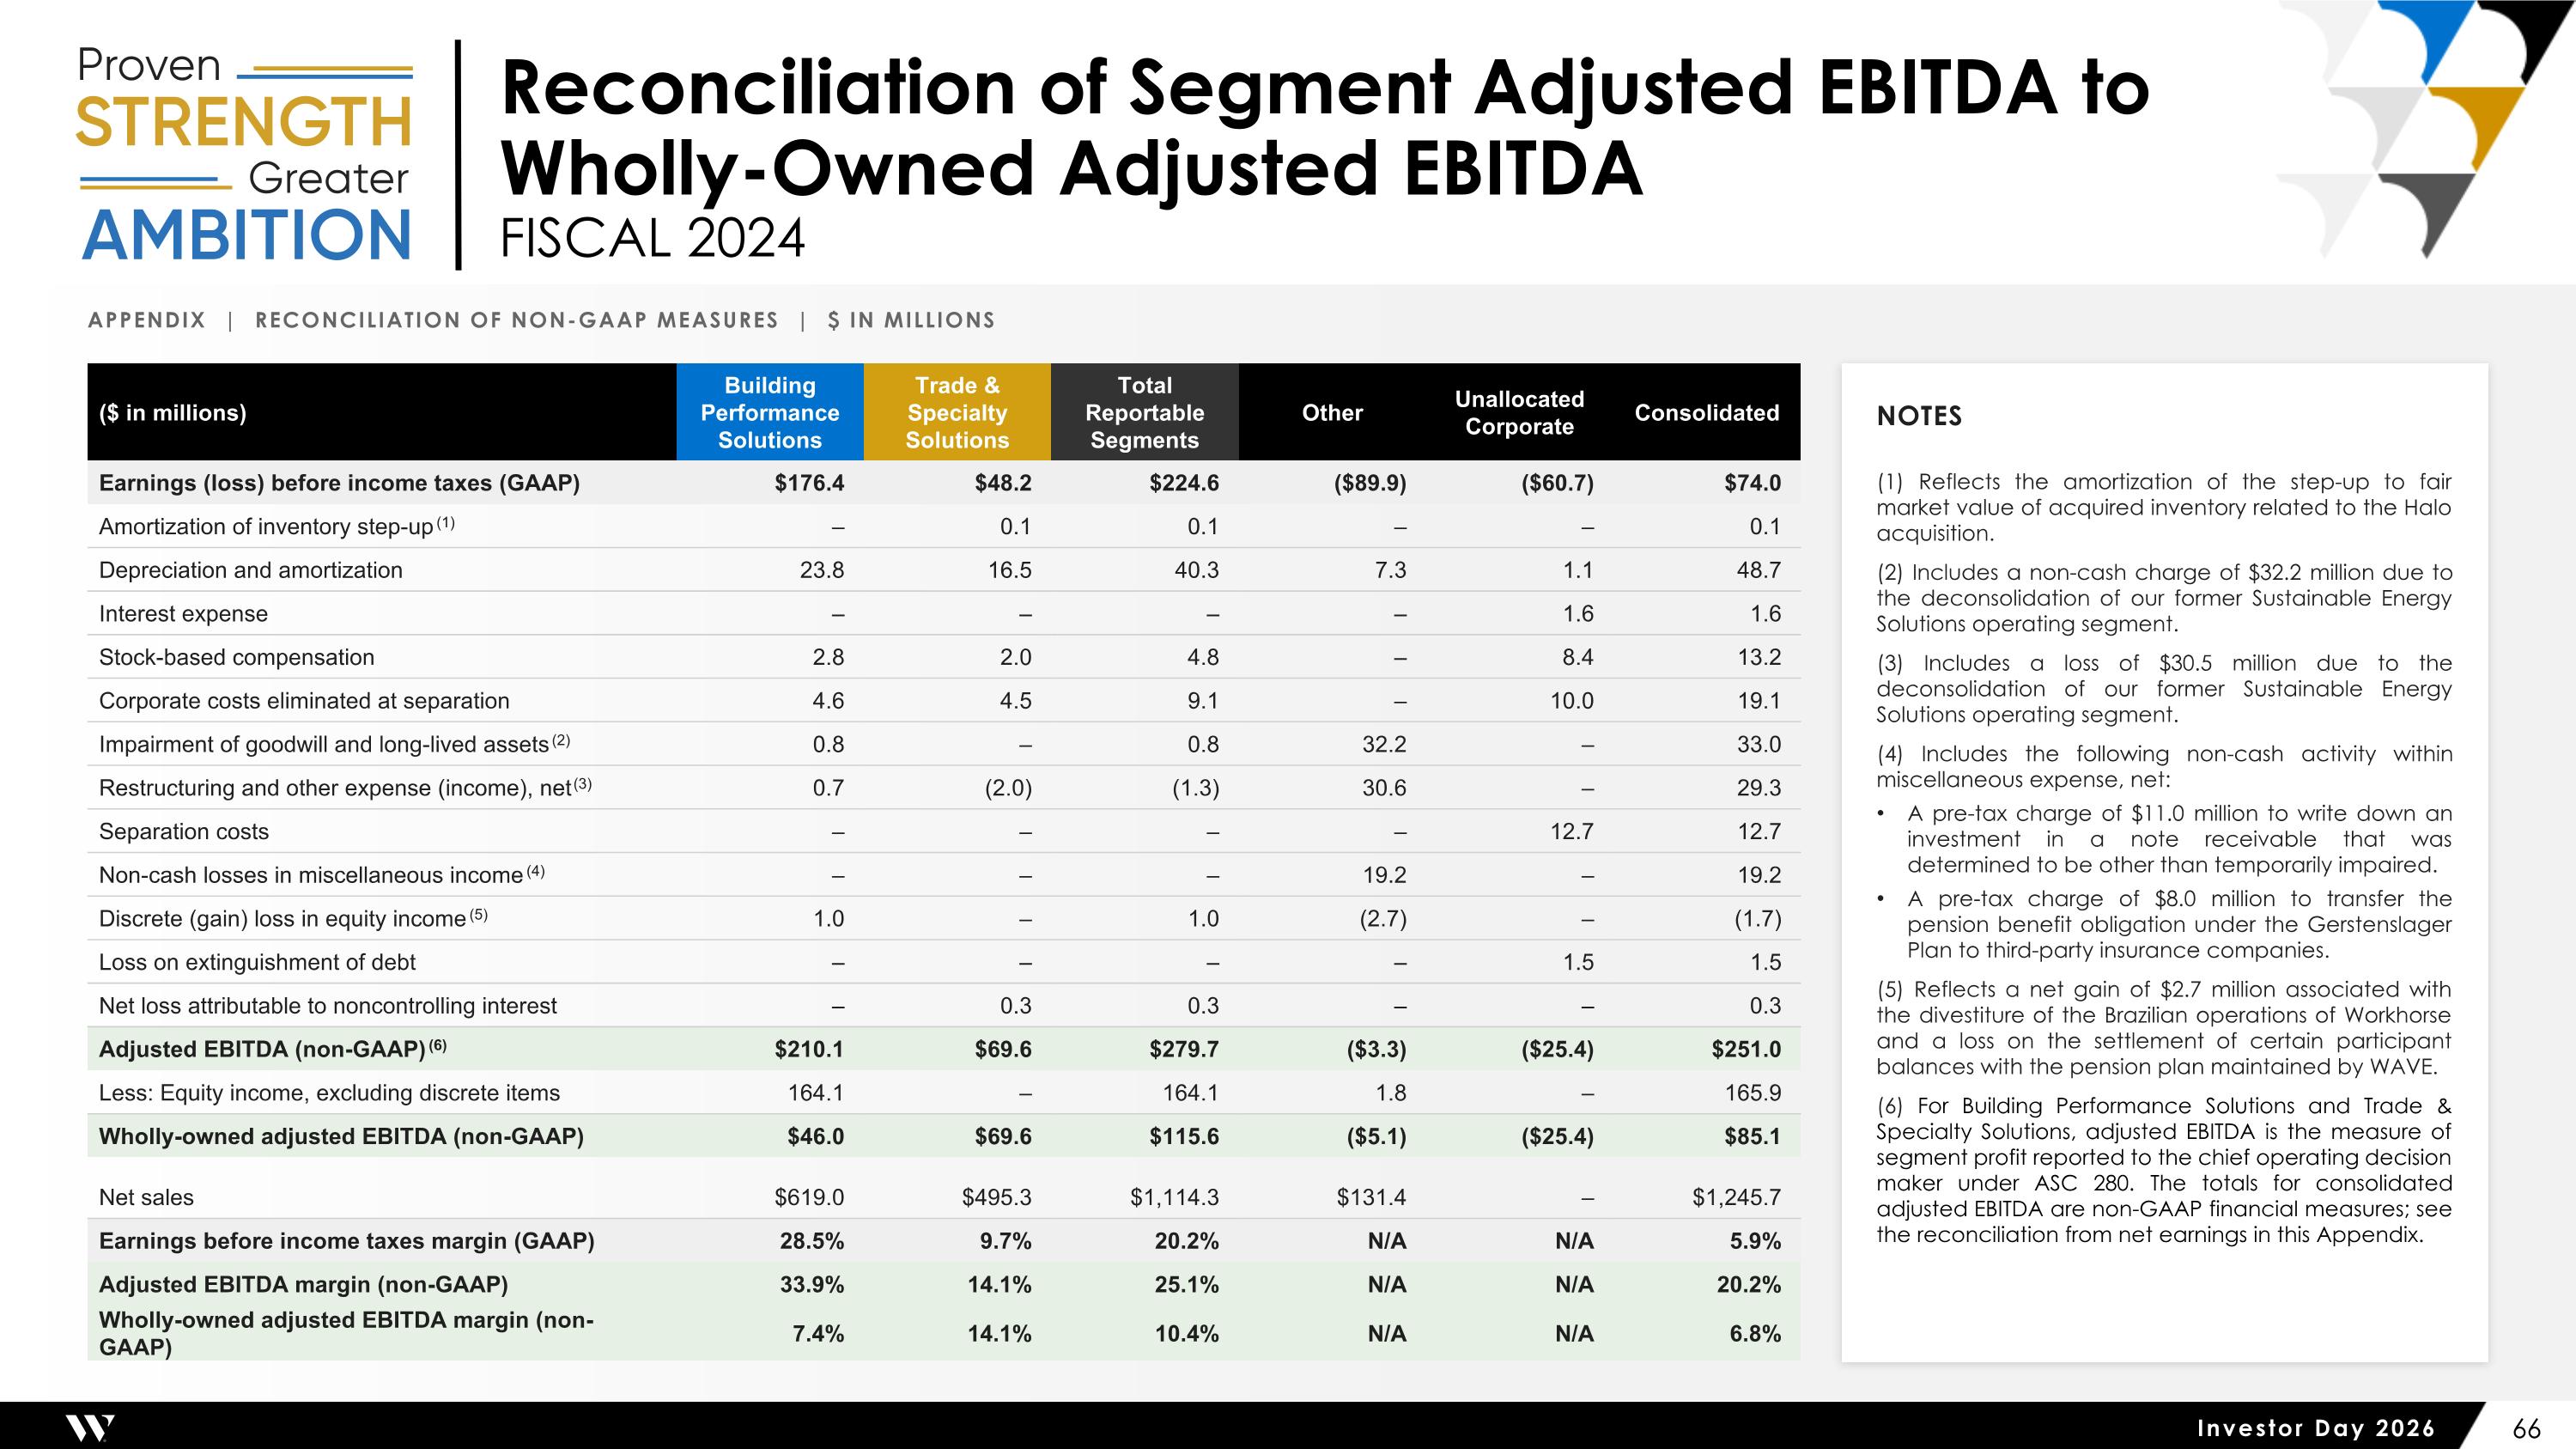
Reconciliation of Segment Adjusted EBITDA to Wholly-Owned Adjusted EBITDA FISCAL 2024 Appendix | Reconciliation of Non-GAAP Measures | $ in millions ($ in millions) Building Performance Solutions Trade & Specialty Solutions Total Reportable Segments Other Unallocated Corporate Consolidated Earnings (loss) before income taxes (GAAP) $176.4 $48.2 $224.6 ($89.9) ($60.7) $74.0 Amortization of inventory step-up (1) – 0.1 0.1 – – 0.1 Depreciation and amortization 23.8 16.5 40.3 7.3 1.1 48.7 Interest expense – – – – 1.6 1.6 Stock-based compensation 2.8 2.0 4.8 – 8.4 13.2 Corporate costs eliminated at separation 4.6 4.5 9.1 – 10.0 19.1 Impairment of goodwill and long-lived assets (2) 0.8 – 0.8 32.2 – 33.0 Restructuring and other expense (income), net (3) 0.7 (2.0) (1.3) 30.6 – 29.3 Separation costs – – – – 12.7 12.7 Non-cash losses in miscellaneous income (4) – – – 19.2 – 19.2 Discrete (gain) loss in equity income (5) 1.0 – 1.0 (2.7) – (1.7) Loss on extinguishment of debt – – – – 1.5 1.5 Net loss attributable to noncontrolling interest – 0.3 0.3 – – 0.3 Adjusted EBITDA (non-GAAP) (6) $210.1 $69.6 $279.7 ($3.3) ($25.4) $251.0 Less: Equity income, excluding discrete items 164.1 – 164.1 1.8 – 165.9 Wholly-owned adjusted EBITDA (non-GAAP) $46.0 $69.6 $115.6 ($5.1) ($25.4) $85.1 Net sales $619.0 $495.3 $1,114.3 $131.4 – $1,245.7 Earnings before income taxes margin (GAAP) 28.5% 9.7% 20.2% N/A N/A 5.9% Adjusted EBITDA margin (non-GAAP) 33.9% 14.1% 25.1% N/A N/A 20.2% Wholly-owned adjusted EBITDA margin (non-GAAP) 7.4% 14.1% 10.4% N/A N/A 6.8% Notes (1) Reflects the amortization of the step-up to fair market value of acquired inventory related to the Halo acquisition. (2) Includes a non-cash charge of $32.2 million due to the deconsolidation of our former Sustainable Energy Solutions operating segment. (3) Includes a loss of $30.5 million due to the deconsolidation of our former Sustainable Energy Solutions operating segment. (4) Includes the following non-cash activity within miscellaneous expense, net: A pre-tax charge of $11.0 million to write down an investment in a note receivable that was determined to be other than temporarily impaired. A pre-tax charge of $8.0 million to transfer the pension benefit obligation under the Gerstenslager Plan to third-party insurance companies. (5) Reflects a net gain of $2.7 million associated with the divestiture of the Brazilian operations of Workhorse and a loss on the settlement of certain participant balances with the pension plan maintained by WAVE. (6) For Building Performance Solutions and Trade & Specialty Solutions, adjusted EBITDA is the measure of segment profit reported to the chief operating decision maker under ASC 280. The totals for consolidated adjusted EBITDA are non-GAAP financial measures; see the reconciliation from net earnings in this Appendix.
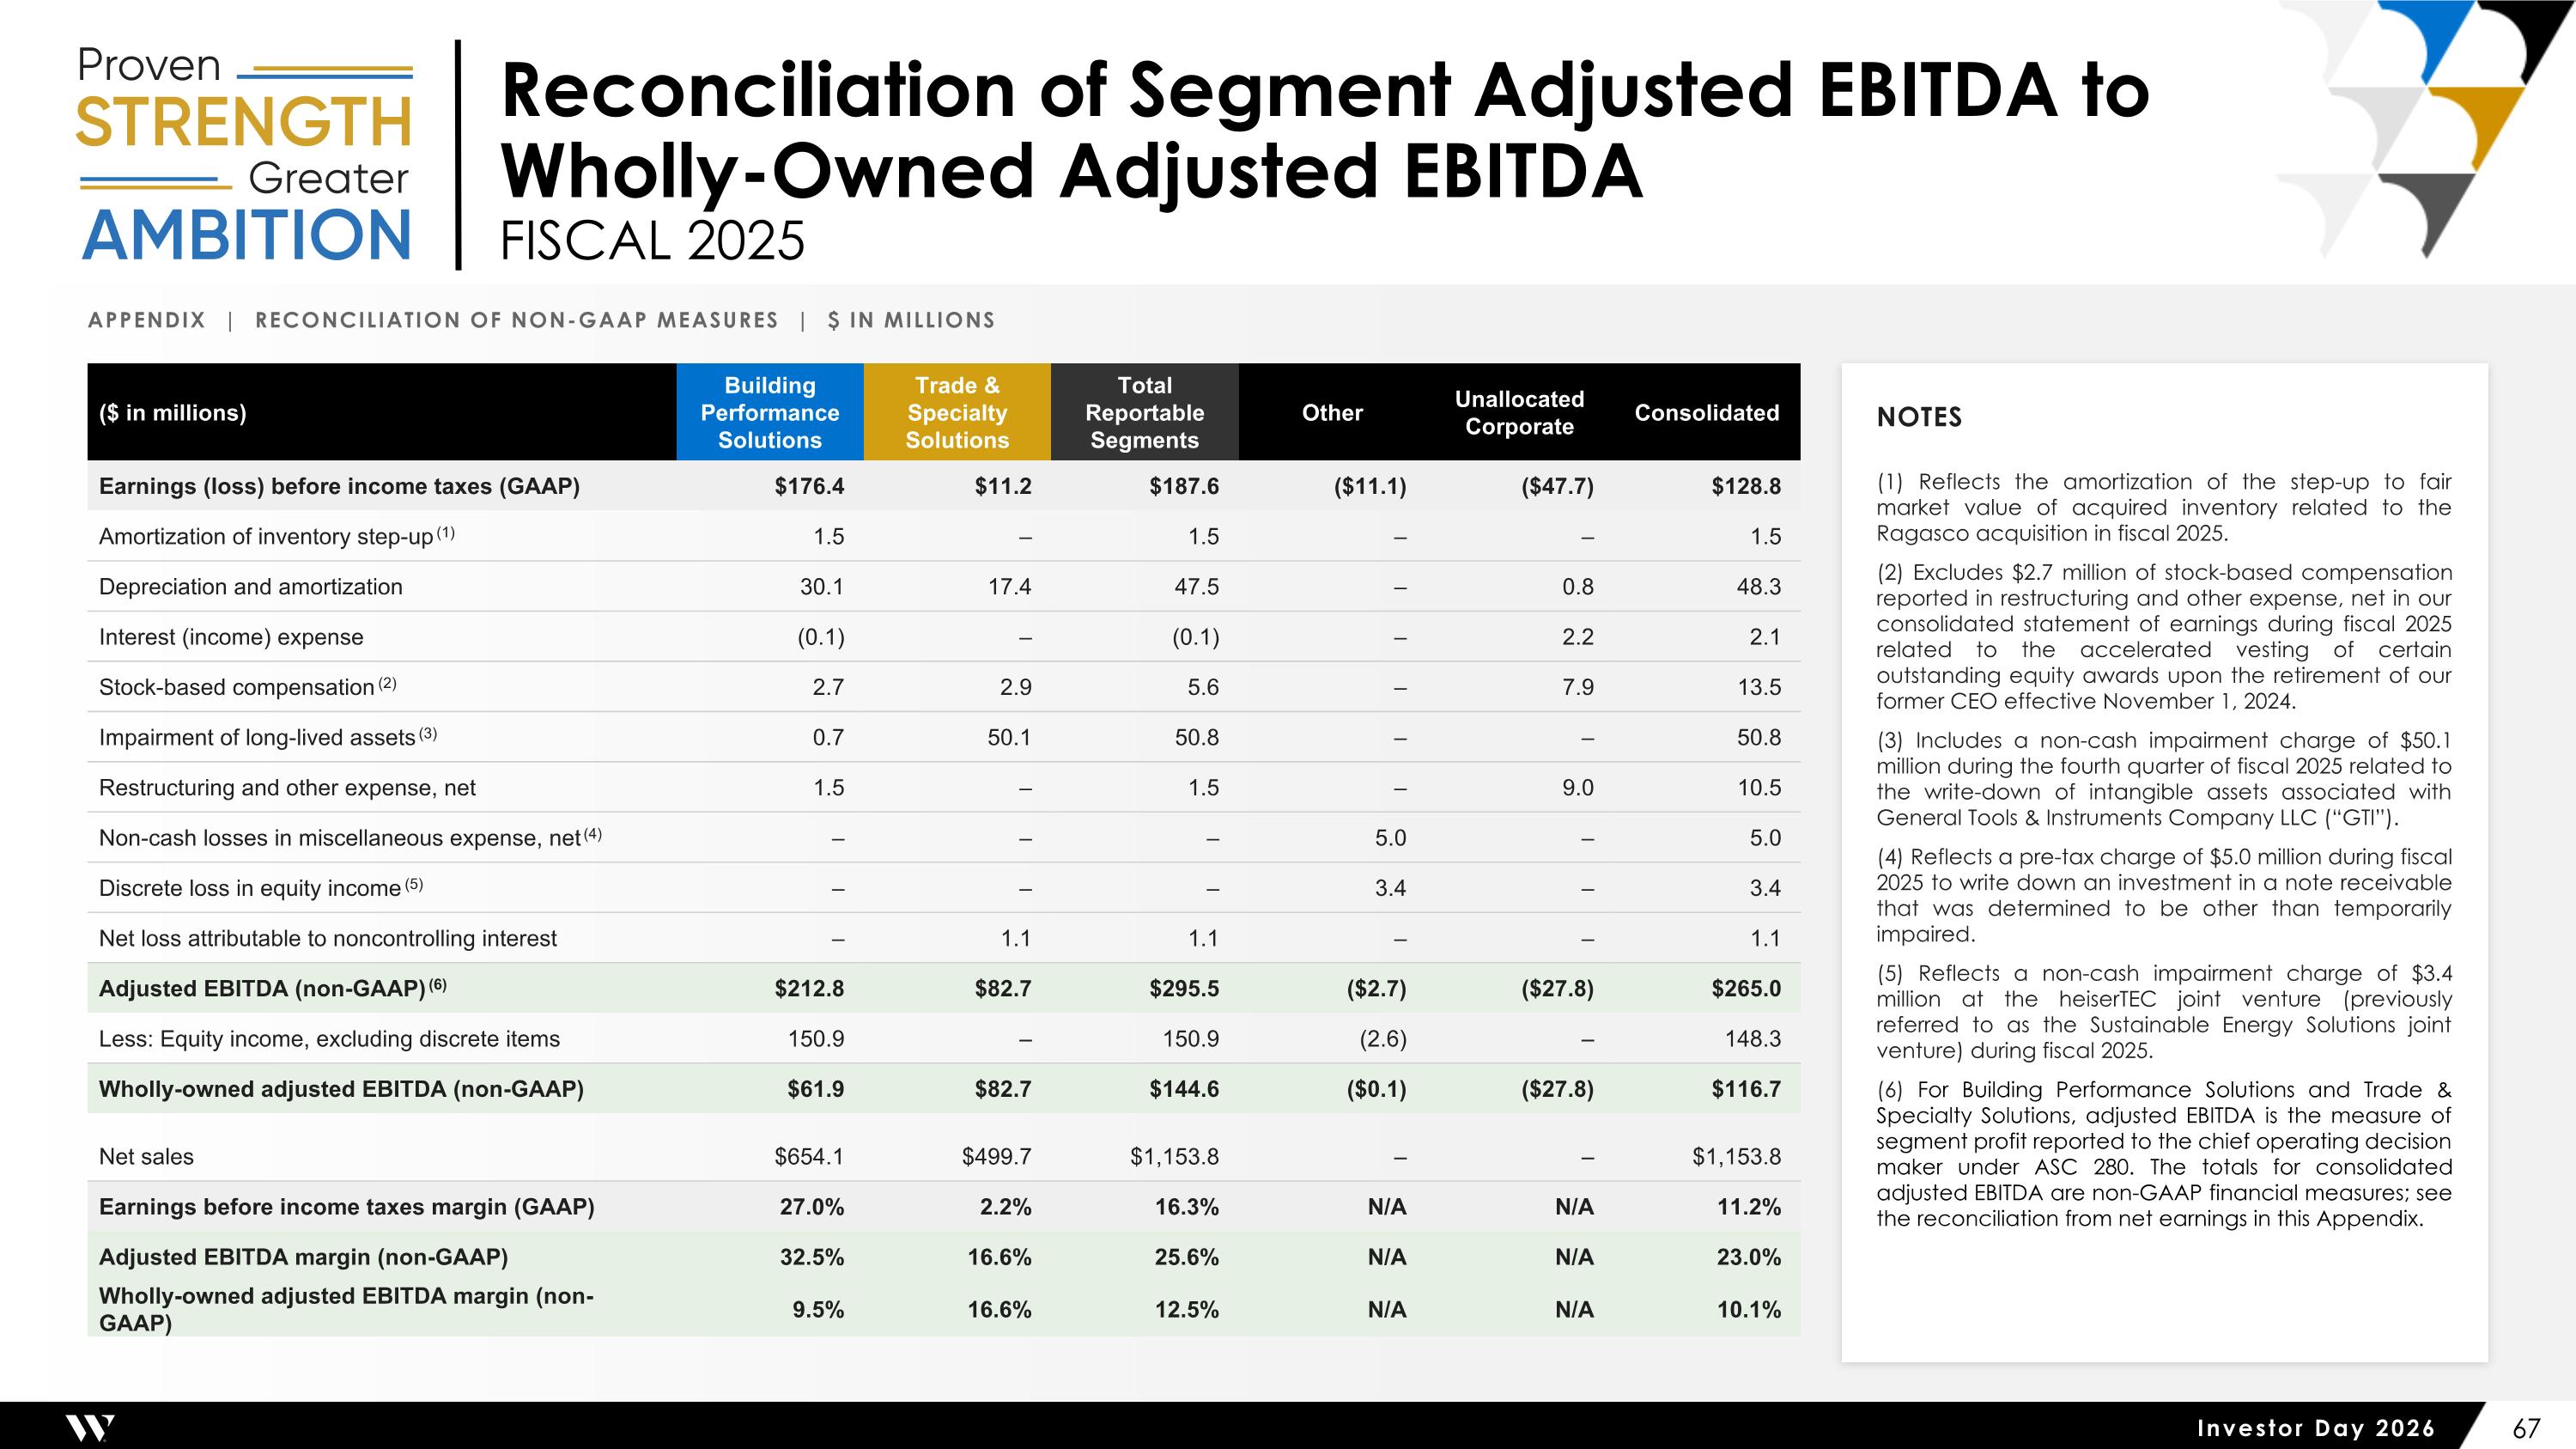
Appendix | Reconciliation of Non-GAAP Measures | $ in millions ($ in millions) Building Performance Solutions Trade & Specialty Solutions Total Reportable Segments Other Unallocated Corporate Consolidated Earnings (loss) before income taxes (GAAP) $176.4 $11.2 $187.6 ($11.1) ($47.7) $128.8 Amortization of inventory step-up (1) 1.5 – 1.5 – – 1.5 Depreciation and amortization 30.1 17.4 47.5 – 0.8 48.3 Interest (income) expense (0.1) – (0.1) – 2.2 2.1 Stock-based compensation (2) 2.7 2.9 5.6 – 7.9 13.5 Impairment of long-lived assets (3) 0.7 50.1 50.8 – – 50.8 Restructuring and other expense, net 1.5 – 1.5 – 9.0 10.5 Non-cash losses in miscellaneous expense, net (4) – – – 5.0 – 5.0 Discrete loss in equity income (5) – – – 3.4 – 3.4 Net loss attributable to noncontrolling interest – 1.1 1.1 – – 1.1 Adjusted EBITDA (non-GAAP) (6) $212.8 $82.7 $295.5 ($2.7) ($27.8) $265.0 Less: Equity income, excluding discrete items 150.9 – 150.9 (2.6) – 148.3 Wholly-owned adjusted EBITDA (non-GAAP) $61.9 $82.7 $144.6 ($0.1) ($27.8) $116.7 Net sales $654.1 $499.7 $1,153.8 – – $1,153.8 Earnings before income taxes margin (GAAP) 27.0% 2.2% 16.3% N/A N/A 11.2% Adjusted EBITDA margin (non-GAAP) 32.5% 16.6% 25.6% N/A N/A 23.0% Wholly-owned adjusted EBITDA margin (non-GAAP) 9.5% 16.6% 12.5% N/A N/A 10.1% Notes (1) Reflects the amortization of the step-up to fair market value of acquired inventory related to the Ragasco acquisition in fiscal 2025. (2) Excludes $2.7 million of stock-based compensation reported in restructuring and other expense, net in our consolidated statement of earnings during fiscal 2025 related to the accelerated vesting of certain outstanding equity awards upon the retirement of our former CEO effective November 1, 2024. (3) Includes a non-cash impairment charge of $50.1 million during the fourth quarter of fiscal 2025 related to the write-down of intangible assets associated with General Tools & Instruments Company LLC (“GTI”). (4) Reflects a pre-tax charge of $5.0 million during fiscal 2025 to write down an investment in a note receivable that was determined to be other than temporarily impaired. (5) Reflects a non-cash impairment charge of $3.4 million at the heiserTEC joint venture (previously referred to as the Sustainable Energy Solutions joint venture) during fiscal 2025. (6) For Building Performance Solutions and Trade & Specialty Solutions, adjusted EBITDA is the measure of segment profit reported to the chief operating decision maker under ASC 280. The totals for consolidated adjusted EBITDA are non-GAAP financial measures; see the reconciliation from net earnings in this Appendix. Reconciliation of Segment Adjusted EBITDA to Wholly-Owned Adjusted EBITDA FISCAL 2025
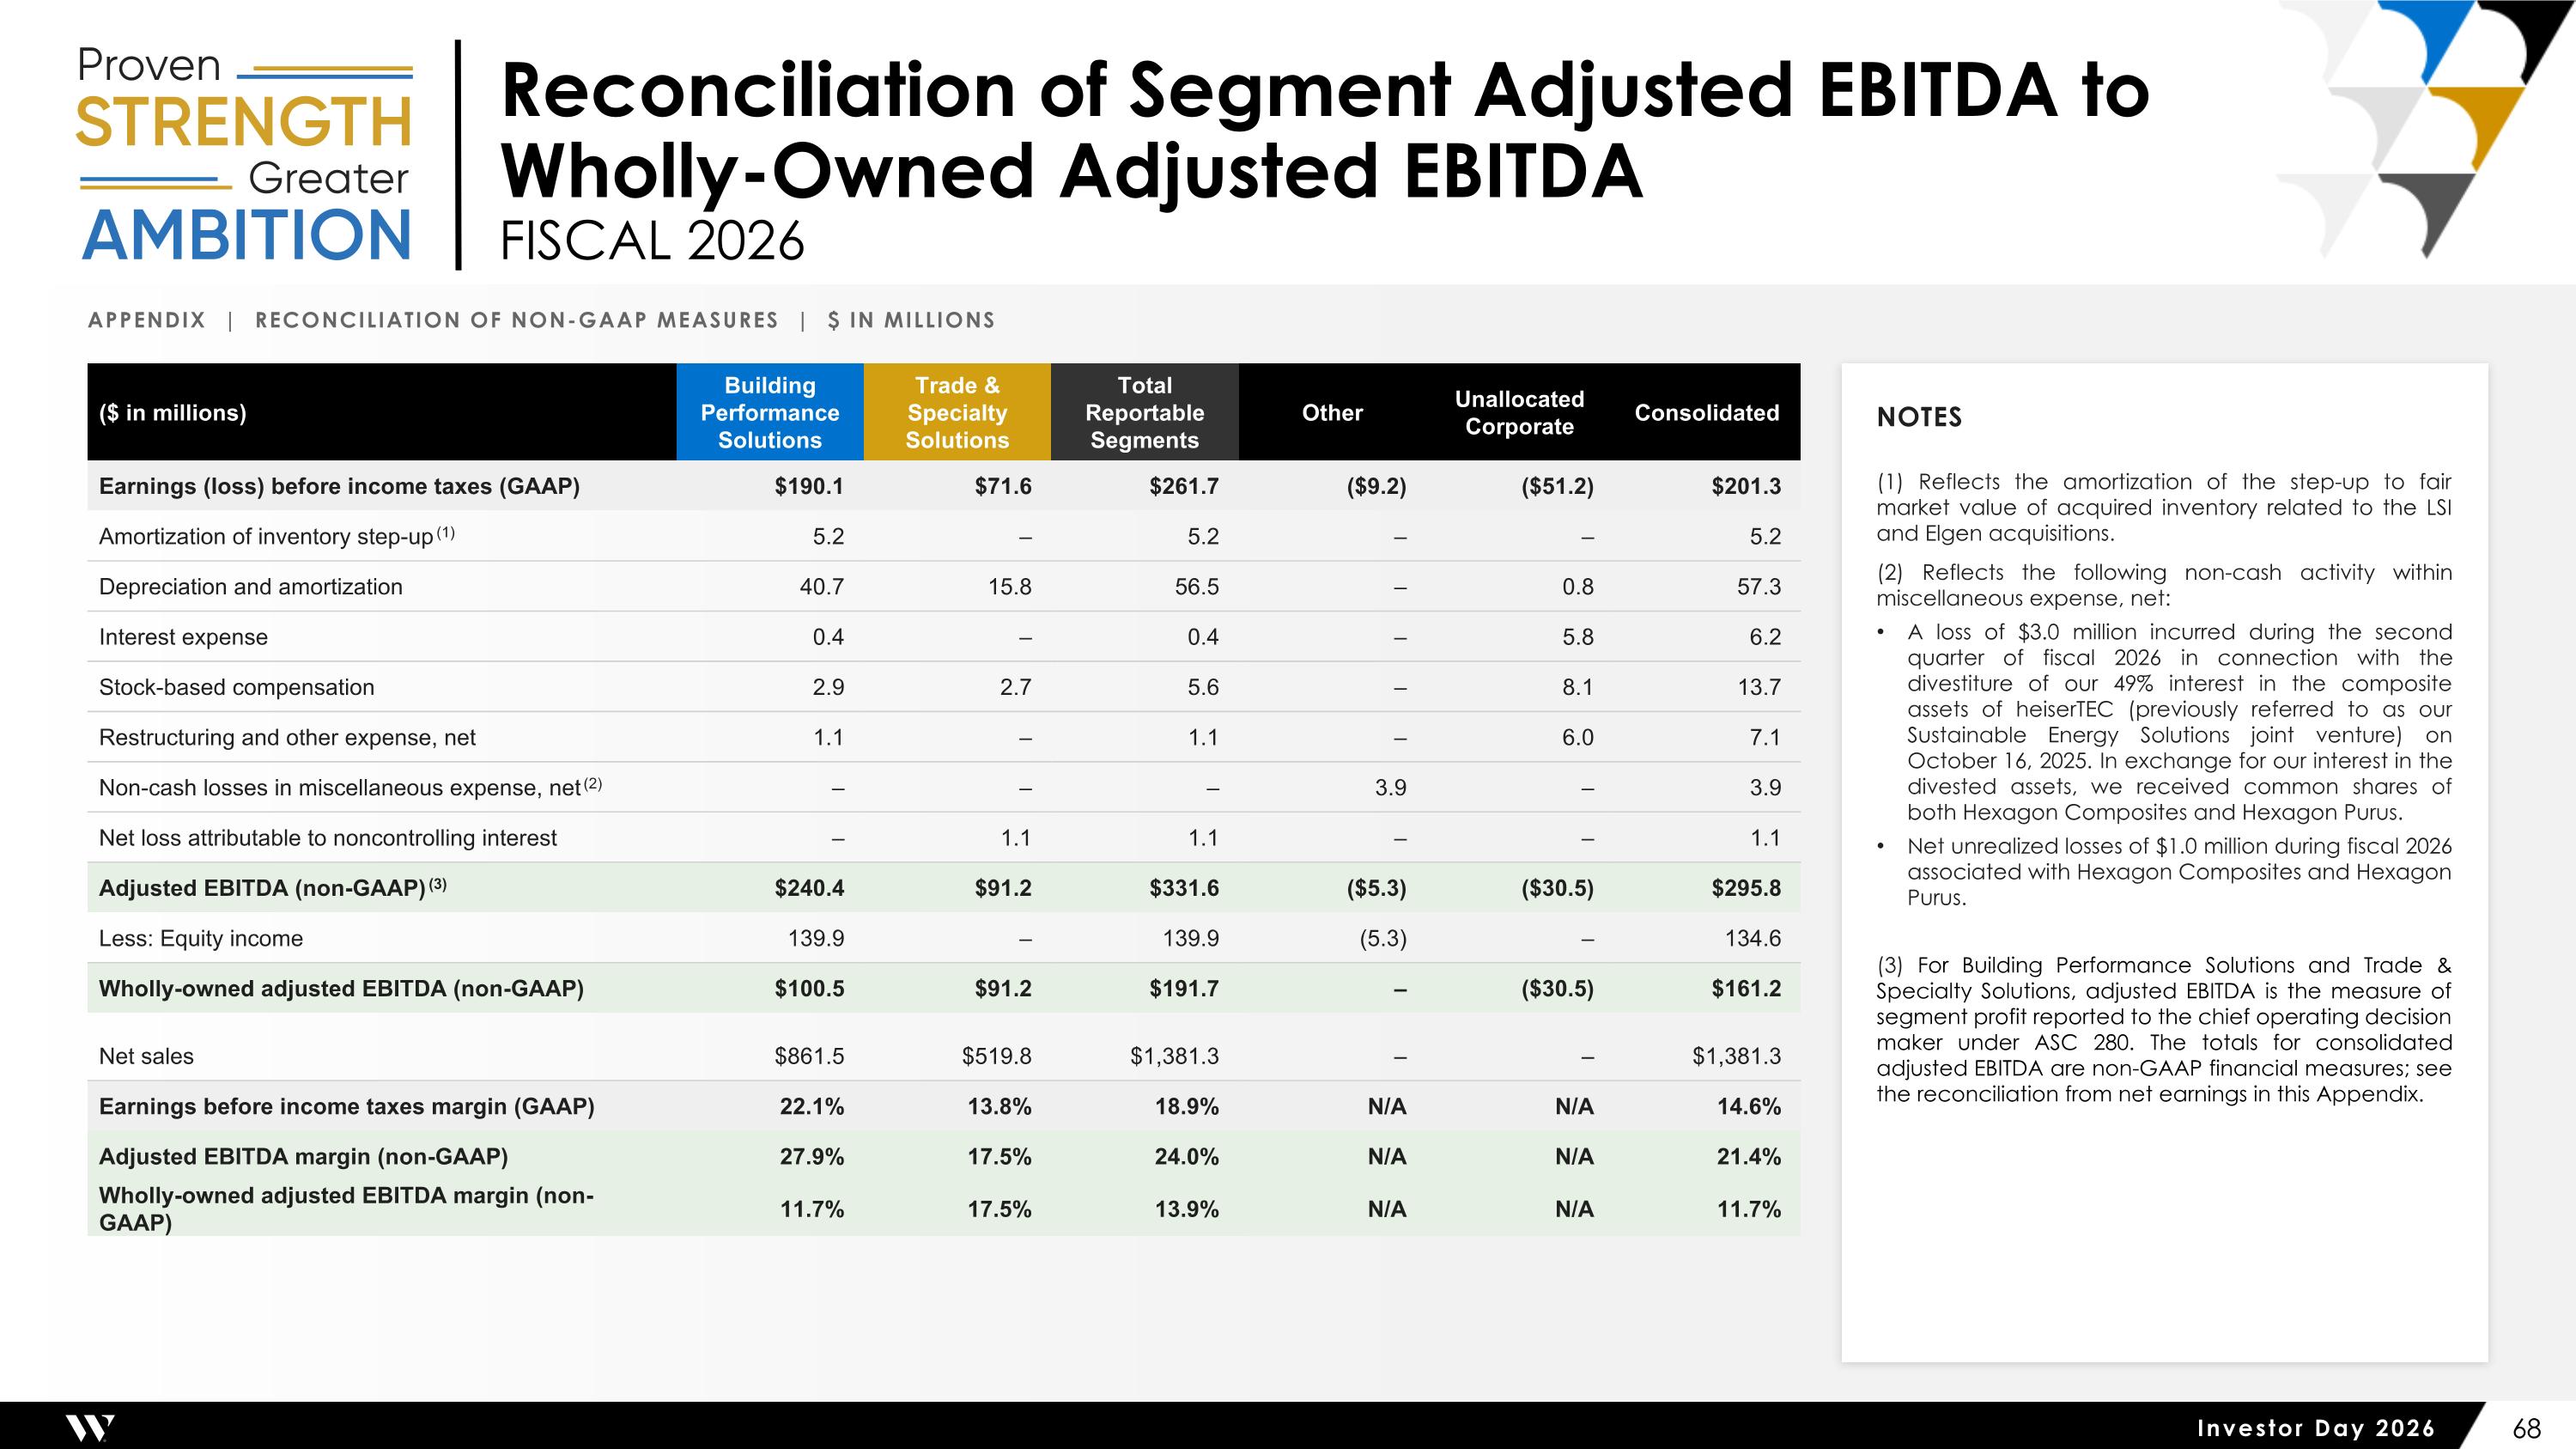
Appendix | Reconciliation of Non-GAAP Measures | $ in millions ($ in millions) Building Performance Solutions Trade & Specialty Solutions Total Reportable Segments Other Unallocated Corporate Consolidated Earnings (loss) before income taxes (GAAP) $190.1 $71.6 $261.7 ($9.2) ($51.2) $201.3 Amortization of inventory step-up (1) 5.2 – 5.2 – – 5.2 Depreciation and amortization 40.7 15.8 56.5 – 0.8 57.3 Interest expense 0.4 – 0.4 – 5.8 6.2 Stock-based compensation 2.9 2.7 5.6 – 8.1 13.7 Restructuring and other expense, net 1.1 – 1.1 – 6.0 7.1 Non-cash losses in miscellaneous expense, net (2) – – – 3.9 – 3.9 Net loss attributable to noncontrolling interest – 1.1 1.1 – – 1.1 Adjusted EBITDA (non-GAAP) (3) $240.4 $91.2 $331.6 ($5.3) ($30.5) $295.8 Less: Equity income 139.9 – 139.9 (5.3) – 134.6 Wholly-owned adjusted EBITDA (non-GAAP) $100.5 $91.2 $191.7 – ($30.5) $161.2 Net sales $861.5 $519.8 $1,381.3 – – $1,381.3 Earnings before income taxes margin (GAAP) 22.1% 13.8% 18.9% N/A N/A 14.6% Adjusted EBITDA margin (non-GAAP) 27.9% 17.5% 24.0% N/A N/A 21.4% Wholly-owned adjusted EBITDA margin (non-GAAP) 11.7% 17.5% 13.9% N/A N/A 11.7% Notes (1) Reflects the amortization of the step-up to fair market value of acquired inventory related to the LSI and Elgen acquisitions. (2) Reflects the following non-cash activity within miscellaneous expense, net: A loss of $3.0 million incurred during the second quarter of fiscal 2026 in connection with the divestiture of our 49% interest in the composite assets of heiserTEC (previously referred to as our Sustainable Energy Solutions joint venture) on October 16, 2025. In exchange for our interest in the divested assets, we received common shares of both Hexagon Composites and Hexagon Purus. Net unrealized losses of $1.0 million during fiscal 2026 associated with Hexagon Composites and Hexagon Purus. (3) For Building Performance Solutions and Trade & Specialty Solutions, adjusted EBITDA is the measure of segment profit reported to the chief operating decision maker under ASC 280. The totals for consolidated adjusted EBITDA are non-GAAP financial measures; see the reconciliation from net earnings in this Appendix. Reconciliation of Segment Adjusted EBITDA to Wholly-Owned Adjusted EBITDA FISCAL 2026
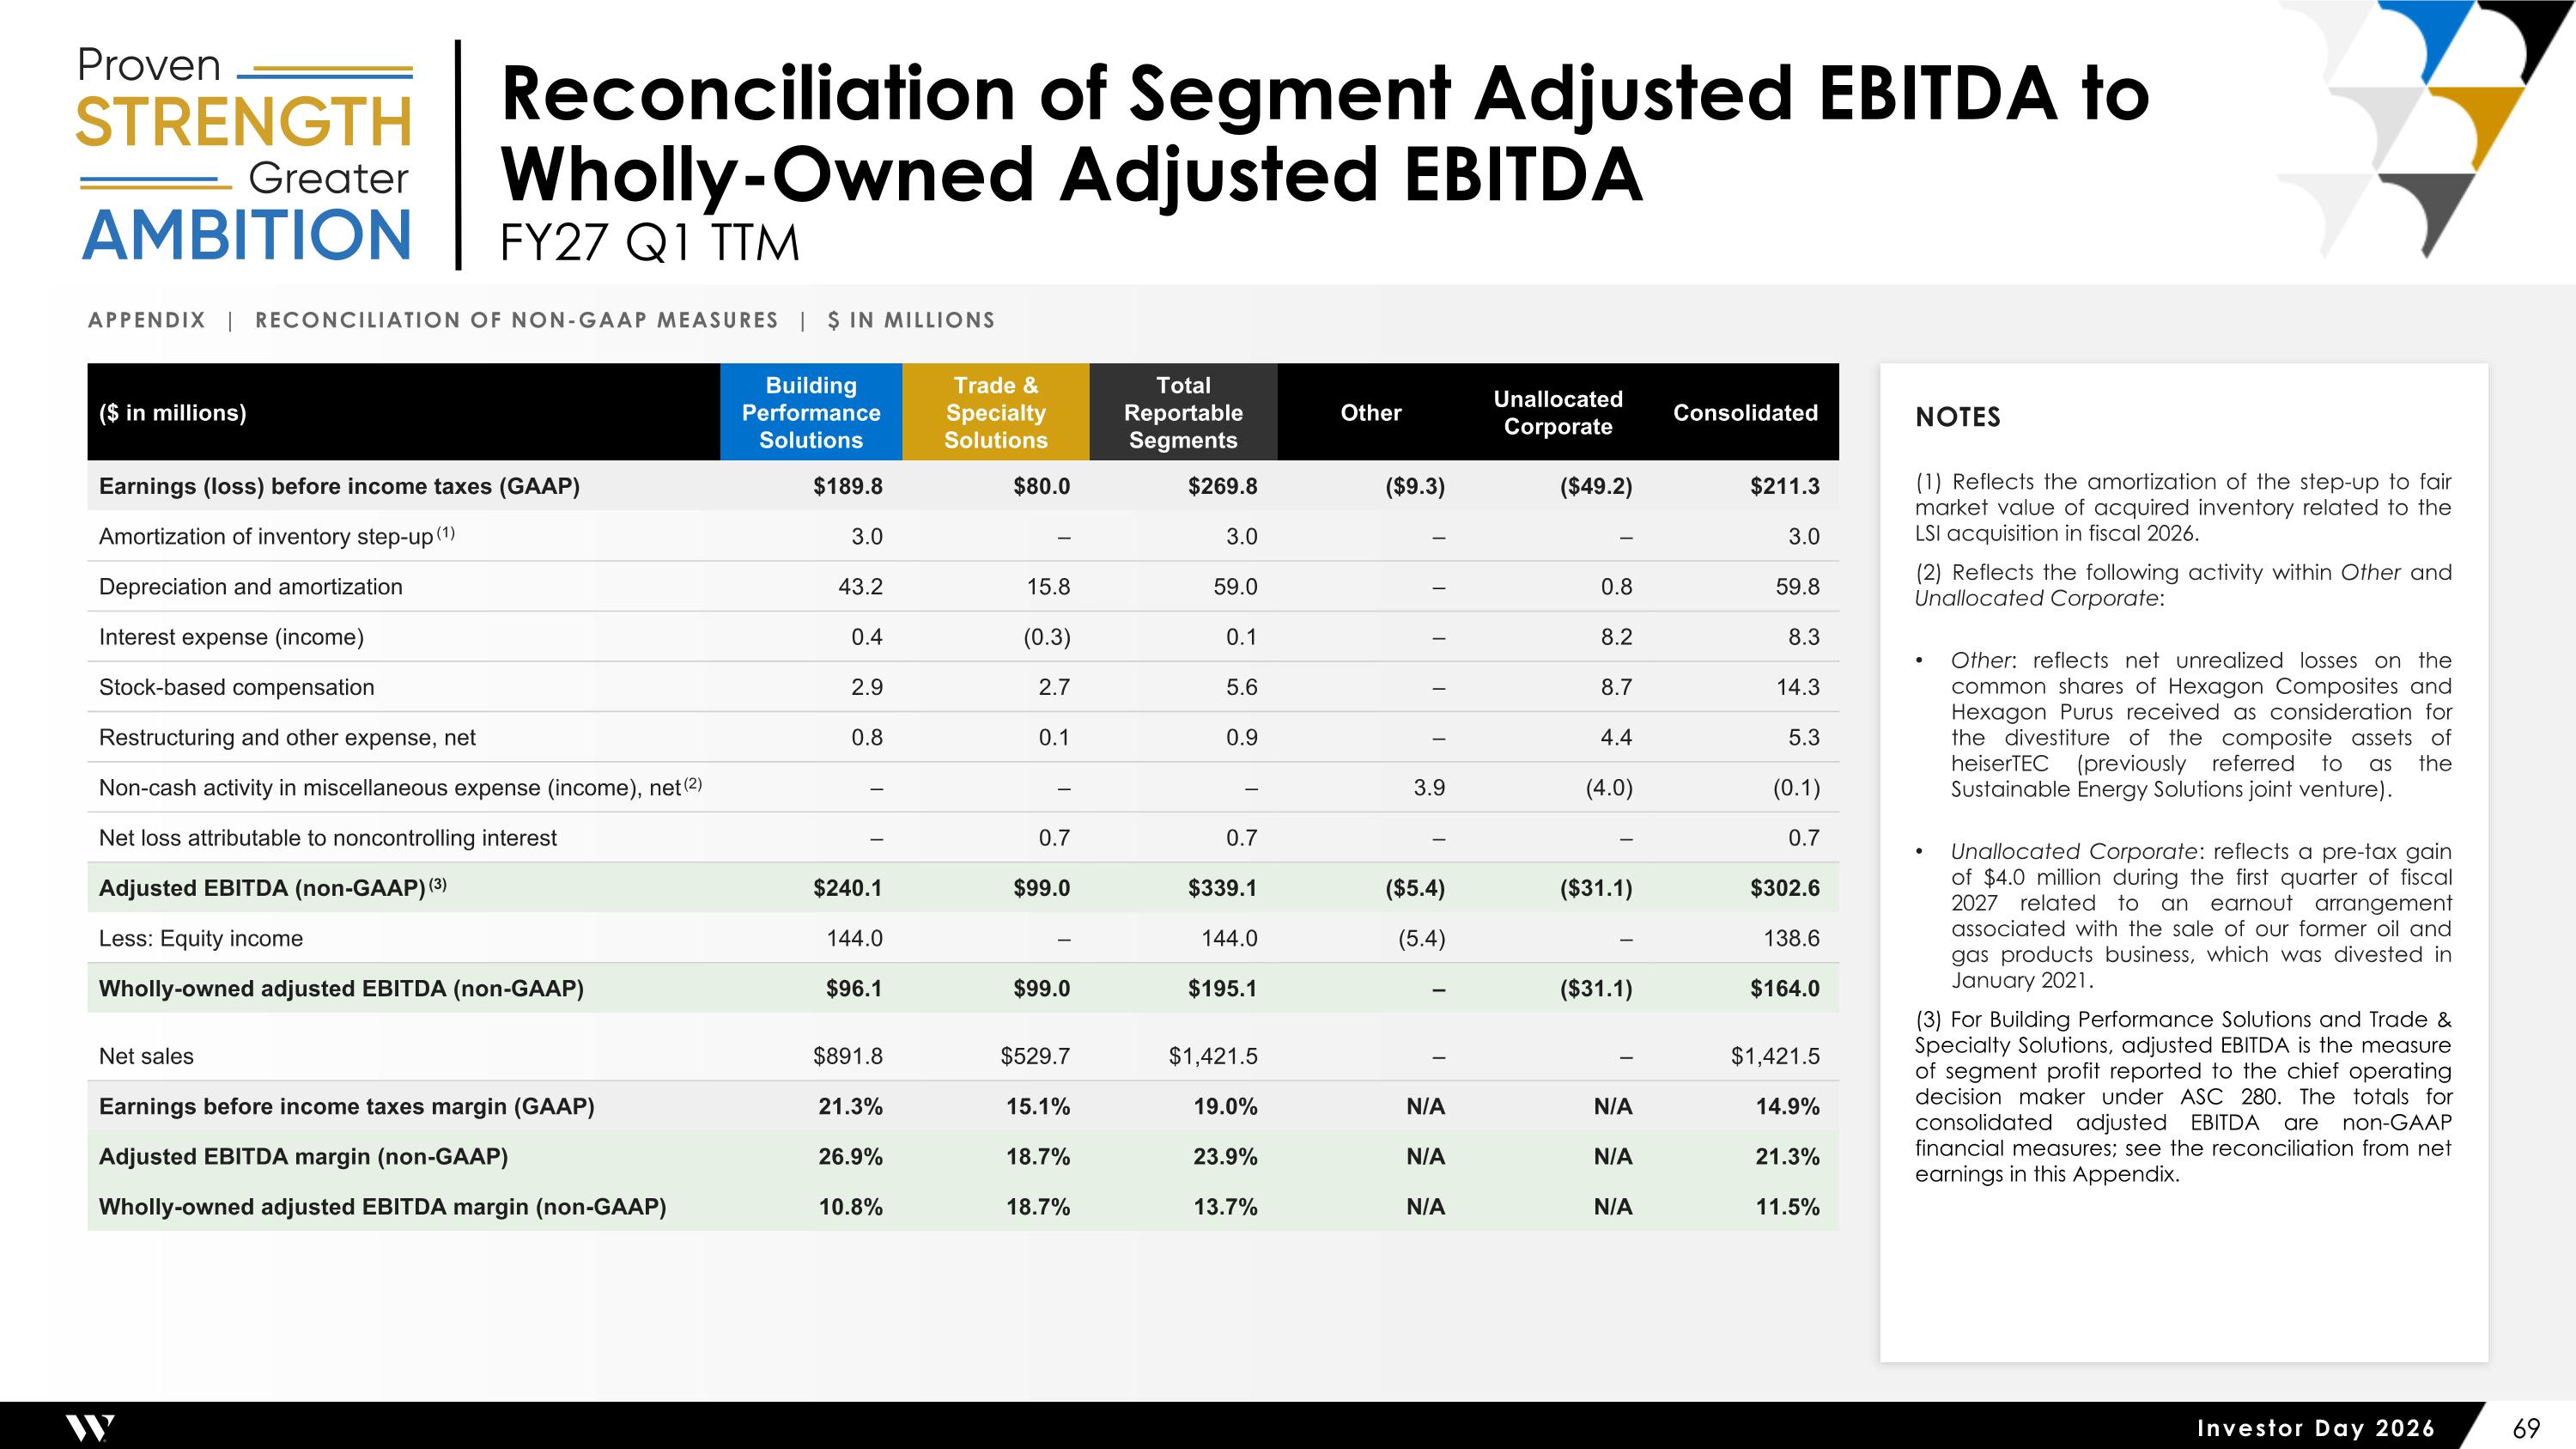
Appendix | Reconciliation of Non-GAAP Measures | $ in millions ($ in millions) Building Performance Solutions Trade & Specialty Solutions Total Reportable Segments Other Unallocated Corporate Consolidated Earnings (loss) before income taxes (GAAP) $189.8 $80.0 $269.8 ($9.3) ($49.2) $211.3 Amortization of inventory step-up (1) 3.0 – 3.0 – – 3.0 Depreciation and amortization 43.2 15.8 59.0 – 0.8 59.8 Interest expense (income) 0.4 (0.3) 0.1 – 8.2 8.3 Stock-based compensation 2.9 2.7 5.6 – 8.7 14.3 Restructuring and other expense, net 0.8 0.1 0.9 – 4.4 5.3 Non-cash activity in miscellaneous expense (income), net (2) – – – 3.9 (4.0) (0.1) Net loss attributable to noncontrolling interest – 0.7 0.7 – – 0.7 Adjusted EBITDA (non-GAAP) (3) $240.1 $99.0 $339.1 ($5.4) ($31.1) $302.6 Less: Equity income 144.0 – 144.0 (5.4) – 138.6 Wholly-owned adjusted EBITDA (non-GAAP) $96.1 $99.0 $195.1 – ($31.1) $164.0 Net sales $891.8 $529.7 $1,421.5 – – $1,421.5 Earnings before income taxes margin (GAAP) 21.3% 15.1% 19.0% N/A N/A 14.9% Adjusted EBITDA margin (non-GAAP) 26.9% 18.7% 23.9% N/A N/A 21.3% Wholly-owned adjusted EBITDA margin (non-GAAP) 10.8% 18.7% 13.7% N/A N/A 11.5% Notes (1) Reflects the amortization of the step-up to fair market value of acquired inventory related to the LSI acquisition in fiscal 2026. (2) Reflects the following activity within Other and Unallocated Corporate: Other: reflects net unrealized losses on the common shares of Hexagon Composites and Hexagon Purus received as consideration for the divestiture of the composite assets of heiserTEC (previously referred to as the Sustainable Energy Solutions joint venture). Unallocated Corporate: reflects a pre-tax gain of $4.0 million during the first quarter of fiscal 2027 related to an earnout arrangement associated with the sale of our former oil and gas products business, which was divested in January 2021. (3) For Building Performance Solutions and Trade & Specialty Solutions, adjusted EBITDA is the measure of segment profit reported to the chief operating decision maker under ASC 280. The totals for consolidated adjusted EBITDA are non-GAAP financial measures; see the reconciliation from net earnings in this Appendix. Reconciliation of Segment Adjusted EBITDA to Wholly-Owned Adjusted EBITDA FY27 Q1 TTM
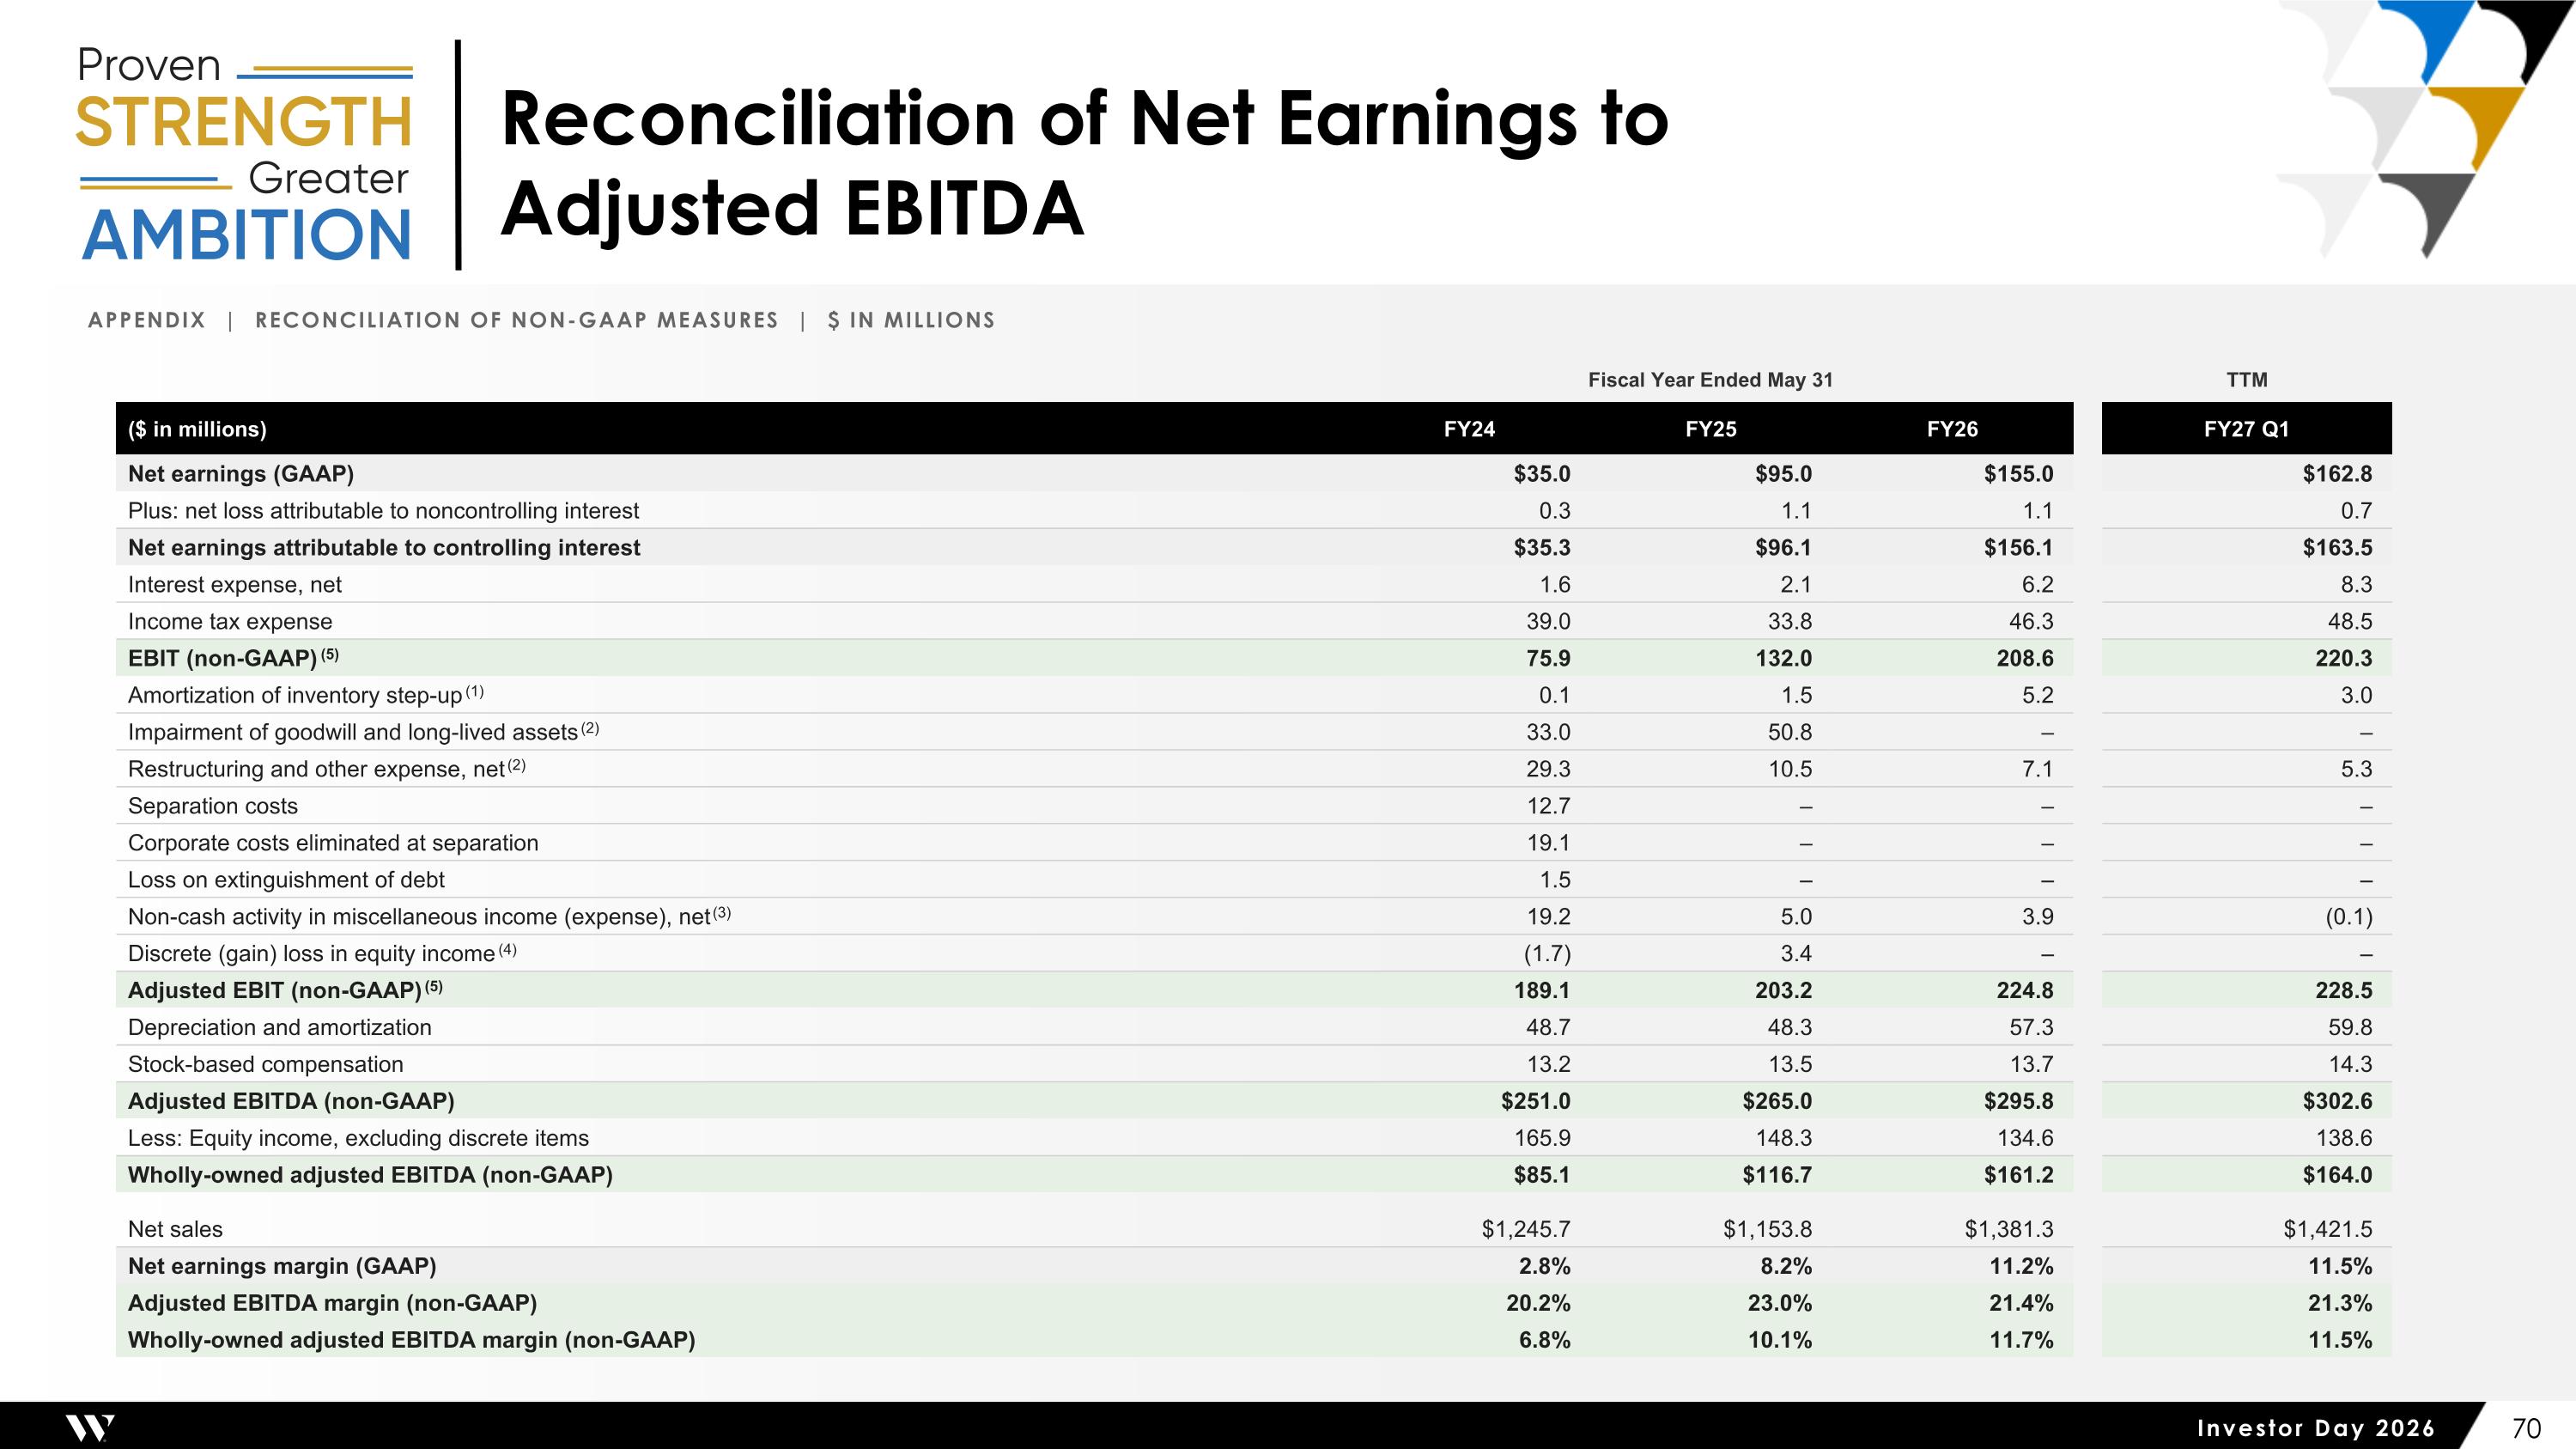
Reconciliation of Net Earnings to Adjusted EBITDA Appendix | Reconciliation of Non-GAAP Measures | $ in millions Fiscal Year Ended May 31 TTM ($ in millions) FY24 FY25 FY26 FY27 Q1 Net earnings (GAAP) $35.0 $95.0 $155.0 $162.8 Plus: net loss attributable to noncontrolling interest 0.3 1.1 1.1 0.7 Net earnings attributable to controlling interest $35.3 $96.1 $156.1 $163.5 Interest expense, net 1.6 2.1 6.2 8.3 Income tax expense 39.0 33.8 46.3 48.5 EBIT (non-GAAP) (5) 75.9 132.0 208.6 220.3 Amortization of inventory step-up (1) 0.1 1.5 5.2 3.0 Impairment of goodwill and long-lived assets (2) 33.0 50.8 – – Restructuring and other expense, net (2) 29.3 10.5 7.1 5.3 Separation costs 12.7 – – – Corporate costs eliminated at separation 19.1 – – – Loss on extinguishment of debt 1.5 – – – Non-cash activity in miscellaneous income (expense), net (3) 19.2 5.0 3.9 (0.1) Discrete (gain) loss in equity income (4) (1.7) 3.4 – – Adjusted EBIT (non-GAAP) (5) 189.1 203.2 224.8 228.5 Depreciation and amortization 48.7 48.3 57.3 59.8 Stock-based compensation 13.2 13.5 13.7 14.3 Adjusted EBITDA (non-GAAP) $251.0 $265.0 $295.8 $302.6 Less: Equity income, excluding discrete items 165.9 148.3 134.6 138.6 Wholly-owned adjusted EBITDA (non-GAAP) $85.1 $116.7 $161.2 $164.0 Net sales $1,245.7 $1,153.8 $1,381.3 $1,421.5 Net earnings margin (GAAP) 2.8% 8.2% 11.2% 11.5% Adjusted EBITDA margin (non-GAAP) 20.2% 23.0% 21.4% 21.3% Wholly-owned adjusted EBITDA margin (non-GAAP) 6.8% 10.1% 11.7% 11.5%
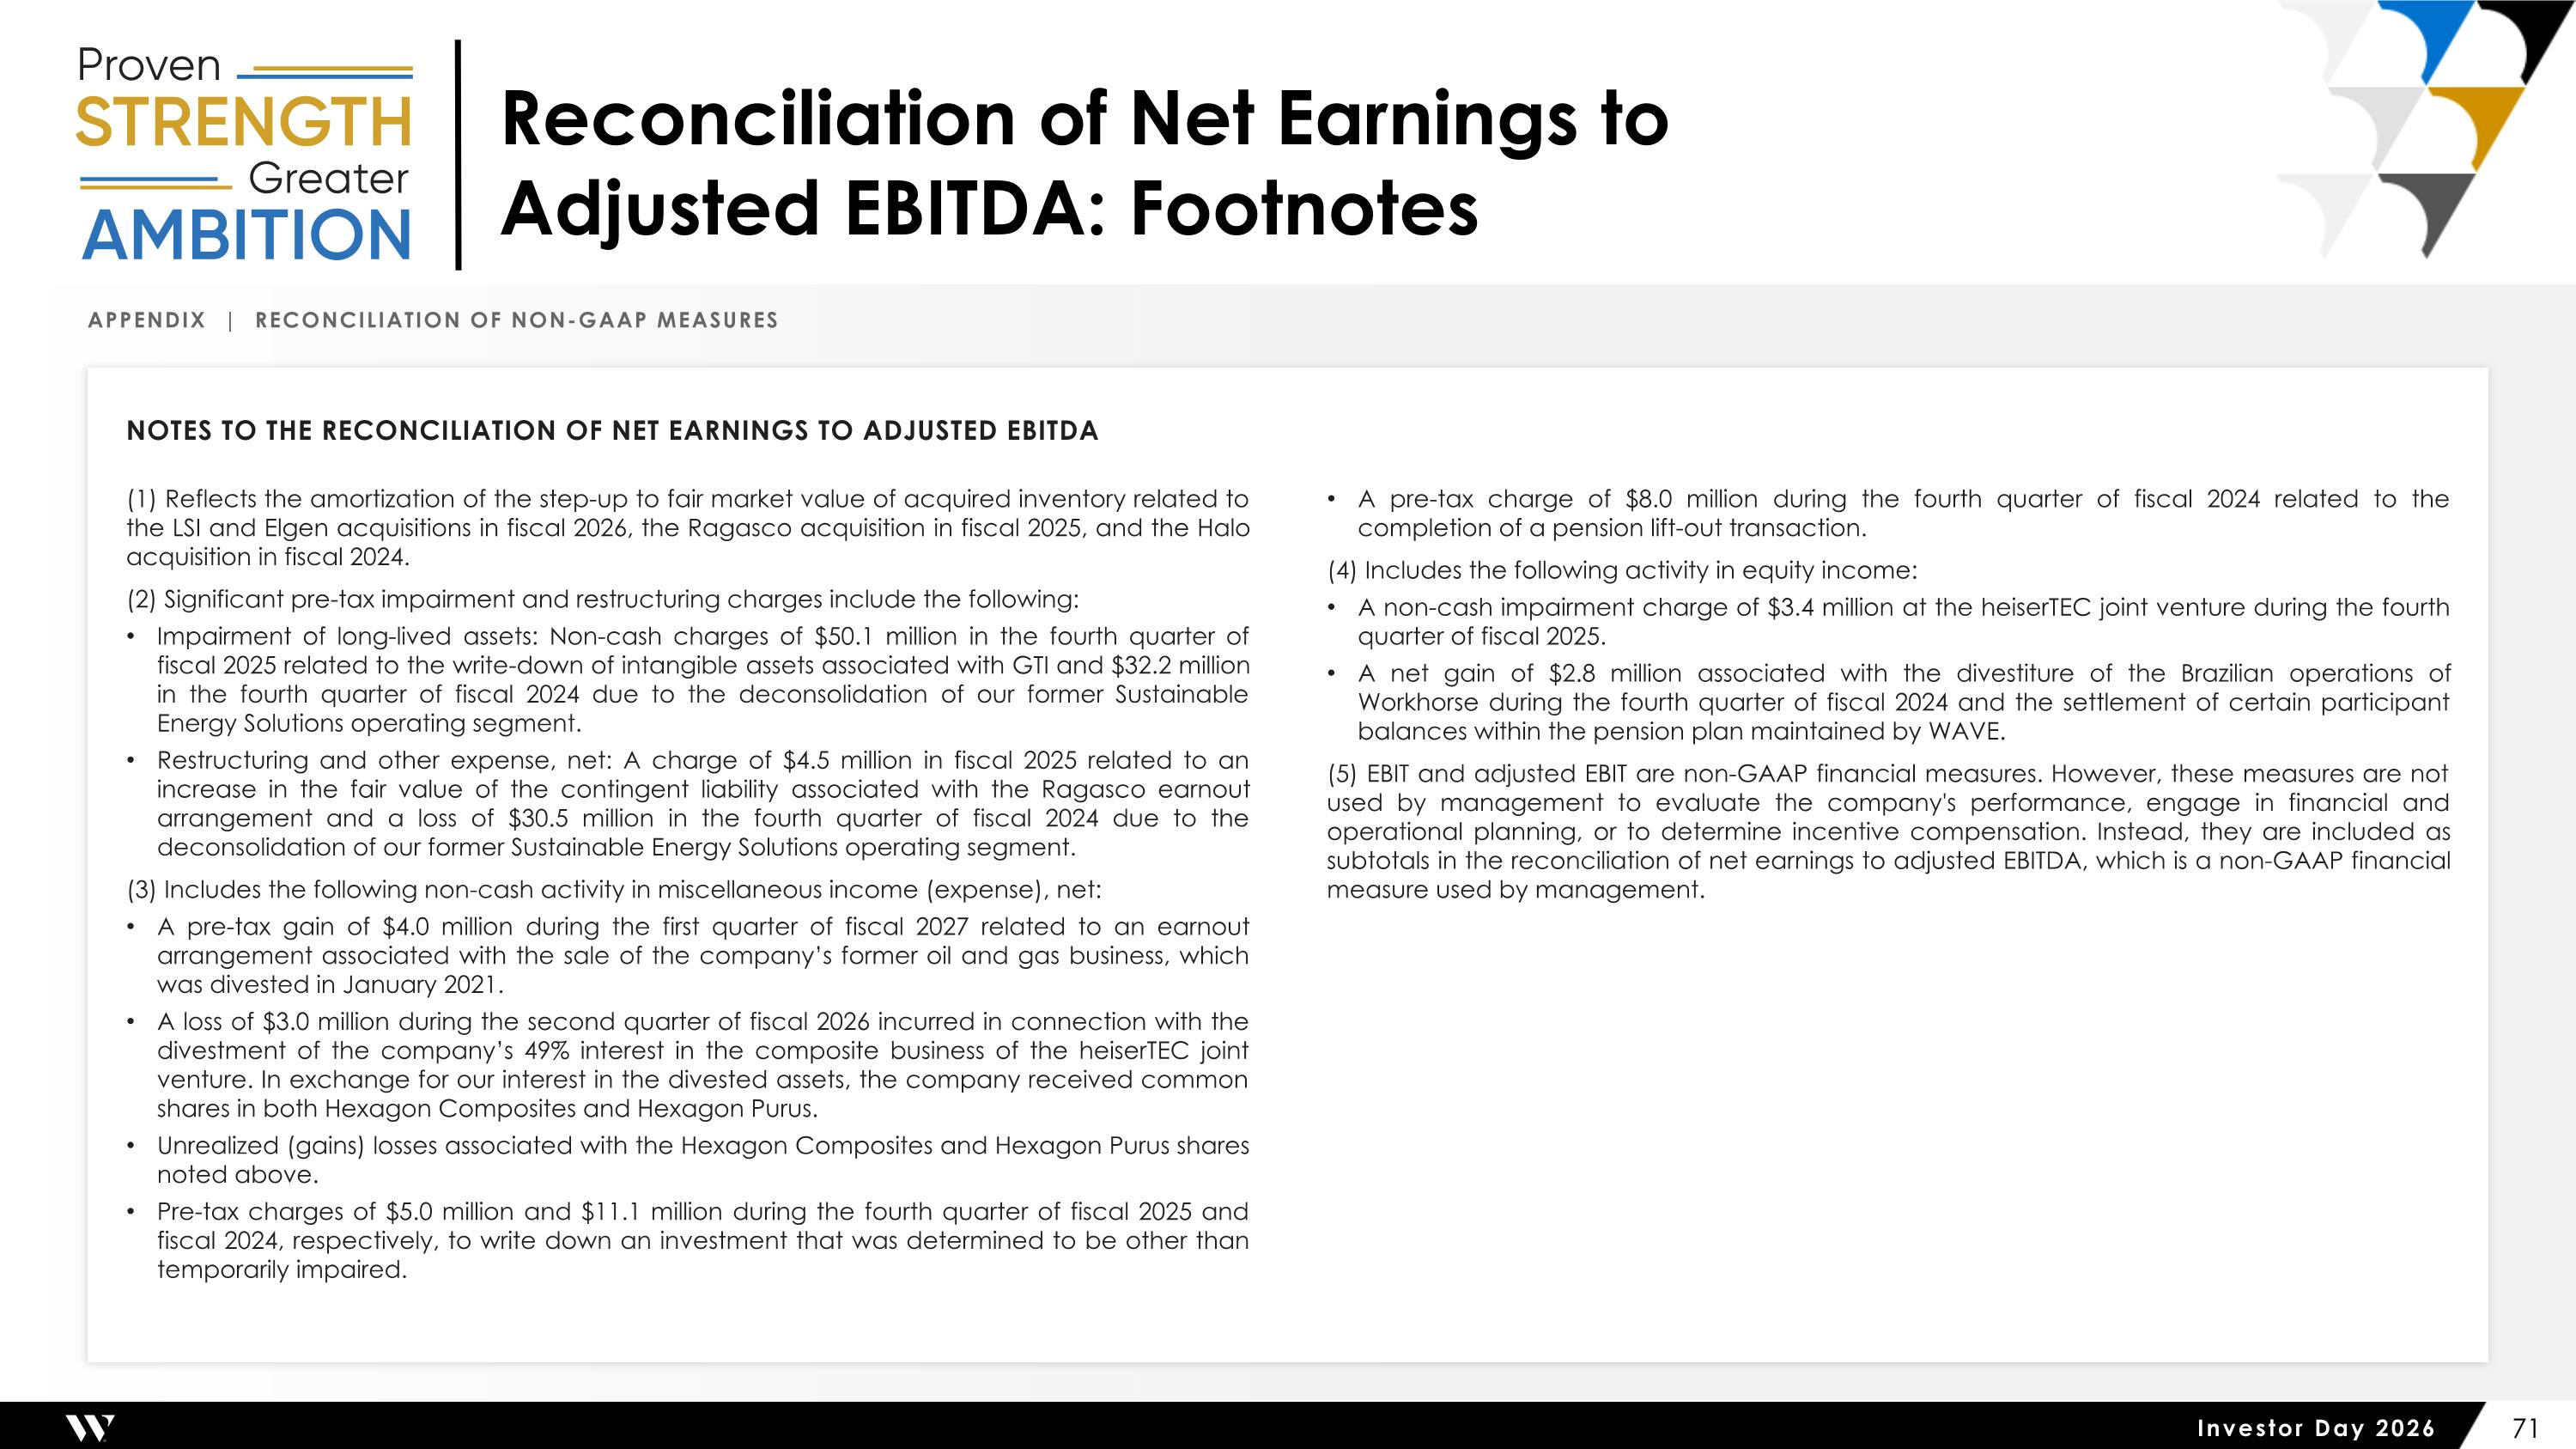
Reconciliation of Net Earnings to Adjusted EBITDA: Footnotes Appendix | Reconciliation of Non-GAAP Measures Notes to the reconciliation of net earnings to adjusted EBITDA (1) Reflects the amortization of the step-up to fair market value of acquired inventory related to the LSI and Elgen acquisitions in fiscal 2026, the Ragasco acquisition in fiscal 2025, and the Halo acquisition in fiscal 2024. (2) Significant pre-tax impairment and restructuring charges include the following: Impairment of long-lived assets: Non-cash charges of $50.1 million in the fourth quarter of fiscal 2025 related to the write-down of intangible assets associated with GTI and $32.2 million in the fourth quarter of fiscal 2024 due to the deconsolidation of our former Sustainable Energy Solutions operating segment. Restructuring and other expense, net: A charge of $4.5 million in fiscal 2025 related to an increase in the fair value of the contingent liability associated with the Ragasco earnout arrangement and a loss of $30.5 million in the fourth quarter of fiscal 2024 due to the deconsolidation of our former Sustainable Energy Solutions operating segment. (3) Includes the following non-cash activity in miscellaneous income (expense), net: A pre-tax gain of $4.0 million during the first quarter of fiscal 2027 related to an earnout arrangement associated with the sale of the company’s former oil and gas business, which was divested in January 2021. A loss of $3.0 million during the second quarter of fiscal 2026 incurred in connection with the divestment of the company’s 49% interest in the composite business of the heiserTEC joint venture. In exchange for our interest in the divested assets, the company received common shares in both Hexagon Composites and Hexagon Purus. Unrealized (gains) losses associated with the Hexagon Composites and Hexagon Purus shares noted above. Pre-tax charges of $5.0 million and $11.1 million during the fourth quarter of fiscal 2025 and fiscal 2024, respectively, to write down an investment that was determined to be other than temporarily impaired. A pre-tax charge of $8.0 million during the fourth quarter of fiscal 2024 related to the completion of a pension lift-out transaction. (4) Includes the following activity in equity income: A non-cash impairment charge of $3.4 million at the heiserTEC joint venture during the fourth quarter of fiscal 2025. A net gain of $2.8 million associated with the divestiture of the Brazilian operations of Workhorse during the fourth quarter of fiscal 2024 and the settlement of certain participant balances within the pension plan maintained by WAVE. (5) EBIT and adjusted EBIT are non-GAAP financial measures. However, these measures are not used by management to evaluate the company's performance, engage in financial and operational planning, or to determine incentive compensation. Instead, they are included as subtotals in the reconciliation of net earnings to adjusted EBITDA, which is a non-GAAP financial measure used by management.
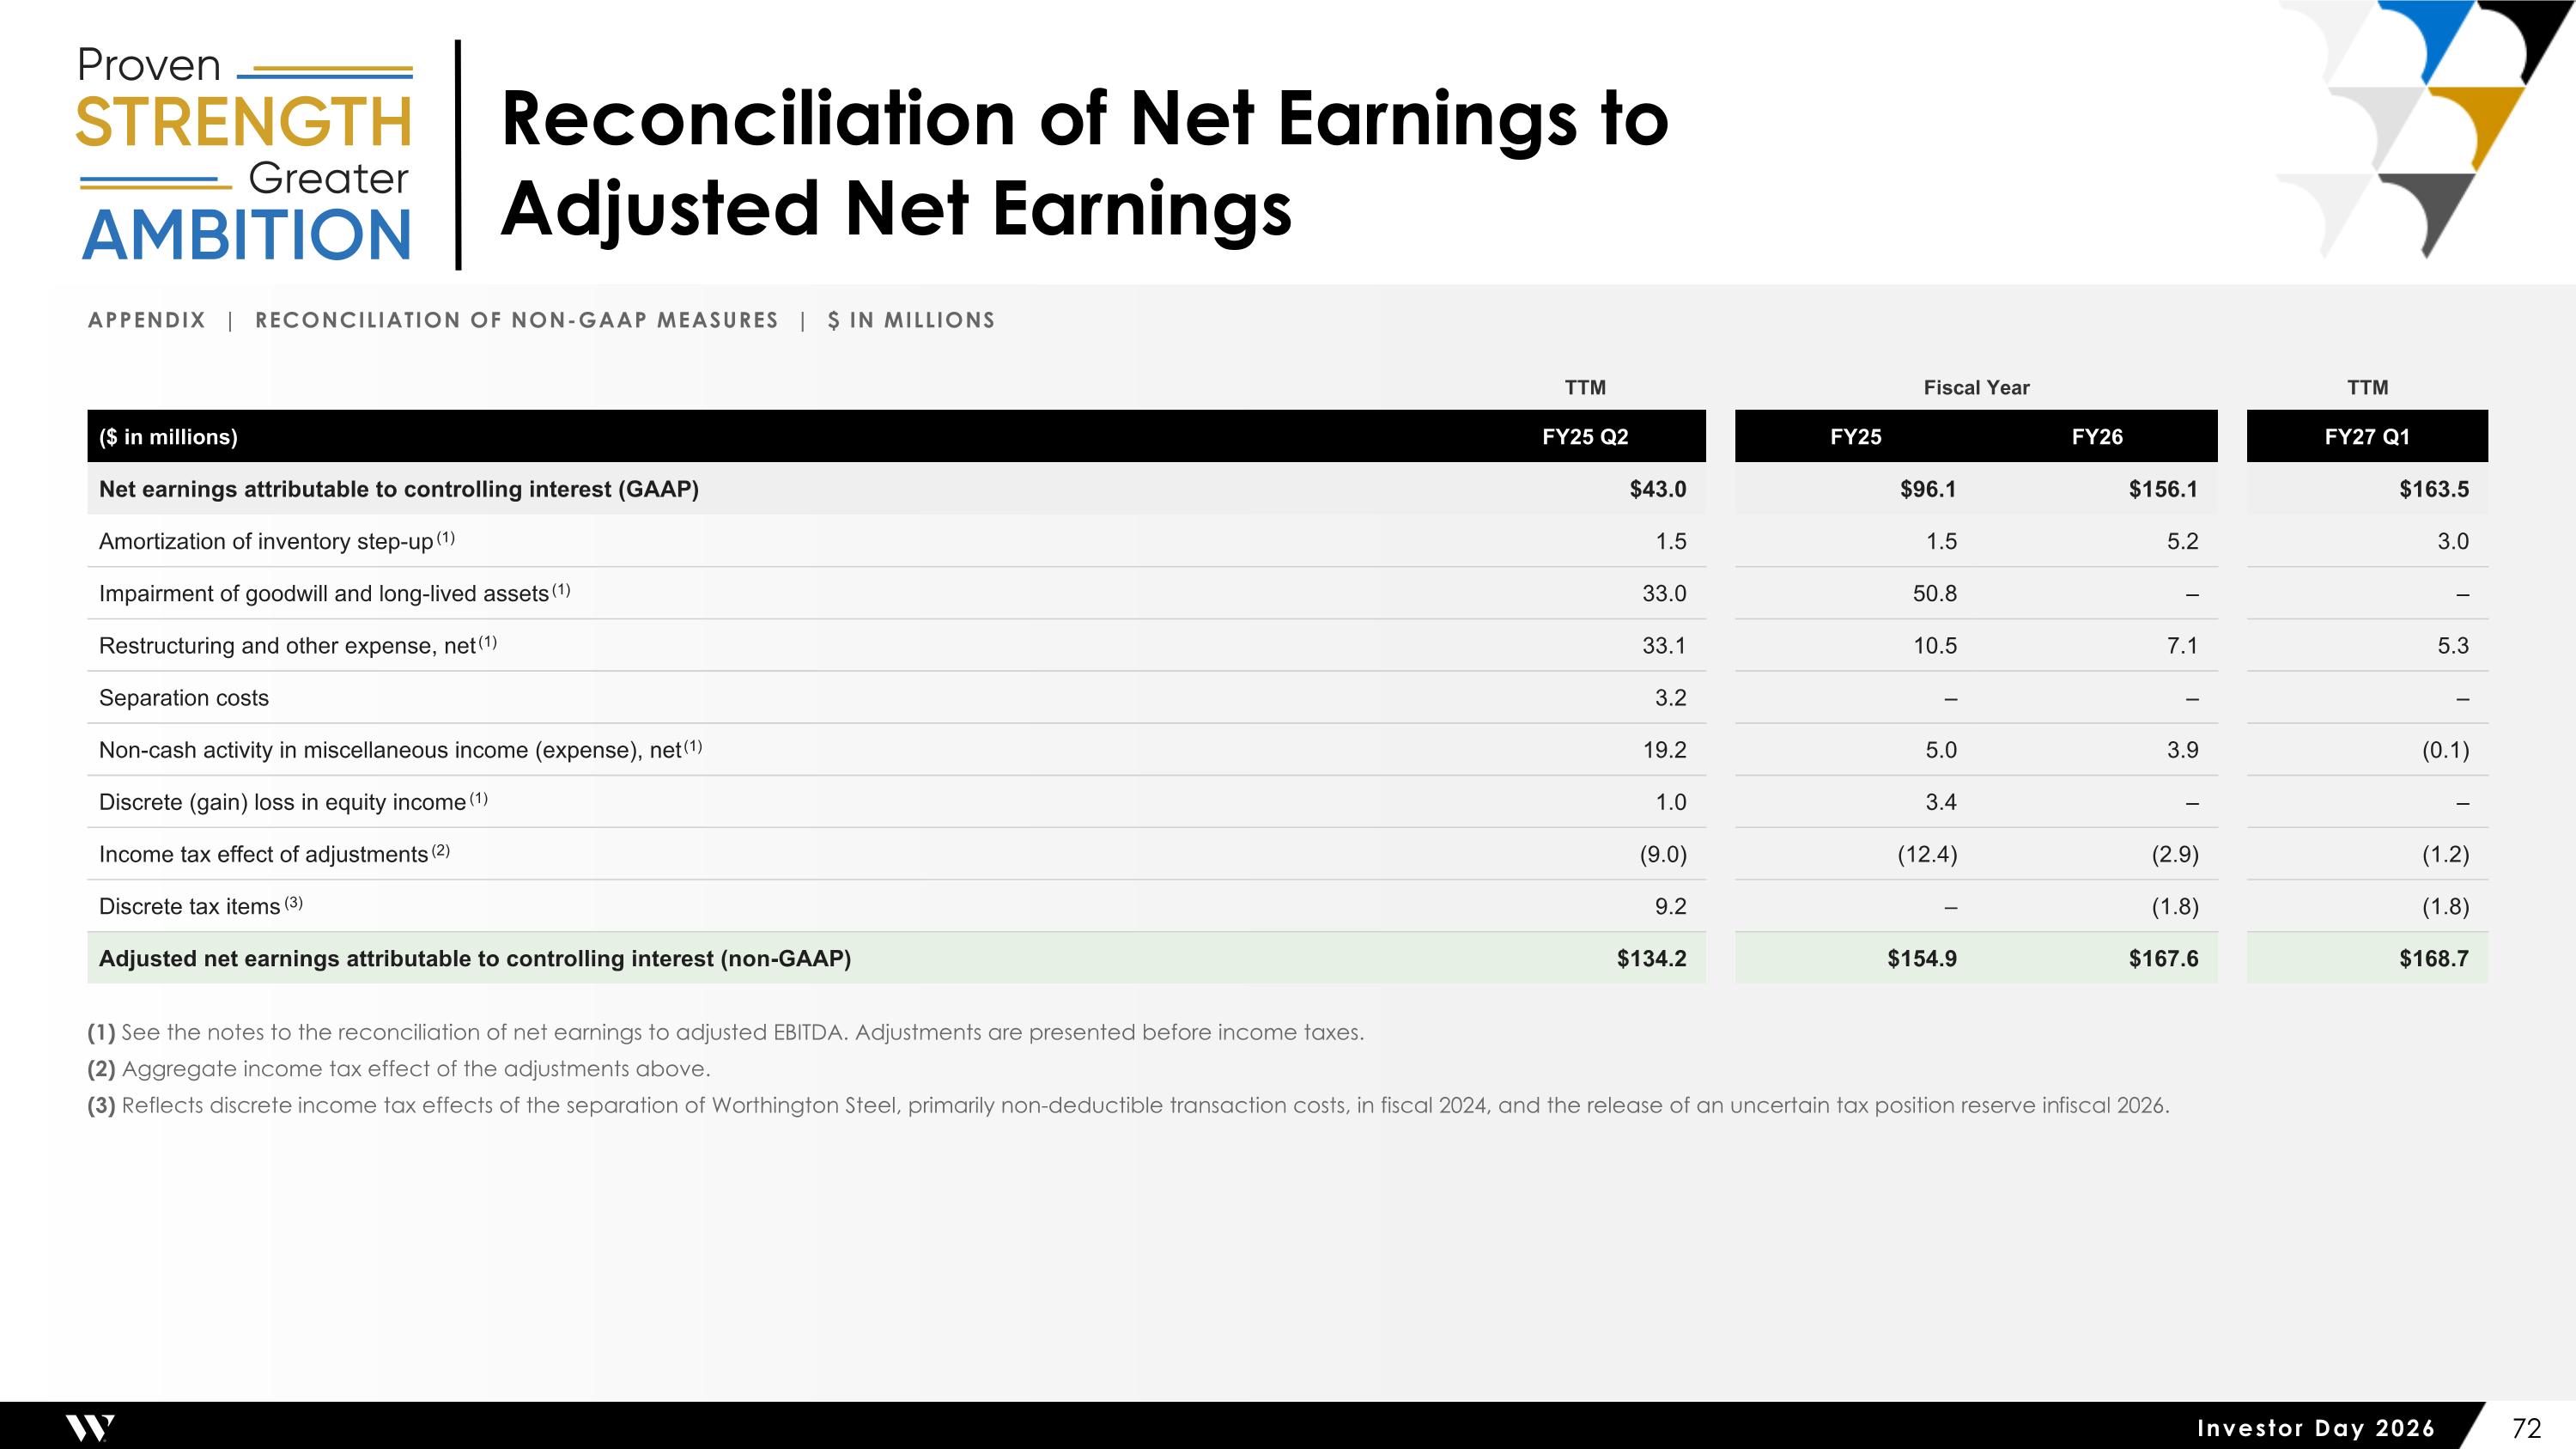
Reconciliation of Net Earnings to Adjusted Net Earnings Appendix | Reconciliation of Non-GAAP Measures | $ in millions TTM Fiscal Year TTM ($ in millions) FY25 Q2 FY25 FY26 FY27 Q1 Net earnings attributable to controlling interest (GAAP) $43.0 $96.1 $156.1 $163.5 Amortization of inventory step-up (1) 1.5 1.5 5.2 3.0 Impairment of goodwill and long-lived assets (1) 33.0 50.8 – – Restructuring and other expense, net (1) 33.1 10.5 7.1 5.3 Separation costs 3.2 – – – Non-cash activity in miscellaneous income (expense), net (1) 19.2 5.0 3.9 (0.1) Discrete (gain) loss in equity income (1) 1.0 3.4 – – Income tax effect of adjustments (2) (9.0) (12.4) (2.9) (1.2) Discrete tax items (3) 9.2 – (1.8) (1.8) Adjusted net earnings attributable to controlling interest (non-GAAP) $134.2 $154.9 $167.6 $168.7 (1) See the notes to the reconciliation of net earnings to adjusted EBITDA. Adjustments are presented before income taxes. (2) Aggregate income tax effect of the adjustments above. (3) Reflects discrete income tax effects of the separation of Worthington Steel, primarily non-deductible transaction costs, in fiscal 2024, and the release of an uncertain tax position reserve in fiscal 2026.
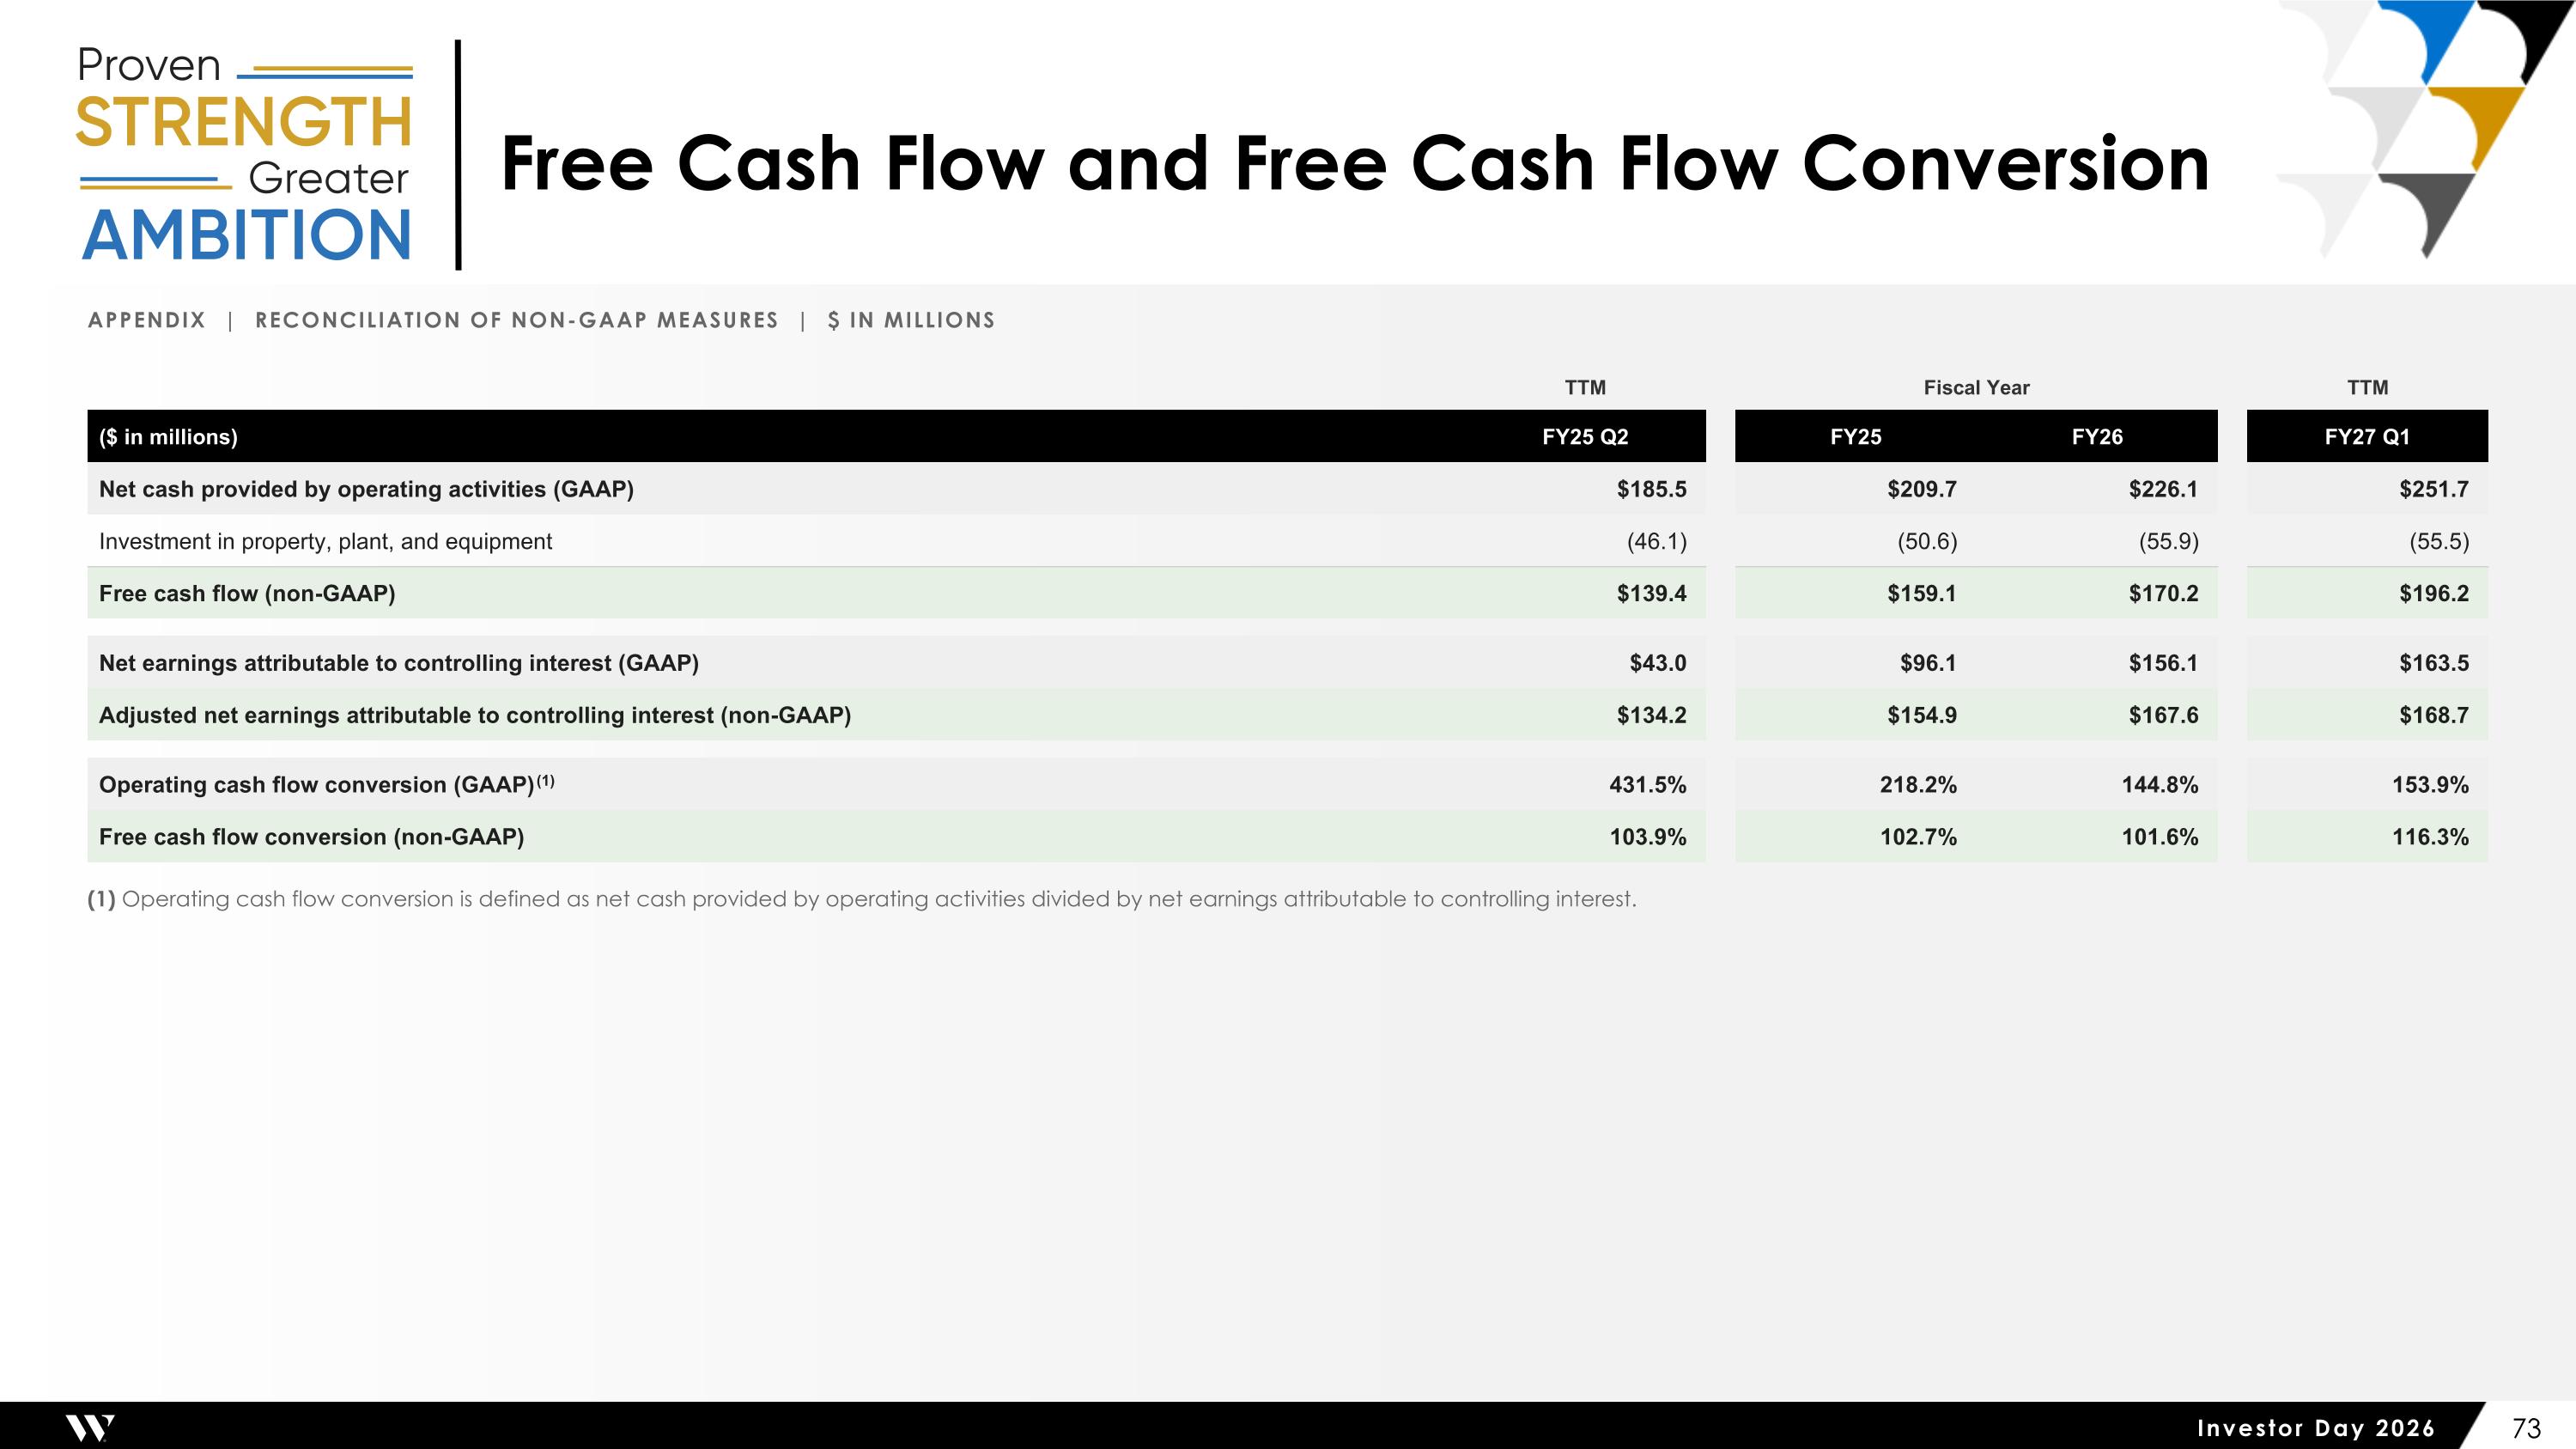
Free Cash Flow and Free Cash Flow Conversion Appendix | Reconciliation of Non-GAAP Measures | $ in millions TTM Fiscal Year TTM ($ in millions) FY25 Q2 FY25 FY26 FY27 Q1 Net cash provided by operating activities (GAAP) $185.5 $209.7 $226.1 $251.7 Investment in property, plant, and equipment (46.1) (50.6) (55.9) (55.5) Free cash flow (non-GAAP) $139.4 $159.1 $170.2 $196.2 Net earnings attributable to controlling interest (GAAP) $43.0 $96.1 $156.1 $163.5 Adjusted net earnings attributable to controlling interest (non-GAAP) $134.2 $154.9 $167.6 $168.7 Operating cash flow conversion (GAAP) (1) 431.5% 218.2% 144.8% 153.9% Free cash flow conversion (non-GAAP) 103.9% 102.7% 101.6% 116.3% (1) Operating cash flow conversion is defined as net cash provided by operating activities divided by net earnings attributable to controlling interest.
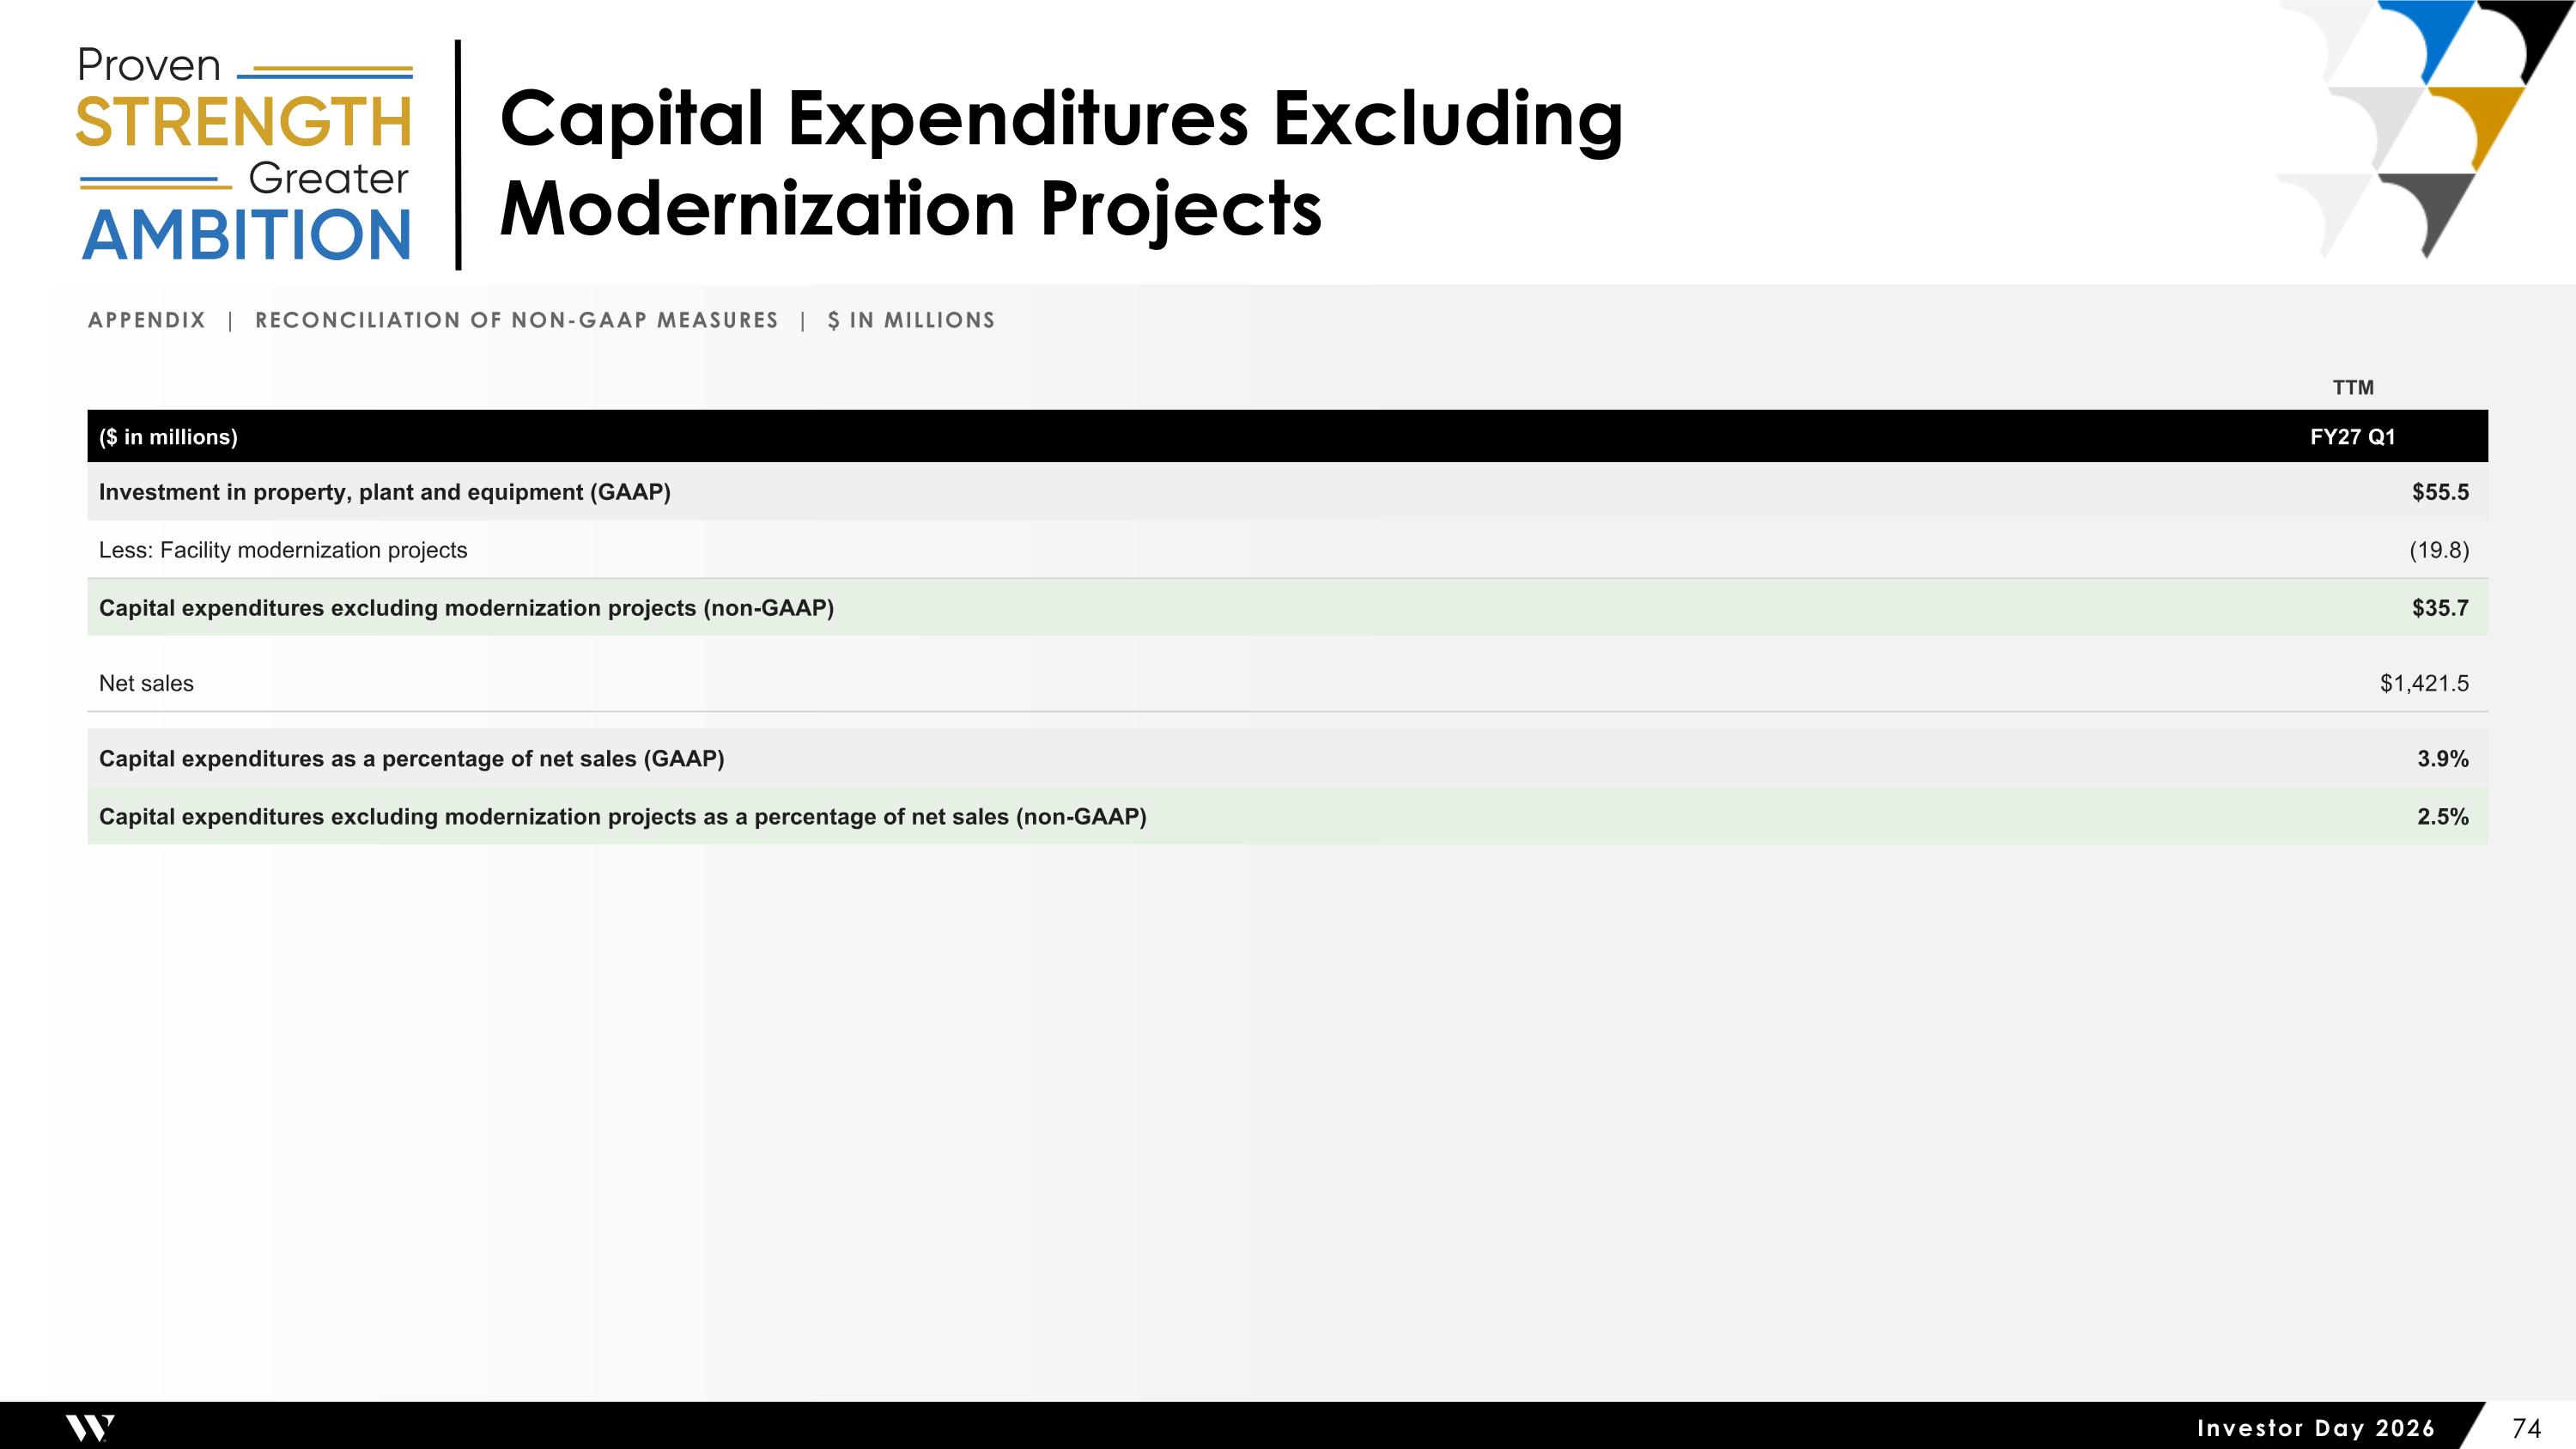
Capital Expenditures Excluding Modernization Projects Appendix | Reconciliation of Non-GAAP Measures | $ in millions TTM ($ in millions) FY27 Q1 Investment in property, plant and equipment (GAAP) $55.5 Less: Facility modernization projects (19.8) Capital expenditures excluding modernization projects (non-GAAP) $35.7 Net sales $1,421.5 Capital expenditures as a percentage of net sales (GAAP) 3.9% Capital expenditures excluding modernization projects as a percentage of net sales (non-GAAP) 2.5%
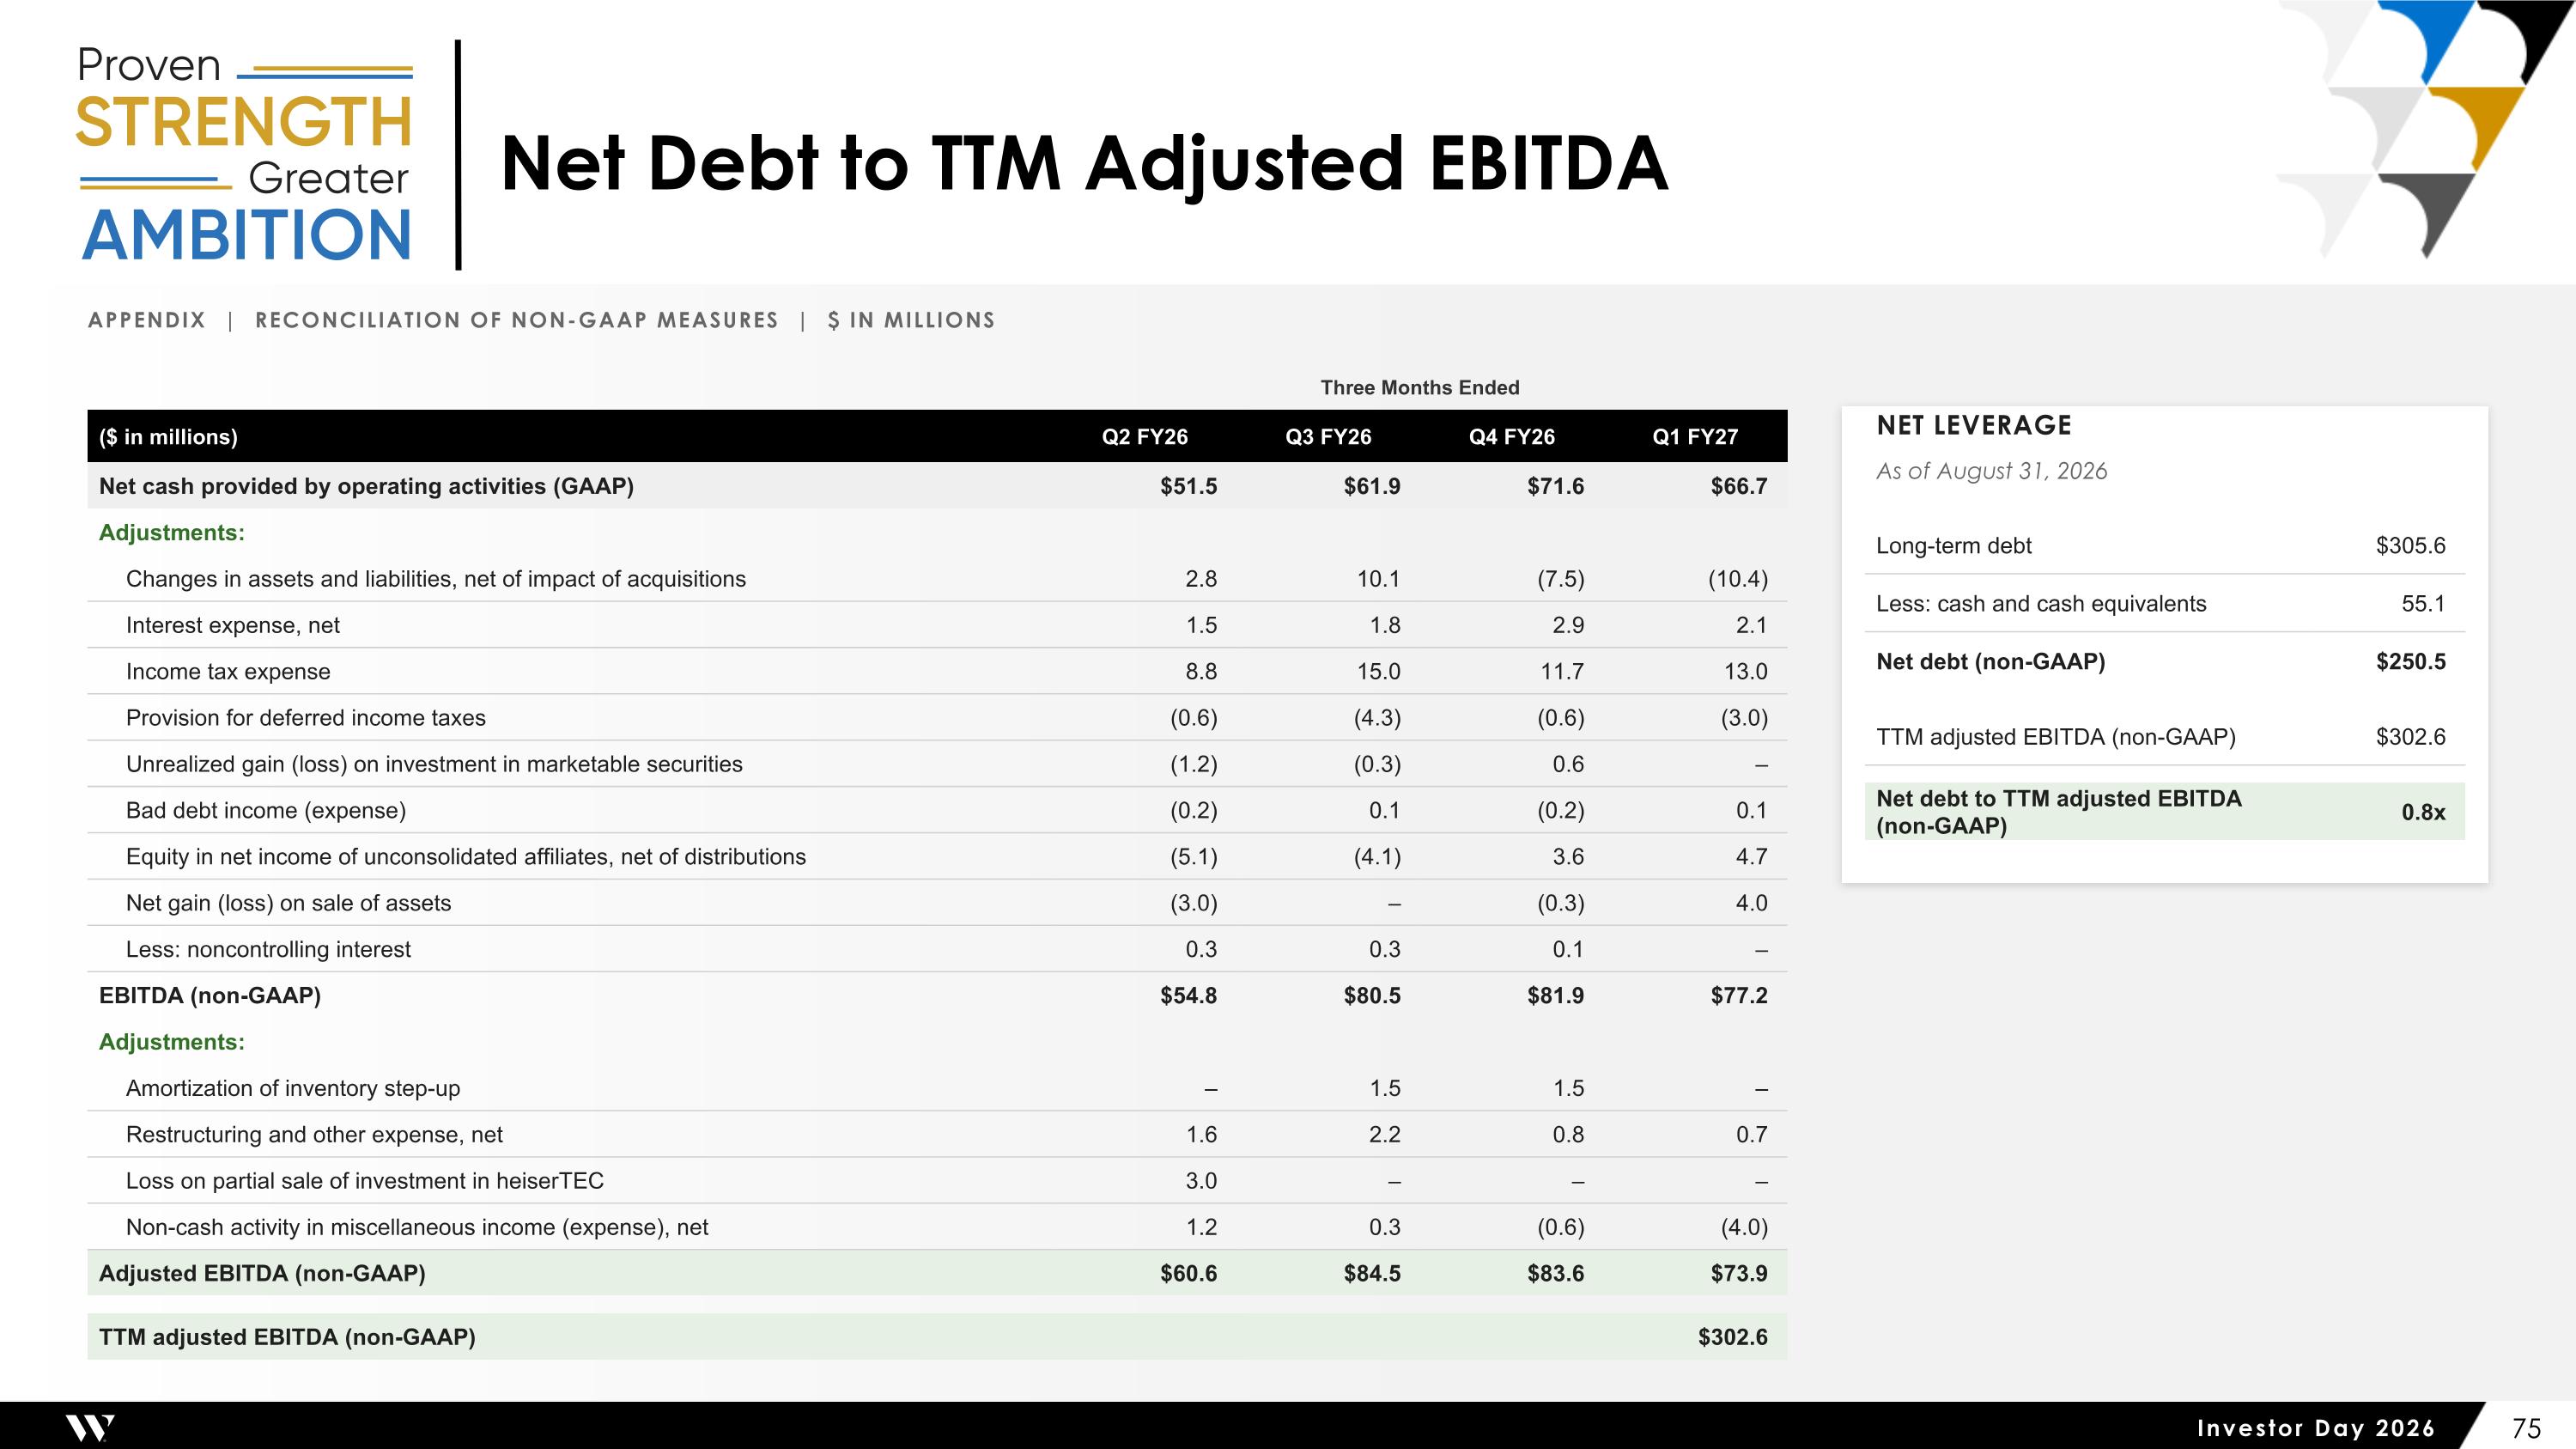
Net Debt to TTM Adjusted EBITDA Appendix | Reconciliation of Non-GAAP Measures | $ in millions Three Months Ended ($ in millions) Q2 FY26 Q3 FY26 Q4 FY26 Q1 FY27 Net cash provided by operating activities (GAAP) $51.5 $61.9 $71.6 $66.7 Adjustments: Changes in assets and liabilities, net of impact of acquisitions 2.8 10.1 (7.5) (10.4) Interest expense, net 1.5 1.8 2.9 2.1 Income tax expense 8.8 15.0 11.7 13.0 Provision for deferred income taxes (0.6) (4.3) (0.6) (3.0) Unrealized gain (loss) on investment in marketable securities (1.2) (0.3) 0.6 – Bad debt income (expense) (0.2) 0.1 (0.2) 0.1 Equity in net income of unconsolidated affiliates, net of distributions (5.1) (4.1) 3.6 4.7 Net gain (loss) on sale of assets (3.0) – (0.3) 4.0 Less: noncontrolling interest 0.3 0.3 0.1 – EBITDA (non-GAAP) $54.8 $80.5 $81.9 $77.2 Adjustments: Amortization of inventory step-up – 1.5 1.5 – Restructuring and other expense, net 1.6 2.2 0.8 0.7 Loss on partial sale of investment in heiserTEC 3.0 – – – Non-cash activity in miscellaneous income (expense), net 1.2 0.3 (0.6) (4.0) Adjusted EBITDA (non-GAAP) $60.6 $84.5 $83.6 $73.9 TTM adjusted EBITDA (non-GAAP) $302.6 Net leverage As of August 31, 2026 Long-term debt $305.6 Less: cash and cash equivalents 55.1 Net debt (non-GAAP) $250.5 TTM adjusted EBITDA (non-GAAP) $302.6 Net debt to TTM adjusted EBITDA (non-GAAP) 0.8x
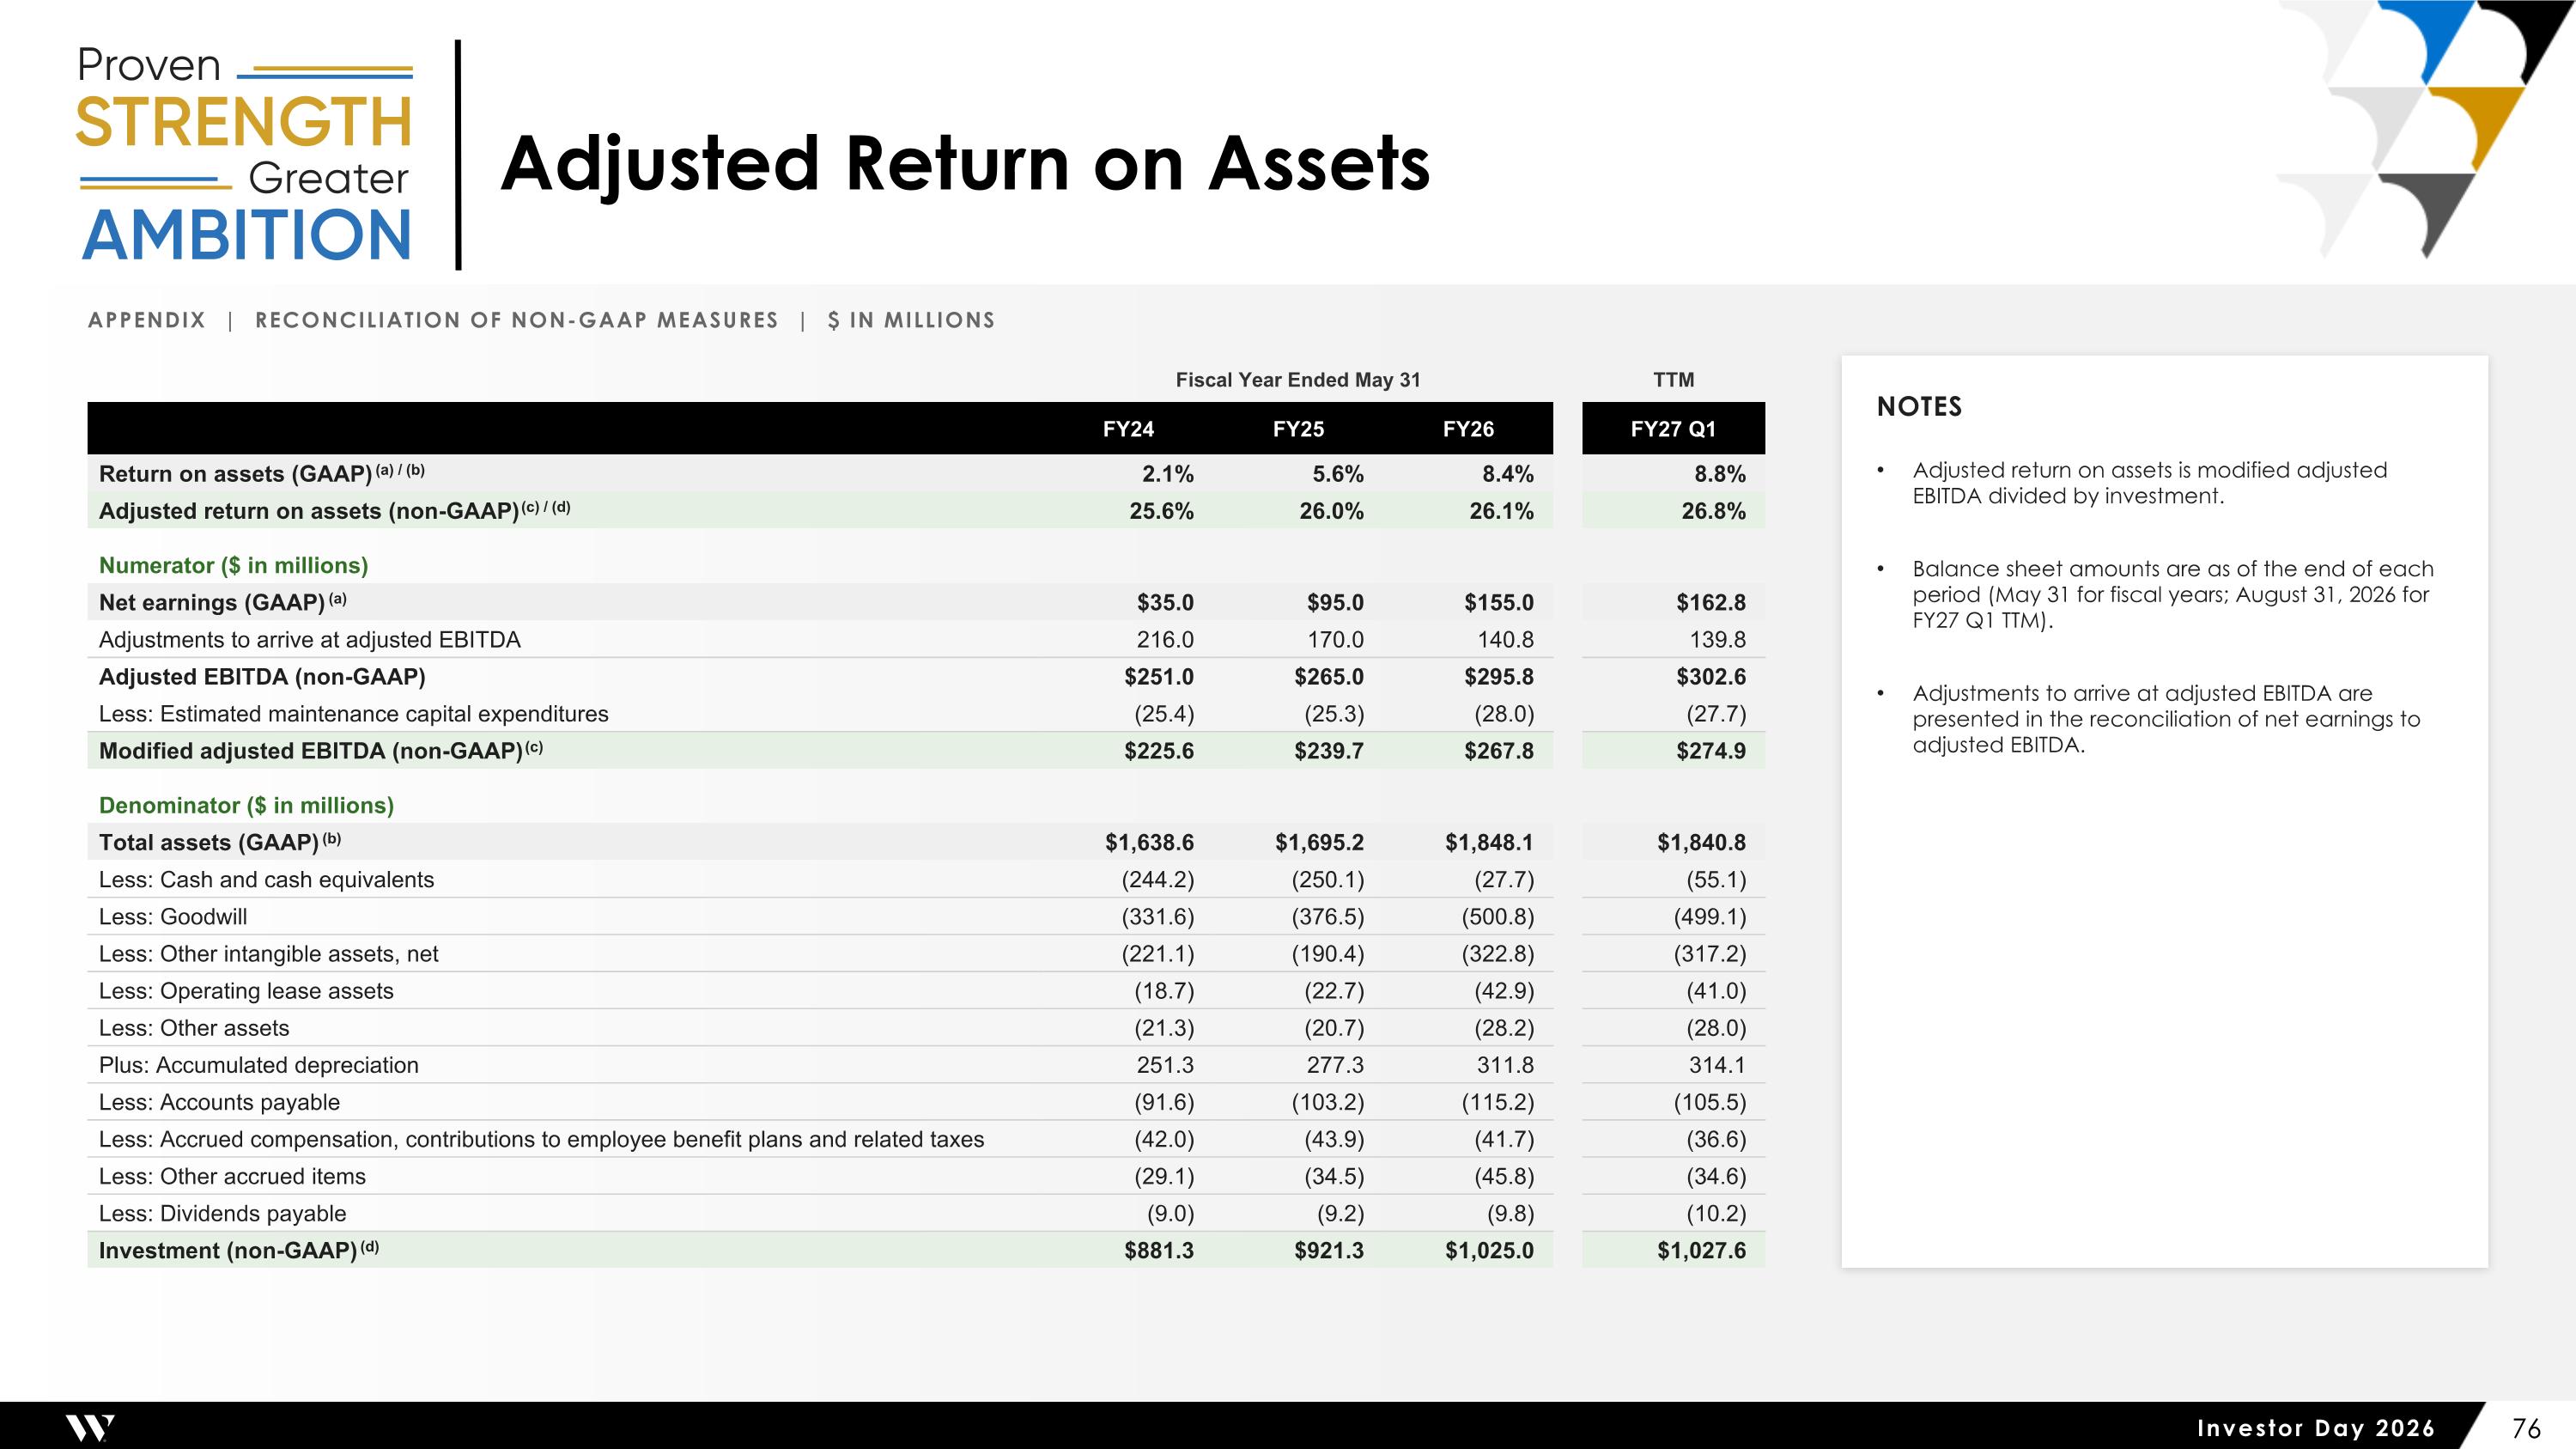
Adjusted Return on Assets Appendix | Reconciliation of Non-GAAP Measures | $ in millions Fiscal Year Ended May 31 TTM FY24 FY25 FY26 FY27 Q1 Return on assets (GAAP) (a) / (b) 2.1% 5.6% 8.4% 8.8% Adjusted return on assets (non-GAAP) (c) / (d) 25.6% 26.0% 26.1% 26.8% Numerator ($ in millions) Net earnings (GAAP) (a) $35.0 $95.0 $155.0 $162.8 Adjustments to arrive at adjusted EBITDA 216.0 170.0 140.8 139.8 Adjusted EBITDA (non-GAAP) $251.0 $265.0 $295.8 $302.6 Less: Estimated maintenance capital expenditures (25.4) (25.3) (28.0) (27.7) Modified adjusted EBITDA (non-GAAP) (c) $225.6 $239.7 $267.8 $274.9 Denominator ($ in millions) Total assets (GAAP) (b) $1,638.6 $1,695.2 $1,848.1 $1,840.8 Less: Cash and cash equivalents (244.2) (250.1) (27.7) (55.1) Less: Goodwill (331.6) (376.5) (500.8) (499.1) Less: Other intangible assets, net (221.1) (190.4) (322.8) (317.2) Less: Operating lease assets (18.7) (22.7) (42.9) (41.0) Less: Other assets (21.3) (20.7) (28.2) (28.0) Plus: Accumulated depreciation 251.3 277.3 311.8 314.1 Less: Accounts payable (91.6) (103.2) (115.2) (105.5) Less: Accrued compensation, contributions to employee benefit plans and related taxes (42.0) (43.9) (41.7) (36.6) Less: Other accrued items (29.1) (34.5) (45.8) (34.6) Less: Dividends payable (9.0) (9.2) (9.8) (10.2) Investment (non-GAAP) (d) $881.3 $921.3 $1,025.0 $1,027.6 Notes Adjusted return on assets is modified adjusted EBITDA divided by investment. Balance sheet amounts are as of the end of each period (May 31 for fiscal years; August 31, 2026 for FY27 Q1 TTM). Adjustments to arrive at adjusted EBITDA are presented in the reconciliation of net earnings to adjusted EBITDA.
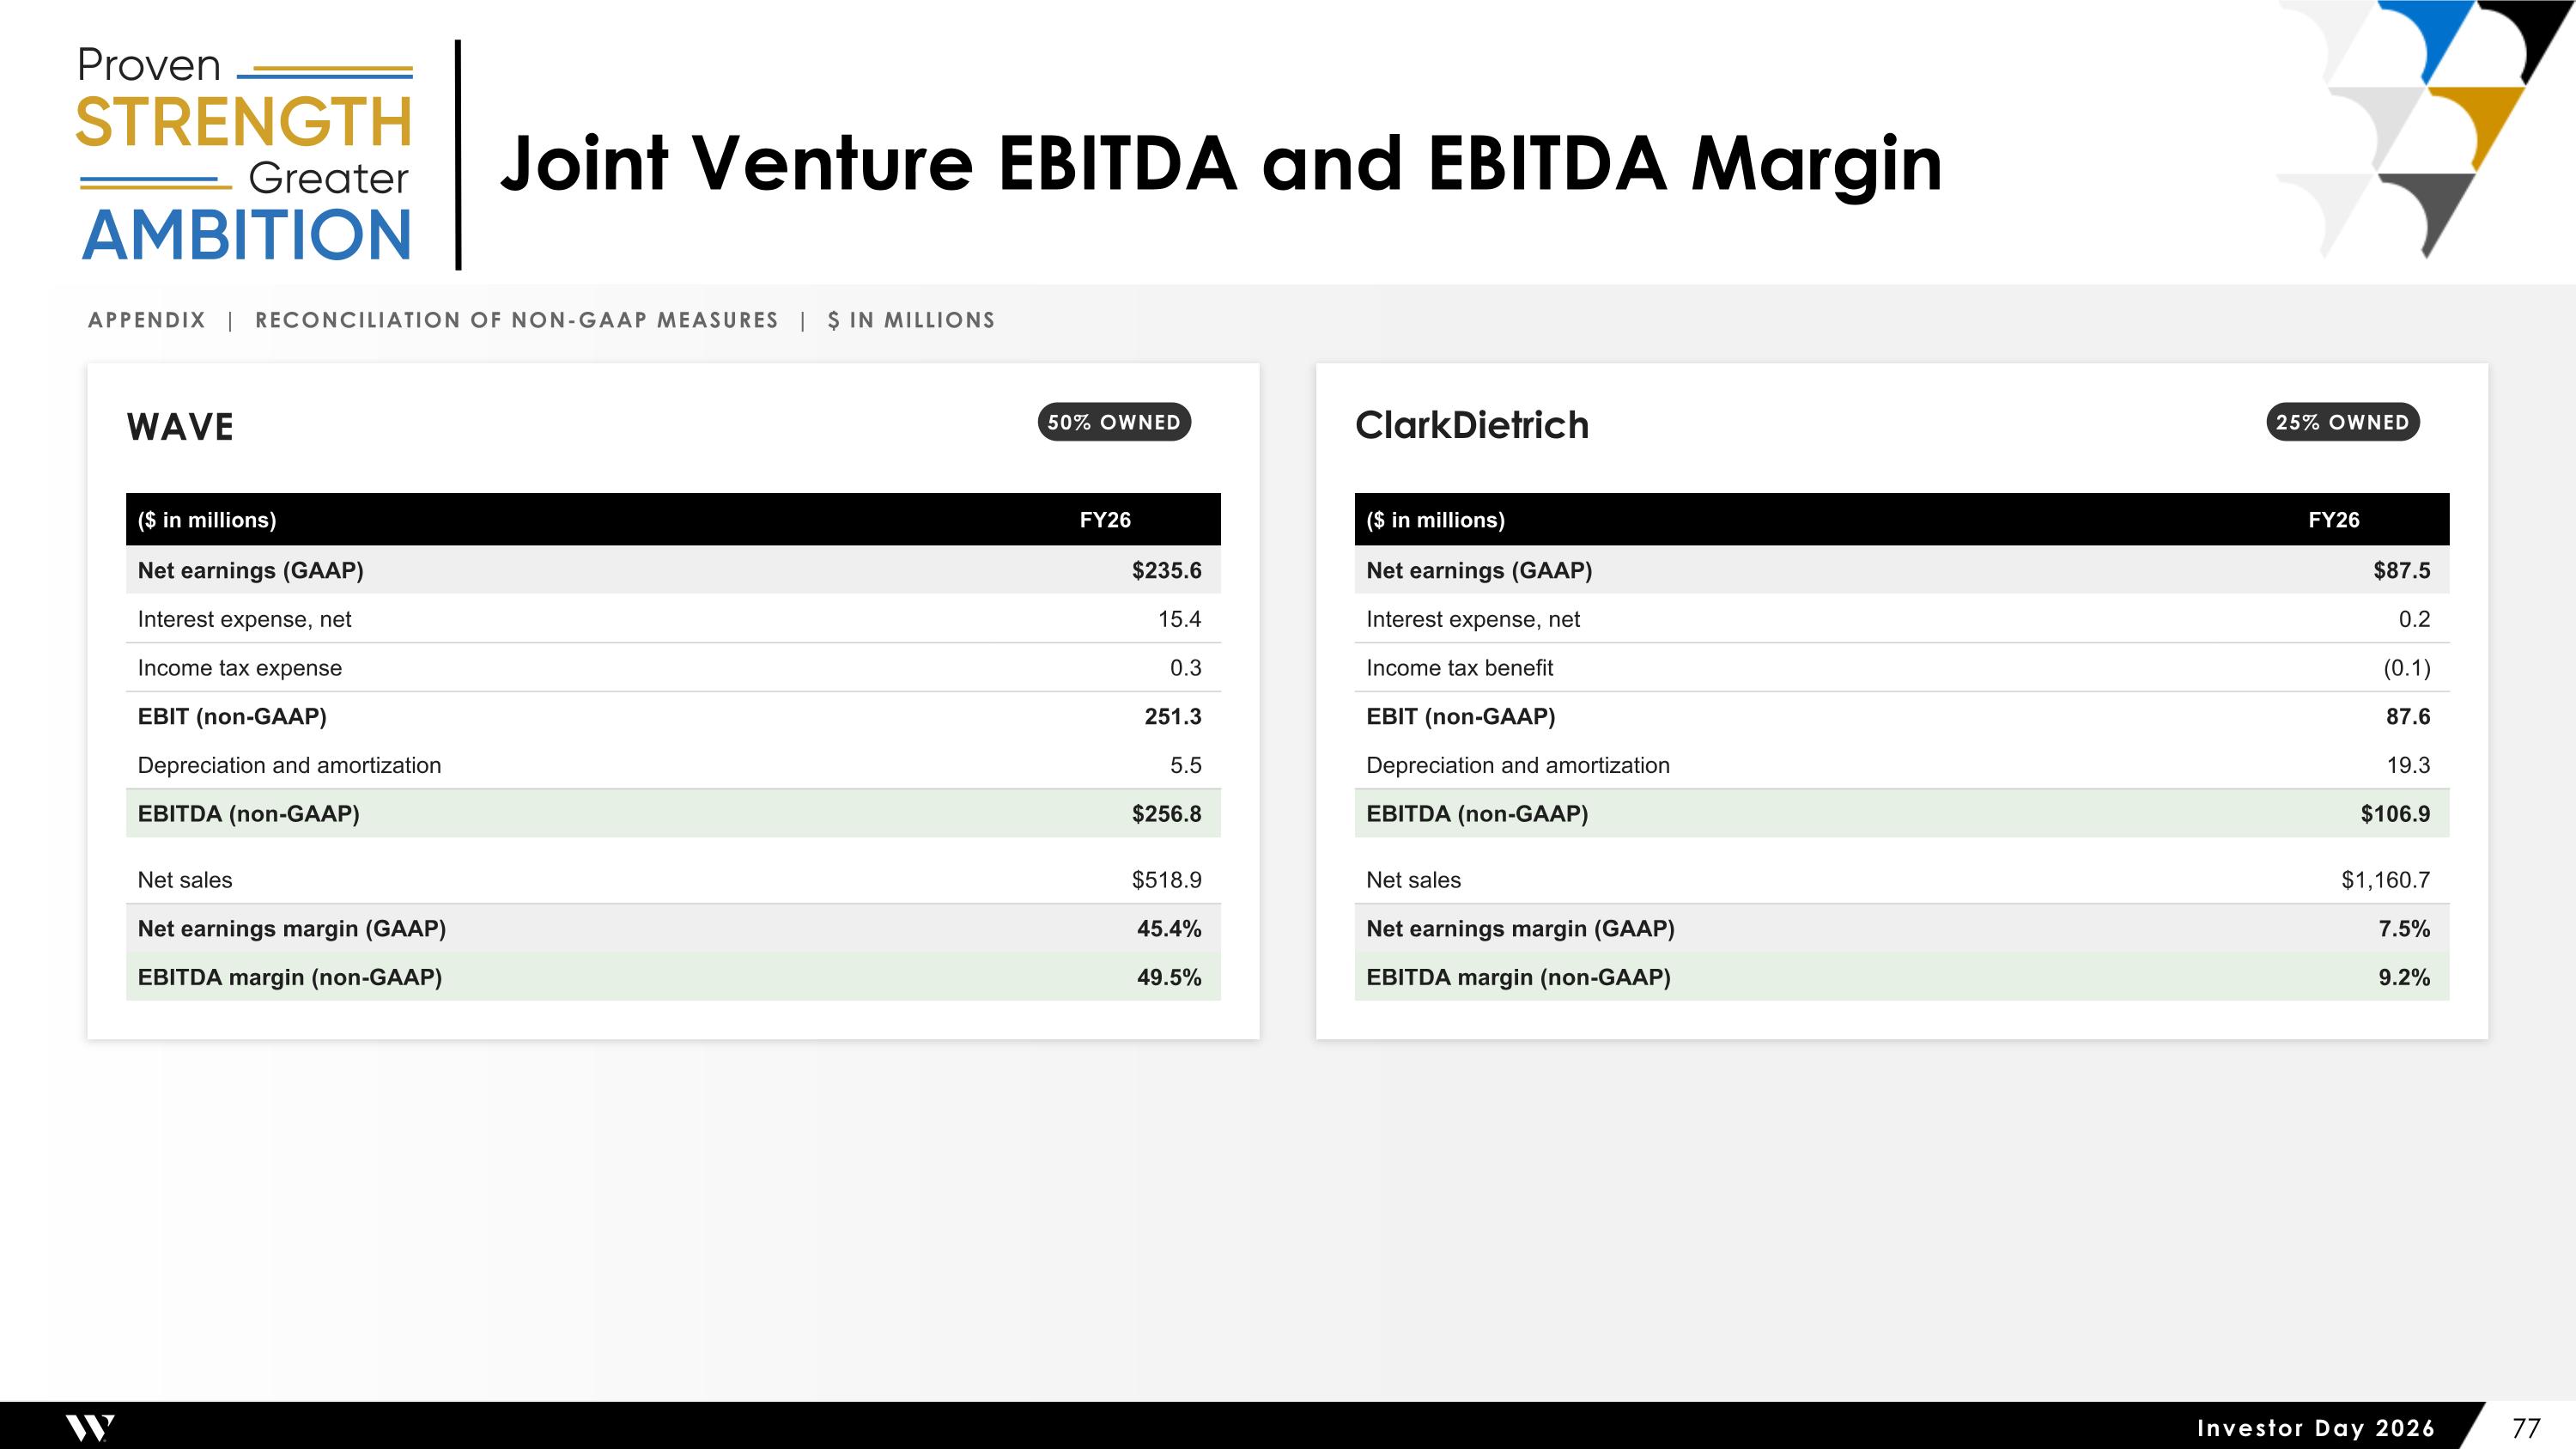
Joint Venture EBITDA and EBITDA Margin Appendix | Reconciliation of Non-GAAP Measures | $ in millions WAVE 50% OWNED ($ in millions) FY26 Net earnings (GAAP) $235.6 Interest expense, net 15.4 Income tax expense 0.3 EBIT (non-GAAP) 251.3 Depreciation and amortization 5.5 EBITDA (non-GAAP) $256.8 Net sales $518.9 Net earnings margin (GAAP) 45.4% EBITDA margin (non-GAAP) 49.5% ClarkDietrich 25% OWNED ($ in millions) FY26 Net earnings (GAAP) $87.5 Interest expense, net 0.2 Income tax benefit (0.1) EBIT (non-GAAP) 87.6 Depreciation and amortization 19.3 EBITDA (non-GAAP) $106.9 Net sales $1,160.7 Net earnings margin (GAAP) 7.5% EBITDA margin (non-GAAP) 9.2%
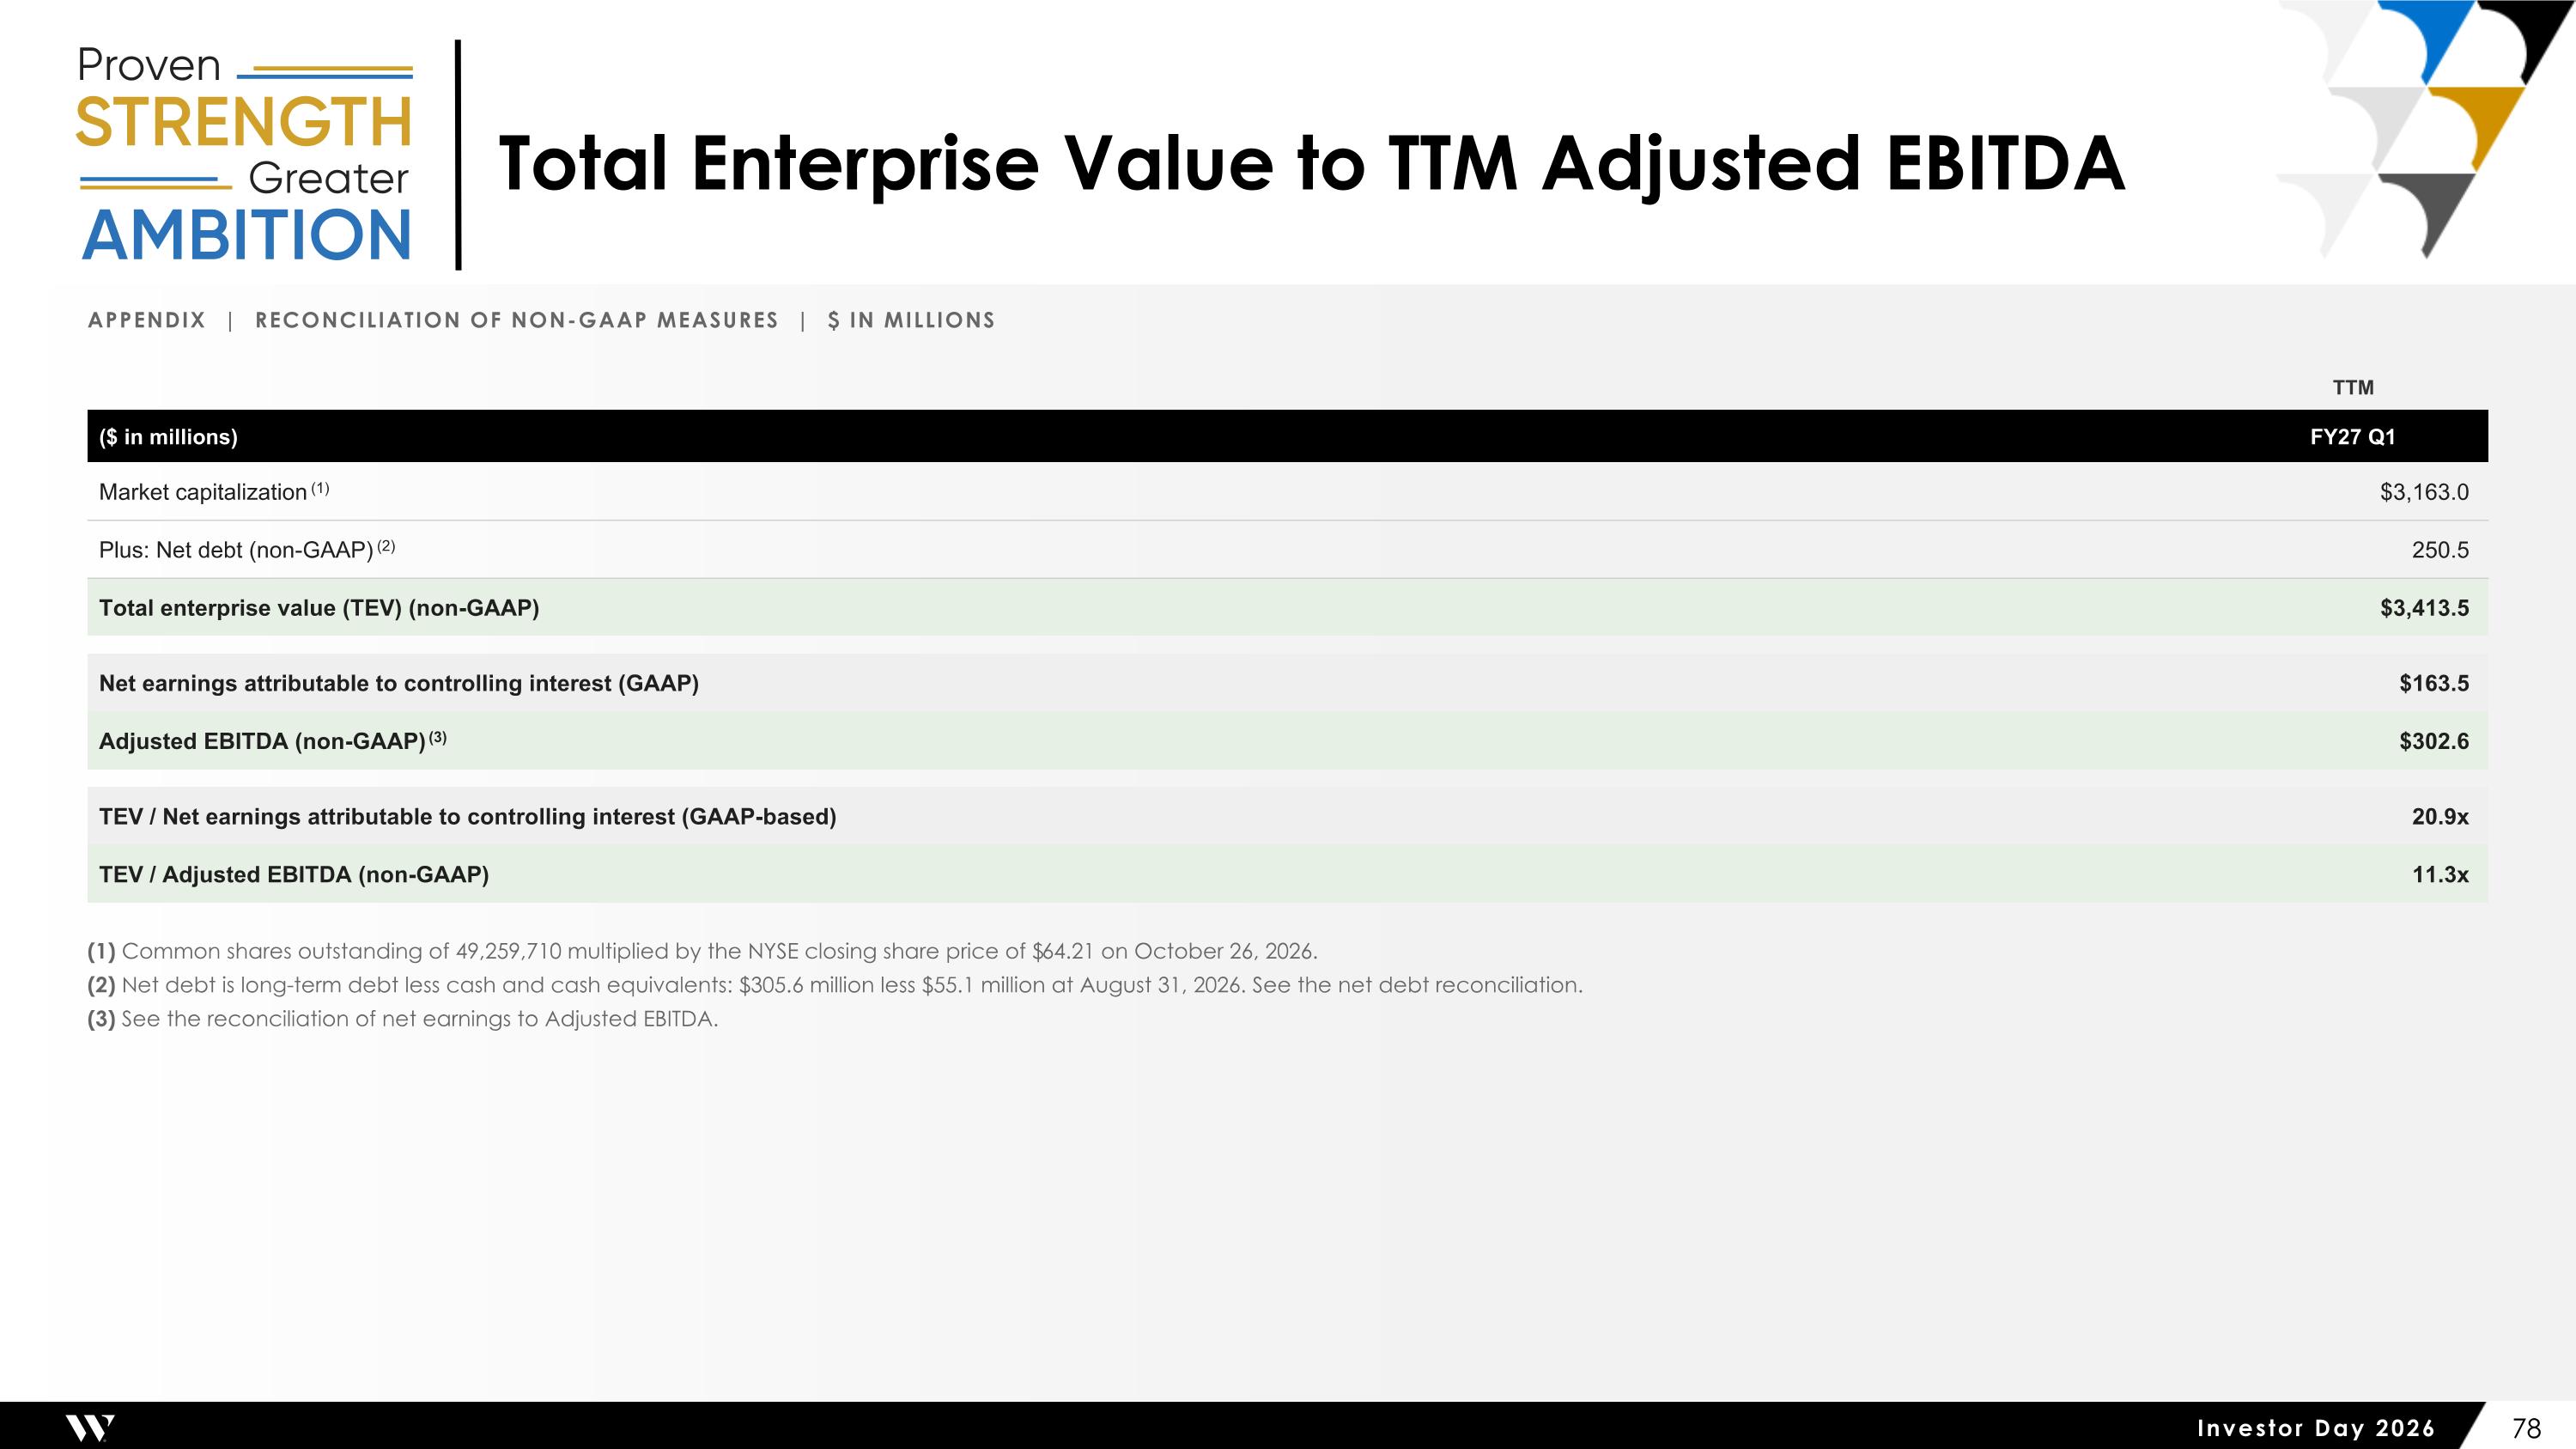
Total Enterprise Value to TTM Adjusted EBITDA Appendix | Reconciliation of Non-GAAP Measures | $ in millions TTM ($ in millions) FY27 Q1 Market capitalization (1) $3,163.0 Plus: Net debt (non-GAAP) (2) 250.5 Total enterprise value (TEV) (non-GAAP) $3,413.5 Net earnings attributable to controlling interest (GAAP) $163.5 Adjusted EBITDA (non-GAAP) (3) $302.6 TEV / Net earnings attributable to controlling interest (GAAP-based) 20.9x TEV / Adjusted EBITDA (non-GAAP) 11.3x (1) Common shares outstanding of 49,259,710 multiplied by the NYSE closing share price of $64.21 on October 26, 2026. (2) Net debt is long-term debt less cash and cash equivalents: $305.6 million less $55.1 million at August 31, 2026. See the net debt reconciliation. (3) See the reconciliation of net earnings to Adjusted EBITDA.