Exhibit 99.2

Vroom third quarter 2026 earnings november 2026
Exhibit 99.2
Vroom third quarter 2026 earnings november 2026
Disclaimer Forward Looking Statements This presentation contains forward-looking statements within the meaning of the Private Securities Litigation Reform Act of 1995. All statements contained in this presentation that do not relate to matters of historical fact should be considered forward-looking statements, including without limitation statements regarding our financial outlook for the full year 2026, including expected indirect origination volume and adjusted net income (loss) guidance, expected credit performance and realized and unrealized losses, lifetime loss expectations, expected benefits of our rebuilt internal customer scoring model, anticipated performance of recently underwritten loan vintages, the restructuring, including its impact and intended benefits, our strategic initiatives and long-term strategy, future expense management, planned technology investments, including in our technology platform and dealer portal, future results of operations and financial position, our total available liquidity, our liquidity position and the timing of any of the foregoing. These statements are based on management’s current assumptions and are neither promises nor guarantees, but involve known and unknown risks, uncertainties and other important factors that may cause our actual results, performance or achievements to be materially different from any future results, performance or achievements expressed or implied by the forward-looking statements. For factors that could cause actual results to differ materially from the forward-looking statements in this presentation, please see the risks and uncertainties identified under the heading "Risk Factors" in our Annual Report on Form 10-K for the year ended December 31, 2025, as updated by our Quarterly Report on Form 10-Q for the quarter ended September 30, 2026, which are available on our Investor Relations website at ir.vroom.com and on the SEC website at www.sec.gov. All forward-looking statements reflect our beliefs and assumptions only as of the date of this presentation. We undertake no obligation to update forward-looking statements to reflect future events or circumstances except as required by applicable law. Industry and Market Information To the extent this presentation includes information concerning the industry and the markets in which the Company operates, including general observations, expectations, market position, market opportunity and market size, such information is based on management's knowledge and experience in the markets in which we operate, including publicly available information from independent industry analysts and publications, as well as the Company’s own estimates. Our estimates are based on third-party sources, as well as internal research, which the Company believes to be reasonable, but which are inherently uncertain and imprecise. Accordingly, you are cautioned not to place undue reliance on such market and industry information. Financial Presentation and Use of Non-GAAP Financial MeasuresCertain monetary amounts, percentages and other figures included in this presentation have been subject to rounding adjustments. Certain other amounts that appear in this presentation may not sum due to rounding. This presentation contains certain supplemental financial measures that are not calculated pursuant to U.S. generally accepted accounting principles (“GAAP”). These non-GAAP measures are in addition to, and not a substitute or superior to, measures of financial performance prepared in accordance with GAAP. These non-GAAP financial measures have limitations as analytical tools in that they do not reflect all of the amounts associated with our results of operations as determined in accordance with U.S. GAAP. Because of these limitations, these non-GAAP financial measures should be considered along with other operating and financial performance measures presented in accordance with U.S. GAAP. We have reconciled all non-GAAP financial measures with the most directly comparable U.S. GAAP financial measures in the Appendix to this presentation. Non-GAAP Combined Nine Months Ended September 30, 2025 Our financial results for the periods from January 1, 2025 through January 14, 2025 are referred to as those of the “Predecessor” period. Our financial results for the period from January 15, 2025 through September 30, 2025 and thereafter are referred to as those of the “Successor” period. Our results of operations as reported in our Condensed Consolidated Financial Statements for these periods are prepared in accordance with GAAP. Although GAAP requires that we report our results for the period from January 1, 2025 through January 14, 2025 and the period from January 15, 2025 through September 30, 2025 separately, management views our operating results for the nine months ended September 30, 2025 by combining the results of the applicable Predecessor and Successor periods because such presentation provides the most meaningful comparison of our results to prior periods. We believe we cannot adequately benchmark the operating results of the period from January 15, 2025 through September 30, 2025 against any of the previous or subsequent periods reported in our Consolidated Financial Statements without combining it with the period from January 1, 2025 through January 14, 2025 and do not believe that reviewing the results of this period in isolation would be useful in identifying trends in or reaching conclusions regarding our overall operating performance. Management believes that the key performance metrics for the Successor period when combined with the Predecessor period provide more meaningful comparisons to other periods and are useful in identifying current business trends. Accordingly, in addition to presenting our results of operations as reported in our Consolidated Financial Statements in accordance with GAAP, the tables and discussion below also present the combined results for the nine months ended September 30, 2025. The combined results for the nine months ended September 30, 2025 represent the sum of the reported amounts for the Predecessor period from January 1, 2025 through January 14, 2025 and the Successor period from January 15, 2025 through September 30, 2025. These combined results are not considered to be prepared in accordance with GAAP and have not been prepared as pro forma results per applicable regulations. The combined operating results do not reflect the actual results we would have achieved absent our emergence from Prepackaged Chapter 11 Case and are not necessarily indicative of future results. Accordingly, the results for the combined nine months ended September 30, 2025 (prepared on a Non-GAAP basis) and the nine months ended September 30, 2026 (prepared on a GAAP basis) may not be comparable, particularly for statement of operations line items significantly impacted by the Reorganization transactions and the impact of fresh start accounting. 2
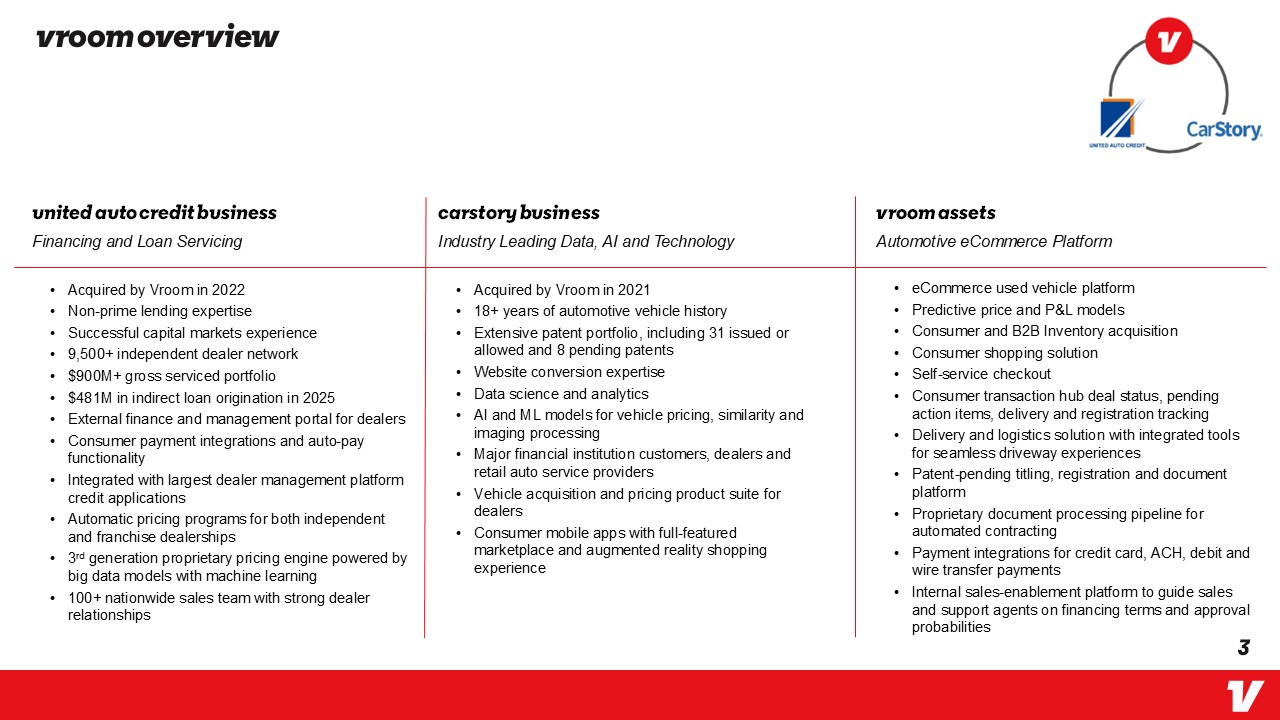
Vroom overview United Auto Credit business Financing and Loan Servicing Acquired by Vroom in 2022 Non-prime lending expertise Successful capital markets experience 9,500+ independent dealer network $900M+ gross serviced portfolio $481M in indirect loan origination in 2025 External finance and management portal for dealers Consumer payment integrations and auto-pay functionality Integrated with largest dealer management platform credit applications Automatic pricing programs for both independent and franchise dealerships 3rd generation proprietary pricing engine powered by big data models with machine learning 100+ nationwide sales team with strong dealer relationships CarStory business Industry Leading Data, AI and Technology Acquired by Vroom in 2021 18+ years of automotive vehicle history Extensive patent portfolio, including 31 issued or allowed and 8 pending patents Website conversion expertise Data science and analytics AI and ML models for vehicle pricing, similarity and imaging processing Major financial institution customers, dealers and retail auto service providers Vehicle acquisition and pricing product suite for dealers Consumer mobile apps with full-featured marketplace and augmented reality shopping experience Vroom assets Automotive eCommerce Platform eCommerce used vehicle platform Predictive price and P&L models Consumer and B2B Inventory acquisition Consumer shopping solution Self-service checkout Consumer transaction hub deal status, pending action items, delivery and registration tracking Delivery and logistics solution with integrated tools for seamless driveway experiences Patent-pending titling, registration and document platform Proprietary document processing pipeline for automated contracting Payment integrations for credit card, ACH, debit and wire transfer payments Internal sales-enablement platform to guide sales and support agents on financing terms and approval probabilities 3
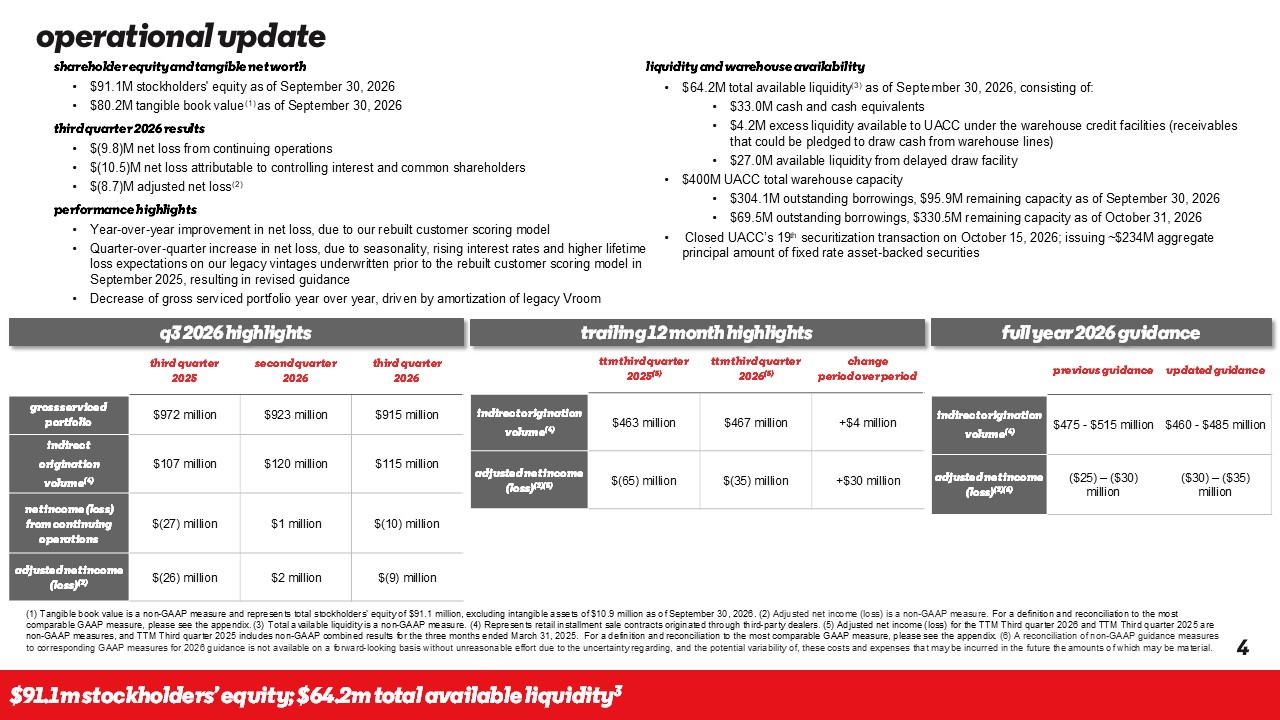
Operational update Shareholder equity and tangible net worth $91.1M stockholders' equity as of September 30, 2026 $80.2M tangible book value(1) as of September 30, 2026 Third quarter 2026 results $(9.8)M net loss from continuing operations $(10.5)M net loss attributable to controlling interest and common shareholders $(8.7)M adjusted net loss(2) Performance highlights Year-over-year improvement in net loss, due to our rebuilt customer scoring model Quarter-over-quarter increase in net loss, due to seasonality, rising interest rates and higher lifetime loss expectations on our legacy vintages underwritten prior to the rebuilt customer scoring model in September 2025, resulting in revised guidance Decrease of gross serviced portfolio year over year, driven by amortization of legacy Vroom Liquidity and warehouse availability $64.2M total available liquidity(3) as of September 30, 2026, consisting of: $33.0M cash and cash equivalents $4.2M excess liquidity available to UACC under the warehouse credit facilities (receivables that could be pledged to draw cash from warehouse lines) $27.0M available liquidity from delayed draw facility $400M UACC total warehouse capacity $304.1M outstanding borrowings, $95.9M remaining capacity as of September 30, 2026 $69.5M outstanding borrowings, $330.5M remaining capacity as of October 31, 2026 Closed UACC’s 19th securitization transaction on October 15, 2026; issuing ~$234M aggregate principal amount of fixed rate asset-backed securities Q3 2026 Highlights Third quarter 2025 Second quarter 2026 Third quarter 2026 Gross serviced portfolio Indirect Origination Volume(4) Net income (loss) from continuing operations Adjusted net income (loss)(2) $972 million $107 million $(27) million $(26) million $923 million $120 million $1 million $2 million $915 million $115 million $(10) million $(9) million Trailing 12 month Highlights TTM Third quarter 2025(5) TTM Third quarter 2026(5) Change Period over period Indirect Origination Volume(4) Adjusted net income (loss)(2)(5) $463 million $(65) million $467 million $(35) million +$4 million +$30 million Full year 2026 guidance Previous guidance Updated guidance Indirect Origination Volume(4) Adjusted net income (loss)(2)(6) $475 - $515 million $460 - $485 million ($25) – ($30) million ($30) – ($35) million (1) Tangible book value is a non-GAAP measure and represents total stockholders' equity of $91.1 million, excluding intangible assets of $10.9 million as of September 30, 2026. (2) Adjusted net income (loss) is a non-GAAP measure. For a definition and reconciliation to the most comparable GAAP measure, please see the appendix. (3) Total available liquidity is a non-GAAP measure. (4) Represents retail installment sale contracts originated through third-party dealers. (5) Adjusted net income (loss) for the TTM Third quarter 2026 and TTM Third quarter 2025 are non-GAAP measures, and TTM Third quarter 2025 includes non-GAAP combined results for the three months ended March 31, 2025. For a definition and reconciliation to the most comparable GAAP measure, please see the appendix. (6) A reconciliation of non-GAAP guidance measures to corresponding GAAP measures for 2026 guidance is not available on a forward-looking basis without unreasonable effort due to the uncertainty regarding, and the potential variability of, these costs and expenses that may be incurred in the future the amounts of which may be material. $91.1M stockholders’ equity; $64.2M total available liquidity3 4
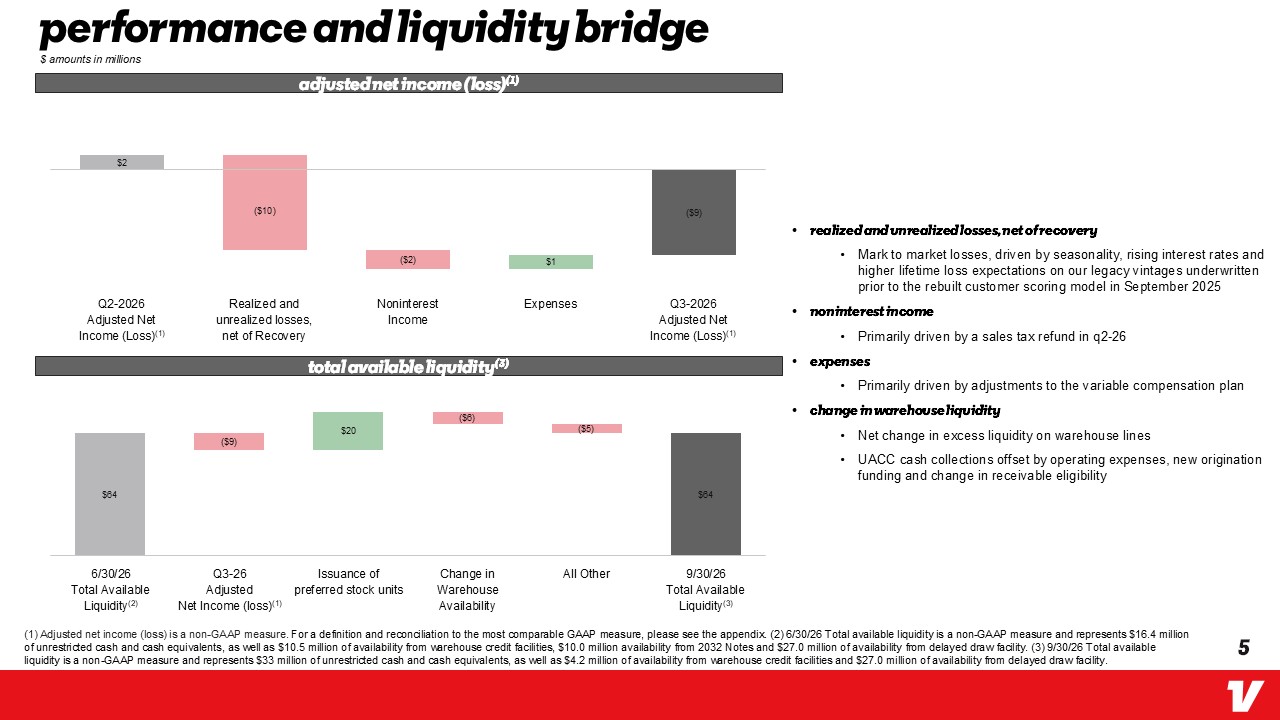
Performance and liquidity bridge $ amounts in millions Adjusted net income (loss)(1) $2 ($10) ($2) $1 ($9) Q2-2026 Adjusted Net Income (Loss)(1) Realized and unrealized losses, net of Recovery Noninterest Income Expenses Q3-2026 Adjusted Net Income (Loss)(1) Total available liquidity(3) $64 ($9) $20 ($6) ($5) $64 6/30/26 Total Available Liquidity(2) Q3-26 Adjusted Net Income (loss)(1)Issuance of preferred stock units Change in Warehouse Availability All Other 9/30/26 Total Available Liquidity(3) Realized and unrealized losses, net of recovery Mark to market losses, driven by seasonality, rising interest rates and higher lifetime loss expectations on our legacy vintages underwritten prior to the rebuilt customer scoring model in September 2025 Noninterest income Primarily driven by a sales tax refund in q2-26 expenses Primarily driven by adjustments to the variable compensation plan Change in warehouse liquidity Net change in excess liquidity on warehouse lines UACC cash collections offset by operating expenses, new origination funding and change in receivable eligibility (1) Adjusted net income (loss) is a non-GAAP measure. For a definition and reconciliation to the most comparable GAAP measure, please see the appendix. (2) 6/30/26 Total available liquidity is a non-GAAP measure and represents $16.4 million of unrestricted cash and cash equivalents, as well as $10.5 million of availability from warehouse credit facilities, $10.0 million availability from 2032 Notes and $27.0 million of availability from delayed draw facility. (3) 9/30/26 Total available liquidity is a non-GAAP measure and represents $33 million of unrestricted cash and cash equivalents, as well as $4.2 million of availability from warehouse credit facilities and $27.0 million of availability from delayed draw facility. 5
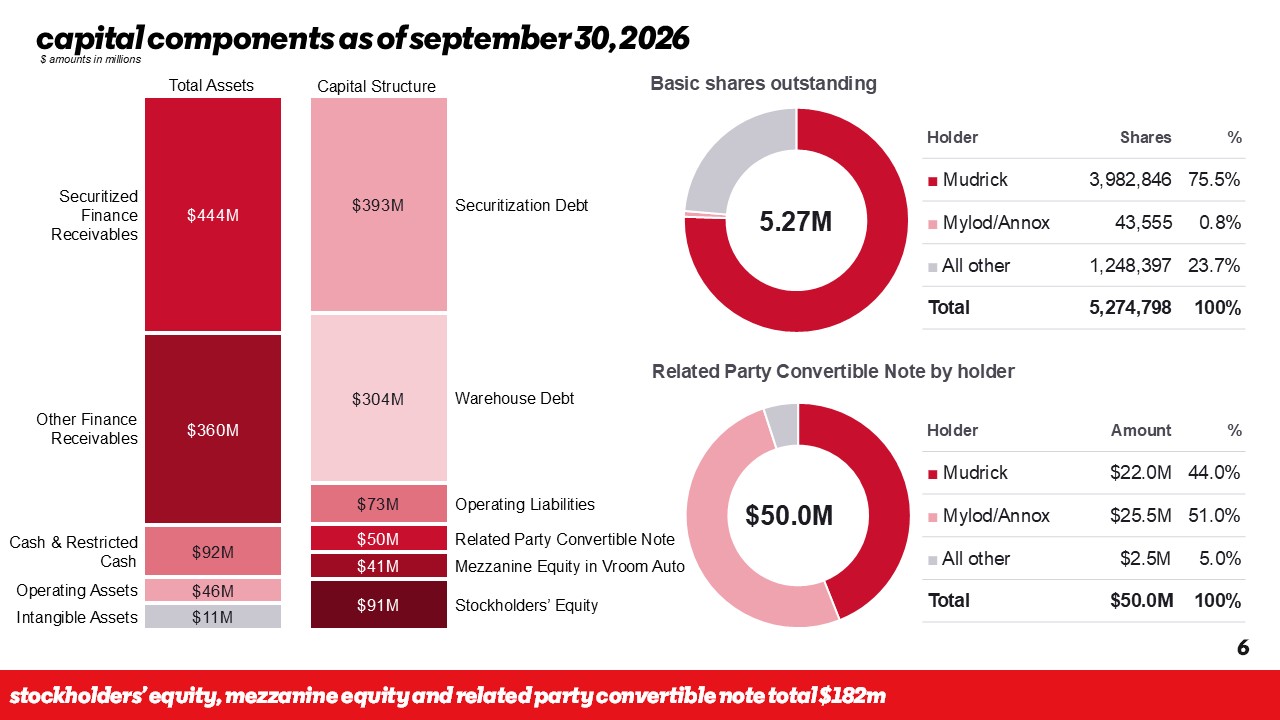
Capital components as of September 30, 2026 $ amounts in millions Total Assets Capital Structure Securitized Finance Receivables $444M $393M Other Finance Receivables $360M $304M Cash & Restricted Cash $92M $73M $50M $41M $91M Operating Assets $46M Intangible Assets $11M Securitization Debt Warehouse Debt Operating Liabilities Related Party Convertible Note Mezzanine Equity in Vroom Auto Stockholders’ Equity Basic shares outstanding 5.27M Holder Shares % Mudrick Mylod/Annox All other Total 3,982,846 43,555 1,248,397 5,274,798 75.5% 0.8% 23.7% 100% Related Party Convertible Note by holder $50.0M Holder Shares % Mudrick Mylod/Annox All other Total Amount % $22.0M $25.5M $2.5M $50.0M 44.0% 51.0% 5.0% 100% Stockholders’ equity, mezzanine equity and related party convertible note total $182M 6
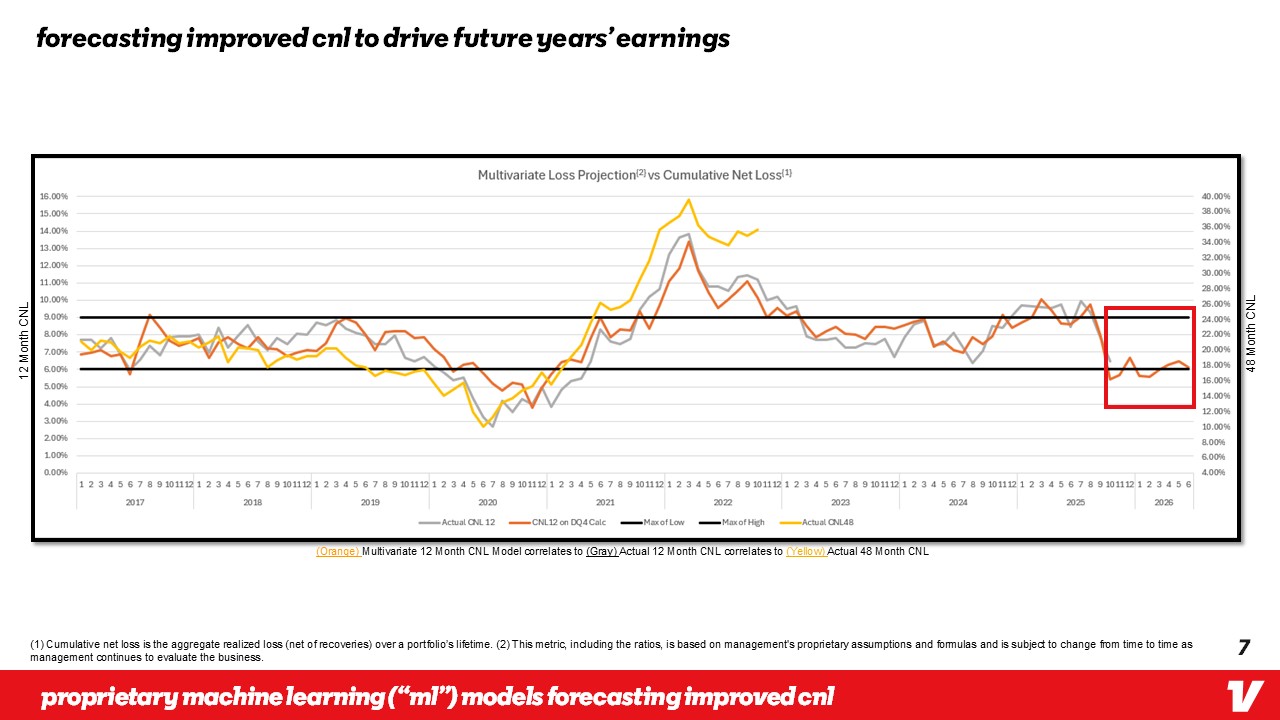
Forecasting improved CNL to drive future years’ earnings 12 Month CNL 48 Month CNL (Line Chart) (Orange) Multivariate 12 Month CNL Model correlates to (Gray) Actual 12 Month CNL correlates to (Yellow) Actual 48 Month CNL (1) Cumulative net loss is the aggregate realized loss (net of recoveries) over a portfolio’s lifetime. (2) This metric, including the ratios, is based on management's proprietary assumptions and formulas and is subject to change from time to time as management continues to evaluate the business. Proprietary machine learning (“ML”) models forecasting improved CNL 7

vroom appendix
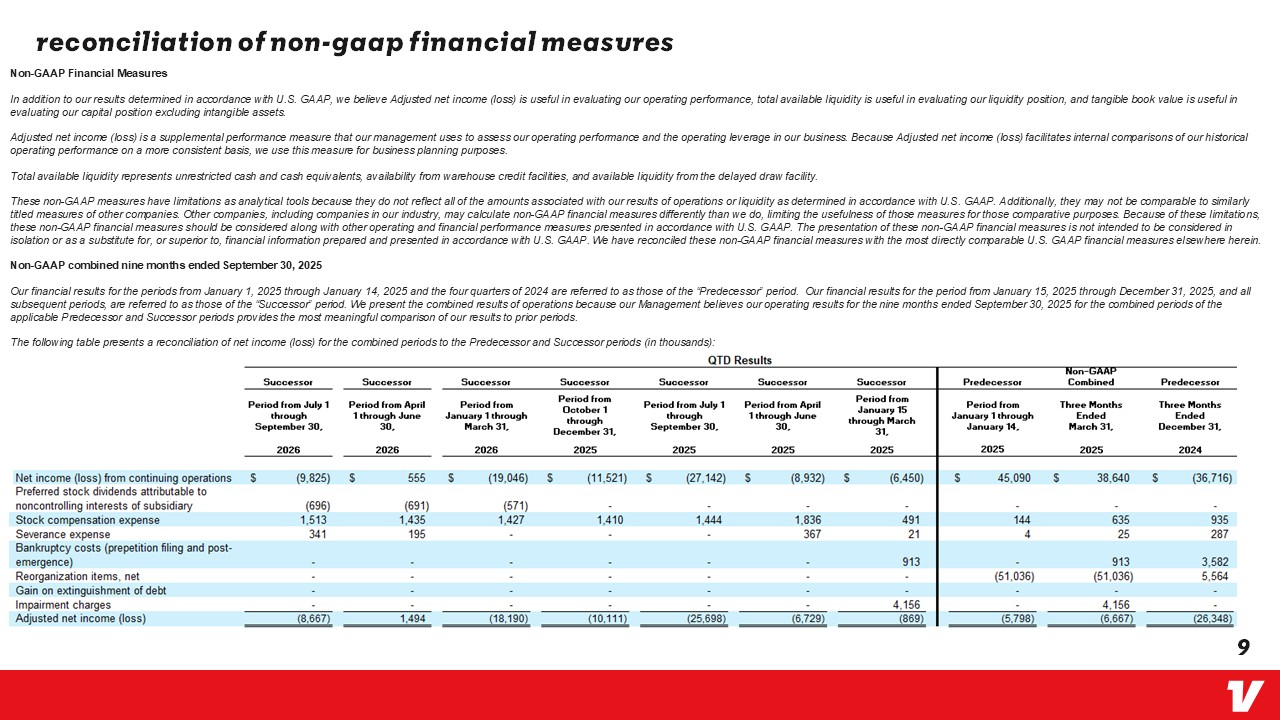
Reconciliation of non-GAAP financial measures Non-GAAP Financial Measures In addition to our results determined in accordance with U.S. GAAP, we believe Adjusted net income (loss) is useful in evaluating our operating performance, total available liquidity is useful in evaluating our liquidity position, and tangible book value is useful in evaluating our capital position excluding intangible assets. Adjusted net income (loss) is a supplemental performance measure that our management uses to assess our operating performance and the operating leverage in our business. Because Adjusted net income (loss) facilitates internal comparisons of our historical operating performance on a more consistent basis, we use this measure for business planning purposes. Total available liquidity represents unrestricted cash and cash equivalents, availability from warehouse credit facilities, and available liquidity from the delayed draw facility. These non-GAAP measures have limitations as analytical tools because they do not reflect all of the amounts associated with our results of operations or liquidity as determined in accordance with U.S. GAAP. Additionally, they may not be comparable to similarly titled measures of other companies. Other companies, including companies in our industry, may calculate non-GAAP financial measures differently than we do, limiting the usefulness of those measures for those comparative purposes. Because of these limitations, these non-GAAP financial measures should be considered along with other operating and financial performance measures presented in accordance with U.S. GAAP. The presentation of these non-GAAP financial measures is not intended to be considered in isolation or as a substitute for, or superior to, financial information prepared and presented in accordance with U.S. GAAP. We have reconciled these non-GAAP financial measures with the most directly comparable U.S. GAAP financial measures elsewhere herein. Non-GAAP combined nine months ended September 30, 2025 Our financial results for the periods from January 1, 2025 through January 14, 2025 and the four quarters of 2024 are referred to as those of the “Predecessor” period. Our financial results for the period from January 15, 2025 through December 31, 2025, and all subsequent periods, are referred to as those of the “Successor” period. We present the combined results of operations because our Management believes our operating results for the nine months ended September 30, 2025 for the combined periods of the applicable Predecessor and Successor periods provides the most meaningful comparison of our results to prior periods. The following table presents a reconciliation of net income (loss) for the combined periods to the Predecessor and Successor periods (in thousands): (Numeric value Table) 9