Share Combination On February 10, 2026, the authorised, issued, and outstanding shares of the Founder Group Limited were combined on a 100 for 1 ratio (the “Share Combination”) with the marketplace. As a result of the Share Combination, each 100 ordinary shares outstanding will automatically combine and convert to one issued and outstanding ordinary share without any action on the part of the shareholders
Exhibit 99.1
FOUNDER GROUP LIMITED
INDEX TO CONDENSED CONSOLIDATED FINANCIAL STATEMENTS
TABLE OF CONTENTS
FOUNDER GROUP LIMITED AND ITS SUBSIDIARIES
UNAUDITED INTERIM CONDENSED CONSOLIDATED STATEMENT OF FINANCIAL POSITION
AS OF DECEMBER 31, 2025 AND JUNE 30, 2026
| |
|
Note |
|
|
As of
December 31,
2025 (Audited) |
|
|
As of
June 30,
2026 (Unaudited) |
|
|
As of
June 30,
2026 (Unaudited) |
|
| |
|
|
|
|
RM |
|
|
RM |
|
|
USD |
|
| ASSETS |
|
|
|
|
|
|
|
|
|
|
|
|
| |
|
|
|
|
|
|
|
|
|
|
|
|
| Non-current assets |
|
|
|
|
|
|
|
|
|
|
|
|
| Plant and equipment | | | 4 | | | | 22,012,303 | | | | 31,173,554 | | | | 7,645,262 | |
| Right-of-use assets | | | 5 | | | | 687,863 | | | | 533,045 | | | | 130,728 | |
| Investment in an associate | | | 6 | | | | 1,923,775 | | | | 2,599,672 | | | | 637,565 | |
| Investment in other investment | | | 7 | | | | — | | | | 1,006,240 | | | | 246,779 | |
| Trade receivables | | | 8 | | | | 1,508,742 | | | | 2,041,823 | | | | 500,754 | |
| Deferred tax asset | | | 9 | | | | 175,810 | | | | 175,810 | | | | 43,117 | |
| Total non-current assets | | | | | | | 26,308,493 | | | | 37,530,144 | | | | 9,204,205 | |
| |
|
|
|
|
|
|
|
|
|
|
|
|
|
|
|
|
| Current assets |
|
|
|
|
|
|
|
|
|
|
|
|
|
|
|
|
| Cash and bank balances | | | | | | | 80,243,158 | | | | 72,605,810 | | | | 17,806,452 | |
| Inventories | | | 10 | | | | 2,457,916 | | | | 1,874,932 | | | | 459,824 | |
| Trade receivables | | | 8 | | | | 19,411,022 | | | | 14,178,600 | | | | 3,477,278 | |
| Contract assets | | | 11 | | | | 41,440,035 | | | | 87,349,420 | | | | 21,422,298 | |
| Other receivables and prepayment | | | 12 | | | | 17,430,594 | | | | 40,364,600 | | | | 9,899,350 | |
| Amount due from related parties | | | 13 | | | | 2,457,382 | | | | 4,529,037 | | | | 1,110,739 | |
| Income tax receivable | | | 9 | | | | — | | | | 318,213 | | | | 78,041 | |
| Total current assets | | | | | | | 163,440,107 | | | | 221,220,612 | | | | 54,253,982 | |
| Total assets | | | | | | | 189,748,600 | | | | 258,750,756 | | | | 63,458,187 | |
| |
|
|
|
|
|
|
|
|
|
|
|
|
|
|
|
|
| LIABILITIES AND EQUITY |
|
|
|
|
|
|
|
|
|
|
|
|
|
|
|
|
| |
|
|
|
|
|
|
|
|
|
|
|
|
|
|
|
|
| Current liabilities |
|
|
|
|
|
|
|
|
|
|
|
|
|
|
|
|
| Trade payables | | | 8 | | | | 18,315,260 | | | | 34,236,294 | | | | 8,396,393 | |
| Other payables and accrued liabilities | | | 12 | | | | 8,951,463 | | | | 17,471,394 | | | | 4,284,830 | |
| Convertible securities payable | | | 14 | | | | 64,170,406 | | | | 52,819,830 | | | | 12,953,974 | |
| Bank and other borrowings | | | 15 | | | | 45,626,825 | | | | 86,918,717 | | | | 21,316,670 | |
| Lease liabilities | | | 5 | | | | 431,946 | | | | 81,808 | | | | 20,063 | |
| Amount due to related parties | | | 13 | | | | 3,901,595 | | | | 469,425 | | | | 115,126 | |
| Income tax payable | | | 9 | | | | 104,021 | | | | — | | | | — | |
| Total current liabilities | | | | | | | 141,501,516 | | | | 191,997,468 | | | | 47,087,056 | |
| |
|
|
|
|
|
|
|
|
|
|
|
|
|
|
|
|
| Non-current liabilities |
|
|
|
|
|
|
|
|
|
|
|
|
|
|
|
|
| Lease liabilities | | | 5 | | | | 276,683 | | | | 471,295 | | | | 115,584 | |
| Bank and other borrowings | | | 15 | | | | 17,714,042 | | | | 23,367,975 | | | | 5,730,956 | |
| Total non-current labilities | | | | | | | 17,990,725 | | | | 23,839,270 | | | | 5,846,540 | |
| Total liabilities | | | | | | | 159,492,241 | | | | 215,836,738 | | | | 52,933,596 | |
| |
|
|
|
|
|
|
|
|
|
|
|
|
|
|
|
|
| Capital and reserves |
|
|
|
|
|
|
|
|
|
|
|
|
|
|
|
|
| Share capital | | | 16 | | | | 28,941,506 | | | | 40,716,817 | | | | 9,985,731 | |
| Reserves | | | 17 | | | | 1,704,989 | | | | 1,304,091 | | | | 319,826 | |
| Retained earnings | | | | | | | 95,920 | | | | 887,705 | | | | 217,709 | |
| Other comprehensive income/(loss) | | | | | | | (486,057 | ) | | | 5,404 | | | | 1,325 | |
| Attributable to equity owners of the Company | | | | | | | 30,256,358 | | | | 42,914,017 | | | | 10,524,591 | |
| Non-controlling interests | | | | | | | 1 | | | | 1 | | | | — | |
| Total equity | | | | | | | 30,256,359 | | | | 42,914,018 | | | | 10,524,591 | |
| Total liabilities and equity | | | | | | | 189,748,600 | | | | 258,750,756 | | | | 63,458,187 | |
The accompanying notes are an integral part of
these consolidated financial statements.
FOUNDER GROUP LIMITED AND ITS SUBSIDIARIES
UNAUDITED INTERIM CONDENSED
CONSOLIDATED STATEMENT OF COMPREHENSIVE INCOME
FOR THE SIX MONTHS ENDED JUNE 30, 2025 AND JUNE 30, 2026
| |
|
Note |
|
|
Six months
ended
June 30,
2025 |
|
|
Six months
ended
June 30,
2026 |
|
|
Six months
ended
June 30,
2026 |
|
| |
|
|
|
|
RM |
|
|
RM |
|
|
USD |
|
| Revenue from contract services | | | | | | | 38,289,161 | | | | 42,571,195 | | | | 10,440,513 | |
| Revenue from sales of goods | | | | | | | 2,507,413 | | | | 4,728,963 | | | | 1,159,770 | |
| Revenue from contract services – related parties | | | | | | | 14,669,420 | | | | 35,713,128 | | | | 8,758,584 | |
| Total revenue | | | 18 | | | | 55,465,994 | | | | 83,013,286 | | | | 20,358,867 | |
| |
|
|
|
|
|
|
|
|
|
|
|
|
|
|
|
|
| Cost of sales from contract services | | | | | | | (46,953,622 | ) | | | (70,042,430 | ) | | | (17,177,787 | ) |
| Cost of sales from sales of goods | | | | | | | (2,262,004 | ) | | | (3,899,015 | ) | | | (956,228 | ) |
| Cost of sales for contract services – related party | | | | | | | (386,972 | ) | | | (430,856 | ) | | | (105,667 | ) |
| Total cost of sales | | | 19 | | | | (49,602,598 | ) | | | (74,372,301 | ) | | | (18,239,682 | ) |
| Gross profit | | | | | | | 5,863,396 | | | | 8,640,985 | | | | 2,119,185 | |
| |
|
|
|
|
|
|
|
|
|
|
|
|
|
|
|
|
| Selling and administrative | | | | | | | (6,127,228 | ) | | | (6,454,283 | ) | | | (1,582,901 | ) |
| Selling and administrative to related party | | | | | | | (216,352 | ) | | | — | | | | — | |
| (Loss)/profit from operation before income tax | | | | | | | (480,184 | ) | | | 2,186,702 | | | | 536,284 | |
| |
|
|
|
|
|
|
|
|
|
|
|
|
|
|
|
|
| Other income | | | | | | | 848,670 | | | | 709,986 | | | | 174,123 | |
| Other income from related party | | | | | | | — | | | | — | | | | — | |
| Finance cost | | | | | | | (2,090,193 | ) | | | (2,458,672 | ) | | | (602,984 | ) |
| Finance cost – related parties | | | | | | | (59,223 | ) | | | (6,862 | ) | | | (1,683 | ) |
| Share of results of an associate | | | | | | | — | | | | 675,897 | | | | 165,763 | |
| (Loss)/profit before income tax | | | | | | | (1,780,930 | ) | | | 1,107,051 | | | | 271,503 | |
| Income tax expense | | | 9 | | | | (148,668 | ) | | | (315,266 | ) | | | (77,319 | ) |
| Net (loss)/profit for the period | | | | | | | (1,929,598 | ) | | | 791,785 | | | | 194,184 | |
| |
|
|
|
|
|
|
|
|
|
|
|
|
|
|
|
|
| (Loss)/profit attributable to: |
|
|
|
|
|
|
|
|
|
|
|
|
|
|
|
|
| Equity owners of the Company | | | | | | | (1,929,598 | ) | | | 791,785 | | | | 194,184 | |
| Non-controlling interests | | | | | | | — | | | | — | | | | — | |
| Total | | | | | | | (1,929,598 | ) | | | 791,785 | | | | 194,184 | |
| |
|
|
|
|
|
|
|
|
|
|
|
|
|
|
|
|
| Other comprehensive (expense)/income: |
|
|
|
|
|
|
|
|
|
|
|
|
|
|
|
|
| Currency translation arising from consolidation | | | | | | | (270,178 | ) | | | 5,404 | | | | 1,325 | |
| |
|
|
|
|
|
|
|
|
|
|
|
|
|
|
|
|
| Total comprehensive (expense)/income for the period | | | | | | | (2,199,776 | ) | | | 797,189 | | | | 195,509 | |
| |
|
|
|
|
|
|
|
|
|
|
|
|
|
|
|
|
| Total comprehensive (expense)/profit attributable to: |
|
|
|
|
|
|
|
|
|
|
|
|
|
|
|
|
| Equity owners of the Company | | | | | | | (2,199,776 | ) | | | 797,189 | | | | 195,509 | |
| Non-controlling interests | | | | | | | — | | | | — | | | | — | |
| Total | | | | | | | (2,199,776 | ) | | | 797,189 | | | | 195,509 | |
| |
|
|
|
|
|
|
|
|
|
|
|
|
|
|
|
|
| Basic and diluted net (loss)/earnings per share: |
|
|
20 |
|
|
|
|
|
|
|
|
|
|
|
|
|
| Basic (restated) | | | | | | | (10.73 | ) | | | 0.97 | | | | 0.24 | |
| Diluted (restated) | | | | | | | (7.29 | ) | | | 0.03 | | | | 0.01 | |
| Weighted average number of common shares outstanding – Basic and diluted: |
|
|
|
|
|
|
|
|
|
|
|
|
|
|
|
|
| Basic (restated) | | | | | | | 179,848 | | | | 816,406 | | | | 816,406 | |
| Diluted (restated) | | | | | | | 264,794 | | | | 23,079,057 | | | | 23,079,057 | |
The accompanying notes are an integral part of
these consolidated financial statements.
FOUNDER GROUP LIMITED AND ITS SUBSIDIARIES
UNAUDITED INTERIM CONDENSED CONSOLIDATED STATEMENT OF CHANGES IN EQUITY
FOR THE SIX MONTHS ENDED JUNE 30, 2025 AND 2026
| |
|
Class A and
Class B Shares |
|
|
Share
capital |
|
|
Reserves |
|
|
Retained
earnings |
|
|
Other
comprehensive
income/(loss) |
|
|
Non-controlling interests |
|
|
Total
shareholders’
equity |
|
| |
|
|
|
|
RM |
|
|
RM |
|
|
RM |
|
|
RM |
|
|
RM |
|
|
RM |
|
| Balance at January 1, 2025 (restated) # | | | 176,653 | | | | 7,425,257 | | | | 1,704,989 | | | | 7,859,024 | | | | 132,208 | | | | — | | | | 17,121,478 | |
| Transaction costs of share issue | | | — | | | | (228,590 | ) | | | — | | | | — | | | | — | | | | — | | | | (228,590 | ) |
| Convertible securities | | | 7,852 | | | | 2,615,680 | | | | — | | | | — | | | | — | | | | — | | | | 2,615,680 | |
| Non-controlling interests arising from a new subsidiary | | | — | | | | — | | | | — | | | | — | | | | — | | | | 1 | | | | 1 | |
| Foreign currency translation adjustment | | | — | | | | — | | | | — | | | | — | | | | (270,178 | ) | | | — | | | | (270,178 | ) |
| Net loss for the period | | | — | | | | — | | | | — | | | | (1,929,598 | ) | | | — | | | | — | | | | (1,929,598 | ) |
| Balance at June 30, 2025 (restated) | | | 184,505 | | | | 9,812,347 | | | | 1,704,989 | | | | 5,929,426 | | | | (137,970 | ) | | | 1 | | | | 17,308,793 | |
| |
|
|
|
|
|
|
|
|
|
|
|
|
|
|
|
|
|
|
|
|
|
|
|
|
|
|
|
|
| Balance at January 1, 2026 (restated) # | | | 330,337 | | | | 28,941,506 | | | | 1,704,989 | | | | 95,920 | | | | (486,057 | ) | | | 1 | | | | 30,256,359 | |
| Conversion of convertible securities into ordinary shares | | | 1,401,399 | | | | 11,775,311 | | | | — | | | | — | | | | — | | | | — | | | | 11,775,311 | |
| Reclassification of foreign exchange translation reserve to reserves | | | — | | | | — | | | | (486,057 | ) | | | — | | | | 486,057 | | | | — | | | | — | |
| Foreign currency translation differences | | | — | | | | — | | | | 85,159 | | | | — | | | | — | | | | — | | | | 85,159 | |
| Foreign currency translation adjustment | | | — | | | | — | | | | — | | | | — | | | | 5,404 | | | | — | | | | 5,404 | |
| Net profit for the period | | | — | | | | — | | | | — | | | | 791,785 | | | | — | | | | — | | | | 791,785 | |
| Balance at June 30, 2026 (Unaudited) | | | 1,731,736 | | | | 40,716,817 | | | | 1,304,091 | | | | 887,705 | | | | 5,404 | | | | 1 | | | | 42,914,018 | |
| |
|
Share
capital |
|
|
Reserves |
|
|
Retained
earnings |
|
|
Other
comprehensive
income |
|
|
Non-controlling interests |
|
|
Total
shareholders’
equity |
|
| |
|
USD |
|
|
USD |
|
|
USD |
|
|
USD |
|
|
USD |
|
|
USD |
|
| Balance at June 30, 2025 | | | 2,234,635 | | | | 404,745 | | | | 1,407,579 | | | | 61,953 | | | | — | | | | 4,108,912 | |
| Balance at June 30, 2026 | | | 9,985,731 | | | | 319,826 | | | | 217,709 | | | | 1,325 | | | | — | | | | 10,524,591 | |
On February 10, 2026, the authorised, issued, and outstanding shares
of the Founder Group Limited were combined on a 100 for 1 ratio (the “Share Combination”) with the marketplace. As a result
of the Share Combination, each 100 ordinary shares outstanding will automatically combine and convert to one issued and outstanding ordinary
share without any action on the part of the shareholders
The accompanying notes are an integral part of
these consolidated financial statements.
FOUNDER GROUP LIMITED AND ITS SUBSIDIARIES
UNAUDITED INTERIM CONDENSED CONSOLIDATED STATEMENT OF CASH FLOWS
FOR THE SIX MONTHS ENDED JUNE 30, 2025 AND 2026
| |
|
Six months
ended
June 30,
2025 |
|
|
Six months
ended
June 30,
2026 |
|
|
Six months
ended
June 30,
2026 |
|
| |
|
RM |
|
|
RM |
|
|
USD |
|
| CASH FLOWS FROM OPERATING ACTIVITIES: |
|
|
|
|
|
|
|
|
|
| (Loss)/Profit before income tax | | | (1,780,930 | ) | | | 1,107,051 | | | | 271,503 | |
| |
|
|
|
|
|
|
|
|
|
|
|
|
| Adjustments for: |
|
|
|
|
|
|
|
|
|
|
|
|
| Depreciation of plant and equipment | | | 1,293,080 | | | | 1,228,222 | | | | 301,219 | |
| Plant and equipment written off | | | — | | | | 13,738 | | | | 3,369 | |
| Amortization of right-of-use assets | | | 143,079 | | | | 154,818 | | | | 37,969 | |
| Imputed interests of lease liabilities | | | 19,703 | | | | 12,974 | | | | 3,182 | |
| Allowance for expected credit losses on trade receivables | | | 649,075 | | | | — | | | | — | |
| Reversal of allowance for expected credit losses on trade receivables | | | (376,000 | ) | | | — | | | | — | |
| Fair value gain on financial instruments | | | — | | | | (813,002 | ) | | | (199,387 | ) |
| Discount on convertible securities | | | 689,549 | | | | — | | | | — | |
| Interest income | | | (58,456 | ) | | | (667,330 | ) | | | (163,662 | ) |
| Finance cost | | | 1,440,164 | | | | 2,445,694 | | | | 599,802 | |
| Unrealized foreign exchange (gains)/losses | | | (748,233 | ) | | | 422,383 | | | | 103,589 | |
| Share of results of an associate | | | — | | | | (675,897 | ) | | | (165,763 | ) |
| Operating profit before changes in working capital | | | 1,271,031 | | | | 3,228,651 | | | | 791,821 | |
| |
|
|
|
|
|
|
|
|
|
|
|
|
| Changes in operating assets and liabilities: |
|
|
|
|
|
|
|
|
|
|
|
|
| Contract assets | | | 12,246,823 | | | | (45,909,385 | ) | | | (11,259,199 | ) |
| Trade receivables | | | (3,972,139 | ) | | | 4,699,343 | | | | 1,152,506 | |
| Inventories | | | 1,672,073 | | | | 582,983 | | | | 142,976 | |
| Other receivables and prepayment | | | (5,018,533 | ) | | | (22,934,006 | ) | | | (5,624,526 | ) |
| Contract liabilities | | | — | | | | — | | | | — | |
| Trade payables | | | (2,242,484 | ) | | | 15,896,890 | | | | 3,898,685 | |
| Other payables and accrued liabilities | | | (18,804,175 | ) | | | 8,121,697 | | | | 1,991,832 | |
| Cash flows generated from/(used in) operations | | | (14,847,404 | ) | | | (36,313,826 | ) | | | (8,905,905 | ) |
| Income tax paid | | | (748,261 | ) | | | (737,500 | ) | | | (180,871 | ) |
| Net cash generated from/(used in) operating activities | | | (15,595,665 | ) | | | (37,051,326 | ) | | | (9,086,776 | ) |
| |
|
|
|
|
|
|
|
|
|
|
|
|
| Investing activities |
|
|
|
|
|
|
|
|
|
|
|
|
| Interest income | | | 58,456 | | | | 667,330 | | | | 163,662 | |
| Purchase of plant and equipment | | | (324,019 | ) | | | (10,074,457 | ) | | | (2,470,744 | ) |
| Acquisition of other investment | | | — | | | | (193,238 | ) | | | (47,391 | ) |
| Proceeds from disposal of property, plant and equipment | | | — | | | | 5,132 | | | | 1,259 | |
| Incorporation of a subsidiary company | | | 1 | | | | — | | | | — | |
| Deposit pledged with licensed banks | | | (1,634,469 | ) | | | (2,372,850 | ) | | | (581,937 | ) |
| Net cash used in investing activities | | | (1,900,031 | ) | | | (11,968,083 | ) | | | (2,935,151 | ) |
| |
|
|
|
|
|
|
|
|
|
|
|
|
| Financing activities |
|
|
|
|
|
|
|
|
|
|
|
|
| Proceeds from convertible securities | | | 10,044,046 | | | | 424,734 | | | | 104,165 | |
| Interest paid | | | (2,070,490 | ) | | | (2,445,694 | ) | | | (599,802 | ) |
| Repayment of lease liabilities | | | (156,000 | ) | | | (168,500 | ) | | | (41,324 | ) |
| Amount due to related parties | | | (3,073,460 | ) | | | (5,503,828 | ) | | | (1,349,805 | ) |
| Proceeds from bank borrowings | | | 19,951,926 | | | | 47,350,232 | | | | 11,612,565 | |
| Net cash provided by financing activities | | | 24,696,022 | | | | 39,656,944 | | | | 9,725,799 | |
| |
|
|
|
|
|
|
|
|
|
|
|
|
| Net increase/(decrease) in cash and cash equivalents | | | 7,200,326 | | | | (9,362,465 | ) | | | (2,296,128 | ) |
| |
|
|
|
|
|
|
|
|
|
|
|
|
| Cash and cash equivalents at beginning of period | | | 4,563,108 | | | | 66,215,856 | | | | 16,239,327 | |
| Effects of exchange rate changes | | | 276,082 | | | | 90,677 | | | | 22,238 | |
| Cash and cash equivalents at end of period | | | 12,039,516 | | | | 56,944,068 | | | | 13,965,437 | |
The accompanying notes are an integral part of
these consolidated financial statements.
For the purpose of the statement of cash flows,
cash and cash equivalents comprise the following as at the end of each reporting period:
| |
|
Six months
ended
June 30,
2025 |
|
|
Six months
ended
June 30,
2026 |
|
|
Six months
ended
June 30,
2026 |
|
| |
|
RM |
|
|
RM |
|
|
USD |
|
| Cash and bank balances | | | 13,529,427 | | | | 56,944,068 | | | | 13,965,437 | |
| Deposits with licensed banks | | | 9,507,734 | | | | 15,661,742 | | | | 3,841,015 | |
| As per statement of financial position | | | 23,037,161 | | | | 72,605,810 | | | | 17,806,452 | |
| Less: |
|
|
|
|
|
|
|
|
|
|
|
|
| Bank overdraft (Note 15) | | | (1,489,911 | ) | | | — | | | | — | |
| Deposit pledged with licensed banks | | | (9,507,734 | ) | | | (15,661,742 | ) | | | (3,841,015 | ) |
| As per statement of cash flows | | | 12,039,516 | | | | 56,944,068 | | | | 13,965,437 | |
Liabilities arising from financing activities
Reconciliation between the opening and closing
balances in the statement of financial position for liabilities arising from financing activities of the Company is as follows
| |
|
At
beginning
of year |
|
|
Cash flows |
|
|
Non cash
flows |
|
|
At end
of year |
|
| |
|
RM |
|
|
RM |
|
|
RM |
|
|
RM |
|
| As of June 30, 2026 |
|
|
|
|
|
|
|
|
|
|
|
|
| Convertible securities payable | | | 64,170,406 | | | | 424,734 | | | | (11,775,310 | ) | | | 52,819,830 | |
| Hire purchase payables | | | 416,488 | | | | 227,421 | | | | — | | | | 643,909 | |
| Term loan | | | 18,511,138 | | | | 7,738,124 | | | | — | | | | 26,249,262 | |
| Trade financing | | | 43,674,831 | | | | 39,718,690 | | | | — | | | | 83,393,521 | |
| Lease liabilities | | | 708,629 | | | | (168,500 | ) | | | 12,974 | | | | 553,103 | |
| | | | 127,481,492 | | | | 47,940,469 | | | | (11,762,336 | ) | | | 163,659,625 | |
| |
|
At
beginning
of year |
|
|
Cash flows |
|
|
Non cash
flows |
|
|
At end
of year |
|
| |
|
USD |
|
|
USD |
|
|
USD |
|
|
USD |
|
| As of June 30, 2026 |
|
|
|
|
|
|
|
|
|
|
|
|
| Convertible securities payable | | | 15,737,684 | | | | 104,165 | | | | (2,887,875 | ) | | | 12,953,974 | |
| Hire purchase payables | | | 102,143 | | | | 55,775 | | | | — | | | | 157,918 | |
| Term loan | | | 4,539,825 | | | | 1,897,761 | | | | — | | | | 6,437,586 | |
| Trade financing | | | 10,711,179 | | | | 9,740,942 | | | | — | | | | 20,452,121 | |
| Lease liabilities | | | 173,790 | | | | (41,324 | ) | | | 3,182 | | | | 135,648 | |
| | | | 31,264,621 | | | | 11,757,319 | | | | (2,884,693 | ) | | | 40,137,247 | |
| |
|
At
beginning
of year |
|
|
Cash flows |
|
|
Non cash
flows |
|
|
At end
of year |
|
| |
|
RM |
|
|
RM |
|
|
RM |
|
|
RM |
|
| As of December 31, 2025 |
|
|
|
|
|
|
|
|
|
|
|
|
| Convertible securities payable | | | — | | | | 84,895,915 | | | | (20,725,509 | ) | | | 64,170,406 | |
| Hire purchase payables | | | 250,000 | | | | (133,812 | ) | | | 300,300 | | | | 416,488 | |
| Term loan | | | 2,072,038 | | | | 16,439,100 | | | | — | | | | 18,511,138 | |
| Trade financing | | | 31,252,219 | | | | 12,422,612 | | | | — | | | | 43,674,831 | |
| Lease liabilities | | | 747,819 | | | | (362,000 | ) | | | 322,810 | | | | 708,629 | |
| | | | 34,322,076 | | | | 113,261,815 | | | | (20,102,399 | ) | | | 127,481,492 | |
FOUNDER GROUP LIMITED AND ITS SUBSIDIARIES
NOTES TO UNAUDITED INTERIM CONDENSED CONSOLIDATED FINANCIAL STATEMENTS
| 1 | ORGANIZATION AND PRINCIPAL ACTIVITIES |
Founder Group Limited (the “Company”) was incorporated in the British Virgin Islands on May 18, 2023 with registered office at Trinity Chambers, P.O Box 4301, Road Town, Tortola, British Virgin Islands while principal place of business of the Company at No. 17, Jalan Astana 1D, Bandar Bukit Raja 41050 Klang, Selangor, Malaysia.
The group structure which represents the operating subsidiaries and dormant companies as of the reporting date is as follow:
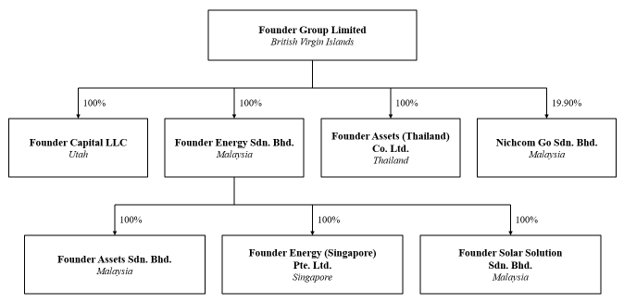
Details of the Company and its subsidiaries (collectively, the “Group”) are shown in the table below:
| | | Percentage of effective ownership |
| | | June 30, |
| Name | | Date of
incorporation | | 2026 | | | 2025 | | | Place of
incorporation | | Principal
activities |
| | | | | % | | | % | | | | | |
| Founder Group Limited | | May 18, 2023 | | | — | | | | — | | | British Virgin Islands | | Holding company |
| Founder Energy Sdn. Bhd. | | April 13, 2021 | | | 100 | | | | 100 | | | Malaysia | | Business of renewable energy activities and related business and activities of holding companies |
| Founder Energy (Singapore) Pte Ltd | | May 27, 2022 | | | 100 | | | | 100 | | | Singapore | | Dormant |
| Founder Assets Sdn. Bhd. | | September 21, 2022 | | | 100 | | | | 100 | | | Malaysia | | Business in the investment of renewable energy project |
| Founder Assets (Thailand) Company Limited | | January 14, 2025 | | | 99.99 | | | | — | | | Thailand | | Dormant |
| Founder Solar Solution Sdn. Bhd. | | February 10, 2025 | | | 100 | | | | — | | | Malaysia | | Business of renewable energy activities |
| Founder Capital, LLC | | November 18, 2025 | | | 100 | | | | — | | | Utah | | Utah |
The Company provides engineering, procurement, construction and commissioning (“EPCC”) services for solar photovoltaic (“PV”) facilities in Malaysia primarily through Founder Energy Sdn. Bhd and Founder Solar Solution Sdn. Bhd.
On April 13, 2021, Mr. Lee Seng Chi incorporate Founder Energy Sdn. Bhd. with 100% equity interest.
On August 25, 2021, Reservoir Link Energy Bhd acquired 51% equity interest in Founder Energy Sdn. Bhd. from Mr. Lee Seng Chi.
FOUNDER GROUP LIMITED AND ITS SUBSIDIARIES
NOTES TO UNAUDITED INTERIM CONDENSED CONSOLIDATED FINANCIAL STATEMENTS
| 1 | ORGANIZATION AND PRINCIPAL ACTIVITIES (cont.) |
Founder Energy (Singapore) Pte Ltd was incorporated and domiciled in Singapore for future business expansion purpose in Singapore.
Founder Assets Sdn. Bhd. and Founder Assets (Thailand) Company Limited were incorporated and domiciled in Malaysia and Thailand respectively to carry out business in the investment of renewable energy project.
Founder Capital, LLC was incorporated and domiciled in State of Utah for the purpose of a private placement.
| 2 | MATERIAL ACCOUNTING POLICIES INFORMATION |
BASIS OF PREPARATION
The unaudited condensed consolidated financial statements have been prepared in accordance with International Accounting Standard 34 Interim Financial Reporting (“IAS 34”) as issued by the International Accounting Standards Board (“IASB”) and should be read in conjunction with the Group’s audited consolidated financial statements for the financial year ended 31 December 2025, which were prepared in accordance with International Financial Reporting Standards (“IFRSs”).
The unaudited condensed consolidated financial statements have been prepared on the historical cost basis, except as disclosed in the accounting policies below. The accounting policies and methods of computation applied in the preparation of these unaudited condensed consolidated financial statements are consistent with those applied in the Group’s audited consolidated financial statements for the financial year ended 31 December 2025.
NEW IFRS ADOPTED DURING THE FINANCIAL PERIOD
The significant accounting policies adopted by the Group in this interim financial report are consistent with those adopted in the audited financial statements of the Group for the financial year ended 31 December 2025 except for the adoption of the following new accounting standards, amendments and interpretation:
| Title | | Effective Date |
Amendments to IFRS 9 and IFRS 7 Admendments to the Classification and
Measurement of Financial Instruments | | 1 January 2026 |
| Annual Improvement to IFRS Accounting Standars – Volume 11 | | 1 January 2026 |
| Amendments to IFRS 9 and IFRS 7 Contracts Referencing Nature-dependent Electricity | | 1 January 2026 |
The adoption of the above amendments to IFRSs do not have a material impact on the financial statements of the Group.
NEW AND REVISED IFRS IN ISSUE BUT NOT YET EFFECTIVE
The Group has not applied in advance the following accounting standards and/or interpretations (including the consequential amendments, if any) that have been issued by the International Accounting Standards Board (IASB) but are not yet effective for the current financial period:
| IFRSs and/or IC Interpretations (Including The Consequential Amendments) | | Effective Date |
| IFRS 20 (Regulatory Assets and Regulatory Liabilities) | | 1 January 2029 |
| IFRS 19 (Subsidiaries without Public Accountability) | | 1 January 2027 |
| IFRS 18 (Presentation and Disclosure) | | 1 January 2027 |
FOUNDER GROUP LIMITED AND ITS SUBSIDIARIES
NOTES TO UNAUDITED INTERIM CONDENSED CONSOLIDATED FINANCIAL STATEMENTS
| 2 | MATERIAL ACCOUNTING POLICIES INFORMATION (cont.) |
BASIS OF CONSOLIDATION
The acquisition of entities, businesses or assets under common control are accounted for in accordance with merger accounting.
The consolidated financial statements incorporate the financial statements of the combined entities or businesses in which the common control combination occurs as if they had been combined from the date when the combining entities or businesses first came under the control of the controlling party.
The consolidated financial statements have prepared using uniform accounting policies for like transactions and other events in similar circumstances.
All intra-group balances, transactions, income and expenses are eliminated in full on combination and the combined financial statements reflect external transactions only. Unrealised gains and losses arising from intra-group transactions are also eliminated. Where necessary, adjustments are made to the financial statements of subsidiaries to ensure consistency with the accounting policies adopted by the Group.
The net assets of the combined entities or businesses are combined using the existing carrying amounts from the controlling party’s perspective. No amount is recognized in respect of goodwill or excess of the acquirer’s interest in the net fair value of acquiree’s identifiable assets, liabilities and contingent liabilities over the acquisition cost at the time of common control combination. All differences between the cost of acquisition (fair value of consideration paid) and the amounts at which the assets and liabilities are recorded, arising from common control combination, have been recognized directly in equity as part of the capital reserve.
The consolidated statements of profit or loss and other comprehensive income include the results of each of the combining entities or businesses from the earliest date presented or since the date when the combined entities or businesses first came under the common control, where this is a shorter period, regardless of the date of the common control combination.
Non-controlling interests comprise the portion of a subsidiary corporation’s net results of operations and its net assets, which is attributable to the interests that are not owned directly or indirectly by the equity holders of the Company. They are shown separately in the unaudited interim condensed consolidated statement of comprehensive income, statement of changes in equity, and statement of financial position. Total comprehensive income is attributed to the non-controlling interests based on the respective interests in a subsidiary, even if this results in the non-controlling interests having a deficit balance.
Investment in associates is accounted for in the consolidated financial statements of the Group using the equity method. An associate is an entity over which the Group has significant influence but does not have control or joint control. Significant influence is the power to participate in the financial and operating policy decisions of the investee but is not control or joint control over those policies.
The Group accounts for its investments in associates using the equity method. Under the equity method, the investment is initially recognised at cost and subsequently adjusted to recognise the Group’s share of the post-acquisition profits or losses and other comprehensive income of the associate. Dividends received or receivable from associates reduce the carrying amount of the investment.
CONVENIENCE TRANSLATION
Translations of amounts in the unaudited interim consolidated statement of financial position, unaudited interim consolidated statement of comprehensive income and unaudited interim consolidated statement of cash flows from RM into USD as of and for the period ended June 30, 2026 are solely for the convenience of the reader. Unless otherwise noted, all translations from RM into USD for the six months ended June 30, 2026 were calculated at the evening middle rate of USD1 = RM4.07750, as published by Bank Negara Malaysia, or an average rate of USD1 = RM3.98479.
FOUNDER GROUP LIMITED AND ITS SUBSIDIARIES
NOTES TO UNAUDITED INTERIM CONDENSED CONSOLIDATED FINANCIAL STATEMENTS
| 2 | MATERIAL ACCOUNTING POLICIES INFORMATION (cont.) |
FINANCIAL ASSETS
Classification and measurement
The Group classifies its financial assets at fair value through other comprehensive income, fair value through profit and loss and amortized cost.
The classification depends on the Group’s business model for managing the financial assets as well as the contractual terms of the cash flows of the financial assets.
| | 1. | Financial assets at FVTPL are initially recorded at fair value and transaction costs are expensed in the statement of income and comprehensive income. Realized and unrealized gains and income arising from changes in the fair value of the financial asset held at FVTPL are included in the statement of income and comprehensive income in the period in which they arise. |
| | 2. | Financial assets at FVTOCI are initially recognized at fair value plus transaction costs. Subsequently they are measured at fair value, with gains and losses arising from changes in fair value recognized in other comprehensive income. There is no subsequent reclassification of fair value gains and losses to profit or loss following the derecognition of the investment. There are no financial assets classified as FVTOCI. |
| | 3. | Financial assets at amortized cost are initially recognized at fair value, net of transaction costs, and subsequently carried at amortized cost less any impairment. They are classified as current assets or non- current assets based on their maturity date. The Company has classified trade receivables, contract assets, other receivables and amounts due from related parties at amortized cost. |
Impairment
The Company recognizes expected credit losses (“ECL”) for accounts receivable based on the simplified approach. The simplified approach to the recognition of expected losses does not require the Company to track the changes in credit risk; rather, the Company recognizes a loss allowance based on lifetime expected credit losses at each reporting date from the date of the account receivable.
The Company measures expected credit loss by considering the risk of default over the contract period and incorporates forward-looking information into its measurement. ECLs are a probability-weighted estimate of credit losses.
ECLs are measured as the difference in the present value of the contractual cash flows that are due to the Company under the contract, and the cash flows that the Company expects to receive. The Company assesses all information available, including past due status, and forward looking macro-economic factors in the measurement of the ECLs associated with its assets carried at amortized cost.
The maximum period considered when estimating ECLs is the maximum contractual period over which the Company is exposed to credit risk.
FOUNDER GROUP LIMITED AND ITS SUBSIDIARIES
NOTES TO UNAUDITED INTERIM CONDENSED CONSOLIDATED FINANCIAL STATEMENTS
| 2 | MATERIAL ACCOUNTING POLICIES INFORMATION (cont.) |
FINANCIAL LIABILITIES AND EQUITY INSTRUMENTS
Classification as debt or equity
Debt and equity instruments issued by the Group are classified as either financial liabilities or as equity in accordance with the substance of the contractual arrangements and the definitions of a financial liability and an equity instrument.
Equity instruments
An equity instrument is any contract that evidences a residual interest in the assets of an entity after deducting all of its liabilities. Equity instruments issued by the Group are recognised at the proceeds received, net of direct issue costs.
Financial liabilities
Except for derivative financial instruments which are stated at fair value through profit or loss (“FVTPL”), all other financial liabilities are subsequently measured at amortised cost using the effective interest method.
The effective interest method is a method of calculating the amortised cost of a financial liability and of allocating interest expense over the relevant period. The effective interest rate is the rate that exactly discounts estimated future cash payments (including all fees and points paid or received that form an integral part of the effective interest rate, transaction costs and other premiums or discounts) through the expected life of the financial liability, or (where appropriate) a shorter period, to the amortised cost of a financial liability.
Financial liabilities are classified as either financial liabilities at FVTPL or at amortized cost. The Company determines the classification of its financial liabilities at initial recognition.
Financial liabilities are classified as measured at amortized cost, net of transaction costs unless classified as FVTPL. The Company’s trade payables, other payables and accrued liabilities, amounts due to related parties, lease liabilities and bank loans are classified as measured at amortized cost.
The Group derecognises financial liabilities when, and only when, the Group’s obligations are discharged, cancelled or expired. The difference between the carrying amount of the financial liability derecognised and the consideration paid and payable, including any non-cash assets transferred or liabilities assumed, is recognised in profit or loss.
FOUNDER GROUP LIMITED AND ITS SUBSIDIARIES
NOTES TO UNAUDITED INTERIM CONDENSED CONSOLIDATED FINANCIAL STATEMENTS
| 2 | MATERIAL ACCOUNTING POLICIES INFORMATION (cont.) |
PLANT AND EQUIPMENT
Plant and equipment is recognized and subsequently measured at cost less accumulated depreciation and any accumulated impairment losses, if any. When components of property and equipment have different useful lives they are accounted for separately. Depreciation is provided at rates which are calculated to write off the assets over their estimated useful lives as follows:
| Computer and Software | | 4 years straight line |
| Motor Vehicles | | 5 years straight line |
| Office Equipment | | 4 years straight line |
| Equipment and Tools | | 5 years straight line |
| Solar Asset Plant | | 10 - 21 years straight line |
| Office Renovation | | 5 years straight line |
| Plant and Machinery | | 5 years straight line |
| Forklift | | 5 years straight line |
Assets under construction are not depreciated as these assets are not available for use.
Plant or equipment is derecognized upon disposal or when no future economic benefits are expected from its use. Any gain or loss arising from derecognition of the asset, being the difference between the net disposal proceeds and the carrying amount, is recognized in profit or loss.
INVENTORIES
Inventories are stated at the lower of cost and net realizable value. Cost is determined based on weighted average method and comprises the purchase price and incidentals incurred in bringing the inventories to their present location and condition.
Net realizable value represents the estimated selling price less the estimated costs of completion and the estimated costs necessary to make the sale.
IMPAIRMENT OF NON-FINANCIAL ASSETS
Impairment of assets are reviewed at the end of each reporting period for impairment when there is an indication that the assets might be impaired. Impairment is measured by comparing the carrying values of the assets with their recoverable amounts. When the carrying amount of an asset exceeds its recoverable amount, the asset is written down to its recoverable amount and an impairment loss shall be recognized. The recoverable amount of an asset is the higher of the asset’s fair value less costs to sell and its value in use, which is measured by reference to discounted future cash flows using a pre-tax discount rate that reflects current market assessments of the time value of money and the risks specific to the asset. An impairment loss is recognized in profit or loss.
When there is a change in the estimates used to determine the recoverable amount, a subsequent increase in the recoverable amount of an asset is treated as a reversal of the previous impairment loss and is recognized to the extent of the carrying amount of the asset that would have been determined (net of amortization and depreciation) had no impairment loss been recognized. The reversal is recognized in profit or loss immediately.
CONTRACT ASSETS AND LIABILITIES
Contract assets includes unbilled amounts resulting from performance obligation satisfied measured under input method. Contract assets are subsequently transferred to trade receivable upon satisfaction of billing milestone base on contract and entitlement to pay becomes unconditional. A contract asset is subject to impairment requirement of IFRS 9.
Contract liabilities include advance payments from customers that performance obligation yet to satisfied. A contract liabilities is stated at cost and represents the obligation of the Group to transfer goods or services to a customer for which consideration has been received (or the amount is due) from the customers.
FOUNDER GROUP LIMITED AND ITS SUBSIDIARIES
NOTES TO UNAUDITED INTERIM CONDENSED CONSOLIDATED FINANCIAL STATEMENTS
| 2 | MATERIAL ACCOUNTING POLICIES INFORMATION (cont.) |
LEASES
The Group assesses whether a contract is or contains a lease, at inception of the contract. The Group recognizes a right-of-use asset and corresponding lease liability with respect to all lease arrangements in which it is the lessee, except for low-value assets and short-term leases with 12 months or less. For these leases, the Group recognizes the lease payments as an operating expense on a straight-line method over the term of the lease unless another systematic basis is more representative of the time pattern in which economic benefits from the leased assets are consumed.
The Group recognizes a right-of-use asset and a lease liability at the lease commencement date. The right-of-use assets and the associated lease liabilities are presented as a separate line item in the statement of financial position.
The right-of-use asset is initially measured at cost. Cost includes the initial amount of the corresponding lease liability adjusted for any lease payments made at or before the commencement date, plus any initial direct costs incurred, less any incentives received.
The right-of-use asset is subsequently measured at cost less accumulated depreciation and any impairment losses, and adjustment for any remeasurement of the lease liability. The depreciation starts from the commencement date of the lease. If the lease transfers ownership of the underlying asset to the Group or the cost of the right-of-use asset reflects that the Group expects to exercise a purchase option, the related right-of-use asset is depreciated over the useful life of the underlying asset. Otherwise, the Group depreciates the right-of-use asset to the earlier of the end of the useful life of the right-of-use asset or the end of the lease term. The estimated useful lives of the right-of-use assets are determined on the same basis as those property, plant and equipment.
The lease liability is initially measured at the present value of the lease payments that are not paid at the commencement date, discounted by using the rate implicit in the lease. If this rate cannot be readily determined, the Group uses its incremental borrowing rate.
The lease liability is subsequently measured at amortised cost using the effective interest method. It is remeasured when there is a change in the future lease payments (other than lease modification that is not accounted for as a separate lease) with the corresponding adjustment is made to the carrying amount of the right-of-use asset, or is recognized in profit or loss if the carrying amount has been reduced to zero.
PROVISIONS
Provisions are recognized when the Group has a present obligation (legal or constructive) as a result of past events, when it is probable that an outflow of resources embodying economic benefits will be required to settle the obligation, and when a reliable estimate of the amount can be made. Provisions are reviewed at the end of each reporting period and adjusted to reflect the current best estimate. Where the effect of the time value of money is material, the provision is the present value of the estimated expenditure required to settle the obligation. The discount rate shall be a pre-tax rate that reflects current market assessments of the time value of money and the risks specific to the liability. The unwinding of the discount is recognized as interest expense in profit or loss.
REVENUE RECOGNITION
The Group accounts for its revenue under IFRS 15 Revenue from Contracts with Customers. (“IFRS 15”) The five-step model defined by IFRS 15 requires the Company to:
| | (1) | identify its contracts with customers; |
| | (2) | identify its performance obligations under those contracts; |
| | (3) | determine the transaction prices of those contracts; |
| | (4) | allocate the transaction prices to its performance obligations in those contracts; and |
| | (5) | recognise revenue when each performance obligation under those contracts is satisfied. Revenue recognized when promised goods and services are transferred to the client in an amount that reflects the consideration expected in exchange for those services. |
FOUNDER GROUP LIMITED AND ITS SUBSIDIARIES
NOTES TO UNAUDITED INTERIM CONDENSED CONSOLIDATED FINANCIAL STATEMENTS
| 2 | MATERIAL ACCOUNTING POLICIES INFORMATION (cont.) |
REVENUE RECOGNITION (cont.)
Our revenue agreements generally do not include a right of return in relation to the delivered goods or services. Depending on the terms of the agreement and the laws that apply to the agreement, control of the services may be transferred over time or at a point in time. Control of the services is transferred over time if our performance:
| | - | provides all of the benefits received and consumed simultaneously by the client; |
| | - | creates and enhances an asset that the client controls as the Group performs; or |
| | - | does not create an asset with an alternative use to the Group and the Group has an enforceable right to payment for performance complete to date. |
The Group recognises revenue from the following major sources:
| | (i) | Large-scale solar projects (“LSS”) |
LSS are utility scale solar PV power plants with installed generating capacity of 1 MWac or more. Large-scale solar projects are ground mounted and floating and are designed to supply power to the power grid. For the majority of our large-scale solar projects, we usually act as the contractor to the project awarder, who is the main contractor for a solar project. As an EPCC provider, we assume most of the responsibility for the entire project lifecycle, from design and engineering to material procurement, construction, installation, integration, and commissioning.
| | (ii) | Commercial and industrial (“C&I”) solar projects |
C&I projects are smaller scale solar projects where the solar PV systems are installed on rooftops and are designed to generate electricity for commercial and industrial properties for their own consumption, such as factories, warehouses and commercial stores. For C&I projects, we usually sign a service contract with the project owner and act as the main contractor. As the main contractor, we engage in comprehensive services encompassing project design, engineering, equipment procurement, construction, and commissioning.
Rendering of Services
Revenue from providing product and services related to renewable energy services industry is recognized over time in the year in which the services are rendered using input method, determined based on the proportion of costs incurred for work performed to date over the estimated total costs. Transaction price is computed based on the price specified in the contract and adjusted for any variable consideration such as incentives and penalties.
A receivable is recognized when the services are rendered as this is the point over time that the consideration is unconditional because only the passage of time is required before the payment is due. If the services rendered exceed the payment received, a contract asset is recognized. If the payments exceed the services rendered, a contract liability is recognized.
Billings are made with a credit term of 30 days to 90 days, which is consistent with market practice, therefore, no element of financing is deemed present. The Company become entitled to invoice customers for construction of solar PV power plants and systems based on achieving a series of performance-related milestones.
Defect liability period and performance warranty are usually 24 months from the date of Certificate of Practical Completion as provided in the contracts with customers.
FOUNDER GROUP LIMITED AND ITS SUBSIDIARIES
NOTES TO UNAUDITED INTERIM CONDENSED CONSOLIDATED FINANCIAL STATEMENTS
| 2 | MATERIAL ACCOUNTING POLICIES INFORMATION (cont.) |
REVENUE RECOGNITION (cont.)
Sale of Goods
Revenue is recognized at a point in time when the goods have been delivered to the customer and upon its acceptance, and it is probable that the Group will collect the considerations to which it would be entitled to in exchange for the goods sold. Billings are made with a credit term of 30 days to 90 days, which is consistent with market practice, therefore, no element of financing is deemed present.
The Company generally provides standard warranties to its customers, from date of delivery cost or satisfactory completion of the project. There is no warranty claim historically.
CASH AND CASH EQUIVALENTS
Cash and cash equivalents comprise cash in hand, bank balances, fixed deposits, demand deposits, and short-term, highly liquid investments that are readily convertible to known amounts of cash and which are subject to an insignificant risk of changes in value with original maturity periods of three months or less. For the purpose of the statement of cash flows, cash and cash equivalents are presented net of bank overdrafts.
SHARE CAPITAL
Ordinary shares are classified as equity. Incremental costs directly attributable to the issuance of new ordinary shares are deducted against the share capital account.
The Company’s ordinary shares are divided into two classes, Class A ordinary shares and Class B ordinary shares, both of which have no par value. The two classes rank pari passu in all respects, including with respect to dividends and distributions upon liquidation, and both are classified as equity; however, each Class B Share is entitled to 20 votes, whereas each Class A Share is entitled to one vote.
INCOME TAX
Current tax assets and liabilities are the expected amount of income tax recoverable or payable to the taxation authorities, measured using tax rates and tax laws that have been enacted or substantively enacted at the end of the reporting period and are recognized in profit or loss except to the extent that the tax relates to items recognized outside profit or loss (either in other comprehensive income or directly in equity).
Deferred taxes are recognized using the liability method for temporary differences other than those that arise from the initial recognition of an asset or liability in a transaction which is not a business combination and at the time of the transaction, affects neither accounting profit nor taxable profit.
Deferred tax assets and liabilities are measured at the tax rates that are expected to apply in the period when the asset is realized or the liability is settled, based on the period.
Deferred tax assets are recognized for all deductible temporary differences, unused tax losses and unused tax credits to the extent that it is probable that future taxable profits will be available against which the deductible temporary differences, unused tax losses and unused tax credits can be utilised. The carrying amounts of deferred tax assets are reviewed at the end of each reporting period and reduced to the extent that it is no longer probable that the related tax benefits will be realized.
Current and deferred tax items are recognized in correlation to the underlying transactions either in profit or loss, other comprehensive income or directly in equity.
Current tax assets and liabilities or deferred tax assets and liabilities are offset when there is a legally enforceable right to set off current tax assets against current tax liabilities and when the deferred taxes relate to the same taxable entity (or on different tax entities but they intend to settle current tax assets and liabilities on a net basis) and the same taxation authority.
FOUNDER GROUP LIMITED AND ITS SUBSIDIARIES
NOTES TO UNAUDITED INTERIM CONDENSED CONSOLIDATED FINANCIAL STATEMENTS
| 2 | MATERIAL ACCOUNTING POLICIES INFORMATION (cont.) |
FOREIGN CURRENCY TRANSACTIONS
The functional currency used by the Company is the Malaysia Ringgit. Consequently, operations in currencies other than the Malaysia Ringgit are considered to be denominated in foreign currency and are recorded at the exchange rates in force on the dates of the operations.
At year-end, monetary assets and liabilities denominated in foreign currency are converted by applying the exchange rate on the balance sheet date. The profits or losses revealed are charged directly to the profit and loss account for the year in which they occur. Non-monetary items in foreign currency measured in terms of historical cost are converted at the exchange rate on the date of the transaction.
The exchange differences of the monetary items that arise both when liquidating them and when converting them at the closing exchange rate, are recognized in the results of the year, except those that are part of the investment of a business abroad, which are recognized directly in equity net of taxes until the time of its disposal.
EARNINGS PER SHARE
Basic income per share is calculated by dividing the income attributable to ordinary shareholders by the weighted average number of ordinary shares outstanding in the period. For all periods presented, the income attributable to ordinary shareholders equals the reported income attributable to owners of the Company.
Diluted income per share is calculated by dividing net income attributable to ordinary shareholders as adjusted for the effect of dilutive potential ordinary shares outstanding during the period. Potential ordinary shares include ordinary shares issuable upon the exercise of outstanding share options by using the treasury stock method and ordinary shares issuable upon the conversion of convertible instruments using the if-converted method.
| 3 | CRITICAL ACCOUNTING JUDGEMENTS AND KEY SOURCES OF ESTIMATION UNCERTAINTY |
Management believes that there are no key assumptions made concerning the future, and other key sources of estimation uncertainty at the reporting date, that have a significant risk of causing a material adjustment to the carrying amounts of the assets and liabilities within the next financial year other than as disclosed below:-
Contract Revenue Recognition
Revenue from providing product and services related to renewable energy services industry is recognized over time measure via input method, determined based on the proportion of costs incurred for work performed to date over the estimated total costs. Transaction price is computed based on the price specified in the contract and adjusted for any variable consideration such as incentives and penalties. The Group applied judgement and assumptions significantly affects the determination of the amount and the timing of revenue recognized from contract with customers for commercial& industrial and large scale solar. The Group measures the performance of service work done by comparing the actual costs incurred with the estimated total costs required to complete the services. Significant judgements are required to estimate the total contract costs to complete. In making these estimate, management relied on estimates and also on past experience of completed projects. A change in estimate will directly affect the revenue to be recognized.
FOUNDER GROUP LIMITED AND ITS SUBSIDIARIES
NOTES TO UNAUDITED INTERIM CONDENSED CONSOLIDATED FINANCIAL STATEMENTS
| | | As of
December 31,
2025
(Audited) | | | Addition | | | Written off | | | Adjustment | | | As of
June 30,
2026
(Unaudited) | |
| At cost | | RM | | | RM | | | RM | | | RM | | | RM | |
| Computer and Software | | | 348,437 | | | | 13,913 | | | | (100,230 | ) | | | (164 | ) | | | 261,956 | |
| Motor Vehicles | | | 719,547 | | | | 371,134 | | | | — | | | | — | | | | 1,090,681 | |
| Office Equipment | | | 45,738 | | | | — | | | | — | | | | — | | | | 45,738 | |
| Equipment and Tools | | | 362,137 | | | | — | | | | — | | | | — | | | | 362,137 | |
| Office Renovation | | | 1,131,903 | | | | — | | | | — | | | | 24,870 | | | | 1,156,773 | |
| Solar Asset Under Construction | | | 353,385 | | | | 10,003,180 | | | | — | | | | 474,912 | | | | 10,831,477 | |
| Plant and Machinery & Solar Asset Plant | | | 22,194,248 | | | | — | | | | — | | | | — | | | | 22,194,248 | |
| Forklift | | | 45,800 | | | | — | | | | — | | | | — | | | | 45,800 | |
| Capital Work-in-progress | | | 495,642 | | | | 20,230 | | | | — | | | | (499,782 | ) | | | 16,090 | |
| | | | 25,696,837 | | | | 10,408,457 | | | | (100,230 | ) | | | (164 | ) | | | 36,004,900 | |
| | | As of
December 31,
2025
(Audited) | | | Depreciation
charge
during the
year | | | Written off | | | Adjustment | | | As of
June 30,
2026
(Unaudited) | |
| Accumulated depreciation | | RM | | | RM | | | RM | | | RM | | | RM | |
| Computer and Software | | | 214,061 | | | | 29,737 | | | | (81,360 | ) | | | (50 | ) | | | 162,388 | |
| Motor Vehicles | | | 175,362 | | | | 108,672 | | | | — | | | | — | | | | 284,034 | |
| Office Equipment | | | 36,885 | | | | 1,867 | | | | — | | | | — | | | | 38,752 | |
| Equipment and Tools | | | 63,785 | | | | 36,213 | | | | — | | | | — | | | | 99,998 | |
| Office Renovation | | | 321,624 | | | | 113,603 | | | | — | | | | — | | | | 435,227 | |
| Plant and Machinery & Solar Asset Plant | | | 2,831,737 | | | | 934,084 | | | | — | | | | — | | | | 3,765,821 | |
| Forklift | | | 41,080 | | | | 4,046 | | | | — | | | | — | | | | 45,126 | |
| | | | 3,684,534 | | | | 1,228,222 | | | | (81,360 | ) | | | (50 | ) | | | 4,831,346 | |
| | | As of
December 31,
2024
(Audited) | | | Addition | | | Adjustments | | | As of
December 31,
2025
(Audited) | |
| At cost | | RM | | | RM | | | RM | | | RM | |
| Computer and Software | | | 254,214 | | | | 94,223 | | | | — | | | | 348,437 | |
| Motor Vehicles | | | 369,547 | | | | 350,000 | | | | — | | | | 719,547 | |
| Office Equipment | | | 39,628 | | | | 6,110 | | | | — | | | | 45,738 | |
| Equipment and Tools | | | 59,389 | | | | 302,748 | | | | — | | | | 362,137 | |
| Office Renovation | | | 1,082,273 | | | | 49,630 | | | | — | | | | 1,131,903 | |
| Solar Asset Under Construction | | | 470,396 | | | | — | | | | (117,011 | ) | | | 353,385 | |
| Plant and Machinery & Solar Asset Plant | | | 25,486,353 | | | | — | | | | (3,292,105 | ) | | | 22,194,248 | |
| Forklift | | | 45,800 | | | | — | | | | — | | | | 45,800 | |
| Capital Work-in-progress | | | 171,720 | | | | 323,922 | | | | — | | | | 495,642 | |
| | | | 27,979,320 | | | | 1,126,633 | | | | (3,409,116 | ) | | | 25,696,837 | |
FOUNDER GROUP LIMITED AND ITS SUBSIDIARIES
NOTES TO UNAUDITED INTERIM CONDENSED CONSOLIDATED FINANCIAL STATEMENTS
| 4 | PLANT AND EQUIPMENT (cont.) |
| | | As of
December 31,
2024
(Audited) | | | Depreciation
charge
during the
year | | | Written off | | | As of
December 31,
2025
(Audited) | |
| Accumulated depreciation | | RM | | | RM | | | RM | | | RM | |
| Computer and Software | | | 148,905 | | | | 65,156 | | | | — | | | | 214,061 | |
| Motor Vehicles | | | 49,741 | | | | 125,621 | | | | — | | | | 175,362 | |
| Office Equipment | | | 30,879 | | | | 6,006 | | | | — | | | | 36,885 | |
| Equipment and Tools | | | 22,248 | | | | 41,537 | | | | — | | | | 63,785 | |
| Office Renovation | | | 101,419 | | | | 220,205 | | | | — | | | | 321,624 | |
| Plant and Machinery & Solar Asset Plant | | | 1,010,144 | | | | 1,821,593 | | | | — | | | | 2,831,737 | |
| Forklift | | | 32,989 | | | | 8,091 | | | | — | | | | 41,080 | |
| | | | 1,396,325 | | | | 2,288,209 | | | | — | | | | 3,684,534 | |
| | | As of
December 31,
2025
(Audited) | | | As of
June 30,
2026
(Unaudited) | | | As of
June 30,
2026
(Unaudited) | |
| Carrying amounts | | RM | | | RM | | | Convenience
Translation
USD | |
| Computer and Software | | | 134,376 | | | | 99,568 | | | | 24,419 | |
| Motor Vehicles | | | 544,185 | | | | 806,647 | | | | 197,829 | |
| Office Equipment | | | 8,853 | | | | 6,986 | | | | 1,713 | |
| Equipment and Tools | | | 298,352 | | | | 262,139 | | | | 64,289 | |
| Office Renovation | | | 810,279 | | | | 721,546 | | | | 176,958 | |
| Solar Asset Under Construction | | | 353,385 | | | | 10,831,477 | | | | 2,656,402 | |
| Plant and Machinery & Solar Asset Plant | | | 19,362,511 | | | | 18,428,427 | | | | 4,519,541 | |
| Forklift | | | 4,720 | | | | 674 | | | | 165 | |
| Capital Work-in-progress | | | 495,642 | | | | 16,090 | | | | 3,946 | |
| | | | 22,012,303 | | | | 31,173,554 | | | | 7,645,262 | |
| | | As of
December 31,
2025
(Audited) | | | As of
June 30,
2026
(Unaudited) | | | As of
June 30,
2026
(Unaudited) | |
| | | RM | | | RM | | | Convenience
Translation
USD | |
| Depreciation expenses, class under cost of sale | | | 1,715,714 | | | | 879,977 | | | | 215,813 | |
| Depreciation expenses, class separately from cost of sale | | | 572,495 | | | | 348,245 | | | | 85,406 | |
| Total depreciation expenses | | | 2,288,209 | | | | 1,228,222 | | | | 301,219 | |
FOUNDER GROUP LIMITED AND ITS SUBSIDIARIES
NOTES TO UNAUDITED INTERIM CONDENSED CONSOLIDATED FINANCIAL STATEMENTS
| 4 | PLANT AND EQUIPMENT (cont.) |
During the financial period, the Group made the following cash payments to purchase plant and equipment.
| | | As of
December 31,
2025
(Audited) | | | As of
June 30,
2026
(Unaudited) | | | As of
June 30,
2026
(Unaudited) | |
| | | RM | | | RM | | | Convenience
Translation
USD | |
| Purchase of plant and equipment | | | 1,126,633 | | | | 10,408,457 | | | | 2,552,657 | |
| Financed by hire purchase arrangements | | | (300,300 | ) | | | (334,000 | ) | | | (81,913 | ) |
| Cash payments on purchase of plant and equipment | | | 826,333 | | | | 10,074,457 | | | | 2,470,744 | |
The carrying amount of the plant and equipment of the Group under hire purchase arrangements at the end of the reporting period are as follows:
| | | As of
December 31,
2025
(Audited) | | | As of
June 30,
2026
(Unaudited) | | | As of
June 30,
2026
(Unaudited) | |
| | | RM | | | RM | | | Convenience
Translation
USD | |
| Motor vehicles | | | 524,510 | | | | 794,550 | | | | 194,862 | |
FOUNDER GROUP LIMITED AND ITS SUBSIDIARIES
NOTES TO UNAUDITED INTERIM CONDENSED CONSOLIDATED FINANCIAL STATEMENTS
| 5 | RIGHT-OF-USE ASSETS AND LEASE LIABILITIES |
| | | As of
December 31,
2025
(Audited) | | | As of
June 30,
2026 (Unaudited) | | | As of
June 30,
2026 (Unaudited) | |
| | RM | | | RM | | | Convenience
Translation
USD | |
| Right-of-use assets | | | | | | | | | |
| Balance brought forward | | | 739,244 | | | | 687,863 | | | | 168,697 | |
| Less: Amortization | | | (333,115 | ) | | | (154,818 | ) | | | (37,969 | ) |
| Termination of right-of-use asset | | | — | | | | — | | | | — | |
| Add: New lease recognized | | | 281,734 | | | | — | | | | — | |
| Balance carried forward | | | 687,863 | | | | 533,045 | | | | 130,728 | |
| | | | | | | | | | | | | |
| Lease liabilities | | | | | | | | | | | | |
| Balance brought forward | | | 747,819 | | | | 708,629 | | | | 173,789 | |
| Add: Imputed interest | | | 41,076 | | | | 12,974 | | | | 3,182 | |
| Less: Principal repayment | | | (362,000 | ) | | | (168,500 | ) | | | (41,324 | ) |
| Termination of lease liability | | | — | | | | — | | | | — | |
| Add: New lease recognized | | | 281,734 | | | | — | | | | — | |
| Balance carried forward | | | 708,629 | | | | 553,103 | | | | 135,647 | |
| | | | | | | | | | | | | |
| Future minimum lease payments together with the present value of net minimum lease payments are as follows: | | | | | | | | | | | | |
| | | | | | | | | | | | | |
| Minimum lease payment: | | | | | | | | | | | | |
| Not later than one (1) year | | | 462,000 | | | | 81,808 | | | | 20,063 | |
| Later than one (1) year and not later than five (5) years | | | 282,000 | | | | 471,295 | | | | 115,584 | |
| | | | 744,000 | | | | 553,103 | | | | 135,648 | |
| Less: Future interest charges | | | (35,371 | ) | | | — | | | | — | |
| Present value of lease payment | | | 708,629 | | | | 553,103 | | | | 135,647 | |
| | | | | | | | | | | | | |
| Repayment as follows: | | | | | | | | | | | | |
| Lease liabilities current portion | | | 431,946 | | | | 81,808 | | | | 20,063 | |
| Lease liabilities non-current portion | | | 276,683 | | | | 471,295 | | | | 115,584 | |
| | | | 708,629 | | | | 553,103 | | | | 135,647 | |
| | | | | | | | | | | | | |
| The followings are the amounts recognized in profit or loss: | | | | | | | | | | | | |
| Depreciation charges of right-of-use assets | | | 333,115 | | | | 154,818 | | | | 37,969 | |
| Interest expense on lease liabilities | | | 41,076 | | | | 12,974 | | | | 3,182 | |
| Expense relating to short-term leases and leases of low-value assets | | | 118,080 | | | | 76,443 | | | | 18,747 | |
| Total | | | 492,271 | | | | 244,235 | | | | 59,898 | |
On July 1, 2024, Founder Energy Sdn. Bhd. had entered into a Tenancy Agreement with Mr. Lee Seng Chi pertaining to the rental of our principal office for two years with option to renew for additional year with monthly rental amounted RM 26,000 (December 31, 2025: RM 26,000).
On August 13, 2025, Founder Energy Sdn. Bhd. had entered into Tenancy Agreements for the rental of our two satellite offices for a period of two years with an option to renew for an additional two years with monthly rental total amounted RM 12,500 (December 31, 2025: RM 12,500)
Extension options
The Group’s office leases include extension options of between one (1) and two (2) years, which are subject to mutual agreement between the Group and the respective lessors. Where practicable, the Group seeks to include extension options in new leases to provide operational flexibility. The Group assesses at lease commencement and reassessed when relevant, to determine whether it is reasonably certain that they will be exercised.
FOUNDER GROUP LIMITED AND ITS SUBSIDIARIES
NOTES TO UNAUDITED INTERIM CONDENSED CONSOLIDATED FINANCIAL STATEMENTS
| 6 | INVESTMENT IN AN ASSOCIATE |
| | | As of
December 31,
2025
(Audited) | | | As of
June 30,
2026
(Unaudited) | | | As of
June 30,
2026
(Unaudited) | |
| | | RM | | | RM | | | Convenience
Translation
USD | |
| Shares at cost | | | 1,916,650 | | | | 1,923,775 | | | | 471,802 | |
| Share of post-acquisition reserves | | | 7,125 | | | | 675,897 | | | | 165,763 | |
| | | | 1,923,775 | | | | 2,599,672 | | | | 637,565 | |
Details of associate is as follows:
| | | Percentage of effective ownership |
| | | June 30, |
| Name | | 2026 | | | 2025 | | | Place of
incorporation | | Principal activities |
| | | % | | | % | | | | | |
| RL Solar Assets Sdn. Bhd. (Formerly known as RL Sunseap Energy Sdn. Bhd.) | | | 49 | | | | — | | | Malaysia | | Renewable energy business |
The summarised financial information of the associate is as follows:
| | | As of
December 31,
2025
(Audited) | | | As of
June 30,
2026
(Unaudited) | | | As of
June 30,
2026
(Unaudited) | |
| | | RM | | | RM | | | Convenience
Translation
USD | |
| Carrying amount | | | 1,916,650 | | | | 1,923,775 | | | | 471,802 | |
| | | | | | | | | | | | | |
| Share of results: | | | | | | | | | | | | |
| Group’s share of profit from continuing operations | | | 7,125 | | | | 675,897 | | | | 165,763 | |
| Group’s share of total comprehensive income | | | 7,125 | | | | 675,897 | | | | 165,763 | |
On September 15, 2025, Founder Assets Sdn. Bhd. acquired 49% equity interest in RL Solar Assets Sdn. Bhd. for a total purchase consideration of RM 1,916,650. The investment is classified as an associate as the Group has significant influence over the financial and operating policy decisions of RL Solar Assets Sdn. Bhd.
FOUNDER GROUP LIMITED AND ITS SUBSIDIARIES
NOTES TO UNAUDITED INTERIM CONDENSED CONSOLIDATED FINANCIAL STATEMENTS
| 7 | INVESTMENT IN OTHER INVESTMENT |
| | | As of
December 31,
2025
(Audited) | | | As of
June 30,
2026
(Unaudited) | | | As of
June 30,
2026
(Unaudited) | |
| | | RM | | | RM | | | Convenience
Translation
USD | |
| Shares at cost | | | — | | | | 1,006,240 | | | | 246,779 | |
Details of other investment is as follows:
| | | Percentage of effective ownership |
| | | June 30, |
| Name | | 2026 | | | 2025 | | | Place of
incorporation | | Principal activities |
| | | % | | | % | | | | | |
| Nichcom Go Sdn Bhd | | | 19.90 | | | | — | | | Malaysia | | Electric vehicles charging facilities |
On 20 January, 2026, the Company invested in Nichcom Go Sdn Bhd, by way of acquiring 19.90% equity interest in Nichcom Go Sdn Bhd. Nichcom Go Sdn Bhd , primarily engages in providing services in relation to electric vehicles charging facilities.
| 8 | TRADE RECEIVABLES AND TRADE PAYABLES |
| | | As of
December 31,
2025
(Audited) | | | As of
June 30,
2026
(Unaudited) | | | As of
June 30,
2026
(Unaudited) | |
| | | RM | | | RM | | | Convenience
Translation
USD | |
| Trade receivables | | | | | | | | | |
| Non-current | | | | | | | | | |
| Project retention receivables | | | 1,508,742 | | | | 2,041,823 | | | | 500,754 | |
| | | | | | | | | | | | | |
| Current | | | | | | | | | | | | |
| Trade receivables | | | 19,340,447 | | | | 14,640,718 | | | | 3,590,611 | |
| Project retention receivables | | | 1,482,191 | | | | 949,497 | | | | 232,863 | |
| Accrued liquidated ascertained damages to sub-contractors | | | 831,373 | | | | 831,374 | | | | 203,893 | |
| Less: Provision for expected credit loss | | | (2,242,989 | ) | | | (2,242,989 | ) | | | (550,089 | ) |
| Total current trade receivables | | | 19,411,022 | | | | 14,178,600 | | | | 3,477,278 | |
| Total trade receivables | | | 20,919,764 | | | | 16,220,423 | | | | 3,978,032 | |
| | | | | | | | | | | | | |
| Increase in provision for expected credit loss | | | 1,662,564 | | | | — | | | | — | |
| Decrease in total trade receivables | | | (353,330 | ) | | | (4,699,341 | ) | | | (1,152,505 | ) |
Trade receivables are non-interest bearing and generally have 30 to 90 days (December 31, 2025: 30 to 90 days) payment terms. Other credit terms may be negotiated with customers on a case-by-case basis. Due to their comparatively short maturities, the carrying value of trade receivables approximate their fair value.
FOUNDER GROUP LIMITED AND ITS SUBSIDIARIES
NOTES TO UNAUDITED INTERIM CONDENSED CONSOLIDATED FINANCIAL STATEMENTS
| 8 | TRADE RECEIVABLES AND TRADE PAYABLES (cont.) |
The aging of the Group’s net trade receivables is as follows:
| | | Gross | | | Impaired | | | Total | |
| | | RM | | | RM | | | RM | | | Convenience
Translation
USD | |
| As of June 30, 2026 (Unaudited) | | | | | | | | | | | | |
| Current | | | 2,095,499 | | | | — | | | | 2,095,499 | | | | 513,918 | |
| | | | | | | | | | | | | | | | | |
| Past due | | | | | | | | | | | | | | | | |
| 1 – 30 days | | | 2,026,359 | | | | — | | | | 2,026,359 | | | | 496,961 | |
| 31 – 60 days | | | 1,273,331 | | | | — | | | | 1,273,331 | | | | 312,282 | |
| 61 – 90 days | | | 1,407,084 | | | | — | | | | 1,407,084 | | | | 345,085 | |
| More than 90 days | | | 7,838,445 | | | | (2,242,989 | ) | | | 5,595,456 | | | | 1,372,276 | |
| | | | 12,545,219 | | | | (2,242,989 | ) | | | 10,302,230 | | | | 2,526,604 | |
| | | | 14,640,718 | | | | (2,242,989 | ) | | | 12,397,729 | | | | 3,040,522 | |
| | | Gross | | | Impaired | | | Total | |
| | | RM | | | RM | | | RM | | | Convenience
Translation
USD | |
| As of December 31, 2025 (Audited) | | | | | | | | | | | | |
| Current | | | 8,212,169 | | | | (121,786 | ) | | | 8,090,383 | | | | 1,992,214 | |
| | | | | | | | | | | | | | | | | |
| Past due | | | | | | | | | | | | | | | | |
| 1 – 30 days | | | 2,526,465 | | | | (155,409 | ) | | | 2,371,056 | | | | 583,860 | |
| 31 – 60 days | | | 1,227,916 | | | | (835,839 | ) | | | 392,077 | | | | 96,547 | |
| 61 – 90 days | | | 1,279,896 | | | | (70,690 | ) | | | 1,209,206 | | | | 297,761 | |
| More than 90 days | | | 6,094,001 | | | | (1,059,265 | ) | | | 5,034,736 | | | | 1,239,778 | |
| | | | 11,128,278 | | | | (2,121,203 | ) | | | 9,007,075 | | | | 2,217,946 | |
| | | | 19,340,447 | | | | (2,242,989 | ) | | | 17,097,458 | | | | 4,210,160 | |
FOUNDER GROUP LIMITED AND ITS SUBSIDIARIES
NOTES TO UNAUDITED INTERIM CONDENSED CONSOLIDATED FINANCIAL STATEMENTS
| 8 | TRADE RECEIVABLES AND TRADE PAYABLES (cont.) |
The movements in the Group’s allowance for expected credit losses are as follows:
| | | ECL – not credit impaired | | | ECL –
credit impaired | | | Total | |
| | | RM | | | RM | | | RM | | | Convenience
Translation
USD | |
| Trade receivables | | | | | | | | | | | | |
| As of January 01, 2025 | | | 95,976 | | | | 484,449 | | | | 580,425 | | | | 129,689 | |
| Charge for the year | | | 369,790 | | | | 2,193,932 | | | | 2,563,722 | | | | 631,303 | |
| Reversal during the year | | | — | | | | (901,158 | ) | | | (901,158 | ) | | | (221,905 | ) |
| As of December 31, 2025 | | | 465,766 | | | | 1,777,223 | | | | 2,242,989 | | | | 552,324 | |
| As of January 01, 2026 | | | 465,766 | | | | 1,777,223 | | | | 2,242,989 | | | | 550,089 | |
| Charge for the year | | | — | | | | — | | | | — | | | | — | |
| Reversal during the year | | | — | | | | — | | | | — | | | | — | |
| As of June 30, 2026 | | | 465,766 | | | | 1,777,223 | | | | 2,242,989 | | | | 550,089 | |
| | | As of
December 31,
2025
(Audited) | | | As of
June 30,
2026
(Unaudited) | | | As of
June 30,
2026
(Unaudited) | |
| | | RM | | | RM | | | Convenience
Translation
USD | |
| Trade payables | | | | | | | | | |
| Trade payables | | | 15,213,238 | | | | 30,724,094 | | | | 7,535,032 | |
| Project retention payables | | | 3,102,022 | | | | 3,512,200 | | | | 861,361 | |
| Total trade payables | | | 18,315,260 | | | | 34,236,294 | | | | 8,396,393 | |
| | | | | | | | | | | | | |
| (Decrease)/Increase in total trade payables | | | (9,081,554 | ) | | | 15,921,034 | | | | 3,904,607 | |
Included in trade payables is related party balance amounting to RM62,875 (December 31, 2025: Nil).
Trade payables are non-interest bearing and generally on cash basis or credit terms of 7 days to 90 days (December 31, 2025: 7 to 90 days). Other credit terms may be negotiated with suppliers on a case-by-case basis.
FOUNDER GROUP LIMITED AND ITS SUBSIDIARIES
NOTES TO UNAUDITED INTERIM CONDENSED CONSOLIDATED FINANCIAL STATEMENTS
| 9 | DEFERRED TAX ASSET AND INCOME TAX (EXPENSE)/BENEFIT |
| | | For the six months ended | |
| | | June 30,
2025 | | | June 30,
2026 | | | June 30,
2026 | |
| | | RM | | | RM | | | Convenience
Translation
USD | |
| Income tax expense | | | | | | | | | |
| Tax expense recognized in profit or loss | | | | | | | | | |
| Current income tax | | | | | | | | | |
| Current financial year | | | 610,581 | | | | 315,266 | | | | 77,319 | |
| Prior financial year | | | 73,304 | | | | — | | | | — | |
| | | | | | | | | | | | | |
| Deferred taxation | | | | | | | | | | | | |
| Current financial year | | | (932,747 | ) | | | — | | | | — | |
| Prior financial year | | | 397,530 | | | | — | | | | — | |
| Total income tax expense recognized in profit or loss | | | 148,668 | | | | 315,266 | | | | 77,319 | |
British Virgin Islands
The Company is incorporated in the British Virgin Islands and is not subject to tax on income or capital gains under current British Virgin Islands law.
Malaysia
Founder Energy Sdn. Bhd., Founder Assets Sdn. Bhd. and Founder Solar Solution Sdn. Bhd. are subject to Malaysia Corporate Tax on the taxable income as reported in its statutory financial statements adjusted in accordance with relevant Malaysia tax laws. The standard corporate income tax rate in Malaysia is calculated at 24% of the estimated assessable profits for the financial year.
The unutilized tax losses can be carried forward for a maximum period of ten consecutive years to offset future taxable income.
Singapore
Founder Energy (Singapore) Pte Ltd is subject to Singapore Corporate Tax on the taxable income as reported in its statutory financial statements adjusted in accordance with relevant Singapore tax laws. The standard corporate income tax rate in Singapore is 17%.
Thailand
Founder Assets (Thailand) Company Limited is subject to Thailand Corporate Tax on the taxable income as reported in its statutory financial statements adjusted in accordance with relevant Thailand tax laws. The standard corporate income tax rate in Thailand is 20%.
Utah
Founder Capital, LLC has not elected to be treated as a corporation for U.S. federal income tax purposes and is therefore classified as a disregarded entity. Accordingly, its income and expenses are generally treated as those of its sole foreign parent, Founder Group Limited, for U.S. federal income tax purposes.
Management has assessed the potential U.S. and Utah income tax implications arising from the activities of Founder Capital, LLC, including whether the Group has established a U.S. trade or business, generated effectively connected income or established a taxable presence in Utah. Based on management’s assessment of the relevant facts and circumstances and applicable tax regulations, management has concluded that activities of Founder Capital, LLC are limited to facilitating the Group’s private placement, that the Group does not have a U.S. trade or business or income effectively connected with one, and that no U.S. federal or Utah income tax liability arises for the period.
Management will continue to monitor the Group’s U.S. activities and reassess its tax position if there are changes in the relevant facts, circumstances or applicable tax regulations.
FOUNDER GROUP LIMITED AND ITS SUBSIDIARIES
NOTES TO UNAUDITED INTERIM CONDENSED CONSOLIDATED FINANCIAL STATEMENTS
| 9 | DEFERRED TAX ASSET AND INCOME TAX (EXPENSE)/BENEFIT (cont.) |
The numerical reconciliations between the tax expense and the product of accounting loss multiplied by the applicable tax rates of the Group are as follows:
| | | For the six months ended | |
| | | June 30,
2025 | | | June 30,
2026 | | | June 30,
2026 | |
| | | RM | | | RM | | | Convenience
Translation
USD | |
| Net (loss)/profit before taxes | | | (1,780,930 | ) | | | 1,107,051 | | | | 271,503 | |
| | | | | | | | | | | | | |
| Tax at the Malaysian statutory income tax rate of 24% | | | (427,423 | ) | | | 265,693 | | | | 65,161 | |
| | | | | | | | | | | | | |
| Tax effects in respect of: | | | | | | | | | | | | |
| Different tax rates in other countries | | | 554,889 | | | | 140,680 | | | | 34,502 | |
| Deferred tax not recognized on previously unrecognized origination and reversal of temporary differences | | | (740,027 | ) | | | 71,108 | | | | 17,439 | |
| Adjustment in respect of current income tax of prior years | | | 73,304 | | | | — | | | | — | |
| Adjustment in respect of deferred tax of prior years | | | 397,530 | | | | — | | | | — | |
| Non-deductible expenses | | | 410,137 | | | | — | | | | — | |
| Non-taxable income | | | (119,742 | ) | | | (162,215 | ) | | | (39,783 | ) |
| Tax expense | | | 148,668 | | | | 315,266 | | | | 77,319 | |
The deferred tax assets are made up of the following:
| | | As of
December 31,
2025
(Audited) | | | As of
June 30,
2026
(Unaudited) | | | As of
June 30,
2026
(Unaudited) | |
| | | RM | | | RM | | | Convenience
Translation
USD | |
| At beginning of year/period | | | 74,000 | | | | 175,810 | | | | 43,117 | |
| Recognised in profit or loss | | | 101,810 | | | | — | | | | — | |
| At end of year/period | | | 175,810 | | | | 175,810 | | | | 43,117 | |
FOUNDER GROUP LIMITED AND ITS SUBSIDIARIES
NOTES TO UNAUDITED INTERIM CONDENSED CONSOLIDATED FINANCIAL STATEMENTS
| 9 | DEFERRED TAX ASSET AND INCOME TAX EXPENSE (cont.) |
Presented after appropriate offsetting as follows:
| | | As of
December 31,
2025
(Audited) | | | As of
June 30,
2026
(Unaudited) | | | As of
June 30,
2026
(Unaudited) | |
| | | RM | | | RM | | | Convenience
Translation
USD | |
| Deferred tax asset | | | 175,810 | | | | 175,810 | | | | 43,117 | |
The deferred tax asset as at the end of the reporting period are made up of the temporary differences arising from:
| | | As of
December 31,
2025
(Audited) | | | As of
June 30,
2026
(Unaudited) | | | As of
June 30,
2026
(Unaudited) | |
| | | RM | | | RM | | | Convenience
Translation
USD | |
| Deferred tax asset | | | | | | | | | |
| Unabsorbed capital allowance | | | 5,112,349 | | | | 5,112,349 | | | | 1,253,795 | |
| | | | | | | | | | | | | |
| Deferred tax liability | | | | | | | | | | | | |
| Plant and equipment | | | (4,379,810 | ) | | | (4,379,810 | ) | | | (1,074,141 | ) |
| Presented after appropriate offsetting | | | 732,539 | | | | 732,539 | | | | 179,654 | |
| | | | | | | | | | | | | |
| At 24% | | | 175,810 | | | | 175,810 | | | | 43,117 | |
FOUNDER GROUP LIMITED AND ITS SUBSIDIARIES
NOTES TO UNAUDITED INTERIM CONDENSED CONSOLIDATED FINANCIAL STATEMENTS
| | | As of
December 31,
2025
(Audited) | | | As of
June 30,
2026
(Unaudited) | | | As of
June 30,
2026
(Unaudited) | |
| | | RM | | | RM | | | Convenience
Translation
USD | |
| Inventories | | | 2,457,916 | | | | 1,874,932 | | | | 459,824 | |
The amount of inventories recognized as an expense in cost of sales of the Group was RM 74,372,301 (USD 18,239,682) (June 30, 2025: RM 49,602,598).
| 11 | CONTRACT ASSETS AND CONTRACT LIABILITIES |
| | | As of
December 31,
2025
(Audited) | | | As of
June 30,
2026
(Unaudited) | | | As of
June 30,
2026
(Unaudited) | |
| | | RM | | | RM | | | Convenience
Translation
USD | |
| Contract Assets | | | | | | | | | |
| Contract cost | | | 285,872,146 | | | | 340,581,147 | | | | 83,526,952 | |
| Contract margin | | | 41,836,852 | | | | 44,237,939 | | | | 10,849,280 | |
| Contract revenue recognized | | | 327,708,998 | | | | 384,819,086 | | | | 94,376,232 | |
| Less: Bill to trade receivables | | | (286,591,376 | ) | | | (297,775,569 | ) | | | (73,028,956 | ) |
| Contract assets carried forward | | | 41,117,622 | | | | 87,043,517 | | | | 21,347,276 | |
| Add: Accrued revenue | | | 322,413 | | | | 305,903 | | | | 75,022 | |
| Balance carried forward | | | 41,440,035 | | | | 87,349,420 | | | | 21,422,298 | |
| | | | | | | | | | | | | |
| Increase in contract assets | | | (8,892,446 | ) | | | (45,909,385 | ) | | | (11,259,199 | ) |
| Increase in provision for impairment loss | | | 2,668,908 | | | | — | | | | — | |
Significant increase in contract assets for the period ended June 30, 2026 primarily due to a increase in unbilled revenue related to the satisfaction of performance obligation in excess of amounts billed to customers.
| 12 | OTHER RECEIVABLES AND PREPAYMENT AND OTHER PAYABLES AND ACCRUED LIABILITIES |
| | | As of
December 31,
2025
(Audited) | | | As of
June 30,
2026
(Unaudited) | | | As of
June 30,
2026
(Unaudited) | |
| | | RM | | | RM | | | Convenience
Translation
USD | |
| Other Receivables | | | | | | | | | |
| Project deposits | | | 1,476,069 | | | | 3,051,362 | | | | 748,341 | |
| Prepayment to suppliers | | | 13,289,633 | | | | 35,567,406 | | | | 8,722,846 | |
| Other receivables | | | 60,108 | | | | — | | | | — | |
| Other deposits | | | 158,271 | | | | — | | | | — | |
| Other prepayments | | | 2,445,802 | | | | 1,745,119 | | | | 427,987 | |
| Other current assets | | | 711 | | | | 713 | | | | 176 | |
| | | | 17,430,594 | | | | 40,364,600 | | | | 9,899,350 | |
FOUNDER GROUP LIMITED AND ITS SUBSIDIARIES
NOTES TO UNAUDITED INTERIM CONDENSED CONSOLIDATED FINANCIAL STATEMENTS
| 12 | OTHER RECEIVABLES AND PREPAYMENT AND OTHER PAYABLES AND ACCRUED LIABILITIES (cont.) |
Included in the other current assets of the Group are commitment fee and deferred transaction costs of attributable to the convertible securities payable.
| | | As of
December 31,
2025
(Audited) | | | As of
June 30,
2026
(Unaudited) | | | As of
June 30,
2026
(Unaudited) | |
| | | RM | | | RM | | | Convenience
Translation
USD | |
| Other Payables | | | | | | | | | |
| Accrued staff cost | | | 464,136 | | | | 513,488 | | | | 125,932 | |
| Other payables and accrued expenses | | | 6,406,695 | | | | 3,572,558 | | | | 876,164 | |
| Prepayment from customer | | | 2,080,632 | | | | 13,385,348 | | | | 3,282,734 | |
| | | | 8,951,463 | | | | 17,471,394 | | | | 4,284,830 | |
| 13 | AMOUNT DUE FROM/(TO) RELATED PARTIES |
| | | As of
December 31,
2025
(Audited) | | | As of
June 30,
2026 (Unaudited) | | | As of
June 30,
2026 (Unaudited) | |
| | | RM | | | RM | | | Convenience
Translation
USD | |
| Trade | | | | | | | | | |
| Amount due from Solar Bina Engineering Sdn. Bhd. | | | 24,727 | | | | — | | | | — | |
| Amount due from RL Solar Assets Sdn. Bhd. | | | — | | | | 1,181,436 | | | | 289,745 | |
| Amount due from Reservoir Link Renewable Sdn. Bhd. | | | 1,108,818 | | | | 1,908,621 | | | | 468,087 | |
| Amount due from RL Sigma Engineering Sdn. Bhd. | | | 697,677 | | | | 697,677 | | | | 171,104 | |
| | | | 1,831,222 | | | | 3,787,734 | | | | 928,936 | |
| Non-trade | | | | | | | | | | | | |
| Amount due from Solar Bina Engineering Sdn. Bhd. | | | 100,000 | | | | — | | | | — | |
| Amount due from Reservoir Link Energy Bhd. | | | 217,995 | | | | 433,138 | | | | 106,226 | |
| Amount due from RL Solar Assets Sdn. Bhd. | | | 308,165 | | | | 308,165 | | | | 75,577 | |
| | | | 626,160 | | | | 741,303 | | | | 181,803 | |
| | | | | | | | | | | | | |
| Amount due from related parties | | | 2,457,382 | | | | 4,529,037 | | | | 1,110,739 | |
| | | | | | | | | | | | | |
| Non-trade | | | | | | | | | | | | |
| Amount due to Reservoir Link Energy Bhd. | | | 1,830,787 | | | | — | | | | — | |
| Amount due to Reservoir Link Sdn. Bhd. | | | 258,804 | | | | 258,804 | | | | 63,471 | |
| Amount due to Solar Bina Engineering Sdn. Bhd. | | | 1,500,000 | | | | — | | | | — | |
| Amount due to Reservoir Link Renewable Sdn. Bhd. | | | — | | | | 54,613 | | | | 13,394 | |
| Amount due to Mr. Lee Seng Chi | | | 312,004 | | | | 156,008 | | | | 38,261 | |
| Amount due to related parties | | | 3,901,595 | | | | 469,425 | | | | 115,126 | |
Both amount due to and from related parties is repayable on demand. Other than amount due to and from related parties that is trade nature, amount due to and from related parties is subject to interest rate of BLR + 1.5% per annum.
FOUNDER GROUP LIMITED AND ITS SUBSIDIARIES
NOTES TO UNAUDITED INTERIM CONDENSED CONSOLIDATED FINANCIAL STATEMENTS
| 13 | AMOUNT DUE FROM/(TO) RELATED PARTIES (cont.) |
Material Transactions with Related Parties
| Name of Related Party | | Relationship to Us |
| Solar Bina Engineering Sdn. Bhd. | | An entity where Chief Executive Officer and Director Mr. Lee Seng Chi is a common director. |
| Reservoir Link Energy Bhd. | | Our largest shareholder. |
| Reservoir Link Holdings Sdn. Bhd. | | A corporate shareholder of Reservoir Link Energy Bhd. |
| Reservoir Link Sdn. Bhd. | | An entity controlled by Reservoir Link Energy Bhd. |
| Reservoir Link Renewable Sdn. Bhd. | | An entity controlled by Reservoir Link Energy Bhd. |
| RL Sigma Engineering Sdn. Bhd. | | An entity controlled by Reservoir Link Energy Bhd. |
| Lee Seng Chi | | Our Chief Executive Officer and Director |
| RL Solar Assets Sdn Bhd (formerly known as RL Sunseap Energy Sdn. Bhd.) | | Related company with Reservoir Link Energy Bhd. and joint venture with Founder Assets Sdn Bhd |
| SRM Utama Selambau Sdn. Bhd. | | An entity controlled by Reservoir Link Energy Bhd. |
| | | For the six months ended | |
| | | June 30,
2025 | | | June 30,
2026 | | | June 30,
2026 | |
| | | RM | | | RM | | | Convenience
Translation
USD | |
| Revenue from RL Solar Assets Sdn. Bhd. | | | 4,360,439 | | | | 753,841 | | | | 184,878 | |
| Revenue from Reservoir Link Renewable Sdn. Bhd. | | | 7,368,513 | | | | 8,130,348 | | | | 1,993,954 | |
| Revenue from RL Sigma Engineering Sdn. Bhd. | | | 2,940,468 | | | | — | | | | — | |
| Revenue from SRM Utama Selambau Sdn. Bhd. | | | — | | | | 26,828,939 | | | | 6,579,752 | |
| Total revenue from related parties | | | 14,669,420 | | | | 35,713,128 | | | | 8,758,584 | |
| | | | | | | | | | | | | |
| Purchases from Reservoir Link Renewable Sdn. Bhd. | | | 386,972 | | | | 430,333 | | | | 105,538 | |
| | | | | | | | | | | | | |
| Expenses charged by Reservoir Link Energy Bhd. | | | 216,352 | | | | — | | | | — | |
| | | | | | | | | | | | | |
| Rental payment to Mr. Lee Seng Chi | | | 156,000 | | | | 156,000 | | | | 38,259 | |
| | | | | | | | | | | | | |
| Finance cost charged by Reservoir Link Energy Bhd. | | | 59,223 | | | | 6,862 | | | | 1,683 | |
| | | | | | | | | | | | | |
| Advances to Solar Bina Engineering Sdn. Bhd. | | | 1,500,000 | | | | 1,004,490 | | | | 246,349 | |
The related party transactions mainly derived from the sales of renewable energy services, recharge of expenses, rental expenses, interest expenses on advances, management fees and advances.
The significant related party transactions with RL Solar Assets Sdn. Bhd. and Reservoir Link Renewable Sdn. Bhd. were attributable to several contracts secured through these entities as solar assets investors. The Group was appointed as the contractor to provide engineering, procurement, construction and commissioning works for rooftop solar photovoltaic facilities.
The consultancy fees related to project management services provided by Reservoir Link Renewable Sdn. Bhd. for commercial and industrial projects. In addition, rental payments of RM26,000 per month are payable to Mr. Lee Seng Chi for the lease of the Company’s principal office.
The significant related party transactions charged by Reservoir Link Energy Bhd. include one-off expense reimbursement related to the Initial Public Offering exercise and the interest expenses and management fees are costs incurred or shared on behalf of the Group and interest expense on funds advanced to the Group.
Advances were provided to Solar Bina Engineering Sdn. Bhd. for its short-term working capital needs, which are expected to be settled in due course.
FOUNDER GROUP LIMITED AND ITS SUBSIDIARIES
NOTES TO UNAUDITED INTERIM CONDENSED CONSOLIDATED FINANCIAL STATEMENTS
| 14 | CONVERTIBLE SECURITIES PAYABLE |
The amount of convertible securities payable consists of the followings:
| | | As of
December 31,
2025
(Audited) | | | As of
June 30,
2026
(Unaudited) | | | As of
June 30,
2026
(Unaudited) | |
| | | RM | | | RM | | | Convenience
Translation
USD | |
| At beginning of year/period | | | — | | | | 64,170,406 | | | | 15,737,684 | |
| Addition | | | 84,895,915 | | | | 424,734 | | | | 104,165 | |
| Interest expenses | | | — | | | | — | | | | — | |
| Conversion | | | (20,725,509 | ) | | | (11,775,310 | ) | | | (2,887,875 | ) |
| At end of year/period | | | 64,170,406 | | | | 52,819,830 | | | | 12,953,974 | |
Securities Purchase Agreement with Avondale Capital, LLC
On April 22, 2025, the Company entered into a Securities Purchase Agreement with Avondale Capital, LLC, a Utah limited liability company (“Avondale”), pursuant to which the Company issue and sell to the Avondale an aggregate amount of up to USD10,000,000, representing the Company’s Class A Shares.
On April 24, 2025, the Company received net proceeds of USD 1,250,000 from the initial Pre-Paid Purchase with a principal amount of USD 1,357,500, after deduction of USD 87,500 original issue discount and USD 20,000 for Avondale’s transaction costs.
During the year ended December 31, 2025, the Company received net proceeds of USD 4,250,000 from the Pre-Paid Purchase #2 to Pre-Paid Purchase #6, after deduction of USD 297,500 original issue discount.
On May 30, 2025, the Company delivered 1,750,000 shares of ordinary shares as a commitment fee. The Company has the right to repurchase these pre-delivery shares at USD 0.0001 per share.
During the year ended December 31, 2025, Avondale purchased 13,618,411 Class A Shares, at par value, in exchange for USD 5,103,548 with exchange prices ranging from USD 0.2707 to USD 0.9310 pursuant to purchase notices related to Pre-Paid Purchase #1 to Pre-Paid Purchase #6.
Purchase Agreement with Streeterville Capital, LLC
On December 11, 2025, the Company entered into a Purchase Agreement with Streeterville Capital, LLC (“Streeterville”), pursuant to which the Company issue and sell to the Streeterville convertible promissory note (the “Note”), in the original principal amount of USD 16,070,000, which included an original issue discount of USD 1,050,000 and transaction expenses amount of USD 20,000. The Note is convertible into the Company’s Class A Shares.
On December 16, 2025, Streeterville paid USD 3,000,000 to the Company and USD 12,000,000 into a deposit account of the Company’s subsidiary, Founder Capital, LLC and entered into a Deposit Account Control Agreement with Streeterville and a banking corporation, to secure the Note.
On June 30, 2026, the Company and Streeterville Capital agreed to (i) partition a new secured convertible promissory note (the “Partitioned Note”) in the original principal amount of US$8,000,000 (the “Partitioned Amount”) from that certain secured convertible promissory note (the “Original Note”) in the original principal amount of US$16,070,000 that was issued to Streeterville Capital on December 11, 2025 pursuant to that certain securities purchase agreement dated as of December 11, 2025 with the outstanding balance of the Original Note to be reduced by the Partitioned Amount, and (ii) exchange the Partitioned Note for a new secured non-convertible promissory note (the “Exchange Note”) in the original principal amount of US$8,000,000.
FOUNDER GROUP LIMITED AND ITS SUBSIDIARIES
NOTES TO UNAUDITED INTERIM CONDENSED CONSOLIDATED FINANCIAL STATEMENTS
| | | Note | | As of
December 31,
2025
(Audited) | | | As of
June 30,
2026
(Unaudited) | | | As of
June 30,
2026
(Unaudited) | |
| | | | | RM | | | RM | | | Convenience
Translation
USD | |
| Non-current liabilities | | | | | | | | | | | |
| Hire purchase payables | | | | | 234,939 | | | | 415,513 | | | | 101,904 | |
| Term loan | | | | | 17,479,103 | | | | 22,952,462 | | | | 5,629,052 | |
| | | | | | 17,714,042 | | | | 23,367,975 | | | | 5,730,956 | |
| | | | | | | | | | | | | | | |
| Current liabilities | | | | | | | | | | | | | | |
| Bank overdraft | | | | | 738,410 | | | | — | | | | — | |
| Hire purchase payables | | | | | 181,549 | | | | 228,396 | | | | 56,014 | |
| Term loan | | | | | 1,032,035 | | | | 3,296,800 | | | | 808,536 | |
| Trade financing | | | | | 43,674,831 | | | | 83,393,521 | | | | 20,452,120 | |
| | | | | | 45,626,825 | | | | 86,918,717 | | | | 21,316,670 | |
| | | | | | | | | | | | | | | |
| Total borrowings | | | | | | | | | | | | | | |
| Bank overdraft | | (a) | | | 738,410 | | | | — | | | | — | |
| Hire purchase payables | | (b) | | | 416,488 | | | | 643,909 | | | | 157,918 | |
| Term loan | | (a) | | | 18,511,138 | | | | 26,249,262 | | | | 6,437,588 | |
| Trade financing | | (a) | | | 43,674,831 | | | | 83,393,521 | | | | 20,452,120 | |
| | | | | | 63,340,867 | | | | 110,286,692 | | | | 27,047,626 | |
(a) The following table sets out the carrying amount of the borrowings:
| | | Capacity | | | As of
December 31,
2025
(Audited) | | | As of
June 30,
2026
(Unaudited) | | | As of
June 30,
2026
(Unaudited) | |
| | | RM | | | RM | | | RM | | | Convenience
Translation
USD | |
| Line of Credit | | | | | | | | | | | | |
| AmBank Islamic Bank – Domestic Recourse Factoring, at Base Financing Rate – 1% | | | 10,000,000 | | | | 6,686,298 | | | | 9,202,054 | | | | 2,256,788 | |
| AmBank Islamic Bank – Invoice Financing, at Base Financing Rate | | | 96,000,000 | | | | 24,073,870 | | | | 60,858,371 | | | | 14,925,413 | |
| AmBank Islamic Bank – Overdraft, Base Financing Rate +1.0% | | | 1,000,000 | | | | 364,167 | | | | — | | | | — | |
| CIMB Islamic Bank – Invoice Financing, at Cost of Funds + 1.5% | | | 10,000,000 | | | | 7,980,612 | | | | 9,960,691 | | | | 2,442,843 | |
| CIMB Islamic Bank – Overdraft, at Base Financing Rate +0.5% | | | 500,000 | | | | 374,243 | | | | — | | | | — | |
| Maybank Islamic Bank – Invoice Financing, at Cost of Funds + 1.5% | | | 5,000,000 | | | | 4,934,051 | | | | 3,372,406 | | | | 827,077 | |
| AmBank Islamic Bank – Term Financing, at Base Financing Rate – 1% | | | 1,000,000 | | | | 778,060 | | | | 733,815 | | | | 179,967 | |
| AmBank Islamic Bank – Term Financing, at Base Financing Rate – 1% | | | 3,000,000 | | | | — | | | | 2,963,417 | | | | 726,773 | |
| CIMB Islamic Bank – Term Financing, at Effective Rate 6.6% | | | 500,000 | | | | — | | | | 464,030 | | | | 113,803 | |
| AmBank Islamic Bank – Term Financing, at Base Financing Rate – 1.75% | | | 14,900,000 | | | | 1,150,531 | | | | 5,358,678 | | | | 1,314,207 | |
| AmBank Islamic Bank – Term Financing, at Base Financing Rate – 0.75% | | | 16,100,000 | | | | 16,582,547 | | | | 16,090,573 | | | | 3,946,186 | |
| AmBank Islamic Bank – Term Financing, at Base Financing Rate – 1.75% | | | 200,000 | | | | — | | | | 165,715 | | | | 40,641 | |
| AmBank Islamic Bank – Term Financing, at Base Financing Rate – 0.75% | | | 500,000 | | | | — | | | | 473,033 | | | | 116,010 | |
| | | | 158,700,000 | | | | 62,924,379 | | | | 109,642,783 | | | | 26,889,708 | |
FOUNDER GROUP LIMITED AND ITS SUBSIDIARIES
NOTES TO UNAUDITED INTERIM CONDENSED CONSOLIDATED FINANCIAL STATEMENTS
The Group entered into banking facilities with AmBank Islamic Bank and is secured by:
| | i) | Corporate guarantee from the Group; |
| | ii) | Fixed deposits pledged by Founder Energy Sdn. Bhd.; |
| | iii) | First legal charge over the escrow account, debt reserve account and sinking fund account; and |
| | iv) | Insurance policy for the Directors of the Group. |
The Group entered into a banking facility with Maybank Islamic Bank and is secured by:
| | i) | Corporate guarantee from the Group; and |
| | ii) | Fixed deposits pledged by Founder Energy Sdn. Bhd.. |
| | | |
| | iii) | Sinking fund pledged by Founder Energy Sdn. Bhd. |
The Group entered into a banking facility with CIMB Islamic Bank and is secured by:
| | i) | Corporate guarantee from the Group; |
| | ii) | Fixed deposits pledged by Founder Energy Sdn. Bhd.; and |
| | iii) | Sinking fund account. |
(b) Hire purchase payable
| | | As of
December 31,
2025
(Audited) | | | As of
June 30,
2026 (Unaudited) | | | As of
June 30,
2026 (Unaudited) | |
| | | RM | | | RM | | | Convenience
Translation
USD | |
| Minimum hire purchase payment | | | | | | | | | |
| Not later than one (1) year | | | 197,712 | | | | 252,984 | | | | 62,044 | |
| Later than one (1) year and not later than five (5) years | | | 242,317 | | | | 364,549 | | | | 89,405 | |
| Later than five (5) years | | | — | | | | 87,449 | | | | 21,447 | |
| | | | 440,029 | | | | 704,982 | | | | 172,896 | |
| Less: Future interest charges | | | (23,541 | ) | | | (61,073 | ) | | | (14,978 | ) |
| Present value of hire purchase payment | | | 416,488 | | | | 643,909 | | | | 157,918 | |
| | | | | | | | | | | | | |
| Repayable as follows: | | | | | | | | | | | | |
| Non-current liabilities | | | 234,939 | | | | 415,513 | | | | 101,904 | |
| Current liabilities | | | 181,549 | | | | 228,396 | | | | 56,014 | |
| | | | 416,488 | | | | 643,909 | | | | 157,918 | |
The hire purchase payables of the Group bears interest ranging from 4.26% to 5.52% (December 31, 2025: 2.91%) per annum and are secured by the Group’s motor vehicle under hire purchase arrangements.
FOUNDER GROUP LIMITED AND ITS SUBSIDIARIES
NOTES TO UNAUDITED INTERIM CONDENSED CONSOLIDATED FINANCIAL STATEMENTS
(c) The following table sets out the remaining maturities of the borrowings based on carrying amounts:
| | | As of
December 31,
2025
(Audited) | | | As of
June 30,
2026 (Unaudited) | | | As of
June 30,
2026 (Unaudited) | |
| | | RM | | | RM | | | Convenience
Translation
USD | |
| Maturities | | | | | | | | | |
| Within 1 year | | | 45,626,825 | | | | 86,918,717 | | | | 21,316,669 | |
| 1 - 5 years | | | 15,263,709 | | | | 11,822,723 | | | | 2,899,503 | |
| More than 5 years | | | 2,450,333 | | | | 11,545,252 | | | | 2,831,454 | |
| Total | | | 63,340,867 | | | | 110,286,692 | | | | 27,047,626 | |
The interest rate profile of the Group’s interest-bearing financial instruments based on their carrying amount as at the end of the reporting period are as follows based on their carrying amount as at the end of the reporting period are as follows:
| | | As of
December 31,
2025
(Audited) | | | As of
June 30,
2026 (Unaudited) | | | As of
June 30,
2026 (Unaudited) | |
| | | RM | | | RM | | | Convenience
Translation
USD | |
| Fixed rate instrument | | | | | | | | | |
| Hire purchase payables | | | 416,488 | | | | 643,909 | | | | 157,918 | |
| Floating rate instrument | | | | | | | | | | | | |
| Bank borrowings | | | 62,924,379 | | | | 109,642,783 | | | | 26,889,708 | |
| Total | | | 63,340,867 | | | | 110,286,692 | | | | 27,047,626 | |
Sensitivity analysis for variable rate instruments
Sensitivity analysis of interest rate for the floating rate instruments at the end of each reporting period, assuming all other variables remain constant, is as follows:
| | | As of
December 31,
2025
(Audited) | | | As of
June 30,
2026 (Unaudited) | | | As of
June 30,
2026 (Unaudited) | |
| Effects of 50 basis point changes | | RM | | | RM | | | Convenience
Translation
USD | |
| Floating rate instrument | | | | | | | | | |
| Bank borrowings | | | 239,113 | | | | 416,643 | | | | 102,181 | |
Sensitivity analysis for fixed rate instruments at the end of each reporting period is not presented as fixed rate instruments are not affected by changes in interest rates.
FOUNDER GROUP LIMITED AND ITS SUBSIDIARIES
NOTES TO UNAUDITED INTERIM CONDENSED CONSOLIDATED FINANCIAL STATEMENTS
| | | As of
December 31,
2025 (Audited) | | | As of
June 30,
2026 (Unaudited) | | | As of
December 31,
2025
(Audited) | | | As of
June 30,
2026 (Unaudited) | | | As of
June 30,
2026 (Unaudited) | |
| Paid up capital: | | Number of ordinary shares – Class A and Class B Shares(6) | | | RM | | | RM | | | Convenience
Translation
USD | |
| At beginning of year/period | | | 17,665,289 | | | | 330,337 | | | | 7,425,257 | | | | 28,941,506 | | | | 7,097,856 | |
| Issuance of share capital (1) | | | — | | | | — | | | | — | | | | — | | | | — | |
| Issuance of share capital (2) | | | — | | | | — | | | | — | | | | — | | | | — | |
| Transaction costs of share issue | | | — | | | | — | | | | — | | | | — | | | | — | |
| Issuance of share capital (3) | | | — | | | | — | | | | — | | | | — | | | | — | |
| Issuance of share capital (4) | | | 1,750,000 | | | | — | | | | — | | | | — | | | | — | |
| Issuance of share capital (5) | | | 13,618,411 | | | | — | | | | 21,516,249 | | | | — | | | | — | |
| Issuance of share capital (7) | | | — | | | | 9,735,870 | | | | — | | | | 11,775,311 | | | | 2,887,875 | |
| Share combination (8) | | | (32,703,363 | ) | | | (8,334,471 | ) | | | — | | | | — | | | | — | |
| At end of year/period | | | 330,337 | | | | 1,731,736 | | | | 28,941,506 | | | | 40,716,817 | | | | 9,985,731 | |
As of December 31, 2023, the Company has authorized 15,700,000 ordinary shares at USD 0.001. The paid up ordinary shares has no par value and carry one vote per share and carry a right to dividends as and when declared by the Company.
| (1) | On October 24, 2024, 1,218,750 ordinary shares were issued in our initial public offering at USD 4.00 per ordinary share, before deduction the discounts and expenses. |
| (2) | On October 31, 2024, 2,813 ordinary shares were issued in our underwriters’ partial exercise of the over-allotment option, at USD 4.00 per ordinary share, before deduction the discounts and expenses. |
| (3) | On December 31, 2024, 743,726 ordinary shares were issued to CNP Equity Limited pursuant to the exercise of warrant as consideration for certain professional consulting service relating to the initial offering rendered to the Company. |
| | |
| (4) | On May 30, 2025, the Company issued 1,750,000 shares of the Company’s Class A Common Stock as part of the Securities Purchase Agreement. The issued shares serve as the commitment shares of the agreement. |
| | |
| (5) | Pursuant to the Securities Purchase Agreement dated April 22, 2025, between Avondale Capital, LLC and the Company, Avondale elected to convert a portion of its convertible securities into redemption conversion shares. On June 23, 2025, 785,171 ordinary shares were issued to Avondale, amount of USD 610,000 at a price of USD 0.7769 per share. |
| | |
| (6) | On July 16, 2025, the Company amended and restated memorandum and articles of association to include a dual class share structure and the creation of two new classes of shares, being A (Class A Shares) and B (Class B Shares), both with no par value which rank pari passu as to distributions (including on a liquidation), and provide for enhanced voting rights at a rate of twenty-to-one in favour of the Class B Shares. The share designations state that the 2,000,000 Ordinary Shares registered in the name of Mr. Lee Seng Chi and Reservoir Link Energy Bhd shall be redesignated as Class B Shares and the remaining Ordinary Shares in issue shall be redesignated as Class A Shares. |
| (7) | Pursuant to the Securities Purchase Agreement dated December 11, 2025, between Streeterville Capital, LLC and the Company, Streeterville elected to convert a portion of its convertible securities into redemption conversion shares. On June 30, 2026, 1,040,186 ordinary shares were issued to Streeterville, amount of USD 2,046,000 at a price of USD 1.9670 per share. |
| (8) | On February 10, 2026, the authorised, issued, and outstanding shares of the Founder Group Limited were combined on a 100 for 1 ratio (the “Share Combination”) with the marketplace. As a result of the Share Combination, each 100 ordinary shares outstanding will automatically combine and convert to one issued and outstanding ordinary share without any action on the part of the shareholders. |
FOUNDER GROUP LIMITED AND ITS SUBSIDIARIES
NOTES TO UNAUDITED INTERIM CONDENSED CONSOLIDATED FINANCIAL STATEMENTS
| | | As of
December 31,
2025
(Audited) | | | As of
June 30,
2026 (Unaudited) | | | As of
June 30,
2026 (Unaudited) | |
| | | RM | | | RM | | | Convenience
Translation
USD | |
| Bargain purchases from acquisition of Founder Energy Sdn. Bhd. under common control accounted as merger reserve | | | 1,299,996 | | | | 1,299,996 | | | | 318,822 | |
| Bargain purchase from acquisition of plant, equipment and inventory from Solar Bina Engineering Sdn. Bhd. under common control accounted as other reserve | | | 355,271 | | | | 355,271 | | | | 87,130 | |
| Bargain purchase from acquisition of business from Solar Bina Engineering Sdn. Bhd. under common control accounted as other reserve | | | 49,722 | | | | 49,722 | | | | 12,195 | |
| Foreign translation reserve | | | — | | | | (400,898 | ) | | | (98,321 | ) |
| | | | 1,704,989 | | | | 1,304,091 | | | | 319,826 | |
| | | For the six months ended | |
| | | June 30,
2025 | | | June 30,
2026 | | | June 30,
2026 | |
| | | RM | | | RM | | | Convenience
Translation
USD | |
| Revenue from contract services | | | 38,289,161 | | | | 42,571,195 | | | | 10,440,513 | |
| Revenue from sales of goods | | | 2,507,413 | | | | 4,728,963 | | | | 1,159,770 | |
| Revenue from contract services – related parties | | | 14,669,420 | | | | 35,713,128 | | | | 8,758,584 | |
| | | | 55,465,994 | | | | 83,013,286 | | | | 20,358,867 | |
| | | | | | | | | | | | | |
| Timing of revenue recognition: | | | | | | | | | | | | |
| Point in time | | | 2,507,413 | | | | 4,728,963 | | | | 1,159,770 | |
| Over time | | | 52,958,581 | | | | 78,284,323 | | | | 19,199,097 | |
| | | | 55,465,994 | | | | 83,013,286 | | | | 20,358,867 | |
| | | | | | | | | | | | | |
| Unsatisfied performance obligation | | | 196,695,432 | | | | 176,320,359 | | | | 43,242,271 | |
Revenue from contract services primarily involved in project execution, including construction, installation and integration works, testing and commissioning of our solar projects. Revenue from sales of goods involved in supply and selling of solar mounting structure and its accessories.
Unsatisfied performance obligations are expected to be satisfied and recognized as revenue within 12 months after the reporting year end, respectively. Revenue from contract services primarily involved in project execution, including construction, installation and integration works, testing and commissioning of our solar projects. Revenue from sales of goods involved in supply and selling of parts and accessories. All of the Group’s revenue is derived exclusively from customers located in Malaysia.
FOUNDER GROUP LIMITED AND ITS SUBSIDIARIES
NOTES TO UNAUDITED INTERIM CONDENSED CONSOLIDATED FINANCIAL STATEMENTS
| | | For the six months ended | |
| | | June 30,
2025 | | | June 30,
2026 | | | June 30,
2026 | |
| | | RM | | | RM | | | Convenience
Translation
USD | |
| Material cost | | | 8,774,878 | | | | 37,051,828 | | | | 9,086,898 | |
| Construction cost | | | 34,874,969 | | | | 27,394,671 | | | | 6,718,497 | |
| Staff cost | | | 2,409,446 | | | | 2,516,265 | | | | 617,110 | |
| Logistic cost | | | 643,081 | | | | 586,545 | | | | 143,849 | |
| Tools & machinery | | | 537,700 | | | | 520,816 | | | | 127,729 | |
| Miscellaneous | | | 1,333,093 | | | | 5,422,199 | | | | 1,329,785 | |
| Depreciation | | | 1,029,431 | | | | 879,977 | | | | 215,814 | |
| Total cost of sale | | | 49,602,598 | | | | 74,372,301 | | | | 18,239,682 | |
The cost of sale incurred pertaining to revenue derived from related party is amounting to RM 29,961,865 (USD 7,519,056) (June 30, 2025: RM 12,804,754).
Included in Cost of Sale of the Group is liquidated ascertained damages charged to subcontractors amounting to RM Nil (June 30, 2025: RM Nil).
| | | For the six months ended | |
| | | June 30,
2025 | | | June 30,
2026 | | | June 30,
2026 | |
| | | | | | | | | Convenience
Translation | |
| Basic earnings per share | | | | | | | | | |
| | | RM | | | RM | | | USD | |
| Net (loss)/income attributable to owners of the parent | | | (1,929,598 | ) | | | 791,785 | | | | 194,184 | |
| | | | Shares | | | | Shares | | | | Shares | |
| Shares used in computation: | | | | | | | | | | | | |
| Weighted-average ordinary shares outstanding | | | 179,848 | | | | 816,406 | | | | 816,406 | |
| | | | | | | | | | | | | |
| Basic earnings per share attributable to owners of the parent | | | (10.73 | ) | | | 0.97 | | | | 0.24 | |
Diluted earnings per share
| | | | RM | | | | RM | | | | USD | |
| Net (loss)/income attributable to owners of the parent | | | (1,929,598 | ) | | | 791,785 | | | | 194,184 | |
| | | | Shares | | | | Shares | | | | Shares | |
| Shares used in computation: | | | | | | | | | | | | |
| Weighted-average ordinary shares outstanding | | | 179,848 | | | | 816,406 | | | | 816,406 | |
| Potential issuable shares | | | 84,946 | | | | 22,262,651 | | | | 22,262,651 | |
| Diluted total ordinary shares | | | 264,794 | | | | 23,079,057 | | | | 23,079,057 | |
| | | | | | | | | | | | | |
| Diluted earnings per shares attributable to owners of the parent | | | (7.29 | ) | | | 0.03 | | | | 0.01 | |
FOUNDER GROUP LIMITED AND ITS SUBSIDIARIES
NOTES TO UNAUDITED INTERIM CONDENSED CONSOLIDATED FINANCIAL STATEMENTS
| 21 | EMPLOYEES SALARY AND RELATED COSTS |
| | | For the six months ended | |
| | | June 30,
2025 | | | June 30,
2026 | | | June 30,
2026 | |
| | | RM | | | RM | | | Convenience
Translation
USD | |
| Director fees | | | 407,080 | | | | 370,586 | | | | 90,886 | |
| Director salaries | | | 390,000 | | | | 432,000 | | | | 105,947 | |
| Admin salaries | | | 1,485,617 | | | | 2,141,262 | | | | 525,141 | |
| Technical staff salaries | | | 1,696,953 | | | | 1,865,110 | | | | 457,415 | |
| Total | | | 3,979,650 | | | | 4,808,958 | | | | 1,179,389 | |
| | | | | | | | | | | | | |
| Director related expenses | | | 327,795 | | | | 281,609 | | | | 69,064 | |
| Admin related expenses | | | 584,928 | | | | 843,711 | | | | 206,919 | |
| Technical staff related expenses | | | 712,493 | | | | 689,926 | | | | 169,203 | |
| Total | | | 1,625,216 | | | | 1,815,246 | | | | 445,186 | |
| 22 | FINANCIAL INSTRUMENTS AND RISK MANAGEMENT |
| | | As of
December 31,
2025
(Audited) | | | As of
June 30,
2026 (Unaudited) | | | As of
June 30,
2026 (Unaudited) | |
| | | RM | | | RM | | | Convenience
Translation
USD | |
| Financial assets at amortized cost | | | | | | | | | |
| Trade receivables | | | 20,919,764 | | | | 16,220,423 | | | | 3,978,032 | |
| Other receivables | | | 1,695,159 | | | | 3,052,075 | | | | 748,515 | |
| Amount due from related parties | | | 2,457,382 | | | | 4,529,037 | | | | 1,110,739 | |
| Cash and bank balances | | | 80,243,158 | | | | 72,605,810 | | | | 17,806,452 | |
| | | | 105,315,463 | | | | 96,407,345 | | | | 23,643,738 | |
| | | | | | | | | | | | | |
| Financial assets at FVTPL | | | | | | | | | | | | |
| Other investment | | | — | | | | 1,006,240 | | | | 246,779 | |
| | | | | | | | | | | | | |
| Financial liabilities at amortized cost | | | | | | | | | | | | |
| Trade payables | | | (18,315,260 | ) | | | (34,236,294 | ) | | | (8,396,393 | ) |
| Other payables and accrued liabilities | | | (8,951,463 | ) | | | (17,471,394 | ) | | | (4,284,830 | ) |
| Convertible securities payable | | | (64,170,406 | ) | | | (52,819,830 | ) | | | (12,953,974 | ) |
| Bank and other borrowings | | | (63,340,867 | ) | | | (110,286,692 | ) | | | (27,047,626 | ) |
| Amount due to related parties | | | (3,901,595 | ) | | | (469,425 | ) | | | (115,126 | ) |
| | | | (158,679,591 | ) | | | (215,283,635 | ) | | | (52,797,949 | ) |
FOUNDER GROUP LIMITED AND ITS SUBSIDIARIES
NOTES TO UNAUDITED INTERIM CONDENSED CONSOLIDATED FINANCIAL STATEMENTS
| 22 | FINANCIAL INSTRUMENTS AND RISK MANAGEMENT (cont.) |
Foreign Currency Risk
We are exposed to foreign currency risk with transactions and balances that are denominated in currencies other than our functional currency. The currencies giving rise to this risk are primarily Chinese Yuan Renminbi (“CNY”) and United States Dollar (“USD”). Foreign currency risk is monitored closely on an on-going basis to ensure that the net exposure is at an acceptable level.
Sensitivity analysis for foreign currency risk
We are exposed to foreign currency risk with transactions and balances that are denominated in currencies other than the respective functional currencies of Group entities. The currencies giving rise to this risk are primarily Chinese Yuan Renminbi (“CNY”) and United States Dollar (“USD”). Foreign currency risk is monitored closely on an on-going basis to ensure that the net exposure is at an acceptable level.
Our exposure to foreign currency risk based on the carrying amounts of the financial instruments at the end of the reporting period is summarized below.
| | | CNY | | | USD | |
| As of June 30, 2026 | | RM | | | RM | |
| Financial assets in foreign currencies | | | | | | |
| Cash and bank balances | | | 2,077 | | | | 3,106,083 | |
| | | | | | | | | |
| Financial liabilities in foreign currencies | | | | | | | | |
| Trade payables | | | (407,217 | ) | | | (13,661,429 | ) |
| Other payables | | | — | | | | (47,244 | ) |
| | | | (407,217 | ) | | | (13,708,673 | ) |
| | | CNY | | | USD | |
| As of December 31, 2025 | | RM | | | RM | |
| Financial assets in foreign currencies | | | | | | |
| Cash and bank balances | | | 2,116 | | | | 2,117,602 | |
| | | | | | | | | |
| Financial liabilities in foreign currencies | | | | | | | | |
| Trade payables | | | (1,432,416 | ) | | | (870,994 | ) |
| Other payables | | | — | | | | (47,244 | ) |
| | | | (1,432,416 | ) | | | (918,237 | ) |
FOUNDER GROUP LIMITED AND ITS SUBSIDIARIES
NOTES TO UNAUDITED INTERIM CONDENSED CONSOLIDATED FINANCIAL STATEMENTS
| 22 | FINANCIAL INSTRUMENTS AND RISK MANAGEMENT (cont.) |
The following table details the sensitivity analysis to a 10% change in the foreign currencies at the end of the reporting period, with all other variables held constant.
| | | As of
December 31,
2025
(Audited) | | | As of
June 30,
2026 (Unaudited) | |
| | | RM | | | RM | |
| United States Dollar | | | 91,152 | | | | (805,797 | ) |
| Chinese Yuan Renminbi | | | (108,703 | ) | | | (30,791 | ) |
Interest Rate Risk
We are exposed to interest rate risk as we have bank loans which are interest bearing. The interest rates and terms of repayment of the loans are disclosed in Note 15 to the financial statements. We currently do not have an interest rate hedging policy.
Liquidity Risk
Liquidity risk arises mainly due to general funding and business activities. We practice prudent risk management by maintaining sufficient cash balances and the availability of funding through certain committed credit facilities.
The table below summarises the maturity profile of the Company’s financial liabilities as at the end of the reporting period and are based on undiscounted contractual payments:
| | | Carrying amount | | | Contractual cash flows | | | Within 1 year | | | More than 1 year and less than 5 years | | | More than 5 years | |
| | | RM | | | RM | | | RM | | | RM | | | RM | |
| As of June 30, 2026 | | | | | | | | | | | | | | | |
| Trade payables | | | 34,236,294 | | | | 34,236,294 | | | | 34,236,294 | | | | — | | | | — | |
| Other payables and accrued liabilities | | | 17,471,394 | | | | 17,471,394 | | | | 17,471,394 | | | | — | | | | — | |
| Convertible securities payable | | | 52,819,830 | | | | 52,819,830 | | | | 52,819,830 | | | | — | | | | — | |
| Bank and other borrowings | | | 110,286,692 | | | | 117,496,300 | | | | 88,362,161 | | | | 15,792,923 | | | | 13,341,216 | |
| Lease liabilities | | | 553,103 | | | | 553,103 | | | | 81,808 | | | | 471,295 | | | | — | |
| Amount due to related parties | | | 469,425 | | | | 469,425 | | | | 469,425 | | | | — | | | | — | |
| | | | 215,836,738 | | | | 223,046,346 | | | | 192,971,487 | | | | 16,264,218 | | | | 13,341,216 | |
| | | Carrying amount | | | Contractual cash flows | | | Within 1 year | | | More than
1 year and less than 5 years | | | More than
5 years | |
| | | USD | | | USD | | | USD | | | USD | | | USD | |
| As of June 30, 2026 | | | | | | | | | | | | | | | |
| Trade payables | | | 8,396,393 | | | | 8,396,393 | | | | 8,396,393 | | | | — | | | | — | |
| Other payables and accrued liabilities | | | 4,284,830 | | | | 4,284,830 | | | | 4,284,830 | | | | — | | | | — | |
| Convertible securities payable | | | 12,953,974 | | | | 12,953,974 | | | | 12,953,974 | | | | — | | | | — | |
| Bank and other borrowings | | | 27,047,625 | | | | 28,815,770 | | | | 21,670,671 | | | | 3,873,188 | | | | 3,271,911 | |
| Lease liabilities | | | 135,647 | | | | 135,647 | | | | 20,063 | | | | 115,584 | | | | — | |
| Amount due to related parties | | | 115,126 | | | | 115,126 | | | | 115,126 | | | | — | | | | — | |
| | | | 52,933,595 | | | | 54,701,740 | | | | 47,441,057 | | | | 3,988,772 | | | | 3,271,911 | |
FOUNDER GROUP LIMITED AND ITS SUBSIDIARIES
NOTES TO UNAUDITED INTERIM CONDENSED CONSOLIDATED FINANCIAL STATEMENTS
| 22 | FINANCIAL INSTRUMENTS AND RISK MANAGEMENT (cont.) |
| | | Carrying amount | | | Contractual cash flows | | | Within 1 year | | | More than
1 year and less than 5 years | | | More than
5 years | |
| | | RM | | | RM | | | RM | | | RM | | | RM | |
| As of December 31, 2025 | | | | | | | | | | | | | | | |
| Trade payables | | | 18,315,260 | | | | 18,315,260 | | | | 18,315,260 | | | | — | | | | — | |
| Other payables and accrued liabilities | | | 8,951,463 | | | | 8,951,463 | | | | 8,951,463 | | | | — | | | | — | |
| Convertible securities payable | | | 64,170,406 | | | | 64,170,406 | | | | 64,170,406 | | | | — | | | | — | |
| Bank and other borrowings | | | 63,340,867 | | | | 67,741,152 | | | | 46,998,342 | | | | 16,109,886 | | | | 4,632,924 | |
| Lease liabilities | | | 708,629 | | | | 744,000 | | | | 462,000 | | | | 282,000 | | | | — | |
| Amount due to related parties | | | 3,901,595 | | | | 4,047,143 | | | | 4,047,143 | | | | — | | | | — | |
| | | | 159,388,220 | | | | 163,969,424 | | | | 142,944,614 | | | | 16,391,886 | | | | 4,632,924 | |
Capital Risk Management
We manage our capital to ensure that entities within our Company will be able to maintain an optimal capital structure so as to support our businesses and maximize shareholders value. To achieve this objective, we may make adjustments to the capital structure in view of changes in economic conditions, such as adjusting the amount of dividend payment, returning of capital to shareholders or issuing new shares.
We manage our capital based on debt-to-equity ratio that complies with debt covenants and regulatory, if any. The debt-to-equity ratio is calculated as net debt divided by total equity. We include within net debt, loans, and borrowings from financial institutions. Capital includes equity attributable to the owners of the parent and non-controlling interest.
Customer Concentration
For the six months ended June 30, 2026, the Company generated total revenue of RM 83,013,286, of which four customers accounted for more than 10% of the Company’s total revenue.
For the six months ended June 30, 2025, the Company generated total revenue of RM 55,465,994, of which three customers accounted for more than 10% of the Company’s total revenue.
| | | For the six months ended | |
| | | June 30,
2025 | | | June 30,
2026 | | | June 30,
2025 | | | June 30,
2026 | |
| | | Revenues | | | Percentage of revenues | |
| | | RM | | | RM | | | USD | | | % | | | % | |
| Customer A | | | 13,555,612 | | | | 9,618,188 | | | | 2,358,844 | | | | 24.44 | | | | 11.59 | |
| Customer B | | | 7,368,513 | | | | N/A | * | | | N/A | * | | | 13.28 | | | | N/A | * |
| Customer C | | | 7,163,241 | | | | 9,477,721 | | | | 2,324,395 | | | | 12.91 | | | | 11.42 | |
| Customer D | | | N/A | * | | | 26,828,939 | | | | 6,579,752 | | | | N/A | * | | | 32.32 | |
| Customer E | | | N/A | * | | | 14,109,849 | | | | 3,460,417 | | | | N/A | * | | | 17.00 | |
| Others | | | 27,378,628 | | | | 22,978,589 | | | | 5,635,459 | | | | 49.36 | | | | 27.68 | |
| Total | | | 55,465,994 | | | | 83,013,286 | | | | 20,358,867 | | | | 100.00 | | | | 100.00 | |
FOUNDER GROUP LIMITED AND ITS SUBSIDIARIES
NOTES TO UNAUDITED INTERIM CONDENSED CONSOLIDATED FINANCIAL STATEMENTS
| 23 | CONCENTRATION OF RISK (cont.) |
The following table sets forth a summary of customers who represent 10% or more of the Group’s total accounts receivable:
| | | As of
December 31,
2025
(Audited) | | | As of
June 30,
2026
(Unaudited) | | | As of
December 31,
2025 (Audited) | | | As of
June 30,
2026
(Unaudited) | |
| | | Receivables | | | Percentage of receivables | |
| | | RM | | | RM | | | USD | | | % | | | % | |
| Customer F | | | 8,027,391 | | | | N/A | ^ | | | N/A | ^ | | | 38.37 | | | | N/A | ^ |
| Customer G | | | 2,303,536 | | | | 1,787,500 | | | | 438,381 | | | | 11.01 | | | | 11.02 | |
| Customer H | | | N/A | | | | 2,224,908 | | | | 545,655 | | | | N/A | | | | 13.72 | |
| Others | | | 10,588,837 | | | | 12,208,015 | | | | 2,993,996 | | | | 50.62 | | | | 75.26 | |
| Total | | | 20,919,764 | | | | 16,220,423 | | | | 3,978,032 | | | | 100.00 | | | | 100.00 | |
| * | Revenue from relevant customer was less than 10% of the Group’s total revenue for the respective year. |
| ^ | Receivables was less than 10% of the Groups total accounts receivables for the respective year. |
Vendor Concentration
For the six months ended June 30, 2026, the Company incurred cost of sale of RM 74,372,301, of which three vendors accounted for more than 10% of the Company’s total cost of sale.
For the six months ended June 30, 2025, the Company incurred cost of sale of RM 49,602,598, of which one vendor accounted for more than 10% of the Company’s total cost of sale.
| | | For the six months ended | |
| | | June 30, 2025 | | | June 30, 2026 | | | June 30, 2025 | | | June 30, 2026 | |
| | | Cost of sales | | | Percentage of cost of sales | |
| | | RM | | | RM | | | USD | | | % | | | % | |
| Vendor A | | | 8,547,239 | | | | 8,500,000 | | | | 2,084,611 | | | | 17.23 | | | | 11.43 | |
| Vendor B | | | N/A | * | | | 14,027,838 | | | | 3,440,304 | | | | N/A | * | | | 18.86 | |
| Vendor C | | | N/A | * | | | 10,713,639 | | | | 2,627,502 | | | | N/A | * | | | 14.41 | |
| Others | | | 41,055,359 | | | | 41,130,824 | | | | 10,087,265 | | | | 82.77 | | | | 55.30 | |
| Total | | | 49,602,598 | | | | 74,372,301 | | | | 18,239,682 | | | | 100.00 | | | | 100.00 | |
FOUNDER GROUP LIMITED AND ITS SUBSIDIARIES
NOTES TO UNAUDITED INTERIM CONDENSED CONSOLIDATED FINANCIAL STATEMENTS
| 23 | CONCENTRATION OF RISK (cont.) |
The following table sets forth a summary of vendors who represent 10% or more of the Group’s total accounts payable:
| | | As of
December 31,
2025 (Audited) | | | As of
June 30,
2026
(Unaudited) | | | As of
December 31,
2025 (Audited) | | | As of
June 30,
2026
(Unaudited) | |
| | | Payables | | | Percentage of payables | |
| | | RM | | | RM | | | USD | | | % | | | % | |
| Vendor B | | | N/A | ^ | | | 13,326,446 | | | | 3,268,288 | | | | N/A | ^ | | | 38.92 | |
| Vendor D | | | 2,082,351 | | | | N/A^ | | | | N/A | ^ | | | 11.37 | | | | N/A | ^ |
| Others | | | 16,232,909 | | | | 20,909,848 | | | | 5,128,105 | | | | 88.63 | | | | 61.08 | |
| Total | | | 18,315,260 | | | | 34,236,294 | | | | 8,396,393 | | | | 100.00 | | | | 100.00 | |
| * | Purchases from relevant vendor was less than 10% of the Group’s total cost of sale for the respective year. |
| ^ | Payables was less than 10% of the Groups total accounts payables for the respective year. |
The group reporting is organized and managed in two major business units. All of our revenue is derived from one segment country which is in Malaysia.
The reportable segments are summarized as follows:
| | i) | Large-scale solar — Large-scale solar projects are utility scale solar PV power plants with installed generating capacity of 1 MWac or more. Large-scale solar projects are ground mounted and floating and are designed to supply power to the power grid. For the majority of our large-scale solar projects, we usually act as the contractor to the project awarder, who is the main contractor for a solar project. |
| | ii) | Commercial & Industrial — C&I projects are smaller scale solar projects where the solar PV systems are installed on rooftops and are designed to generate electricity for commercial and industrial properties for their own consumption, such as factories, warehouses and commercial stores. For C&I projects, we usually sign a service contract with the project owner and act as the main contractor. |
Revenue from contract services primarily involved project execution, including construction, installation and integration works, testing and commissioning of our solar projects. Revenue from sales of goods involved supply and selling of solar mounting structures and accessories. Consequently, both segments contribute to revenue from contract services and sales of goods, as reflected in our disclosed financial reports.
The Group did not generate any inter-segment revenues.
Segment profit
Segment performance is used to performance as Group’s CEO believes that such information is the most relevant in evaluating the results of certain segment relative to other entities that operate within these industries. Performance is evaluated based on operating profit and loss which is measured differently from operating profit or loss in the consolidated financial statements.
Segment assets
The total of segment asset is measured on all assets of a segment as included in the internal management reports that are reviewed by the CODM. Segment total assets are used to measure the return of assets of each segment.
Segment liabilities
The total of segment liability is measured on all liabilities of a segment as included in the internal management reports that are reviewed by the CODM. Segment total liabilities are used to measure the assess the financial position of each segment.
FOUNDER GROUP LIMITED AND ITS SUBSIDIARIES
NOTES TO UNAUDITED INTERIM CONDENSED CONSOLIDATED FINANCIAL STATEMENTS
| 24 | SEGMENT REPORTING (cont.) |
| | | For the six months ended | |
| | | June 30, 2025 | | | June 30, 2026 | | | June 30, 2026 | |
| By Business Unit | | RM | | | RM | | | Convenience
Translation
USD | |
| Revenue | | | | | | | | | |
| Large Scale Solar Contract Services | | | 31,310,177 | | | | 64,740,421 | | | | 15,877,480 | |
| Commercial & Industrial Contract Services | | | 21,648,404 | | | | 13,543,902 | | | | 3,321,619 | |
| Large Scale Solar Sales of Goods | | | — | | | | 1,940,000 | | | | 475,781 | |
| Commercial & Industrial Sales of Goods | | | 2,507,413 | | | | 2,788,963 | | | | 683,987 | |
| Total revenue | | | 55,465,994 | | | | 83,013,286 | | | | 20,358,867 | |
| | | | | | | | | | | | | |
| Cost of Sales | | | | | | | | | | | | |
| Large Scale Solar Contract Services | | | (28,708,507 | ) | | | (60,148,005 | ) | | | (14,751,197 | ) |
| Commercial & Industrial Contract Services | | | (18,632,087 | ) | | | (9,951,432 | ) | | | (2,440,572 | ) |
| Commercial & Industrial Sales of Goods | | | (2,262,004 | ) | | | (4,272,864 | ) | | | (1,047,913 | ) |
| Total cost of sales | | | (49,602,598 | ) | | | (74,372,301 | ) | | | (18,239,682 | ) |
| | | | | | | | | | | | | |
| Large Scale Solar gross profit | | | 2,601,670 | | | | 6,532,416 | | | | 1,602,064 | |
| Commercial & Industrial gross profit | | | 3,261,726 | | | | 2,108,569 | | | | 517,121 | |
| Total gross profit | | | 5,863,396 | | | | 8,640,985 | | | | 2,119,185 | |
| Selling and administrative expenses | | | (6,127,228 | ) | | | (6,454,283 | ) | | | (1,582,901 | ) |
| Selling and administrative expenses to related parties | | | (216,352 | ) | | | — | | | | — | |
| (Loss)/profit from operations before income tax | | | (480,184 | ) | | | 2,186,702 | | | | 536,284 | |
| | | As of
December 31,
2025
(Audited) | | | As of
June 30,
2026
(Unaudited) | | | As of
June 30,
2026
(Unaudited) | |
| Total assets | | RM | | | RM | | | Convenience
Translation
USD | |
| Large Scale Solar segment | | | 48,822,485 | | | | 95,112,630 | | | | 23,326,212 | |
| Commercial & Industrial segment | | | 38,476,543 | | | | 39,488,720 | | | | 9,684,542 | |
| Total of reportable segments | | | 87,299,028 | | | | 134,601,350 | | | | 33,010,754 | |
| Corporate and other | | | 102,449,572 | | | | 124,149,406 | | | | 30,447,433 | |
| Consolidated total assets | | | 189,748,600 | | | | 258,750,756 | | | | 63,458,187 | |
| | RM | | | RM | | | Convenience
Translation
USD | |
| Total liabilities | | | | | | | | | |
| Large Scale Solar segment | | | 8,255,741 | | | | 22,448,950 | | | | 5,505,567 | |
| Commercial & Industrial segment | | | 12,149,110 | | | | 10,316,536 | | | | 2,530,113 | |
| Total of reportable segments | | | 20,404,851 | | | | 32,765,486 | | | | 8,035,680 | |
| Corporate and other | | | 139,087,390 | | | | 183,071,252 | | | | 44,897,916 | |
| Consolidated total liabilities | | | 159,492,241 | | | | 215,836,738 | | | | 52,933,596 | |
FOUNDER GROUP LIMITED AND ITS SUBSIDIARIES
NOTES TO UNAUDITED INTERIM CONDENSED CONSOLIDATED FINANCIAL STATEMENTS
| 25 | COMMITMENTS AND CONTINGENCIES |
Right-of-use assets and lease liabilities
For the details on future minimum lease payments under the non-cancelable operating leases as of June 30, 2026, please refer to Note 5 to the Consolidated Financial Statements.
Capital commitments
Capital expenditure as at the end of the reporting period is as follows:
| | | As of December 31, 2025
(Audited) | | | As of June 30, 2026 (Unaudited) | | | As of June 30, 2026 (Unaudited) | |
| | | RM | | | RM | | | Convenience
Translation
USD | |
| Not later than one year | | | | | | | | | |
| Capital expenditure: | | | | | | | | | |
| Plant and equipment | | | 13,687,514 | | | | 3,817,981 | | | | 936,353 | |
The Group evaluated all events and transactions that occurred after June 30, 2026 up through the date of report, which is the date that these consolidated financial statements are available for distribution. Other than the event disclosed below:
| (a) | On September 1, 2026, the authorized, issued, and outstanding shares of the Founder Group Limited were combined on a 100 for 1 ratio (the “Share Combination”) with the marketplace. As a result of the Share Combination, each 100 ordinary shares outstanding will automatically combine and convert to one issued and outstanding ordinary share without any action on the part of the shareholders. |