Exhibit 99.1
| Investor Presentation Data as of or for the period ended September 30, 2026, unless otherwise noted EX 99.1 |
| CAUTION REGARDING FORWARD LOOKING STATEMENTS This presentation contains forward-looking statements within the meaning of the Private Securities Litigation Reform Act of 1995 that relate to future events or the future performance of the Company. Forward-looking statements are not guarantees of performance or results. These forward-looking statements are based on the current beliefs and expectations of the respective management of the Company and are inherently subject to significant business, economic and competitive uncertainties and contingencies, many of which are beyond their respective control. In addition, these forward-looking statements are subject to assumptions with respect to future business strategies and decisions that are subject to change. Actual results may differ materially from the anticipated results discussed or implied in these forward-looking statements because of numerous possible uncertainties. Words like "may," "plan," "contemplate," "anticipate," "believe," "intend," "continue," "expect," "project," "predict," "estimate," "could," "should," "would," "will," and similar expressions, should be considered as identifying forward-looking statements, although other phrasing may be used. Such forward-looking statements involve risks and uncertainties and may not be realized due to a variety of factors. Factors that could cause actual results to differ materially from those expressed in the forward-looking statements are discussed in the reports (such as Annual Reports on Form 10-K and Quarterly Reports on Form 10-Q) filed by the Company with the Securities and Exchange Commission. You should consider such factors and not place undue reliance on such forward-looking statements. No obligation is undertaken by the Company to update such forward-looking statements to reflect events or circumstances occurring after the issuance of this presentation. NON-GAAP FINANCIAL MEASURES Statements included in this presentation include non-GAAP financial measures and should be read along with the accompanying tables under the section titled “Non-GAAP Reconciliations.” The Company uses non-GAAP financial measures to analyze its performance. Management believes that non-GAAP financial measures provide additional useful information that allows readers to evaluate the ongoing performance of the Company and provide meaningful comparison to its peers. Non-GAAP financial measures should not be considered as an alternative to any measure of performance or financial condition as promulgated under GAAP, and investors should consider the Company’s performance and financial condition as reported under GAAP and all other relevant information when assessing the performance or financial condition of the Company. Non-GAAP financial measures have limitations as analytical tools, and investors should not consider them in isolation or as a substitute for analysis of the results or financial condition as reported under GAAP. Legal Disclaimer 2 |
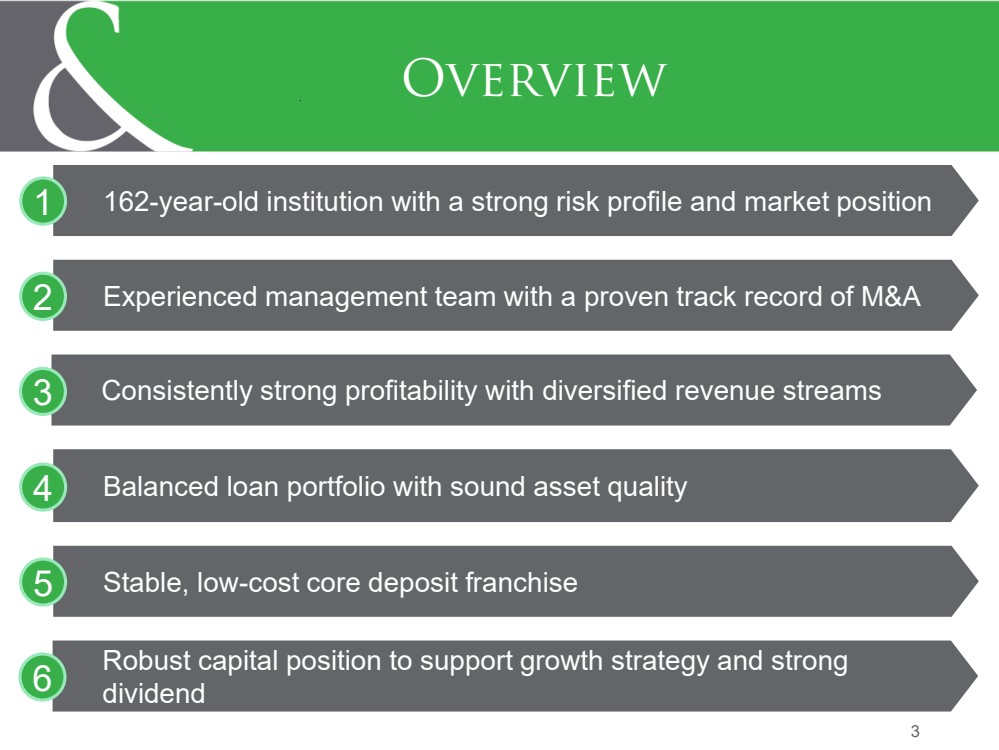
| 3 Overview 162-year-old institution with a strong risk profile and market position Experienced management team with a proven track record of M&A Consistently strong profitability with diversified revenue streams Balanced loan portfolio with sound asset quality Stable, low-cost core deposit franchise 1 2 3 4 5 Robust capital position to support growth strategy and strong dividend 6 |
| • Citizens & Northern Corporation (“C&N”) is a bank holding company with assets of approximately $3.2 billion at September 30, 2026. It was founded in 1987 and has been listed on the NASDAQ since 2005. C&N’s principal subsidiary is Citizens & Northern Bank (“C&N Bank”). • Headquartered in Wellsboro, PA, C&N Bank has 34 full-service branches, a limited production office (LPO) dedicated to lending services and an office dedicated to wealth management services. C&N Bank was founded in 1864. • 23 branches in the Northern Tier of PA and Steuben County NY and an LPO dedicated to commercial and other lending services in Elmira, NY. • 6 branches in the Susquehanna PA region. In 2025, the Company acquired Susquehanna Community Financial, Inc. ($596.2 million in total assets). • 3 branches and an office dedicated to wealth management services in Southeastern PA • In 2019, the Company acquired Monument Bancorp, Inc. ($376m assets) • In 2020, the Company acquired Covenant Financial, Inc. ($608m assets) • 2 branches in Southcentral PA • Trust services and investment and insurance products are offered through C&N Wealth Management. At September 30, 2026, assets under management and advisement through the Wealth Management Group totaled approximately $2.3 billion. • C&N’s common stock trades on the NASDAQ Capital Market Securities under the symbol CZNC. At November 3, 2026, the market capitalization was $502 million. • The closing market price on November 3, 2026 was $27.94, or 12.2X annualized earnings for the nine months ended September 30, 2026 and 184% of tangible common book value per share at September 30, 2026. In 2026, dividends totaled $1.14 per common share, including quarterly dividends of $0.28 per share for each of the first 3 quarters and $0.30 per share in the fourth quarter. Based on total dividends declared in 2026 and the closing market price on November 3, 2026, the annualized dividend yield was 4.08%. C&N Franchise 4 |
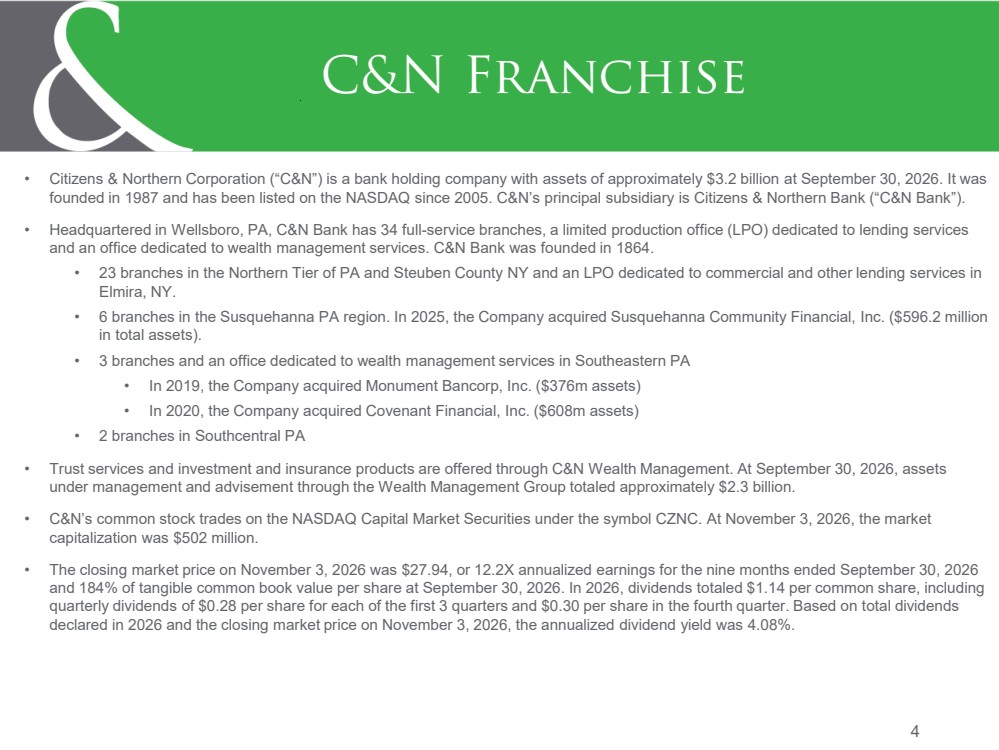
| Current Branch and LPO Footprint 5 |
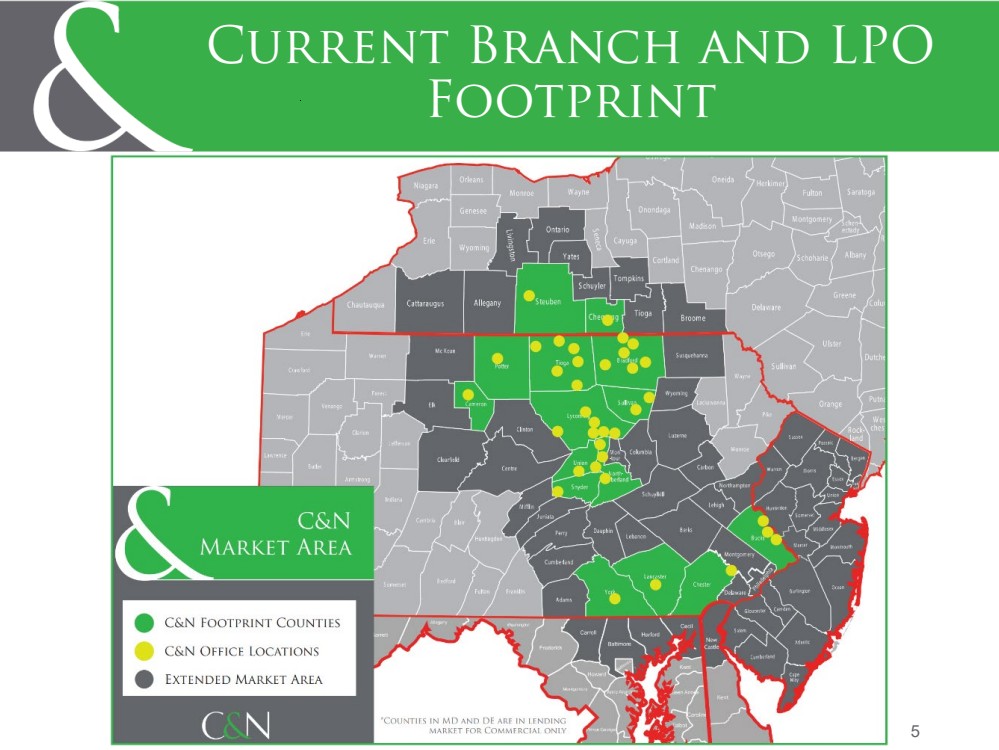
| 6 Experienced Management Team Name Position Years of Banking Experience Years with C&N J. Bradley Scovill President and CEO 35 11 Mark Hughes Chief Financial Officer 26 26 Alexander Balagour Chief Information Officer 13 5 Stan Dunsmore Chief Credit Officer 42 19 Harold (Hal) Hoose Chief Revenue Officer 35 28 Glenn R. James, Esquire General Counsel and Corporate Secretary 47 3 John Reber Chief Risk Officer 34 22 Thomas L. Rudy, Jr. Chief Delivery Officer & Northern Tier Region President 26 26 David Runk Strategic Advisor 32 1 Blair Rush Southeastern PA Region President 45 6 William F. Van Sant III Chief Wealth Officer 25 6 months Tracy Watkins Chief Human Resources Officer 23 23 Total 383 171 At October 31, 2026, total Board and Management Ownership of C&N is approximately 4.4%. |
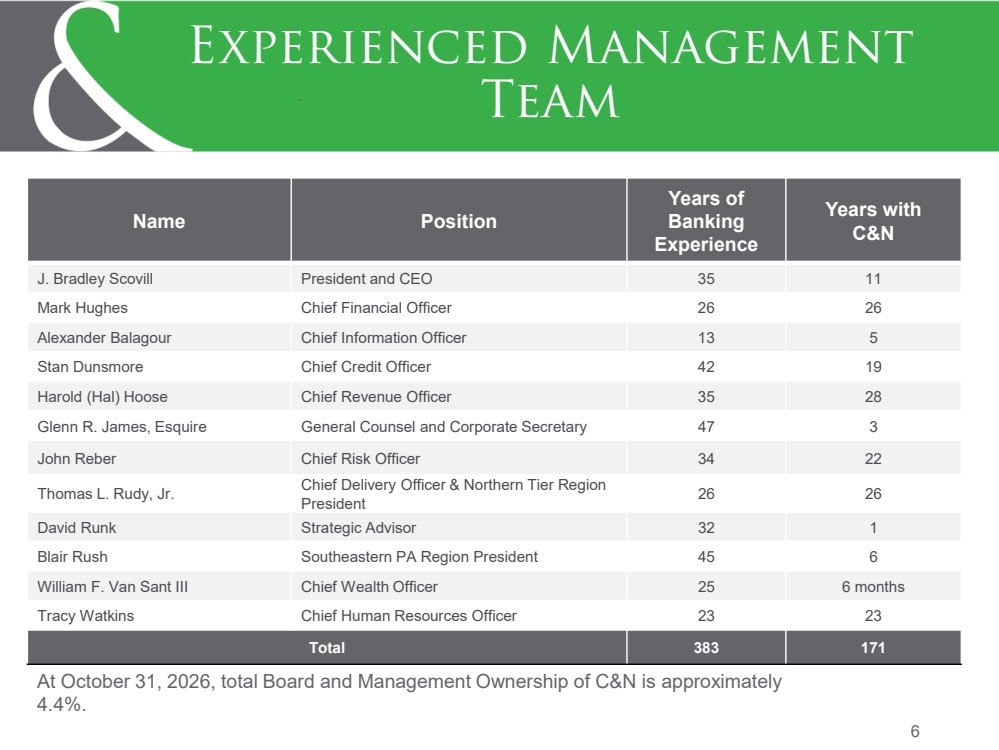
| 7 Current Strategic Focus •Target business segments we know and understand •Blending digital with personal/physical access •Sustain focus on core deposits as main driver to fund loans and maintain cost of deposits advantage to peer Relationship Banking Model •Scale the bank through automation, AI and integrated technology platforms •Simplify the model by consolidating systems and reducing complexity •Expand digital capabilities while preserving C&N’s relationship-banking model Technology-Driven Business Transformation •Brad Scovill retirement planned for spring 2027. CEO search in progress. •Board leadership transition in progress with Terry Lehman planning to step down as Chair in April 2027 while remaining on the Board and Aaron Singer appointed Vice Chair of the Board effective October 22, 2026 •4th Q 2025 additions from Susquehanna of Board member Christian Trate, EVP and Strategic Advisor and Region President •Continued organization-wide focus on succession planning Leadership, Management and Board Development •Further deployment of strong capital base •Organic growth •Multiple business lines •Opportunistic M&A – Banks and Wealth Growth Strategy •Strategic investing in people, markets and technology •Continued pursuit and evaluation of opportunities for expansion of scale via M&A •Position the stock to be fairly valued through growth in EPS, dividends and share repurchases Shareholder Value |
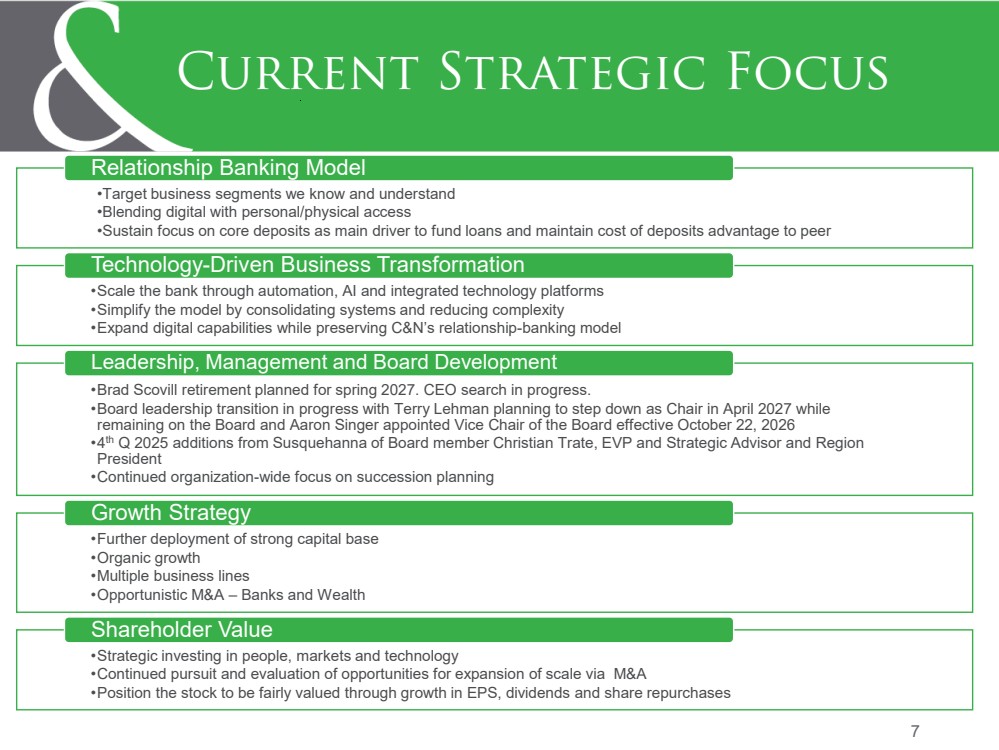
| 8 Creating Scalable Growth and Operating Leverage Disciplined technology investment is enabling C&N to support growth, increase capacity and simplify the operating model 22% vs. 9% Asset growth vs. technology staffing growth 23.5% Customer Salesforce cases automated 100% Customer-care interactions AI-captured and summarized STRATEGIC VALUE Growth-ready capacity Supported 22% asset growth with 9% technology staffing growth and no new core infrastructure capital investment. Automate routine work Automation now resolves 23.5% service Salesforce cases, exceeding the original enterprise target of 20%. Simplify operations Consolidating core banking services onto an integrated Fiserv platform to reduce complexity and support future growth. AI-enabled relationships Customer Care Center captures and summarizes over 11,000 monthly interactions, enabling better customer service through the bank. AI enhanced tools are expanding employee effectiveness across multiple departments. Scalable growth without proportional increases in cost or complexity |
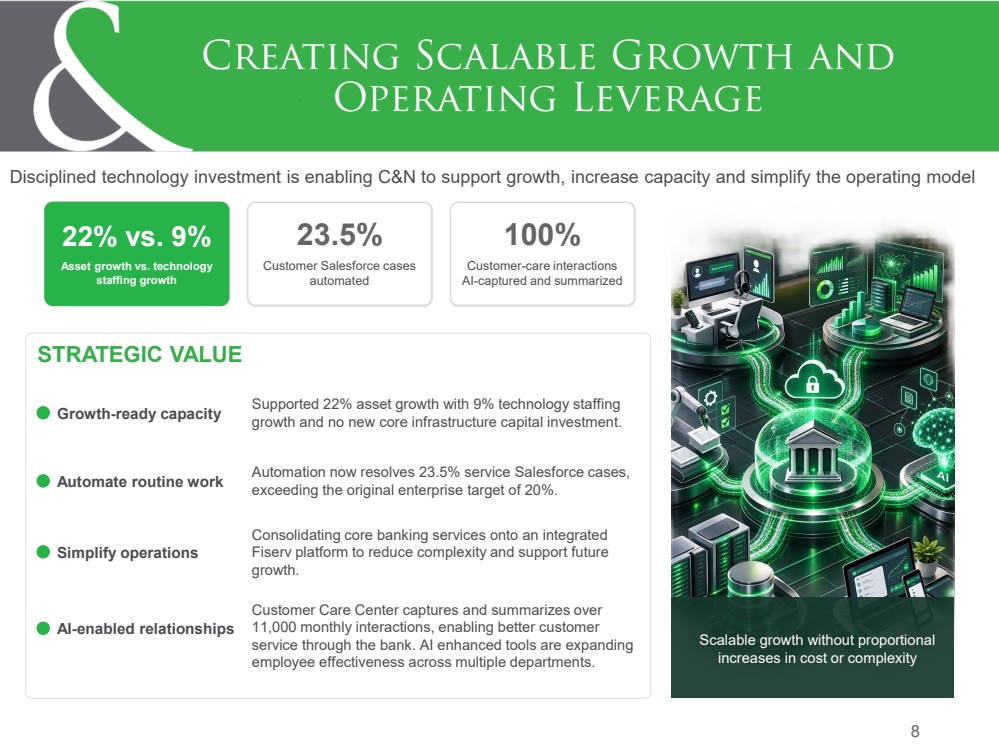
| 9 Summary Statistics September 30, 2026 (Unaudited) Total Assets $3,150 Million Net Loans $2,302 Million Total Deposits $2,609 Million Total Loans / Total Deposits 89.4% Uninsured and Uncollateralized Deposits / Total Deposits 24.1% Tangible Common Equity1 $272.9 Million Tang. Common Equity / Tang. Assets1 8.86% Tier 1 Risk Based Capital Ratio 13.02% Total Risk Based Capital Ratio 15.01% Allowance for Credit Losses (ACL) / Total Loans 1.24% NPAs2/ Assets 1.16% C&N Bank Nonowner Occupied CRE / Tier 1 Capital Plus ACL1 249.8% As of or For the Nine Months Ended September 30, 2026: Annualized Return on Average Assets (ROAA) 1.30% Annualized Return on Average Equity (ROAE) 11.86% Annualized Return on Average Tangible Common Equity (ROATCE)1 14.97% Efficiency Ratio1 59.22% Earnings Per Share (EPS) $1.72 Book Value Per Share $19.13 Tangible Book Value Per Share1 $15.20 ¹ See GAAP to Non-GAAP reconciliations ² Defined as non-accrual loans + all loans that are 90 days past due + OREO |
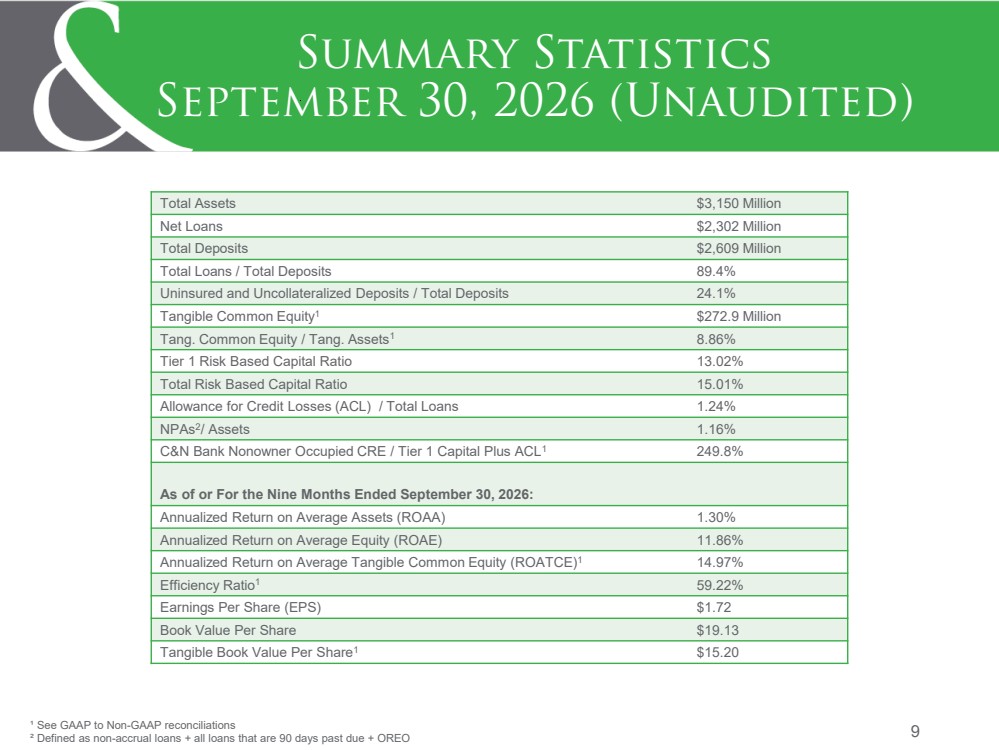
| 10 Strong Historical Profitability Net Income ($M) Efficiency Ratio (%) ROAA (%) Net Interest Margin (%) 1) Annualized 2) Reference GAAP to Non GAAP reconciliation pages in appendix 3) YTD 9/2026 information is unaudited Non-GAAP GAAP Adjusted2 Non-GAAP GAAP Adjusted2 69.51% 68.04% 64.27% 59.22% 2023Y 2024Y 2025Y YTD 9/2026¹ 3.47 3.30 3.61 4.06 2023Y 2024Y 2025Y YTD 9/2026¹ $24.1 $26.0 $23.4 $40.8 $25.4 $29.8 2023Y 2024Y 2025Y YTD 9/2026¹ 0.98 1.00 0.85 1.30 1.03 1.09 2023Y 2024Y 2025Y YTD 9/2026¹ |
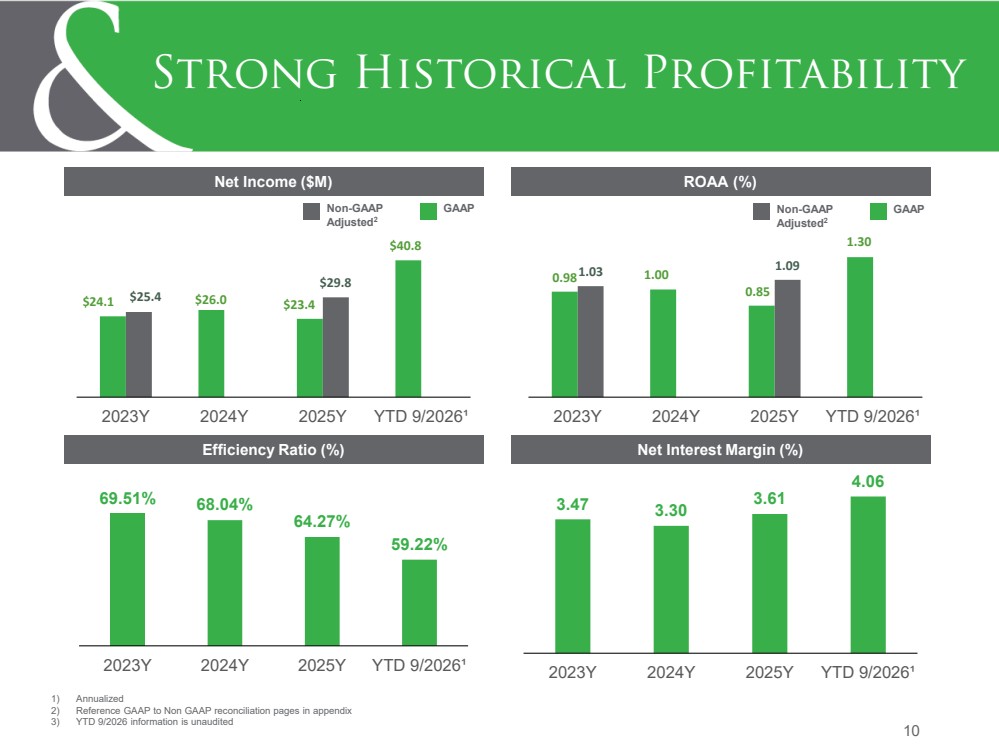
| 11 Pre-tax Pre-provision Net Revenue Minus Net Charge-Offs 1) YTD 9/2026 information is unaudited and annualized 2) See GAAP to NON-GAAP reconciliation in appendix. PPNR – Net Charge-Offs ($M) $33.2 $33.3 $42.5 $48.8 2023Y 2024Y 2025Y YTD 9/2026¹ |
| 12 Net Interest Margin Trend (Unaudited) Net Interest Margin (%) 3.62% 3.84% 3.98% 4.07% 4.13% 2025 Q3 2025 Q4 2026 Q1 2026 Q2 2026 Q3 |
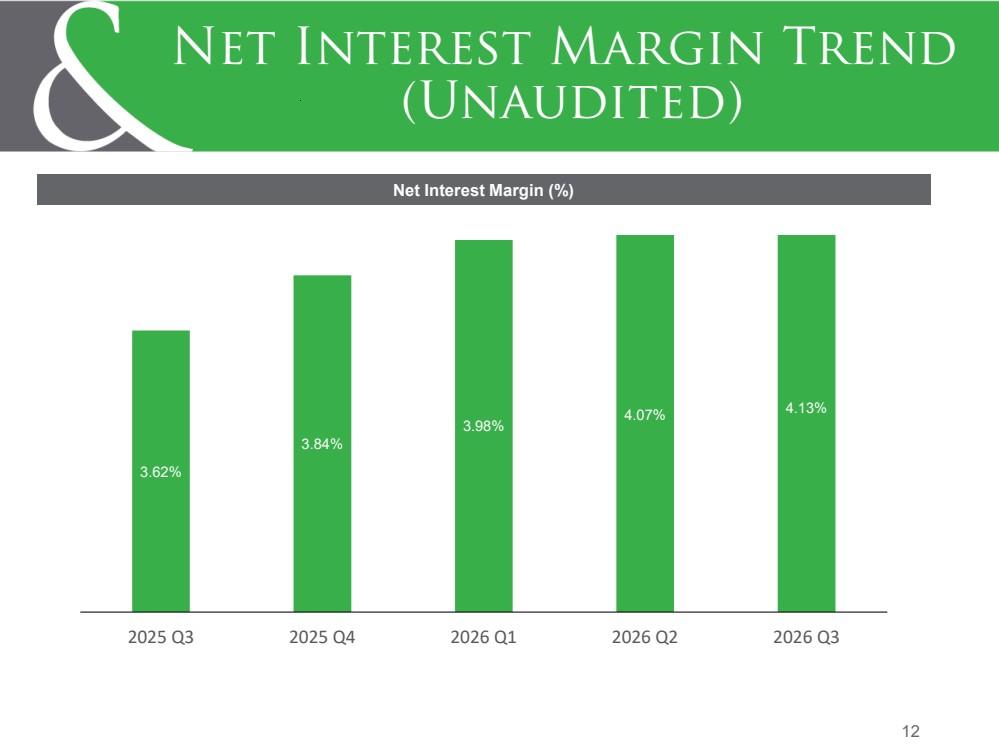
| 13 Average Loan Yield and Deposit Cost (Unaudited) 1) Noninterest-bearing and interest-bearing deposits are included in the calculation of average deposit cost. 6.14% 6.22% 6.24% 6.29% 6.40% 1.76% 1.68% 1.59% 1.53% 1.56% 2025 Q3 2025 Q4 2026 Q1 2026 Q2 2026 Q3 1.00% 1.50% 2.00% 2.50% 3.00% 4.60% 5.10% 5.60% 6.10% 6.60% 2025 Q3 2025 Q4 2026 Q1 2026 Q2 2026 Q3 Average Deposit Cost (%) Average Loan Yield (%) Total Yield on Loans Total Deposit Cost |
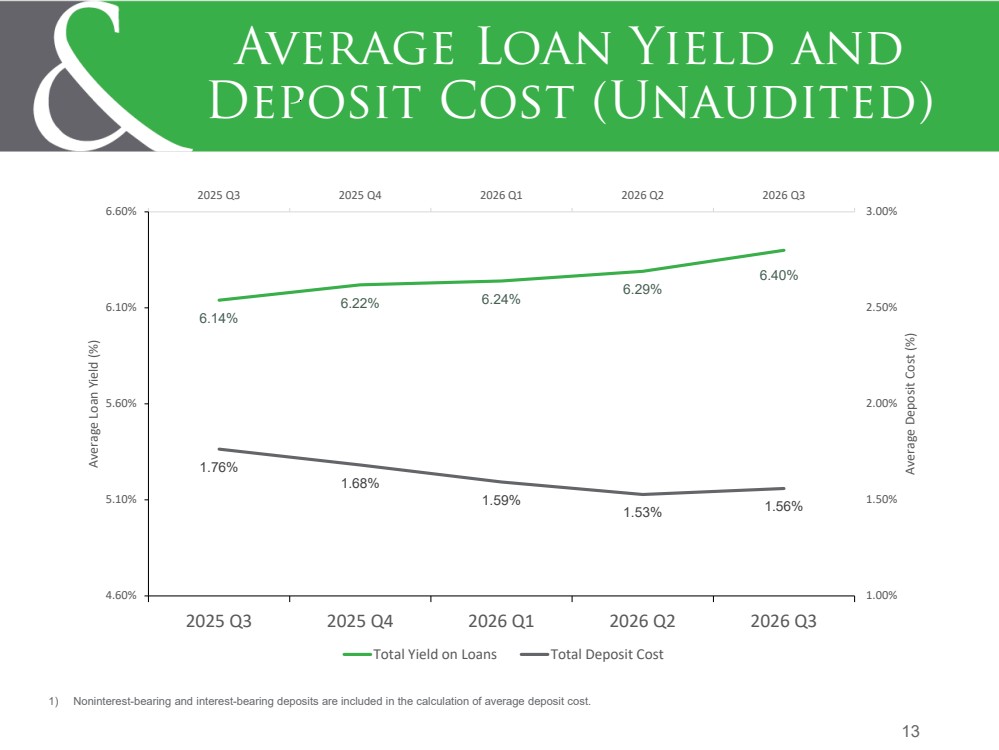
| 14 Diversified Revenue: Meaningful Contribution of Fee Income 1) Annualized returns on tax-exempt securities and loans are presented on a fully taxable-equivalent basis using a 21% marginal income tax rate. Increase in cash surrender value of life insurance for 2023 excludes enhancement fee of $2.1 million. Reference GAAP to non-GAAP reconciliation in the Appendix. 2) Noninterest income is unaudited and annualized for purposes of the ratio for the 9 months ended September 30, 2026. Dollars in Thousands For the Year Ended, Nine Months Ended 2023Y 2024Y 2025Y September 30,2026 Trust Revenue 7,413 7,928 8,212 6,515 Brokerage and Insurance Revenue 1,675 2,271 2,313 2,159 Service Charges on Deposit Accounts 5,567 5,867 5,976 5,196 Interchange Revenue from Debit Card Transactions 4,160 4,276 4,623 3,962 Net Gains from Sales of Loans 723 1,158 1,483 1,706 Loan Servicing Fees, Net 602 649 643 517 Increase in Cash Surrender Value of Life Insurance 603 1,830 1,927 1,579 Other Noninterest Income 4,610 5,230 5,637 5,684 Total Noninterest Income, Excluding Realized Gains and Losses on Securities and Income from BOLI Enhancement (1) 25,353 29,209 30,814 27,318 Total: Net Interest Income (2) 81,319 79,934 92,735 88,980 Plus: Noninterest Income, Excluding Realized Gains 25,353 29,209 30,814 27,318 Operating Revenue 106,672 109,143 123,549 116,298 Total Noninterest Income, As Adjusted / Operating Revenue (%) 23.77% 26.76% 24.94% 23.49% Total Noninterest Income, As Adjusted / Average Assets (%) 1.03% 1.13% 1.12% 1.16% |
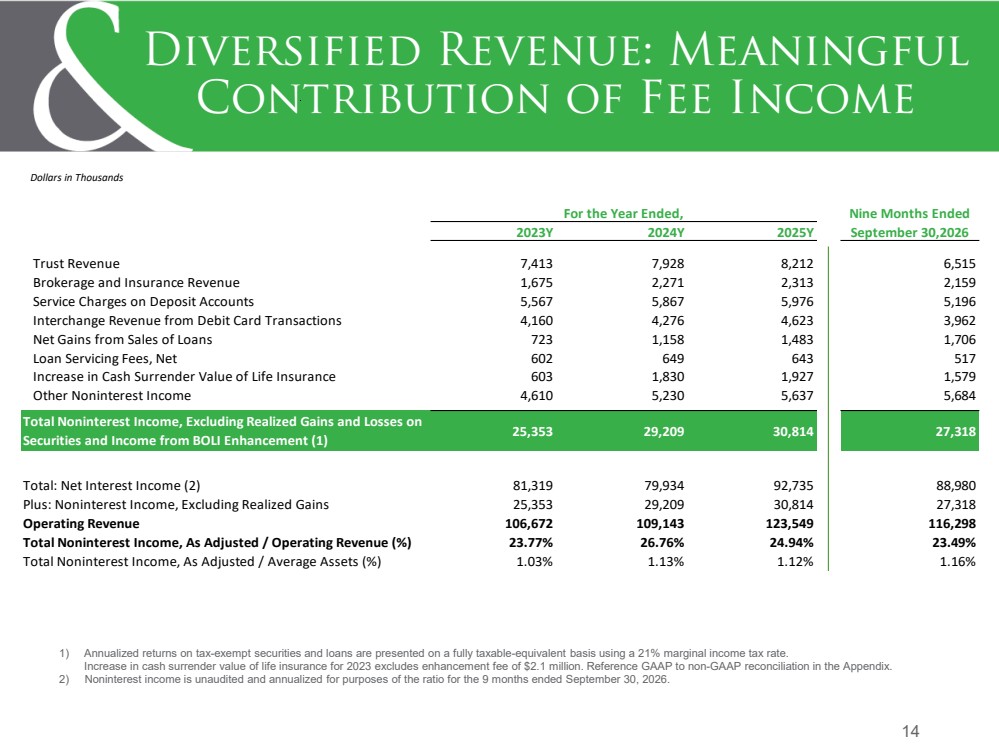
| 15 Targeted Balance Sheet Growth Total Assets ($M) Total Deposits ($M) Total Loans and Leases ($M) Total Equity ($M) CAGR2: 8.5% 1) 2026Q3 information is unaudited 2) CAGR calculated from 2023Y to 2026Q3 CAGR2: 8.8% CAGR2: 9.8% CAGR2: 10.3% $2,516 $2,611 $3,132 $3,150 2023Y 2024Y 2025Y 2026Q3 $1,848 $1,896 $2,354 $2,331 2023Y 2024Y 2025Y 2026Q3 $262 $275 $342 $343 2023Y 2024Y 2025Y 2026Q3 $2,015 $2,094 $2,565 $2,609 2023Y 2024Y 2025Y 2026Q3 |
| • Diversified strategy across lending products and geographies • Relationship based lending strategy with strong credit culture • MRQ fully taxable-equivalent yield on loans of 6.40% • At 9/30/26, approximately 34% of all loans are fixed rate and 66% are adjustable rate 16 Diversified Lending Strategy & Portfolio Composition (Unaudited) 2026Q3 Gross Loans: $2,331M 2026Q3 Commercial Loans: $1,771M 2026Q3 Nonowner Occupied CRE: $543M CRE - Nonowner occupied 39% CRE - Owner occupied 14% All other commercial loans 23% Residential mortgage loans 19% Consumer loans 5% Nonowner occupied 31% Multi-family 9% 1-4 family - commercial purpose 11% Owner occupied 19% C&I 7% Commercial lines of credit 9% Political subdivisions 5% Commercial construction and land 5% Other commercial loans 4% Office 20% Retail 19% Industrial 18% Hotels 14% Mixed Use 12% Self Storage 10% Other 8% |
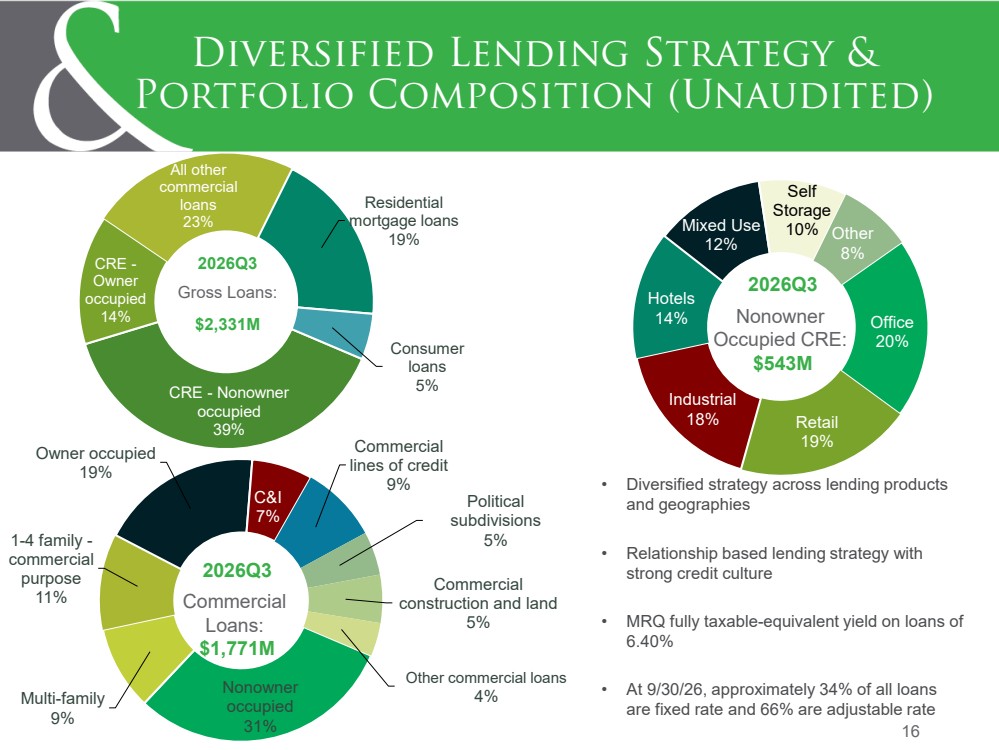
| 17 Commercial Loans – Maturity & Repricing Summary Loan balances as of 9/30/2026 $ in 000s Maturity or Repricing Frequency 3 Months or Less 3 to 12 Months 1 to 3 Years 3 to 5 Years 5 to 15 Years Over 15 Years Totals Number of Loans Average Loan Size Nonowner Occupied $ 83,436 $ 114,455 $ 175,005 $ 147,055 $ 22,665 $ 35 $ 542,651 474 $ 1,145 Multi-family (5 or more) residential $ 24,352 $ 24,302 $ 53,310 $ 59,331 $ 8,362 $ 980 $ 170,637 209 $ 816 1-4 Family - Commercial Purpose $ 17,646 $ 31,369 $ 64,870 $ 69,091 $ 10,357 $ 970 $ 194,303 1,065 $ 182 Total Commercial Real Estate - Nonowner Occupied $ 125,434 $ 170,126 $ 293,185 $ 275,477 $ 41,384 $ 1,985 $ 907,591 1,748 $ 519 Commercial Real Estate - Owner Occupied $ 48,700 $ 54,160 $ 99,798 $ 105,746 $ 21,348 $ 503 $ 330,255 599 $ 551 Commercial and industrial $ 11,431 $ 9,602 $ 34,001 $ 53,853 $ 13,966 $ 436 $ 123,289 771 $ 160 Commercial Lines of Credit $ 155,741 $ 40 $ 56 $ 931 $ - $ - $ 156,768 755 $ 208 (1) Political subdivisions $ 7,892 $ 5,675 $ 6,422 $ 14,211 $ 49,641 $ 4,403 $ 88,244 60 $ 1,471 Commercial construction and land $ 60,772 $ 23,070 $ 8,281 $ 5,163 $ 259 $ - $ 97,545 80 $ 1,219 Other commercial loans $ 13,597 $ 7,030 $ 6,668 $ 31,327 $ 6,900 $ 2,031 $ 67,553 220 $ 307 Total All Other Commercial Loans $ 249,433 $ 45,417 $ 55,428 $ 105,485 $ 70,766 $ 6,870 $ 533,399 1,886 $ 283 Total - All Commercial Loans $ 423,567 $ 269,703 $ 448,411 $ 486,708 $ 133,498 $ 9,358 $ 1,771,245 4,233 $ 418 % of All Commercial Loans 24% 15% 25% 27% 8% 1% (1) - Number of loans and average loan size excludes lines of credit with $0 balance outstanding. At 9/30/2026, there were 1,327 lines of credit with $229.3 million in available credit |
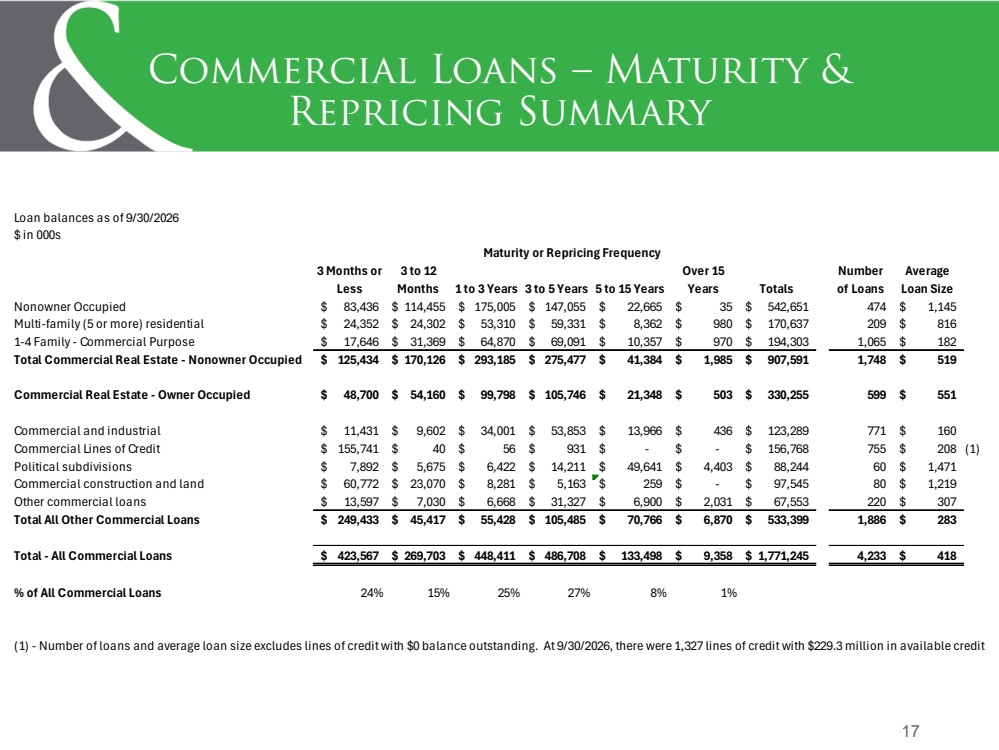
| 18 Investment CRE by Loan-to-Value (LTV) |
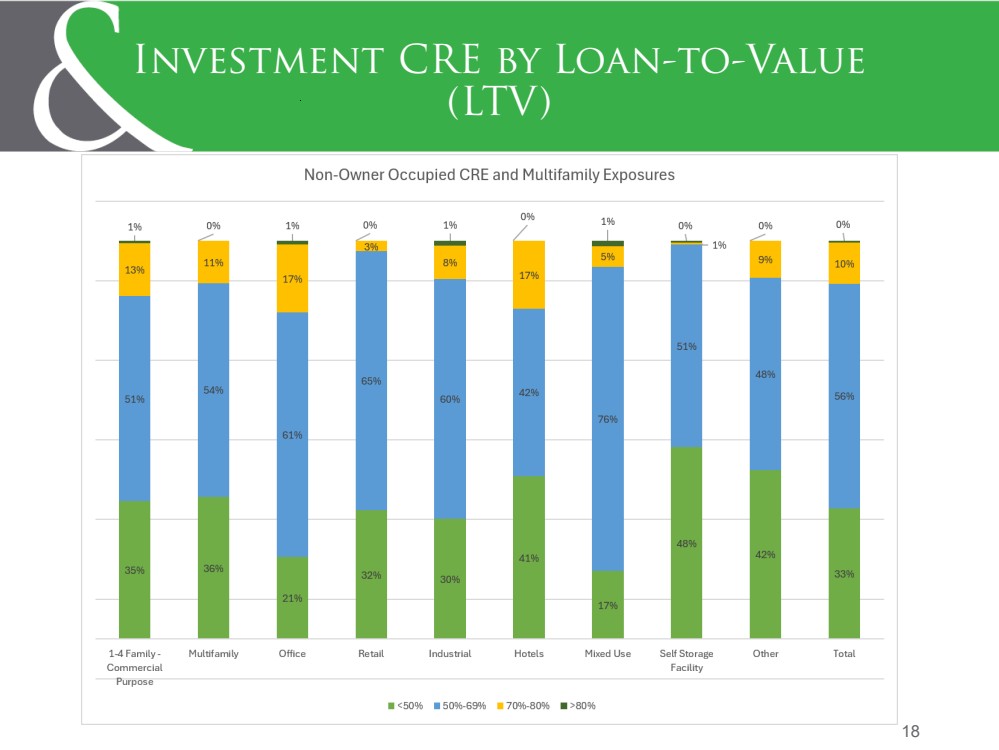
| 19 Well Covered Asset Quality Metrics 1) Reference nonperforming assets detail page in appendix 2) YTD 9/2026 information is unaudited 3) YTD 9/2026 information is annualized. YTD 9/2026 NCOs includes COs related to one non-owner occupied CRE loan of $10.4 million, or 0.59% (annualized). At 9/30/2026, the amortized cost basis of the loan, net of the partial charge-offs, was $5.836 million. NPAs / Assets (%) Allowance for Credit Losses / Total Loans (%) NCOs / Avg. Loans (%) Provision for Credit Losses / NCOs (%) (3) 0.75 0.92 1.06 1.16 2023Y 2024Y 2025Y YTD 9/2026 0.01 0.09 0.08 0.61 2023Y 2024Y 2025Y YTD 9/2026 285 152 344 81 2023Y 2024Y 2025Y YTD 9/2026 1.04 1.06 1.32 1.24 2023Y 2024Y 2025Y YTD 9/2026 |
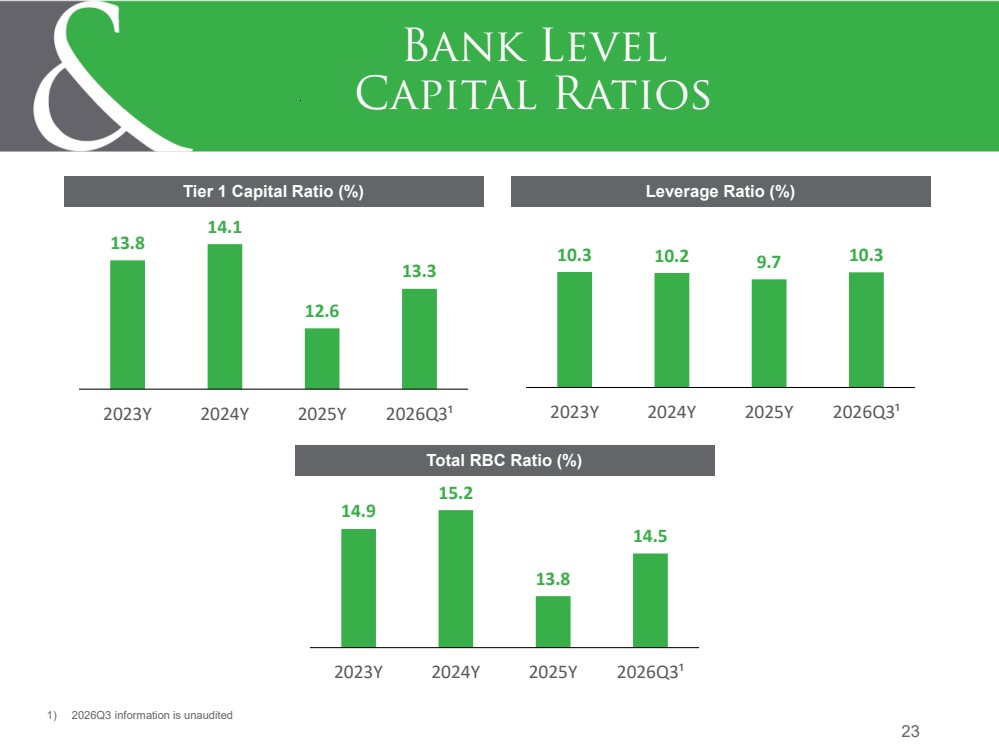
| 20 Nonaccrual Loans & Allowance Summary $ in 000s Total Nonaccrual Loans (1) Nonaccrual Loans with ACL (2) Specific ACL Total Nonaccrual as % of Total Loans Commercial Real Estate - Nonowner Occupied 13,267 1,201 140 0.57% Commercial Real Estate - Owner Occupied 5,390 479 261 0.23% All Other Commercial Loans 11,465 3,603 2,235 0.49% Residential Mortgage 4,334 - - 0.19% Consumer 819 - - 0.04% Total 35,275 5,283 2,636 1.51% (1) Amortized cost as of 9/30/2026 (2) All Commercial loan relationships greater than $400,000 and any residential mortgage or consumer loans of $400,000 or more for which there was at least one extension of credit graded Special Mention or Substandard were individually evaluated by C&N's Watch List Committee for credit loss as of 9/30/2026. |
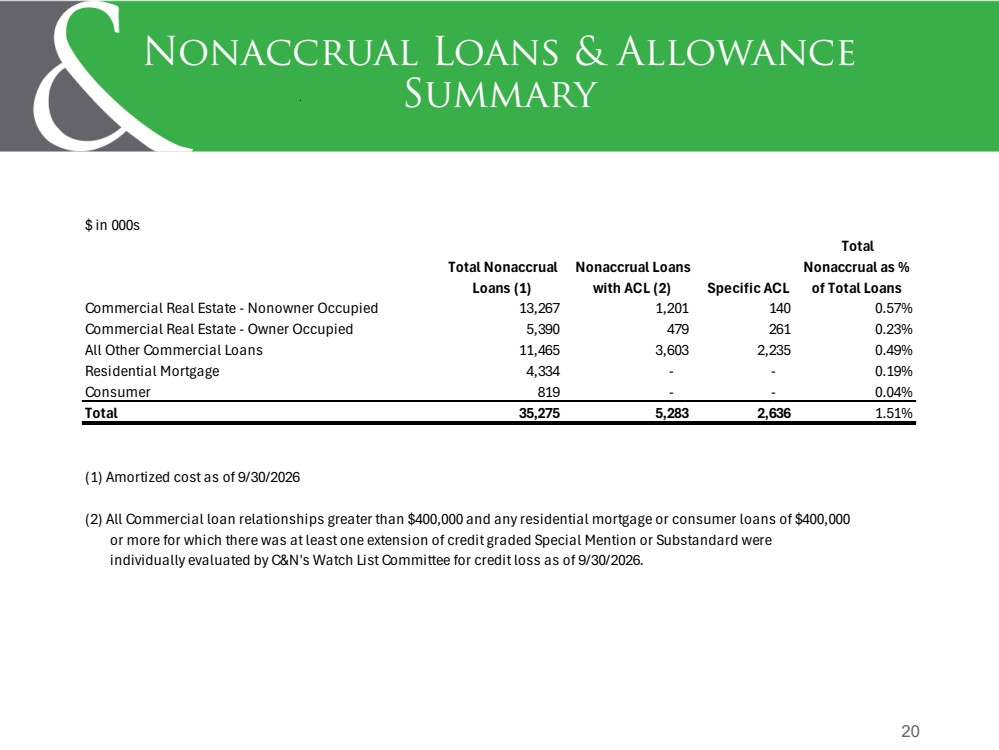
| 21 Strong Core Deposit Base (Unaudited) • No brokered deposits at September 30, 2026 • Total deposits excluding time of $2.02B, which represents 77.3% of total deposits • 1.56% cost of total deposits in three months ended September 30, 2026 • Noninterest-bearing deposits were $538M, and represent 20.6% of total deposits 2026Q3 Total Deposits: $2,609M (Dollars in Thousands) 9/30/2026 Deposits Type Balance % Total MMDA & Savings $742,680 28.5% Interest-Bearing Demand $736,677 28.2% Noninterest-Bearing Demand $537,857 20.6% Time < $250k $386,397 14.8% Jumbo Time $204,901 7.9% Total Deposits $2,608,512 100.0% MMDA & Savings 28.5% Interest-Bearing Demand 28.2% Noninterest-Bearing Demand 20.6% Time < $250k 14.8% Jumbo Time 7.9% |
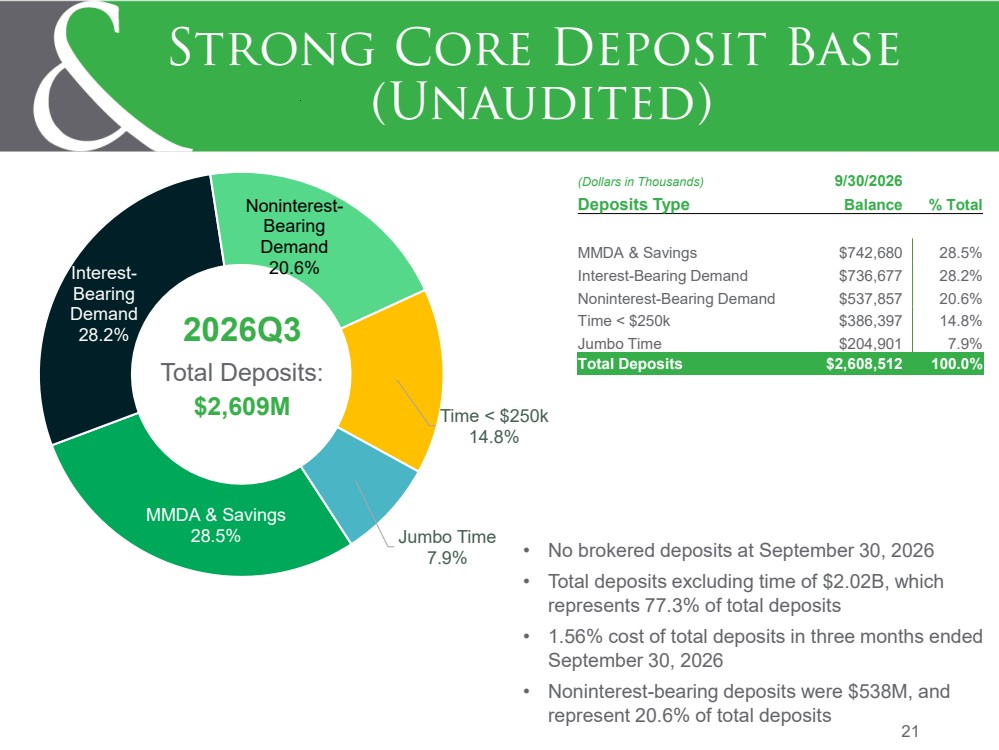
| 22 Holding Company Capital Ratios TCE / TA (%) Tier 1 Capital Ratio (%) Leverage Ratio (%) Total RBC Ratio (%) 1) 2026Q3 information is unaudited 8.4 8.7 8.8 8.9 2023Y 2024Y 2025Y 2026Q3¹ 9.9 9.8 9.3 10.1 2023Y 2024Y 2025Y 2026Q3¹ 15.7 16.0 14.5 15.0 2023Y 2024Y 2025Y 2026Q3¹ 13.3 13.6 12.2 13.0 2023Y 2024Y 2025Y 2026Q3¹ |
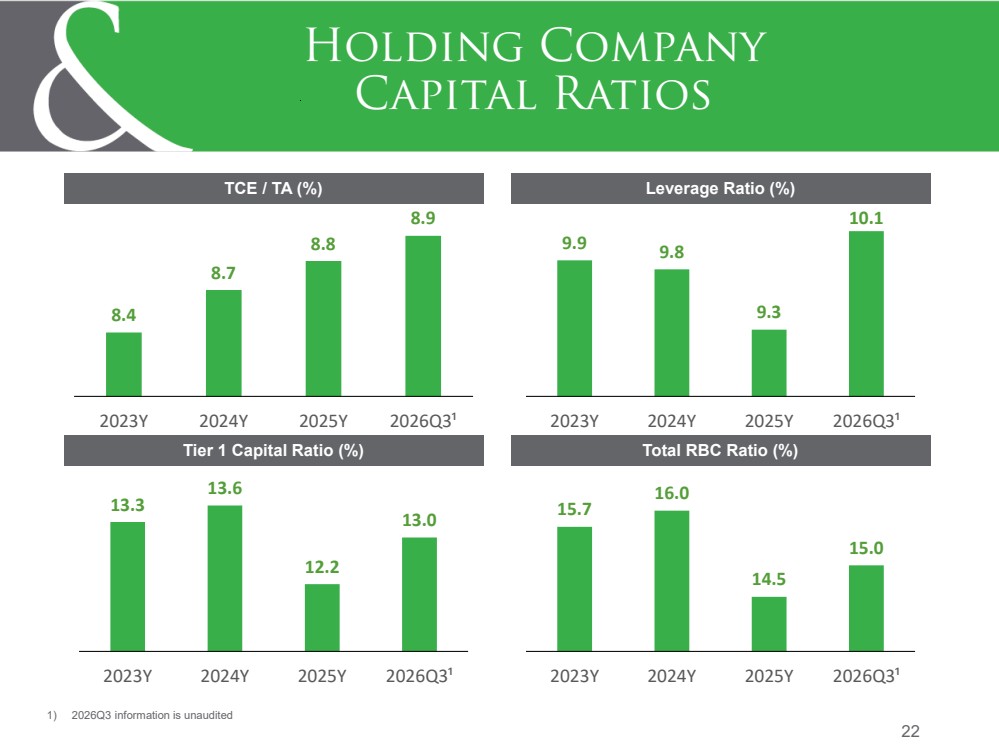
| 23 Bank Level Capital Ratios Tier 1 Capital Ratio (%) Leverage Ratio (%) Total RBC Ratio (%) 1) 2026Q3 information is unaudited 13.8 14.1 12.6 13.3 2023Y 2024Y 2025Y 2026Q3¹ 10.3 10.2 9.7 10.3 2023Y 2024Y 2025Y 2026Q3¹ 14.9 15.2 13.8 14.5 2023Y 2024Y 2025Y 2026Q3¹ |
| Appendix 24 |
| • J. Bradley Scovill - Mr. Scovill has served as President and Chief Executive Officer of the Corporation and Citizens & Northern Bank (the “Bank”) since March 2, 2015. Prior to joining the Corporation and Bank, Mr. Scovill most recently served as President and Chief Operating Officer of Kish Bancorp, Inc. and Kish Bank headquartered in Belleville, Pennsylvania, where he was an executive for more than five (5) years. Prior to Kish, Mr. Scovill held various executive management positions with both PNC Bank and Sterling Financial Corporation, headquartered in Lancaster, Pennsylvania. Mr. Scovill received a Bachelor of Science degree in Finance from The Pennsylvania State University. • Mark Hughes - Mr. Hughes serves as Treasurer of the Corporation and Executive Vice President and Chief Financial Officer of the Bank. Mr. Hughes served as Interim President and Chief Executive Officer of the Corporation and Bank from August 12, 2014 through March 1, 2015. Effective March 2, 2015, Mr. Hughes resigned from the positions of Interim President and Chief Executive Officer of the Corporation and Bank and was appointed to the positions he had formerly held as Treasurer of the Corporation since November 2000 and Executive Vice President and Chief Financial Officer of the Bank since August 2000. Mr. Hughes received a Bachelor of Arts degree in Accounting from Lycoming College. • Alexander Balagour - Mr. Balagour has served as Executive Vice President and Chief Information Officer of the Bank since May 2021. Prior to joining the Bank, Mr. Balagour most recently served as the Chief Information Officer at Customers Bank in Reading, PA, where he led the organization through the transformation of their sales and lending technology, data analytics and customer experience. Mr. Balagour received a Bachelor of Science degree in Computer Science from Arcadia University, where he earned the Sigma Zeta Award in Computer Science, given to the top-graduating student for academic excellence. He went on to receive his Executive Masters in Technology Management from Wharton School and School of Engineering from the University of Pennsylvania. • Stan Dunsmore - Mr. Dunsmore has served as Executive Vice President and Chief Credit Officer of the Bank since January 2015. Previously, Mr. Dunsmore served as Vice President and Commercial Loan Sales Officer of the Bank since May 2007. Prior to the May 2007 acquisition of Citizens Trust Company by Citizens & Northern Bank, Mr. Dunsmore served as Vice President and Chief Lending Officer of Citizens Trust Company since 1995. Mr. Dunsmore received a Bachelor of Science degree in Management Science from Lock Haven University of Pennsylvania. 25 Executive Officer Biographies |

| • Harold (Hal) Hoose - Executive Vice President and Chief Revenue Officer of the Bank since February 2021; formerly Executive Vice President and Director of Lending of the Bank since March of 2005. Prior to becoming the Director of Lending, Mr. Hoose was a regional commercial relationship manager for C&N since August of 1997. Prior to that, Mr. Hoose began his banking career in 1990 as a management trainee with Commonwealth Bank (Williamsport PA) and moved to the credit/lending area of the bank in April 1993. Mr. Hoose received his Bachelor of Science degree from Mansfield University and completed the Graduate School of Banking at the University of Colorado. • Glenn R. James, Esq. - Executive Vice President, General Counsel and Corporate Secretary of the Bank since June 2023. Prior to joining the Bank, Mr. James was a Director, Executive Vice President, and General Counsel of Noah Bank (Elkins Park PA). Prior to that Mr. James served, successively, as a financial services industry partner in the firms of KPMG, Grant Thornton LLP, ParenteBeard LLC, and BDO USA. Mr. James took a bachelor’s degree in business administration from Temple University and a Juris Doctorem degree from the Villanova University School of Law. • John Reber - Executive Vice President and Chief Risk Management Officer of the Bank since February 2021; formerly Executive Vice President and Director of Risk Management of the Bank since January 2011; formerly Vice President and Director of Risk Management of the Bank since June 2004. Prior to joining C&N, Mr. Reber held various staff and management positions in credit, lending and risk management with SunBank, headquartered in Lewisburg, Pennsylvania. Mr. Reber received a Bachelor of Science degree in Finance from Bloomsburg University of Pennsylvania. • Thomas L. Rudy, Jr. - Executive Vice President, Chief Delivery Officer and Region President of the Bank since February 2021; formerly Executive Vice President and Director of Branch Delivery of the Bank since February 2004; President of C&N Financial Services, LLC since January 2000; President of Bucktail Life Insurance Company since May 2018. Mr. Rudy received a Bachelor of Science degree in Finance from The Pennsylvania State University and is a graduate of the ABA Graduate School of Banking at the Wharton School, University of Pennsylvania. 26 Executive Officer Biographies |
| • David S. Runk- Executive Vice President and Strategic Advisor of the Bank since October 2025. Prior to his employment with C&N, Mr. Runk most recently served as Chief Executive Officer of Susquehanna Community Bank since 2011. Prior to this time, Mr. Runk was Chief Risk Officer of Pennian Bank from 2008-2011, Chief Operating Officer of Omega Bank from 2005- 2008, and Chief Financial Officer of Kish Bank from 1994-2005. He began his career as a CPA with Peat Marwick after graduation from Penn State University in 1986. • Blair Rush - Executive Vice President and Southeast Region President of the Bank since February 2021; formerly Southeast Region President of the Bank since July 2020 with the acquisition of Covenant Bank. Prior to his employment with C&N, Mr. Rush most recently served as President & Chief Operating Officer of Covenant Bank since April 2016. Prior to this time, he was the Eastern Region President with National Penn Bank. He joined National Penn through their acquisition of FirstService Bank in February 2003, where he was an Executive Vice President and was one of four original officers of the de novo FirstService Bank. Prior to FirstService Bank, Blair was a Vice President with CoreStates and Bucks County Bank where he started his forty-year banking career. Blair is a graduate of Delaware Valley College with a Bachelor of Science degree in Business Administration and the Pennsylvania Bankers Association’s Central Atlantic Advanced School of Banking. • William F. Van Sant III- Mr. Van Sant has served as Executive Vice President and Chief Wealth Officer of the Bank since May 2026. Prior to his employment with C&N, Mr. Van Sant spent more than 20 years with Girard, the wealth management division of Univest Bank & Trust Company. During his tenure, Mr. Van Sant served as a Managing Director of Wealth Management and as a member of the company’s Senior Leadership Team. Mr. Van Sant also served as Executive Director of the Univest Foundation, helping bring charitable organizations and donors together through the promotion of philanthropy. Mr. Van Sant holds a Bachelor of Arts in Economics and Business Administration from Ursinus College in 2001. and is a Certified Financial Planner professional (CFP®), an Accredited Investment Fiduciary® (AIF®), and a Certified Exit Planning Advisor (CEPA®). He also maintains FINRA Series 7, 24, 51, and 63 licenses. • Tracy Watkins - Ms. Watkins has served as Executive Vice President and Chief Human Resources Officer of the Bank since February 2021; formerly, Executive Vice President and Director of Human Resources of the Bank since January 2018; formerly Vice President and Director of Human Resources of the Bank since 2010, and HRIS (Human Resources Information System) & Employee Relations Manager since 2005 after joining Citizens & Northern Bank in 2003. Ms. Watkins holds a B.S. in English/Secondary Education from Juniata College, a Certificate from The Institute for Paralegal Training in Philadelphia, PA and is a Graduate of the PBA Advanced School of Banking and The Graduate School of Banking Human Resource Management School as well as being a Certified Employee Benefit Specialist (CEBS – RPA, GBA) and Senior Professional in Human Resources (SPHR). 27 Executive Officer Biographies |
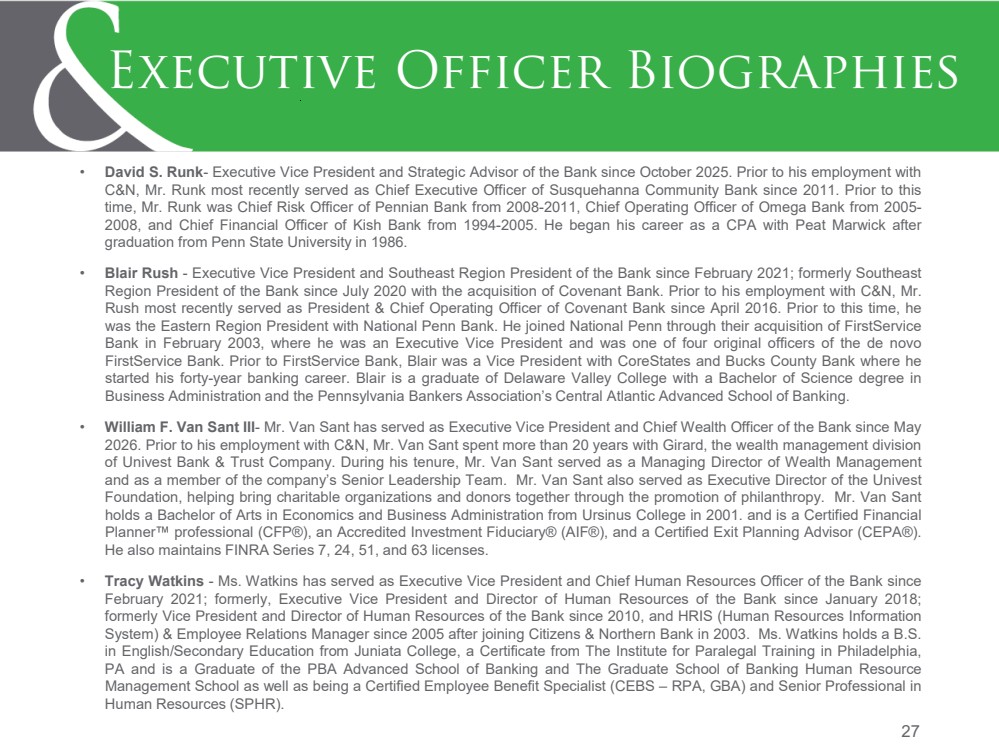
| Source: FDIC Summary of Deposits; data as of June 30, 2026 28 Strong Presence in Legacy Markets Support Our Continued Expansion Susquehanna Pa 16% Southeastern Pa 17% Southcentral PA Northern Tier 65% Total Deposits ($000) As of June 30, 2026 Region C&N Deposits % of Total C&N Deposits Total Market Deposits C&N Market Share Northern Tier 1,688,615 64.68% 7,911,600 21.34% Susquehanna PA 417,010 15.97% 4,019,768 10.37% Southeastern PA 446,260 17.09% 42,571,452 1.05% Southcentral PA 58,667 2.25% 28,317,930 0.21% 2,610,552 100.00% 82,820,750 3.15% Northern Tier Steuben County, NY 80,646 3.09% 1,448,433 5.57% Bradford County, PA 561,324 21.50% 1,607,577 34.92% Cameron County, PA 39,085 1.50% 93,135 41.97% Lycoming County, PA 327,503 12.55% 3,001,023 10.91% Potter County, PA 83,401 3.19% 340,695 24.48% Sullivan County, PA 125,768 4.82% 188,639 66.67% Tioga County, PA 470,888 18.04% 1,232,098 38.22% 1,688,615 64.68% 7,911,600 21.34% Susquehanna PA Northumberland Cty 92,935 3.56% 1,693,174 5.49% Snyder County 27,479 1.05% 1,190,729 2.31% Union County 296,596 11.36% 1,135,865 26.11% 417,010 15.97% 4,019,768 10.37% Southeastern PA Bucks County 415,779 15.93% 26,218,546 1.59% Chester County 30,481 1.17% 16,352,906 0.19% 446,260 17.09% 42,571,452 1.05% Southcentral PA Lancaster County 13,195 0.51% 18,876,407 0.07% York County 45,472 1.74% 9,441,523 0.48% 58,667 2.25% 28,317,930 0.21% |
| 29 Loan Summary by Region Loan balances as of 9/30/2026 $ in 000s Commercial Mortgage Consumer Total % of Total Loans Northern Region $ 394,575 $ 335,802 $ 52,721 $ 783,098 34% Southeast Region $ 916,085 $ 35,117 $ 27,582 $ 978,784 42% Southcentral Region $ 225,611 $ 6,414 $ 3,345 $ 235,370 10% Susquehanna Region $ 152,363 $ 54,279 $ 27,534 $ 234,176 10% Other / Out of Market $ 82,611 $ 11,276 $ 6,080 $ 99,967 4% Totals $ 1,771,245 $ 442,888 $ 117,262 $ 2,331,395 Northern Region, 34% Southeast Region, 42% Southcentral Region, 10% Susquehanna Region, 10% Other / Out of Market, 4% % of Total Loans |
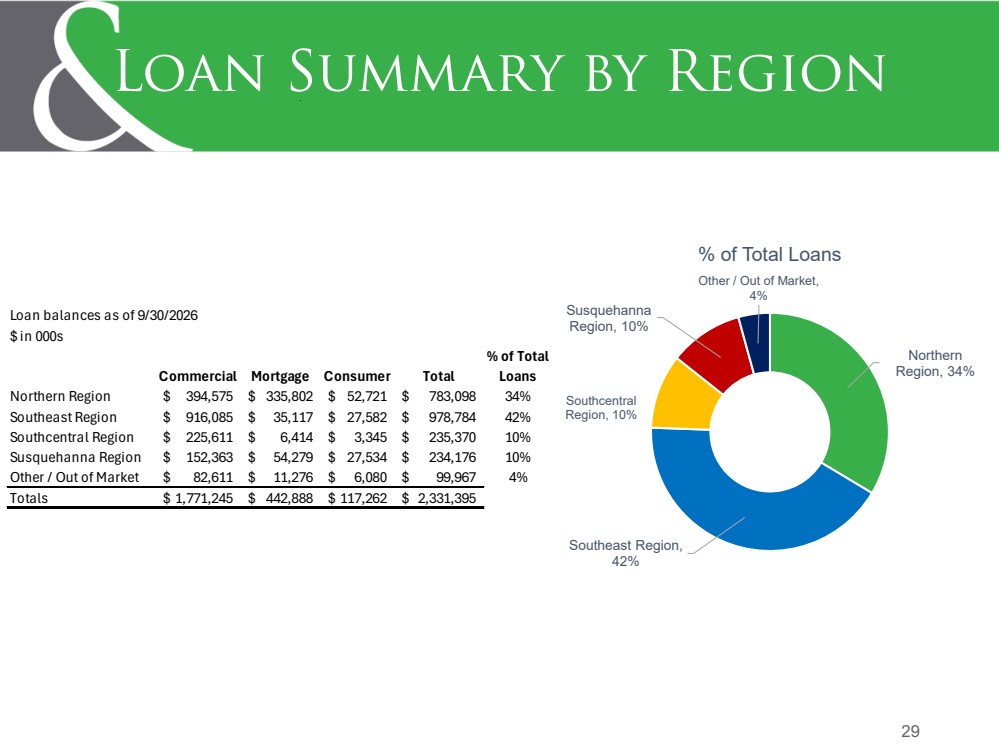
| 30 Consolidated Balance Sheet Data At September 30, 2023 2024 2025 2026 Assets ($000) Cash and Due from Banks 56,878 126,174 46,056 99,992 Available-for-sale Debt Securities 415,755 402,380 506,575 490,474 Total Cash & Securities 472,633 528,554 552,631 590,466 Gross Loans Held for Investment 1,848,139 1,895,848 2,354,365 2,331,395 Allowance for Credit Losses (19,208) (20,035) (31,048) (28,952) Total Net Loans 1,828,931 1,875,813 2,323,317 2,302,443 Bank-owned Life Insurance 63,674 51,214 61,094 62,673 Bank Premises and Equipment, Net 21,632 21,338 27,755 27,113 Foreclosed Assets Held for Sale (OREO) 478 181 189 336 Deferred Tax Asset, Net 17,441 19,098 17,615 22,186 Goodwill and Core Deposit Intangibles, Net 54,974 54,585 74,884 72,440 Total Other Assets 55,821 59,870 74,984 72,547 Total Assets 2,515,584 2,610,653 3,132,469 3,150,204 3 Liabilities ($000) Non-Interest Bearing 490,554 486,566 531,442 537,857 Interest Bearing 1,524,252 1,607,343 2,033,274 2,070,655 Total Deposits 2,014,806 2,093,909 2,564,716 2,608,512 FHLB Borrowings and Repurchase Agreements 172,211 167,939 149,553 138,458 Senior and Subordinated Debt 39,548 39,730 39,919 25,000 Total Other Liabilities 26,638 33,791 36,567 34,914 Total Liabilities 2,253,203 2,335,369 2,790,755 2,806,884 Equity ($000) Equity, Excluding AOCI (1) 300,818 312,045 364,509 382,083 AOCI (1) (38,437) (36,761) (22,795) (38,763) Total Equity 262,381 275,284 341,714 343,320 Total Liabilities and Equity 2,515,584 2,610,653 3,132,469 3,150,204 (1) Accumulated Other Comprehensive Income (Loss) (2) September 30, 2026 information is unaudited At December 31, |
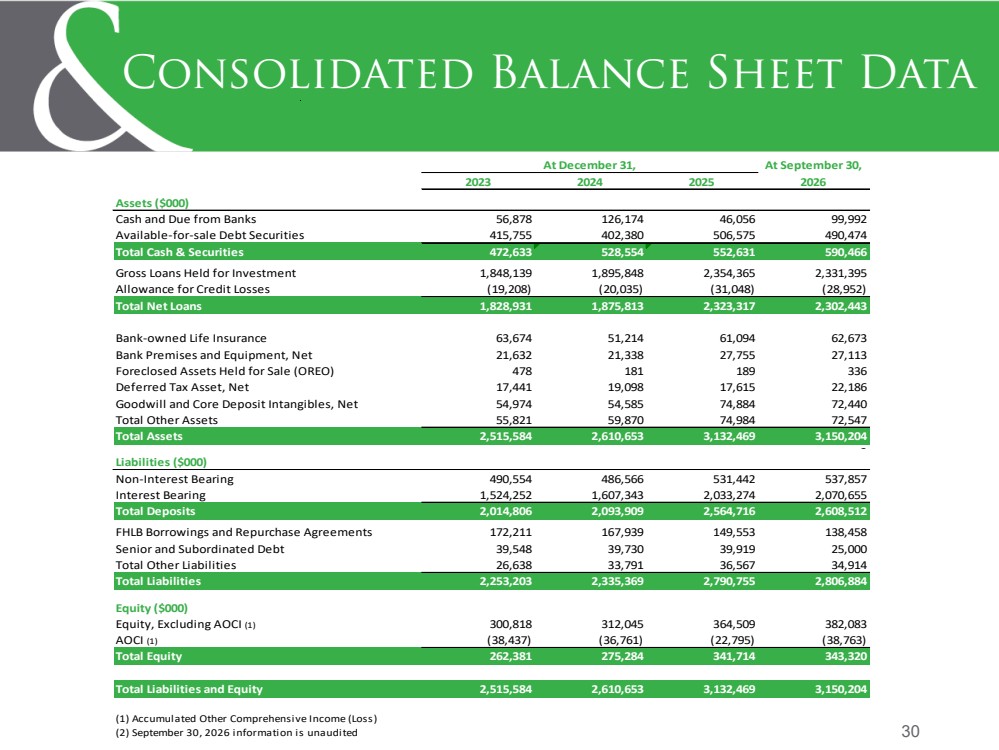
| 31 Consolidated Income Statement Data For the Year Ended December 31, 9 Months Ended 2023 2024 2025 September 30, 2026 Net Interest Income 80,400 79,115 91,853 88,277 Provision for Credit Losses 186 2,195 6,073 8,585 Trust Revenue 7,413 7,928 8,212 6,515 Brokerage and Insurance Revenue 1,675 2,271 2,313 2,159 Service Charges on Deposit Accounts 5,567 5,867 5,976 5,196 Interchange Revenue from Debit Card Transactions 4,160 4,276 4,623 3,962 Net Gains from Sale of Loans 723 1,158 1,483 1,706 Loan Servicing Fees, Net 602 649 643 517 Increase in Cash Surrender Value of Life Insurance 603 1,830 1,927 1,579 Other Noninterest Income 4,610 5,230 5,637 5,684 Total Noninterest Income, Excluding Income from Enhancement on Purchase of Bank-Owned Life Insurance and Realized Gain (Loss) on Securities 25,353 29,209 30,814 27,318 Compensation & Benefits 44,195 44,930 47,386 39,215 Total Noninterest Expense, Excluding Merger-Related Expenses 74,148 74,258 80,049 68,877 Realized (Loss) Gain on Securities (3,036) - 38 29 Income from Enhancement on Purchase of Bank-Owned Life Insurance 2,100 - - - Merger-Related Expenses - - 7,940 - Income Before Income Tax Provision 30,483 31,871 28,643 38,162 Income Tax Provision 6,335 5,913 5,216 7,547 Net Income 24,148 25,958 23,427 30,615 (1) September 30, 2026 information is unaudited |
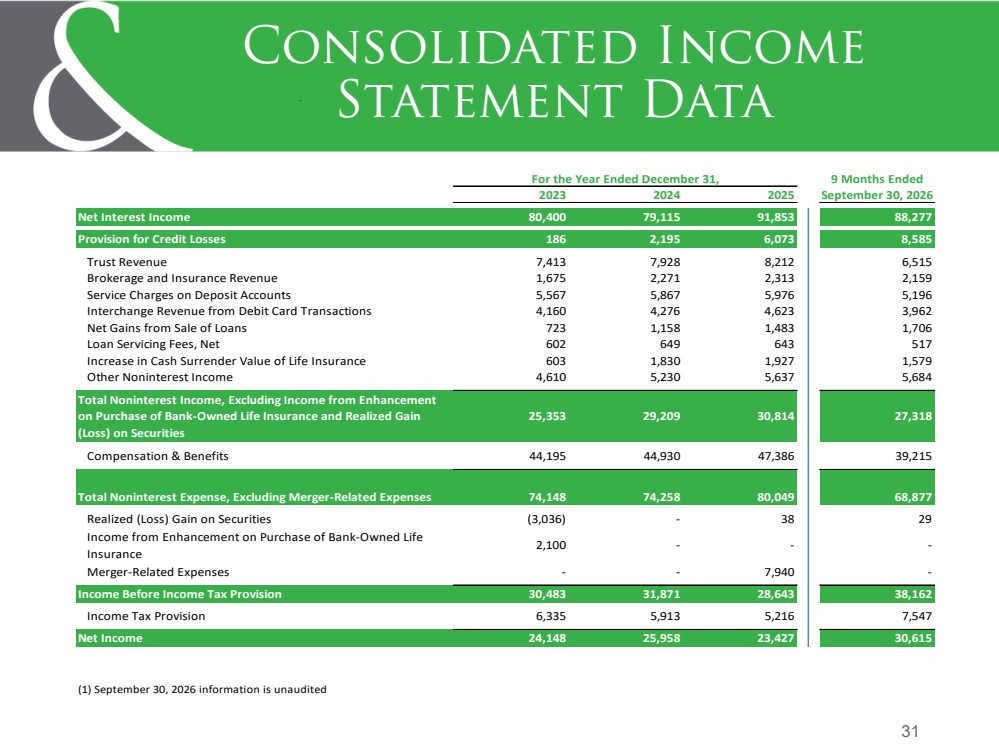
| 32 Net Interest Margin Trend (Unaudited) Net Interest Margin Trends (Dollars in Thousands) 3 Months 3 Months 3 Months 3 Months 3 Months Ended Rate of Ended Rate of Ended Rate of Ended Rate of Ended Rate of 9/30/2025 9/30/2025 Return/ 12/31/2025 12/31/2025 Return/ 3/31/2026 3/31/2026 Return/ 6/30/2026 6/30/2026 Return/ 9/30/2026 9/30/2026 Return/ Average Quarterly Cost of Average Quarterly Cost of Average Quarterly Cost of Average Quarterly Cost of Average Quarterly Cost of Balance Inc/Exp Funds % Balance Inc/Exp Funds % Balance Inc/Exp Funds % Balance Inc/Exp Funds % Balance Inc/Exp Funds % Average total earning assets and net interest income under U.S. GAAP $2,462,776 $22,263 3.59% $2,962,499 $28,473 3.81% $2,925,616 $28,454 3.94% $2,941,044 $29,618 4.04% $2,926,322 $30,205 4.10% Add: Fully taxable-equivalent (FTE) adjustment on tax-exempt securities 81 82 85 87 84 Add: Fully taxable-equivalent (FTE) adjustment on tax-exempt loans 137 151 146 150 151 Net Interest Margin, FTE $2,462,776 $22,481 3.62% $2,962,499 $28,706 3.84% $2,925,616 $28,685 3.98% $2,941,044 $29,855 4.07% $2,926,322 $30,440 4.13% |
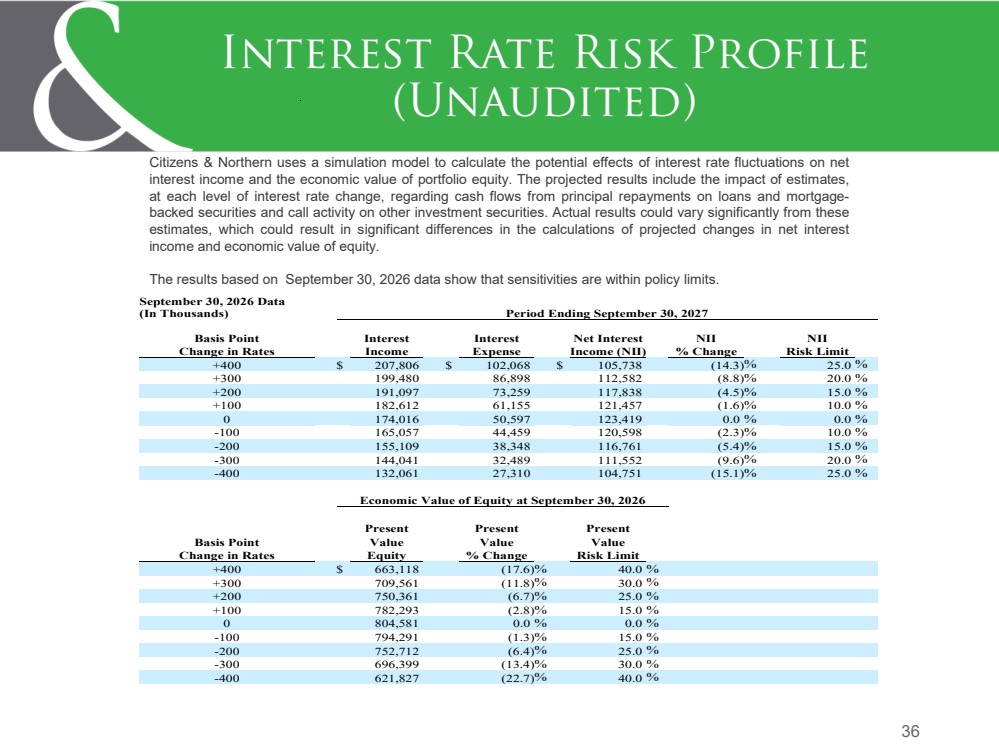
| 33 Average Loan Yield and Deposit Cost Details (Unaudited) Average Loan Yield and Deposit Cost (Dollars in Thousands) 3 Months 3 Months 3 Months 3 Months 3 Months Ended Rate of Ended Rate of Ended Rate of Ended Rate of Ended Rate of 9/30/2025 9/30/2025 Return/ 12/31/2025 12/31/2025 Return/ 3/31/2026 3/31/2026 Return/ 6/30/2026 6/30/2026 Return/ 9/30/2026 9/30/2026 Return/ Average Quarterly Cost of Average Quarterly Cost of Average Quarterly Cost of Average Quarterly Cost of Average Quarterly Cost of Balance Inc/Exp Funds % Balance Inc/Exp Funds % Balance Inc/Exp Funds % Balance Inc/Exp Funds % Balance Inc/Exp Funds % Interest and fees on loans under U.S. GAAP $1,926,231 $29,675 6.11% $2,345,504 $36,594 6.19% $2,364,964 $36,260 6.22% $2,382,190 $37,212 6.27% $2,338,696 $37,554 6.37% Add: Fully taxable-equivalent (FTE) adjustment on tax-exempt loans 137 151 146 150 151 Total Interest and fees on loans, FTE equivalent $1,926,231 $29,812 6.14% $2,345,504 $36,745 6.22% $2,364,964 $36,406 6.24% $2,382,190 $37,362 6.29% $2,338,696 $37,705 6.40% Total interest-bearing deposits $1,615,406 $9,456 2.32% $2,089,325 $11,143 2.12% $2,020,060 $10,058 2.02% $2,023,642 $9,820 1.95% $2,035,538 $10,165 1.98% Noninterest-bearing Demand deposits 510,802 0 539,557 0 540,165 0 553,828 0 550,221 0 Total deposits $2,126,208 $9,456 1.76% $2,628,882 $11,143 1.68% $2,560,225 $10,058 1.59% $2,577,470 $9,820 1.53% $2,585,759 $10,165 1.56% |
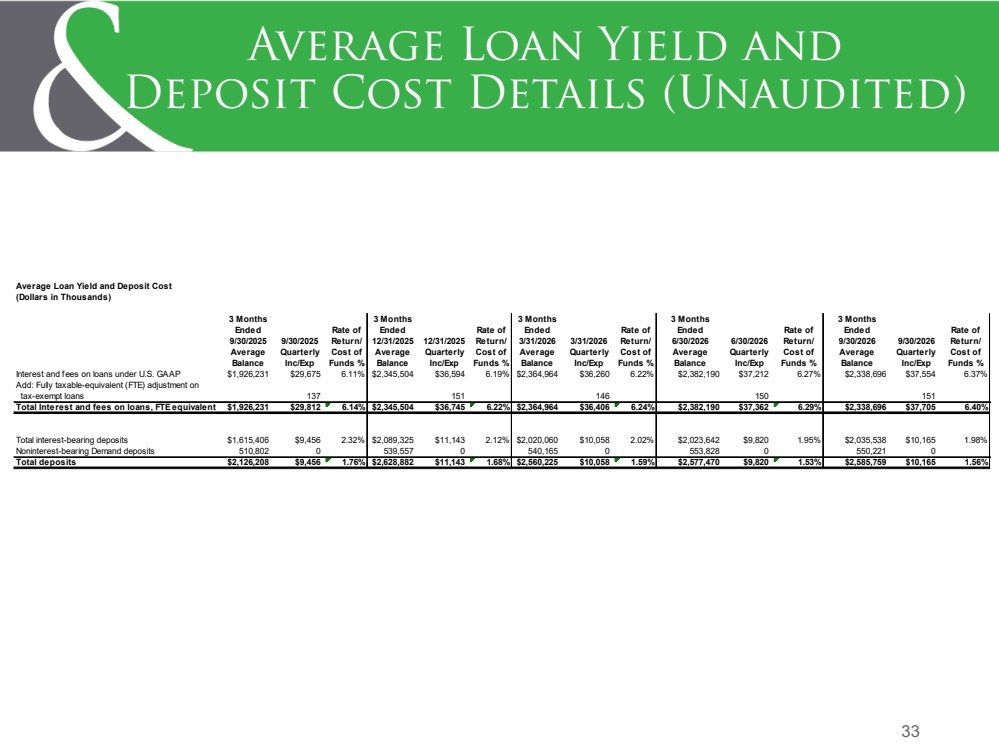
| Investment Portfolio Characteristics as of September 30, 2026 34 Securities Portfolio (Unaudited) 1) Municipal portfolio credit quality information is summarized based on amortized cost values. Ratings are assigned to each security based on the lowest enhanced or underlying rating from Moody’s, S&P or Fitch. • Book Value: $540.6 Million • Market Value $490.5 Million • 100% of portfolio is available-for-sale Composite Quality (%) Current AAA or Prerefunded 19% AA 73% A 8% NR Municipal Portfolio Characteristics as of September 30, 2026 1 Agency MBS - Residential 41% Municipal 26% Agency MBS - Commercial 20% Bank Holding Company Debt Securities 8% US Treasuries and Agencies 3% CLOs 2% |
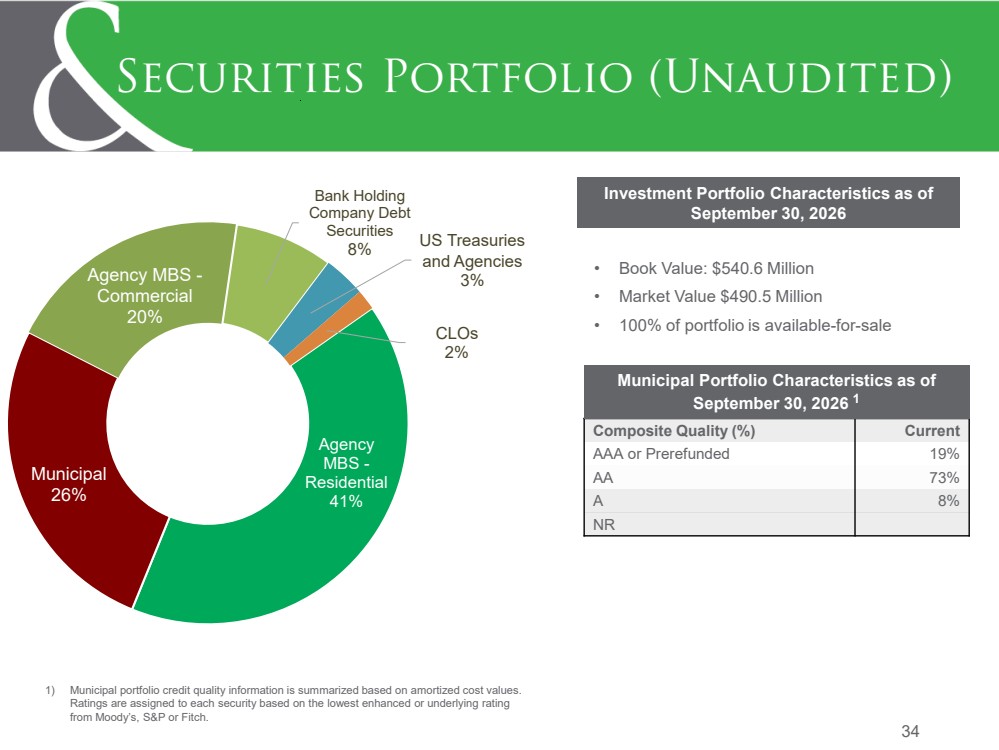
| 35 Securities Portfolio, continued The composition of the available-for-sale debt securities portfolio at September 30, 2026, December 31, 2025 and December 31, 2024 is as follows: (a) There was no allowance for credit losses on available-for-sale debt securities at September 30, 2026. (b) September 30, 2026 information is unaudited. (Dollars In Thousands) September 30, 2026 December 31, 2025 December 31, 2024 Amortized Fair Amortized Fair Amortized Fair Cost Value Cost Value Cost Value Obligations of the U.S. Treasury $ 8,031 7,327 $ 8,047 7,482 $ 8,067 7,118 Obligations of U.S. Government agencies 10,153 9,180 11,423 10,749 10,154 9,025 Bank holding company debt securities 40,200 39,026 36,103 34,076 28,958 25,246 Obligations of states and political subdivisions: Tax-exempt 101,811 87,424 105,149 98,359 111,995 101,302 Taxable 50,107 41,713 50,306 44,152 51,147 42,506 Mortgage-backed securities issued or guaranteed by U.S. Government agencies or sponsored agencies: Residential pass-through securities 155,405 144,491 148,865 143,921 104,378 94,414 Residential collateralized mortgage obligations 59,946 56,023 65,782 63,707 53,389 49,894 Commercial mortgage-backed securities 106,914 97,274 99,095 92,631 73,470 64,501 Private label commercial mortgage-backed securities 0 0 3,490 3,489 8,365 8,374 Asset-backed securities, Collateralized loan obligations 8,000 8,016 8,000 8,009 0 0 Total Available-for-Sale Debt Securities $ 540,567 $ 490,474 $ 536,260 $ 506,575 $ 449,923 $ 402,380 Net Unrealized Loss $ (50,093) $ (29,685) $ (47,543) Net Unrealized Loss as a % of Amortized Cost (9.3)% (5.5)% (10.6)% |
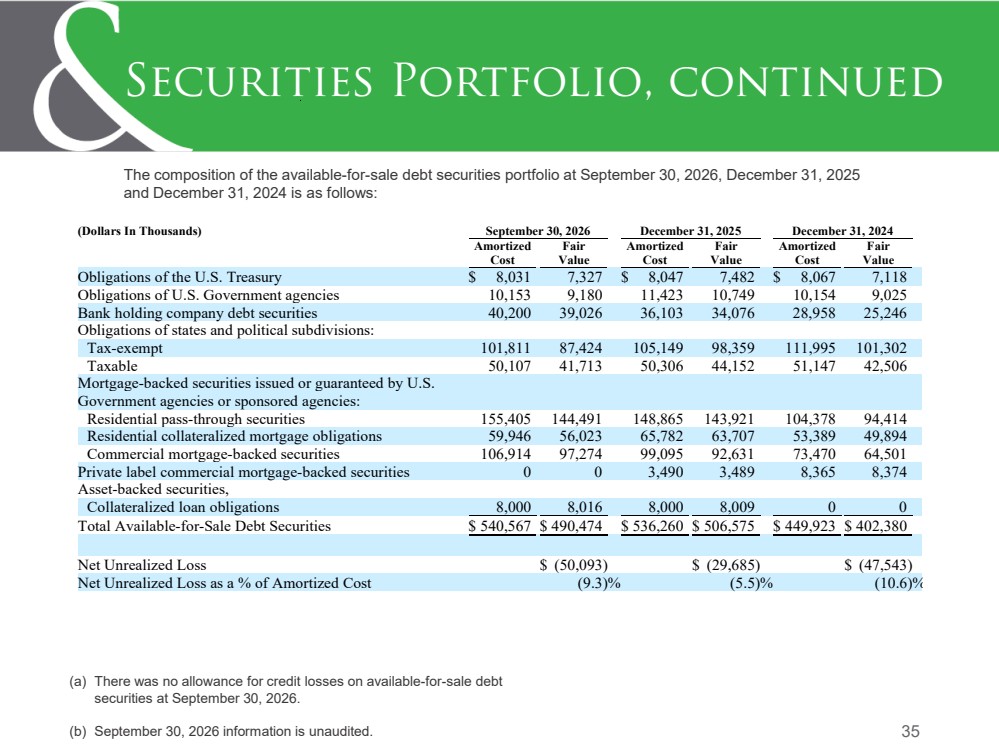
| 36 Interest Rate Risk Profile (Unaudited) Citizens & Northern uses a simulation model to calculate the potential effects of interest rate fluctuations on net interest income and the economic value of portfolio equity. The projected results include the impact of estimates, at each level of interest rate change, regarding cash flows from principal repayments on loans and mortgage-backed securities and call activity on other investment securities. Actual results could vary significantly from these estimates, which could result in significant differences in the calculations of projected changes in net interest income and economic value of equity. The results based on September 30, 2026 data show that sensitivities are within policy limits. September 30, 2026 Data (In Thousands) Period Ending September 30, 2027 Basis Point Interest Interest Net Interest NII NII Change in Rates Income Expense Income (NII) % Change Risk Limit +400 $ 207,806 $ 102,068 $ 105,738 (14.3)% 25.0 % +300 199,480 86,898 112,582 (8.8)% 20.0 % +200 191,097 73,259 117,838 (4.5)% 15.0 % +100 182,612 61,155 121,457 (1.6)% 10.0 % 0 174,016 50,597 123,419 0.0 % 0.0 % -100 165,057 44,459 120,598 (2.3)% 10.0 % -200 155,109 38,348 116,761 (5.4)% 15.0 % -300 144,041 32,489 111,552 (9.6)% 20.0 % -400 132,061 27,310 104,751 (15.1)% 25.0 % Economic Value of Equity at September 30, 2026 Present Present Present Basis Point Value Value Value Change in Rates Equity % Change Risk Limit +400 $ 663,118 (17.6)% 40.0 % +300 709,561 (11.8)% 30.0 % +200 750,361 (6.7)% 25.0 % +100 782,293 (2.8)% 15.0 % 0 804,581 0.0 % 0.0 % -100 794,291 (1.3)% 15.0 % -200 752,712 (6.4)% 25.0 % -300 696,399 (13.4)% 30.0 % -400 621,827 (22.7)% 40.0 % |
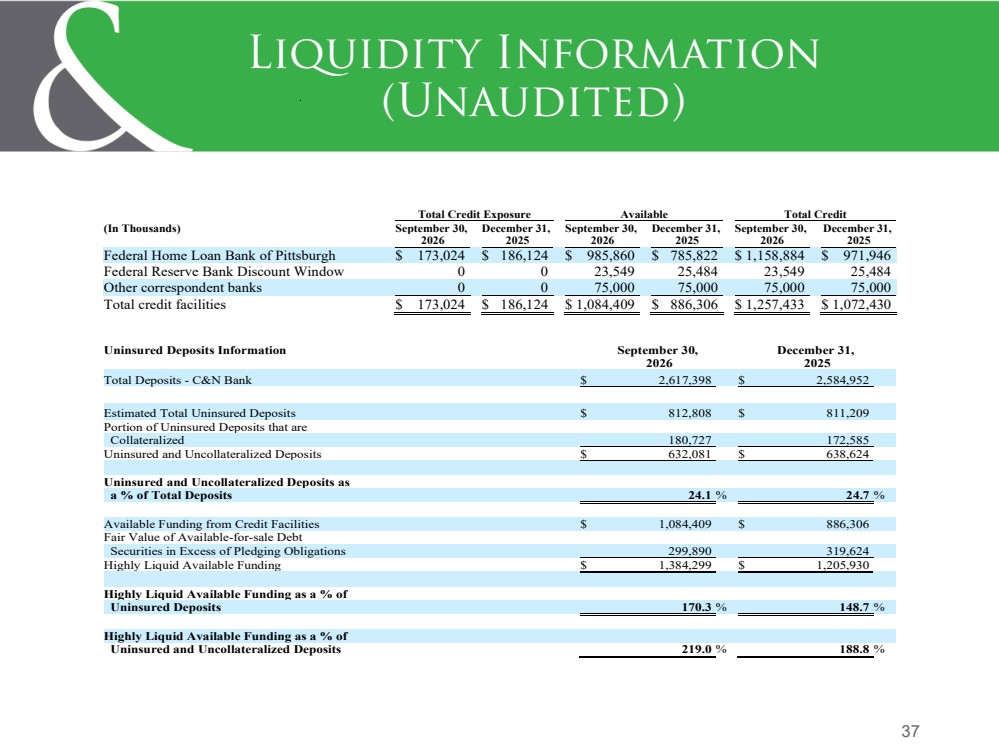
| 37 Liquidity Information (Unaudited) Uninsured Deposits Information September 30, December 31, 2026 2025 Total Deposits - C&N Bank $ 2,617,398 $ 2,584,952 Estimated Total Uninsured Deposits $ 812,808 $ 811,209 Portion of Uninsured Deposits that are Collateralized 180,727 172,585 Uninsured and Uncollateralized Deposits $ 632,081 $ 638,624 Uninsured and Uncollateralized Deposits as a % of Total Deposits 24.1 % 24.7 % Available Funding from Credit Facilities $ 1,084,409 $ 886,306 Fair Value of Available-for-sale Debt Securities in Excess of Pledging Obligations 299,890 319,624 Highly Liquid Available Funding $ 1,384,299 $ 1,205,930 Highly Liquid Available Funding as a % of Uninsured Deposits 170.3 % 148.7 % Highly Liquid Available Funding as a % of Uninsured and Uncollateralized Deposits 219.0 % 188.8 % Total Credit Exposure Available Total Credit (In Thousands) September 30, December 31, September 30, December 31, September 30, December 31, 2026 2025 2026 2025 2026 2025 Federal Home Loan Bank of Pittsburgh $ 173,024 $ 186,124 $ 985,860 $ 785,822 $ 1,158,884 $ 971,946 Federal Reserve Bank Discount Window 0 0 23,549 25,484 23,549 25,484 Other correspondent banks 0 0 75,000 75,000 75,000 75,000 Total credit facilities $ 173,024 $ 186,124 $ 1,084,409 $ 886,306 $ 1,257,433 $ 1,072,430 |
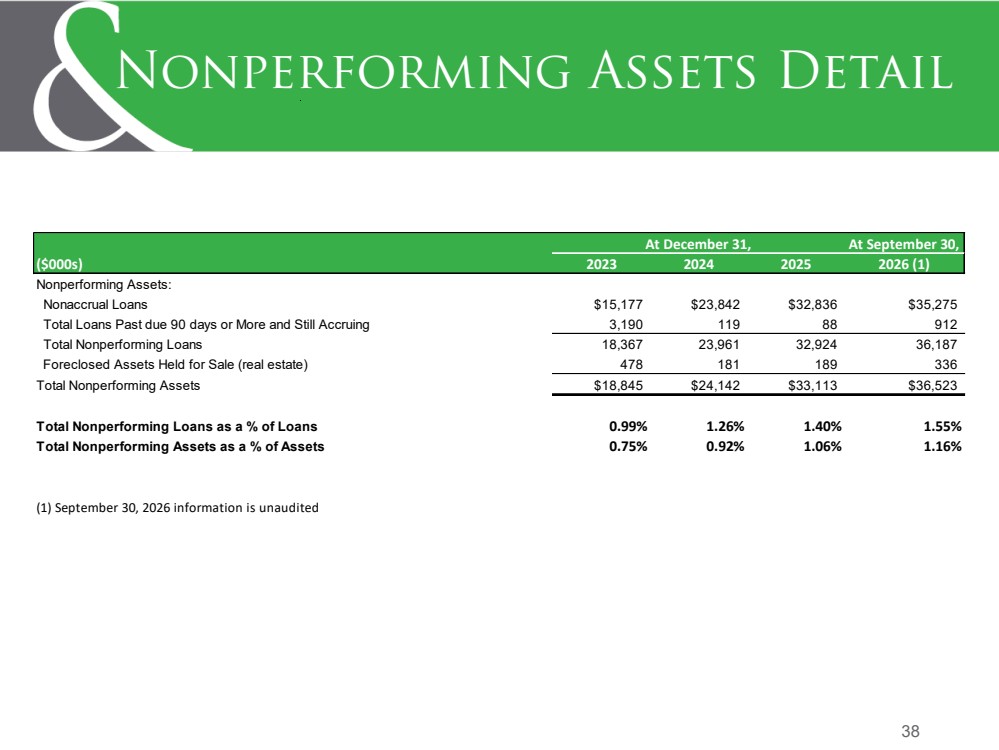
| 38 Nonperforming Assets Detail At September 30, ($000s) 2023 2024 2025 2026 (1) Nonperforming Assets: Nonaccrual Loans $15,177 $23,842 $32,836 $35,275 Total Loans Past due 90 days or More and Still Accruing 3,190 119 88 912 Total Nonperforming Loans 18,367 23,961 32,924 36,187 Foreclosed Assets Held for Sale (real estate) 478 181 189 336 Total Nonperforming Assets $18,845 $24,142 $33,113 $36,523 Total Nonperforming Loans as a % of Loans 0.99% 1.26% 1.40% 1.55% Total Nonperforming Assets as a % of Assets 0.75% 0.92% 1.06% 1.16% (1) September 30, 2026 information is unaudited At December 31, |
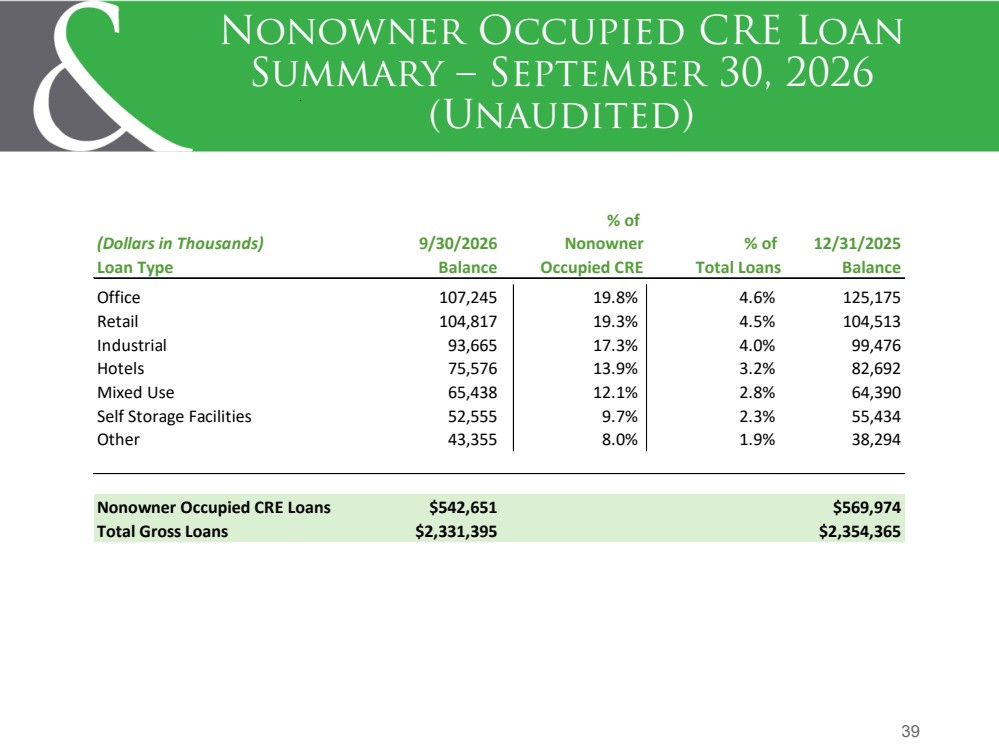
| 39 Nonowner Occupied CRE Loan Summary – September 30, 2026 (Unaudited) % of (Dollars in Thousands) 9/30/2026 Nonowner % of 12/31/2025 Loan Type Balance Occupied CRE Total Loans Balance Office 107,245 19.8% 4.6% 125,175 Retail 104,817 19.3% 4.5% 104,513 Industrial 93,665 17.3% 4.0% 99,476 Hotels 75,576 13.9% 3.2% 82,692 Mixed Use 65,438 12.1% 2.8% 64,390 Self Storage Facilities 52,555 9.7% 2.3% 55,434 Other 43,355 8.0% 1.9% 38,294 Nonowner Occupied CRE Loans $542,651 $569,974 Total Gross Loans $2,331,395 $2,354,365 |
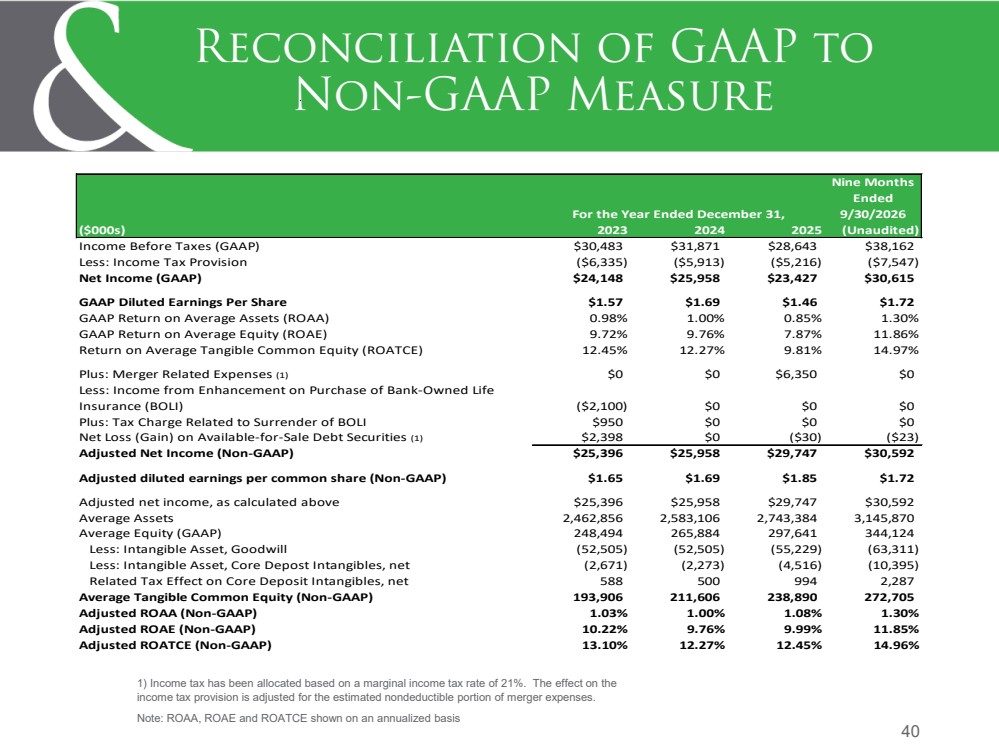
| 40 Reconciliation of GAAP to Non-GAAP Measure 1) Income tax has been allocated based on a marginal income tax rate of 21%. The effect on the income tax provision is adjusted for the estimated nondeductible portion of merger expenses. Note: ROAA, ROAE and ROATCE shown on an annualized basis Nine Months Ended 9/30/2026 ($000s) 2023 2024 2025 (Unaudited) Income Before Taxes (GAAP) $30,483 $31,871 $28,643 $38,162 Less: Income Tax Provision ($6,335) ($5,913) ($5,216) ($7,547) Net Income (GAAP) $24,148 $25,958 $23,427 $30,615 GAAP Diluted Earnings Per Share $1.57 $1.69 $1.46 $1.72 GAAP Return on Average Assets (ROAA) 0.98% 1.00% 0.85% 1.30% GAAP Return on Average Equity (ROAE) 9.72% 9.76% 7.87% 11.86% Return on Average Tangible Common Equity (ROATCE) 12.45% 12.27% 9.81% 14.97% Plus: Merger Related Expenses (1) $0 $0 $6,350 $0 Less: Income from Enhancement on Purchase of Bank-Owned Life Insurance (BOLI) ($2,100) $0 $0 $0 Plus: Tax Charge Related to Surrender of BOLI $950 $0 $0 $0 Net Loss (Gain) on Available-for-Sale Debt Securities (1) $2,398 $0 ($30) ($23) Adjusted Net Income (Non-GAAP) $25,396 $25,958 $29,747 $30,592 Adjusted diluted earnings per common share (Non-GAAP) $1.65 $1.69 $1.85 $1.72 Adjusted net income, as calculated above $25,396 $25,958 $29,747 $30,592 Average Assets 2,462,856 2,583,106 2,743,384 3,145,870 Average Equity (GAAP) 248,494 265,884 297,641 344,124 Less: Intangible Asset, Goodwill (52,505) (52,505) (55,229) (63,311) Less: Intangible Asset, Core Depost Intangibles, net (2,671) (2,273) (4,516) (10,395) Related Tax Effect on Core Deposit Intangibles, net 588 500 994 2,287 Average Tangible Common Equity (Non-GAAP) 193,906 211,606 238,890 272,705 Adjusted ROAA (Non-GAAP) 1.03% 1.00% 1.08% 1.30% Adjusted ROAE (Non-GAAP) 10.22% 9.76% 9.99% 11.85% Adjusted ROATCE (Non-GAAP) 13.10% 12.27% 12.45% 14.96% For the Year Ended December 31, |
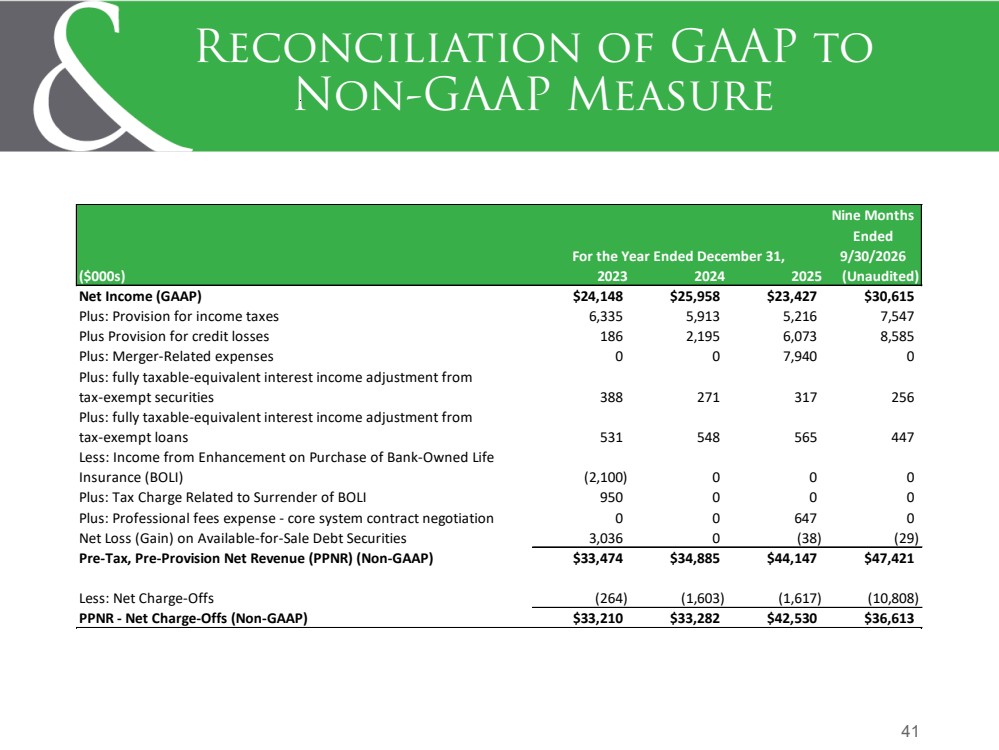
| 41 Reconciliation of GAAP to Non-GAAP Measure Nine Months Ended 9/30/2026 ($000s) 2023 2024 2025 (Unaudited) Net Income (GAAP) $24,148 $25,958 $23,427 $30,615 Plus: Provision for income taxes 6,335 5,913 5,216 7,547 Plus Provision for credit losses 186 2,195 6,073 8,585 Plus: Merger-Related expenses 0 0 7,940 0 Plus: fully taxable-equivalent interest income adjustment from tax-exempt securities 388 271 317 256 Plus: fully taxable-equivalent interest income adjustment from tax-exempt loans 531 548 565 447 Less: Income from Enhancement on Purchase of Bank-Owned Life Insurance (BOLI) (2,100) 0 0 0 Plus: Tax Charge Related to Surrender of BOLI 950 0 0 0 Plus: Professional fees expense - core system contract negotiation 0 0 647 0 Net Loss (Gain) on Available-for-Sale Debt Securities 3,036 0 (38) (29) Pre-Tax, Pre-Provision Net Revenue (PPNR) (Non-GAAP) $33,474 $34,885 $44,147 $47,421 Less: Net Charge-Offs (264) (1,603) (1,617) (10,808) PPNR - Net Charge-Offs (Non-GAAP) $33,210 $33,282 $42,530 $36,613 For the Year Ended December 31, |
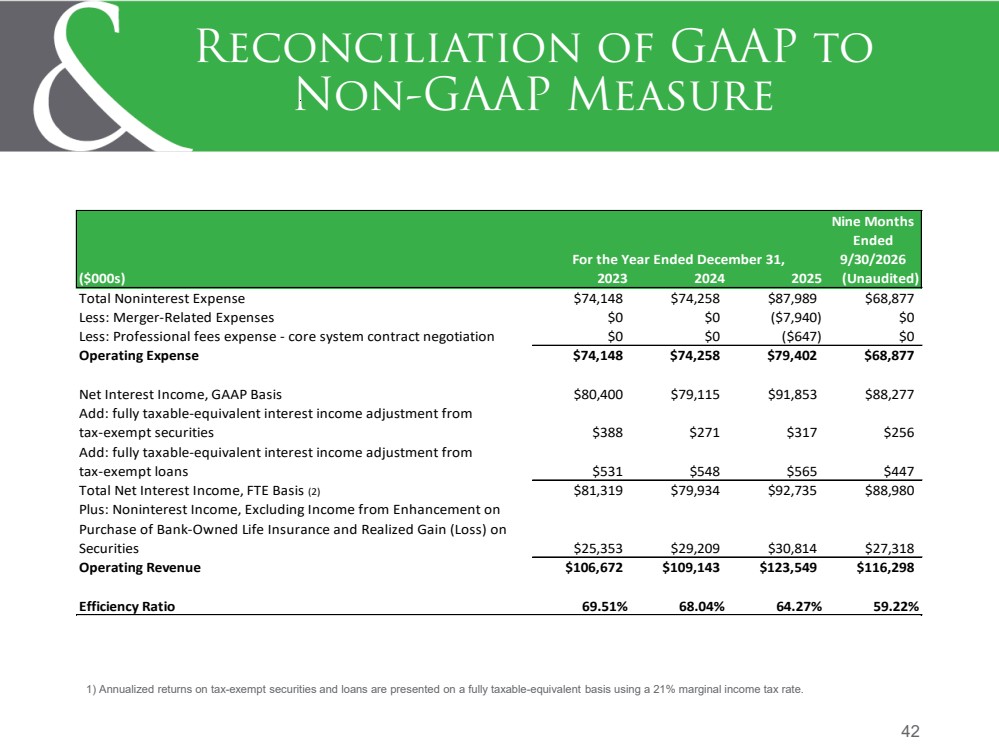
| 42 Reconciliation of GAAP to Non-GAAP Measure 1) Annualized returns on tax-exempt securities and loans are presented on a fully taxable-equivalent basis using a 21% marginal income tax rate. Nine Months Ended 9/30/2026 ($000s) 2023 2024 2025 (Unaudited) Total Noninterest Expense $74,148 $74,258 $87,989 $68,877 Less: Merger-Related Expenses $0 $0 ($7,940) $0 Less: Professional fees expense - core system contract negotiation $0 $0 ($647) $0 Operating Expense $74,148 $74,258 $79,402 $68,877 Net Interest Income, GAAP Basis $80,400 $79,115 $91,853 $88,277 Add: fully taxable-equivalent interest income adjustment from tax-exempt securities $388 $271 $317 $256 Add: fully taxable-equivalent interest income adjustment from tax-exempt loans $531 $548 $565 $447 Total Net Interest Income, FTE Basis (2) $81,319 $79,934 $92,735 $88,980 Plus: Noninterest Income, Excluding Income from Enhancement on Purchase of Bank-Owned Life Insurance and Realized Gain (Loss) on Securities $25,353 $29,209 $30,814 $27,318 Operating Revenue $106,672 $109,143 $123,549 $116,298 Efficiency Ratio 69.51% 68.04% 64.27% 59.22% For the Year Ended December 31, |
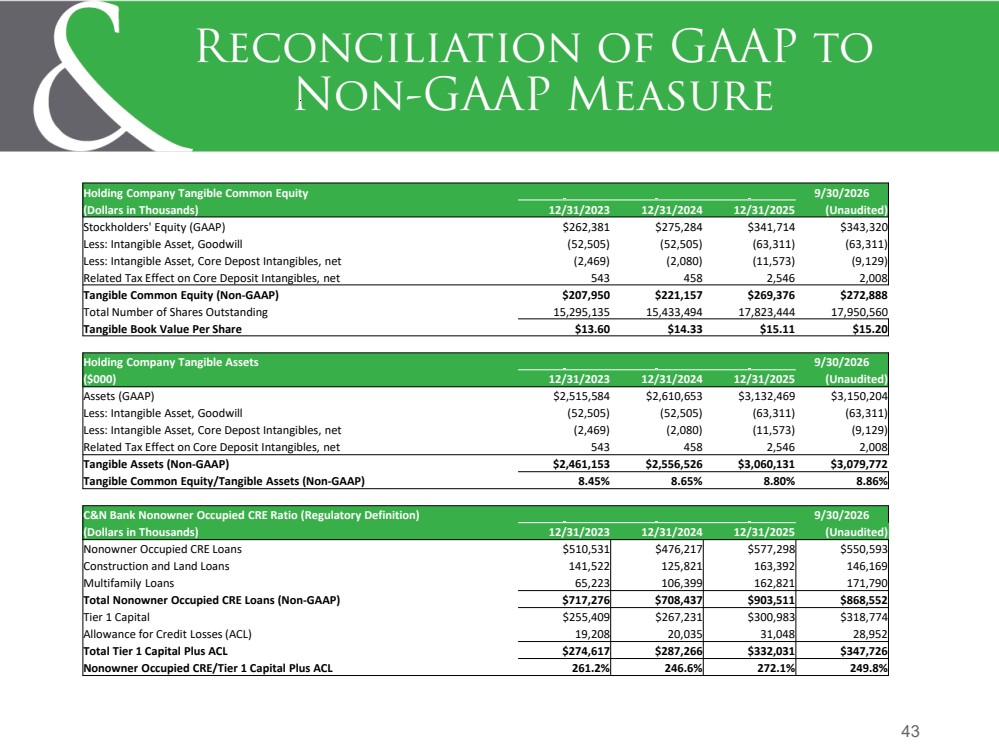
| 43 Reconciliation of GAAP to Non-GAAP Measure Holding Company Tangible Common Equity 9/30/2026 (Dollars in Thousands) 12/31/2023 12/31/2024 12/31/2025 (Unaudited) Stockholders' Equity (GAAP) $262,381 $275,284 $341,714 $343,320 Less: Intangible Asset, Goodwill (52,505) (52,505) (63,311) (63,311) Less: Intangible Asset, Core Depost Intangibles, net (2,469) (2,080) (11,573) (9,129) Related Tax Effect on Core Deposit Intangibles, net 543 458 2,546 2,008 Tangible Common Equity (Non-GAAP) $207,950 $221,157 $269,376 $272,888 Total Number of Shares Outstanding 15,295,135 15,433,494 17,823,444 17,950,560 Tangible Book Value Per Share $13.60 $14.33 $15.11 $15.20 Holding Company Tangible Assets 9/30/2026 ($000) 12/31/2023 12/31/2024 12/31/2025 (Unaudited) Assets (GAAP) $2,515,584 $2,610,653 $3,132,469 $3,150,204 Less: Intangible Asset, Goodwill (52,505) (52,505) (63,311) (63,311) Less: Intangible Asset, Core Depost Intangibles, net (2,469) (2,080) (11,573) (9,129) Related Tax Effect on Core Deposit Intangibles, net 543 458 2,546 2,008 Tangible Assets (Non-GAAP) $2,461,153 $2,556,526 $3,060,131 $3,079,772 Tangible Common Equity/Tangible Assets (Non-GAAP) 8.45% 8.65% 8.80% 8.86% C&N Bank Nonowner Occupied CRE Ratio (Regulatory Definition) 9/30/2026 (Dollars in Thousands) 12/31/2023 12/31/2024 12/31/2025 (Unaudited) Nonowner Occupied CRE Loans $510,531 $476,217 $577,298 $550,593 Construction and Land Loans 141,522 125,821 163,392 146,169 Multifamily Loans 65,223 106,399 162,821 171,790 Total Nonowner Occupied CRE Loans (Non-GAAP) $717,276 $708,437 $903,511 $868,552 Tier 1 Capital $255,409 $267,231 $300,983 $318,774 Allowance for Credit Losses (ACL) 19,208 20,035 31,048 28,952 Total Tier 1 Capital Plus ACL $274,617 $287,266 $332,031 $347,726 Nonowner Occupied CRE/Tier 1 Capital Plus ACL 261.2% 246.6% 272.1% 249.8% |