
Exhibit 99.2
Third Quarter 2026 Earnings Supplemental As of and for the periods ended September 30, 2026 Chicago Atlantic Real Estate Finance, Inc. (NASDAQ: REFI)
Forward Looking Statements This presentation contains forward - looking statements, within the meaning of the Private Securities Litigation Reform Act of 1995 and Section 21 E of the Securities and Exchange Act of 1934 , as amended (the “Exchange Act”), regarding future events and the future results of Chicago Atlantic Real Estate Finance, Inc . (“Chicago Atlantic”, “REFI”, the “Company”, and “we”, “us”, and “our”) that are based on current expectations, estimates, forecasts, projections about the industry in which the Company operates and the beliefs and assumptions of the management of the Company, including statements regarding the proposed merger with Chicago Atlantic BDC, Inc . (“LIEN”) and its expected timing and effects, the expected pro forma ownership of former REFI stockholders in LIEN following the merger, the expected implementation and effects of federal rescheduling of medical cannabis, the Company’s dividend expectations, and the Company’s future operations and strategies . Words such as “address,” “anticipate,” “believe,” “consider,” “continue,” “develop,” “estimate,” “expect,” “further,” “goal,” “intend,” “may,” “plan,” “potential,” “project,” “seek,” “should,” “target,” “will,” variations of such words and similar expressions are intended to identify such forward - looking statements . Such statements reflect the current views of the Company and its management with respect to future events and are subject to certain risks, uncertainties and assumptions . Should one or more of these risks or uncertainties materialize, or should underlying assumptions prove incorrect, the Company’s actual results, performance or achievements could differ materially from the results expressed in, or implied by, these forward - looking statements . Summaries of documents contained in this presentation may not be complete . The Company does not represent that the information herein is complete . The information in this presentation is current only as of September 30 , 2026 , or such other date noted in this presentation, and the Company’s business or financial condition and other information in this presentation may change after that date . The Company undertakes no obligation to update any forward - looking statements in order to reflect any event or circumstance occurring after the date of this presentation or currently unknown facts or conditions . You are urged to review and carefully consider any cautionary statements and other disclosures, including the statements under the heading “Risk Factors” and elsewhere in the Company’s filings with the Securities and Exchange Commission . Factors that may cause actual results to differ materially from current expectations include, among others : the Company’s business and investment strategy ; global conflicts, such as the war between Russia and Ukraine, the hostilities in the Middle East and market volatility resulting from such conflicts ; the ability of Chicago Atlantic REIT Manager, LLC (the “Manager”) to locate suitable loan opportunities for the Company and allocate such opportunities among the Company and affiliates with similar investment strategies, monitor and actively manage the Company’s loan portfolio and implement the Company’s investment strategy ; allocation of loan opportunities to the Company by the Manager ; the Company’s projected operating results ; actions and initiatives of the U . S . or state governments and changes to government policies and the execution and impact of these actions, initiatives and policies, including the fact that cannabis remains illegal under federal law, and developments relating to federal rescheduling of medical cannabis and its implementation ; the estimated growth in and evolving market dynamics of the cannabis market ; the demand for cannabis cultivation and processing facilities ; shifts in public opinion regarding cannabis ; the state of the U . S . economy generally or in specific geographic regions ; economic trends and economic recoveries ; the amount and timing of the Company’s cash flows, if any, from the Company’s loans ; the Company’s ability to obtain and maintain financing arrangements ; the Company’s leverage ; changes in the value of the Company’s loans ; the Company’s investment and underwriting process ; rates of default or decreased recovery rates on the Company’s loans ; the degree to which any interest rate or other hedging strategies may or may not protect the Company from interest rate volatility ; changes in interest rates and impacts of such changes on the Company’s results of operations, cash flows and the market value of the Company’s loans ; interest rate mismatches between the Company’s loans and the Company’s borrowings used to fund such loans ; the impact of inflation on our operating results ; the departure of any of the executive officers or key personnel supporting and assisting the Company from the Manager or its affiliates ; impact of and changes in governmental regulations, tax law and rates, accounting guidance and similar matters ; the Company’s ability to maintain the Company’s exclusion or exemption from registration under the Investment Company Act of 1940 ; the Company’s ability to qualify and maintain such qualification as a real estate investment trust (“REIT”) for U . S . federal income tax purposes ; estimates relating to the Company’s ability to make distributions to its stockholders in the future ; the Company’s understanding of its competition ; market trends in the Company’s industry, interest rates, real estate values, the securities markets or the economy in general ; and the other risks identified in the Company’s filings with the SEC, including its Annual Report on Form 10 - K for the year ended December 31 , 2025 and subsequent Quarterly Reports on Form 10 - Q, and in the registration statement on Form N - 14 filed by LIEN with the SEC on July 31 , 2026 and amended via Pre - Effective Amendment No . 1 on September 23 , 2026 , including the joint proxy statement/prospectus contained therein .. The information contained in this presentation should be read in conjunction with our financial statements and notes thereto appearing elsewhere in our annual report on Form 10 - K for the year ended December 31 , 2025 , and other documents we file from time to time with the SEC . You are advised to consult any additional disclosures that we may make through reports that we have filed or in the future may file with the SEC, including annual reports on Form 10 - K, quarterly reports on Form 10 - Q, and current reports on Form 8 - K . Chicago Atlantic Real Estate Finance, Inc. 2 Important Disclosure Information DI S CL O S URE S
Market and Industry Data In this presentation, the Company relies on and refers to certain information and statistics obtained from third - party sources which it believes to be reliable, including reports by market research firms . The Company has not independently verified the accuracy or completeness of any such third - party information . Because the cannabis industry is relatively new and rapidly evolving, such market and industry data may be subject to significant change in a relatively short period . Important Notices This presentation is by Chicago Atlantic Real Estate Finance, Inc . , (“REFI” or the “Company”) a publicly traded company that has elected to be taxed as a REIT for federal income tax purposes . This presentation is provided for informational purposes only and is not an offer to sell, or a solicitation of an offer to buy, any security or instrument , and is not a solicitation of any vote or approval with respect to the proposed merger between REFI and Chicago Atlantic BDC, Inc . (“LIEN”) or any related matter . REFI is not a registered investment company and is managed by Chicago Atlantic REIT Manager, LLC (our “Manager”) . This presentation is not a communication by our Manager and is not designed to maintain any existing client or investor or solicit new clients or investors of the Manager . We routinely post important information for investors on our website, refi . reit . We intend to use this webpage as a means of disclosing material information, for complying with our disclosure obligations under Regulation FD and to post and update investor presentations and similar materials on a regular basis . REFI encourages investors, analysts, the media and others interested in REFI to monitor the Investor Relations section of our website, in addition to following our press releases, SEC filings, public conference calls, presentations, webcasts and other information we post from time to time on our website . Past performance is no guarantee of future results . There is no guarantee that any investment strategy referenced herein will work under all market conditions . You alone assume the responsibility of evaluating the merits and risks associated with any potential investment or investment strategy referenced herein . The information contained herein is not intended to provide, and should not be relied upon for accounting, legal or tax advice or investment recommendations for REFI or any of its affiliates . Non - GAAP Financial Measures This presentation includes certain non - GAAP financial measures, including Distributable Earnings, to evaluate our performance excluding the effects of certain transactions and certain GAAP adjustments that we believe are not necessarily indicative of our current loan activity and operations . We believe the non - GAAP financial measures are useful for management, investors, analysts, and other interested parties in evaluating our performance but should not be viewed in isolation and are not a substitute for financial measures computed in accordance with GAAP . We define Distributable Earnings as, for a specified period, the net income (loss) computed in accordance with GAAP, excluding (i) non - cash equity compensation expense, (ii) depreciation and amortization, (iii) any unrealized gains, losses or other non - cash items recorded in net income (loss) for the period, regardless of whether such items are included in other comprehensive income or loss, or in net income (loss) ; provided that Distributable Earnings does not exclude, in the case of investments with a deferred interest feature (such as OID, debt instruments with PIK interest and zero coupon securities), accrued income that we have not yet received in cash, (iv) provision for current expected credit losses, (v) one - time events pursuant to changes in GAAP and certain non - cash charges, in each case after discussions between our Manager and our independent directors and after approval by a majority of such independent directors, and including (vi) beginning with the three months ended September 30 , 2026 , interest income (including paid - in - kind interest), exit fees, and other amounts earned under the Koach Notes that, under GAAP, are recorded directly in stockholders' equity rather than in net income, as described below . We believe providing Distributable Earnings on a supplemental basis to our net income as determined in accordance with GAAP is helpful to stockholders in assessing the overall performance of our business . As a REIT, we are required to distribute at least 90 % of our annual REIT taxable income and to pay tax at regular corporate rates to the extent that we annually distribute less than 100 % of such taxable income . Given these requirements and our belief that dividends are generally one of the principal reasons that stockholders invest in our common stock, we generally intend to attempt to pay dividends to our stockholders in an amount equal to our net taxable income, if and to the extent authorized by our Board . Distributable Earnings is one of many factors considered by our Board in authorizing dividends and, while not a direct measure of net taxable income, over time, the measure can be considered a useful indicator of our dividends . Chicago Atlantic Real Estate Finance, Inc. 3 Important Disclosure Information DI S CL O S URE S
Additional Information and Where to Find It This communication includes information relating to the proposed merger (the “Merger”) of REFI with and into Chicago Atlantic BDC, Inc . (“LIEN”), along with related proposals for which stockholder approval will be sought, pursuant to the Agreement and Plan of Merger, dated as of June 17 , 2026 (the “Merger Agreement”) by and between LIEN and REFI . The Merger Agreement was unanimously approved by the Boards of Directors of both LIEN and REFI, each acting on the unanimous recommendation of its special committee of independent directors (each, a “Special Committee”) . In connection with the proposals, LIEN has filed relevant materials with the SEC, including a registration statement on Form N - 14 on July 31 , 2026 , as amended by Pre - Effective Amendment No . 1 on N - 14 /A on September 22 , 2026 , which includes a preliminary joint proxy statement of LIEN and REFI and a preliminary prospectus of LIEN (the “Proxy Statement/Prospectus”) . The registration statement has not yet been declared effective, and the information in the preliminary Proxy Statement/Prospectus is not complete and may be changed . After the registration statement is declared effective, the definitive Proxy Statement/Prospectus will be mailed to stockholders of LIEN and REFI . This communication does not constitute an offer to sell or the solicitation of an offer to buy any securities or a solicitation of any vote or approval . No offer of securities shall be made except by means of a prospectus meeting the requirements of Section 10 of the Securities Act . STOCKHOLDERS OF LIEN AND REFI ARE URGED TO READ THE PRELIMINARY PROXY STATEMENT/PROSPECTUS, THE DEFINITIVE PROXY STATEMENT/PROSPECTUS WHEN IT BECOMES AVAILABLE AND OTHER DOCUMENTS THAT ARE FILED OR WILL BE FILED WITH THE SEC, AS WELL AS ANY AMENDMENTS OR SUPPLEMENTS TO THESE DOCUMENTS, CAREFULLY AND IN THEIR ENTIRETY BECAUSE THEY WILL CONTAIN IMPORTANT INFORMATION ABOUT LIEN, REFI, THE MERGER AND THE PROPOSALS . Investors and security holders will be able to obtain the documents filed with the SEC free of charge at the SEC’s website, www . sec . gov, or from each company’s investor relations website at www . investors . chicagoatlanticbdc . com (LIEN) and www . investors . refi . reit (REFI), or by directing a request to LIEN@chicagoatlantic . com (LIEN) or IR@REFI . reit (REFI) . Participants in the Solicitation LIEN, REFI and their respective directors and executive officers, Chicago Atlantic BDC Adviser, LLC, the external investment adviser to LIEN (the “LIEN Adviser”), and Chicago Atlantic REIT Manager, LLC, the external manager of REFI (the “Company Manager”), and their respective directors, officers, members, managers, partners, employees and affiliates, and other persons may be deemed to be participants in the solicitation of proxies from the stockholders of LIEN and REFI in connection with the Merger and the related proposals . Information regarding the persons who may, under the rules of the SEC, be deemed participants in the solicitation of the stockholders of LIEN and REFI in connection with the Merger and the related proposals, including a description of their direct or indirect interests, by security holdings or otherwise, is set forth in the preliminary Proxy Statement/Prospectus and will be set forth in the definitive Proxy Statement/Prospectus and other relevant materials filed with the SEC . Additional information regarding the ownership of LIEN and REFI securities by their respective directors and executive officers is included in their SEC filings on Forms 3 , 4 and 5 , which can be found through the SEC’s website at www . sec . gov . Information about the directors and executive officers of LIEN set forth in LIEN’s proxy statement for its 2026 annual meeting of stockholders, filed with the SEC on April 30 , 2026 , and in LIEN’s Annual Report on Form 10 - K for the fiscal year ended December 31 , 2025 , filed with the SEC on March 19 , 2026 . Information about the directors and executive officers of REFI set forth in REFI’s proxy statement for its 2026 annual meeting of stockholders, filed with the SEC on April 23 , 2026 , and in REFI’s Annual Report on Form 10 - K for the fiscal year ended December 31 , 2025 , filed with the SEC on March 12 , 2026 . Each of these documents is available free of charge at the SEC’s website, www . sec . gov, or from LIEN’s or REFI’s investor relations website, as applicable . . Chicago Atlantic Real Estate Finance, Inc. 4 Important Disclosure Information DI S CL O S URE S
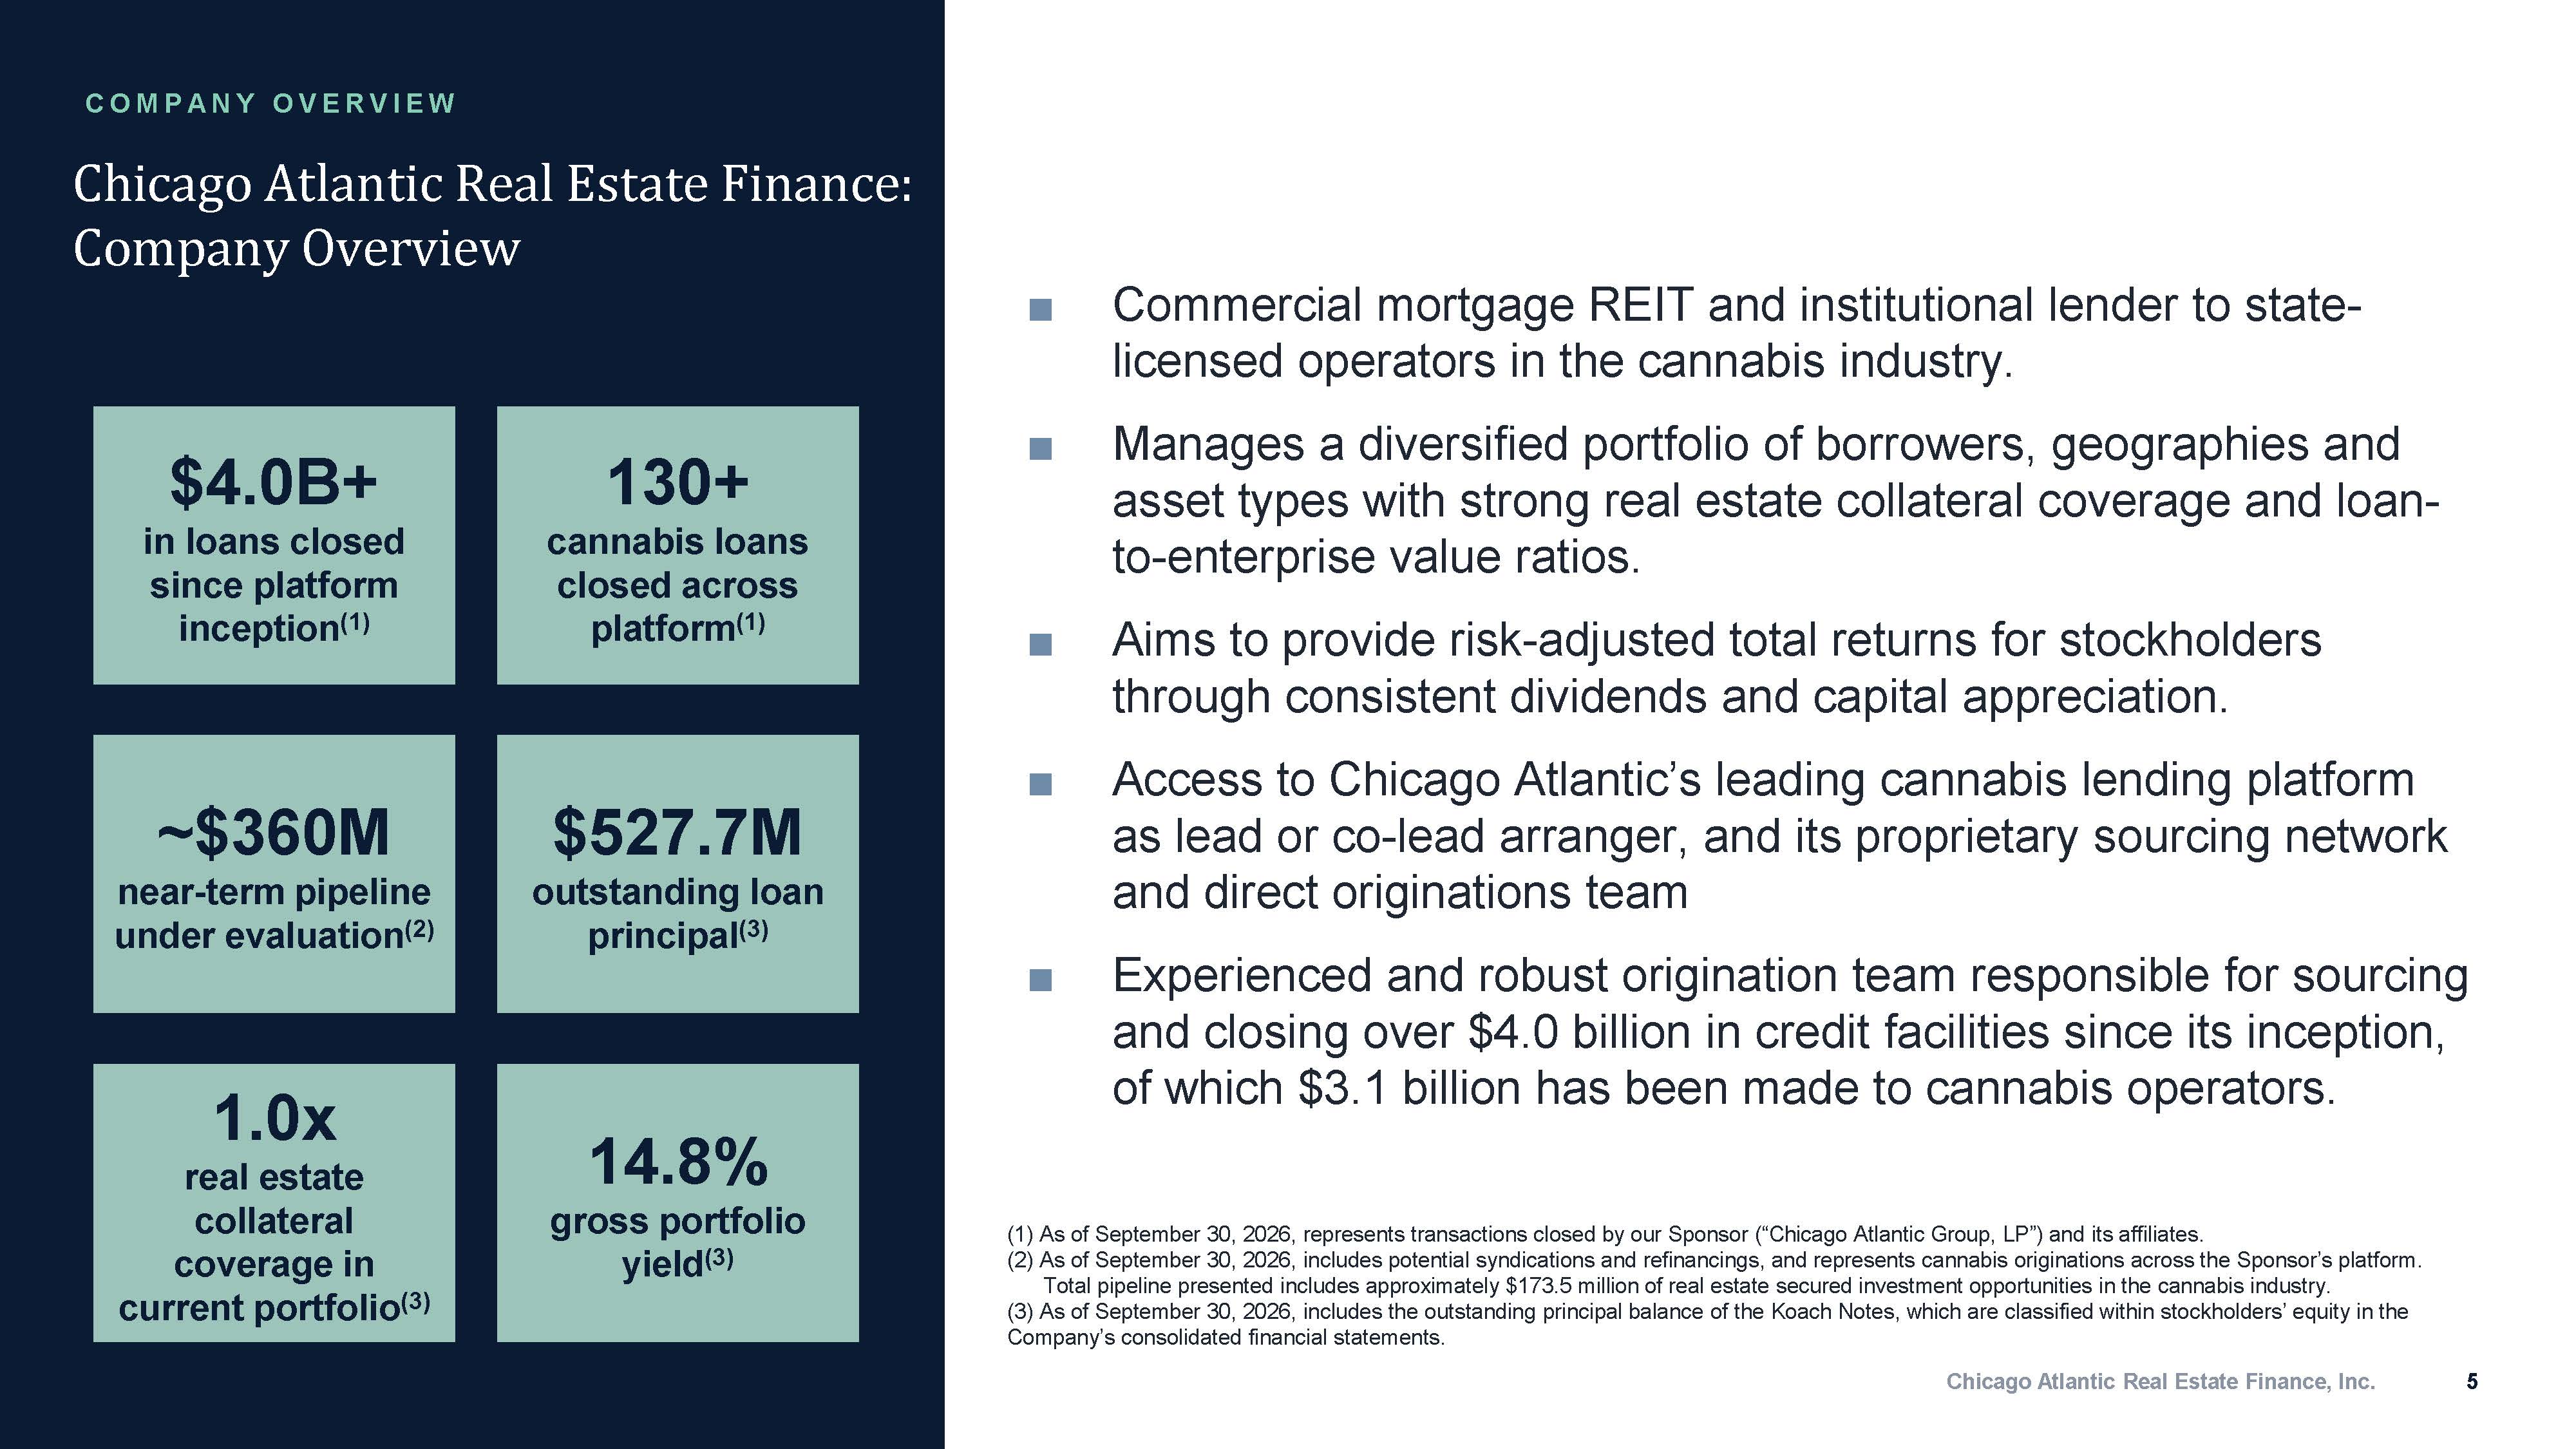
Chicago Atlantic Real Estate Finance: Company Overview Chicago Atlantic Real Estate Finance, Inc. 5 ■ Commercial mortgage REIT and institutional lender to state - licensed operators in the cannabis industry. ■ Manages a diversified portfolio of borrowers, geographies and asset types with strong real estate collateral coverage and loan - to - enterprise value ratios. ■ Aims to provide risk - adjusted total returns for stockholders through consistent dividends and capital appreciation. ■ Access to Chicago Atlantic’s leading cannabis lending platform as lead or co - lead arranger, and its proprietary sourcing network and direct originations team ■ Experienced and robust origination team responsible for sourcing and closing over $4.0 billion in credit facilities since its inception, of which $3.1 billion has been made to cannabis operators. (1) As of September 30, 2026, represents transactions closed by our Sponsor (“Chicago Atlantic Group, LP”) and its affiliates. (2) As of September 30, 2026, includes potential syndications and refinancings, and represents cannabis originations across the Sponsor’s platform. Total pipeline presented includes approximately $173.5 million of real estate secured investment opportunities in the cannabis industry. (3) As of September 30, 2026, includes the outstanding principal balance of the Koach Notes, which are classified within stockholders’ equity in the Company’s consolidated financial statements. ~$360M near - term pipeline under evaluation (2) $4.0B+ in loans closed since platform inception (1) 130+ cannabis loans closed across platform (1) $527.7M outstanding loan principal (3) 14.8% gross portfolio yield (3) 1.0x real estate collateral coverage in current portfolio (3) C O M P A N Y O V E R V I E W

(1) Denotes member of Investment Committee 100 YEARS OF COMBINED EXPERIENCE AND OVER $8 BILLION IN REAL ESTATE AND COMMERCIAL CREDIT Peter Sack (1) Co - CEO Tony Cappell (1) Co - CEO John Mazarakis (1) Executive Chairman ■ Former Principal at BC Partners Credit, leading its cannabis practice ■ Former private equity investor, focusing on distressed industrial opportunities ■ MBA from University of Pennsylvania’s Wharton School of Business, BA from Yale University, and Fulbright Scholar ■ Debt investor with 20 years of investment management experience, beginning at Wells Fargo Foothill ■ Completed over 150 deals, comprising over $5bn in total credit ■ MBA from Chicago Booth and BA from University of Wisconsin ■ Originated over $500mm in cannabis credit transactions ■ Developed and owns over 1mm sf of real estate across 4 states ■ Founded restaurant group with 30+ units and 1,200+ employees ■ MBA from Chicago Booth and BA from University of Delaware Phil Silverman Chief Financial Officer David Kite (1) President and COO ■ Finance and accounting expert, with 15 years of experience in financial reporting, operations, and internal controls within the asset management industry ■ Former CFO of Chicago Atlantic Group, LP ■ B.S in Finance from Indiana University and holds the CPA designation ■ Over 20 years of experience in investment management and real estate investments ■ Former Partner and COO of Free Market Ventures ■ Former Founder of K&K Capital Management ■ MBA from Chicago Booth and BA from University of Illinois Industry - Leading Management and Investment Team Deep Cannabis, Credit and Real Estate Expertise With Entrepreneurial Approach C O M P A N Y O V E R V I E W | M A N A G E M E N T (1) Denotes member of the Investment Committee Chicago Atlantic Real Estate Finance, Inc. 6

Elizabeth Stavola Brandon Konigsberg Jason Papastavrou ■ Founder & President of MPX Bioceutical Corp (MPX) which went public in 2017 ■ Founder & Creator of the brands CBD for Life, Melting Point Extracts (MPX), Health for Life AZ, GreenMart of Maryland & Nevada ■ Former CSO & Board Member of iAnthus Capital Management ■ Former Top Institutional Equities Salesperson at Jefferies & Co. ■ Audit Committee Chairman ■ EVP and Group Treasurer at Scotiabank ■ Former CFO at J.P. Morgan Securities and Managing Director at JPMorgan Chase ■ Current member of board of directors of GTJ REIT, SEC - registered equity REIT ■ Former auditor at Goldstein, Golub and Kessler ■ CPA and BA in Accounting from University of Albany and MBA from New York University’s Stern School of Business ■ Lead Independent Director ■ Founder and CIO of ARIS Capital Management ■ Former member of board of directors of GXO Logistics (NYSE:GXO); XPO Logistics (NYSE:XPO) and United Rentals (NYSE:URI) ■ BS in Mathematics and MS and PhD in Electrical Engineering and Computer Science from MIT Veteran Independent Directors Significant Public Board, REIT, Financial and Corporate Governance Expertise C O M P A N Y O V E R V I E W | G O V E R N A N C E Chicago Atlantic Real Estate Finance, Inc. 7

Financial Overview As of and for the periods ended September 30, 2026
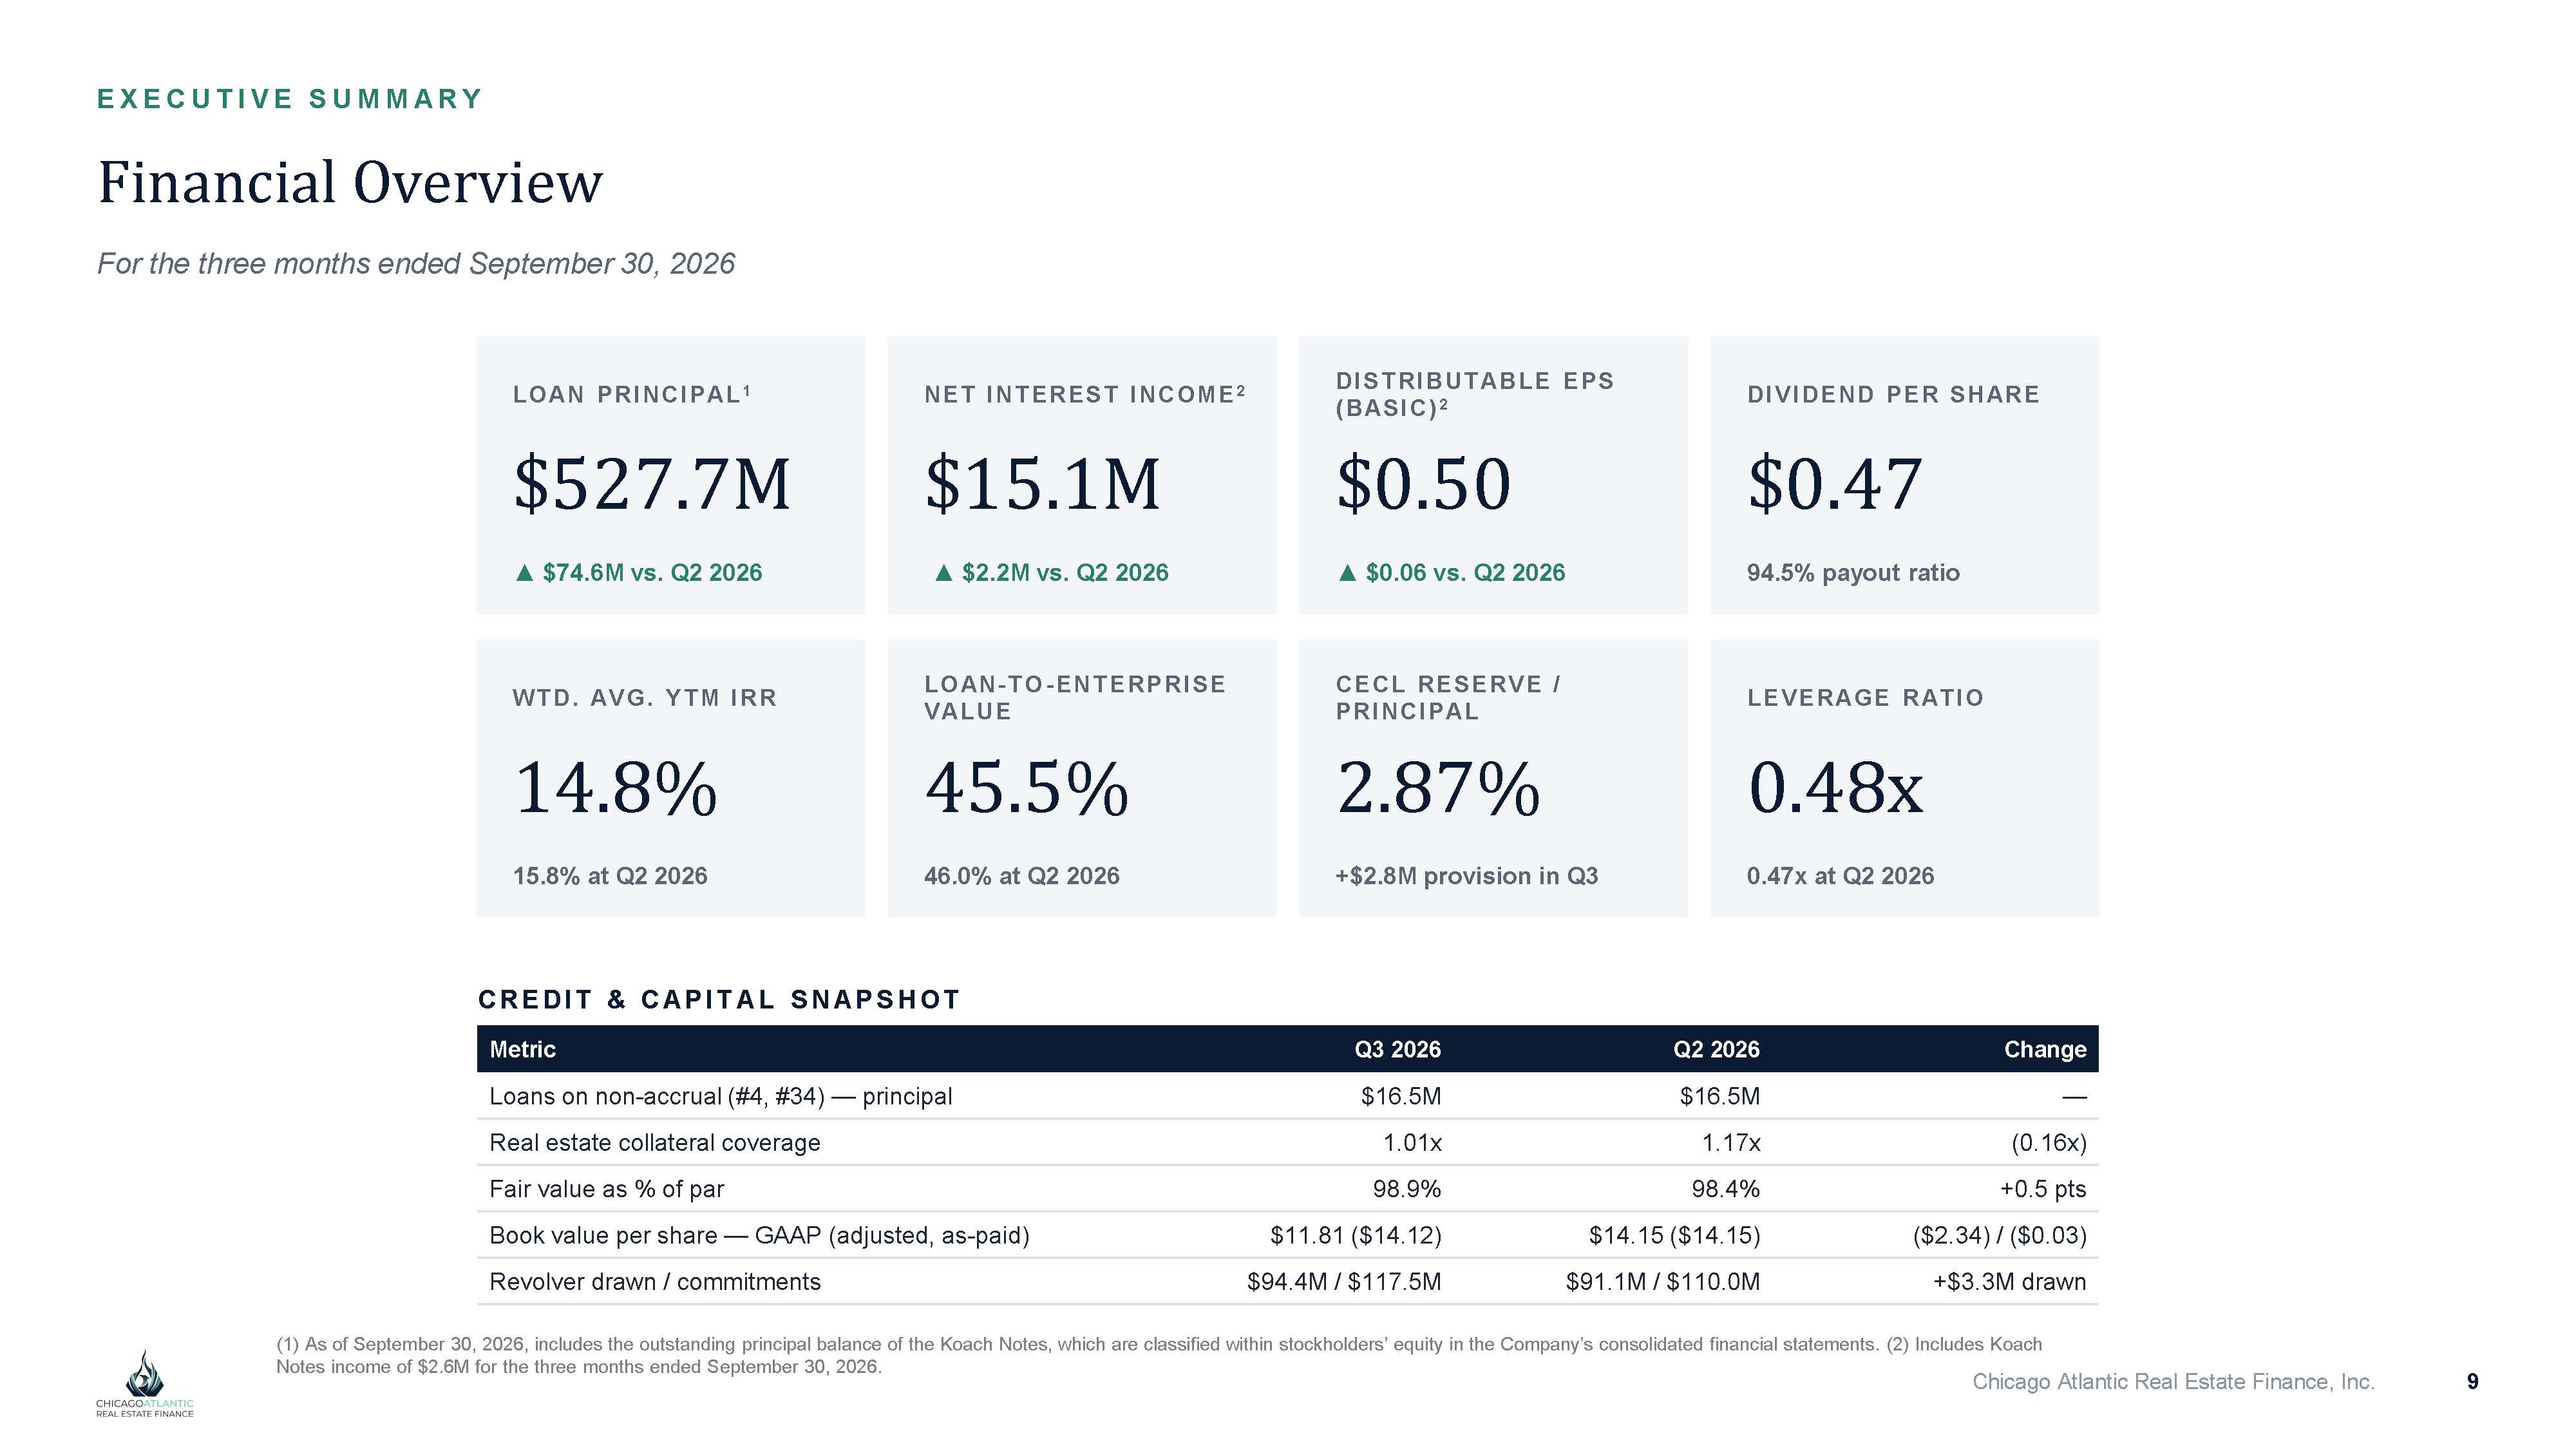
E X E C U T I V E S U M M A R Y Chicago Atlantic Real Estate Finance, Inc. 9 Financial Overview For the three months ended September 30, 2026 LOAN PRINCIPAL 1 $527.7M Ÿ $74.6M vs. Q2 2026 NET INTEREST INCOME 2 $15.1M Ÿ $2.2M vs. Q2 2026 DISTRIBUTABLE EPS ( BASIC) 2 $0.50 Ÿ $0.06 vs. Q2 2026 DIVIDEND PER SHARE $0.47 94.5% payout ratio WTD. AVG. YTM IRR 14.8% 15.8% at Q2 2026 LOAN - TO - ENTERPRISE VALUE 45.5% 46.0% at Q2 2026 CECL RESERVE / PRINCIPAL 2.87% +$2.8M provision in Q3 LEVERAGE RATIO 0.48x 0.47x at Q2 2026 CRE DI T & CA P I T AL S NA P S H O T Change Q2 2026 Q3 2026 Metric — $16.5M $16.5M Loans on non - accrual (#4, #34) — principal (0.16x) 1.17x 1.01x Real estate collateral coverage +0.5 pts 98.4% 98.9% Fair value as % of par ($2.34) / ($0.03) $14.15 ($14.15) $11.81 ($14.12) Book value per share — GAAP (adjusted, as - paid) +$3.3M drawn $91.1M / $110.0M $94.4M / $117.5M Revolver drawn / commitments (1) As of September 30, 2026, includes the outstanding principal balance of the Koach Notes, which are classified within stockholders’ equity in the Company’s consolidated financial statements. (2) Includes Koach Notes income of $2.6M for the three months ended September 30, 2026.
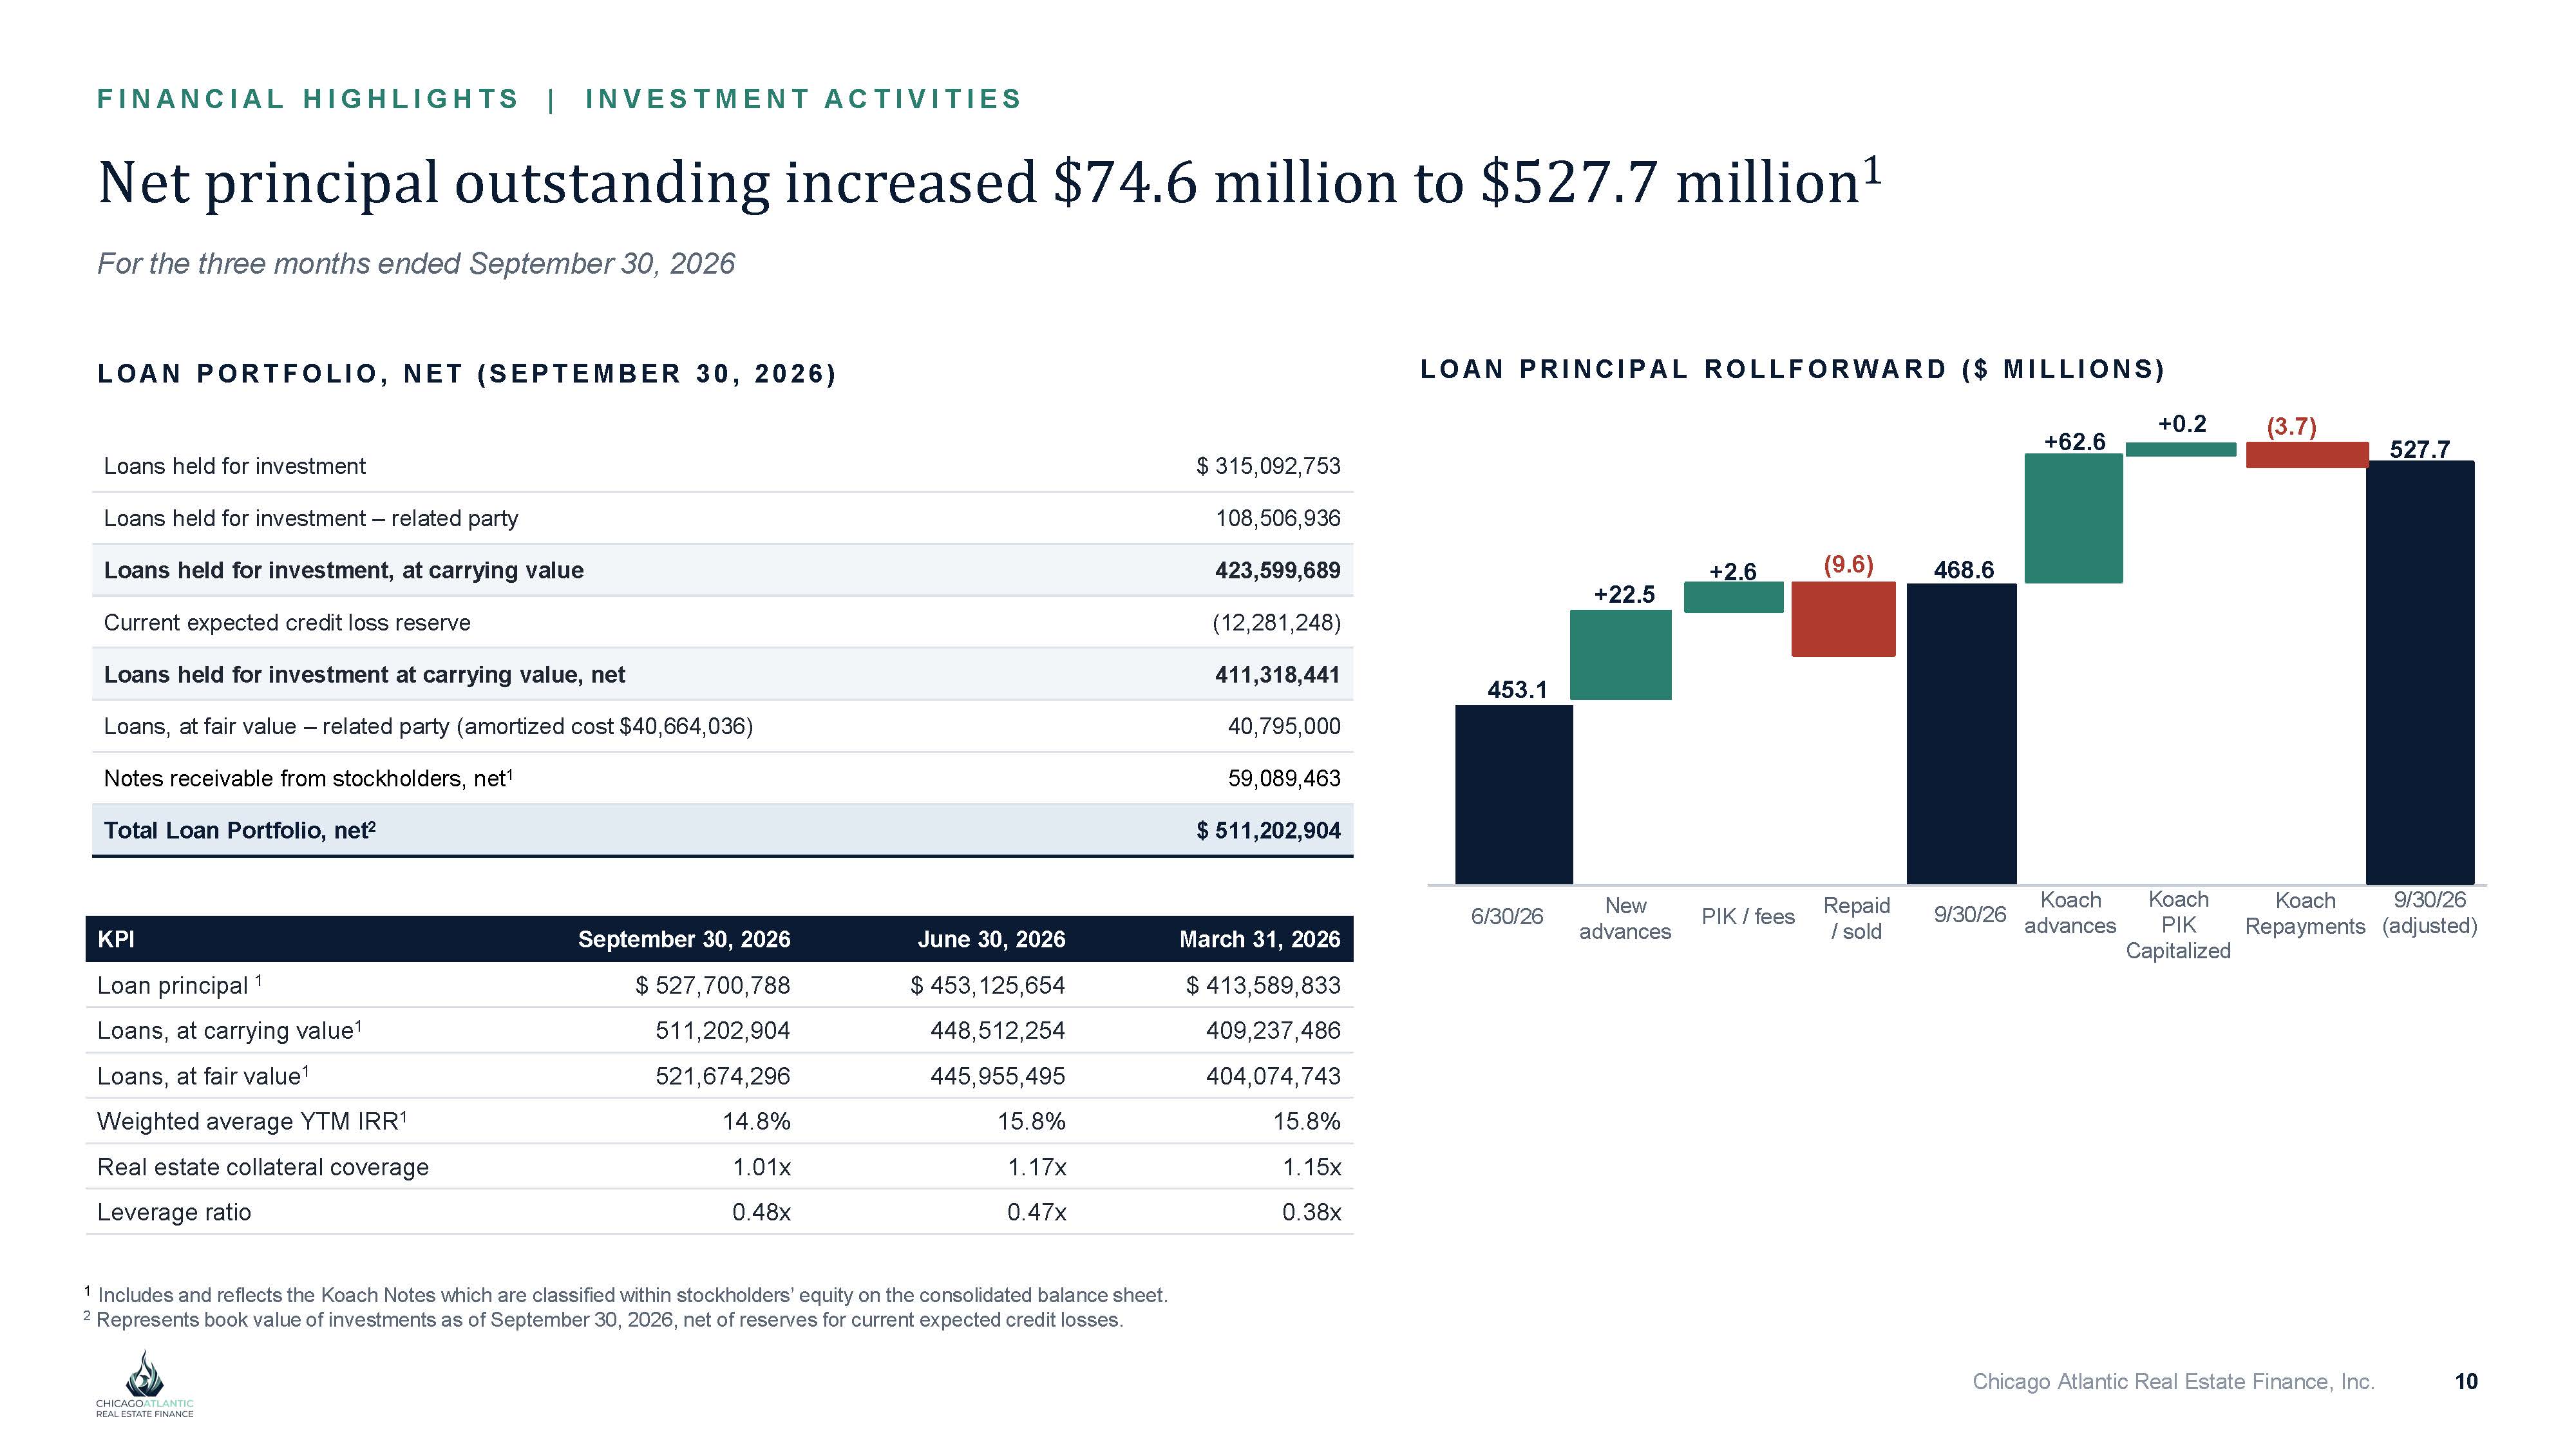
F I NA NCI A L HI G HL I G HT S | I NV E S T M E NT A CT I V I T I E S Net principal outstanding increased $74.6 million to $527.7 million 1 For the three months ended September 30, 2026 L O A N P RI NCI P AL RO L L F O R W AR D ( $ M I L L I O NS ) 6/30/26 +62.6 New advances +2.6 PIK / fees (9.6) Repaid / sold 468.6 9/30/26 L O A N P O R T F O L I O , N E T ( S E P T E M B E R 30, 2026) $ 315,092,753 Loans held for investment 108,506,936 Loans held for investment – related party 423,599,689 Loans held for investment, at carrying value (12,281,248) Current expected credit loss reserve 411,318,441 Loans held for investment at carrying value, net 40,795,000 Loans, at fair value – related party (amortized cost $40,664,036) 59,089,463 Notes receivable from stockholders, net 1 $ 511,202,904 Total Loan Portfolio, net 2 Koach advances +22.5 453.1 527.7 March 31, 2026 June 30, 2026 September 30, 2026 KPI $ 413,589,833 $ 453,125,654 $ 527,700,788 Loan principal 1 409,237,486 448,512,254 511,202,904 Loans, at carrying value 1 404,074,743 445,955,495 521,674,296 Loans, at fair value 1 15.8% 15.8% 14.8% Weighted average YTM IRR 1 1.15x 1.17x 1.01x Real estate collateral coverage 0.38x 0.47x 0.48x Leverage ratio 1 Includes and reflects the Koach Notes which are classified within stockholders’ equity on the consolidated balance sheet. 2 Represents book value of investments as of September 30, 2026, net of reserves for current expected credit losses. (3.7) +0.2 Chicago Atlantic Real Estate Finance, Inc. 10 Koach PIK Capitalized Koach 9/30/26 Repayments (adjusted)
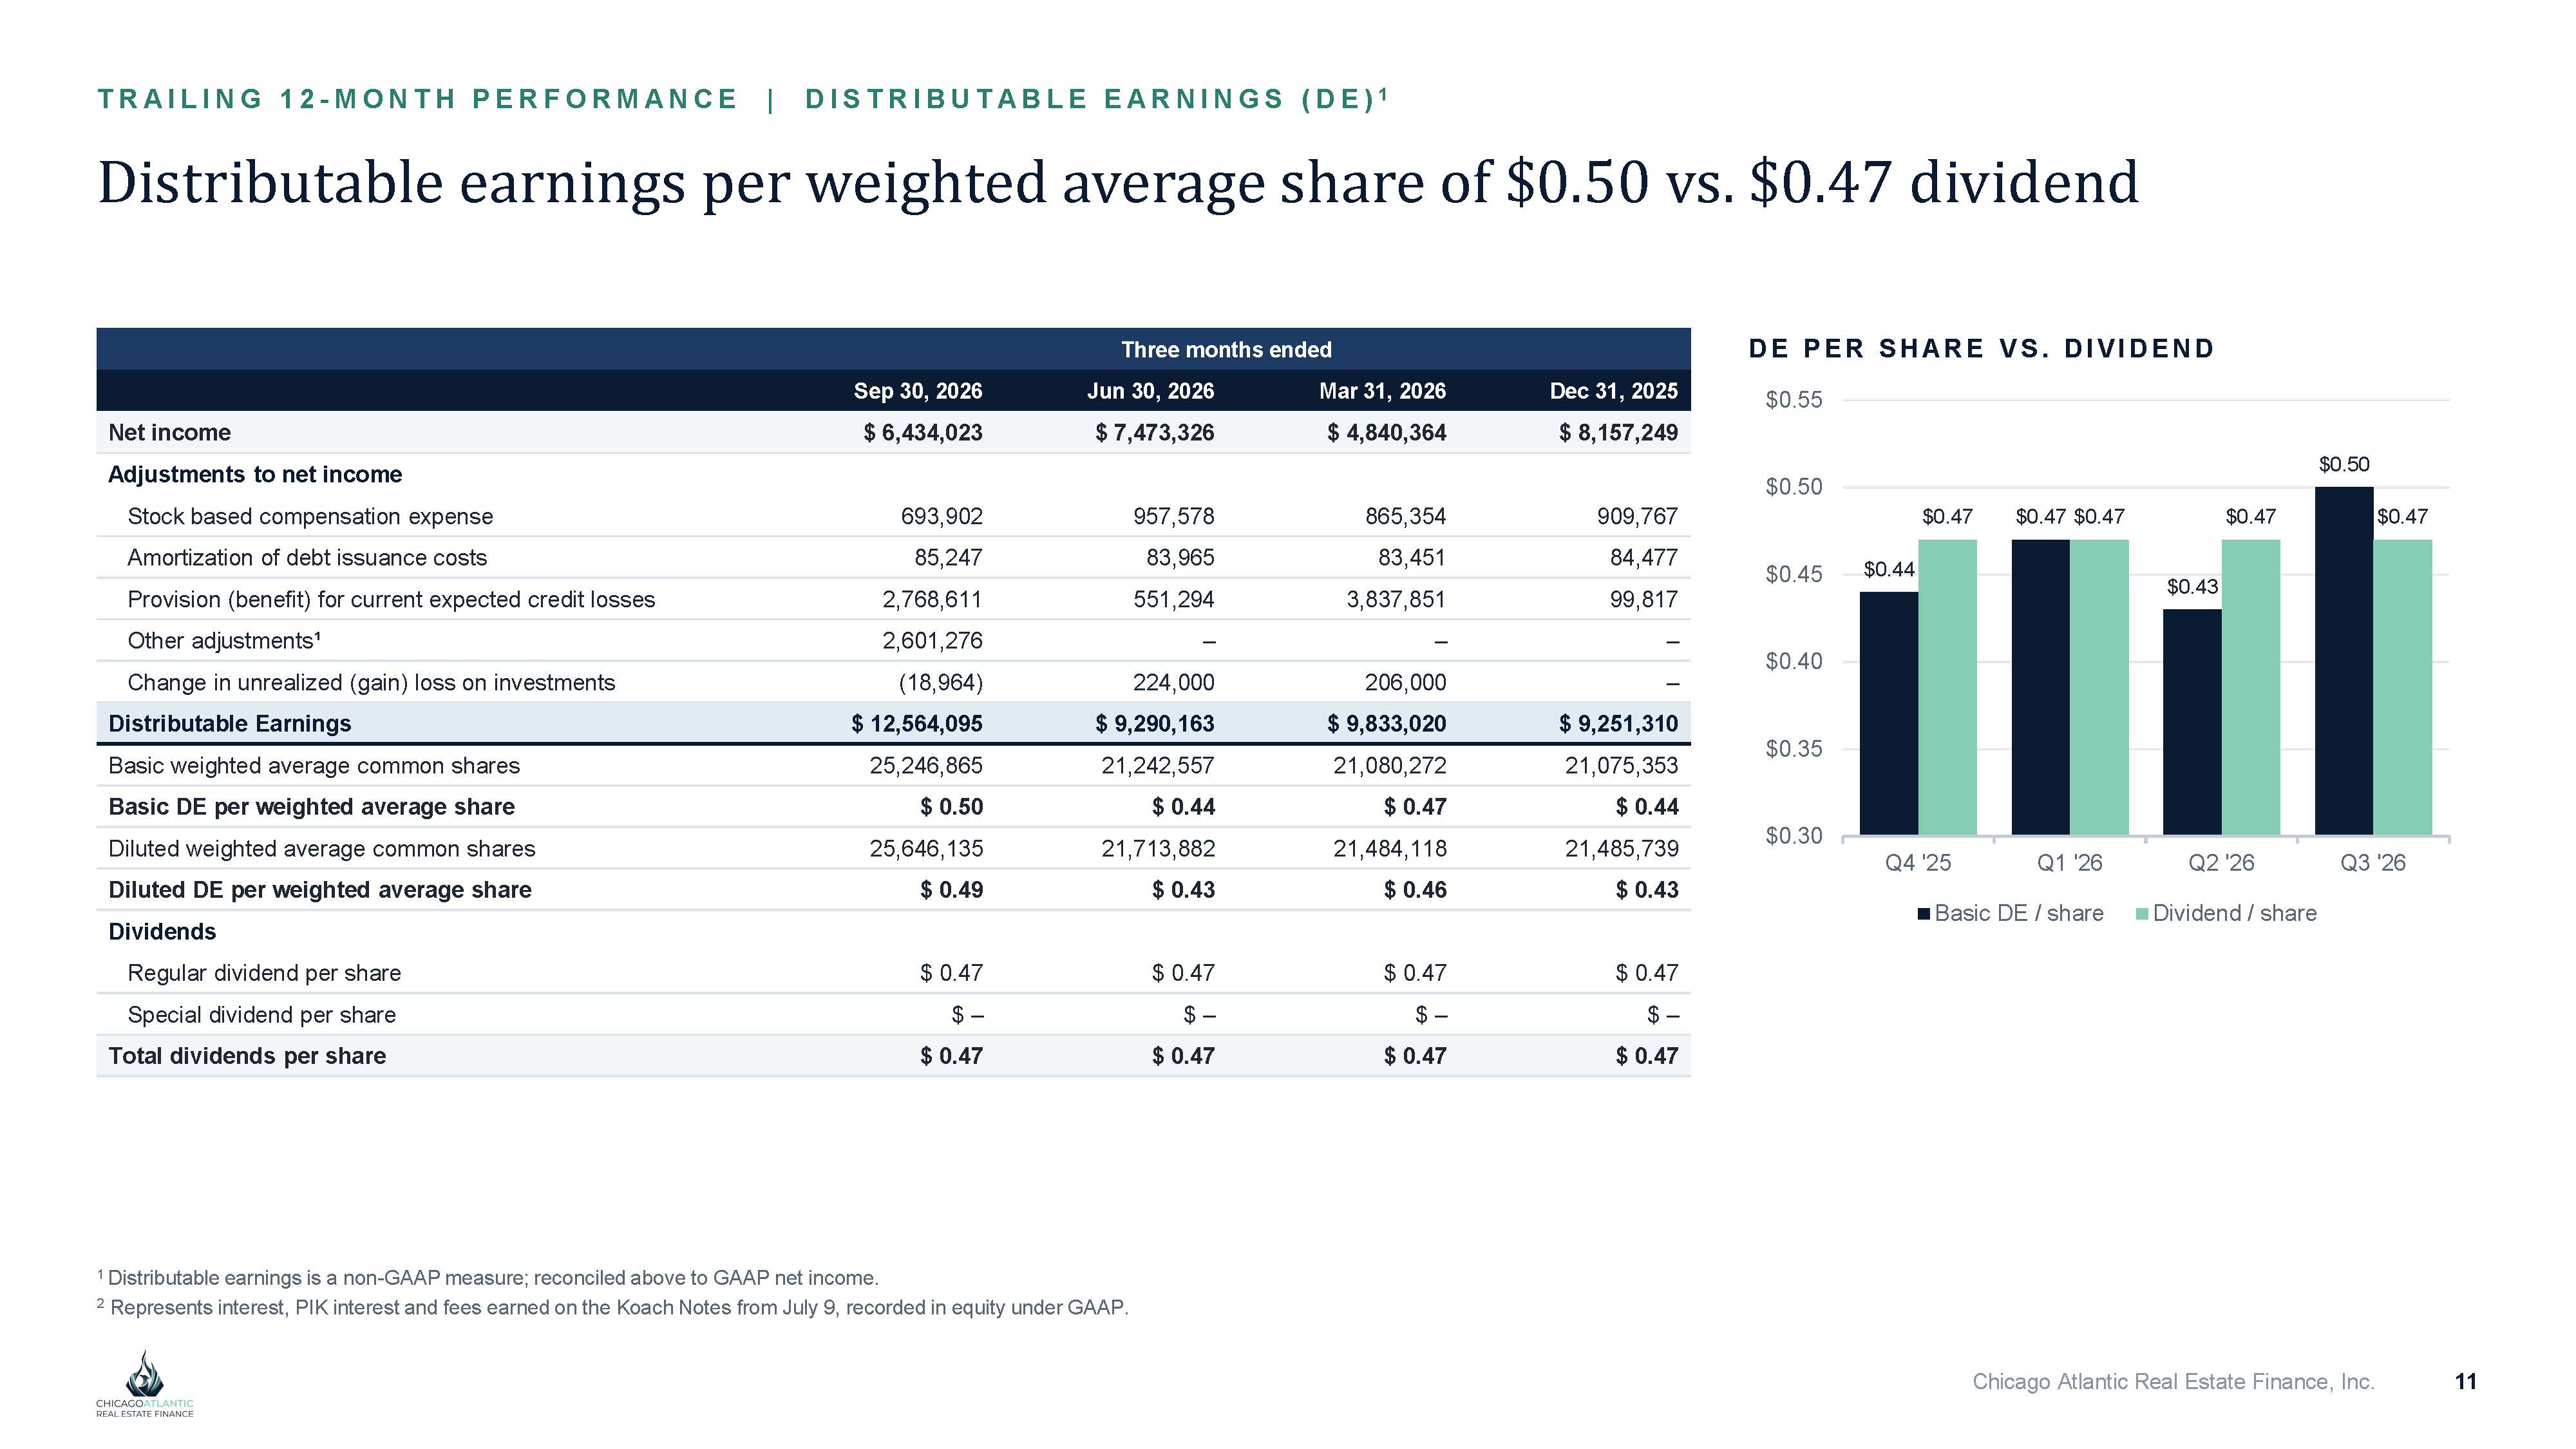
T R A IL IN G 1 2 - M O NT H P E RF O RM A NCE | DI S T RI BUT A BL E E A RNI NG S ( DE ) 1 Distributable earnings per weighted average share of $0.50 vs. $0.47 dividend Three months ended Dec 31, 2025 Mar 31, 2026 Jun 30, 2026 Sep 30, 2026 $ 8,157,249 $ 4,840,364 $ 7,473,326 $ 6,434,023 Net income Adjustments to net income 909,767 865,354 957,578 693,902 Stock based compensation expense 84,477 83,451 83,965 85,247 Amortization of debt issuance costs 99,817 3,837,851 551,294 2,768,611 Provision (benefit) for current expected credit losses – – – 2,601,276 Other adjustments¹ – 206,000 224,000 (18,964) Change in unrealized (gain) loss on investments $ 9,251,310 $ 9,833,020 $ 9,290,163 $ 12,564,095 Distributable Earnings 21,075,353 21,080,272 21,242,557 25,246,865 Basic weighted average common shares $ 0.44 $ 0.47 $ 0.44 $ 0.50 Basic DE per weighted average share 21,485,739 21,484,118 21,713,882 25,646,135 Diluted weighted average common shares $ 0.43 $ 0.46 $ 0.43 $ 0.49 Diluted DE per weighted average share Dividends $ 0.47 $ 0.47 $ 0.47 $ 0.47 Regular dividend per share $ – $ – $ – $ – Special dividend per share $ 0.47 $ 0.47 $ 0.47 $ 0.47 Total dividends per share $0.44 $0.43 $0.47 $0.47 $0.47 $0.47 $0.47 D E PER SH A R E VS. D I VI D EN D $0.55 $0.50 $0.50 $0.40 $0.35 $0.30 $0.45 Q2 '26 Q3 '26 Q4 '25 Q1 '26 Basic DE / share Dividend / share Chicago Atlantic Real Estate Finance, Inc. 11 1 Distributable earnings is a non - GAAP measure; reconciled above to GAAP net income. 2 Represents interest, PIK interest and fees earned on the Koach Notes from July 9, recorded in equity under GAAP.
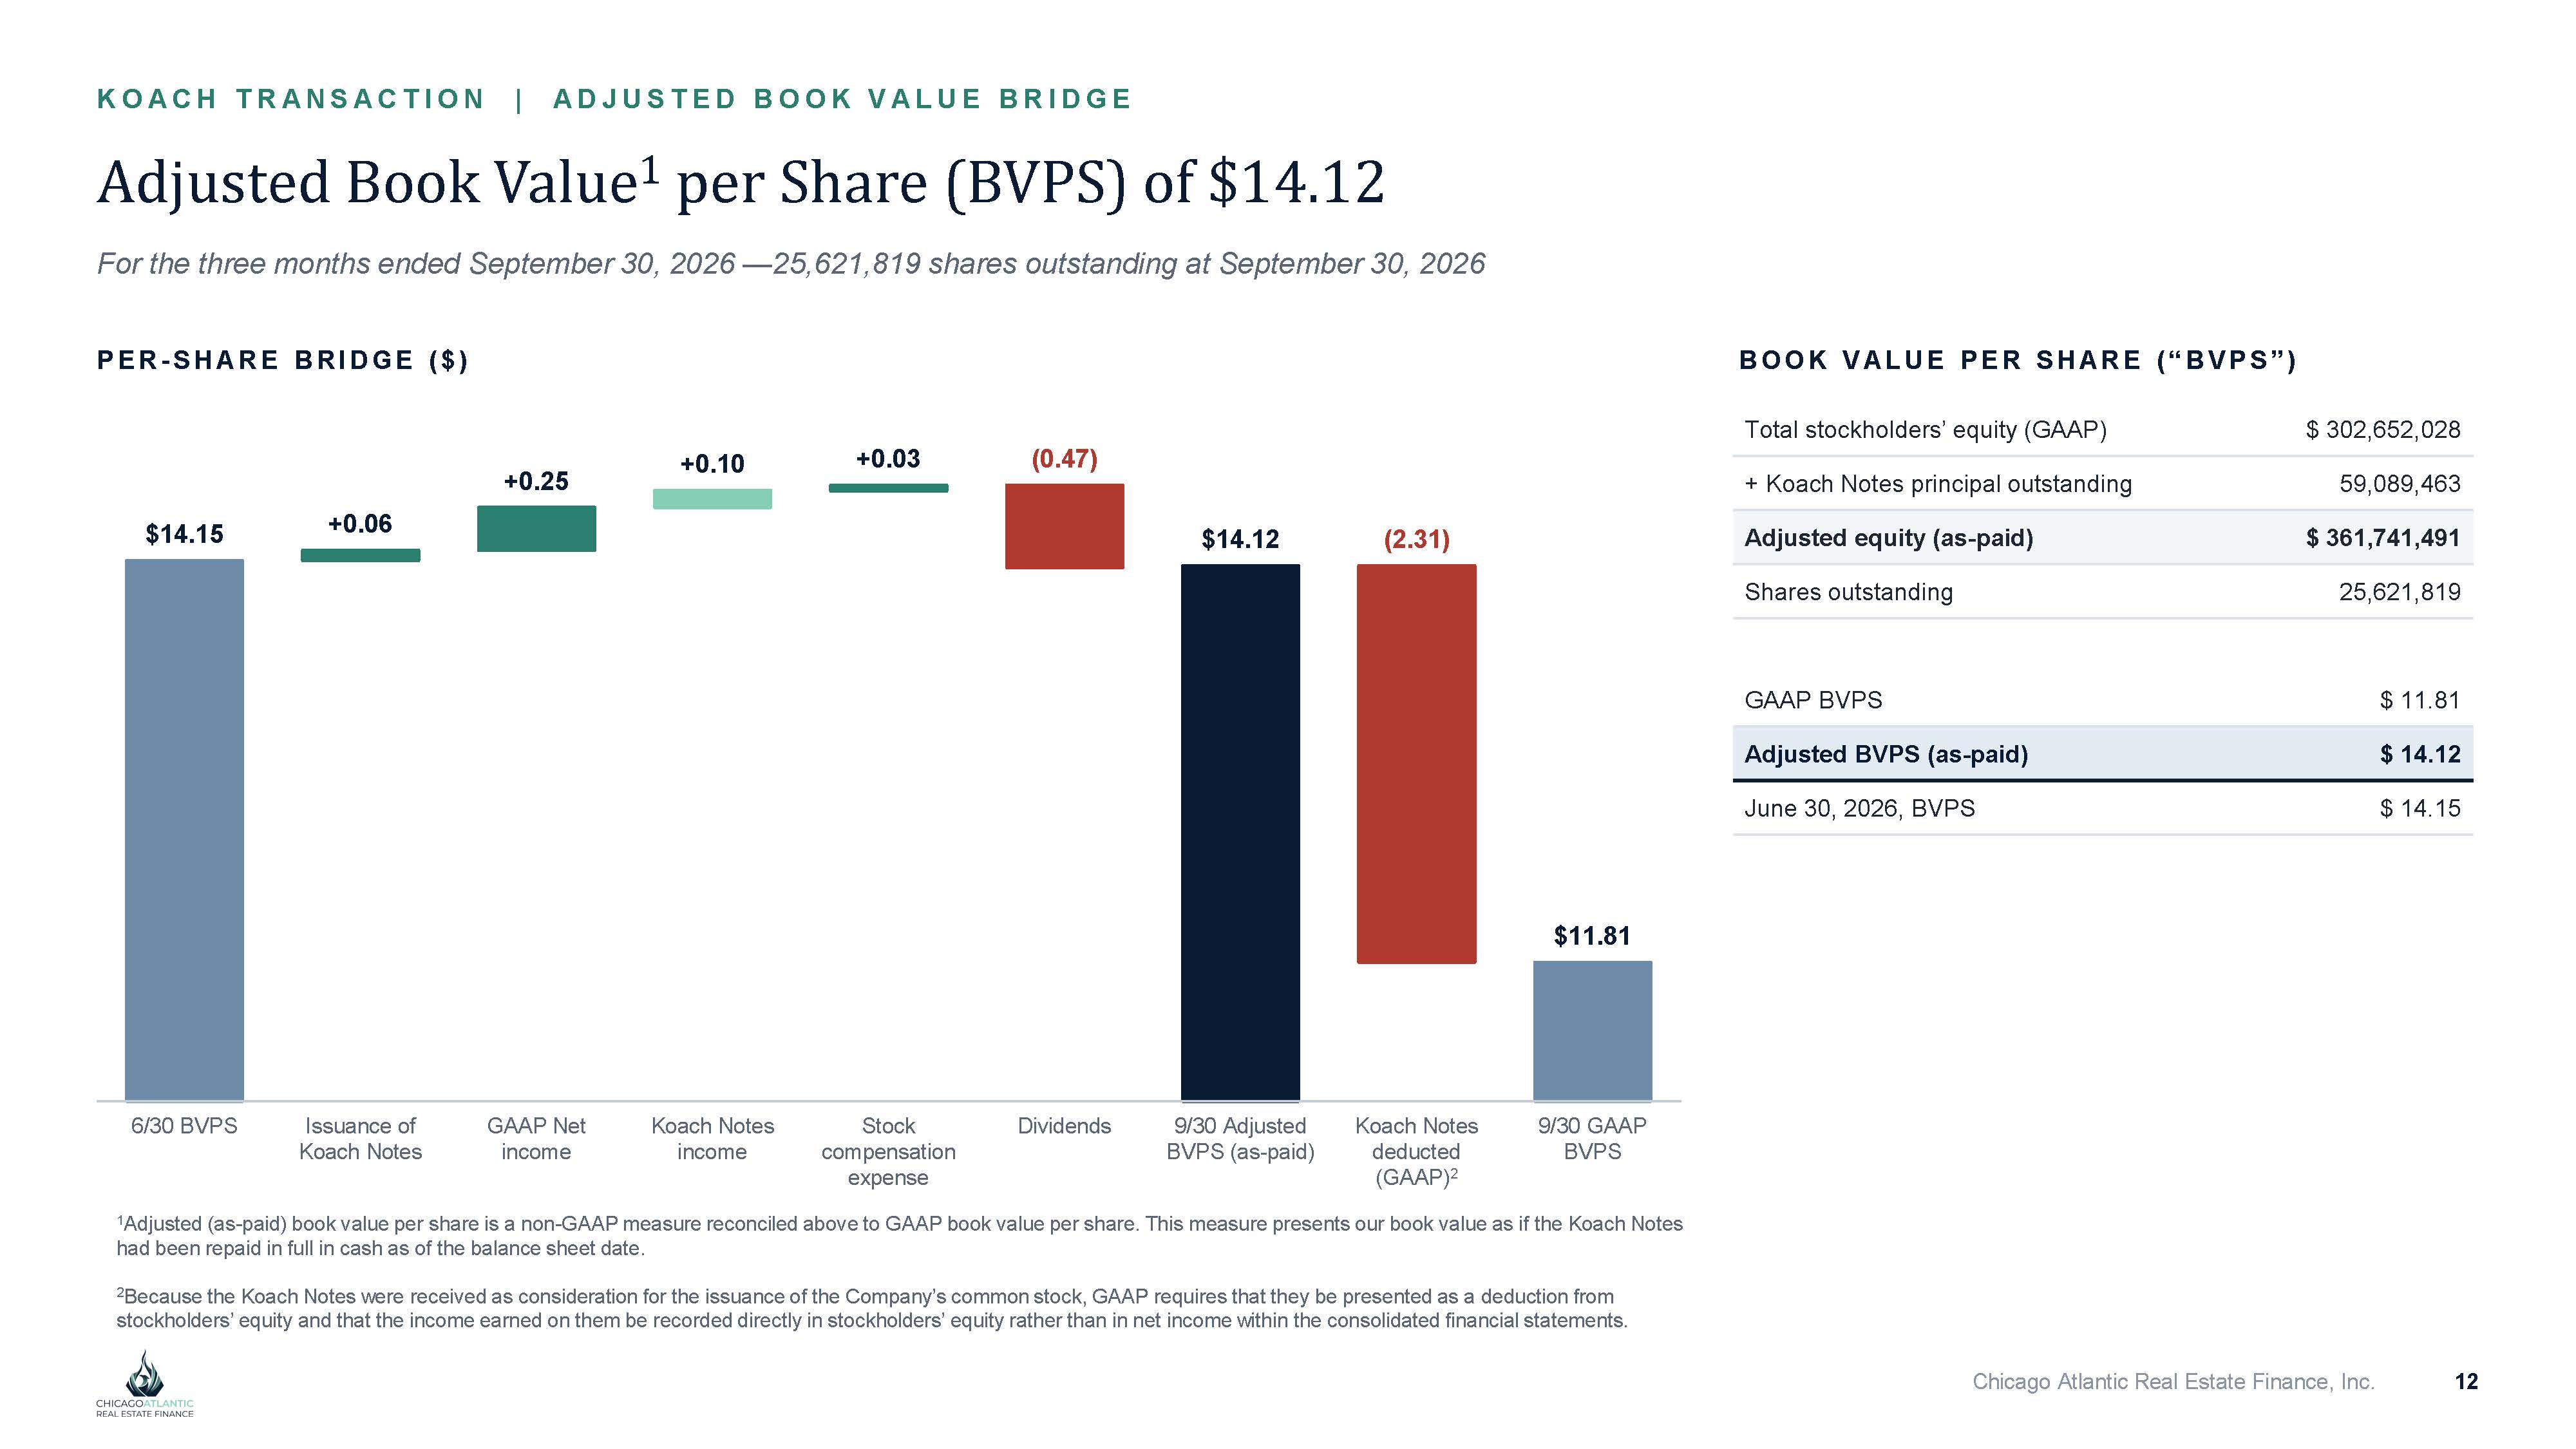
KO A CH T RA NS A CT I O N | A DJ US T E D BO O K V A L UE BRI DG E Adjusted Book Value 1 per Share (BVPS) of $14.12 For the three months ended September 30, 2026 — 25,621,819 shares outstanding at September 30, 2026 $14.15 9/30 GAAP Koach Notes 9/30 Adjusted Dividends Stock Koach Notes GAAP Net Issuance of 6/30 BVPS BVPS deducted BVPS (as - paid) compensation income income Koach Notes (GAAP) 2 expense +0.06 +0.25 +0.10 +0.03 (0.47) $14.12 (2.31) Chicago Atlantic Real Estate Finance, Inc. 12 $11.81 PER - S H ARE BRI DG E ( $ ) B O O K VA L U E PER SH A R E ( “ B VPS” ) $ 302,652,028 Total stockholders’ equity (GAAP) 59,089,463 + Koach Notes principal outstanding $ 361,741,491 Adjusted equity (as - paid) 25,621,819 Shares outstanding $ 11.81 GAAP BVPS $ 14.12 Adjusted BVPS (as - paid) $ 14.15 June 30, 2026, BVPS 1 Adjusted (as - paid) book value per share is a non - GAAP measure reconciled above to GAAP book value per share. This measure presents our book value as if the Koach Notes had been repaid in full in cash as of the balance sheet date. 2 Because the Koach Notes were received as consideration for the issuance of the Company’s common stock, GAAP requires that they be presented as a deduction from stockholders’ equity and that the income earned on them be recorded directly in stockholders’ equity rather than in net income within the consolidated financial statements.
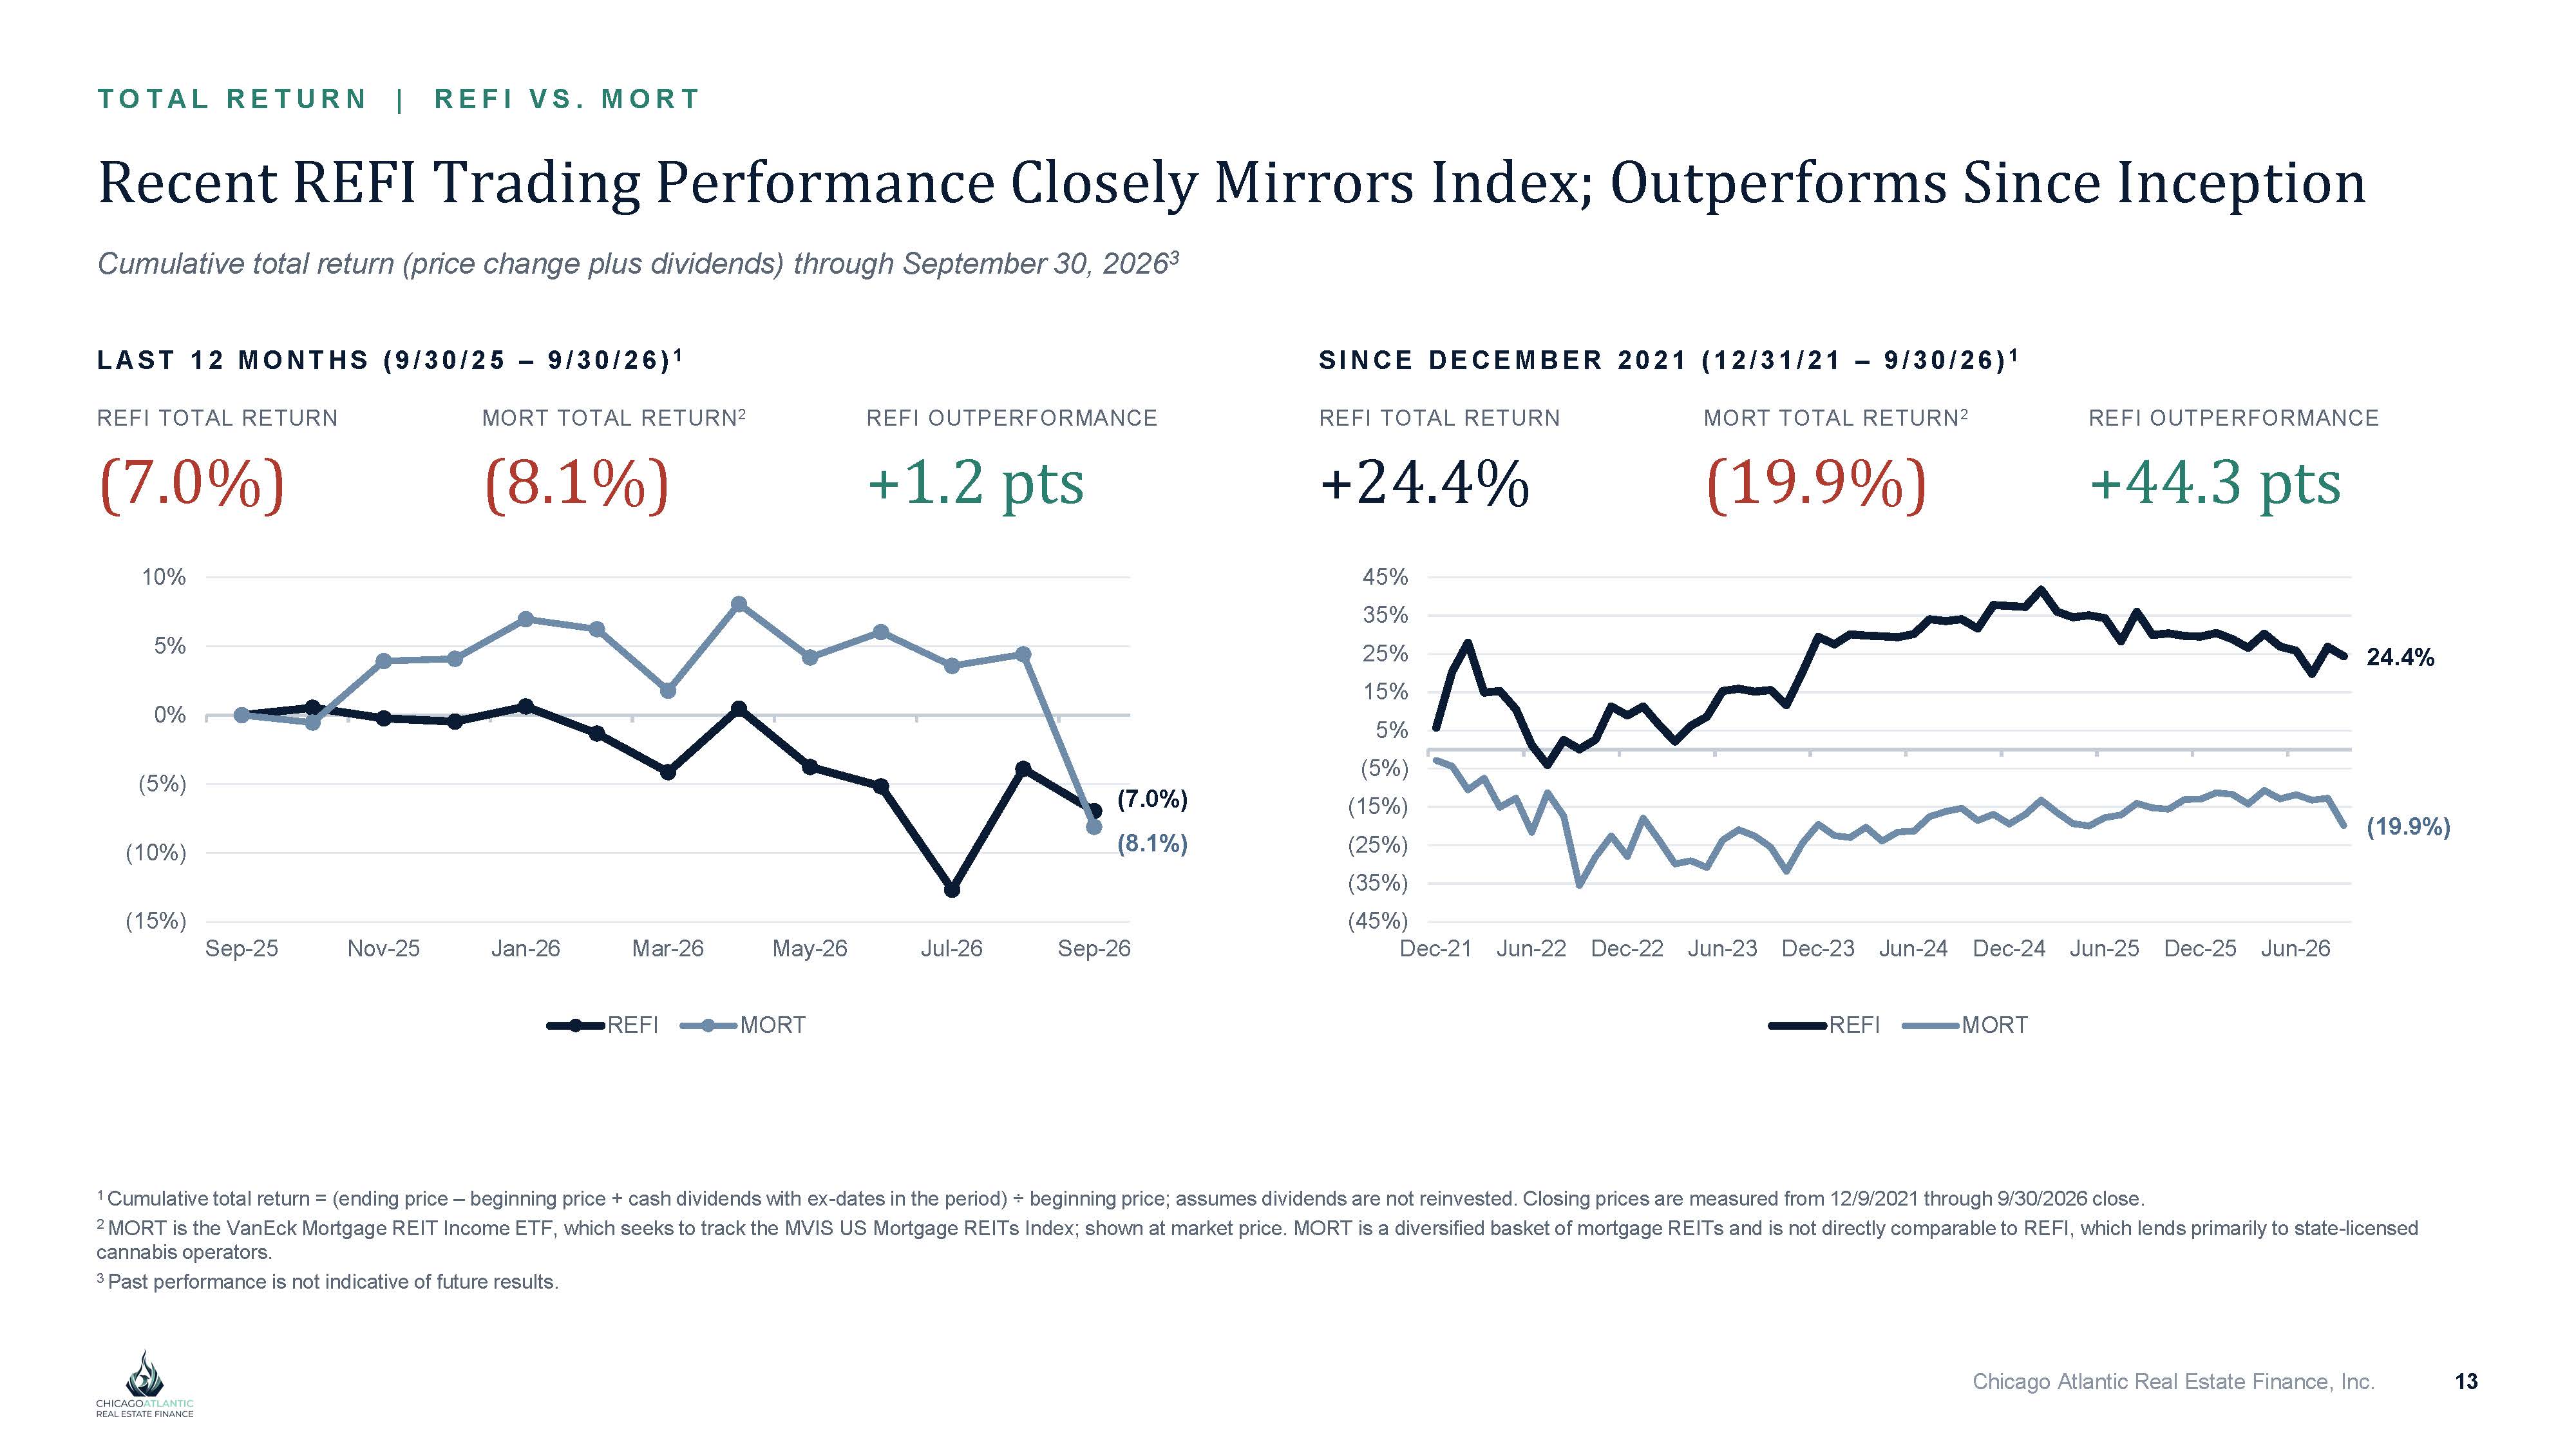
T O T A L RE T URN | RE F I V S . M O RT Recent REFI Trading Performance Closely Mirrors Index; Outperforms Since Inception Cumulative total return (price change plus dividends) through September 30, 2026 3 L A S T 12 M O N T H S ( 9/ 30/ 25 – 9/ 30/ 26) 1 REFI TOTAL RETURN (7.0%) MORT TOTAL RETURN 2 (8.1%) REFI OUTPERFORMANCE +1.2 pts (7.0%) (8.1%) (15%) (10%) (5%) 0% 5% 10% Sep - 25 Nov - 25 Jan - 26 Mar - 26 May - 26 Jul - 26 Sep - 26 REFI MORT S I N C E D E C E M B E R 2021 ( 12/ 31/ 21 – 9/ 30/ 26) 1 REFI TOTAL RETURN +24.4% MORT TOTAL RETURN 2 (19.9%) REFI OUTPERFORMANCE +44.3 pts 24.4% (19.9%) 45% 35% 25% 15% 5% (5%) (15%) (25%) (35%) (45%) Dec - 21 Jun - 22 Dec - 22 Jun - 23 Dec - 23 Jun - 24 Dec - 24 Jun - 25 Dec - 25 Jun - 26 REFI MORT Chicago Atlantic Real Estate Finance, Inc. 13 1 Cumulative total return = (ending price – beginning price + cash dividends with ex - dates in the period) · beginning price; assumes dividends are not reinvested. Closing prices are measured from 12/9/2021 through 9/30/2026 close. 2 MORT is the VanEck Mortgage REIT Income ETF, which seeks to track the MVIS US Mortgage REITs Index; shown at market price. MORT is a diversified basket of mortgage REITs and is not directly comparable to REFI, which lends primarily to state - licensed cannabis operators. 3 Past performance is not indicative of future results.

Portfolio Summary As of September 30, 2026
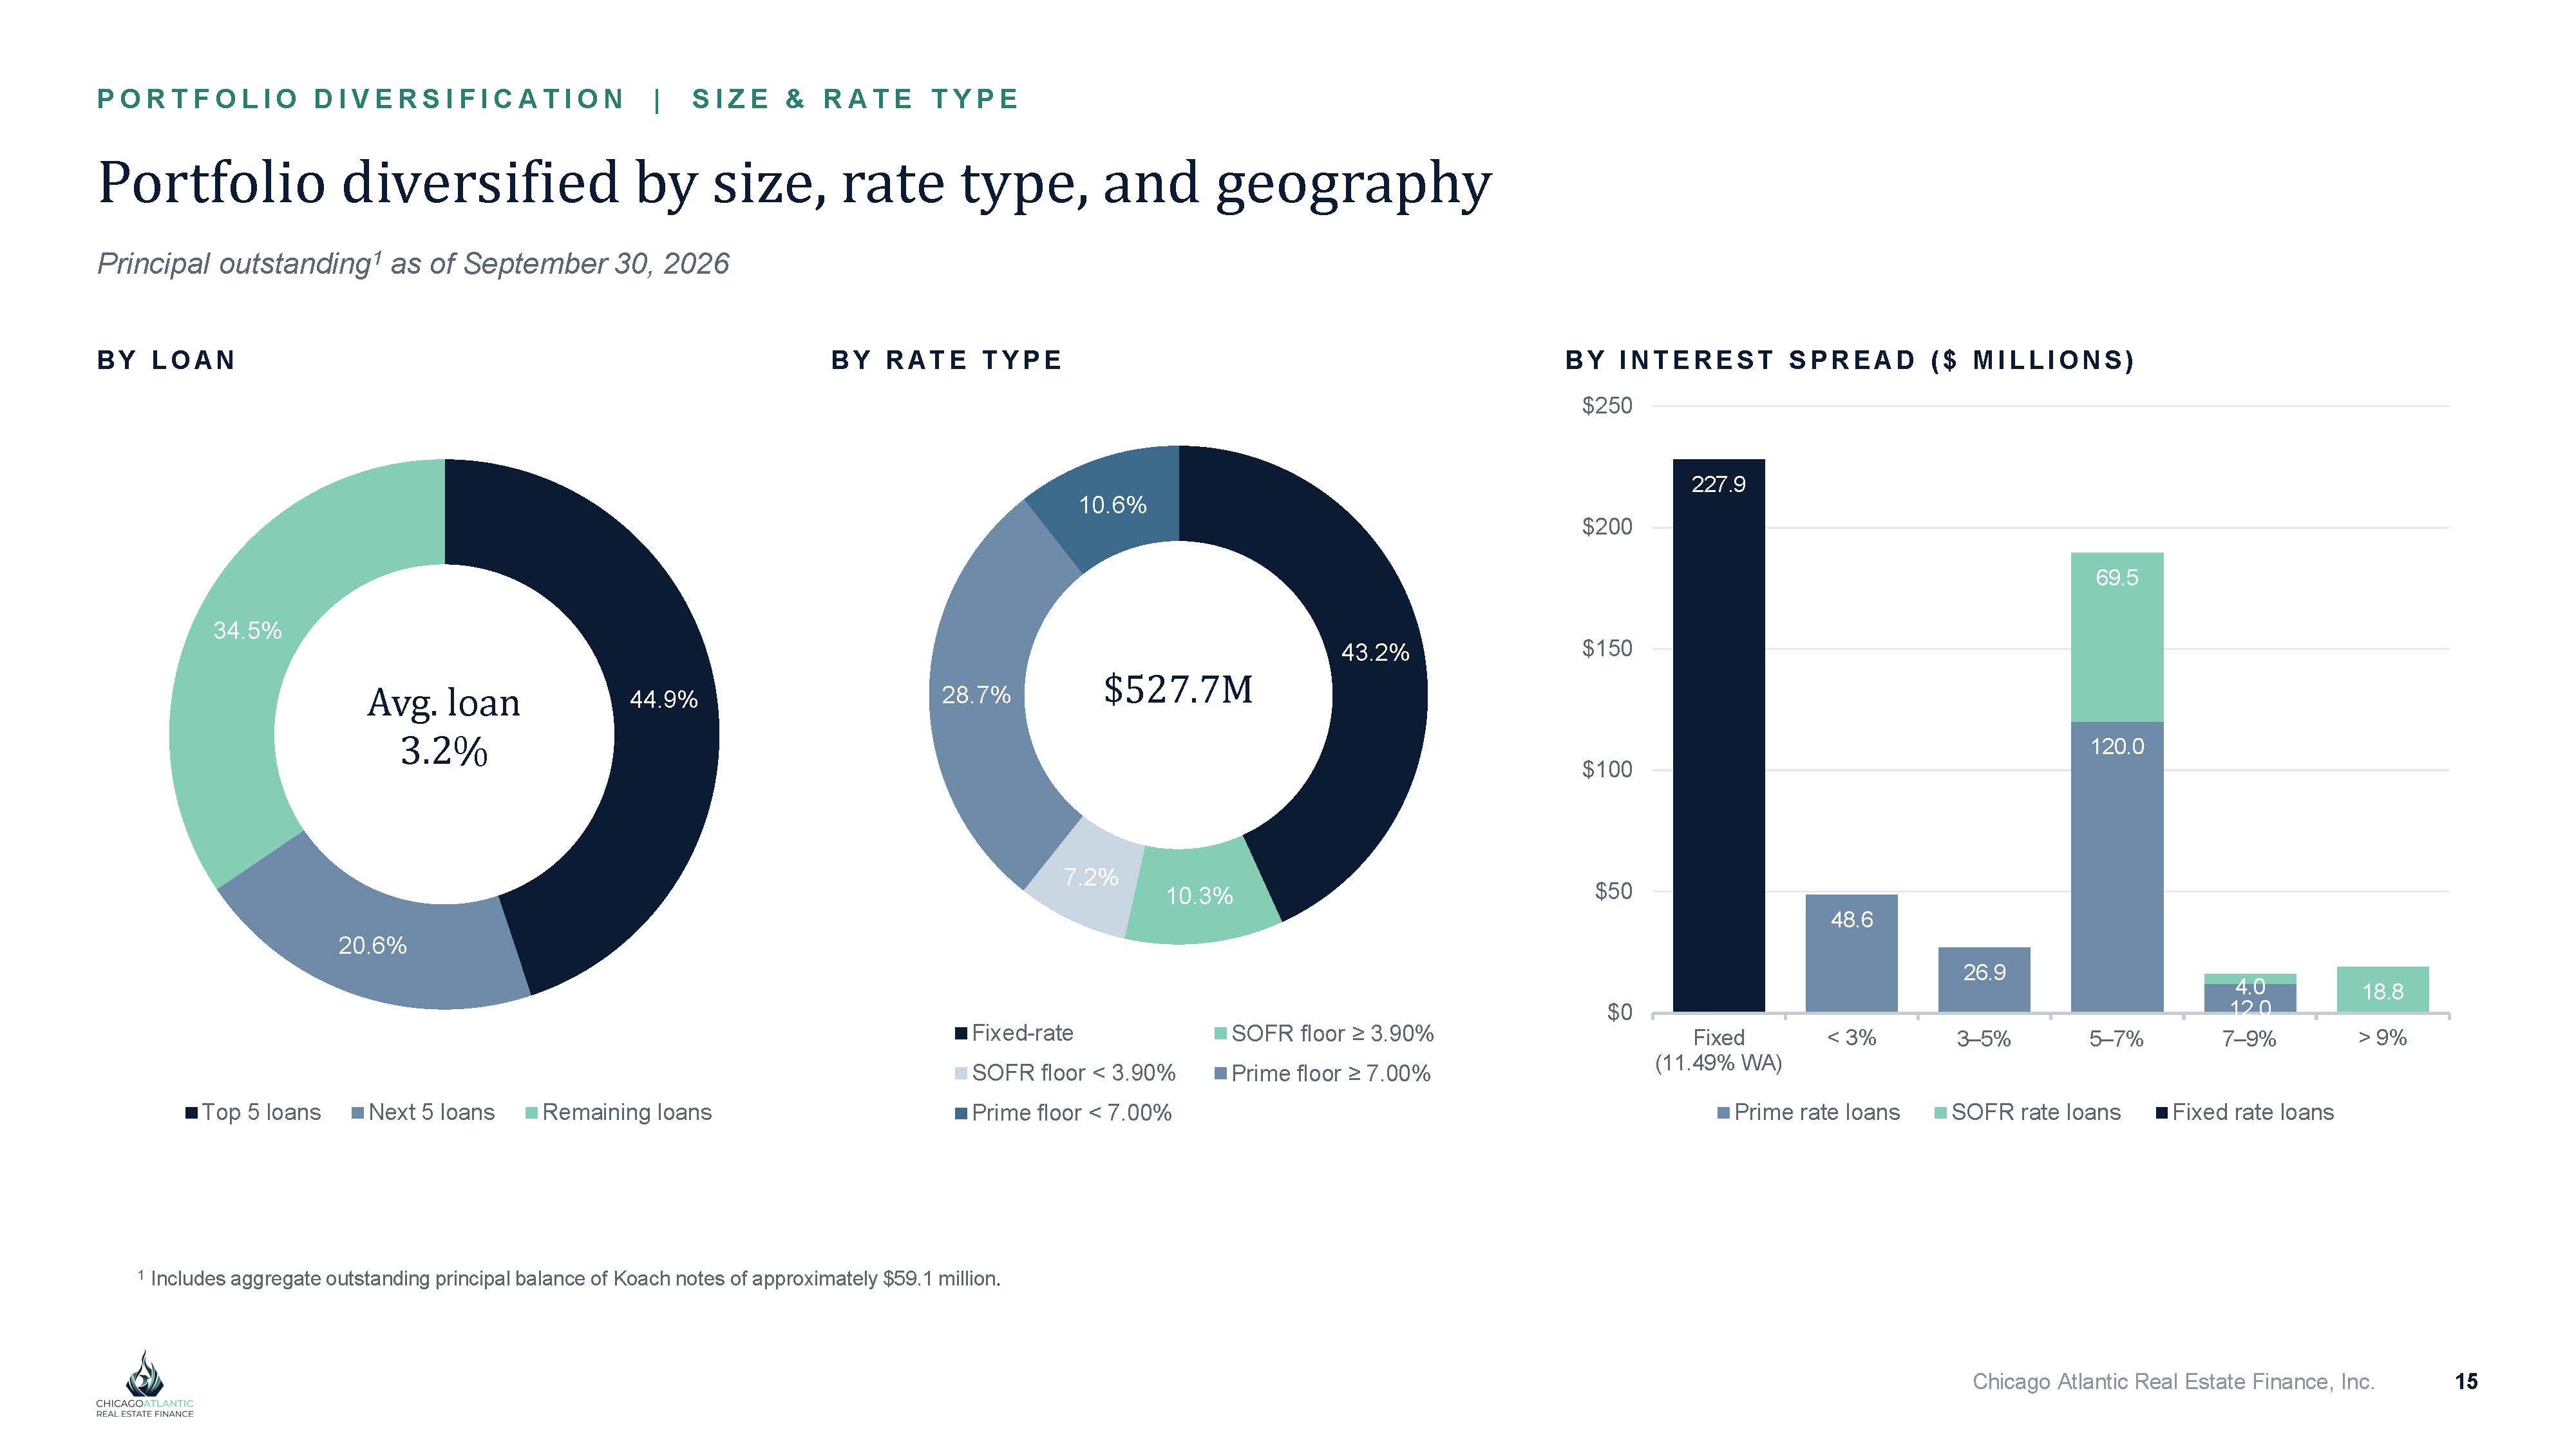
P O R T F O L I O D I V E R S I F I C A T I O N | S I Z E & R A T E T Y P E Portfolio diversified by size, rate type, and geography Principal outstanding 1 as of September 30, 2026 B Y L O AN 44.9% 20.6% 34.5% Top 5 loans Next 5 loans Remaining loans Avg. loan 3.2% B Y R A T E T YPE 43.2% 10.3% 7.2% 28.7% 10.6% Fixed - rate SOFR floor < 3.90% Prime floor < 7.00% SOFR floor ≥ 3.90% Prime floor ≥ 7.00% $527.7M B Y I N T ER EST SPR EA D ( $ M I L L I O N S) 48.6 26.9 120.0 12.0 69.5 4.0 18.8 $250 227.9 $0 $50 $100 $150 $200 Fixed (11.49% WA) < 3% 3 – 5% 5 – 7% 7 – 9% > 9% Prime rate loans SOFR rate loans Fixed rate loans Chicago Atlantic Real Estate Finance, Inc. 15 1 Includes aggregate outstanding principal balance of Koach notes of approximately $59.1 million .
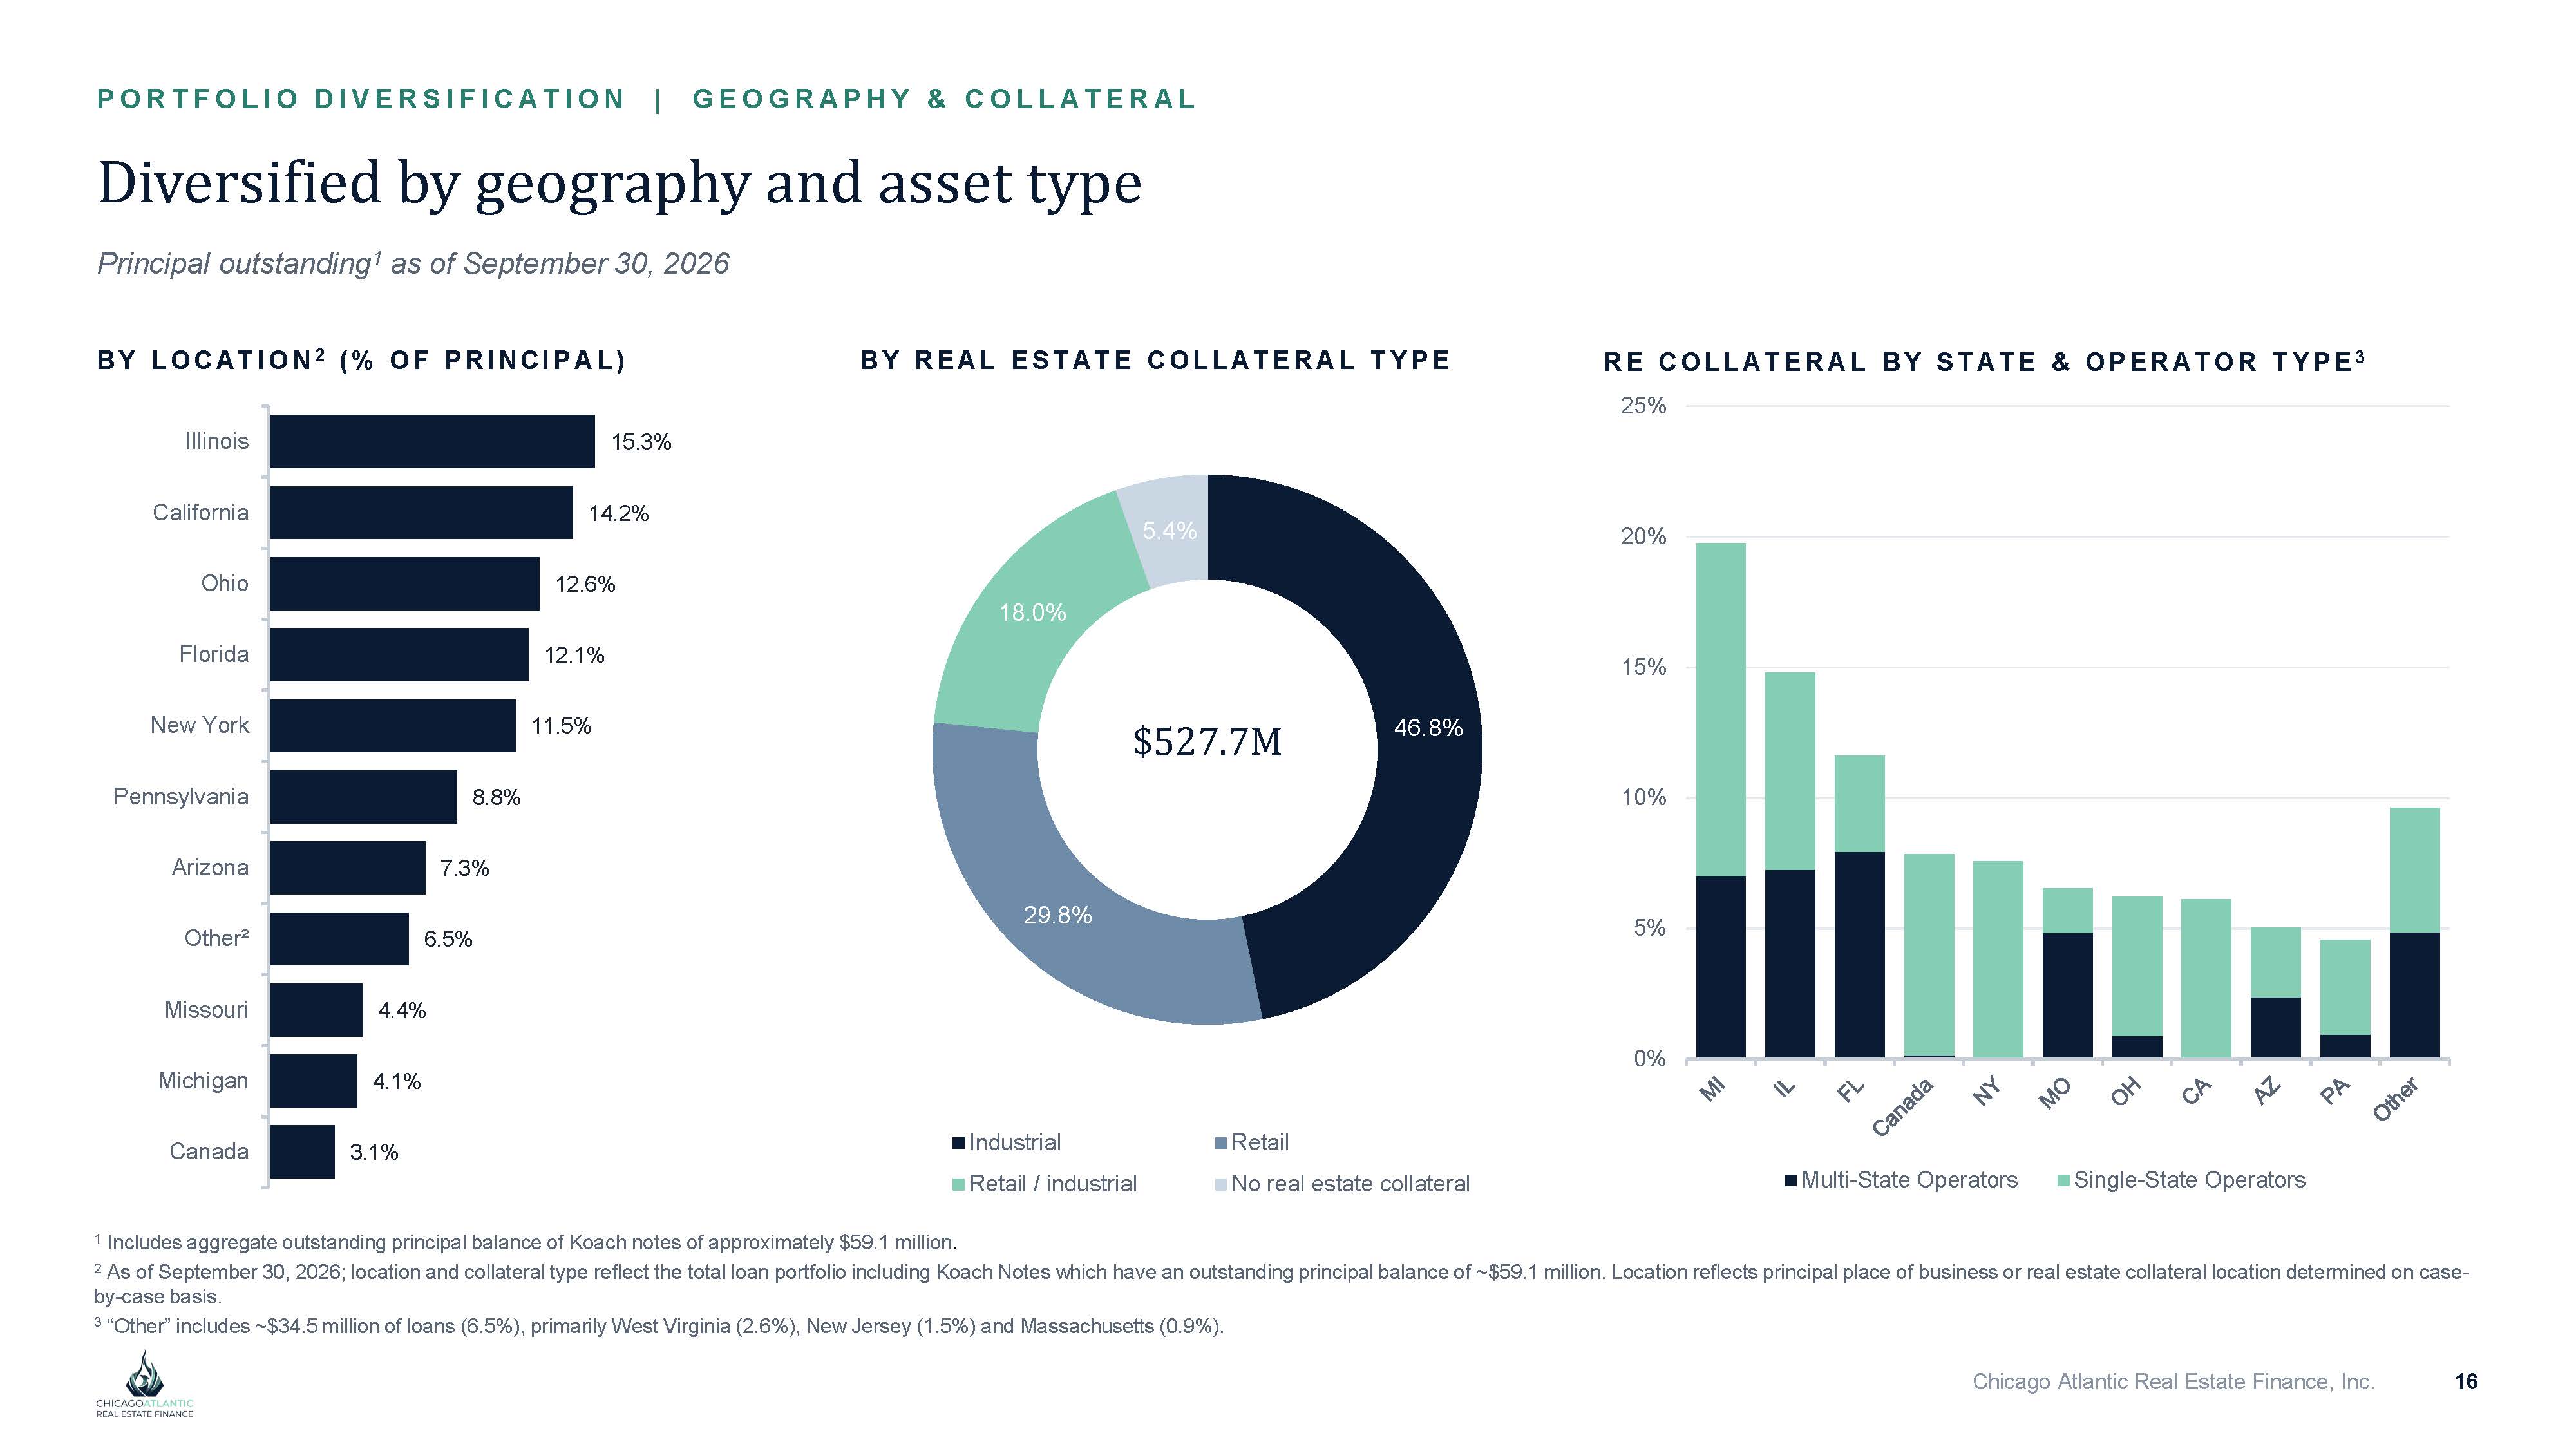
P O RT F O L I O DI V E RS I F I CA T I O N | G E O G RA P HY & CO L L A T E RA L Diversified by geography and asset type Principal outstanding 1 as of September 30, 2026 BY L O CA T I O N 2 ( % O F P RI NCI P AL ) 7.3% 8.8% 11.5% 12.1% 12.6% 14.2% 6.5% Other² 4.4% Missouri 4.1% Michigan 1% 3. Canada 15.3% Arizona Pennsylvania New York Florida Ohio California Illinois B Y R EA L EST A T E C O L L A T E R A L T YPE 46.8% 29.8% 18.0% 5.4% Industrial Retail / industrial Retail No real estate collateral $527.7M R E C O L L A T E R A L B Y ST A T E & O PER A T O R T YPE 3 0% 5% 10% 15% 20% 25% Multi - State Operators Single - State Operators Chicago Atlantic Real Estate Finance, Inc. 16 1 Includes aggregate outstanding principal balance of Koach notes of approximately $59.1 million . 2 A s of September 30, 2026; location and collateral type reflect the total loan portfolio including Koach Notes which have an outstanding principal balance of ~$59.1 million. Location reflects principal place of business or real estate collateral location determined on case - by - case basis. 3 “Other” includes ~$34.5 million of loans (6.5%), primarily West Virginia (2.6%), New Jersey (1.5%) and Massachusetts (0.9%).
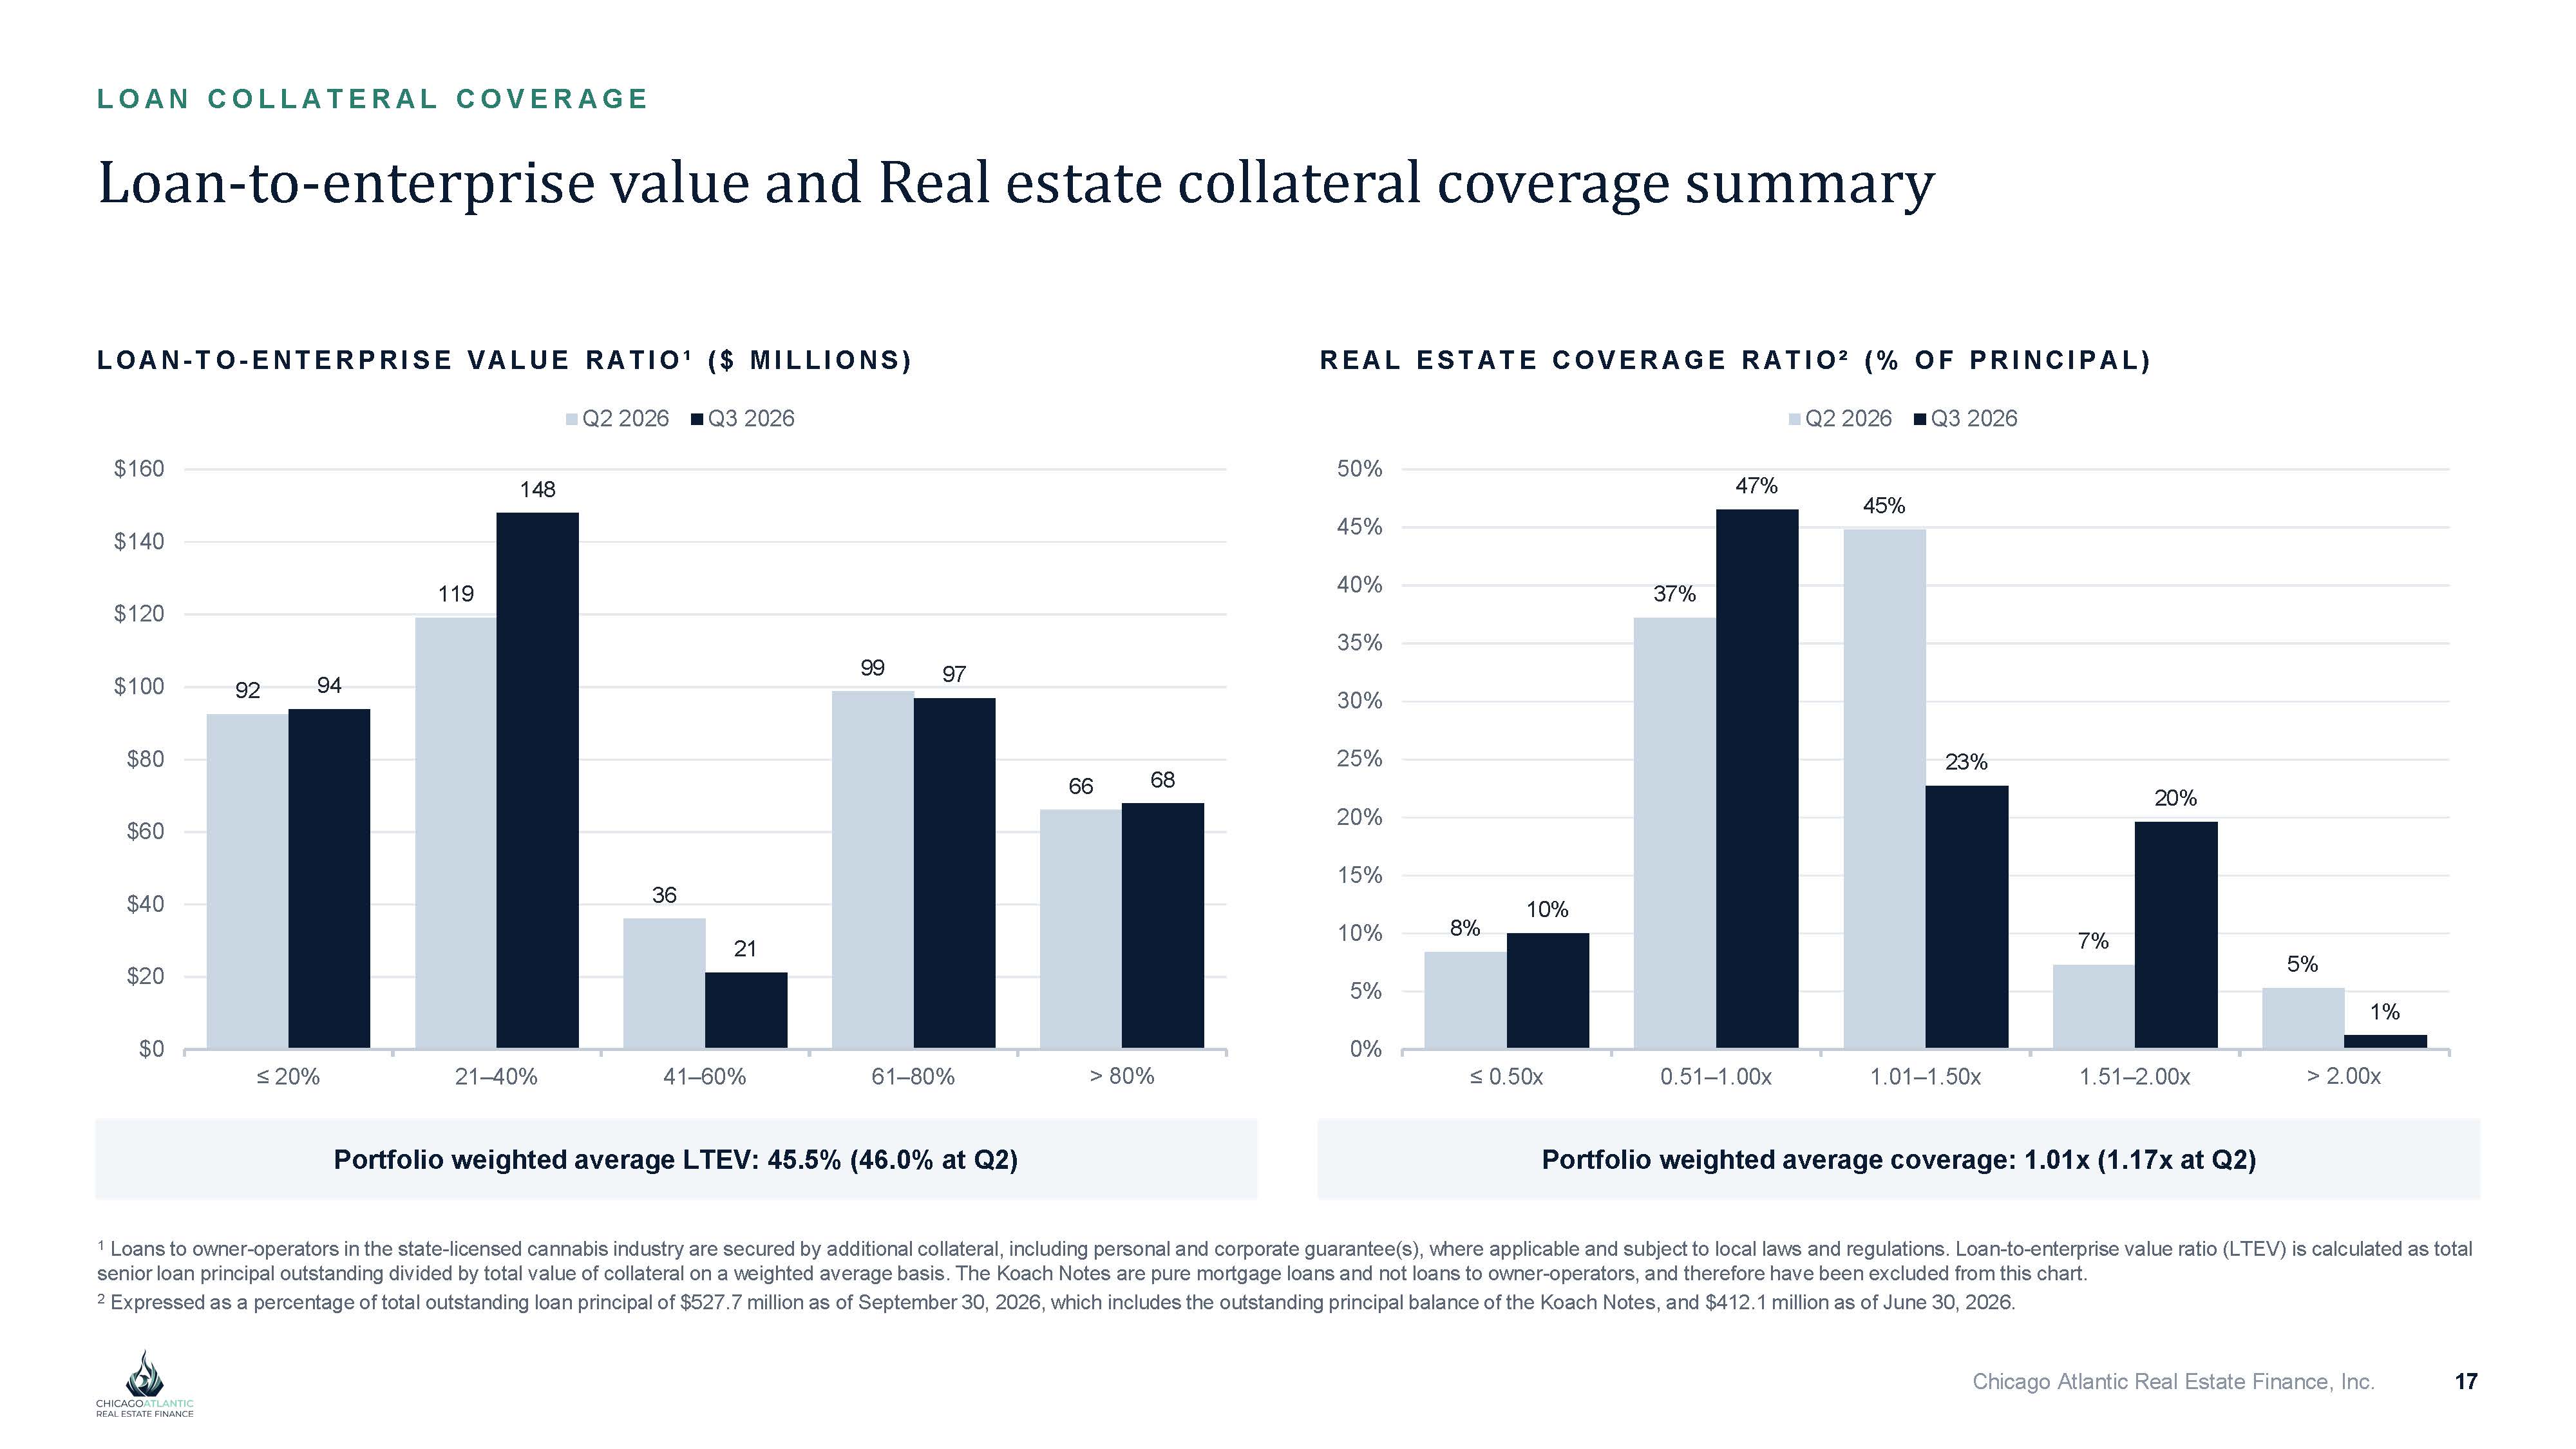
L O A N CO L L A T E RA L CO V E RA G E Loan - to - enterprise value and Real estate collateral coverage summary 92 119 36 99 66 94 148 21 97 68 $0 $20 $40 $60 $80 $100 $120 $140 $160 ≤ 20% 21 – 40% 41 – 60% 61 – 80% > 80% L O AN - TO - E NT E RP RI S E V A L UE RA T I O ¹ ( $ M I L L I O NS ) Q2 2026 Q3 2026 8% 37% 45% 7% 5% 10% 47% 23% 20% 1% ≤ 0.50x 0.51 – 1.00x 1.01 – 1.50x 1.51 – 2.00x > 2.00x 0% 5% 10% 15% 20% 25% 30% 35% 40% 45% 50% R EA L EST A T E C O VER A G E R A T I O ² ( % O F PR I N C I P A L ) Q2 2026 Q3 2026 Portfolio weighted average LTEV: 45.5% (46.0% at Q2) Portfolio weighted average coverage: 1.01x (1.17x at Q2) Chicago Atlantic Real Estate Finance, Inc. 17 1 Loans to owner - operators in the state - licensed cannabis industry are secured by additional collateral, including personal and corporate guarantee(s), where applicable and subject to local laws and regulations. Loan - to - enterprise value ratio (LTEV) is calculated as total senior loan principal outstanding divided by total value of collateral on a weighted average basis. The Koach Notes are pure mortgage loans and not loans to owner - operators, and therefore have been excluded from this chart. 2 Expressed as a percentage of total outstanding loan principal of $527.7 million as of September 30, 2026, which includes the outstanding principal balance of the Koach Notes, and $412.1 million as of June 30, 2026.
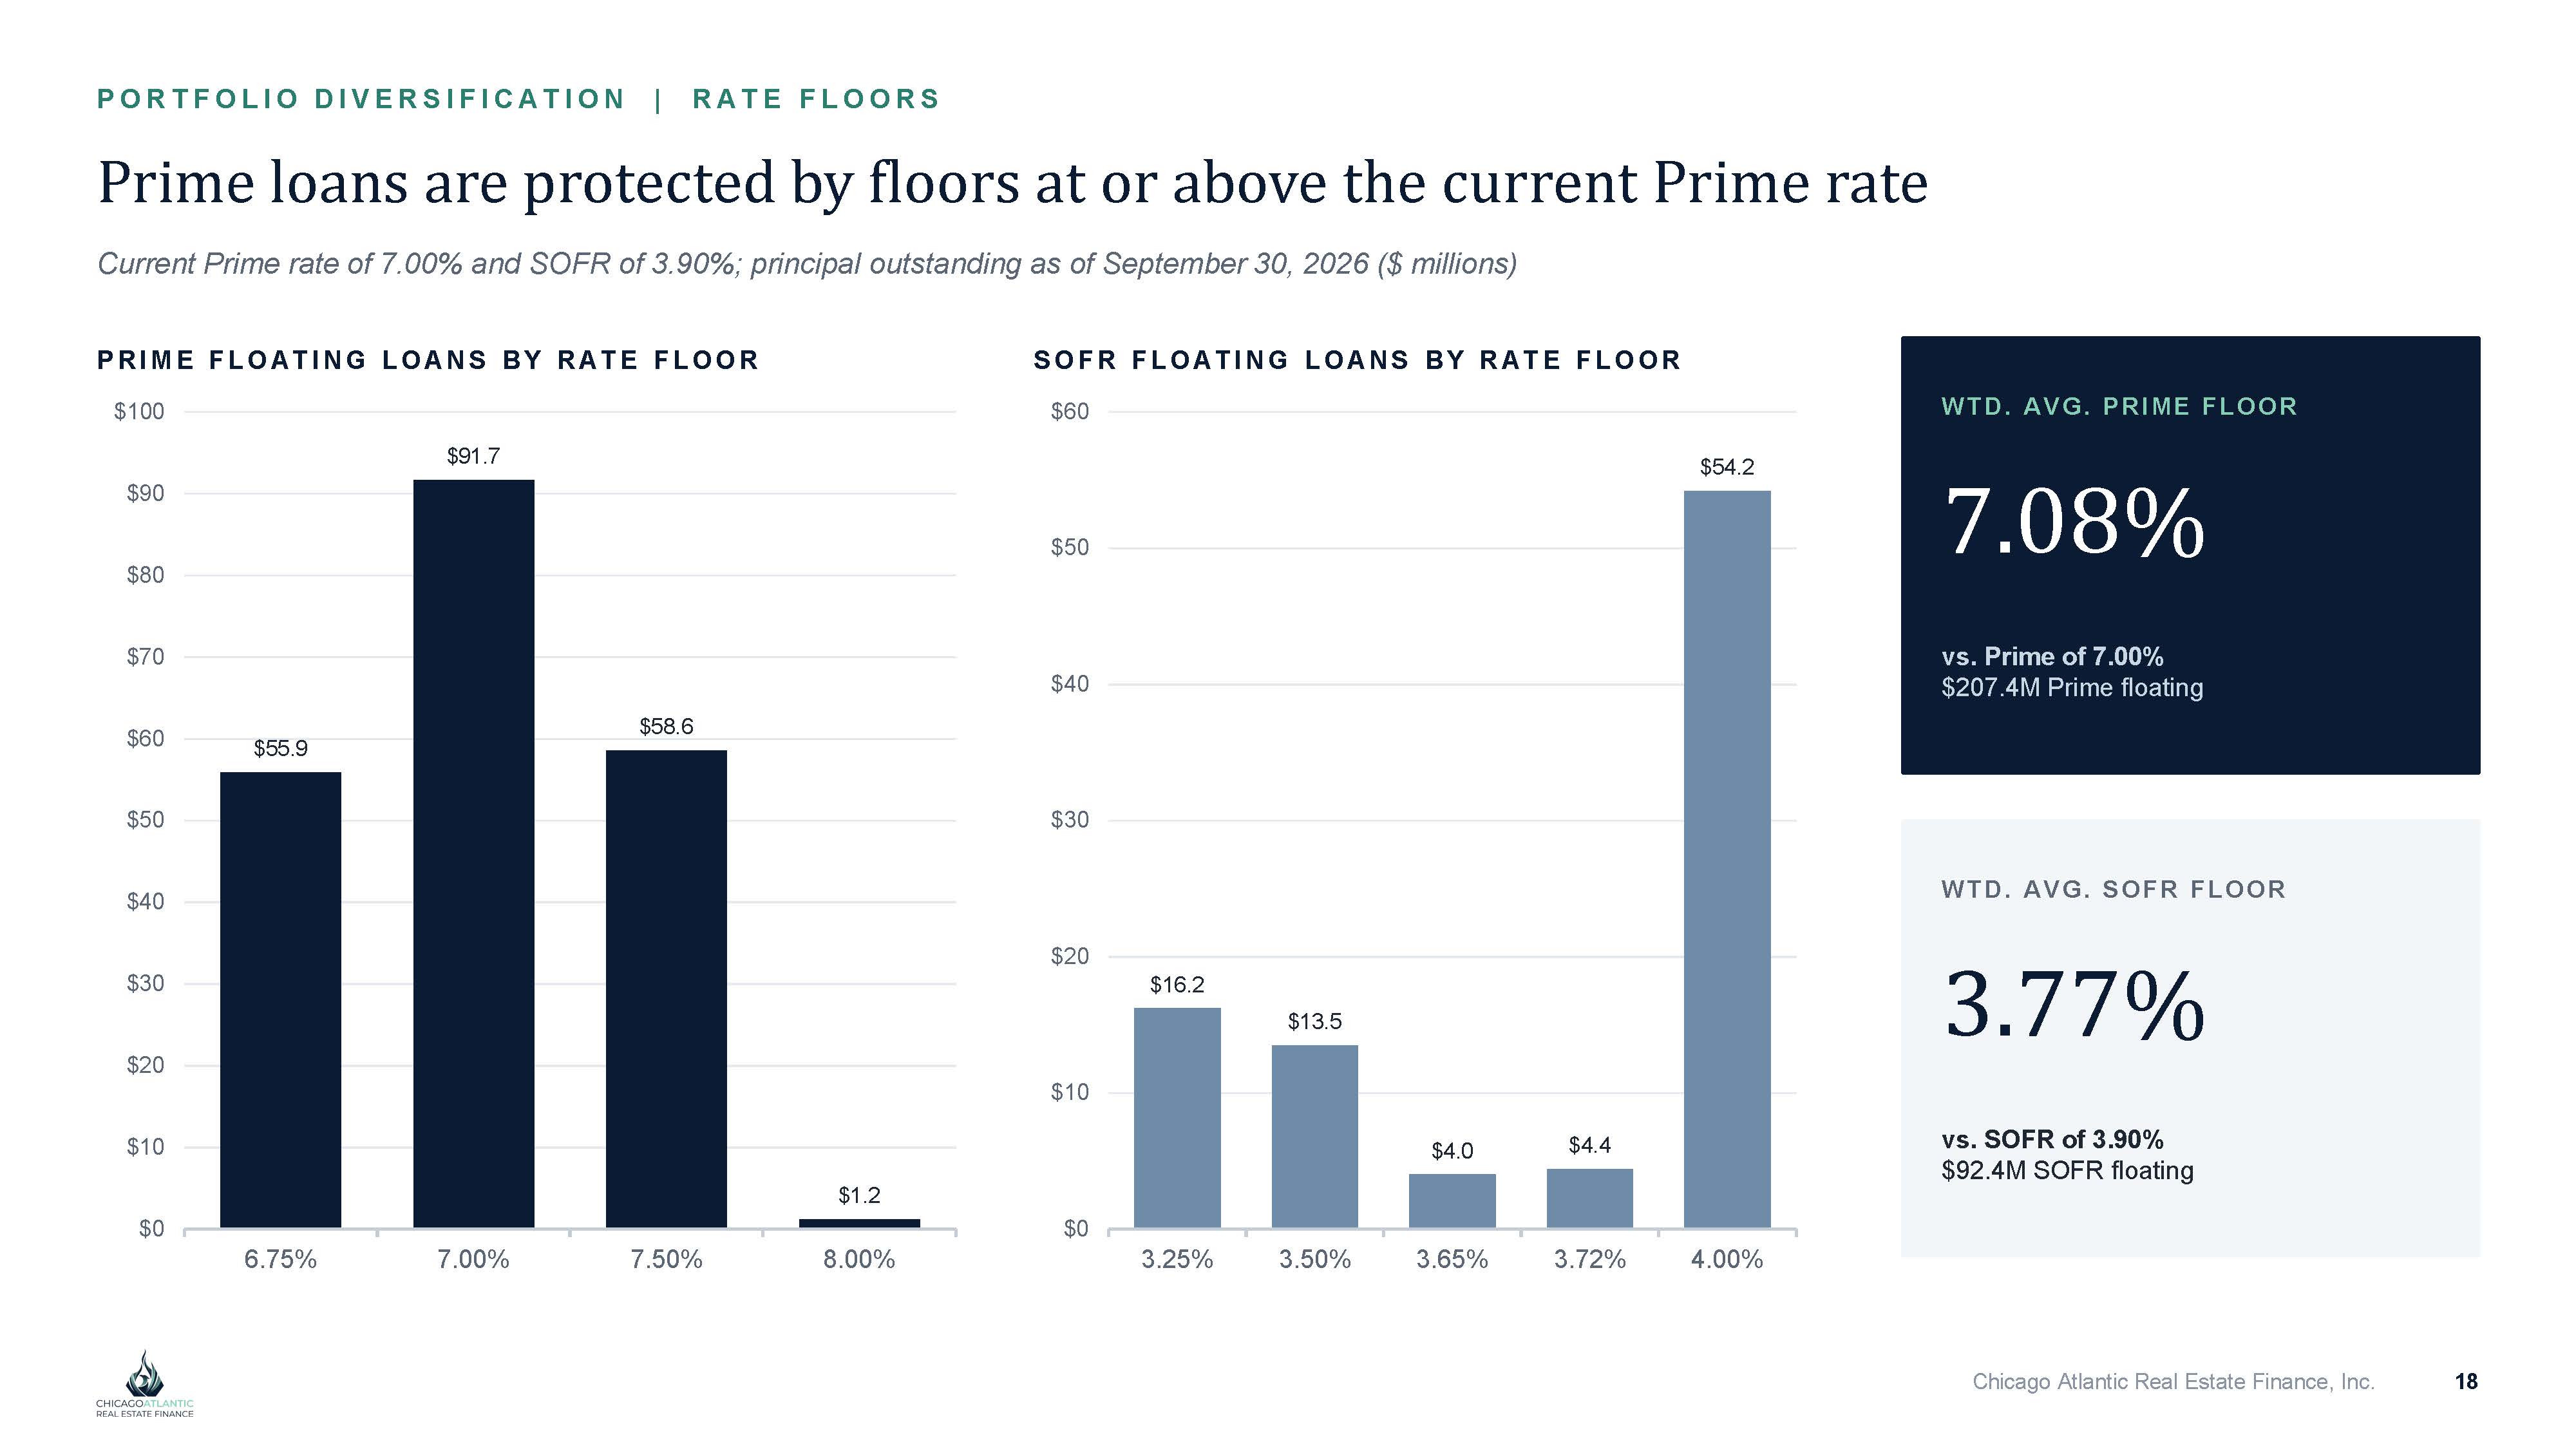
P O RT F O L I O DI V E RS I F I CA T I O N | RA T E F L O O RS Prime loans are protected by floors at or above the current Prime rate Current Prime rate of 7.00% and SOFR of 3.90%; principal outstanding as of September 30, 2026 ($ millions) $55.9 $91.7 $58.6 $1.2 $0 $10 $20 $30 $40 $50 $60 $70 $80 $90 6.75% 7.00% 7.50% 8.00% $16.2 $13.5 $4.0 $4.4 $54.2 $0 $10 $20 $30 $40 $50 3.25% 3.50% 3.65% 3.72% 4.00% F L OOR R A T E B Y L OA N S F L OA T I N G S OF R F L OOR R A T E L OA N S B Y F L OA T I N G P R I M E WTD. AVG. PRIME FLOOR $60 $100 7.08% vs. Prime of 7.00% $207.4M Prime floating Chicago Atlantic Real Estate Finance, Inc. 18 WTD. AVG. SOFR FLOOR 3.77% vs. SOFR of 3.90% $92.4M SOFR floating
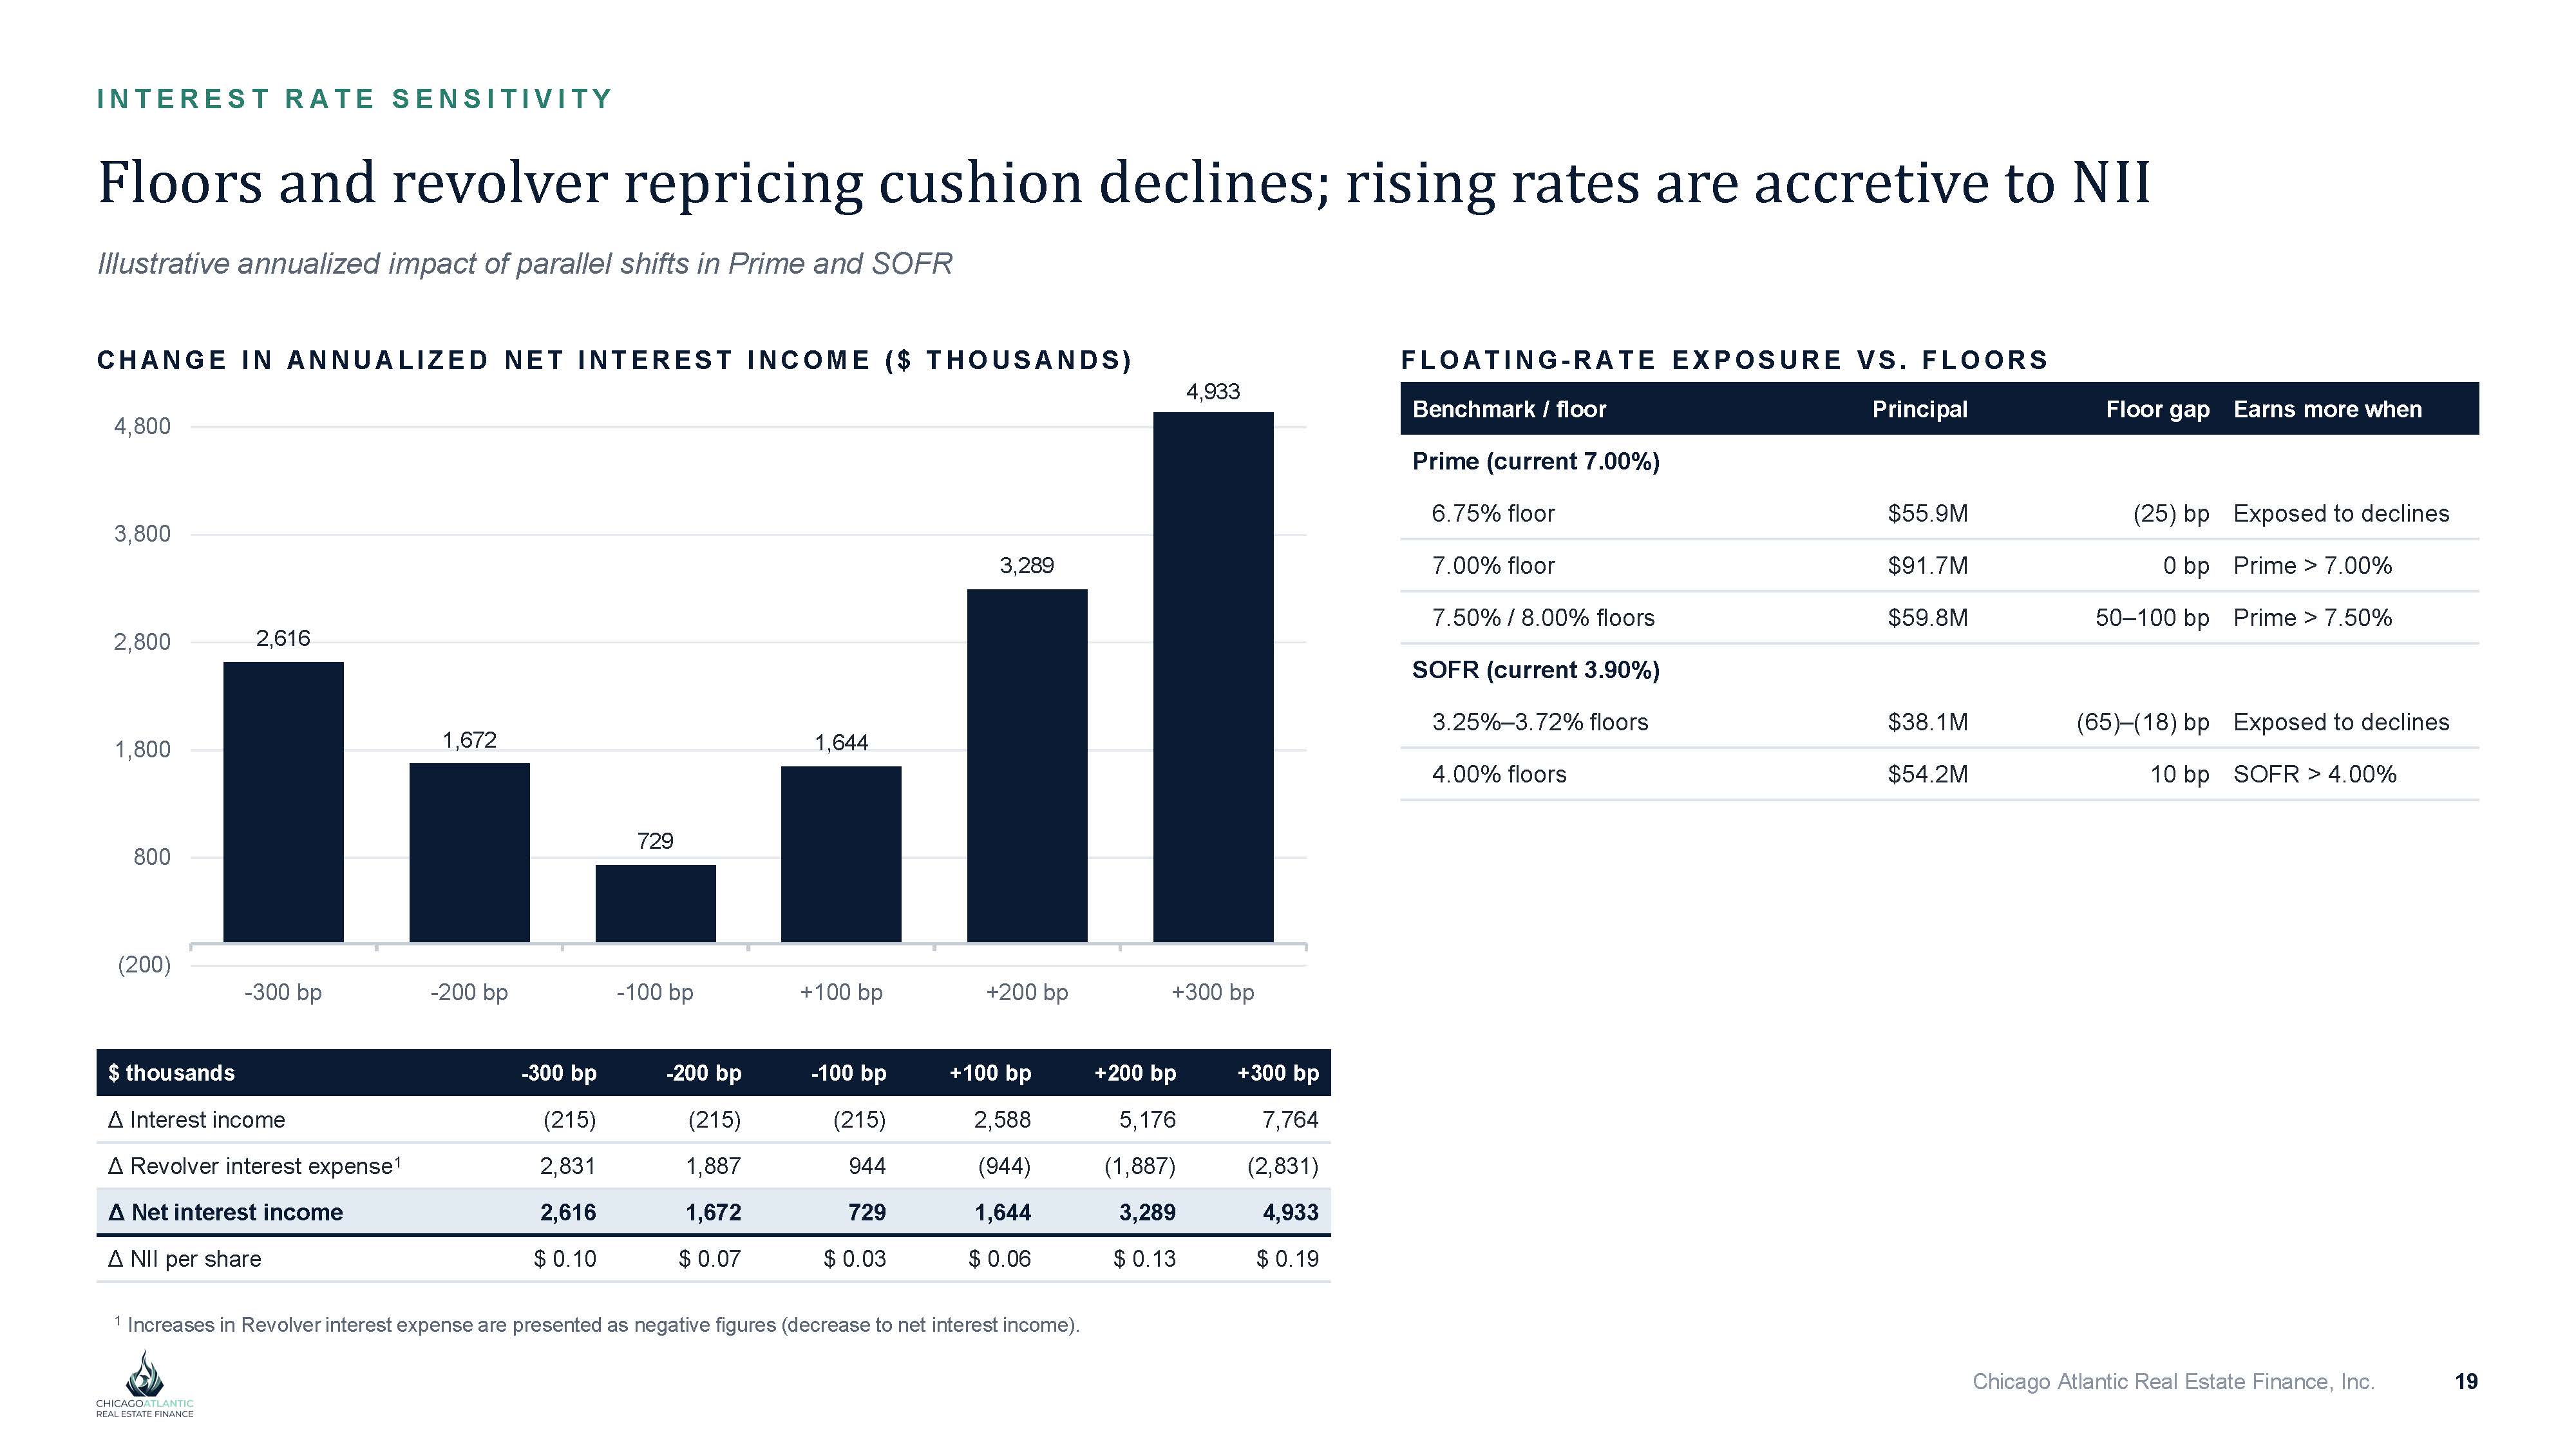
I N T E R E S T R A T E S E N S I T I V I T Y Floors and revolver repricing cushion declines; rising rates are accretive to NII Illustrative annualized impact of parallel shifts in Prime and SOFR CHA N G E I N A NNU AL I Z E D NE T I NT E RE S T I NCO M E ( $ T HO US A N D S ) 2,616 Chicago Atlantic Real Estate Finance, Inc. 19 1,672 729 1,644 3,289 4,933 (200) 800 1,800 2,800 3,800 4,800 - 300 bp - 200 bp - 100 bp +100 bp +200 bp +300 bp +300 bp +200 bp +100 bp - 100 bp - 200 bp - 300 bp $ thousands 7,764 5,176 2,588 (215) (215) (215) Δ Interest income (2,831) (1,887) (944) 944 1,887 2,831 Δ Revolver interest expense 1 4,933 3,289 1,644 729 1,672 2,616 Δ Net interest income $ 0.19 $ 0.13 $ 0.06 $ 0.03 $ 0.07 $ 0.10 Δ NII per share F L O A T I N G - R A T E EXPO SU R E VS. F L O O R S Earns more when Floor gap Principal Benchmark / floor Prime (current 7.00%) Exposed to declines (25) bp $55.9M 6.75% floor Prime > 7.00% 0 bp $91.7M 7.00% floor Prime > 7.50% 50 – 100 bp $59.8M 7.50% / 8.00% floors SOFR (current 3.90%) Exposed to declines (65) – (18) bp $38.1M 3.25% – 3.72% floors SOFR > 4.00% 10 bp $54.2M 4.00% floors 1 Increases in Revolver interest expense are presented as negative figures (decrease to net interest income).

Koach Transaction
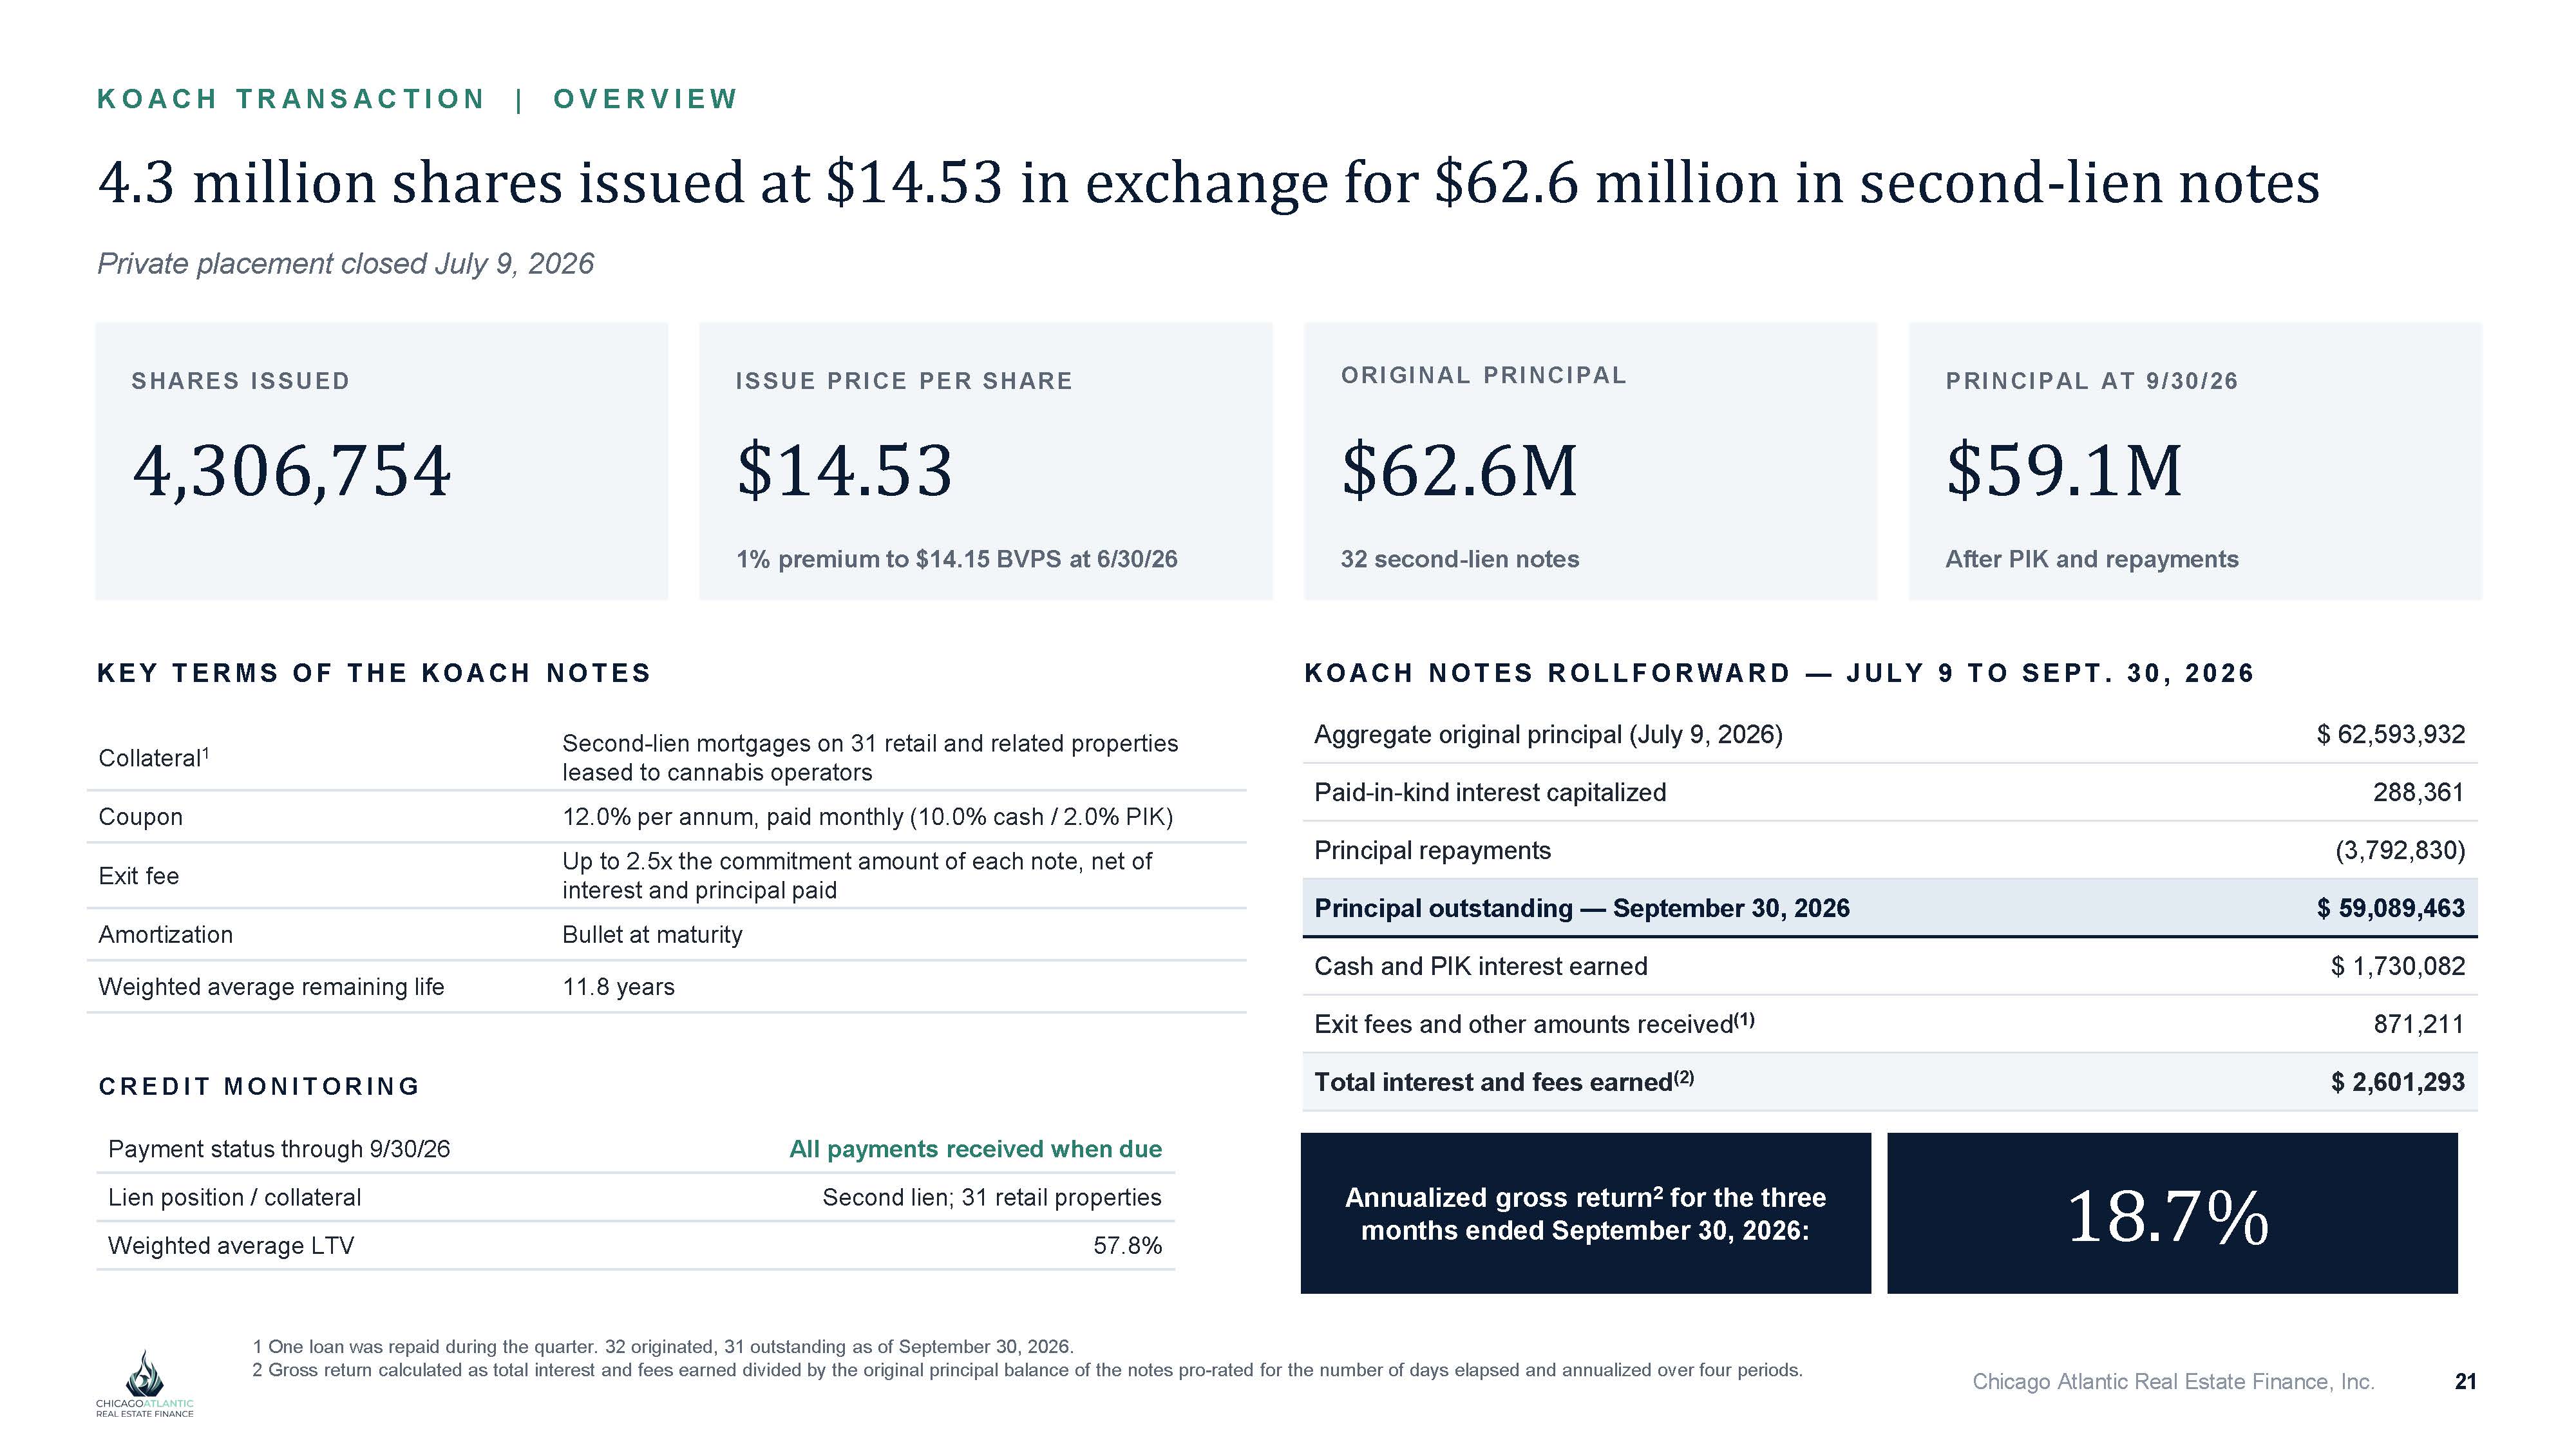
Chicago Atlantic Real Estate Finance, Inc. KO A CH T RA NS A CT I O N | O V E RV I E W 4.3 million shares issued at $14.53 in exchange for $62.6 million in second - lien notes Private placement closed July 9, 2026 SHARES ISSUED 4,306,754 ISSUE PRICE PER SHARE $14.53 1% premium to $14.15 BVPS at 6/30/26 ORIGINAL PRINCIPAL $62.6M 32 second - lien notes PRINCIPAL AT 9/ 30/ 26 $59.1M After PIK and repayments KE Y T E RM S O F T HE KO A CH NO T E S Second - lien mortgages on 31 retail and related properties leased to cannabis operators Collateral 1 12.0% per annum, paid monthly (10.0% cash / 2.0% PIK) Coupon Up to 2.5x the commitment amount of each note, net of interest and principal paid Exit fee Bullet at maturity Amortization 11.8 years Weighted average remaining life KO A C H NO T E S RO L L F O R W AR D — JU L Y 9 T O S E P T . 30, 2026 $ 62,593,932 Aggregate original principal (July 9, 2026) 288,361 Paid - in - kind interest capitalized (3,792,830) Principal repayments $ 59,089,463 Principal outstanding — September 30, 2026 $ 1,730,082 Cash and PIK interest earned 871,211 Exit fees and other amounts received (1) $ 2,601,293 Total interest and fees earned (2) 21 CRE DI T M O NI T O RI NG All payments received when due Payment status through 9/30/26 Second lien; 31 retail properties Lien position / collateral 57.8% Weighted average LTV Annualized gross return 2 for the three months ended September 30, 2026: 18.7% 1 One loan was repaid during the quarter. 32 originated, 31 outstanding as of September 30, 2026. 2 Gross return calculated as total interest and fees earned divided by the original principal balance of the notes pro - rated for the number of days elapsed and annualized over four periods.
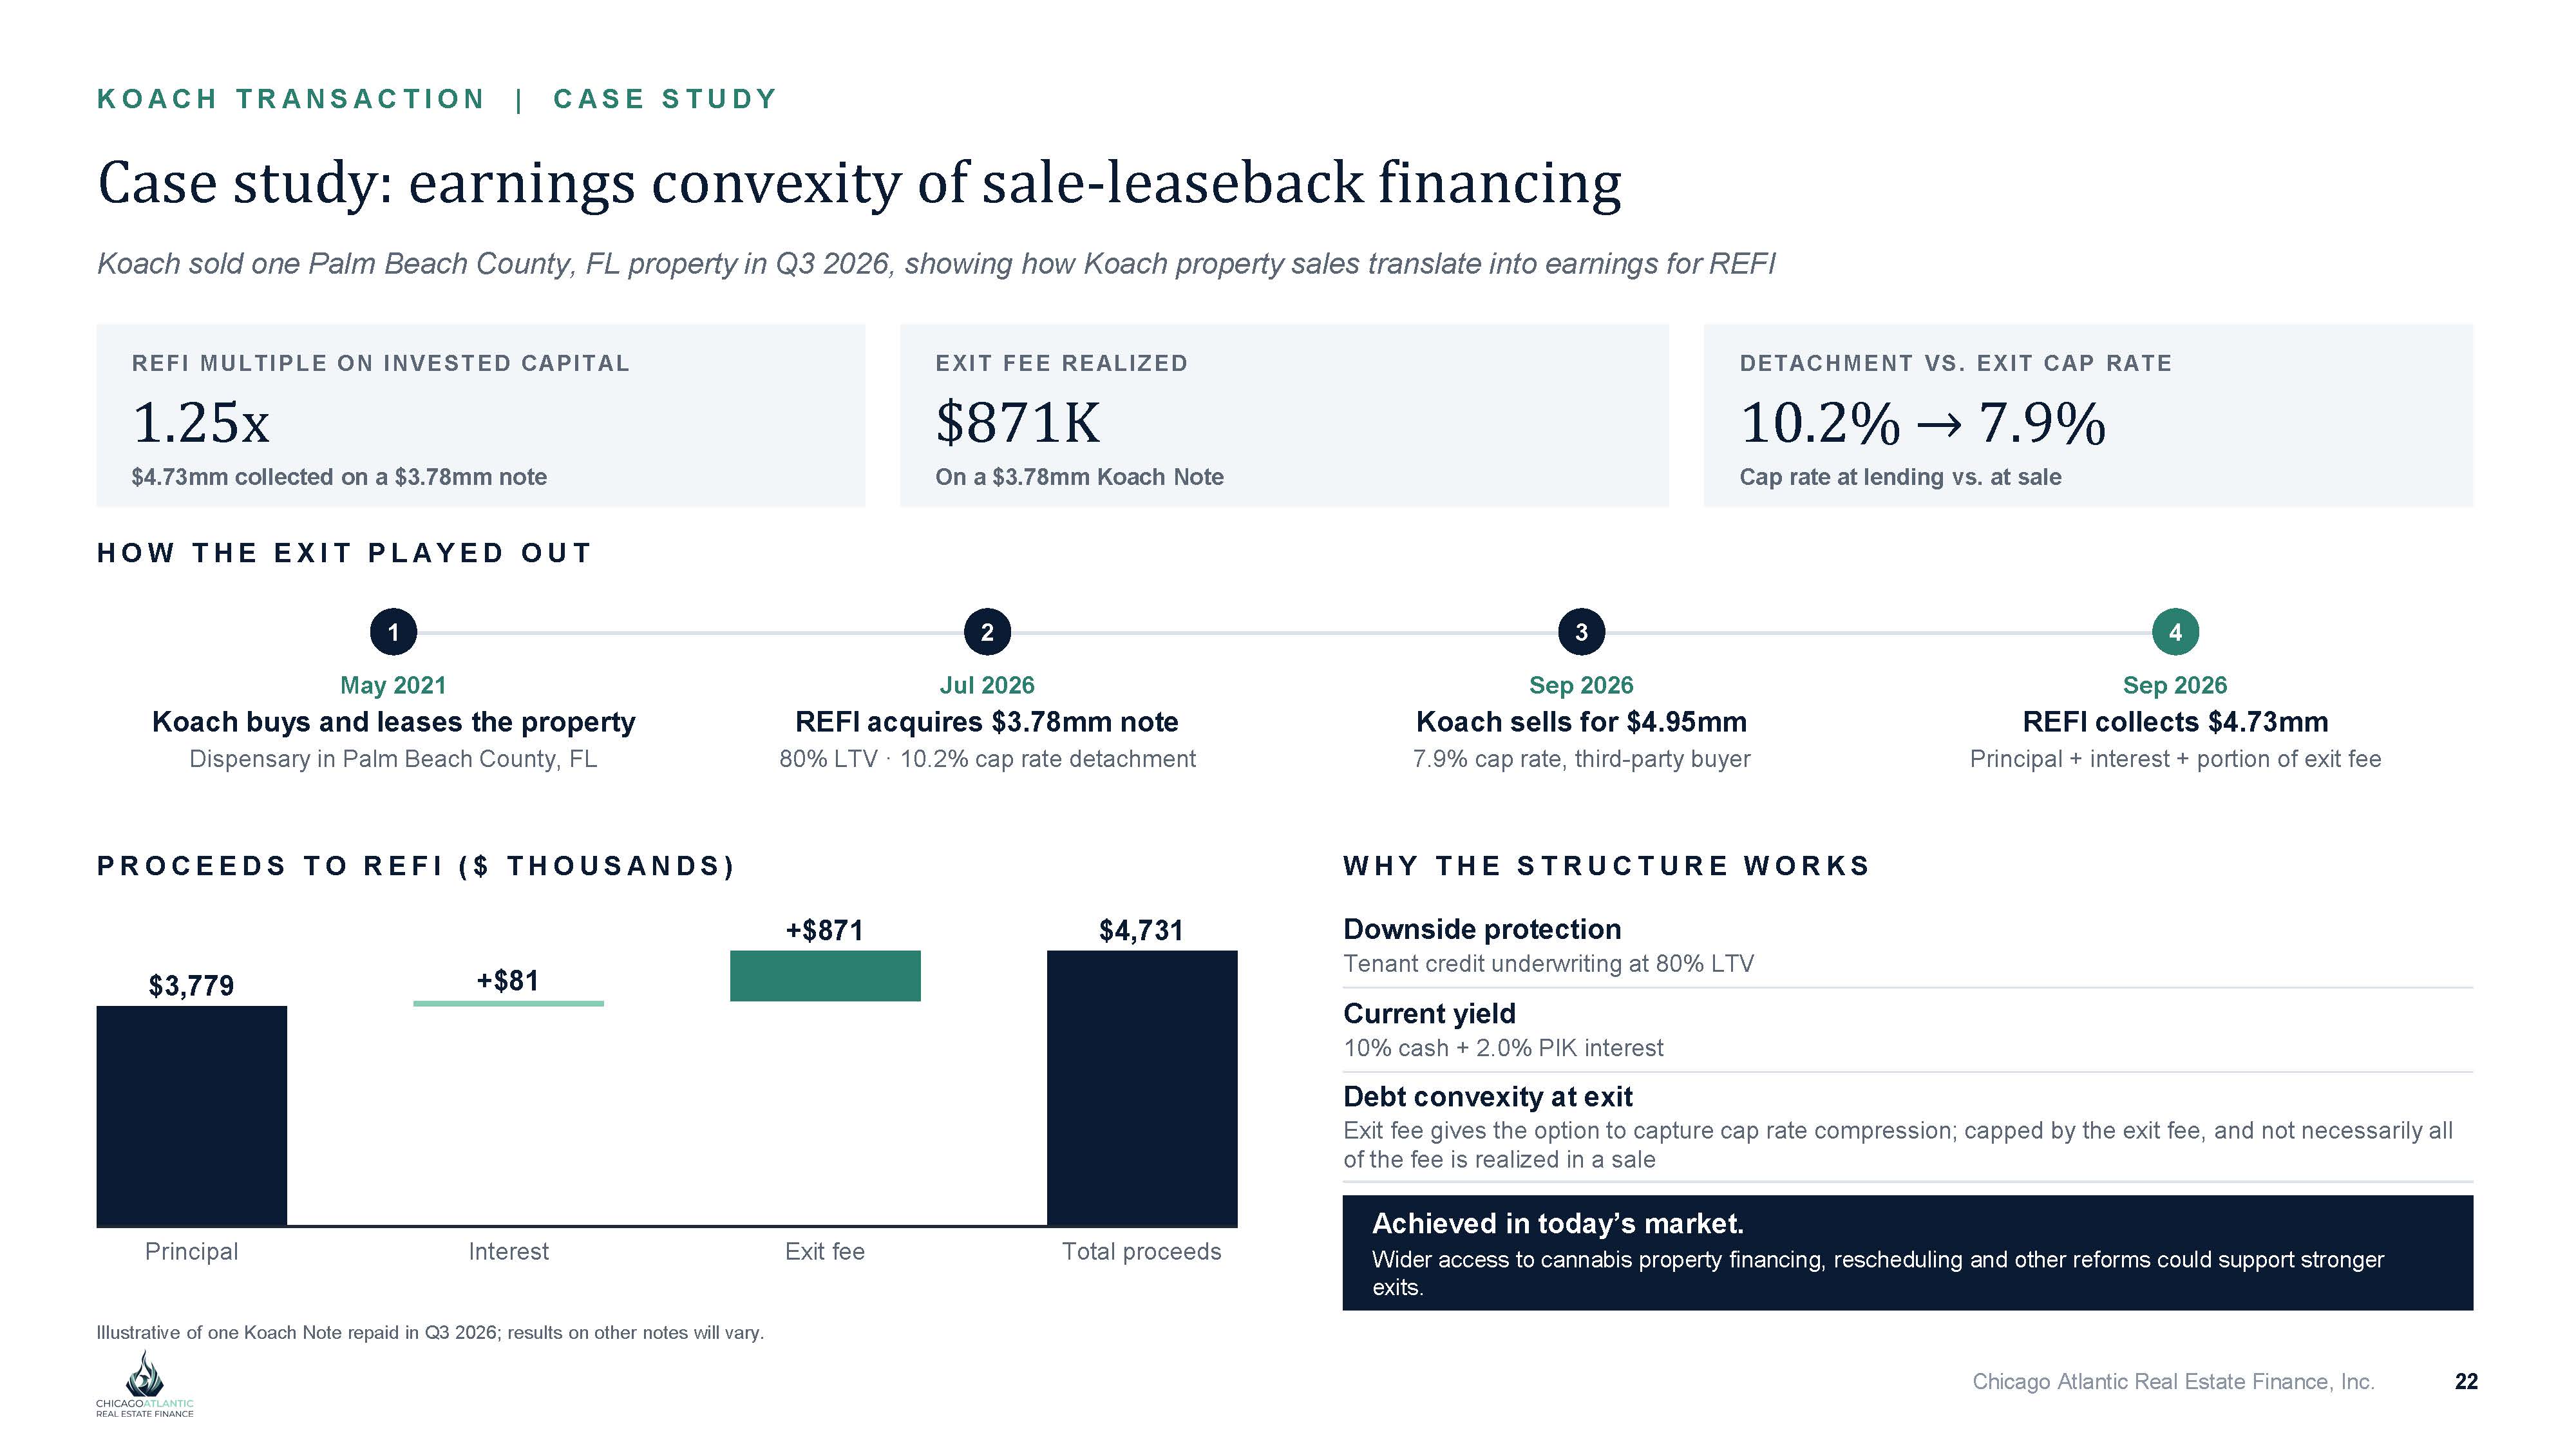
KO A CH T RA NS A CT I O N | CA S E S T UDY Case study: earnings convexity of sale - leaseback financing Koach sold one Palm Beach County, FL property in Q3 2026, showing how Koach property sales translate into earnings for REFI REFI M ULTI PLE ON I NVESTED CAPI TAL 1.25x $4.73mm collected on a $3.78mm note EXI T FEE REALI ZED $871K On a $3.78mm Koach Note DETACHM ENT VS. EXI T CAP RATE 10.2% → 7.9% Cap rate at lending vs. at sale H O W T H E E X I T P L A Y E D O U T 1 May 2021 Koach buys and leases the property Dispensary in Palm Beach County, FL 2 Jul 2026 REFI acquires $3.78mm note 80% LTV · 10.2% cap rate detachment 3 Sep 2026 Koach sells for $4.95mm 7.9% cap rate, third - party buyer 4 Sep 2026 REFI collects $4.73mm Principal + interest + portion of exit fee P RO CE E DS T O RE F I ( $ T HO US A NDS ) $3,779 Principal +$81 Interest +$871 Exit fee $4,731 Total proceeds W HY T HE S T RUCT URE W O RKS Downside protection Tenant credit underwriting at 80% LTV Current yield 10% cash + 2.0% PIK interest Debt convexity at exit Exit fee gives the option to capture cap rate compression; capped by the exit fee, and not necessarily all of the fee is realized in a sale Achieved in today’s market. Wider access to cannabis property financing, rescheduling and other reforms could support stronger exits. Chicago Atlantic Real Estate Finance, Inc. 22 Illustrative of one Koach Note repaid in Q3 2026; results on other notes will vary.
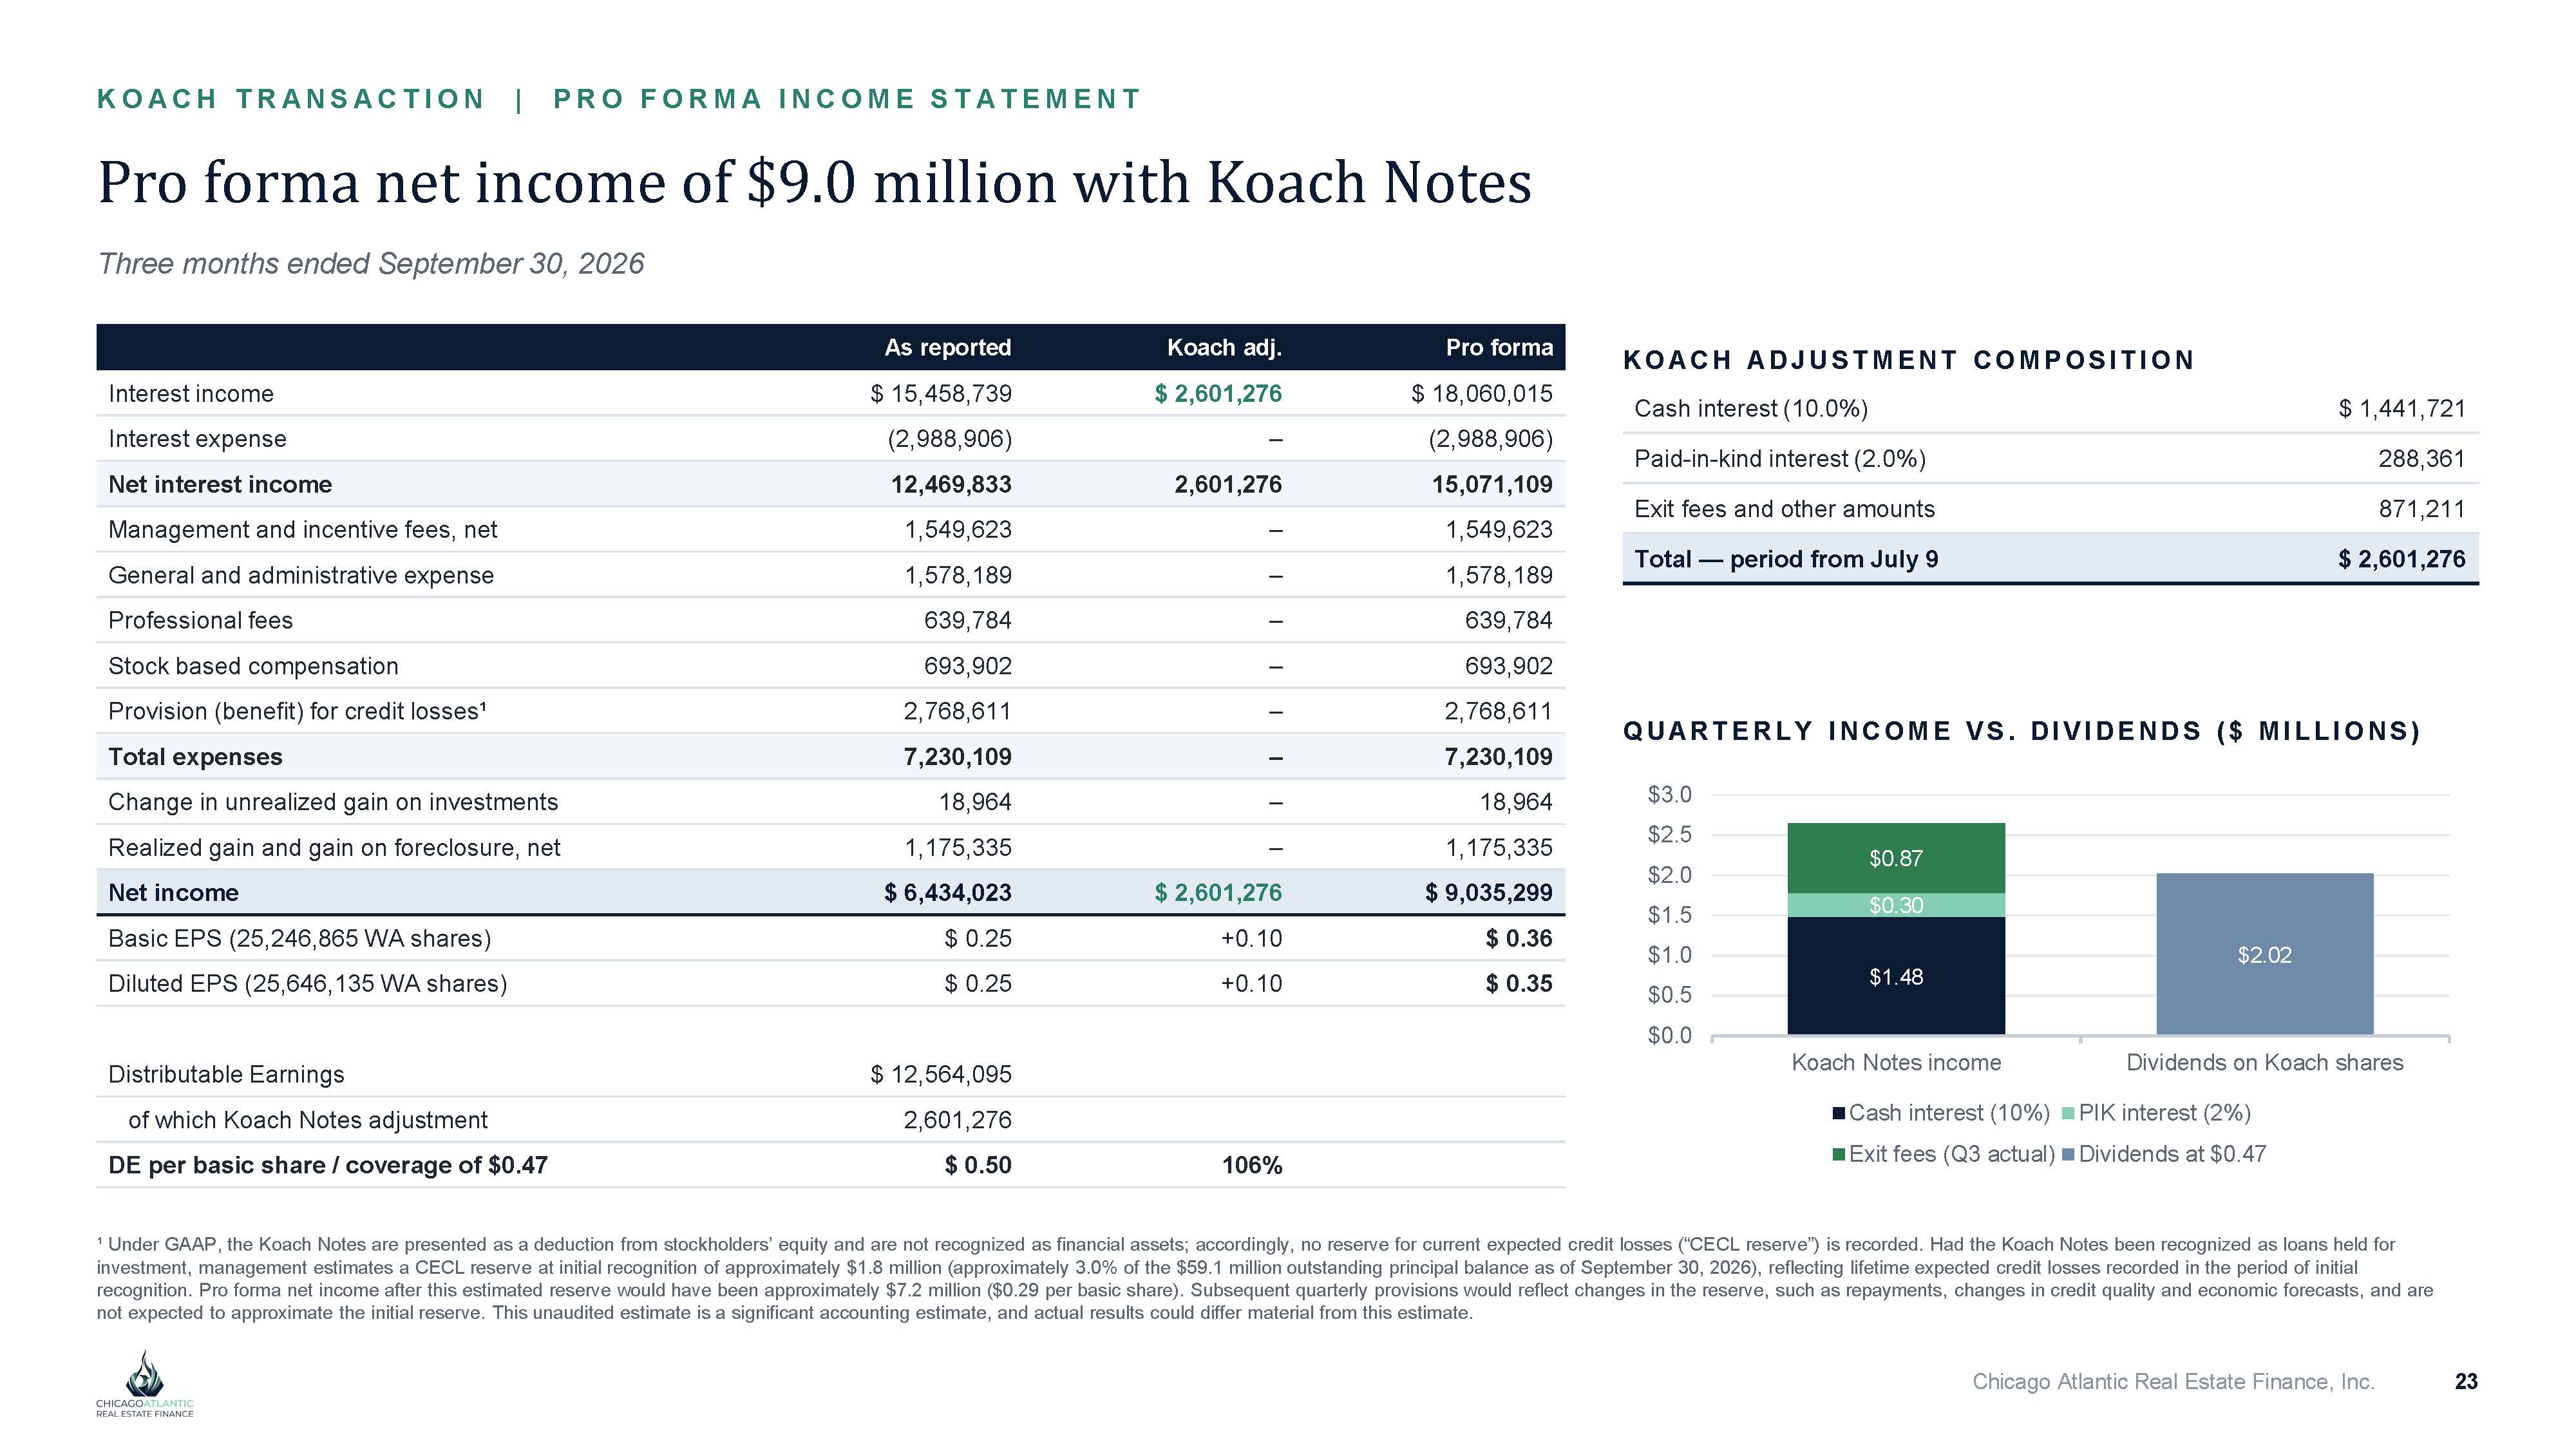
KO A CH T RA NS A CT I O N | P RO F O RM A I NCO M E S T A T E M E NT Pro forma net income of $9.0 million with Koach Notes Three months ended September 30, 2026 Pro forma Koach adj. As reported $ 18,060,015 $ 2,601,276 $ 15,458,739 Interest income (2,988,906) – (2,988,906) Interest expense 15,071,109 2,601,276 12,469,833 Net interest income 1,549,623 – 1,549,623 Management and incentive fees, net 1,578,189 – 1,578,189 General and administrative expense 639,784 – 639,784 Professional fees 693,902 – 693,902 Stock based compensation 2,768,611 – 2,768,611 Provision (benefit) for credit losses¹ 7,230,109 – 7,230,109 Total expenses 18,964 – 18,964 Change in unrealized gain on investments 1,175,335 – 1,175,335 Realized gain and gain on foreclosure, net $ 9,035,299 $ 2,601,276 $ 6,434,023 Net income $ 0.36 +0.10 $ 0.25 Basic EPS (25,246,865 WA shares) $ 0.35 +0.10 $ 0.25 Diluted EPS (25,646,135 WA shares) $ 12,564,095 Distributable Earnings 2,601,276 of which Koach Notes adjustment 106% $ 0.50 DE per basic share / coverage of $0.47 KO A C H A DJ U S T M E NT CO M P O S I T I O N $ 1,441,721 Cash interest (10.0%) 288,361 Paid - in - kind interest (2.0%) 871,211 Exit fees and other amounts $ 2,601,276 Total — period from July 9 ¹ Under GAAP, the Koach Notes are presented as a deduction from stockholders’ equity and are not recognized as financial assets; accordingly, no reserve for current expected credit losses (“CECL reserve”) is recorded. Had the Koach Notes been recognized as loans held for investment, management estimates a CECL reserve at initial recognition of approximately $1.8 million (approximately 3.0% of the $59.1 million outstanding principal balance as of September 30, 2026), reflecting lifetime expected credit losses recorded in the period of initial recognition. Pro forma net income after this estimated reserve would have been approximately $7.2 million ($0.29 per basic share). Subsequent quarterly provisions would reflect changes in the reserve, such as repayments, changes in credit quality and economic forecasts, and are not expected to approximate the initial reserve. This unaudited estimate is a significant accounting estimate, and actual results could differ material from this estimate. $0.87 $2.02 $0.30 $1.48 Koach Notes income Dividends on Koach shares Q UA RT E R L Y I NCO M E V S . DI V I DE NDS ( $ M I L L I O NS ) $3.0 $2.5 $2.0 $1.5 $1.0 $0.5 $0.0 Cash interest (10%) Exit fees (Q3 actual) PIK interest (2%) Dividends at $0.47 Chicago Atlantic Real Estate Finance, Inc. 23

Industry and Regulatory Update
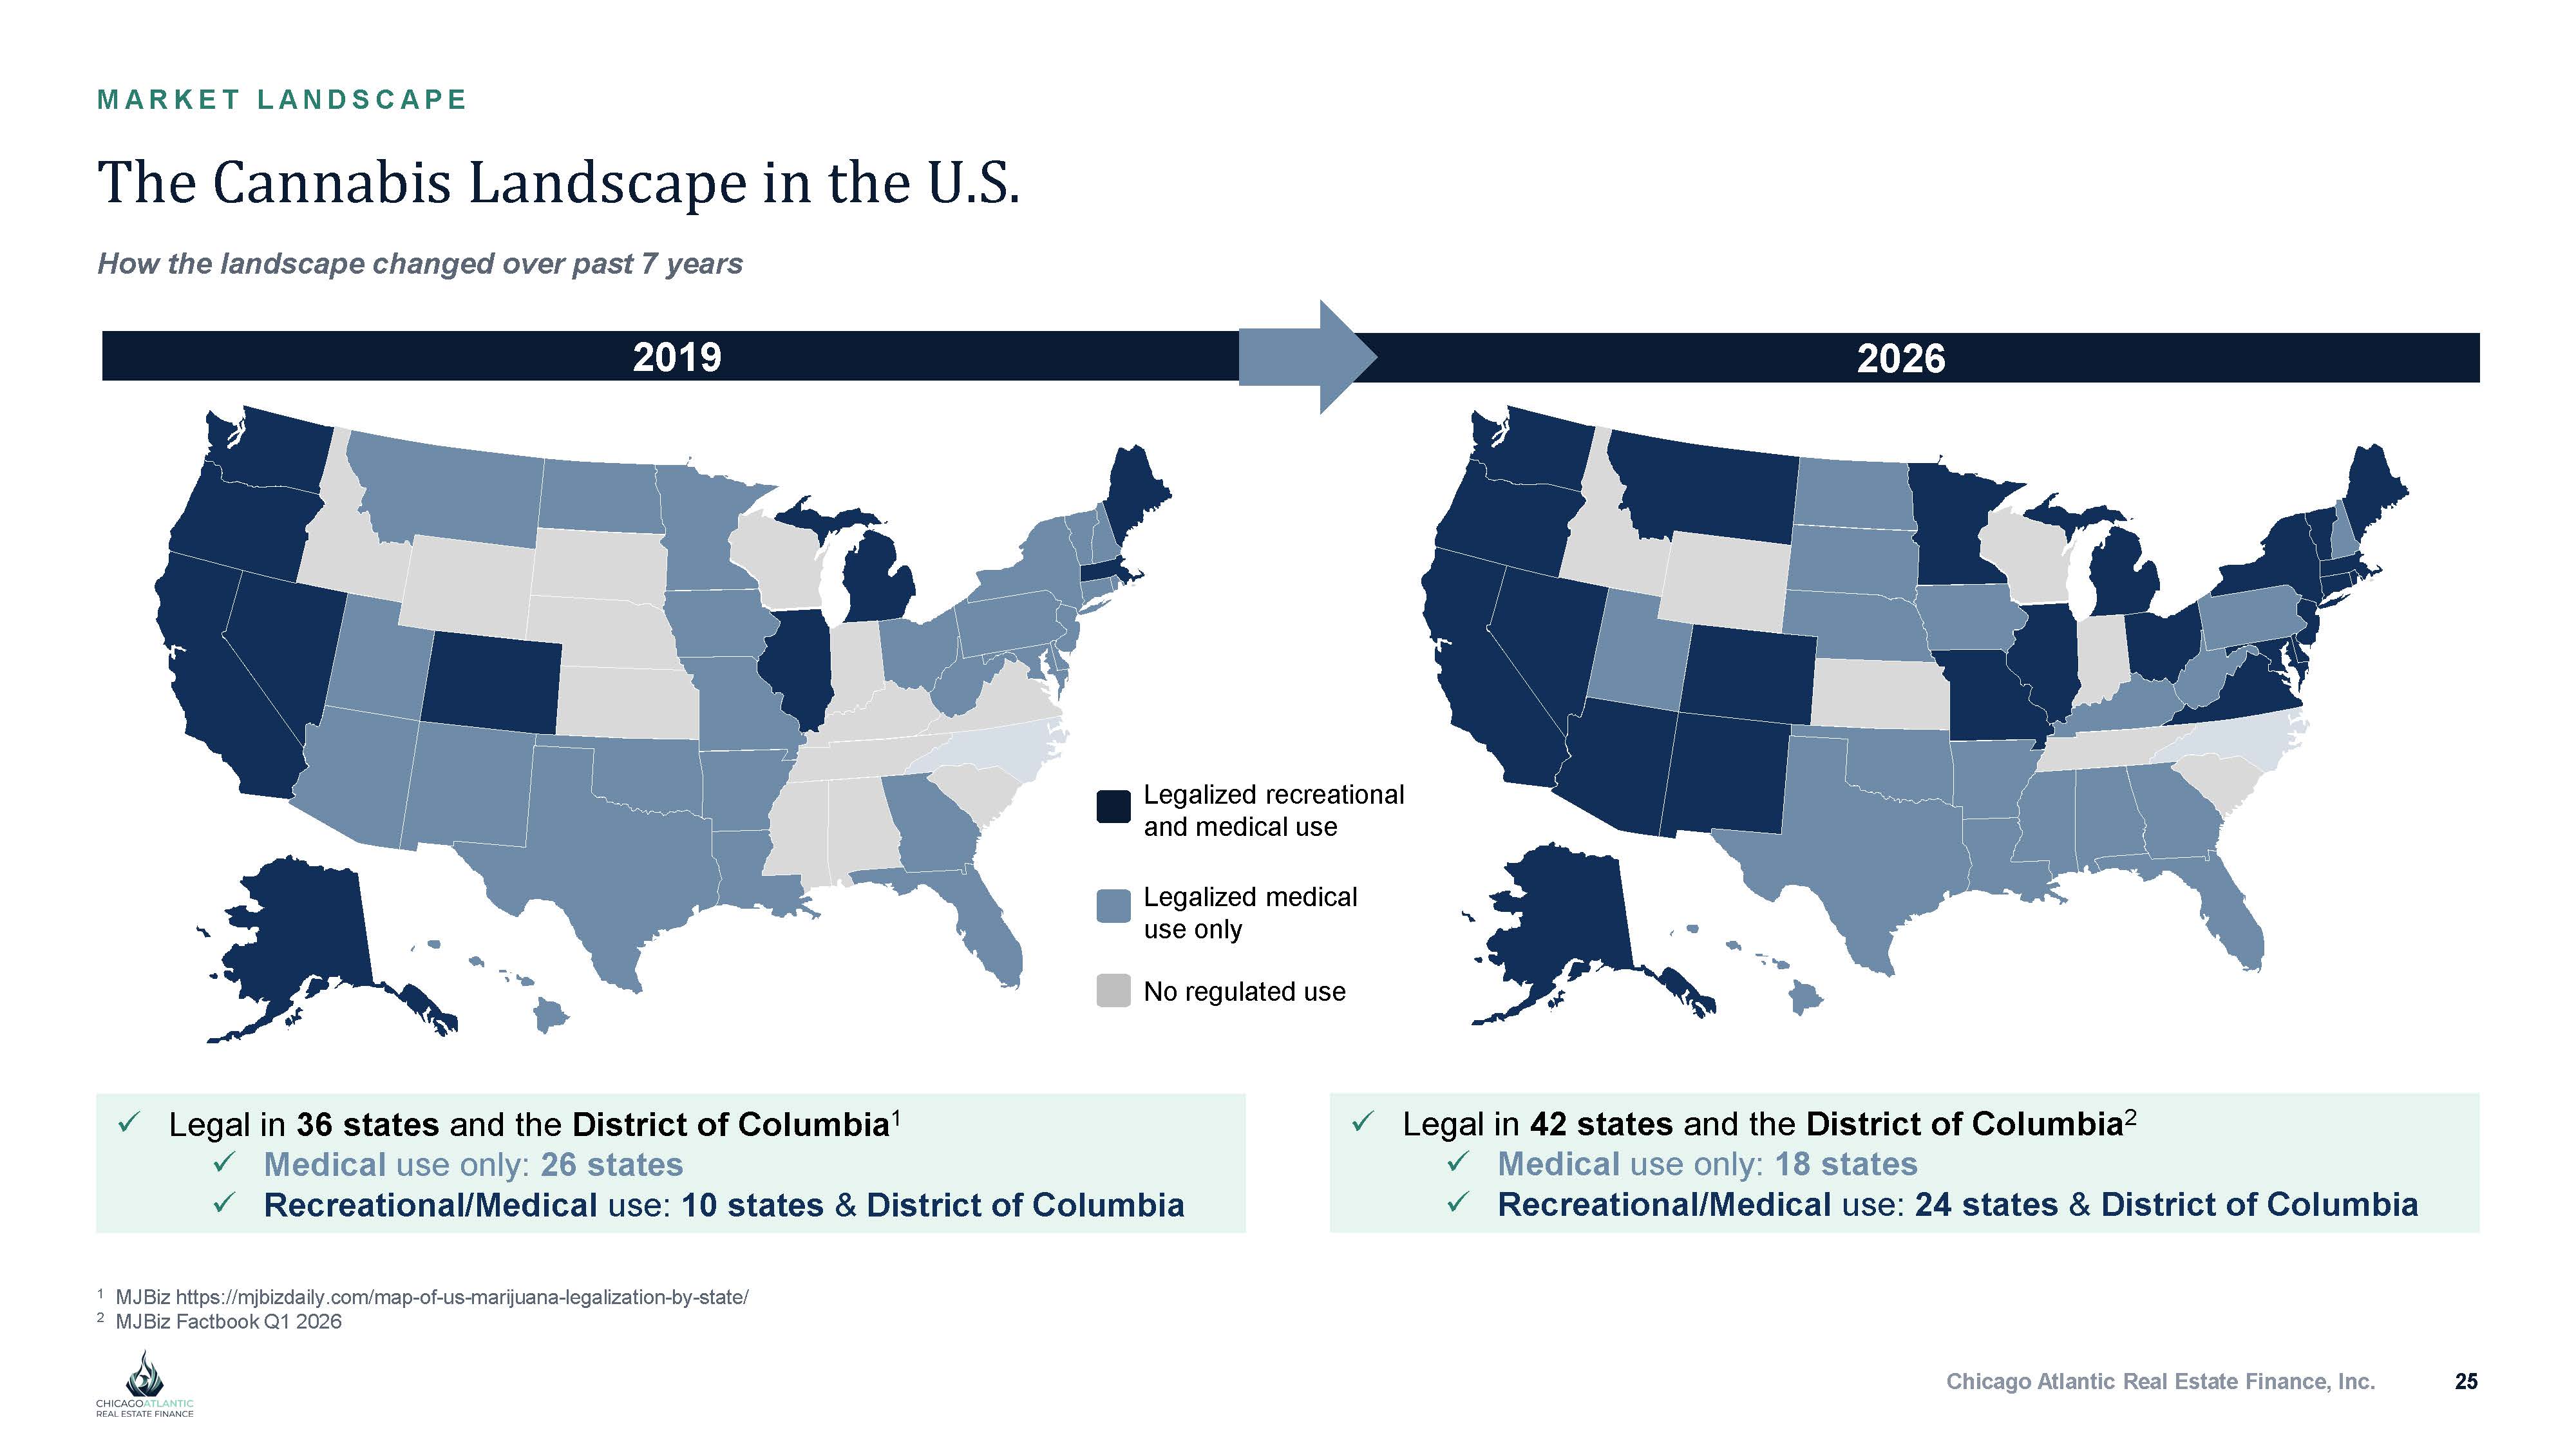
The Cannabis Landscape in the U.S. 2019 2026 1 MJBiz https://mjbizdaily.com/map - of - us - marijuana - legalization - by - state/ 2 MJBiz Factbook Q1 2026 x Legal in 42 states and the District of Columbia 2 x Medical use only: 18 states x Recreational/Medical use: 24 states & District of Columbia x Legal in 36 states and the District of Columbia 1 x Medical use only: 26 states x Recreational/Medical use: 10 states & District of Columbia Legalized recreational and medical use Legalized medical use only No regulated use Chicago Atlantic Real Estate Finance, Inc. 25 M A RKE T L A NDS C A P E How the landscape changed over past 7 years
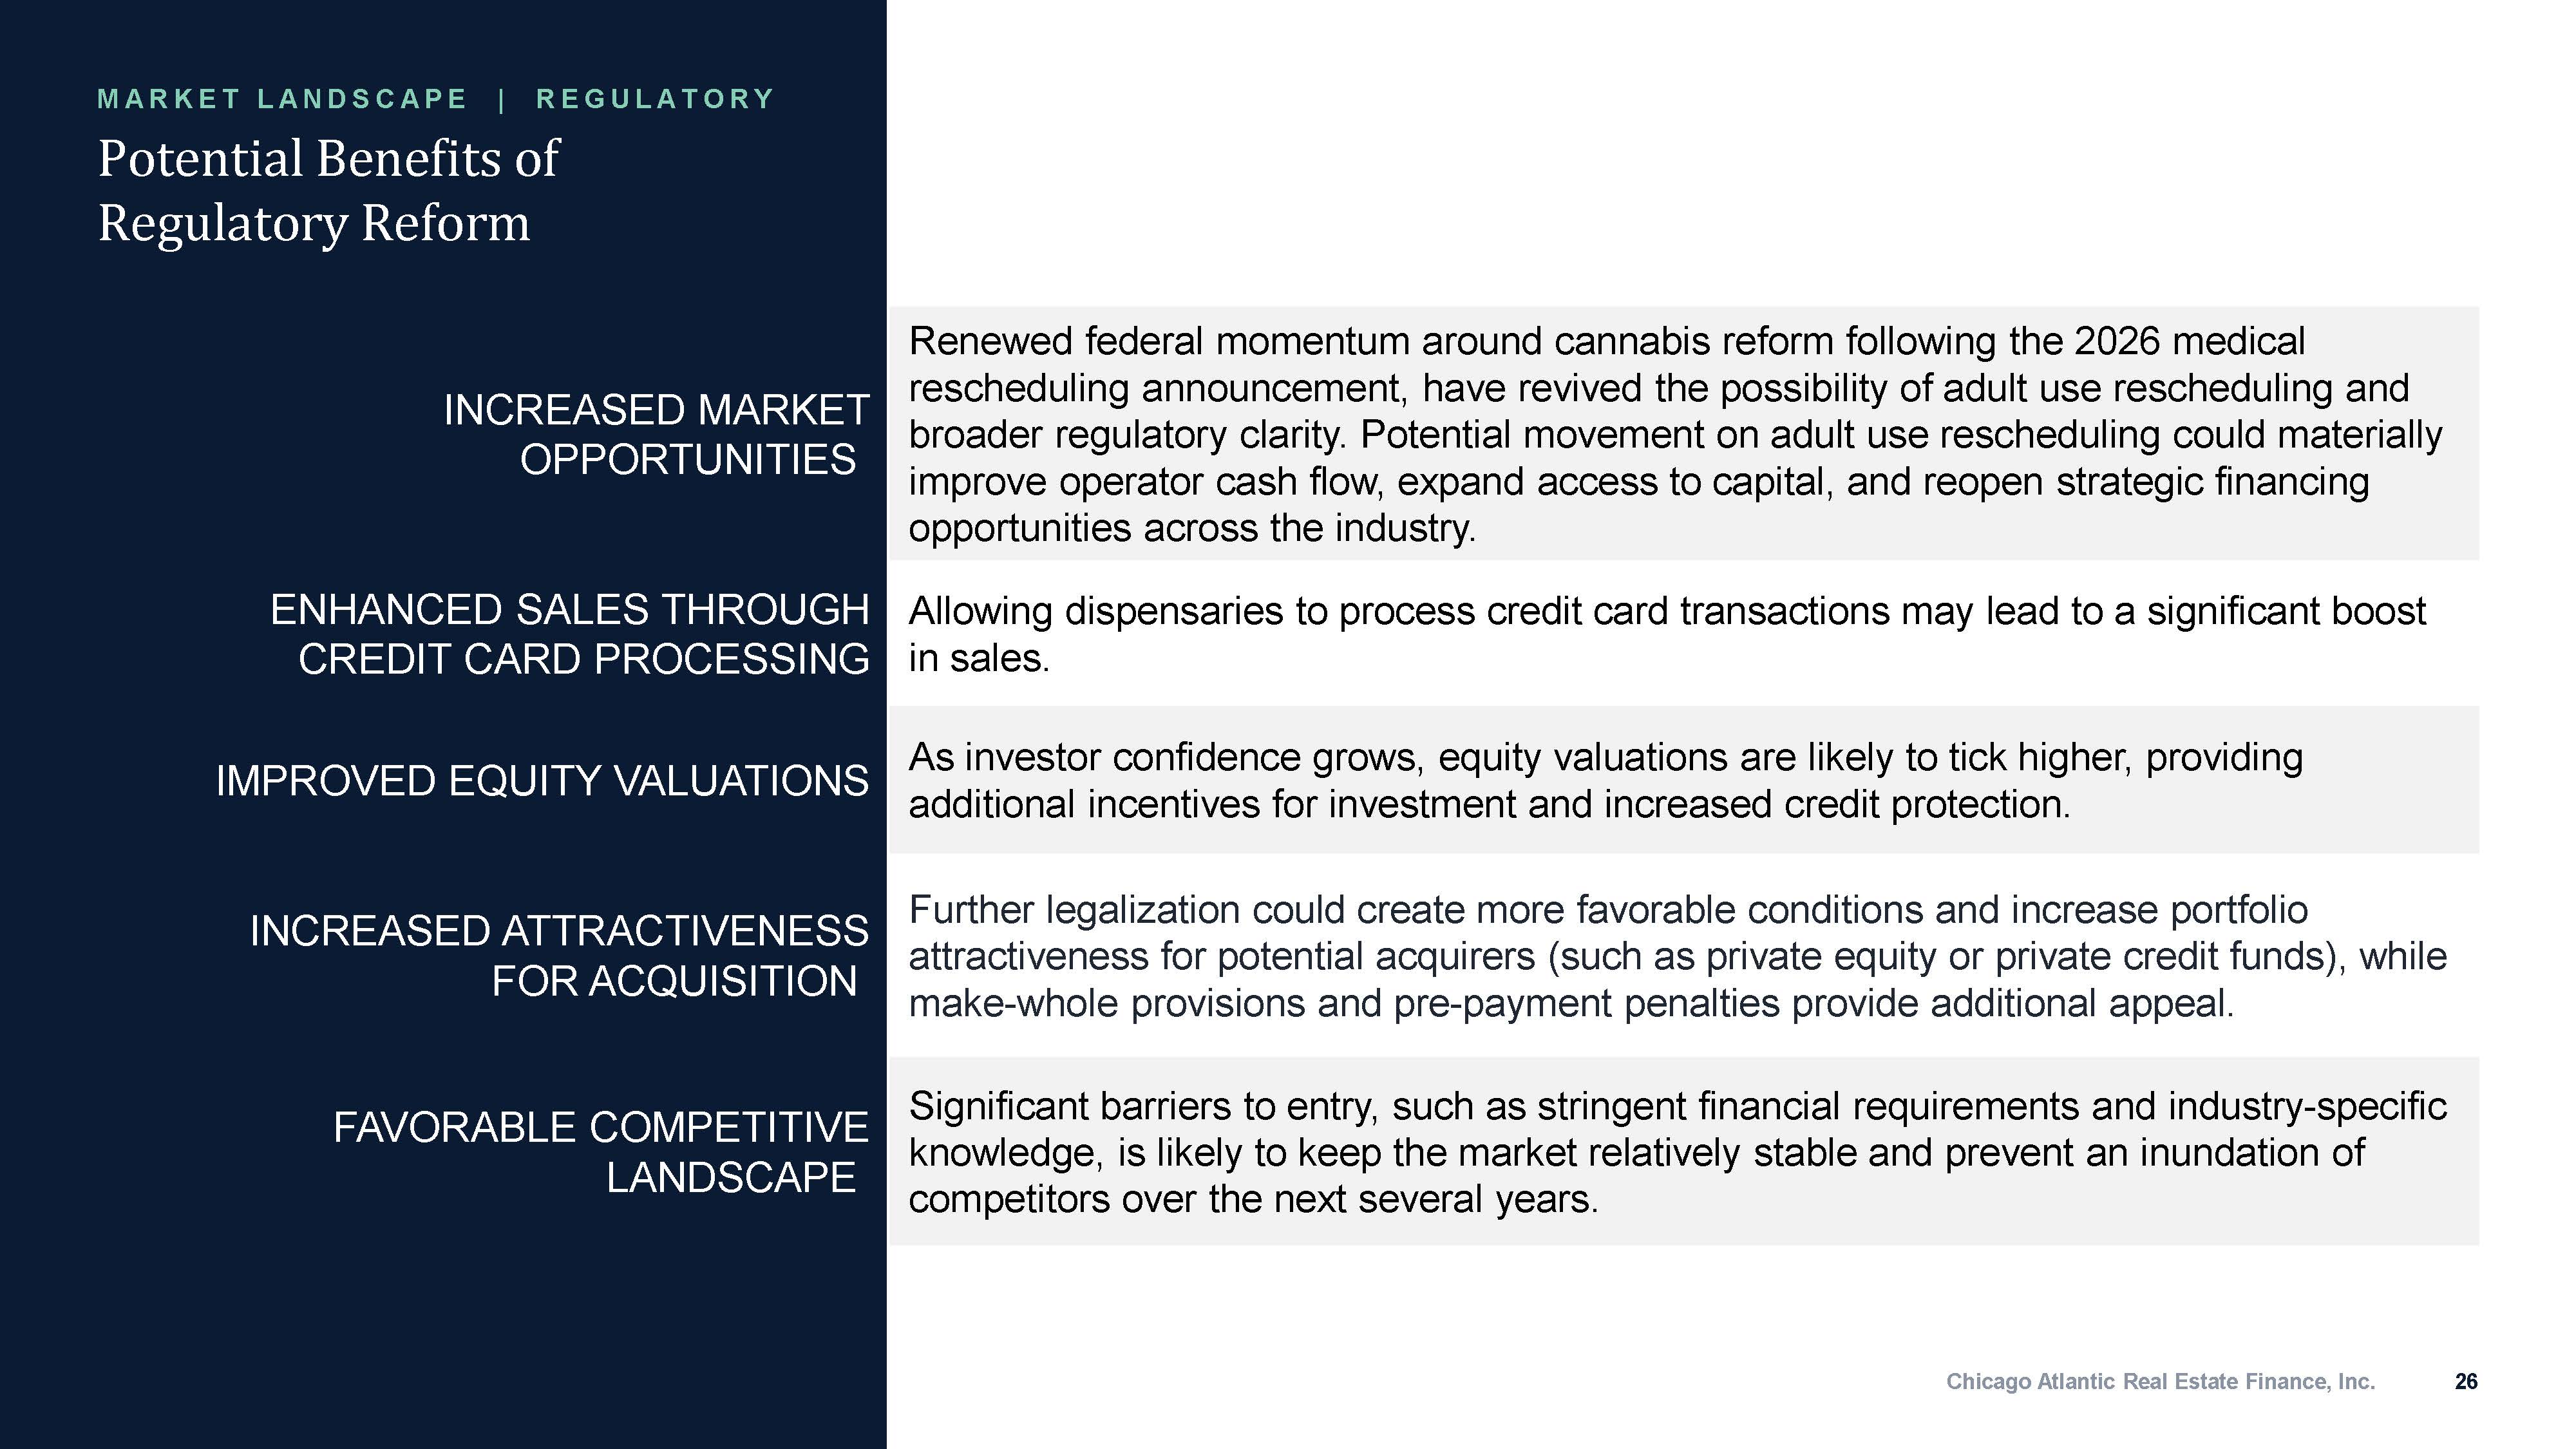
Potential Benefits of Regulatory Reform Chicago Atlantic Real Estate Finance, Inc. 26 Renewed federal momentum around cannabis reform following the 2026 medical rescheduling announcement, have revived the possibility of adult use rescheduling and broader regulatory clarity. Potential movement on adult use rescheduling could materially improve operator cash flow, expand access to capital, and reopen strategic financing opportunities across the industry. INCREASED MARKET OPPORTUNITIES Allowing dispensaries to process credit card transactions may lead to a significant boost in sales. ENHANCED SALES THROUGH CREDIT CARD PROCESSING As investor confidence grows, equity valuations are likely to tick higher, providing additional incentives for investment and increased credit protection. IMPROVED EQUITY VALUATIONS Further legalization could create more favorable conditions and increase portfolio attractiveness for potential acquirers (such as private equity or private credit funds), while make - whole provisions and pre - payment penalties provide additional appeal. INCREASED ATTRACTIVENESS FOR ACQUISITION Significant barriers to entry, such as stringent financial requirements and industry - specific knowledge, is likely to keep the market relatively stable and prevent an inundation of competitors over the next several years. FAVORABLE COMPETITIVE LANDSCAPE M A RKE T L A NDS C A P E | RE G UL A T O RY

Chicago Atlantic Real Estate Finance, Inc. 27 The Cannabis Landscape in the U.S. WE FOLLOW POTENTIAL ALPHA INTO INDUSTRIES WITH LOW COMPETITION LACK OF TRADITIONAL FINANCING Banks generally don’t lend to firms in this industry, allowing higher interest rates, attractive collateral, and lender - friendly covenants. LOW CORRELATIONS TO TRADITIONAL MARKETS Medical cannabis behaves like pharmaceuticals, recreational cannabis behaves like tobacco and alcohol, both exhibiting low correlation with traditional markets. HIGH BARRIERS TO ENTRY Each state has unique investment characteristics, supply and demand dynamics, and legal frameworks, requiring sophisticated understanding of the industry and strong underwriting expertise. FOCUS ON LIMITED LICENSE STATES Limited license states have limited competition, lucrative license values, high wholesale prices, and less black - market presence. M A RKE T L A NDS C A P E | O P P O RT UNI T Y Where We See Opportunities

About Chicago Atlantic
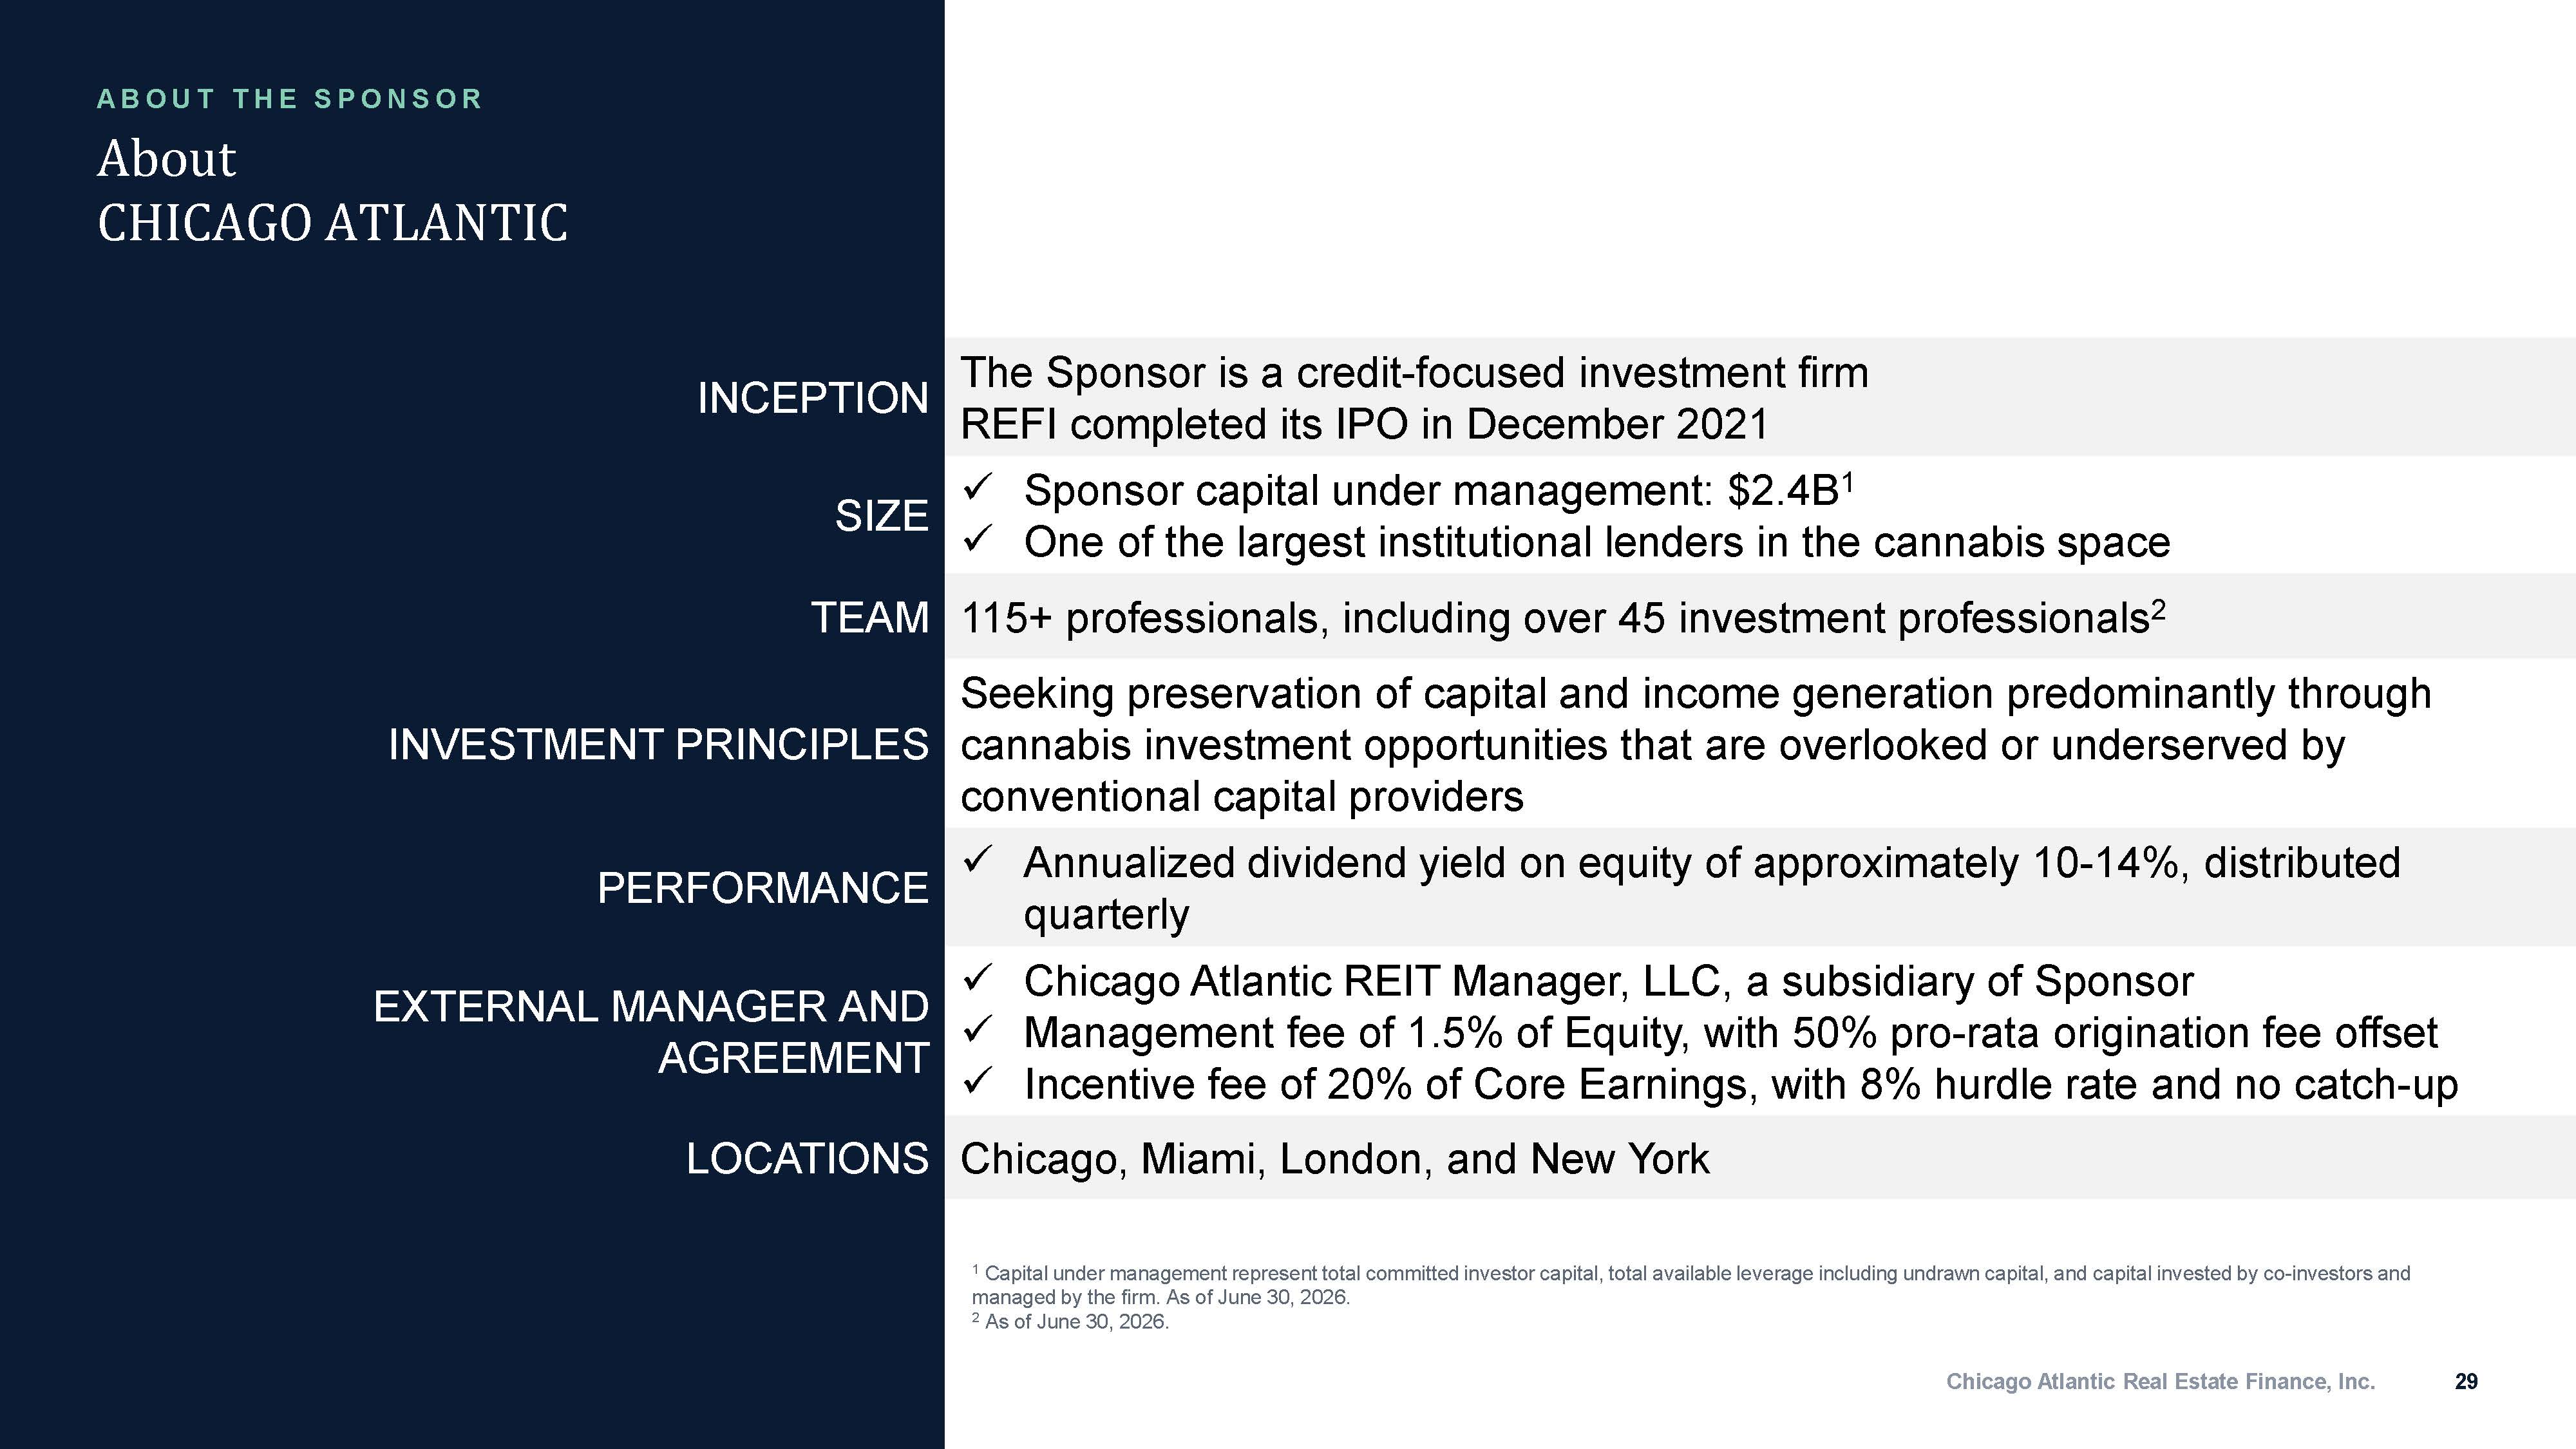
About CHICAGO ATLANTIC Chicago Atlantic Real Estate Finance, Inc. 29 1 Capital under management represent total committed investor capital, total available leverage including undrawn capital, and capital invested by co - investors and managed by the firm. As of June 30, 2026. 2 As of June 30, 2026. The Sponsor is a credit - focused investment firm REFI completed its IPO in December 2021 INCEPTION x Sponsor capital under management: $2.4B 1 x One of the largest institutional lenders in the cannabis space SIZE 115+ professionals, including over 45 investment professionals 2 TEAM Seeking preservation of capital and income generation predominantly through cannabis investment opportunities that are overlooked or underserved by conventional capital providers INVESTMENT PRINCIPLES x Annualized dividend yield on equity of approximately 10 - 14%, distributed quarterly PERFORMANCE x Chicago Atlantic REIT Manager, LLC, a subsidiary of Sponsor x Management fee of 1.5% of Equity, with 50% pro - rata origination fee offset x Incentive fee of 20% of Core Earnings, with 8% hurdle rate and no catch - up EXTERNAL MANAGER AND AGREEMENT Chicago, Miami, London, and New York LOCATIONS A B O U T T H E S P O N S O R
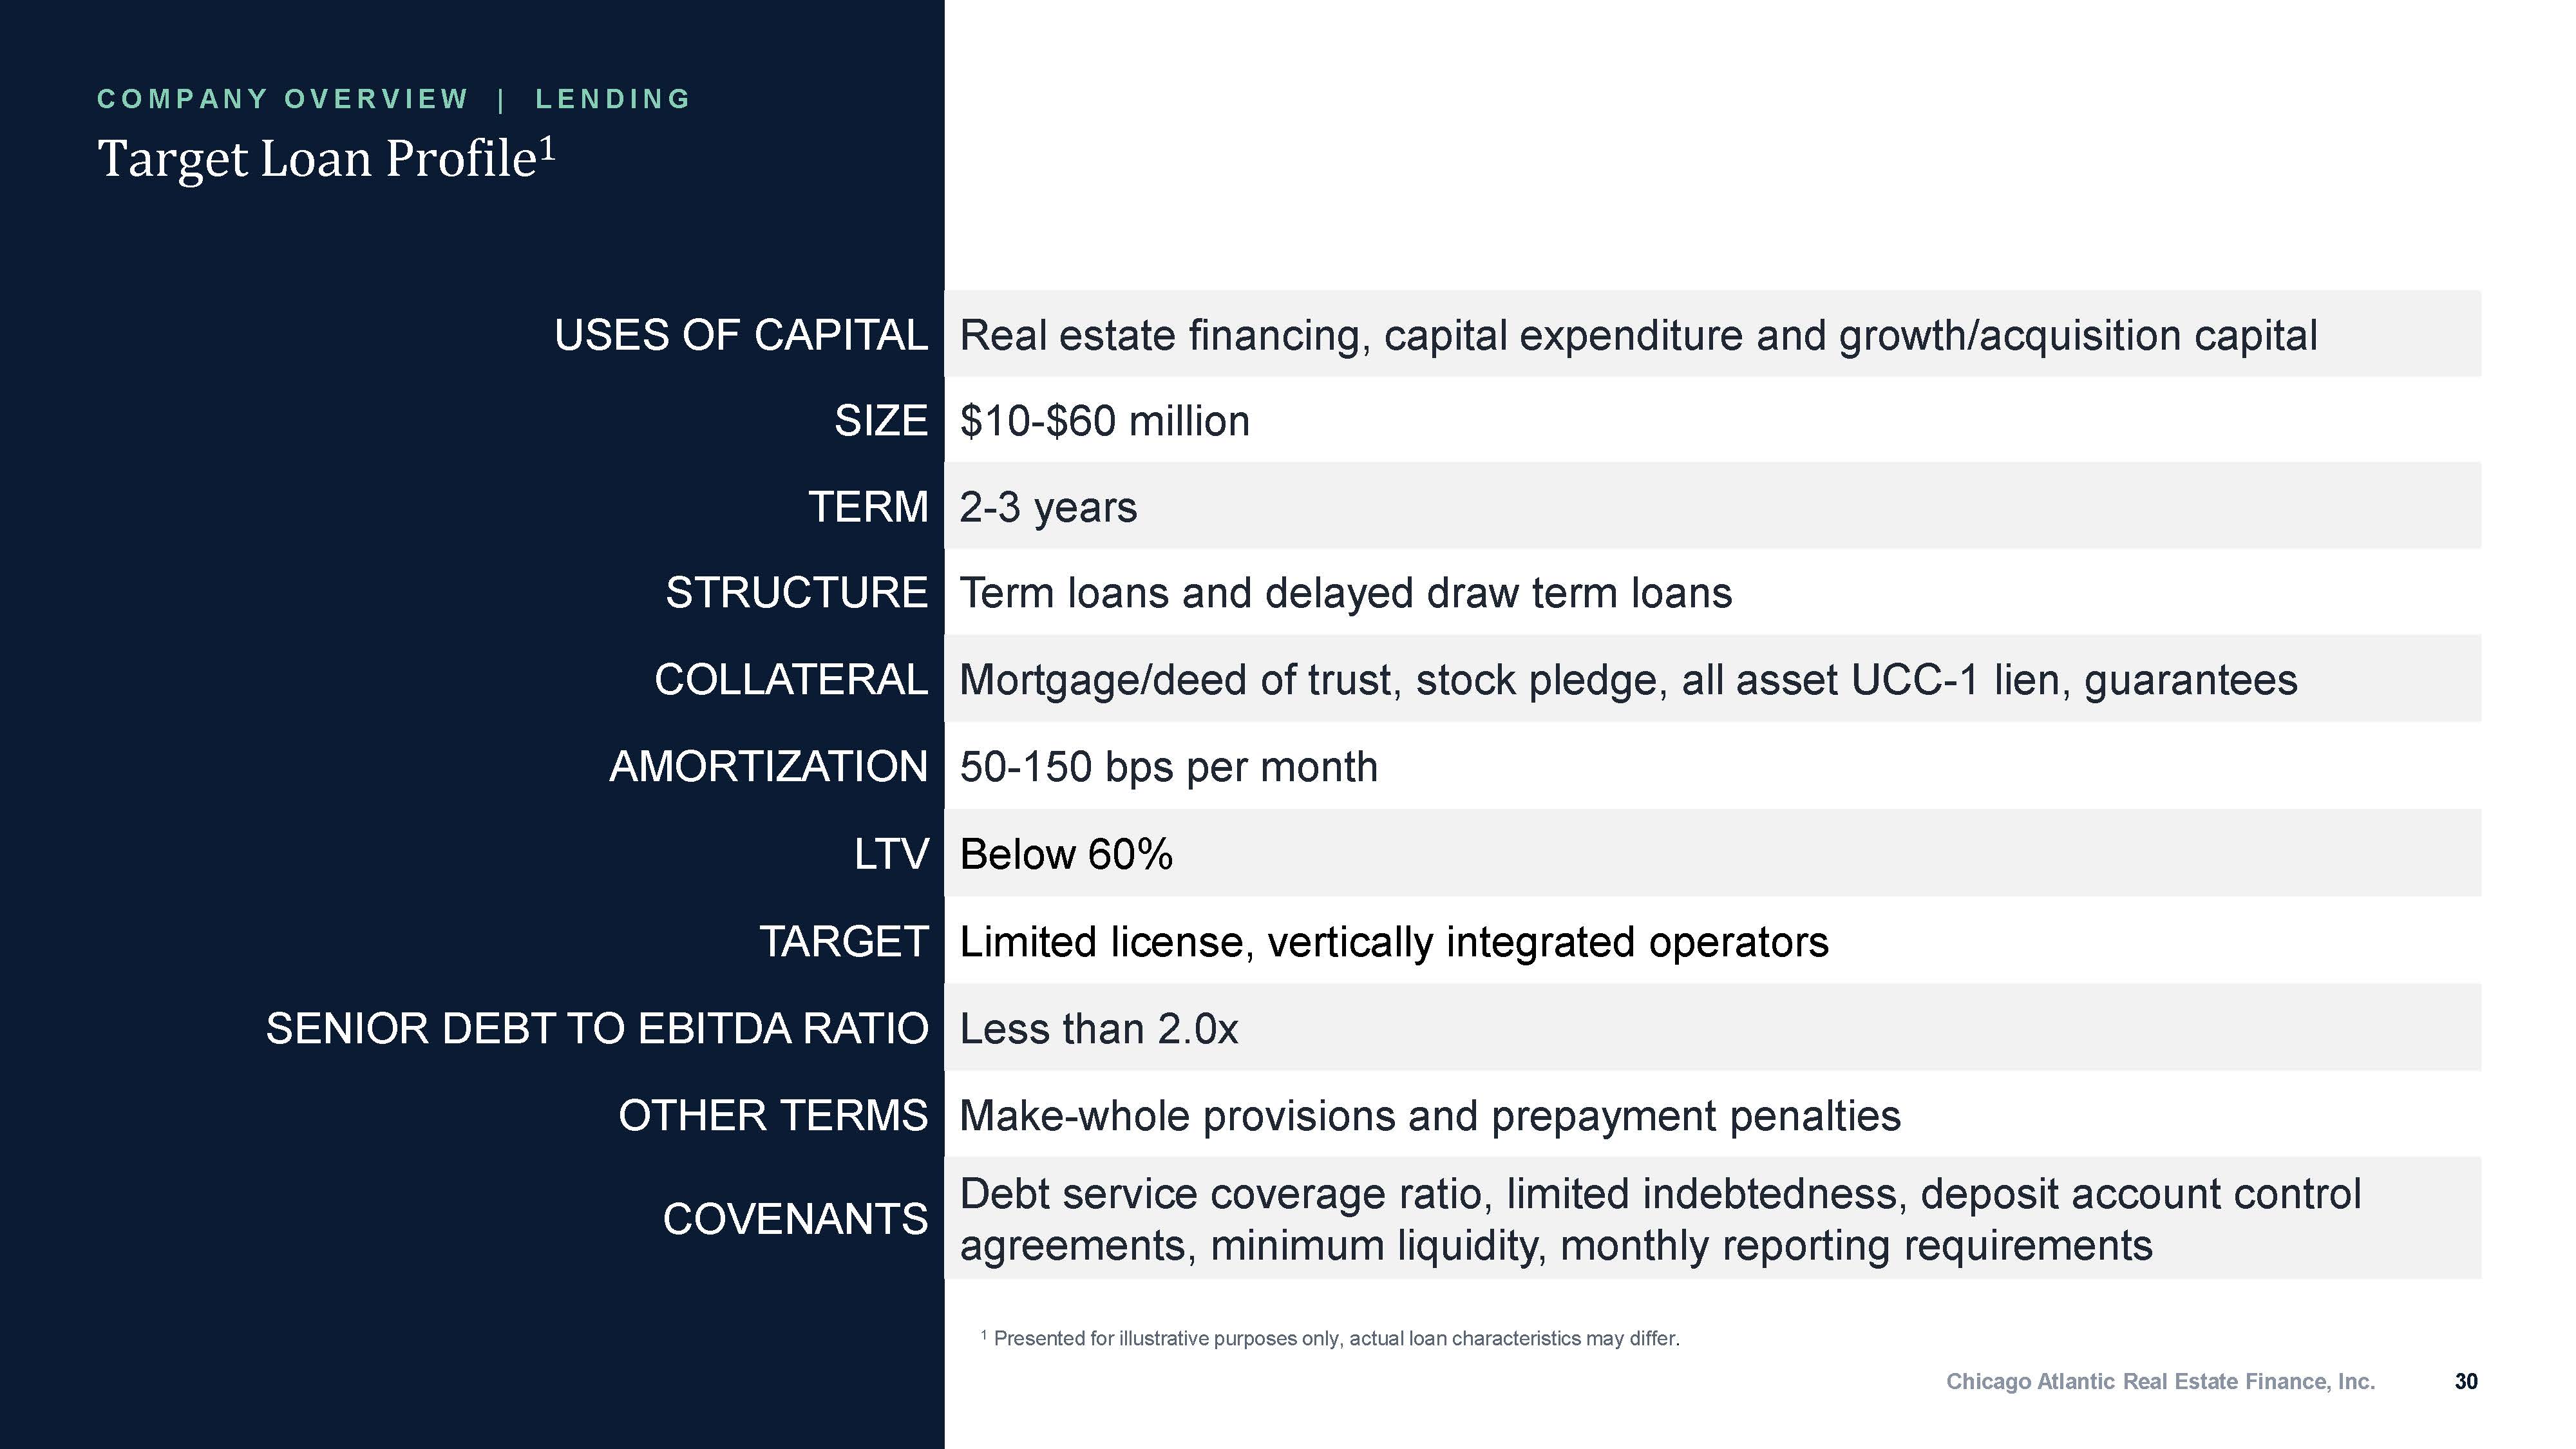
Target Loan Profile 1 Chicago Atlantic Real Estate Finance, Inc. 30 1 Presented for illustrative purposes only, actual loan characteristics may differ . Real estate financing, capital expenditure and growth/acquisition capital USES OF CAPITAL $10 - $60 million SIZE 2 - 3 years TERM Term loans and delayed draw term loans STRUCTURE Mortgage/deed of trust, stock pledge, all asset UCC - 1 lien, guarantees COLLATERAL 50 - 150 bps per month AMORTIZATION Below 60% LTV Limited license, vertically integrated operators TARGET Less than 2.0x SENIOR DEBT TO EBITDA RATIO Make - whole provisions and prepayment penalties OTHER TERMS Debt service coverage ratio, limited indebtedness, deposit account control agreements, minimum liquidity, monthly reporting requirements COVENANTS C O M P A N Y O V E R V I E W | L E N D I N G
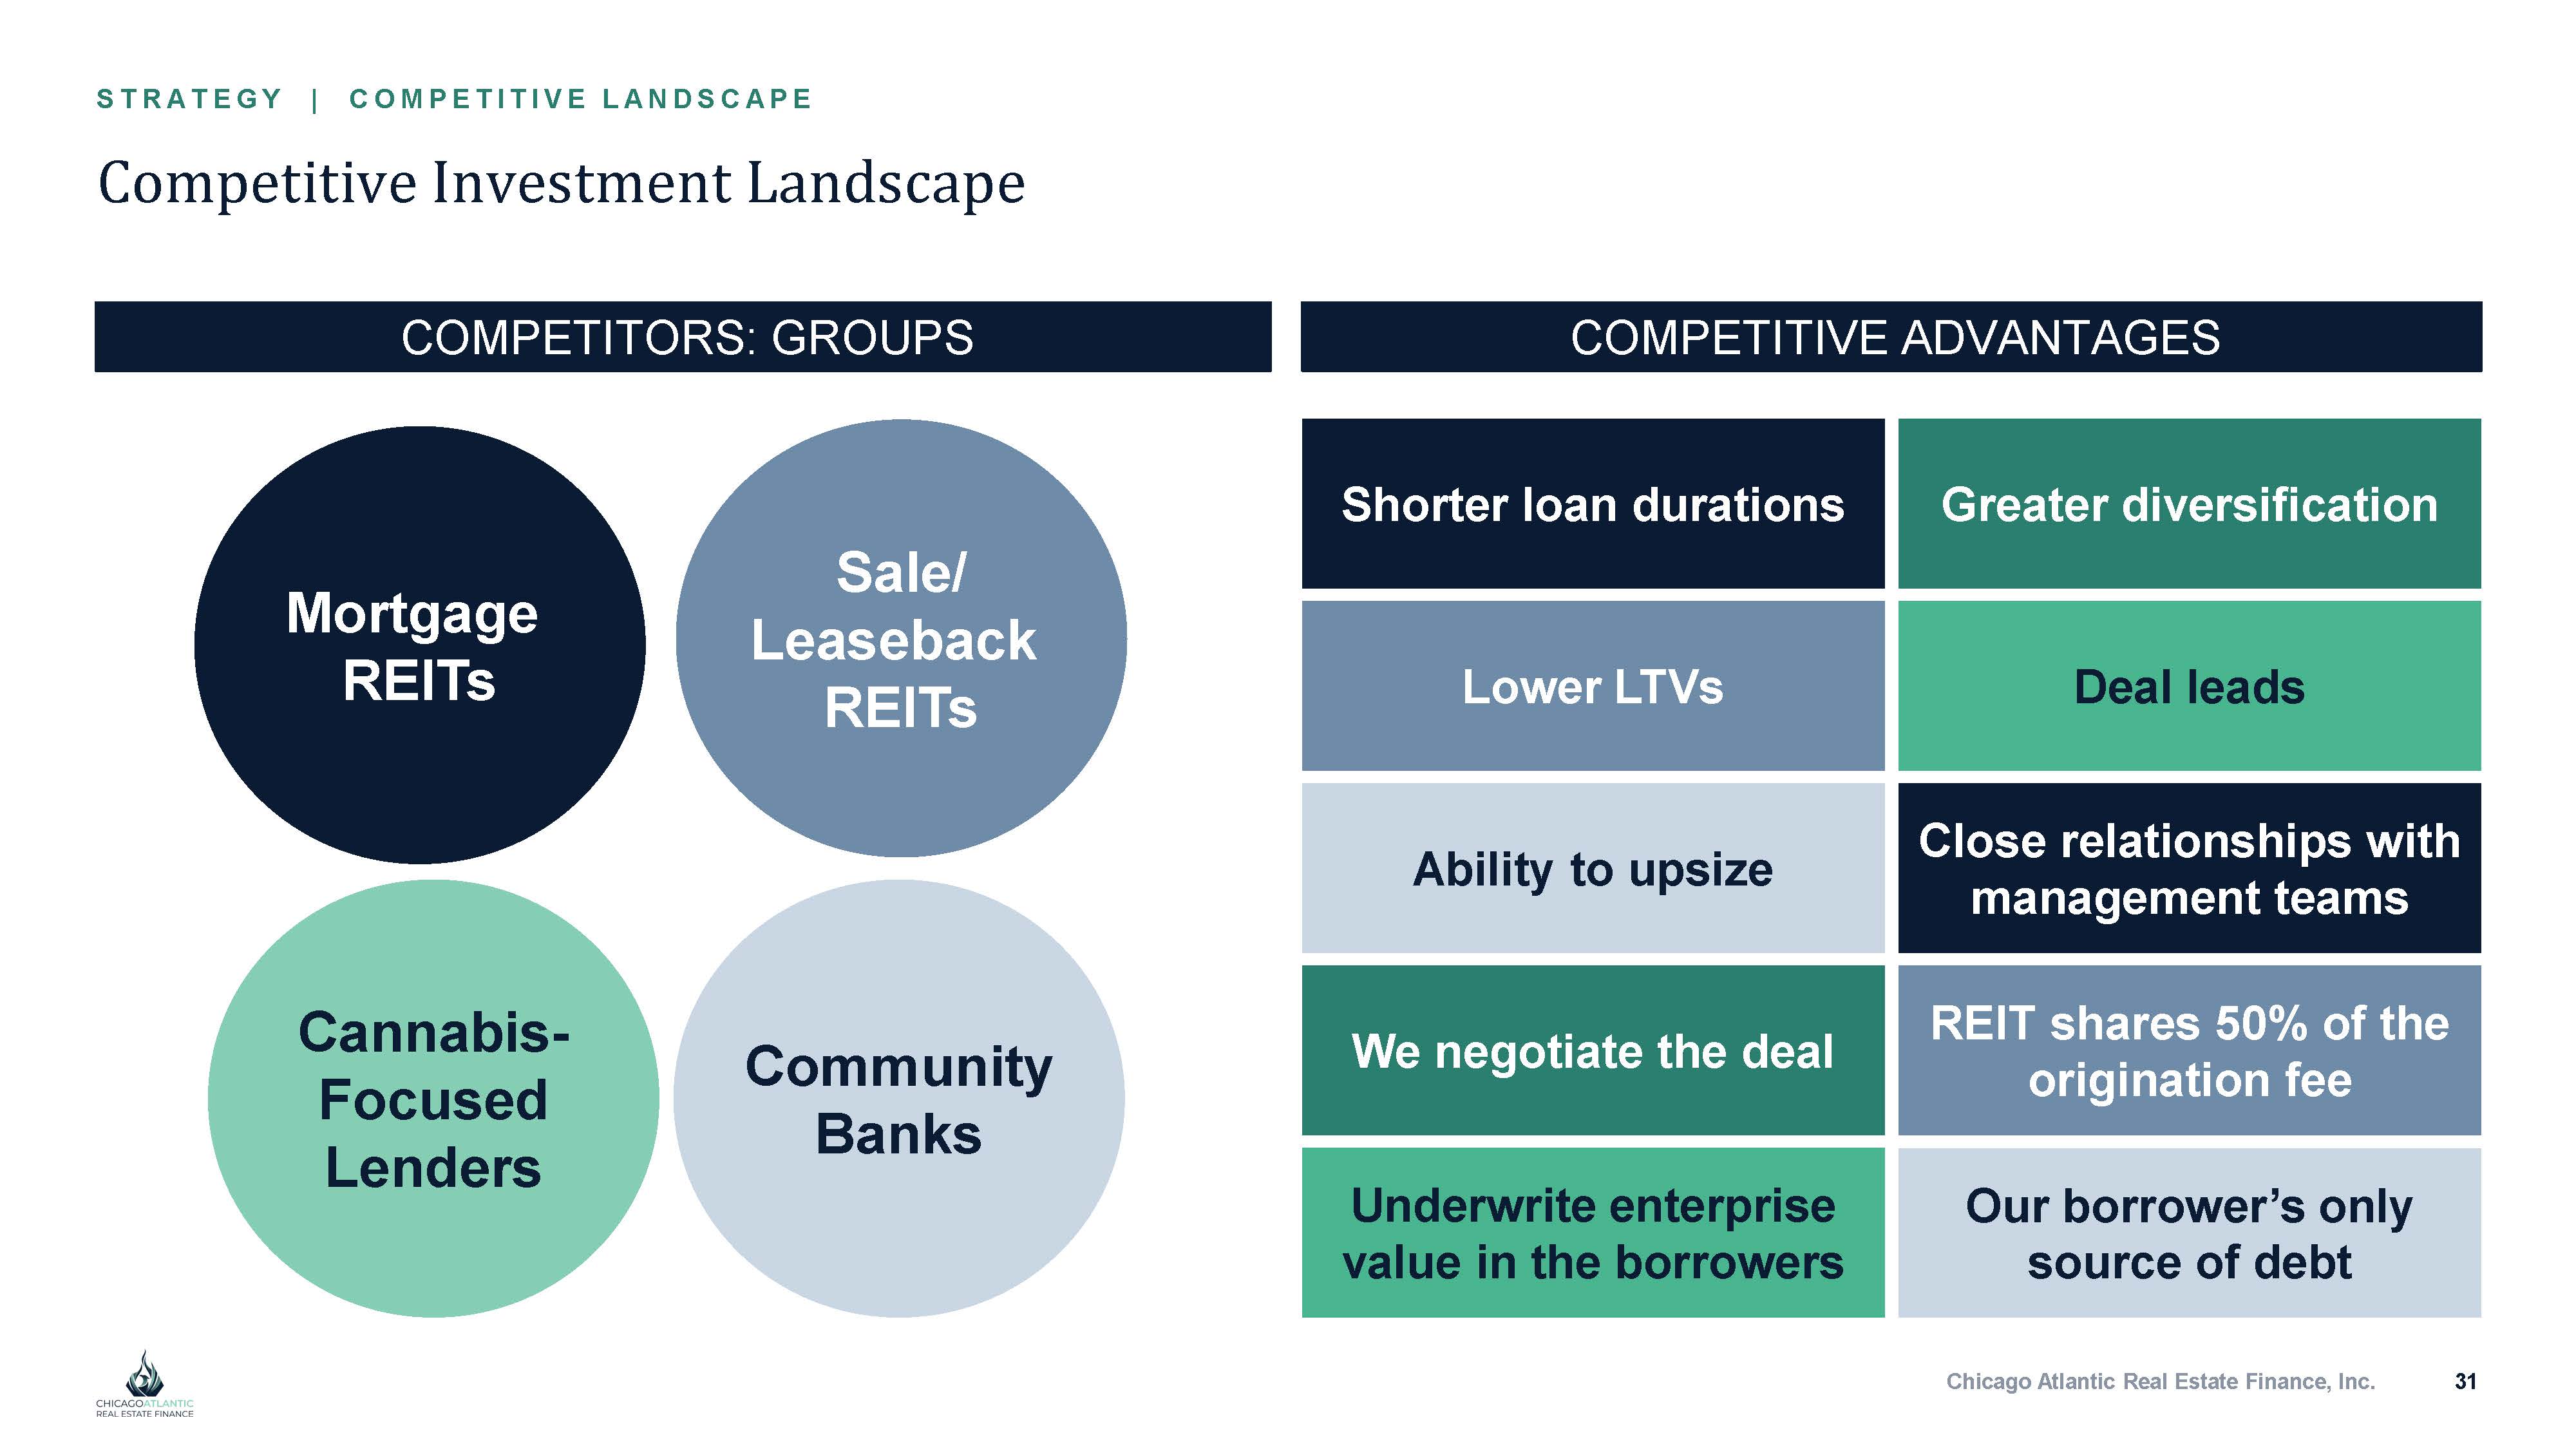
COMPETITORS: GROUPS COMPETITIVE ADVANTAGES Competitive Investment Landscape Mortgage REITs Sale/ Leaseback REITs Cannabis - Focused Lenders Community Banks Chicago Atlantic Real Estate Finance, Inc. 31 Greater diversification Shorter loan durations Deal leads Lower LTVs Close relationships with management teams Ability to upsize REIT shares 50% of the origination fee We negotiate the deal Our borrower’s only source of debt Underwrite enterprise value in the borrowers S T R A T E G Y | C O M P E T I T I V E L A N D S C A P E
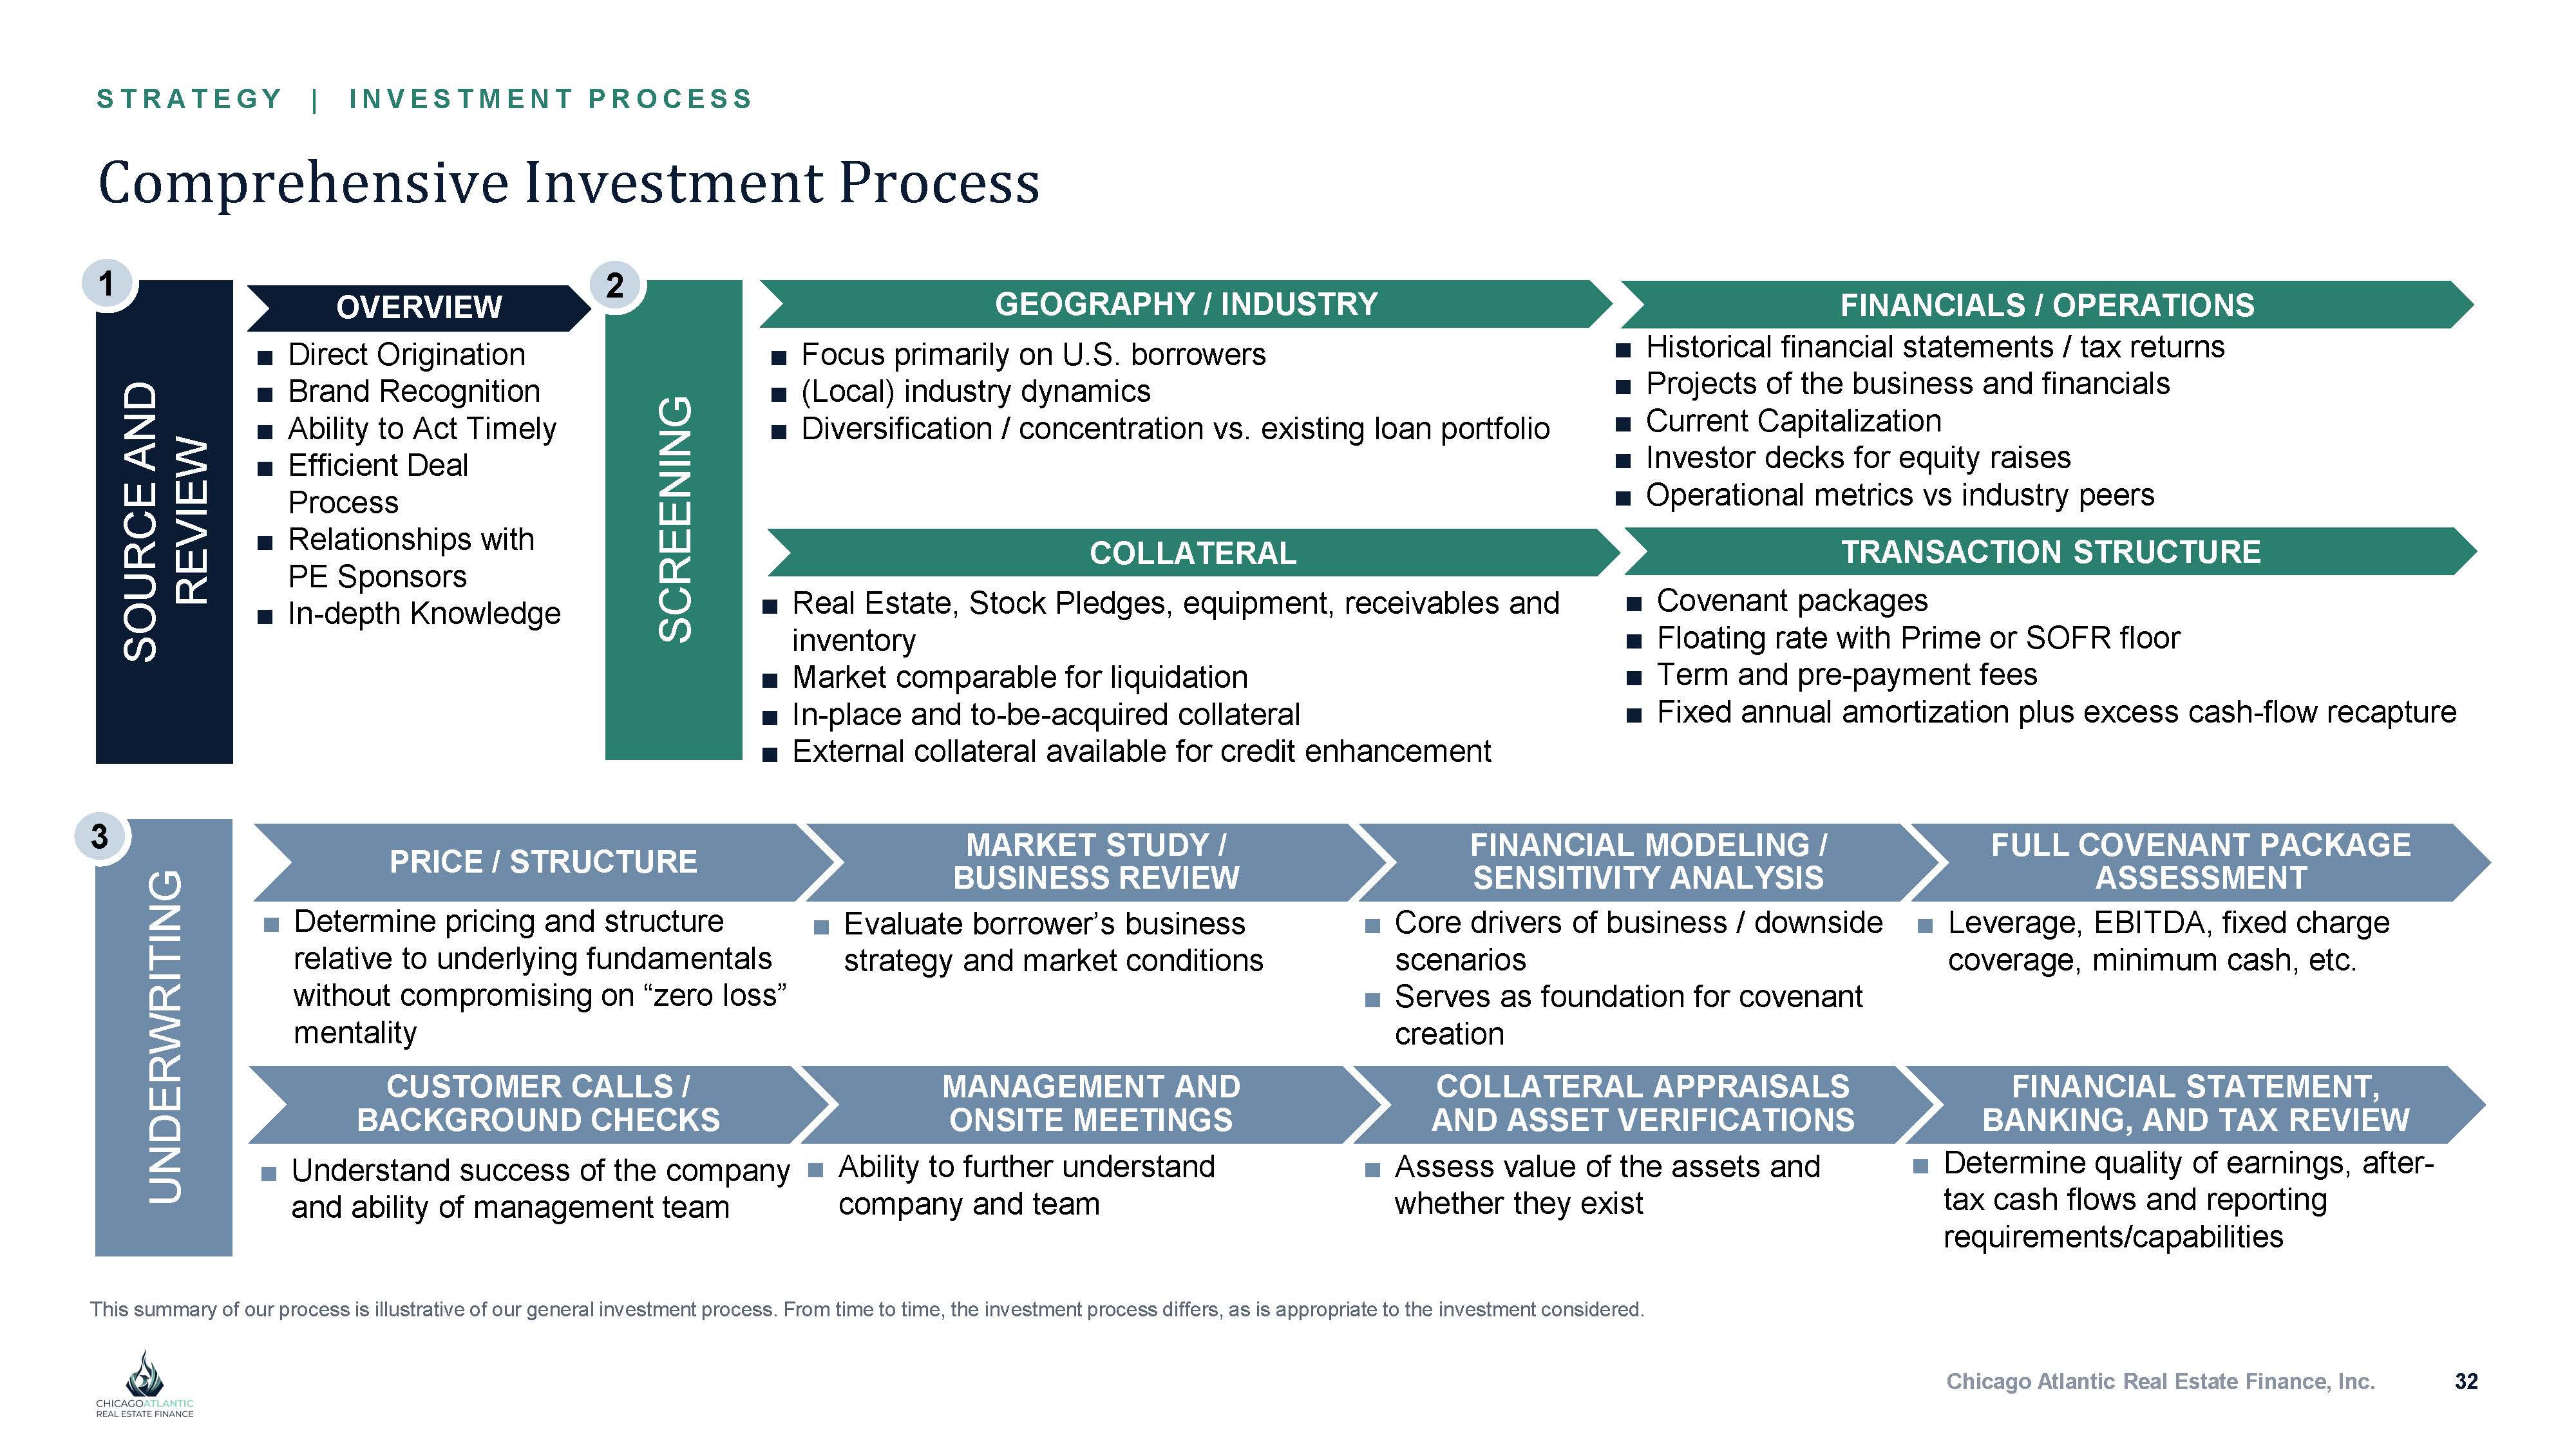
Comprehensive Investment Process SOURCE AND REVIEW SCREENING 1 2 GEOGRAPHY / INDUSTRY ■ Focus primarily on U.S. borrowers ■ (Local) industry dynamics ■ Diversification / concentration vs. existing loan portfolio COLLATERAL ■ Real Estate, Stock Pledges, equipment, receivables and inventory ■ Market comparable for liquidation ■ In - place and to - be - acquired collateral ■ External collateral available for credit enhancement FINANCIALS / OPERATIONS ■ Historical financial statements / tax returns ■ Projects of the business and financials ■ Current Capitalization ■ Investor decks for equity raises ■ Operational metrics vs industry peers TRANSACTION STRUCTURE ■ Covenant packages ■ Floating rate with Prime or SOFR floor ■ Term and pre - payment fees ■ Fixed annual amortization plus excess cash - flow recapture UNDERWRITING 3 MARKET STUDY / BUSINESS REVIEW ■ Evaluate borrower’s business strategy and market conditions FULL COVENANT PACKAGE ASSESSMENT ■ Leverage, EBITDA, fixed charge coverage, minimum cash, etc. MANAGEMENT AND ONSITE MEETINGS ■ Ability to further understand company and team FINANCIAL MODELING / SENSITIVITY ANALYSIS ■ Core drivers of business / downside scenarios ■ Serves as foundation for covenant creation COLLATERAL APPRAISALS AND ASSET VERIFICATIONS ■ Assess value of the assets and whether they exist OVERVIEW ■ Direct Origination ■ Brand Recognition ■ Ability to Act Timely ■ Efficient Deal Process ■ Relationships with PE Sponsors ■ In - depth Knowledge PRICE / STRUCTURE ■ Determine pricing and structure relative to underlying fundamentals without compromising on “zero loss” mentality CUSTOMER CALLS / BACKGROUND CHECKS ■ Understand success of the company and ability of management team FINANCIAL STATEMENT, BANKING, AND TAX REVIEW ■ Determine quality of earnings, after - tax cash flows and reporting requirements/capabilities Chicago Atlantic Real Estate Finance, Inc. 32 This summary of our process is illustrative of our general investment process. From time to time, the investment process differs, as is appropriate to the investment considered. S T R A T E G Y | I N V E S T M E N T P R O C E S S
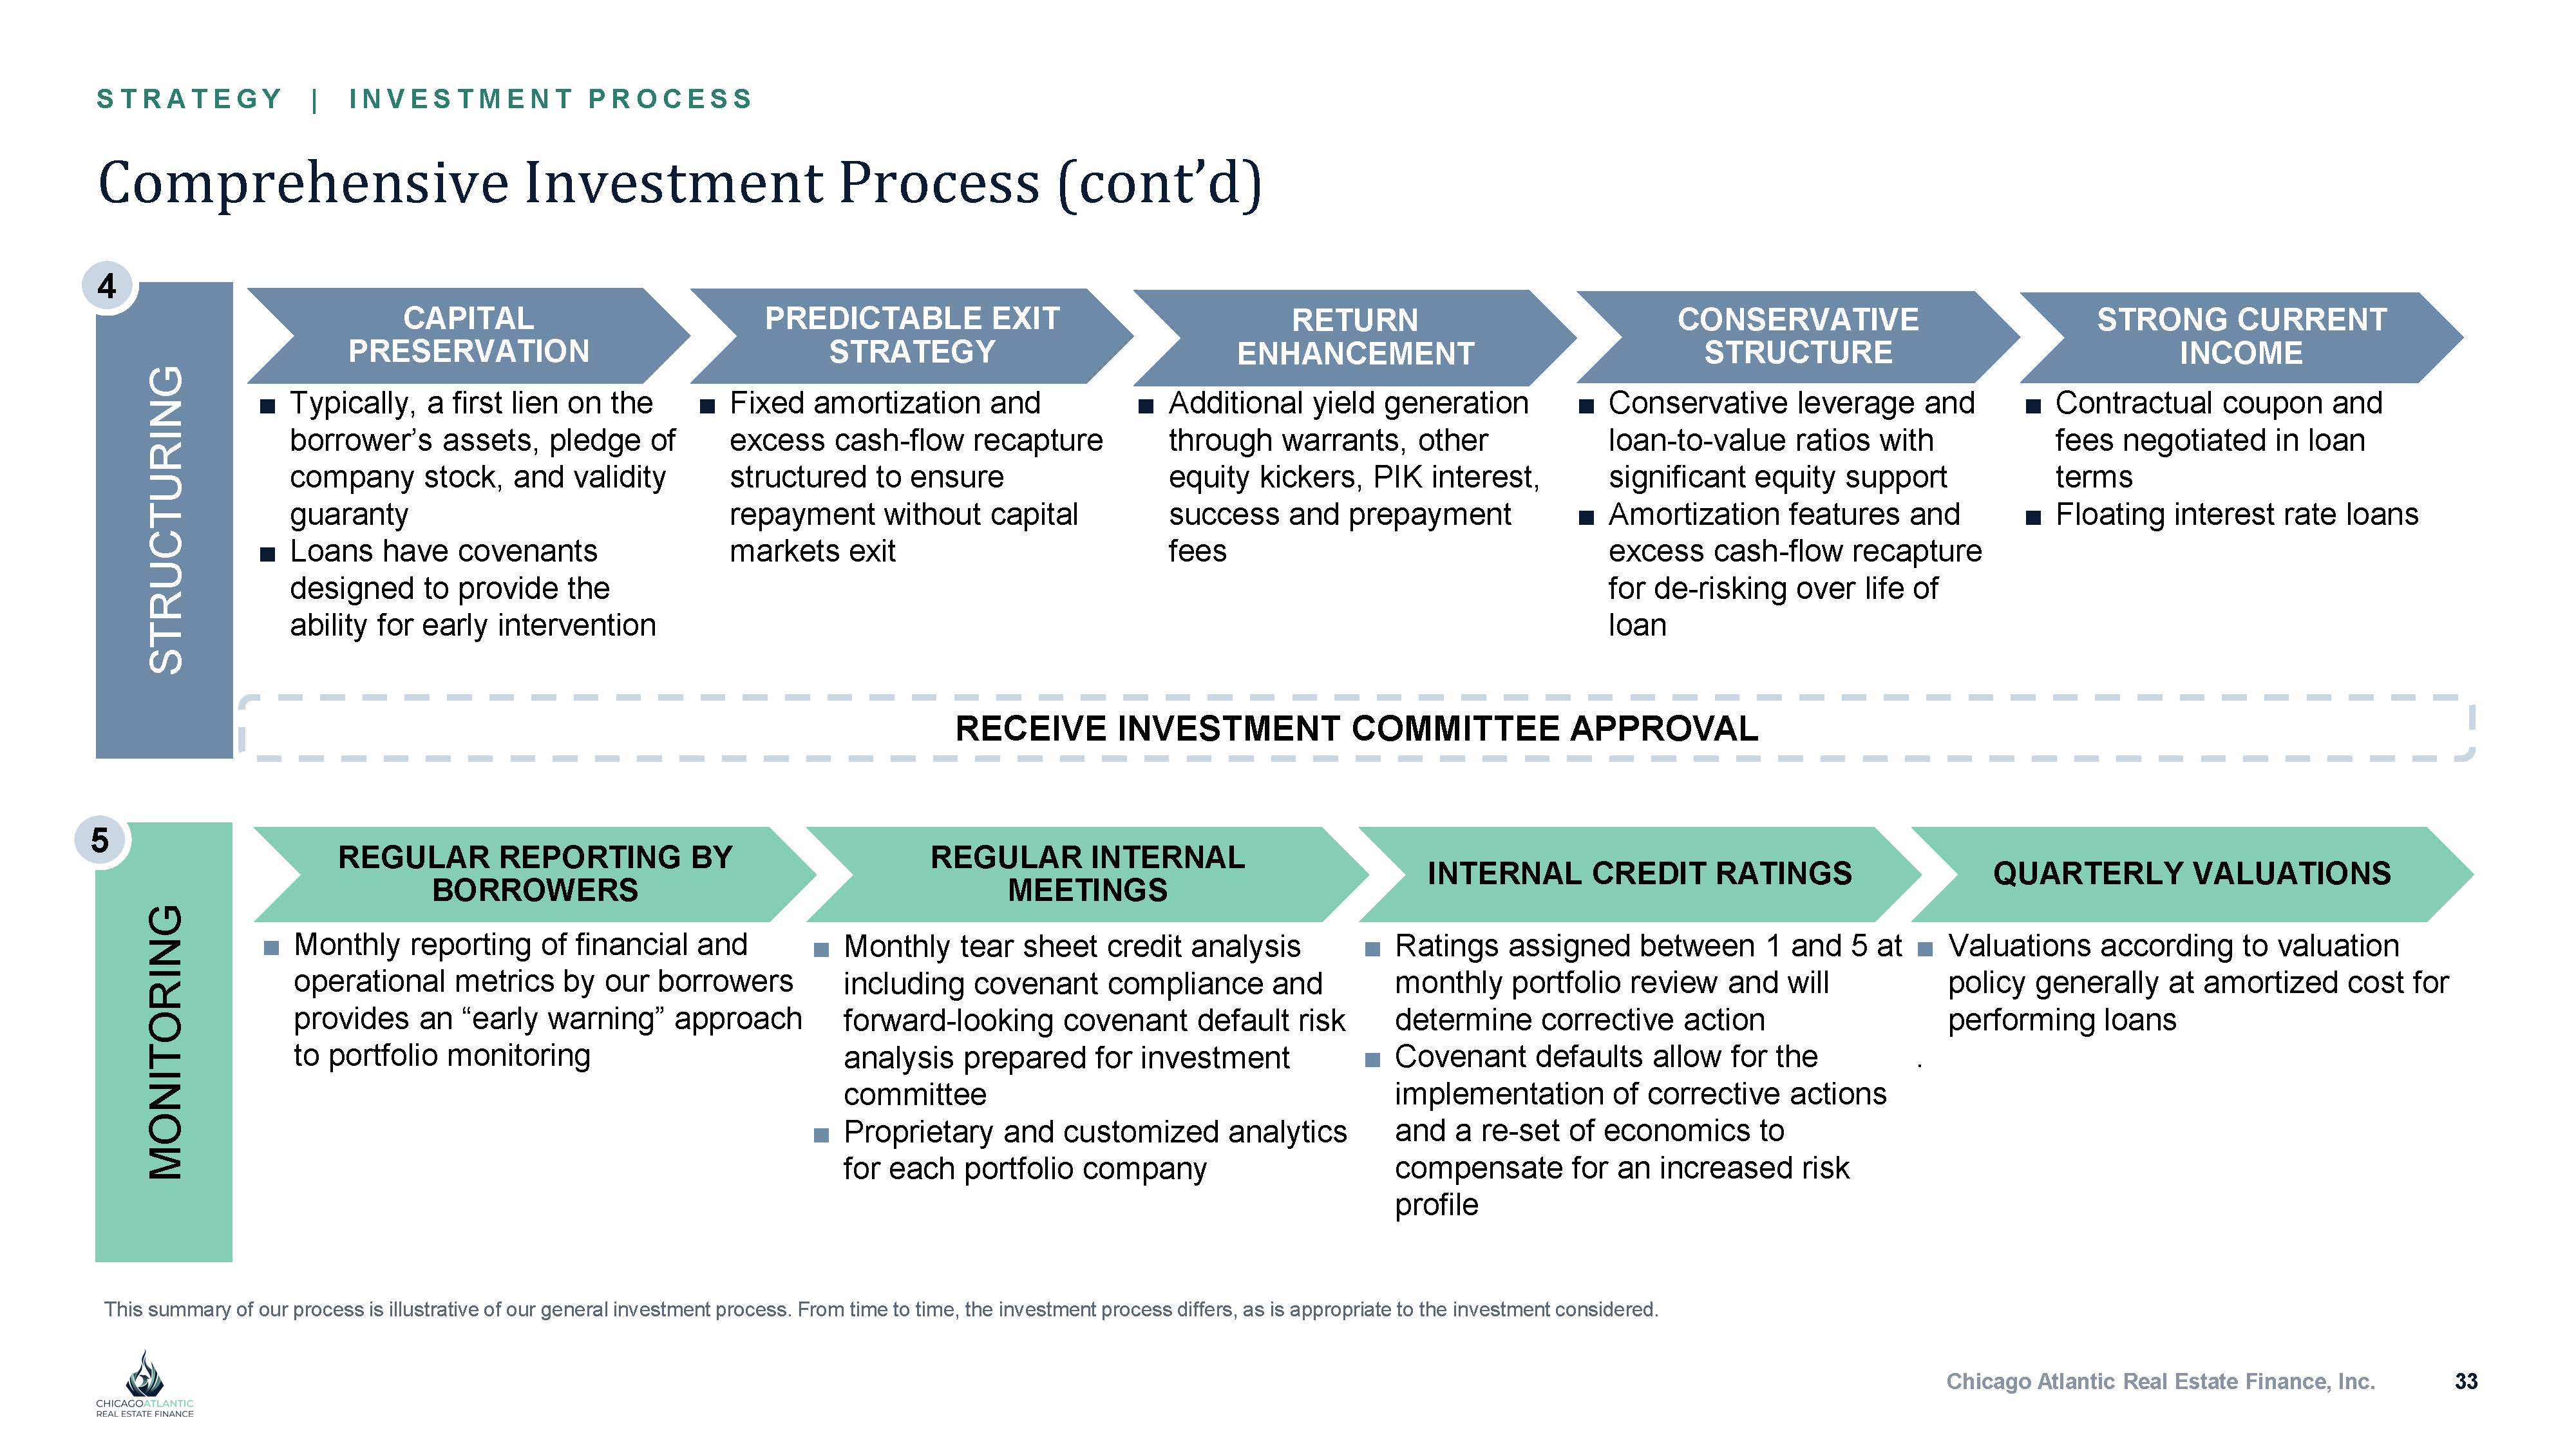
Comprehensive Investment Process (cont’d) STRUCTURING 4 MONITORING 5 INTERNAL CREDIT RATINGS QUARTERLY VALUATIONS REGULAR REPORTING BY BORROWERS ■ Monthly reporting of financial and operational metrics by our borrowers provides an “early warning” approach to portfolio monitoring REGULAR INTERNAL MEETINGS ■ Monthly tear sheet credit analysis including covenant compliance and forward - looking covenant default risk analysis prepared for investment committee ■ Proprietary and customized analytics for each portfolio company ■ Ratings assigned between 1 and 5 at monthly portfolio review and will determine corrective action ■ Covenant defaults allow for the implementation of corrective actions and a re - set of economics to compensate for an increased risk profile ■ Valuations according to valuation policy generally at amortized cost for performing loans . CAPITAL PRESERVATION ■ Typically, a first lien on the borrower’s assets, pledge of company stock, and validity guaranty ■ Loans have covenants designed to provide the ability for early intervention STRONG CURRENT INCOME ■ Contractual coupon and fees negotiated in loan terms ■ Floating interest rate loans CONSERVATIVE STRUCTURE ■ Conservative leverage and loan - to - value ratios with significant equity support ■ Amortization features and excess cash - flow recapture for de - risking over life of loan RETURN ENHANCEMENT ■ Additional yield generation through warrants, other equity kickers, PIK interest, success and prepayment fees PREDICTABLE EXIT STRATEGY ■ Fixed amortization and excess cash - flow recapture structured to ensure repayment without capital markets exit RECEIVE INVESTMENT COMMITTEE APPROVAL Chicago Atlantic Real Estate Finance, Inc. 33 This summary of our process is illustrative of our general investment process. From time to time, the investment process differs, as is appropriate to the investment considered. S T R A T E G Y | I N V E S T M E N T P R O C E S S

Appendix
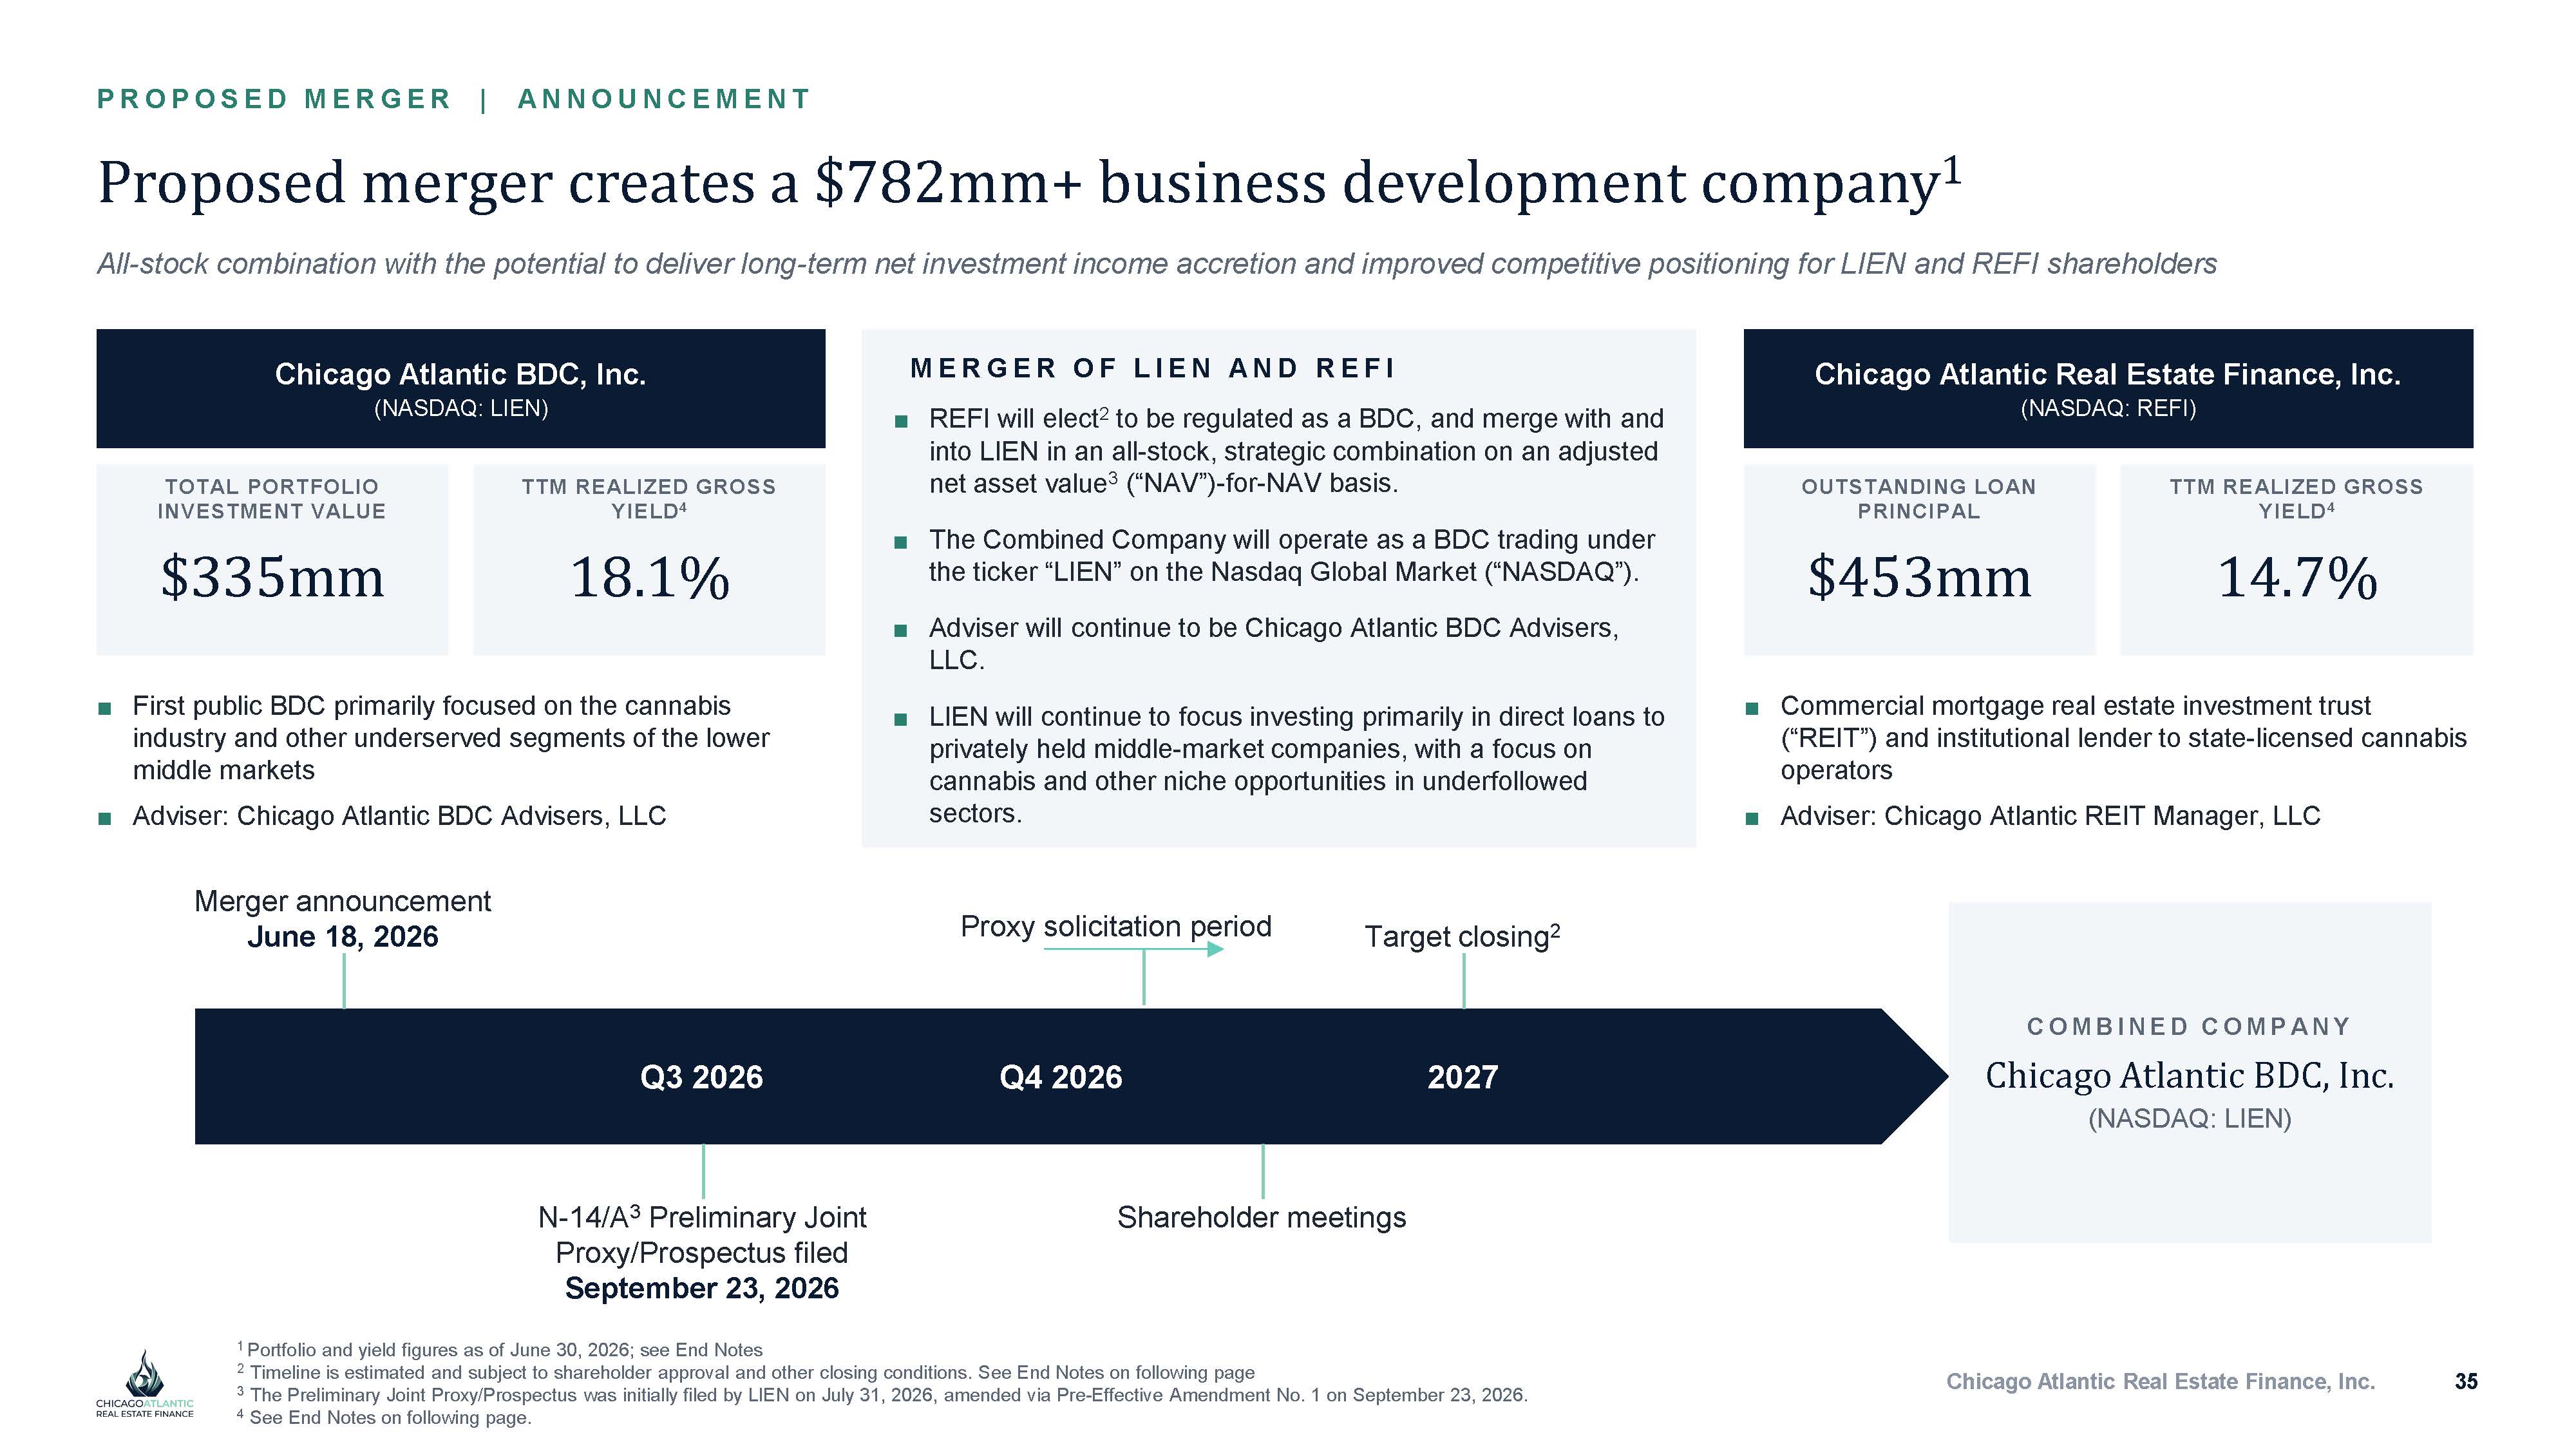
Chicago Atlantic Real Estate Finance, Inc. P RO P O S E D M E RG E R | A NNO UNCE M E NT Proposed merger creates a $782mm+ business development company 1 All - stock combination with the potential to deliver long - term net investment income accretion and improved competitive positioning for LIEN and REFI shareholders 35 Chicago Atlantic BDC, Inc. (NASDAQ: LIEN) TTM REALIZED GROSS YIELD 4 18.1% TOTAL PORTFOLIO INVESTMENT VALUE $335mm ■ First public BDC primarily focused on the cannabis industry and other underserved segments of the lower middle markets ■ Adviser: Chicago Atlantic BDC Advisers, LLC Chicago Atlantic Real Estate Finance, Inc. (NASDAQ: REFI) TTM REALIZED GROSS YIELD 4 14.7% OUTSTANDING LOAN PRINCIPAL $453mm ■ Commercial mortgage real estate investment trust (“REIT”) and institutional lender to state - licensed cannabis operators ■ Adviser: Chicago Atlantic REIT Manager, LLC M E RG E R O F L I E N A ND RE F I ■ REFI will elect 2 to be regulated as a BDC, and merge with and into LIEN in an all - stock, strategic combination on an adjusted net asset value 3 (“NAV”) - for - NAV basis . ■ The Combined Company will operate as a BDC trading under the ticker “LIEN” on the Nasdaq Global Market (“NASDAQ”) . ■ Adviser will continue to be Chicago Atlantic BDC Advisers, LLC. ■ LIEN will continue to focus investing primarily in direct loans to privately held middle - market companies, with a focus on cannabis and other niche opportunities in underfollowed sectors. 1 Portfolio and yield figures as of June 30, 2026; see End Notes 2 Timeline is estimated and subject to shareholder approval and other closing conditions. See End Notes on following page 3 The Preliminary Joint Proxy/Prospectus was initially filed by LIEN on July 31, 2026, amended via Pre - Effective Amendment No. 1 on September 23, 2026. 4 See End Notes on following page. Q3 2026 Q4 2026 2027 Merger announcement June 18, 2026 N - 14/A 3 Preliminary Joint Proxy/Prospectus filed September 23, 2026 Proxy solicitation period Shareholder meetings Target closing 2 CO M BI NE D CO M P A NY Chicago Atlantic BDC, Inc. (NASDAQ: LIEN)
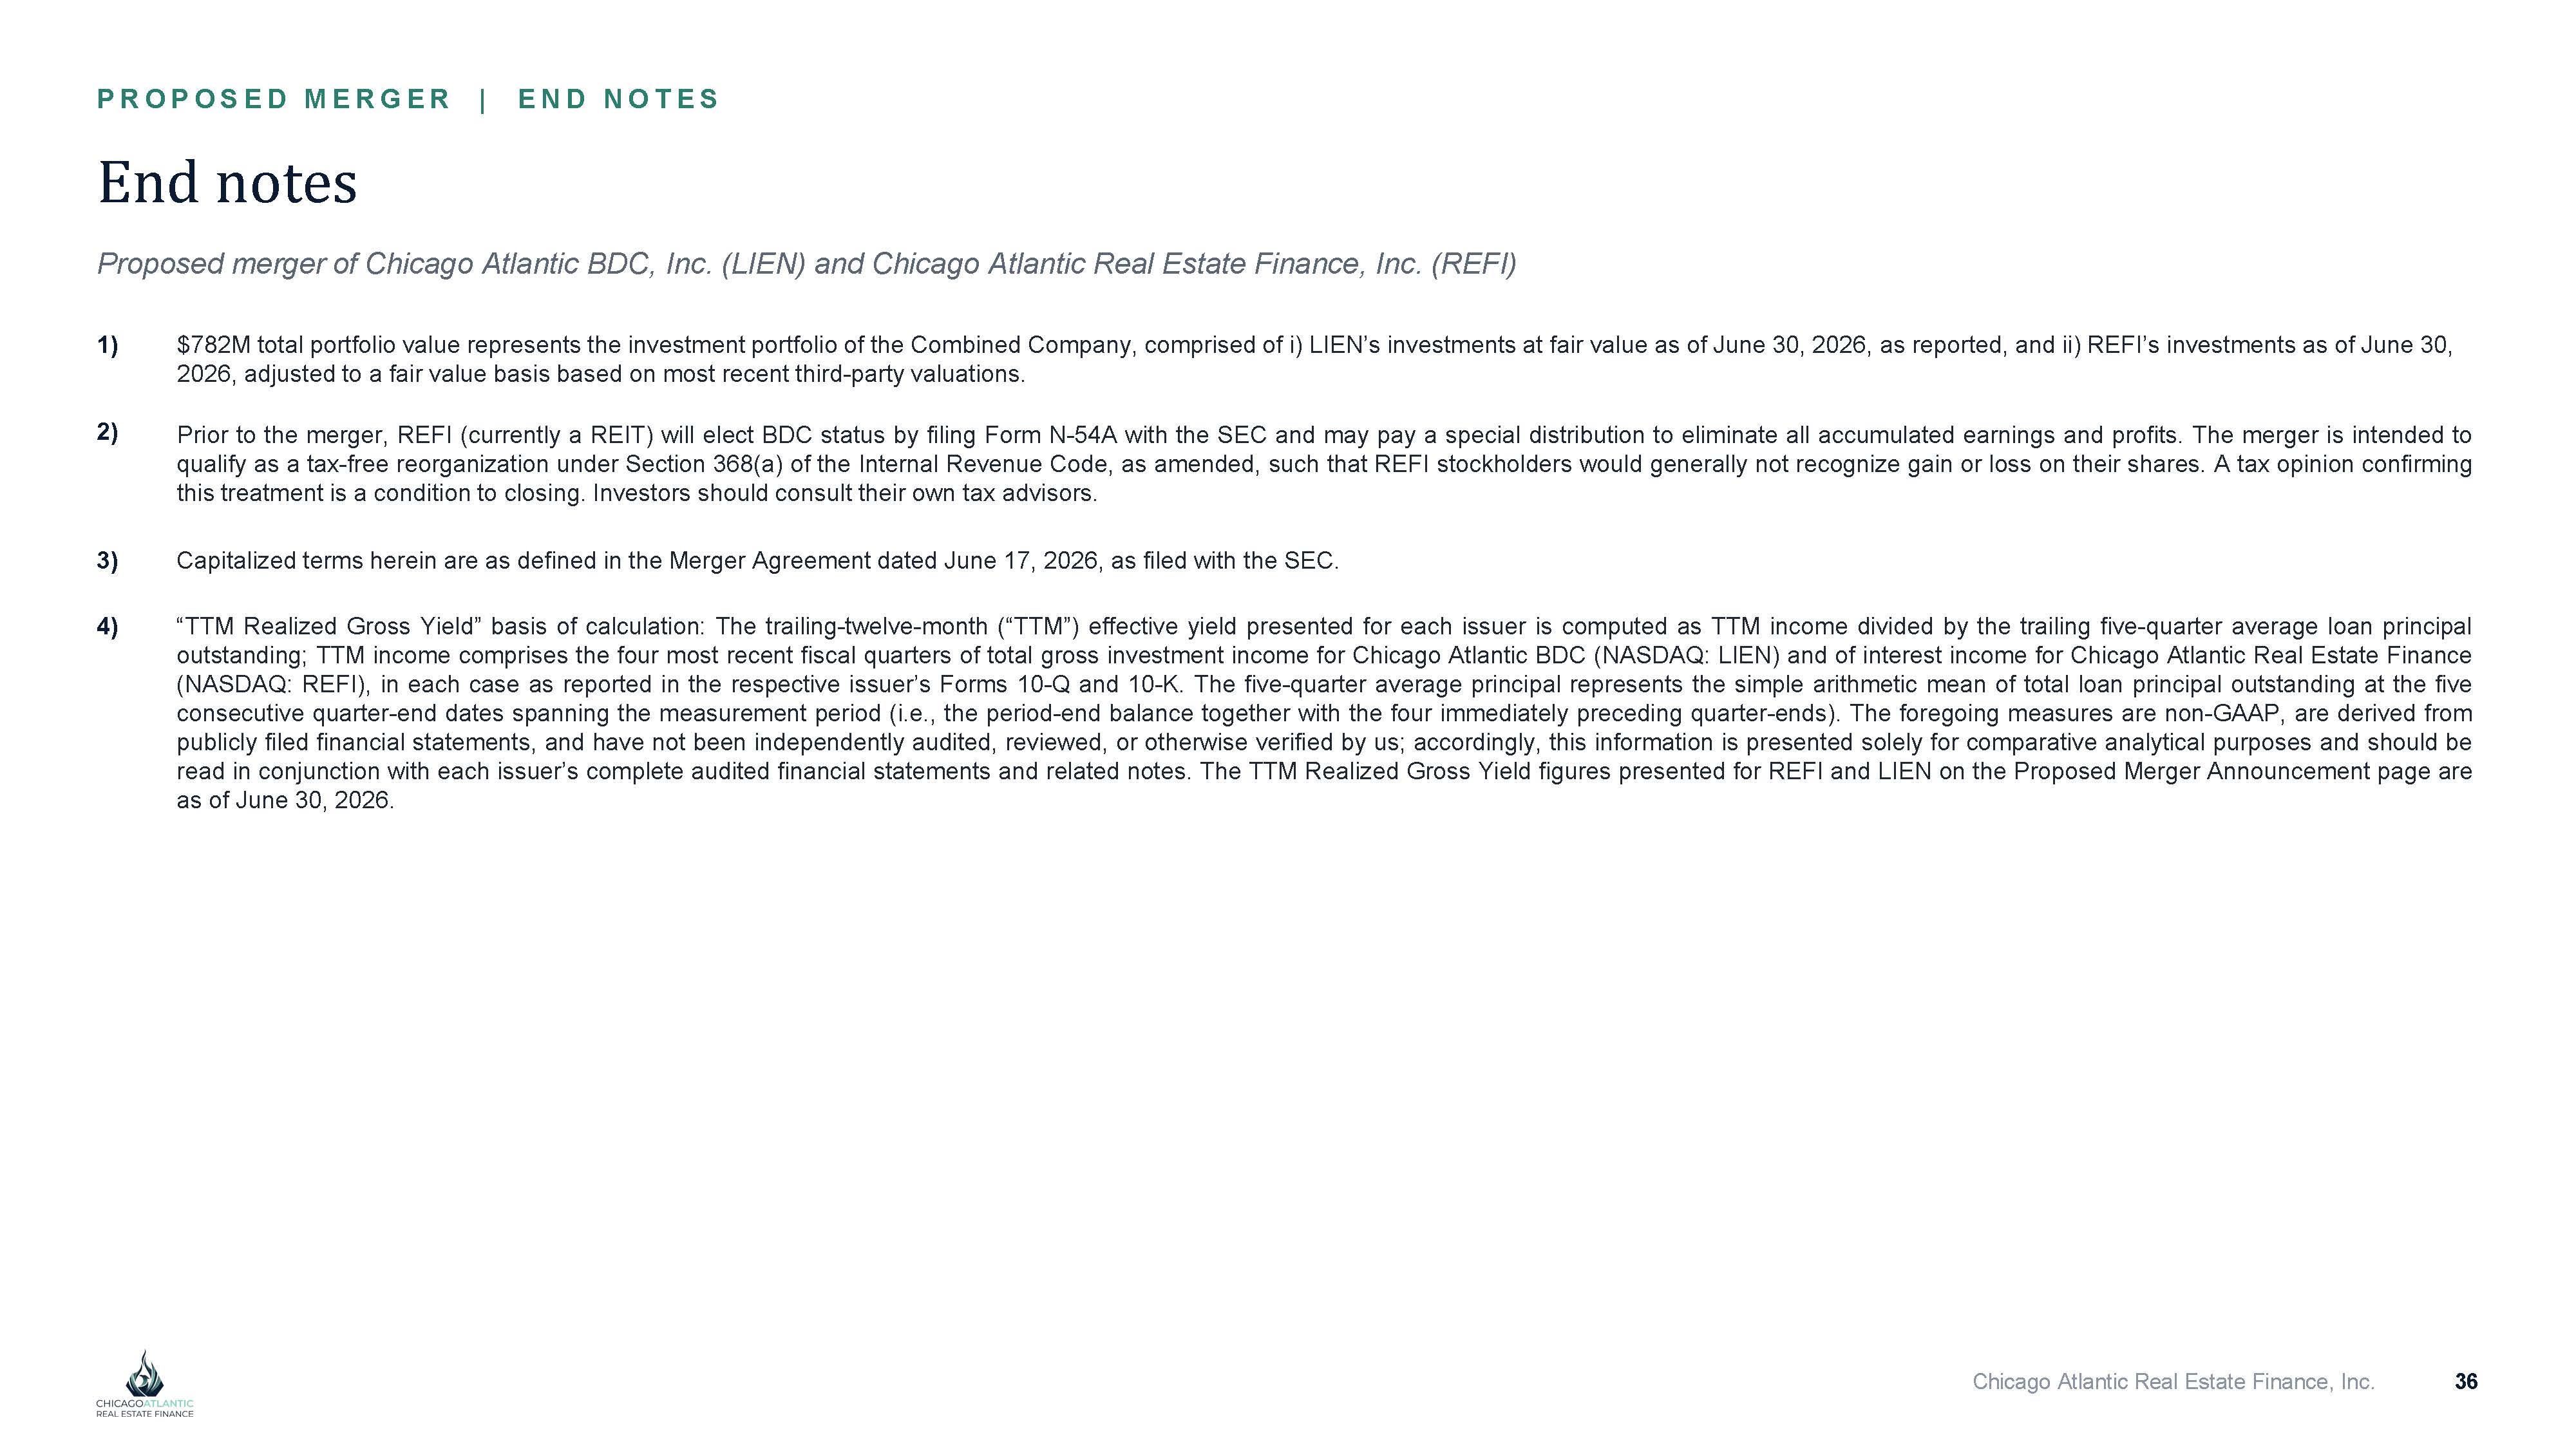
P R O P O S E D M E R G E R | E N D N O T E S Chicago Atlantic Real Estate Finance, Inc. 36 End notes Proposed merger of Chicago Atlantic BDC, Inc. (LIEN) and Chicago Atlantic Real Estate Finance, Inc. (REFI) 1) $782M total portfolio value represents the investment portfolio of the Combined Company, comprised of i) LIEN’s investments at fair value as of June 30, 2026, as reported, and ii) REFI’s investments as of June 30, 2026, adjusted to a fair value basis based on most recent third - party valuations. 2) Prior to the merger, REFI (currently a REIT) will elect BDC status by filing Form N - 54 A with the SEC and may pay a special distribution to eliminate all accumulated earnings and profits . The merger is intended to qualify as a tax - free reorganization under Section 368 (a) of the Internal Revenue Code, as amended, such that REFI stockholders would generally not recognize gain or loss on their shares . A tax opinion confirming this treatment is a condition to closing . Investors should consult their own tax advisors . 3) Capitalized terms herein are as defined in the Merger Agreement dated June 17, 2026, as filed with the SEC. 4) “TTM Realized Gross Yield” basis of calculation : The trailing - twelve - month (“TTM”) effective yield presented for each issuer is computed as TTM income divided by the trailing five - quarter average loan principal outstanding ; TTM income comprises the four most recent fiscal quarters of total gross investment income for Chicago Atlantic BDC (NASDAQ : LIEN) and of interest income for Chicago Atlantic Real Estate Finance (NASDAQ : REFI), in each case as reported in the respective issuer’s Forms 10 - Q and 10 - K . The five - quarter average principal represents the simple arithmetic mean of total loan principal outstanding at the five consecutive quarter - end dates spanning the measurement period (i . e . , the period - end balance together with the four immediately preceding quarter - ends) . The foregoing measures are non - GAAP, are derived from publicly filed financial statements, and have not been independently audited, reviewed, or otherwise verified by us ; accordingly, this information is presented solely for comparative analytical purposes and should be read in conjunction with each issuer’s complete audited financial statements and related notes . The TTM Realized Gross Yield figures presented for REFI and LIEN on the Proposed Merger Announcement page are as of June 30 , 2026 .
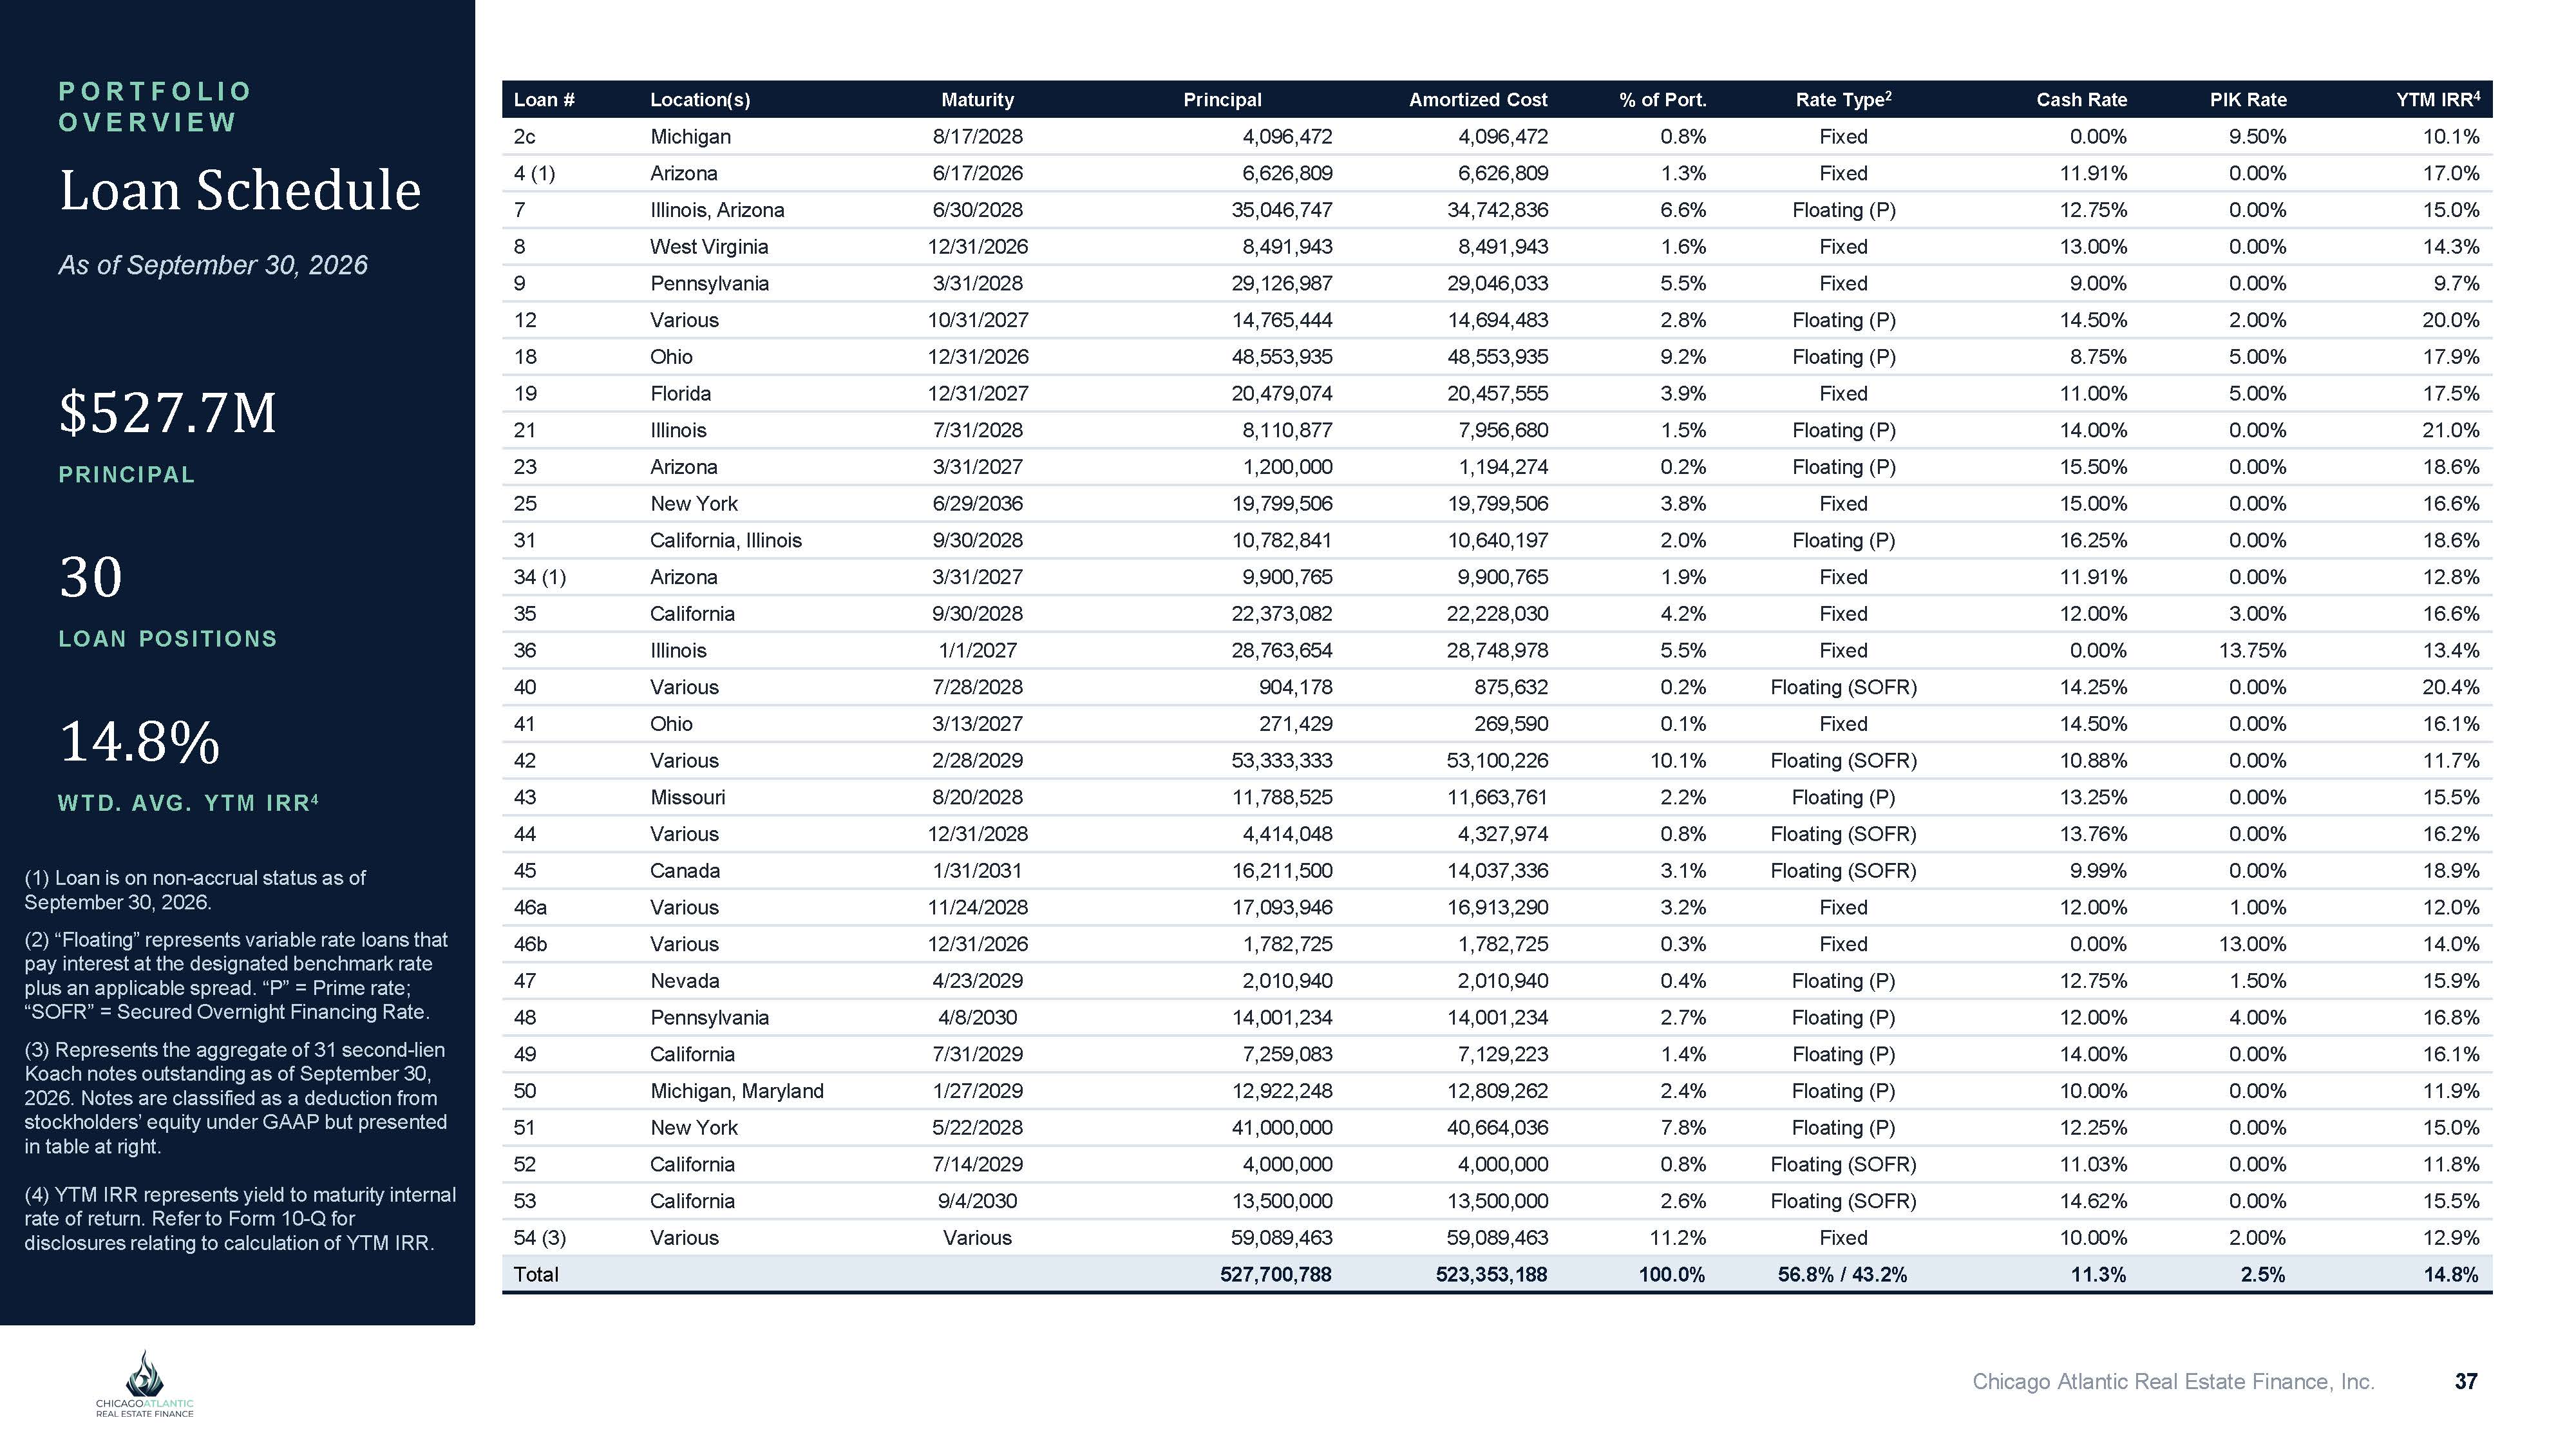
P O R T F O L I O O VER VI EW Chicago Atlantic Real Estate Finance, Inc. 37 Loan Schedule As of September 30, 2026 $527.7M P RI NCI P AL 30 LOAN P OS I TI ONS 14.8% W TD. AV G. YTM I RR 4 (1) Loan is on non - accrual status as of September 30, 2026. (2) “Floating” represents variable rate loans that pay interest at the designated benchmark rate plus an applicable spread. “P” = Prime rate; “SOFR” = Secured Overnight Financing Rate. (3) Represents the aggregate of 31 second - lien Koach notes outstanding as of September 30, 2026. Notes are classified as a deduction from stockholders’ equity under GAAP but presented in table at right. (4) YTM IRR represents yield to maturity internal rate of return. Refer to Form 10 - Q for disclosures relating to calculation of YTM IRR. YTM IRR 4 PIK Rate Cash Rate Rate Type 2 % of Port. Amortized Cost Principal Maturity Location(s) Loan # 10.1% 9.50% 0.00% Fixed 0.8% 4,096,472 4,096,472 8/17/2028 Michigan 2c 17.0% 0.00% 11.91% Fixed 1.3% 6,626,809 6,626,809 6/17/2026 Arizona 4 (1) 15.0% 0.00% 12.75% Floating (P) 6.6% 34,742,836 35,046,747 6/30/2028 Illinois, Arizona 7 14.3% 0.00% 13.00% Fixed 1.6% 8,491,943 8,491,943 12/31/2026 West Virginia 8 9.7% 0.00% 9.00% Fixed 5.5% 29,046,033 29,126,987 3/31/2028 Pennsylvania 9 20.0% 2.00% 14.50% Floating (P) 2.8% 14,694,483 14,765,444 10/31/2027 Various 12 17.9% 5.00% 8.75% Floating (P) 9.2% 48,553,935 48,553,935 12/31/2026 Ohio 18 17.5% 5.00% 11.00% Fixed 3.9% 20,457,555 20,479,074 12/31/2027 Florida 19 21.0% 0.00% 14.00% Floating (P) 1.5% 7,956,680 8,110,877 7/31/2028 Illinois 21 18.6% 0.00% 15.50% Floating (P) 0.2% 1,194,274 1,200,000 3/31/2027 Arizona 23 16.6% 0.00% 15.00% Fixed 3.8% 19,799,506 19,799,506 6/29/2036 New York 25 18.6% 0.00% 16.25% Floating (P) 2.0% 10,640,197 10,782,841 9/30/2028 California, Illinois 31 12.8% 0.00% 11.91% Fixed 1.9% 9,900,765 9,900,765 3/31/2027 Arizona 34 (1) 16.6% 3.00% 12.00% Fixed 4.2% 22,228,030 22,373,082 9/30/2028 California 35 13.4% 13.75% 0.00% Fixed 5.5% 28,748,978 28,763,654 1/1/2027 Illinois 36 20.4% 0.00% 14.25% Floating (SOFR) 0.2% 875,632 904,178 7/28/2028 Various 40 16.1% 0.00% 14.50% Fixed 0.1% 269,590 271,429 3/13/2027 Ohio 41 11.7% 0.00% 10.88% Floating (SOFR) 10.1% 53,100,226 53,333,333 2/28/2029 Various 42 15.5% 0.00% 13.25% Floating (P) 2.2% 11,663,761 11,788,525 8/20/2028 Missouri 43 16.2% 0.00% 13.76% Floating (SOFR) 0.8% 4,327,974 4,414,048 12/31/2028 Various 44 18.9% 0.00% 9.99% Floating (SOFR) 3.1% 14,037,336 16,211,500 1/31/2031 Canada 45 12.0% 1.00% 12.00% Fixed 3.2% 16,913,290 17,093,946 11/24/2028 Various 46a 14.0% 13.00% 0.00% Fixed 0.3% 1,782,725 1,782,725 12/31/2026 Various 46b 15.9% 1.50% 12.75% Floating (P) 0.4% 2,010,940 2,010,940 4/23/2029 Nevada 47 16.8% 4.00% 12.00% Floating (P) 2.7% 14,001,234 14,001,234 4/8/2030 Pennsylvania 48 16.1% 0.00% 14.00% Floating (P) 1.4% 7,129,223 7,259,083 7/31/2029 California 49 11.9% 0.00% 10.00% Floating (P) 2.4% 12,809,262 12,922,248 1/27/2029 Michigan, Maryland 50 15.0% 0.00% 12.25% Floating (P) 7.8% 40,664,036 41,000,000 5/22/2028 New York 51 11.8% 0.00% 11.03% Floating (SOFR) 0.8% 4,000,000 4,000,000 7/14/2029 California 52 15.5% 0.00% 14.62% Floating (SOFR) 2.6% 13,500,000 13,500,000 9/4/2030 California 53 12.9% 2.00% 10.00% Fixed 11.2% 59,089,463 59,089,463 Various Various 54 (3) 14.8% 2.5% 11.3% 56.8% / 43.2% 100.0% 523,353,188 527,700,788 Total
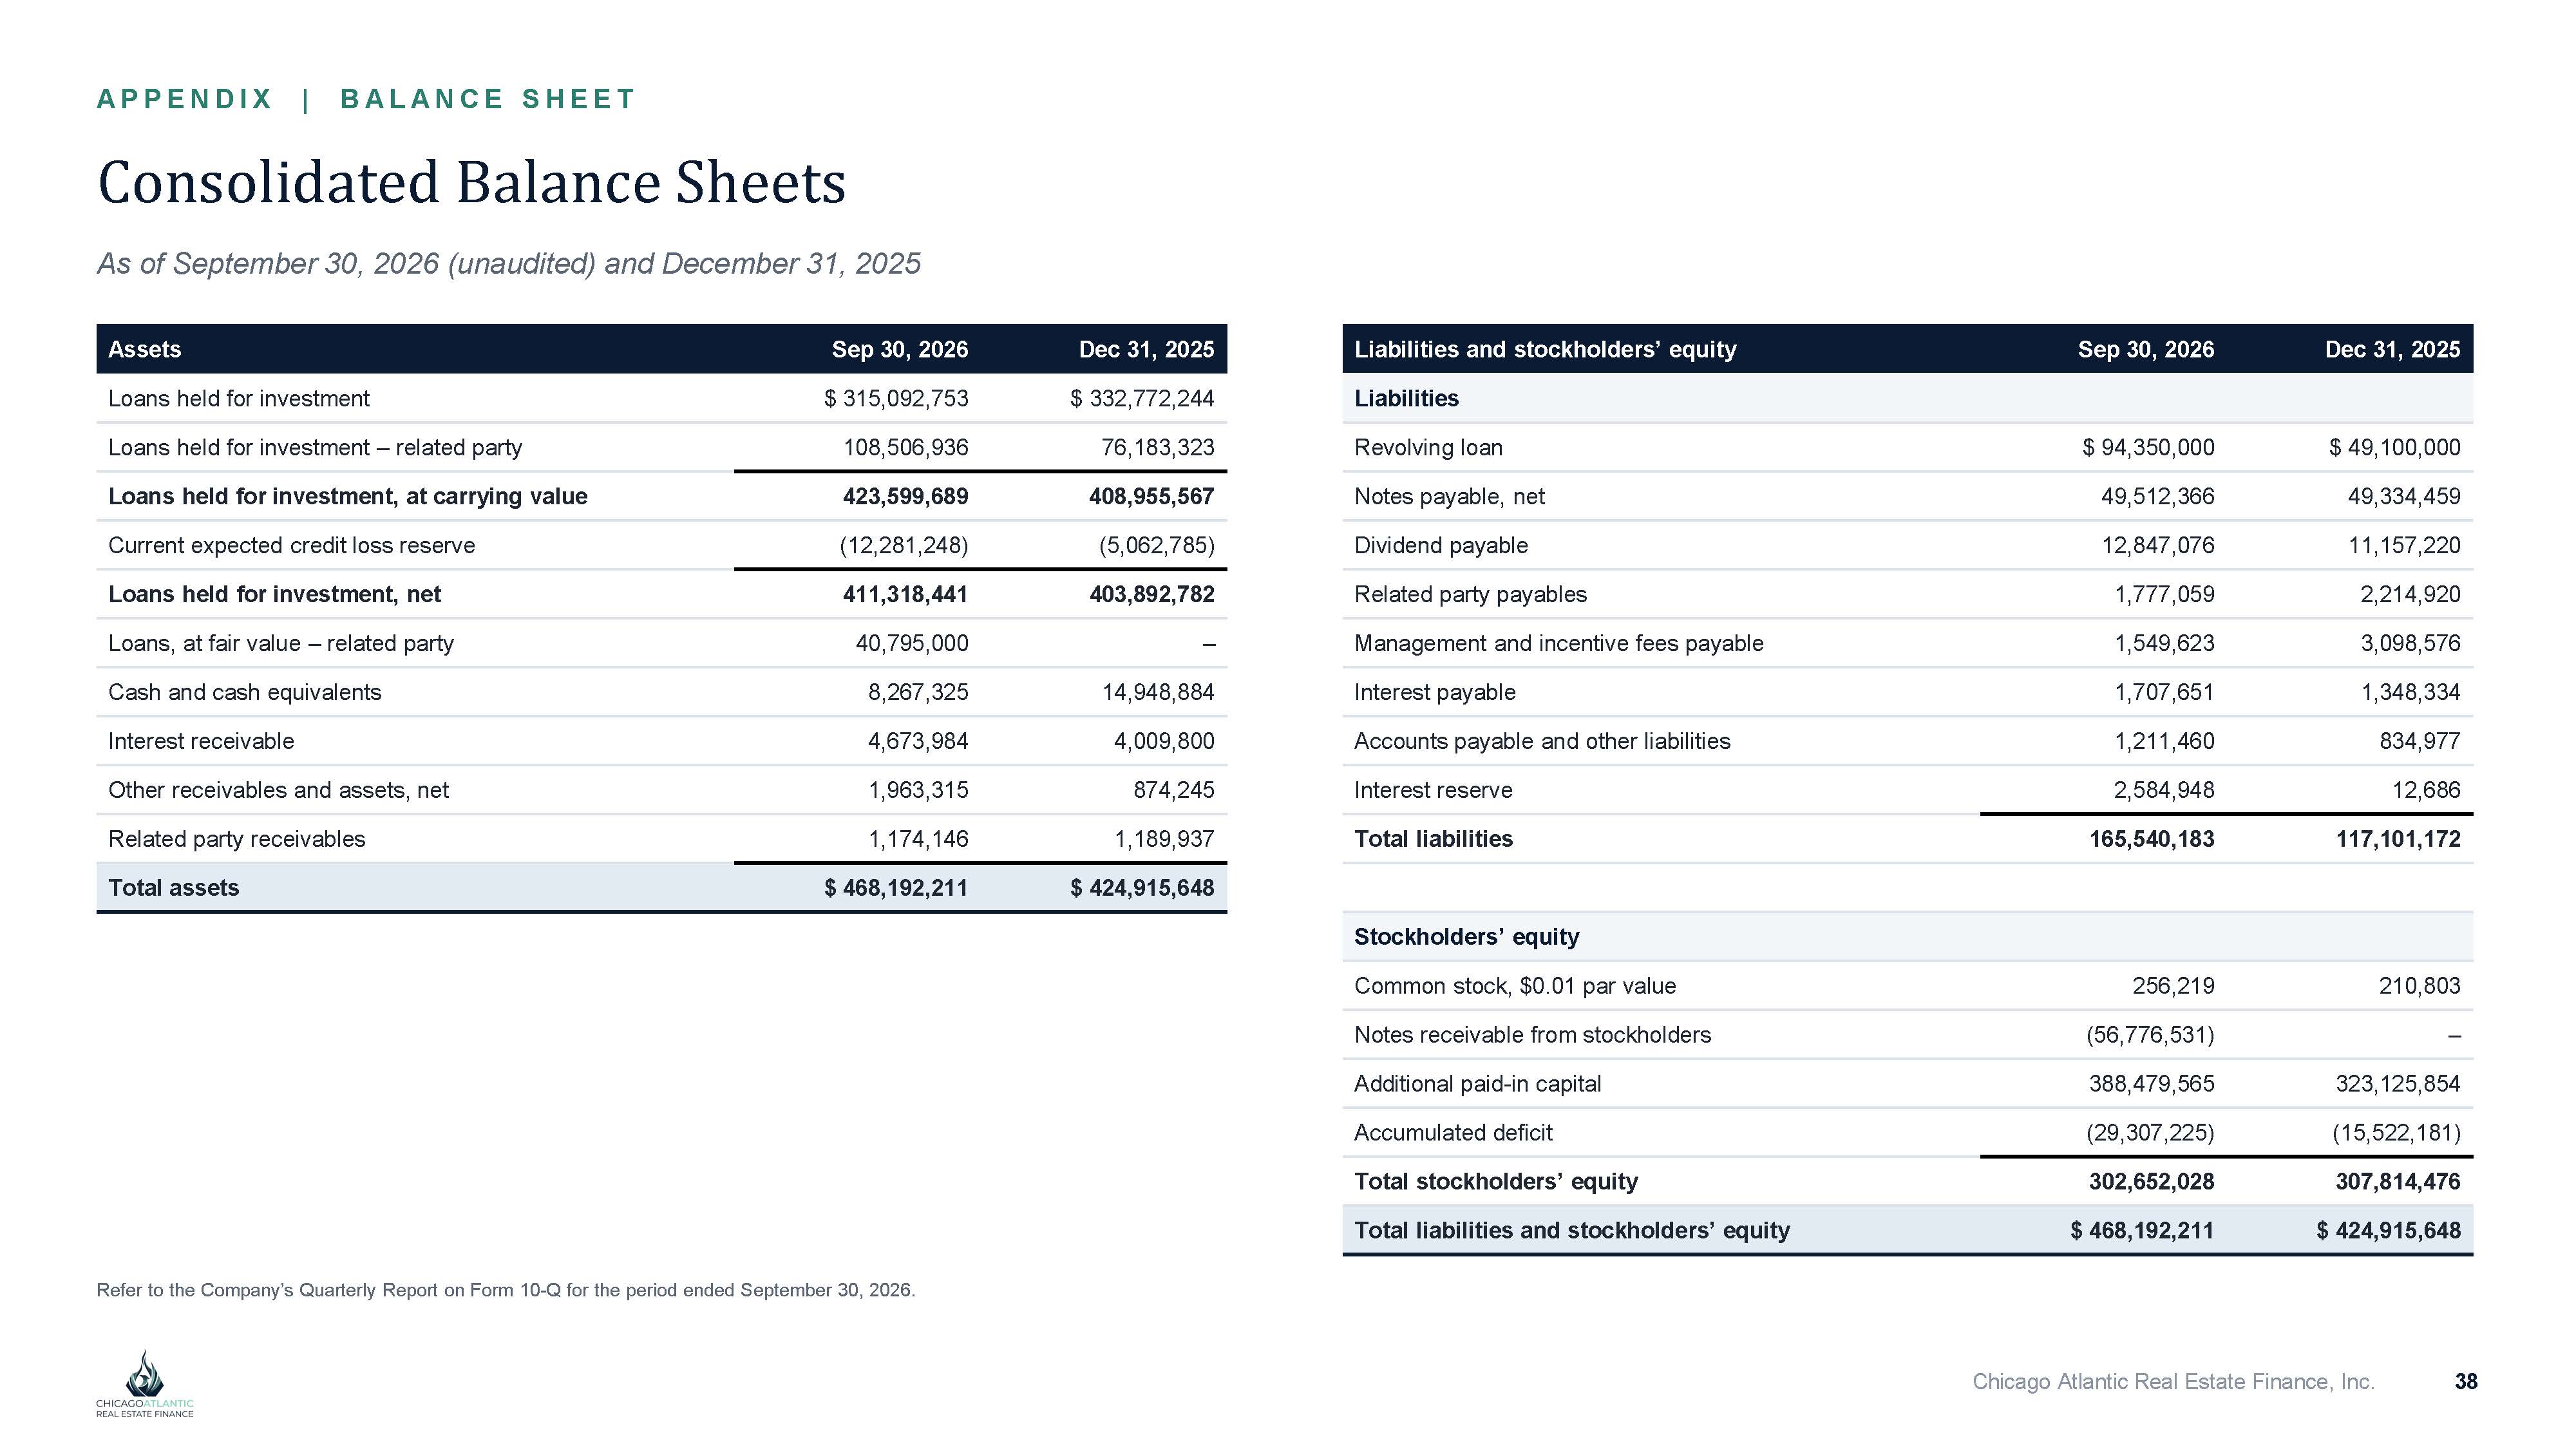
A P P E N D I X | B A L A N C E S H E E T Chicago Atlantic Real Estate Finance, Inc. 38 Consolidated Balance Sheets As of September 30, 2026 (unaudited) and December 31, 2025 Dec 31, 2025 Sep 30, 2026 Assets $ 332,772,244 $ 315,092,753 Loans held for investment 76,183,323 108,506,936 Loans held for investment – related party 408,955,567 423,599,689 Loans held for investment, at carrying value (5,062,785) (12,281,248) Current expected credit loss reserve 403,892,782 411,318,441 Loans held for investment, net – 40,795,000 Loans, at fair value – related party 14,948,884 8,267,325 Cash and cash equivalents 4,009,800 4,673,984 Interest receivable 874,245 1,963,315 Other receivables and assets, net 1,189,937 1,174,146 Related party receivables $ 424,915,648 $ 468,192,211 Total assets Dec 31, 2025 Sep 30, 2026 Liabilities and stockholders’ equity Liabilities $ 49,100,000 $ 94,350,000 Revolving loan 49,334,459 49,512,366 Notes payable, net 11,157,220 12,847,076 Dividend payable 2,214,920 1,777,059 Related party payables 3,098,576 1,549,623 Management and incentive fees payable 1,348,334 1,707,651 Interest payable 834,977 1,211,460 Accounts payable and other liabilities 12,686 2,584,948 Interest reserve 117,101,172 165,540,183 Total liabilities Stockholders’ equity 210,803 256,219 Common stock, $0.01 par value – (56,776,531) Notes receivable from stockholders 323,125,854 388,479,565 Additional paid - in capital (15,522,181) (29,307,225) Accumulated deficit 307,814,476 302,652,028 Total stockholders’ equity $ 424,915,648 $ 468,192,211 Total liabilities and stockholders’ equity Refer to the Company’s Quarterly Report on Form 10 - Q for the period ended September 30, 2026.
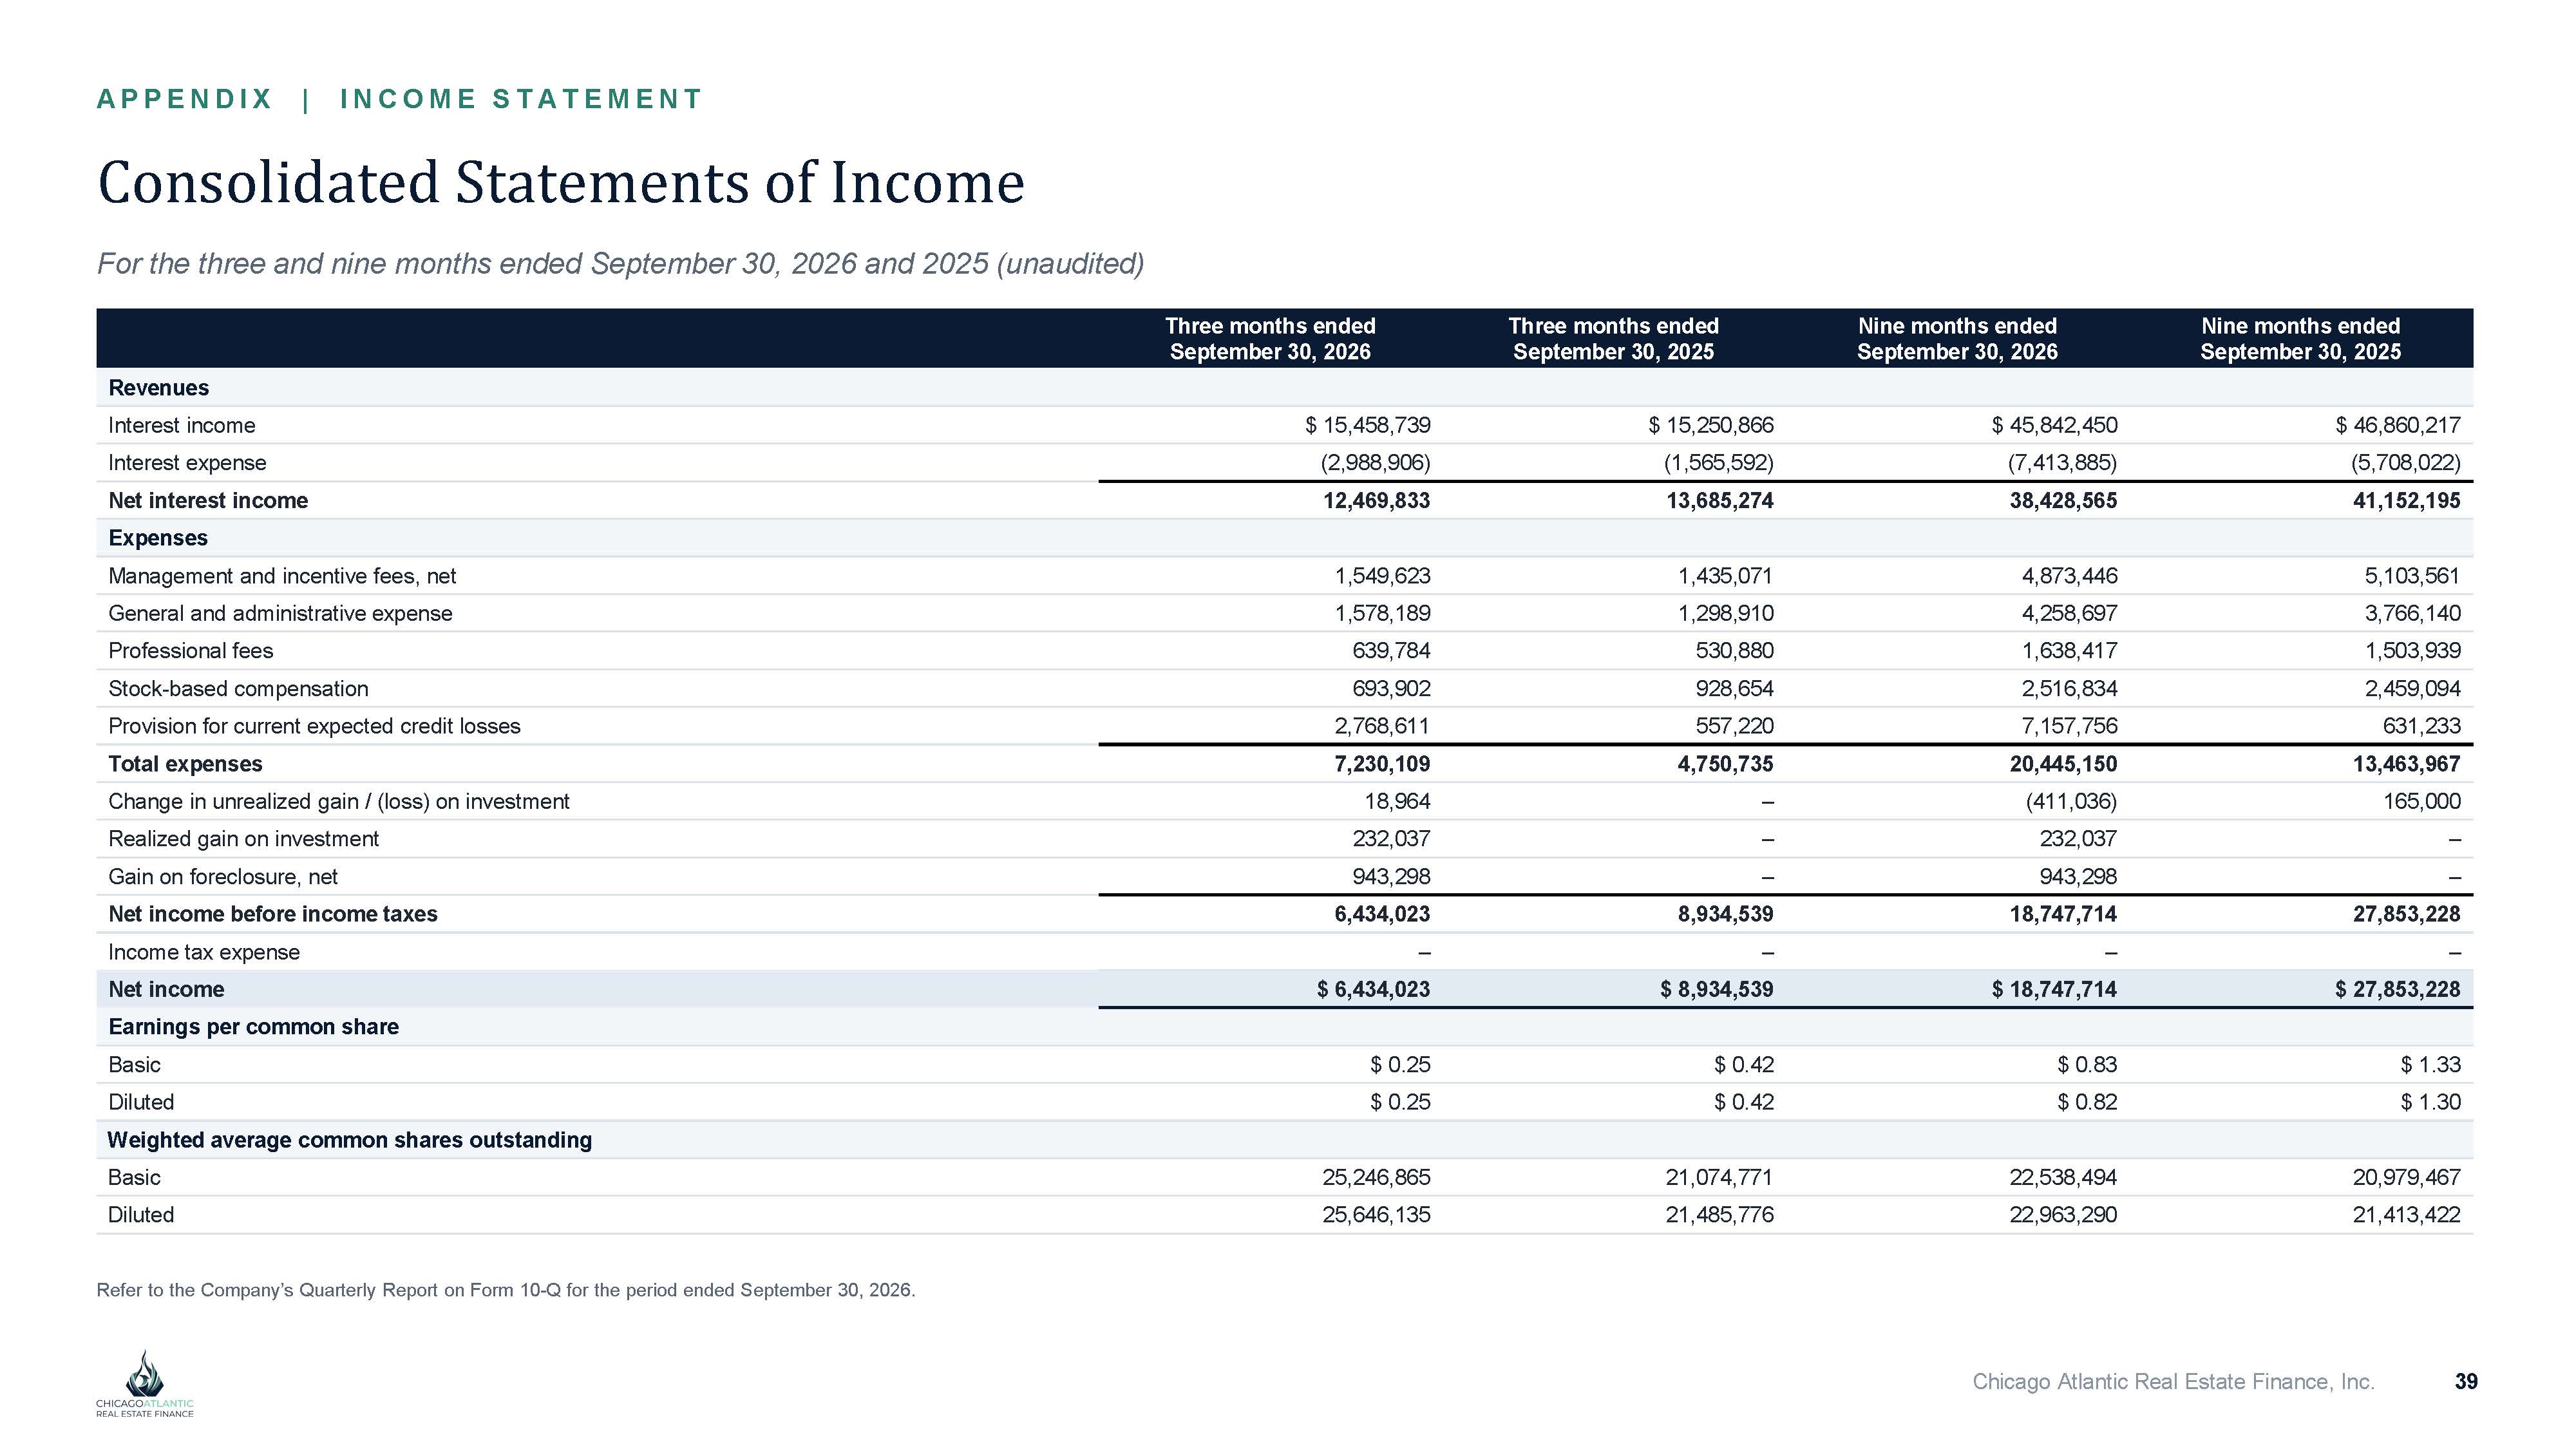
A P P E N D I X | I N C O M E S T A T E M E N T Chicago Atlantic Real Estate Finance, Inc. 39 Consolidated Statements of Income For the three and nine months ended September 30, 2026 and 2025 (unaudited) Nine months ended September 30, 2025 Nine months ended September 30, 2026 Three months ended September 30, 2025 Three months ended September 30, 2026 Revenues $ 46,860,217 $ 45,842,450 $ 15,250,866 $ 15,458,739 Interest income (5,708,022) (7,413,885) (1,565,592) (2,988,906) Interest expense 41,152,195 38,428,565 13,685,274 12,469,833 Net interest income Expenses 5,103,561 4,873,446 1,435,071 1,549,623 Management and incentive fees, net 3,766,140 4,258,697 1,298,910 1,578,189 General and administrative expense 1,503,939 1,638,417 530,880 639,784 Professional fees 2,459,094 2,516,834 928,654 693,902 Stock - based compensation 631,233 7,157,756 557,220 2,768,611 Provision for current expected credit losses 13,463,967 20,445,150 4,750,735 7,230,109 Total expenses 165,000 (411,036) – 18,964 Change in unrealized gain / (loss) on investment – 232,037 – 232,037 Realized gain on investment – 943,298 – 943,298 Gain on foreclosure, net 27,853,228 18,747,714 8,934,539 6,434,023 Net income before income taxes – – – – Income tax expense $ 27,853,228 $ 18,747,714 $ 8,934,539 $ 6,434,023 Net income Earnings per common share $ 1.33 $ 0.83 $ 0.42 $ 0.25 Basic $ 1.30 $ 0.82 $ 0.42 $ 0.25 Diluted Weighted average common shares outstanding 20,979,467 22,538,494 21,074,771 25,246,865 Basic 21,413,422 22,963,290 21,485,776 25,646,135 Diluted Refer to the Company’s Quarterly Report on Form 10 - Q for the period ended September 30, 2026.
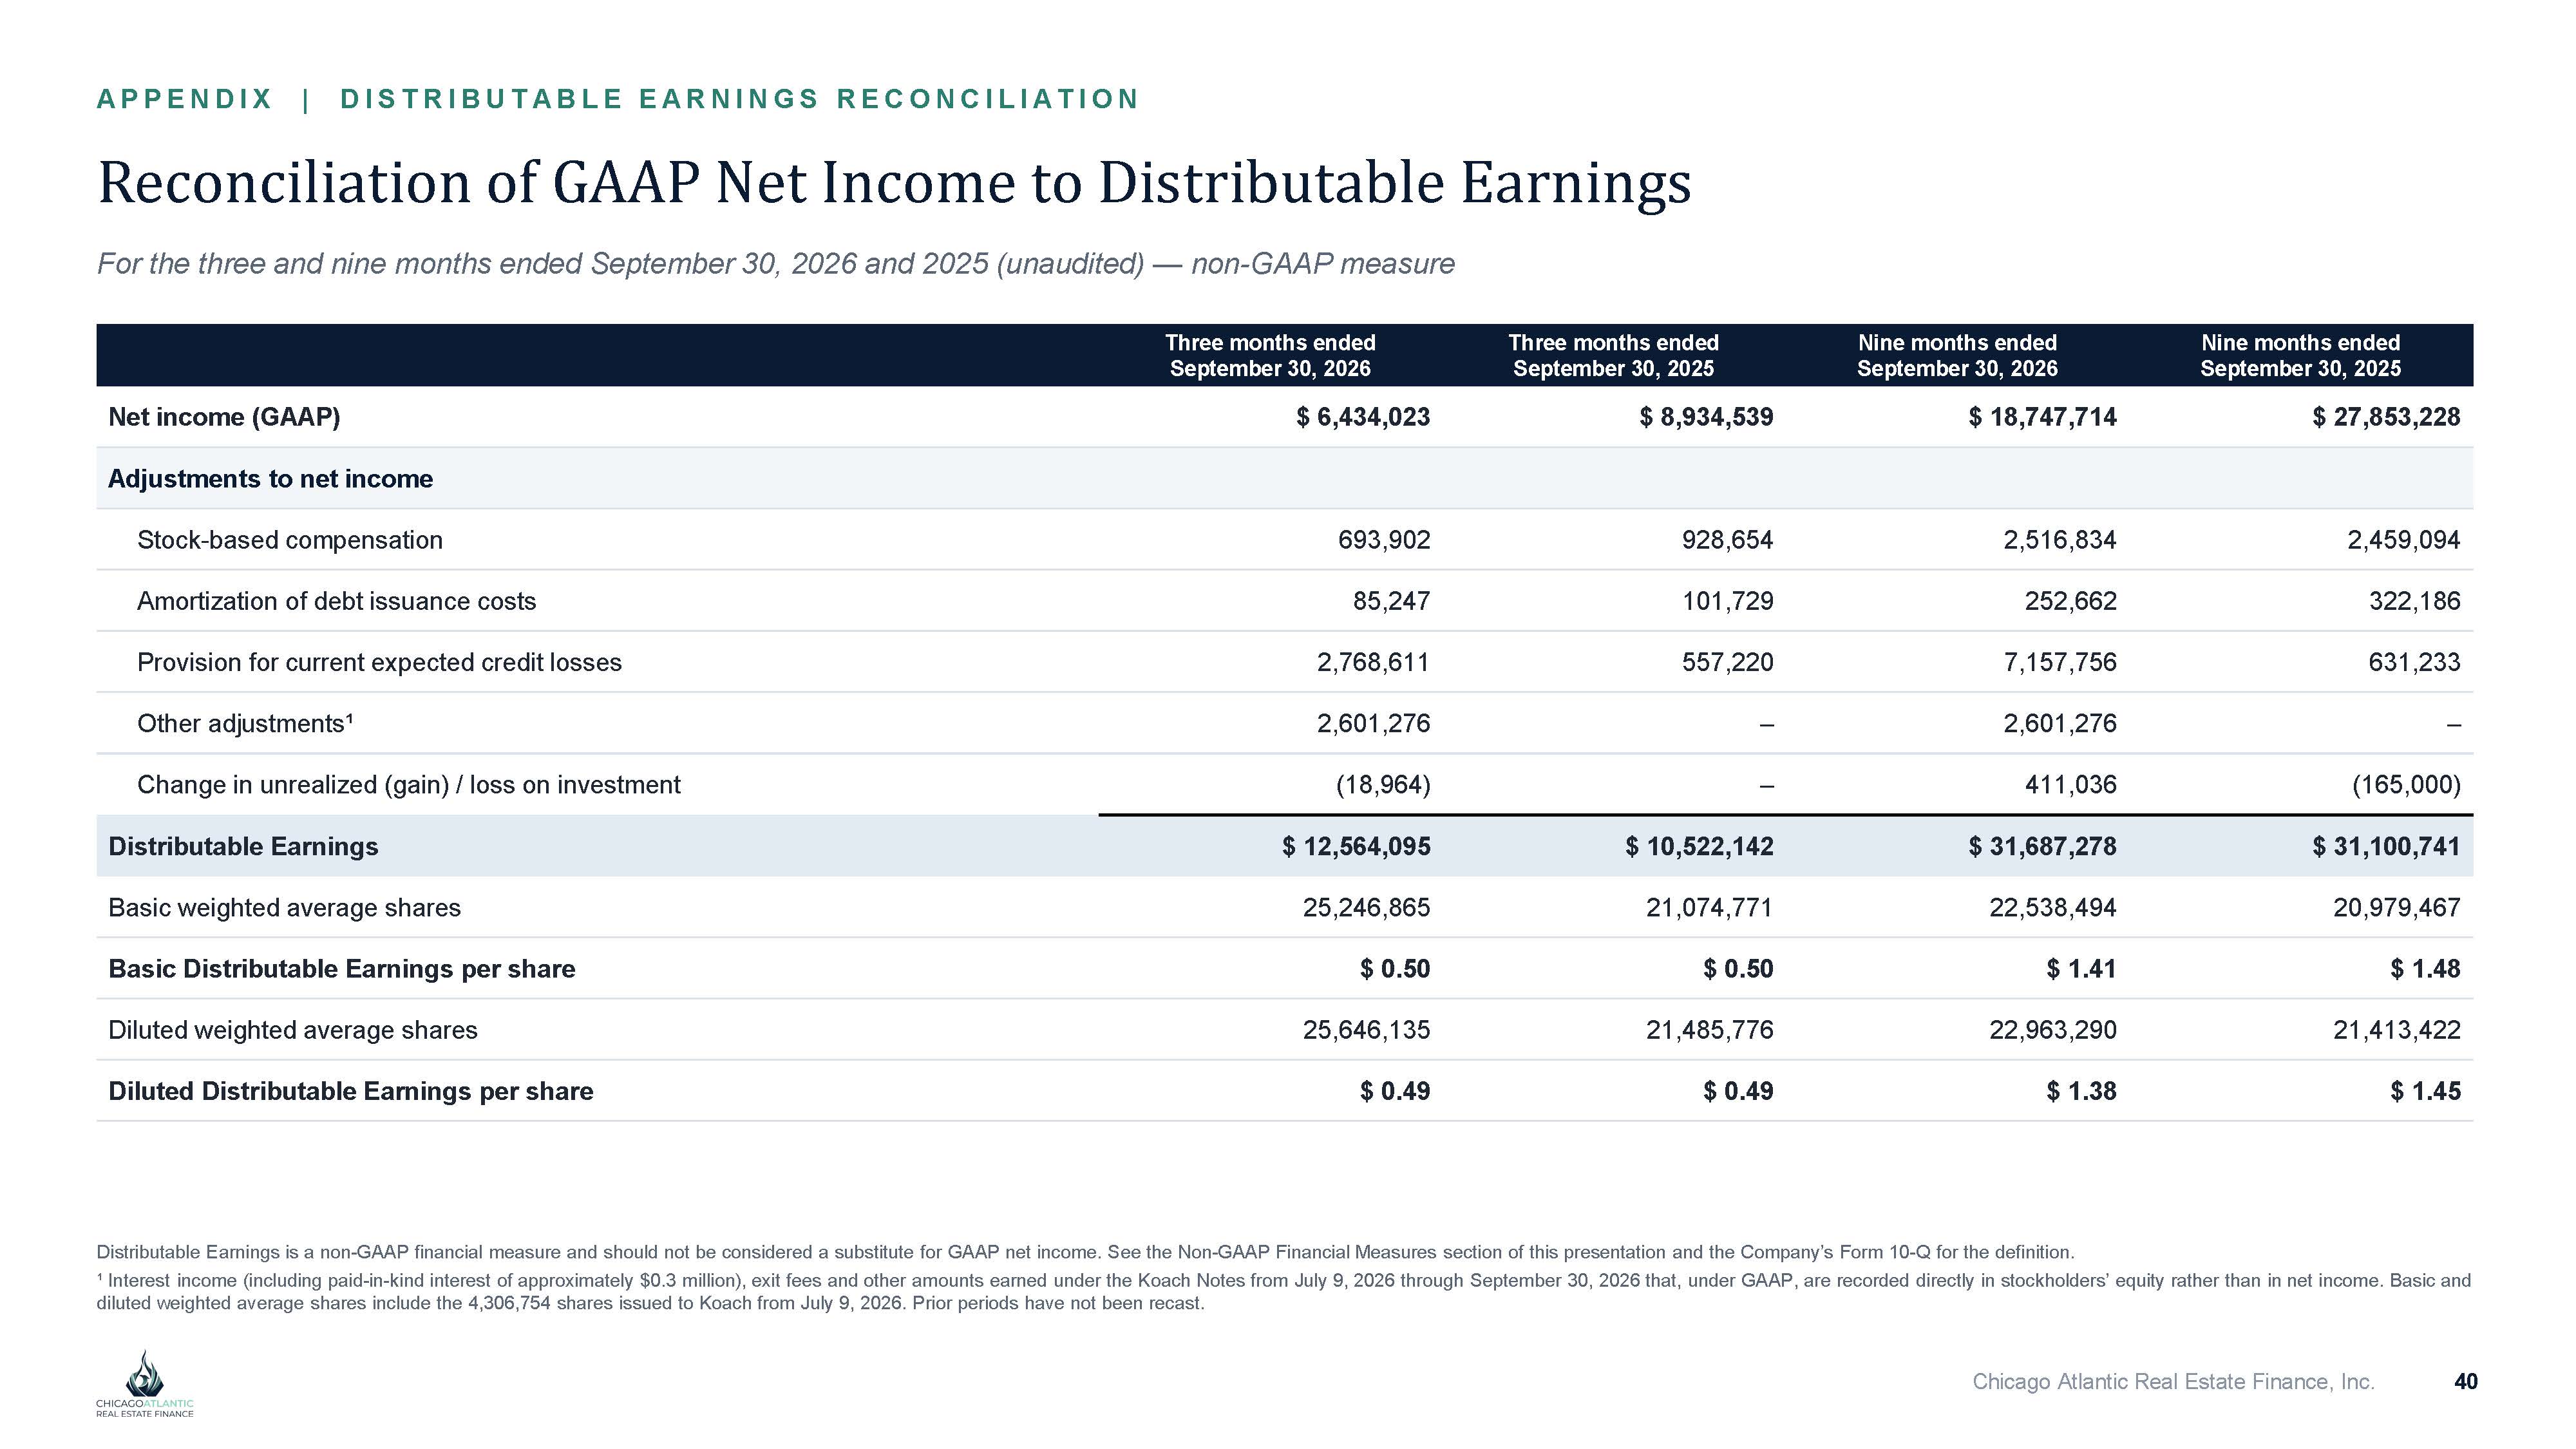
A P P E NDI X | DI S T RI BUT A BL E E A RNI NG S RE CO NCI L I A T I O N Chicago Atlantic Real Estate Finance, Inc. 40 Reconciliation of GAAP Net Income to Distributable Earnings For the three and nine months ended September 30, 2026 and 2025 (unaudited) — non - GAAP measure Nine months ended September 30, 2025 Nine months ended September 30, 2026 Three months ended September 30, 2025 Three months ended September 30, 2026 $ 27,853,228 $ 18,747,714 $ 8,934,539 $ 6,434,023 Net income (GAAP) Adjustments to net income 2,459,094 2,516,834 928,654 693,902 Stock - based compensation 322,186 252,662 101,729 85,247 Amortization of debt issuance costs 631,233 7,157,756 557,220 2,768,611 Provision for current expected credit losses – 2,601,276 – 2,601,276 Other adjustments¹ (165,000) 411,036 – (18,964) Change in unrealized (gain) / loss on investment $ 31,100,741 $ 31,687,278 $ 10,522,142 $ 12,564,095 Distributable Earnings 20,979,467 22,538,494 21,074,771 25,246,865 Basic weighted average shares $ 1.48 $ 1.41 $ 0.50 $ 0.50 Basic Distributable Earnings per share 21,413,422 22,963,290 21,485,776 25,646,135 Diluted weighted average shares $ 1.45 $ 1.38 $ 0.49 $ 0.49 Diluted Distributable Earnings per share Distributable Earnings is a non - GAAP financial measure and should not be considered a substitute for GAAP net income. See the Non - GAAP Financial Measures section of this presentation and the Company’s Form 10 - Q for the definition. ¹ Interest income (including paid - in - kind interest of approximately $0.3 million), exit fees and other amounts earned under the Koach Notes from July 9, 2026 through September 30, 2026 that, under GAAP, are recorded directly in stockholders’ equity rather than in net income. Basic and diluted weighted average shares include the 4,306,754 shares issued to Koach from July 9, 2026. Prior periods have not been recast.