What were the Fund costs for the last year?
(based on a hypothetical $10,000 investment)
|
Class Name
|
Costs of a $10,000 investment
|
Costs paid as a percentage of a $10,000 investment
|
|---|---|---|
|
Green California Tax-free Income Fund, Investor Class
|
$83
|
0.82%
|
What affected the Fund's performance this period?
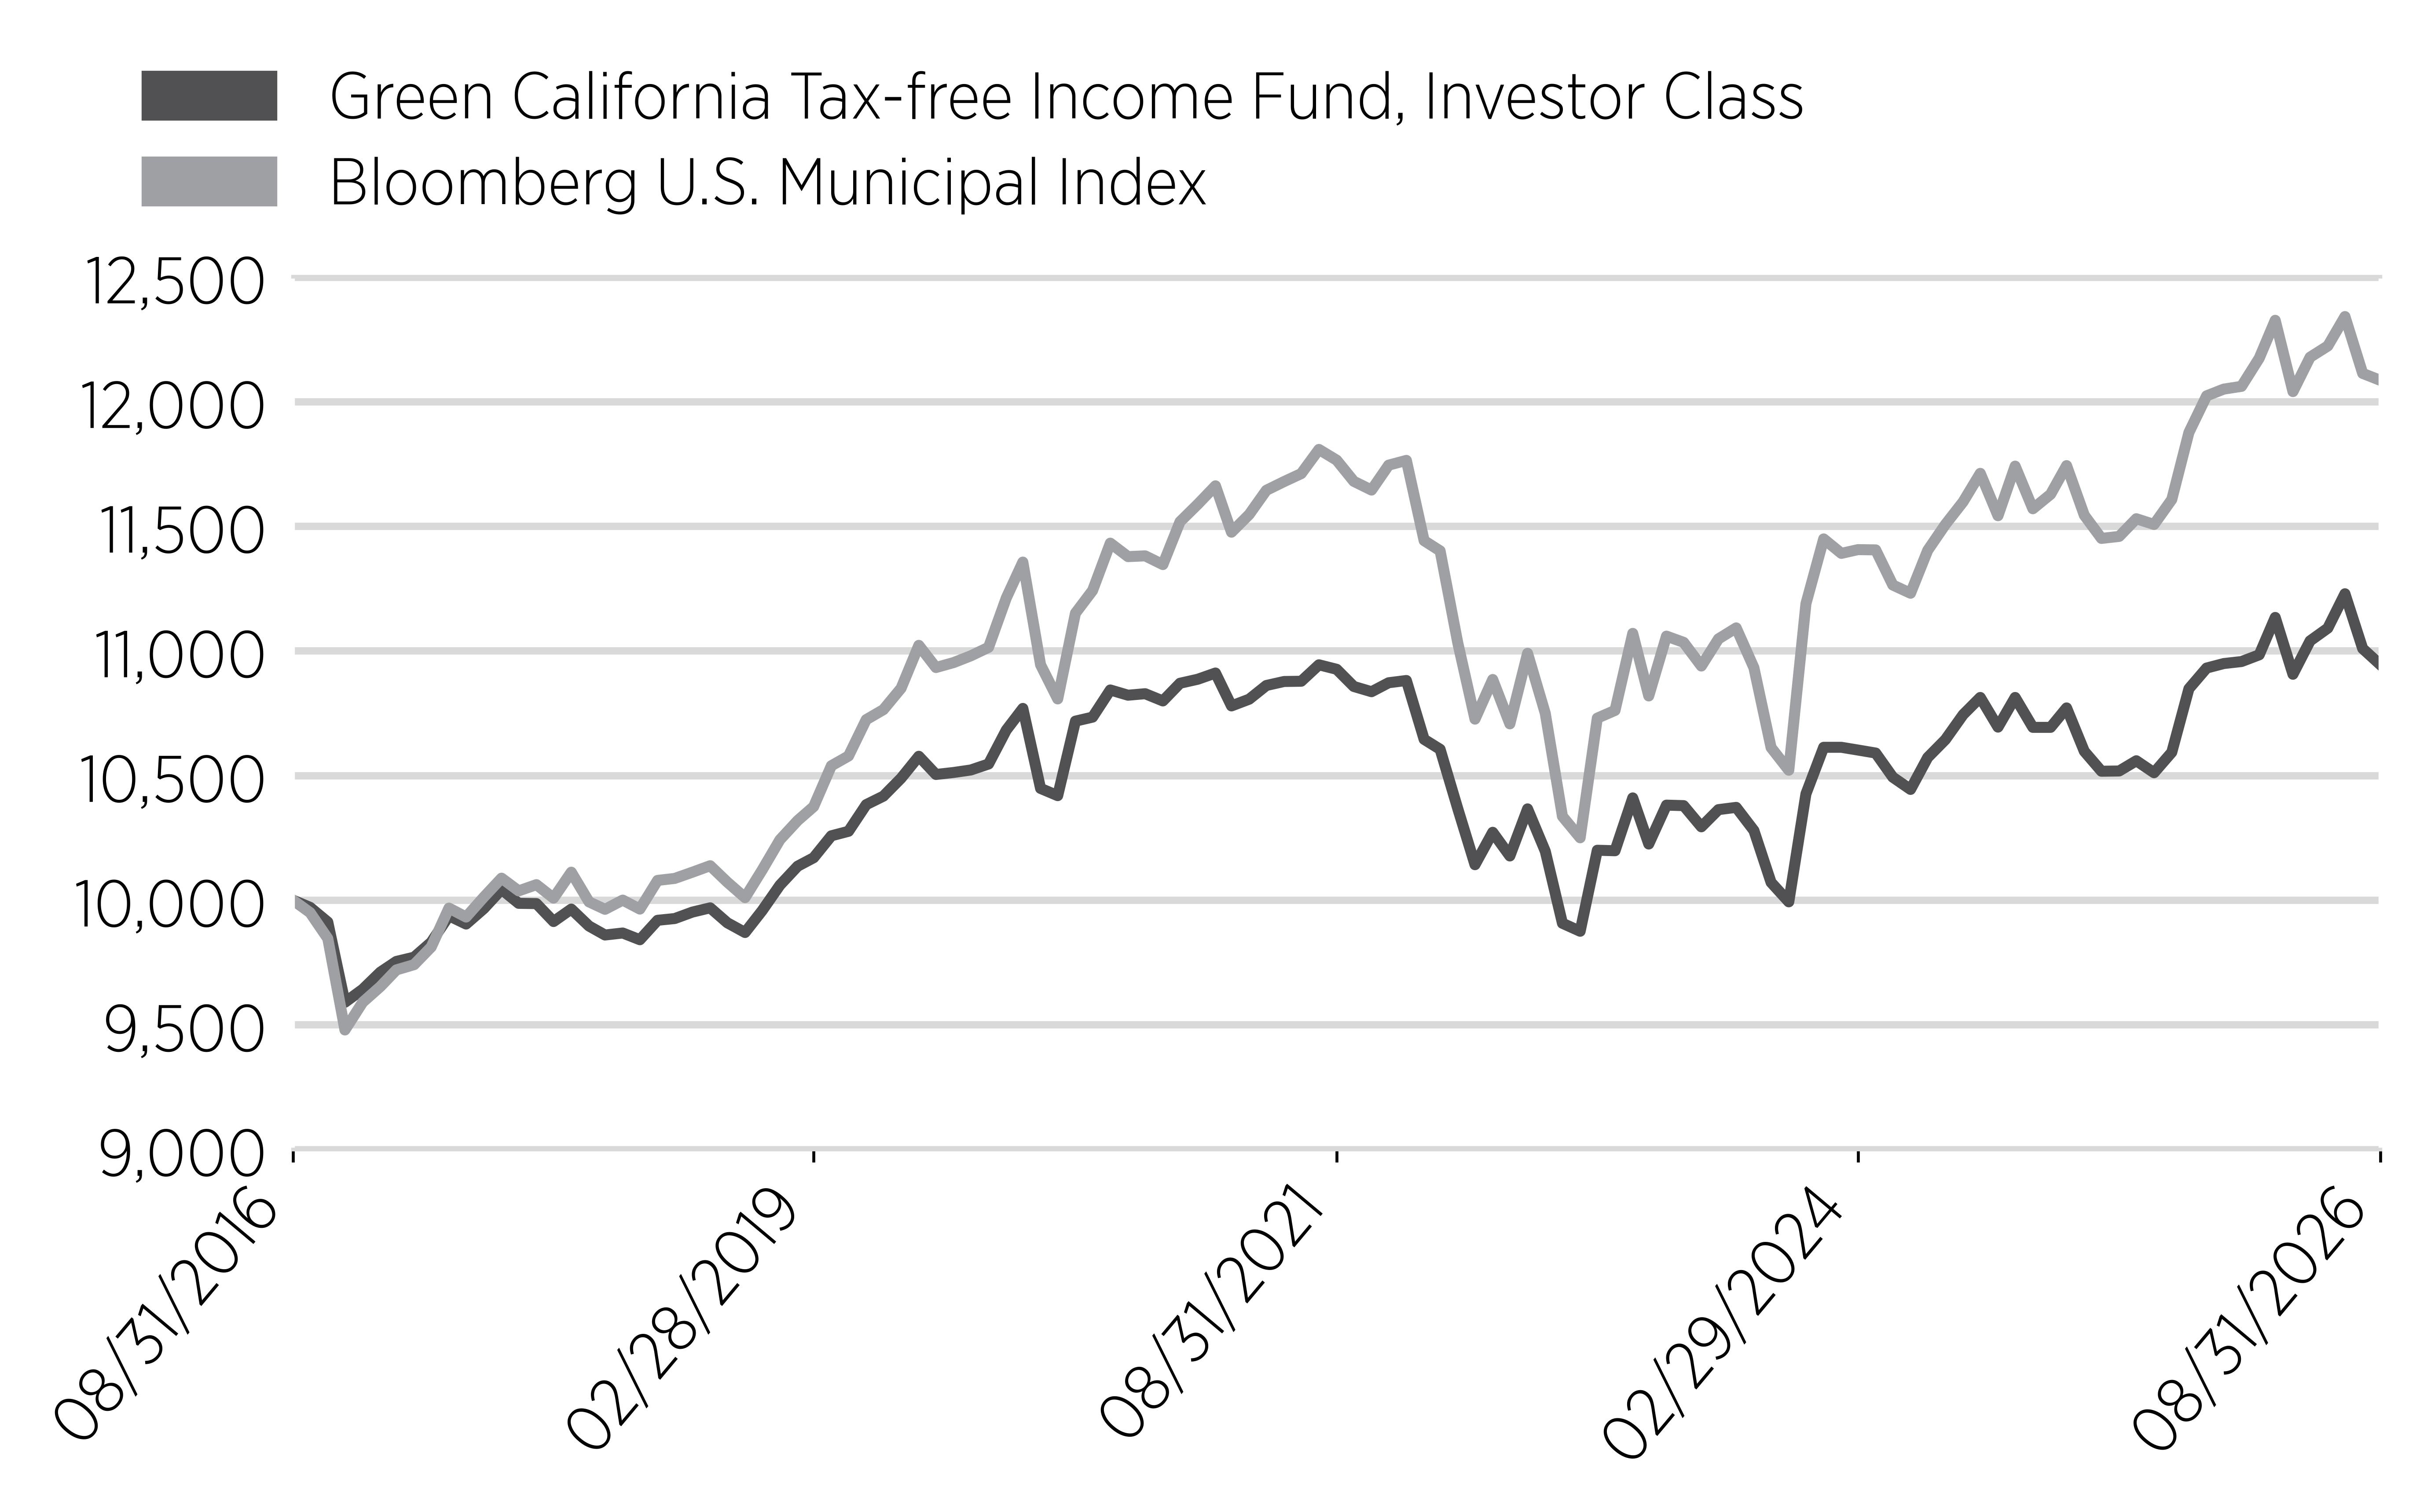
- The 3.31% return on the Fund for the year ended 8/31/26 underperformed the 4.12% return on the Bloomberg US Municipal Index (Ticker: LMBITR).
- Of note, in the period from September 1, 2025, through calendar year end 12/31, the Fund underperformed the index 3.43% versus 3.92%. This was a period of relatively steady interest rates, so the longer duration of the Index and resulting higher yields caused the Fund to lag.
- Adjustments to the Fund portfolio in early calendar 2026 lengthened the portfolio's duration and performance generally tracked the index for the balance of the fiscal year, a period characterized by sharply higher interest rates.
Cumulative Performance
(based on a hypothetical $10,000 investment)
Annual Performance
|
Annual Performance
|
1 Year
|
5 Year
|
10 Year
|
|---|---|---|---|
|
Green California Tax-free Income Fund,
Investor Class
|
3.31%
|
0.03%
|
0.91%
|
|
Bloomberg U.S. Municipal Index
|
4.12%
|
0.54%
|
1.91%
|
Key Fund Statistics
(as of August 31, 2026)
|
Net Assets
|
$33,023,031
|
|
Total Number of Portfolio Holdings
|
39
|
|
Total Advisory Fees Paid
|
$165,526
|
|
Portfolio Turnover Rate
|
55%
|
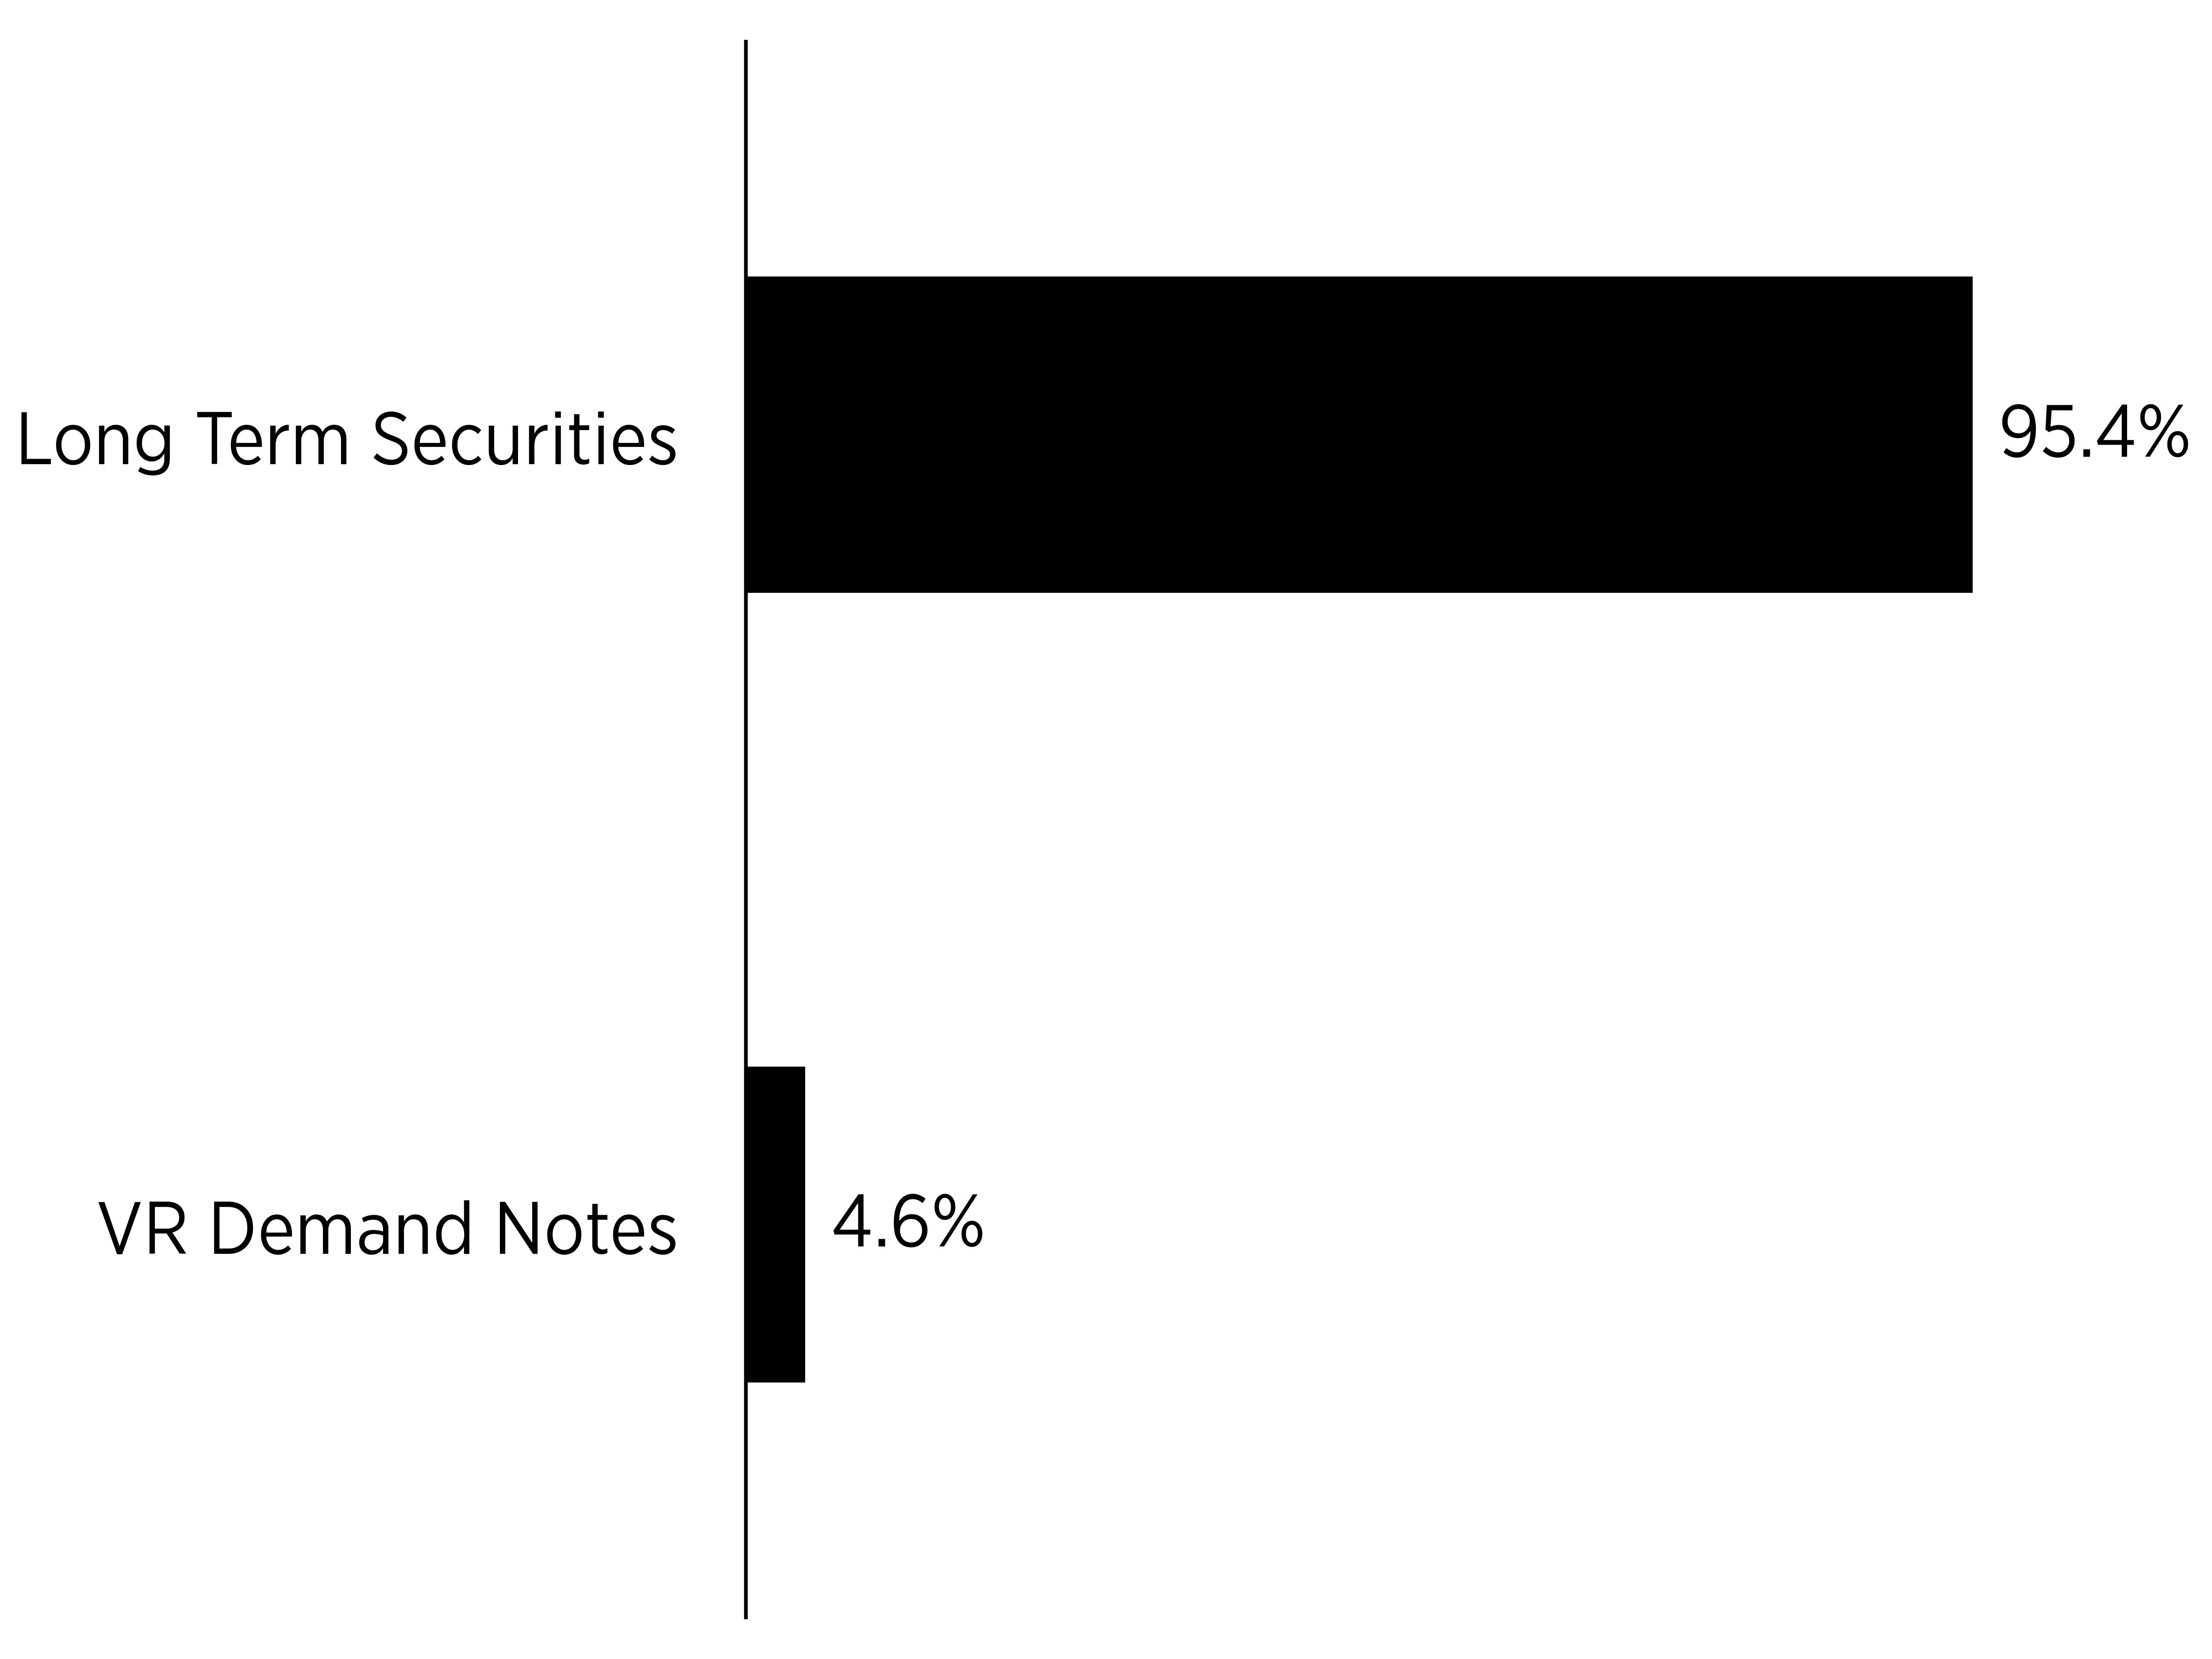
What did the Fund invest in?
(% of Total Investments as of August 31, 2026)
Sector Breakdown
|
Top Ten Holdings
|
Percentage of Total Investments
|
|---|---|
|
California Educational Facilities Authority
|
6.7%
|
|
San Jose Financing Authority
|
4.8%
|
|
San Diego Public Facilities Financing Authority
|
4.8%
|
|
City of Los Angeles CA Wastewater System Revenue
|
4.7%
|
|
San Mateo Foster City Public Financing Authority
|
4.3%
|
|
Desert Community College District
|
3.8%
|
|
San Diego Unified School District
|
3.7%
|
|
California Community Choice Financing Authority
|
3.3%
|
|
East Bay Municipal Utility District Water System Revenue
|
3.2%
|
|
East Bay Municipal Utility District Water System Revenue
|
3.2%
|
What were the Fund costs for the last year?
(based on a hypothetical $10,000 investment)
|
Class Name
|
Costs of a $10,000 investment
|
Costs paid as a percentage of a $10,000 investment
|
|---|---|---|
|
U.S. Government Securities Fund, Investor Class
|
$77
|
0.76%
|
What affected the Fund's performance this period?
- The trendline for yields in the US Government Bond market was higher throughout the fiscal year ending 8/31/26. Volatility subsided into the calendar year end of December 2025, as the Federal Open Market Committee was data dependent with a keen focus on employment and inflation. Softer economic data with weaker employment and three back-to-back Fed rate cuts provided stability. As a result, yields were rangebound between the starting point of 4.23% and 4.17% at the end of 2025, with a peak (+4.26%) to trough (+3.95%) of 31bps.
- After the Fed’s 3rd rate cut in December, the policy outlook in early 2026 became more hawkish. Economic conditions showed perseverance, while inflation wouldn’t vanish. The modest rally in US government bonds to start the fiscal year turned.
- The US Treasury (UST) market dynamics changed significantly alongside geopolitical risk. The start of conflict in Iran on February 28, 2026 sparked volatility. The MOVE Index, which measures bond market volatility, spiked from 64 to 115 on March 26, 2026. After 1-day of a flight to quality, UST yields escalated rapidly from a low of 3.94%, the day prior to when the bombing began, to the annual peak of 4.75% to close the fiscal year – a +81bps move higher. Higher oil prices and its widening impact on expected inflation rises persisted for the remainder of the fiscal year.
- The shape of the US Treasury curve changed quite dramatically over the course of the fiscal year. An inverted yield curve based on market expectations initially for further rate cuts, succumbed to a steeper curve as the year went on.
- 3-Year UST yields rose +83bps
- 30-Year UST Bond yields rose +31bps
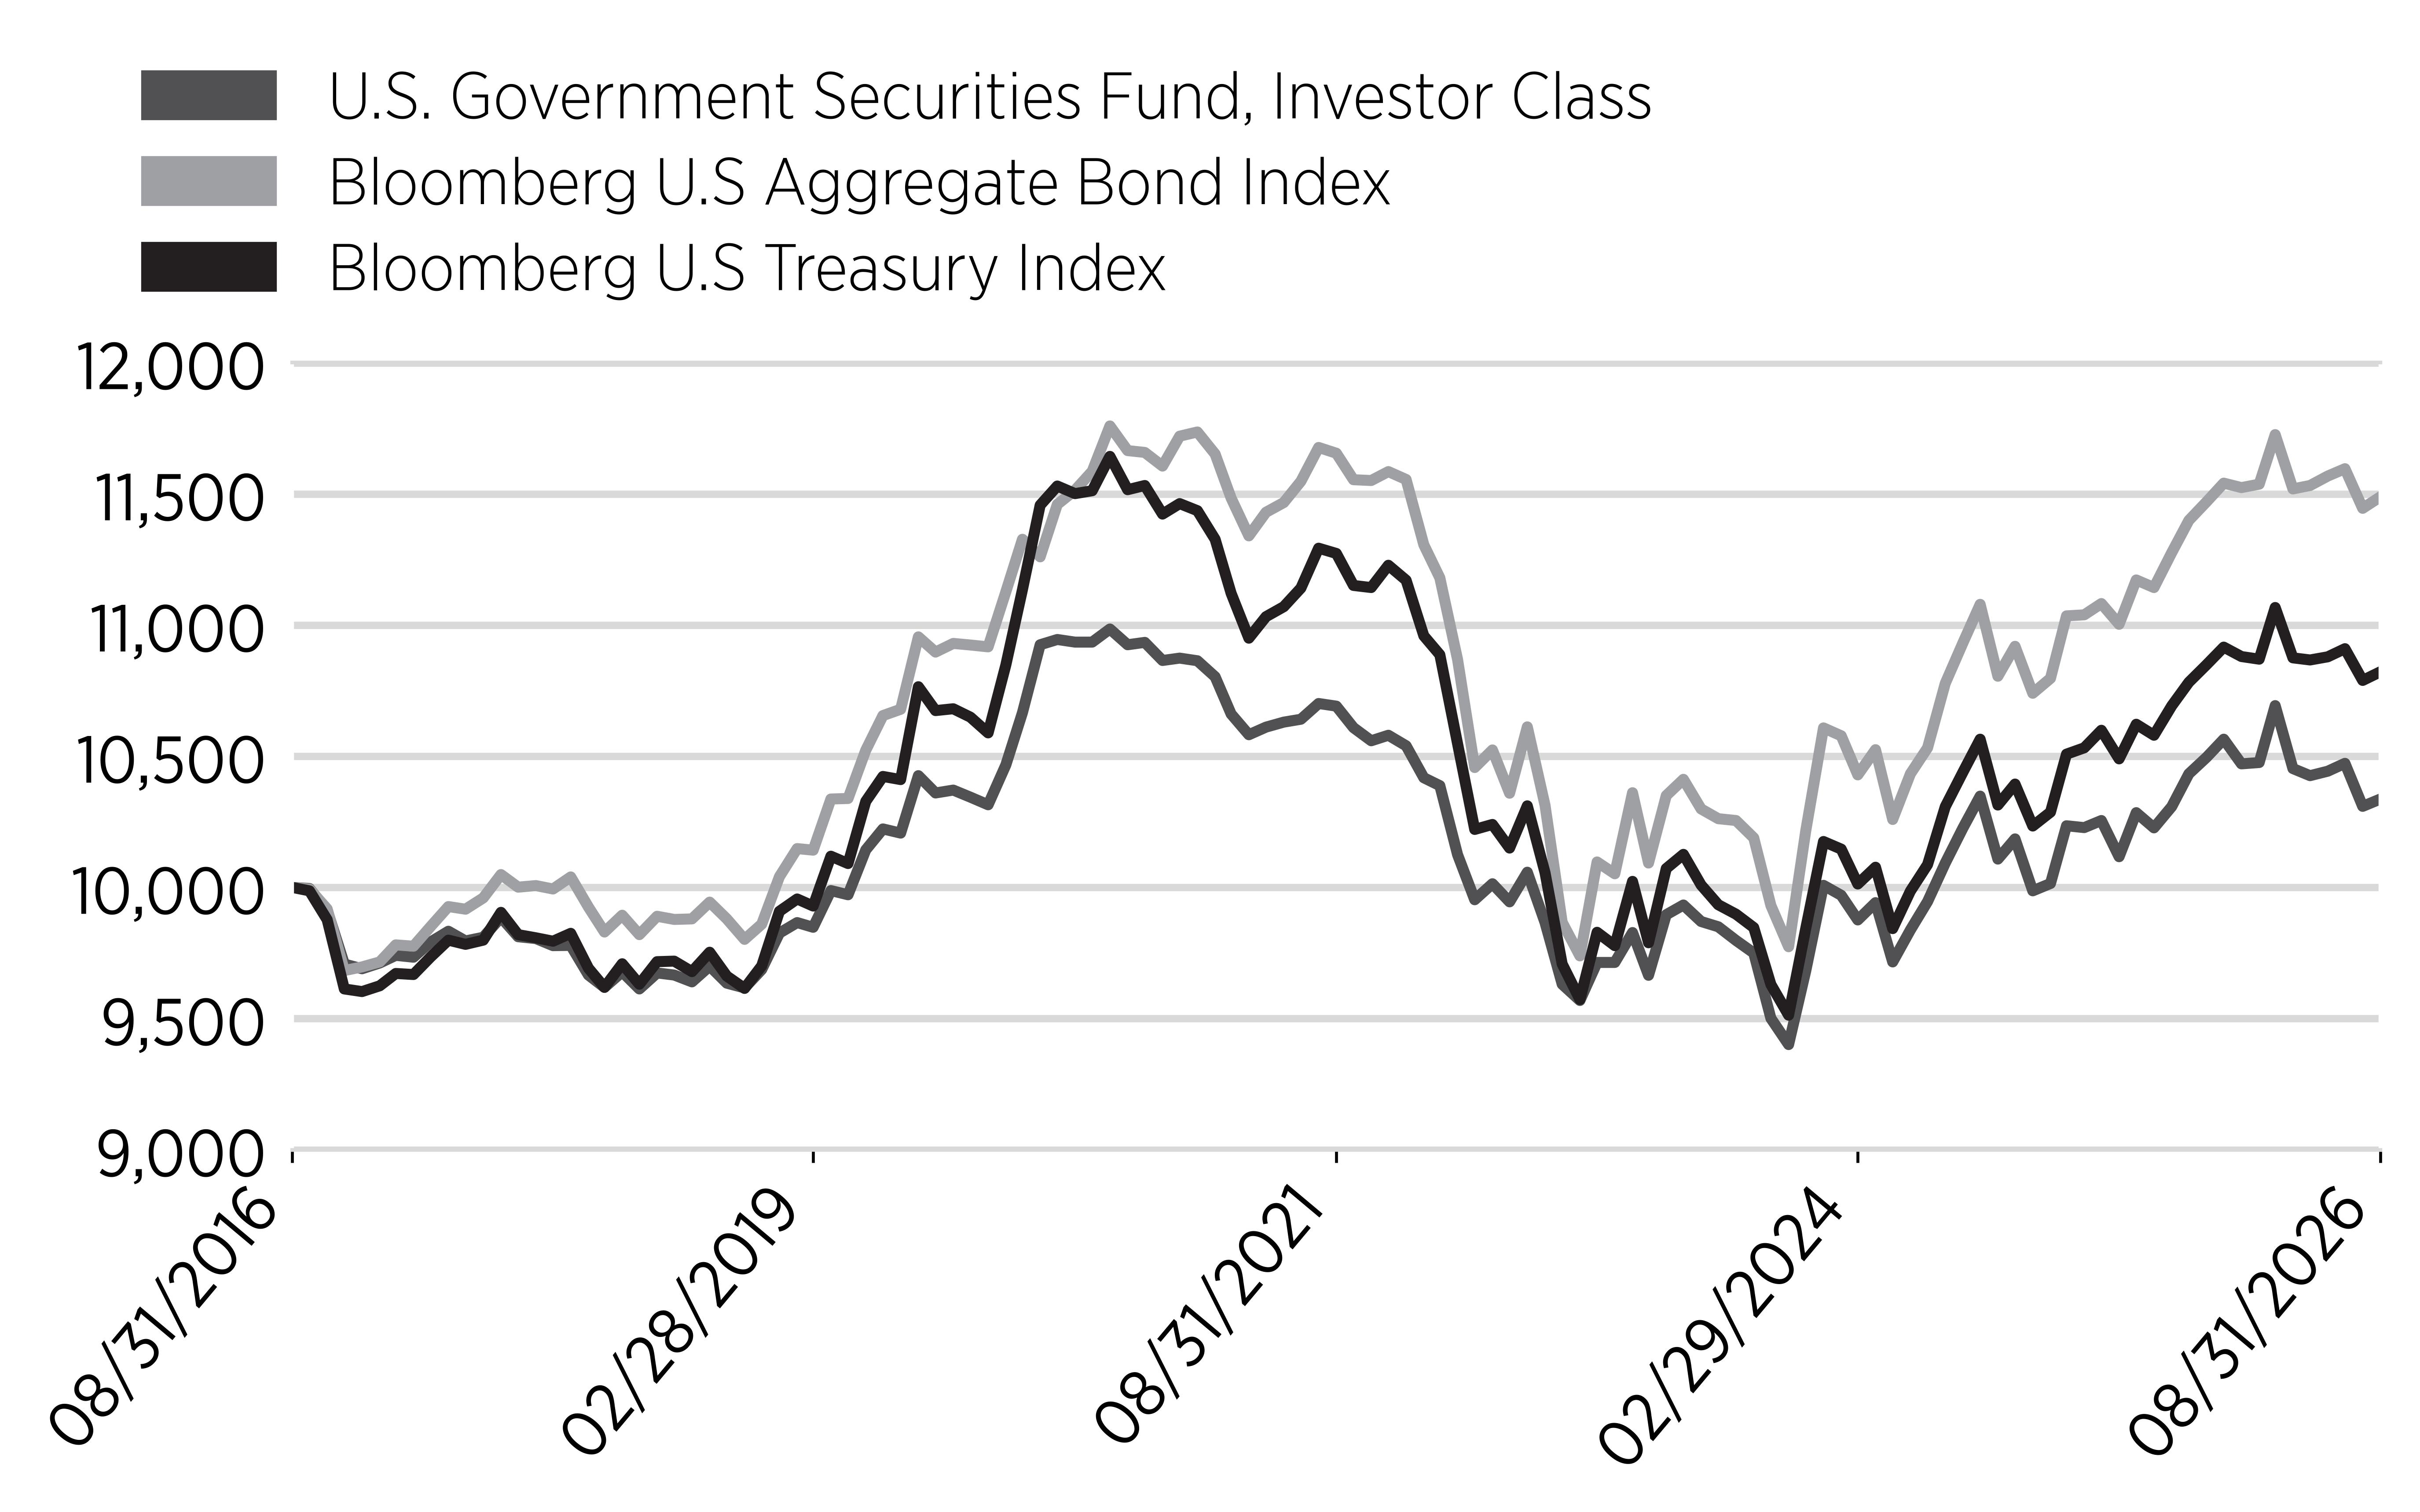
- The result of this volatility produced coupon-less type of returns for the Bloomberg US Treasury Index (Ticker: LUATTRUU) of +1.22% for the year ending 8/31/26.
- The Fund returned +0.28% for the period of September 1, 2025 to August 31, 2026. Despite its higher all-in yield versus the Bloomberg US Treasury Index, it’s longer duration penalized performance. Since longer dated bonds are more sensitive to interest rate moves than short-dated bonds, the Fund’s overweight positioning, concentrated on maturities over 10 years was a drag on returns, causing underperformance for the fiscal year.
Cumulative Performance
(based on a hypothetical $10,000 investment)
Annual Performance
|
Annual Performance
|
1 Year
|
5 Year
|
10 Year
|
|---|---|---|---|
|
U.S. Government Securities Fund,
Investor Class
|
0.28%
|
-0.67%
|
0.33%
|
|
Bloomberg U.S. Aggregate Bond
Index
|
1.89%
|
-0.29%
|
1.40%
|
|
Bloomberg U.S. Treasury Index
|
1.22%
|
-0.81%
|
0.79%
|
Key Fund Statistics
(as of August 31, 2026)
|
Net Assets
|
$11,463,453
|
|
Total Number of Portfolio Holdings
|
20
|
|
Total Advisory Fees Paid
|
$0
|
|
Portfolio Turnover Rate
|
28%
|
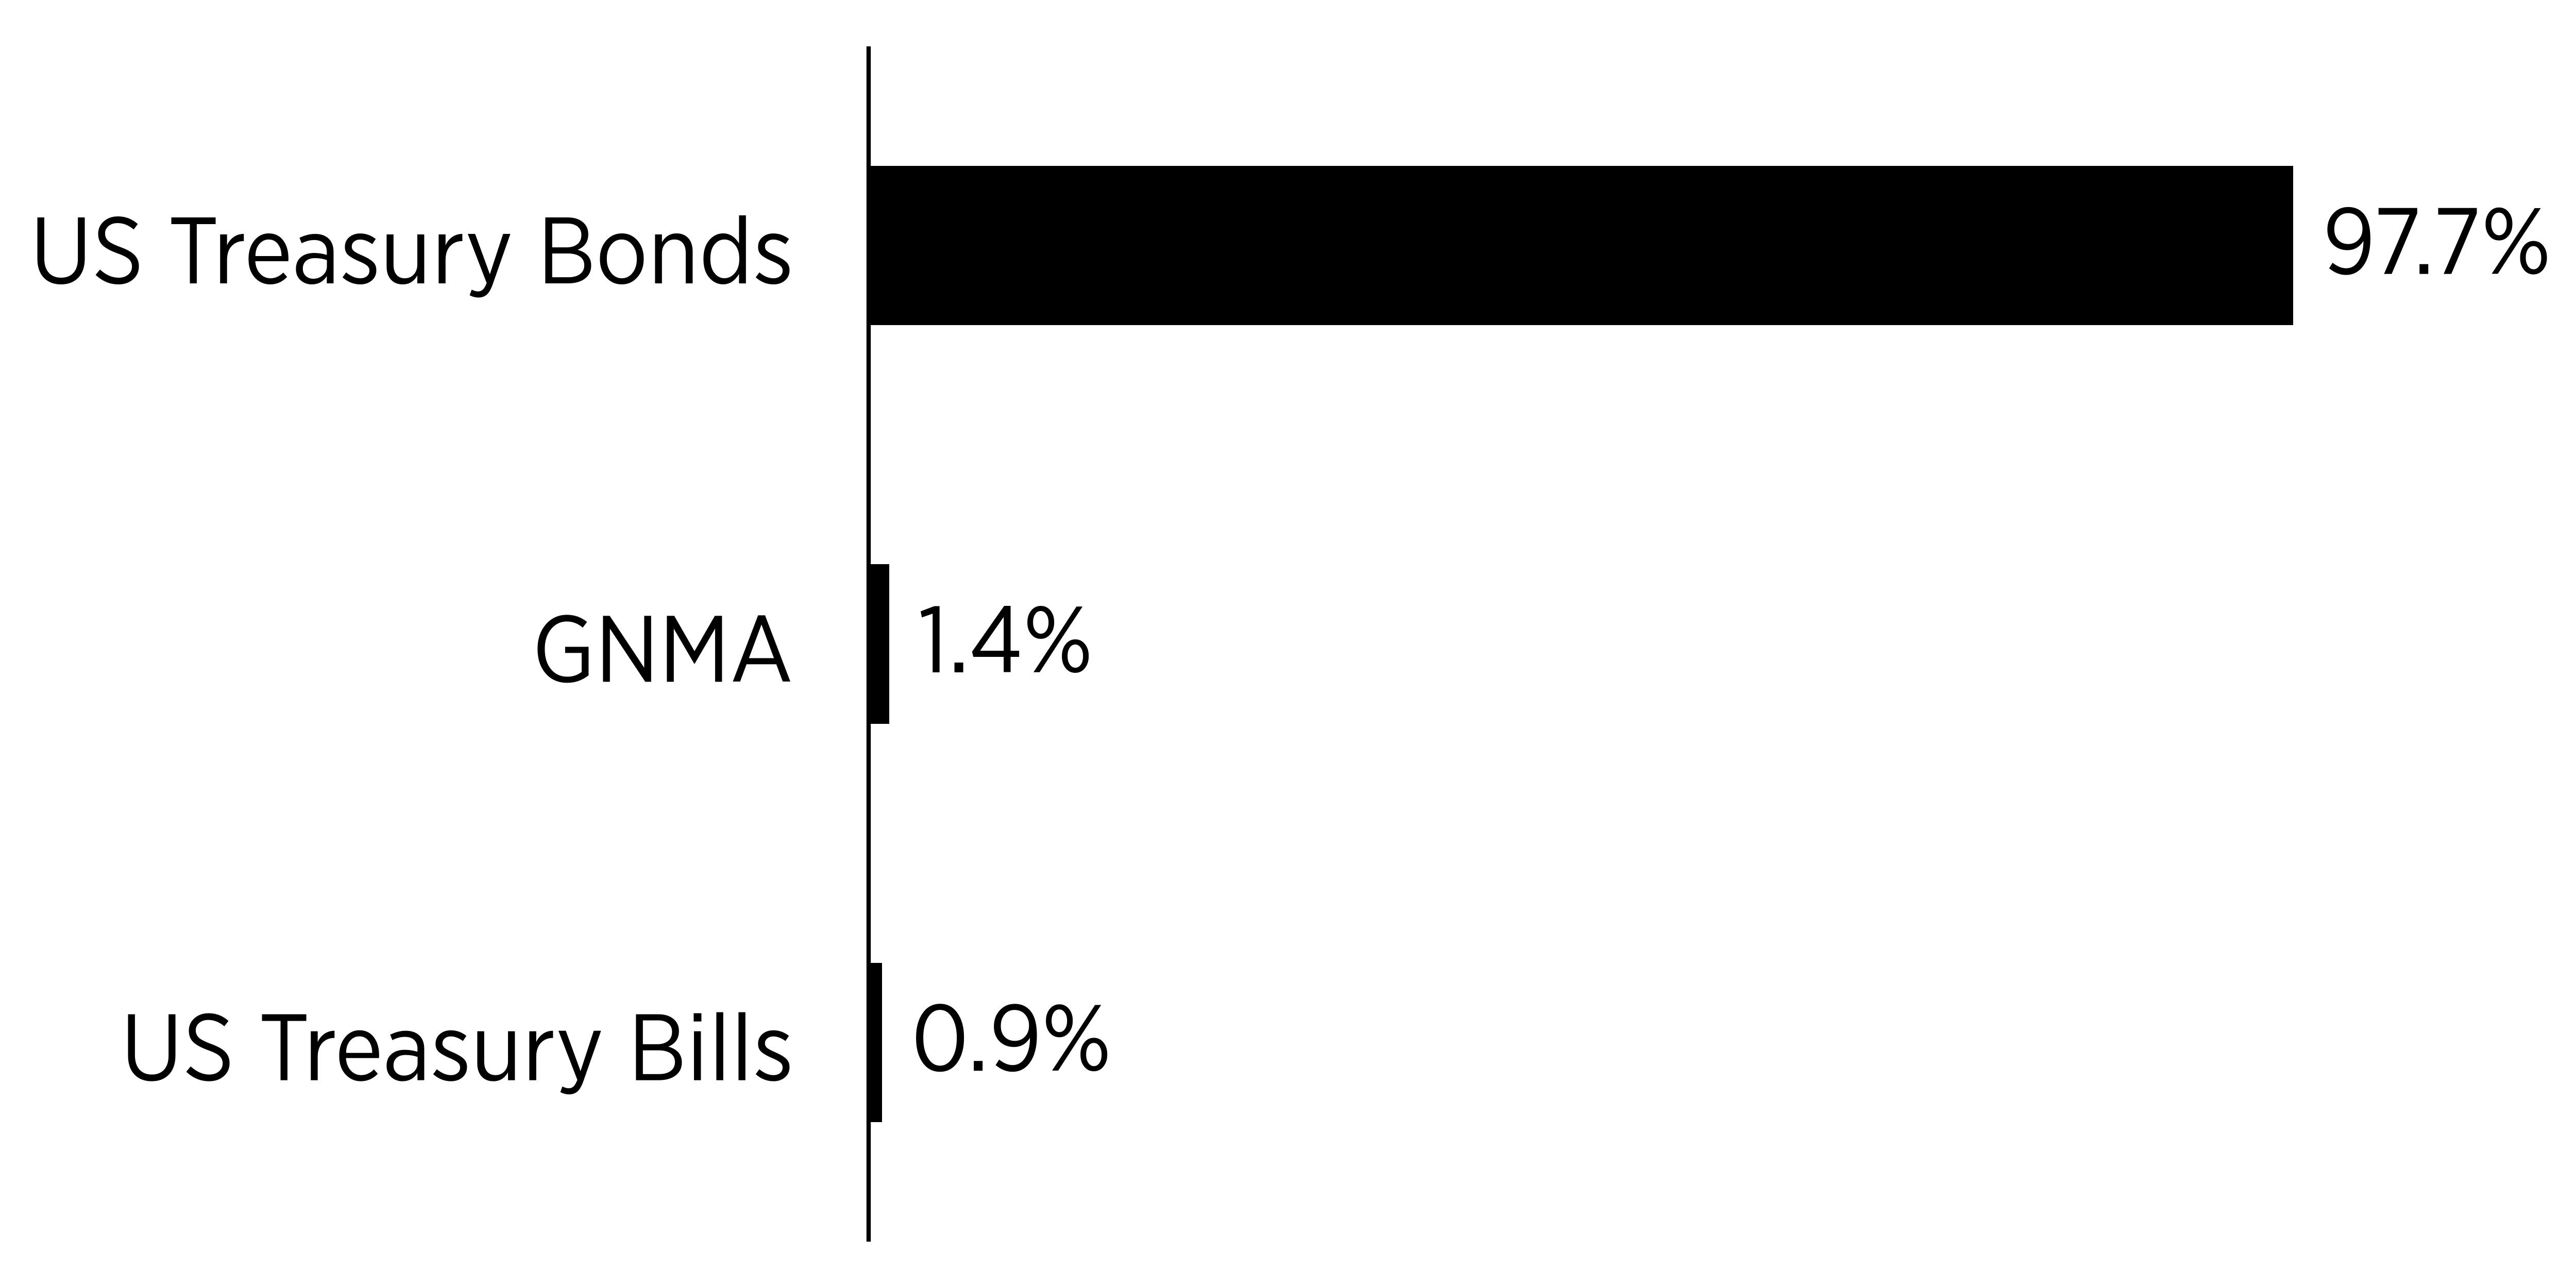
What did the Fund invest in?
(% of Total Investments as of August 31, 2026)
Sector Breakdown
|
Top Ten Holdings
|
Percentage of Total Investments
|
|---|---|
|
United States Treasury Note/Bond, 09/30/2029
|
12.4%
|
|
United States Treasury Note/Bond, 11/15/2041
|
11.8%
|
|
United States Treasury Note/Bond, 04/30/2032
|
10.3%
|
|
United States Treasury Note/Bond, 11/15/2054
|
9.8%
|
|
United States Treasury Note/Bond, 03/31/2027
|
8.2%
|
|
United States Treasury Note/Bond, 08/15/2033
|
7.2%
|
|
United States Treasury Note/Bond, 10/31/2030
|
7.2%
|
|
United States Treasury Note/Bond, 08/15/2034
|
6.7%
|
|
United States Treasury Note/Bond, 08/31/2031
|
5.1%
|
|
United States Treasury Note/Bond, 08/15/2045
|
5.0%
|
What were the Fund costs for the last year?
(based on a hypothetical $10,000 investment)
|
Class Name
|
Costs of a
$10,000 investment
|
Costs paid as a percentage of a
$10,000 investment
|
|---|---|---|
|
U.S. Government Securities Fund,
K Class
|
$128
|
1.26%
|
What affected the Fund's performance this period?
- The trendline for yields in the US Government Bond market was higher throughout the fiscal year ending 8/31/26. Volatility subsided into the calendar year end of December 2025, as the Federal Open Market Committee was data dependent with a keen focus on employment and inflation. Softer economic data with weaker employment and three back-to-back Fed rate cuts provided stability. As a result, yields were rangebound between the starting point of 4.23% and 4.17% at the end of 2025, with a peak (+4.26%) to trough (+3.95%) of 31bps.
- After the Fed’s 3rd rate cut in December, the policy outlook in early 2026 became more hawkish. Economic conditions showed perseverance, while inflation wouldn’t vanish. The modest rally in US government bonds to start the fiscal year turned.
- The US Treasury (UST) market dynamics changed significantly alongside geopolitical risk. The start of conflict in Iran on February 28, 2026 sparked volatility. The MOVE Index, which measures bond market volatility, spiked from 64 to 115 on March 26, 2026. After 1-day of a flight to quality, UST yields escalated rapidly from a low of 3.94%, the day prior to when the bombing began, to the annual peak of 4.75% to close the fiscal year – a +81bps move higher. Higher oil prices and its widening impact on expected inflation rises persisted for the remainder of the fiscal year.
- The shape of the US Treasury curve changed quite dramatically over the course of the fiscal year. An inverted yield curve based on market expectations initially for further rate cuts, succumbed to a steeper curve as the year went on.
- 3-Year UST yields rose +83bps
- 30-Year UST Bond yields rose +31bps
- The result of this volatility produced coupon-less type of returns for the Bloomberg US Treasury Index (Ticker: LUATTRUU) of +1.22% for the year ending 8/31/26.
- The Fund returned -0.23% for the period of September 1, 2025 to August 31, 2026. Despite its higher all-in yield versus the Bloomberg US Treasury Index, it’s longer duration penalized performance. Since longer dated bonds are more sensitive to interest rate moves than short-dated bonds, the Fund’s overweight positioning, concentrated on maturities over 10 years was a drag on returns, causing underperformance for the fiscal year.
Cumulative Performance
(based on a hypothetical $10,000 investment)
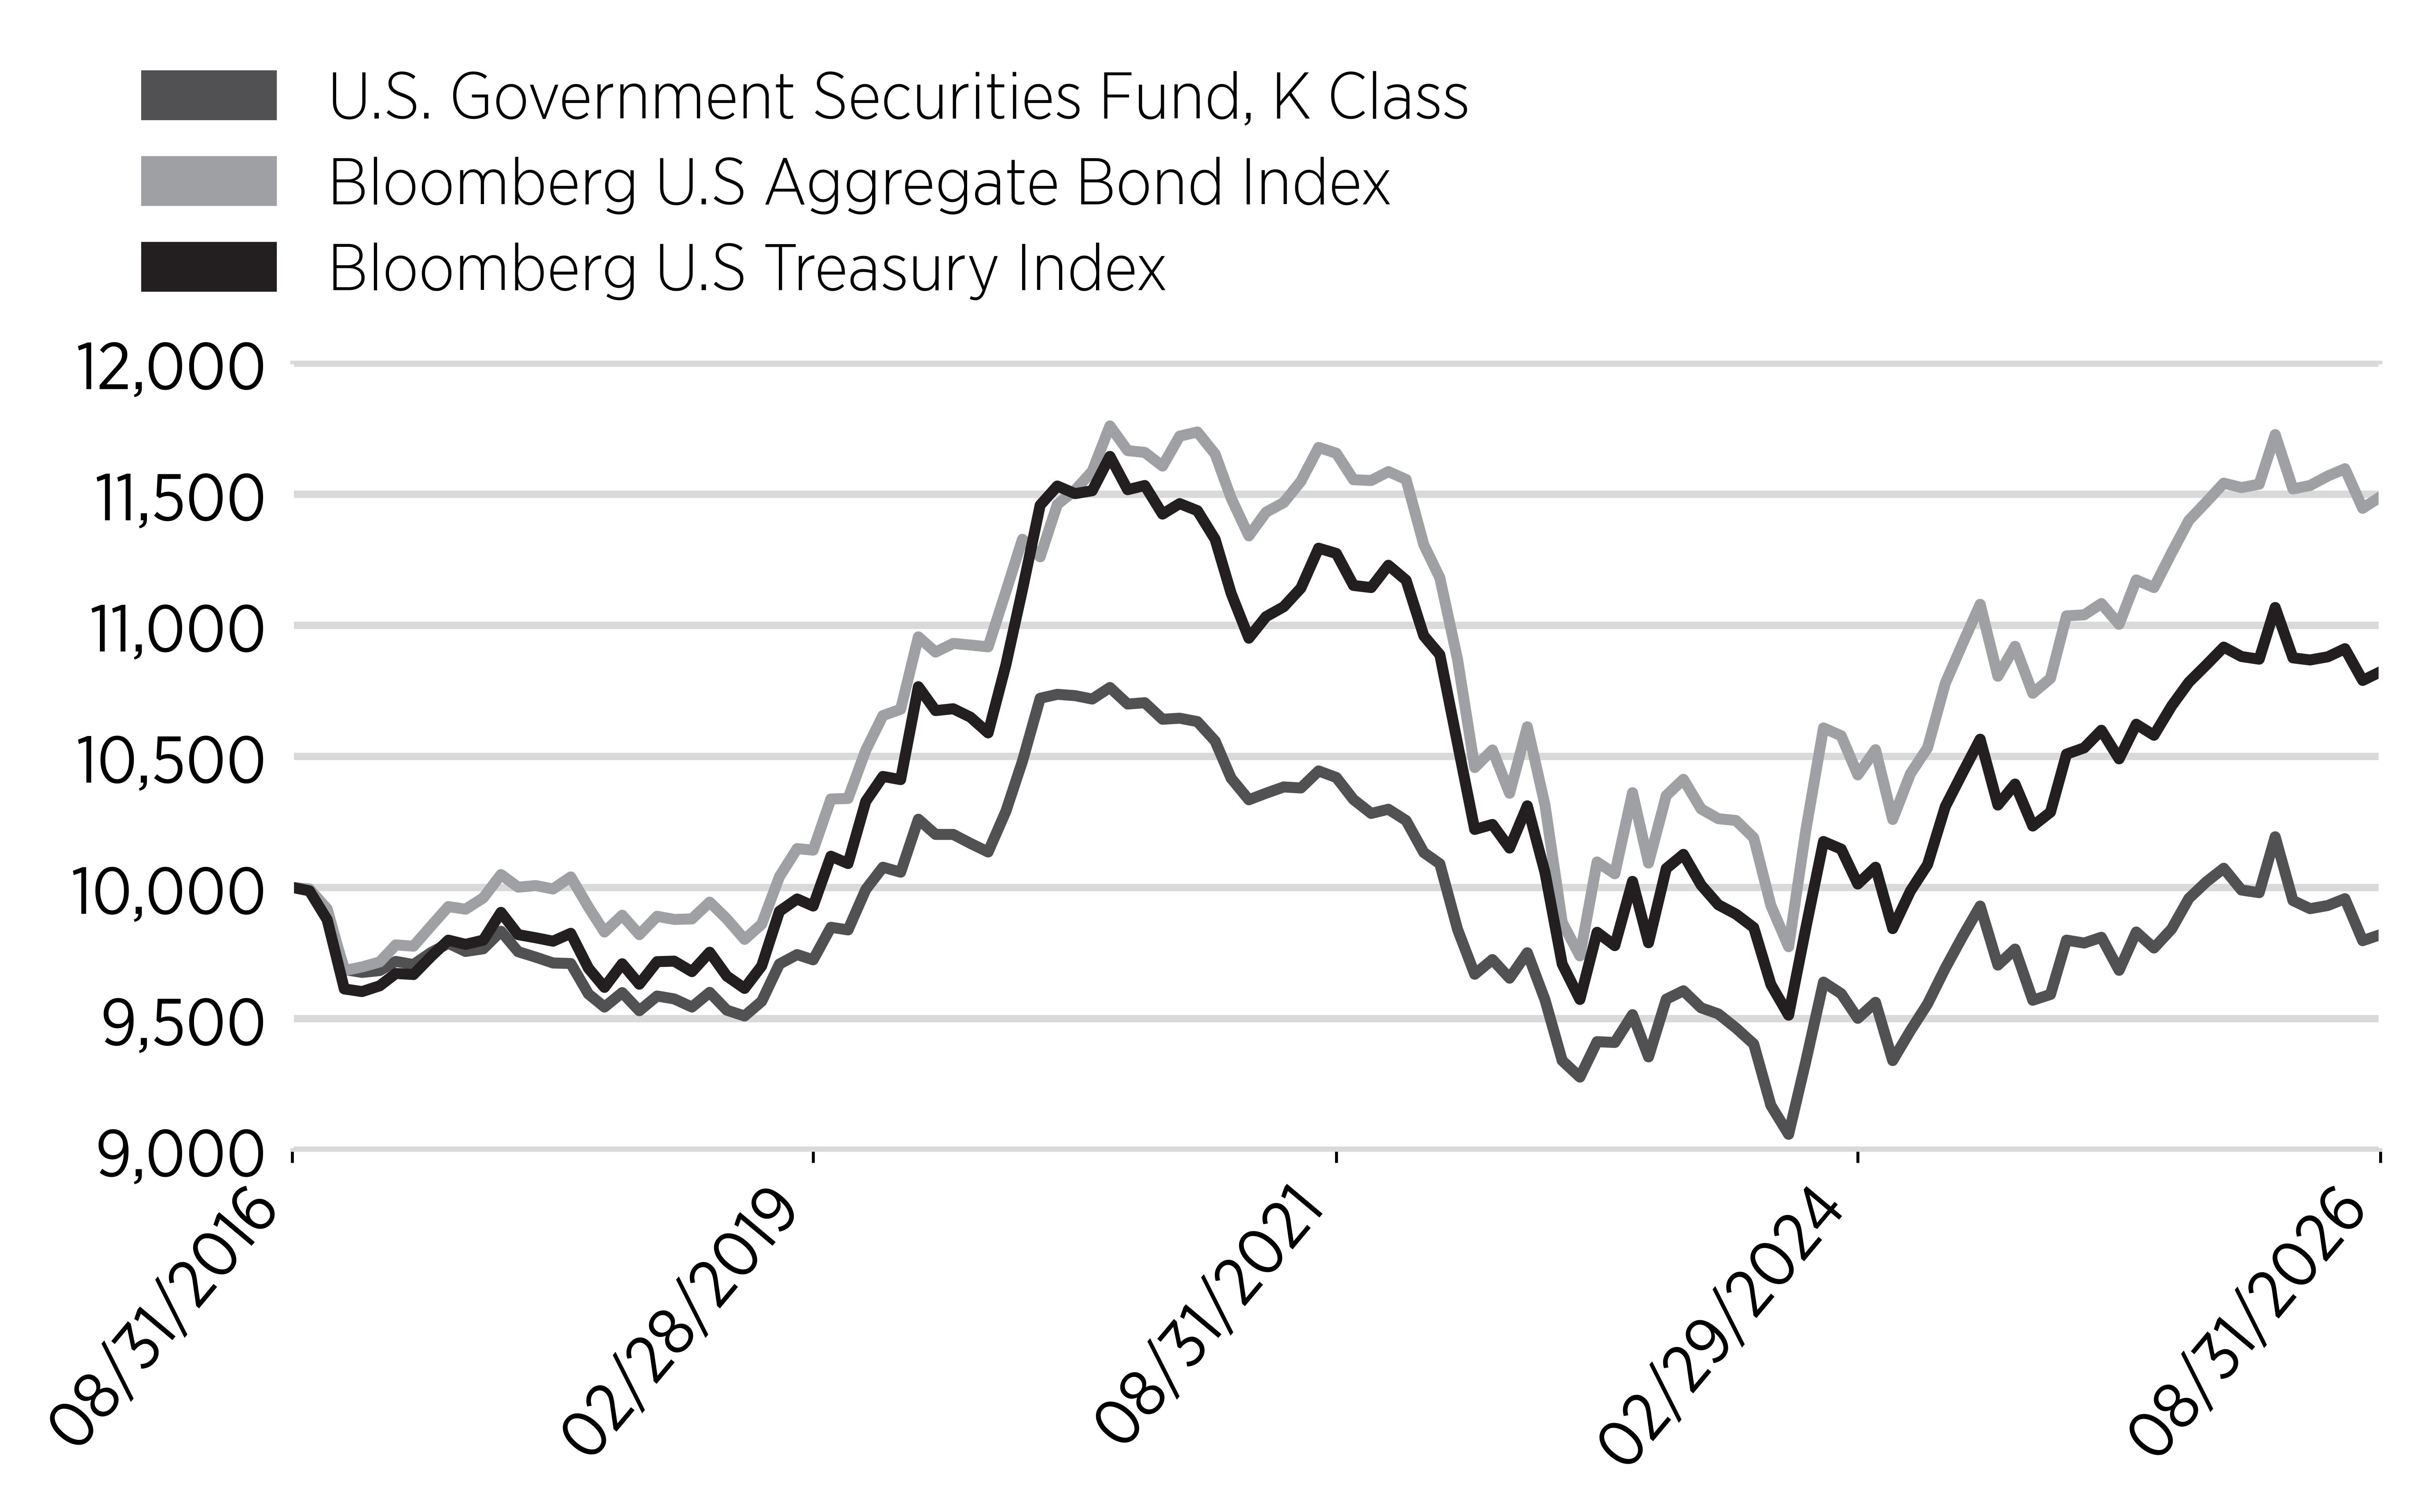
Annual Performance
|
Annual Performance
|
1 Year
|
5 Year
|
10 Year
|
|---|---|---|---|
|
U.S. Government Securities Fund,
K Class
|
-0.23%
|
-1.18%
|
-0.18%
|
|
Bloomberg U.S. Aggregate Bond
Index
|
1.89%
|
-0.29%
|
1.40%
|
|
Bloomberg U.S. Treasury Index
|
1.22%
|
-0.81%
|
0.79%
|
Key Fund Statistics
(as of August 31, 2026)
|
Net Assets
|
$85,754
|
|
Total Number of Portfolio Holdings
|
20
|
|
Total Advisory Fees Paid
|
$0
|
|
Portfolio Turnover Rate
|
28%
|
What did the Fund invest in?
(% of Total Investments as of August 31, 2026)
Sector Breakdown
|
Top Ten Holdings
|
Percentage of Total Investments
|
|---|---|
|
United States Treasury Note/Bond, 09/30/2029
|
12.4%
|
|
United States Treasury Note/Bond, 11/15/2041
|
11.8%
|
|
United States Treasury Note/Bond, 04/30/2032
|
10.3%
|
|
United States Treasury Note/Bond, 11/15/2054
|
9.8%
|
|
United States Treasury Note/Bond, 03/31/2027
|
8.2%
|
|
United States Treasury Note/Bond, 08/15/2033
|
7.2%
|
|
United States Treasury Note/Bond, 10/31/2030
|
7.2%
|
|
United States Treasury Note/Bond, 08/15/2034
|
6.7%
|
|
United States Treasury Note/Bond, 08/31/2031
|
5.1%
|
|
United States Treasury Note/Bond, 08/15/2045
|
5.0%
|
What were the Fund costs for the last year?
(based on a hypothetical $10,000 investment)
|
Class Name
|
Costs of a
$10,000 investment
|
Costs paid as a percentage of a
$10,000 investment
|
|---|---|---|
|
S&P 500 Index Fund, Investor Class
|
$41
|
0.40%
|
What affected the Fund's performance this period?
- For the fiscal year ended August 31, 2026, the evolution of artificial intelligence (AI), including increased investment in AI-related technology and infrastructure, influenced market returns, particularly within the Information Technology sector, while conflict in the Middle East contributed to market volatility. Inflation ranged from 2.4% to 4.2% year-over-year, with higher energy prices contributing to elevated readings in the second half of the fiscal year. During the same period, the Federal Reserve reduced the federal funds rate from 4.5% at the start of the fiscal year to 3.75% by December 2025, where it remained through the end of the fiscal year. While the rate reduction was broadly considered supportive of financial markets, its impacts varied across asset classes. According to Bloomberg L.P., the Fund's correlation was 1.00 to the S&P 500 Index.
- The Information Technology GICS sector contributed the most to the Fund's total return, gaining over 34%. Within this sector, the Semiconductors & Semiconductor Equipment industry drove most of the returns, gaining over 55% for the year. Additionally, the Health Care sector was the second largest contributor, returning over 26% for the period, led by the Pharmaceuticals, Biotechnology & Life Sciences industry, which returned over 43%.
- While no GICS sector detracted from the Fund's total return for the year, the Utilities industry within the Utilities sector contributed the least, with a positive return of less than 3%, which lagged behind the other sectors. At the industry level, the Software & Services industry within the Information Technology sector detracted the most from the Fund's total return, despite a positive return of less than 1% for the year. Additionally, the Commercial & Professional Services industry within the Industrials sector lost more than 11% for the period.
- In terms of specific stock holdings, Apple, Nvidia, and Micron Technology were the top three contributors to the total return of the Fund, gaining approximately 37%, over 26%, and over 706%, respectively. Conversely, the top three detractors were Meta Platforms, Netflix, and Oracle, which lost more than 22%, 32%, and 33%, respectively, for the Fund's fiscal year.
Cumulative Performance
(based on a hypothetical $10,000 investment)
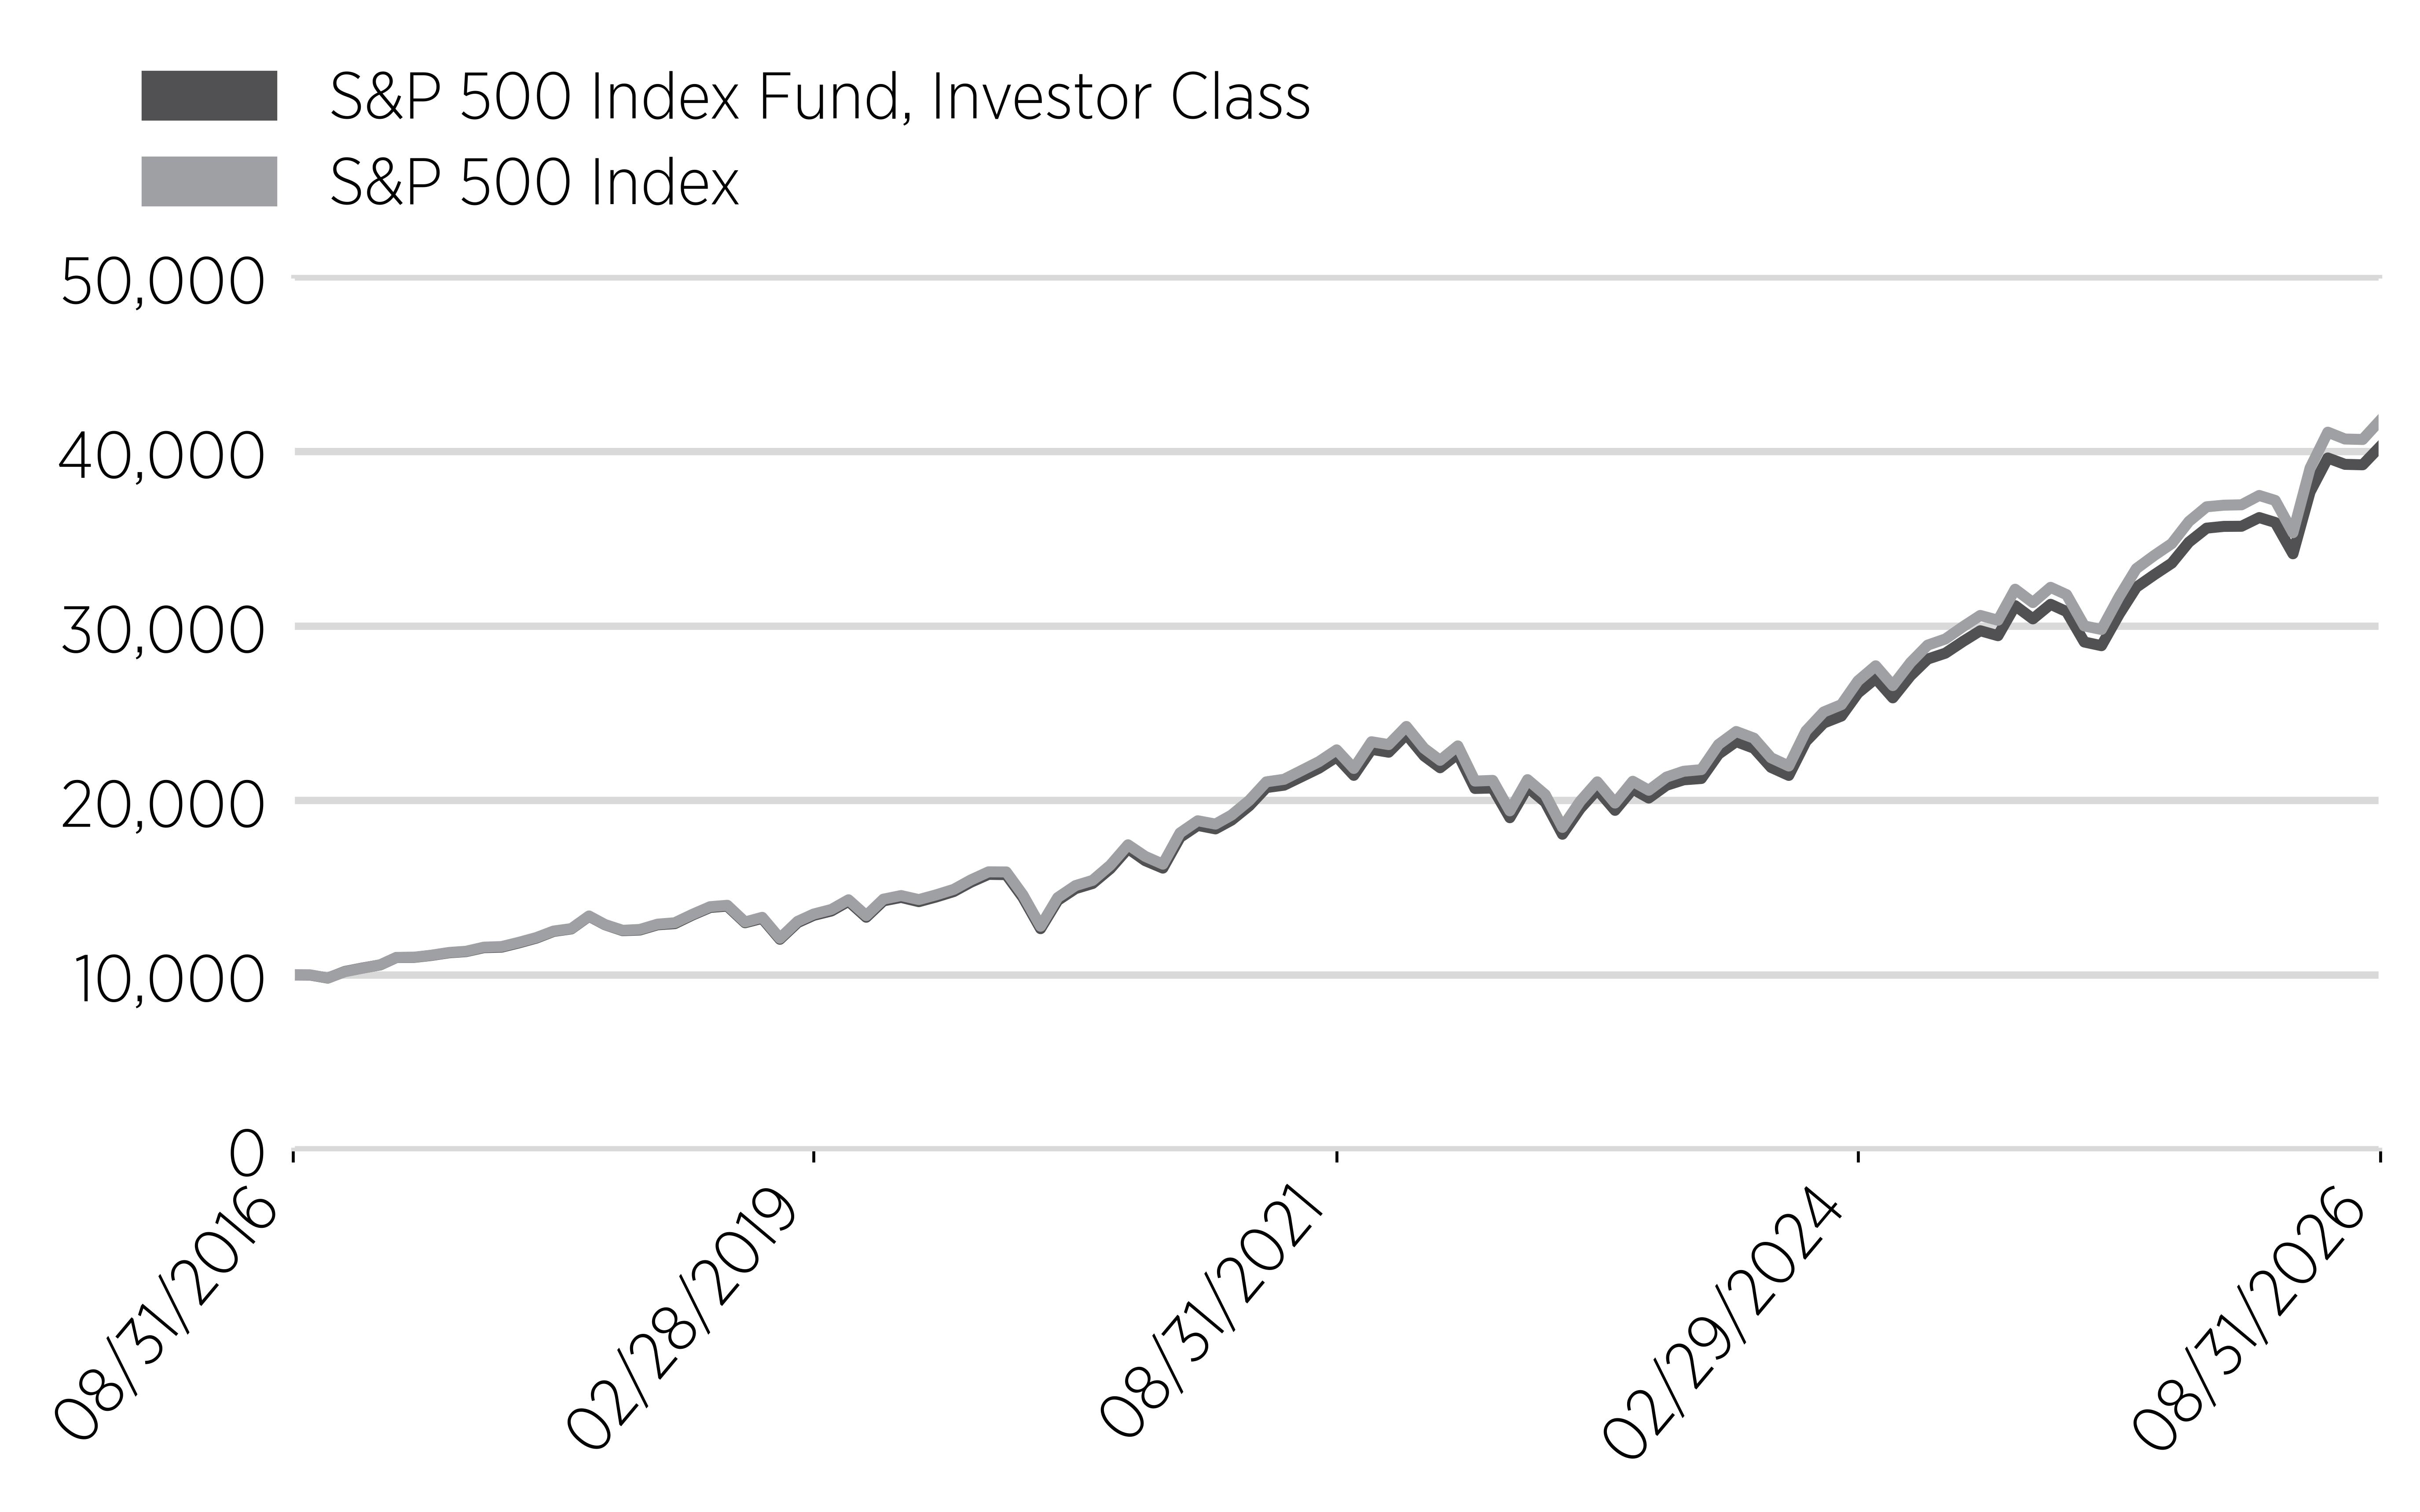
Annual Performance
|
Annual Performance
|
1 Year
|
5 Year
|
10 Year
|
|---|---|---|---|
|
S&P 500 Index Fund, Investor Class
|
19.93%
|
12.37%
|
14.95%
|
|
S&P 500 Index
|
20.35%
|
12.76%
|
15.35%
|
Key Fund Statistics
(as of August 31, 2026)
|
Net Assets
|
$344,184,317
|
|
Total Number of Portfolio Holdings
|
503
|
|
Total Advisory Fees Paid
|
$801,260
|
|
Portfolio Turnover Rate
|
3%
|
What did the Fund invest in?
(% of Total Investments as of August 31, 2026)
Sector Breakdown
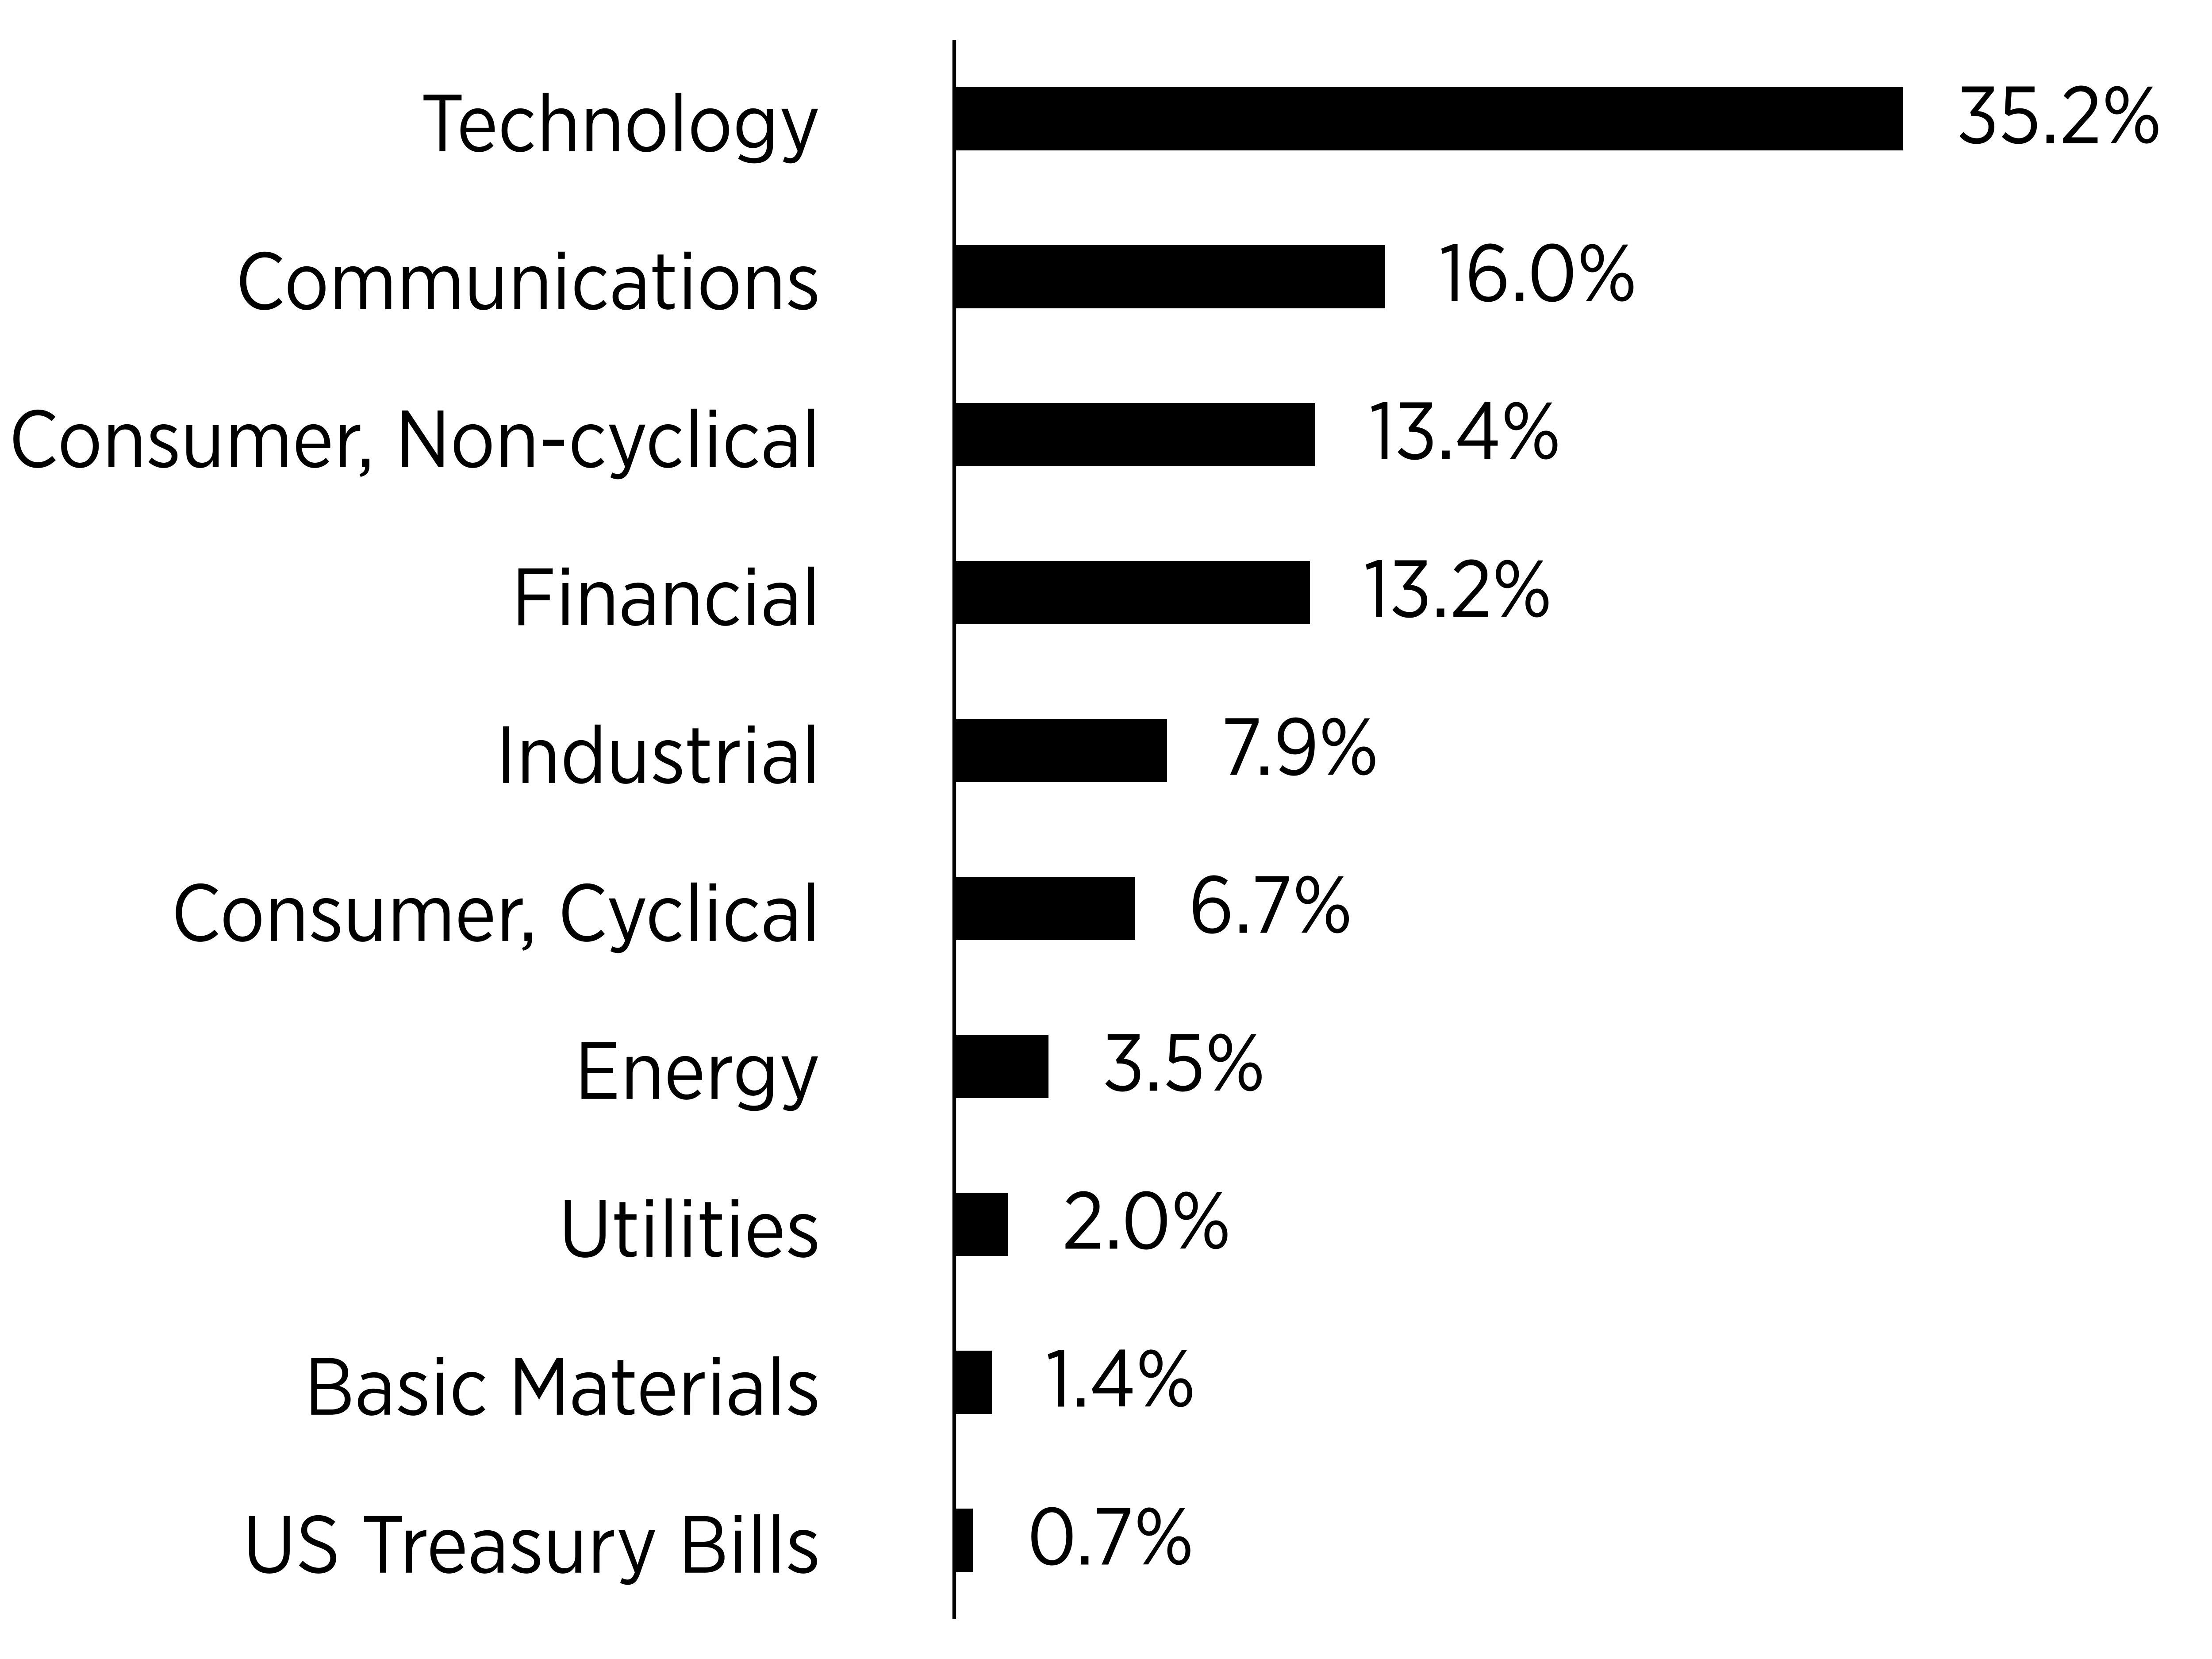
|
Top Ten Holdings
|
Percentage of Total Investments
|
|---|---|
|
NVIDIA Corp
|
8.0%
|
|
Apple Inc
|
7.0%
|
|
Microsoft Corp
|
5.7%
|
|
Amazon.com Inc
|
3.8%
|
|
Alphabet Inc - Class A
|
3.0%
|
|
Broadcom Inc
|
2.6%
|
|
Alphabet Inc - Class C
|
2.4%
|
|
Meta Platforms Inc
|
1.9%
|
|
Micron Technology Inc
|
1.6%
|
|
Tesla Inc
|
1.6%
|
What were the Fund costs for the last year?
(based on a hypothetical $10,000 investment)
|
Class Name
|
Costs of a
$10,000 investment
|
Costs paid as a percentage of a
$10,000 investment
|
|---|---|---|
|
S&P 500 Index Fund, K Class
|
$93
|
0.91%
|
What affected the Fund's performance this period?
- For the fiscal year ended August 31, 2026, the evolution of artificial intelligence (AI), including increased investment in AI-related technology and infrastructure, influenced market returns, particularly within the Information Technology sector, while conflict in the Middle East contributed to market volatility. Inflation ranged from 2.4% to 4.2% year-over-year, with higher energy prices contributing to elevated readings in the second half of the fiscal year. During the same period, the Federal Reserve reduced the federal funds rate from 4.5% at the start of the fiscal year to 3.75% by December 2025, where it remained through the end of the fiscal year. While the rate reduction was broadly considered supportive of financial markets, its impacts varied across asset classes. According to Bloomberg L.P., the Fund's correlation was 1.00 to the S&P 500 Index.
- The Information Technology GICS sector contributed the most to the Fund's total return, gaining over 34%. Within this sector, the Semiconductors & Semiconductor Equipment industry drove most of the returns, gaining over 55% for the year. Additionally, the Health Care sector was the second largest contributor, returning over 26% for the period, led by the Pharmaceuticals, Biotechnology & Life Sciences industry, which returned over 43%.
- While no GICS sector detracted from the Fund's total return for the year, the Utilities industry within the Utilities sector contributed the least, with a positive return of less than 3%, which lagged behind the other sectors. At the industry level, the Software & Services industry within the Information Technology sector detracted the most from the Fund's total return, despite a positive return of less than 1% for the year. Additionally, the Commercial & Professional Services industry within the Industrials sector lost more than 11% for the period.
- In terms of specific stock holdings, Apple, Nvidia, and Micron Technology were the top three contributors to the total return of the Fund, gaining approximately 37%, over 26%, and over 706%, respectively. Conversely, the top three detractors were Meta Platforms, Netflix, and Oracle, which lost more than 22%, 32%, and 33%, respectively, for the Fund's fiscal year.
Cumulative Performance
(based on a hypothetical $10,000 investment)
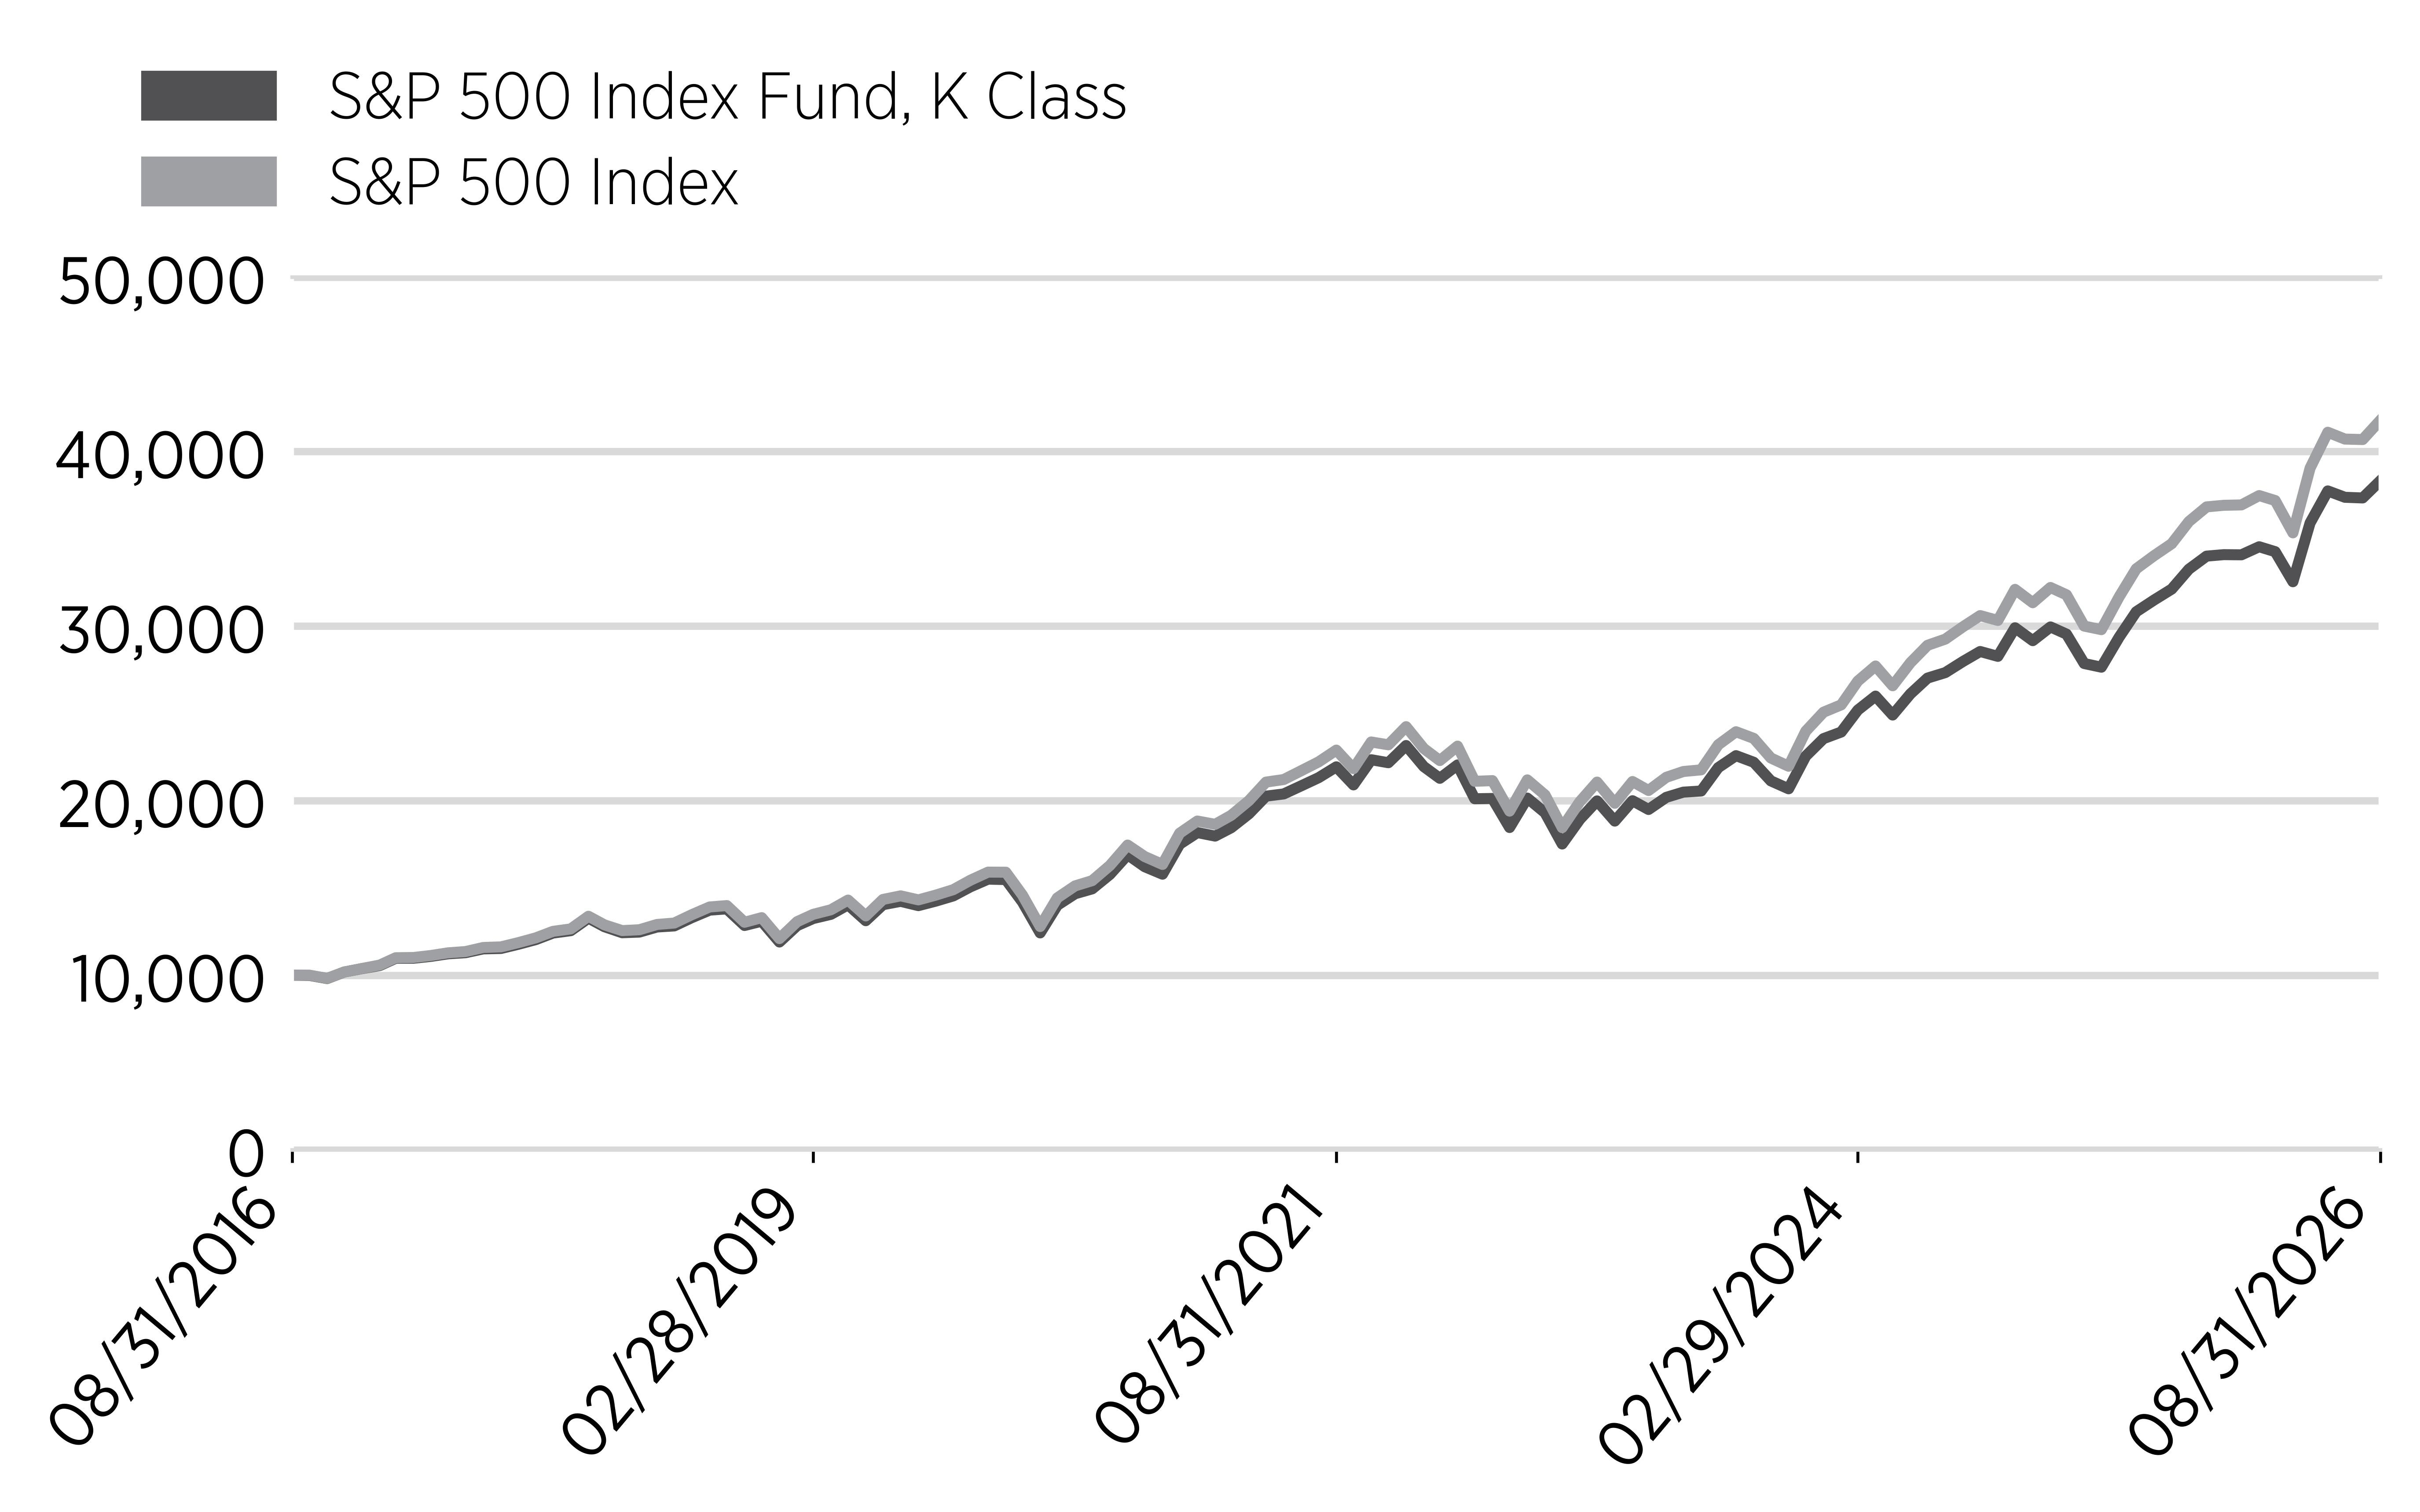
Annual Performance
|
Annual Performance
|
1 Year
|
5 Year
|
10 Year
|
|---|---|---|---|
|
S&P 500 Index Fund, K Class
|
19.34%
|
11.81%
|
14.38%
|
|
S&P 500 Index
|
20.35%
|
12.76%
|
15.35%
|
Key Fund Statistics
(as of August 31, 2026)
|
Net Assets
|
$1,975,144
|
|
Total Number of Portfolio Holdings
|
503
|
|
Total Advisory Fees Paid
|
$4,931
|
|
Portfolio Turnover Rate
|
3%
|
What did the Fund invest in?
(% of Total Investments as of August 31, 2026)
Sector Breakdown
|
Top Ten Holdings
|
Percentage of Total Investments
|
|---|---|
|
NVIDIA Corp
|
8.0%
|
|
Apple Inc
|
7.0%
|
|
Microsoft Corp
|
5.7%
|
|
Amazon.com Inc
|
3.8%
|
|
Alphabet Inc - Class A
|
3.0%
|
|
Broadcom Inc
|
2.6%
|
|
Alphabet Inc - Class C
|
2.4%
|
|
Meta Platforms Inc
|
1.9%
|
|
Micron Technology Inc
|
1.6%
|
|
Tesla Inc
|
1.6%
|
What were the Fund costs for the last year?
(based on a hypothetical $10,000 investment)
|
Class Name
|
Costs of a
$10,000 investment
|
Costs paid as a percentage of a
$10,000 investment
|
|---|---|---|
|
S&P MidCap Index Fund, Investor
Class
|
$63
|
0.62%
|
What affected the Fund's performance this period?
- For the fiscal year ended August 31, 2026, the evolution of artificial intelligence (AI), including increased investment in AI-related technology and infrastructure, influenced market returns, particularly within the Information Technology sector, while conflict in the Middle East contributed to market volatility. Inflation ranged from 2.4% to 4.2% year-over-year, with higher energy prices contributing to elevated readings in the second half of the fiscal year. During the same period, the Federal Reserve reduced the federal funds rate from 4.5% at the start of the fiscal year to 3.75% by December 2025, where it remained through the end of the fiscal year. While the rate reduction was broadly considered supportive of financial markets, its impacts varied across asset classes. According to Bloomberg L.P., the Fund's correlation was 1.00 to the S&P MidCap 400 Index.
- The Information Technology GICS sector contributed the most to the Fund's total return, gaining over 65%. Within this sector, the Technology Hardware & Equipment industry drove most of the returns, gaining over 126% for the year. Additionally, the Industrials sector was the second largest contributor, returning over 11% for the period, led by the Capital Goods industry, which returned over 15%.
- Contrarily, the GICS Consumer Discretionary sector detracted the most from the Fund's total return, losing more than 6% for the year. Within this sector, the Consumer Services industry detracted the most, losing more than 10%. Additionally, the Consumer Staples sector detracted from the Fund's total return despite a positive return of over 2% for the period, brought down the most by the Household & Personal Products industry, which lost more than 30%.
- In terms of specific stock holdings, Lumentum Holdings, Flex, and Ciena were the top three contributors to the total return of the Fund, gaining over 448%, 200%, and 208%, respectively. Conversely, the top three detractors were AECOM, Sprouts Farmers Market, and Duolingo, which lost more than 45%, 41%, and 50%, respectively, for the Fund's fiscal year.
Cumulative Performance
(based on a hypothetical $10,000 investment)
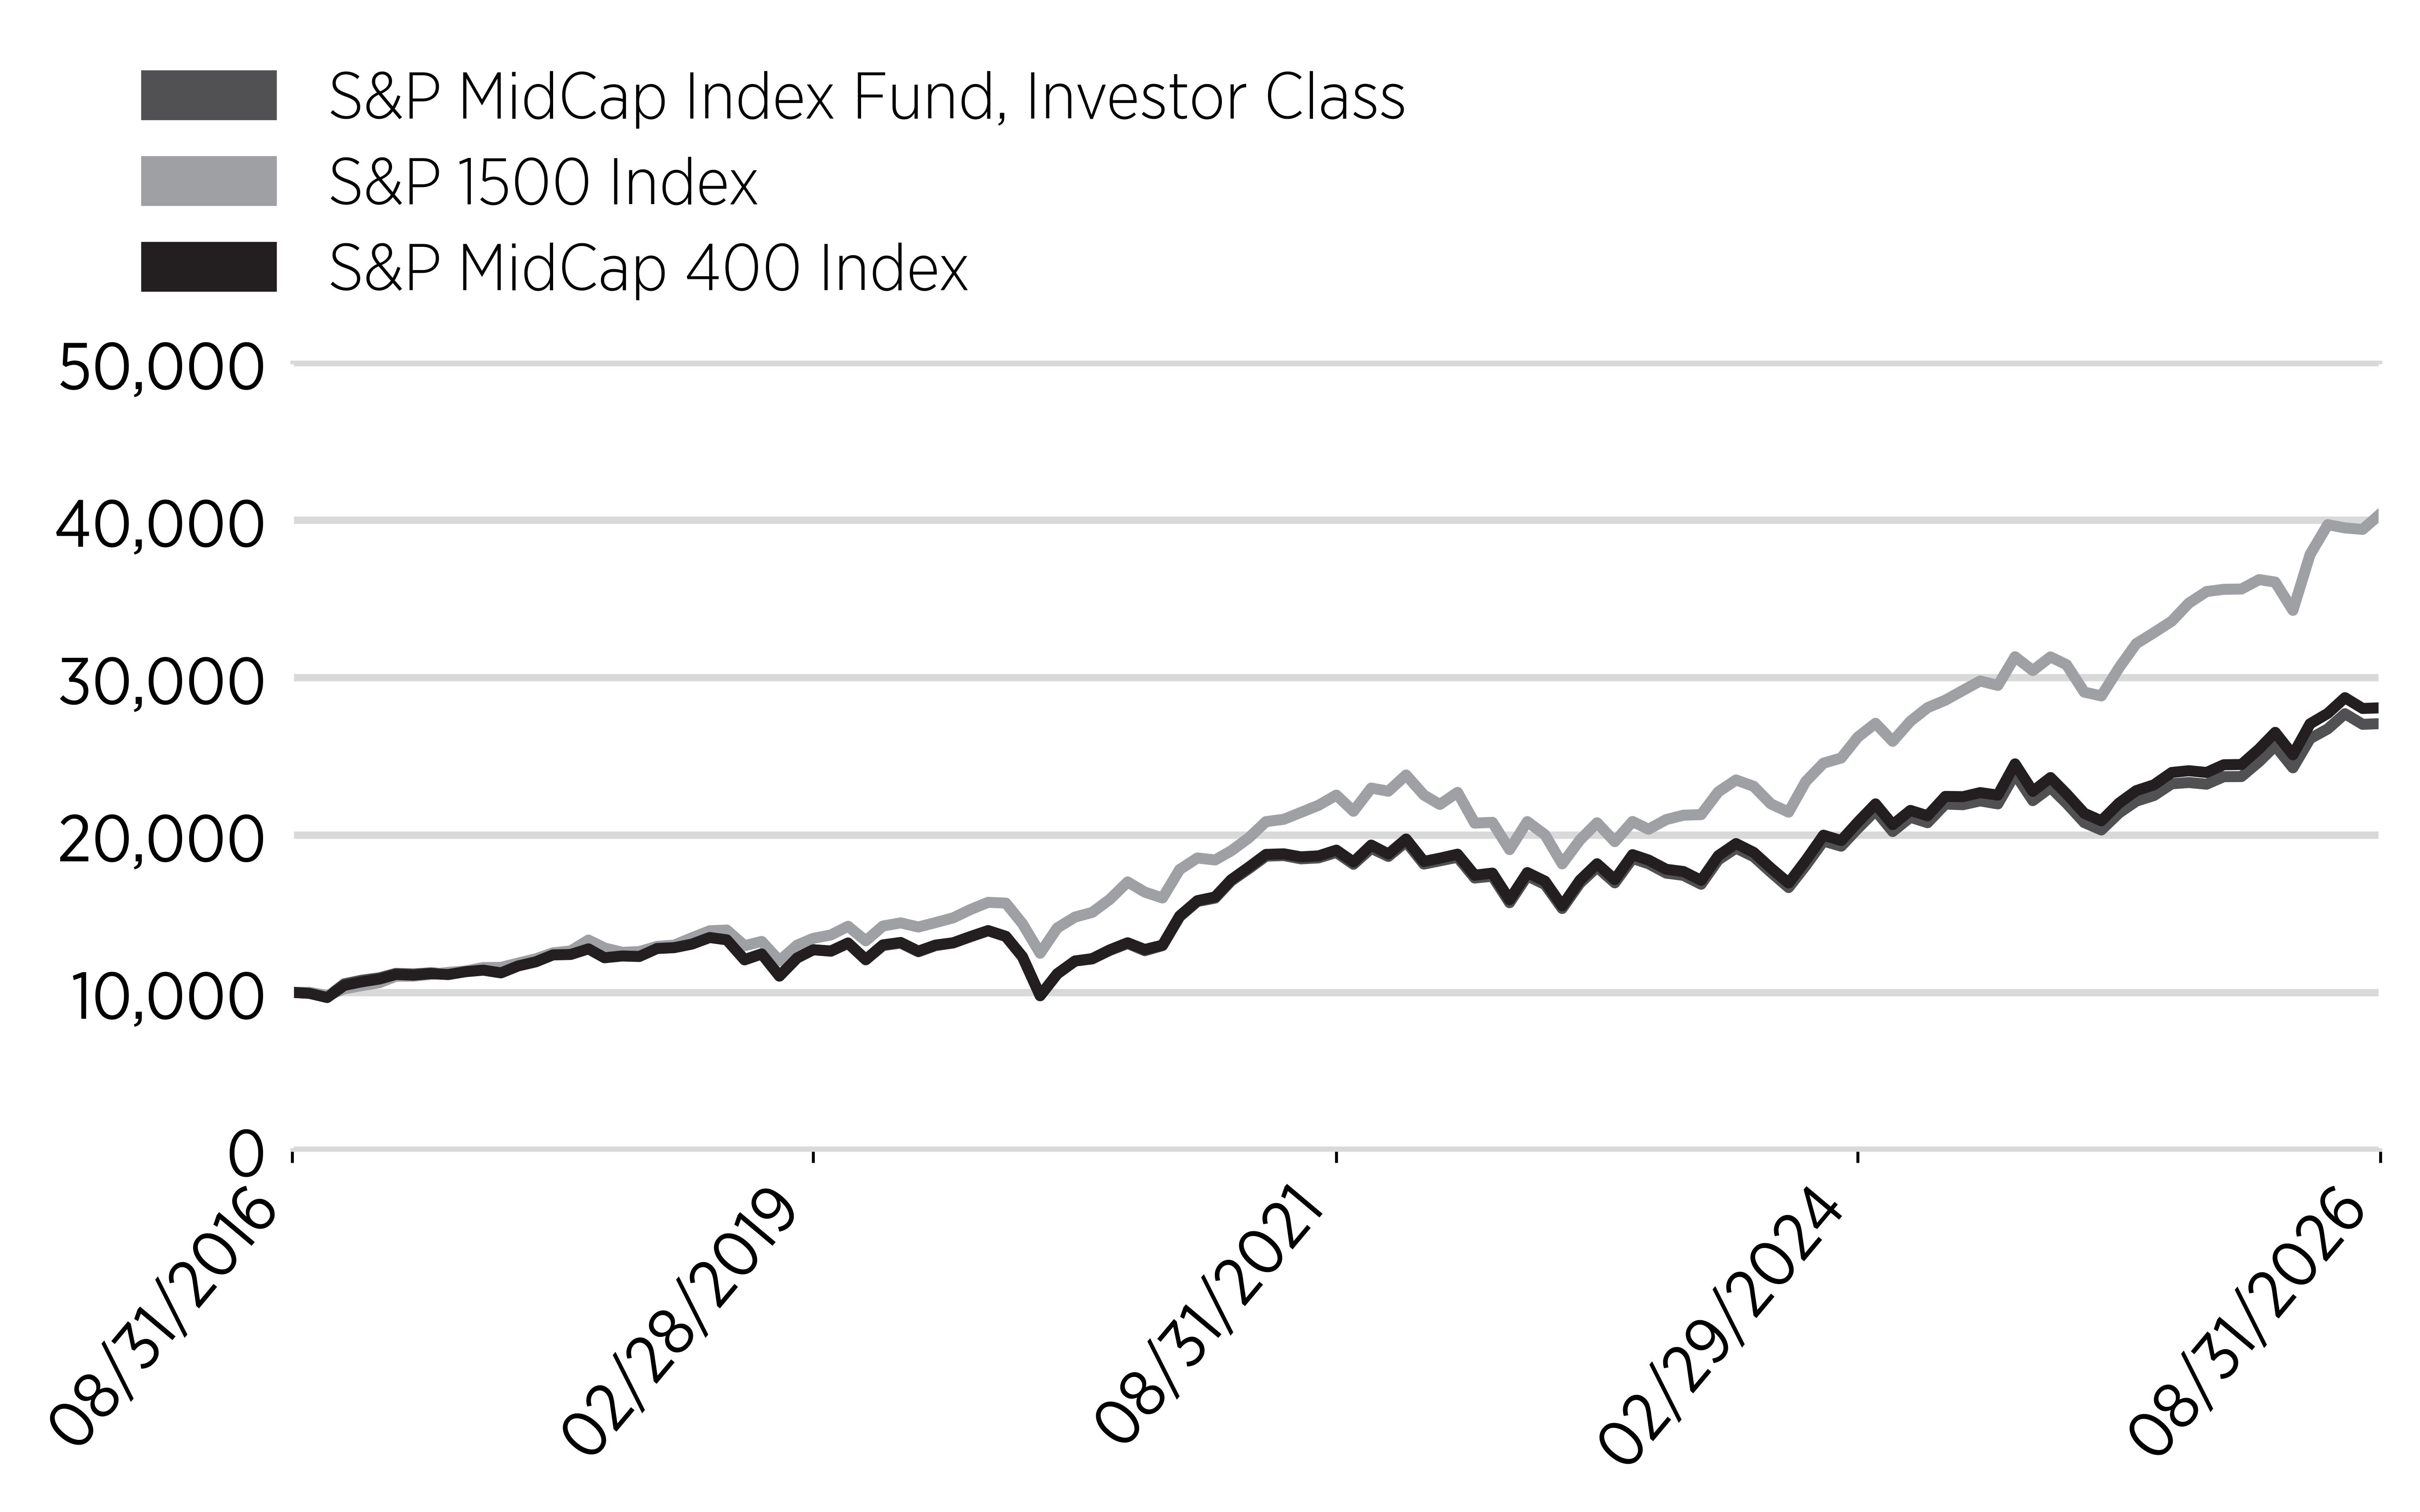
Annual Performance
|
Annual Performance
|
1 Year
|
5 Year
|
10 Year
|
|---|---|---|---|
|
S&P MidCap Index Fund,
Investor Class
|
16.45%
|
7.47%
|
10.47%
|
|
S&P 1500 Index
|
20.31%
|
12.38%
|
14.98%
|
|
S&P MidCap 400 Index
|
17.12%
|
8.04%
|
10.84%
|
Key Fund Statistics
(as of August 31, 2026)
|
Net Assets
|
$115,666,366
|
|
Total Number of Portfolio Holdings
|
398
|
|
Total Advisory Fees Paid
|
$444,427
|
|
Portfolio Turnover Rate
|
18%
|
What did the Fund invest in?
(% of Total Investments as of August 31, 2026)
Sector Breakdown
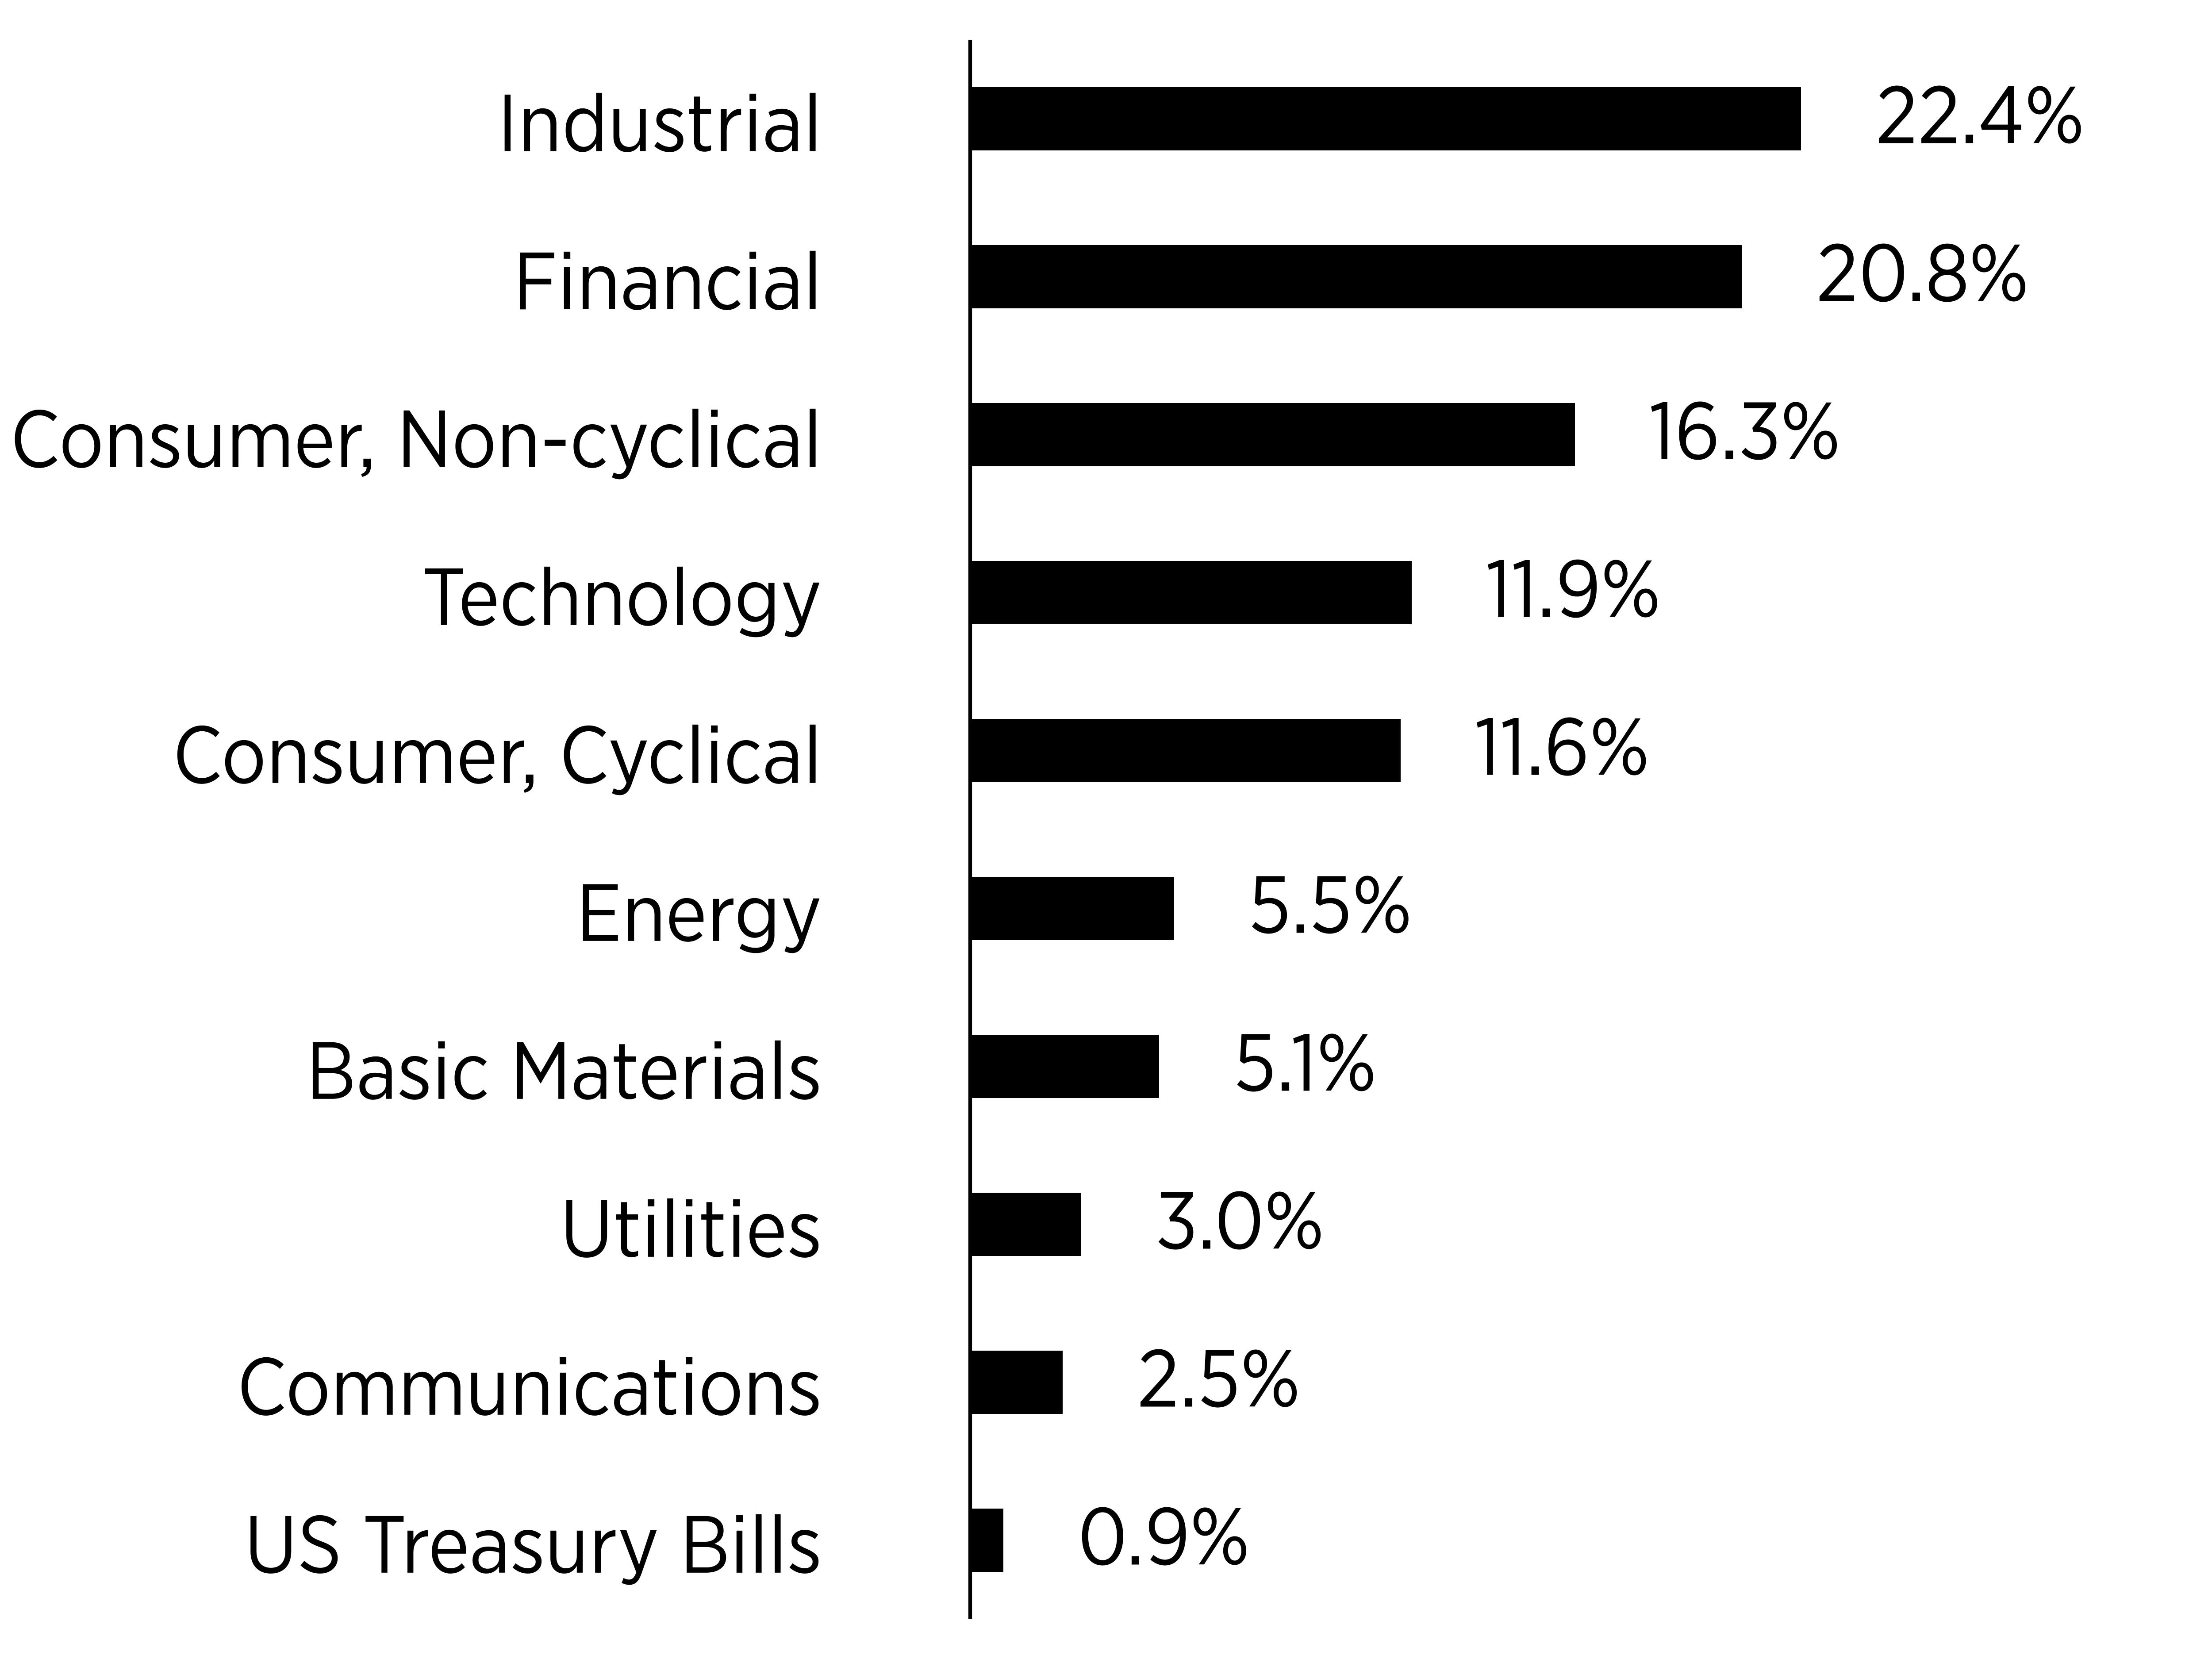
|
Top Ten Holdings
|
Percentage of Total Investments
|
|---|---|
|
Twilio Inc
|
1.0%
|
|
United States Treasury Bill
|
0.9%
|
|
Illumina Inc
|
0.9%
|
|
TechnipFMC PLC
|
0.9%
|
|
Everpure Inc
|
0.8%
|
|
Okta Inc
|
0.8%
|
|
ATI Inc
|
0.8%
|
|
nVent Electric PLC
|
0.7%
|
|
Carpenter Technology Corp
|
0.7%
|
|
US Foods Holding Corp
|
0.6%
|
What were the Fund costs for the last year?
(based on a hypothetical $10,000 investment)
|
Class Name
|
Costs of a
$10,000 investment
|
Costs paid as a percentage of a
$10,000 investment
|
|---|---|---|
|
S&P MidCap Index Fund, K Class
|
$115
|
1.13%
|
What affected the Fund's performance this period?
- For the fiscal year ended August 31, 2026, the evolution of artificial intelligence (AI), including increased investment in AI-related technology and infrastructure, influenced market returns, particularly within the Information Technology sector, while conflict in the Middle East contributed to market volatility. Inflation ranged from 2.4% to 4.2% year-over-year, with higher energy prices contributing to elevated readings in the second half of the fiscal year. During the same period, the Federal Reserve reduced the federal funds rate from 4.5% at the start of the fiscal year to 3.75% by December 2025, where it remained through the end of the fiscal year. While the rate reduction was broadly considered supportive of financial markets, its impacts varied across asset classes. According to Bloomberg L.P., the Fund's correlation was 1.00 to the S&P MidCap 400 Index.
- The Information Technology GICS sector contributed the most to the Fund's total return, gaining over 65%. Within this sector, the Technology Hardware & Equipment industry drove most of the returns, gaining over 126% for the year. Additionally, the Industrials sector was the second largest contributor, returning over 11% for the period, led by the Capital Goods industry, which returned over 15%.
- Contrarily, the GICS Consumer Discretionary sector detracted the most from the Fund's total return, losing more than 6% for the year. Within this sector, the Consumer Services industry detracted the most, losing more than 10%. Additionally, the Consumer Staples sector detracted from the Fund's total return despite a positive return of over 2% for the period, brought down the most by the Household & Personal Products industry, which lost more than 30%.
- In terms of specific stock holdings, Lumentum Holdings, Flex, and Ciena were the top three contributors to the total return of the Fund, gaining over 448%, 200%, and 208%, respectively. Conversely, the top three detractors were AECOM, Sprouts Farmers Market, and Duolingo, which lost more than 45%, 41%, and 50%, respectively, for the Fund's fiscal year.
Cumulative Performance
(based on a hypothetical $10,000 investment)
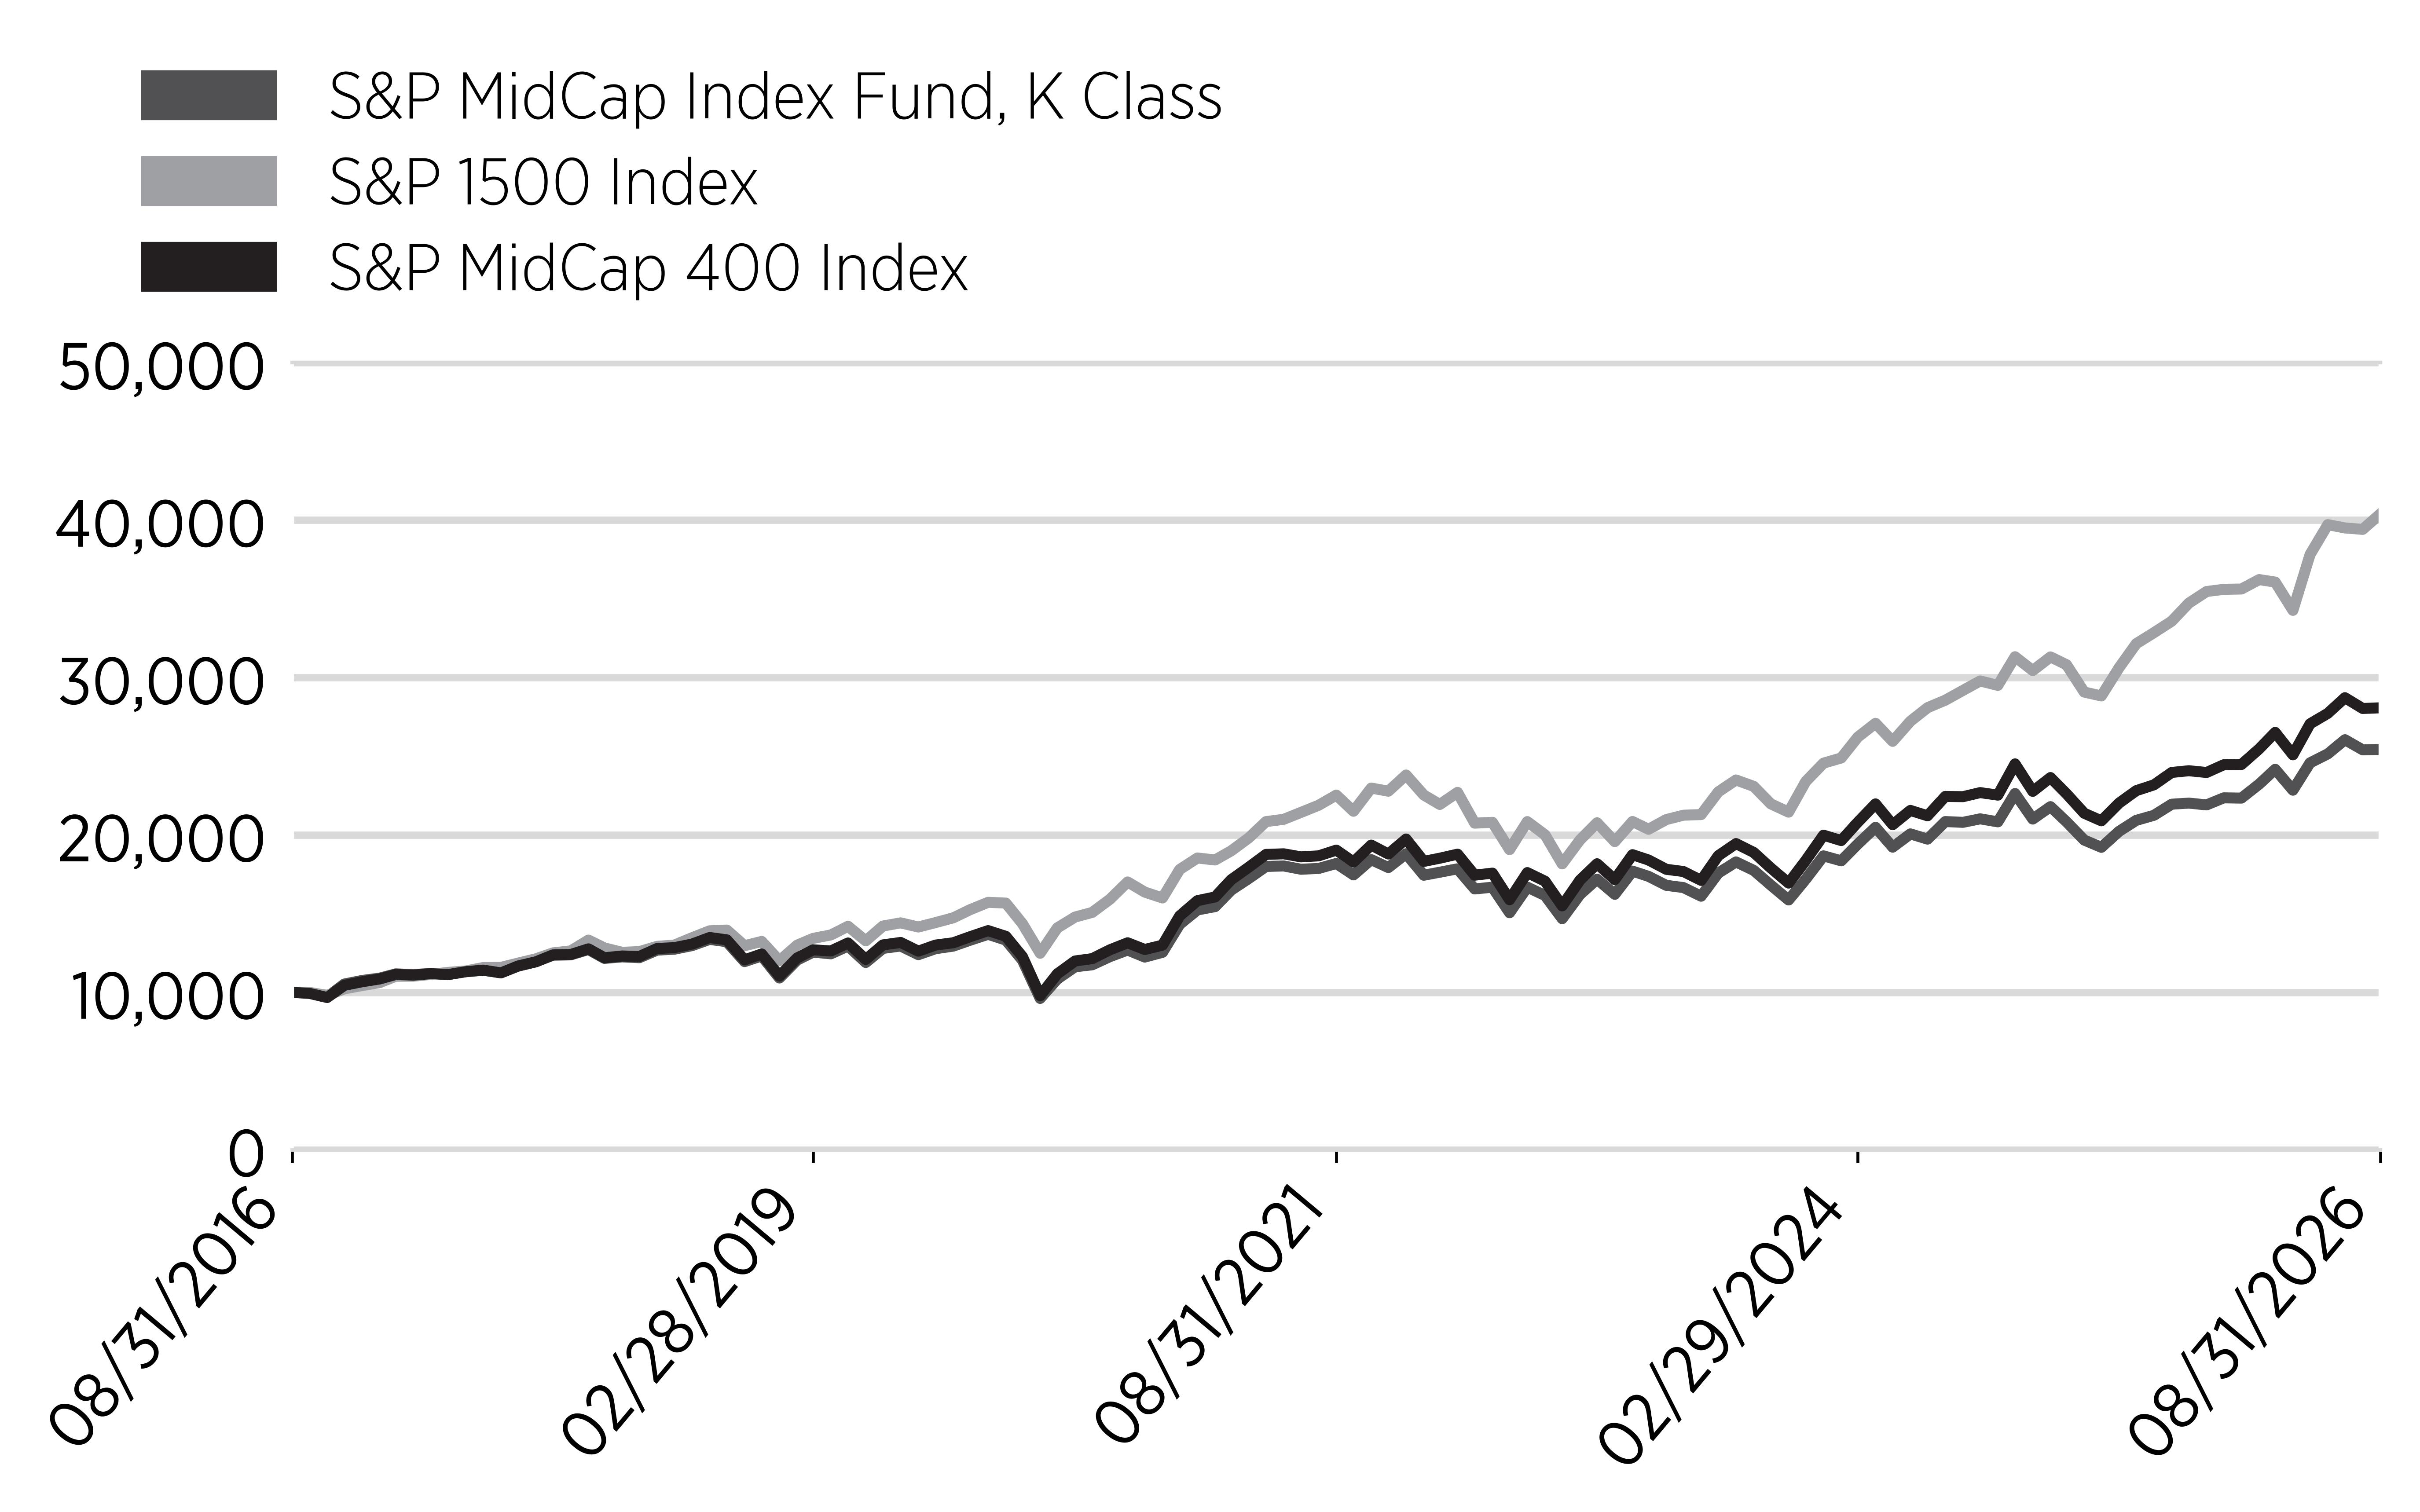
Annual Performance
|
Annual Performance
|
1 Year
|
5 Year
|
10 Year
|
|---|---|---|---|
|
S&P MidCap Index Fund, K Class
|
15.86%
|
6.94%
|
9.79%
|
|
S&P 1500 Index
|
20.31%
|
12.38%
|
14.98%
|
|
S&P MidCap 400 Index
|
17.12%
|
8.04%
|
10.84%
|
Key Fund Statistics
(as of August 31, 2026)
|
Net Assets
|
$116,462
|
|
Total Number of Portfolio Holdings
|
398
|
|
Total Advisory Fees Paid
|
$1,432
|
|
Portfolio Turnover Rate
|
18%
|
What did the Fund invest in?
(% of Total Investments as of August 31, 2026)
Sector Breakdown
|
Top Ten Holdings
|
Percentage of Total Investments
|
|---|---|
|
Twilio Inc
|
1.0%
|
|
United States Treasury Bill
|
0.9%
|
|
Illumina Inc
|
0.9%
|
|
TechnipFMC PLC
|
0.9%
|
|
Everpure Inc
|
0.8%
|
|
Okta Inc
|
0.8%
|
|
ATI Inc
|
0.8%
|
|
nVent Electric PLC
|
0.7%
|
|
Carpenter Technology Corp
|
0.7%
|
|
US Foods Holding Corp
|
0.6%
|
What were the Fund costs for the last year?
(based on a hypothetical $10,000 investment)
|
Class Name
|
Costs of a $10,000 investment
|
Costs paid as a percentage of a $10,000 investment
|
|---|---|---|
|
Shelton Equity Income Fund, Investor Class
|
$62
|
0.61%
|
What affected the Fund's performance this period?
- Positive Stock Selection: Security selection contributed positively to performance relative to the S&P 500 Index. Micron Technology (MU), Microsoft (MSFT), and Caterpillar (CAT) were the largest positive contributors to relative performance from security selection. Advanced Micro Devices (AMD), NetApp (NTAP), and Goldman Sachs (GS) also contributed positively.
- Holdings That Detracted: Positive stock selection was partially offset by negative relative contributions from Palo Alto Networks (PANW), Intuit (INTU), Intuitive Surgical (ISRG), and Applied Materials (AMAT). At the sector level, security selection in communication services and consumer discretionary detracted, while selection in financials, consumer staples, and healthcare contributed positively.
- Sector Allocation: Sector and other allocation effects detracted from performance relative to the S&P 500. The Fund’s lower weighting in information technology during the period was the largest sector allocation detractor, despite positive stock selection within that sector. Allocation effects in healthcare and industrials partially offset this drag.
- Covered Call Strategy: The Fund continued writing covered calls on individual equity holdings to generate cash flow alongside portfolio dividends. Option premiums provided a limited cushion against declines in the underlying stocks, while calls limited gains on covered shares when stock prices exceeded their strike prices. Strike prices, expiration dates, and coverage levels were actively managed to seek to balance cash flow generation with participation in equity appreciation.
Cumulative Performance
(based on a hypothetical $10,000 investment)
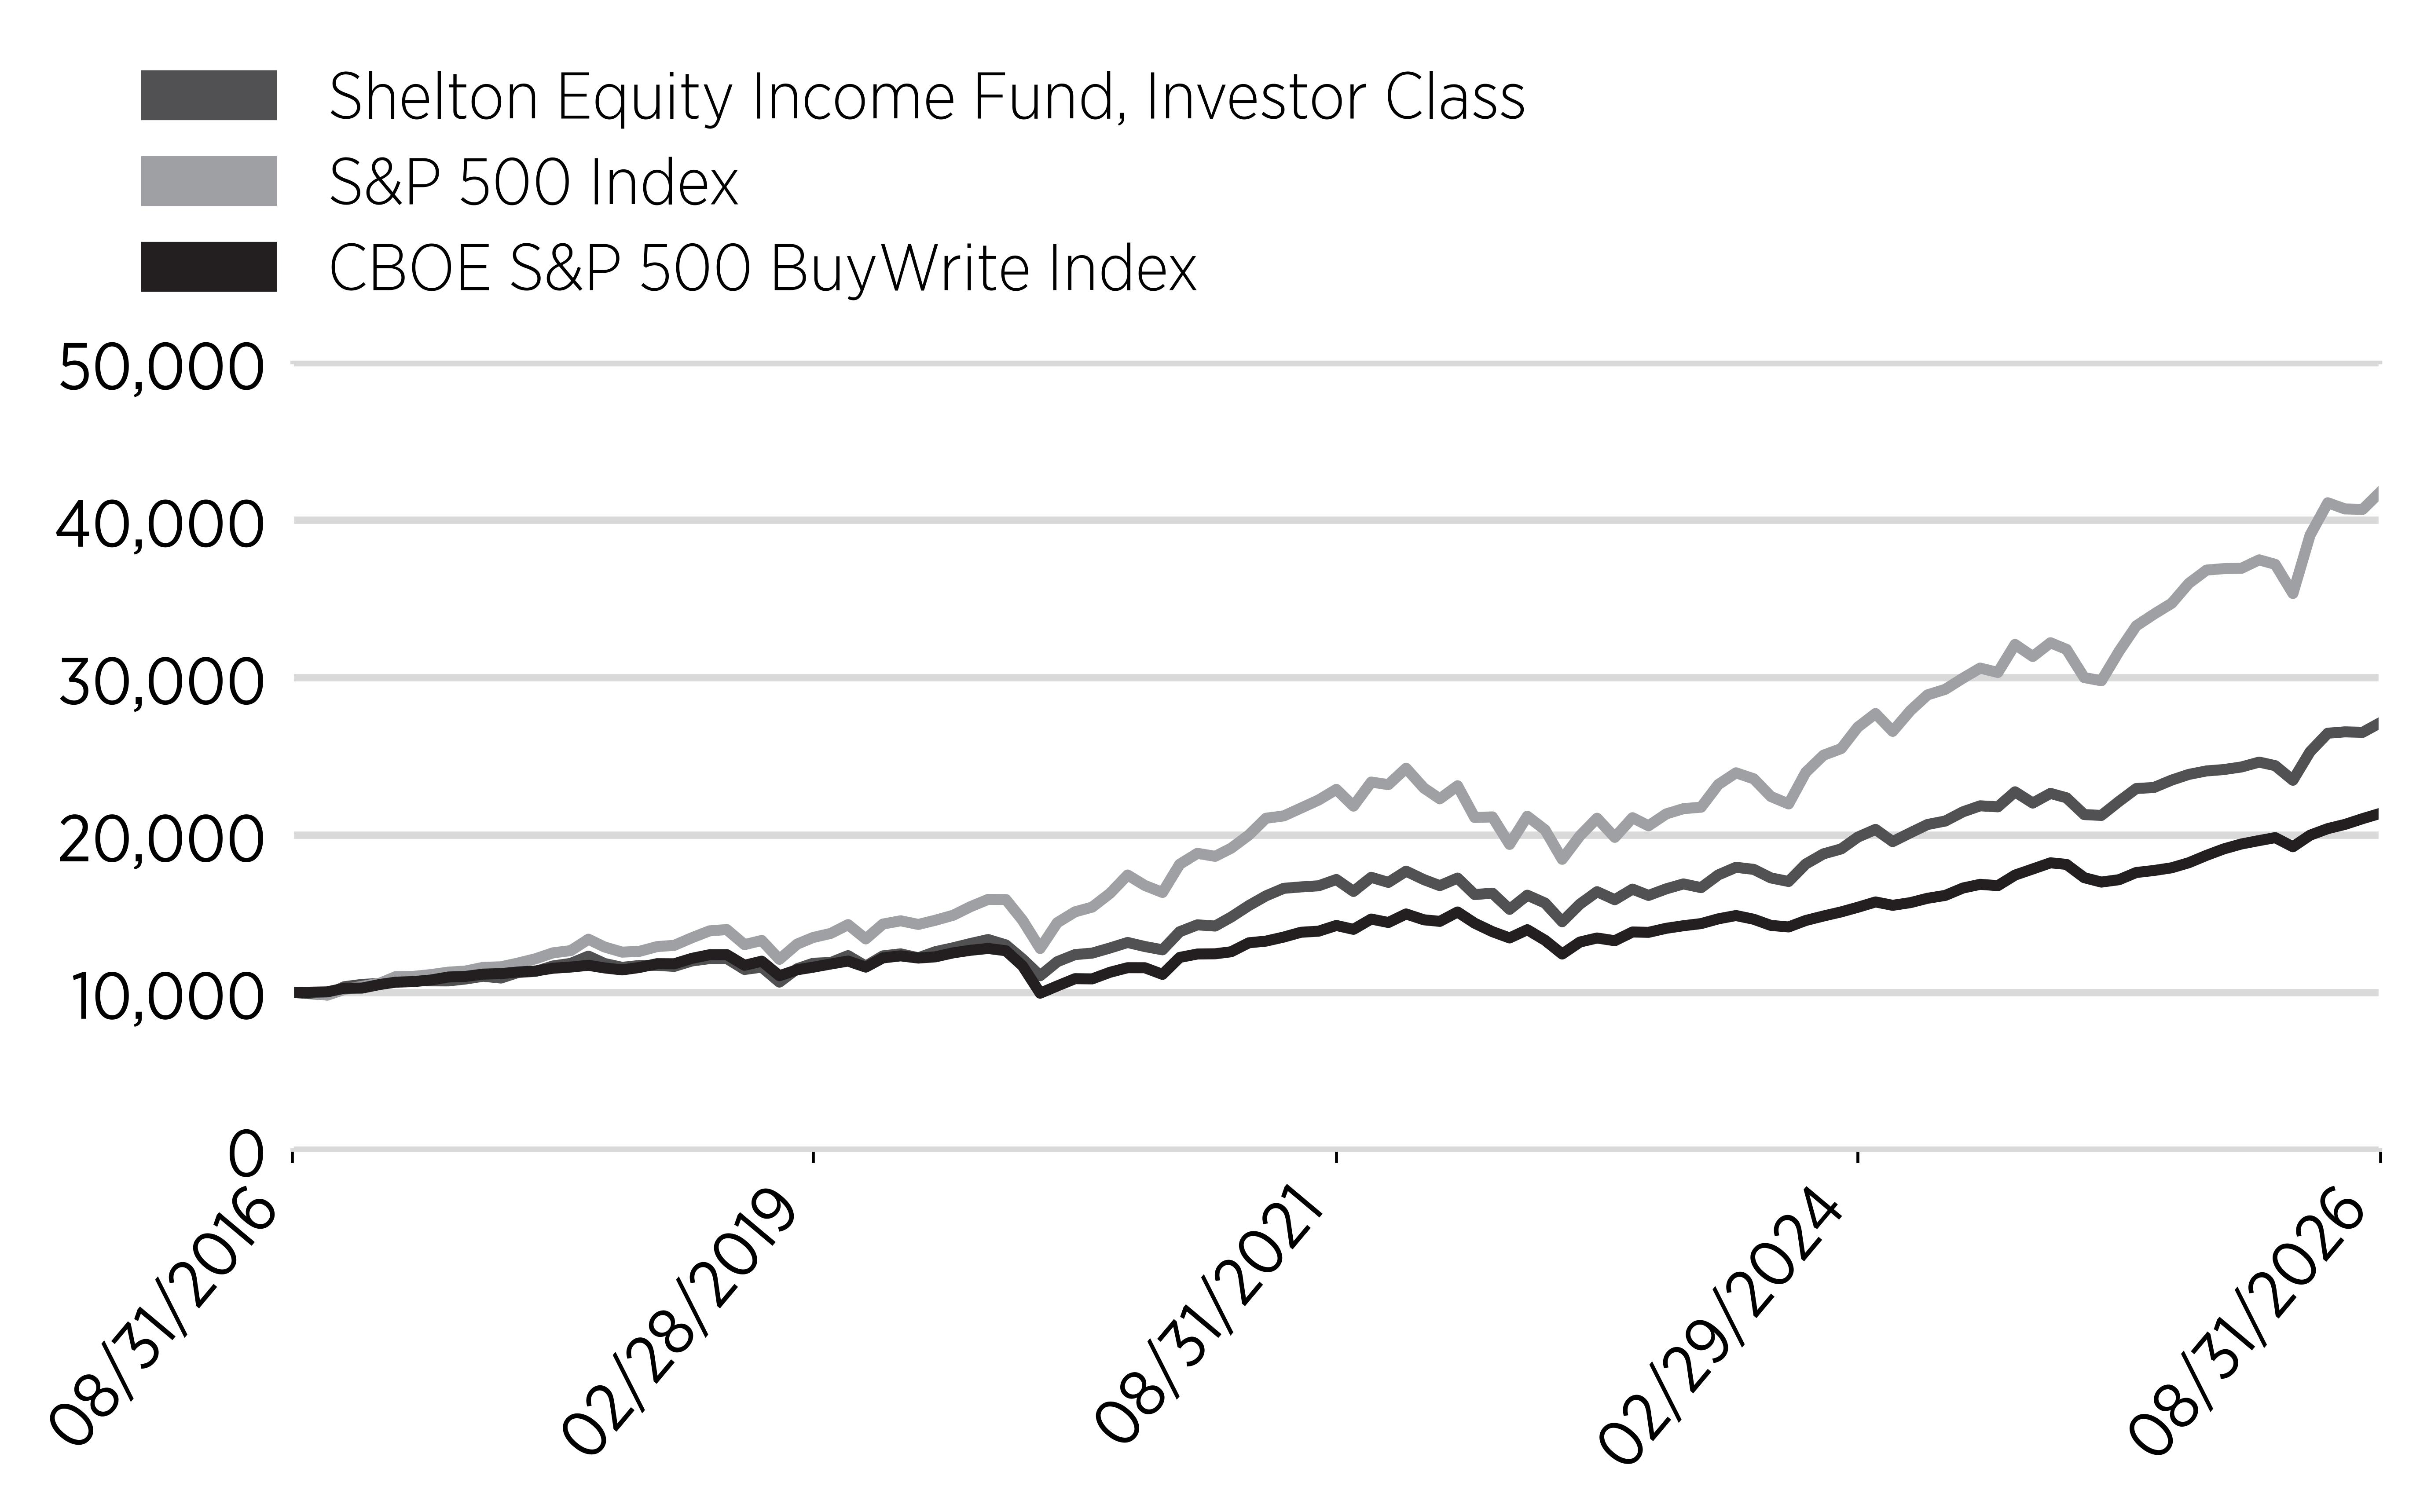
Annual Performance
|
Annual Performance
|
1 Year
|
5 Year
|
10 Year
|
|---|---|---|---|
|
Shelton Equity Income Fund,
Investor Class
|
15.55%
|
9.59%
|
10.50%
|
|
S&P 500 Index
|
20.35%
|
12.76%
|
15.35%
|
|
CBOE S&P 500 BuyWrite Index
|
19.31%
|
8.44%
|
7.89%
|
Key Fund Statistics
(as of August 31, 2026)
|
Net Assets
|
$1,152,199,013
|
|
Total Number of Portfolio Holdings
|
182
|
|
Total Advisory Fees Paid
|
$4,789,281
|
|
Portfolio Turnover Rate
|
76%
|
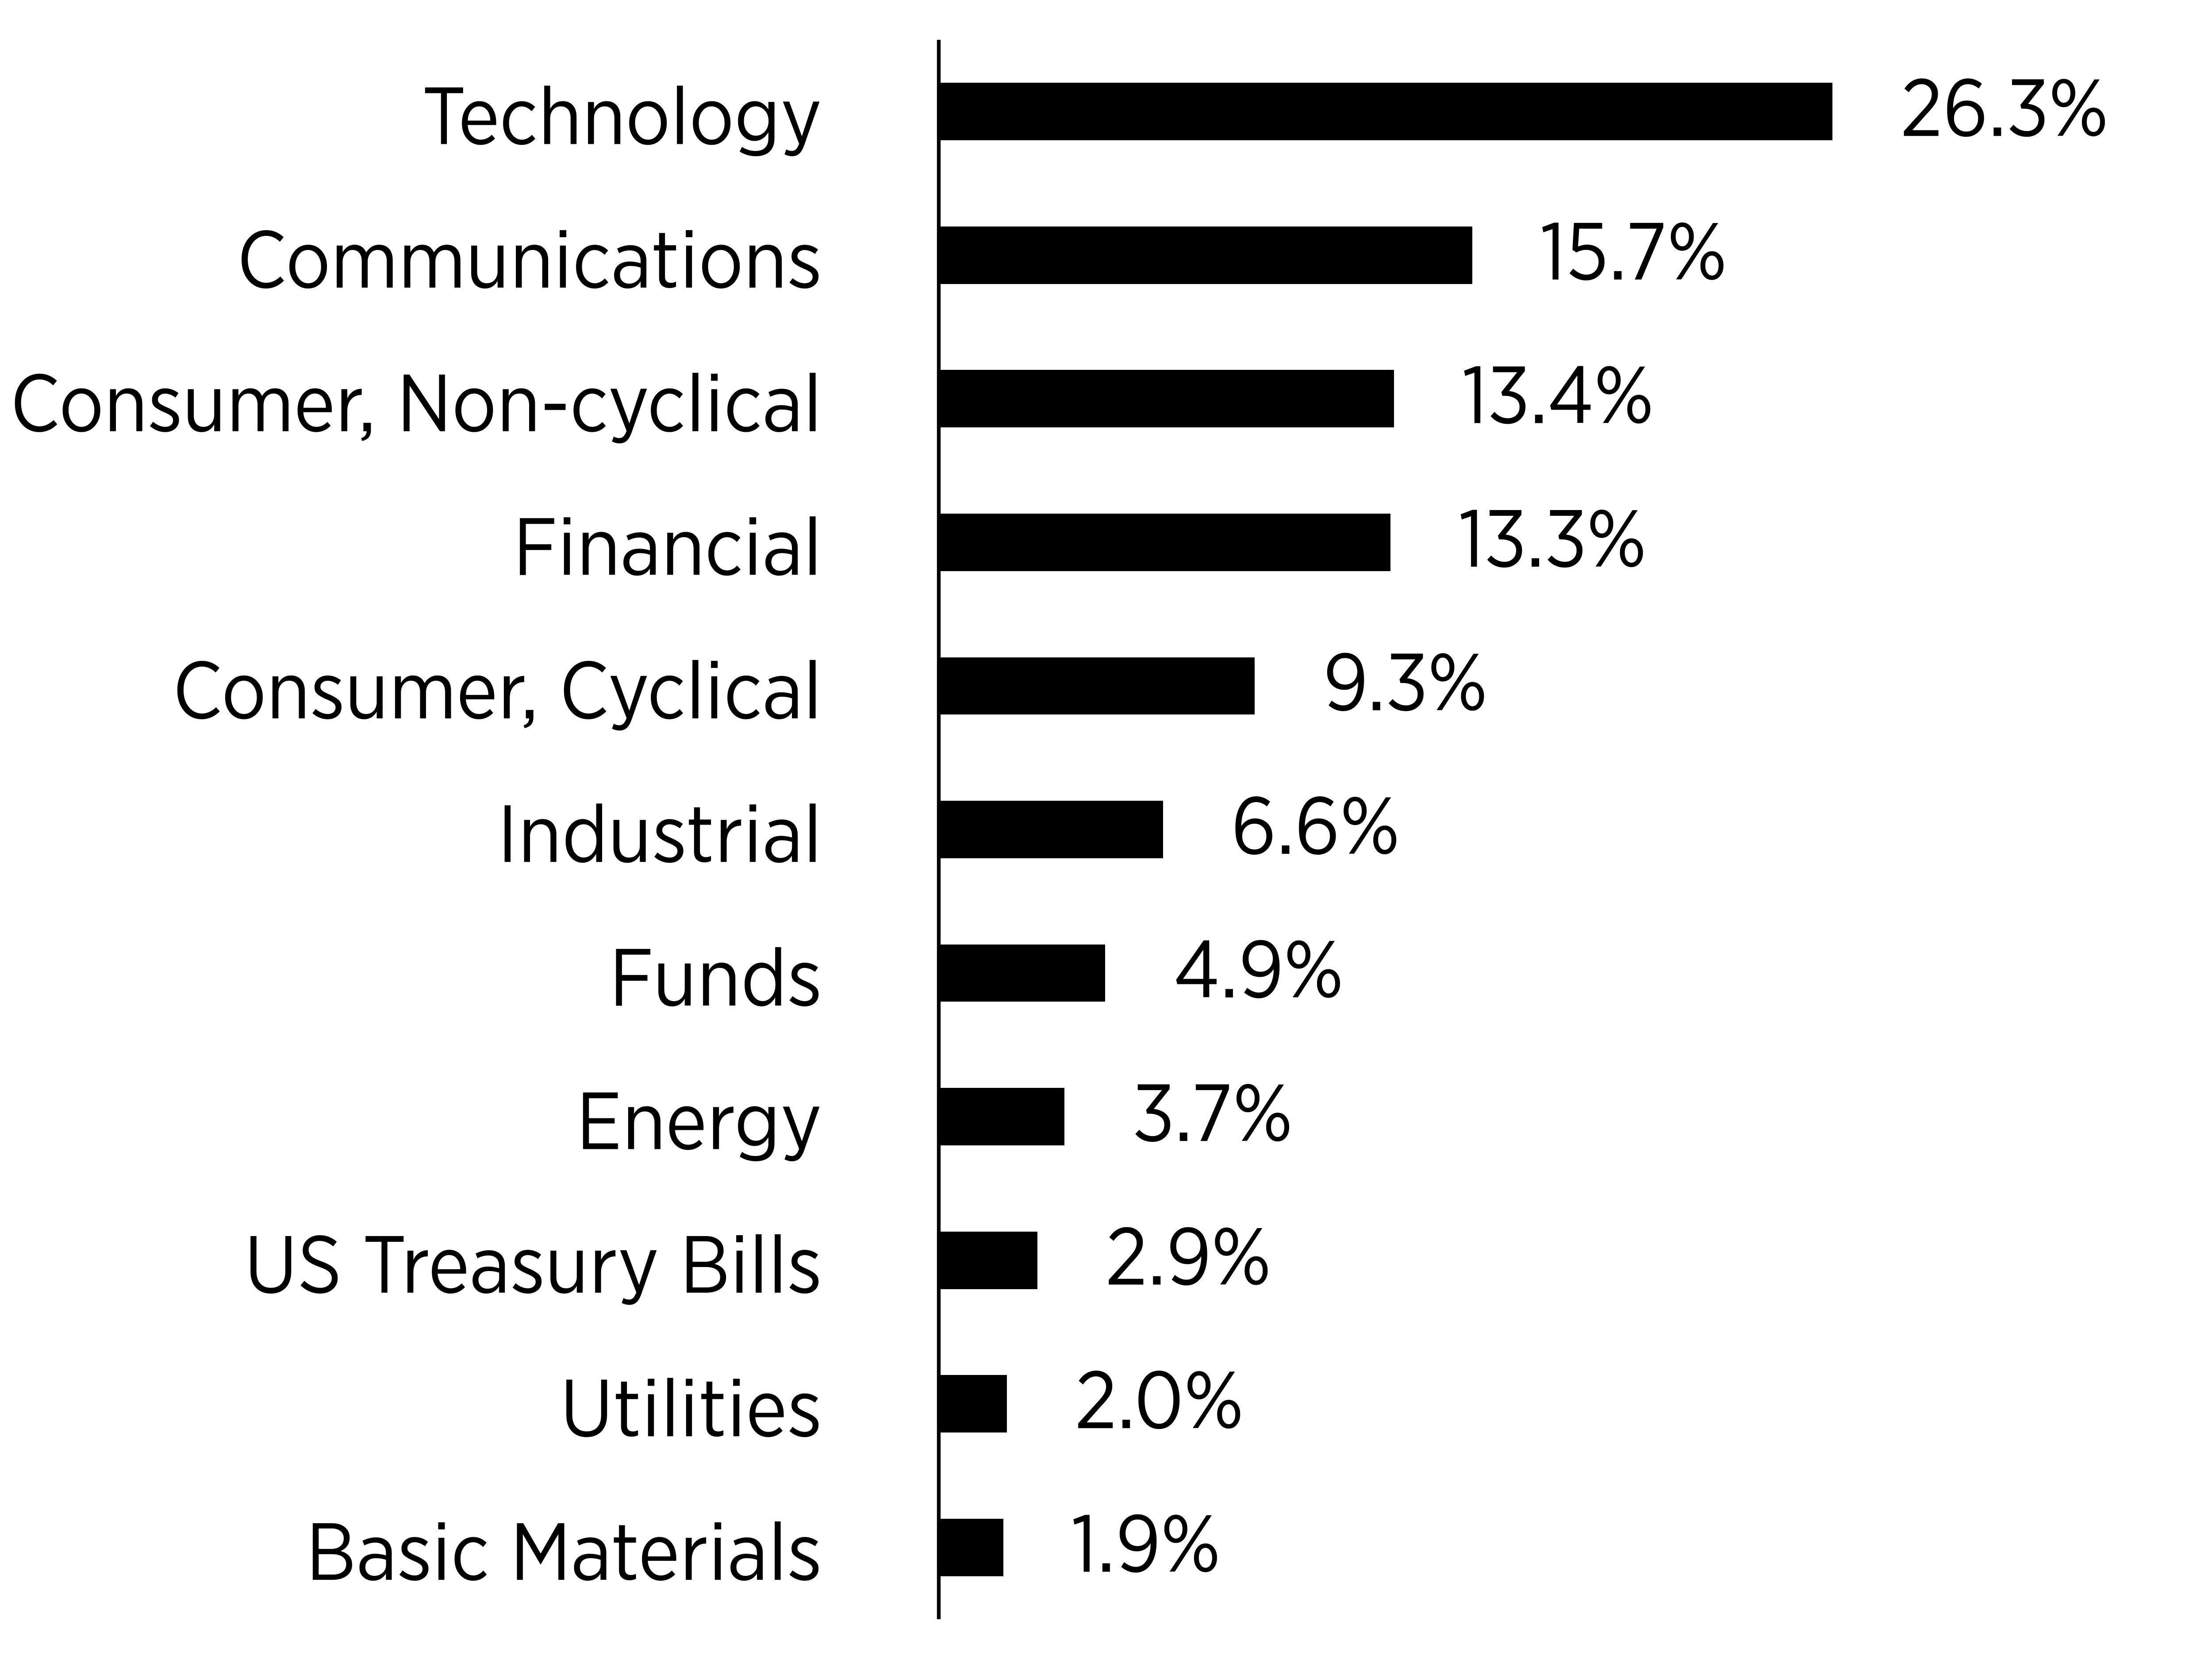
What did the Fund invest in?
(% of Total Investments as of August 31, 2026)
Sector Breakdown
|
Top Ten Holdings
|
Percentage of Total Investments
|
|---|---|
|
Shelton Equity Premium Income ETF
|
4.9%
|
|
NVIDIA Corp
|
3.3%
|
|
Microsoft Corp
|
3.2%
|
|
Apple Inc
|
3.1%
|
|
United States Treasury Bill
|
2.9%
|
|
Micron Technology Inc
|
2.9%
|
|
Meta Platforms Inc
|
2.7%
|
|
Alphabet Inc - Class A
|
2.5%
|
|
The Goldman Sachs Group Inc
|
2.4%
|
|
Arista Networks Inc
|
2.0%
|
What were the Fund costs for the last year?
(based on a hypothetical $10,000 investment)
|
Class Name
|
Costs of a
$10,000 investment
|
Costs paid as a percentage of a
$10,000 investment
|
|---|---|---|
|
Shelton Equity Income Fund,
K Class
|
$112
|
1.10%
|
What affected the Fund's performance this period?
- Positive Stock Selection: Security selection contributed positively to performance relative to the S&P 500 Index. Micron Technology (MU), Microsoft (MSFT), and Caterpillar (CAT) were the largest positive contributors to relative performance from security selection. Advanced Micro Devices (AMD), NetApp (NTAP), and Goldman Sachs (GS) also contributed positively.
- Holdings That Detracted: Positive stock selection was partially offset by negative relative contributions from Palo Alto Networks (PANW), Intuit (INTU), Intuitive Surgical (ISRG), and Applied Materials (AMAT). At the sector level, security selection in communication services and consumer discretionary detracted, while selection in financials, consumer staples, and healthcare contributed positively.
- Sector Allocation: Sector and other allocation effects detracted from performance relative to the S&P 500. The Fund’s lower weighting in information technology during the period was the largest sector allocation detractor, despite positive stock selection within that sector. Allocation effects in healthcare and industrials partially offset this drag.
- Covered Call Strategy: The Fund continued writing covered calls on individual equity holdings to generate cash flow alongside portfolio dividends. Option premiums provided a limited cushion against declines in the underlying stocks, while calls limited gains on covered shares when stock prices exceeded their strike prices. Strike prices, expiration dates, and coverage levels were actively managed to seek to balance cash flow generation with participation in equity appreciation.
Cumulative Performance
(based on a hypothetical $10,000 investment)
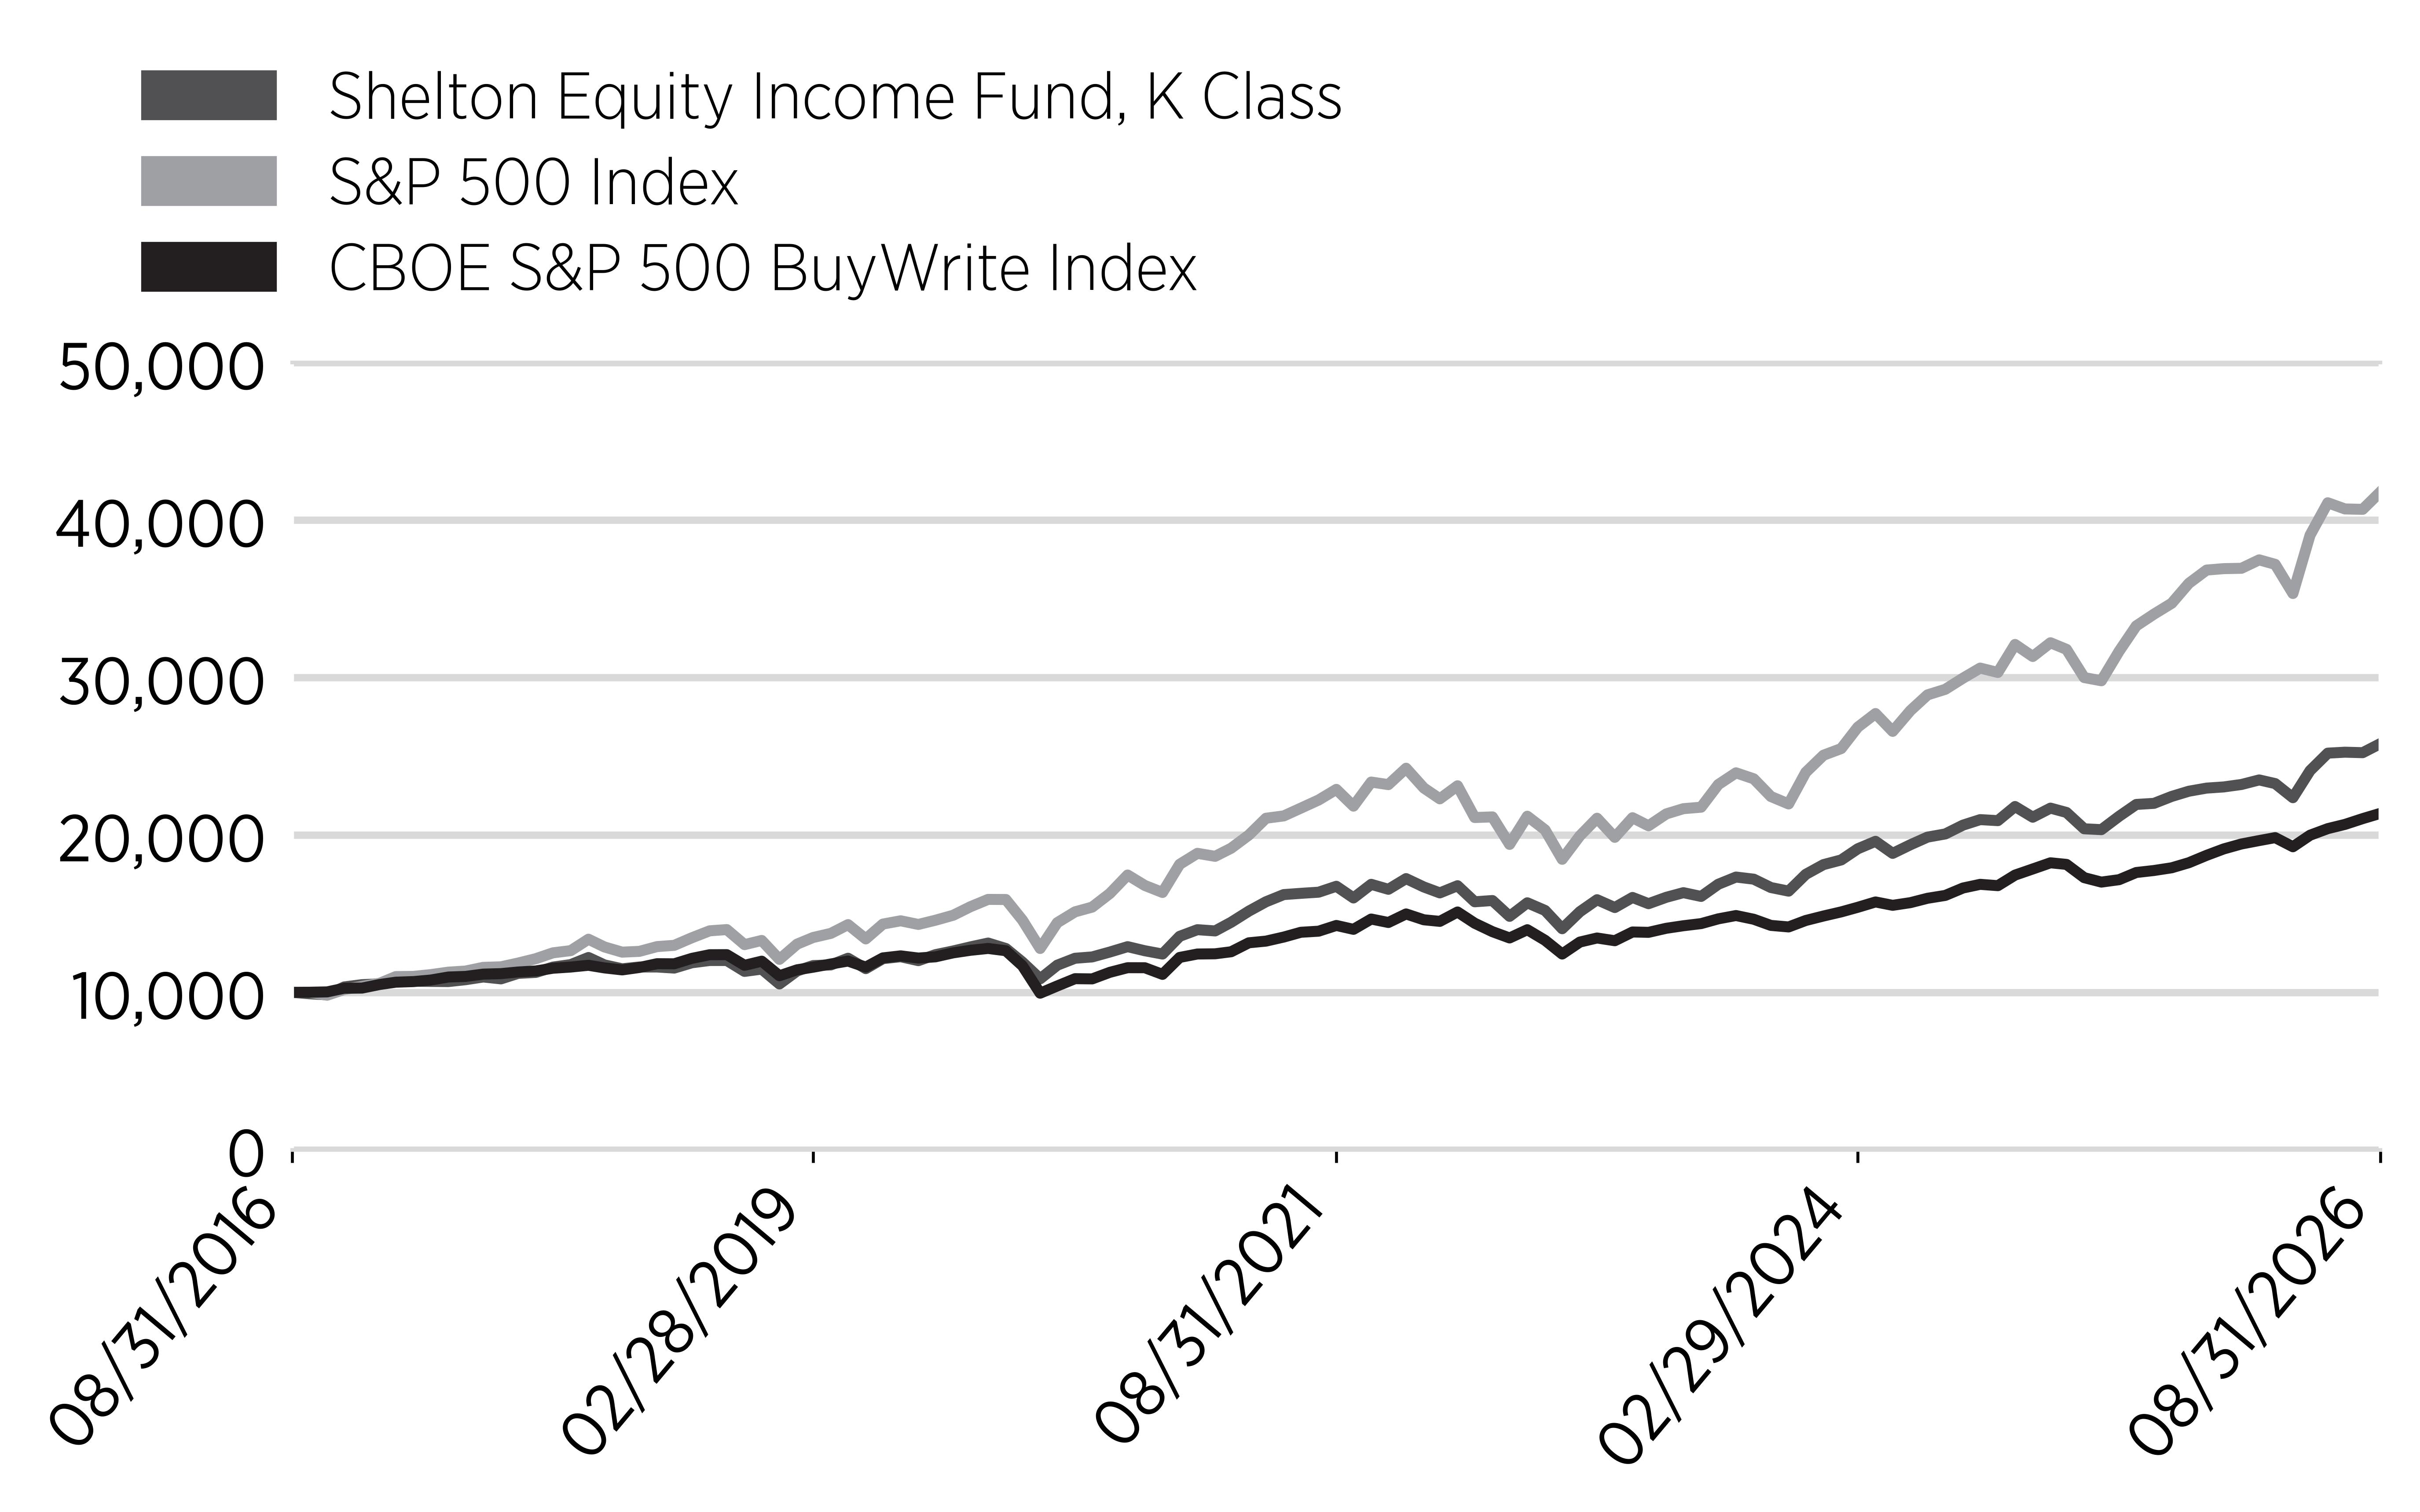
Annual Performance
|
Annual Performance
|
1 Year
|
5 Year
|
10 Year
|
|---|---|---|---|
|
Shelton Equity Income Fund, K Class
|
14.95%
|
9.04%
|
9.94%
|
|
S&P 500 Index
|
20.35%
|
12.76%
|
15.35%
|
|
CBOE S&P 500 BuyWrite Index
|
19.31%
|
8.44%
|
7.89%
|
Key Fund Statistics
(as of August 31, 2026)
|
Net Assets
|
$79,391
|
|
Total Number of Portfolio Holdings
|
182
|
|
Total Advisory Fees Paid
|
$489
|
|
Portfolio Turnover Rate
|
76%
|
What did the Fund invest in?
(% of Total Investments as of August 31, 2026)
Sector Breakdown
|
Top Ten Holdings
|
Percentage of Total Investments
|
|---|---|
|
Shelton Equity Premium Income ETF
|
4.9%
|
|
NVIDIA Corp
|
3.3%
|
|
Microsoft Corp
|
3.2%
|
|
Apple Inc
|
3.1%
|
|
United States Treasury Bill
|
2.9%
|
|
Micron Technology Inc
|
2.9%
|
|
Meta Platforms Inc
|
2.7%
|
|
Alphabet Inc - Class A
|
2.5%
|
|
The Goldman Sachs Group Inc
|
2.4%
|
|
Arista Networks Inc
|
2.0%
|
What were the Fund costs for the last year?
(based on a hypothetical $10,000 investment)
|
Class Name
|
Costs of a
$10,000 investment
|
Costs paid as a percentage of a
$10,000 investment
|
|---|---|---|
|
S&P SmallCap Index Fund, Investor Class
|
$88
|
0.86%
|
What affected the Fund's performance this period?
- For the fiscal year ended August 31, 2026, the evolution of artificial intelligence (AI), including increased investment in AI-related technology and infrastructure, influenced market returns, particularly within the Information Technology sector, while conflict in the Middle East contributed to market volatility. Inflation ranged from 2.4% to 4.2% year-over-year, with higher energy prices contributing to elevated readings in the second half of the fiscal year. During the same period, the Federal Reserve reduced the federal funds rate from 4.5% at the start of the fiscal year to 3.75% by December 2025, where it remained through the end of the fiscal year. While the rate reduction was broadly considered supportive of financial markets, its impacts varied across asset classes. According to Bloomberg L.P., the Fund's correlation was 1.00 to the S&P SmallCap 600 Index.
- The Information Technology GICS sector contributed the most to the Fund's total return, gaining over 61%. Within this sector, the Technology Hardware & Equipment industry drove most of the returns, gaining over 85% for the year. Additionally, the Health Care sector was the second largest contributor, returning over 31% for the period, led by the Pharmaceuticals, Biotechnology & Life Sciences industry, which returned over 51%.
- While no GICS sector detracted from the Fund's total return for the year, the Consumer Staples sector contributed the least, with a positive return of over 8%. Within this sector, the Food, Beverage & Tobacco industry detracted from the Fund's total return, losing more than 7% for the period.
- In terms of specific stock holdings, Sandisk, Semtech, and Viavi Solutions were the top three contributors to the total return of the Fund, gaining over 325%, 179%, and 347%, respectively. Conversely, the top three detractors were FMC, Stride, and Verra Mobility, which lost more than 69%, 46%, and 82%, respectively, for the Fund's fiscal year.
Cumulative Performance
(based on a hypothetical $10,000 investment)
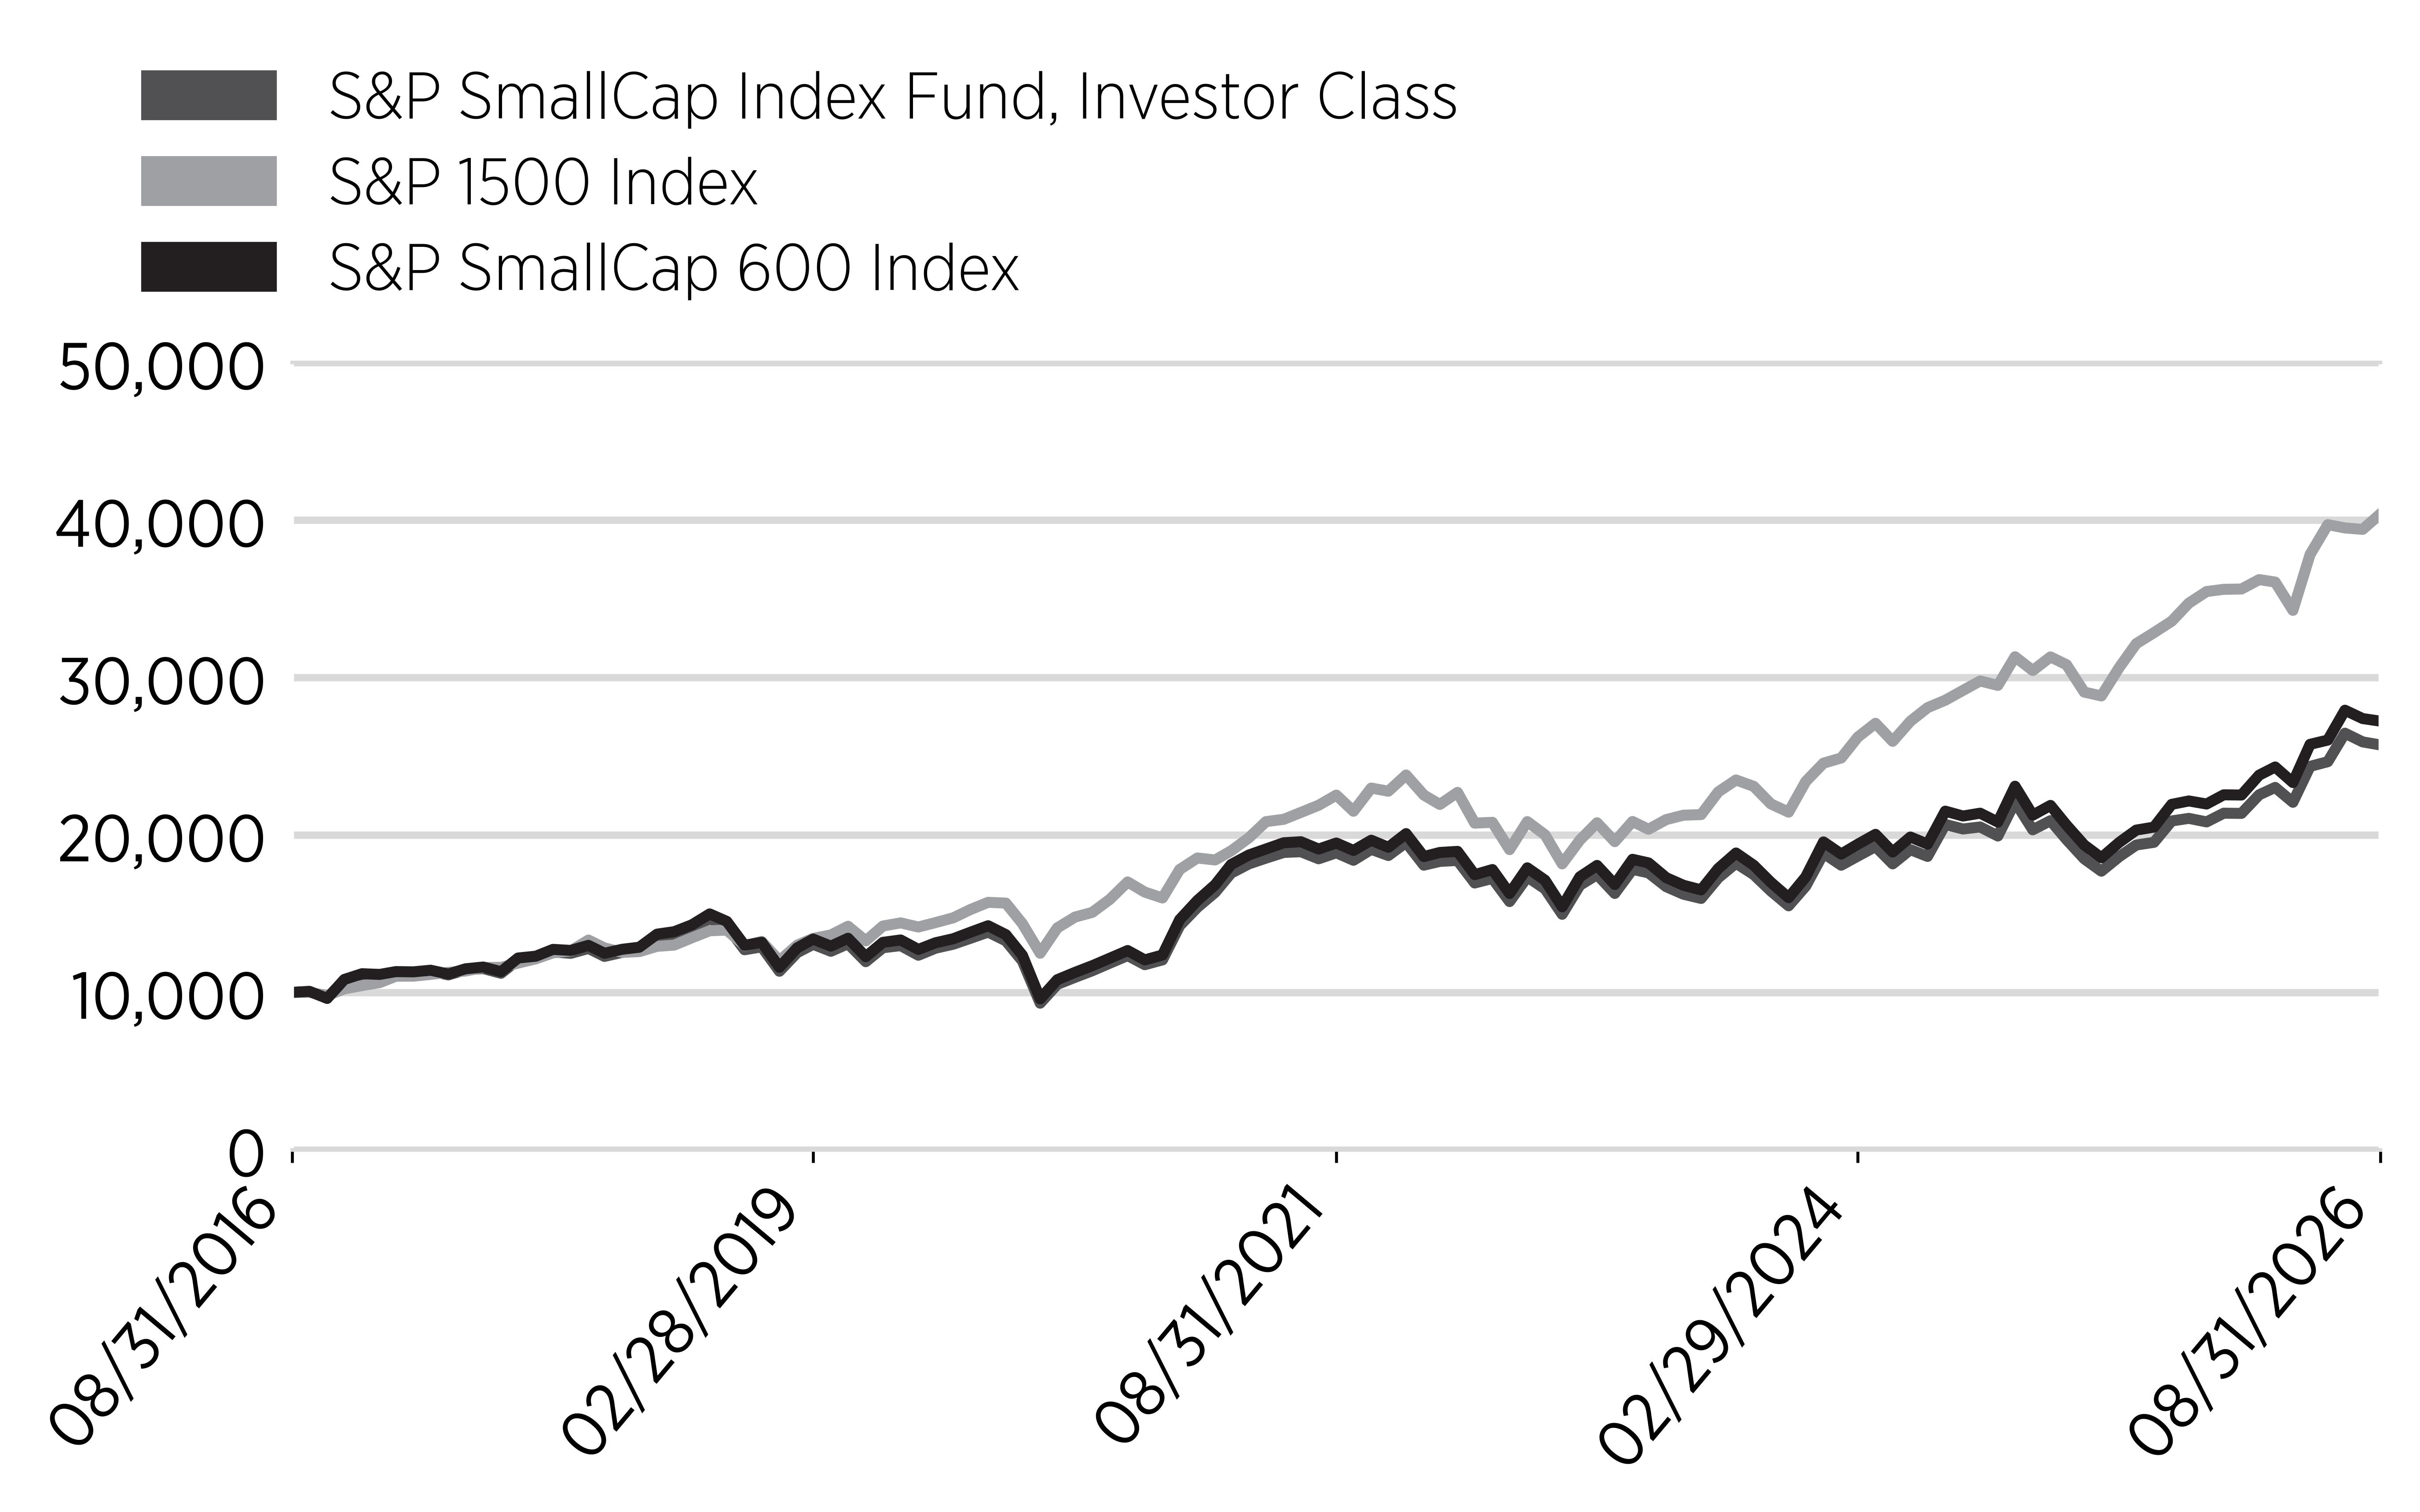
Annual Performance
|
Annual Performance
|
1 Year
|
5 Year
|
10 Year
|
|---|---|---|---|
|
S&P SmallCap Index Fund,
Investor Class
|
23.10%
|
6.39%
|
9.91%
|
|
S&P 1500 Index
|
20.31%
|
12.38%
|
14.98%
|
|
S&P SmallCap 600 Index
|
24.14%
|
6.87%
|
10.47%
|
Key Fund Statistics
(as of August 31, 2026)
|
Net Assets
|
$48,752,978
|
|
Total Number of Portfolio Holdings
|
591
|
|
Total Advisory Fees Paid
|
$254,683
|
|
Portfolio Turnover Rate
|
27%
|
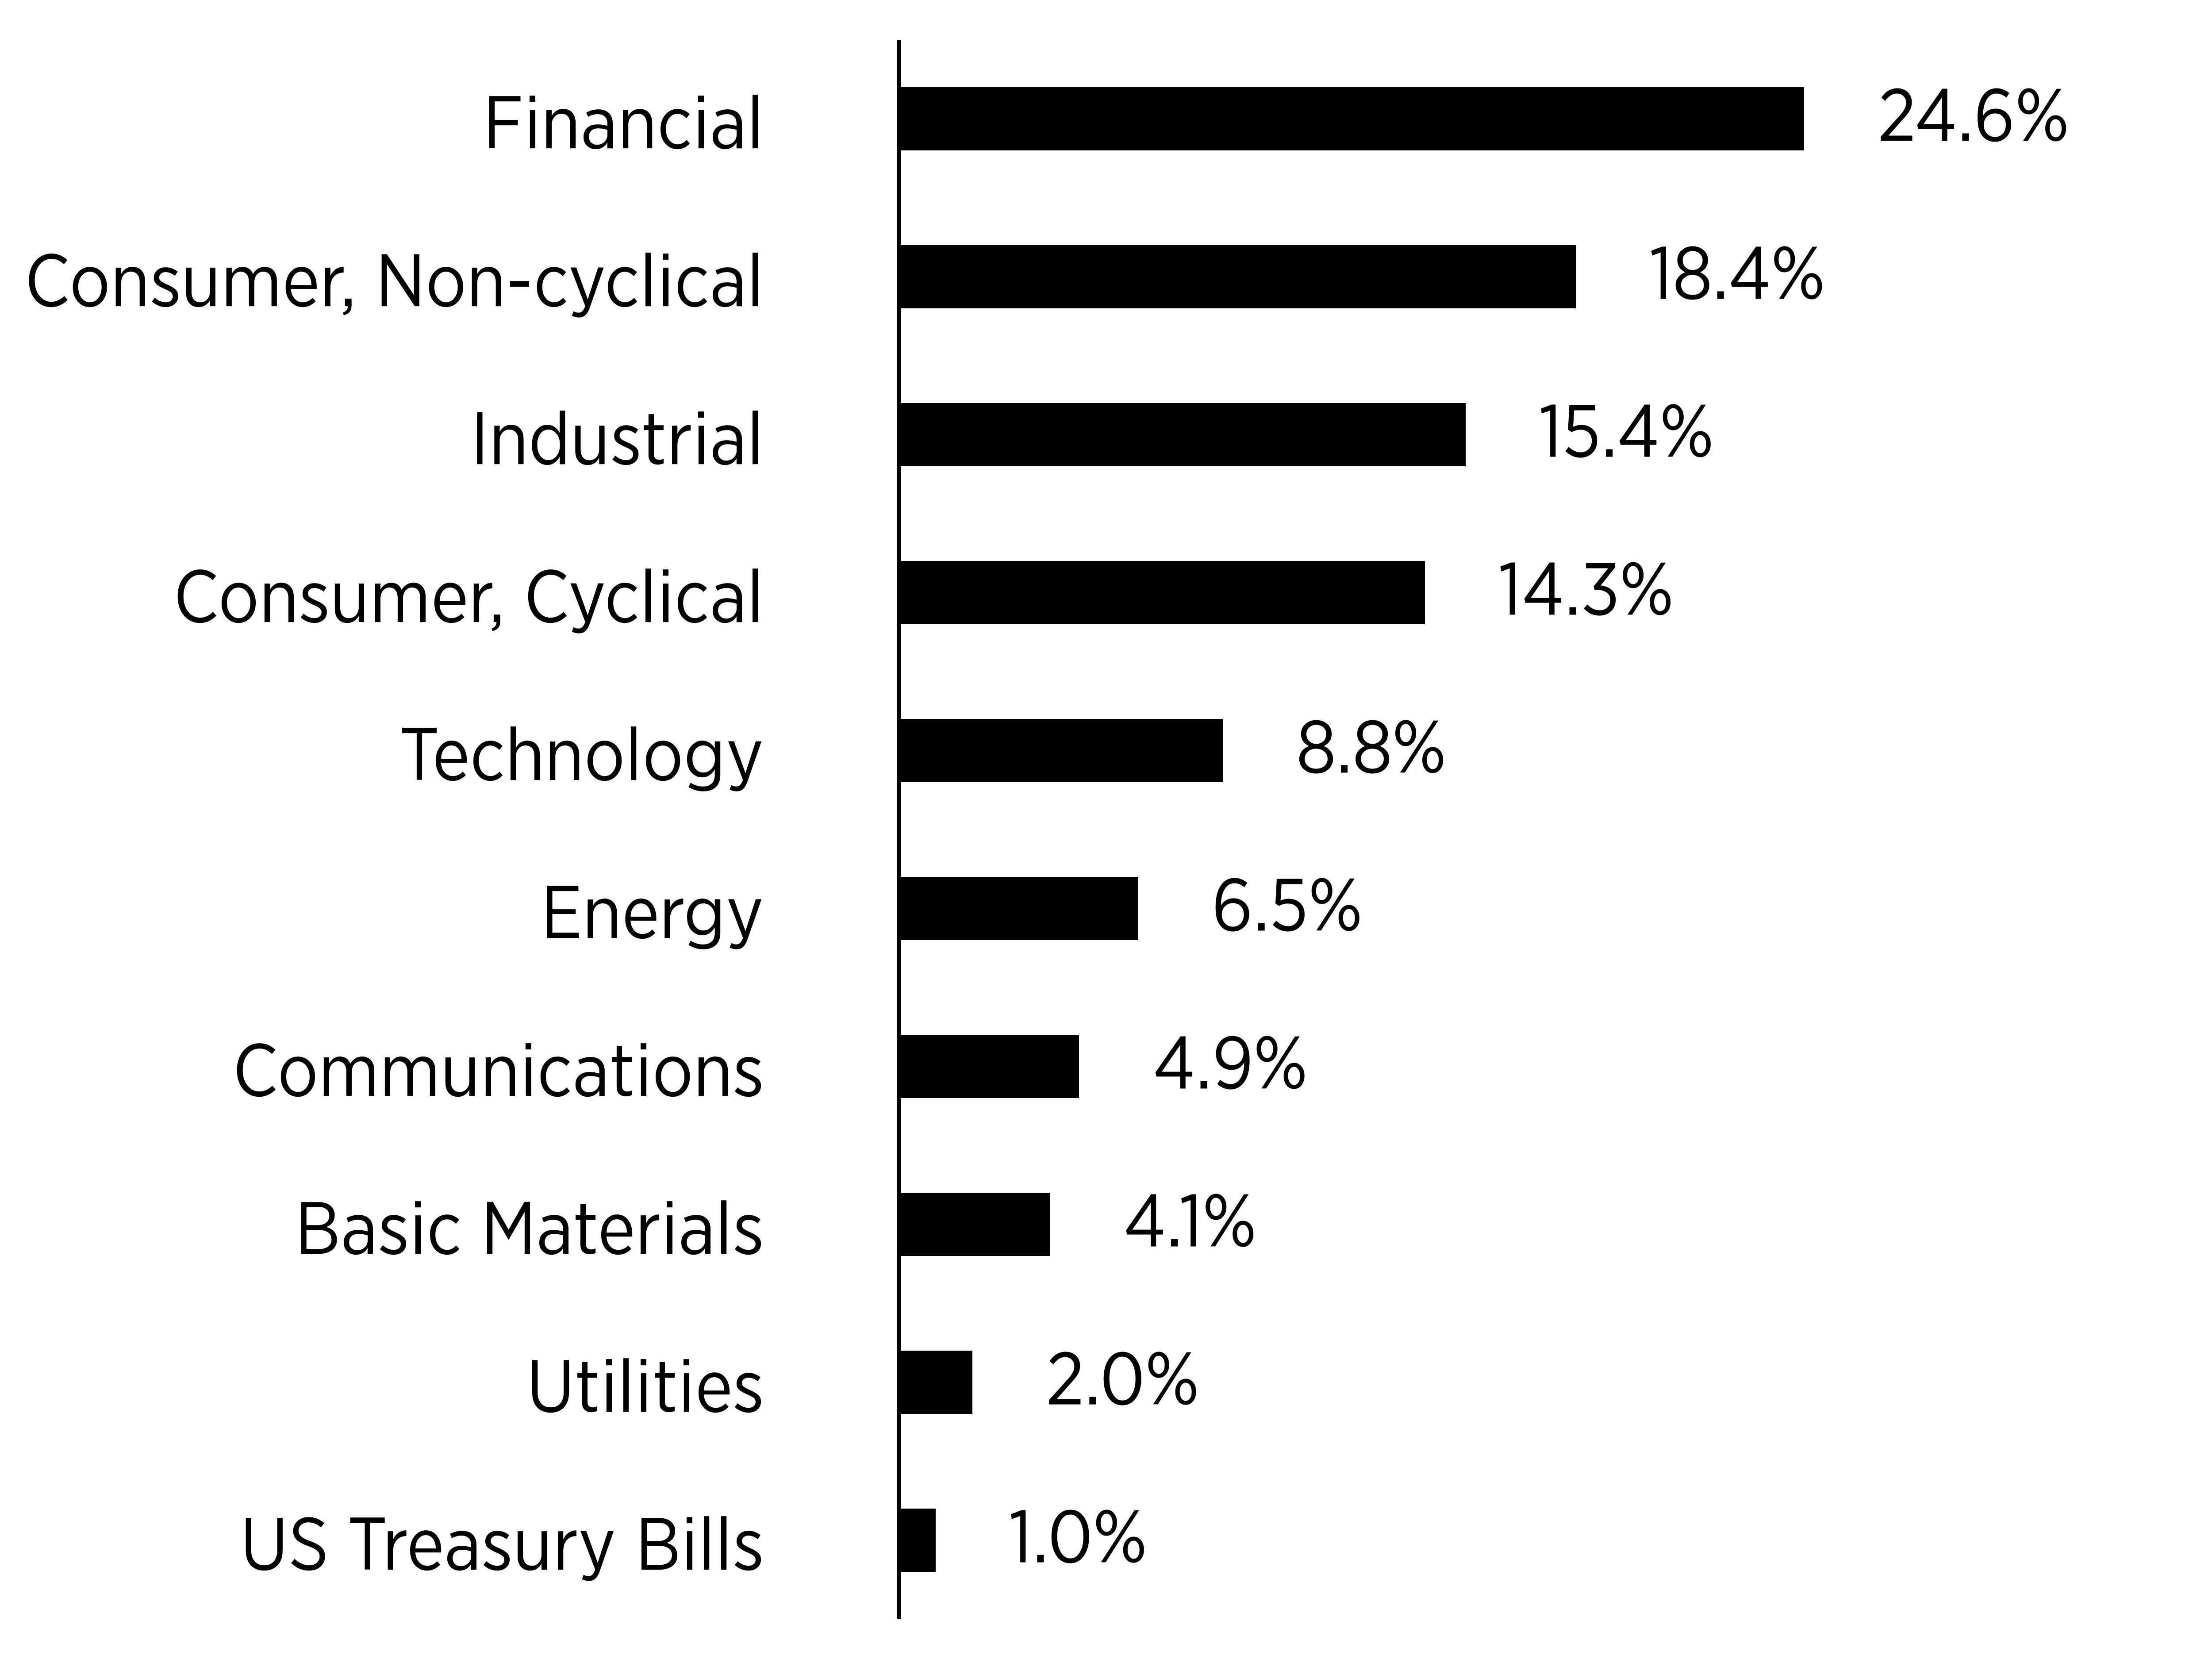
What did the Fund invest in?
(% of Total Investments as of August 31, 2026)
Sector Breakdown
|
Top Ten Holdings
|
Percentage of Total Investments
|
|---|---|
|
United States Treasury Bill
|
1.0%
|
|
Corcept Therapeutics Inc
|
0.6%
|
|
Glaukos Corp
|
0.6%
|
|
Paycom Software Inc
|
0.6%
|
|
Brinker International Inc
|
0.5%
|
|
Match Group Inc
|
0.5%
|
|
Jackson Financial Inc
|
0.5%
|
|
Viasat Inc
|
0.5%
|
|
Protagonist Therapeutics Inc
|
0.5%
|
|
CarMax Inc
|
0.5%
|
What were the Fund costs for the last year?
(based on a hypothetical $10,000 investment)
|
Class Name
|
Costs of a $10,000 investment
|
Costs paid as a percentage of a
$10,000 investment
|
|---|---|---|
|
S&P SmallCap Index Fund,
K Class
|
$141
|
1.39%
|
What affected the Fund's performance this period?
- For the fiscal year ended August 31, 2026, the evolution of artificial intelligence (AI), including increased investment in AI-related technology and infrastructure, influenced market returns, particularly within the Information Technology sector, while conflict in the Middle East contributed to market volatility. Inflation ranged from 2.4% to 4.2% year-over-year, with higher energy prices contributing to elevated readings in the second half of the fiscal year. During the same period, the Federal Reserve reduced the federal funds rate from 4.5% at the start of the fiscal year to 3.75% by December 2025, where it remained through the end of the fiscal year. While the rate reduction was broadly considered supportive of financial markets, its impacts varied across asset classes. According to Bloomberg L.P., the Fund's correlation was 1.00 to the S&P SmallCap 600 Index.
- The Information Technology GICS sector contributed the most to the Fund's total return, gaining over 61%. Within this sector, the Technology Hardware & Equipment industry drove most of the returns, gaining over 85% for the year. Additionally, the Health Care sector was the second largest contributor, returning over 31% for the period, led by the Pharmaceuticals, Biotechnology & Life Sciences industry, which returned over 51%.
- While no GICS sector detracted from the Fund's total return for the year, the Consumer Staples sector contributed the least, with a positive return of over 8%. Within this sector, the Food, Beverage & Tobacco industry detracted from the Fund's total return, losing more than 7% for the period.
- In terms of specific stock holdings, Sandisk, Semtech, and Viavi Solutions were the top three contributors to the total return of the Fund, gaining over 325%, 179%, and 347%, respectively. Conversely, the top three detractors were FMC, Stride, and Verra Mobility, which lost more than 69%, 46%, and 82%, respectively, for the Fund's fiscal year.
Cumulative Performance
(based on a hypothetical $10,000 investment)
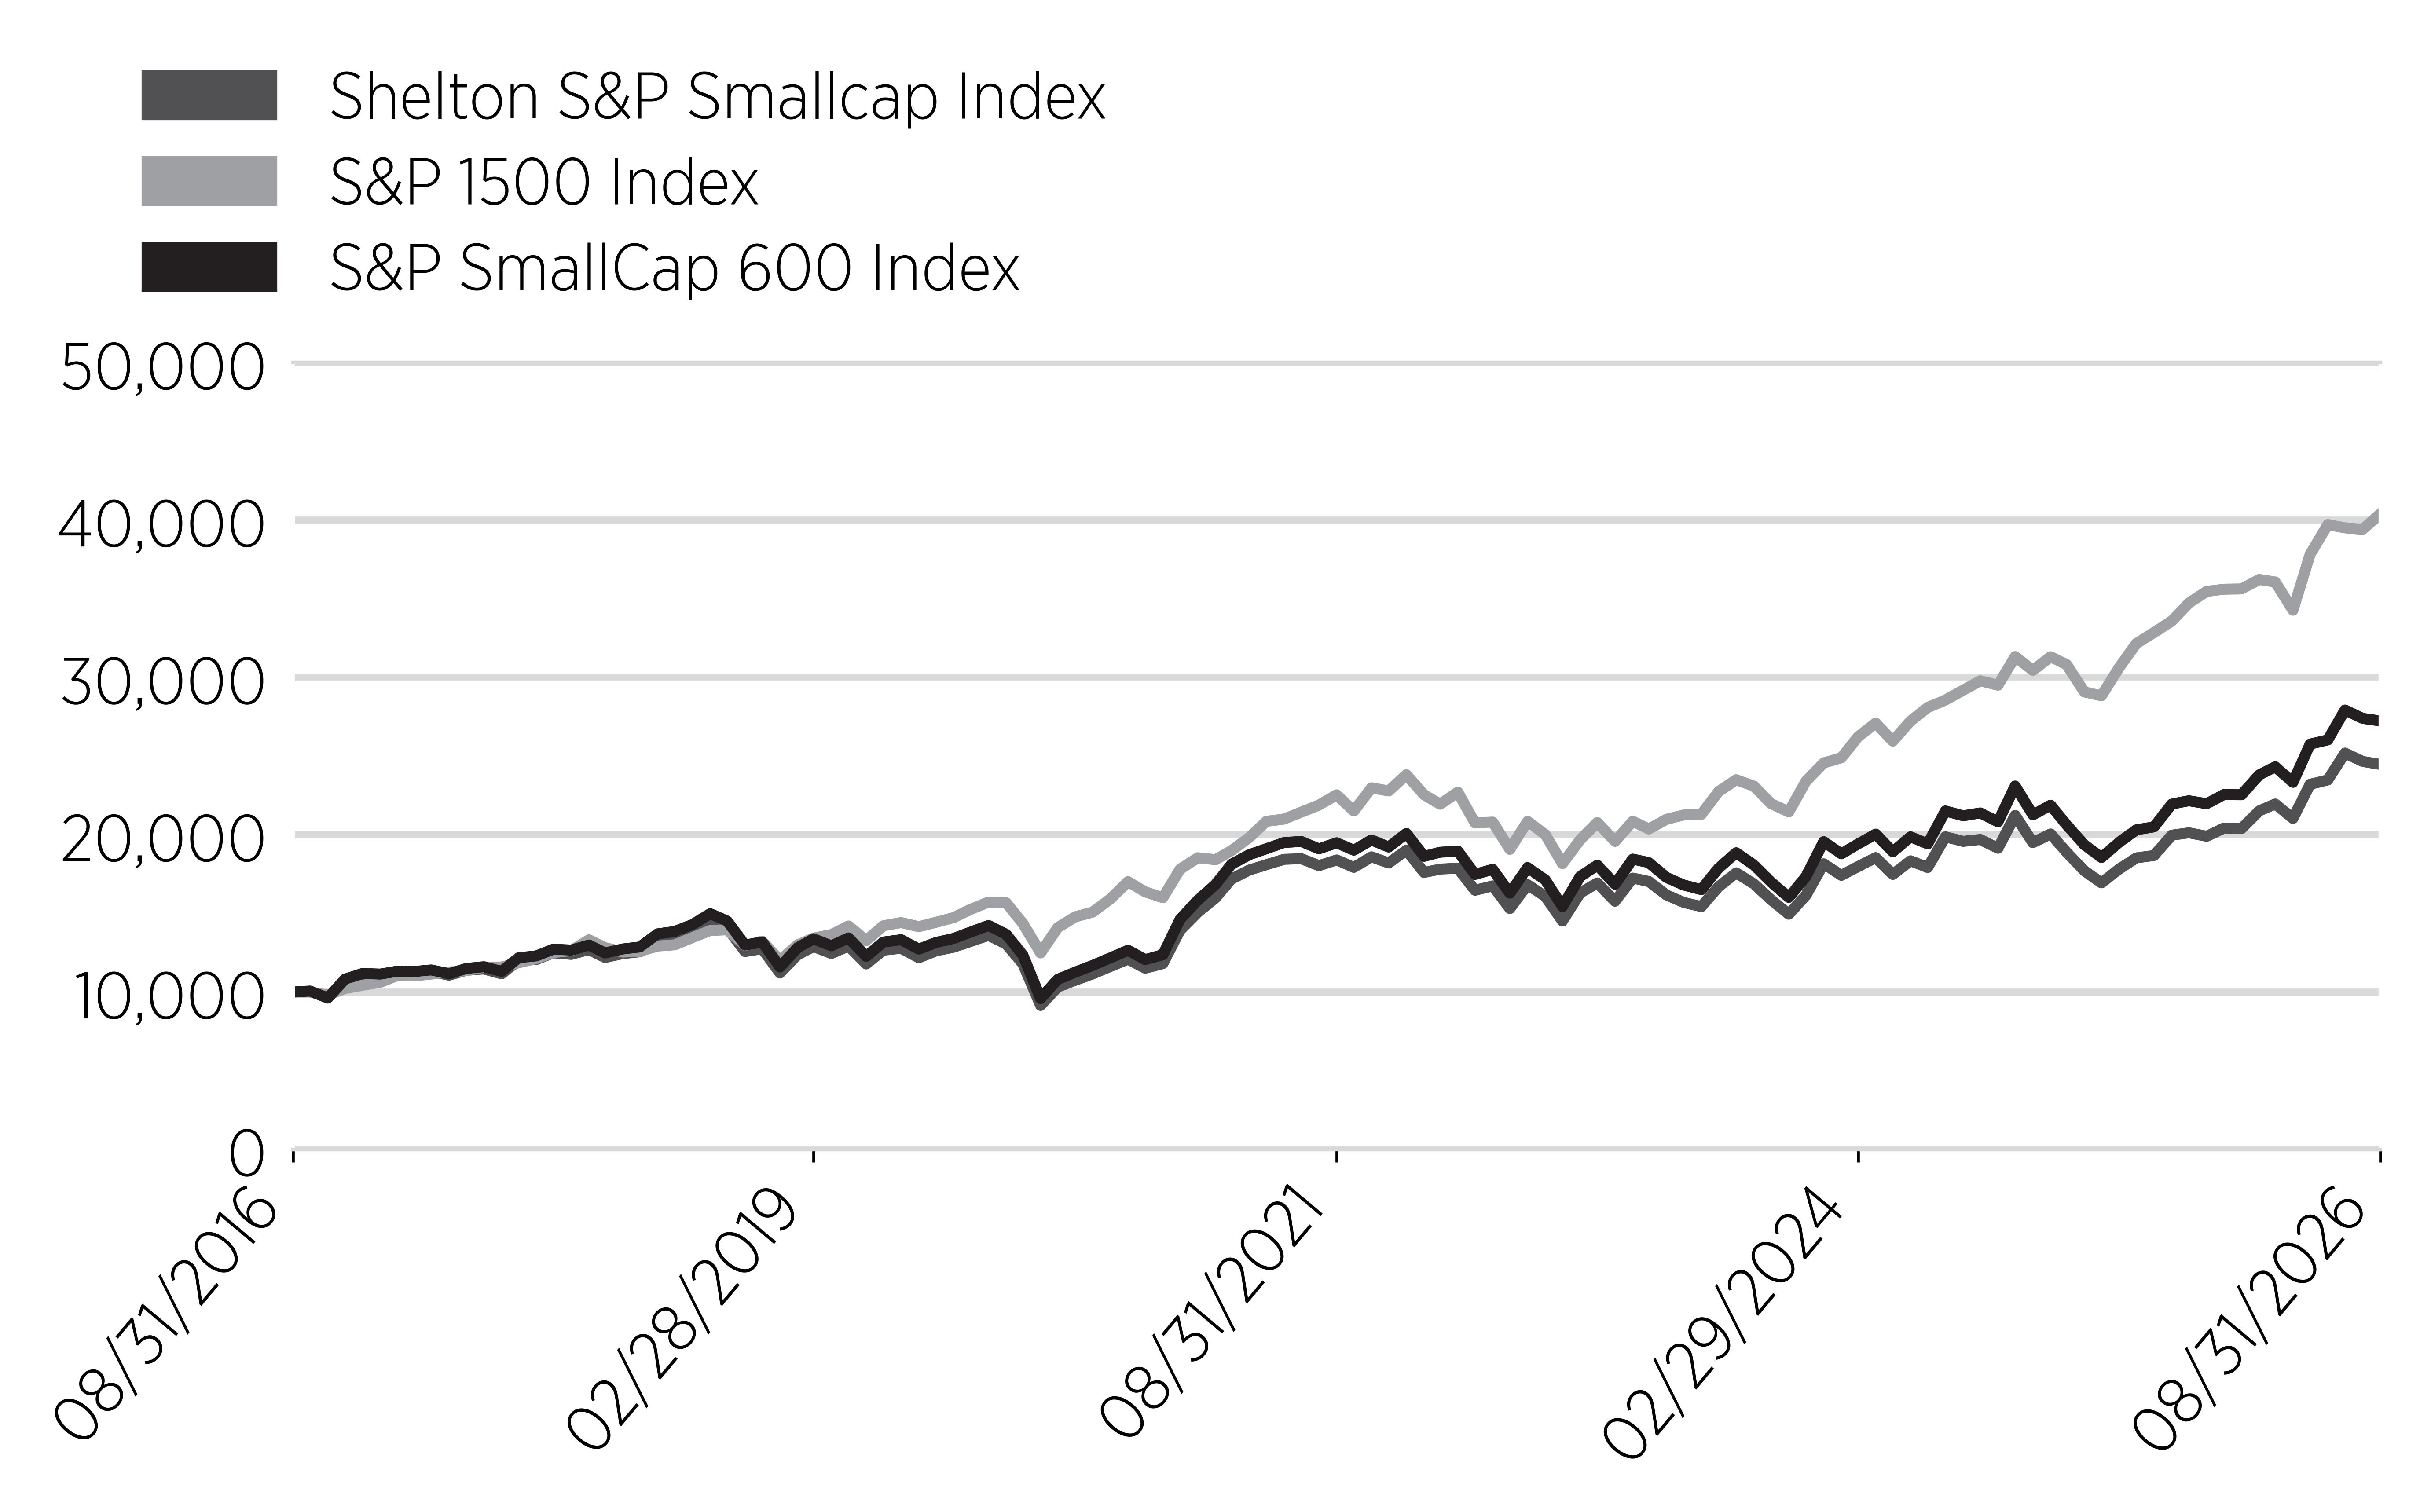
Annual Performance
|
Annual Performance
|
1 Year
|
5 Year
|
10 Year
|
|---|---|---|---|
|
Shelton S&P Smallcap Index Fund,
K Class
|
22.51%
|
5.87%
|
9.36%
|
|
S&P 1500 Index
|
20.31%
|
12.38%
|
14.98%
|
|
S&P SmallCap 600 Index
|
24.14%
|
6.87%
|
10.47%
|
Key Fund Statistics
(as of August 31, 2026)
|
Net Assets
|
$187,818
|
|
Total Number of Portfolio Holdings
|
591
|
|
Total Advisory Fees Paid
|
$2,317
|
|
Portfolio Turnover Rate
|
27%
|
What did the Fund invest in?
(% of Total Investments as of August 31, 2026)
Sector Breakdown
|
Top Ten Holdings
|
Percentage of Total Investments
|
|---|---|
|
United States Treasury Bill
|
1.0%
|
|
Corcept Therapeutics Inc
|
0.6%
|
|
Glaukos Corp
|
0.6%
|
|
Paycom Software Inc
|
0.6%
|
|
Brinker International Inc
|
0.5%
|
|
Match Group Inc
|
0.5%
|
|
Jackson Financial Inc
|
0.5%
|
|
Viasat Inc
|
0.5%
|
|
Protagonist Therapeutics Inc
|
0.5%
|
|
CarMax Inc
|
0.5%
|
What were the Fund costs for the last year?
(based on a hypothetical $10,000 investment)
|
Class Name
|
Costs of a $10,000 investment
|
Costs paid as a percentage of a
$10,000 investment
|
|---|---|---|
|
Nasdaq-100 Index Fund,
Investor Class
|
$53
|
0.52%
|
What affected the Fund's performance this period?
- For the fiscal year ended August 31, 2026, the evolution of artificial intelligence (AI), including increased investment in AI-related technology and infrastructure, influenced market returns, particularly within the Information Technology sector, while conflict in the Middle East contributed to market volatility. Inflation ranged from 2.4% to 4.2% year-over-year, with higher energy prices contributing to elevated readings in the second half of the fiscal year. During the same period, the Federal Reserve reduced the federal funds rate from 4.5% at the start of the fiscal year to 3.75% by December 2025, where it remained through the end of the fiscal year. While the rate reduction was broadly considered supportive of financial markets, its impacts varied across asset classes. According to Bloomberg L.P., the Fund's correlation was 1.00 to the Nasdaq-100 Index.
- The Information Technology GICS sector contributed the most to the Fund's total return, gaining over 51%. Within this sector, the Semiconductors & Semiconductor Equipment industry drove most of the returns, gaining over 87% for the year. Additionally, the Consumer Discretionary sector was the second largest contributor, returning over 6% for the period, led by the Consumer Discretionary Distribution & Retail industry, which returned approximately 7%.
- Contrarily, the GICS Industrials sector detracted the most from the Fund's total return, losing more than 5% for the year. Within this sector, the Commercial & Professional Services industry detracted the most, losing more than 13%. Additionally, the Real Estate Management & Development industry within the Real Estate sector lost more than 63% for the period.
- In terms of specific stock holdings, Micron Technology, Advanced Micro Devices, and Apple were the top three contributors to the total return of the Fund, gaining over 706%, over 189%, and approximately 37%, respectively. Conversely, the top three detractors were Netflix, Meta Platforms, and Intuit, which lost more than 32%, 22%, and 45%, respectively, for the Fund's fiscal year.
Cumulative Performance
(based on a hypothetical $10,000 investment)
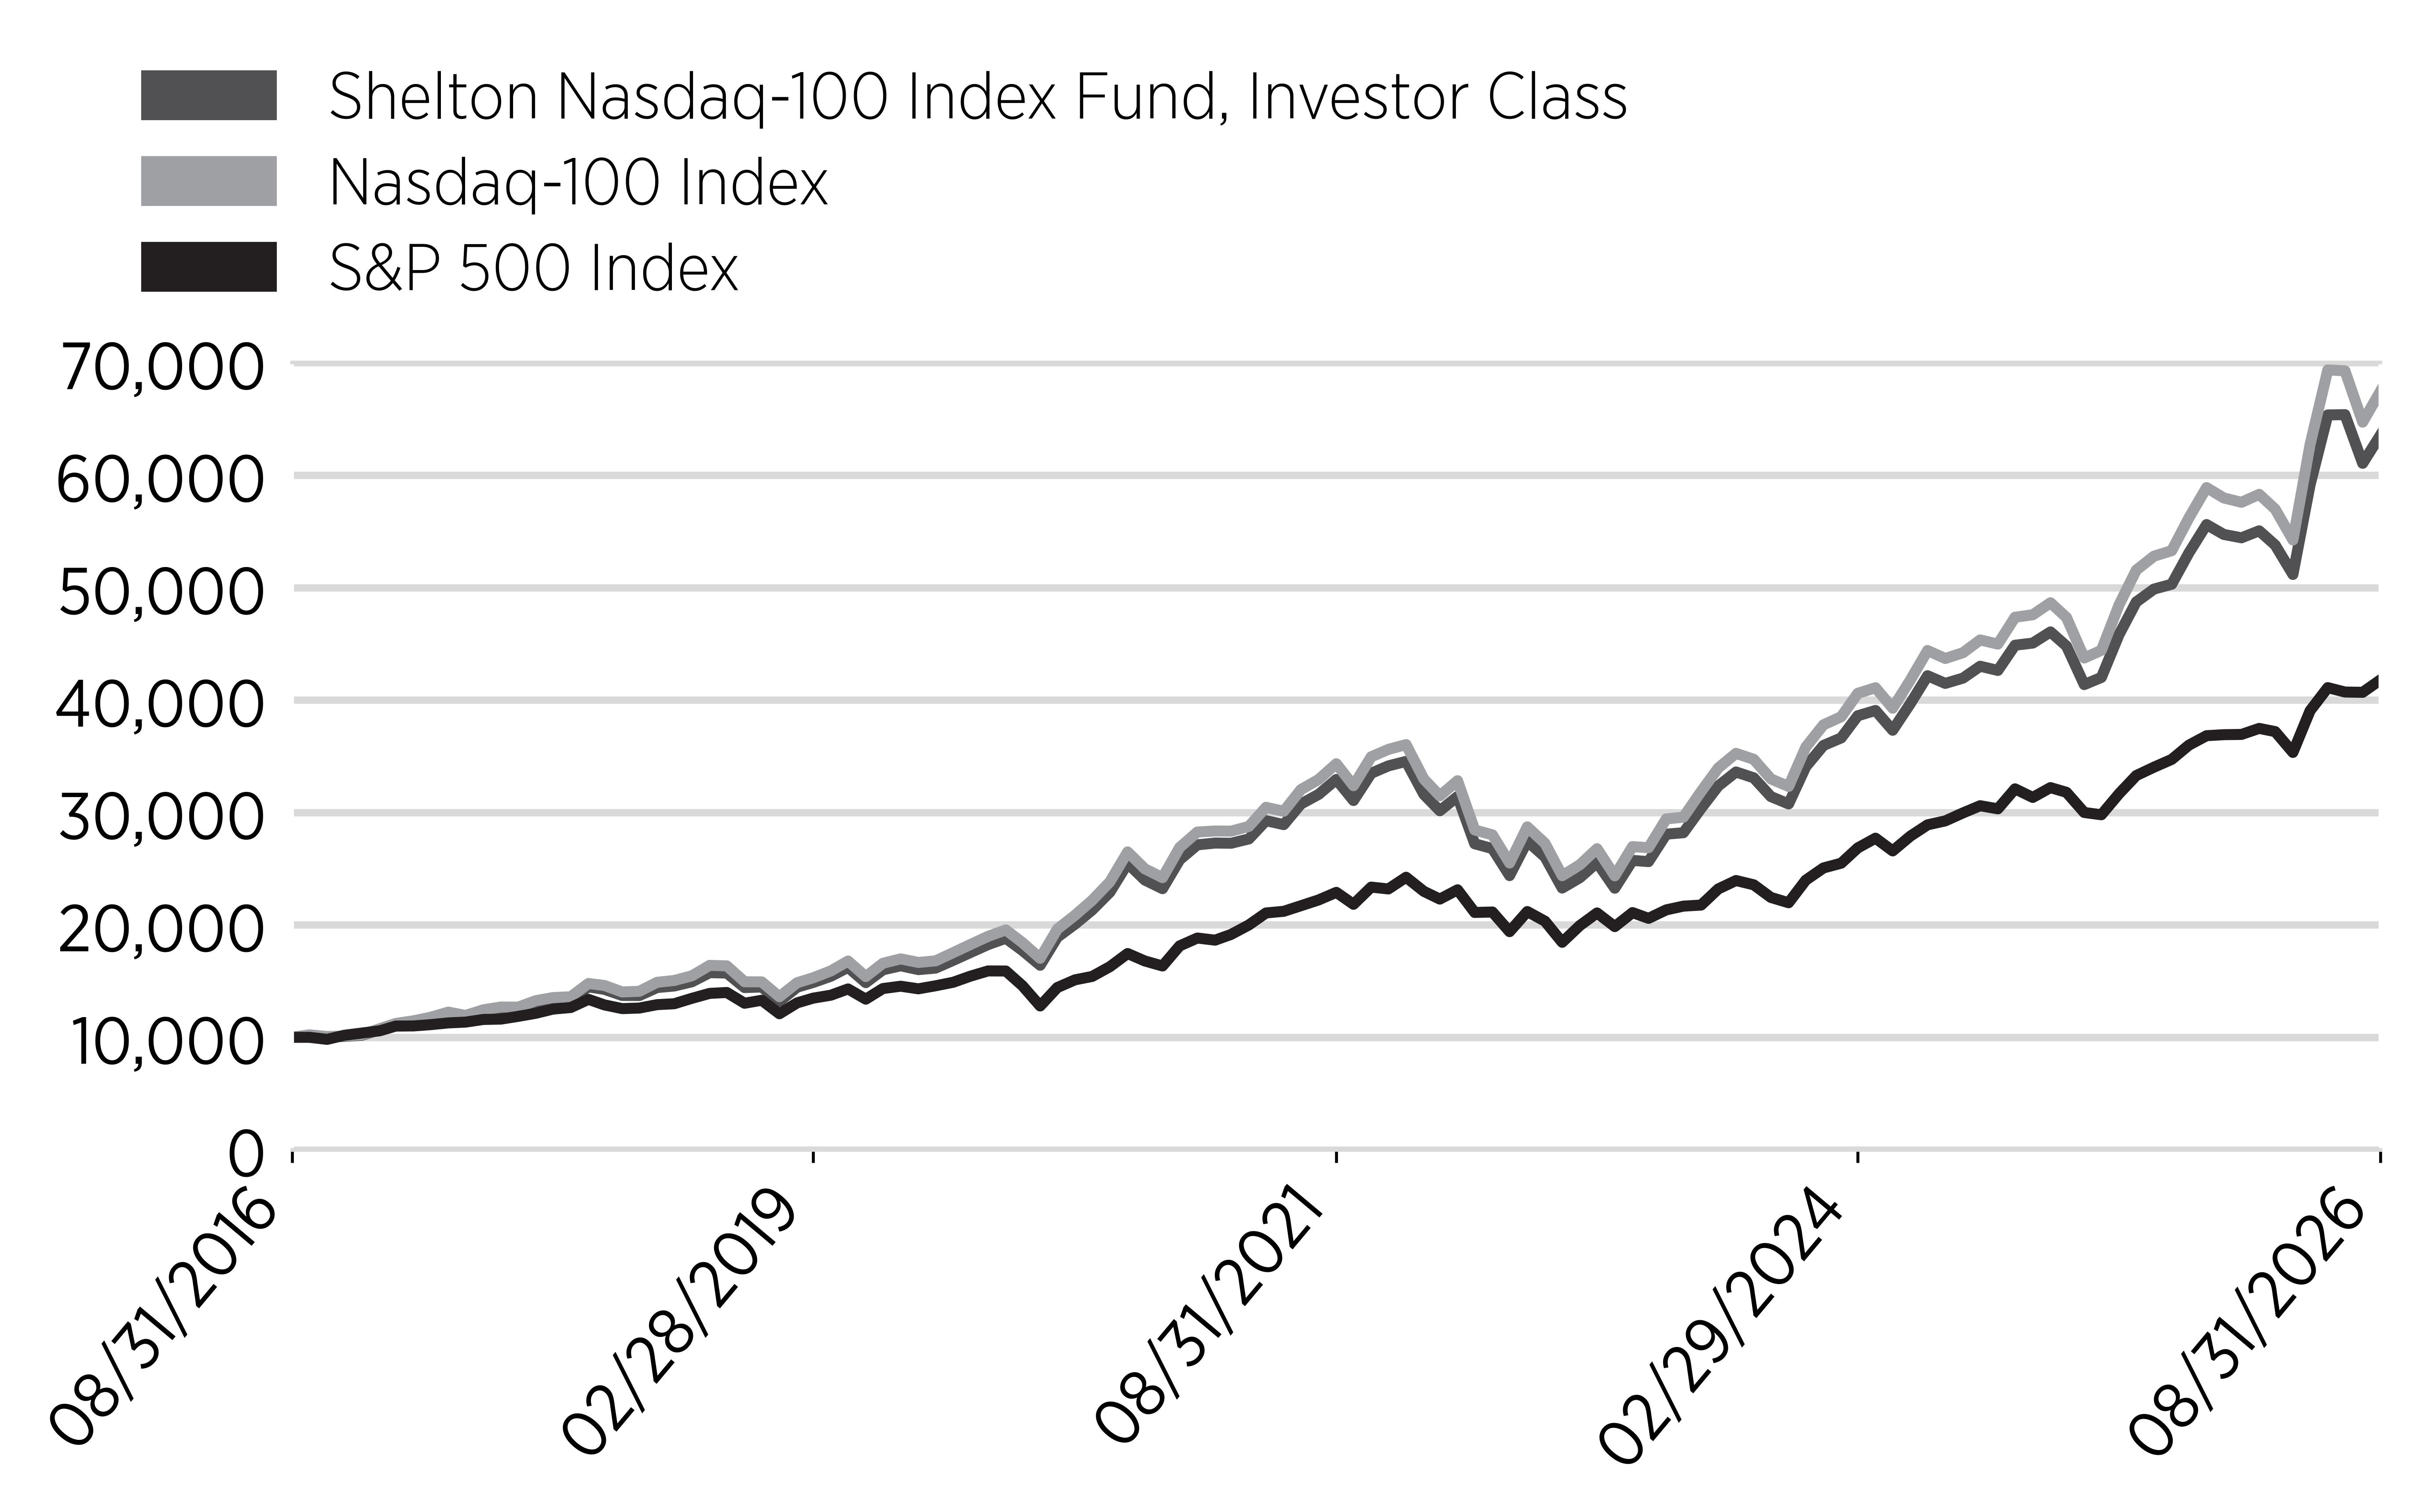
Annual Performance
|
Annual Performance
|
1 Year
|
5 Year
|
10 Year
|
|---|---|---|---|
|
Nasdaq-100 Index Fund,
Investor Class
|
26.37%
|
14.05%
|
20.31%
|
|
S&P 500 Index
|
20.35%
|
12.76%
|
15.35%
|
|
Nasdaq-100 Index
|
26.60%
|
14.45%
|
21.02%
|
Key Fund Statistics
(as of August 31, 2026)
|
Net Assets
|
$2,064,192,509
|
|
Total Number of Portfolio Holdings
|
98
|
|
Total Advisory Fees Paid
|
$2,827,955
|
|
Portfolio Turnover Rate
|
15%
|
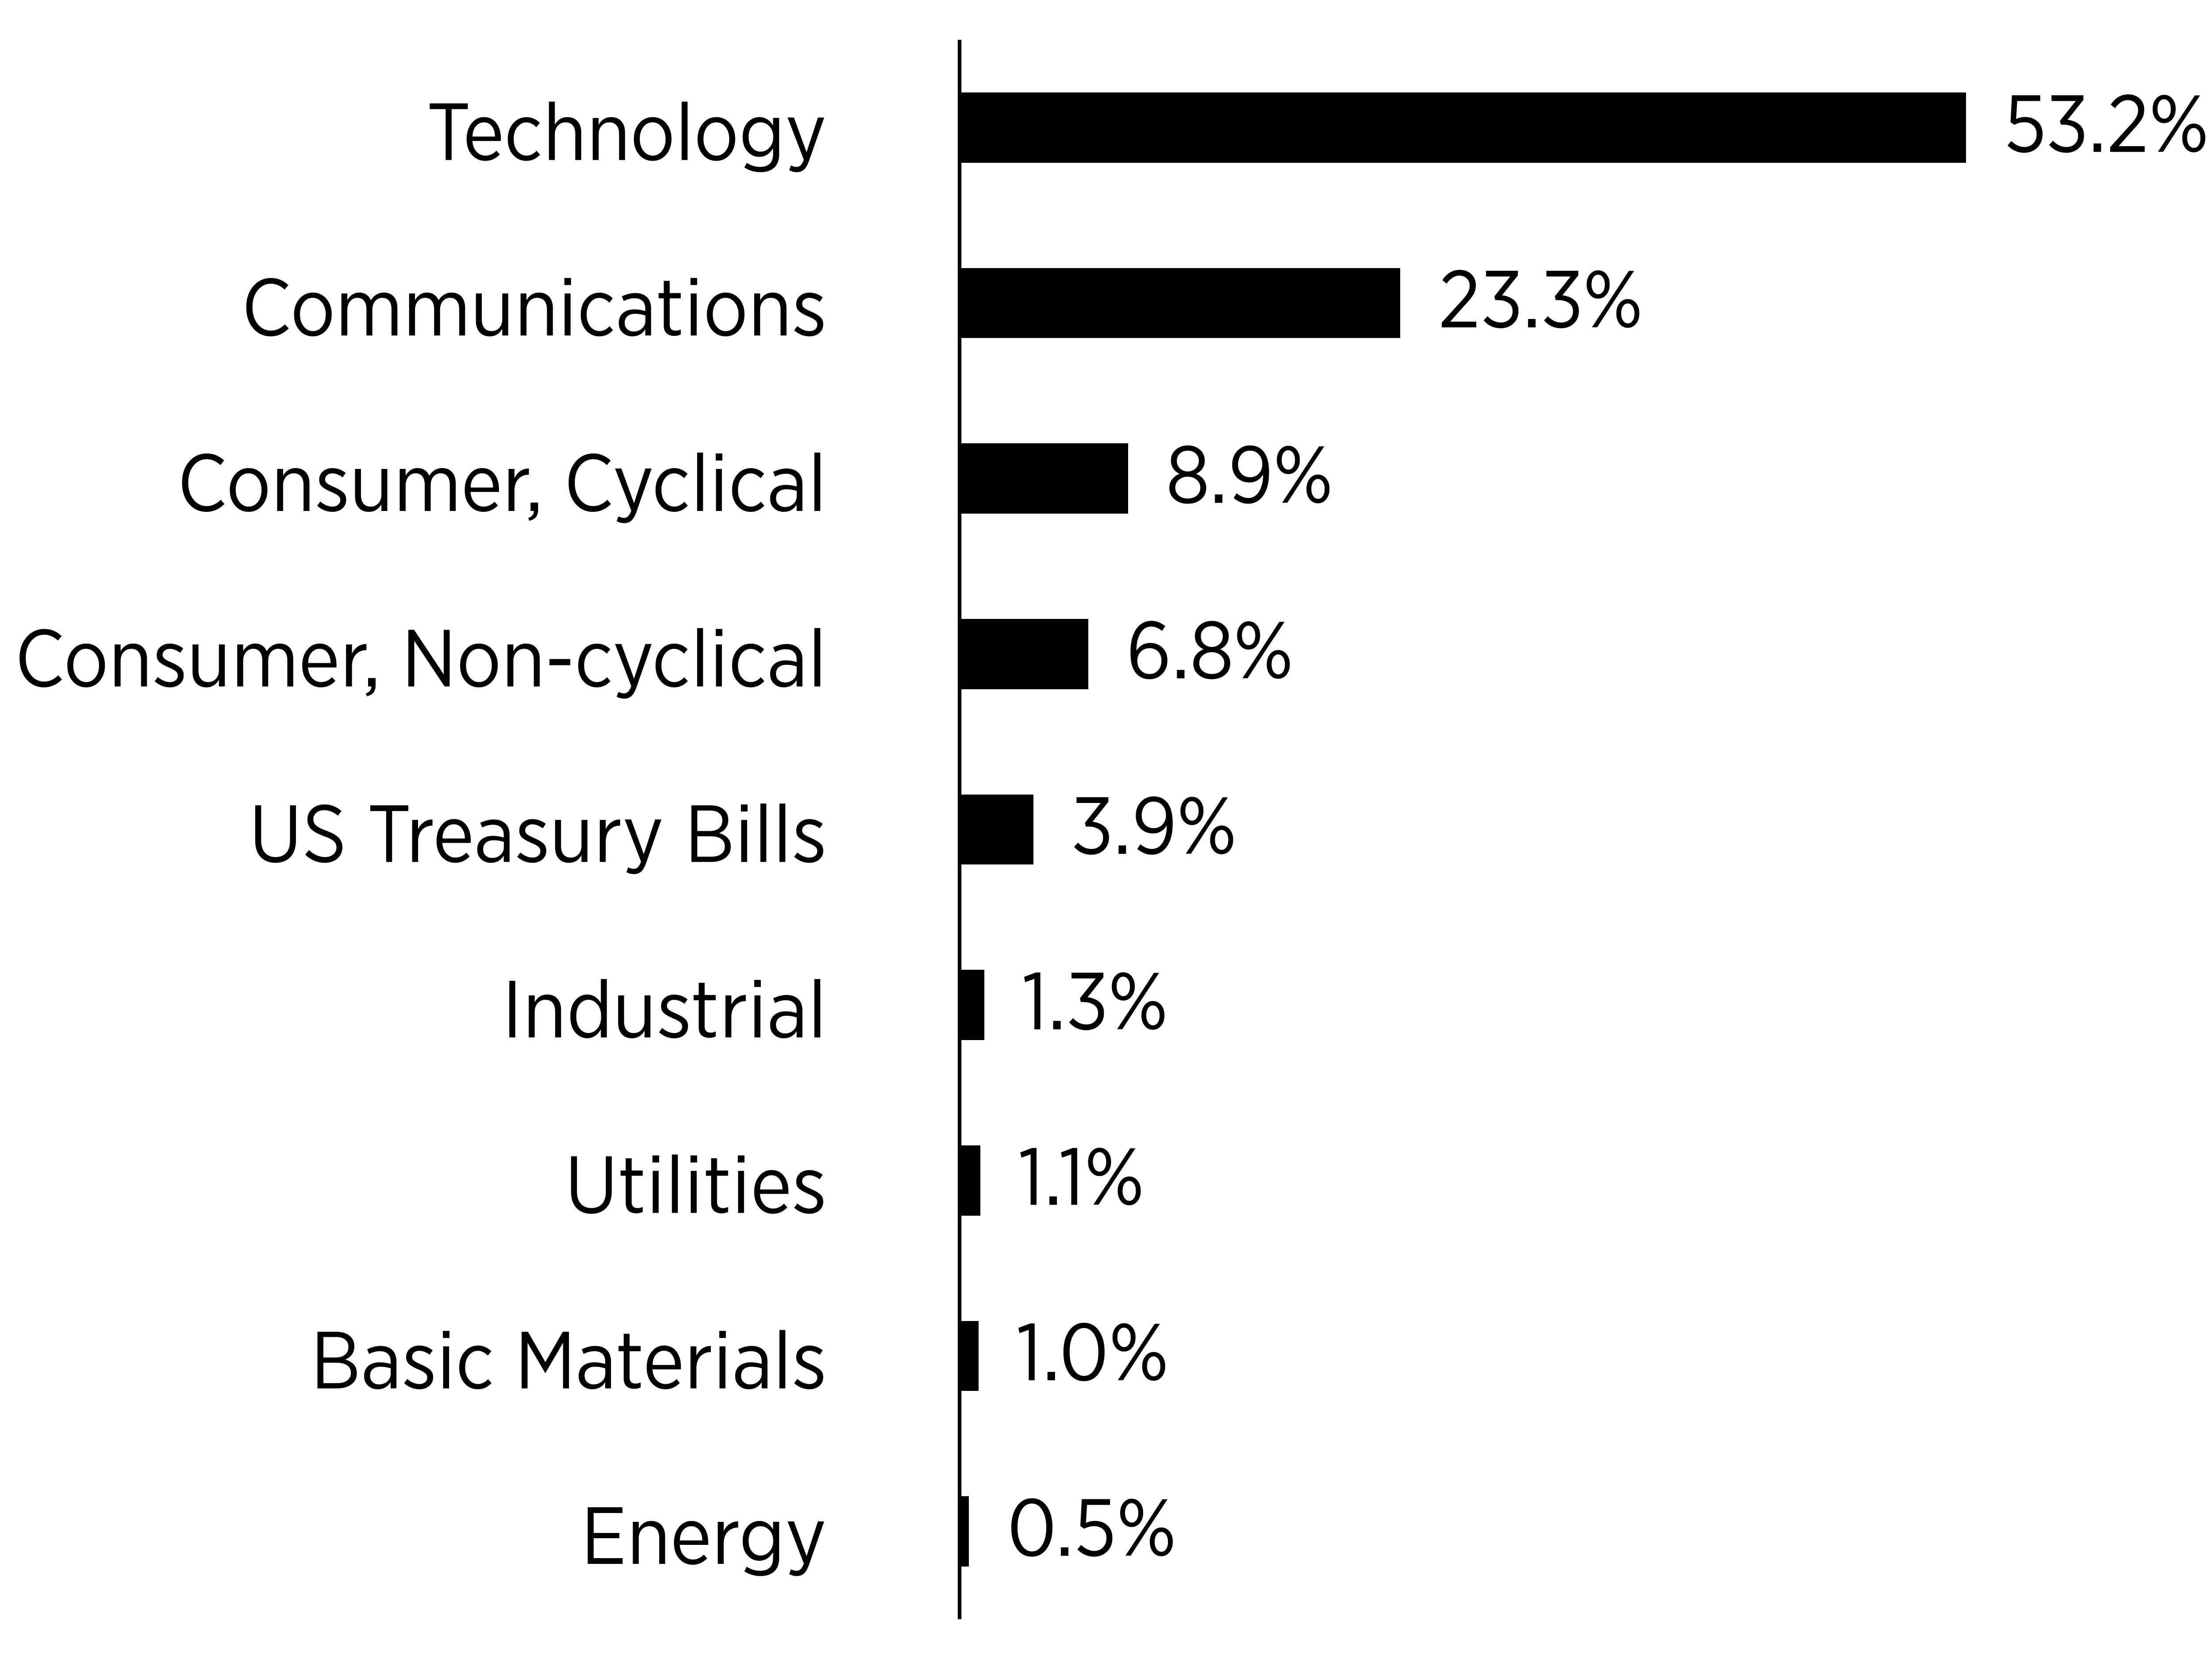
What did the Fund invest in?
(% of Total Investments as of August 31, 2026)
Sector Breakdown
|
Top Ten Holdings
|
Percentage of Total Investments
|
|---|---|
|
NVIDIA Corp
|
8.5%
|
|
Apple Inc
|
7.4%
|
|
Microsoft Corp
|
6.0%
|
|
Micron Technology Inc
|
4.8%
|
|
Amazon.com Inc
|
4.4%
|
|
United States Treasury Bill
|
3.9%
|
|
Advanced Micro Devices Inc
|
3.4%
|
|
Alphabet Inc - Class A
|
3.1%
|
|
Alphabet Inc - Class C
|
2.9%
|
|
Broadcom Inc
|
2.8%
|
Material Fund Changes
This is a summary of certain changes to the Fund since September 1, 2025. For more complete information, you may review the Fund’s next prospectus, which we expect to be available by January 1, 2027 at https://sheltonfunds.com/forms-literature/ or upon request at 800‐955‐9988.
Effective April 10, 2026, Shelton Capital Management, as the Fund's investment adviser, contractually agreed to waive and/or reimburse each class of the Fund for any acquired fund fees and expenses incurred by the Fund in connection with the Fund’s investment in any exchange-traded funds advised or sub-advised by Shelton Capital Management. These fee waiver and reimbursements for the Fund shall continue until modified or discontinued by the Fund’s Board of Trustees.
What were the Fund costs for the last year?
(based on a hypothetical $10,000 investment)
|
Class Name
|
Costs of a
$10,000 investment
|
Costs paid as a percentage of a
$10,000 investment
|
|---|---|---|
|
Nasdaq-100 Index Fund, K Class
|
$78
|
0.77%
|
What affected the Fund's performance this period?
- For the fiscal year ended August 31, 2026, the evolution of artificial intelligence (AI), including increased investment in AI-related technology and infrastructure, influenced market returns, particularly within the Information Technology sector, while conflict in the Middle East contributed to market volatility. Inflation ranged from 2.4% to 4.2% year-over-year, with higher energy prices contributing to elevated readings in the second half of the fiscal year. During the same period, the Federal Reserve reduced the federal funds rate from 4.5% at the start of the fiscal year to 3.75% by December 2025, where it remained through the end of the fiscal year. While the rate reduction was broadly considered supportive of financial markets, its impacts varied across asset classes. According to Bloomberg L.P., the Fund's correlation was 1.00 to the Nasdaq-100 Index.
- The Information Technology GICS sector contributed the most to the Fund's total return, gaining over 51%. Within this sector, the Semiconductors & Semiconductor Equipment industry drove most of the returns, gaining over 87% for the year. Additionally, the Consumer Discretionary sector was the second largest contributor, returning over 6% for the period, led by the Consumer Discretionary Distribution & Retail industry, which returned approximately 7%.
- Contrarily, the GICS Industrials sector detracted the most from the Fund's total return, losing more than 5% for the year. Within this sector, the Commercial & Professional Services industry detracted the most, losing more than 13%. Additionally, the Real Estate Management & Development industry within the Real Estate sector lost more than 63% for the period.
- In terms of specific stock holdings, Micron Technology, Advanced Micro Devices, and Apple were the top three contributors to the total return of the Fund, gaining over 706%, over 189%, and approximately 37%, respectively. Conversely, the top three detractors were Netflix, Meta Platforms, and Intuit, which lost more than 32%, 22%, and 45%, respectively, for the Fund's fiscal year.
Cumulative Performance
(based on a hypothetical $10,000 investment)
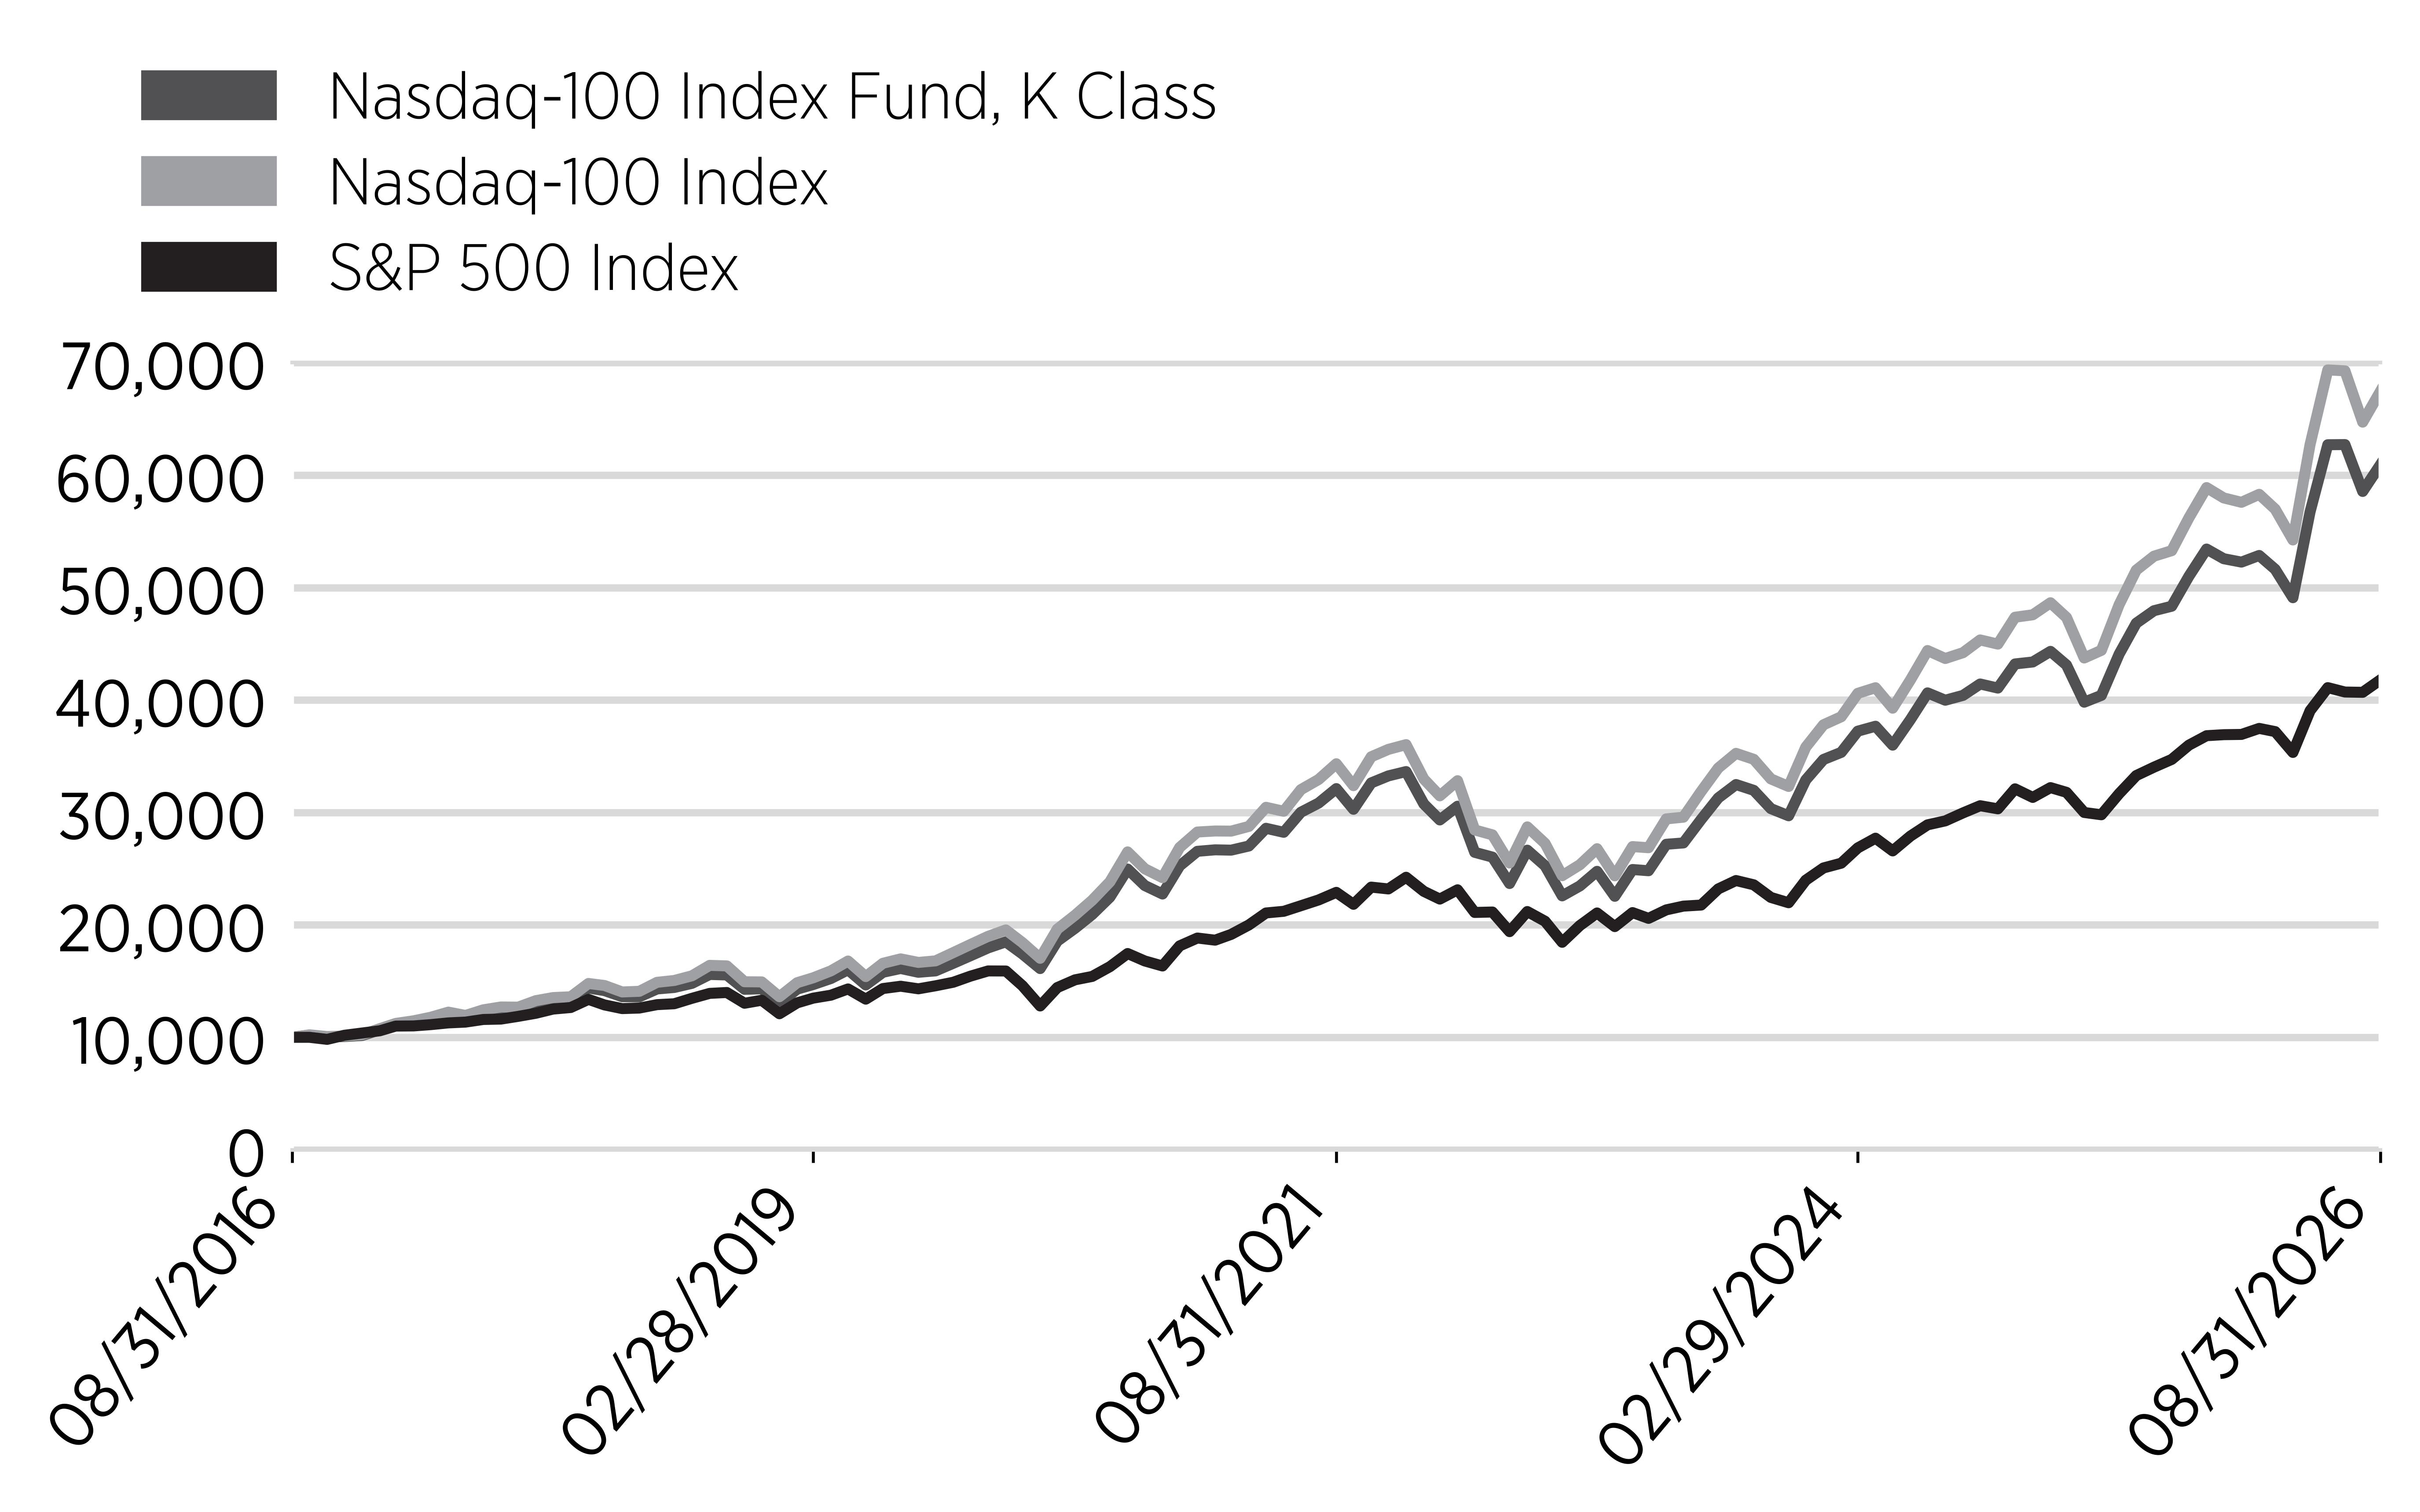
Annual Performance
|
Annual Performance
|
1 Year
|
5 Year
|
10 Year
|
|---|---|---|---|
|
Nasdaq-100 Index Fund, K Class
|
26.04%
|
13.66%
|
19.81%
|
|
S&P 500 Index
|
20.35%
|
12.76%
|
15.35%
|
|
Nasdaq-100 Index
|
26.60%
|
14.45%
|
21.02%
|
Key Fund Statistics
(as of August 31, 2026)
|
Net Assets
|
$46,194,960
|
|
Total Number of Portfolio Holdings
|
98
|
|
Total Advisory Fees Paid
|
$62,094
|
|
Portfolio Turnover Rate
|
15%
|
What did the Fund invest in?
(% of Total Investments as of August 31, 2026)
Sector Breakdown
|
Top Ten Holdings
|
Percentage of Total Investments
|
|---|---|
|
NVIDIA Corp
|
8.5%
|
|
Apple Inc
|
7.4%
|
|
Microsoft Corp
|
6.0%
|
|
Micron Technology Inc
|
4.8%
|
|
Amazon.com Inc
|
4.4%
|
|
United States Treasury Bill
|
3.9%
|
|
Advanced Micro Devices Inc
|
3.4%
|
|
Alphabet Inc - Class A
|
3.1%
|
|
Alphabet Inc - Class C
|
2.9%
|
|
Broadcom Inc
|
2.8%
|
Material Fund Changes
This is a summary of certain changes to the Fund since September 1, 2025. For more complete information, you may review the Fund’s next prospectus, which we expect to be available by January 1, 2027 at https://sheltonfunds.com/forms-literature/ or upon request at 800‐955‐9988.
Effective April 10, 2026, Shelton Capital Management, as the Fund's investment adviser, contractually agreed to waive and/or reimburse each class of the Fund for any acquired fund fees and expenses incurred by the Fund in connection with the Fund’s investment in any exchange-traded funds advised or sub-advised by Shelton Capital Management. These fee waiver and reimbursements for the Fund shall continue until modified or discontinued by the Fund’s Board of Trustees.
What were the Fund costs for the last year?
(based on a hypothetical $10,000 investment)
|
Fund Name
|
Costs of a $10,000 investment
|
Costs paid as a percentage of a $10,000 investment
|
|---|---|---|
|
Nasdaq-100 Index Fund, Institutional Class
|
$28
|
0.27%
|
What affected the Fund's performance this period?
- For the fiscal year ended August 31, 2026, the evolution of artificial intelligence (AI), including increased investment in AI-related technology and infrastructure, influenced market returns, particularly within the Information Technology sector, while conflict in the Middle East contributed to market volatility. Inflation ranged from 2.4% to 4.2% year-over-year, with higher energy prices contributing to elevated readings in the second half of the fiscal year. During the same period, the Federal Reserve reduced the federal funds rate from 4.5% at the start of the fiscal year to 3.75% by December 2025, where it remained through the end of the fiscal year. While the rate reduction was broadly considered supportive of financial markets, its impacts varied across asset classes. According to Bloomberg L.P., the Fund's correlation was 1.00 to the Nasdaq-100 Index.
- The Information Technology GICS sector contributed the most to the Fund's total return, gaining over 51%. Within this sector, the Semiconductors & Semiconductor Equipment industry drove most of the returns, gaining over 87% for the year. Additionally, the Consumer Discretionary sector was the second largest contributor, returning over 6% for the period, led by the Consumer Discretionary Distribution & Retail industry, which returned approximately 7%.
- Contrarily, the GICS Industrials sector detracted the most from the Fund's total return, losing more than 5% for the year. Within this sector, the Commercial & Professional Services industry detracted the most, losing more than 13%. Additionally, the Real Estate Management & Development industry within the Real Estate sector lost more than 63% for the period.
- In terms of specific stock holdings, Micron Technology, Advanced Micro Devices, and Apple were the top three contributors to the total return of the Fund, gaining over 706%, over 189%, and approximately 37%, respectively. Conversely, the top three detractors were Netflix, Meta Platforms, and Intuit, which lost more than 32%, 22%, and 45%, respectively, for the Fund's fiscal year.
Cumulative Performance
(based on a hypothetical $10,000,000 investment)
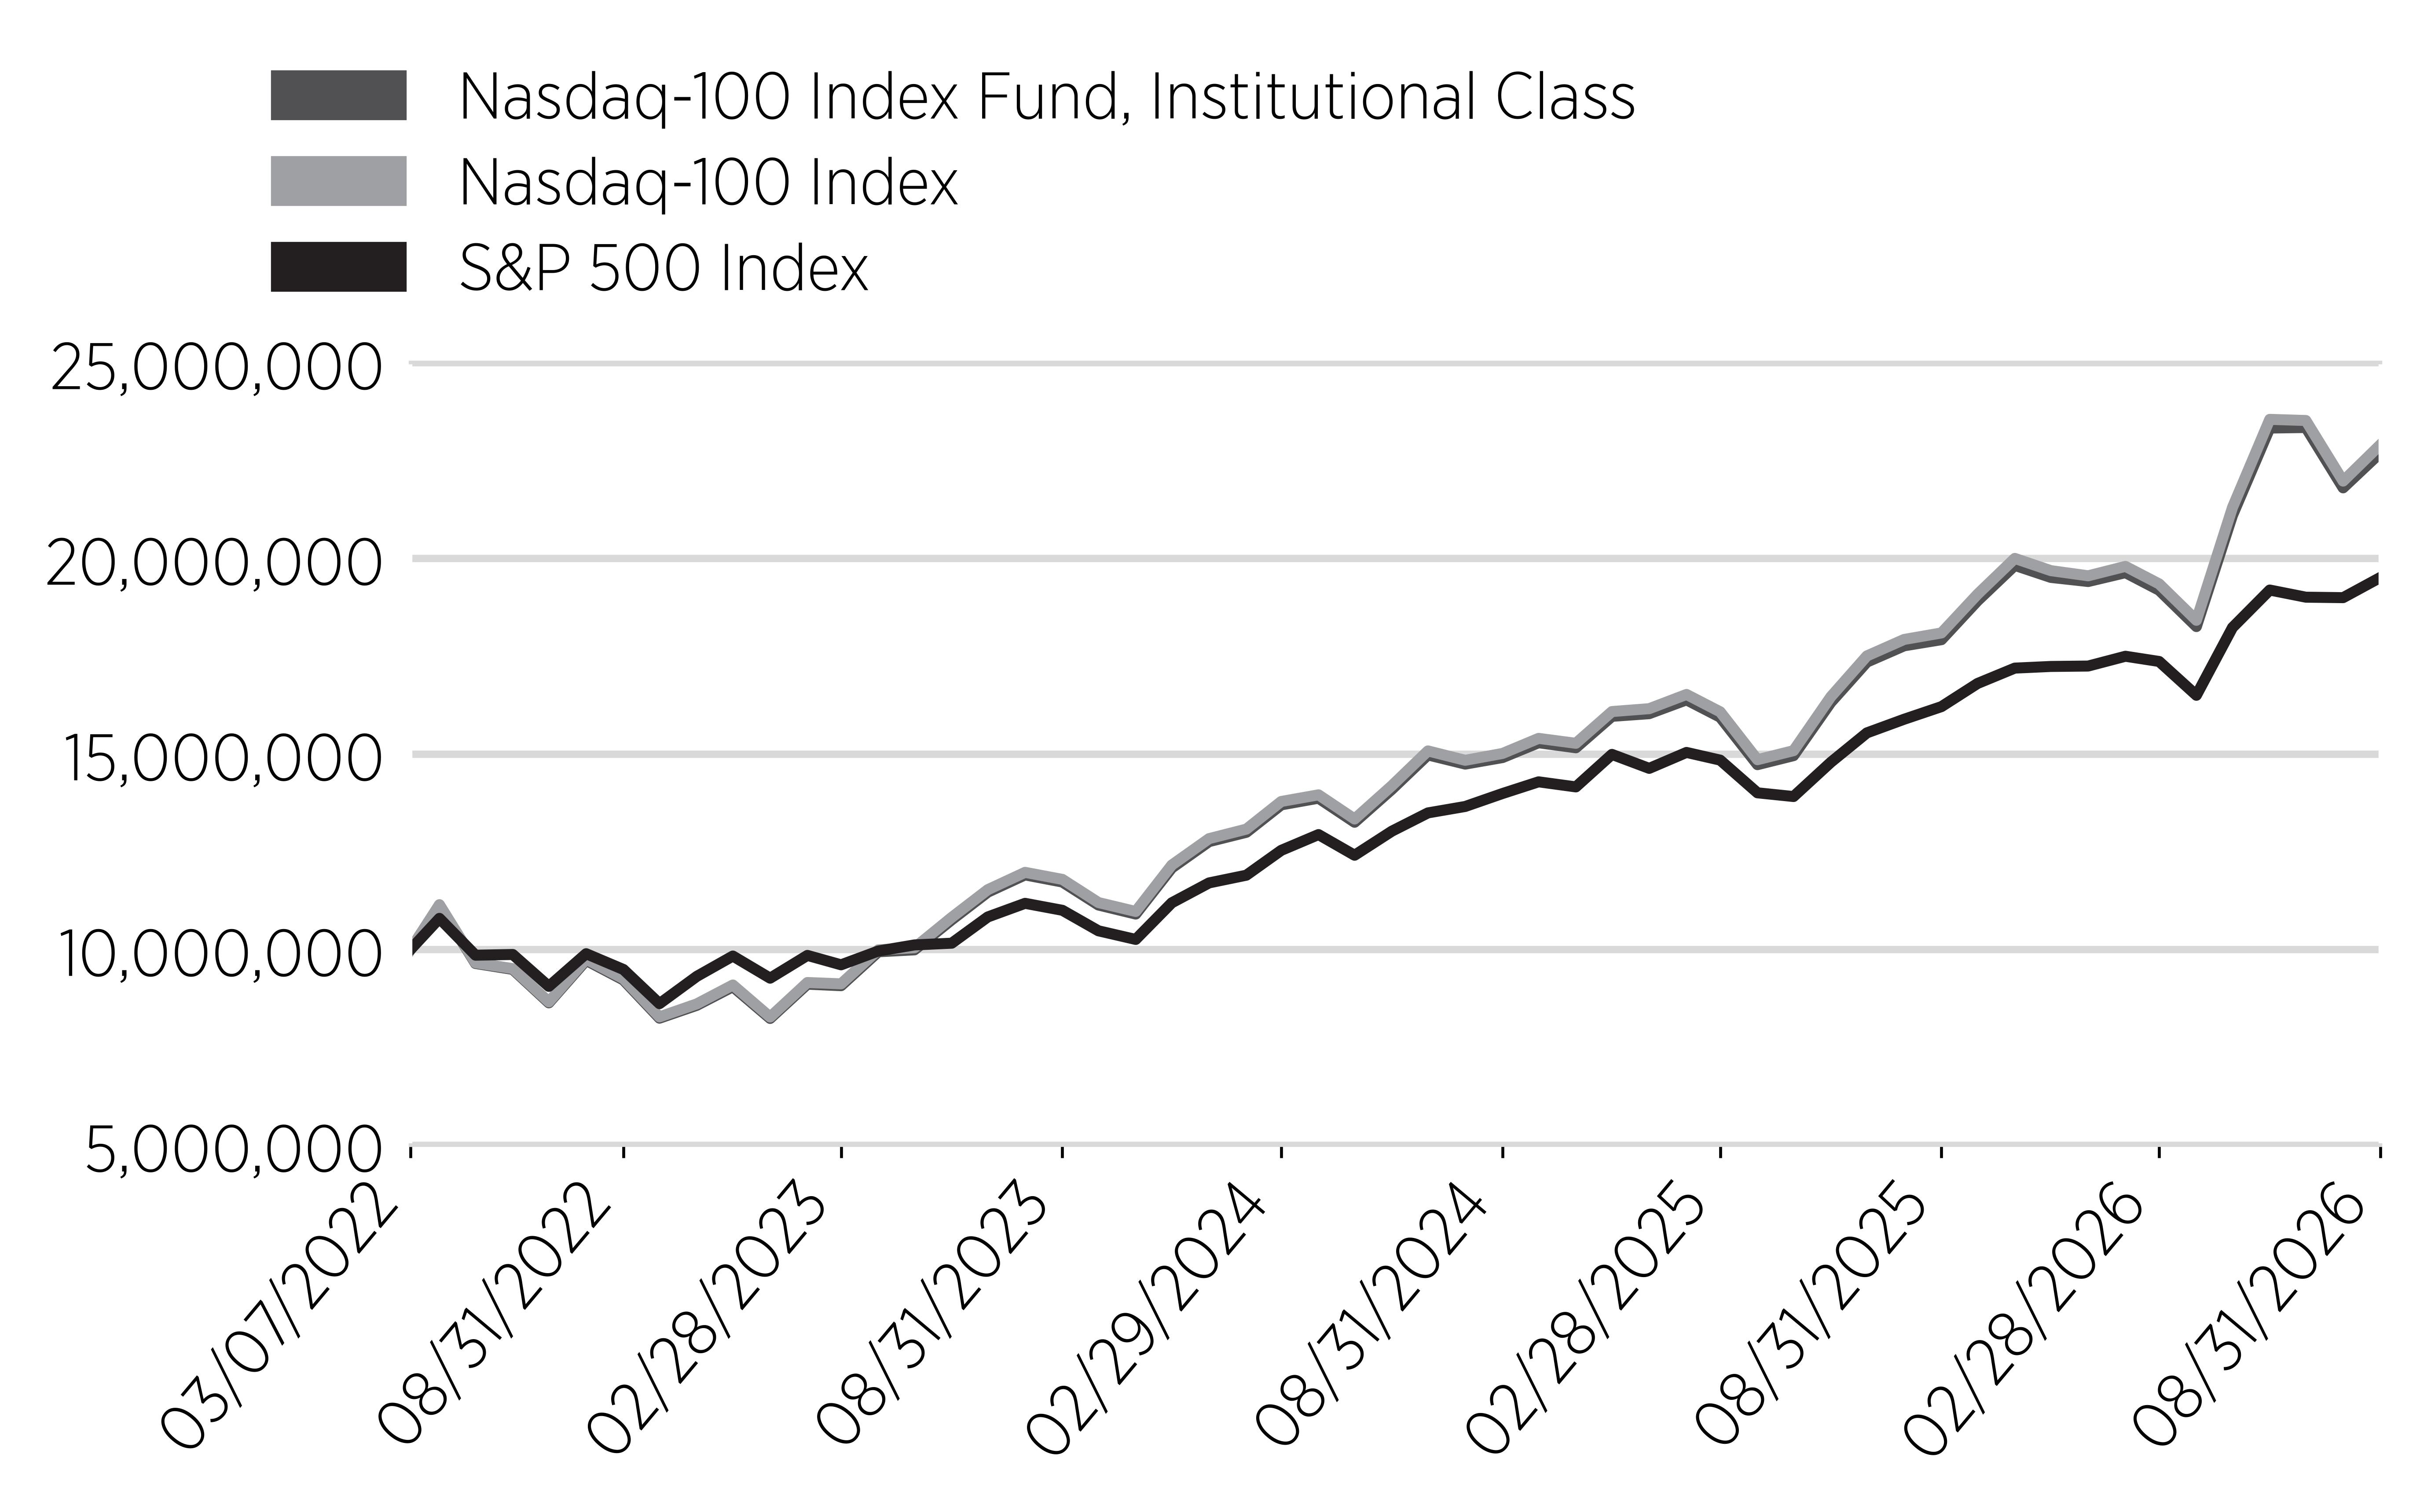
Annual Performance
|
Annual Performance
|
1 Year
|
Since Inception
(3/7/22)
|
|---|---|---|
|
Nasdaq-100 Index Fund, Institutional Class
|
26.67%
|
20.05%
|
|
S&P 500 Index
|
20.35%
|
16.04%
|
|
Nasdaq-100 Index
|
26.60%
|
20.28%
|
Key Fund Statistics
(as of August 31, 2026)
|
Net Assets
|
$158,239,519
|
|
Total Number of Portfolio Holdings
|
98
|
|
Total Advisory Fees Paid
|
$133,285
|
|
Portfolio Turnover Rate
|
15%
|
What did the Fund invest in?
(% of Total Investments as of August 31, 2026)
Sector Breakdown
|
Top Ten Holdings
|
Percentage of Total Investments
|
|---|---|
|
NVIDIA Corp
|
8.5%
|
|
Apple Inc
|
7.4%
|
|
Microsoft Corp
|
6.0%
|
|
Micron Technology Inc
|
4.8%
|
|
Amazon.com Inc
|
4.4%
|
|
United States Treasury Bill
|
3.9%
|
|
Advanced Micro Devices Inc
|
3.4%
|
|
Alphabet Inc - Class A
|
3.1%
|
|
Alphabet Inc - Class C
|
2.9%
|
|
Broadcom Inc
|
2.8%
|
Material Fund Changes
This is a summary of certain changes to the Fund since September 1, 2025. For more complete information, you may review the Fund’s next prospectus, which we expect to be available by January 1, 2027 at https://sheltonfunds.com/forms-literature/ or upon request at 800‐955‐9988.
Effective April 10, 2026, Shelton Capital Management, as the Fund's investment adviser, contractually agreed to waive and/or reimburse each class of the Fund for any acquired fund fees and expenses incurred by the Fund in connection with the Fund’s investment in any exchange-traded funds advised or sub-advised by Shelton Capital Management. These fee waiver and reimbursements for the Fund shall continue until modified or discontinued by the Fund’s Board of Trustees.
What were the Fund costs for the last year?
(based on a hypothetical $10,000 investment)
|
Fund Name
|
Costs of a $10,000 investment
|
Costs paid as a percentage of a
$10,000 investment
|
|---|---|---|
|
Shelton Sustainable Equity Fund,
Investor Class
|
$129
|
1.27%
|
What affected the Fund's performance this period?
Mid-cap stocks underperformed the broader U.S. equity market during the fiscal year, with the S&P MidCap 400 Index returning 17.12%, compared with a 20.28% return for the S&P 1500 Index. The Fund's Investor Class returned 9.55% for the period, trailing the S&P MidCap 400 Index by 7.57% and the S&P 1500 Index by 10.73%.
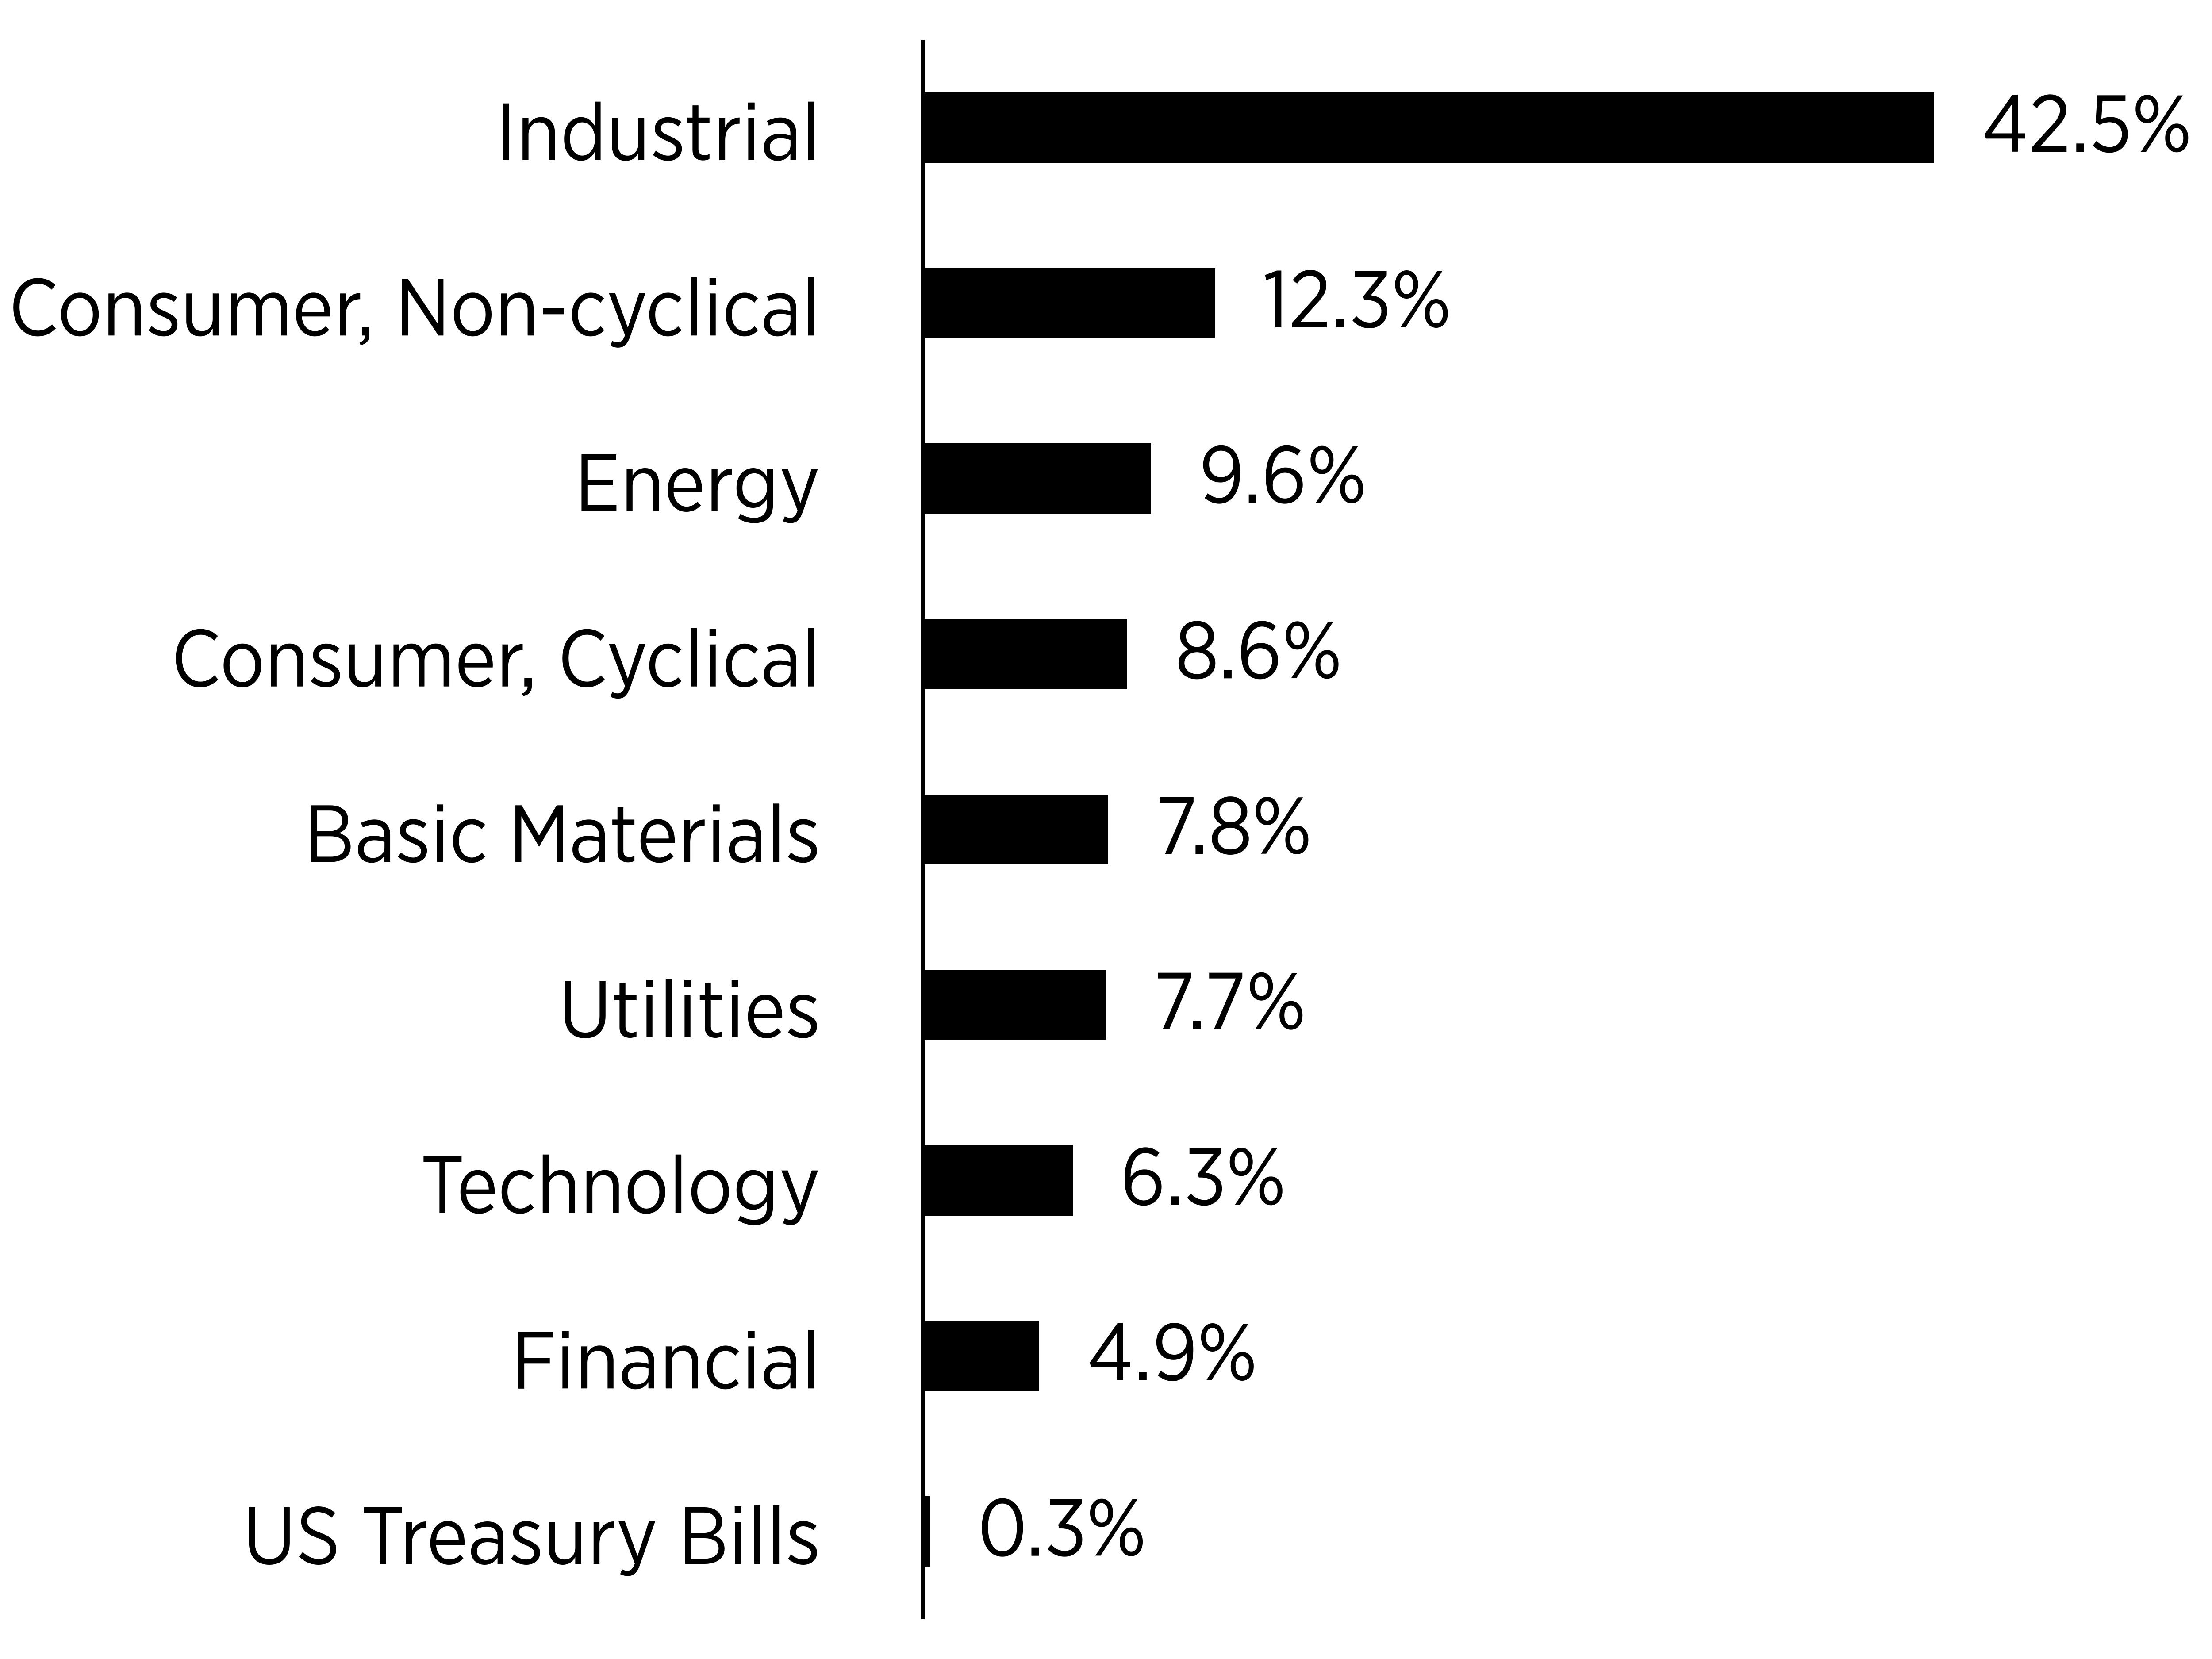
Sector positioning was the primary influence on the Fund’s relative performance. The Fund maintained a significant allocation to Industrials—42.3%, compared with 21.0% for the S&P MidCap 400 Index and 9.0% for the S&P 1500 Index. Industrials returned 13.4% during the period, providing positive absolute performance but lagging stronger areas of the market. The Fund’s lower allocations to Information Technology and Health Care during the period also limited participation in two of the period’s best-performing sectors. Information Technology returned 59.9%, while the Fund held 11.3% in the sector compared with 37.9% for the S&P 1500 Index. Health Care returned 29.6%, while the Fund held 3.0% compared with 9.0% for the S&P 1500 Index.
Several of the Fund’s larger holdings delivered strong results. Vertiv, Schneider Electric, CF Industries, HA Sustainable Infrastructure, Aramark, Bunge and Deere each generated substantial gains during the fiscal year. These results supported the Fund’s positive absolute return but were not sufficient to offset the effects of its sector positioning and weaker performance elsewhere in the portfolio.
Cumulative Performance
(based on a hypothetical $10,000 investment)
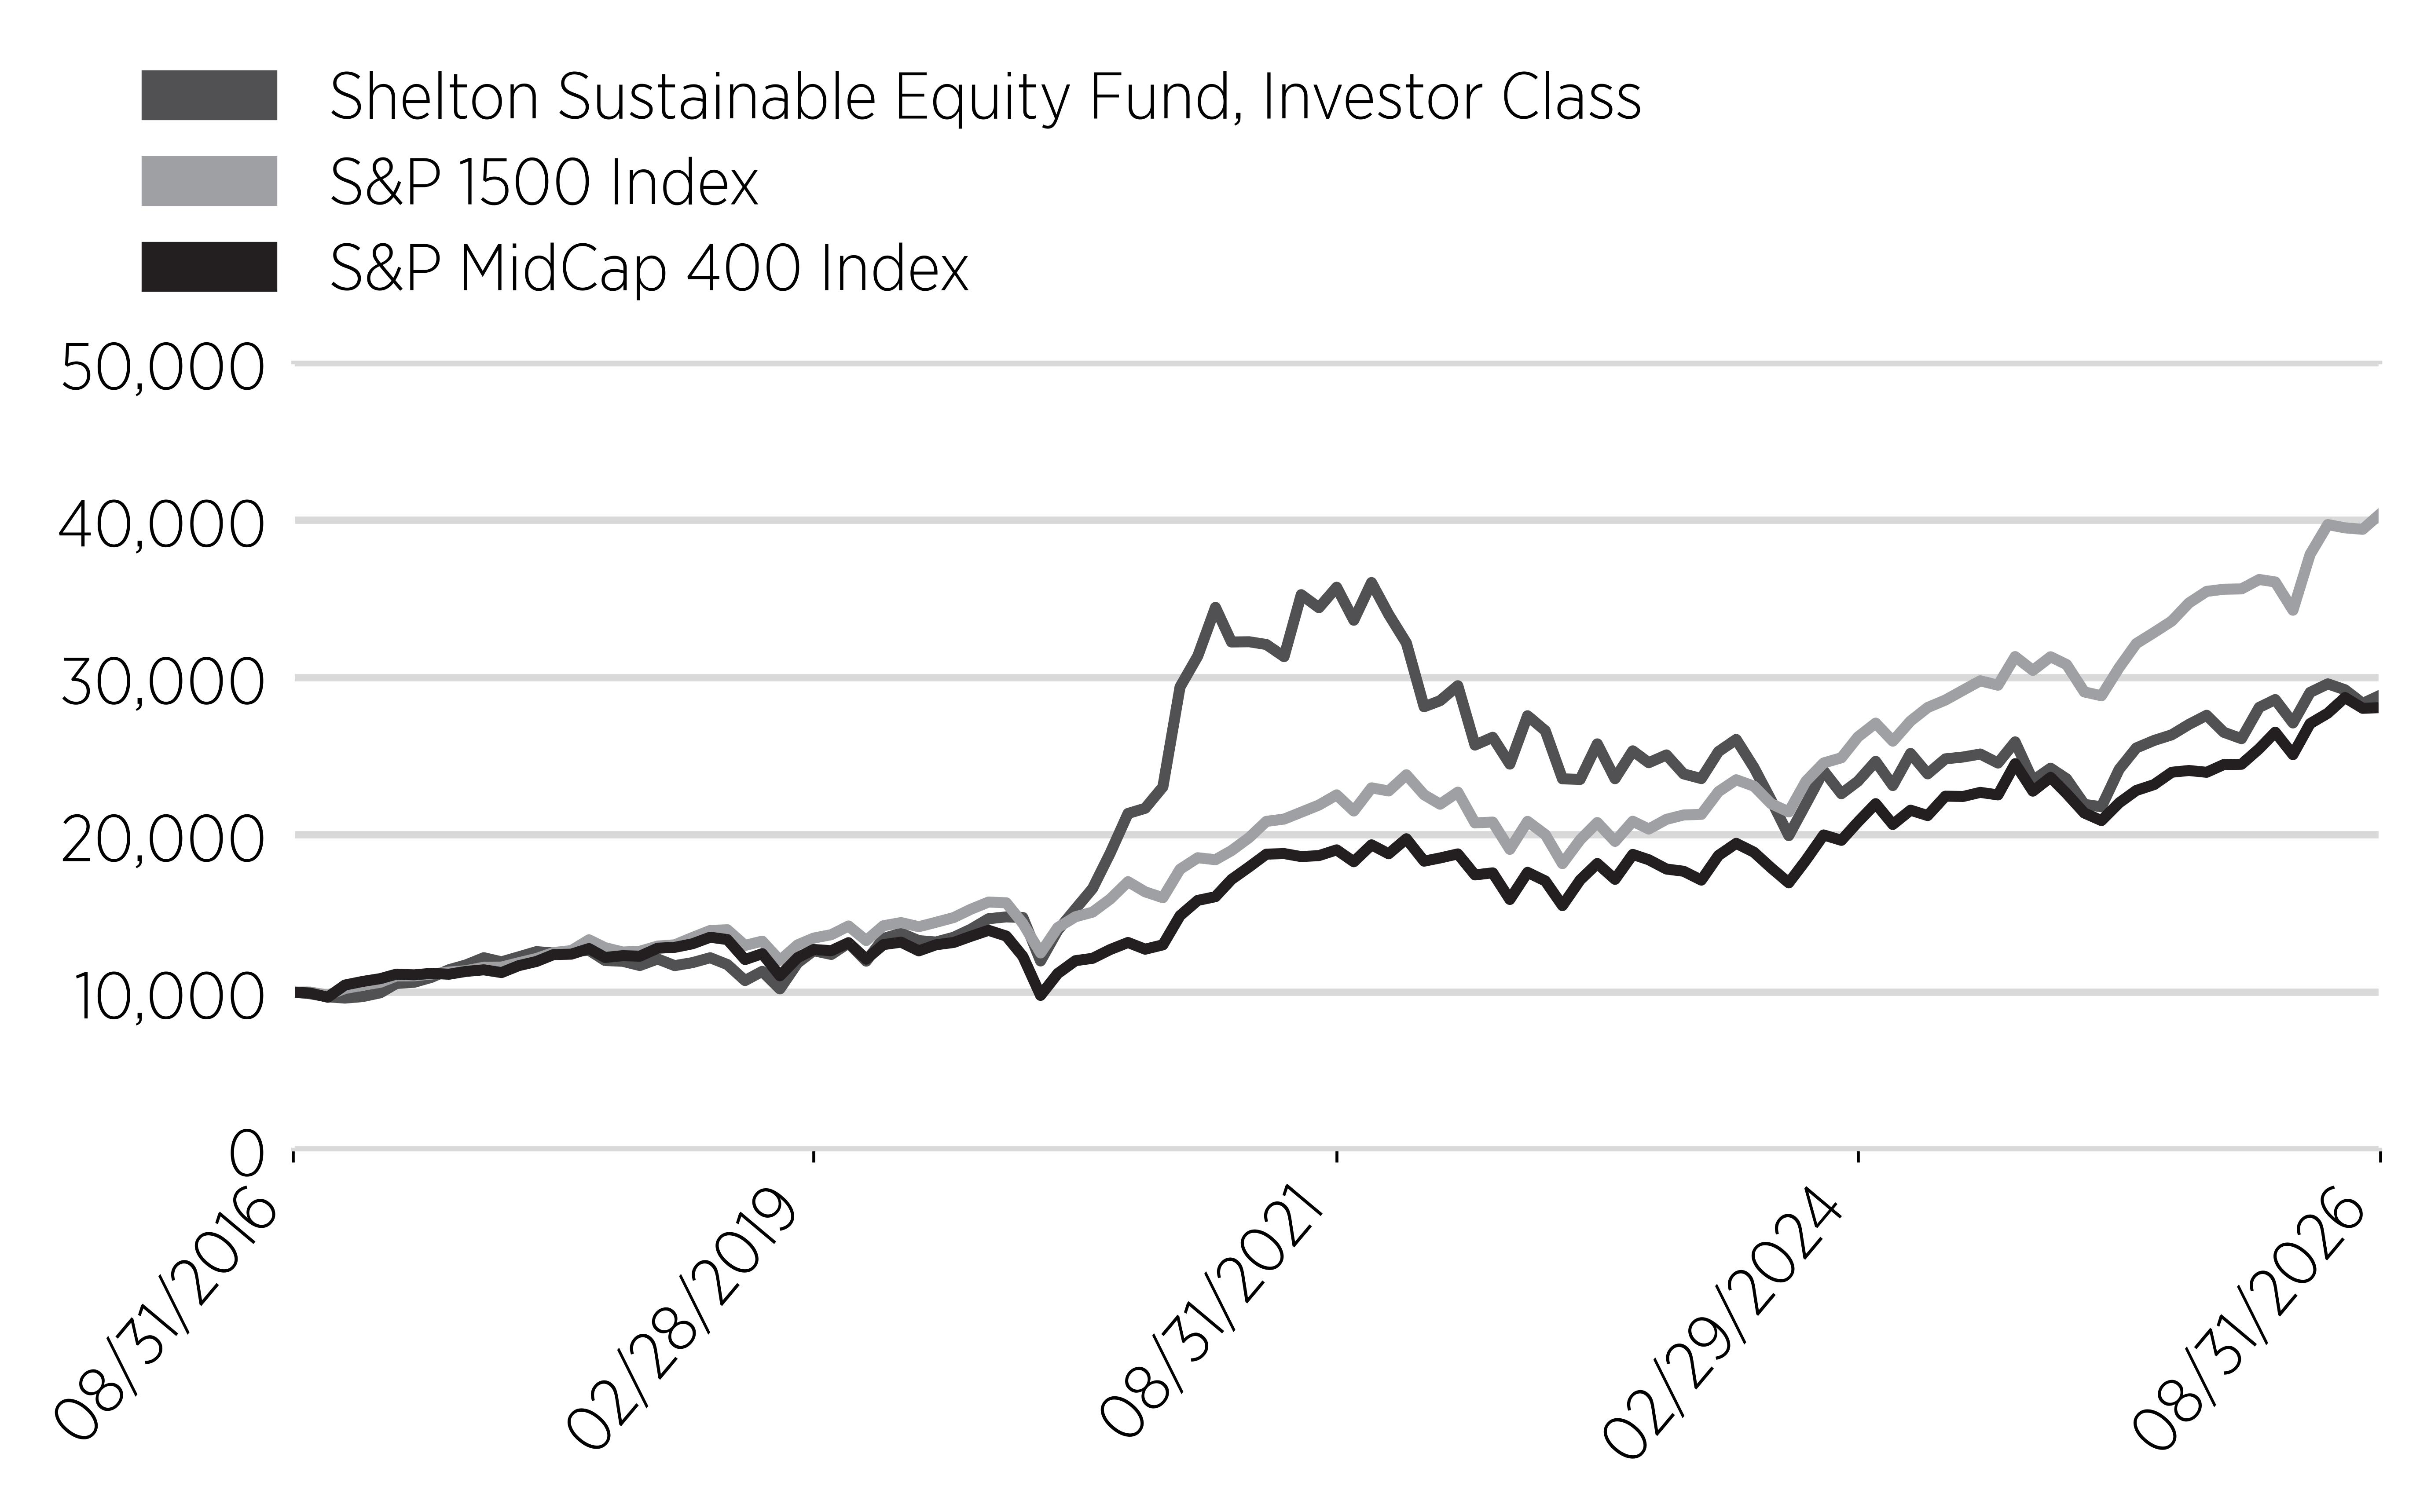
Annual Performance
|
Annual Performance
|
1 Year
|
5 Year
|
10 Year
|
|---|---|---|---|
|
Shelton Sustainable Equity Fund,
Investor Class
|
9.55%
|
-4.18%
|
11.19%
|
|
S&P 1500 Index
|
20.31%
|
12.38%
|
14.98%
|
|
S&P MidCap 400 Index
|
17.12%
|
8.04%
|
10.84%
|
Key Fund Statistics
(as of August 31, 2026)
|
Net Assets
|
$58,283,888
|
|
Total Number of Portfolio Holdings
|
45
|
|
Total Advisory Fee Paid
|
$467,532
|
|
Portfolio Turnover Rate
|
4%
|
What did the Fund invest in?
(% of Total Investments as of August 31, 2026)
Sector Breakdown
|
Top Ten Holdings
|
Percentage of
Total Investments
|
|---|---|
|
Ormat Technologies Inc
|
4.1%
|
|
Gaztransport Et Technigaz SA
|
3.7%
|
|
Siemens AG
|
3.6%
|
|
Deere & Co
|
3.5%
|
|
First Solar Inc
|
3.4%
|
|
Aramark
|
3.4%
|
|
HA Sustainable Infrastructure Capital Inc
|
3.3%
|
|
Bunge Global SA
|
3.3%
|
|
CF Industries Holdings Inc
|
3.3%
|
|
Schneider Electric SE
|
3.2%
|
What were the Fund costs for the last year?
(based on a hypothetical $10,000 investment)
|
Class Name
|
Costs of a $10,000 investment
|
Costs paid as a percentage of a $10,000 investment
|
|---|---|---|
|
Shelton Sustainable Equity Fund, Institutional Class
|
$105
|
1.03%
|
What affected the Fund's performance this period?
Mid-cap stocks underperformed the broader U.S. equity market during the fiscal year, with the S&P MidCap 400 Index returning 17.12%, compared with a 20.28% return for the S&P 1500 Index. The Fund's Institutional Class returned 9.55% for the period, trailing the S&P MidCap 400 Index by 7.57% and the S&P 1500 Index by 10.73%.
Sector positioning was the primary influence on the Fund’s relative performance. The Fund maintained a significant allocation to Industrials—42.3%, compared with 21.0% for the S&P MidCap 400 Index and 9.0% for the S&P 1500 Index. Industrials returned 13.4% during the period, providing positive absolute performance but lagging stronger areas of the market. The Fund’s lower allocations to Information Technology and Health Care during the period also limited participation in two of the period’s best-performing sectors. Information Technology returned 59.9%, while the Fund held 11.3% in the sector compared with 37.9% for the S&P 1500 Index. Health Care returned 29.6%, while the Fund held 3.0% compared with 9.0% for the S&P 1500 Index.
Several of the Fund’s larger holdings delivered strong results. Vertiv, Schneider Electric, CF Industries, HA Sustainable Infrastructure, Aramark, Bunge and Deere each generated substantial gains during the fiscal year. These results supported the Fund’s positive absolute return but were not sufficient to offset the effects of its sector positioning and weaker performance elsewhere in the portfolio.
Cumulative Performance
(based on a hypothetical $500,000 investment)
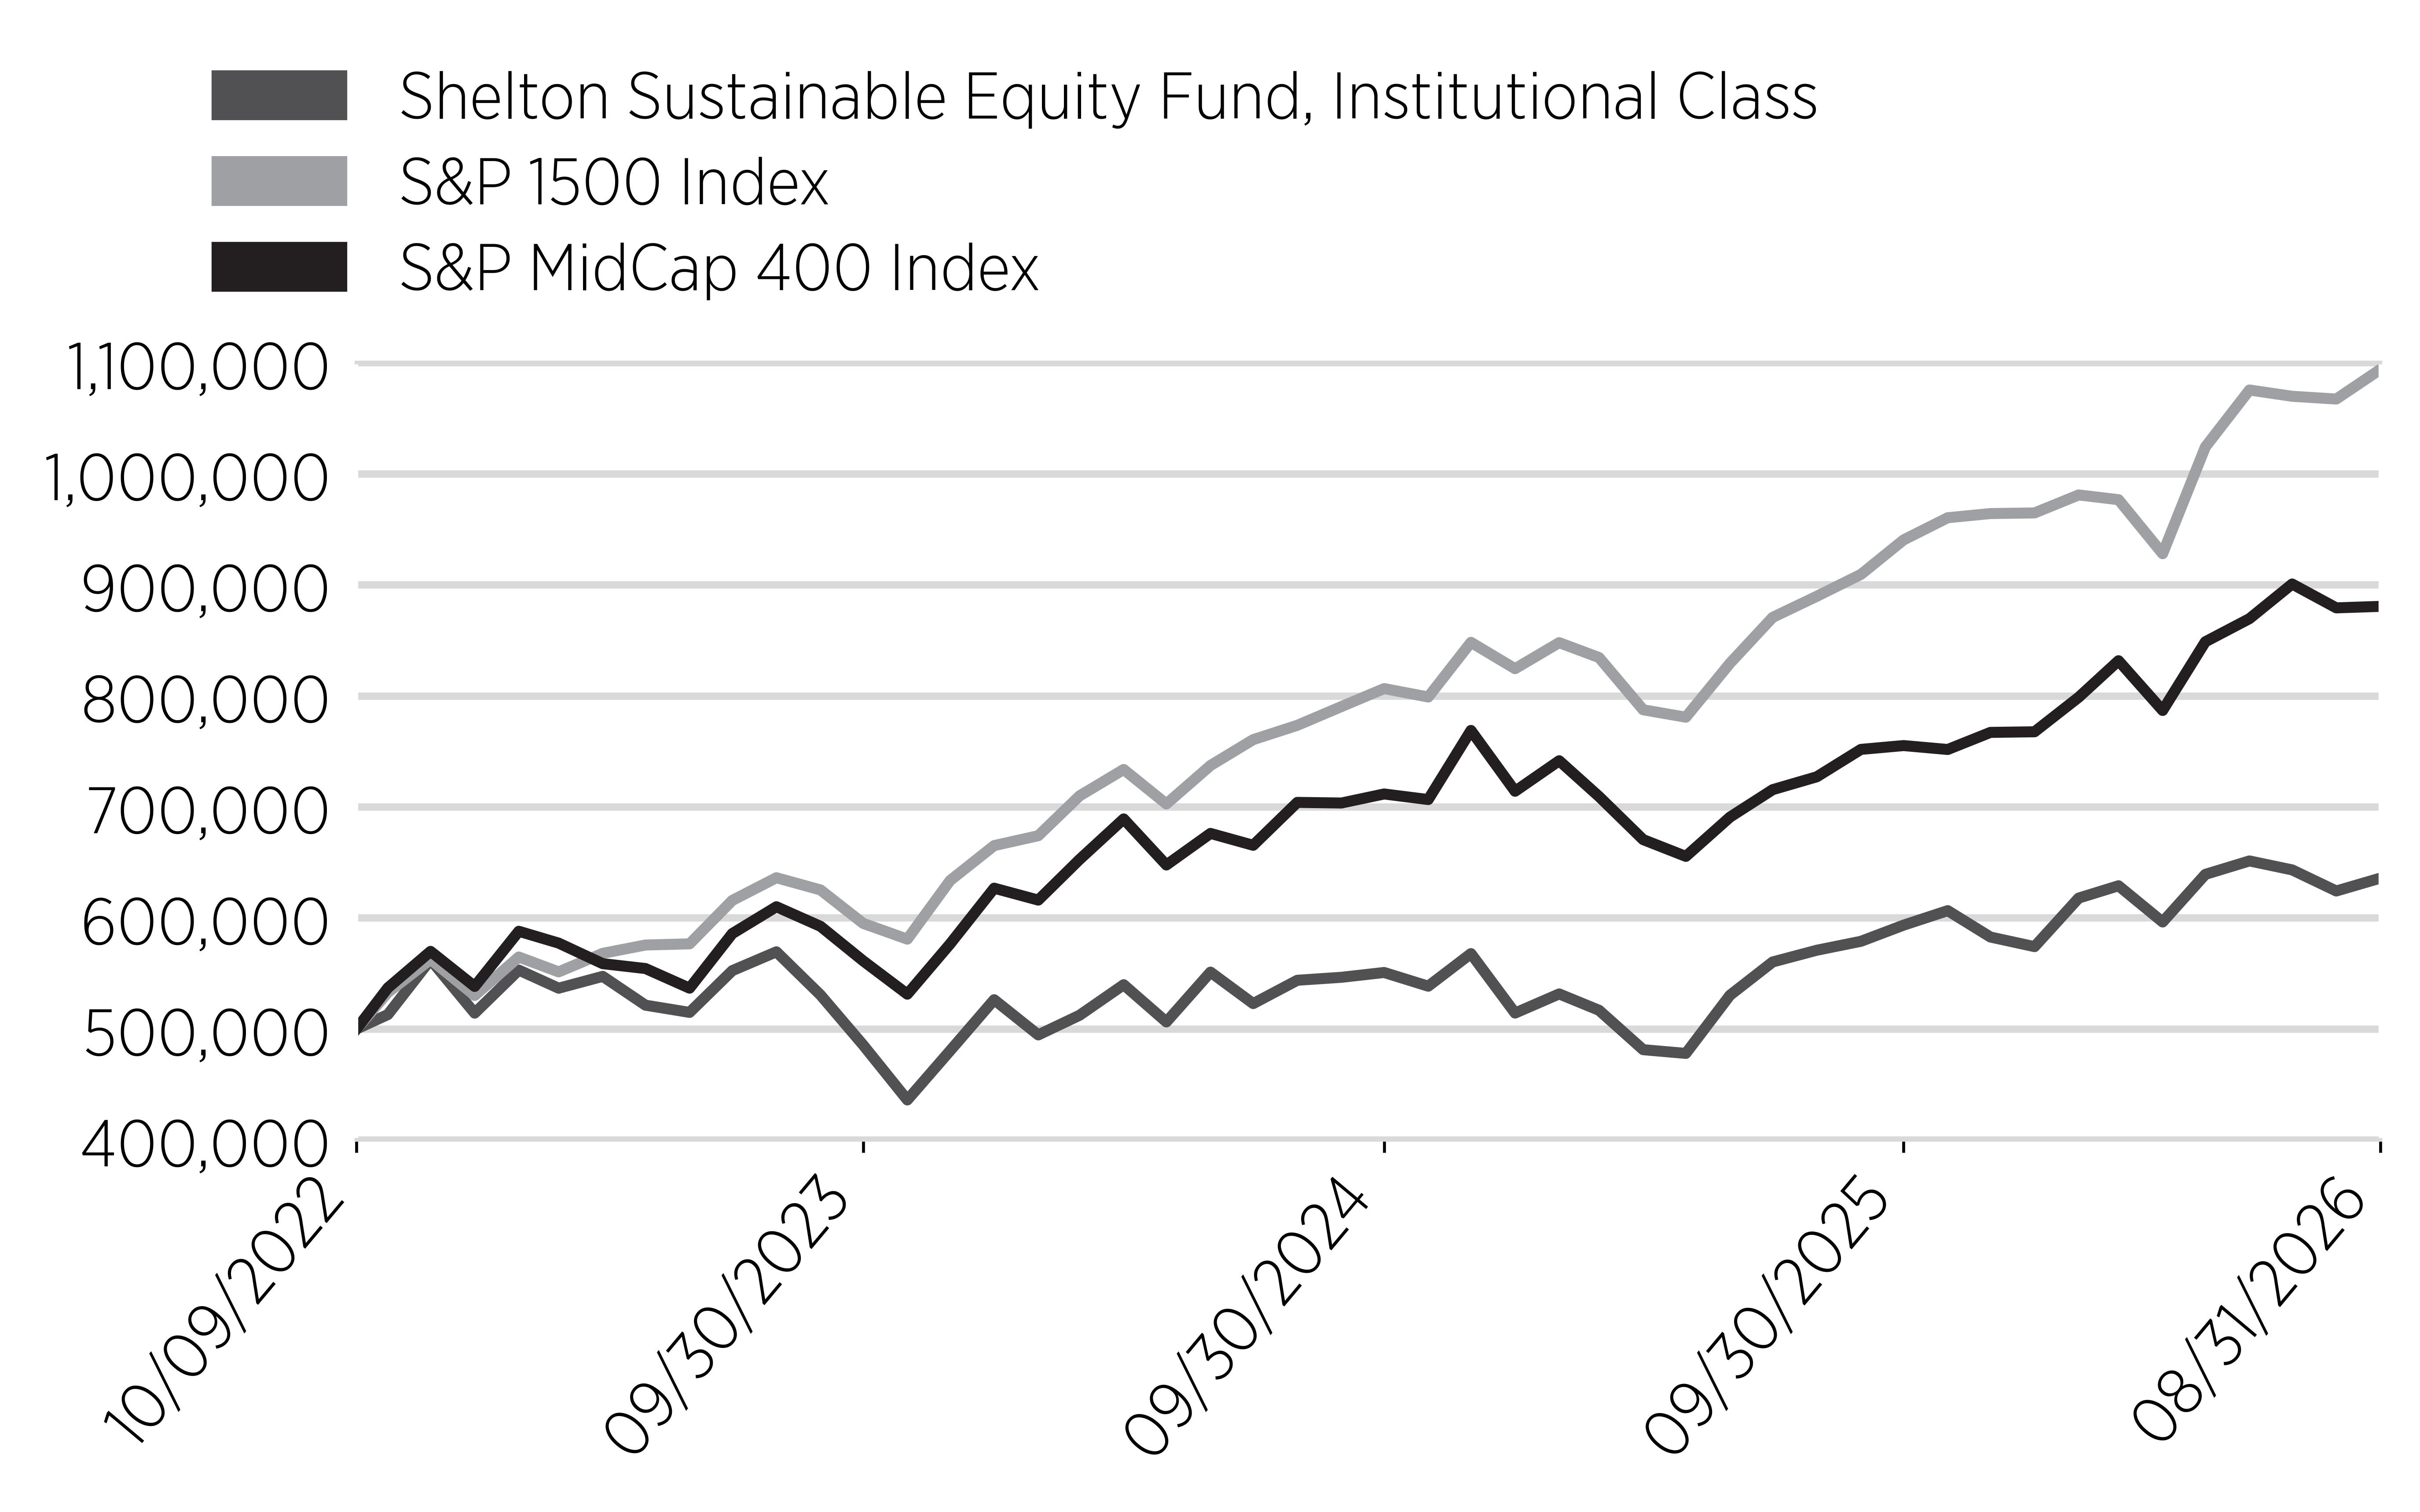
Annual Performance
|
Annual Performance
|
1 Year
|
Since Inception
(10/10/22)
|
|---|---|---|
|
Shelton Sustainable Equity Fund,
Institutional Class
|
9.83%
|
6.83%
|
|
S&P 1500 Index
|
20.31%
|
22.70%
|
|
S&P MidCap 400 Index
|
17.12%
|
15.64%
|
Key Fund Statistics
(as of August 31, 2026)
|
Net Assets
|
$9,132,168
|
|
Total Number of Portfolio Holdings
|
45
|
|
Total Advisory Fees Paid
|
$69,052
|
|
Portfolio Turnover Rate
|
4%
|
What did the Fund invest in?
(% of Total Investments as of August 31, 2026)
Sector Breakdown
|
Top Ten Holdings
|
Percentage of
Total Investments
|
|---|---|
|
Ormat Technologies Inc
|
4.1%
|
|
Gaztransport Et Technigaz SA
|
3.7%
|
|
Siemens AG
|
3.6%
|
|
Deere & Co
|
3.5%
|
|
First Solar Inc
|
3.4%
|
|
Aramark
|
3.4%
|
|
HA Sustainable Infrastructure Capital Inc
|
3.3%
|
|
Bunge Global SA
|
3.3%
|
|
CF Industries Holdings Inc
|
3.3%
|
|
Schneider Electric SE
|
3.2%
|
What were the Fund costs for the last year?
(based on a hypothetical $10,000 investment)
|
Class Name
|
Costs of a
$10,000 investment
|
Costs paid as a percentage of a
$10,000 investment
|
|---|---|---|
|
The United States Treasury Trust, Investor Class
|
$89
|
0.87%
|
Key Fund Statistics
(as of August 31, 2026)
|
Net Assets
|
$22,742,336
|
|
Total Number of Portfolio Holdings
|
11
|
|
Total Advisory Fees Paid
|
$126,769
|
What did the Fund invest in?
(% of Total Investments as of August 31, 2026)
Sector Breakdown
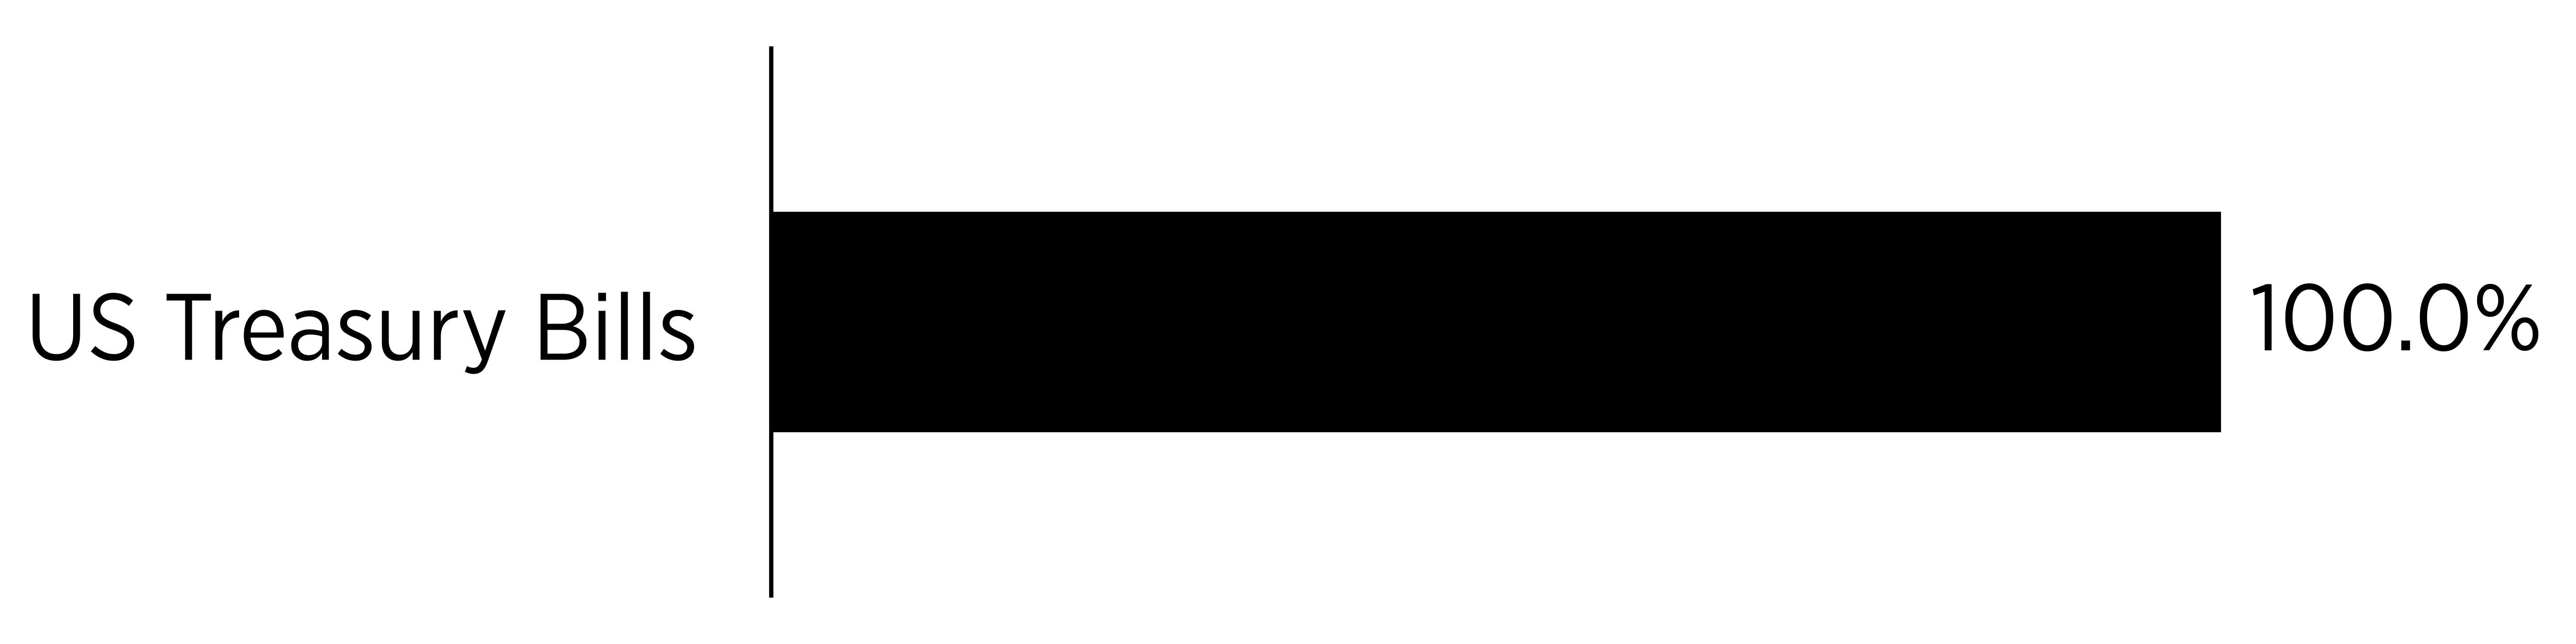
|
Top Ten Holdings
|
Percentage of Total Investments
|
|---|---|
|
United States Treasury Bill, 10/06/2026
|
13.1%
|
|
United States Treasury Bill, 10/20/2026
|
13.1%
|
|
United States Treasury Bill, 10/01/2026
|
12.5%
|
|
United States Treasury Bill, 10/15/2026
|
12.2%
|
|
United States Treasury Bill, 09/17/2026
|
10.9%
|
|
United States Treasury Bill, 11/03/2026
|
10.5%
|
|
United States Treasury Bill, 10/27/2026
|
6.8%
|
|
United States Treasury Bill, 09/10/2026
|
6.6%
|
|
United States Treasury Bill, 09/24/2026
|
6.6%
|
|
United States Treasury Bill, 11/19/2026
|
5.7%
|