Shareholder Report
|
12 Months Ended |
|
Aug. 31, 2026
USD ($)
|
|---|
| Shareholder Report [Line Items] |
|
|
| Document Type |
N-CSR
|
|
| Amendment Flag |
false
|
|
| Registrant Name |
Goldman Sachs ETF Trust
|
|
| Entity Central Index Key |
0001479026
|
|
| Entity Investment Company Type |
N-1A
|
|
| Document Period End Date |
Aug. 31, 2026
|
|
| Shareholder Report Annual or Semi-Annual |
Annual Shareholder Report
|
|
| C000201200 |
|
|
| Shareholder Report [Line Items] |
|
|
| Fund Name |
Goldman Sachs Access Emerging Markets USD Bond ETF
|
|
| Trading Symbol |
GEMD
|
|
| Security Exchange Name |
CboeBZX
|
|
| Annual or Semi-Annual Statement [Text Block] |
This annual shareholder report contains important information about Goldman Sachs Access Emerging Markets USD Bond ETF (the “Fund”) for the period of September 1, 2025 to August 31, 2026 (the “Period”).
|
|
| Additional Information [Text Block] |
You can find additional information about the Fund at am.gs.com or dfinview.com/GoldmanSachs. You can also request this information by contacting us at 1-800-621-2550.
|
|
| Material Fund Change Notice [Text Block] |
This report describes changes to the Fund that occurred during the Period.
|
|
| Additional Information Phone Number |
1-800-621-2550
|
|
| Expenses [Text Block] |
What were the Fund costs for the Period?Based on a hypothetical $10,000 investment.
Table Summary
Fund |
Costs of a $10,000 investment |
Costs paid as a percentage of a $10,000 investment |
GEMD |
$31 |
0.30% | |
|
| Expenses Paid, Amount |
$ 31
|
|
| Expense Ratio, Percent |
0.30%
|
|
| Factors Affecting Performance [Text Block] |
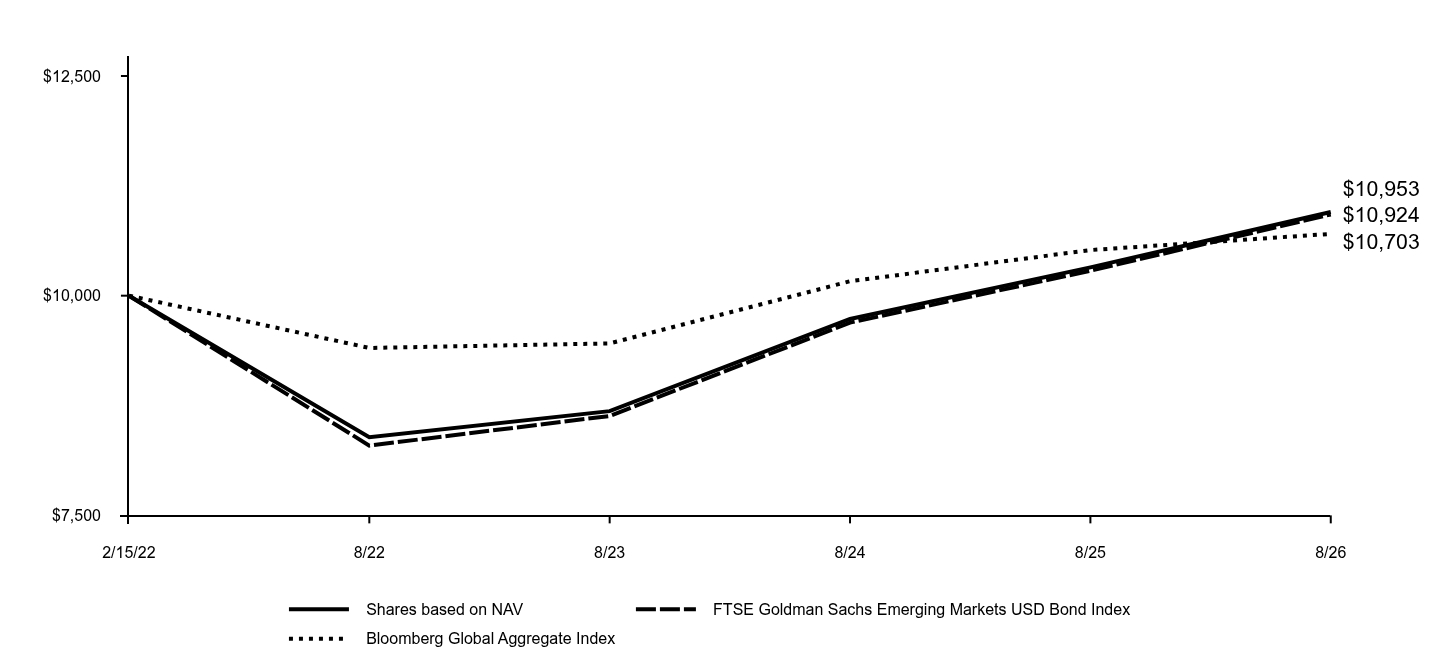
How did the Fund perform and what affected its performance?The performance of the emerging debt markets was shaped by a significant shift in U.S. Federal Reserve (Fed) monetary policy, uncertainty in trade relations, a shifting macroeconomic backdrop and geopolitical events. The Fed, which cut interest rates three times in late 2025, paused its easing cycle in 2026 as inflation reaccelerated, fueled by tariff-related price pressures and energy supply shocks resulting from the U.S.-Iran war. The start of the conflict in the Middle East weighed broadly on emerging markets debt, as the potential impact on inflation and economic growth from constraints on crude oil and liquid natural gas pushed up bond yields. Despite this challenging backdrop, emerging markets debt remained relatively resilient, with weakness mainly concentrated in oil-importing countries, credits exposed to heightened geopolitical risk, and countries facing local political or supply pressures. The asset class was supported overall by robust stand-alone fundamentals, low net leverage, positive credit ratings momentum and the ongoing growth of most emerging markets economies. For the Period overall, emerging markets debt significantly outperformed developed markets debt. Top Contributors to Performance: The FTSE Goldman Sachs Emerging Markets USD Bond Index (Index) generated positive returns, supported by the accommodative monetary policies of emerging markets central banks, attractive yields and the faster economic growth rates of emerging markets countries compared to developed markets countries. Following notable volatility in the first half of the Period, particularly during a war-related oil shock in early 2026, the Index posted gains in the spring and summer amid steady investment flows into emerging markets debt and periods of U.S. dollar weakness driven by concerns about the U.S. budget deficit, ongoing U.S. political gridlock and global trade uncertainty. The Index benefited from its regional exposures, with exposure to South America, Central America and Eastern Europe adding most to returns. Exposure to Central Asia and Asia Pacific also bolstered the Index’s performance, though to a smaller extent. Among countries, the Index’s top contributors were Argentina, Colombia and Turkey. The Index was helped by its exposure to five- to seven-year maturities. The top performing Index constituent was the sovereign debt of Argentina (4.63% of Fund net assets as of August 31, 2026).
Top Detractors from Performance: |
|
| Performance Past Does Not Indicate Future [Text] |
Performance data quoted above represents past performance. Past performance does not guarantee future results.
|
|
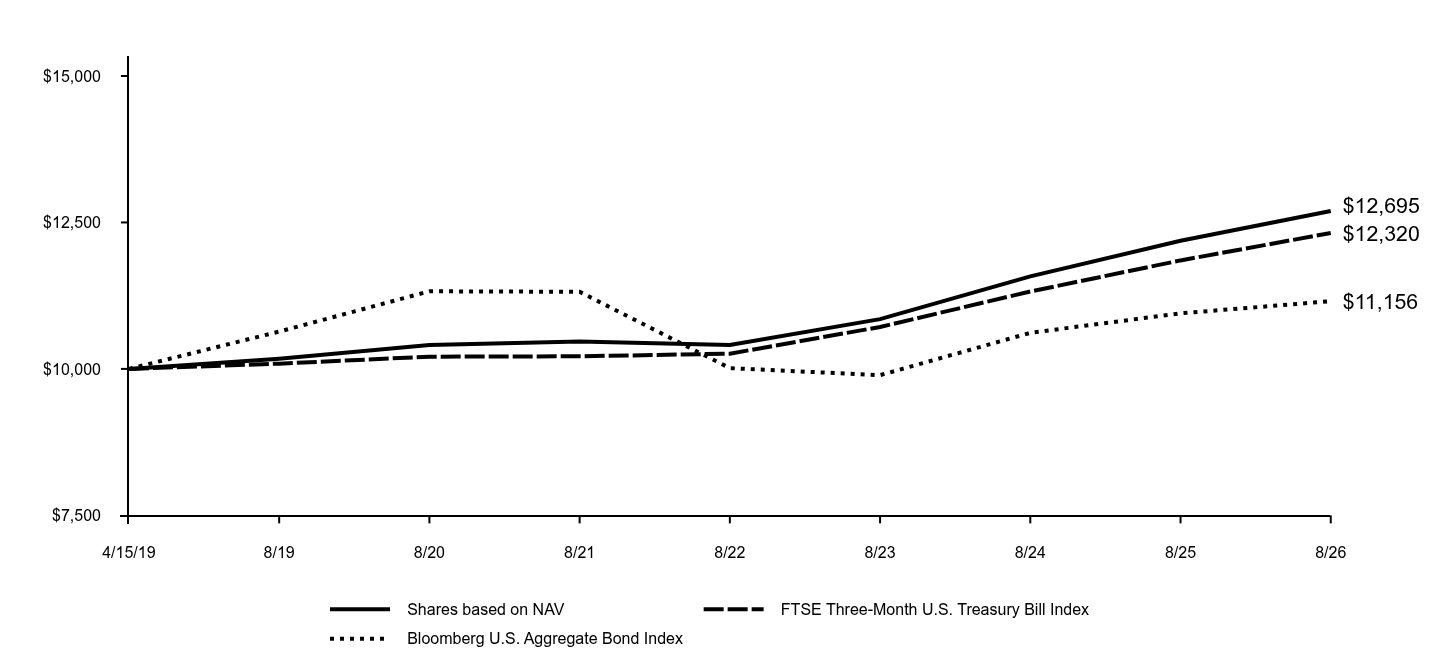
| Line Graph [Table Text Block] |
Table Summary
|
Shares based on NAV |
FTSE Goldman Sachs Emerging Markets USD Bond Index |
Bloomberg Global Aggregate Index |
2/15/22 |
$10,000 |
$10,000 |
$10,000 |
8/22 |
$8,389 |
$8,294 |
$9,405 |
8/23 |
$8,686 |
$8,631 |
$9,457 |
8/24 |
$9,735 |
$9,693 |
$10,164 |
8/25 |
$10,322 |
$10,284 |
$10,519 |
8/26 |
$10,953 |
$10,924 |
$10,703 |
|
|
| Average Annual Return [Table Text Block] |
Table Summary
|
1 Year |
Since Inception |
Shares based on NAV (Commenced February 15, 2022) |
6.11% |
2.02% |
FTSE Goldman Sachs Emerging Markets USD Bond Index |
6.22% |
1.96% |
Bloomberg Global Aggregate Index |
1.75% |
1.51% | |
|
| Performance Inception Date |
Feb. 15, 2022
|
|
| AssetsNet |
$ 35,453,062
|
|
| Advisory Fees Paid, Amount |
$ 82,314
|
|
| InvestmentCompanyPortfolioTurnover |
18.00%
|
|
| Additional Fund Statistics [Text Block] |
Table Summary
Total Net Assets as of Period End |
$35,453,062 |
# of Portfolio Holdings as of Period End |
205 |
Portfolio Turnover Rate for the Period |
18% |
Total Net Advisory Fees Paid for the Period |
$82,314 | |
|
| Holdings [Text Block] |
Table Summary
Government |
86.2 |
Energy |
6.5 |
Basic Materials |
2.2 |
Financial |
1.7 |
Utilities |
0.8 |
Industrial |
0.5 |
Other |
0.1 | |
|
| Material Fund Change [Text Block] |
This is a summary of certain changes to the Fund for the Period. For more complete information, you may review the Fund's next prospectus, which we expect to be available by December 29, 2026 at dfinview.com/GoldmanSachs or upon request at 1-800-621-2550. The Fund's net expense ratio decreased during the Period as a result of a reduction in unitary fees, and the elimination of the associated fee waiver, that took effect during the previous fiscal year. |
|
| Summary of Change Legend [Text Block] |
This is a summary of certain changes to the Fund for the Period. For more complete information, you may review the Fund's next prospectus, which we expect to be available by December 29, 2026 at dfinview.com/GoldmanSachs or upon request at 1-800-621-2550.
|
|
| Updated Prospectus Phone Number |
1-800-621-2550
|
|
| Updated Prospectus Web Address |
<span style="box-sizing: border-box; color: rgb(0, 0, 0); display: inline; flex-wrap: nowrap; font-size: 12px; font-weight: 400; grid-area: auto; line-height: 12px; margin: 0px; overflow: visible; text-align: left; text-align-last: auto; white-space-collapse: preserve-breaks;">dfinview.com/GoldmanSachs</span>
|
|
| C000186813 |
|
|
| Shareholder Report [Line Items] |
|
|
| Fund Name |
Goldman Sachs Access High Yield Corporate Bond ETF
|
|
| Trading Symbol |
GHYB
|
|
| Security Exchange Name |
NYSEArca
|
|
| Annual or Semi-Annual Statement [Text Block] |
This annual shareholder report contains important information about Goldman Sachs Access High Yield Corporate Bond ETF (the “Fund”) for the period of September 1, 2025 to August 31, 2026 (the “Period”).
|
|
| Additional Information [Text Block] |
You can find additional information about the Fund at am.gs.com or dfinview.com/GoldmanSachs. You can also request this information by contacting us at 1-800-621-2550.
|
|
| Material Fund Change Notice [Text Block] |
This report describes changes to the Fund that occurred during the Period.
|
|
| Additional Information Phone Number |
1-800-621-2550
|
|
| Expenses [Text Block] |
What were the Fund costs for the Period?Based on a hypothetical $10,000 investment.
Table Summary
Fund |
Costs of a $10,000 investment |
Costs paid as a percentage of a $10,000 investment |
GHYB |
$15 |
0.15% | |
|
| Expenses Paid, Amount |
$ 15
|
|
| Expense Ratio, Percent |
0.15%
|
|
| Factors Affecting Performance [Text Block] |
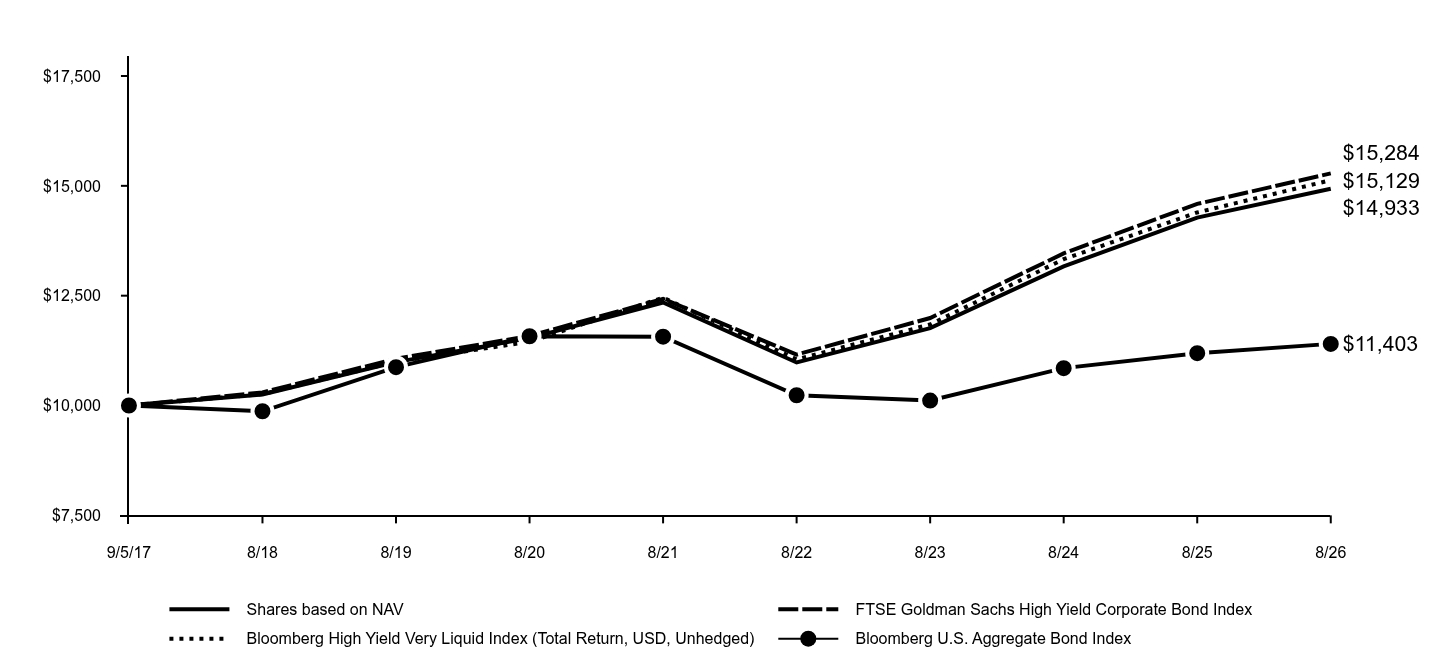
How did the Fund perform and what affected its performance?The performance of the U.S. fixed income markets was shaped by a significant shift in Federal Reserve (Fed) monetary policy and a volatile macroeconomic backdrop. After cutting interest rates three times in late 2025, the Fed paused its easing cycle in 2026 as inflation reaccelerated, driven by tariff-related price pressures and energy supply shocks resulting from the U.S.-Iran war. Bond yields, which had fallen earlier in the Period in response to Fed easing, rose along the curve, with longer-term yields increasing significantly as investors demanded greater compensation for the risks associated with higher inflation and fiscal challenges, such as the U.S. national debt. As for U.S. high yield corporate bonds, when the Period began in September 2025, their performance was broadly positive, supported by Fed rate cuts, active primary markets, robust corporate earnings and better than market expected macroeconomic data. However, in March 2026, the high yield corporate bond market suffered its weakest monthly performance since October 2023, reflecting an increase in risk aversion as investors faced heightened geopolitical tensions in the Middle East and worried about the rapid transformation of industries and market dynamics driven by artificial intelligence. Performance rebounded in April and then fluctuated thereafter amid shifting market sentiment about the U.S.-Iran war, inflation, Fed monetary policy and ongoing strength in corporate earnings. Top Contributors to Performance: The FTSE Goldman Sachs High Yield Corporate Bond Index (Index) produced positive returns, as the fundamental backdrop for high yield corporate bond issuers remained remarkably healthy. Companies across multiple sectors provided optimistic corporate guidance overall, suggesting that default risks remained low. All sectors contributed positively to the Index’s returns, led by consumer cyclical, energy and consumer non-cyclical. The transportation and other industrial sectors also added to Index performance, albeit to a lesser extent. From a credit quality perspective, the Index benefited from its exposure to BB- and B-rated credits. Regarding individual securities, Index returns were aided by the high yield debt of Community Health Systems, an operator of general acute care hospitals and outpatient facilities; Bausch Health, a specialty pharmaceutical and medical device maker; and Michaels Stores, an arts and crafts retail chain (0.96%, 0.95% and 0.16% of Fund net assets as of August 31, 2026, respectively).
Top Detractors from Performance: The Index was held back by its exposure to CC-rated credits, which produced marginally negative returns. The Index’s performance was hurt by the high yield debt of telecommunications company CSC Holdings; packaging label manufacturer LABL; and luxury retail and related commerce services provider SGUS (0.45%, 0.00%1 and 0.00%1 of Fund net assets as of August 31, 2026, respectively).
1Some weights are 0.00% at August 31, 2026 either because those positions were eliminated during the most recent rebalance given the Index construction methodology or were not held at all during the Period as they did not meet the Fund’s investment criteria. |
|
| Performance Past Does Not Indicate Future [Text] |
Performance data quoted above represents past performance. Past performance does not guarantee future results.
|
|
| Line Graph [Table Text Block] |
Table Summary
|
Shares based on NAV |
FTSE Goldman Sachs High Yield Corporate Bond Index |
Bloomberg High Yield Very Liquid Index (Total Return, USD, Unhedged) |
Bloomberg U.S. Aggregate Bond Index |
9/5/17 |
$10,000 |
$10,000 |
$10,000 |
$10,000 |
8/18 |
$10,250 |
$10,298 |
$10,260 |
$9,869 |
8/19 |
$10,988 |
$11,064 |
$10,997 |
$10,873 |
8/20 |
$11,533 |
$11,583 |
$11,451 |
$11,576 |
8/21 |
$12,346 |
$12,427 |
$12,455 |
$11,567 |
8/22 |
$10,979 |
$11,159 |
$11,050 |
$10,234 |
8/23 |
$11,762 |
$11,992 |
$11,845 |
$10,113 |
8/24 |
$13,165 |
$13,464 |
$13,330 |
$10,851 |
8/25 |
$14,278 |
$14,589 |
$14,394 |
$11,192 |
8/26 |
$14,933 |
$15,284 |
$15,129 |
$11,403 |
|
|
| Average Annual Return [Table Text Block] |
Table Summary
|
1 Year |
5 Years |
Since Inception |
Shares based on NAV (Commenced September 5, 2017) |
4.59% |
3.88% |
4.56% |
FTSE Goldman Sachs High Yield Corporate Bond Index |
4.76% |
4.22% |
4.83% |
Bloomberg High Yield Very Liquid Index (Total Return, USD, Unhedged) |
5.11% |
3.96% |
4.71% |
Bloomberg U.S. Aggregate Bond Index |
1.89% |
-0.29% |
1.47% | |
|
| Performance Inception Date |
Sep. 05, 2017
|
|
| AssetsNet |
$ 143,003,248
|
|
| Advisory Fees Paid, Amount |
$ 151,400
|
|
| InvestmentCompanyPortfolioTurnover |
19.00%
|
|
| Additional Fund Statistics [Text Block] |
Table Summary
Total Net Assets as of Period End |
$143,003,248 |
# of Portfolio Holdings as of Period End |
941 |
Portfolio Turnover Rate for the Period |
19% |
Total Net Advisory Fees Paid for the Period |
$151,400 | |
|
| Holdings [Text Block] |
Table Summary
Consumer Cyclical |
17.1 |
Energy |
8.3 |
Financial Company |
6.7 |
Healthcare |
5.5 |
Communications |
5.2 |
Technology |
4.4 |
Consumer Noncyclical |
4.2 |
Basic Industry |
3.6 |
Electric |
3.4 |
Other |
40.0 | |
|
| Material Fund Change [Text Block] |
This is a summary of certain changes to the Fund for the Period. For more complete information, you may review the Fund's next prospectus, which we expect to be available by December 29, 2026 at dfinview.com/GoldmanSachs or upon request at 1-800-621-2550. The Fund's net expense ratio decreased during the Period as a result of a reduction in unitary fees that took effect during the previous fiscal year. |
|
| Summary of Change Legend [Text Block] |
This is a summary of certain changes to the Fund for the Period. For more complete information, you may review the Fund's next prospectus, which we expect to be available by December 29, 2026 at dfinview.com/GoldmanSachs or upon request at 1-800-621-2550.
|
|
| Updated Prospectus Phone Number |
1-800-621-2550
|
|
| Updated Prospectus Web Address |
<span style="box-sizing: border-box; color: rgb(0, 0, 0); display: inline; flex-wrap: nowrap; font-size: 12px; font-weight: 400; grid-area: auto; line-height: 12px; margin: 0px; overflow: visible; text-align: left; text-align-last: auto; white-space-collapse: preserve-breaks;">dfinview.com/GoldmanSachs</span>
|
|
| C000202360 |
|
|
| Shareholder Report [Line Items] |
|
|
| Fund Name |
Goldman Sachs Access Inflation Protected USD Bond ETF
|
|
| Trading Symbol |
GTIP
|
|
| Security Exchange Name |
CboeBZX
|
|
| Annual or Semi-Annual Statement [Text Block] |
This annual shareholder report contains important information about Goldman Sachs Access Inflation Protected USD Bond ETF (the “Fund”) for the period of September 1, 2025 to August 31, 2026 (the “Period”).
|
|
| Additional Information [Text Block] |
You can find additional information about the Fund at am.gs.com or dfinview.com/GoldmanSachs. You can also request this information by contacting us at 1-800-621-2550.
|
|
| Additional Information Phone Number |
1-800-621-2550
|
|
| Expenses [Text Block] |
What were the Fund costs for the Period?Based on a hypothetical $10,000 investment.
Table Summary
Fund |
Costs of a $10,000 investment |
Costs paid as a percentage of a $10,000 investment |
GTIP |
$12 |
0.12% | |
|
| Expenses Paid, Amount |
$ 12
|
|
| Expense Ratio, Percent |
0.12%
|
|
| Factors Affecting Performance [Text Block] |
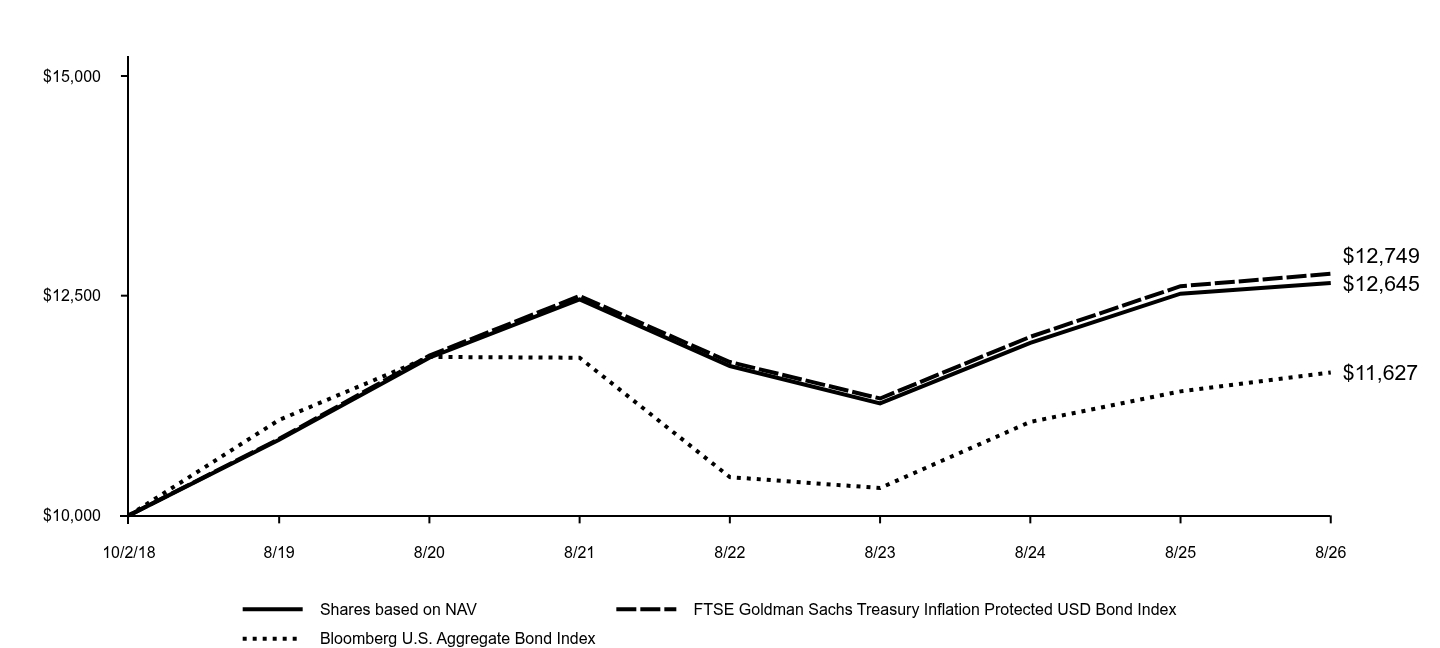
How did the Fund perform and what affected its performance?The performance of the U.S. fixed income markets was shaped by a significant shift in Federal Reserve (Fed) monetary policy and a volatile macroeconomic backdrop. After cutting interest rates three times in late 2025, the Fed paused its easing cycle in 2026 as inflation reaccelerated, driven by tariff-related price pressures and energy supply shocks resulting from the U.S.-Iran war. Bond yields, which had fallen earlier in the Period in response to Fed easing, rose along the curve, with longer-term yields increasing significantly as investors demanded greater compensation for the risks associated with higher inflation and fiscal challenges, such as the U.S. national debt. During the Period overall, inflation stayed well above the Fed’s 2% target. The headline Consumer Price Index (CPI) was 3.4% year over year through August 2026, while core CPI was 2.4%. The Fed’s preferred gauge, Personal Consumption Expenditures (PCE), ran hotter, with headline PCE at 3.7% and core PCE at 3.3% in July 2026 (latest data available). Top Contributors to Performance: The FTSE Goldman Sachs Treasury Inflation Protected USD Bond Index (Index) generated a positive return, as investors favored Treasury inflation protected securities (TIPS) for the attractive inflation-adjusted income they offered. The performance of the Index was defined by two opposing factors. The first was persistent inflation, which led to upward adjustments to TIPS’ principal and interest payments. The second was a significant rise in bond yields, which was a headwind for TIPS prices. The Index benefited from its exposure to maturities of less than 10 years, with the one- to three-year and one-year and shorter segments of the U.S. Treasury yield curve contributing most positively.
Top Detractors from Performance: |
|
| Performance Past Does Not Indicate Future [Text] |
Performance data quoted above represents past performance. Past performance does not guarantee future results.
|
|
| Line Graph [Table Text Block] |
Table Summary
|
Shares based on NAV |
FTSE Goldman Sachs Treasury Inflation Protected USD Bond Index |
Bloomberg U.S. Aggregate Bond Index |
10/2/18 |
$10,000 |
$10,000 |
$10,000 |
8/19 |
$10,861 |
$10,871 |
$11,086 |
8/20 |
$11,794 |
$11,818 |
$11,803 |
8/21 |
$12,457 |
$12,497 |
$11,794 |
8/22 |
$11,699 |
$11,745 |
$10,435 |
8/23 |
$11,274 |
$11,330 |
$10,311 |
8/24 |
$11,962 |
$12,032 |
$11,064 |
8/25 |
$12,523 |
$12,608 |
$11,411 |
8/26 |
$12,645 |
$12,749 |
$11,627 |
|
|
| Average Annual Return [Table Text Block] |
Table Summary
|
1 Year |
5 Years |
Since Inception |
Shares based on NAV (Commenced October 2, 2018) |
0.97% |
0.30% |
3.01% |
FTSE Goldman Sachs Treasury Inflation Protected USD Bond Index |
1.12% |
0.40% |
3.12% |
Bloomberg U.S. Aggregate Bond Index |
1.89% |
-0.29% |
1.92% | |
|
| Performance Inception Date |
Oct. 02, 2018
|
|
| AssetsNet |
$ 280,516,310
|
|
| Advisory Fees Paid, Amount |
$ 258,177
|
|
| InvestmentCompanyPortfolioTurnover |
41.00%
|
|
| Additional Fund Statistics [Text Block] |
Table Summary
Total Net Assets as of Period End |
$280,516,310 |
# of Portfolio Holdings as of Period End |
39 |
Portfolio Turnover Rate for the Period |
41% |
Total Net Advisory Fees Paid for the Period |
$258,177 | |
|
| Holdings [Text Block] |
Table Summary
Government |
99.4 |
Other |
0.1 | |
|
| Material Fund Change [Text Block] |
|
|
| Updated Prospectus Phone Number |
1-800-621-2550
|
|
| Updated Prospectus Web Address |
<span style="box-sizing: border-box; color: rgb(0, 0, 0); display: inline; flex-wrap: nowrap; font-size: 12px; font-weight: 400; grid-area: auto; line-height: 12px; margin: 0px; overflow: visible; text-align: left; text-align-last: auto; white-space-collapse: preserve-breaks;">dfinview.com/GoldmanSachs</span>
|
|
| C000186809 |
|
|
| Shareholder Report [Line Items] |
|
|
| Fund Name |
Goldman Sachs Access Investment Grade Corporate Bond ETF
|
|
| Trading Symbol |
GIGB
|
|
| Security Exchange Name |
NYSEArca
|
|
| Annual or Semi-Annual Statement [Text Block] |
This annual shareholder report contains important information about Goldman Sachs Access Investment Grade Corporate Bond ETF (the “Fund”) for the period of September 1, 2025 to August 31, 2026 (the “Period”).
|
|
| Additional Information [Text Block] |
You can find additional information about the Fund at am.gs.com or dfinview.com/GoldmanSachs. You can also request this information by contacting us at 1-800-621-2550.
|
|
| Material Fund Change Notice [Text Block] |
This report describes changes to the Fund that occurred during the Period.
|
|
| Additional Information Phone Number |
1-800-621-2550
|
|
| Expenses [Text Block] |
What were the Fund costs for the Period?Based on a hypothetical $10,000 investment.
Table Summary
Fund |
Costs of a $10,000 investment |
Costs paid as a percentage of a $10,000 investment |
GIGB |
$8 |
0.08% | |
|
| Expenses Paid, Amount |
$ 8
|
|
| Expense Ratio, Percent |
0.08%
|
|
| Factors Affecting Performance [Text Block] |
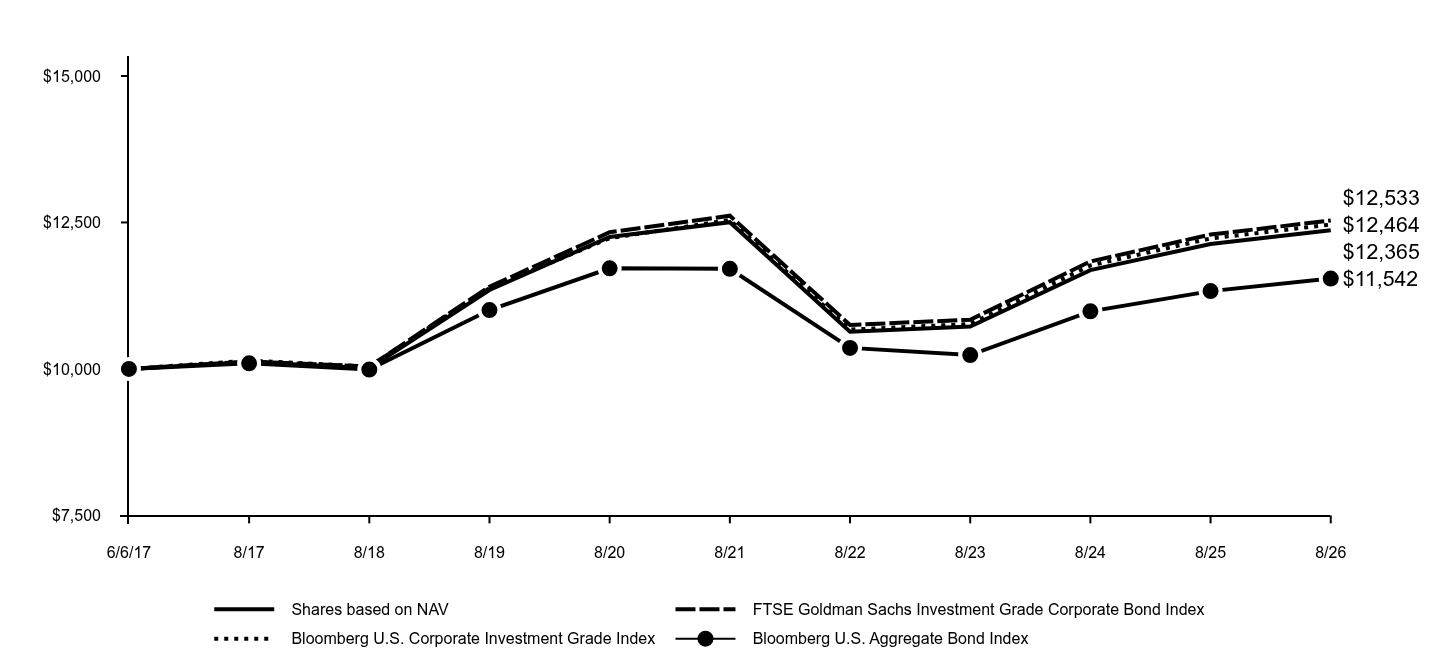
How did the Fund perform and what affected its performance?The performance of the U.S. fixed income markets was shaped by a significant shift in Federal Reserve (Fed) monetary policy and a volatile macroeconomic backdrop. After cutting interest rates three times in late 2025, the Fed paused its easing cycle in 2026 as inflation reaccelerated, driven by tariff-related price pressures and energy supply shocks resulting from the U.S.-Iran war. Bond yields, which had fallen earlier in the Period in response to Fed easing, rose along the curve, with longer-term yields increasing significantly as investors demanded greater compensation for the risks associated with higher inflation and fiscal challenges, such as the U.S. national debt. In this environment, the performance of investment grade corporate bonds was volatile, with strong gains following the Fed’s 2025 rate cuts and subsequent weakness as inflation concerns pushed yields higher. Top Contributors to Performance: The FTSE Goldman Sachs Investment Grade Corporate Bond Index (Index) generated positive returns, as investment grade corporate bonds benefited from favorable risk sentiment and supportive supply/demand dynamics. The Index’s lower credit quality bias added to returns, as investors took on additional credit risk in exchange for higher yields. BBB-rated credits generally outperformed those of higher quality. The Index was helped by its yield curve positioning in one- to three-year maturities, as these investment grade corporate bonds significantly outperformed their longer-term counterparts. Positions in the banking and consumer non-cyclical sectors contributed positively to Index performance. Among individual issues, the Index’s top contributors were large financial companies, including Bank of America, Citigroup and Morgan Stanley (2.25%, 1.45% and 1.49% of Fund net assets as of August 31, 2026, respectively).
Top Detractors from Performance: The Index was hampered by positions in major technology companies, including Oracle, Meta Platforms and Google (1.45%, 1.13% and 0.89% of Fund net assets as of August 31, 2026, respectively).
|
|
| Performance Past Does Not Indicate Future [Text] |
Performance data quoted above represents past performance. Past performance does not guarantee future results.
|
|
| Line Graph [Table Text Block] |
Table Summary
|
Shares based on NAV |
FTSE Goldman Sachs Investment Grade Corporate Bond Index |
Bloomberg U.S. Corporate Investment Grade Index |
Bloomberg U.S. Aggregate Bond Index |
6/6/17 |
$10,000 |
$10,000 |
$10,000 |
$10,000 |
8/17 |
$10,119 |
$10,126 |
$10,142 |
$10,095 |
8/18 |
$10,011 |
$10,041 |
$10,040 |
$9,989 |
8/19 |
$11,347 |
$11,403 |
$11,378 |
$11,005 |
8/20 |
$12,252 |
$12,333 |
$12,232 |
$11,717 |
8/21 |
$12,505 |
$12,615 |
$12,541 |
$11,708 |
8/22 |
$10,634 |
$10,750 |
$10,671 |
$10,359 |
8/23 |
$10,724 |
$10,840 |
$10,766 |
$10,236 |
8/24 |
$11,687 |
$11,834 |
$11,766 |
$10,983 |
8/25 |
$12,132 |
$12,294 |
$12,227 |
$11,328 |
8/26 |
$12,365 |
$12,533 |
$12,464 |
$11,542 |
|
|
| Average Annual Return [Table Text Block] |
Table Summary
|
1 Year |
5 Years |
Since Inception |
Shares based on NAV (Commenced June 6, 2017) |
1.92% |
-0.22% |
2.32% |
FTSE Goldman Sachs Investment Grade Corporate Bond Index |
1.94% |
-0.13% |
2.47% |
Bloomberg U.S. Corporate Investment Grade Index |
1.94% |
-0.12% |
2.41% |
Bloomberg U.S. Aggregate Bond Index |
1.89% |
-0.29% |
1.56% | |
|
| Performance Inception Date |
Jun. 06, 2017
|
|
| AssetsNet |
$ 1,009,738,619
|
|
| Advisory Fees Paid, Amount |
$ 634,800
|
|
| InvestmentCompanyPortfolioTurnover |
6.00%
|
|
| Additional Fund Statistics [Text Block] |
Table Summary
Total Net Assets as of Period End |
$1,009,738,619 |
# of Portfolio Holdings as of Period End |
2,620 |
Portfolio Turnover Rate for the Period |
6% |
Total Net Advisory Fees Paid for the Period |
$634,800 | |
|
| Holdings [Text Block] |
Table Summary
Banks |
22.9 |
Electric |
10.4 |
Technology |
8.5 |
Consumer Noncyclical |
7.3 |
Energy |
6.7 |
Consumer Cyclical |
6.6 |
Capital Goods |
3.7 |
Wireless |
3.3 |
REITs and Real Estate |
2.8 |
Other |
26.5 | |
|
| Material Fund Change [Text Block] |
This is a summary of certain changes to the Fund for the Period. For more complete information, you may review the Fund's next prospectus, which we expect to be available by December 29, 2026 at dfinview.com/GoldmanSachs or upon request at 1-800-621-2550. The Fund's net expense ratio decreased during the Period as a result of a reduction in unitary fees that took effect during the previous fiscal year. |
|
| Summary of Change Legend [Text Block] |
This is a summary of certain changes to the Fund for the Period. For more complete information, you may review the Fund's next prospectus, which we expect to be available by December 29, 2026 at dfinview.com/GoldmanSachs or upon request at 1-800-621-2550.
|
|
| Updated Prospectus Phone Number |
1-800-621-2550
|
|
| Updated Prospectus Web Address |
<span style="box-sizing: border-box; color: rgb(0, 0, 0); display: inline; flex-wrap: nowrap; font-size: 12px; font-weight: 400; grid-area: auto; line-height: 12px; margin: 0px; overflow: visible; text-align: left; text-align-last: auto; white-space-collapse: preserve-breaks;">dfinview.com/GoldmanSachs</span>
|
|
| C000172210 |
|
|
| Shareholder Report [Line Items] |
|
|
| Fund Name |
Goldman Sachs Access Treasury 0-1 Year ETF
|
|
| Trading Symbol |
GBIL
|
|
| Security Exchange Name |
NYSEArca
|
|
| Annual or Semi-Annual Statement [Text Block] |
This annual shareholder report contains important information about Goldman Sachs Access Treasury 0-1 Year ETF (the “Fund”) for the period of September 1, 2025 to August 31, 2026 (the “Period”).
|
|
| Additional Information [Text Block] |
You can find additional information about the Fund at am.gs.com or dfinview.com/GoldmanSachs. You can also request this information by contacting us at 1-800-621-2550.
|
|
| Additional Information Phone Number |
1-800-621-2550
|
|
| Expenses [Text Block] |
What were the Fund costs for the Period?Based on a hypothetical $10,000 investment.
Table Summary
Fund |
Costs of a $10,000 investment |
Costs paid as a percentage of a $10,000 investment |
GBIL |
$12 |
0.12% | |
|
| Expenses Paid, Amount |
$ 12
|
|
| Expense Ratio, Percent |
0.12%
|
|
| Factors Affecting Performance [Text Block] |
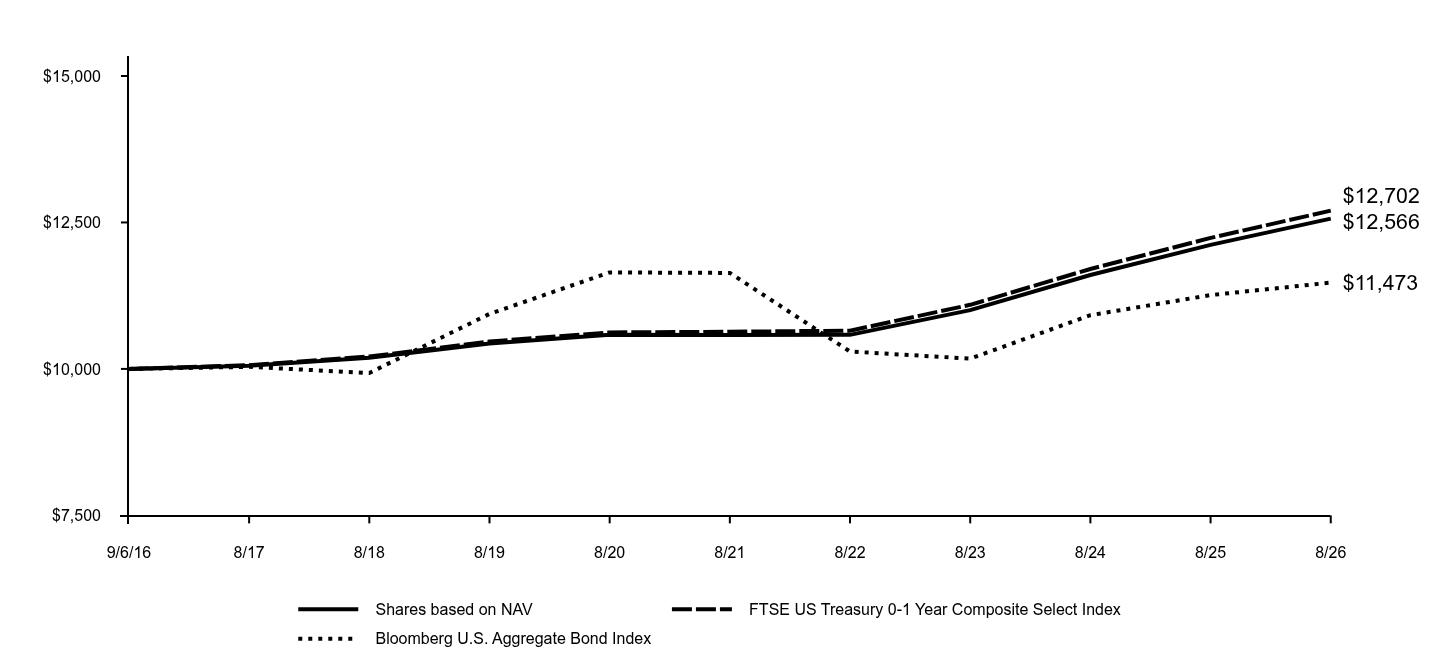
How did the Fund perform and what affected its performance?The performance of the U.S. fixed income markets was shaped by a significant shift in Federal Reserve (Fed) monetary policy and a volatile macroeconomic backdrop. After cutting interest rates three times in late 2025, the Fed paused its easing cycle in 2026 as inflation reaccelerated, driven by tariff-related price pressures and energy supply shocks resulting from the U.S.-Iran war. Intermediate- and longer-term U.S. Treasury yields, which had fallen early in the Period in response to Fed easing, rose as investors demanded greater compensation for the risks associated with higher inflation and fiscal challenges, such as the U.S. national debt. Shorter-term U.S. Treasury yields, which had also fallen due to Fed action, remained rather low through the end of the Period. Top Contributors to Performance: The FTSE US Treasury 0-1 Year Composite Select Index (Index) generated a positive return. Its performance was largely reflective of the performance of short-term U.S. Treasury yields, which were primarily affected by existing and anticipated Fed monetary policy. Short-term U.S. Treasury securities produced positive returns, as their yields fell in response to Fed interest rates cuts. Yields on one-year Treasury bills dropped by 30 basis points during the Period. Although short-term U.S. Treasury yields fell, they remained high by historical measures. As a result, short-term U.S. Treasury securities offered investors attractive income potential, which, in turn, supported their prices. Short-term U.S. Treasuries have little duration risk, which tends to insulate them from interest rate movements.
Top Detractors from Performance: |
|
| Performance Past Does Not Indicate Future [Text] |
Performance data quoted above represents past performance. Past performance does not guarantee future results.
|
|
| Line Graph [Table Text Block] |
Table Summary
|
Shares based on NAV |
FTSE US Treasury 0-1 Year Composite Select Index |
Bloomberg U.S. Aggregate Bond Index |
9/6/16 |
$10,000 |
$10,000 |
$10,000 |
8/17 |
$10,053 |
$10,064 |
$10,035 |
8/18 |
$10,190 |
$10,212 |
$9,930 |
8/19 |
$10,434 |
$10,467 |
$10,939 |
8/20 |
$10,583 |
$10,623 |
$11,647 |
8/21 |
$10,580 |
$10,634 |
$11,638 |
8/22 |
$10,581 |
$10,653 |
$10,297 |
8/23 |
$11,004 |
$11,094 |
$10,175 |
8/24 |
$11,603 |
$11,706 |
$10,917 |
8/25 |
$12,117 |
$12,236 |
$11,260 |
8/26 |
$12,566 |
$12,702 |
$11,473 |
|
|
| Average Annual Return [Table Text Block] |
Table Summary
|
1 Year |
5 Years |
Since Inception |
Shares based on NAV (Commenced September 6, 2016) |
3.70% |
3.50% |
2.31% |
FTSE US Treasury 0-1 Year Composite Select Index |
3.81% |
3.62% |
2.42% |
Bloomberg U.S. Aggregate Bond Index |
1.89% |
-0.29% |
1.38% | |
|
| Performance Inception Date |
Sep. 06, 2016
|
|
| AssetsNet |
$ 7,639,037,793
|
|
| Advisory Fees Paid, Amount |
$ 8,440,454
|
|
| InvestmentCompanyPortfolioTurnover |
0.00%
|
|
| Additional Fund Statistics [Text Block] |
Table Summary
Total Net Assets as of Period End |
$7,639,037,793 |
# of Portfolio Holdings as of Period End |
1,005 |
Portfolio Turnover Rate for the Period |
0% |
Total Net Advisory Fees Paid for the Period |
$8,440,454 | |
|
| Holdings [Text Block] |
Table Summary
Government |
99.7 | |
|
| Material Fund Change [Text Block] |
|
|
| Updated Prospectus Phone Number |
1-800-621-2550
|
|
| Updated Prospectus Web Address |
<span style="box-sizing: border-box; color: rgb(0, 0, 0); display: inline; flex-wrap: nowrap; font-size: 12px; font-weight: 400; grid-area: auto; line-height: 12px; margin: 0px; overflow: visible; text-align: left; text-align-last: auto; white-space-collapse: preserve-breaks;">dfinview.com/GoldmanSachs</span>
|
|
| C000215322 |
|
|
| Shareholder Report [Line Items] |
|
|
| Fund Name |
Goldman Sachs Access U.S. Aggregate Bond ETF
|
|
| Trading Symbol |
GCOR
|
|
| Security Exchange Name |
NYSEArca
|
|
| Annual or Semi-Annual Statement [Text Block] |
This annual shareholder report contains important information about Goldman Sachs Access U.S. Aggregate Bond ETF (the “Fund”) for the period of September 1, 2025 to August 31, 2026 (the “Period”).
|
|
| Additional Information [Text Block] |
You can find additional information about the Fund at am.gs.com or dfinview.com/GoldmanSachs. You can also request this information by contacting us at 1-800-621-2550.
|
|
| Material Fund Change Notice [Text Block] |
This report describes changes to the Fund that occurred during the Period.
|
|
| Additional Information Phone Number |
1-800-621-2550
|
|
| Expenses [Text Block] |
What were the Fund costs for the Period?Based on a hypothetical $10,000 investment.
Table Summary
Fund |
Costs of a $10,000 investment |
Costs paid as a percentage of a $10,000 investment |
GCOR |
$7 |
0.07% | |
|
| Expenses Paid, Amount |
$ 7
|
|
| Expense Ratio, Percent |
0.07%
|
|
| Factors Affecting Performance [Text Block] |
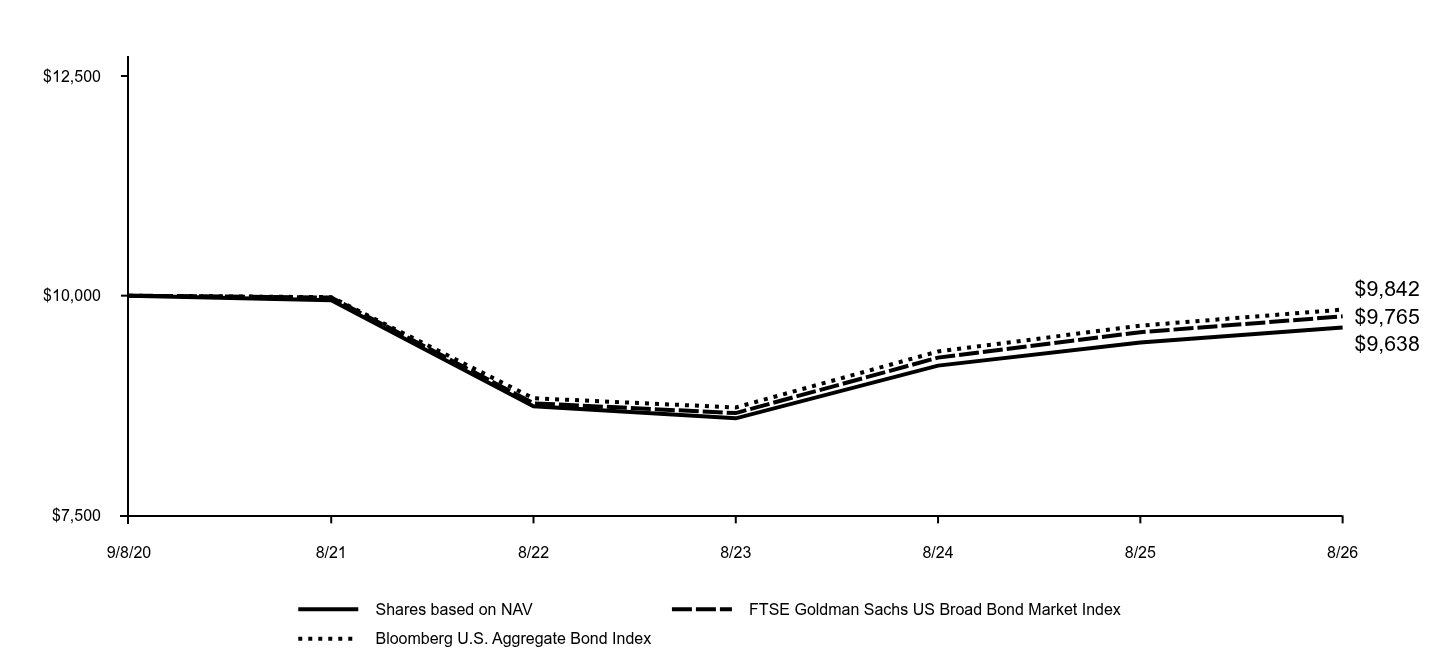
How did the Fund perform and what affected its performance?The performance of the U.S. fixed income markets was shaped by a significant shift in Federal Reserve (Fed) monetary policy and a volatile macroeconomic backdrop. After cutting interest rates three times in late 2025, the Fed paused its easing cycle in 2026 as inflation reaccelerated, driven by tariff-related price pressures and energy supply shocks resulting from the U.S.-Iran war. Bond yields, which had fallen earlier in the Period in response to Fed easing, rose along the curve, with longer-term yields increasing significantly as investors demanded greater compensation for the risks associated with higher inflation and fiscal challenges, such as the U.S. national debt. In this environment, the performance of investment grade corporate bonds was volatile, with strong gains following the Fed’s 2025 rate cuts and subsequent weakness as inflation concerns pushed yields higher. Top Contributors to Performance: The FTSE Goldman Sachs U.S. Broad Bond Market Index (Index) generated a positive return, as the income component of the Index offset negative price performance. From a yield curve perspective, the Index benefited from its positioning overall. The Index was helped most by its positions in shorter-term maturities of one to three years. Securitized bonds contributed positively to the Index’s return, followed closely by U.S. Treasury securities and corporate bonds. Key contributors were agency fixed-rate mortgage-backed securities and banking corporate bonds.
Top Detractors from Performance: |
|
| Performance Past Does Not Indicate Future [Text] |
Performance data quoted above represents past performance. Past performance does not guarantee future results.
|
|
| Line Graph [Table Text Block] |
Table Summary
|
Shares based on NAV |
FTSE Goldman Sachs US Broad Bond Market Index |
Bloomberg U.S. Aggregate Bond Index |
9/8/20 |
$10,000 |
$10,000 |
$10,000 |
8/21 |
$9,948 |
$9,979 |
$9,983 |
8/22 |
$8,742 |
$8,775 |
$8,833 |
8/23 |
$8,604 |
$8,664 |
$8,728 |
8/24 |
$9,204 |
$9,295 |
$9,365 |
8/25 |
$9,467 |
$9,584 |
$9,659 |
8/26 |
$9,638 |
$9,765 |
$9,842 |
|
|
| Average Annual Return [Table Text Block] |
Table Summary
|
1 Year |
5 Years |
Since Inception |
Shares based on NAV (Commenced September 8, 2020) |
1.80% |
-0.63% |
-0.61% |
FTSE Goldman Sachs US Broad Bond Market Index |
1.89% |
-0.43% |
-0.40% |
Bloomberg U.S. Aggregate Bond Index |
1.89% |
-0.29% |
-0.27% | |
|
| Performance Inception Date |
Sep. 08, 2020
|
|
| AssetsNet |
$ 833,852,121
|
|
| Advisory Fees Paid, Amount |
$ 488,139
|
|
| InvestmentCompanyPortfolioTurnover |
245.00%
|
|
| Additional Fund Statistics [Text Block] |
Table Summary
Total Net Assets as of Period End |
$833,852,121 |
# of Portfolio Holdings as of Period End |
1,833 |
Portfolio Turnover Rate for the Period |
245% |
Total Net Advisory Fees Paid for the Period |
$488,139 | |
|
| Holdings [Text Block] |
Table Summary
U.S. Treasury Obligations |
47.0 |
Mortgage-Backed Securities |
22.7 |
Corporate Obligations |
21.6 |
Foreign Corporate Debt |
4.9 |
Sovereign Debt Obligations |
2.5 |
U.S. Government Agency Obligations |
0.6 |
Other |
10.0 | |
|
| Material Fund Change [Text Block] |
This is a summary of certain changes to the Fund for the Period. For more complete information, you may review the Fund's next prospectus, which we expect to be available by December 29, 2026 at dfinview.com/GoldmanSachs or upon request at 1-800-621-2550. The Fund's net expense ratio decreased during the Period as a result of a reduction in unitary fees that took effect during the previous fiscal year. |
|
| Summary of Change Legend [Text Block] |
This is a summary of certain changes to the Fund for the Period. For more complete information, you may review the Fund's next prospectus, which we expect to be available by December 29, 2026 at dfinview.com/GoldmanSachs or upon request at 1-800-621-2550.
|
|
| Updated Prospectus Phone Number |
1-800-621-2550
|
|
| Updated Prospectus Web Address |
<span style="box-sizing: border-box; color: rgb(0, 0, 0); display: inline; flex-wrap: nowrap; font-size: 12px; font-weight: 400; grid-area: auto; line-height: 12px; margin: 0px; overflow: visible; text-align: left; text-align-last: auto; white-space-collapse: preserve-breaks;">dfinview.com/GoldmanSachs</span>
|
|
| C000248475 |
|
|
| Shareholder Report [Line Items] |
|
|
| Fund Name |
Goldman Sachs Access U.S. Preferred Stock and Hybrid Securities ETF
|
|
| Trading Symbol |
GPRF
|
|
| Security Exchange Name |
NASDAQ
|
|
| Annual or Semi-Annual Statement [Text Block] |
This annual shareholder report contains important information about Goldman Sachs Access U.S. Preferred Stock and Hybrid Securities ETF (the “Fund”) for the period of September 1, 2025 to August 31, 2026 (the “Period”).
|
|
| Additional Information [Text Block] |
You can find additional information about the Fund at am.gs.com or dfinview.com/GoldmanSachs. You can also request this information by contacting us at 1-800-621-2550.
|
|
| Additional Information Phone Number |
1-800-621-2550
|
|
| Expenses [Text Block] |
What were the Fund costs for the Period?Based on a hypothetical $10,000 investment.
Table Summary
Fund |
Costs of a $10,000 investment |
Costs paid as a percentage of a $10,000 investment |
GPRF |
$46 |
0.45% | |
|
| Expenses Paid, Amount |
$ 46
|
|
| Expense Ratio, Percent |
0.45%
|
|
| Factors Affecting Performance [Text Block] |
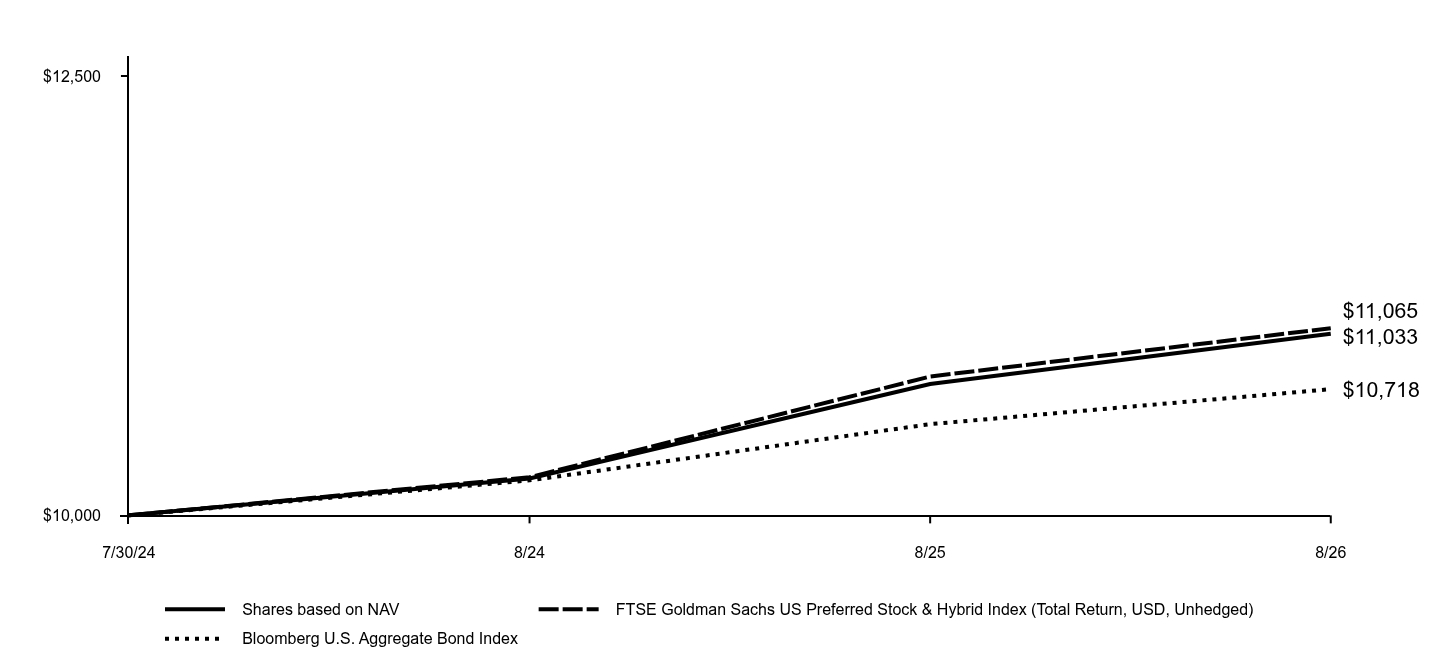
How did the Fund perform and what affected its performance?Interest rates had the greatest impact on the performance of U.S. preferred stocks and hybrid securities. The Federal Reserve (Fed), after cutting interest rates three times in late 2025, paused its monetary policy easing cycle in 2026 as inflation reaccelerated, driven by the outbreak of the U.S.-Iran war and the continued impact of trade tariffs. As inflation remained above the Fed's 2% target, the market began to price in potential Fed rate hikes, which led to a rise in long-term interest rates. In this environment, $1,000 par over-the-counter traded securities ($1,000 pars), which typically have variable rate structures, generated positive total returns, driven by coupon/dividend income and spread tightening. Conversely, $25 par exchange traded securities ($25 pars), which typically have fixed-rate coupons and are of longer duration, recorded negative total returns due to spread widening and higher long-term interest rates. Top Contributors to Performance: The FTSE Goldman Sachs US Preferred Stock and Hybrids Index (Index) produced a positive return, with $1,000 pars outperforming $25 pars. The outperformance of $1,000 pars was driven in part by spread tightening of more than 36 basis points. In comparison, $25 pars saw spread widening of approximately 75 basis points. The relatively shorter duration of $1,000 pars added to Index performance, as these securities experienced a smaller negative impact from rising long-term interest rates. The Index benefited from its holdings in the electric, energy and insurance sectors. In terms of individual securities, the Index was helped by positions in CVS Health, a provider of integrated services across retail pharmacy, pharmacy benefit management and health insurance; PG&E, which sells and delivers electricity and natural gas to customers in northern and central California; and Sempra Energy, an energy services holding company (0.55%, 0.50% and 0.00%1 of Fund net assets as of August 31, 2026, respectively). From a broader company perspective, Sempra Energy; Dominion Energy, which provides regulated electricity and natural gas services in the U.S.; and Energy Transfer LP, an owner and operator of natural gas transportation pipelines and storage facilities added to Index performance.
Top Detractors from Performance: Holdings in the basic industry and communications sectors detracted most from Index performance. Two individual positions in media and entertainment conglomerate Paramount Global and a position in agricultural solutions company FMC detracted most from Index returns (0.30%, 0.18% and 0.12% of Fund net assets as of August 31, 2026, respectively). From a broader company perspective, the weakest performers in the Index were Paramount Global, FMC and telecommunications company Verizon.
1Some weights were 0.00% as of August 31, 2026, either because those positions were eliminated during the most recent rebalance, given the Index construction methodology, or because they were not held at all during the Period as they did not meet the Fund’s investment criteria. |
|
| Performance Past Does Not Indicate Future [Text] |
Performance data quoted above represents past performance. Past performance does not guarantee future results.
|
|
| Line Graph [Table Text Block] |
Table Summary
|
Shares based on NAV |
FTSE Goldman Sachs US Preferred Stock & Hybrid Index (Total Return, USD, Unhedged) |
Bloomberg U.S. Aggregate Bond Index |
7/30/24 |
$10,000 |
$10,000 |
$10,000 |
8/24 |
$10,210 |
$10,217 |
$10,199 |
8/25 |
$10,747 |
$10,790 |
$10,519 |
8/26 |
$11,033 |
$11,065 |
$10,718 |
|
|
| Average Annual Return [Table Text Block] |
Table Summary
|
1 Year |
Since Inception |
Shares based on NAV (Commenced July 30, 2024) |
2.66% |
4.82% |
FTSE Goldman Sachs US Preferred Stock & Hybrid Index (Total Return, USD, Unhedged) |
2.55% |
4.96% |
Bloomberg U.S. Aggregate Bond Index |
1.89% |
3.37% | |
|
| Performance Inception Date |
Jul. 30, 2024
|
|
| AssetsNet |
$ 146,026,491
|
|
| Advisory Fees Paid, Amount |
$ 555,435
|
|
| InvestmentCompanyPortfolioTurnover |
24.00%
|
|
| Additional Fund Statistics [Text Block] |
Table Summary
Total Net Assets as of Period End |
$146,026,491 |
# of Portfolio Holdings as of Period End |
526 |
Portfolio Turnover Rate for the Period |
24% |
Total Net Advisory Fees Paid for the Period |
$555,435 | |
|
| Holdings [Text Block] |
Table Summary
Financial |
23.5 |
Banks |
23.1 |
Electric |
19.1 |
Energy |
9.1 |
Insurance |
6.7 |
Wireless |
5.1 |
Utilities |
3.4 |
Communications |
1.6 |
Financial Company |
1.5 |
Other |
5.8 | |
|
| Material Fund Change [Text Block] |
|
|
| Updated Prospectus Phone Number |
1-800-621-2550
|
|
| Updated Prospectus Web Address |
<span style="box-sizing: border-box; color: rgb(0, 0, 0); display: inline; flex-wrap: nowrap; font-size: 12px; font-weight: 400; grid-area: auto; line-height: 12px; margin: 0px; overflow: visible; text-align: left; text-align-last: auto; white-space-collapse: preserve-breaks;">dfinview.com/GoldmanSachs</span>
|
|
| C000152548 |
|
|
| Shareholder Report [Line Items] |
|
|
| Fund Name |
Goldman Sachs ActiveBeta<sup style="inset: 1.5px 0px 4px; box-sizing: border-box; color: rgb(33, 120, 196); display: inline; flex-wrap: nowrap; font-size: 14px; font-weight: 700; grid-area: auto; line-height: 0px; margin: 0px; overflow: visible; position: relative; text-align: left; text-align-last: auto; white-space-collapse: preserve-breaks;">®</sup> Emerging Markets Equity ETF
|
|
| Trading Symbol |
GEM
|
|
| Security Exchange Name |
NYSEArca
|
|
| Annual or Semi-Annual Statement [Text Block] |
This annual shareholder report contains important information about Goldman Sachs ActiveBeta® Emerging Markets Equity ETF (the “Fund”) for the period of September 1, 2025 to August 31, 2026 (the “Period”).
|
|
| Additional Information [Text Block] |
You can find additional information about the Fund at am.gs.com or dfinview.com/GoldmanSachs. You can also request this information by contacting us at 1-800-621-2550.
|
|
| Material Fund Change Notice [Text Block] |
This report describes changes to the Fund that occurred during the Period.
|
|
| Additional Information Phone Number |
1-800-621-2550
|
|
| Expenses [Text Block] |
What were the Fund costs for the Period?Based on a hypothetical $10,000 investment.
Table Summary
Fund |
Costs of a $10,000 investment |
Costs paid as a percentage of a $10,000 investment |
GEM |
$44 |
0.37% | |
|
| Expenses Paid, Amount |
$ 44
|
|
| Expense Ratio, Percent |
0.37%
|
|
| Factors Affecting Performance [Text Block] |
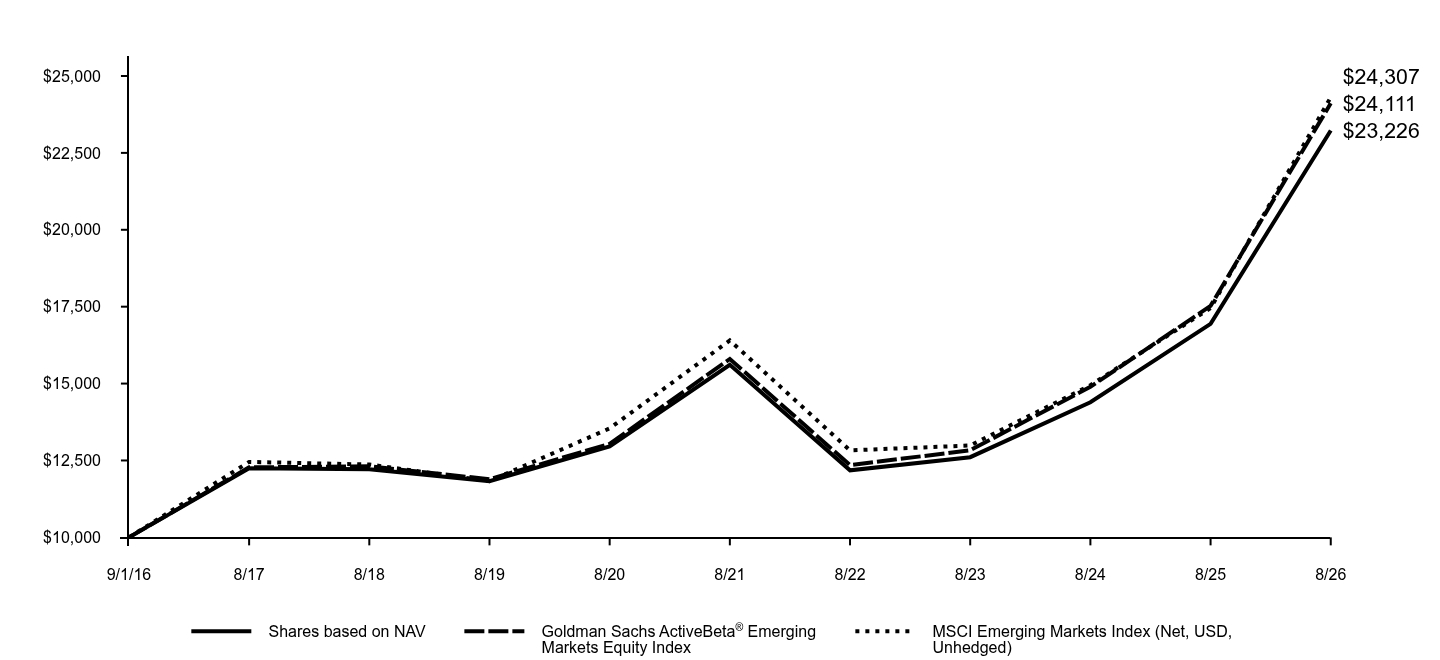
How did the Fund perform and what affected its performance?The broad emerging markets equity market experienced volatility but performed robustly, driven by reduced currency pressures, appealing valuations, generally favorable trade agreements, accelerated foreign institutional investor inflows, resilient domestic demand in several economies, targeted policy support from governments and central banks, rising commodity prices and ongoing investor enthusiasm for semiconductor and other artificial intelligence (AI)-related stocks. Still, performance across sectors and individual country markets was diverse, with some showing resilience supported by domestic demand and foreign investment inflows, while others were affected by global trade policies, including tariffs, and slowed economic activity. Geopolitical tensions, including the conflict in the Middle East, impacted the emerging markets equity markets as well, creating both opportunities and challenges. Top Contributors to Performance: Goldman Sachs ActiveBeta® Emerging Markets Equity Index (Index) constituents in the consumer discretionary, financials and communication services sectors contributed most positively to the Index’s results relative to the MSCI Emerging Markets Index (EM Index). Index constituents in India, Saudi Arabia and Indonesia contributed most positively. The Fund’s Value Underlying Factor contributed positively. Underweight positions in South Korea-based semiconductor company SK Hynix, Chinese consumer electronics and smart manufacturing company Xiaomi and Chinese producer of energy vehicles, handset components and assembly services, rechargeable batteries, and photovoltaics BYD contributed most positively (4.73%, 0.29% and 0.01% of Fund net assets as of August 31, 2026, respectively).
Top Detractors from Performance: Index constituents in the materials, information technology and industrials sectors detracted most from the Index’s results relative to the EM Index. Index constituents in Taiwan, China and South Africa detracted most. The Fund’s Quality, Low Volatility and Momentum Underlying Factors detracted. Underweight positions in SK Square, a South Korean investment holding company focused on semiconductors, information and communication technologies and digital platforms, and Unimicron Technology, a Taiwan-based printed circuit board manufacturer, and an overweight position in Pop Mart International Group, a Chinese toy company, detracted most (0.30%, 0.16% and 0.17% of Fund net assets as of August 31, 2026, respectively).
|
|
| Performance Past Does Not Indicate Future [Text] |
Performance data quoted above represents past performance. Past performance does not guarantee future results.
|
|
| Line Graph [Table Text Block] |
Table Summary
|
Shares based on NAV |
Goldman Sachs ActiveBeta® Emerging Markets Equity Index |
MSCI Emerging Markets Index (Net, USD, Unhedged) |
9/1/16 |
$10,000 |
$10,000 |
$10,000 |
8/17 |
$12,249 |
$12,276 |
$12,453 |
8/18 |
$12,215 |
$12,309 |
$12,368 |
8/19 |
$11,823 |
$11,891 |
$11,829 |
8/20 |
$12,955 |
$13,042 |
$13,543 |
8/21 |
$15,610 |
$15,800 |
$16,403 |
8/22 |
$12,180 |
$12,349 |
$12,827 |
8/23 |
$12,607 |
$12,832 |
$12,988 |
8/24 |
$14,392 |
$14,894 |
$14,945 |
8/25 |
$16,942 |
$17,526 |
$17,456 |
8/26 |
$23,226 |
$24,111 |
$24,307 |
|
|
| Performance Inception Date |
Sep. 25, 2015
|
|
| AssetsNet |
$ 1,750,004,120
|
|
| Advisory Fees Paid, Amount |
$ 5,014,293
|
|
| InvestmentCompanyPortfolioTurnover |
35.00%
|
|
| Additional Fund Statistics [Text Block] |
Table Summary
Total Net Assets as of Period End |
$1,750,004,120 |
# of Portfolio Holdings as of Period End |
740 |
Portfolio Turnover Rate for the Period |
35% |
Total Net Advisory Fees Paid for the Period |
$5,014,293 | |
|
| Holdings [Text Block] |
Table Summary
Information Technology |
40.4% |
Financials |
19.9% |
Consumer Discretionary |
7.2% |
Communication Services |
6.2% |
Materials |
5.4% |
Industrials |
4.9% |
Consumer Staples |
3.3% |
Other |
14.8% | |
|
| Material Fund Change [Text Block] |
This is a summary of certain changes to the Fund for the Period. For more complete information, you may review the Fund's next prospectus, which we expect to be available by December 29, 2026 at dfinview.com/GoldmanSachs or upon request at 1-800-621-2550. Effective December 29, 2025, the Investment Adviser agreed to waive a portion of its management fee in order to achieve an effective net management fee rate of 0.35% as an annual percentage rate of average daily net assets of the Fund and the Investment Adviser has agreed to reduce or limit “Other Expenses” from 0.05% to 0.00% of the Fund’s average daily net assets, through at least December 29, 2026, and prior to such date the Investment Adviser may not terminate the arrangement without the approval of the Board of Trustees. The Fund's net expense ratio decreased during the Period as a result of these changes. Effective December 29, 2025, investments related to Greater China was added as a principal risk of the Fund. |
|
| Summary of Change Legend [Text Block] |
This is a summary of certain changes to the Fund for the Period. For more complete information, you may review the Fund's next prospectus, which we expect to be available by December 29, 2026 at dfinview.com/GoldmanSachs or upon request at 1-800-621-2550.
|
|
| Updated Prospectus Phone Number |
1-800-621-2550
|
|
| Updated Prospectus Web Address |
<span style="box-sizing: border-box; color: rgb(0, 0, 0); display: inline; flex-wrap: nowrap; font-size: 12px; font-weight: 400; grid-area: auto; line-height: 12px; margin: 0px; overflow: visible; text-align: left; text-align-last: auto; white-space-collapse: preserve-breaks;">dfinview.com/GoldmanSachs</span>
|
|
| C000152549 |
|
|
| Shareholder Report [Line Items] |
|
|
| Fund Name |
Goldman Sachs ActiveBeta<sup style="inset: 1.5px 0px 4px; box-sizing: border-box; color: rgb(33, 120, 196); display: inline; flex-wrap: nowrap; font-size: 14px; font-weight: 700; grid-area: auto; line-height: 0px; margin: 0px; overflow: visible; position: relative; text-align: left; text-align-last: auto; white-space-collapse: preserve-breaks;">®</sup> Europe Equity ETF
|
|
| Trading Symbol |
GSEU
|
|
| Security Exchange Name |
NYSEArca
|
|
| Annual or Semi-Annual Statement [Text Block] |
This annual shareholder report contains important information about Goldman Sachs ActiveBeta® Europe Equity ETF (the “Fund”) for the period of September 1, 2025 to August 31, 2026 (the “Period”).
|
|
| Additional Information [Text Block] |
You can find additional information about the Fund at am.gs.com or dfinview.com/GoldmanSachs. You can also request this information by contacting us at 1-800-621-2550.
|
|
| Additional Information Phone Number |
1-800-621-2550
|
|
| Expenses [Text Block] |
What were the Fund costs for the Period?Based on a hypothetical $10,000 investment.
Table Summary
Fund |
Costs of a $10,000 investment |
Costs paid as a percentage of a $10,000 investment |
GSEU |
$28 |
0.25% | |
|
| Expenses Paid, Amount |
$ 28
|
|
| Expense Ratio, Percent |
0.25%
|
|
| Factors Affecting Performance [Text Block] |
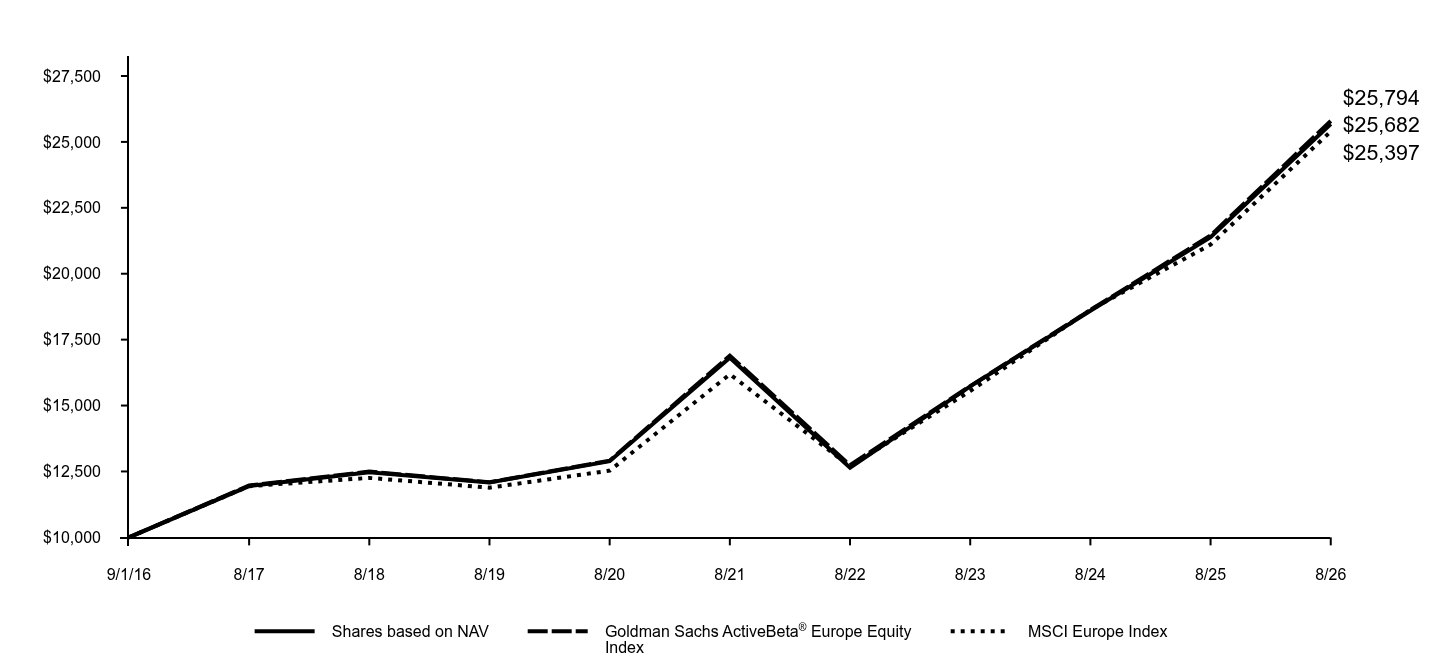
How did the Fund perform and what affected its performance?The broad European equity markets performed strongly, driven by a combination of resilient corporate earnings, a marked pick-up in foreign investment inflow, a highly concentrated rally in its hardware and semiconductor supply chain fueled by global data center expansion, a surge in bank profitability amid an end to a low-to-negative interest rate era, easing economic anxiety, large fiscal stimulus packages, a broad shift toward regional strategic autonomy, and attractive valuations compared to U.S. equities. Still, the European equity markets experienced volatility amid geopolitical tensions, global tariff concerns, energy transitions and sticky inflation. For the Period overall, the U.K. equity market outperformed the equity markets of continental Europe, though both the MSCI Europe ex UK Index and MSCI UK Index generated double-digit positive returns. Top Contributors to Performance: Goldman Sachs ActiveBeta® Europe Equity Index (Index) constituents in the consumer discretionary, health care and industrials sectors contributed most positively to the Index’s results relative to the MSCI Europe Index (Europe Index). Index constituents in France, Denmark and Italy contributed most positively. The Fund’s Value and Momentum Underlying Factors contributed positively. Overweight positions in Denmark-based integrated logistics and container shipping company AP Moller-Maersk and Germany-based life science company Bayer and an underweight position in France-based health care company EssilorLuxottica contributed most positively (0.39%, 0.69% and 0.10% of Fund net assets as of August 31, 2026, respectively).
Top Detractors from Performance: Index constituents in the information technology, utilities and materials sectors detracted most from the Index’s results relative to the Europe Index. Index constituents in the U.K., the Netherlands and Switzerland detracted most. The Fund’s Quality and Low Volatility Underlying Factors detracted. An underweight position in Netherlands-based information technology company ASML Holding and overweight positions in U.K.-based digital automotive marketplace Auto Trader Group and Germany-based software provider for the architecture, engineering, construction and operations industries as well as for the media and entertainment industries Nemetschek Group detracted most (4.21%, 0.00%1 and 0.25% of Fund net assets as of August 31, 2026, respectively).
1 Some weights are 0.00% at August 31, 2026 either because those positions were taken out during the most recent rebalance given the Fund’s index construction methodology or because they were not components of the Index during the Period. |
|
| Performance Past Does Not Indicate Future [Text] |
Performance data quoted above represents past performance. Past performance does not guarantee future results.
|
|
| Line Graph [Table Text Block] |
Table Summary
|
Shares based on NAV |
Goldman Sachs ActiveBeta® Europe Equity Index |
MSCI Europe Index |
9/1/16 |
$10,000 |
$10,000 |
$10,000 |
8/17 |
$11,946 |
$11,970 |
$11,943 |
8/18 |
$12,472 |
$12,495 |
$12,256 |
8/19 |
$12,079 |
$12,091 |
$11,885 |
8/20 |
$12,889 |
$12,908 |
$12,530 |
8/21 |
$16,814 |
$16,893 |
$16,186 |
8/22 |
$12,642 |
$12,735 |
$12,695 |
8/23 |
$15,727 |
$15,737 |
$15,552 |
8/24 |
$18,594 |
$18,622 |
$18,630 |
8/25 |
$21,383 |
$21,450 |
$21,104 |
8/26 |
$25,682 |
$25,794 |
$25,397 |
|
|
| Performance Inception Date |
Mar. 02, 2016
|
|
| AssetsNet |
$ 177,428,498
|
|
| Advisory Fees Paid, Amount |
$ 268,792
|
|
| InvestmentCompanyPortfolioTurnover |
28.00%
|
|
| Additional Fund Statistics [Text Block] |
Table Summary
Total Net Assets as of Period End |
$177,428,498 |
# of Portfolio Holdings as of Period End |
339 |
Portfolio Turnover Rate for the Period |
28% |
Total Net Advisory Fees Paid for the Period |
$268,792 | |
|
| Holdings [Text Block] |
Table Summary
Financials |
27.9% |
Industrials |
18.3% |
Health Care |
12.9% |
Information Technology |
8.9% |
Consumer Staples |
8.0% |
Consumer Discretionary |
6.6% |
Materials |
4.7% |
Energy |
4.5% |
Utilities |
4.5% |
Other |
3.8% | |
|
| Material Fund Change [Text Block] |
|
|
| Updated Prospectus Phone Number |
1-800-621-2550
|
|
| Updated Prospectus Web Address |
<span style="box-sizing: border-box; color: rgb(0, 0, 0); display: inline; flex-wrap: nowrap; font-size: 12px; font-weight: 400; grid-area: auto; line-height: 12px; margin: 0px; overflow: visible; text-align: left; text-align-last: auto; white-space-collapse: preserve-breaks;">dfinview.com/GoldmanSachs</span>
|
|
| C000152545 |
|
|
| Shareholder Report [Line Items] |
|
|
| Fund Name |
Goldman Sachs ActiveBeta<sup style="inset: 1.5px 0px 4px; box-sizing: border-box; color: rgb(33, 120, 196); display: inline; flex-wrap: nowrap; font-size: 14px; font-weight: 700; grid-area: auto; line-height: 0px; margin: 0px; overflow: visible; position: relative; text-align: left; text-align-last: auto; white-space-collapse: preserve-breaks;">®</sup> International Equity ETF
|
|
| Trading Symbol |
GSIE
|
|
| Security Exchange Name |
NYSEArca
|
|
| Annual or Semi-Annual Statement [Text Block] |
This annual shareholder report contains important information about Goldman Sachs ActiveBeta® International Equity ETF (the “Fund”) for the period of September 1, 2025 to August 31, 2026 (the “Period”).
|
|
| Additional Information [Text Block] |
You can find additional information about the Fund at am.gs.com or dfinview.com/GoldmanSachs. You can also request this information by contacting us at 1-800-621-2550.
|
|
| Additional Information Phone Number |
1-800-621-2550
|
|
| Expenses [Text Block] |
What were the Fund costs for the Period?Based on a hypothetical $10,000 investment.
Table Summary
Fund |
Costs of a $10,000 investment |
Costs paid as a percentage of a $10,000 investment |
GSIE |
$28 |
0.25% | |
|
| Expenses Paid, Amount |
$ 28
|
|
| Expense Ratio, Percent |
0.25%
|
|
| Factors Affecting Performance [Text Block] |
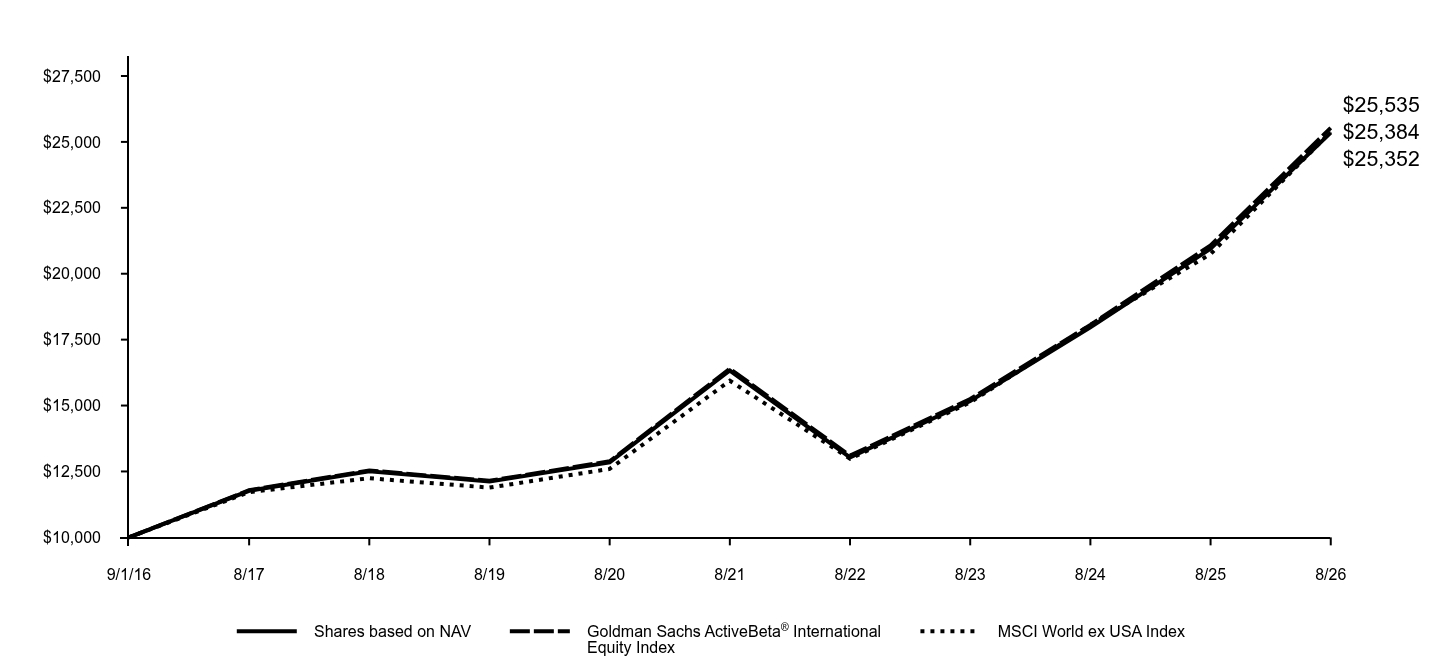
How did the Fund perform and what affected its performance?The broad international equity market posted double-digit positive returns for the Period but experienced varied performance, influenced by diverse economic conditions, central bank policies and political and geopolitical developments. Still, strong performance overall was supported by a broad-based economic recovery in developed markets, a softening U.S. dollar that provided a material tailwind to U.S. dollar-denominated returns, an artificial intelligence investment theme that moved beyond pure-play technology into the wider industrial value chain, and resilient corporate earnings. Top Contributors to Performance: Goldman Sachs ActiveBeta® International Equity Index (Index) constituents in the consumer discretionary, industrials, health care and communication services sectors contributed most positively to the Index’s results relative to the MSCI World ex USA Index (World ex USA Index). Index constituents in France, Singapore and Italy contributed most positively. The Fund’s Value and Momentum Underlying Factors contributed positively. An overweight position in Japan-based manufacturer of semiconductor and component test system products and mechatronics-related products Advantest and underweight positions in Japan-based video game and gaming systems creator Nintendo and France-based health care company EssilorLuxottica contributed most positively (0.91%, 0.00%1 and 0.02% of Fund net assets as of August 31, 2026, respectively).
Top Detractors from Performance: Index constituents in the information technology, materials and utilities sectors detracted most from the Index’s results relative to the World ex USA Index. Index constituents in Canada, the Netherlands and Japan detracted most. The Fund’s Quality and Low Volatility Underlying Factors detracted. Underweight positions in Netherlands-based information technology company ASML Holding and Australia-based materials company BHP Group and an overweight position in Israel-based cloud-based web development and software-as-a-service platform Wix.com detracted most (2.19%, 0.56% and 0.00%1 of Fund net assets as of August 31, 2026, respectively).
1 Some weights are 0.00% at August 31, 2026 either because those positions were taken out during the most recent rebalance given the Fund’s index construction methodology or because they were not components of the Index during the Period. |
|
| Performance Past Does Not Indicate Future [Text] |
Performance data quoted above represents past performance. Past performance does not guarantee future results.
|
|
| Line Graph [Table Text Block] |
Table Summary
|
Shares based on NAV |
Goldman Sachs ActiveBeta® International Equity Index |
MSCI World ex USA Index |
9/1/16 |
$10,000 |
$10,000 |
$10,000 |
8/17 |
$11,766 |
$11,787 |
$11,714 |
8/18 |
$12,507 |
$12,537 |
$12,242 |
8/19 |
$12,121 |
$12,144 |
$11,887 |
8/20 |
$12,844 |
$12,884 |
$12,596 |
8/21 |
$16,328 |
$16,396 |
$15,942 |
8/22 |
$13,033 |
$13,099 |
$12,984 |
8/23 |
$15,170 |
$15,246 |
$15,119 |
8/24 |
$17,968 |
$18,061 |
$18,060 |
8/25 |
$20,952 |
$21,072 |
$20,747 |
8/26 |
$25,352 |
$25,535 |
$25,384 |
|
|
| Performance Inception Date |
Nov. 06, 2015
|
|
| AssetsNet |
$ 6,115,840,079
|
|
| Advisory Fees Paid, Amount |
$ 13,086,241
|
|
| InvestmentCompanyPortfolioTurnover |
30.00%
|
|
| Additional Fund Statistics [Text Block] |
Table Summary
Total Net Assets as of Period End |
$6,115,840,079 |
# of Portfolio Holdings as of Period End |
633 |
Portfolio Turnover Rate for the Period |
30% |
Total Net Advisory Fees Paid for the Period |
$13,086,241 | |
|
| Holdings [Text Block] |
Table Summary
Financials |
29.6% |
Industrials |
17.4% |
Information Technology |
9.9% |
Health Care |
8.9% |
Consumer Discretionary |
8.3% |
Consumer Staples |
7.4% |
Materials |
5.9% |
Energy |
4.6% |
Utilities |
3.6% |
Other |
4.2% | |
|
| Material Fund Change [Text Block] |
|
|
| Updated Prospectus Phone Number |
1-800-621-2550
|
|
| Updated Prospectus Web Address |
<span style="box-sizing: border-box; color: rgb(0, 0, 0); display: inline; flex-wrap: nowrap; font-size: 12px; font-weight: 400; grid-area: auto; line-height: 12px; margin: 0px; overflow: visible; text-align: left; text-align-last: auto; white-space-collapse: preserve-breaks;">dfinview.com/GoldmanSachs</span>
|
|
| C000152550 |
|
|
| Shareholder Report [Line Items] |
|
|
| Fund Name |
Goldman Sachs ActiveBeta<sup style="inset: 1.5px 0px 4px; box-sizing: border-box; color: rgb(33, 120, 196); display: inline; flex-wrap: nowrap; font-size: 14px; font-weight: 700; grid-area: auto; line-height: 0px; margin: 0px; overflow: visible; position: relative; text-align: left; text-align-last: auto; white-space-collapse: preserve-breaks;">®</sup> Japan Equity ETF
|
|
| Trading Symbol |
GSJY
|
|
| Security Exchange Name |
NYSEArca
|
|
| Annual or Semi-Annual Statement [Text Block] |
This annual shareholder report contains important information about Goldman Sachs ActiveBeta® Japan Equity ETF (the “Fund”) for the period of September 1, 2025 to August 31, 2026 (the “Period”).
|
|
| Additional Information [Text Block] |
You can find additional information about the Fund at am.gs.com or dfinview.com/GoldmanSachs. You can also request this information by contacting us at 1-800-621-2550.
|
|
| Additional Information Phone Number |
1-800-621-2550
|
|
| Expenses [Text Block] |
What were the Fund costs for the Period?Based on a hypothetical $10,000 investment.
Table Summary
Fund |
Costs of a $10,000 investment |
Costs paid as a percentage of a $10,000 investment |
GSJY |
$28 |
0.25% | |
|
| Expenses Paid, Amount |
$ 28
|
|
| Expense Ratio, Percent |
0.25%
|
|
| Factors Affecting Performance [Text Block] |
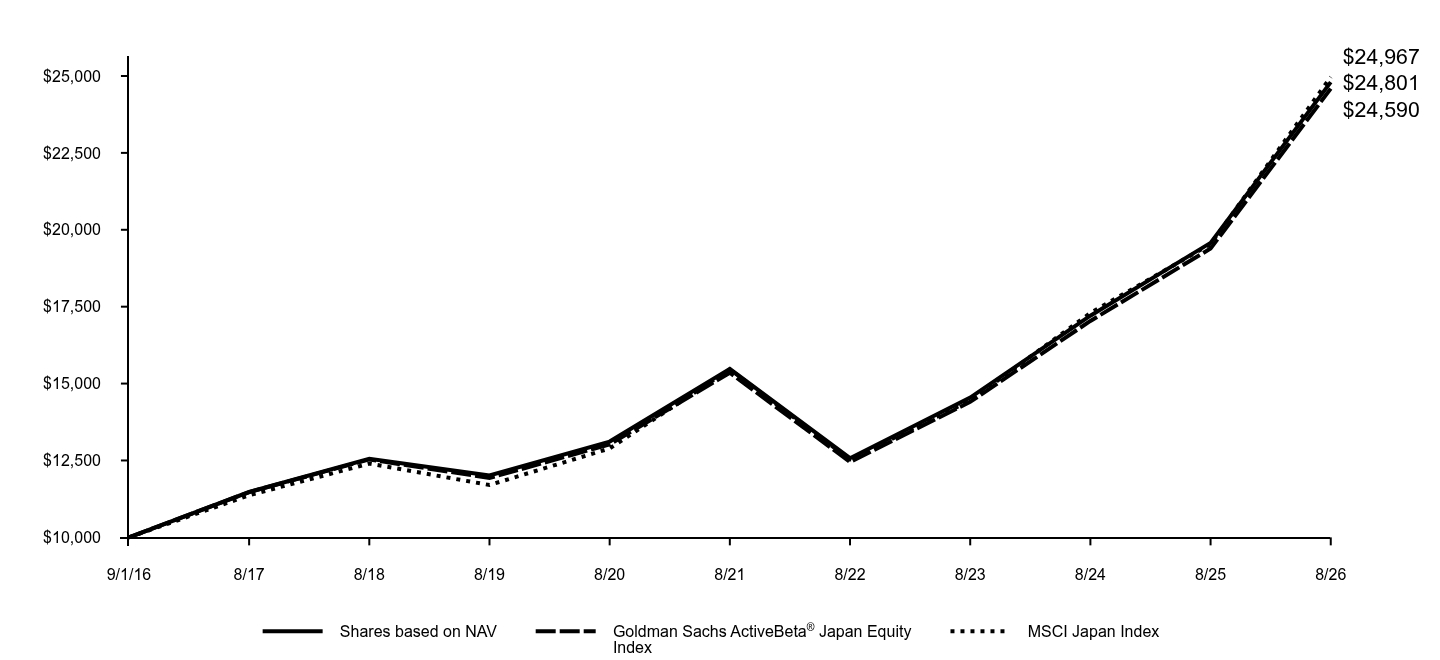
How did the Fund perform and what affected its performance?Even as volatility remained elevated amid geopolitical and macroeconomic uncertainty, the Japanese equity market posted strong double-digit positive returns for the Period, driven by improved political stability, proactive fiscal stimulus, aggressive corporate governance reforms, an exit from the Bank of Japan’s loose monetary policy era, a historic shift out of deflation into sustainable inflation, and robust corporate earnings supported by global demand for technology and semiconductors. Further, ongoing structural interest from international investors, coupled with active domestic allocation into equities, provided a foundation for the market despite currency fluctuations and global interest rate jitters. Top Contributors to Performance: Goldman Sachs ActiveBeta® Japan Equity Index (Index) constituents in the communication services, health care and energy sectors contributed most positively to the Index’s results relative to the MSCI Japan Index (Japan Index). The Fund’s Value Underlying Factor contributed positively. An underweight position in Nintendo, a video game and gaming systems creator, and overweight positions in Sumitomo Electric Industries, a wire, cable and materials manufacturer, and Advantest, a manufacturer of semiconductor and component test system products and mechatronics-related products, contributed most positively (0.43%, 1.04% and 3.56% of Fund net assets as of August 31, 2026, respectively).
Top Detractors from Performance: Index constituents in the information technology, financials and industrials sectors detracted most from the Index’s results relative to the Japan Index. The Fund’s Momentum, Quality and Low Volatility Underlying Factors detracted. An underweight position in Kioxia Holdings, a semiconductor manufacturer, and overweight positions in Aisin, an automotive components supplier, and Subaru, an auto and aerospace products manufacturer, detracted most (1.33%, 0.65% and 0.27% of Fund net assets as of August 31, 2026, respectively).
|
|
| Performance Past Does Not Indicate Future [Text] |
Performance data quoted above represents past performance. Past performance does not guarantee future results.
|
|
| Line Graph [Table Text Block] |
Table Summary
|
Shares based on NAV |
Goldman Sachs ActiveBeta® Japan Equity Index |
MSCI Japan Index |
9/1/16 |
$10,000 |
$10,000 |
$10,000 |
8/17 |
$11,474 |
$11,473 |
$11,369 |
8/18 |
$12,555 |
$12,534 |
$12,398 |
8/19 |
$12,012 |
$11,931 |
$11,702 |
8/20 |
$13,114 |
$13,024 |
$12,891 |
8/21 |
$15,477 |
$15,353 |
$15,464 |
8/22 |
$12,574 |
$12,451 |
$12,532 |
8/23 |
$14,546 |
$14,406 |
$14,450 |
8/24 |
$17,207 |
$17,037 |
$17,295 |
8/25 |
$19,575 |
$19,391 |
$19,533 |
8/26 |
$24,801 |
$24,590 |
$24,967 |
|
|
| Performance Inception Date |
Mar. 02, 2016
|
|
| AssetsNet |
$ 98,999,794
|
|
| Advisory Fees Paid, Amount |
$ 165,827
|
|
| InvestmentCompanyPortfolioTurnover |
23.00%
|
|
| Additional Fund Statistics [Text Block] |
Table Summary
Total Net Assets as of Period End |
$98,999,794 |
# of Portfolio Holdings as of Period End |
159 |
Portfolio Turnover Rate for the Period |
23% |
Total Net Advisory Fees Paid for the Period |
$165,827 | |
|
| Holdings [Text Block] |
Table Summary
Industrials |
23.6% |
Financials |
20.9% |
Information Technology |
18.0% |
Consumer Discretionary |
14.8% |
Health Care |
4.6% |
Communication Services |
4.6% |
Consumer Staples |
4.1% |
Materials |
3.8% |
Energy |
3.1% |
Other |
2.4% | |
|
| Material Fund Change [Text Block] |
|
|
| Updated Prospectus Phone Number |
1-800-621-2550
|
|
| Updated Prospectus Web Address |
<span style="box-sizing: border-box; color: rgb(0, 0, 0); display: inline; flex-wrap: nowrap; font-size: 12px; font-weight: 400; grid-area: auto; line-height: 12px; margin: 0px; overflow: visible; text-align: left; text-align-last: auto; white-space-collapse: preserve-breaks;">dfinview.com/GoldmanSachs</span>
|
|
| C000152551 |
|
|
| Shareholder Report [Line Items] |
|
|
| Fund Name |
Goldman Sachs ActiveBeta<sup style="inset: 1.5px 0px 4px; box-sizing: border-box; color: rgb(33, 120, 196); display: inline; flex-wrap: nowrap; font-size: 14px; font-weight: 700; grid-area: auto; line-height: 0px; margin: 0px; overflow: visible; position: relative; text-align: left; text-align-last: auto; white-space-collapse: preserve-breaks;">®</sup> U.S. Large Cap Equity ETF
|
|
| Trading Symbol |
GSLC
|
|
| Security Exchange Name |
NYSEArca
|
|
| Annual or Semi-Annual Statement [Text Block] |
This annual shareholder report contains important information about Goldman Sachs ActiveBeta® U.S. Large Cap Equity ETF (the “Fund”) for the period of September 1, 2025 to August 31, 2026 (the “Period”).
|
|
| Additional Information [Text Block] |
You can find additional information about the Fund at am.gs.com or dfinview.com/GoldmanSachs. You can also request this information by contacting us at 1-800-621-2550.
|
|
| Additional Information Phone Number |
1-800-621-2550
|
|
| Expenses [Text Block] |
What were the Fund costs for the Period?Based on a hypothetical $10,000 investment.
Table Summary
Fund |
Costs of a $10,000 investment |
Costs paid as a percentage of a $10,000 investment |
GSLC |
$10 |
0.09% | |
|
| Expenses Paid, Amount |
$ 10
|
|
| Expense Ratio, Percent |
0.09%
|
|
| Factors Affecting Performance [Text Block] |
How did the Fund perform and what affected its performance?The broad U.S. equity market delivered strong gains overall, driven by resilient corporate earnings, solid labor data and expanding artificial intelligence (AI) infrastructure. Monetary policy also played a crucial role, with the Federal Reserve implementing interest rate cuts in the last months of 2025 and then holding steady, as it weighed inflation that remained above target. Still, U.S. equities faced periodic volatility around AI monetization, returns on investment and debt issuance. Concurrently, geopolitical tensions, including maritime shipping disruptions and trade tariffs, drove commodity and energy market volatility. Corporate fundamentals cushioned pullbacks, with profit margins and earnings rather consistently beating consensus expectations across the information technology, industrials and health care sectors. Top Contributors to Performance: Goldman Sachs ActiveBeta® U.S. Large Cap Equity Index (Index) constituents in the financials and real estate sectors were the only two sectors that contributed positively to the Index’s results relative to the S&P 500 Index during the Period. The Fund’s Value Underlying Factor contributed positively. Overweight positions in data storage company Western Digital and media and entertainment company Warner Bros. Discovery and a neutral position in semiconductor company Marvell Technology contributed most positively (0.41%, 0.31% and 0.13% of Fund net assets as of August 31, 2026, respectively).
Top Detractors from Performance: Index constituents in the information technology, communication services and industrials sectors detracted most from the Index’s results relative to the S&P 500 Index. The Fund’s Quality, Low Volatility and Momentum Underlying Factors detracted. Underweight positions in semiconductor company Micron Technology, Google parent company Alphabet and semiconductor company Advanced Micro Devices detracted most (1.24%, 2.88% and 0.69% of Fund net assets as of August 31, 2026, respectively).
|
|
| Performance Past Does Not Indicate Future [Text] |
Performance data quoted above represents past performance. Past performance does not guarantee future results.
|
|
| Line Graph [Table Text Block] |
Table Summary
|
Shares based on NAV |
Goldman Sachs ActiveBeta® U.S. Large Cap Equity Index |
S&P 500® Index |
9/1/16 |
$10,000 |
$10,000 |
$10,000 |
8/17 |
$11,415 |
$11,430 |
$11,623 |
8/18 |
$13,886 |
$13,921 |
$13,908 |
8/19 |
$14,222 |
$14,270 |
$14,314 |
8/20 |
$17,333 |
$17,412 |
$17,455 |
8/21 |
$22,569 |
$22,693 |
$22,895 |
8/22 |
$19,703 |
$19,825 |
$20,324 |
8/23 |
$22,625 |
$22,787 |
$23,564 |
8/24 |
$28,729 |
$28,962 |
$29,959 |
8/25 |
$33,185 |
$33,492 |
$34,717 |
8/26 |
$38,700 |
$39,091 |
$41,792 |
|
|
| Performance Inception Date |
Sep. 17, 2015
|
|
| AssetsNet |
$ 15,182,528,214
|
|
| Advisory Fees Paid, Amount |
$ 13,238,962
|
|
| InvestmentCompanyPortfolioTurnover |
17.00%
|
|
| Additional Fund Statistics [Text Block] |
Table Summary
Total Net Assets as of Period End |
$15,182,528,214 |
# of Portfolio Holdings as of Period End |
427 |
Portfolio Turnover Rate for the Period |
17% |
Total Net Advisory Fees Paid for the Period |
$13,238,962 | |
|
| Holdings [Text Block] |
Table Summary
Information Technology |
38.0% |
Financials |
11.4% |
Health Care |
9.8% |
Communication Services |
9.6% |
Consumer Discretionary |
9.3% |
Industrials |
8.0% |
Consumer Staples |
5.5% |
Energy |
3.3% |
Utilities |
1.8% |
Other |
3.3% | |
|
| Material Fund Change [Text Block] |
|
|
| Updated Prospectus Phone Number |
1-800-621-2550
|
|
| Updated Prospectus Web Address |
<span style="box-sizing: border-box; color: rgb(0, 0, 0); display: inline; flex-wrap: nowrap; font-size: 12px; font-weight: 400; grid-area: auto; line-height: 12px; margin: 0px; overflow: visible; text-align: left; text-align-last: auto; white-space-collapse: preserve-breaks;">dfinview.com/GoldmanSachs</span>
|
|
| C000152552 |
|
|
| Shareholder Report [Line Items] |
|
|
| Fund Name |
Goldman Sachs ActiveBeta<sup style="inset: 1.5px 0px 4px; box-sizing: border-box; color: rgb(33, 120, 196); display: inline; flex-wrap: nowrap; font-size: 14px; font-weight: 700; grid-area: auto; line-height: 0px; margin: 0px; overflow: visible; position: relative; text-align: left; text-align-last: auto; white-space-collapse: preserve-breaks;">®</sup> U.S. Small Cap Equity ETF
|
|
| Trading Symbol |
GSSC
|
|
| Security Exchange Name |
NYSEArca
|
|
| Annual or Semi-Annual Statement [Text Block] |
This annual shareholder report contains important information about Goldman Sachs ActiveBeta® U.S. Small Cap Equity ETF (the “Fund”) for the period of September 1, 2025 to August 31, 2026 (the “Period”).
|
|
| Additional Information [Text Block] |
You can find additional information about the Fund at am.gs.com or dfinview.com/GoldmanSachs. You can also request this information by contacting us at 1-800-621-2550.
|
|
| Additional Information Phone Number |
1-800-621-2550
|
|
| Expenses [Text Block] |
What were the Fund costs for the Period?Based on a hypothetical $10,000 investment.
Table Summary
Fund |
Costs of a $10,000 investment |
Costs paid as a percentage of a $10,000 investment |
GSSC |
$22 |
0.20% | |
|
| Expenses Paid, Amount |
$ 22
|
|
| Expense Ratio, Percent |
0.20%
|
|
| Factors Affecting Performance [Text Block] |
How did the Fund perform and what affected its performance?The broad U.S. equity market delivered strong gains overall, driven by resilient corporate earnings, solid labor data and expanding artificial intelligence (AI) infrastructure. Monetary policy also played a crucial role, with the Federal Reserve implementing interest rate cuts in the last months of 2025 and then holding steady, as it weighed inflation that remained above target. Still, U.S. equities faced periodic volatility around AI monetization, returns on investment and debt issuance. Concurrently, geopolitical tensions, including maritime shipping disruptions and trade tariffs, drove commodity and energy market volatility. Corporate fundamentals cushioned pullbacks, with profit margins and earnings rather consistently beating consensus expectations across the information technology, industrials and health care sectors. Small-cap equities outperformed their larger counterparts during the Period as a whole, but the third quarter of 2025 was especially challenging, as the market then favored lower quality, unprofitable and highly volatile stocks, creating headwinds for our quality-focused, lower volatility strategy. Top Contributors to Performance: Goldman Sachs ActiveBeta® U.S. Small Cap Equity Index (Index) constituents in the financials, industrials and real estate sectors contributed most positively to the Index’s results relative to the Russell 2000® Index (Russell Index). The Fund’s Value Underlying Factor contributed positively. Overweight positions in precision medicine diagnostics company CareDx, biotechnology company 10X Genomics and designer and installer of integrated electrical and technology systems IES Holdings contributed most positively (0.41%, 0.50% and 0.00%1 of Fund net assets as of August 31, 2026, respectively).
Top Detractors from Performance: Index constituents in the health care, information technology and communication services sectors detracted most from the Index’s results relative to the Russell Index. The Fund’s Quality, Low Volatility and Momentum Underlying Factors detracted. Underweight positions in solid-oxide fuel cell systems manufacturer Bloom Energy, provider of test and measurement technologies for the semiconductor industry FormFactor and commercial-stage biopharmaceutical company Arrowhead Pharmaceuticals detracted most (0.00%1, 0.00%1 and 0.00%1 of Fund net assets as of August 31, 2026, respectively).
1 Some weights are 0.00% at August 31, 2026 either because those positions were taken out during the most recent rebalance given the Fund’s index construction methodology or because they were not components of the Index during the Period. |
|
| Performance Past Does Not Indicate Future [Text] |
Performance data quoted above represents past performance. Past performance does not guarantee future results.
|
|
| Line Graph [Table Text Block] |
Table Summary
|
Shares based on NAV |
Goldman Sachs ActiveBeta® U.S. Small Cap Equity Index |
Russell 2000® Index |
Russell 3000® Index |
6/28/17 |
$10,000 |
$10,000 |
$10,000 |
$10,000 |
8/17 |
$9,824 |
$9,832 |
$9,878 |
$10,138 |
8/18 |
$12,406 |
$12,450 |
$12,392 |
$12,191 |
8/19 |
$10,882 |
$10,910 |
$10,794 |
$12,351 |
8/20 |
$11,224 |
$11,260 |
$11,444 |
$14,999 |
8/21 |
$16,887 |
$16,995 |
$16,832 |
$19,954 |
8/22 |
$14,700 |
$14,825 |
$13,822 |
$17,304 |
8/23 |
$15,721 |
$15,898 |
$14,465 |
$19,858 |
8/24 |
$18,708 |
$18,951 |
$17,136 |
$25,049 |
8/25 |
$20,381 |
$20,706 |
$18,536 |
$29,017 |
8/26 |
$24,899 |
$25,360 |
$23,440 |
$34,850 |
|
|
| Performance Inception Date |
Jun. 28, 2017
|
|
| AssetsNet |
$ 1,080,538,003
|
|
| Advisory Fees Paid, Amount |
$ 1,680,275
|
|
| InvestmentCompanyPortfolioTurnover |
36.00%
|
|
| Additional Fund Statistics [Text Block] |
Table Summary
Total Net Assets as of Period End |
$1,080,538,003 |
# of Portfolio Holdings as of Period End |
1,414 |
Portfolio Turnover Rate for the Period |
36% |
Total Net Advisory Fees Paid for the Period |
$1,680,275 | |
|
| Holdings [Text Block] |
Table Summary
Health Care |
21.3% |
Financials |
18.1% |
Industrials |
13.3% |
Information Technology |
13.1% |
Consumer Discretionary |
10.0% |
Energy |
6.5% |
Real Estate |
4.5% |
Materials |
3.4% |
Consumer Staples |
3.1% |
Other |
6.5% | |
|
| Material Fund Change [Text Block] |
|
|
| Updated Prospectus Phone Number |
1-800-621-2550
|
|
| Updated Prospectus Web Address |
<span style="box-sizing: border-box; color: rgb(0, 0, 0); display: inline; flex-wrap: nowrap; font-size: 12px; font-weight: 400; grid-area: auto; line-height: 12px; margin: 0px; overflow: visible; text-align: left; text-align-last: auto; white-space-collapse: preserve-breaks;">dfinview.com/GoldmanSachs</span>
|
|
| C000190083 |
|
|
| Shareholder Report [Line Items] |
|
|
| Fund Name |
Goldman Sachs Equal Weight U.S. Large Cap Equity ETF
|
|
| Trading Symbol |
GSEW
|
|
| Security Exchange Name |
CboeBZX
|
|
| Annual or Semi-Annual Statement [Text Block] |
This annual shareholder report contains important information about Goldman Sachs Equal Weight U.S. Large Cap Equity ETF (the “Fund”) for the period of September 1, 2025 to August 31, 2026 (the “Period”).
|
|
| Additional Information [Text Block] |
You can find additional information about the Fund at am.gs.com or dfinview.com/GoldmanSachs. You can also request this information by contacting us at 1-800-621-2550.
|
|
| Additional Information Phone Number |
1-800-621-2550
|
|
| Expenses [Text Block] |
What were the Fund costs for the Period?Based on a hypothetical $10,000 investment.
Table Summary
Fund |
Costs of a $10,000 investment |
Costs paid as a percentage of a $10,000 investment |
GSEW |
$10 |
0.09% | |
|
| Expenses Paid, Amount |
$ 10
|
|
| Expense Ratio, Percent |
0.09%
|
|
| Factors Affecting Performance [Text Block] |
How did the Fund perform and what affected its performance?The broad U.S. equity market delivered strong gains overall, driven by resilient corporate earnings, solid labor data and expanding artificial intelligence (AI) infrastructure. Monetary policy also played a crucial role, with the Federal Reserve implementing interest rate cuts in the last months of 2025 and then holding steady, as it weighed inflation that remained above target. Still, U.S. equities faced periodic volatility around AI monetization, returns on investment and debt issuance. Concurrently, geopolitical tensions, including maritime shipping disruptions and trade tariffs, drove commodity and energy market volatility. Corporate fundamentals cushioned pullbacks, with profit margins and earnings rather consistently beating consensus expectations across the information technology, industrials and health care sectors. Top Contributors to Performance: Relative to the S&P 500® Index, the energy, industrials and materials sectors contributed most positively to the Solactive U.S. Large Cap Equal Weight Index’s (GTR) (Index) results. Relative to the S&P 500® Index, positions in social media platforms giant Meta Platforms, semiconductor company Marvell Technology and biotechnology and pharmaceuticals company Moderna contributed most positively to the Index’s results during the Period (0.20%, 0.20% and 0.50% of Fund net assets as of August 31, 2026, respectively).
Top Detractors from Performance: Relative to the S&P 500® Index, the information technology, communication services and consumer discretionary sectors detracted most from the Index’s results. Relative to the S&P 500® Index, positions in communication services company Alphabet, information technology products giant Apple and semiconductor company NVIDIA detracted most from the Index’s results during the Period (0.19%, 0.21% and 0.20% of Fund net assets as of August 31, 2026, respectively).
|
|
| Performance Past Does Not Indicate Future [Text] |
Performance data quoted above represents past performance. Past performance does not guarantee future results.
|
|
| Line Graph [Table Text Block] |
Table Summary
|
Shares based on NAV |
Solactive U.S. Large Cap Equal Weight Index (GTR) |
S&P 500® Index |
9/12/17 |
$10,000 |
$10,000 |
$10,000 |
8/18 |
$11,560 |
$11,577 |
$11,842 |
8/19 |
$11,747 |
$11,783 |
$12,188 |
8/20 |
$13,170 |
$13,239 |
$14,862 |
8/21 |
$18,380 |
$18,499 |
$19,494 |
8/22 |
$15,718 |
$15,841 |
$17,305 |
8/23 |
$17,067 |
$17,227 |
$20,063 |
8/24 |
$20,981 |
$21,195 |
$25,509 |
8/25 |
$23,607 |
$23,852 |
$29,559 |
8/26 |
$27,658 |
$27,969 |
$35,584 |
|
|
| Performance Inception Date |
Sep. 12, 2017
|
|
| AssetsNet |
$ 2,076,209,009
|
|
| Advisory Fees Paid, Amount |
$ 1,424,736
|
|
| InvestmentCompanyPortfolioTurnover |
55.00%
|
|
| Additional Fund Statistics [Text Block] |
Table Summary
Total Net Assets as of Period End |
$2,076,209,009 |
# of Portfolio Holdings as of Period End |
499 |
Portfolio Turnover Rate for the Period |
55% |
Total Net Advisory Fees Paid for the Period |
$1,424,736 | |
|
| Holdings [Text Block] |
Table Summary
Information Technology |
17.5% |
Industrials |
16.3% |
Financials |
15.1% |
Health Care |
12.4% |
Consumer Discretionary |
8.3% |
Consumer Staples |
5.8% |
Utilities |
5.6% |
Energy |
5.1% |
Materials |
5.0% |
Other |
8.8% | |
|
| Material Fund Change [Text Block] |
|
|
| Updated Prospectus Phone Number |
1-800-621-2550
|
|
| Updated Prospectus Web Address |
<span style="box-sizing: border-box; color: rgb(0, 0, 0); display: inline; flex-wrap: nowrap; font-size: 12px; font-weight: 400; grid-area: auto; line-height: 12px; margin: 0px; overflow: visible; text-align: left; text-align-last: auto; white-space-collapse: preserve-breaks;">dfinview.com/GoldmanSachs</span>
|
|
| C000168500 |
|
|
| Shareholder Report [Line Items] |
|
|
| Fund Name |
Goldman Sachs Hedge Industry VIP ETF
|
|
| Trading Symbol |
GVIP
|
|
| Security Exchange Name |
NYSEArca
|
|
| Annual or Semi-Annual Statement [Text Block] |
This annual shareholder report contains important information about Goldman Sachs Hedge Industry VIP ETF (the “Fund”) for the period of September 1, 2025 to August 31, 2026 (the “Period”).
|
|
| Additional Information [Text Block] |
You can find additional information about the Fund at am.gs.com or dfinview.com/GoldmanSachs. You can also request this information by contacting us at 1-800-621-2550.
|
|
| Additional Information Phone Number |
1-800-621-2550
|
|
| Expenses [Text Block] |
What were the Fund costs for the Period?Based on a hypothetical $10,000 investment.
Table Summary
Fund |
Costs of a $10,000 investment |
Costs paid as a percentage of a $10,000 investment |
GVIP |
$49 |
0.45% | |
|
| Expenses Paid, Amount |
$ 49
|
|
| Expense Ratio, Percent |
0.45%
|
|
| Factors Affecting Performance [Text Block] |
How did the Fund perform and what affected its performance?The broad U.S. equity market delivered strong gains overall, driven by resilient corporate earnings, solid labor data and expanding artificial intelligence (AI) infrastructure. Monetary policy also played a crucial role, with the Federal Reserve implementing interest rate cuts in the last months of 2025 and then holding steady, as it weighed inflation that remained above target. Still, U.S. equities faced periodic volatility around AI monetization, returns on investment and debt issuance. Concurrently, geopolitical tensions, including maritime shipping disruptions and trade tariffs, drove commodity and energy market volatility. Corporate fundamentals cushioned pullbacks, with profit margins and earnings rather consistently beating consensus expectations across the information technology, industrials and health care sectors. Top Contributors to Performance: Relative to the S&P 500® Index, the information technology and health care sectors were the only two sectors to contribute positively to the Goldman Sachs Hedge Fund VIP IndexTM TR (Index) results during the Period. Relative to the S&P 500® Index, positions in information technology companies Sandisk, Western Digital and Micron Technology contributed most positively to the Index’s results during the Period (2.00%, 0.00%1 and 2.06% of Fund net assets as of August 31, 2026, respectively).
Top Detractors from Performance: Relative to the S&P 500® Index, the consumer discretionary, industrials and financials sectors detracted most from the Index’s results. Relative to the S&P 500® Index, positions in information technology products giant Apple and semiconductor companies NVIDIA and Intel contributed least to the Index’s results during the Period (2.16%, 2.05% and 1.83% of Fund net assets as of August 31, 2026, respectively).
1Some weights are 0.00% at August 31, 2026 either because those positions were eliminated during the most recent rebalance given the Index construction methodology or were not held at all during the Period as they did not meet the Fund’s investment criteria. |
|
| Performance Past Does Not Indicate Future [Text] |
Performance data quoted above represents past performance. Past performance does not guarantee future results.
|
|
| Line Graph [Table Text Block] |
Table Summary
|
Shares based on NAV |
Goldman Sachs Hedge Fund VIP Index™ TR |
S&P 500® Index |
11/1/16 |
$10,000 |
$10,000 |
$10,000 |
8/17 |
$12,661 |
$12,714 |
$11,918 |
8/18 |
$14,594 |
$14,725 |
$14,261 |
8/19 |
$14,450 |
$14,597 |
$14,678 |
8/20 |
$20,259 |
$20,639 |
$17,898 |
8/21 |
$26,336 |
$26,961 |
$23,476 |
8/22 |
$19,239 |
$19,781 |
$20,840 |
8/23 |
$22,682 |
$23,425 |
$24,162 |
8/24 |
$29,893 |
$30,869 |
$30,720 |
8/25 |
$37,008 |
$38,358 |
$35,598 |
8/26 |
$44,132 |
$45,988 |
$42,853 |
|
|
| Performance Inception Date |
Nov. 01, 2016
|
|
| AssetsNet |
$ 566,907,311
|
|
| Advisory Fees Paid, Amount |
$ 2,138,320
|
|
| InvestmentCompanyPortfolioTurnover |
140.00%
|
|
| Additional Fund Statistics [Text Block] |
Table Summary
Total Net Assets as of Period End |
$566,907,311 |
# of Portfolio Holdings as of Period End |
51 |
Portfolio Turnover Rate for the Period |
140% |
Total Net Advisory Fees Paid for the Period |
$2,138,320 | |
|
| Holdings [Text Block] |
Table Summary
Information Technology |
31.0% |
Financials |
14.6% |
Communication Services |
14.4% |
Industrials |
13.5% |
Consumer Discretionary |
12.6% |
Health Care |
8.3% |
Utilities |
3.6% |
Real Estate |
1.7% |
Other |
0.1% | |
|
| Material Fund Change [Text Block] |
|
|
| Updated Prospectus Phone Number |
1-800-621-2550
|
|
| Updated Prospectus Web Address |
<span style="box-sizing: border-box; color: rgb(0, 0, 0); display: inline; flex-wrap: nowrap; font-size: 12px; font-weight: 400; grid-area: auto; line-height: 12px; margin: 0px; overflow: visible; text-align: left; text-align-last: auto; white-space-collapse: preserve-breaks;">dfinview.com/GoldmanSachs</span>
|
|
| C000255663 |
|
|
| Shareholder Report [Line Items] |
|
|
| Fund Name |
Goldman Sachs India Equity ETF
|
|
| Trading Symbol |
GIND
|
|
| Security Exchange Name |
NASDAQ
|
|
| Annual or Semi-Annual Statement [Text Block] |
This annual shareholder report contains important information about Goldman Sachs India Equity ETF (the “Fund”) for the period of September 1, 2025 to August 31, 2026 (the “Period”).
|
|
| Additional Information [Text Block] |
You can find additional information about the Fund at am.gs.com or dfinview.com/GoldmanSachs. You can also request this information by contacting us at 1-800-621-2550.
|
|
| Additional Information Phone Number |
1-800-621-2550
|
|
| Expenses [Text Block] |
What were the Fund costs for the Period?Based on a hypothetical $10,000 investment.
Table Summary
Fund |
Costs of a $10,000 investment |
Costs paid as a percentage of a $10,000 investment |
GIND |
$75 |
0.75% | |
|
| Expenses Paid, Amount |
$ 75
|
|
| Expense Ratio, Percent |
0.75%
|
|
| Factors Affecting Performance [Text Block] |
How did the Fund perform and what affected its performance?The broad Indian equity market posted negative returns, in U.S. dollars, driven primarily by persistent foreign capital outflows until June 2026, surging global crude oil prices driven by Middle East conflicts, sluggish revenue growth and compressed profit margins across major sectors, and a weakening Indian rupee that added imported cost pressures. Despite these headwinds, India consistently maintained its position as the fastest growing major economy globally, supported by financialization of household assets, public capital expenditure and a resurgence in private consumption. In our view, India continued to offer a rare combination of structural growth and robust underlying macroeconomic and corporate fundamentals. The Indian equity market correction cooled valuations substantially, making it a relatively attractive entry point for long-term investors, in our opinion. Top Contributors to Performance: Relative to the MSCI India IMI (Net returns, Unhedged, USD) (Index), the health care, consumer discretionary and materials sectors contributed most positively to the Fund’s results. Relative to the Index, positions in Laurus Labs, a pharmaceutical and biotechnology company; Divi’s Laboratories, a manufacturer of active pharmaceutical ingredients, custom synthesis for big pharma companies, and nutraceuticals; and Axis Bank, a banking and financial services company and one of India’s largest private sector banks, contributed most positively to the Fund’s results during the Period (0.38%, 1.66% and 2.36% of Fund net assets as of August 31, 2026, respectively).
Top Detractors from Performance: Relative to the Index, the real estate, communication services and energy sectors detracted most from the Fund’s results. Relative to the Index, positions in HDFC Bank, a private sector bank and financial services conglomerate; Infosys Technologies, a digital services, consulting and technology outsourcing company; and Reliance Industries, which engages in hydrocarbon exploration and production, petroleum refining and marketing, petrochemicals, retail and telecommunications, detracted most from the Fund’s results during the Period (3.10%, 1.63% and 2.79% of Fund net assets as of August 31, 2026, respectively).
|
|
| Performance Past Does Not Indicate Future [Text] |
Performance data quoted above represents past performance. Past performance does not guarantee future results.
|
|
| Line Graph [Table Text Block] |
Table Summary
|
Shares based on NAV |
MSCI India IMI (Net, USD, Unhedged) |
4/1/25 |
$10,000 |
$10,000 |
8/25 |
$10,289 |
$10,291 |
8/26 |
$10,160 |
$10,071 |
|
|
| Performance Inception Date |
Apr. 01, 2025
|
|
| AssetsNet |
$ 171,670,374
|
|
| Advisory Fees Paid, Amount |
$ 938,380
|
|
| InvestmentCompanyPortfolioTurnover |
37.00%
|
|
| Additional Fund Statistics [Text Block] |
Table Summary
Total Net Assets as of Period End |
$171,670,374 |
# of Portfolio Holdings as of Period End |
128 |
Portfolio Turnover Rate for the Period |
37% |
Total Net Advisory Fees Paid for the Period |
$938,380 | |
|
| Holdings [Text Block] |
Table Summary
Financials |
29.3% |
Consumer Discretionary |
17.6% |
Industrials |
12.8% |
Health Care |
9.9% |
Materials |
9.4% |
Information Technology |
6.6% |
Consumer Staples |
4.2% |
Energy |
2.9% |
Real Estate |
2.4% |
Other |
5.5% | |
|
| Material Fund Change [Text Block] |
|
|
| Updated Prospectus Phone Number |
1-800-621-2550
|
|
| Updated Prospectus Web Address |
<span style="box-sizing: border-box; color: rgb(0, 0, 0); display: inline; flex-wrap: nowrap; font-size: 12px; font-weight: 400; grid-area: auto; line-height: 12px; margin: 0px; overflow: visible; text-align: left; text-align-last: auto; white-space-collapse: preserve-breaks;">dfinview.com/GoldmanSachs</span>
|
|
| C000219502 |
|
|
| Shareholder Report [Line Items] |
|
|
| Fund Name |
Goldman Sachs Innovate Equity ETF
|
|
| Trading Symbol |
GINN
|
|
| Security Exchange Name |
NYSEArca
|
|
| Annual or Semi-Annual Statement [Text Block] |
This annual shareholder report contains important information about Goldman Sachs Innovate Equity ETF (the “Fund”) for the period of September 1, 2025 to August 31, 2026 (the “Period”).
|
|
| Additional Information [Text Block] |
You can find additional information about the Fund at am.gs.com or dfinview.com/GoldmanSachs. You can also request this information by contacting us at 1-800-621-2550.
|
|
| Additional Information Phone Number |
1-800-621-2550
|
|
| Expenses [Text Block] |
What were the Fund costs for the Period?Based on a hypothetical $10,000 investment.
Table Summary
Fund |
Costs of a $10,000 investment |
Costs paid as a percentage of a $10,000 investment |
GINN |
$55 |
0.50% | |
|
| Expenses Paid, Amount |
$ 55
|
|
| Expense Ratio, Percent |
0.50%
|
|
| Factors Affecting Performance [Text Block] |
How did the Fund perform and what affected its performance?The broad global equity market produced positive returns in a dynamic and often volatile environment, shaped by a combination of geopolitical developments, shifting trade and fiscal policy expectations, and ongoing macroeconomic uncertainty. These factors led to sharp swings in investor sentiment and increased performance dispersion across regions, sectors and individual companies, as investors reassessed the implications of policy changes, supply chain considerations and global economic growth prospects. Global equities were generally resilient despite periodic bouts of volatility, supported by constructive economic fundamentals and corporate adaptability. Many businesses delivered solid financial results, reinforcing market confidence in underlying corporate fundamentals. Investors appeared to differentiate between companies based on their ability to execute, sustain growth and navigate an evolving geopolitical and economic landscape. Top Contributors to Performance: The Solactive Innovative Global Equity Index (Index) generated positive returns, with all five Key Themes—Data-Driven World, Finance Reimagined, Human Evolution, Manufacturing Revolution and New Age Consumer—adding to performance. The Data-Driven World Key Theme was the largest positive contributor, as ongoing investment in artificial intelligence (AI), cloud infrastructure and digital transformation supported strong corporate earnings growth. Market leadership was concentrated in companies with durable competitive advantages and clear monetization opportunities tied to the expanding data economy. The Manufacturing Revolution Key Theme was the second largest contributor to Index returns amid a growing focus on supply chain resiliency, domestic production capabilities and strategic industrial investment. Companies also benefited from increasing demand for advanced manufacturing technologies and automation solutions. The Index was helped during the Period by its positions in Intel, a semiconductor company that designs and manufactures processors, data center chips and other computing technologies; Alphabet, the parent company of Google and operator of businesses in search, digital advertising, cloud computing, AI and autonomous driving; and Micron Technology, a producer of memory and storage semiconductors (1.12%, 1.90% and 0.49% of Fund net assets as of August 31, 2026, respectively).
Top Detractors from Performance: During the Period, the Index was hurt by its positions in U.S.-based Meta Platforms, China-based Tencent Holdings and Singapore-based Sea—all technology conglomerates (1.52%, 1.16% and 0.59% of Fund net assets as of August 31, 2026, respectively).
|
|
| Performance Past Does Not Indicate Future [Text] |
Performance data quoted above represents past performance. Past performance does not guarantee future results.
|
|
| Line Graph [Table Text Block] |
Table Summary
|
Shares based on NAV |
Solactive Innovative Global Equity Index (Net total Return, USD, Unhedged) |
MSCI ACWI Index |
11/6/20 |
$10,000 |
$10,000 |
$10,000 |
8/21 |
$12,680 |
$12,738 |
$12,662 |
8/22 |
$8,832 |
$8,864 |
$10,651 |
8/23 |
$10,013 |
$10,048 |
$12,137 |
8/24 |
$12,102 |
$12,172 |
$14,982 |
8/25 |
$14,593 |
$14,719 |
$17,348 |
8/26 |
$17,308 |
$17,493 |
$21,225 |
|
|
| Performance Inception Date |
Nov. 06, 2020
|
|
| AssetsNet |
$ 198,022,542
|
|
| Advisory Fees Paid, Amount |
$ 1,065,660
|
|
| InvestmentCompanyPortfolioTurnover |
35.00%
|
|
| Additional Fund Statistics [Text Block] |
Table Summary
Total Net Assets as of Period End |
$198,022,542 |
# of Portfolio Holdings as of Period End |
474 |
Portfolio Turnover Rate for the Period |
35% |
Total Net Advisory Fees Paid for the Period |
$1,065,660 | |
|
| Holdings [Text Block] |
Table Summary
Information Technology |
28.3% |
Health Care |
21.5% |
Consumer Discretionary |
14.4% |
Financials |
13.6% |
Communication Services |
10.5% |
Industrials |
6.4% |
Utilities |
1.8% |
Consumer Staples |
1.4% |
Energy |
1.2% |
Other |
0.6% | |
|
| Material Fund Change [Text Block] |
|
|
| Updated Prospectus Phone Number |
1-800-621-2550
|
|
| Updated Prospectus Web Address |
<span style="box-sizing: border-box; color: rgb(0, 0, 0); display: inline; flex-wrap: nowrap; font-size: 12px; font-weight: 400; grid-area: auto; line-height: 12px; margin: 0px; overflow: visible; text-align: left; text-align-last: auto; white-space-collapse: preserve-breaks;">dfinview.com/GoldmanSachs</span>
|
|
| C000264456 |
|
|
| Shareholder Report [Line Items] |
|
|
| Fund Name |
Goldman Sachs MSCI World Private Equity Return Tracker ETF
|
|
| Trading Symbol |
GTPE
|
|
| Security Exchange Name |
NASDAQ
|
|
| Annual or Semi-Annual Statement [Text Block] |
This annual shareholder report contains important information about Goldman Sachs MSCI World Private Equity Return Tracker ETF (the “Fund”) for the period of October 21, 2025 to August 31, 2026 (the “Period”).
|
|
| Additional Information [Text Block] |
You can find additional information about the Fund at am.gs.com or dfinview.com/GoldmanSachs. You can also request this information by contacting us at 1-800-621-2550.
|
|
| Additional Information Phone Number |
1-800-621-2550
|
|
| Expenses [Text Block] |
What were the Fund costs for the Period?Based on a hypothetical $10,000 investment.
Table Summary
Fund |
Costs of a $10,000 investment |
Costs paid as a percentage of a $10,000 investment |
GTPE |
$45Footnote Reference* |
0.47%Footnote Reference** |
| Footnote |
Description |
Footnote* |
The Fund has less than one year of operations. Expenses would be higher if the Fund operated for a full year. |
Footnote** |
Annualized | |
|
| Expenses Paid, Amount |
$ 45
|
[1] |
| Expense Ratio, Percent |
0.47%
|
[2] |
| Factors Affecting Performance [Text Block] |
How did the Fund perform and what affected its performance?The broad global equity market posted strong positive returns, but individual country markets experienced varied performance, influenced by diverse economic conditions, central bank policies and political and geopolitical developments. Internationally, performance was supported by a broad-based economic recovery in developed markets, a softening U.S. dollar that provided a material tailwind to U.S. dollar-denominated returns, an artificial intelligence (AI) investment theme that moved beyond pure-play technology into the wider industrial value chain, and resilient corporate earnings. In the U.S., resilient corporate earnings, solid labor data and expanding AI infrastructure drove gains most. Monetary policy also played a crucial role, with the U.S. Federal Reserve implementing interest rate cuts in the last months of 2025 and then holding steady, as it weighed inflation that remained above target. Periodic volatility, on a global basis, was largely based on investor concerns around AI monetization, returns on investment and debt issuance as well as geopolitical tensions, including maritime shipping disruptions and trade tariffs. Top Contributors to Performance: The information technology and health care sectors contributed most positively. From a country perspective, exposure to the U.S. contributed most positively. Relative to the MSCI World Private Equity Return Tracker Index (Index), an underweight in U.S.-based pharmaceutical firm Eli Lilly & Co., an overweight in Singapore-based data storage company Seagate Technology Holdings and a neutral position in U.S.-based analytics software provider Fair Isaac contributed most positively (2.54%, 0.13% and 0.68% of Fund net assets as of August 31, 2026, respectively).
Top Detractors from Performance: The energy sector detracted most. Country exposures to Germany and Canada detracted most. Relative to the Index, underweights in semiconductor companies Advanced Micro Devices and Marvell Technology and an overweight in entertainment services provider Netflix—each a U.S.-based company—detracted most (2.23%, 2.13% and 0.54% of Fund net assets as of August 31, 2026, respectively).
|
|
| Performance Past Does Not Indicate Future [Text] |
Performance data quoted above represents past performance. Past performance does not guarantee future results.
|
|
| Line Graph [Table Text Block] |
Table Summary
|
Shares based on NAV |
MSCI World Private Equity Return Tracker Index (Net, USD, Unhedged) |
MSCI World Index IMI (Net, USD, Unhedged) |
10/21/25 |
$10,000 |
$10,000 |
$10,000 |
8/26 |
$12,287 |
$12,342 |
$11,608 |
|
|
| Performance Inception Date |
Oct. 21, 2025
|
|
| AssetsNet |
$ 30,705,566
|
|
| Advisory Fees Paid, Amount |
$ 99,275
|
|
| InvestmentCompanyPortfolioTurnover |
88.00%
|
|
| Additional Fund Statistics [Text Block] |
Table Summary
Total Net Assets as of Period End |
$30,705,566 |
# of Portfolio Holdings as of Period End |
1,581 |
Portfolio Turnover Rate for the Period |
88% |
Total Net Advisory Fees Paid for the Period |
$99,275 | |
|
| Holdings [Text Block] |
Table Summary
Information Technology |
25.9% |
Industrials |
14.0% |
Financials |
11.0% |
Health Care |
8.2% |
Consumer Discretionary |
6.0% |
Consumer Staples |
4.0% |
Energy |
3.9% |
Real Estate |
2.9% |
Communication Services |
2.0% |
Other |
21.3% | |
|
| Material Fund Change [Text Block] |
|
|
| Updated Prospectus Phone Number |
1-800-621-2550
|
|
| Updated Prospectus Web Address |
<span style="box-sizing: border-box; color: rgb(0, 0, 0); display: inline; flex-wrap: nowrap; font-size: 12px; font-weight: 400; grid-area: auto; line-height: 12px; margin: 0px; overflow: visible; text-align: left; text-align-last: auto; white-space-collapse: preserve-breaks;">dfinview.com/GoldmanSachs</span>
|
|
| C000245144 |
|
|
| Shareholder Report [Line Items] |
|
|
| Fund Name |
Goldman Sachs Small Cap Equity ETF
|
|
| Trading Symbol |
GSC
|
|
| Security Exchange Name |
NYSEArca
|
|
| Annual or Semi-Annual Statement [Text Block] |
This annual shareholder report contains important information about Goldman Sachs Small Cap Equity ETF (the “Fund”) for the period of September 1, 2025 to August 31, 2026 (the “Period”).
|
|
| Additional Information [Text Block] |
You can find additional information about the Fund at am.gs.com or dfinview.com/GoldmanSachs. You can also request this information by contacting us at 1-800-621-2550.
|
|
| Additional Information Phone Number |
1-800-621-2550
|
|
| Expenses [Text Block] |
What were the Fund costs for the Period?Based on a hypothetical $10,000 investment.
Table Summary
Fund |
Costs of a $10,000 investment |
Costs paid as a percentage of a $10,000 investment |
GSC |
$83 |
0.75% | |
|
| Expenses Paid, Amount |
$ 83
|
|
| Expense Ratio, Percent |
0.75%
|
|
| Factors Affecting Performance [Text Block] |
How did the Fund perform and what affected its performance?The broad U.S. equity market delivered strong gains overall, driven by resilient corporate earnings, solid labor data and expanding artificial intelligence (AI) infrastructure. Monetary policy also played a crucial role, with the Federal Reserve implementing interest rate cuts in the last months of 2025 and then holding steady, as it weighed inflation that remained above target. Still, U.S. equities faced periodic volatility around AI monetization, returns on investment and debt issuance. Concurrently, geopolitical tensions, including maritime shipping disruptions and trade tariffs, drove commodity and energy market volatility. Corporate fundamentals cushioned pullbacks, with profit margins and earnings rather consistently beating consensus expectations across the information technology, industrials and health care sectors. Small-cap equities outperformed their larger counterparts during the Period as a whole, but the third quarter of 2025 was especially challenging, as the market then favored lower quality, unprofitable and highly volatile stocks, creating headwinds for our quality-focused, lower volatility strategy. Top Contributors to Performance: The information technology and industrials sectors contributed most positively, driven by stock selection in the semiconductors & semiconductor equipment and aerospace & defense industries, respectively. Relative to the Russell 2000® Index, an out-of-benchmark position in clinical-stage precision oncology company Revolution Medicines proved beneficial on the back of historic results from its Phase 3 clinical trial for its pancreatic cancer drug, daraxonrasib. Strong early data from another pancreatic cancer drug candidate, zoldonrasib, further contributed to its stock’s appreciation. An overweight in cloud service provider DigitalOcean Holdings added to results. The company benefited from record annual run-rate revenues, an upsized $800 million capital raise to expand AI data center infrastructure, heightened AI infrastructure demand and multiple analyst upgrades. An out-of-benchmark position in Onto Innovation, which develops process control, advanced metrology, defect inspection, lithography and enterprise software for the microelectronics and semiconductor industries, contributed positively. Its stock rallied sharply following upward revisions to its revenue guidance and a surge in AI-driven advanced packaging demand. These three positions accounted for 0.00%1, 1.2% and 1.2% of Fund net assets as of August 31, 2026, respectively.
Top Detractors from Performance: Stock selection overall detracted most from the Fund’s relative results. To a lesser degree, sector allocation decisions as a whole also dampened relative results. The health care and financials sectors detracted most, driven by stock selection in the health care providers & services and capital markets industries, respectively. Relative to the Russell 2000® Index, an overweight to genomics and biotechnology company GeneDx Holdings detracted due to a conservative guidance release, which reignited investors’ growth concerns. An out-of-benchmark position in value retailer Ollie’s Bargain Outlet Holdings detracted. The company’s stock pulled back consequent to lower than consensus expected comparisons, which caused investors to recalibrate expectations. An overweight in Waystar Holding, a cloud-based software company focused on health care payments and revenue cycle management for health care providers, hurt. Its stock fell due to decelerating growth metrics and broader market worries around software and health care information technology spending. These three positions accounted for 0.00%1, 0.00%1 and 0.00%1 of Fund net assets as of August 31, 2026, respectively.
1Some weights are 0.00% at August 31, 2026 either because those positions were eliminated during the most recent rebalance given the Index construction methodology or were not held at all during the Period as they did not meet the Fund’s investment criteria. |
|
| Performance Past Does Not Indicate Future [Text] |
Performance data quoted above represents past performance. Past performance does not guarantee future results.
|
|
| Line Graph [Table Text Block] |
Table Summary
|
Shares based on NAV |
Russell 2000® Index |
Russell 3000® Index |
10/3/23 |
$10,000 |
$10,000 |
$10,000 |
8/24 |
$13,405 |
$13,009 |
$13,463 |
8/25 |
$13,743 |
$14,072 |
$15,596 |
8/26 |
$16,663 |
$17,795 |
$18,730 |
|
|
| Performance Inception Date |
Oct. 03, 2023
|
|
| AssetsNet |
$ 279,050,467
|
|
| Advisory Fees Paid, Amount |
$ 1,455,038
|
|
| InvestmentCompanyPortfolioTurnover |
89.00%
|
|
| Additional Fund Statistics [Text Block] |
Table Summary
Total Net Assets as of Period End |
$279,050,467 |
# of Portfolio Holdings as of Period End |
99 |
Portfolio Turnover Rate for the Period |
89% |
Total Net Advisory Fees Paid for the Period |
$1,455,038 | |
|
| Holdings [Text Block] |
Table Summary
Financials |
19.9% |
Health Care |
18.7% |
Information Technology |
16.3% |
Industrials |
14.6% |
Consumer Discretionary |
11.7% |
Materials |
4.9% |
Energy |
4.7% |
Utilities |
2.9% |
Real Estate |
2.6% |
Other |
3.8% | |
|
| Material Fund Change [Text Block] |
|
|
| Updated Prospectus Phone Number |
1-800-621-2550
|
|
| Updated Prospectus Web Address |
<span style="box-sizing: border-box; color: rgb(0, 0, 0); display: inline; flex-wrap: nowrap; font-size: 12px; font-weight: 400; grid-area: auto; line-height: 12px; margin: 0px; overflow: visible; text-align: left; text-align-last: auto; white-space-collapse: preserve-breaks;">dfinview.com/GoldmanSachs</span>
|
|
| C000228400 |
|
|
| Shareholder Report [Line Items] |
|
|
| Fund Name |
Goldman Sachs Future Health Care Equity ETF
|
|
| Trading Symbol |
GDOC
|
|
| Security Exchange Name |
NYSEArca
|
|
| Annual or Semi-Annual Statement [Text Block] |
This annual shareholder report contains important information about Goldman Sachs Future Health Care Equity ETF (the “Fund”) for the period of September 1, 2025 to August 31, 2026 (the “Period”).
|
|
| Additional Information [Text Block] |
You can find additional information about the Fund at am.gs.com or dfinview.com/GoldmanSachs. You can also request this information by contacting us at 1-800-621-2550.
|
|
| Additional Information Phone Number |
1-800-621-2550
|
|
| Expenses [Text Block] |
What were the Fund costs for the Period?Based on a hypothetical $10,000 investment.
Table Summary
Fund |
Costs of a $10,000 investment |
Costs paid as a percentage of a $10,000 investment |
GDOC |
$81 |
0.75% | |
|
| Expenses Paid, Amount |
$ 81
|
|
| Expense Ratio, Percent |
0.75%
|
|
| Factors Affecting Performance [Text Block] |
How did the Fund perform and what affected its performance?When the Period began in the final months of 2025, health care stocks advanced as investors gained greater clarity around pricing, reimbursement and regulatory dynamics. Large pharmaceutical companies facing upcoming patent expirations sought external innovation to replenish their pipelines, which supported an increase in mergers and acquisitions (M&A) activity and investor interest in biotechnology and other innovative health care companies. This was particularly evident in the first quarter of 2026 when M&A activity accelerated in areas such as precision medicine, oncology, genomics, obesity and rare diseases. The companies that benefited most were those with differentiated technologies and clinical pipelines. In March 2026, the performance of health care stocks was increasingly influenced by broader market rotations, with investment flows often having a greater impact on returns than underlying company fundamentals. Top Contributors to Performance: Relative to the MSCI ACWI Health Care Index (Index), the Fund’s best performing Key Theme was Precision Medicine. Among sub-themes, the Fund benefited most from positions in chronic diseases and targeted oncology. The Fund’s second-strongest Key Theme was Genomics, with its sub-theme of diagnostic testing adding to Fund performance. On an industry level, stock selection and an overweight position versus the Index in biotechnology added to the Fund’s returns. Stock selection among health care providers and services and within pharmaceuticals further bolstered performance. Regarding countries, the Fund was helped by an underweight in France and Australia as well as by stock selection in Belgium. The Fund benefited from overweight positions in Guardant Health, a precision oncology company specializing in blood-based genomic testing for cancer detection, treatment guidance and monitoring; Apogee Therapeutics, a clinical-stage biotechnology company developing novel biologics for inflammatory and immunology diseases; and Roivant Sciences, a biopharmaceutical company that develops and commercializes innovative therapies (4.02%, 0.00%1 and 2.48% of Fund net assets as of August 31, 2026, respectively).
Top Detractors from Performance: The Fund, which is primarily invested in what may be considered the innovative parts of the health care ecosystem, generated positive absolute returns but underperformed the Index, as more established segments of the health care sector outperformed more innovative segments. Among Key Themes, the Fund was hurt most by Technology-Enabled Procedures, with minimally invasive surgery and robotic surgery the weakest sub-themes. Another Key Theme—Digital Healthcare—also detracted from relative performance. Connective devices was the weakest sub-theme within Digital Healthcare. On the industry level, the Fund’s allocations to health care equipment and supplies and to life sciences tools and services limited relative returns. In terms of countries, stock selection in the U.S. and Switzerland, along with an underweight in Israel, detracted from returns. The Fund was hampered by an overweight position in Boston Scientific, a medical device manufacturer and by underweights in Insulet, an insulin management system platform provider, and Veeva Systems, a provider of cloud-based software, artificial intelligence, data and consulting solutions for the global life sciences industry (1.54%, 0.00%1 and 0.00%1 of Fund net assets as of August 31, 2026, respectively).
1Some weights are 0.00% at August 31, 2026 either because those positions were taken out during the most recent rebalance given the Fund’s index construction methodology or because they were not components of the Index during the Period. |
|
| Performance Past Does Not Indicate Future [Text] |
Performance data quoted above represents past performance. Past performance does not guarantee future results.
|
|
| Line Graph [Table Text Block] |
Table Summary
|
Shares based on NAV |
MSCI ACWI Health Care Index |
MSCI ACWI Index |
11/9/21 |
$10,000 |
$10,000 |
$10,000 |
8/22 |
$7,545 |
$8,907 |
$8,218 |
8/23 |
$8,170 |
$9,745 |
$9,364 |
8/24 |
$9,431 |
$11,713 |
$11,559 |
8/25 |
$8,234 |
$10,440 |
$13,385 |
8/26 |
$9,491 |
$12,426 |
$16,376 |
|
|
| Performance Inception Date |
Nov. 09, 2021
|
|
| AssetsNet |
$ 19,597,194
|
|
| Advisory Fees Paid, Amount |
$ 130,567
|
|
| InvestmentCompanyPortfolioTurnover |
67.00%
|
|
| Additional Fund Statistics [Text Block] |
Table Summary
Total Net Assets as of Period End |
$19,597,194 |
# of Portfolio Holdings as of Period End |
40 |
Portfolio Turnover Rate for the Period |
67% |
Total Net Advisory Fees Paid for the Period |
$130,567 | |
|
| Holdings [Text Block] |
Table Summary
Health Care |
98.3% |
Other |
1.6% | |
|
| Material Fund Change [Text Block] |
|
|
| Updated Prospectus Phone Number |
1-800-621-2550
|
|
| Updated Prospectus Web Address |
<span style="box-sizing: border-box; color: rgb(0, 0, 0); display: inline; flex-wrap: nowrap; font-size: 12px; font-weight: 400; grid-area: auto; line-height: 12px; margin: 0px; overflow: visible; text-align: left; text-align-last: auto; white-space-collapse: preserve-breaks;">dfinview.com/GoldmanSachs</span>
|
|
| C000226526 |
|
|
| Shareholder Report [Line Items] |
|
|
| Fund Name |
Goldman Sachs Future Tech Leaders Equity ETF
|
|
| Trading Symbol |
GTEK
|
|
| Security Exchange Name |
NYSEArca
|
|
| Annual or Semi-Annual Statement [Text Block] |
This annual shareholder report contains important information about Goldman Sachs Future Tech Leaders Equity ETF (the “Fund”) for the period of September 1, 2025 to August 31, 2026 (the “Period”).
|
|
| Additional Information [Text Block] |
You can find additional information about the Fund at am.gs.com or dfinview.com/GoldmanSachs. You can also request this information by contacting us at 1-800-621-2550.
|
|
| Additional Information Phone Number |
1-800-621-2550
|
|
| Expenses [Text Block] |
What were the Fund costs for the Period?Based on a hypothetical $10,000 investment.
Table Summary
Fund |
Costs of a $10,000 investment |
Costs paid as a percentage of a $10,000 investment |
GTEK |
$96 |
0.75% | |
|
| Expenses Paid, Amount |
$ 96
|
|
| Expense Ratio, Percent |
0.75%
|
|
| Factors Affecting Performance [Text Block] |
How did the Fund perform and what affected its performance?Technology stocks posted positive returns, though there was significant dispersion in performance as investors differentiated among companies based on their exposure to artificial intelligence (AI) as well as on their capital investment requirements, competitive positioning and ability to translate innovation into sustainable earnings growth. Many of the strongest performers were technology supply-chain companies based in South Korea, Taiwan, Japan and other emerging technology hubs. These businesses benefited from growing demand for the advanced semiconductors, memory, connectivity, power-management solutions and manufacturing equipment required to support next-generation AI infrastructure. Market leadership rotated meaningfully, with hardware, semiconductor and infrastructure-related companies generally performing best and segments of software, consumer internet, fintech and digital-platform markets experiencing greater volatility. Top Contributors to Performance: The Fund generated positive absolute returns and outperformed its benchmark, the MSCI All Country World Index (Index), benefiting from its exposure to companies enabling the buildout of global AI infrastructure. As investment in AI broadened beyond the largest technology platforms, investors increasingly rewarded the semiconductor, memory, component, networking and equipment providers supplying the underlying technologies required to support next-generation computing workloads. The Fund’s emphasis on these “picks and shovels” beneficiaries of AI was a significant contributor to its performance. Exposure to smart components and leading-edge semi-cap equipment added most to the Fund’s relative performance. Stock selection among companies focused on digital transformation contributed positively. The Fund was helped by exposure to companies well positioned to navigate the dynamic technology landscape and capitalize on evolving digital adoption trends. In terms of sectors, the Fund benefited from stock selection in information technology, especially semiconductor, memory, component, networking and AI-infrastructure companies. Regarding countries, exposure to South Korea and Taiwan added to the Fund’s returns. In South Korea, the Fund was aided by allocations to memory, semiconductor and technology holding companies. Its significant exposure to Taiwanese semiconductor, component, networking and technology supply chain companies bolstered relative performance. The Fund benefited from its relative overweights in SK Hynix, a South Korean semiconductor manufacturer; South Korea-based SK Square, which invests in semiconductor and information and communication technologies; and Taiwan-based Jentech Precision Industrial, which specializes in thermal management, precision metal components and integrated manufacturing solutions (0.00%,1 2.53% and 3.51% of Fund net assets as of August 31, 2026, respectively).
Top Detractors from Performance: The Fund’s exposure to consumer internet, fintech and cybersecurity detracted from relative returns. Investors increasingly differentiated between companies directly benefiting from AI infrastructure spending and those facing questions around competitive positioning, monetization and the potential impact of AI on existing business models. Among sectors, the Fund was hampered by its overweight relative to the Index in consumer discretionary stocks, as certain Internet-enabled consumer and technology-oriented businesses experienced weak performance. As for countries, the Fund’s exposure to the U.S. detracted from relative returns, largely due to poor stock selection. The Fund was hurt by its overweight positions in South Korea-based electronic component manufacturer Samsung Electro-Mechanics; Swedish digital audio streaming and media service provider Spotify Technology; and U.S.-based cybersecurity company Varonis Systems (2.10%, 1.44% and 0.00%1 of Fund net assets as of August 31, 2026, respectively).
1Some weights are 0.00% at August 31, 2026 either because those positions were taken out during the most recent rebalance given the Fund’s index construction methodology or because they were not components of the Index during the Period. |
|
| Performance Past Does Not Indicate Future [Text] |
Performance data quoted above represents past performance. Past performance does not guarantee future results.
|
|
| Line Graph [Table Text Block] |
Table Summary
|
Shares based on NAV |
MSCI ACWI Index |
MSCI ACWI Select Information Technology + Communication Services (excluding >$100B Market Cap) Index |
9/14/21 |
$10,000 |
$10,000 |
$10,000 |
8/22 |
$5,997 |
$8,475 |
$7,197 |
8/23 |
$6,240 |
$9,657 |
$7,925 |
8/24 |
$7,453 |
$11,921 |
$9,602 |
8/25 |
$9,181 |
$13,803 |
$11,699 |
8/26 |
$14,215 |
$16,888 |
$16,238 |
|
|
| Performance Inception Date |
Sep. 14, 2021
|
|
| AssetsNet |
$ 238,039,115
|
|
| Advisory Fees Paid, Amount |
$ 1,459,644
|
|
| InvestmentCompanyPortfolioTurnover |
73.00%
|
|
| Additional Fund Statistics [Text Block] |
Table Summary
Total Net Assets as of Period End |
$238,039,115 |
# of Portfolio Holdings as of Period End |
61 |
Portfolio Turnover Rate for the Period |
73% |
Total Net Advisory Fees Paid for the Period |
$1,459,644 | |
|
| Holdings [Text Block] |
Table Summary
Information Technology |
71.0% |
Industrials |
9.6% |
Consumer Discretionary |
7.2% |
Communication Services |
5.3% |
Materials |
2.8% |
Real Estate |
2.6% |
Health Care |
1.0% |
Other |
0.6% | |
|
| Material Fund Change [Text Block] |
|
|
| Updated Prospectus Phone Number |
1-800-621-2550
|
|
| Updated Prospectus Web Address |
<span style="box-sizing: border-box; color: rgb(0, 0, 0); display: inline; flex-wrap: nowrap; font-size: 12px; font-weight: 400; grid-area: auto; line-height: 12px; margin: 0px; overflow: visible; text-align: left; text-align-last: auto; white-space-collapse: preserve-breaks;">dfinview.com/GoldmanSachs</span>
|
|
| C000214554 |
|
|
| Shareholder Report [Line Items] |
|
|
| Fund Name |
Goldman Sachs MarketBeta<sup style="inset: 1.5px 0px 4px; box-sizing: border-box; color: rgb(33, 120, 196); display: inline; flex-wrap: nowrap; font-size: 14px; font-weight: 700; grid-area: auto; line-height: 0px; margin: 0px; overflow: visible; position: relative; text-align: left; text-align-last: auto; white-space-collapse: preserve-breaks;">®</sup> Emerging Markets Equity ETF
|
|
| Trading Symbol |
GSEE
|
|
| Security Exchange Name |
CboeBZX
|
|
| Annual or Semi-Annual Statement [Text Block] |
This annual shareholder report contains important information about Goldman Sachs MarketBeta® Emerging Markets Equity ETF (the “Fund”) for the period of September 1, 2025 to August 31, 2026 (the “Period”).
|
|
| Additional Information [Text Block] |
You can find additional information about the Fund at am.gs.com or dfinview.com/GoldmanSachs. You can also request this information by contacting us at 1-800-621-2550.
|
|
| Additional Information Phone Number |
1-800-621-2550
|
|
| Expenses [Text Block] |
What were the Fund costs for the Period?Based on a hypothetical $10,000 investment.
Table Summary
Fund |
Costs of a $10,000 investment |
Costs paid as a percentage of a $10,000 investment |
GSEE |
$43 |
0.36% | |
|
| Expenses Paid, Amount |
$ 43
|
|
| Expense Ratio, Percent |
0.36%
|
|
| Factors Affecting Performance [Text Block] |
How did the Fund perform and what affected its performance?The broad emerging markets equity market experienced volatility but performed robustly, driven by reduced currency pressures, appealing valuations, generally favorable trade agreements, accelerated foreign institutional investor inflows, resilient domestic demand in several economies, targeted policy support from governments and central banks, rising commodity prices and ongoing investor enthusiasm for semiconductor and other artificial intelligence ("AI") related stocks. Still, performance across sectors and individual country markets was diverse, with some showing resilience supported by domestic demand and foreign investment inflows, while others were affected by global trade policies, including tariffs, and slowed economic activity. Geopolitical tensions, including the conflict in the Middle East, impacted the emerging markets equity markets as well, creating both opportunities and challenges. Top Contributors to Performance: Solactive GBS Emerging Markets Large & Mid Cap Index (Index) constituents in the information technology, financials and materials sectors contributed most positively to the Index’s results during the Period. Taiwan, South Korea and Brazil were the top country contributors to the Index’s results. Positions in Taiwan Semiconductor Manufacturing, a Taiwan-based semiconductor company; Samsung Electronics, a South Korea-based technology, hardware, storage and peripherals company; and SK Hynix, a South Korea-based semiconductor company, contributed most positively to the Index’s returns during the Period (13.78%, 7.50% and 5.20% of Fund net assets as of August 31, 2026, respectively).
Top Detractors from Performance: Index constituents in the communication services, consumer discretionary and consumer staples sectors detracted most from the Index’s results during the Period. China, India and Indonesia detracted most from the Index’s results from a country perspective. Positions in Tencent Holdings, a China-based technology conglomerate; Xiaomi, a China-based consumer electronics and smart manufacturing company; and HDFC Bank, an India-based private sector bank, contributed least to the Index’s results during the Period (2.72%, 0.46% and 0.65% of Fund net assets as of August 31, 2026, respectively).
|
|
| Performance Past Does Not Indicate Future [Text] |
Performance data quoted above represents past performance. Past performance does not guarantee future results.
|
|
| Line Graph [Table Text Block] |
Table Summary
|
Shares based on NAV |
Solactive GBS Emerging Markets Large & Mid Cap Index |
MSCI Emerging Markets Index (Net, USD, Unhedged) |
5/12/20 |
$10,000 |
$10,000 |
$10,000 |
8/20 |
$12,154 |
$12,206 |
$12,248 |
8/21 |
$14,506 |
$14,602 |
$14,835 |
8/22 |
$11,603 |
$11,670 |
$11,601 |
8/23 |
$11,790 |
$11,909 |
$11,746 |
8/24 |
$13,382 |
$13,759 |
$13,516 |
8/25 |
$15,635 |
$16,043 |
$15,787 |
8/26 |
$21,369 |
$21,978 |
$21,983 |
|
|
| Performance Inception Date |
May 12, 2020
|
|
| AssetsNet |
$ 138,692,979
|
|
| Advisory Fees Paid, Amount |
$ 452,544
|
|
| InvestmentCompanyPortfolioTurnover |
14.00%
|
|
| Additional Fund Statistics [Text Block] |
Table Summary
Total Net Assets as of Period End |
$138,692,979 |
# of Portfolio Holdings as of Period End |
1,800 |
Portfolio Turnover Rate for the Period |
14% |
Total Net Advisory Fees Paid for the Period |
$452,544 | |
|
| Holdings [Text Block] |
Table Summary
Information Technology |
40.3% |
Financials |
18.9% |
Consumer Discretionary |
8.3% |
Industrials |
7.7% |
Communication Services |
5.9% |
Materials |
5.9% |
Energy |
3.4% |
Health Care |
2.8% |
Consumer Staples |
2.5% |
Other |
4.7% | |
|
| Material Fund Change [Text Block] |
|
|
| Updated Prospectus Phone Number |
1-800-621-2550
|
|
| Updated Prospectus Web Address |
<span style="box-sizing: border-box; color: rgb(0, 0, 0); display: inline; flex-wrap: nowrap; font-size: 12px; font-weight: 400; grid-area: auto; line-height: 12px; margin: 0px; overflow: visible; text-align: left; text-align-last: auto; white-space-collapse: preserve-breaks;">dfinview.com/GoldmanSachs</span>
|
|
| C000214553 |
|
|
| Shareholder Report [Line Items] |
|
|
| Fund Name |
Goldman Sachs MarketBeta<sup style="inset: 1.5px 0px 4px; box-sizing: border-box; color: rgb(33, 120, 196); display: inline; flex-wrap: nowrap; font-size: 14px; font-weight: 700; grid-area: auto; line-height: 0px; margin: 0px; overflow: visible; position: relative; text-align: left; text-align-last: auto; white-space-collapse: preserve-breaks;">®</sup> International Equity ETF
|
|
| Trading Symbol |
GSID
|
|
| Security Exchange Name |
CboeBZX
|
|
| Annual or Semi-Annual Statement [Text Block] |
This annual shareholder report contains important information about Goldman Sachs MarketBeta® International Equity ETF (the “Fund”) for the period of September 1, 2025 to August 31, 2026 (the “Period”).
|
|
| Additional Information [Text Block] |
You can find additional information about the Fund at am.gs.com or dfinview.com/GoldmanSachs. You can also request this information by contacting us at 1-800-621-2550.
|
|
| Additional Information Phone Number |
1-800-621-2550
|
|
| Expenses [Text Block] |
What were the Fund costs for the Period?Based on a hypothetical $10,000 investment.
Table Summary
Fund |
Costs of a $10,000 investment |
Costs paid as a percentage of a $10,000 investment |
GSID |
$22 |
0.20% | |
|
| Expenses Paid, Amount |
$ 22
|
|
| Expense Ratio, Percent |
0.20%
|
|
| Factors Affecting Performance [Text Block] |
How did the Fund perform and what affected its performance?The broad international equity market posted double-digit positive returns for the Period but experienced varied performance, influenced by diverse economic conditions, central bank policies and political and geopolitical developments. Still, strong performance overall was supported by a broad-based economic recovery in developed markets, a softening U.S. dollar that provided a material tailwind to U.S. dollar-denominated returns, an artificial intelligence ("AI") investment theme that moved beyond pure-play technology into the wider industrial value chain, and resilient corporate earnings. Top Contributors to Performance: Solactive GBS Developed Markets ex North America Large & Mid Cap Index (Index) constituents in the financials, information technology and industrials sectors contributed most positively to the Index’s results during the Period. Japan, the U.K. and the Netherlands were top country contributors to the Index’s results. Positions in Netherlands-based information technology company ASML Holding, U.K.-based financials company HSBC Holdings and Australia-based materials company BHP Group contributed most positively to the Index’s returns during the Period (2.78%, 1.56% and 1.04% of Fund net assets as of August 31, 2026, respectively).
Top Detractors from Performance: Index constituents in the communication services sector was the only sector to detract from the Index’s results during the Period. New Zealand, Macau1 and Taiwan1 contributed least to the Index’s results from a country perspective. Positions in Germany-based enterprise application software and business AI company SAP, Japan-based video game and gaming systems creator Nintendo and France-based health care company EssilorLuxottica contributed least to the Index’s results during the Period (0.98%, 0.27% and 0.23% of Fund net assets as of August 31, 2026, respectively).
1 Country of domicile. |
|
| Performance Past Does Not Indicate Future [Text] |
Performance data quoted above represents past performance. Past performance does not guarantee future results.
|
|
| Line Graph [Table Text Block] |
Table Summary
|
Shares based on NAV |
Solactive GBS Developed Markets ex North America Large & Mid Cap Index |
MSCI World ex USA Index |
5/12/20 |
$10,000 |
$10,000 |
$10,000 |
8/20 |
$11,657 |
$11,650 |
$11,684 |
8/21 |
$14,711 |
$14,716 |
$14,788 |
8/22 |
$11,798 |
$11,797 |
$12,044 |
8/23 |
$13,830 |
$13,844 |
$14,025 |
8/24 |
$16,487 |
$16,515 |
$16,753 |
8/25 |
$18,808 |
$18,859 |
$19,246 |
8/26 |
$22,908 |
$22,990 |
$23,547 |
|
|
| Performance Inception Date |
May 12, 2020
|
|
| AssetsNet |
$ 1,075,402,127
|
|
| Advisory Fees Paid, Amount |
$ 1,925,995
|
|
| InvestmentCompanyPortfolioTurnover |
6.00%
|
|
| Additional Fund Statistics [Text Block] |
Table Summary
Total Net Assets as of Period End |
$1,075,402,127 |
# of Portfolio Holdings as of Period End |
893 |
Portfolio Turnover Rate for the Period |
6% |
Total Net Advisory Fees Paid for the Period |
$1,925,995 | |
|
| Holdings [Text Block] |
Table Summary
Financials |
26.0% |
Industrials |
18.8% |
Information Technology |
10.5% |
Health Care |
9.8% |
Consumer Discretionary |
8.4% |
Consumer Staples |
6.5% |
Materials |
6.3% |
Communication Services |
4.2% |
Energy |
3.7% |
Other |
5.7% | |
|
| Material Fund Change [Text Block] |
|
|
| Updated Prospectus Phone Number |
1-800-621-2550
|
|
| Updated Prospectus Web Address |
<span style="box-sizing: border-box; color: rgb(0, 0, 0); display: inline; flex-wrap: nowrap; font-size: 12px; font-weight: 400; grid-area: auto; line-height: 12px; margin: 0px; overflow: visible; text-align: left; text-align-last: auto; white-space-collapse: preserve-breaks;">dfinview.com/GoldmanSachs</span>
|
|
| C000246478 |
|
|
| Shareholder Report [Line Items] |
|
|
| Fund Name |
Goldman Sachs MarketBeta<sup style="inset: 1.5px 0px 4px; box-sizing: border-box; color: rgb(33, 120, 196); display: inline; flex-wrap: nowrap; font-size: 14px; font-weight: 700; grid-area: auto; line-height: 0px; margin: 0px; overflow: visible; position: relative; text-align: left; text-align-last: auto; white-space-collapse: preserve-breaks;">®</sup> Russell 1000 Growth Equity ETF
|
|
| Trading Symbol |
GGUS
|
|
| Security Exchange Name |
NYSEArca
|
|
| Annual or Semi-Annual Statement [Text Block] |
This annual shareholder report contains important information about Goldman Sachs MarketBeta® Russell 1000 Growth Equity ETF (the “Fund”) for the period of September 1, 2025 to August 31, 2026 (the “Period”).
|
|
| Additional Information [Text Block] |
You can find additional information about the Fund at am.gs.com or dfinview.com/GoldmanSachs. You can also request this information by contacting us at 1-800-621-2550.
|
|
| Additional Information Phone Number |
1-800-621-2550
|
|
| Expenses [Text Block] |
What were the Fund costs for the Period?Based on a hypothetical $10,000 investment.
Table Summary
Fund |
Costs of a $10,000 investment |
Costs paid as a percentage of a $10,000 investment |
GGUS |
$13 |
0.12% | |
|
| Expenses Paid, Amount |
$ 13
|
|
| Expense Ratio, Percent |
0.12%
|
|
| Factors Affecting Performance [Text Block] |
How did the Fund perform and what affected its performance?The broad U.S. equity market delivered strong gains overall, driven by resilient corporate earnings, solid labor data and expanding artificial intelligence ("AI") infrastructure. Monetary policy also played a crucial role, with the Federal Reserve implementing interest rate cuts in the last months of 2025 and then holding steady, as it weighed inflation that remained above target. Still, U.S. equities faced periodic volatility around AI monetization, returns on investment and debt issuance. Concurrently, geopolitical tensions, including maritime shipping disruptions and trade tariffs, drove commodity and energy market volatility. Corporate fundamentals cushioned pullbacks, with profit margins and earnings rather consistently beating consensus expectations across the information technology, industrials and health care sectors. Top Contributors to Performance: Information technology, health care and consumer discretionary were the sectors that contributed most positively to the Russell 1000® Growth 40 Act Daily Capped Index’s (Index) results. Positions in semiconductor company NVIDIA, information technology products giant Apple and pharmaceuticals company Eli Lilly & Co. contributed most positively to the Index’s returns during the Period (13.35%, 3.92% and 3.26% of Fund net assets as of August 31, 2026, respectively).
Top Detractors from Performance: The financials, communication services and utilities sectors detracted most from the Index’s results. Positions in social media platforms giant Meta Platforms, entertainment services provider Netflix and semiconductor company Micron Technology contributed least to the Index’s results during the Period (3.44%, 1.20% and 3.82% of Fund net assets as of August 31, 2026, respectively).
|
|
| Performance Past Does Not Indicate Future [Text] |
Performance data quoted above represents past performance. Past performance does not guarantee future results.
|
|
| Line Graph [Table Text Block] |
Table Summary
|
Shares based on NAV |
Russell 1000 Growth 40 Act Daily Capped Index (Total Return, USD, Unhedged) |
Russell 1000® Index |
11/28/23 |
$10,000 |
$10,000 |
$10,000 |
8/24 |
$12,526 |
$12,540 |
$12,505 |
8/25 |
$15,182 |
$15,209 |
$14,536 |
8/26 |
$16,880 |
$16,933 |
$17,410 |
|
|
| Performance Inception Date |
Nov. 28, 2023
|
|
| AssetsNet |
$ 477,639,679
|
|
| Advisory Fees Paid, Amount |
$ 463,258
|
|
| InvestmentCompanyPortfolioTurnover |
42.00%
|
|
| Additional Fund Statistics [Text Block] |
Table Summary
Total Net Assets as of Period End |
$477,639,679 |
# of Portfolio Holdings as of Period End |
360 |
Portfolio Turnover Rate for the Period |
42% |
Total Net Advisory Fees Paid for the Period |
$463,258 | |
|
| Holdings [Text Block] |
Table Summary
Information Technology |
50.7% |
Communication Services |
15.4% |
Consumer Discretionary |
9.2% |
Industrials |
8.9% |
Health Care |
6.5% |
Financials |
5.8% |
Consumer Staples |
1.5% |
Energy |
0.6% |
Real Estate |
0.5% |
Other |
0.9% | |
|
| Material Fund Change [Text Block] |
|
|
| Updated Prospectus Phone Number |
1-800-621-2550
|
|
| Updated Prospectus Web Address |
<span style="box-sizing: border-box; color: rgb(0, 0, 0); display: inline; flex-wrap: nowrap; font-size: 12px; font-weight: 400; grid-area: auto; line-height: 12px; margin: 0px; overflow: visible; text-align: left; text-align-last: auto; white-space-collapse: preserve-breaks;">dfinview.com/GoldmanSachs</span>
|
|
| C000246479 |
|
|
| Shareholder Report [Line Items] |
|
|
| Fund Name |
Goldman Sachs MarketBeta<sup style="inset: 1.5px 0px 4px; box-sizing: border-box; color: rgb(33, 120, 196); display: inline; flex-wrap: nowrap; font-size: 14px; font-weight: 700; grid-area: auto; line-height: 0px; margin: 0px; overflow: visible; position: relative; text-align: left; text-align-last: auto; white-space-collapse: preserve-breaks;">®</sup> Russell 1000 Value Equity ETF
|
|
| Trading Symbol |
GVUS
|
|
| Security Exchange Name |
NYSEArca
|
|
| Annual or Semi-Annual Statement [Text Block] |
This annual shareholder report contains important information about Goldman Sachs MarketBeta® Russell 1000 Value Equity ETF (the “Fund”) for the period of September 1, 2025 to August 31, 2026 (the “Period”).
|
|
| Additional Information [Text Block] |
You can find additional information about the Fund at am.gs.com or dfinview.com/GoldmanSachs. You can also request this information by contacting us at 1-800-621-2550.
|
|
| Additional Information Phone Number |
1-800-621-2550
|
|
| Expenses [Text Block] |
What were the Fund costs for the Period?Based on a hypothetical $10,000 investment.
Table Summary
Fund |
Costs of a $10,000 investment |
Costs paid as a percentage of a $10,000 investment |
GVUS |
$14 |
0.12% | |
|
| Expenses Paid, Amount |
$ 14
|
|
| Expense Ratio, Percent |
0.12%
|
|
| Factors Affecting Performance [Text Block] |
How did the Fund perform and what affected its performance?The broad U.S. equity market delivered strong gains overall, driven by resilient corporate earnings, solid labor data and expanding artificial intelligence ("AI") infrastructure. Monetary policy also played a crucial role, with the Federal Reserve implementing interest rate cuts in the last months of 2025 and then holding steady, as it weighed inflation that remained above target. Still, U.S. equities faced periodic volatility around AI monetization, returns on investment and debt issuance. Concurrently, geopolitical tensions, including maritime shipping disruptions and trade tariffs, drove commodity and energy market volatility. Corporate fundamentals cushioned pullbacks, with profit margins and earnings rather consistently beating consensus expectations across the information technology, industrials and health care sectors. Top Contributors to Performance: Information technology, health care and industrials were the sectors that contributed most positively to the Russell 1000® Value 40 Act Daily Capped Index’s (Index) results. Positions in information technology companies Micron Technology and Microsoft and communication services company Alphabet contributed most positively to the Index’s returns during the Period (0.00%1, 5.01% and 0.00%1 of Fund net assets as of August 31, 2026, respectively).
Top Detractors from Performance: No sectors detracted from the Index’s results during the Period. Positions in medical device manufacturer Boston Scientific, social media platforms giant Meta Platforms and Bitcoin treasury company and enterprise analytics software provider Strategy contributed least to the Index’s results during the Period (0.18%, 0.60% and 0.10% of Fund net assets as of August 31, 2026, respectively).
1 Some weights are 0.00% at August 31, 2026 either because those positions were taken out during the most recent rebalance given the Fund’s index construction methodology and/or because they were not components of the Index at the end of the Period. |
|
| Performance Past Does Not Indicate Future [Text] |
Performance data quoted above represents past performance. Past performance does not guarantee future results.
|
|
| Line Graph [Table Text Block] |
Table Summary
|
Shares based on NAV |
Russell 1000 Value 40 Act Daily Capped Index (Total Return, USD, Unhedged) |
Russell 1000® Index |
11/28/23 |
$10,000 |
$10,000 |
$10,000 |
8/24 |
$12,267 |
$12,288 |
$12,505 |
8/25 |
$13,392 |
$13,434 |
$14,536 |
8/26 |
$17,347 |
$17,427 |
$17,410 |
|
|
| Performance Inception Date |
Nov. 28, 2023
|
|
| AssetsNet |
$ 416,904,970
|
|
| Advisory Fees Paid, Amount |
$ 451,401
|
|
| InvestmentCompanyPortfolioTurnover |
22.00%
|
|
| Additional Fund Statistics [Text Block] |
Table Summary
Total Net Assets as of Period End |
$416,904,970 |
# of Portfolio Holdings as of Period End |
857 |
Portfolio Turnover Rate for the Period |
22% |
Total Net Advisory Fees Paid for the Period |
$451,401 | |
|
| Holdings [Text Block] |
Table Summary
Financials |
19.1% |
Information Technology |
19.1% |
Health Care |
13.0% |
Industrials |
10.7% |
Consumer Discretionary |
10.4% |
Consumer Staples |
7.1% |
Energy |
6.2% |
Materials |
3.7% |
Utilities |
3.5% |
Other |
7.0% | |
|
| Material Fund Change [Text Block] |
|
|
| Updated Prospectus Phone Number |
1-800-621-2550
|
|
| Updated Prospectus Web Address |
<span style="box-sizing: border-box; color: rgb(0, 0, 0); display: inline; flex-wrap: nowrap; font-size: 12px; font-weight: 400; grid-area: auto; line-height: 12px; margin: 0px; overflow: visible; text-align: left; text-align-last: auto; white-space-collapse: preserve-breaks;">dfinview.com/GoldmanSachs</span>
|
|
| C000214556 |
|
|
| Shareholder Report [Line Items] |
|
|
| Fund Name |
Goldman Sachs MarketBeta<sup style="inset: 1.5px 0px 4px; box-sizing: border-box; color: rgb(33, 120, 196); display: inline; flex-wrap: nowrap; font-size: 14px; font-weight: 700; grid-area: auto; line-height: 0px; margin: 0px; overflow: visible; position: relative; text-align: left; text-align-last: auto; white-space-collapse: preserve-breaks;">®</sup> U.S. Equity ETF
|
|
| Trading Symbol |
GSUS
|
|
| Security Exchange Name |
CboeBZX
|
|
| Annual or Semi-Annual Statement [Text Block] |
This annual shareholder report contains important information about Goldman Sachs MarketBeta® U.S. Equity ETF (the “Fund”) for the period of September 1, 2025 to August 31, 2026 (the “Period”).
|
|
| Additional Information [Text Block] |
You can find additional information about the Fund at am.gs.com or dfinview.com/GoldmanSachs. You can also request this information by contacting us at 1-800-621-2550.
|
|
| Additional Information Phone Number |
1-800-621-2550
|
|
| Expenses [Text Block] |
What were the Fund costs for the Period?Based on a hypothetical $10,000 investment.
Table Summary
Fund |
Costs of a $10,000 investment |
Costs paid as a percentage of a $10,000 investment |
GSUS |
$8 |
0.07% | |
|
| Expenses Paid, Amount |
$ 8
|
|
| Expense Ratio, Percent |
0.07%
|
|
| Factors Affecting Performance [Text Block] |
How did the Fund perform and what affected its performance?The broad U.S. equity market delivered strong gains overall, driven by resilient corporate earnings, solid labor data and expanding artificial intelligence ("AI") infrastructure. Monetary policy also played a crucial role, with the Federal Reserve implementing interest rate cuts in the last months of 2025 and then holding steady, as it weighed inflation that remained above target. Still, U.S. equities faced periodic volatility around AI monetization, returns on investment and debt issuance. Concurrently, geopolitical tensions, including maritime shipping disruptions and trade tariffs, drove commodity and energy market volatility. Corporate fundamentals cushioned pullbacks, with profit margins and earnings rather consistently beating consensus expectations across the information technology, industrials and health care sectors. Top Contributors to Performance: Information technology, health care and communication services were the sectors that contributed most positively to the Solactive GBS United States Large & Mid Cap Index’s (Index) results. Positions in information technology giant Apple and semiconductor companies NVIDIA and Micron Technology contributed most positively to the Index’s returns during the Period (7.02%, 7.96% and 1.67% of Fund net assets as of August 31, 2026, respectively).
Top Detractors from Performance: No sectors detracted from the Index’s results during the Period. Positions in social media platforms giant Meta Platforms, entertainment services provider Netflix and information technology company Oracle contributed least to the Index’s results during the Period (1.95%, 0.53% and 0.39% of Fund net assets as of August 31, 2026, respectively).
|
|
| Performance Past Does Not Indicate Future [Text] |
Performance data quoted above represents past performance. Past performance does not guarantee future results.
|
|
| Line Graph [Table Text Block] |
Table Summary
|
Shares based on NAV |
Solactive GBS United States Large & Mid Cap Index |
S&P 500® Index |
5/12/20 |
$10,000 |
$10,000 |
$10,000 |
8/20 |
$12,403 |
$12,410 |
$12,266 |
8/21 |
$16,322 |
$16,345 |
$16,089 |
8/22 |
$14,134 |
$14,157 |
$14,282 |
8/23 |
$16,412 |
$16,449 |
$16,559 |
8/24 |
$20,897 |
$20,960 |
$21,053 |
8/25 |
$24,377 |
$24,475 |
$24,397 |
8/26 |
$29,274 |
$29,415 |
$29,369 |
|
|
| Performance Inception Date |
May 12, 2020
|
|
| AssetsNet |
$ 3,333,907,493
|
|
| Advisory Fees Paid, Amount |
$ 2,055,784
|
|
| InvestmentCompanyPortfolioTurnover |
3.00%
|
|
| Additional Fund Statistics [Text Block] |
Table Summary
Total Net Assets as of Period End |
$3,333,907,493 |
# of Portfolio Holdings as of Period End |
406 |
Portfolio Turnover Rate for the Period |
3% |
Total Net Advisory Fees Paid for the Period |
$2,055,784 | |
|
| Holdings [Text Block] |
Table Summary
Information Technology |
38.1% |
Financials |
12.1% |
Communication Services |
10.0% |
Health Care |
9.3% |
Consumer Discretionary |
9.3% |
Industrials |
8.0% |
Consumer Staples |
4.4% |
Energy |
3.5% |
Utilities |
1.9% |
Other |
3.5% | |
|
| Material Fund Change [Text Block] |
|
|
| Updated Prospectus Phone Number |
1-800-621-2550
|
|
| Updated Prospectus Web Address |
<span style="box-sizing: border-box; color: rgb(0, 0, 0); display: inline; flex-wrap: nowrap; font-size: 12px; font-weight: 400; grid-area: auto; line-height: 12px; margin: 0px; overflow: visible; text-align: left; text-align-last: auto; white-space-collapse: preserve-breaks;">dfinview.com/GoldmanSachs</span>
|
|
| C000251207 |
|
|
| Shareholder Report [Line Items] |
|
|
| Fund Name |
Goldman Sachs Dynamic California Municipal Income ETF
|
|
| Trading Symbol |
GCAL
|
|
| Security Exchange Name |
NYSEArca
|
|
| Annual or Semi-Annual Statement [Text Block] |
This annual shareholder report contains important information about Goldman Sachs Dynamic California Municipal Income ETF (the “Fund”) for the period of September 1, 2025 to August 31, 2026 (the “Period”).
|
|
| Additional Information [Text Block] |
You can find additional information about the Fund at am.gs.com or dfinview.com/GoldmanSachs. You can also request this information by contacting us at 1-800-621-2550.
|
|
| Material Fund Change Notice [Text Block] |
This report describes changes to the Fund that occurred during the Period.
|
|
| Additional Information Phone Number |
1-800-621-2550
|
|
| Expenses [Text Block] |
What were the Fund costs for the Period?Based on a hypothetical $10,000 investment.
Table Summary
Fund |
Costs of a $10,000 investment |
Costs paid as a percentage of a $10,000 investment |
GCAL |
$31 |
0.30% | |
|
| Expenses Paid, Amount |
$ 31
|
|
| Expense Ratio, Percent |
0.30%
|
|
| Factors Affecting Performance [Text Block] |
How did the Fund perform and what affected its performance?Municipal bond performance was influenced most by heightened volatility across fixed income markets and supply/demand dynamics. The Federal Reserve lowered the target federal funds rate by 25 basis points at each of its September, October and December 2025 meetings in response to signs of weakening in the U.S. labor market. It then left rates unchanged through the end of the Period, as inflation concerns resurfaced, with oil prices rising amid increased tensions in the Middle East. Short- and intermediate-term municipal yields moved higher, with the yields on two-year, five-year and 10-year AAA municipal securities climbing 33, 53 and 18 basis points, respectively. In contrast, the yield on a 30-year AAA municipal security fell 1 basis point to 4.58%. These moves produced a flatter yield curve and placed greater pressure on the intermediate portion of the municipal bond market. Regarding supply and demand, new municipal issuance remained at record levels during the Period, while demand was generally strong, supported by positive investment flows into intermediate- and long-term strategies. Overall, municipal credit conditions remained solid. In California, revenue collections outperformed expectations, supporting upward forecast revisions and strengthening budget flexibility. Pension funding improved, while the state’s debt burden decreased. Top Contributors to Performance: The Fund posted positive returns and outperformed its benchmark, the Bloomberg Municipal Bond Quality Intermediate–California Index (Index), largely due to its combined duration and yield curve positioning. In particular, the Fund’s overweight in securities with maturities of 10 years and longer added to relative returns as the municipal yield curve flattened during the Period. The Fund benefited from its lower credit quality relative to the Index. Specifically, the Fund’s overweight in lower-rated credits and its underweight in higher-rated credits bolstered relative returns. The supportive credit backdrop and consistent demand for municipal securities pushed credit spreads tighter, helping lower-rated credits outperform higher-rated credits. Exposure to Puerto Rico credits added to the Fund’s relative performance. Bottom-up individual issue selection contributed positively to relative returns, with the Fund’s investments in general obligation bonds and revenue bonds contributing most positively. On a sector level, the Fund was helped by its holdings of industrial and electric bonds.
Top Detractors from Performance: |
|
| Performance Past Does Not Indicate Future [Text] |
Performance data quoted above represents past performance. Past performance does not guarantee future results.
|
|
| Line Graph [Table Text Block] |
Table Summary
|
Shares based on NAV |
Bloomberg Municipal Bond Quality Intermediate - California Index (Total Return, USD, Unhedged) |
Bloomberg Municipal Bond Index |
7/23/24 |
$10,000 |
$10,000 |
$10,000 |
8/24 |
$10,130 |
$10,127 |
$10,091 |
8/25 |
$10,266 |
$10,421 |
$10,099 |
8/26 |
$10,741 |
$10,615 |
$10,515 |
|
|
| Average Annual Return [Table Text Block] |
Table Summary
|
1 Year |
Since Inception |
Shares based on NAV (Commenced July 23, 2024) |
4.63% |
3.45% |
Bloomberg Municipal Bond Quality Intermediate - California Index (Total Return, USD, Unhedged) |
1.86% |
2.87% |
Bloomberg Municipal Bond Index |
4.12% |
2.41% | |
|
| Performance Inception Date |
Jul. 23, 2024
|
|
| AssetsNet |
$ 186,019,058
|
|
| Advisory Fees Paid, Amount |
$ 422,693
|
|
| InvestmentCompanyPortfolioTurnover |
22.00%
|
|
| Additional Fund Statistics [Text Block] |
Table Summary
Total Net Assets as of Period End |
$186,019,058 |
# of Portfolio Holdings as of Period End |
360 |
Portfolio Turnover Rate for the Period |
22% |
Total Net Advisory Fees Paid for the Period |
$422,693 | |
|
| Holdings [Text Block] |
Table Summary
Special Assessment |
10.9% |
Hospital |
10.5% |
School District GO |
9.1% |
Airport |
6.9% |
Water/Sewer |
6.6% |
Muni Electric |
5.5% |
Sales Tax |
5.4% |
State Housing |
5.0% |
City/County Appropriation |
4.6% |
Corporate |
4.3% |
Charter School |
4.3% |
State GO |
3.2% |
University |
3.1% |
TIF |
2.7% |
Other |
18.2% | |
|
| Material Fund Change [Text Block] |
This is a summary of certain changes to the Fund for the Period. For more complete information, you may review the Fund's next prospectus, which we expect to be available by December 29, 2026 at dfinview.com/GoldmanSachs or upon request at 1-800-621-2550. Effective December 29, 2025, investments subject to call/prepayment was added as a principal risk of the Fund. |
|
| Summary of Change Legend [Text Block] |
This is a summary of certain changes to the Fund for the Period. For more complete information, you may review the Fund's next prospectus, which we expect to be available by December 29, 2026 at dfinview.com/GoldmanSachs or upon request at 1-800-621-2550.
|
|
| Updated Prospectus Phone Number |
1-800-621-2550
|
|
| Updated Prospectus Web Address |
<span style="box-sizing: border-box; color: rgb(0, 0, 0); display: inline; flex-wrap: nowrap; font-size: 12px; font-weight: 400; grid-area: auto; line-height: 12px; margin: 0px; overflow: visible; text-align: left; text-align-last: auto; white-space-collapse: preserve-breaks;">dfinview.com/GoldmanSachs</span>
|
|
| C000251208 |
|
|
| Shareholder Report [Line Items] |
|
|
| Fund Name |
Goldman Sachs Dynamic New York Municipal Income ETF
|
|
| Trading Symbol |
GMNY
|
|
| Security Exchange Name |
NYSEArca
|
|
| Annual or Semi-Annual Statement [Text Block] |
This annual shareholder report contains important information about Goldman Sachs Dynamic New York Municipal Income ETF (the “Fund”) for the period of September 1, 2025 to August 31, 2026 (the “Period”).
|
|
| Additional Information [Text Block] |
You can find additional information about the Fund at am.gs.com or dfinview.com/GoldmanSachs. You can also request this information by contacting us at 1-800-621-2550.
|
|
| Material Fund Change Notice [Text Block] |
This report describes changes to the Fund that occurred during the Period.
|
|
| Additional Information Phone Number |
1-800-621-2550
|
|
| Expenses [Text Block] |
What were the Fund costs for the Period?Based on a hypothetical $10,000 investment.
Table Summary
Fund |
Costs of a $10,000 investment |
Costs paid as a percentage of a $10,000 investment |
GMNY |
$31 |
0.30% | |
|
| Expenses Paid, Amount |
$ 31
|
|
| Expense Ratio, Percent |
0.30%
|
|
| Factors Affecting Performance [Text Block] |
How did the Fund perform and what affected its performance?Municipal bond performance was influenced most by heightened volatility across fixed income markets and supply/demand dynamics. The Federal Reserve lowered the target federal funds rate by 25 basis points at each of its September, October and December 2025 meetings in response to signs of weakening in the U.S. labor market. It then left rates unchanged through the end of the Period, as inflation concerns resurfaced, with oil prices rising amid increased tensions in the Middle East. Short- and intermediate-term municipal yields moved higher, with the yields on two-year, five-year and 10-year AAA municipal securities climbing 33, 53 and 18 basis points, respectively. In contrast, the yield on a 30-year AAA municipal security fell 1 basis point to 4.58%. These moves produced a flatter yield curve and placed greater pressure on the intermediate portion of the municipal bond market. Regarding supply and demand, new municipal issuance remained at record levels during the Period, while demand was generally strong, supported by positive investment flows into intermediate- and long-term strategies. Overall, municipal credit conditions remained solid. In New York state, tax collections exceeded market expectations, reflecting the state’s broad economic base and resilient income growth. Strong revenue performance and fiscal 2026 results supported adoption of a balanced fiscal 2027 budget. Future budget gaps were projected, though they were within historical norms and appeared manageable through ongoing budget action. Strong pension funding, established financial management practices, and long-term forecasting remained key credit strengths for the state. Top Contributors to Performance: The Fund recorded positive returns and outperformed its benchmark, the Bloomberg Municipal Bond Quality Intermediate–New York Index (Index), largely due to its combined duration and yield curve positioning. The outperformance was driven by the Fund’s longer duration position versus the Index and its overweight in securities with maturities of 10 years and longer, as the yield curve flattened during the Period. The Fund benefited from its lower credit quality bias compared to the Index and its exposure to Puerto Rico credits. The supportive credit backdrop and consistent demand for municipal securities pushed credit spreads tighter, helping lower-rated credits outperform higher-rated credits. Bottom-up individual issue selection among general obligation bonds, income tax bonds and corporate-backed bonds bolstered the Fund’s performance.
Top Detractors from Performance: - The Fund was hurt by its positioning, as well as individual issue selection, in the hospital, education and stadium sectors.
|
|
| Performance Past Does Not Indicate Future [Text] |
Performance data quoted above represents past performance. Past performance does not guarantee future results.
|
|
| Line Graph [Table Text Block] |
Table Summary
|
Shares based on NAV |
Bloomberg Municipal Bond Quality Intermediate - New York Index (Total Return, USD, Unhedged) |
Bloomberg Municipal Bond Index |
7/23/24 |
$10,000 |
$10,000 |
$10,000 |
8/24 |
$10,104 |
$10,119 |
$10,091 |
8/25 |
$10,112 |
$10,367 |
$10,099 |
8/26 |
$10,572 |
$10,614 |
$10,515 |
|
|
| Average Annual Return [Table Text Block] |
Table Summary
|
1 Year |
Since Inception |
Shares based on NAV (Commenced July 23, 2024) |
4.55% |
2.67% |
Bloomberg Municipal Bond Quality Intermediate - New York Index (Total Return, USD, Unhedged) |
2.38% |
2.86% |
Bloomberg Municipal Bond Index |
4.12% |
2.41% | |
|
| Performance Inception Date |
Jul. 23, 2024
|
|
| AssetsNet |
$ 41,969,831
|
|
| Advisory Fees Paid, Amount |
$ 76,671
|
|
| InvestmentCompanyPortfolioTurnover |
28.00%
|
|
| Additional Fund Statistics [Text Block] |
Table Summary
Total Net Assets as of Period End |
$41,969,831 |
# of Portfolio Holdings as of Period End |
205 |
Portfolio Turnover Rate for the Period |
28% |
Total Net Advisory Fees Paid for the Period |
$76,671 | |
|
| Holdings [Text Block] |
Table Summary
University |
11.8% |
Special Tax |
8.8% |
Sales Tax |
8.1% |
Hospital |
7.0% |
City/County GO |
6.2% |
Water/Sewer |
4.5% |
Airport |
4.2% |
Stadium |
3.7% |
Transportation |
3.6% |
Muni Electric |
3.6% |
Charter School |
3.4% |
School District GO |
3.1% |
Toll |
2.7% |
Education Other |
2.7% |
Others |
23.5% | |
|
| Material Fund Change [Text Block] |
This is a summary of certain changes to the Fund for the Period. For more complete information, you may review the Fund's next prospectus, which we expect to be available by December 29, 2026 at dfinview.com/GoldmanSachs or upon request at 1-800-621-2550. Effective December 29, 2025, investments subject to call/prepayment was added as a principal risk of the Fund. The Fund's net expense ratio decreased during the Period as a result of the addition of a management fee waiver that took effect during the previous fiscal year. |
|
| Summary of Change Legend [Text Block] |
This is a summary of certain changes to the Fund for the Period. For more complete information, you may review the Fund's next prospectus, which we expect to be available by December 29, 2026 at dfinview.com/GoldmanSachs or upon request at 1-800-621-2550.
|
|
| Updated Prospectus Phone Number |
1-800-621-2550
|
|
| Updated Prospectus Web Address |
<span style="box-sizing: border-box; color: rgb(0, 0, 0); display: inline; flex-wrap: nowrap; font-size: 12px; font-weight: 400; grid-area: auto; line-height: 12px; margin: 0px; overflow: visible; text-align: left; text-align-last: auto; white-space-collapse: preserve-breaks;">dfinview.com/GoldmanSachs</span>
|
|
| C000251209 |
|
|
| Shareholder Report [Line Items] |
|
|
| Fund Name |
Goldman Sachs Municipal Income ETF
|
|
| Trading Symbol |
GMUB
|
|
| Security Exchange Name |
NYSEArca
|
|
| Annual or Semi-Annual Statement [Text Block] |
This annual shareholder report contains important information about Goldman Sachs Municipal Income ETF (the “Fund”) for the period of September 1, 2025 to August 31, 2026 (the “Period”).
|
|
| Additional Information [Text Block] |
You can find additional information about the Fund at am.gs.com or dfinview.com/GoldmanSachs. You can also request this information by contacting us at 1-800-621-2550.
|
|
| Material Fund Change Notice [Text Block] |
This report describes changes to the Fund that occurred during the Period.
|
|
| Additional Information Phone Number |
1-800-621-2550
|
|
| Expenses [Text Block] |
What were the Fund costs for the Period?Based on a hypothetical $10,000 investment.
Table Summary
Fund |
Costs of a $10,000 investment |
Costs paid as a percentage of a $10,000 investment |
GMUB |
$18 |
0.18% | |
|
| Expenses Paid, Amount |
$ 18
|
|
| Expense Ratio, Percent |
0.18%
|
|
| Factors Affecting Performance [Text Block] |
How did the Fund perform and what affected its performance?Municipal bond performance was influenced most by heightened volatility across fixed income markets and supply/demand dynamics. The Federal Reserve lowered the target federal funds rate by 25 basis points at each of its September, October and December 2025 meetings in response to signs of weakening in the U.S. labor market. It then left rates unchanged through the end of the Period, as inflation concerns resurfaced, with oil prices rising amid increased tensions in the Middle East. Short- and intermediate-term municipal yields moved higher, with the yields on two-year, five-year and 10-year AAA municipal securities climbing 33, 53 and 18 basis points, respectively. In contrast, the yield on a 30-year AAA municipal security fell 1 basis point to 4.58%. These moves produced a flatter yield curve and placed greater pressure on the intermediate portion of the municipal bond market. Regarding supply and demand, new municipal issuance remained at record levels during the Period, while demand was generally strong, supported by positive investment flows into intermediate- and long-term strategies. Overall, municipal credit conditions remained solid. Top Contributors to Performance: The Fund generated positive returns and outperformed its benchmark, the Bloomberg 1-15 Year Blend (1-17) Municipal Bond Index, largely because of its combined duration and yield curve positioning. In particular, the Fund was overweight in securities with maturities of 17 years and longer, which added to relative returns as the municipal yield curve flattened during the Period. The Fund was helped by its comparatively lower credit quality bias than that of the Index. Specifically, the Fund’s overweight in medium-grade and lower-rated credits contributed positively. The supportive credit backdrop and consistent demand for municipal securities pushed credit spreads tighter and led lower-rated credits to outperform higher-rated credits during the Period. The Fund benefited from its overweight position versus the Index in Puerto Rico credits. Bottom-up individual issue selection added to relative performance overall, led by investments in general obligation bonds and special tax bonds.
Top Detractors from Performance: |
|
| Performance Past Does Not Indicate Future [Text] |
Performance data quoted above represents past performance. Past performance does not guarantee future results.
|
|
| Line Graph [Table Text Block] |
Table Summary
|
Shares based on NAV |
Bloomberg 1-15 Year Blend (1-17) Municipal Bond Index |
Bloomberg Municipal Bond Index |
7/23/24 |
$10,000 |
$10,000 |
$10,000 |
8/24 |
$10,098 |
$10,101 |
$10,091 |
8/25 |
$10,333 |
$10,297 |
$10,099 |
8/26 |
$10,808 |
$10,594 |
$10,515 |
|
|
| Average Annual Return [Table Text Block] |
Table Summary
|
1 Year |
Since Inception |
Shares based on NAV (Commenced July 23, 2024) |
4.59% |
3.76% |
Bloomberg 1-15 Year Blend (1-17) Municipal Bond Index |
2.88% |
2.77% |
Bloomberg Municipal Bond Index |
4.12% |
2.41% | |
|
| Performance Inception Date |
Jul. 23, 2024
|
|
| AssetsNet |
$ 452,558,942
|
|
| Advisory Fees Paid, Amount |
$ 343,224
|
|
| InvestmentCompanyPortfolioTurnover |
24.00%
|
|
| Additional Fund Statistics [Text Block] |
Table Summary
Total Net Assets as of Period End |
$452,558,942 |
# of Portfolio Holdings as of Period End |
696 |
Portfolio Turnover Rate for the Period |
24% |
Total Net Advisory Fees Paid for the Period |
$343,224 | |
|
| Holdings [Text Block] |
Table Summary
Hospital |
10.9% |
School District GO |
7.5% |
Sales Tax |
6.6% |
Corporate |
6.6% |
Airport |
5.9% |
University |
5.1% |
State GO |
5.0% |
City/County GO |
4.9% |
State Housing |
4.6% |
Water/Sewer |
4.4% |
Muni Electric |
3.4% |
Special Assessment |
3.3% |
Multi-Family Housing |
3.0% |
LT Health |
2.6% |
Other |
31.3% | |
|
| Material Fund Change [Text Block] |
This is a summary of certain changes to the Fund for the Period. For more complete information, you may review the Fund's next prospectus, which we expect to be available by December 29, 2026 at dfinview.com/GoldmanSachs or upon request at 1-800-621-2550. Effective December 29, 2025, investments subject to call/prepayment and investments related to derivatives were added as principal risks of the Fund. |
|
| Summary of Change Legend [Text Block] |
This is a summary of certain changes to the Fund for the Period. For more complete information, you may review the Fund's next prospectus, which we expect to be available by December 29, 2026 at dfinview.com/GoldmanSachs or upon request at 1-800-621-2550.
|
|
| Updated Prospectus Phone Number |
1-800-621-2550
|
|
| Updated Prospectus Web Address |
<span style="box-sizing: border-box; color: rgb(0, 0, 0); display: inline; flex-wrap: nowrap; font-size: 12px; font-weight: 400; grid-area: auto; line-height: 12px; margin: 0px; overflow: visible; text-align: left; text-align-last: auto; white-space-collapse: preserve-breaks;">dfinview.com/GoldmanSachs</span>
|
|
| C000251203 |
|
|
| Shareholder Report [Line Items] |
|
|
| Fund Name |
Goldman Sachs Ultra Short Municipal Income ETF
|
|
| Trading Symbol |
GUMI
|
|
| Security Exchange Name |
NYSEArca
|
|
| Annual or Semi-Annual Statement [Text Block] |
This annual shareholder report contains important information about Goldman Sachs Ultra Short Municipal Income ETF (the “Fund”) for the period of September 1, 2025 to August 31, 2026 (the “Period”).
|
|
| Additional Information [Text Block] |
You can find additional information about the Fund at am.gs.com or dfinview.com/GoldmanSachs. You can also request this information by contacting us at 1-800-621-2550.
|
|
| Material Fund Change Notice [Text Block] |
This report describes changes to the Fund that occurred during the Period.
|
|
| Additional Information Phone Number |
1-800-621-2550
|
|
| Expenses [Text Block] |
What were the Fund costs for the Period?Based on a hypothetical $10,000 investment.
Table Summary
Fund |
Costs of a $10,000 investment |
Costs paid as a percentage of a $10,000 investment |
GUMI |
$16 |
0.16% | |
|
| Expenses Paid, Amount |
$ 16
|
|
| Expense Ratio, Percent |
0.16%
|
|
| Factors Affecting Performance [Text Block] |
How did the Fund perform and what affected its performance?Municipal bond performance was influenced most by heightened volatility across fixed income markets and supply/demand dynamics. The Federal Reserve lowered the target federal funds rate by 25 basis points at each of its September, October and December 2025 meetings in response to signs of weakening in the U.S. labor market. It then left rates unchanged through the end of the Period, as inflation concerns resurfaced, with oil prices rising amid increased tensions in the Middle East. Short- and intermediate-term municipal yields moved higher, with the yields on two-year, five-year and 10-year AAA municipal securities climbing 33, 53 and 18 basis points, respectively. In contrast, the yield on a 30-year AAA municipal security fell 1 basis point to 4.58%. These moves produced a flatter yield curve and placed greater pressure on the intermediate portion of the municipal bond market. Regarding supply and demand, new municipal issuance remained at record levels during the Period, while demand was generally strong, supported by positive investment flows into intermediate- and long-term strategies. Overall, municipal credit conditions remained solid. Top Contributors to Performance: The Fund produced positive returns and slightly outperformed its benchmark, the Bloomberg Municipal Short-Term Index (Index), mainly because of tactical duration management. As the municipal market rallied in the early months of 2026, the Fund benefited from a longer duration position than that of Index. In April, the Fund was shifted to a comparatively shorter duration position, which helped to mitigate downside risk as yields rose in April and May 2026. Within bottom-up individual issue selection, the Fund’s investments in pre-refunded bonds, specifically those with one- to three-month maturities, and state general obligations bonds added to performance.
Top Detractors from Performance: Sector allocation decisions, such as investments in housing and hospital credits, detracted from the Fund’s relative performance. The Fund was hampered by its higher credit quality bias. The supportive credit backdrop and consistent demand for municipal securities pushed credit spreads tighter, helping lower-rated credits outperform higher-rated credits.
|
|
| Performance Past Does Not Indicate Future [Text] |
Performance data quoted above represents past performance. Past performance does not guarantee future results.
|
|
| Line Graph [Table Text Block] |
Table Summary
|
Shares based on NAV |
Bloomberg Municipal Short-term Index |
Bloomberg Municipal Bond Index |
7/23/24 |
$10,000 |
$10,000 |
$10,000 |
8/24 |
$10,050 |
$10,044 |
$10,091 |
8/25 |
$10,395 |
$10,362 |
$10,099 |
8/26 |
$10,681 |
$10,638 |
$10,515 |
|
|
| Average Annual Return [Table Text Block] |
Table Summary
|
1 Year |
Since Inception |
Shares based on NAV (Commenced July 23, 2024) |
2.75% |
3.18% |
Bloomberg Municipal Short-term Index |
2.66% |
2.98% |
Bloomberg Municipal Bond Index |
4.12% |
2.41% | |
|
| Performance Inception Date |
Jul. 23, 2024
|
|
| AssetsNet |
$ 60,457,143
|
|
| Advisory Fees Paid, Amount |
$ 39,967
|
|
| InvestmentCompanyPortfolioTurnover |
261.00%
|
|
| Additional Fund Statistics [Text Block] |
Table Summary
Total Net Assets as of Period End |
$60,457,143 |
# of Portfolio Holdings as of Period End |
232 |
Portfolio Turnover Rate for the Period |
261% |
Total Net Advisory Fees Paid for the Period |
$39,967 | |
|
| Holdings [Text Block] |
Table Summary
School District GO |
11.5% |
Misc |
10.0% |
State Appropriation |
8.4% |
Hospital |
6.8% |
Transportation |
5.7% |
City/County GO |
5.6% |
Water/Sewer |
5.4% |
Airport |
5.3% |
Muni Electric |
4.6% |
University |
4.5% |
State GO |
4.4% |
Corporate |
4.2% |
School District Appropriation |
4.0% |
Sales Tax |
3.7% |
Others |
28.5% | |
|
| Material Fund Change [Text Block] |
This is a summary of certain changes to the Fund for the Period. For more complete information, you may review the Fund's next prospectus, which we expect to be available by December 29, 2026 at dfinview.com/GoldmanSachs or upon request at 1-800-621-2550. Effective December 29, 2025, investments subject to call/prepayment was added as a principal risk of the Fund. |
|
| Summary of Change Legend [Text Block] |
This is a summary of certain changes to the Fund for the Period. For more complete information, you may review the Fund's next prospectus, which we expect to be available by December 29, 2026 at dfinview.com/GoldmanSachs or upon request at 1-800-621-2550.
|
|
| Updated Prospectus Phone Number |
1-800-621-2550
|
|
| Updated Prospectus Web Address |
<span style="box-sizing: border-box; color: rgb(0, 0, 0); display: inline; flex-wrap: nowrap; font-size: 12px; font-weight: 400; grid-area: auto; line-height: 12px; margin: 0px; overflow: visible; text-align: left; text-align-last: auto; white-space-collapse: preserve-breaks;">dfinview.com/GoldmanSachs</span>
|
|
| C000260524 |
|
|
| Shareholder Report [Line Items] |
|
|
| Fund Name |
Goldman Sachs Core Bond ETF
|
|
| Trading Symbol |
GBND
|
|
| Security Exchange Name |
NYSEArca
|
|
| Annual or Semi-Annual Statement [Text Block] |
This annual shareholder report contains important information about Goldman Sachs Core Bond ETF (the “Fund”) for the period of September 1, 2025 to August 31, 2026 (the “Period”).
|
|
| Additional Information [Text Block] |
You can find additional information about the Fund at am.gs.com or dfinview.com/GoldmanSachs. You can also request this information by contacting us at 1-800-621-2550.
|
|
| Additional Information Phone Number |
1-800-621-2550
|
|
| Expenses [Text Block] |
What were the Fund costs for the Period?Based on a hypothetical $10,000 investment.
Table Summary
Fund |
Costs of a $10,000 investment |
Costs paid as a percentage of a $10,000 investment |
GBND |
$25 |
0.25% | |
|
| Expenses Paid, Amount |
$ 25
|
|
| Expense Ratio, Percent |
0.25%
|
|
| Factors Affecting Performance [Text Block] |
How did the Fund perform and what affected its performance?The performance of U.S. fixed income markets was shaped by a significant shift in Federal Reserve (Fed) monetary policy and a volatile macroeconomic backdrop. After cutting interest rates three times in late 2025, the Fed paused its easing cycle in 2026 as inflation reaccelerated, driven by tariff-related price pressures and energy supply shocks resulting from the U.S.-Iran war. Bond yields, which had fallen earlier in the Period in response to Fed easing, rose along the curve, with longer-term yields increasing significantly as investors demanded greater compensation for the risks associated with higher inflation and fiscal challenges, such as the U.S. national debt. In this environment, the performance of investment grade corporate bonds was volatile, with strong gains following the Fed’s 2025 rate cuts and subsequent weakness as inflation concerns pushed up yields. Top Contributors to Performance: The Fund generated a positive absolute return and outperformed its benchmark, the Bloomberg U.S. Aggregate Bond Index (Index). Relative outperformance was driven by the Fund’s cross-sector allocation strategy. Specifically, the Fund’s overweight positions in high yield corporate bonds, collateralized loan obligations (CLOs), commercial mortgage-backed securities and mortgage-backed securities added to relative performance. The security selection strategy overall contributed positively to relative returns. Investments in the securitized sector, especially holdings of non-agency mortgage-backed securities and CLOs, contributed positively to relative returns. Selection of corporate bonds was also advantageous, driven by positioning along the credit curve. Within investment grade corporate bonds, the Fund benefited from security selection in the financial sector. Active management of the Fund’s duration strategy added to relative returns, as interest rates fluctuated during the Period.
Top Detractors from Performance: The Fund was hurt by selection of emerging markets debt, particularly investments in Brazil. Individual issue selection among technology investment grade corporate bonds detracted from relative performance.
|
|
| Performance Past Does Not Indicate Future [Text] |
Performance data quoted above represents past performance. Past performance does not guarantee future results.
|
|
| Line Graph [Table Text Block] |
Table Summary
|
Shares based on NAV |
Bloomberg U.S. Aggregate Bond Index |
6/24/25 |
$10,000 |
$10,000 |
8/25 |
$10,153 |
$10,140 |
8/26 |
$10,350 |
$10,332 |
|
|
| Average Annual Return [Table Text Block] |
Table Summary
|
1 Year |
Since Inception |
Shares based on NAV (Commenced June 24, 2025) |
1.94% |
2.95% |
Bloomberg U.S. Aggregate Bond Index |
1.89% |
2.79% | |
|
| Performance Inception Date |
Jun. 24, 2025
|
|
| AssetsNet |
$ 528,723,107
|
|
| Advisory Fees Paid, Amount |
$ 535,331
|
|
| InvestmentCompanyPortfolioTurnover |
508.00%
|
|
| Additional Fund Statistics [Text Block] |
Table Summary
Total Net Assets as of Period End |
$528,723,107 |
# of Portfolio Holdings as of Period End |
737 |
Portfolio Turnover Rate for the Period |
508% |
Total Net Advisory Fees Paid for the Period |
$535,331 | |
|
| Holdings [Text Block] |
Table Summary
Mortgage-Backed Securities |
36.2 |
U.S. Treasury Obligations |
28.8 |
Corporate Obligations |
25.6 |
Asset- Backed Securities |
15.3 |
Collateralized Mortgage Obligations |
6.1 |
Foreign Corporate Debt |
3.0 |
Sovereign Debt Obligations |
0.9 |
Municipal Bond |
0.2 |
Other |
0.0 | |
|
| Material Fund Change [Text Block] |
|
|
| Updated Prospectus Phone Number |
1-800-621-2550
|
|
| Updated Prospectus Web Address |
<span style="box-sizing: border-box; color: rgb(0, 0, 0); display: inline; flex-wrap: nowrap; font-size: 12px; font-weight: 400; grid-area: auto; line-height: 12px; margin: 0px; overflow: visible; text-align: left; text-align-last: auto; white-space-collapse: preserve-breaks;">dfinview.com/GoldmanSachs</span>
|
|
| C000260525 |
|
|
| Shareholder Report [Line Items] |
|
|
| Fund Name |
Goldman Sachs Corporate Bond ETF
|
|
| Trading Symbol |
GIGL
|
|
| Security Exchange Name |
NYSEArca
|
|
| Annual or Semi-Annual Statement [Text Block] |
This annual shareholder report contains important information about Goldman Sachs Corporate Bond ETF (the “Fund”) for the period of September 1, 2025 to August 31, 2026 (the “Period”).
|
|
| Additional Information [Text Block] |
You can find additional information about the Fund at am.gs.com or dfinview.com/GoldmanSachs. You can also request this information by contacting us at 1-800-621-2550.
|
|
| Additional Information Phone Number |
1-800-621-2550
|
|
| Expenses [Text Block] |
What were the Fund costs for the Period?Based on a hypothetical $10,000 investment.
Table Summary
Fund |
Costs of a $10,000 investment |
Costs paid as a percentage of a $10,000 investment |
GIGL |
$29 |
0.29% | |
|
| Expenses Paid, Amount |
$ 29
|
|
| Expense Ratio, Percent |
0.29%
|
|
| Factors Affecting Performance [Text Block] |
How did the Fund perform and what affected its performance?The performance of U.S. fixed income markets was shaped by a significant shift in Federal Reserve (Fed) monetary policy and a volatile macroeconomic backdrop. After cutting interest rates three times in late 2025, the Fed paused its easing cycle in 2026 as inflation reaccelerated, driven by tariff-related price pressures and energy supply shocks resulting from the U.S.-Iran war. Bond yields, which had fallen earlier in the Period in response to Fed easing, rose along the curve, with longer-term yields increasing significantly as investors demanded greater compensation for the risks associated with higher inflation and fiscal challenges, such as the U.S. national debt. In this environment, the performance of investment grade corporate bonds was volatile, with strong gains following the Fed’s 2025 rate cuts and subsequent weakness as inflation concerns pushed up yields. Top Contributors to Performance: The Fund posted positive absolute returns and outperformed the Bloomberg U.S. Bond Credit Index (Index), with its credit selection strategy adding most to relative returns. Overall, income generation offset the impact of a decline in bond prices during the Period, as yields on U.S. investment grade corporate bonds reached levels not seen in more than two years. The Fund’s corporate yield curve positioning, wherein it held more short- and intermediate-term maturities and fewer long-term maturities than the Index, contributed positively to relative performance. Longer-term corporate bonds came under pressure due to a surge in supply, driven by artificial intelligence-related capital spending, and an increase in 30-year U.S. Treasury yields. The Fund benefited from its lower credit quality bias, as BBB-rated credits outperformed higher quality credits. Strong corporate fundamentals, healthy earnings growth and a benign default backdrop supported demand for down-quality credits. Within cross-sector positioning, the Fund was helped by its greater risk exposure to high yield corporate bonds than the Index. This was particularly beneficial in April 2026, when the high yield corporate bond market recorded its strongest monthly performance since June 2025. The Fund’s investments in credit derivatives bolstered relative returns, as synthetic securities outperformed cash bonds during the Period. Earnings results were broadly positive across sectors, providing a solid fundamental backdrop for corporate bond issuers. Regarding individual issue selection, the Fund benefited from investments in select financial credits.
Top Detractors from Performance: The Fund was hurt by an overweight position versus the Index in investment grade corporate bonds, as the start of the U.S.-Iran war drove credit spread widening during February and March 2026. Among sectors, the Fund was hampered by its underweight position in energy and its overweight position in technology. Issuer selection within industrials and utilities, as well as among agency securities, limited the Fund’s relative performance. Active management of the Fund’s duration strategy detracted slightly from relative returns.
|
|
| Performance Past Does Not Indicate Future [Text] |
Performance data quoted above represents past performance. Past performance does not guarantee future results.
|
|
| Line Graph [Table Text Block] |
Table Summary
|
Shares based on NAV |
Bloomberg U.S. Credit Bond Index |
Bloomberg U.S. Aggregate Bond Index |
6/24/25 |
$10,000 |
$10,000 |
$10,000 |
8/25 |
$10,163 |
$10,163 |
$10,140 |
8/26 |
$10,377 |
$10,364 |
$10,332 |
|
|
| Average Annual Return [Table Text Block] |
Table Summary
|
1 Year |
Since Inception |
Shares based on NAV (Commenced June 24, 2025) |
2.11% |
3.18% |
Bloomberg U.S. Credit Bond Index |
1.98% |
3.06% |
Bloomberg U.S. Aggregate Bond Index |
1.89% |
2.79% | |
|
| Performance Inception Date |
Jun. 24, 2025
|
|
| AssetsNet |
$ 229,293,550
|
|
| Advisory Fees Paid, Amount |
$ 269,402
|
|
| InvestmentCompanyPortfolioTurnover |
41.00%
|
|
| Additional Fund Statistics [Text Block] |
Table Summary
Total Net Assets as of Period End |
$229,293,550 |
# of Portfolio Holdings as of Period End |
431 |
Portfolio Turnover Rate for the Period |
41% |
Total Net Advisory Fees Paid for the Period |
$269,402 | |
|
| Holdings [Text Block] |
Table Summary
Banks |
21.2 |
Consumer Cyclical |
13.1 |
Technology |
6.9 |
Software |
6.3 |
Healthcare |
6.3 |
REITs and Real Estate |
5.8 |
Consumer Noncyclical |
5.4 |
Financial Company |
5.1 |
Sovereign |
3.2 |
Other |
22.6 | |
|
| Material Fund Change [Text Block] |
|
|
| Updated Prospectus Phone Number |
1-800-621-2550
|
|
| Updated Prospectus Web Address |
<span style="box-sizing: border-box; color: rgb(0, 0, 0); display: inline; flex-wrap: nowrap; font-size: 12px; font-weight: 400; grid-area: auto; line-height: 12px; margin: 0px; overflow: visible; text-align: left; text-align-last: auto; white-space-collapse: preserve-breaks;">dfinview.com/GoldmanSachs</span>
|
|
| C000207250 |
|
|
| Shareholder Report [Line Items] |
|
|
| Fund Name |
Goldman Sachs Ultra Short Bond ETF
|
|
| Trading Symbol |
GSST
|
|
| Security Exchange Name |
CboeBZX
|
|
| Annual or Semi-Annual Statement [Text Block] |
This annual shareholder report contains important information about Goldman Sachs Ultra Short Bond ETF (the “Fund”) for the period of September 1, 2025 to August 31, 2026 (the "Period").
|
|
| Additional Information [Text Block] |
You can find additional information about the Fund at am.gs.com or dfinview.com/GoldmanSachs. You can also request this information by contacting us at 1-800-621-2550.
|
|
| Additional Information Phone Number |
1-800-621-2550
|
|
| Expenses [Text Block] |
What were the Fund costs for the Period?Based on a hypothetical $10,000 investment.
Table Summary
Fund |
Costs of a $10,000 investment |
Costs paid as a percentage of a $10,000 investment |
GSST |
$16 |
0.16% | |
|
| Expenses Paid, Amount |
$ 16
|
|
| Expense Ratio, Percent |
0.16%
|
|
| Factors Affecting Performance [Text Block] |
How did the Fund perform and what affected its performance?The performance of U.S. fixed income markets was shaped by a significant shift in Federal Reserve (Fed) monetary policy and a volatile macroeconomic backdrop. After three consecutive interest rate cuts in late 2025, the Fed paused its easing cycle in 2026 as inflation reaccelerated, driven by tariff-related price pressures and energy supply shocks resulting from the U.S.-Iran war. Intermediate- and longer-term U.S. Treasury yields, which had fallen early in the Period in response to Fed easing, rose as investors demanded greater compensation for the risks associated with higher inflation and fiscal challenges, such as the rising U.S. national debt. In this environment, short-term yields were volatile, with strong gains after the Fed’s 2025 rate cuts and subsequent weakness as inflation concerns pushed yields higher. Top Contributors to Performance: The Fund produced a positive absolute return and outperformed the FTSE Three-Month U.S. Treasury Bill Index (Index), with the cross-sector allocation strategy contributing positively to relative returns. In particular, the Fund benefited from an overweight allocation in investment grade corporate bonds. Despite inflation fears, geopolitical concerns and interest rate volatility, investment grade credit was resilient throughout the Period, supported by solid corporate fundamentals and strong new issuance. Overweight allocations to collateralized loan obligations and commercial mortgage-backed securities added to relative performance. The selection strategy, led by investments among investment grade corporate bonds, bolstered relative returns. Selection of collateralized loan obligations and commercial mortgage-backed securities was also advantageous.
Top Detractors from Performance: |
|
| Performance Past Does Not Indicate Future [Text] |
Performance data quoted above represents past performance. Past performance does not guarantee future results.
|
|
| Line Graph [Table Text Block] |
Table Summary
|
Shares based on NAV |
FTSE Three-Month U.S. Treasury Bill Index |
Bloomberg U.S. Aggregate Bond Index |
4/15/19 |
$10,000 |
$10,000 |
$10,000 |
8/19 |
$10,175 |
$10,090 |
$10,637 |
8/20 |
$10,407 |
$10,209 |
$11,325 |
8/21 |
$10,468 |
$10,215 |
$11,316 |
8/22 |
$10,408 |
$10,260 |
$10,013 |
8/23 |
$10,850 |
$10,716 |
$9,893 |
8/24 |
$11,579 |
$11,321 |
$10,616 |
8/25 |
$12,188 |
$11,852 |
$10,949 |
8/26 |
$12,695 |
$12,320 |
$11,156 |
|
|
| Average Annual Return [Table Text Block] |
Table Summary
|
1 Year |
5 Years |
Since Inception |
Shares based on NAV (Commenced April 15, 2019) |
4.16% |
3.93% |
3.28% |
FTSE Three-Month U.S. Treasury Bill Index |
3.95% |
3.82% |
2.87% |
Bloomberg U.S. Aggregate Bond Index |
1.89% |
-0.29% |
1.49% | |
|
| Performance Inception Date |
Apr. 15, 2019
|
|
| AssetsNet |
$ 1,635,285,344
|
|
| Advisory Fees Paid, Amount |
$ 2,108,946
|
|
| InvestmentCompanyPortfolioTurnover |
78.00%
|
|
| Additional Fund Statistics [Text Block] |
Table Summary
Total Net Assets as of Period End |
$1,635,285,344 |
# of Portfolio Holdings as of Period End |
385 |
Portfolio Turnover Rate for the Period |
78% |
Total Net Advisory Fees Paid for the Period |
$2,108,946 | |
|
| Holdings [Text Block] |
Table Summary
Corporate Obligations |
29.4 |
Foreign Corporate Debt |
26.8 |
Asset- Backed Securities |
15.7 |
Commercial Paper |
14.0 |
Mortgage-Backed Securities |
5.0 |
Certificate of Deposit |
4.0 |
U.S. Treasury Notes |
2.4 |
U.S. Treasury Bills |
2.0 |
U.S. Government Agency Obligations |
0.8 |
Other |
2.4 | |
|
| Material Fund Change [Text Block] |
|
|
| Updated Prospectus Phone Number |
1-800-621-2550
|
|
| Updated Prospectus Web Address |
<span style="box-sizing: border-box; color: rgb(0, 0, 0); display: inline; flex-wrap: nowrap; font-size: 12px; font-weight: 400; grid-area: auto; line-height: 12px; margin: 0px; overflow: visible; text-align: left; text-align-last: auto; white-space-collapse: preserve-breaks;">dfinview.com/GoldmanSachs</span>
|
|
| C000198662 |
|
|
| Shareholder Report [Line Items] |
|
|
| Fund Name |
Goldman Sachs JUST U.S. Large Cap Equity ETF
|
|
| Trading Symbol |
JUST
|
|
| Security Exchange Name |
NYSEArca
|
|
| Annual or Semi-Annual Statement [Text Block] |
This annual shareholder report contains important information about Goldman Sachs JUST U.S. Large Cap Equity ETF (the “Fund”) for the period of September 1, 2025 to August 31, 2026 (the “Period”).
|
|
| Additional Information [Text Block] |
You can find additional information about the Fund at am.gs.com or dfinview.com/GoldmanSachs. You can also request this information by contacting us at 1-800-621-2550.
|
|
| Additional Information Phone Number |
1-800-621-2550
|
|
| Expenses [Text Block] |
What were the Fund costs for the Period?Based on a hypothetical $10,000 investment.
Table Summary
Fund |
Costs of a $10,000 investment |
Costs paid as a percentage of a $10,000 investment |
JUST |
$22 |
0.20% | |
|
| Expenses Paid, Amount |
$ 22
|
|
| Expense Ratio, Percent |
0.20%
|
|
| Factors Affecting Performance [Text Block] |
How did the Fund perform and what affected its performance?The broad U.S. equity market delivered strong gains overall, driven by resilient corporate earnings, solid labor data and expanding artificial intelligence (AI) infrastructure. Monetary policy also played a crucial role, with the Federal Reserve implementing interest rate cuts in the last months of 2025 and then holding steady, as it weighed inflation that remained above target. Still, U.S. equities faced periodic volatility around AI monetization, returns on investment and debt issuance. Concurrently, geopolitical tensions, including maritime shipping disruptions and trade tariffs, drove commodity and energy market volatility. Corporate fundamentals cushioned pullbacks, with profit margins and earnings rather consistently beating consensus expectations across the information technology, industrials and health care sectors. Top Contributors to Performance: Relative to the Russell 1000® Index, the information technology, financials and communication services sectors contributed most positively to the JUST U.S. Large Cap Diversified Index’s (Index) results. Relative to the Russell 1000® Index, positions in information technology giants NVIDIA and Apple and communication services company Alphabet contributed most positively to the Index’s results during the Period (8.38%, 7.40% and 5.79% of Fund net assets as of August 31, 2026, respectively).
Top Detractors from Performance: Relative to the Russell 1000® Index, the real estate sector was the only sector to detract from the Index’s results during the Period. Relative to the Russell 1000® Index, positions in information technology companies Sandisk and Crowdstrike Holdings and electric vehicle maker Tesla detracted most from the Index’s results during the Period (0.00%1, 0.00%1 and 0.00%1 of Fund net assets as of August 31, 2026, respectively).
1Some weights are 0.00% at August 31, 2026 either because those positions were eliminated during the most recent rebalance given the Index construction methodology or were not held at all during the Period as they did not meet the Fund’s investment criteria. |
|
| Performance Past Does Not Indicate Future [Text] |
Performance data quoted above represents past performance. Past performance does not guarantee future results.
|
|
| Line Graph [Table Text Block] |
Table Summary
|
Shares based on NAV |
JUST U.S. Large Cap Diversified Index |
Russell 1000® Index |
6/7/18 |
$10,000 |
$10,000 |
$10,000 |
8/18 |
$10,511 |
$10,517 |
$10,511 |
8/19 |
$10,728 |
$10,750 |
$10,773 |
8/20 |
$13,233 |
$13,309 |
$13,197 |
8/21 |
$17,284 |
$17,422 |
$17,452 |
8/22 |
$15,119 |
$15,267 |
$15,191 |
8/23 |
$17,386 |
$17,587 |
$17,530 |
8/24 |
$22,128 |
$22,434 |
$22,193 |
8/25 |
$25,411 |
$25,808 |
$25,797 |
8/26 |
$30,898 |
$31,450 |
$30,897 |
|
|
| Performance Inception Date |
Jun. 07, 2018
|
|
| AssetsNet |
$ 570,161,532
|
|
| Advisory Fees Paid, Amount |
$ 1,014,751
|
|
| InvestmentCompanyPortfolioTurnover |
8.00%
|
|
| Additional Fund Statistics [Text Block] |
Table Summary
Total Net Assets as of Period End |
$570,161,532 |
# of Portfolio Holdings as of Period End |
461 |
Portfolio Turnover Rate for the Period |
8% |
Total Net Advisory Fees Paid for the Period |
$1,014,751 | |
|
| Holdings [Text Block] |
Table Summary
Information Technology |
37.8% |
Financials |
13.0% |
Health Care |
9.3% |
Consumer Discretionary |
9.0% |
Industrials |
8.4% |
Communication Services |
7.6% |
Consumer Staples |
4.9% |
Energy |
3.7% |
Materials |
2.1% |
Other |
4.0% | |
|
| Material Fund Change [Text Block] |
|
|
| Updated Prospectus Phone Number |
1-800-621-2550
|
|
| Updated Prospectus Web Address |
<span style="box-sizing: border-box; color: rgb(0, 0, 0); display: inline; flex-wrap: nowrap; font-size: 12px; font-weight: 400; grid-area: auto; line-height: 12px; margin: 0px; overflow: visible; text-align: left; text-align-last: auto; white-space-collapse: preserve-breaks;">dfinview.com/GoldmanSachs</span>
|
|
| C000233873 |
|
|
| Shareholder Report [Line Items] |
|
|
| Fund Name |
Goldman Sachs ActiveBeta<sup style="inset: 1.5px 0px 4px; box-sizing: border-box; color: rgb(33, 120, 196); display: inline; flex-wrap: nowrap; font-size: 14px; font-weight: 700; grid-area: auto; line-height: 0px; margin: 0px; overflow: visible; position: relative; text-align: left; text-align-last: auto; white-space-collapse: preserve-breaks;">®</sup> World Equity ETF
|
|
| Trading Symbol |
GSWO
|
|
| Security Exchange Name |
CboeBZX
|
|
| Annual or Semi-Annual Statement [Text Block] |
This annual shareholder report contains important information about Goldman Sachs ActiveBeta® World Equity ETF (the “Fund”) (formerly, Goldman Sachs ActiveBeta® World Low Vol Plus Equity ETF) for the period of September 1, 2025 to August 31, 2026 (the “Period”).
|
|
| Additional Information [Text Block] |
You can find additional information about the Fund at am.gs.com or dfinview.com/GoldmanSachs. You can also request this information by contacting us at 1-800-621-2550.
|
|
| Material Fund Change Notice [Text Block] |
This report describes changes to the Fund that occurred during the Period.
|
|
| Additional Information Phone Number |
1-800-621-2550
|
|
| Expenses [Text Block] |
What were the Fund costs for the Period?Based on a hypothetical $10,000 investment.
Table Summary
Fund |
Costs of a $10,000 investment |
Costs paid as a percentage of a $10,000 investment |
GSWO |
$21 |
0.19% | |
|
| Expenses Paid, Amount |
$ 21
|
|
| Expense Ratio, Percent |
0.19%
|
|
| Factors Affecting Performance [Text Block] |
How did the Fund perform and what affected its performance?The broad global equity market posted strong positive returns, but individual country markets experienced varied performance, influenced by diverse economic conditions, central bank policies and political and geopolitical developments. Internationally, performance was supported by a broad-based economic recovery in developed markets, a softening U.S. dollar, an artificial intelligence (AI) investment theme that moved beyond technology into the wider industrial chain, and resilient corporate earnings. In the U.S., resilient corporate earnings, solid labor data and expanding AI infrastructure drove gains most. Top Contributors to Performance: During the initial part of the Period (i.e., September 1, 2025 through February 3, 2026), Goldman Sachs ActiveBeta® World Low Vol Plus Equity Index (Index) constituents in the health care, real estate and consumer staples sectors contributed most positively to the Index’s results relative to the Solactive GBS Developed Markets Large & Mid Cap Index (Solactive Index). Index constituents in France, Singapore and Sweden contributed most positively. The Fund’s Value and Momentum Underlying Factors contributed positively. Underweight positions in software giant Microsoft and entertainment services provider Netflix and an overweight position in retailing behemoth Walmart—each a U.S.-based company—contributed most positively (2.42%, 0.11% and 1.77% of Fund net assets as of February 3, 2026, respectively). During the latter part of the Period (i.e., February 4, 2026 through August 31, 2026), Goldman Sachs ActiveBeta® World Equity Index (World Equity Index) constituents in the industrials, utilities and health care sectors contributed most positively to the World Equity Index’s results relative to the Solactive Index. World Equity Index constituents in Canada, Japan and the Netherlands contributed most positively. The Fund’s Quality Underlying Factor contributed positively. Overweight positions in U.S. information technology company Sandisk, Japanese industrials firm Recruit Holdings and Japanese semiconductor manufacturer Kioxia Holdings contributed most positively (0.26%, 0.31% and 0.15% of Fund net assets as of August 31, 2026, respectively).
Top Detractors from Performance: During the initial part of the Period, Index constituents in the information technology, industrials and materials sectors detracted most from the Index’s results relative to the Solactive Index. Index constituents in the U.S., the U.K. and the Netherlands detracted most. The Fund’s Low Volatility and Quality Underlying Factors detracted. Underweight positions in U.S.-based communication services company Alphabet and Netherlands-based information technology company ASML Holding and holding no position in U.S.-based information technology company Micron Technology detracted most (1.33%, 0.03% and 0.00%1 of Fund net assets as of February 3, 2026, respectively). During the latter part of the Period, World Equity Index constituents in the information technology, consumer staples and consumer discretionary sectors detracted from the World Equity Index’s results relative to the Solactive Index. World Equity Index constituents in Israel, Australia and Switzerland detracted most. The Fund’s Momentum and Value Underlying Factors detracted. Underweight positions in U.S. information technology company Palo Alto Networks and Japanese information technology company Murata Manufacturing and an overweight position in U.S. apparel retailer Lululemon Athletica detracted most (0.32%, 0.09% and 0.00%1 of Fund net assets as of August 31, 2026, respectively).
1Some weights are 0.00% at August 31, 2026 either because those positions were taken out during the most recent rebalance given the Fund’s index construction methodology or because they were not components of the Index during the Period. |
|
| Performance Past Does Not Indicate Future [Text] |
Performance data quoted above represents past performance. Past performance does not guarantee future results.
|
|
| Line Graph [Table Text Block] |
Table Summary
|
Shares based on NAV |
Goldman Sachs ActiveBeta® World Equity Index* |
Goldman Sachs ActiveBeta® World Low Vol Plus Equity Index |
Solactive GBS Developed Markets Large & Mid Cap Index |
MSCI ACWI Index |
3/15/22 |
$10,000 |
$10,000 |
$10,000 |
$10,000 |
$10,000 |
8/22 |
$9,435 |
$9,421 |
$9,421 |
$9,245 |
$9,314 |
8/23 |
$10,487 |
$10,449 |
$10,449 |
$10,697 |
$10,613 |
8/24 |
$13,027 |
$12,953 |
$12,953 |
$13,317 |
$13,101 |
8/25 |
$14,853 |
$14,748 |
$14,748 |
$15,437 |
$15,170 |
8/26 |
$17,561 |
$17,144 |
$16,841 |
$18,612 |
$18,560 |
|
|
| Performance Inception Date |
Mar. 15, 2022
|
|
| AssetsNet |
$ 1,796,964,515
|
|
| Advisory Fees Paid, Amount |
$ 2,974,713
|
|
| InvestmentCompanyPortfolioTurnover |
60.00%
|
|
| Additional Fund Statistics [Text Block] |
Table Summary
Total Net Assets as of Period End |
$1,796,964,515 |
# of Portfolio Holdings as of Period End |
740 |
Portfolio Turnover Rate for the Period |
60% |
Total Net Advisory Fees Paid for the Period |
$2,974,713 | |
|
| Holdings [Text Block] |
Table Summary
Information Technology |
31.0% |
Financials |
16.6% |
Industrials |
10.2% |
Consumer Discretionary |
10.0% |
Health Care |
9.6% |
Communication Services |
8.0% |
Consumer Staples |
5.9% |
Energy |
4.0% |
Materials |
2.6% |
Other |
1.9% | |
|
| Material Fund Change [Text Block] |
This is a summary of certain changes to the Fund for the Period. For more complete information, you may review the Fund's next prospectus, which we expect to be available by December 29, 2026 at dfinview.com/GoldmanSachs or upon request at 1-800-621-2550. Effective February 4, 2026, the Fund changed its name from the Goldman Sachs ActiveBeta® World Low Vol Plus Equity ETF to the Goldman Sachs ActiveBeta® World Equity ETF. The Fund also changed its investment objective and principal investment strategy and the Fund reduced its contractual management fee rate from 0.25% to 0.15% of the Fund’s average daily net assets. The Fund's net expense ratio decreased during the Period as a result of a reduction in unitary fees. Effective December 29, 2025, investments related to low volatility were removed as a principal risk of the Fund. |
|
| Summary of Change Legend [Text Block] |
This is a summary of certain changes to the Fund for the Period. For more complete information, you may review the Fund's next prospectus, which we expect to be available by December 29, 2026 at dfinview.com/GoldmanSachs or upon request at 1-800-621-2550.
|
|
| Updated Prospectus Phone Number |
1-800-621-2550
|
|
| Updated Prospectus Web Address |
<span style="box-sizing: border-box; color: rgb(0, 0, 0); display: inline; flex-wrap: nowrap; font-size: 12px; font-weight: 400; grid-area: auto; line-height: 12px; margin: 0px; overflow: visible; text-align: left; text-align-last: auto; white-space-collapse: preserve-breaks;">dfinview.com/GoldmanSachs</span>
|
|
| C000263543 |
|
|
| Shareholder Report [Line Items] |
|
|
| Fund Name |
Goldman Sachs Enhanced U.S. Equity ETF
|
|
| Trading Symbol |
GUSE
|
|
| Security Exchange Name |
NASDAQ
|
|
| Annual or Semi-Annual Statement [Text Block] |
This annual shareholder report contains important information about Goldman Sachs Enhanced U.S. Equity ETF (the “Fund”) for the period of September 1, 2025 to August 31, 2026 (the “Period”).
|
|
| Additional Information [Text Block] |
You can find additional information about the Fund at am.gs.com or dfinview.com/GoldmanSachs. You can also request this information by contacting us at 1-800-621-2550.
|
|
| Material Fund Change Notice [Text Block] |
This report describes changes to the Fund that occurred during the Period.
|
|
| Additional Information Phone Number |
1-800-621-2550
|
|
| Expenses [Text Block] |
What were the Fund costs for the Period?Based on a hypothetical $10,000 investment.
Table Summary
Fund |
Costs of a $10,000 investment |
Costs paid as a percentage of a $10,000 investment |
GUSE |
$41 |
0.37% | |
|
| Expenses Paid, Amount |
$ 41
|
|
| Expense Ratio, Percent |
0.37%
|
|
| Factors Affecting Performance [Text Block] |
How did the Fund perform and what affected its performance?The broad U.S. equity market delivered strong gains overall, driven by resilient corporate earnings, solid labor data and expanding artificial intelligence (AI) infrastructure. Monetary policy also played a crucial role, with the Federal Reserve implementing interest rate cuts in the last months of 2025 and then holding steady, as it weighed inflation that remained above target. Still, U.S. equities faced periodic volatility around AI monetization, returns on investment and debt issuance. Concurrently, geopolitical tensions, including maritime shipping disruptions and trade tariffs, drove commodity and energy market volatility. Corporate fundamentals cushioned pullbacks, with profit margins and earnings rather consistently beating consensus expectations across the information technology, industrials and health care sectors. Top Contributors to Performance: Stock selection in the information technology, industrials and financials sectors contributed positively to the Fund’s relative results. An overweight in semiconductor company Micron Technology added value, with its stock rising primarily on its robust financial performance. The company surpassed market expectations with strong earnings, fueled by ongoing demand for its specialized memory products, which are critical components for AI applications. An overweight in Western Digital, a data storage device manufacturer, contributed positively. The company benefited from ongoing strong demand dynamics within its cloud segment as well as increasing needs for AI-driven data storage. An overweight in technology company Dell Technologies contributed positively due to its strong financial results, driven by robust demand for AI servers. Additionally, its management issued constructive guidance, reinforcing investor confidence in the durability of the company’s growth trajectory. These three positions accounted for 1.75%, 0.35% and 0.35% of Fund net assets as of August 31, 2026, respectively.
Top Detractors from Performance: Stock selection overall detracted most from the Fund’s relative results. Sector allocation decisions as a whole also dampened results, albeit modestly. Stock selection in the communication services, health care and real estate sectors detracted from the Fund’s relative results. The Fund’s top detractor was an overweight in semiconductor bellwether Intel. Its stock came under pressure amid concerns around market share losses in core central processing unit markets, execution risk on its foundry buildout and elevated capital spending weighing on margins and free cash flow. Investor caution around the pace of its process technology roadmap, competitive pressure from rivals and near-term earnings dilution also weighed on sentiment. An overweight in financial technology and business software company Intuit detracted. Its stock came under pressure amid concerns around decelerating growth in its consumer tax and small business segments, elevated spending on AI initiatives and valuation sensitivity in a higher interest rate environment. Investor caution around competitive dynamics, customer retention and the pace of monetization across its platform further weighed on sentiment. An overweight in medical device manufacturer Boston Scientific hurt. Its stock was weak amid concerns around decelerating growth, competitive pressures within its core cardiovascular and MedSurg franchises and a more demanding valuation following a strong prior run. As our conviction in its risk/reward profile moderated, we exited the Fund’s position. These three positions accounted for 0.77%, 0.00%1 and 0.00%1 of Fund net assets as of August 31, 2026, respectively.
1 Some weights are 0.00% at August 31, 2026 either because those positions were eliminated during the most recent rebalance given the Index construction methodology or were not held at all during the annual period as they did not meet the Fund’s investment criteria. |
|
| Performance Past Does Not Indicate Future [Text] |
Performance data quoted above represents past performance. Past performance does not guarantee future results.
|
|
| Line Graph [Table Text Block] |
Table Summary
|
Shares based on NAV |
S&P 500® Index |
9/1/16 |
$10,000 |
$10,000 |
8/17 |
$12,061 |
$11,623 |
8/18 |
$14,388 |
$13,908 |
8/19 |
$14,887 |
$14,314 |
8/20 |
$18,251 |
$17,455 |
8/21 |
$23,840 |
$22,895 |
8/22 |
$21,194 |
$20,324 |
8/23 |
$25,072 |
$23,564 |
8/24 |
$31,455 |
$29,959 |
8/25 |
$35,544 |
$34,717 |
8/26 |
$42,401 |
$41,792 |
|
|
| Performance Inception Date |
Jan. 31, 2008
|
|
| AssetsNet |
$ 359,283,800
|
|
| Advisory Fees Paid, Amount |
$ 1,265,951
|
|
| InvestmentCompanyPortfolioTurnover |
82.00%
|
|
| Additional Fund Statistics [Text Block] |
Table Summary
Total Net Assets as of Period End |
$359,283,800 |
# of Portfolio Holdings as of Period End |
121 |
Portfolio Turnover Rate for the Period |
82% |
Total Net Advisory Fees Paid for the Period |
$1,265,951 | |
|
| Holdings [Text Block] |
Table Summary
Information Technology |
36.2% |
Financials |
13.1% |
Communication Services |
9.8% |
Consumer Discretionary |
9.0% |
Health Care |
8.9% |
Industrials |
8.2% |
Energy |
3.8% |
Consumer Staples |
3.6% |
Materials |
2.3% |
Other |
5.0% | |
|
| Material Fund Change [Text Block] |
This is a summary of certain changes to the Fund for the Period. For more complete information, you may review the Fund's next prospectus, which we expect to be available by December 29, 2026 at dfinview.com/GoldmanSachs or upon request at 1-800-621-2550. Effective November 14, 2025, the Fund was converted from a mutual fund to an ETF and adopted a unitary fee structure. The Fund's net expense ratio decreased during the Period as a result. |
|
| Summary of Change Legend [Text Block] |
This is a summary of certain changes to the Fund for the Period. For more complete information, you may review the Fund's next prospectus, which we expect to be available by December 29, 2026 at dfinview.com/GoldmanSachs or upon request at 1-800-621-2550.
|
|
| Updated Prospectus Phone Number |
1-800-621-2550
|
|
| Updated Prospectus Web Address |
<span style="box-sizing: border-box; color: rgb(0, 0, 0); display: inline; flex-wrap: nowrap; font-size: 12px; font-weight: 400; grid-area: auto; line-height: 12px; margin: 0px; overflow: visible; text-align: left; text-align-last: auto; white-space-collapse: preserve-breaks;">dfinview.com/GoldmanSachs</span>
|
|
| C000263544 |
|
|
| Shareholder Report [Line Items] |
|
|
| Fund Name |
Goldman Sachs Growth Opportunities ETF
|
|
| Trading Symbol |
GSGO
|
|
| Security Exchange Name |
NASDAQ
|
|
| Annual or Semi-Annual Statement [Text Block] |
This annual shareholder report contains important information about Goldman Sachs Growth Opportunities ETF (the “Fund”) for the period of September 1, 2025 to August 31, 2026 (the “Period”).
|
|
| Additional Information [Text Block] |
You can find additional information about the Fund at am.gs.com or dfinview.com/GoldmanSachs. You can also request this information by contacting us at 1-800-621-2550.
|
|
| Material Fund Change Notice [Text Block] |
This report describes changes to the Fund that occurred during the Period.
|
|
| Additional Information Phone Number |
1-800-621-2550
|
|
| Expenses [Text Block] |
What were the Fund costs for the Period?Based on a hypothetical $10,000 investment.
Table Summary
Fund |
Costs of a $10,000 investment |
Costs paid as a percentage of a $10,000 investment |
GSGO |
$56 |
0.52% | |
|
| Expenses Paid, Amount |
$ 56
|
|
| Expense Ratio, Percent |
0.52%
|
|
| Factors Affecting Performance [Text Block] |
How did the Fund perform and what affected its performance?The broad U.S. equity market delivered strong gains overall, driven by resilient corporate earnings, solid labor data and expanding artificial intelligence (AI) infrastructure. Monetary policy also played a crucial role, with the Federal Reserve implementing interest rate cuts in the last months of 2025 and then holding steady, as it weighed inflation that remained above target. Still, U.S. equities faced periodic volatility around AI monetization, returns on investment and debt issuance. Concurrently, geopolitical tensions, including maritime shipping disruptions and trade tariffs, drove commodity and energy market volatility. Corporate fundamentals cushioned pullbacks, with profit margins and earnings rather consistently beating consensus expectations across the information technology, industrials and health care sectors. Top Contributors to Performance: Stock selection overall contributed most positively to the Fund’s relative results. Sector allocation decisions as a whole also boosted results, albeit modestly. Stock selection in the information technology, industrials and consumer discretionary sectors contributed positively to the Fund’s relative results. An overweight in semiconductor company Micron Technology added value, with its stock rising primarily on its robust financial performance. The company surpassed market expectations with strong earnings, fueled by ongoing demand for its specialized memory products, which are critical components for AI applications. An overweight in semiconductor company Marvell Technology proved beneficial, largely on the back of strong execution against its AI-driven data center opportunity and a broadening set of growth vectors benefiting its stock. The company is transforming into a more diversified business as concentration risk structurally declines, with custom silicon complemented by a fast-growing interconnect and switching franchise, while its acquisition of Celestial AI and a $2 billion investment from NVIDIA further validated its roadmap. An overweight in cybersecurity firm Palo Alto Networks contributed positively. Its stock gain was driven primarily by a broad-based beating of consensus expectations across a number of metrics and fiscal year 2027 guidance ahead of consensus. Momentum was strong across both organic and acquired assets, led by accelerating bookings, robust software firewall and Secure Access Service Edge growth, and record platformization adds. These three positions accounted for 3.84%, 2.07% and 2.43% of Fund net assets as of August 31, 2026, respectively.
Top Detractors from Performance: Stock selection in the communication services, materials and consumer staples sectors detracted from the Fund’s relative results. So, too, did an underweight in communication services. The Fund’s top detractor was semiconductor company Advanced Micro Devices given the timing of the Fund’s establishment of this new position. Its stock rose for the annual period driven by strong demand for its data center central processing units and traction in AI acceleration. The company gained server market share while ramping its next-generation product portfolio and expanding margins. However, the Fund did not initiate the position until mid-May 2026. An underweight in information technology giant Apple detracted. Its shares gained, driven primarily by an AI-fueled device upgrade cycle, record earnings results and aggressive share buybacks. Despite facing a sharp pullback in late July and August as investors worried about the potential impact of tariffs on its global supply chain and executive changes, Apple spent most of the annual period hitting multi-trillion-dollar valuation records. An overweight in medical device manufacturer Boston Scientific hurt. Its stock was weak amid concerns around decelerating growth, competitive pressures within its core cardiovascular and MedSurg franchises and a more demanding valuation following a strong prior run. As our conviction in its risk/reward profile moderated, we exited the Fund’s position. These three positions accounted for 3.54%, 2.12% and 0.00% of Fund net assets as of August 31, 2026, respectively.
|
|
| Performance Past Does Not Indicate Future [Text] |
Performance data quoted above represents past performance. Past performance does not guarantee future results.
|
|
| Line Graph [Table Text Block] |
Table Summary
|
Shares based on NAV |
Russell 1000® Growth Index |
Russell 1000® Index |
9/1/16 |
$10,000 |
$10,000 |
$10,000 |
8/17 |
$12,029 |
$12,082 |
$11,616 |
8/18 |
$15,170 |
$15,372 |
$13,918 |
8/19 |
$15,672 |
$16,028 |
$14,265 |
8/20 |
$22,647 |
$23,135 |
$17,474 |
8/21 |
$29,362 |
$29,736 |
$23,110 |
8/22 |
$21,975 |
$24,068 |
$20,115 |
8/23 |
$26,928 |
$29,349 |
$23,213 |
8/24 |
$33,892 |
$38,373 |
$29,387 |
8/25 |
$42,239 |
$47,038 |
$34,160 |
8/26 |
$49,238 |
$52,128 |
$40,913 |
|
|
| Performance Inception Date |
May 24, 1999
|
|
| AssetsNet |
$ 175,611,718
|
|
| Advisory Fees Paid, Amount |
$ 857,392
|
|
| InvestmentCompanyPortfolioTurnover |
78.00%
|
|
| Additional Fund Statistics [Text Block] |
Table Summary
Total Net Assets as of Period End |
$175,611,718 |
# of Portfolio Holdings as of Period End |
54 |
Portfolio Turnover Rate for the Period |
78% |
Total Net Advisory Fees Paid for the Period |
$857,392 | |
|
| Holdings [Text Block] |
Table Summary
Information Technology |
48.3% |
Communication Services |
17.3% |
Industrials |
10.2% |
Health Care |
7.3% |
Consumer Discretionary |
7.0% |
Financials |
5.5% |
Other |
2.0% |
Consumer Staples |
1.2% |
Materials |
1.1% | |
|
| Material Fund Change [Text Block] |
This is a summary of certain changes to the Fund for the Period. For more complete information, you may review the Fund's next prospectus, which we expect to be available by December 29, 2026 at dfinview.com/GoldmanSachs or upon request at 1-800-621-2550. Effective November 14, 2025, the Fund was converted from a mutual fund to an ETF and adopted a unitary fee structure. The Fund's net expense ratio decreased during the Period as a result. |
|
| Summary of Change Legend [Text Block] |
This is a summary of certain changes to the Fund for the Period. For more complete information, you may review the Fund's next prospectus, which we expect to be available by December 29, 2026 at dfinview.com/GoldmanSachs or upon request at 1-800-621-2550.
|
|
| Updated Prospectus Phone Number |
1-800-621-2550
|
|
| Updated Prospectus Web Address |
<span style="box-sizing: border-box; color: rgb(0, 0, 0); display: inline; flex-wrap: nowrap; font-size: 12px; font-weight: 400; grid-area: auto; line-height: 12px; margin: 0px; overflow: visible; text-align: left; text-align-last: auto; white-space-collapse: preserve-breaks;">dfinview.com/GoldmanSachs</span>
|
|
| C000263545 |
|
|
| Shareholder Report [Line Items] |
|
|
| Fund Name |
Goldman Sachs Technology Opportunities ETF
|
|
| Trading Symbol |
GTOP
|
|
| Security Exchange Name |
NASDAQ
|
|
| Annual or Semi-Annual Statement [Text Block] |
This annual shareholder report contains important information about Goldman Sachs Technology Opportunities ETF (the “Fund”) for the period of September 1, 2025 to August 31, 2026 (the “Period”).
|
|
| Additional Information [Text Block] |
You can find additional information about the Fund at am.gs.com or dfinview.com/GoldmanSachs. You can also request this information by contacting us at 1-800-621-2550.
|
|
| Material Fund Change Notice [Text Block] |
This report describes changes to the Fund that occurred during the Period.
|
|
| Additional Information Phone Number |
1-800-621-2550
|
|
| Expenses [Text Block] |
What were the Fund costs for the Period?Based on a hypothetical $10,000 investment.
Table Summary
Fund |
Costs of a $10,000 investment |
Costs paid as a percentage of a $10,000 investment |
GTOP |
$84 |
0.73% | |
|
| Expenses Paid, Amount |
$ 84
|
|
| Expense Ratio, Percent |
0.73%
|
|
| Factors Affecting Performance [Text Block] |
How did the Fund perform and what affected its performance?Market leadership within the information technology sector rotated multiple times, resulting in significant performance dispersion and heightened volatility across the Magnificent 7 and across various industries, as investors differentiated between artificial intelligence (AI) strategies, capital allocation priorities and AI investment programs. Companies pursuing frontier model development, cloud infrastructure expansion and AI monetization opportunities saw materially different market outcomes, creating a more selective environment than the broad-based AI rally experienced in recent annual periods past. For example, enterprise software and application companies came under pressure during the first quarter of 2026, as investors questioned the impact of AI disruption on traditional business models and the long-term durability of existing software economics. Investors increasingly scrutinized the sustainability of unprecedented AI capital expenditures by hyperscalers and other large technology companies, driving market debate around whether record investments in AI infrastructure data centers and computing capacity would ultimately generate attractive economic returns. Subsequently, evidence of AI monetization and return on investment began to emerge as enterprises shifted from experimentation toward implementation, supporting renewed investor confidence in companies capable of translating AI adoption into measurable productivity improvements, business outcomes and earnings growth. Top Contributors to Performance: Stock selection and sector/industry allocation decisions as a whole contributed positively to the Fund’s relative results. The Fund’s differentiated exposures across semiconductors, AI infrastructure beneficiaries, software, cybersecurity and Internet platforms, as well as security selection decisions, proved beneficial. The information technology sector contributed most positively, driven primarily by strong stock selection. While market narratives periodically rotated between semiconductor and infrastructure beneficiaries on the one hand and software and application providers on the other, our stock selection across the sector enabled the Fund to capture opportunities as the AI investment cycle broadened. Relative to the NASDAQ Composite Total Return Index, overweights in semiconductor companies Micron Technology and Marvell Technology and in cybersecurity company Palo Alto Networks added the most value (4.00%, 2.80% and 3.60% of Fund net assets as of August 31, 2026, respectively).
Top Detractors from Performance: The communication services sector detracted most due to weak stock selection. The communication services sector faced periods of volatility as investors increasingly focused on the potential for AI-driven disruption across digital advertising and online platforms. Concerns centered on the possibility that AI-enabled search and discovery tools could alter user behavior and redirect advertising budgets over time pressured valuations in parts of the sector. AmongRelative to the NASDAQ Composite Total Return Index, overweights in AI-powered advertising and mobile marketing solutions provider AppLovin (Class A), financial technology platform Intuit and cloud-based solutions for enterprises provider Oracle detracted most (0.95%, 0.00%1 and 0.00%1 of Fund net assets as of August 31, 2026, respectively).
1 Some weights are 0.00% at August 31, 2026 either because those positions were eliminated during the most recent rebalance given the Index construction methodology or were not held at all during the annual period as they did not meet the Fund’s investment criteria. |
|
| Performance Past Does Not Indicate Future [Text] |
Performance data quoted above represents past performance. Past performance does not guarantee future results.
|
|
| Line Graph [Table Text Block] |
Table Summary
|
Shares based on NAV |
NASDAQ Composite Total Return Index |
Russell 1000® Index |
9/1/16 |
$10,000 |
$10,000 |
$10,000 |
8/17 |
$12,966 |
$12,473 |
$11,616 |
8/18 |
$16,979 |
$15,897 |
$13,918 |
8/19 |
$17,848 |
$15,783 |
$14,265 |
8/20 |
$27,069 |
$23,569 |
$17,474 |
8/21 |
$35,032 |
$30,755 |
$23,110 |
8/22 |
$24,740 |
$23,992 |
$20,115 |
8/23 |
$30,274 |
$28,753 |
$23,213 |
8/24 |
$39,314 |
$36,558 |
$29,387 |
8/25 |
$49,170 |
$44,583 |
$34,160 |
8/26 |
$64,167 |
$55,121 |
$40,913 |
|
|
| Performance Inception Date |
Oct. 01, 1999
|
|
| AssetsNet |
$ 710,450,047
|
|
| Advisory Fees Paid, Amount |
$ 5,198,765
|
|
| InvestmentCompanyPortfolioTurnover |
84.00%
|
|
| Additional Fund Statistics [Text Block] |
Table Summary
Total Net Assets as of Period End |
$710,450,047 |
# of Portfolio Holdings as of Period End |
36 |
Portfolio Turnover Rate for the Period |
84% |
Total Net Advisory Fees Paid for the Period |
$5,198,765 | |
|
| Holdings [Text Block] |
Table Summary
Information Technology |
69.5% |
Communication Services |
14.0% |
Consumer Discretionary |
8.5% |
Financials |
4.1% |
Real Estate |
2.6% |
Other |
0.9% | |
|
| Material Fund Change [Text Block] |
This is a summary of certain changes to the Fund for the Period. For more complete information, you may review the Fund's next prospectus, which we expect to be available by December 29, 2026 at dfinview.com/GoldmanSachs or upon request at 1-800-621-2550. Effective December 5, 2025, the Fund was converted from a mutual fund to an ETF and adopted a unitary fee structure. The Fund's net expense ratio decreased during the Period as a result. |
|
| Summary of Change Legend [Text Block] |
This is a summary of certain changes to the Fund for the Period. For more complete information, you may review the Fund's next prospectus, which we expect to be available by December 29, 2026 at dfinview.com/GoldmanSachs or upon request at 1-800-621-2550.
|
|
| Updated Prospectus Phone Number |
1-800-621-2550
|
|
| Updated Prospectus Web Address |
<span style="box-sizing: border-box; color: rgb(0, 0, 0); display: inline; flex-wrap: nowrap; font-size: 12px; font-weight: 400; grid-area: auto; line-height: 12px; margin: 0px; overflow: visible; text-align: left; text-align-last: auto; white-space-collapse: preserve-breaks;">dfinview.com/GoldmanSachs</span>
|
|
| C000263546 |
|
|
| Shareholder Report [Line Items] |
|
|
| Fund Name |
Goldman Sachs Value Opportunities ETF
|
|
| Trading Symbol |
GVLE
|
|
| Security Exchange Name |
NASDAQ
|
|
| Annual or Semi-Annual Statement [Text Block] |
This annual shareholder report contains important information about Goldman Sachs Value Opportunities ETF (the “Fund”) for the period of September 1, 2025 to August 31, 2026 (the “Period”).
|
|
| Additional Information [Text Block] |
You can find additional information about the Fund at am.gs.com or dfinview.com/GoldmanSachs. You can also request this information by contacting us at 1-800-621-2550.
|
|
| Material Fund Change Notice [Text Block] |
This report describes changes to the Fund that occurred during the Period.
|
|
| Additional Information Phone Number |
1-800-621-2550
|
|
| Expenses [Text Block] |
What were the Fund costs for the Period?Based on a hypothetical $10,000 investment.
Table Summary
Fund |
Costs of a $10,000 investment |
Costs paid as a percentage of a $10,000 investment |
GVLE |
$56 |
0.51% | |
|
| Expenses Paid, Amount |
$ 56
|
|
| Expense Ratio, Percent |
0.51%
|
|
| Factors Affecting Performance [Text Block] |
How did the Fund perform and what affected its performance?The broad U.S. equity market delivered strong gains overall, driven by resilient corporate earnings, solid labor data and expanding artificial intelligence (AI) infrastructure. Monetary policy also played a crucial role, with the Federal Reserve implementing interest rate cuts in the last months of 2025 and then holding steady, as it weighed inflation that remained above target. Still, U.S. equities faced periodic volatility around AI monetization, returns on investment and debt issuance. Concurrently, geopolitical tensions, including maritime shipping disruptions and trade tariffs, drove commodity and energy market volatility. Corporate fundamentals cushioned pullbacks, with profit margins and earnings rather consistently beating consensus expectations across the information technology, industrials and health care sectors. Top Contributors to Performance: Stock selection in the financials, information technology and utilities sectors contributed positively to the Fund’s relative results. An overweight in semiconductor company Micron Technology added value, with its stock rising primarily on its robust financial performance. The company surpassed market expectations with strong earnings, fueled by ongoing demand for its specialized memory products, which are critical components for AI applications. An overweight in software giant Microsoft contributed positively, driven by ongoing momentum in its cloud franchise and accelerating monetization of AI across its productivity and Azure offerings. The company sustained strong commercial growth while deepening its enterprise footprint and expanding margins. An overweight in semiconductor company Advanced Micro Devices proved beneficial. Its stock rose driven by strong demand for its data center central processing units and traction in AI acceleration. The company gained server market share while ramping its next-generation product portfolio and expanding margins. These three positions accounted for 0.00%1, 8.97% and 2.44% of Fund net assets as of August 31, 2026, respectively.
Top Detractors from Performance: Stock selection and sector allocation decisions overall detracted from the Fund’s relative results. Stock selection in the materials, communication services and industrials sectors detracted from the Fund’s relative results. So, too, did an underweight in communication services and an overweight in industrials. The Fund’s top detractor was an overweight in bank holding company Capital One Financial. Its stock came under pressure amid concerns around rising consumer credit normalization, higher net charge-offs and elevated reserve builds across its card and consumer lending portfolios. Investor caution around the health of the lower-income consumer and integration risk tied to its strategic activity also weighed on sentiment. An overweight in L3Harris Technologies, an aerospace and defense technology company, detracted. Its stock fell due primarily to concerns around defense budget uncertainty, program timing and margin pressure across its communication systems and space & airborne segments. Caution around the pace of government contract awards, procurement delays and integration execution further weighed on investor sentiment. An overweight in wireless carrier T-Mobile hurt. The company faced intensified competitive concerns following a strong subscriber report from another wireless carrier as well as investor uncertainty surrounding merger speculation with parent company Deutsche Telekom. We exited the Fund position. These three positions accounted for 2.50%, 0.00%1 and 0.00%1 of Fund net assets as of August 31, 2026, respectively.
1 Some weights are 0.00% at August 31, 2026 either because those positions were eliminated during the most recent rebalance given the Index construction methodology or were not held at all during the annual period as they did not meet the Fund’s investment criteria. |
|
| Performance Past Does Not Indicate Future [Text] |
Performance data quoted above represents past performance. Past performance does not guarantee future results.
|
|
| Line Graph [Table Text Block] |
Table Summary
|
Shares based on NAV |
Russell 1000® Value Index |
Russell 1000® Index |
9/1/16 |
$10,000 |
$10,000 |
$10,000 |
8/17 |
$11,379 |
$11,158 |
$11,616 |
8/18 |
$12,410 |
$12,549 |
$13,918 |
8/19 |
$12,716 |
$12,627 |
$14,265 |
8/20 |
$13,609 |
$12,733 |
$17,474 |
8/21 |
$18,345 |
$17,373 |
$23,110 |
8/22 |
$17,248 |
$16,291 |
$20,115 |
8/23 |
$19,513 |
$17,690 |
$23,213 |
8/24 |
$24,032 |
$21,432 |
$29,387 |
8/25 |
$26,034 |
$23,431 |
$34,160 |
8/26 |
$31,446 |
$30,395 |
$40,913 |
|
|
| Performance Inception Date |
Jul. 31, 2015
|
|
| AssetsNet |
$ 42,913,323
|
|
| Advisory Fees Paid, Amount |
$ 223,900
|
|
| InvestmentCompanyPortfolioTurnover |
87.00%
|
|
| Additional Fund Statistics [Text Block] |
Table Summary
Total Net Assets as of Period End |
$42,913,323 |
# of Portfolio Holdings as of Period End |
31 |
Portfolio Turnover Rate for the Period |
87% |
Total Net Advisory Fees Paid for the Period |
$223,900 | |
|
| Holdings [Text Block] |
Table Summary
Financials |
18.1% |
Information Technology |
15.9% |
Consumer Discretionary |
14.7% |
Health Care |
13.6% |
Industrials |
11.5% |
Consumer Staples |
6.6% |
Energy |
6.2% |
Utilities |
5.0% |
Materials |
3.6% |
Other |
4.9% | |
|
| Material Fund Change [Text Block] |
This is a summary of certain changes to the Fund for the Period. For more complete information, you may review the Fund's next prospectus, which we expect to be available by December 29, 2026 at dfinview.com/GoldmanSachs or upon request at 1-800-621-2550. Effective November 14, 2025, the Fund was converted from a mutual fund to an ETF and adopted a unitary fee structure. The Fund's net expense ratio decreased during the Period as a result. |
|
| Summary of Change Legend [Text Block] |
This is a summary of certain changes to the Fund for the Period. For more complete information, you may review the Fund's next prospectus, which we expect to be available by December 29, 2026 at dfinview.com/GoldmanSachs or upon request at 1-800-621-2550.
|
|
| Updated Prospectus Phone Number |
1-800-621-2550
|
|
| Updated Prospectus Web Address |
<span style="box-sizing: border-box; color: rgb(0, 0, 0); display: inline; flex-wrap: nowrap; font-size: 12px; font-weight: 400; grid-area: auto; line-height: 12px; margin: 0px; overflow: visible; text-align: left; text-align-last: auto; white-space-collapse: preserve-breaks;">dfinview.com/GoldmanSachs</span>
|
|
| C000272964 |
|
|
| Shareholder Report [Line Items] |
|
|
| Fund Name |
Goldman Sachs Data Enhanced International Equity ETF
|
|
| Trading Symbol |
GIEQ
|
|
| Security Exchange Name |
NASDAQ
|
|
| Annual or Semi-Annual Statement [Text Block] |
This annual shareholder report contains important information about Goldman Sachs Data Enhanced International Equity ETF (the “Fund”) for the period of May 19, 2026 to August 31, 2026 (the “Period”).
|
|
| Additional Information [Text Block] |
You can find additional information about the Fund at am.gs.com or dfinview.com/GoldmanSachs. You can also request this information by contacting us at 1-800-621-2550.
|
|
| Additional Information Phone Number |
1-800-621-2550
|
|
| Expenses [Text Block] |
What were the Fund costs for the Period?Based on a hypothetical $10,000 investment.
Table Summary
Fund |
Costs of a $10,000 investment |
Costs paid as a percentage of a $10,000 investment |
GIEQ |
$9Footnote Reference* |
0.30%Footnote Reference** |
| Footnote |
Description |
Footnote* |
The Fund has less than one year of operations. Expenses would be higher if the Fund operated for a full year. |
Footnote** |
Annualized | |
|
| Expenses Paid, Amount |
$ 9
|
[3] |
| Expense Ratio, Percent |
0.30%
|
[4] |
| Factors Affecting Performance [Text Block] |
How did the Fund perform and what affected its performance?The broad international equity market posted positive returns for the period from the Fund’s inception on May 19, 2026 through August 31, 2026 but experienced varied performance, influenced by diverse economic conditions, central bank policies and political and geopolitical developments. Still, strong performance overall was supported by resilient international corporate earnings, regional monetary policy adjustments and varying exposure to the global artificial intelligence (AI) boom. Periodic volatility sparked by shifting trade policies, energy cost fluctuations and regional tensions introduced cross-currents for overseas developed equities, though solid second calendar quarter corporate earnings helped cushion against macroeconomic headwinds. Top Contributors to Performance: Relative to the MSCI EAFE Index (Index), positioning in the utilities, health care and consumer discretionary sectors contributed most positively to the Fund’s results. From a country perspective, positioning in Japan, the U.K. and Spain contributed most positively to the Fund’s relative results. The Fund’s Fundamental Mispricings investment theme contributed positively. Relative to the Index, overweights in Japan-based health care company PHC Holdings and Japan-based information technology company Kyocera and an underweight in Finland-based information technology company Nokia contributed most positively to the Fund’s results (0.30%, 0.58% and 0.00%1 of Fund net assets as of August 31, 2026, respectively).
Top Detractors from Performance: Relative to the Index, positioning in the information technology, materials and communication services sectors detracted most from the Fund’s results. From a country perspective, positioning in Australia, Singapore and Hong Kong detracted most from the Fund’s relative results. The Fund’s Market Themes and Trends, High Quality Business Models and Sentiment Analysis investment themes detracted. Relative to the Index, underweights in Japan-based industrials firm Recruit Holdings and Australia-based health care company CSL and an overweight in Australia-based communication services company Telstra Group detracted most from the Fund’s results (0.53%, 0.06% and 0.30% of Fund net assets as of August 31, 2026, respectively).
1Some weights are 0.00% at August 31, 2026 either because those positions were eliminated during the most recent rebalance given the Index construction methodology or were not held at all during the Period as they did not meet the Fund’s investment criteria. |
|
| Performance Past Does Not Indicate Future [Text] |
Performance data quoted above represents past performance. Past performance does not guarantee future results.
|
|
| Line Graph [Table Text Block] |
Table Summary
|
Shares based on NAV |
MSCI EAFE Index (Net, USD, Unhedged) |
5/19/26 |
$10,000 |
$10,000 |
8/26 |
$10,727 |
$10,729 |
|
|
| Performance Inception Date |
May 19, 2026
|
|
| AssetsNet |
$ 32,199,004
|
|
| Advisory Fees Paid, Amount |
$ 9,926
|
|
| InvestmentCompanyPortfolioTurnover |
24.00%
|
|
| Additional Fund Statistics [Text Block] |
Table Summary
Total Net Assets as of Period End |
$32,199,004 |
# of Portfolio Holdings as of Period End |
280 |
Portfolio Turnover Rate for the Period |
24% |
Total Net Advisory Fees Paid for the Period |
$9,926 | |
|
| Holdings [Text Block] |
Table Summary
Financials |
25.3% |
Industrials |
19.7% |
Health Care |
10.5% |
Information Technology |
10.1% |
Consumer Discretionary |
9.8% |
Consumer Staples |
6.8% |
Materials |
6.6% |
Communication Services |
3.6% |
Energy |
3.4% |
Other |
4.7% | |
|
| Material Fund Change [Text Block] |
|
|
| Updated Prospectus Phone Number |
1-800-621-2550
|
|
| Updated Prospectus Web Address |
<span style="box-sizing: border-box; color: rgb(0, 0, 0); display: inline; flex-wrap: nowrap; font-size: 12px; font-weight: 400; grid-area: auto; line-height: 12px; margin: 0px; overflow: visible; text-align: left; text-align-last: auto; white-space-collapse: preserve-breaks;">dfinview.com/GoldmanSachs</span>
|
|
|
|