Shareholder Report
|
12 Months Ended |
|
Aug. 31, 2026
USD ($)
Holding
|
|---|
| Shareholder Report [Line Items] |
|
|
| Document Type |
N-CSR
|
|
| Amendment Flag |
false
|
|
| Registrant Name |
GOLDMAN SACHS TRUST
|
|
| Entity Central Index Key |
0000822977
|
|
| Entity Investment Company Type |
N-1A
|
|
| Document Period End Date |
Aug. 31, 2026
|
|
| Shareholder Report Annual or Semi-Annual |
Annual Shareholder Report
|
|
| C000151917 |
|
|
| Shareholder Report [Line Items] |
|
|
| Fund Name |
Goldman Sachs Global Managed Beta Fund
|
|
| Class Name |
Institutional Shares
|
|
| Trading Symbol |
GGMBX
|
|
| Annual or Semi-Annual Statement [Text Block] |
This annual shareholder report contains important information about Goldman Sachs Global Managed Beta Fund (the “Fund”) for the period of September 1, 2025 to August 31, 2026 (the “Period”).
|
|
| Additional Information [Text Block] |
You can find additional information about the Fund at am.gs.com or dfinview.com/GoldmanSachs. You can also request this information by contacting us at 1-800-621-2550.
|
|
| Material Fund Change Notice [Text Block] |
This report describes changes to the Fund that occurred during the Period.
|
|
| Additional Information Phone Number |
1-800-621-2550
|
|
| Additional Information Website |
<span style="box-sizing: border-box; color: rgb(0, 0, 0); display: inline; flex-wrap: nowrap; font-size: 12px; font-weight: 400; grid-area: auto; line-height: 18px; margin: 0px; overflow: visible; text-align: left; text-align-last: auto; white-space-collapse: preserve-breaks;">am.gs.com</span>
|
|
| Expenses [Text Block] |
What were the Fund costs for the Period?Based on a hypothetical $10,000 investment.
Table Summary
Class |
Costs of a $10,000 investment |
Costs paid as a percentage of a $10,000 investment |
Institutional |
$30 |
0.27% | |
|
| Expenses Paid, Amount |
$ 30
|
|
| Expense Ratio, Percent |
0.27%
|
|
| Factors Affecting Performance [Text Block] |
How did the Fund perform and what affected its performance?Global equities broadly gained, supported by resilient corporate earnings, technology sector strength and generally firm economic activity. Rising bond yields, inflation concerns and geopolitical tensions in the Middle East tempered investor sentiment. Emerging markets stocks outperformed developed markets stocks overall. |
|
| Performance Past Does Not Indicate Future [Text] |
Performance data quoted above represents past performance. Past performance does not guarantee future results.
|
|
| Line Graph [Table Text Block] |
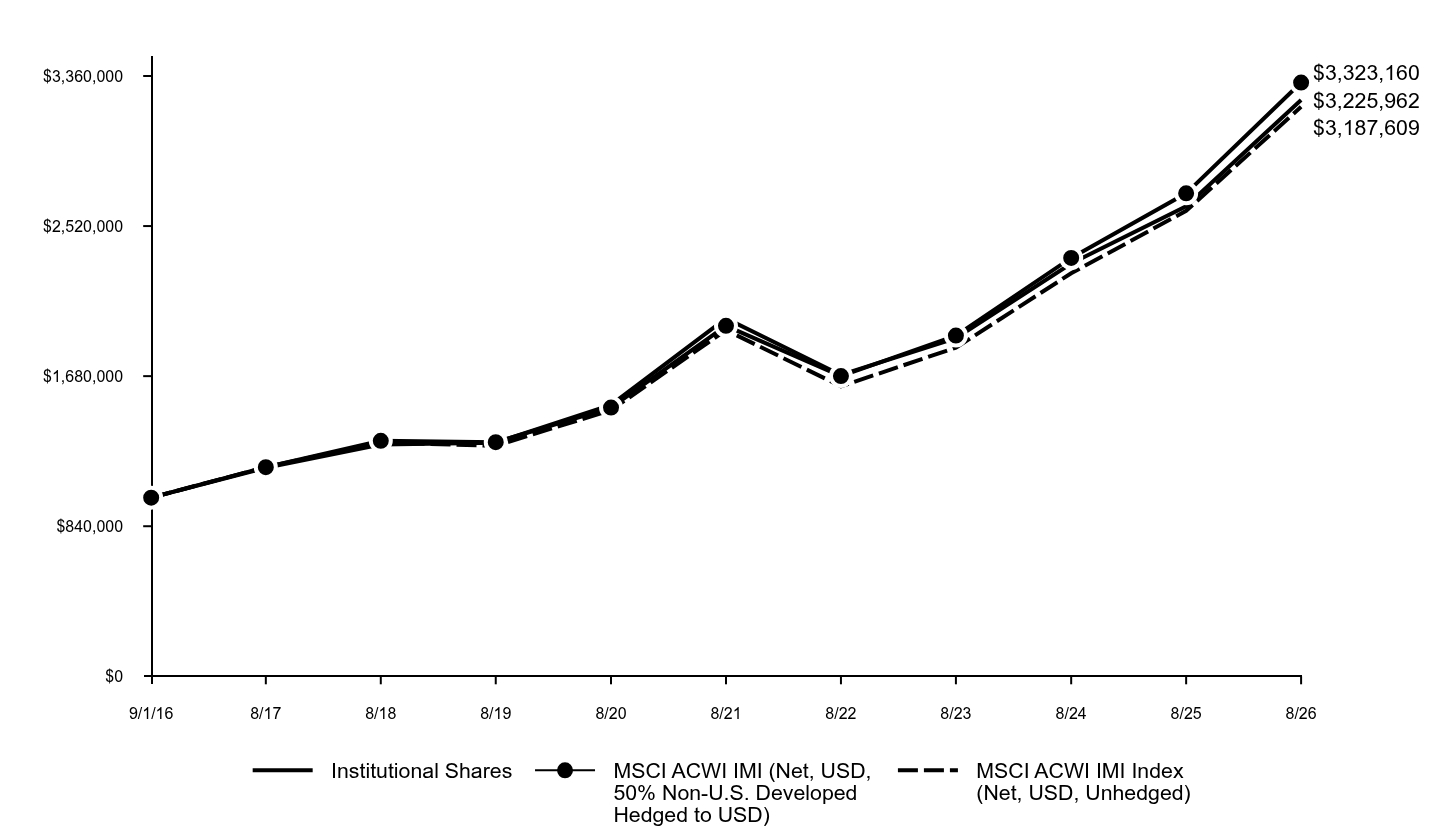
The following graph assumes an initial $1,000,000 investment in the Fund and compares the initial and subsequent account values at the end of each of the most recently completed 10 fiscal years of the Fund's share class (or less if the share class has been in operation for less than 10 years). The Fund's performance reflects applicable sales charges, if any. For comparative purposes, the performance of the Fund's benchmark and any additional performance benchmark(s) are also shown.
Table Summary
|
Institutional Shares |
MSCI ACWI IMI (Net, USD, 50% Non-U.S. Developed Hedged to USD) |
MSCI ACWI IMI Index (Net, USD, Unhedged) |
9/1/16 |
$1,000,000 |
$1,000,000 |
$1,000,000 |
8/17 |
$1,167,200 |
$1,170,400 |
$1,170,800 |
8/18 |
$1,297,693 |
$1,317,753 |
$1,308,954 |
8/19 |
$1,307,815 |
$1,310,374 |
$1,290,236 |
8/20 |
$1,519,289 |
$1,504,047 |
$1,489,449 |
8/21 |
$2,003,486 |
$1,961,428 |
$1,937,922 |
8/22 |
$1,686,735 |
$1,680,551 |
$1,623,203 |
8/23 |
$1,893,191 |
$1,907,258 |
$1,839,576 |
8/24 |
$2,310,640 |
$2,341,540 |
$2,255,689 |
8/25 |
$2,630,432 |
$2,703,074 |
$2,605,320 |
8/26 |
$3,225,962 |
$3,323,160 |
$3,187,609 | |
|
| Average Annual Return [Table Text Block] |
Average Annual Total Returns (%)
Table Summary
AATR |
1 Year |
5 Years |
10 Years |
Institutional Shares |
22.64% |
9.99% |
12.42% |
MSCI ACWI IMI (Net, USD, 50% Non-U.S. Developed Hedged to USD) |
22.94% |
11.11% |
12.75% |
MSCI ACWI IMI Index (Net, USD, Unhedged) |
22.35% |
10.46% |
12.29% | Performance data quoted above represents past performance. Past performance does not guarantee future results. The Fund’s investment return and principal value will fluctuate so that an investor’s shares, when redeemed, may be worth more or less than their original cost. Current performance may be lower or higher than the performance quoted above. Please visit our website at: am.gs.com to obtain the most recent month-end returns. Performance reflects applicable fee waivers and/or expense limitations in effect during the periods shown and in their absence, performance would be reduced. The graph and table do not reflect the deduction of taxes that a shareholder would pay on Fund distributions or redemption of Fund shares. |
|
| AssetsNet |
$ 4,828,780,298
|
|
| Holdings Count | Holding |
482
|
|
| Advisory Fees Paid, Amount |
$ 10,793,596
|
|
| InvestmentCompanyPortfolioTurnover |
25.00%
|
|
| Additional Fund Statistics [Text Block] |
Table Summary
Total Net Assets as of Period End |
$4,828,780,298 |
# of Portfolio Holdings as of Period End |
482 |
Portfolio Turnover Rate for the Period |
25% |
Total Net Advisory Fees Paid for the Period |
$10,793,596 | |
|
| Holdings [Text Block] |
Table Summary
Common Stocks |
11.3% |
Short-Term Investments |
1.0% |
Other |
84.6% | |
|
| Material Fund Change [Text Block] |
This is a summary of certain changes to the Fund for the Period. For more complete information, you may review the Fund's next prospectus, which we expect to be available by December 29, 2026 at dfinview.com/GoldmanSachs or upon request at 1-800-621-2550. The Fund changed its principal investment strategy to enable the Fund to invest in volatility index derivatives and to authorize the Fund to invest in a wholly owned subsidiary, through which the Fund will seek to gain exposure to volatility index derivatives and may also seek to gain exposure to commodities markets through investments in commodity-linked derivatives. As part of these changes, the Fund revised its principal investment risks to reflect commodity sector risk, subsidiary risk, and tax risk. |
|
| Material Fund Change Strategies [Text Block] |
The Fund changed its principal investment strategy to enable the Fund to invest in volatility index derivatives and to authorize the Fund to invest in a wholly owned subsidiary, through which the Fund will seek to gain exposure to volatility index derivatives and may also seek to gain exposure to commodities markets through investments in commodity-linked derivatives.
|
|
| Material Fund Change Risks Change [Text Block] |
As part of these changes, the Fund revised its principal investment risks to reflect commodity sector risk, subsidiary risk, and tax risk.
|
|
| Summary of Change Legend [Text Block] |
This is a summary of certain changes to the Fund for the Period. For more complete information, you may review the Fund's next prospectus, which we expect to be available by December 29, 2026 at dfinview.com/GoldmanSachs or upon request at 1-800-621-2550.
|
|
| Updated Prospectus Phone Number |
1-800-621-2550
|
|
| Updated Prospectus Web Address |
<span style="box-sizing: border-box; color: rgb(0, 0, 0); display: inline; flex-wrap: nowrap; font-size: 12px; font-weight: 400; grid-area: auto; line-height: 18px; margin: 0px; overflow: visible; text-align: left; text-align-last: auto; white-space-collapse: preserve-breaks;">dfinview.com/GoldmanSachs</span>
|
|
| C000277167 |
|
|
| Shareholder Report [Line Items] |
|
|
| Fund Name |
Goldman Sachs Global Managed Beta Fund
|
|
| Class Name |
Investor Shares
|
|
| Trading Symbol |
GGMIX
|
|
| Annual or Semi-Annual Statement [Text Block] |
This annual shareholder report contains important information about Goldman Sachs Global Managed Beta Fund (the “Fund”) for the period of July 7, 2026 to August 31, 2026 (the “Period”).
|
|
| Additional Information [Text Block] |
You can find additional information about the Fund at am.gs.com or dfinview.com/GoldmanSachs. You can also request this information by contacting us at 1-800-526-7384.
|
|
| Material Fund Change Notice [Text Block] |
This report describes changes to the Fund that occurred during the Period.
|
|
| Additional Information Phone Number |
1-800-526-7384
|
|
| Additional Information Website |
<span style="box-sizing: border-box; color: rgb(0, 0, 0); display: inline; flex-wrap: nowrap; font-size: 12px; font-weight: 400; grid-area: auto; line-height: 18px; margin: 0px; overflow: visible; text-align: left; text-align-last: auto; white-space-collapse: preserve-breaks;">am.gs.com</span>
|
|
| Expenses [Text Block] |
What were the Fund costs for the Period?Based on a hypothetical $10,000 investment.
Table Summary
Class |
Costs of a $10,000 investment |
Costs paid as a percentage of a $10,000 investment |
Investor |
$6Footnote Reference(a) |
0.42%Footnote Reference* |
| Footnote |
Description |
Footnote(a) |
Based on the period July 7, 2026 (commencement of operations) through August 31, 2026. Expenses would have been higher if the share class had been in existence for the full reporting period. |
Footnote* |
Annualized. | |
|
| Expenses Paid, Amount |
$ 6
|
[1] |
| Expense Ratio, Percent |
0.42%
|
[2] |
| Expenses Short Period Footnote [Text Block] |
Based on the period July 7, 2026 (commencement of operations) through August 31, 2026. Expenses would have been higher if the share class had been in existence for the full reporting period.
|
|
| Factors Affecting Performance [Text Block] |
How did the Fund perform and what affected its performance?Global equities broadly gained, supported by resilient corporate earnings, technology sector strength and generally firm economic activity. Rising bond yields, inflation concerns and geopolitical tensions in the Middle East tempered investor sentiment. Emerging markets stocks outperformed developed markets stocks overall. |
|
| Performance Past Does Not Indicate Future [Text] |
Performance data quoted above represents past performance. Past performance does not guarantee future results.
|
|
| Line Graph [Table Text Block] |
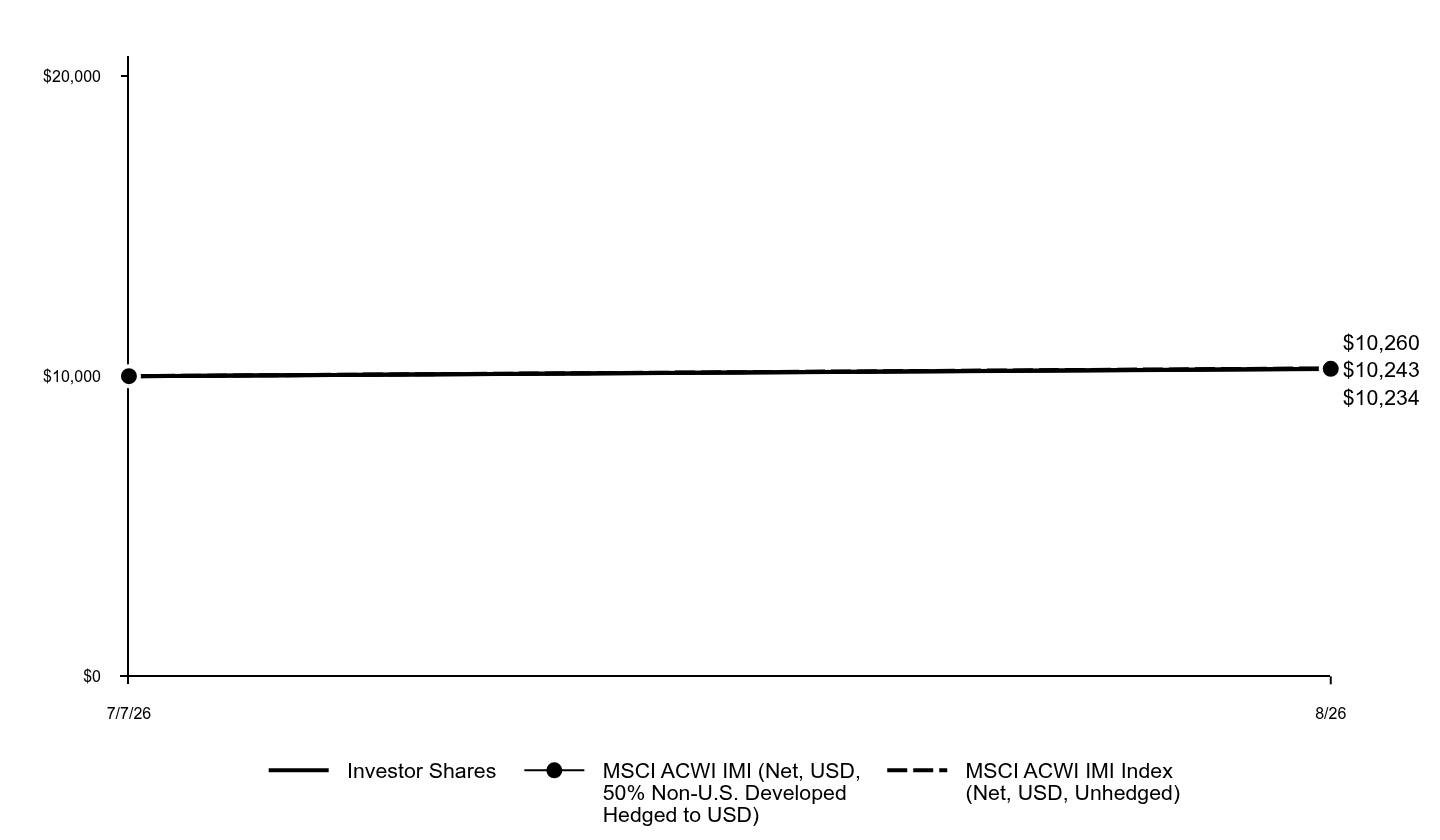
The following graph assumes an initial $10,000 investment in the Fund and compares the initial and subsequent account values at the end of each of the most recently completed 10 fiscal years of the Fund's share class (or less if the share class has been in operation for less than 10 years). The Fund's performance reflects applicable sales charges, if any. For comparative purposes, the performance of the Fund's benchmark and any additional performance benchmark(s) are also shown.
Table Summary
|
Investor Shares |
MSCI ACWI IMI (Net, USD, 50% Non-U.S. Developed Hedged to USD) |
MSCI ACWI IMI Index (Net, USD, Unhedged) |
7/7/26 |
$10,000 |
$10,000 |
$10,000 |
8/26 |
$10,234 |
$10,243 |
$10,260 | |
|
| Average Annual Return [Table Text Block] |
Average Annual Total Returns (%)
Table Summary
AATR |
Since Inception |
Investor Shares (Commenced July 7, 2026) |
2.34% |
MSCI ACWI IMI (Net, USD, 50% Non-U.S. Developed Hedged to USD) |
2.43% |
MSCI ACWI IMI Index (Net, USD, Unhedged) |
2.60% | Performance data quoted above represents past performance. Past performance does not guarantee future results. The Fund’s investment return and principal value will fluctuate so that an investor’s shares, when redeemed, may be worth more or less than their original cost. Current performance may be lower or higher than the performance quoted above. Please visit our website at: am.gs.com to obtain the most recent month-end returns. Performance reflects applicable fee waivers and/or expense limitations in effect during the periods shown and in their absence, performance would be reduced. The graph and table do not reflect the deduction of taxes that a shareholder would pay on Fund distributions or redemption of Fund shares. |
|
| Performance Inception Date |
Jul. 07, 2026
|
|
| AssetsNet |
$ 4,828,780,298
|
|
| Holdings Count | Holding |
482
|
|
| Advisory Fees Paid, Amount |
$ 10,793,596
|
|
| InvestmentCompanyPortfolioTurnover |
25.00%
|
|
| Additional Fund Statistics [Text Block] |
Table Summary
Total Net Assets as of Period End |
$4,828,780,298 |
# of Portfolio Holdings as of Period End |
482 |
Portfolio Turnover Rate for the Period |
25% |
Total Net Advisory Fees Paid for the Period |
$10,793,596 | |
|
| Holdings [Text Block] |
Table Summary
Common Stocks |
11.3% |
Short-Term Investments |
1.0% |
Other |
84.6% | |
|
| Material Fund Change [Text Block] |
This is a summary of certain changes to the Fund for the Period. For more complete information, you may review the Fund's next prospectus, which we expect to be available by December 29, 2026 at dfinview.com/GoldmanSachs or upon request at 1-800-526-7384. The Fund changed its principal investment strategy to enable the Fund to invest in volatility index derivatives and to authorize the Fund to invest in a wholly owned subsidiary, through which the Fund will seek to gain exposure to volatility index derivatives and may also seek to gain exposure to commodities markets through investments in commodity-linked derivatives. As part of these changes, the Fund revised its principal investment risks to reflect commodity sector risk, subsidiary risk, and tax risk. |
|
| Material Fund Change Strategies [Text Block] |
The Fund changed its principal investment strategy to enable the Fund to invest in volatility index derivatives and to authorize the Fund to invest in a wholly owned subsidiary, through which the Fund will seek to gain exposure to volatility index derivatives and may also seek to gain exposure to commodities markets through investments in commodity-linked derivatives.
|
|
| Material Fund Change Risks Change [Text Block] |
As part of these changes, the Fund revised its principal investment risks to reflect commodity sector risk, subsidiary risk, and tax risk.
|
|
| Summary of Change Legend [Text Block] |
This is a summary of certain changes to the Fund for the Period. For more complete information, you may review the Fund's next prospectus, which we expect to be available by December 29, 2026 at dfinview.com/GoldmanSachs or upon request at 1-800-526-7384.
|
|
| Updated Prospectus Phone Number |
1-800-526-7384
|
|
| Updated Prospectus Web Address |
<span style="box-sizing: border-box; color: rgb(0, 0, 0); display: inline; flex-wrap: nowrap; font-size: 12px; font-weight: 400; grid-area: auto; line-height: 18px; margin: 0px; overflow: visible; text-align: left; text-align-last: auto; white-space-collapse: preserve-breaks;">dfinview.com/GoldmanSachs</span>
|
|
| C000201707 |
|
|
| Shareholder Report [Line Items] |
|
|
| Fund Name |
Goldman Sachs Strategic Factor Allocation Fund
|
|
| Class Name |
Class P Shares
|
|
| Trading Symbol |
GSQPX
|
|
| Annual or Semi-Annual Statement [Text Block] |
This annual shareholder report contains important information about Goldman Sachs Strategic Factor Allocation Fund (the “Fund”) for the period of September 1, 2025 to August 31, 2026 (the “Period”).
|
|
| Additional Information [Text Block] |
You can find additional information about the Fund at am.gs.com or dfinview.com/GoldmanSachs. You can also request this information by contacting us at 1-800-621-2550.
|
|
| Additional Information Phone Number |
1-800-621-2550
|
|
| Additional Information Website |
<span style="box-sizing: border-box; color: rgb(0, 0, 0); display: inline; flex-wrap: nowrap; font-size: 12px; font-weight: 400; grid-area: auto; line-height: 18px; margin: 0px; overflow: visible; text-align: left; text-align-last: auto; white-space-collapse: preserve-breaks;">am.gs.com</span>
|
|
| Expenses [Text Block] |
What were the Fund costs for the Period?Based on a hypothetical $10,000 investment.
Table Summary
Class |
Costs of a $10,000 investment |
Costs paid as a percentage of a $10,000 investment |
P |
$83 |
0.78% | |
|
| Expenses Paid, Amount |
$ 83
|
|
| Expense Ratio, Percent |
0.78%
|
|
| Factors Affecting Performance [Text Block] |
How did the Fund perform and what affected its performance?U.S. equities delivered strong gains, supported by resilient corporate earnings, solid labor market data and expanding artificial intelligence infrastructure. U.S. fixed income performance was generally positive, shaped most by a significant shift in Federal Reserve monetary policy and a volatile macroeconomic backdrop. |
|
| Performance Past Does Not Indicate Future [Text] |
Performance data quoted above represents past performance. Past performance does not guarantee future results.
|
|
| Line Graph [Table Text Block] |
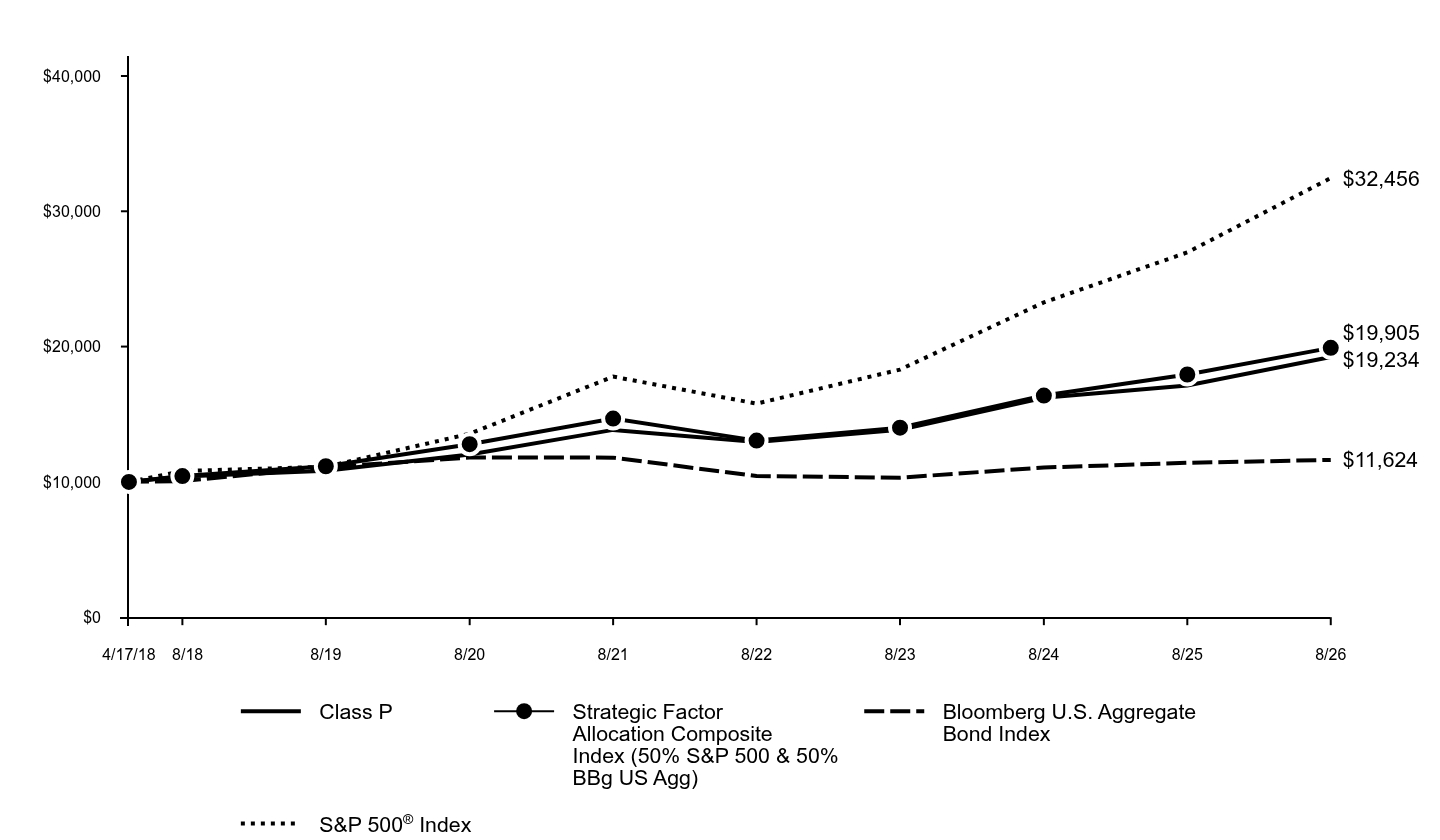
The following graph assumes an initial $10,000 investment in the Fund and compares the initial and subsequent account values at the end of each of the most recently completed 10 fiscal years of the Fund's share class (or less if the share class has been in operation for less than 10 years). The Fund's performance reflects applicable sales charges, if any. For comparative purposes, the performance of the Fund's benchmark and any additional performance benchmark(s) are also shown.
Table Summary
|
Class P |
Strategic Factor Allocation Composite Index (50% S&P 500 & 50% BBg US Agg) |
Bloomberg U.S. Aggregate Bond Index |
S&P 500® Index |
4/17/18 |
$10,000 |
$10,000 |
$10,000 |
$10,000 |
8/18 |
$10,397 |
$10,427 |
$10,061 |
$10,801 |
8/19 |
$10,830 |
$11,153 |
$11,084 |
$11,116 |
8/20 |
$12,027 |
$12,788 |
$11,802 |
$13,555 |
8/21 |
$13,842 |
$14,676 |
$11,792 |
$17,781 |
8/22 |
$12,947 |
$13,050 |
$10,434 |
$15,784 |
8/23 |
$13,849 |
$14,006 |
$10,310 |
$18,300 |
8/24 |
$16,217 |
$16,378 |
$11,062 |
$23,266 |
8/25 |
$17,130 |
$17,937 |
$11,409 |
$26,961 |
8/26 |
$19,234 |
$19,905 |
$11,624 |
$32,456 | |
|
| Average Annual Return [Table Text Block] |
Average Annual Total Returns (%)
Table Summary
AATR |
1 Year |
5 Years |
Since Inception |
Class P (Commenced April 17, 2018) |
12.28% |
6.79% |
8.12% |
Strategic Factor Allocation Composite Index (50% S&P 500 & 50% BBg US Agg) |
10.97% |
6.28% |
8.56% |
Bloomberg U.S. Aggregate Bond Index |
1.89% |
-0.29% |
1.81% |
S&P 500® Index |
20.38% |
12.78% |
15.08% | Performance data quoted above represents past performance. Past performance does not guarantee future results. The Fund’s investment return and principal value will fluctuate so that an investor’s shares, when redeemed, may be worth more or less than their original cost. Current performance may be lower or higher than the performance quoted above. Please visit our website at: am.gs.com to obtain the most recent month-end returns. Performance reflects applicable fee waivers and/or expense limitations in effect during the periods shown and in their absence, performance would be reduced. The graph and table do not reflect the deduction of taxes that a shareholder would pay on Fund distributions or redemption of Fund shares. |
|
| Performance Inception Date |
Apr. 17, 2018
|
|
| AssetsNet |
$ 2,394,964,181
|
|
| Holdings Count | Holding |
681
|
|
| Advisory Fees Paid, Amount |
$ 17,175,962
|
|
| InvestmentCompanyPortfolioTurnover |
27.00%
|
|
| Additional Fund Statistics [Text Block] |
Table Summary
Total Net Assets as of Period End |
$2,394,964,181 |
# of Portfolio Holdings as of Period End |
681 |
Portfolio Turnover Rate for the Period |
27% |
Total Net Advisory Fees Paid for the Period |
$17,175,962 | |
|
| Holdings [Text Block] |
Asset Class Exposure (%)*
Table Summary
Header |
Gross |
Long |
Short |
Net |
Developed Markets Equity Put Options |
368.7 |
156.6 |
212.2 |
-55.6 |
Developed Markets Currency |
3.3 |
0.8 |
2.5 |
-1.7 |
Fixed Income Put Options |
16.3 |
- |
16.3 |
-16.3 |
Fixed Income Call Options |
16.6 |
- |
16.6 |
-16.6 |
Interest Rate Put Options |
8.3 |
8.3 |
- |
8.3 |
US Equity |
50.4 |
50.4 |
- |
50.4 |
Interest Rate Call Options |
8.3 |
8.3 |
- |
8.3 |
Cash |
101.7 |
52.3 |
49.4 |
3.0 |
Fixed Income |
48.1 |
46.5 |
1.7 |
44.8 |
Short-Term Investments |
55.0 |
55.0 |
- |
55.0 |
Developed Markets Equity Call Options |
24.4 |
24.4 |
- |
24.4 |
Developed Markets Ex US Equity |
0.1 |
0.1 |
- |
0.1 | *Asset class exposure includes the impact of derivatives. "Gross Exposure" represents the sum of the absolute value of long and short notional contract values in U.S. dollars of the Fund's positions (for a given asset class), divided by the Fund's net assets exposure within each asset class. "Net Exposure" represents the net exposure within the Fund to a given asset class, calculated as the difference between long and short exposures. The exposure of option contracts is delta-adjusted. Forward foreign currency exchange contracts for individual currency crosses are aggregated by settlement date and counterparty in the determination of gross exposure. Fixed income exposures are duration-adjusted to the 10-year reference rate of each respective country. "Short-term Investments” includes U.S. Treasuries and other short-term investments, including money market funds, repurchase agreements, cash and time deposits. |
|
| Material Fund Change [Text Block] |
|
|
| Updated Prospectus Phone Number |
1-800-621-2550
|
|
| Updated Prospectus Web Address |
<span style="box-sizing: border-box; color: rgb(0, 0, 0); display: inline; flex-wrap: nowrap; font-size: 12px; font-weight: 400; grid-area: auto; line-height: 18px; margin: 0px; overflow: visible; text-align: left; text-align-last: auto; white-space-collapse: preserve-breaks;">dfinview.com/GoldmanSachs</span>
|
|
| C000169918 |
|
|
| Shareholder Report [Line Items] |
|
|
| Fund Name |
Goldman Sachs Strategic Factor Allocation Fund
|
|
| Class Name |
Institutional Shares
|
|
| Trading Symbol |
SFAFX
|
|
| Annual or Semi-Annual Statement [Text Block] |
This annual shareholder report contains important information about Goldman Sachs Strategic Factor Allocation Fund (the “Fund”) for the period of September 1, 2025 to August 31, 2026 (the “Period”).
|
|
| Additional Information [Text Block] |
You can find additional information about the Fund at am.gs.com or dfinview.com/GoldmanSachs. You can also request this information by contacting us at 1-800-621-2550.
|
|
| Additional Information Phone Number |
1-800-621-2550
|
|
| Additional Information Website |
<span style="box-sizing: border-box; color: rgb(0, 0, 0); display: inline; flex-wrap: nowrap; font-size: 12px; font-weight: 400; grid-area: auto; line-height: 18px; margin: 0px; overflow: visible; text-align: left; text-align-last: auto; white-space-collapse: preserve-breaks;">am.gs.com</span>
|
|
| Expenses [Text Block] |
What were the Fund costs for the Period?Based on a hypothetical $10,000 investment.
Table Summary
Class |
Costs of a $10,000 investment |
Costs paid as a percentage of a $10,000 investment |
Institutional |
$84 |
0.79% | |
|
| Expenses Paid, Amount |
$ 84
|
|
| Expense Ratio, Percent |
0.79%
|
|
| Factors Affecting Performance [Text Block] |
How did the Fund perform and what affected its performance?U.S. equities delivered strong gains, supported by resilient corporate earnings, solid labor market data and expanding artificial intelligence infrastructure. U.S. fixed income performance was generally positive, shaped most by a significant shift in Federal Reserve monetary policy and a volatile macroeconomic backdrop. |
|
| Performance Past Does Not Indicate Future [Text] |
Performance data quoted above represents past performance. Past performance does not guarantee future results.
|
|
| Line Graph [Table Text Block] |
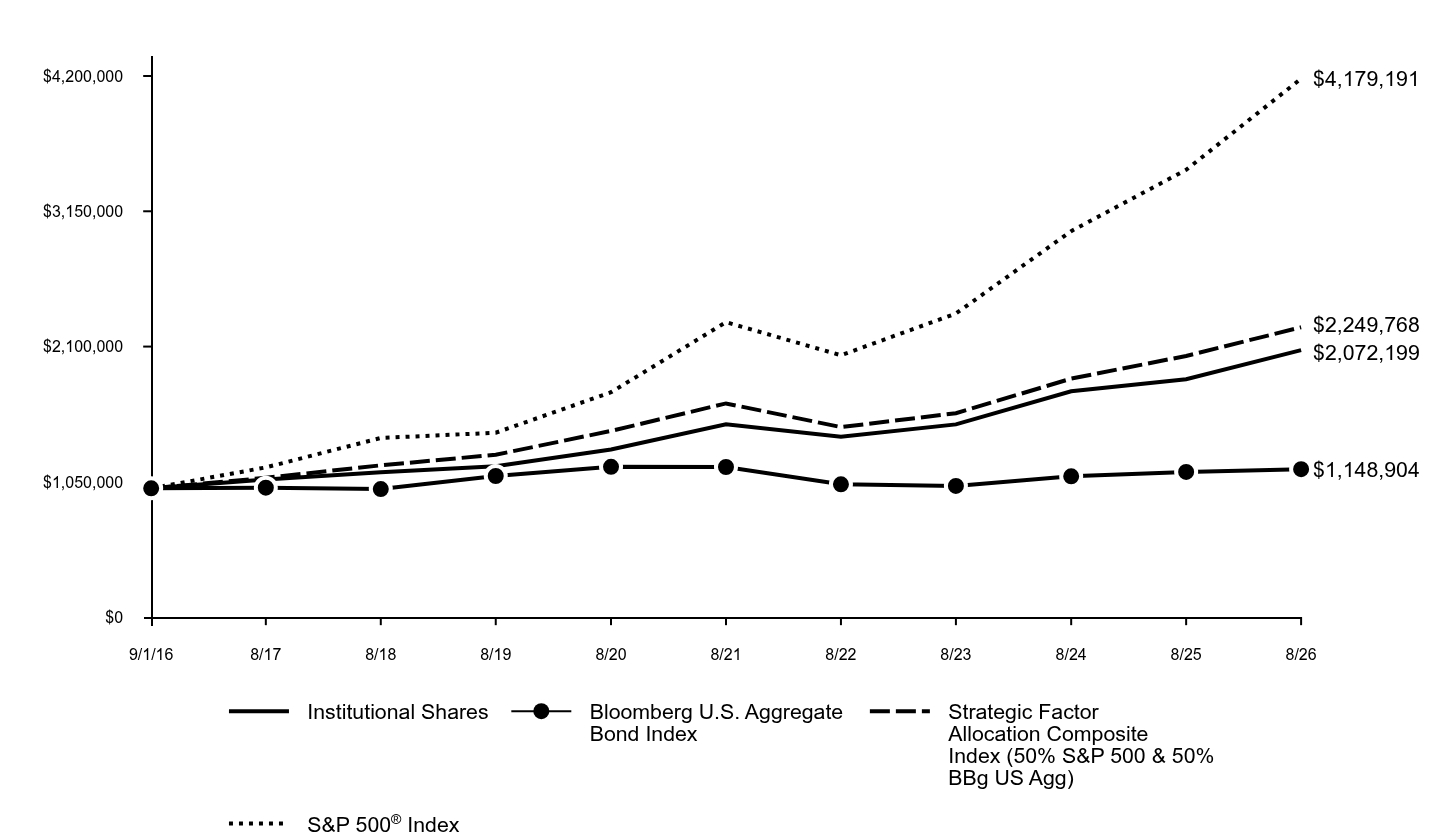
The following graph assumes an initial $1,000,000 investment in the Fund and compares the initial and subsequent account values at the end of each of the most recently completed 10 fiscal years of the Fund's share class (or less if the share class has been in operation for less than 10 years). The Fund's performance reflects applicable sales charges, if any. For comparative purposes, the performance of the Fund's benchmark and any additional performance benchmark(s) are also shown.
Table Summary
|
Institutional Shares |
Bloomberg U.S. Aggregate Bond Index |
Strategic Factor Allocation Composite Index (50% S&P 500 & 50% BBg US Agg) |
S&P 500® Index |
9/1/16 |
$1,000,000 |
$1,000,000 |
$1,000,000 |
$1,000,000 |
8/17 |
$1,068,800 |
$1,004,925 |
$1,081,600 |
$1,162,300 |
8/18 |
$1,124,164 |
$994,379 |
$1,178,511 |
$1,390,808 |
8/19 |
$1,170,817 |
$1,095,532 |
$1,260,536 |
$1,431,420 |
8/20 |
$1,301,246 |
$1,166,450 |
$1,445,330 |
$1,745,473 |
8/21 |
$1,496,563 |
$1,165,466 |
$1,658,806 |
$2,289,537 |
8/22 |
$1,399,735 |
$1,031,252 |
$1,475,010 |
$2,032,422 |
8/23 |
$1,496,037 |
$1,018,948 |
$1,582,981 |
$2,356,390 |
8/24 |
$1,752,757 |
$1,093,297 |
$1,851,138 |
$2,995,915 |
8/25 |
$1,846,880 |
$1,127,585 |
$2,027,366 |
$3,471,666 |
8/26 |
$2,072,199 |
$1,148,904 |
$2,249,768 |
$4,179,191 | |
|
| Average Annual Return [Table Text Block] |
Average Annual Total Returns (%)
Table Summary
AATR |
1 Year |
5 Years |
10 Years |
Institutional Shares |
12.20% |
6.72% |
7.55% |
Strategic Factor Allocation Composite Index (50% S&P 500 & 50% BBg US Agg) |
10.97% |
6.28% |
8.44% |
Bloomberg U.S. Aggregate Bond Index |
1.89% |
-0.29% |
1.40% |
S&P 500® Index |
20.38% |
12.78% |
15.37% | Performance data quoted above represents past performance. Past performance does not guarantee future results. The Fund’s investment return and principal value will fluctuate so that an investor’s shares, when redeemed, may be worth more or less than their original cost. Current performance may be lower or higher than the performance quoted above. Please visit our website at: am.gs.com to obtain the most recent month-end returns. Performance reflects applicable fee waivers and/or expense limitations in effect during the periods shown and in their absence, performance would be reduced. The graph and table do not reflect the deduction of taxes that a shareholder would pay on Fund distributions or redemption of Fund shares. |
|
| AssetsNet |
$ 2,394,964,181
|
|
| Holdings Count | Holding |
681
|
|
| Advisory Fees Paid, Amount |
$ 17,175,962
|
|
| InvestmentCompanyPortfolioTurnover |
27.00%
|
|
| Additional Fund Statistics [Text Block] |
Table Summary
Total Net Assets as of Period End |
$2,394,964,181 |
# of Portfolio Holdings as of Period End |
681 |
Portfolio Turnover Rate for the Period |
27% |
Total Net Advisory Fees Paid for the Period |
$17,175,962 | |
|
| Holdings [Text Block] |
Asset Class Exposure (%)*
Table Summary
Header |
Gross |
Long |
Short |
Net |
Developed Markets Equity Put Options |
368.7 |
156.6 |
212.2 |
-55.6 |
Developed Markets Currency |
3.3 |
0.8 |
2.5 |
-1.7 |
Fixed Income Put Options |
16.3 |
- |
16.3 |
-16.3 |
Fixed Income Call Options |
16.6 |
- |
16.6 |
-16.6 |
Interest Rate Put Options |
8.3 |
8.3 |
- |
8.3 |
US Equity |
50.4 |
50.4 |
- |
50.4 |
Interest Rate Call Options |
8.3 |
8.3 |
- |
8.3 |
Cash |
101.7 |
52.3 |
49.4 |
3.0 |
Fixed Income |
48.1 |
46.5 |
1.7 |
44.8 |
Short-Term Investments |
55.0 |
55.0 |
- |
55.0 |
Developed Markets Equity Call Options |
24.4 |
24.4 |
- |
24.4 |
Developed Markets Ex US Equity |
0.1 |
0.1 |
- |
0.1 | *Asset class exposure includes the impact of derivatives. "Gross Exposure" represents the sum of the absolute value of long and short notional contract values in U.S. dollars of the Fund's positions (for a given asset class), divided by the Fund's net assets exposure within each asset class. "Net Exposure" represents the net exposure within the Fund to a given asset class, calculated as the difference between long and short exposures. The exposure of option contracts is delta-adjusted. Forward foreign currency exchange contracts for individual currency crosses are aggregated by settlement date and counterparty in the determination of gross exposure. Fixed income exposures are duration-adjusted to the 10-year reference rate of each respective country. "Short-term Investments” includes U.S. Treasuries and other short-term investments, including money market funds, repurchase agreements, cash and time deposits. |
|
| Material Fund Change [Text Block] |
|
|
| Updated Prospectus Phone Number |
1-800-621-2550
|
|
| Updated Prospectus Web Address |
<span style="box-sizing: border-box; color: rgb(0, 0, 0); display: inline; flex-wrap: nowrap; font-size: 12px; font-weight: 400; grid-area: auto; line-height: 18px; margin: 0px; overflow: visible; text-align: left; text-align-last: auto; white-space-collapse: preserve-breaks;">dfinview.com/GoldmanSachs</span>
|
|
| C000226253 |
|
|
| Shareholder Report [Line Items] |
|
|
| Fund Name |
Goldman Sachs Strategic Volatility Premium Fund
|
|
| Class Name |
Class P Shares
|
|
| Trading Symbol |
SVPBX
|
|
| Annual or Semi-Annual Statement [Text Block] |
This annual shareholder report contains important information about Goldman Sachs Strategic Volatility Premium Fund (the “Fund”) for the period of September 1, 2025 to August 31, 2026 (the “Period”).
|
|
| Additional Information [Text Block] |
You can find additional information about the Fund at am.gs.com or dfinview.com/GoldmanSachs. You can also request this information by contacting us at 1-800-621-2550.
|
|
| Material Fund Change Notice [Text Block] |
This report describes changes to the Fund that occurred during the Period.
|
|
| Additional Information Phone Number |
1-800-621-2550
|
|
| Additional Information Website |
<span style="box-sizing: border-box; color: rgb(0, 0, 0); display: inline; flex-wrap: nowrap; font-size: 12px; font-weight: 400; grid-area: auto; line-height: 18px; margin: 0px; overflow: visible; text-align: left; text-align-last: auto; white-space-collapse: preserve-breaks;">am.gs.com</span>
|
|
| Expenses [Text Block] |
What were the Fund costs for the Period?Based on a hypothetical $10,000 investment.
Table Summary
Class |
Costs of a $10,000 investment |
Costs paid as a percentage of a $10,000 investment |
P |
$47 |
0.46% | |
|
| Expenses Paid, Amount |
$ 47
|
|
| Expense Ratio, Percent |
0.46%
|
|
| Factors Affecting Performance [Text Block] |
How did the Fund perform and what affected its performance?U.S. fixed income performance was generally positive, shaped most by a significant shift in Federal Reserve monetary policy and a volatile macroeconomic backdrop. U.S. equities delivered strong gains, supported by resilient corporate earnings, solid labor market data and expanding artificial intelligence infrastructure. |
|
| Performance Past Does Not Indicate Future [Text] |
Performance data quoted above represents past performance. Past performance does not guarantee future results.
|
|
| Line Graph [Table Text Block] |
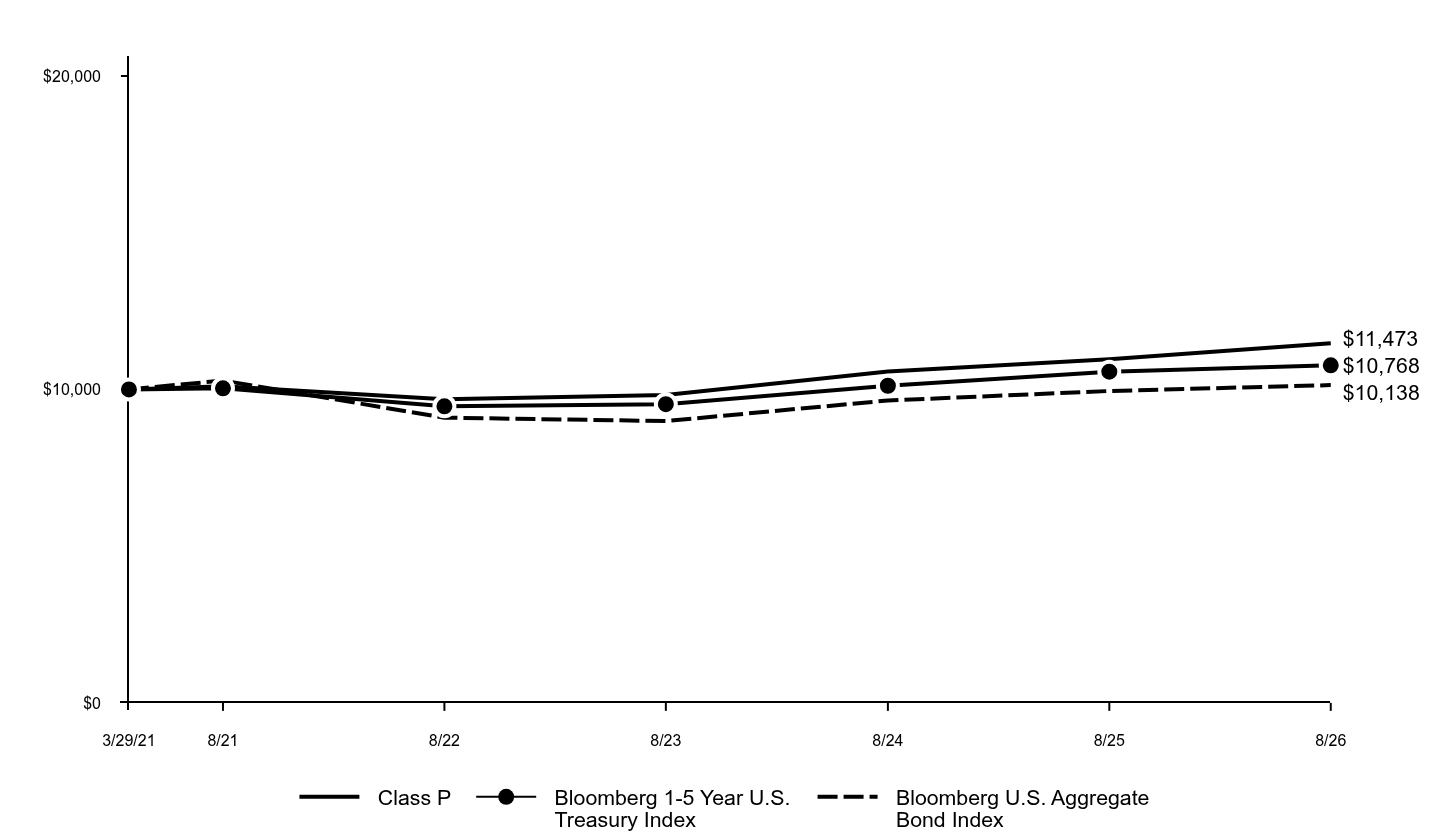
The following graph assumes an initial $10,000 investment in the Fund and compares the initial and subsequent account values at the end of each of the most recently completed 10 fiscal years of the Fund's share class (or less if the share class has been in operation for less than 10 years). The Fund's performance reflects applicable sales charges, if any. For comparative purposes, the performance of the Fund's benchmark and any additional performance benchmark(s) are also shown.
Table Summary
|
Class P |
Bloomberg 1-5 Year U.S. Treasury Index |
Bloomberg U.S. Aggregate Bond Index |
3/29/21 |
$10,000 |
$10,000 |
$10,000 |
8/21 |
$10,100 |
$10,035 |
$10,284 |
8/22 |
$9,687 |
$9,460 |
$9,099 |
8/23 |
$9,822 |
$9,530 |
$8,991 |
8/24 |
$10,573 |
$10,117 |
$9,647 |
8/25 |
$10,965 |
$10,566 |
$9,950 |
8/26 |
$11,473 |
$10,768 |
$10,138 | |
|
| Average Annual Return [Table Text Block] |
Average Annual Total Returns (%)
Table Summary
AATR |
1 Year |
5 Years |
Since Inception |
Class P (Commenced March 29, 2021) |
4.63% |
2.58% |
2.57% |
Bloomberg 1-5 Year U.S. Treasury Index |
1.91% |
1.42% |
1.37% |
Bloomberg U.S. Aggregate Bond Index |
1.89% |
-0.29% |
0.25% | Performance data quoted above represents past performance. Past performance does not guarantee future results. The Fund’s investment return and principal value will fluctuate so that an investor’s shares, when redeemed, may be worth more or less than their original cost. Current performance may be lower or higher than the performance quoted above. Please visit our website at: am.gs.com to obtain the most recent month-end returns. Performance reflects applicable fee waivers and/or expense limitations in effect during the periods shown and in their absence, performance would be reduced. The graph and table do not reflect the deduction of taxes that a shareholder would pay on Fund distributions or redemption of Fund shares. |
|
| Performance Inception Date |
Mar. 29, 2021
|
|
| AssetsNet |
$ 637,297,829
|
|
| Holdings Count | Holding |
72
|
|
| Advisory Fees Paid, Amount |
$ 1,987,516
|
|
| InvestmentCompanyPortfolioTurnover |
0.00%
|
|
| Additional Fund Statistics [Text Block] |
Table Summary
Total Net Assets as of Period End |
$637,297,829 |
# of Portfolio Holdings as of Period End |
72 |
Portfolio Turnover Rate for the Period |
0% |
Total Net Advisory Fees Paid for the Period |
$1,987,516 | |
|
| Holdings [Text Block] |
Asset Class Exposure (%)*
Table Summary
Header |
Gross |
Long |
Short |
Net |
Developed Markets Equity Put Options |
518.9 |
232.6 |
286.3 |
-53.7 |
Fixed Income Put Options |
82.2 |
- |
82.2 |
-82.2 |
Fixed Income Call Options |
83.7 |
- |
83.7 |
-83.7 |
Interest Rate Put Options |
0.8 |
0.8 |
- |
0.8 |
US Equity |
1.3 |
1.3 |
- |
1.3 |
Interest Rate Call Options |
0.8 |
0.8 |
- |
0.8 |
Cash |
40.4 |
23.1 |
17.3 |
5.7 |
Fixed Income |
67.6 |
44.3 |
23.3 |
21.0 |
Short-Term Investments |
94.2 |
94.2 |
- |
94.2 | *Asset class exposure includes the impact of derivatives. "Gross Exposure" represents the sum of the absolute value of long and short notional contract values in U.S. dollars of the Fund's positions (for a given asset class), divided by the Fund's net assets exposure within each asset class. "Net Exposure" represents the net exposure within the Fund to a given asset class, calculated as the difference between long and short exposures. The exposure of option contracts is delta-adjusted. Forward foreign currency exchange contracts for individual currency crosses are aggregated by settlement date and counterparty in the determination of gross exposure. Fixed income exposures are duration-adjusted to the 10-year reference rate of each respective country. "Short-term Investments” includes U.S. Treasuries and other short-term investments, including money market funds, repurchase agreements, cash and time deposits. |
|
| Material Fund Change [Text Block] |
This is a summary of certain changes to the Fund for the Period. For more complete information, you may review the Fund's next prospectus, which we expect to be available by December 29, 2026 at dfinview.com/GoldmanSachs or upon request at 1-800-621-2550. Effective December 29, 2025, investments related to U.S. government securities was added as a principal risk of the Fund. |
|
| Material Fund Change Risks Change [Text Block] |
Effective December 29, 2025, investments related to U.S. government securities was added as a principal risk of the Fund.
|
|
| Summary of Change Legend [Text Block] |
This is a summary of certain changes to the Fund for the Period. For more complete information, you may review the Fund's next prospectus, which we expect to be available by December 29, 2026 at dfinview.com/GoldmanSachs or upon request at 1-800-621-2550.
|
|
| Updated Prospectus Phone Number |
1-800-621-2550
|
|
| Updated Prospectus Web Address |
<span style="box-sizing: border-box; color: rgb(0, 0, 0); display: inline; flex-wrap: nowrap; font-size: 12px; font-weight: 400; grid-area: auto; line-height: 18px; margin: 0px; overflow: visible; text-align: left; text-align-last: auto; white-space-collapse: preserve-breaks;">dfinview.com/GoldmanSachs</span>
|
|
| C000226252 |
|
|
| Shareholder Report [Line Items] |
|
|
| Fund Name |
Goldman Sachs Strategic Volatility Premium Fund
|
|
| Class Name |
Institutional Shares
|
|
| Trading Symbol |
SVPFX
|
|
| Annual or Semi-Annual Statement [Text Block] |
This annual shareholder report contains important information about Goldman Sachs Strategic Volatility Premium Fund (the “Fund”) for the period of September 1, 2025 to August 31, 2026 (the “Period”).
|
|
| Additional Information [Text Block] |
You can find additional information about the Fund at am.gs.com or dfinview.com/GoldmanSachs. You can also request this information by contacting us at 1-800-621-2550.
|
|
| Material Fund Change Notice [Text Block] |
This report describes changes to the Fund that occurred during the Period.
|
|
| Additional Information Phone Number |
1-800-621-2550
|
|
| Additional Information Website |
<span style="box-sizing: border-box; color: rgb(0, 0, 0); display: inline; flex-wrap: nowrap; font-size: 12px; font-weight: 400; grid-area: auto; line-height: 18px; margin: 0px; overflow: visible; text-align: left; text-align-last: auto; white-space-collapse: preserve-breaks;">am.gs.com</span>
|
|
| Expenses [Text Block] |
What were the Fund costs for the Period?Based on a hypothetical $10,000 investment.
Table Summary
Class |
Costs of a $10,000 investment |
Costs paid as a percentage of a $10,000 investment |
Institutional |
$48 |
0.47% | |
|
| Expenses Paid, Amount |
$ 48
|
|
| Expense Ratio, Percent |
0.47%
|
|
| Factors Affecting Performance [Text Block] |
How did the Fund perform and what affected its performance?U.S. fixed income performance was generally positive, shaped most by a significant shift in Federal Reserve monetary policy and a volatile macroeconomic backdrop. U.S. equities delivered strong gains, supported by resilient corporate earnings, solid labor market data and expanding artificial intelligence infrastructure. |
|
| Performance Past Does Not Indicate Future [Text] |
Performance data quoted above represents past performance. Past performance does not guarantee future results.
|
|
| Line Graph [Table Text Block] |
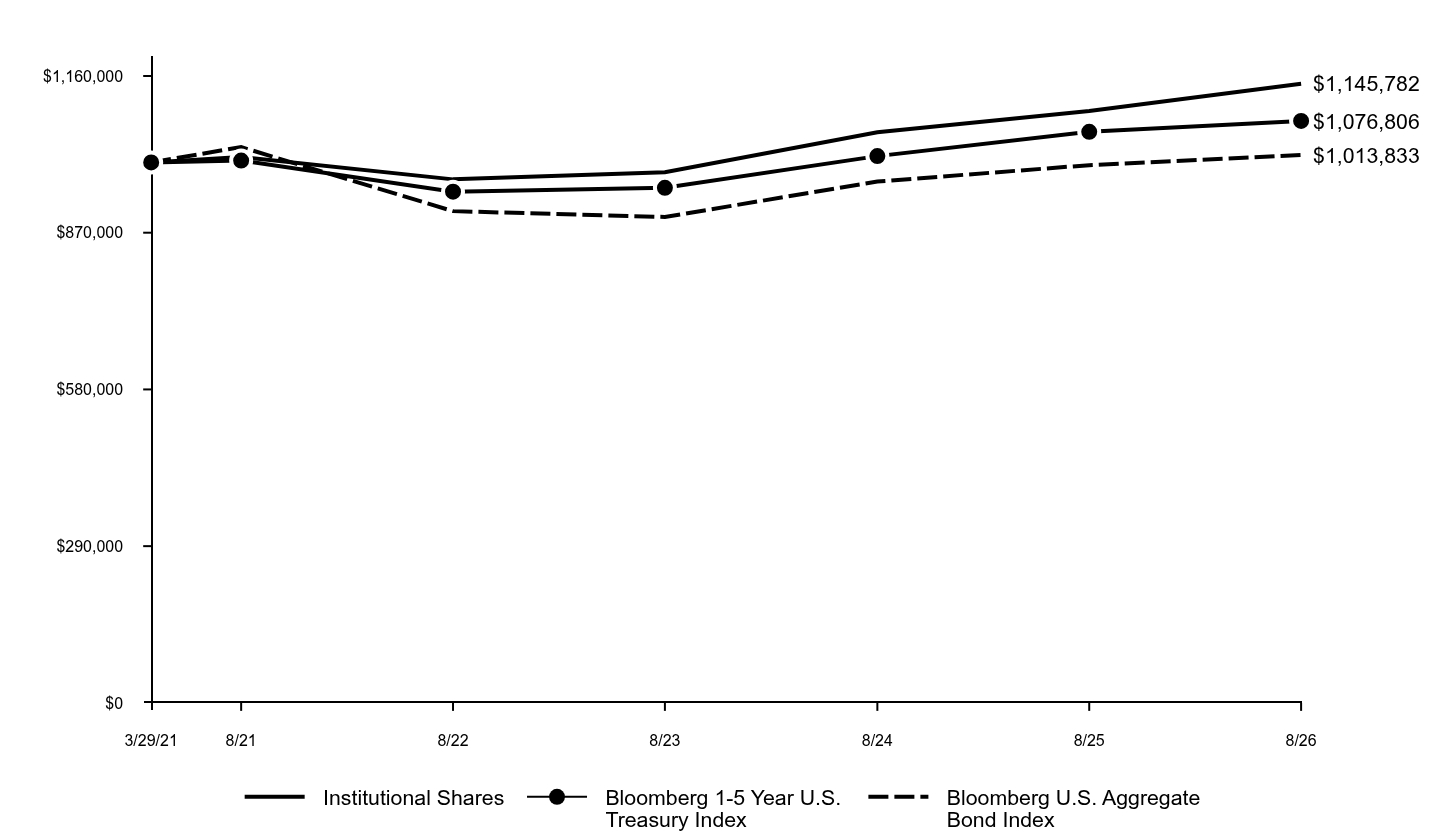
The following graph assumes an initial $1,000,000 investment in the Fund and compares the initial and subsequent account values at the end of each of the most recently completed 10 fiscal years of the Fund's share class (or less if the share class has been in operation for less than 10 years). The Fund's performance reflects applicable sales charges, if any. For comparative purposes, the performance of the Fund's benchmark and any additional performance benchmark(s) are also shown.
Table Summary
|
Institutional Shares |
Bloomberg 1-5 Year U.S. Treasury Index |
Bloomberg U.S. Aggregate Bond Index |
3/29/21 |
$1,000,000 |
$1,000,000 |
$1,000,000 |
8/21 |
$1,010,000 |
$1,003,500 |
$1,028,400 |
8/22 |
$968,691 |
$945,999 |
$909,928 |
8/23 |
$982,059 |
$953,000 |
$899,100 |
8/24 |
$1,056,008 |
$1,011,705 |
$964,734 |
8/25 |
$1,095,080 |
$1,056,624 |
$995,027 |
8/26 |
$1,145,782 |
$1,076,806 |
$1,013,833 | |
|
| Average Annual Return [Table Text Block] |
Average Annual Total Returns (%)
Table Summary
AATR |
1 Year |
5 Years |
Since Inception |
Institutional Shares (Commenced March 29, 2021) |
4.63% |
2.55% |
2.54% |
Bloomberg 1-5 Year U.S. Treasury Index |
1.91% |
1.42% |
1.37% |
Bloomberg U.S. Aggregate Bond Index |
1.89% |
-0.29% |
0.25% | Performance data quoted above represents past performance. Past performance does not guarantee future results. The Fund’s investment return and principal value will fluctuate so that an investor’s shares, when redeemed, may be worth more or less than their original cost. Current performance may be lower or higher than the performance quoted above. Please visit our website at: am.gs.com to obtain the most recent month-end returns. Performance reflects applicable fee waivers and/or expense limitations in effect during the periods shown and in their absence, performance would be reduced. The graph and table do not reflect the deduction of taxes that a shareholder would pay on Fund distributions or redemption of Fund shares. |
|
| Performance Inception Date |
Mar. 29, 2021
|
|
| AssetsNet |
$ 637,297,829
|
|
| Holdings Count | Holding |
72
|
|
| Advisory Fees Paid, Amount |
$ 1,987,516
|
|
| InvestmentCompanyPortfolioTurnover |
0.00%
|
|
| Additional Fund Statistics [Text Block] |
Table Summary
Total Net Assets as of Period End |
$637,297,829 |
# of Portfolio Holdings as of Period End |
72 |
Portfolio Turnover Rate for the Period |
0% |
Total Net Advisory Fees Paid for the Period |
$1,987,516 | |
|
| Holdings [Text Block] |
Asset Class Exposure (%)*
Table Summary
Header |
Gross |
Long |
Short |
Net |
Developed Markets Equity Put Options |
518.9 |
232.6 |
286.3 |
-53.7 |
Fixed Income Put Options |
82.2 |
- |
82.2 |
-82.2 |
Fixed Income Call Options |
83.7 |
- |
83.7 |
-83.7 |
Interest Rate Put Options |
0.8 |
0.8 |
- |
0.8 |
US Equity |
1.3 |
1.3 |
- |
1.3 |
Interest Rate Call Options |
0.8 |
0.8 |
- |
0.8 |
Cash |
40.4 |
23.1 |
17.3 |
5.7 |
Fixed Income |
67.6 |
44.3 |
23.3 |
21.0 |
Short-Term Investments |
94.2 |
94.2 |
- |
94.2 | *Asset class exposure includes the impact of derivatives. "Gross Exposure" represents the sum of the absolute value of long and short notional contract values in U.S. dollars of the Fund's positions (for a given asset class), divided by the Fund's net assets exposure within each asset class. "Net Exposure" represents the net exposure within the Fund to a given asset class, calculated as the difference between long and short exposures. The exposure of option contracts is delta-adjusted. Forward foreign currency exchange contracts for individual currency crosses are aggregated by settlement date and counterparty in the determination of gross exposure. Fixed income exposures are duration-adjusted to the 10-year reference rate of each respective country. "Short-term Investments” includes U.S. Treasuries and other short-term investments, including money market funds, repurchase agreements, cash and time deposits. |
|
| Material Fund Change [Text Block] |
This is a summary of certain changes to the Fund for the Period. For more complete information, you may review the Fund's next prospectus, which we expect to be available by December 29, 2026 at dfinview.com/GoldmanSachs or upon request at 1-800-621-2550. Effective December 29, 2025, investments related to U.S. government securities was added as a principal risk of the Fund. |
|
| Material Fund Change Risks Change [Text Block] |
Effective December 29, 2025, investments related to U.S. government securities was added as a principal risk of the Fund.
|
|
| Summary of Change Legend [Text Block] |
This is a summary of certain changes to the Fund for the Period. For more complete information, you may review the Fund's next prospectus, which we expect to be available by December 29, 2026 at dfinview.com/GoldmanSachs or upon request at 1-800-621-2550.
|
|
| Updated Prospectus Phone Number |
1-800-621-2550
|
|
| Updated Prospectus Web Address |
<span style="box-sizing: border-box; color: rgb(0, 0, 0); display: inline; flex-wrap: nowrap; font-size: 12px; font-weight: 400; grid-area: auto; line-height: 18px; margin: 0px; overflow: visible; text-align: left; text-align-last: auto; white-space-collapse: preserve-breaks;">dfinview.com/GoldmanSachs</span>
|
|
| C000201713 |
|
|
| Shareholder Report [Line Items] |
|
|
| Fund Name |
Goldman Sachs Tactical Tilt Overlay Fund
|
|
| Class Name |
Class P Shares
|
|
| Trading Symbol |
GSLPX
|
|
| Annual or Semi-Annual Statement [Text Block] |
This annual shareholder report contains important information about Goldman Sachs Tactical Tilt Overlay Fund (the “Fund”) for the period of September 1, 2025 to August 31, 2026 (the “Period”).
|
|
| Additional Information [Text Block] |
You can find additional information about the Fund at am.gs.com or dfinview.com/GoldmanSachs. You can also request this information by contacting us at 1-800-621-2550.
|
|
| Material Fund Change Notice [Text Block] |
This report describes changes to the Fund that occurred during the Period.
|
|
| Additional Information Phone Number |
1-800-621-2550
|
|
| Additional Information Website |
<span style="box-sizing: border-box; color: rgb(0, 0, 0); display: inline; flex-wrap: nowrap; font-size: 12px; font-weight: 400; grid-area: auto; line-height: 18px; margin: 0px; overflow: visible; text-align: left; text-align-last: auto; white-space-collapse: preserve-breaks;">am.gs.com</span>
|
|
| Expenses [Text Block] |
What were the Fund costs for the Period?Based on a hypothetical $10,000 investment.
Table Summary
Class |
Costs of a $10,000 investment |
Costs paid as a percentage of a $10,000 investment |
P |
$73 |
0.72% | |
|
| Expenses Paid, Amount |
$ 73
|
|
| Expense Ratio, Percent |
0.72%
|
|
| Factors Affecting Performance [Text Block] |
How did the Fund perform and what affected its performance?Risk assets proved resilient despite geopolitical shocks, persistent inflation and shifting monetary policy expectations. Solid corporate earnings, economic activity and technology sector strength supported equities. Commodities fluctuated amid energy price volatility, while inflation concerns pushed up bond yields. |
|
| Performance Past Does Not Indicate Future [Text] |
Performance data quoted above represents past performance. Past performance does not guarantee future results.
|
|
| Line Graph [Table Text Block] |
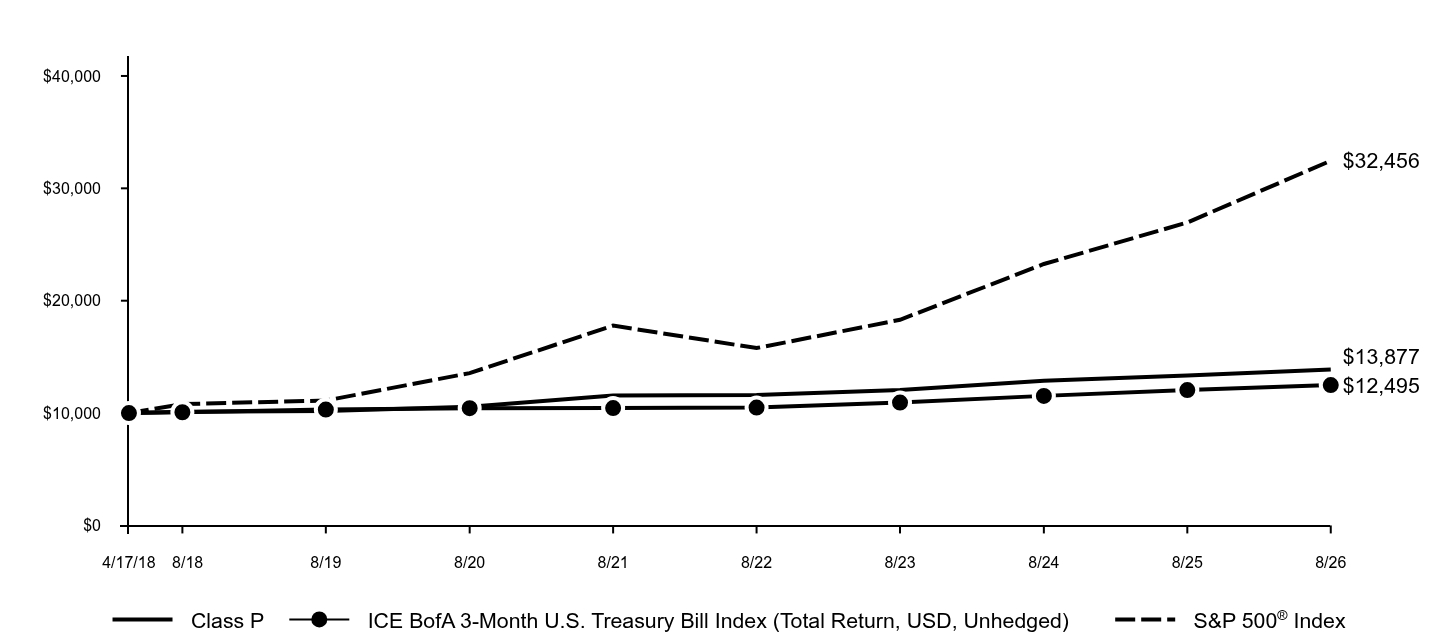
The following graph assumes an initial $10,000 investment in the Fund and compares the initial and subsequent account values at the end of each of the most recently completed 10 fiscal years of the Fund's share class (or less if the share class has been in operation for less than 10 years). The Fund's performance reflects applicable sales charges, if any. For comparative purposes, the performance of the Fund's benchmark and any additional performance benchmark(s) are also shown.
Table Summary
|
Class P |
ICE BofA 3-Month U.S. Treasury Bill Index (Total Return, USD, Unhedged) |
S&P 500® Index |
4/17/18 |
$10,000 |
$10,000 |
$10,000 |
8/18 |
$10,113 |
$10,071 |
$10,801 |
8/19 |
$10,173 |
$10,309 |
$11,116 |
8/20 |
$10,559 |
$10,439 |
$13,555 |
8/21 |
$11,559 |
$10,447 |
$17,781 |
8/22 |
$11,616 |
$10,486 |
$15,784 |
8/23 |
$12,051 |
$10,931 |
$18,300 |
8/24 |
$12,878 |
$11,530 |
$23,266 |
8/25 |
$13,351 |
$12,048 |
$26,961 |
8/26 |
$13,877 |
$12,495 |
$32,456 | |
|
| Average Annual Return [Table Text Block] |
Average Annual Total Returns (%)
Table Summary
AATR |
1 Year |
5 Years |
Since Inception |
Class P (Commenced April 17, 2018) |
3.94% |
3.72% |
3.99% |
ICE BofA 3-Month U.S. Treasury Bill Index (Total Return, USD, Unhedged) |
3.71% |
3.64% |
2.69% |
S&P 500® Index |
20.38% |
12.78% |
15.08% | Performance data quoted above represents past performance. Past performance does not guarantee future results. The Fund’s investment return and principal value will fluctuate so that an investor’s shares, when redeemed, may be worth more or less than their original cost. Current performance may be lower or higher than the performance quoted above. Please visit our website at: am.gs.com to obtain the most recent month-end returns. Performance reflects applicable fee waivers and/or expense limitations in effect during the periods shown and in their absence, performance would be reduced. The graph and table do not reflect the deduction of taxes that a shareholder would pay on Fund distributions or redemption of Fund shares. |
|
| Performance Inception Date |
Apr. 17, 2018
|
|
| AssetsNet |
$ 5,223,578,025
|
|
| Holdings Count | Holding |
226
|
|
| Advisory Fees Paid, Amount |
$ 33,978,839
|
|
| InvestmentCompanyPortfolioTurnover |
106.00%
|
|
| Additional Fund Statistics [Text Block] |
Table Summary
Total Net Assets as of Period End |
$5,223,578,025 |
# of Portfolio Holdings as of Period End |
226 |
Portfolio Turnover Rate for the Period |
106% |
Total Net Advisory Fees Paid for the Period |
$33,978,839 | |
|
| Holdings [Text Block] |
Asset Class Exposure (%)Footnote Reference*
Table Summary
Header |
Gross |
Long |
Short |
Net |
Trend-Based Rotation Tilt |
1.8 |
1.8 |
- |
1.8 |
Long Spot Uranium |
0.8 |
0.8 |
- |
0.8 |
Long Mexico Equities |
1.2 |
1.2 |
- |
1.2 |
Long South Africa Equities |
2.6 |
2.6 |
- |
2.6 |
Ensemble Timing System Tilt (S&P 500) |
0.1 |
0.1 |
- |
0.1 |
Long European Healthcare Equities |
3.8 |
3.8 |
- |
3.8 |
Long Indian Equities |
1.9 |
1.9 |
- |
1.9 |
N.A. Tech Software Equity OptionsFootnote Reference^ |
- |
- |
- |
- |
EURO Stoxx Banks OptionsFootnote Reference^ |
- |
- |
- |
- |
Korean Equity Options |
0.3 |
0.3 |
- |
0.3 |
Long US 5y TIPS |
8.7 |
8.7 |
- |
8.7 |
Long UK 5y Gilt |
2.5 |
2.5 |
- |
2.5 |
US Healthcare Equities Options |
0.3 |
0.3 |
- |
0.3 |
Long INR vs Short EUR |
1.3 |
- |
1.3 |
-1.3 |
Long INR vs Short SGD |
1.3 |
- |
1.3 |
-1.3 |
Investment Grade Fixed Income |
78.0 |
78.0 |
- |
78.0 |
| Footnote |
Description |
Footnote* |
Tilts exposure includes the impact of derivatives. "Gross Exposure" represents the sum of the absolute value of long and short notional contract values in U.S. dollars of the Fund's positions (for a tilt exposure), divided by the Fund's total net assets. "Net Exposure" represents the net exposure within the Fund to a given tilt position, calculated as the difference between long and short exposures. The exposure of option contracts is delta-adjusted. Fixed income exposures are duration-adjusted to the 10-year reference rate of each respective country. |
Footnote^ |
Amounts are rounding to zero. | |
|
| Material Fund Change [Text Block] |
This is a summary of certain changes to the Fund for the Period. For more complete information, you may review the Fund's next prospectus, which we expect to be available by December 29, 2026 at dfinview.com/GoldmanSachs or upon request at 1-800-621-2550. Effective December 29, 2025, industry concentration risk was removed as a principal risk of the Fund. |
|
| Material Fund Change Risks Change [Text Block] |
Effective December 29, 2025, industry concentration risk was removed as a principal risk of the Fund.
|
|
| Summary of Change Legend [Text Block] |
This is a summary of certain changes to the Fund for the Period. For more complete information, you may review the Fund's next prospectus, which we expect to be available by December 29, 2026 at dfinview.com/GoldmanSachs or upon request at 1-800-621-2550.
|
|
| Updated Prospectus Phone Number |
1-800-621-2550
|
|
| Updated Prospectus Web Address |
<span style="box-sizing: border-box; color: rgb(0, 0, 0); display: inline; flex-wrap: nowrap; font-size: 12px; font-weight: 400; grid-area: auto; line-height: 18px; margin: 0px; overflow: visible; text-align: left; text-align-last: auto; white-space-collapse: preserve-breaks;">dfinview.com/GoldmanSachs</span>
|
|
| C000196984 |
|
|
| Shareholder Report [Line Items] |
|
|
| Fund Name |
Goldman Sachs Tactical Tilt Overlay Fund
|
|
| Class Name |
Class R6 Shares
|
|
| Trading Symbol |
TTRFX
|
|
| Annual or Semi-Annual Statement [Text Block] |
This annual shareholder report contains important information about Goldman Sachs Tactical Tilt Overlay Fund (the “Fund”) for the period of September 1, 2025 to August 31, 2026 (the “Period”).
|
|
| Additional Information [Text Block] |
You can find additional information about the Fund at am.gs.com or dfinview.com/GoldmanSachs. You can also request this information by contacting us at 1-800-621-2550.
|
|
| Material Fund Change Notice [Text Block] |
This report describes changes to the Fund that occurred during the Period.
|
|
| Additional Information Phone Number |
1-800-621-2550
|
|
| Additional Information Website |
<span style="box-sizing: border-box; color: rgb(0, 0, 0); display: inline; flex-wrap: nowrap; font-size: 12px; font-weight: 400; grid-area: auto; line-height: 18px; margin: 0px; overflow: visible; text-align: left; text-align-last: auto; white-space-collapse: preserve-breaks;">am.gs.com</span>
|
|
| Expenses [Text Block] |
What were the Fund costs for the Period?Based on a hypothetical $10,000 investment.
Table Summary
Class |
Costs of a $10,000 investment |
Costs paid as a percentage of a $10,000 investment |
R6 |
$73 |
0.72% | |
|
| Expenses Paid, Amount |
$ 73
|
|
| Expense Ratio, Percent |
0.72%
|
|
| Factors Affecting Performance [Text Block] |
How did the Fund perform and what affected its performance?Risk assets proved resilient despite geopolitical shocks, persistent inflation and shifting monetary policy expectations. Solid corporate earnings, economic activity and technology sector strength supported equities. Commodities fluctuated amid energy price volatility, while inflation concerns pushed up bond yields. |
|
| Performance Past Does Not Indicate Future [Text] |
Performance data quoted above represents past performance. Past performance does not guarantee future results.
|
|
| Line Graph [Table Text Block] |
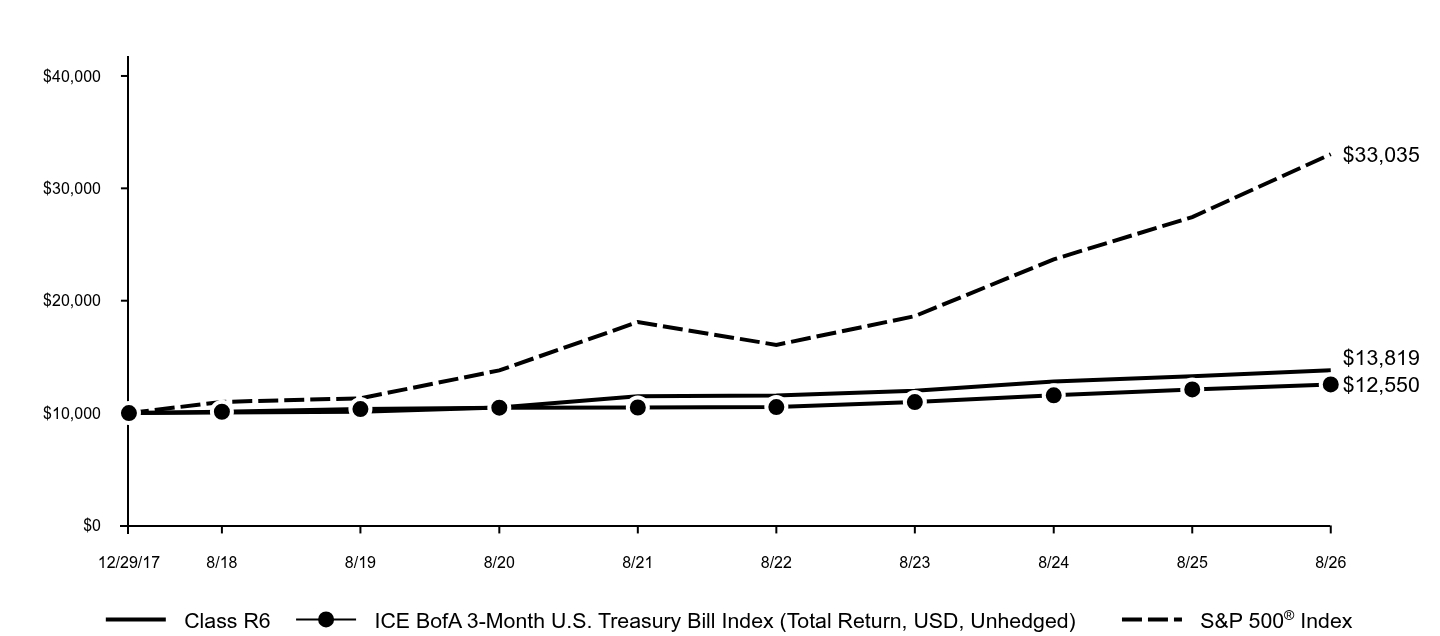
The following graph assumes an initial $10,000 investment in the Fund and compares the initial and subsequent account values at the end of each of the most recently completed 10 fiscal years of the Fund's share class (or less if the share class has been in operation for less than 10 years). The Fund's performance reflects applicable sales charges, if any. For comparative purposes, the performance of the Fund's benchmark and any additional performance benchmark(s) are also shown.
Table Summary
|
Class R6 |
ICE BofA 3-Month U.S. Treasury Bill Index (Total Return, USD, Unhedged) |
S&P 500® Index |
12/29/17 |
$10,000 |
$10,000 |
$10,000 |
8/18 |
$10,061 |
$10,115 |
$10,994 |
8/19 |
$10,119 |
$10,354 |
$11,315 |
8/20 |
$10,505 |
$10,484 |
$13,798 |
8/21 |
$11,501 |
$10,493 |
$18,098 |
8/22 |
$11,557 |
$10,531 |
$16,066 |
8/23 |
$11,989 |
$10,979 |
$18,627 |
8/24 |
$12,812 |
$11,581 |
$23,682 |
8/25 |
$13,282 |
$12,101 |
$27,443 |
8/26 |
$13,819 |
$12,550 |
$33,035 | |
|
| Average Annual Return [Table Text Block] |
Average Annual Total Returns (%)
Table Summary
AATR |
1 Year |
5 Years |
Since Inception |
Class R6 (Commenced December 29, 2017) |
4.04% |
3.74% |
3.80% |
ICE BofA 3-Month U.S. Treasury Bill Index (Total Return, USD, Unhedged) |
3.71% |
3.64% |
2.65% |
S&P 500® Index |
20.38% |
12.78% |
14.76% | Performance data quoted above represents past performance. Past performance does not guarantee future results. The Fund’s investment return and principal value will fluctuate so that an investor’s shares, when redeemed, may be worth more or less than their original cost. Current performance may be lower or higher than the performance quoted above. Please visit our website at: am.gs.com to obtain the most recent month-end returns. Performance reflects applicable fee waivers and/or expense limitations in effect during the periods shown and in their absence, performance would be reduced. The graph and table do not reflect the deduction of taxes that a shareholder would pay on Fund distributions or redemption of Fund shares. |
|
| Performance Inception Date |
Dec. 29, 2017
|
|
| AssetsNet |
$ 5,223,578,025
|
|
| Holdings Count | Holding |
226
|
|
| Advisory Fees Paid, Amount |
$ 33,978,839
|
|
| InvestmentCompanyPortfolioTurnover |
106.00%
|
|
| Additional Fund Statistics [Text Block] |
Table Summary
Total Net Assets as of Period End |
$5,223,578,025 |
# of Portfolio Holdings as of Period End |
226 |
Portfolio Turnover Rate for the Period |
106% |
Total Net Advisory Fees Paid for the Period |
$33,978,839 | |
|
| Holdings [Text Block] |
Asset Class Exposure (%)Footnote Reference*
Table Summary
Header |
Gross |
Long |
Short |
Net |
Trend-Based Rotation Tilt |
1.8 |
1.8 |
- |
1.8 |
Long Spot Uranium |
0.8 |
0.8 |
- |
0.8 |
Long Mexico Equities |
1.2 |
1.2 |
- |
1.2 |
Long South Africa Equities |
2.6 |
2.6 |
- |
2.6 |
Ensemble Timing System Tilt (S&P 500) |
0.1 |
0.1 |
- |
0.1 |
Long European Healthcare Equities |
3.8 |
3.8 |
- |
3.8 |
Long Indian Equities |
1.9 |
1.9 |
- |
1.9 |
N.A. Tech Software Equity OptionsFootnote Reference^ |
- |
- |
- |
- |
EURO Stoxx Banks OptionsFootnote Reference^ |
- |
- |
- |
- |
Korean Equity Options |
0.3 |
0.3 |
- |
0.3 |
Long US 5y TIPS |
8.7 |
8.7 |
- |
8.7 |
Long UK 5y Gilt |
2.5 |
2.5 |
- |
2.5 |
US Healthcare Equities Options |
0.3 |
0.3 |
- |
0.3 |
Long INR vs Short EUR |
1.3 |
- |
1.3 |
-1.3 |
Long INR vs Short SGD |
1.3 |
- |
1.3 |
-1.3 |
Investment Grade Fixed Income |
78.0 |
78.0 |
- |
78.0 |
| Footnote |
Description |
Footnote* |
Tilts exposure includes the impact of derivatives. "Gross Exposure" represents the sum of the absolute value of long and short notional contract values in U.S. dollars of the Fund's positions (for a tilt exposure), divided by the Fund's total net assets. "Net Exposure" represents the net exposure within the Fund to a given tilt position, calculated as the difference between long and short exposures. The exposure of option contracts is delta-adjusted. Fixed income exposures are duration-adjusted to the 10-year reference rate of each respective country. |
Footnote^ |
Amounts are rounding to zero. | |
|
| Material Fund Change [Text Block] |
This is a summary of certain changes to the Fund for the Period. For more complete information, you may review the Fund's next prospectus, which we expect to be available by December 29, 2026 at dfinview.com/GoldmanSachs or upon request at 1-800-621-2550. Effective December 29, 2025, industry concentration risk was removed as a principal risk of the Fund. |
|
| Material Fund Change Risks Change [Text Block] |
Effective December 29, 2025, industry concentration risk was removed as a principal risk of the Fund.
|
|
| Summary of Change Legend [Text Block] |
This is a summary of certain changes to the Fund for the Period. For more complete information, you may review the Fund's next prospectus, which we expect to be available by December 29, 2026 at dfinview.com/GoldmanSachs or upon request at 1-800-621-2550.
|
|
| Updated Prospectus Phone Number |
1-800-621-2550
|
|
| Updated Prospectus Web Address |
<span style="box-sizing: border-box; color: rgb(0, 0, 0); display: inline; flex-wrap: nowrap; font-size: 12px; font-weight: 400; grid-area: auto; line-height: 18px; margin: 0px; overflow: visible; text-align: left; text-align-last: auto; white-space-collapse: preserve-breaks;">dfinview.com/GoldmanSachs</span>
|
|
| C000144475 |
|
|
| Shareholder Report [Line Items] |
|
|
| Fund Name |
Goldman Sachs Tactical Tilt Overlay Fund
|
|
| Class Name |
Institutional Shares
|
|
| Trading Symbol |
TTIFX
|
|
| Annual or Semi-Annual Statement [Text Block] |
This annual shareholder report contains important information about Goldman Sachs Tactical Tilt Overlay Fund (the “Fund”) for the period of September 1, 2025 to August 31, 2026 (the “Period”).
|
|
| Additional Information [Text Block] |
You can find additional information about the Fund at am.gs.com or dfinview.com/GoldmanSachs. You can also request this information by contacting us at 1-800-621-2550.
|
|
| Material Fund Change Notice [Text Block] |
This report describes changes to the Fund that occurred during the Period.
|
|
| Additional Information Phone Number |
1-800-621-2550
|
|
| Additional Information Website |
<span style="box-sizing: border-box; color: rgb(0, 0, 0); display: inline; flex-wrap: nowrap; font-size: 12px; font-weight: 400; grid-area: auto; line-height: 18px; margin: 0px; overflow: visible; text-align: left; text-align-last: auto; white-space-collapse: preserve-breaks;">am.gs.com</span>
|
|
| Expenses [Text Block] |
What were the Fund costs for the Period?Based on a hypothetical $10,000 investment.
Table Summary
Class |
Costs of a $10,000 investment |
Costs paid as a percentage of a $10,000 investment |
Institutional |
$74 |
0.73% | |
|
| Expenses Paid, Amount |
$ 74
|
|
| Expense Ratio, Percent |
0.73%
|
|
| Factors Affecting Performance [Text Block] |
How did the Fund perform and what affected its performance?Risk assets proved resilient despite geopolitical shocks, persistent inflation and shifting monetary policy expectations. Solid corporate earnings, economic activity and technology sector strength supported equities. Commodities fluctuated amid energy price volatility, while inflation concerns pushed up bond yields. |
|
| Performance Past Does Not Indicate Future [Text] |
Performance data quoted above represents past performance. Past performance does not guarantee future results.
|
|
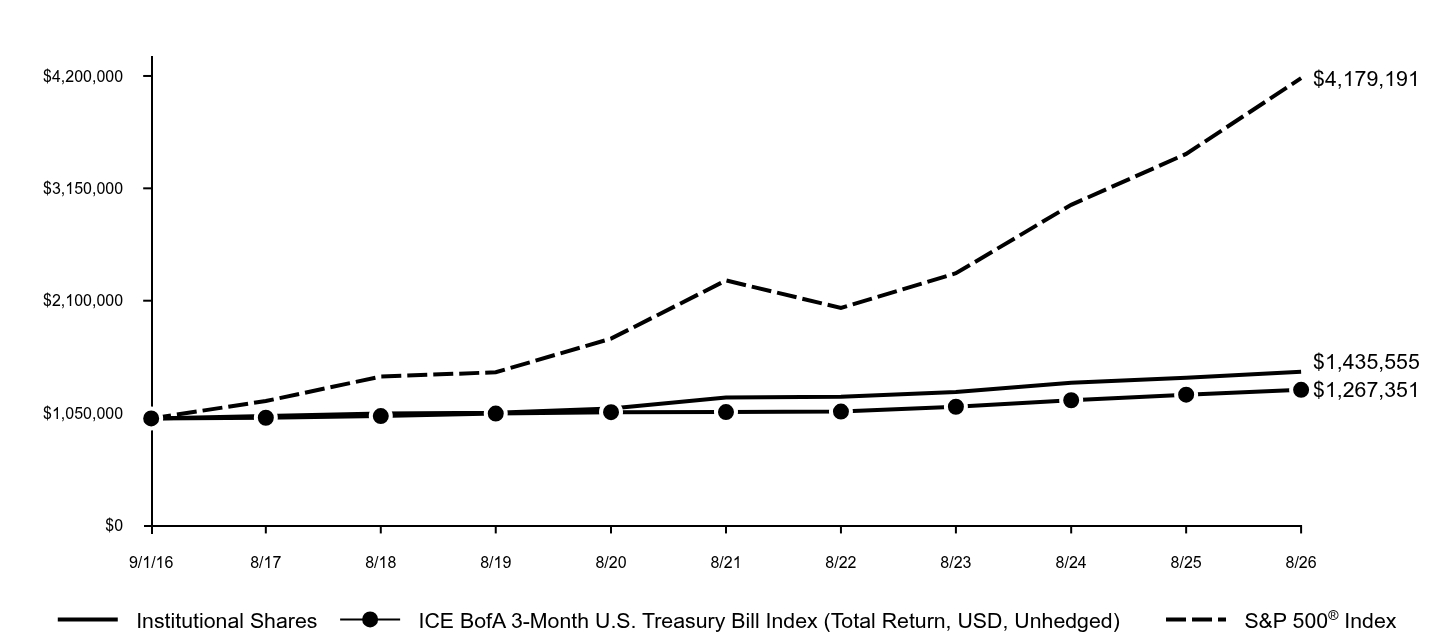
| Line Graph [Table Text Block] |
The following graph assumes an initial $1,000,000 investment in the Fund and compares the initial and subsequent account values at the end of each of the most recently completed 10 fiscal years of the Fund's share class (or less if the share class has been in operation for less than 10 years). The Fund's performance reflects applicable sales charges, if any. For comparative purposes, the performance of the Fund's benchmark and any additional performance benchmark(s) are also shown.
Table Summary
|
Institutional Shares |
ICE BofA 3-Month U.S. Treasury Bill Index (Total Return, USD, Unhedged) |
S&P 500® Index |
9/1/16 |
$1,000,000 |
$1,000,000 |
$1,000,000 |
8/17 |
$1,021,700 |
$1,006,200 |
$1,162,300 |
8/18 |
$1,046,119 |
$1,021,494 |
$1,390,808 |
8/19 |
$1,053,546 |
$1,045,602 |
$1,431,420 |
8/20 |
$1,092,843 |
$1,058,776 |
$1,745,473 |
8/21 |
$1,195,898 |
$1,059,623 |
$2,289,537 |
8/22 |
$1,201,758 |
$1,063,544 |
$2,032,422 |
8/23 |
$1,247,666 |
$1,108,744 |
$2,356,390 |
8/24 |
$1,332,632 |
$1,169,504 |
$2,995,915 |
8/25 |
$1,380,740 |
$1,222,014 |
$3,471,666 |
8/26 |
$1,435,555 |
$1,267,351 |
$4,179,191 | |
|
| Average Annual Return [Table Text Block] |
Average Annual Total Returns (%)
Table Summary
AATR |
1 Year |
5 Years |
10 Years |
Institutional Shares |
3.97% |
3.72% |
3.68% |
ICE BofA 3-Month U.S. Treasury Bill Index (Total Return, USD, Unhedged) |
3.71% |
3.64% |
2.40% |
S&P 500® Index |
20.38% |
12.78% |
15.37% | Performance data quoted above represents past performance. Past performance does not guarantee future results. The Fund’s investment return and principal value will fluctuate so that an investor’s shares, when redeemed, may be worth more or less than their original cost. Current performance may be lower or higher than the performance quoted above. Please visit our website at: am.gs.com to obtain the most recent month-end returns. Performance reflects applicable fee waivers and/or expense limitations in effect during the periods shown and in their absence, performance would be reduced. The graph and table do not reflect the deduction of taxes that a shareholder would pay on Fund distributions or redemption of Fund shares. |
|
| AssetsNet |
$ 5,223,578,025
|
|
| Holdings Count | Holding |
226
|
|
| Advisory Fees Paid, Amount |
$ 33,978,839
|
|
| InvestmentCompanyPortfolioTurnover |
106.00%
|
|
| Additional Fund Statistics [Text Block] |
Table Summary
Total Net Assets as of Period End |
$5,223,578,025 |
# of Portfolio Holdings as of Period End |
226 |
Portfolio Turnover Rate for the Period |
106% |
Total Net Advisory Fees Paid for the Period |
$33,978,839 | |
|
| Holdings [Text Block] |
Asset Class Exposure (%)Footnote Reference*
Table Summary
Header |
Gross |
Long |
Short |
Net |
Trend-Based Rotation Tilt |
1.8 |
1.8 |
- |
1.8 |
Long Spot Uranium |
0.8 |
0.8 |
- |
0.8 |
Long Mexico Equities |
1.2 |
1.2 |
- |
1.2 |
Long South Africa Equities |
2.6 |
2.6 |
- |
2.6 |
Ensemble Timing System Tilt (S&P 500) |
0.1 |
0.1 |
- |
0.1 |
Long European Healthcare Equities |
3.8 |
3.8 |
- |
3.8 |
Long Indian Equities |
1.9 |
1.9 |
- |
1.9 |
N.A. Tech Software Equity OptionsFootnote Reference^ |
- |
- |
- |
- |
EURO Stoxx Banks OptionsFootnote Reference^ |
- |
- |
- |
- |
Korean Equity Options |
0.3 |
0.3 |
- |
0.3 |
Long US 5y TIPS |
8.7 |
8.7 |
- |
8.7 |
Long UK 5y Gilt |
2.5 |
2.5 |
- |
2.5 |
US Healthcare Equities Options |
0.3 |
0.3 |
- |
0.3 |
Long INR vs Short EUR |
1.3 |
- |
1.3 |
-1.3 |
Long INR vs Short SGD |
1.3 |
- |
1.3 |
-1.3 |
Investment Grade Fixed Income |
78.0 |
78.0 |
- |
78.0 |
| Footnote |
Description |
Footnote* |
Tilts exposure includes the impact of derivatives. "Gross Exposure" represents the sum of the absolute value of long and short notional contract values in U.S. dollars of the Fund's positions (for a tilt exposure), divided by the Fund's total net assets. "Net Exposure" represents the net exposure within the Fund to a given tilt position, calculated as the difference between long and short exposures. The exposure of option contracts is delta-adjusted. Fixed income exposures are duration-adjusted to the 10-year reference rate of each respective country. |
Footnote^ |
Amounts are rounding to zero. | |
|
| Material Fund Change [Text Block] |
This is a summary of certain changes to the Fund for the Period. For more complete information, you may review the Fund's next prospectus, which we expect to be available by December 29, 2026 at dfinview.com/GoldmanSachs or upon request at 1-800-621-2550. Effective December 29, 2025, industry concentration risk was removed as a principal risk of the Fund. |
|
| Material Fund Change Risks Change [Text Block] |
Effective December 29, 2025, industry concentration risk was removed as a principal risk of the Fund.
|
|
| Summary of Change Legend [Text Block] |
This is a summary of certain changes to the Fund for the Period. For more complete information, you may review the Fund's next prospectus, which we expect to be available by December 29, 2026 at dfinview.com/GoldmanSachs or upon request at 1-800-621-2550.
|
|
| Updated Prospectus Phone Number |
1-800-621-2550
|
|
| Updated Prospectus Web Address |
<span style="box-sizing: border-box; color: rgb(0, 0, 0); display: inline; flex-wrap: nowrap; font-size: 12px; font-weight: 400; grid-area: auto; line-height: 18px; margin: 0px; overflow: visible; text-align: left; text-align-last: auto; white-space-collapse: preserve-breaks;">dfinview.com/GoldmanSachs</span>
|
|
|
|