Shareholder Report
Aug. 31, 2026
USD ($)
$ / shares
WHAT WERE THE FUND COSTS FOR THE PAST YEAR? (based on a hypothetical $10,000 investment)
|
Class Name
|
Costs of a $10,000 investment
|
Costs paid as a percentage of a $10,000 investment
|
|
Investor Class
|
$222
|
2.48%
|
HOW DID THE FUND PERFORM LAST YEAR AND WHAT AFFECTED ITS PERFORMANCE?
For the 12-month period ended August 31, 2026, the Fund underperformed its benchmark, the S&P 500 TR and NASDAQ Composite Total Return Index.
WHAT FACTORS INFLUENCED PERFORMANCE
The broader equity market advanced over the fiscal year, with technology-sector gains concentrated among semiconductors, artificial intelligence infrastructure and larger companies. Other areas of technology experienced greater volatility as investors reassessed which business models were positioned to benefit from artificial intelligence and which faced potential disruption. The conflict in the Middle East and the resulting increase in oil prices also raised concerns about inflation, economic growth and interest rates, contributing to shifts in investor risk appetite. The Fund declined as losses in several Internet and technology holdings outweighed gains from its strongest contributors. The Fund will continue to focus on companies positioned to benefit from long-term growth in artificial intelligence, cybersecurity, digital finance and modern data infrastructure.
|
Top Contributors
|
|
|
↑
|
Crowdstrike Holdings, Inc.
|
|
↑
|
Lightwave Logic, Inc.
|
|
↑
|
Confluent, Inc.
|
|
Top Detractors
|
|
|
↓
|
WM Technology, Inc.
|
|
↓
|
Flutter Entertainment PLC
|
|
↓
|
Neighborhood Intelligence, Inc.
|
PERFORMANCE
The Jacob Internet Fund declined 21.28% for the fiscal period ended August 31, 2026. Market sentiment shifted sharply during the year as investors assessed the potential impact of artificial intelligence on technology business models. Geopolitical conflict and renewed risk aversion also contributed to broad selling. Conditions improved later in the period as investors became more discriminating about potential AI winners and losers, but the recovery did not offset the earlier weakness.
CrowdStrike Holdings, Inc. was the largest contributor, rising 140.09% during the period as revenue and subscription demand continued to grow. Lightwave Logic, Inc. advanced 61.61% on continued progress with its high-speed electro-optic modulator platform. Confluent, Inc. increased 51.96%, supported by IBM’s agreement to acquire the company for $31 per share in cash.
WM Technology, Inc. was the largest detractor, declining 68.55% during the period. Flutter Entertainment plc fell 65.47%, while Neighborhood Intelligence, Inc. decreased 62.07%. The magnitude of these declines more than offset the positive contributions from the Fund’s strongest holdings.
Overall, a small number of strong gainers did not offset broader weakness across the portfolio, resulting in a negative return for the fiscal year.
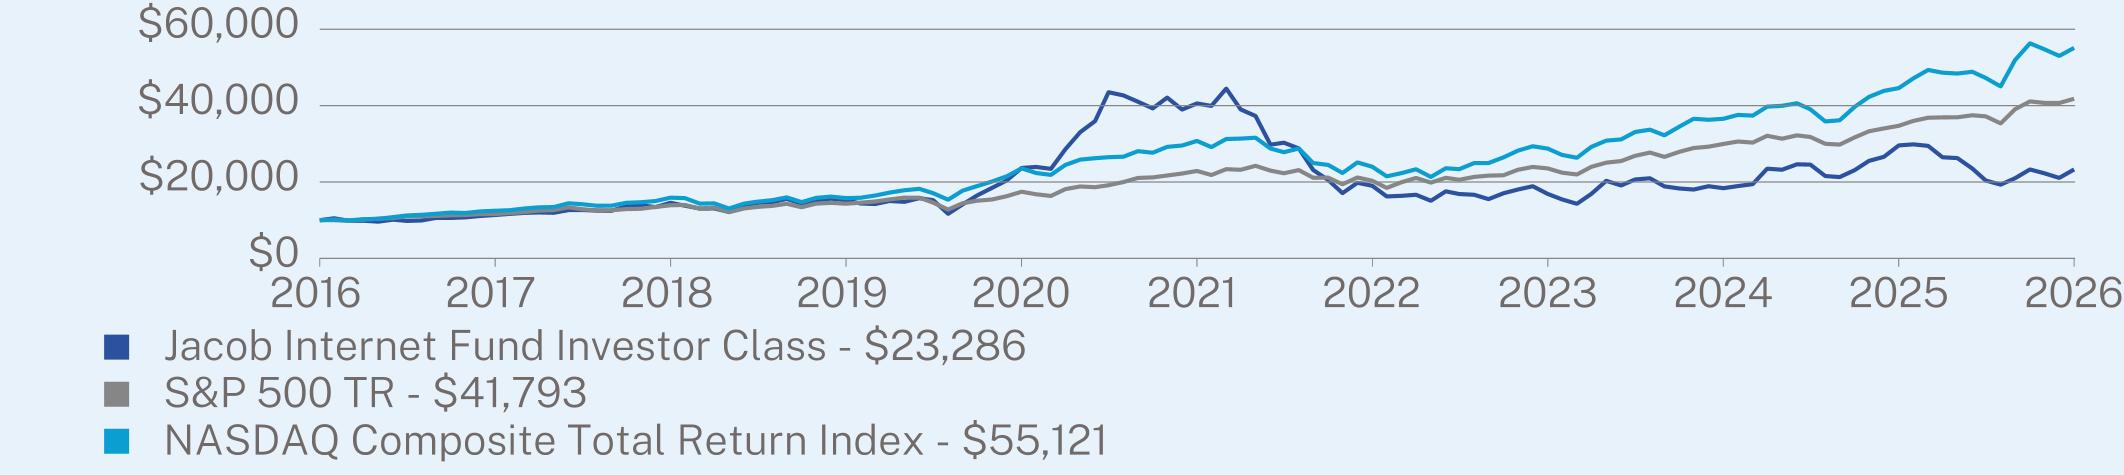
ANNUAL AVERAGE TOTAL RETURN (%)
|
|
1 Year
|
5 Year
|
10 Year
|
|
Investor Class (without sales charge)
|
-21.28
|
-10.51
|
8.82
|
|
S&P 500 TR
|
20.38
|
12.79
|
15.37
|
|
NASDAQ Composite Total Return Index
|
23.64
|
12.38
|
18.61
|
Visit https://jacobam.com/resources/reports/index.html for more recent performance information.
KEY FUND STATISTICS (as of August 31, 2026)
|
Net Assets
|
$42,609,662
|
|
Number of Holdings
|
39
|
|
Net Advisory Fee
|
$603,260
|
|
Portfolio Turnover
|
55%
|
WHAT DID THE FUND INVEST IN? (as of August 31, 2026)
|
Top 10 Issuers
|
(% of net assets)
|
|
|
MongoDB, Inc.
|
6.8
|
%
|
|
OptimizeRx Corp.
|
6.4
|
%
|
|
Snowflake, Inc.
|
5.9
|
%
|
|
Cloudflare, Inc.
|
5.5
|
%
|
|
Robinhood Markets, Inc.
|
5.4
|
%
|
|
Coinbase Global, Inc.
|
5.1
|
%
|
|
Braze, Inc.
|
5.0
|
%
|
|
Circle Internet Group, Inc.
|
4.8
|
%
|
|
Crowdstrike Holdings, Inc.
|
4.3
|
%
|
|
Reddit, Inc.
|
4.3
|
%
|
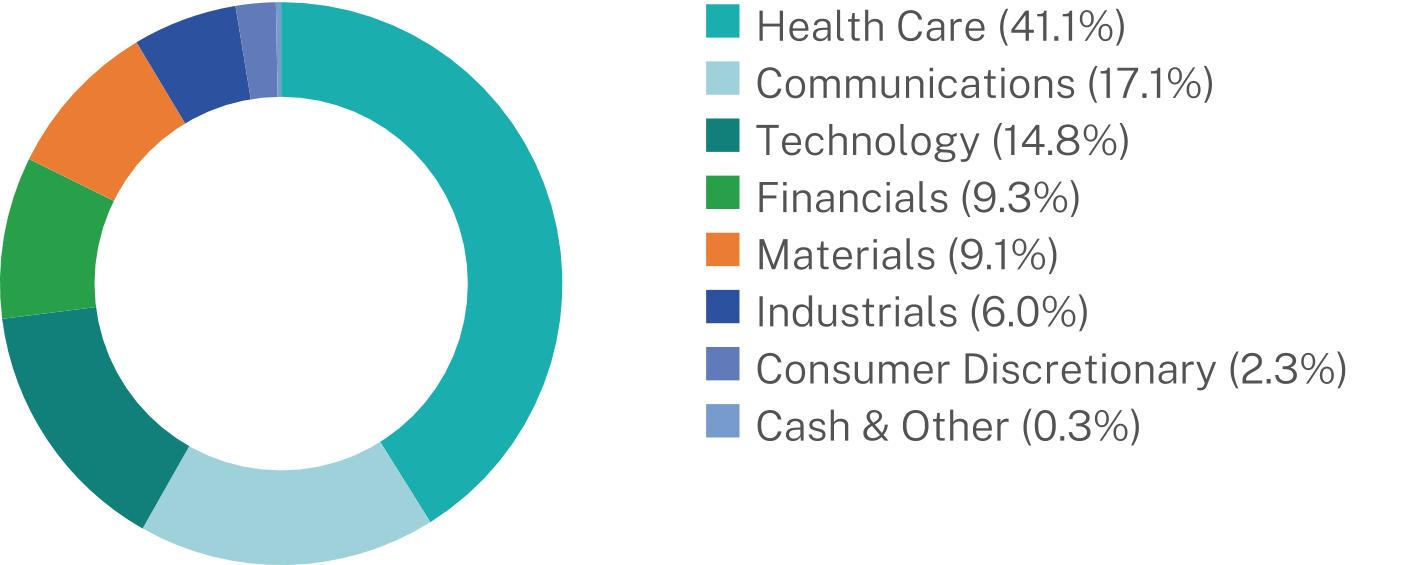
Sector Breakdown (% of net assets)
WHAT WERE THE FUND COSTS FOR THE PAST YEAR? (based on a hypothetical $10,000 investment)
|
Class Name
|
Costs of a $10,000 investment
|
Costs paid as a percentage of a $10,000 investment
|
|
Investor Class
|
$265
|
2.81%
|
HOW DID THE FUND PERFORM LAST YEAR AND WHAT AFFECTED ITS PERFORMANCE?
For the 12-month period ended August 31, 2026, the Fund underperformed its benchmark, the S&P 500 TR and Russell 2000 Growth Total Return.
WHAT FACTORS INFLUENCED PERFORMANCE
The broader equity market advanced over the year, although performance varied considerably across sectors and individual companies. Strong earnings and artificial intelligence-related investment supported larger companies, while conflict in the Middle East pushed oil prices higher and increased concerns about inflation, economic growth and the direction of interest rates. These conditions created greater volatility for smaller, early-stage companies, particularly those with significant financing needs or longer development timelines. The Fund declined as losses in several holdings outweighed gains from companies benefiting from favorable clinical, regulatory and commercial developments. The Fund will continue to focus on innovative companies with strong growth potential, meaningful catalysts and opportunities for valuation expansion.
|
Top Contributors
|
|
|
↑
|
CareDx, Inc.
|
|
↑
|
Krystal Biotech, Inc.
|
|
↑
|
Beam Therapeutics, Inc.
|
|
Top Detractors
|
|
|
↓
|
Heron Therapeutics, Inc.
|
|
↓
|
WM Technology, Inc.
|
|
↓
|
Neighborhood Intelligence, Inc.
|
PERFORMANCE
The Jacob Small Cap Growth Fund - Investor Class declined 11.06% for the fiscal period ended August 31, 2026. The Fund recorded several large biotechnology gains, but declines in smaller holdings and volatility in growth stocks outweighed them.
CareDx, Inc. was the largest contributor, rising 266.84% during the period as testing-services revenue and profitability improved. Krystal Biotech, Inc. advanced 143.3%, supported by VYJUVEK’s continued commercial growth. Beam Therapeutics Inc. increased 79.89% following encouraging updated clinical data for its BEAM-302 program.
Heron Therapeutics, Inc. was the largest detractor, declining 76.44% after the company withdrew its full-year guidance amid patent uncertainty affecting its largest product. WM Technology, Inc. fell 68.55%, and Neighborhood Intelligence, Inc. decreased 67.3%. These declines had a significant effect on the Fund’s results.
Overall, sharp declines in several holdings and continued volatility among smaller growth companies outweighed the strong performance of the Fund’s top contributors, resulting in a negative return for the fiscal year.
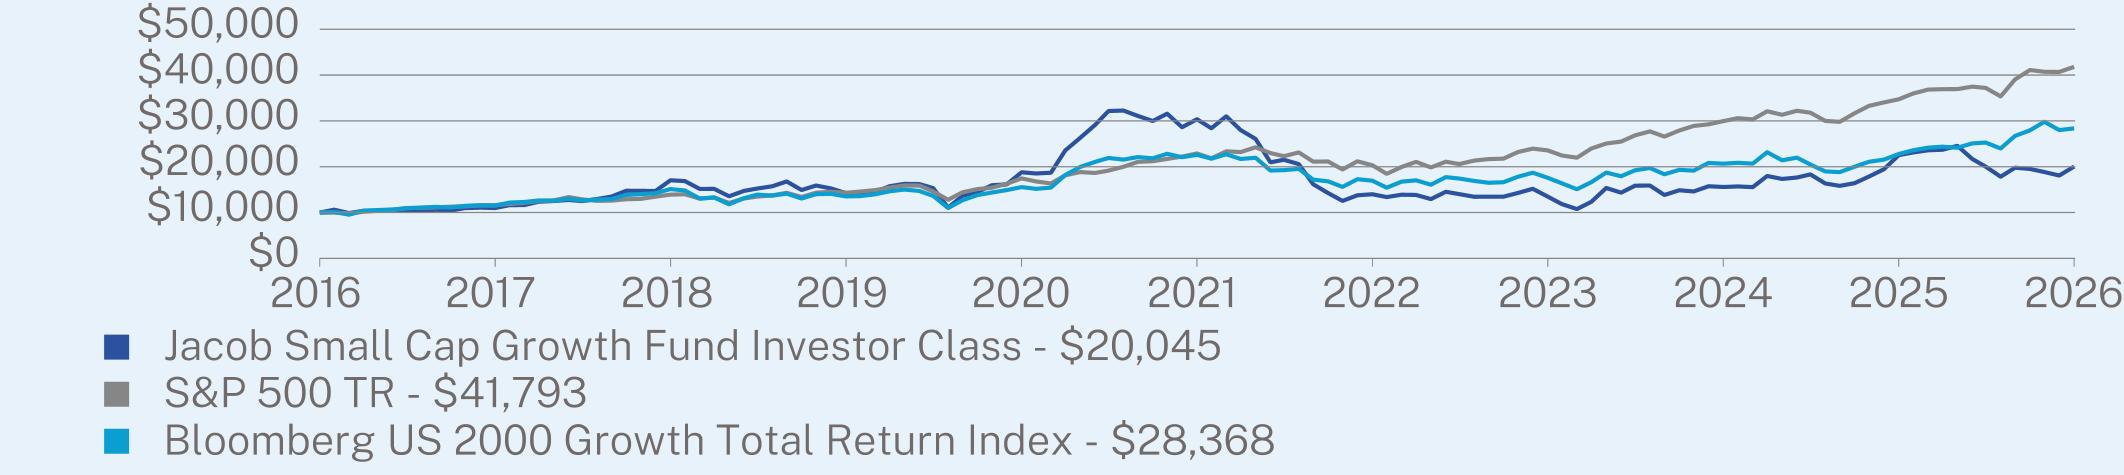
ANNUAL AVERAGE TOTAL RETURN (%)
|
|
1 Year
|
5 Year
|
10 Year
|
|
Investor Class (without sales charge)
|
-11.06
|
-7.97
|
7.20
|
|
S&P 500 TR
|
20.38
|
12.79
|
15.37
|
|
Bloomberg US 2000 Growth Total Return Index
|
24.50
|
4.66
|
10.99
|
Visit https://jacobam.com/resources/reports/index.html for more recent performance information.
KEY FUND STATISTICS (as of August 31, 2026)
|
Net Assets
|
$8,150,351
|
|
Number of Holdings
|
35
|
|
Net Advisory Fee
|
$0
|
|
Portfolio Turnover
|
76%
|
WHAT DID THE FUND INVEST IN? (as of August 31, 2026)
|
Top 10 Issuers
|
(% of net assets)
|
|
|
Omeros Corp.
|
7.6
|
%
|
|
OptimizeRx Corp.
|
6.6
|
%
|
|
Braze, Inc.
|
5.0
|
%
|
|
Circle Internet Group, Inc.
|
4.9
|
%
|
|
Harrow, Inc.
|
4.9
|
%
|
|
Celcuity, Inc.
|
4.7
|
%
|
|
DraftKings, Inc.
|
4.4
|
%
|
|
Nextdoor Holdings, Inc.
|
4.2
|
%
|
|
Beam Therapeutics, Inc.
|
4.1
|
%
|
|
Porch Group, Inc.
|
3.9
|
%
|
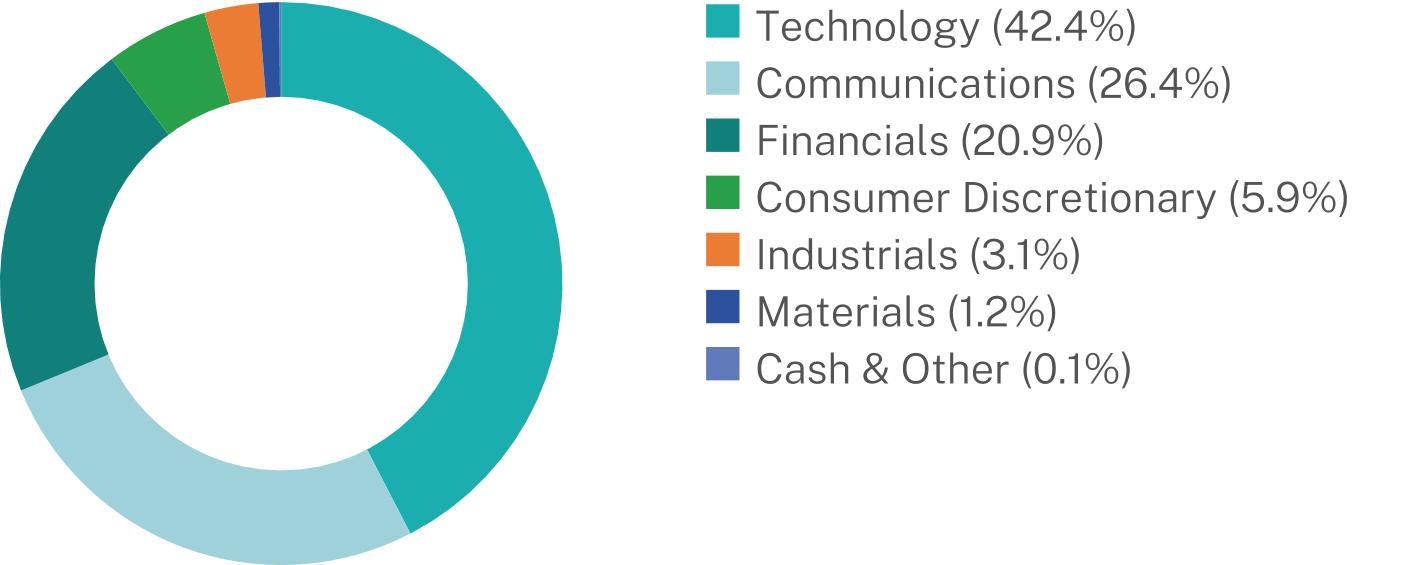
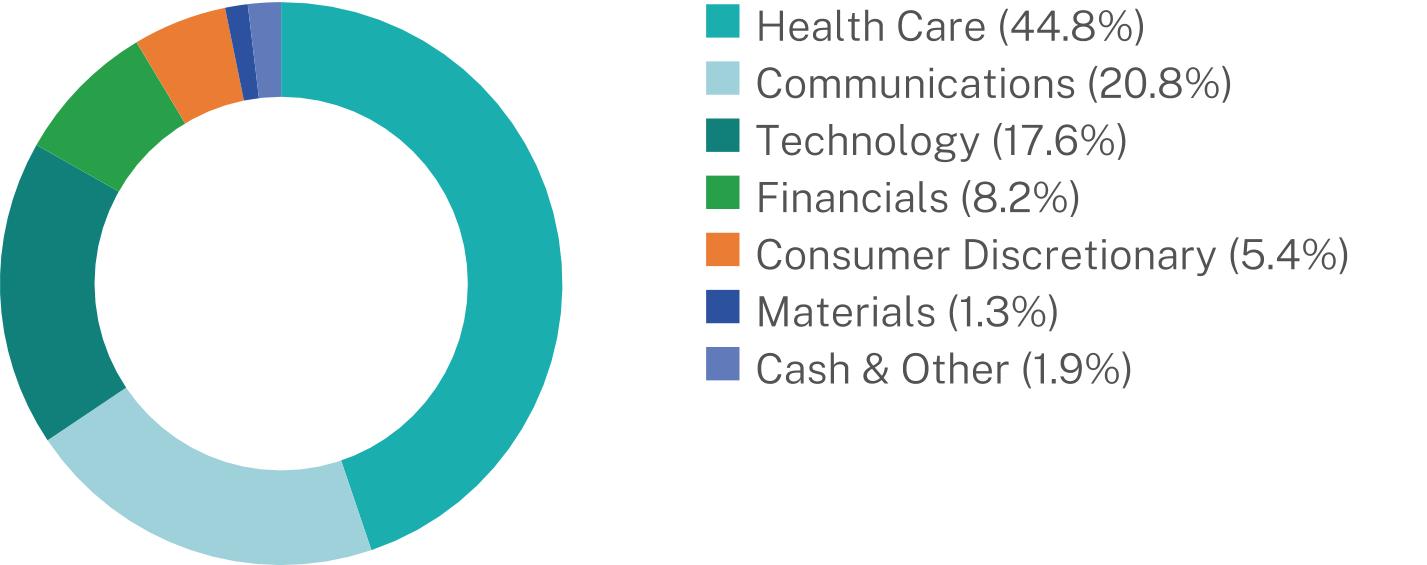
Sector Breakdown (% of net assets)
WHAT WERE THE FUND COSTS FOR THE PAST YEAR? (based on a hypothetical $10,000 investment)
|
Class Name
|
Costs of a $10,000 investment
|
Costs paid as a percentage of a $10,000 investment
|
|
Institutional Class
|
$238
|
2.52%
|
HOW DID THE FUND PERFORM LAST YEAR AND WHAT AFFECTED ITS PERFORMANCE?
For the 12-month period ended August 31, 2026, the Fund underperformed its benchmark, the S&P 500 TR and Russell 2000 Growth Total Return.
WHAT FACTORS INFLUENCED PERFORMANCE
The broader equity market advanced over the year, although performance varied considerably across sectors and individual companies. Strong earnings and artificial intelligence-related investment supported larger companies, while conflict in the Middle East pushed oil prices higher and increased concerns about inflation, economic growth and the direction of interest rates. These conditions created greater volatility for smaller, early-stage companies, particularly those with significant financing needs or longer development timelines. The Fund declined as losses in several holdings outweighed gains from companies benefiting from favorable clinical, regulatory and commercial developments. The Fund will continue to focus on innovative companies with strong growth potential, meaningful catalysts and opportunities for valuation expansion.
|
Top Contributors
|
|
|
↑
|
CareDx, Inc.
|
|
↑
|
Krystal Biotech, Inc.
|
|
↑
|
Beam Therapeutics, Inc.
|
|
Top Detractors
|
|
|
↓
|
Heron Therapeutics, Inc.
|
|
↓
|
WM Technology, Inc.
|
|
↓
|
Neighborhood Intelligence, Inc.
|
PERFORMANCE
The Jacob Small Cap Growth Fund - Institutional Class declined 10.80% for the fiscal period ended August 31, 2026. The Fund recorded several large biotechnology gains, but declines in smaller holdings and volatility in growth stocks outweighed them.
CareDx, Inc. was the largest contributor, rising 266.84% during the period as testing-services revenue and profitability improved. Krystal Biotech, Inc. advanced 143.3%, supported by VYJUVEK’s continued commercial growth. Beam Therapeutics Inc. increased 79.89% following encouraging updated clinical data for its BEAM-302 program.
Heron Therapeutics, Inc. was the largest detractor, declining 76.44% after the company withdrew its full-year guidance amid patent uncertainty affecting its largest product. WM Technology, Inc. fell 68.55%, and Neighborhood Intelligence, Inc. decreased 67.3%. These declines had a significant effect on the Fund’s results.
Overall, sharp declines in several holdings and continued volatility among smaller growth companies outweighed the strong performance of the Fund’s top contributors, resulting in a negative return for the fiscal year.
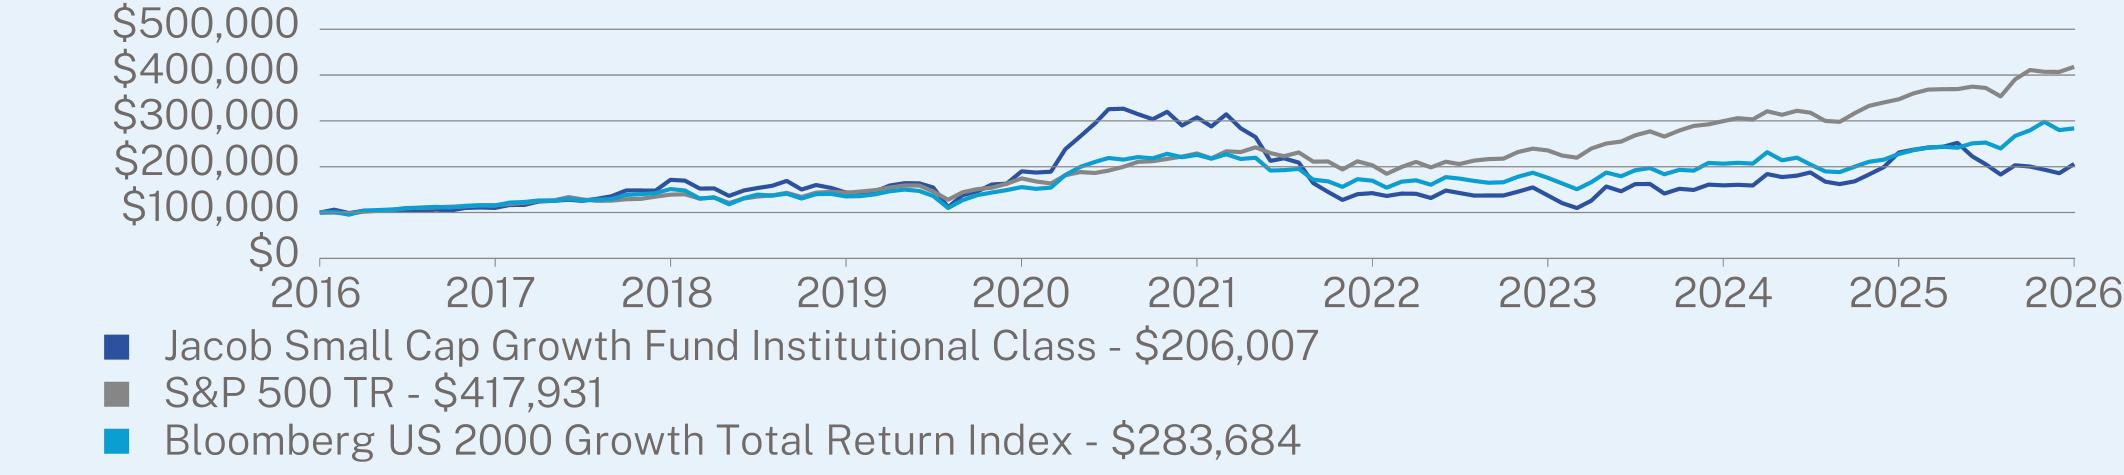
ANNUAL AVERAGE TOTAL RETURN (%)
|
|
1 Year
|
5 Year
|
10 Year
|
|
Institutional Class (without sales charge)
|
-10.80
|
-7.71
|
7.49
|
|
S&P 500 TR
|
20.38
|
12.79
|
15.37
|
|
Bloomberg US 2000 Growth Total Return Index
|
24.50
|
4.66
|
10.99
|
Visit https://jacobam.com/resources/reports/index.html for more recent performance information.
KEY FUND STATISTICS (as of August 31, 2026)
|
Net Assets
|
$8,150,351
|
|
Number of Holdings
|
35
|
|
Net Advisory Fee
|
$0
|
|
Portfolio Turnover
|
76%
|
WHAT DID THE FUND INVEST IN? (as of August 31, 2026)
|
Top 10 Issuers
|
(% of net assets)
|
|
|
Omeros Corp.
|
7.6
|
%
|
|
OptimizeRx Corp.
|
6.6
|
%
|
|
Braze, Inc.
|
5.0
|
%
|
|
Circle Internet Group, Inc.
|
4.9
|
%
|
|
Harrow, Inc.
|
4.9
|
%
|
|
Celcuity, Inc.
|
4.7
|
%
|
|
DraftKings, Inc.
|
4.4
|
%
|
|
Nextdoor Holdings, Inc.
|
4.2
|
%
|
|
Beam Therapeutics, Inc.
|
4.1
|
%
|
|
Porch Group, Inc.
|
3.9
|
%
|
Sector Breakdown (% of net assets)
WHAT WERE THE FUND COSTS FOR THE PAST YEAR? (based on a hypothetical $10,000 investment)
|
Class Name
|
Costs of a $10,000 investment
|
Costs paid as a percentage of a $10,000 investment
|
|
Investor Class
|
$242
|
2.31%
|
HOW DID THE FUND PERFORM LAST YEAR AND WHAT AFFECTED ITS PERFORMANCE?
For the 12-month period ended August 31, 2026, the Fund underperformed its benchmark, the S&P 500 TR and Russell Microcap Growth Total Return.
WHAT FACTORS INFLUENCED PERFORMANCE
The broader equity market advanced over the year, although performance varied considerably across sectors and individual companies. Strong corporate earnings and investment related to artificial intelligence supported major market indexes, while conflict in the Middle East disrupted global energy supplies and caused oil prices to rise sharply. Higher energy costs contributed to renewed inflation and interest-rate concerns, creating additional volatility for smaller companies. Against this backdrop, the Fund generated a positive return as favorable regulatory, commercial and operating developments drove strong gains in several biotechnology and health care holdings. These gains offset the declines in certain smaller positions. The Fund will continue to focus on underfollowed companies with identifiable growth catalysts and the potential for meaningful valuation appreciation.
|
Top Contributors
|
|
|
↑
|
Omeros Corp.
|
|
↑
|
CareDx, Inc.
|
|
↑
|
Cerus Corp.
|
|
Top Detractors
|
|
|
↓
|
Heron Therapeutics, Inc.
|
|
↓
|
WM Technology, Inc.
|
|
↓
|
Neighborhood Intelligence, Inc.
|
PERFORMANCE
The Jacob Discovery Fund - Investor Class gained 9.78% for the fiscal period ended August 31, 2026. Although volatile market conditions weighed on many smaller growth companies during the year, strong gains in several biotechnology holdings allowed the Fund to finish with a positive return.
Omeros Corporation was the largest contributor, rising 351.68% during the period following FDA approval and the initial commercial launch of YARTEMLEA. CareDx, Inc. advanced 266.84%, supported by strong growth in testing services and improved profitability. Cerus Corporation increased 101.53% as product revenue grew and the company raised the lower end of its 2026 product revenue guidance.
Heron Therapeutics, Inc. was the largest detractor, declining 76.44% after patent uncertainty affecting its largest product led the company to withdraw its full-year guidance. WM Technology, Inc. fell 68.55%, while Neighborhood Intelligence, Inc. decreased 62.07%. The declines in these smaller positions weighed on performance.
Overall, the magnitude of the gains from the Fund’s top contributors more than offset the declines from its weakest holdings, producing a positive return for the fiscal year.
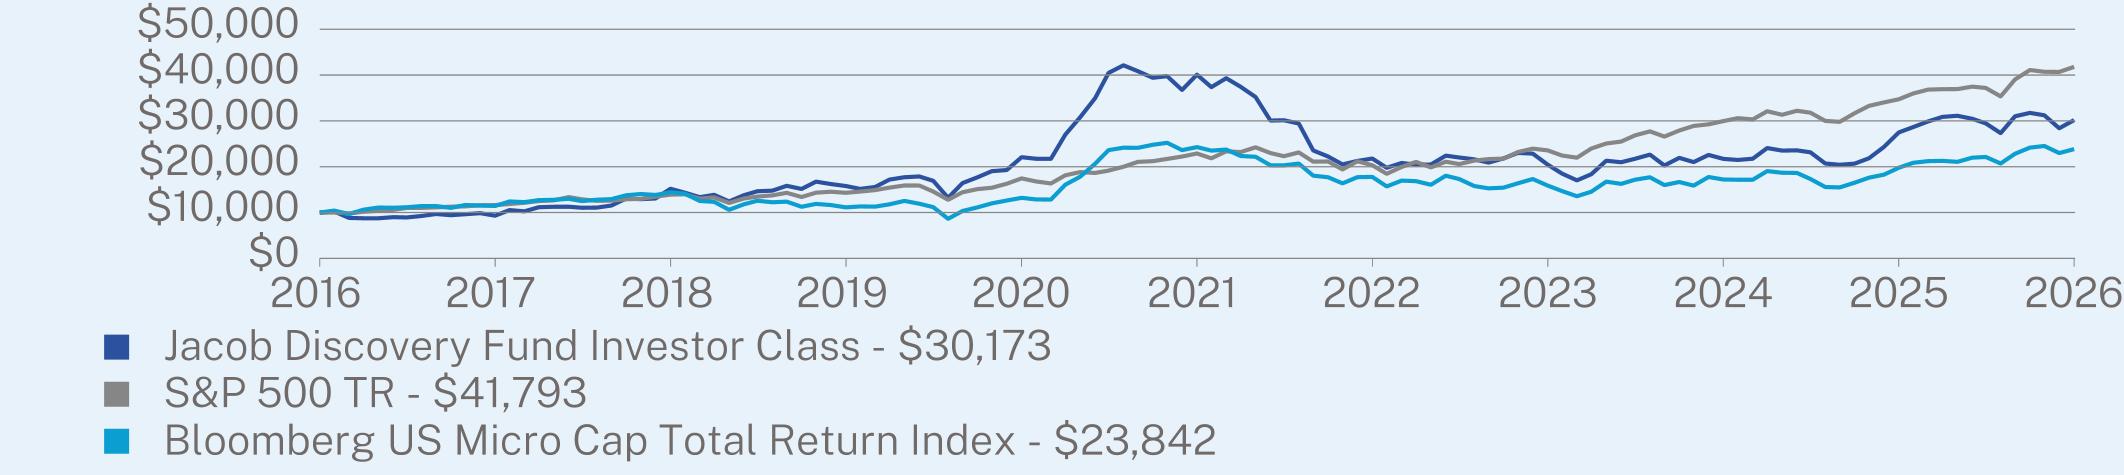
ANNUAL AVERAGE TOTAL RETURN (%)
|
|
1 Year
|
5 Year
|
10 Year
|
|
Investor Class (without sales charge)
|
9.78
|
-5.53
|
11.68
|
|
S&P 500 TR
|
20.38
|
12.79
|
15.37
|
|
Bloomberg US Micro Cap Total Return Index
|
20.54
|
-0.36
|
9.08
|
Visit https://jacobam.com/resources/reports/index.html for more recent performance information.
KEY FUND STATISTICS (as of August 31, 2026)
|
Net Assets
|
$14,476,212
|
|
Number of Holdings
|
49
|
|
Net Advisory Fee
|
$47,584
|
|
Portfolio Turnover
|
49%
|
WHAT DID THE FUND INVEST IN? (as of August 31, 2026)
|
Top 10 Issuers
|
(% of net assets)
|
|
|
Omeros Corp.
|
7.8
|
%
|
|
Usio, Inc.
|
7.3
|
%
|
|
OptimizeRx Corp.
|
4.9
|
%
|
|
Celcuity, Inc.
|
3.4
|
%
|
|
Porch Group, Inc.
|
3.4
|
%
|
|
Solitario Resources Corp.
|
3.2
|
%
|
|
Harrow, Inc.
|
3.1
|
%
|
|
Nextdoor Holdings, Inc.
|
3.0
|
%
|
|
Cerus Corp.
|
3.0
|
%
|
|
Western Copper & Gold Corp.
|
2.6
|
%
|
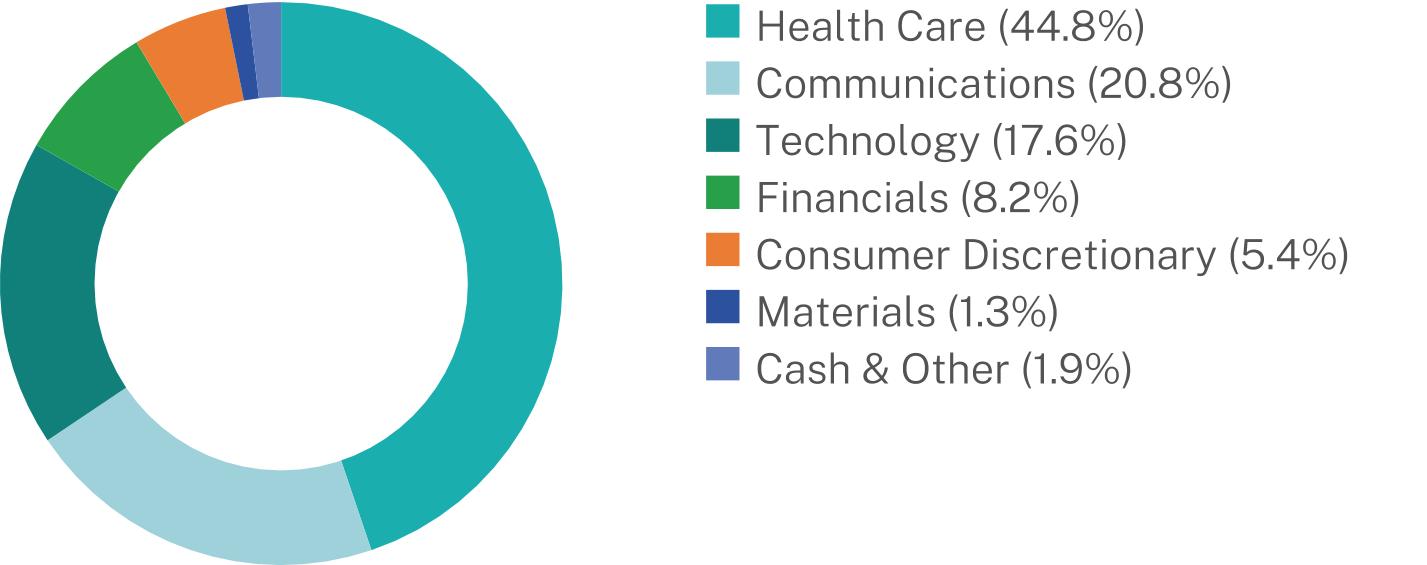
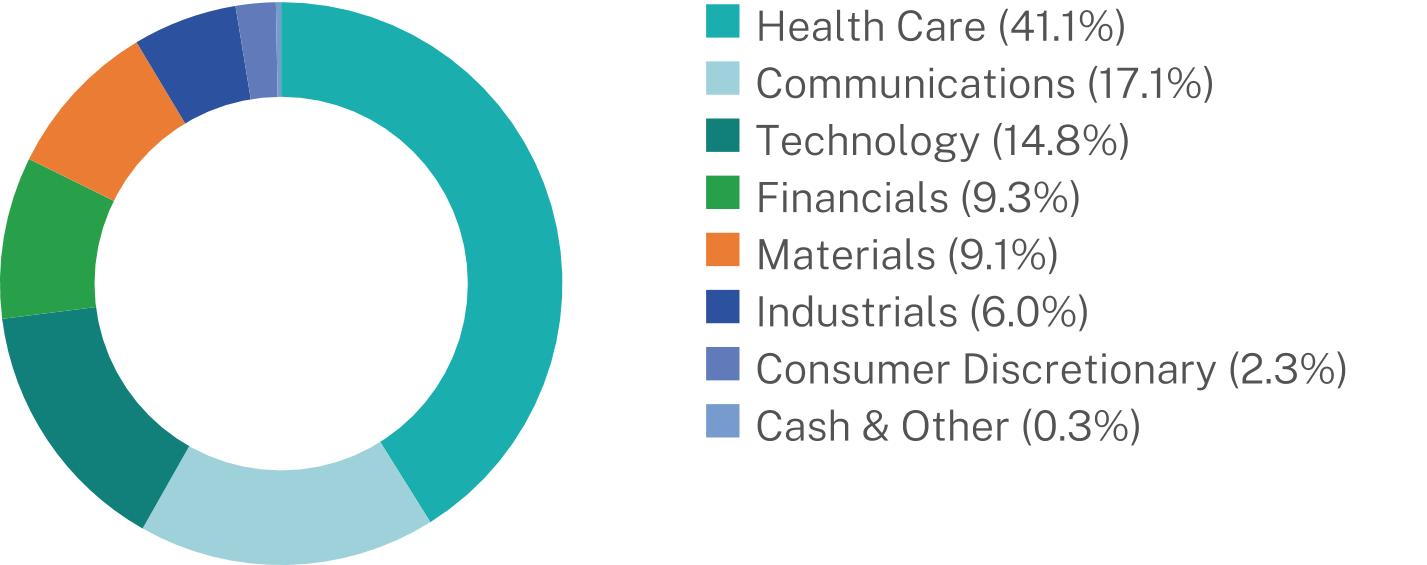
Sector Breakdown (% of net assets)
WHAT WERE THE FUND COSTS FOR THE PAST YEAR? (based on a hypothetical $10,000 investment)
|
Class Name
|
Costs of a $10,000 investment
|
Costs paid as a percentage of a $10,000 investment
|
|
Institutional Class
|
$211
|
2.01%
|
HOW DID THE FUND PERFORM LAST YEAR AND WHAT AFFECTED ITS PERFORMANCE?
For the 12-month period ended August 31, 2026, the Fund underperformed its benchmark, the S&P 500 TR and Russell Microcap Growth Total Return.
WHAT FACTORS INFLUENCED PERFORMANCE
The broader equity market advanced over the year, although performance varied considerably across sectors and individual companies. Strong corporate earnings and investment related to artificial intelligence supported major market indexes, while conflict in the Middle East disrupted global energy supplies and caused oil prices to rise sharply. Higher energy costs contributed to renewed inflation and interest-rate concerns, creating additional volatility for smaller companies. Against this backdrop, the Fund generated a positive return as favorable regulatory, commercial and operating developments drove strong gains in several biotechnology and health care holdings. These gains offset the declines in certain smaller positions. The Fund will continue to focus on underfollowed companies with identifiable growth catalysts and the potential for meaningful valuation appreciation.
|
Top Contributors
|
|
|
↑
|
Omeros Corp.
|
|
↑
|
CareDx, Inc.
|
|
↑
|
Cerus Corp.
|
|
Top Detractors
|
|
|
↓
|
Heron Therapeutics, Inc.
|
|
↓
|
WM Technology, Inc.
|
|
↓
|
Neighborhood Intelligence, Inc.
|
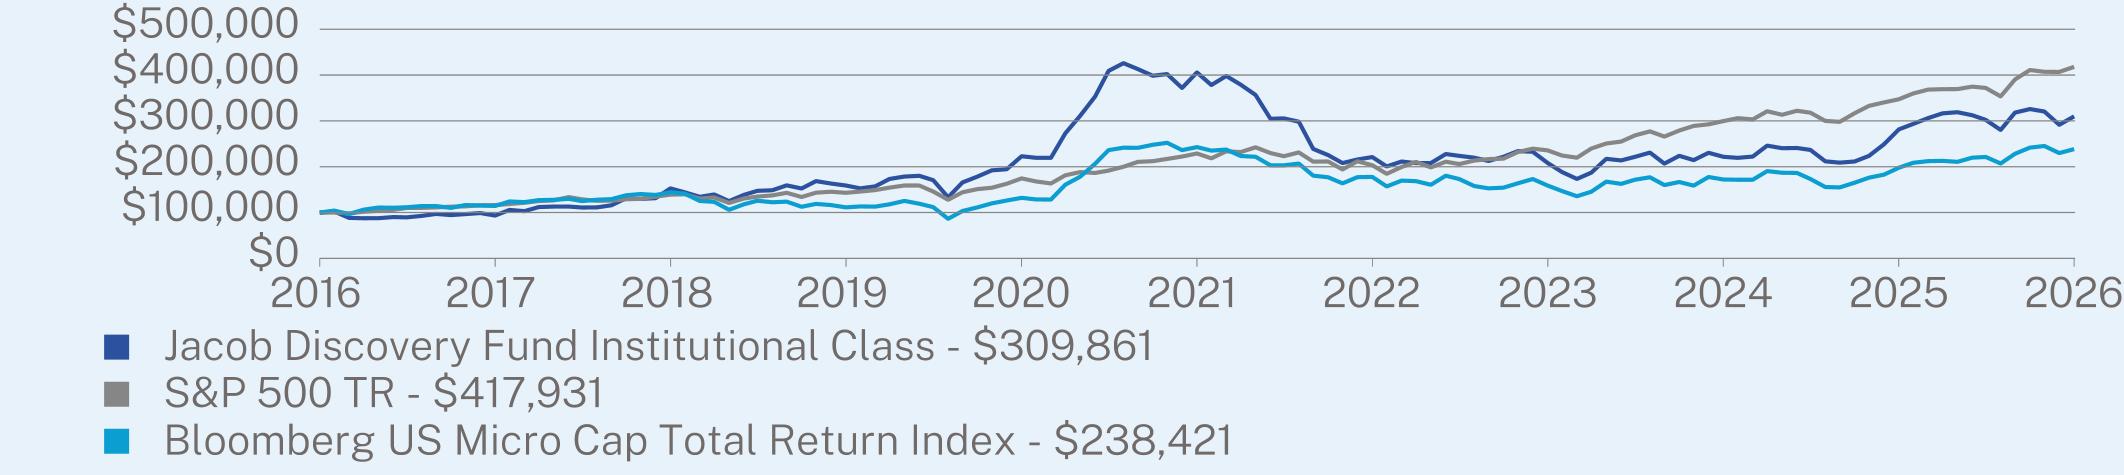
PERFORMANCE
The Jacob Discovery Fund - Institutional Class gained 10.11% for the fiscal period ended August 31, 2026. Although volatile market conditions weighed on many smaller growth companies during the year, strong gains in several biotechnology holdings allowed the Fund to finish with a positive return.
Omeros Corporation was the largest contributor, rising 351.68% during the period following FDA approval and the initial commercial launch of YARTEMLEA. CareDx, Inc. advanced 266.84%, supported by strong growth in testing services and improved profitability. Cerus Corporation increased 101.53% as product revenue grew and the company raised the lower end of its 2026 product revenue guidance.
Heron Therapeutics, Inc. was the largest detractor, declining 76.44% after patent uncertainty affecting its largest product led the company to withdraw its full-year guidance. WM Technology, Inc. fell 68.55%, while Neighborhood Intelligence, Inc. decreased 62.07%. The declines in these smaller positions weighed on performance.
Overall, the magnitude of the gains from the Fund’s top contributors more than offset the declines from its weakest holdings, producing a positive return for the fiscal year.
ANNUAL AVERAGE TOTAL RETURN (%)
|
|
1 Year
|
5 Year
|
10 Year
|
|
Institutional Class (without sales charge)
|
10.11
|
-5.25
|
11.97
|
|
S&P 500 TR
|
20.38
|
12.79
|
15.37
|
|
Bloomberg US Micro Cap Total Return Index
|
20.54
|
-0.36
|
9.08
|
Visit https://jacobam.com/resources/reports/index.html for more recent performance information.
KEY FUND STATISTICS (as of August 31, 2026)
|
Net Assets
|
$14,476,212
|
|
Number of Holdings
|
49
|
|
Net Advisory Fee
|
$47,584
|
|
Portfolio Turnover
|
49%
|
WHAT DID THE FUND INVEST IN? (as of August 31, 2026)
|
Top 10 Issuers
|
(% of net assets)
|
|
|
Omeros Corp.
|
7.8
|
%
|
|
Usio, Inc.
|
7.3
|
%
|
|
OptimizeRx Corp.
|
4.9
|
%
|
|
Celcuity, Inc.
|
3.4
|
%
|
|
Porch Group, Inc.
|
3.4
|
%
|
|
Solitario Resources Corp.
|
3.2
|
%
|
|
Harrow, Inc.
|
3.1
|
%
|
|
Nextdoor Holdings, Inc.
|
3.0
|
%
|
|
Cerus Corp.
|
3.0
|
%
|
|
Western Copper & Gold Corp.
|
2.6
|
%
|
Sector Breakdown (% of net assets)