
Key Highlights |
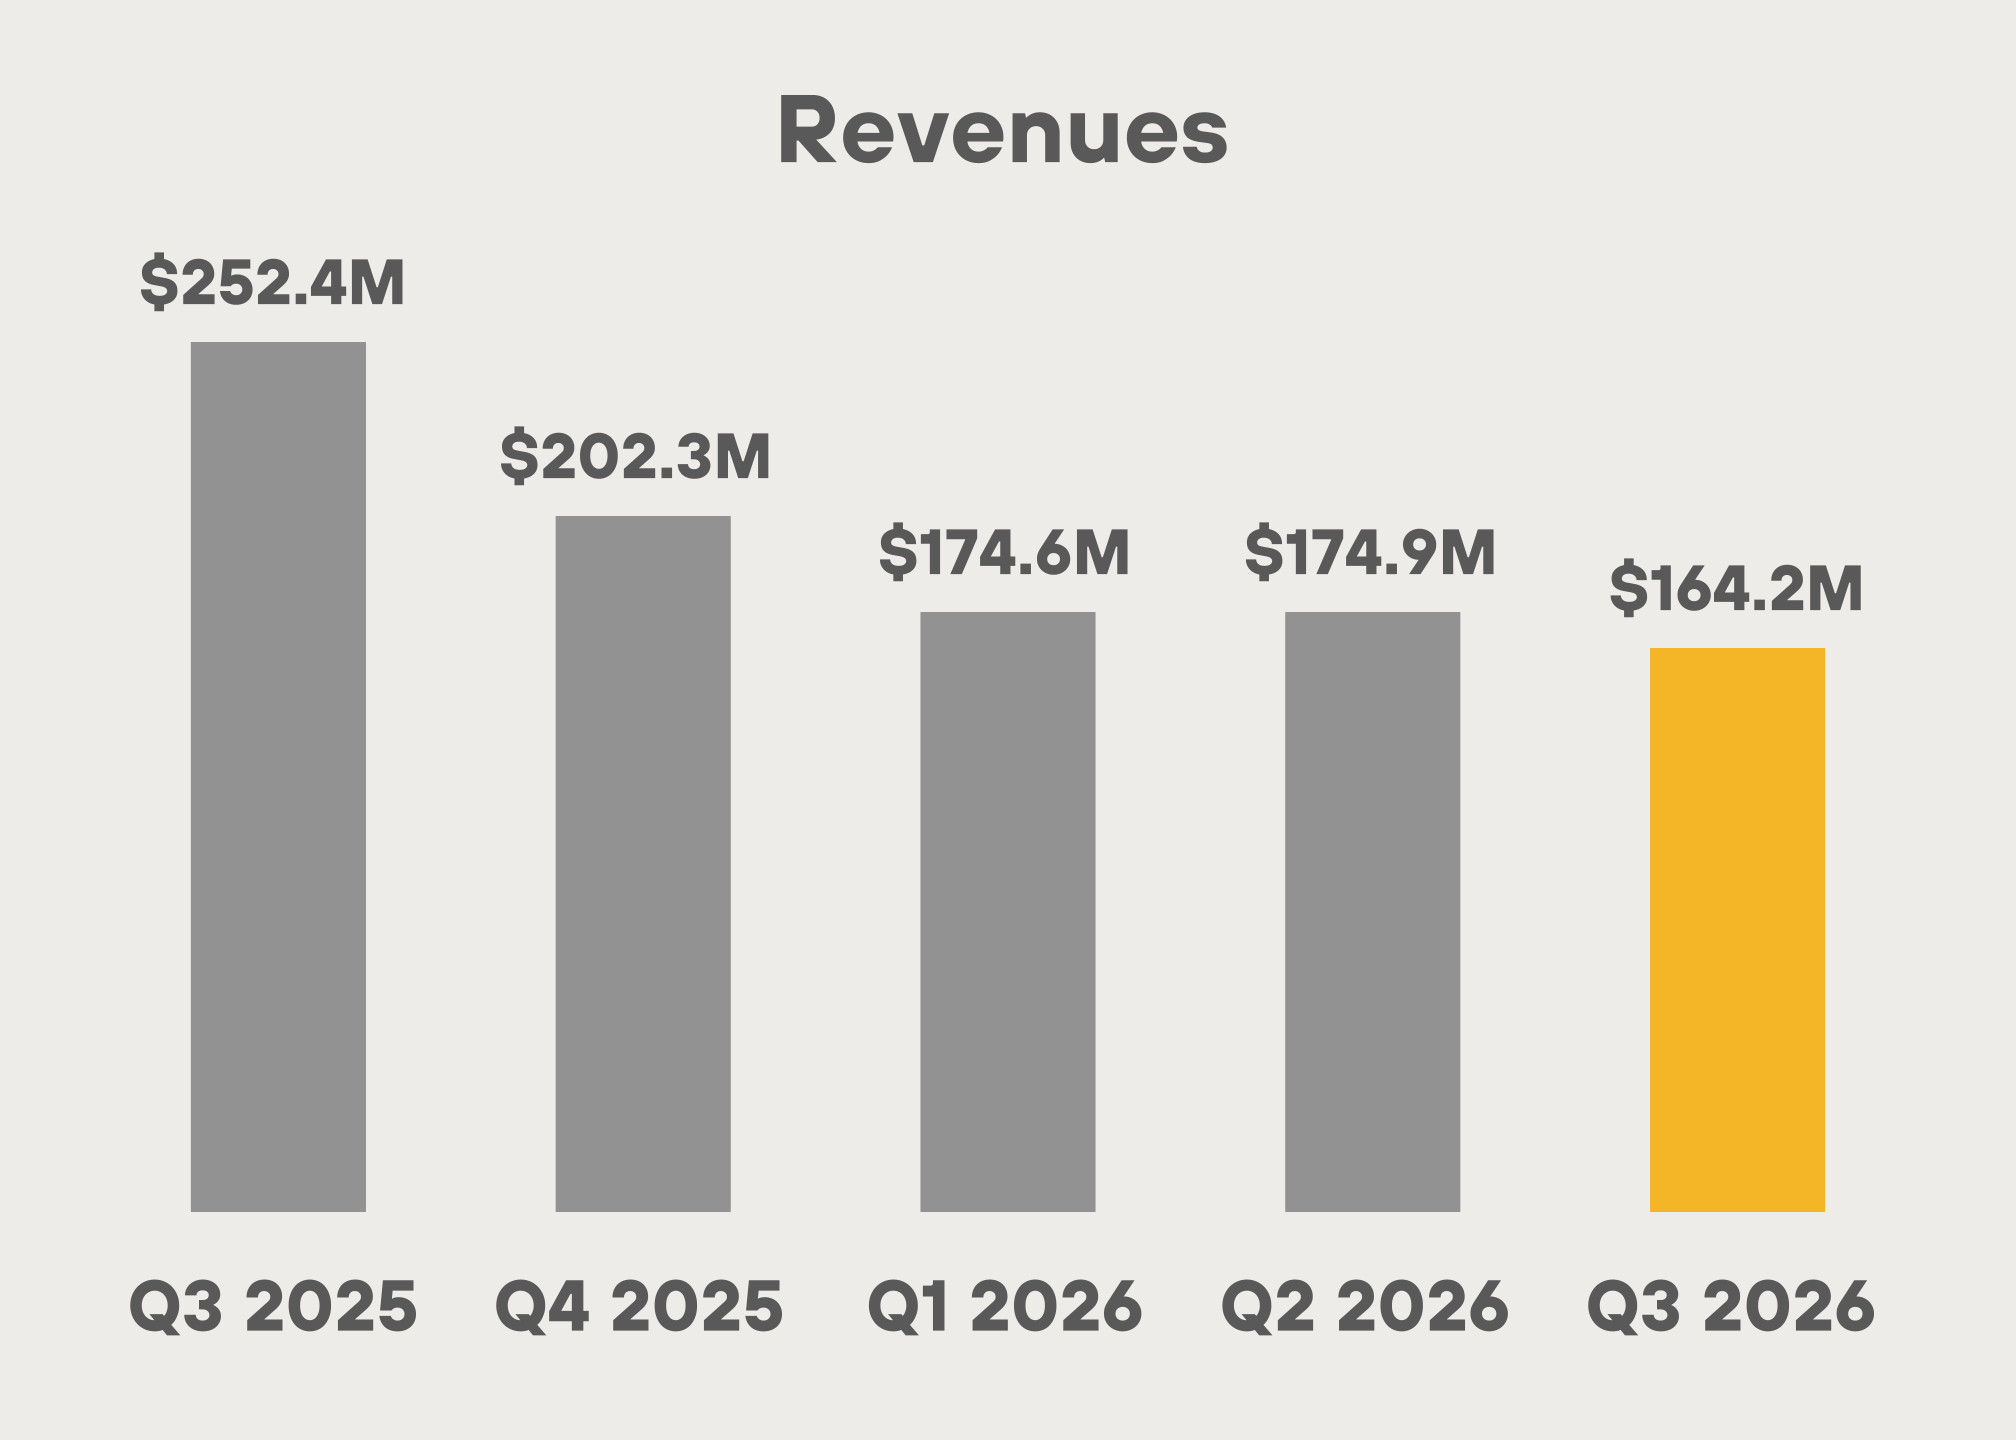
Revenues decreased 35% to $164.2 million |
IN Q3 2026 |
from $252.4 million in Q3 2025. |
Net income increased to $632.1 million |
IN Q3 2026 |
from $123.1 million in Q3 2025. |
Adjusted EBITDA increased to $857.7 million |
IN Q3 2026 |
compared to $395.6 million in Q3 2025. |
Total debt reduction of $1.4 billion |
AS OF SEPTEMBER 30, 2026 |
37% of total debt reduced since the beginning of the year. |
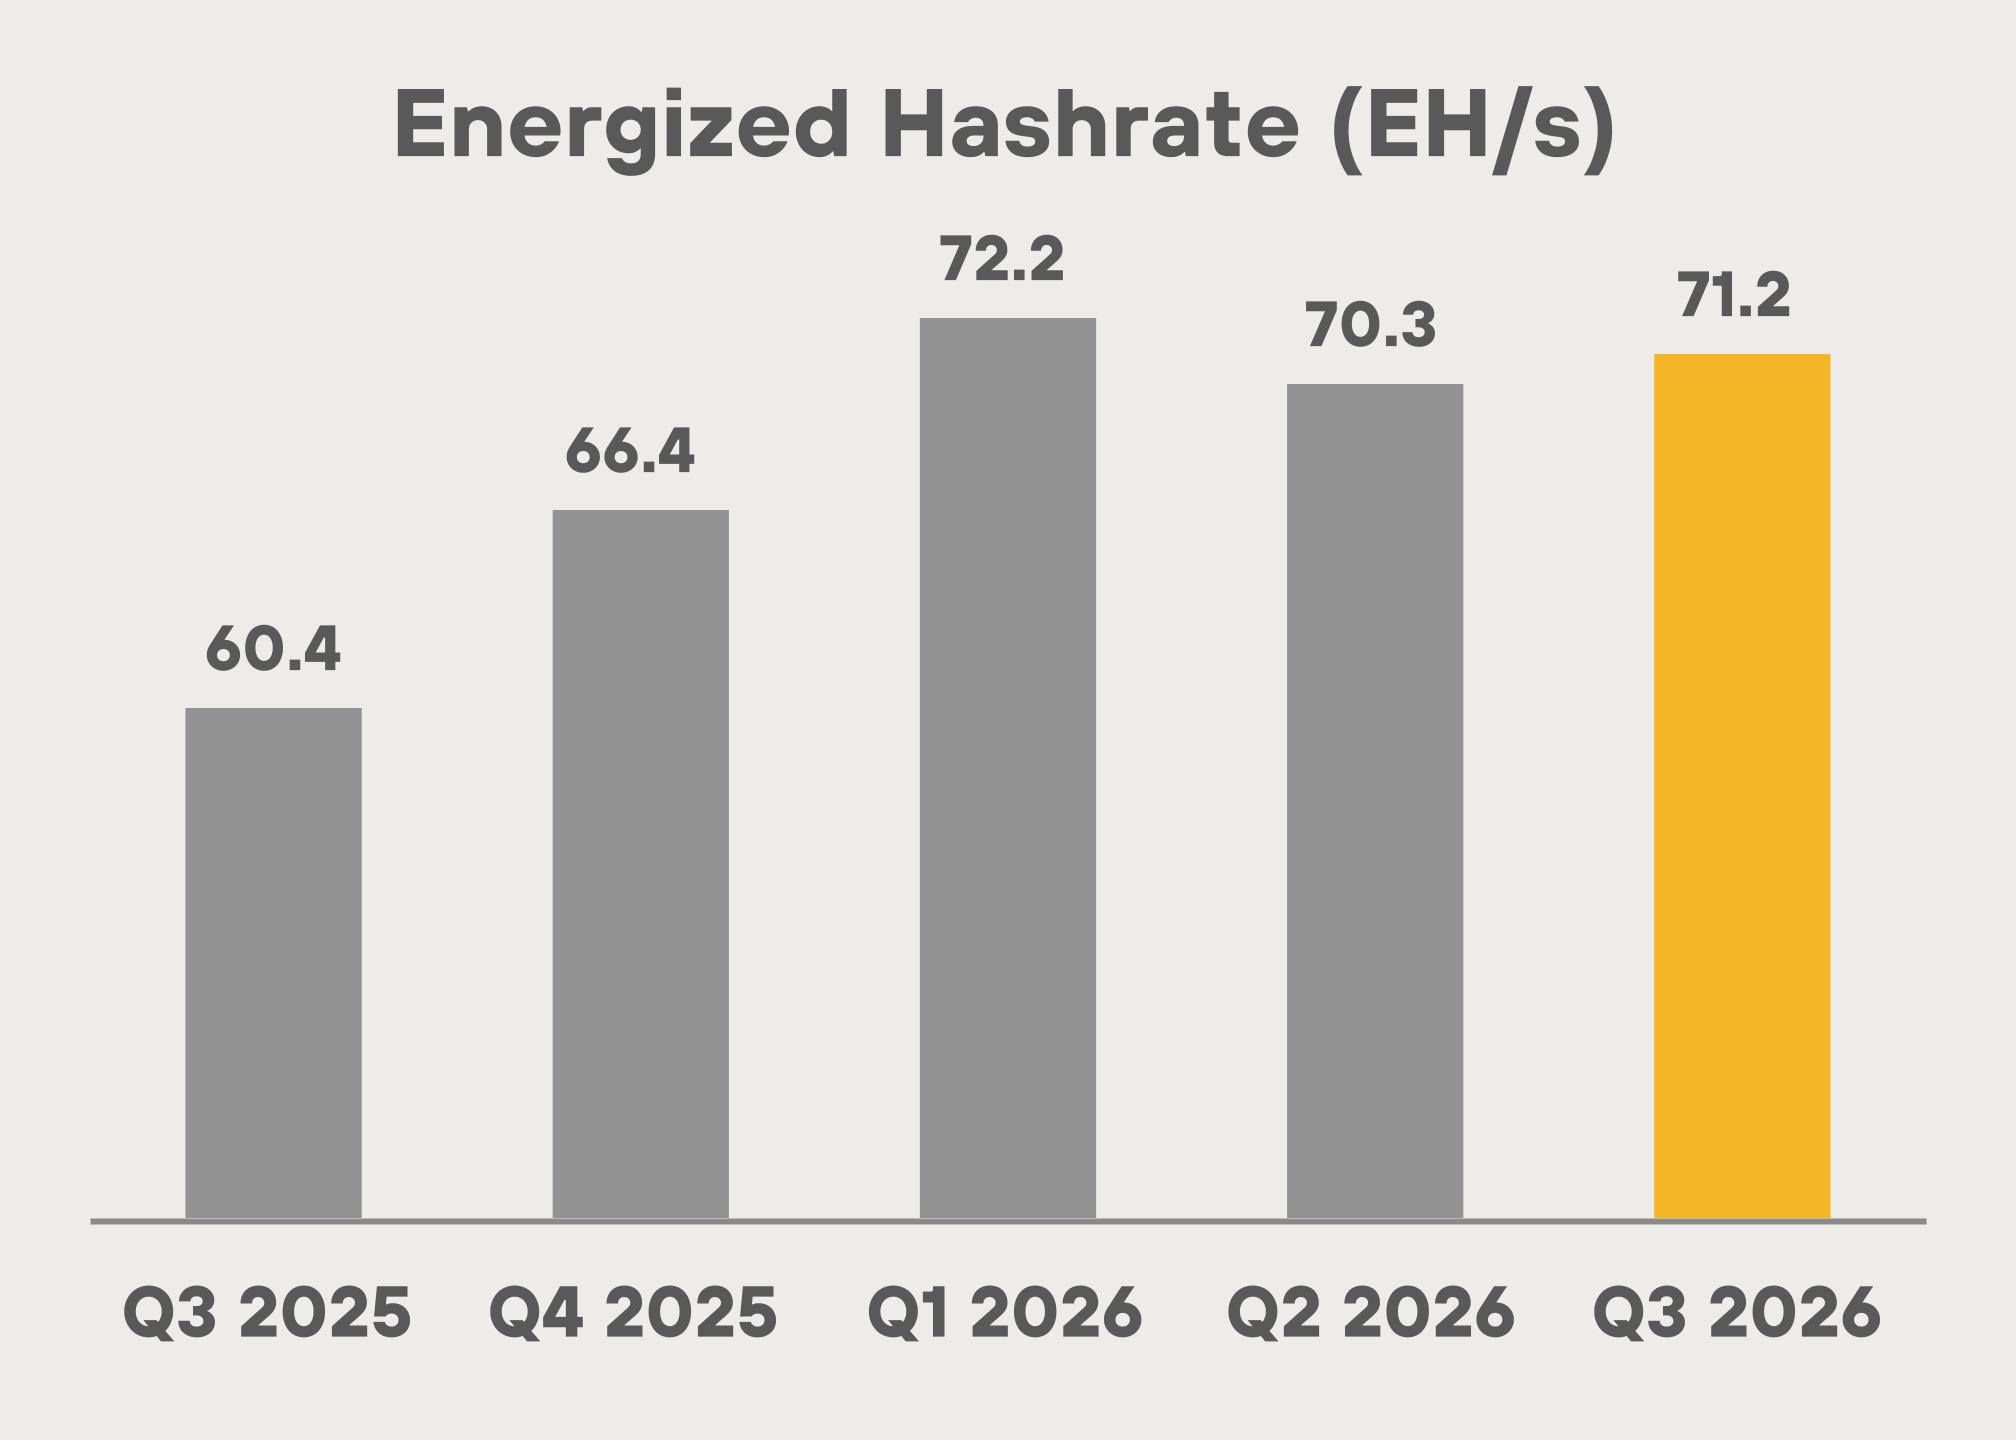
Energized hashrate ("EH/s") increased 18% |
TO 71.2 EH/S IN Q3 2026 |
from 60.4 EH/s in Q3 2025. |
Cost/petahash per day improved by 2% |
IN Q3 2026 |
from Q3 2025. |
Total blocks won increased 2% to 644 |
IN Q3 2026 |
from 633 in Q3 2025. |
Purchased energy cost per BTC was $39,674 |
IN Q3 2026 |
for our owned sites. |
Cost per kWh: $0.04 |
FOR Q3 2026. |
Mined 2,247 BTC |
IN Q3 2026. |
No BTC was purchased in Q3 2026 |
SHAREHOLDER LETTER Q3 2026 3
To Our Shareholders |
Bitcoin built the foundation. Power created the opportunity. Our strategy now is simple: maximize the value of every
megawatt ("MW") we control.
In Q3 2026, we started transforming the platform we have assembled into a business designed to produce durable,
contracted returns. Over the past several years, MARA has built a difficult-to-replicate portfolio of powered assets,
operating infrastructure, and technical capability. Our priority now is to convert those advantages into signed customer
agreements, completed projects, and durable free cash flow.
The Quarter: Progress on Many Fronts
A lease does not start with a signature. It starts with power, a buildable site, a capable partner, and a financeable customer.
This quarter, we advanced each of those pieces.
•Sites and development: Since the end of last quarter, we have made great progress and our discussions with
tenants are in advanced stages. Our engineering and operations teams have hosted prospective tenants across
nearly all of our sites and we feel particularly proud of the development team's progress at Kearney, where pre-
development is well advanced. While we are targeting signing two leases before year-end, market conditions are
fluid and that timing could slip into next year. We will continue to advance the power, permitting, site, and
financing work required to support these agreements and look forward to updating the market as we have news
to share.
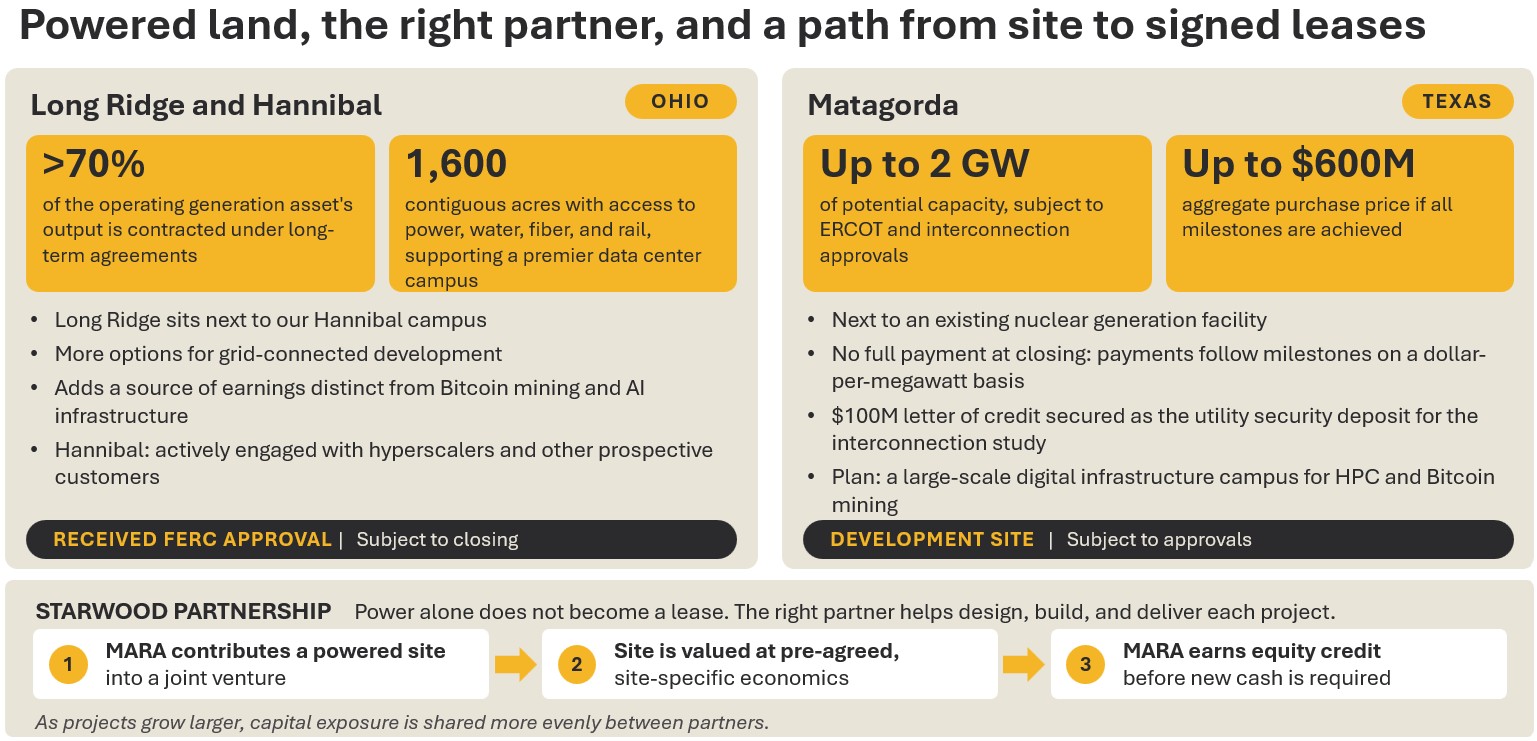
•Power: At Long Ridge, we recently received FERC approval, and we expect to close the transaction in the
coming weeks, subject to customary conditions. We are excited to add a highly efficient natural gas plant to our
portfolio that is currently authorized to sell 485 MW and expected to increase to the full 505 MW nameplate
capacity in the first half of 2027. Long Ridge will not only immediately strengthen our financial profile with
contracted cash flows from power generation but also provides us over 1,600 contiguous acres with access to
power, water, fiber, and rail, supporting a premier data center campus. Together with our existing Bitcoin mining
operations at the site, we will have over 1 GW of total potential capacity. We look forward to completing the
transaction and beginning the next phase of Long Ridge’s development as part of our strategy to expand into data
center infrastructure. In addition, we advanced our power portfolio by securing the rights to develop a site in
Matagorda County, Texas with up to 2 gigawatts ("GW") of power capacity. The site was recently classified as a
studied load by ERCOT in the Batch Zero process and we are working with the utility to bring power online. Any
payments to the sellers are contingent on power being approved and, to date, we have made none.
•Exaion signed a four-year $79M GPU-as-a-service contract on 100% take-or-pay terms with its first US
customer. Customer demand has built a pipeline of over $3 billion in total contract value, with approximately $1
billion of that targeted for delivery by the end of 2027. These are indications of demand and are not yet contracted
or committed.
•After quarter-end, our Board of Directors authorized a share repurchase program of up to $500M of our
common stock, which reflects the Board’s and management’s confidence in our long-term strategy and gives us
an additional tool to enhance shareholder returns. In the current environment, we are always looking to deploy our
capital where it can earn the highest and best return, and at times that may mean repurchasing our shares. While
markets have declined, bitcoin has remained resilient, and our balance sheet gives us the flexibility to act on those
opportunities when they arise. We intend to use it deliberately, in the way that creates the most advantage for our
SHAREHOLDER LETTER Q3 2026 4
shareholders. We have spent years building a differentiated portfolio spanning power, land and compute, and we
remain focused on turning that foundation into contracted returns and durable free cash flow. We will stay
disciplined in how we allocate capital, deploying it where we believe it can create the greatest value for you.
Under the program, we may repurchase shares from time to time through open market purchases, privately
negotiated transactions or other means in accordance with SEC regulations. The timing and amount of any
repurchases will depend on market conditions, share price, capital availability and other factors, and the program
does not obligate us to repurchase any particular amount and may be modified, suspended or terminated at any
time.
•After quarter-end, we repaid $750M of BTC-backed debt with proceeds from Bitcoin sales. The repayment
released all BTC that had been pledged as collateral, leaving less than 5% of our BTC holdings loaned or pledged.
Together with the $1.4 billion, or 37% of total debt reduced since the beginning of the year, this repayment
decreased our exposure to bitcoin price volatility. We intend to continue using bitcoin to build cash for purposes
such as AI infrastructure opportunities, to satisfy the puts on our convertible notes that become exercisable next
year, and potential share repurchases.
To put these milestones in context, it helps to start with the market in which we are building.
The Market
Investor sentiment toward AI infrastructure has become more cautious as the market assesses the pace of AI adoption,
community opposition, higher financing costs, and the credit structures behind some projects. These issues matter, but
they have not reduced the need for power.
Our customer conversations show that demand remains strong and increasingly favors sites that can deliver power on a
credible schedule. Customers are also asking about capacity in locations once considered peripheral, including our
international portfolio.
What has changed is that the market is applying a higher standard. Customers need power, land, permits, financing, and a
development partner who can meet a committed schedule. Lenders and investors are applying the same test.
That environment favors MARA.
MARA built our platform around these requirements. Bitcoin mining gave us deep expertise in power, infrastructure and
large-scale compute, and it is where we cut our teeth acquiring powered land. Today, we own and operate approximately
1 GW across a diversified portfolio of sites in the US and international markets. Subject to the closing of Long Ridge and
energization of Matagorda, we expect that portfolio to reach over 4 GW.
As AI and HPC demand grows, power-ready infrastructure has become the critical constraint. New generation and
transmission take years to build, and permitting and community opposition can stretch the timeline further. Customers are
paying a premium for sites that are already energized or have a credible path to near-term power. That makes what MARA
has built significantly more valuable.
That shift has shaped how we are evolving the business.
Where We Are Now
We are evolving into an energy-backed digital infrastructure enterprise spanning power, land, and compute.
It is important to remember that this is not a pivot away from bitcoin. Bitcoin remains our operating foundation and a
flexible way to monetize power while we develop higher-value infrastructure opportunities. Our strategic advantage is
optionality: we can deploy each megawatt toward the use that creates the greatest risk-adjusted return.
SHAREHOLDER LETTER Q3 2026 5
We see three transformational paths to value:
•Bitcoin mining remains a core business. It generates cash flow, keeps energized sites productive, and gives us
flexibility as other infrastructure is developed.
•AI and HPC infrastructure put our proposition of Speed, Certainty and Reliability into practice, converting
powered land into long-duration, contracted infrastructure for hyperscalers and other large compute customers.
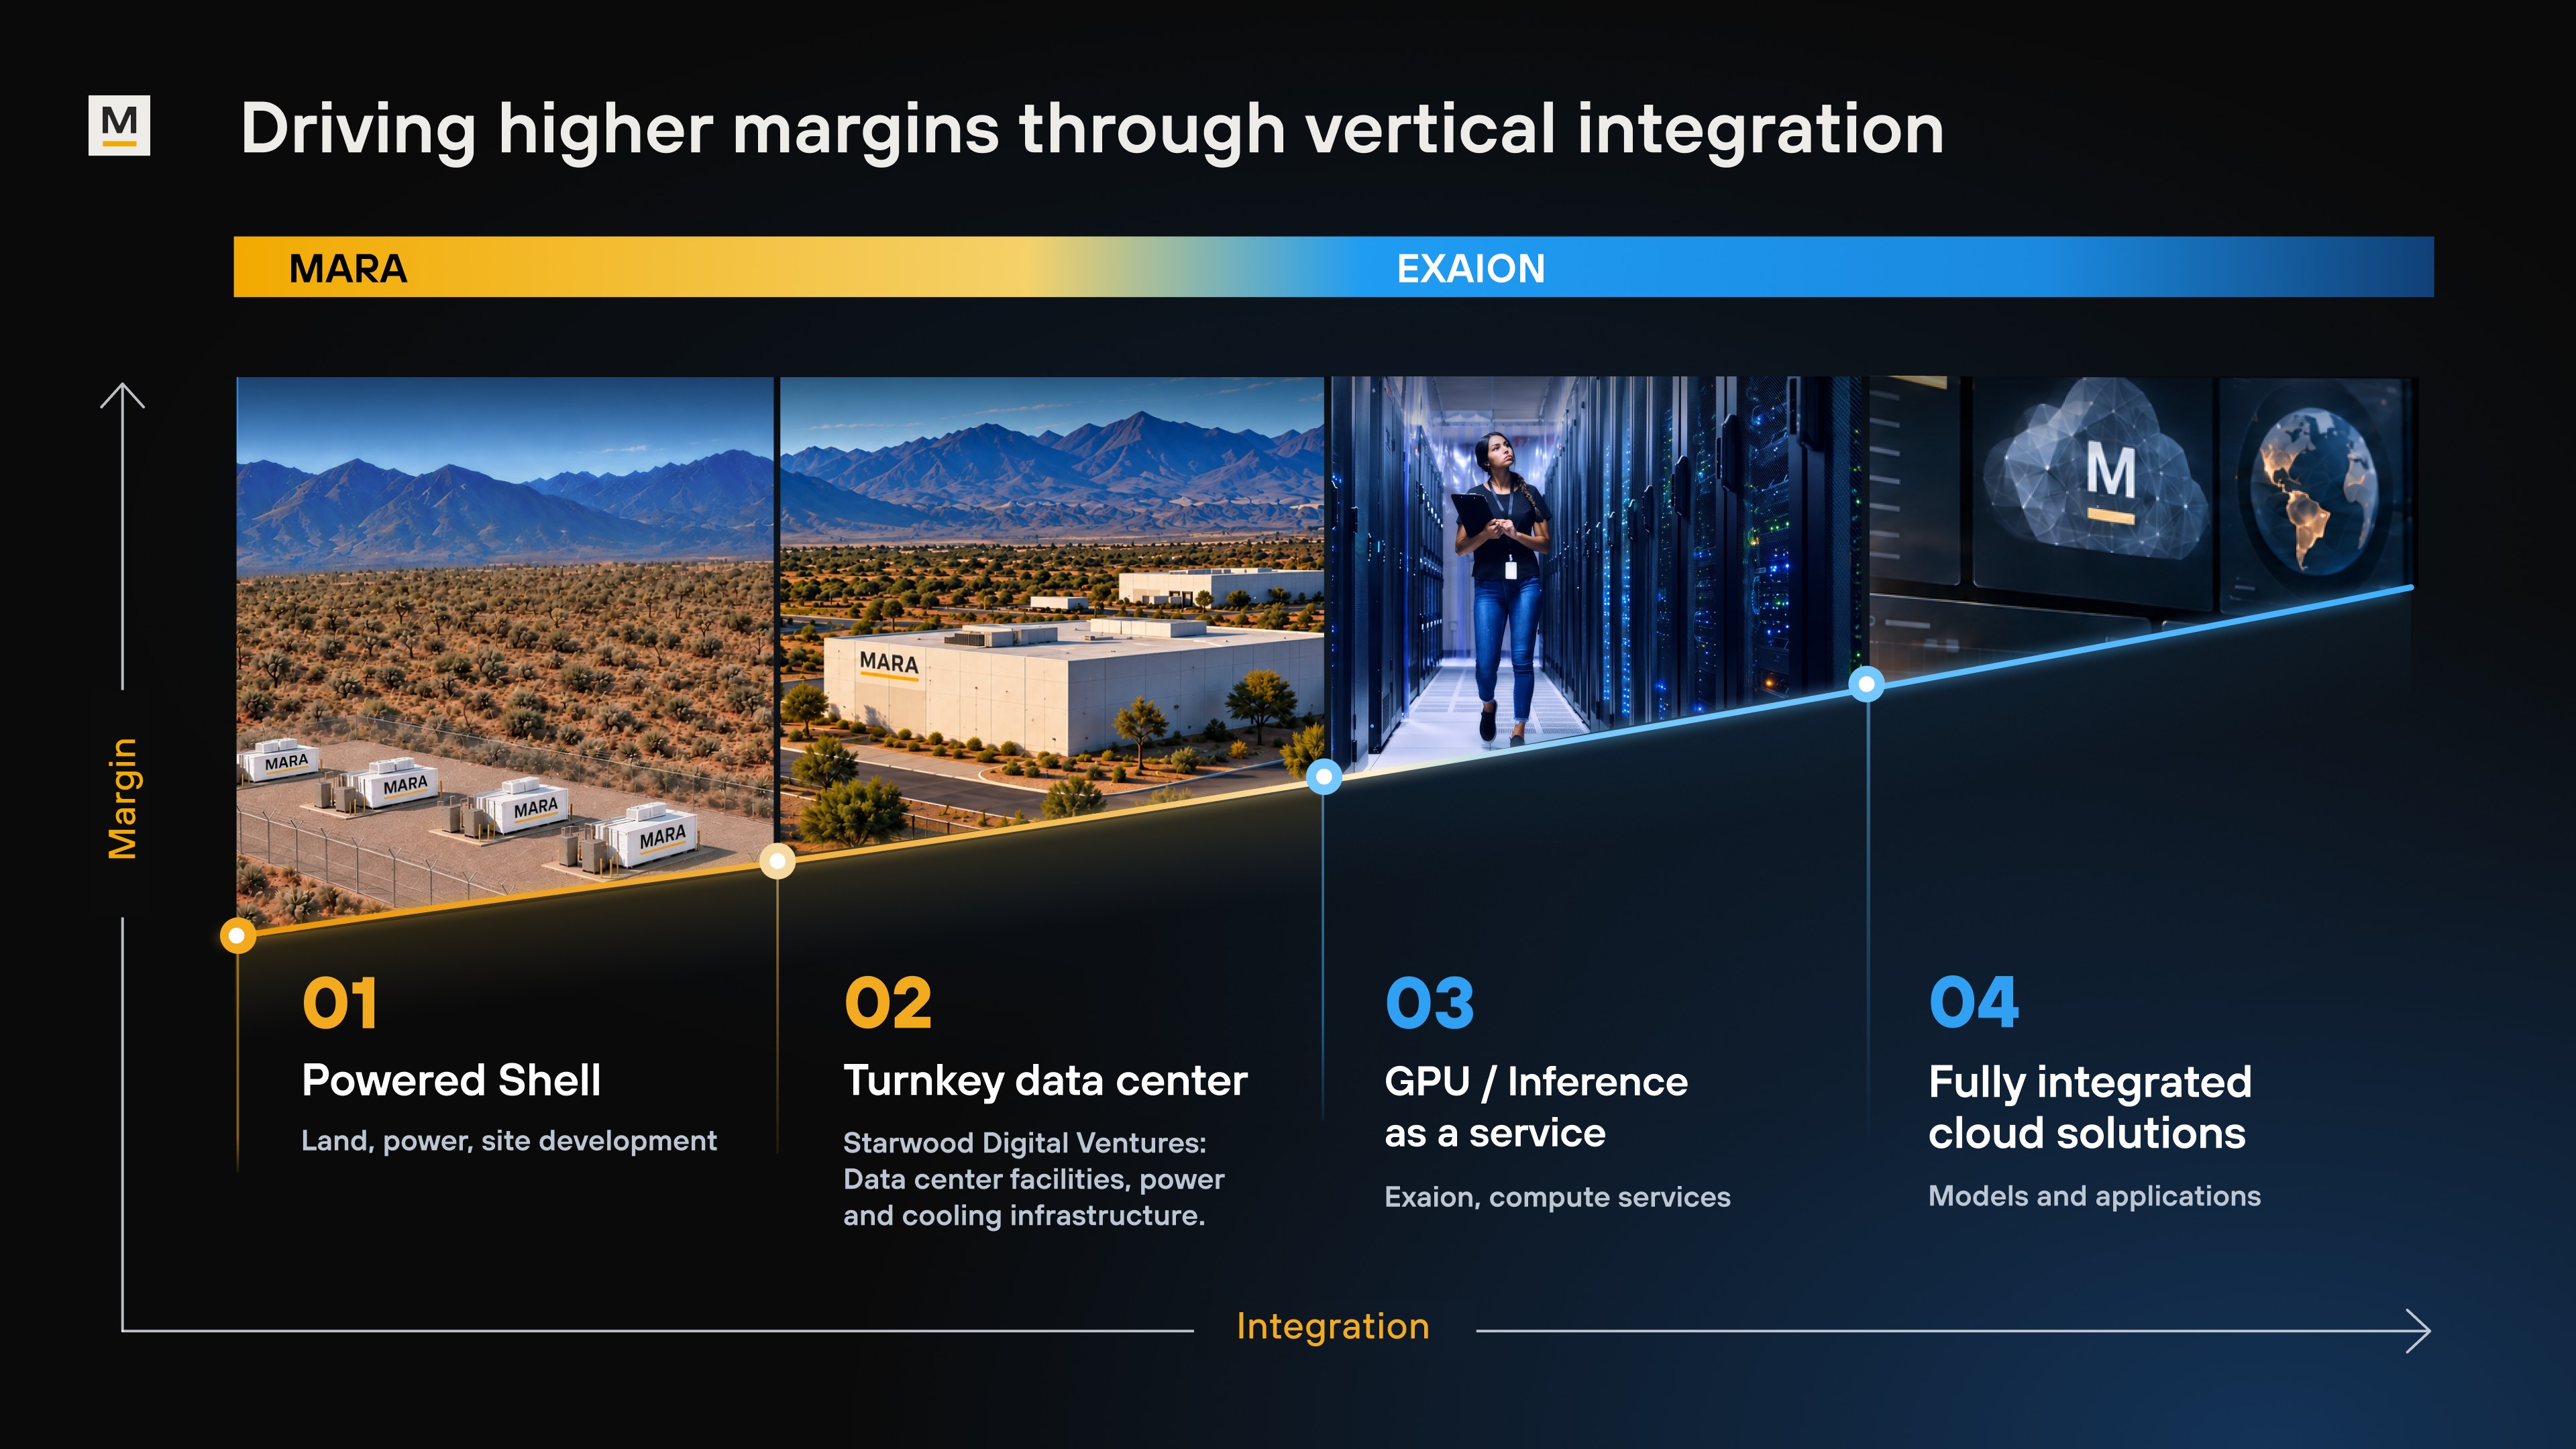
•Exaion provides private cloud infrastructure, inference and GPU-as-a-service, enabling MARA to capture the full
value stack all the way up to the enterprise customer, maximizing the value of every electron while moving up the
value and margin curve.
Why MARA is Positioned to Win
Three advantages set MARA apart.
We have the power and the ability to scale. Once we complete the first phase of a campus, most of the hard work on
land, interconnection, permitting, and campus infrastructure is behind us. A customer that begins with 200 MW may
ultimately want 400 MW, 600 MW or more, and we increase the value of the site without starting over somewhere else.
Large campuses can also host a mix of customers (hyperscalers, AI cloud providers and direct enterprise workloads),
which improves utilization and economics.
We can serve the full range of customers. MARA plus Exaion gives us capabilities across the full compute stack, from
powered infrastructure and traditional colocation to private cloud and AI services. We can lease infrastructure to a
hyperscaler at a lower yield on cost or accept more risk for a higher return with frontier model providers and others. We are
open to new technology solutions that help our customers. And Exaion gives us a footprint and leverage in Europe and
Canada, where it can be harder for a U.S. company to go directly.
We watched as aggressive pricing, rising rates, and uncertain delivery schedules eroded project economics for others.
That experience reinforced our decision to prioritize contracts that can be financed and delivered at acceptable returns. In
our experience, waiting has improved the terms available to us.
SHAREHOLDER LETTER Q3 2026 6
Subject to closing, required approvals and customary conditions. Descriptions are forward-looking and may change.
Exaion
Our future business model already has traction, and it integrates the entire MARA enterprise stack. As we build out our
digital infrastructure platform, Exaion gives us the opportunity to capture a greater share of the value chain, from providing
power and infrastructure to providing the compute and cloud services that run on top of it.
Over time, that creates the potential for MARA to participate in higher-margin AI compute services, enhancing the margin
per megawatt while leveraging the same underlying power and infrastructure assets at the foundation of our strategy.
Exaion takes MARA above the infrastructure layer. It provides private cloud infrastructure, open-weight model
orchestration, and inference as a service for customers who need greater control over their data, infrastructure, and
jurisdiction. Those needs are especially important for governments, regulated industries and enterprises in Europe, and
other markets where sovereignty and security shape technology decisions.
Exaion also lets us share in the value created by the compute itself. Its operating model can utilize GPUs across their
lifecycle, extending their utility and cash flow well beyond initial contract durations. That improves utilization and returns
across the life of the asset.
This is no longer simply a future-state thesis. We now have an early proof point with Exaion recently signing a major GPU-
as-a-service contract with total contract value of $79 million over four years, on 100% take-or-pay terms. The customer
commits to pay for the capacity whether or not it uses it, which gives us predictable, contracted revenue for the life of the
agreement.
This agreement is also a signal of demand. Exaion’s customers and prospects have expressed demand for more than 30
MW of compute capacity for delivery by the end of 2027. We view this contract as an early proof point of the model we are
building: MARA provides the energy-backed infrastructure, and Exaion turns it into compute and cloud services.
This is how we intend to move up the value chain: not by trying to own every layer on our own, but through strategic
partnerships. That gives us a unique, differentiating right to win.
Bitcoin Mining
All of this rests on the business that built MARA, which remains core to our strategy.
SHAREHOLDER LETTER Q3 2026 7
The competencies it takes to run a large mining fleet (power procurement, modular deployment, infrastructure
optimization and real-time load management) are the same competencies that digital infrastructure tenants require.
Modular deployment is a good example. It lets us bring capacity online faster than a traditional build and at lower cost,
which matters to customers who need compute up and running quickly. We believe MARA is one of the largest operators
of modular Bitcoin mining digital infrastructure in the United States, and we intend to apply that experience as we
transition towards AI/HPC.
We continue to modernize the fleet where the gain in efficiency and the expected payback justify the investment. When
equipment pricing is weak, we have been selective, acquiring machines that raise output without increasing total mining
power consumption. We weigh each of these investments against the timing of the next halving and the payback over the
full cycle.
Our objective is to increase computing output within the existing electrical footprint, and to preserve the option to direct
power to the use that offers the best risk-adjusted return. At some sites, that will remain Bitcoin mining. At others,
contracted AI/HPC infrastructure may be the better long-term use. We do not have to choose one or the other.
Vertebrai
We recently launched Vertebrai, MARA's flexible computing platform built on nearly a decade of running power-intensive
computing across energy markets. Power and demand rarely arrive at the same time, and Vertebrai's software decides,
moment to moment, where power should go. It absorbs power that would otherwise sit idle or sell at a loss, then scales
back when the grid needs that power elsewhere.
Based on the site's settlement data, April 1 to September 30, 2026. Percentages are shares of potential generation. "Without Vertebrai" assumes all potential generation during economic curtailment
periods, mostly hours when real-time prices were negative, would have been curtailed. Vertebrai's on-site computing used 53% of that energy.
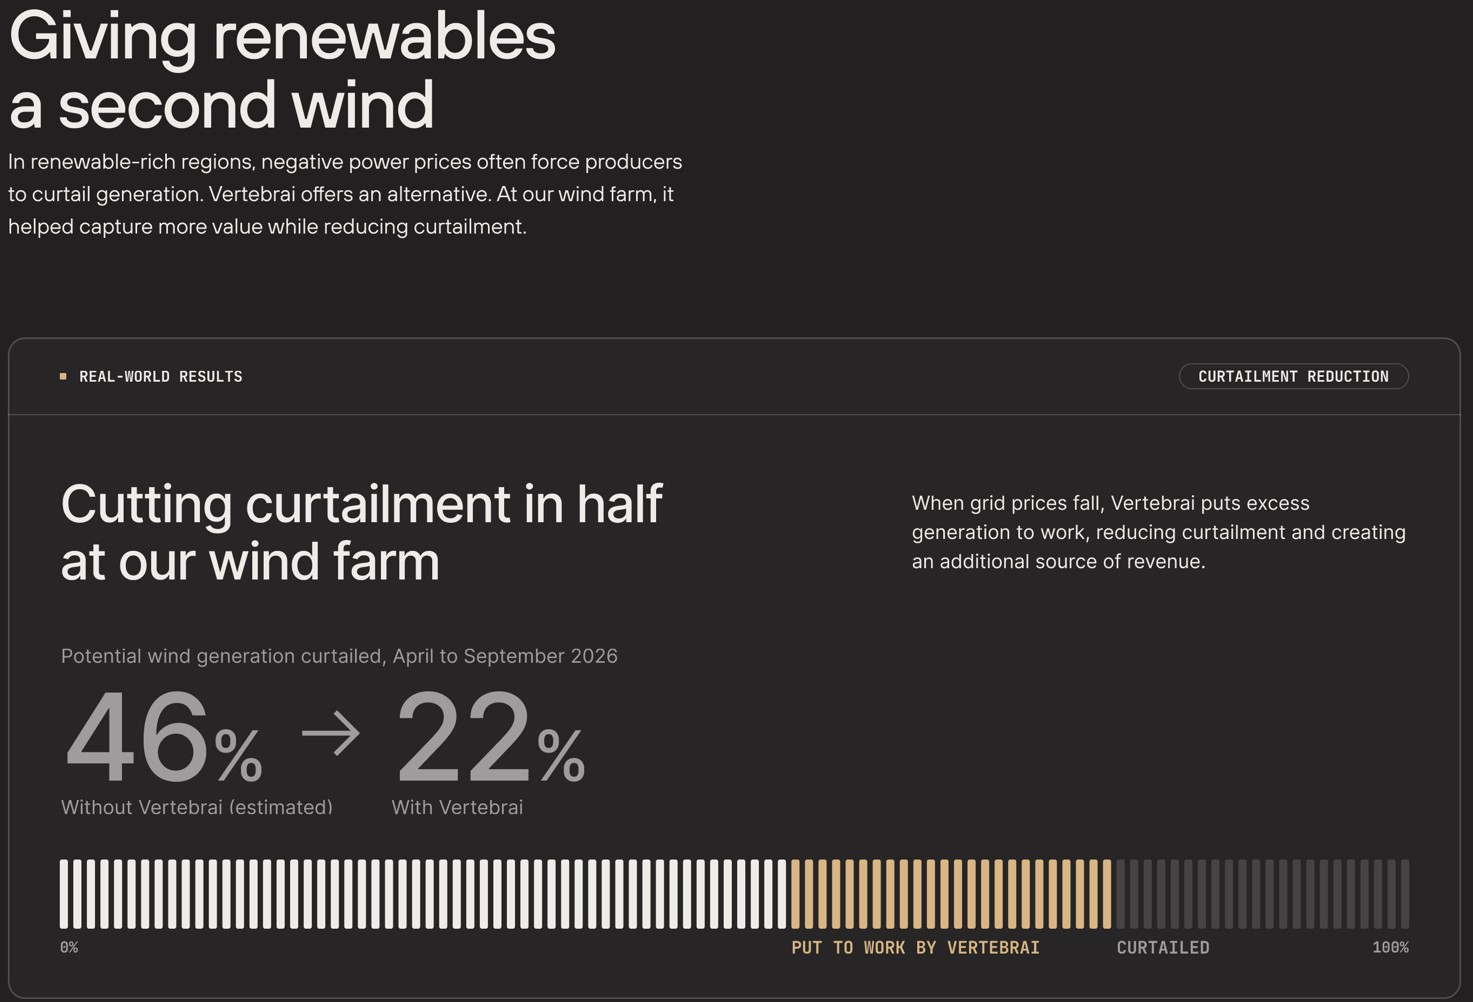
We proved it first at our own wind farm in Hansford County, Texas. From April through September 2026, we estimate that
Vertebrai helped our Texas wind farm cut curtailment by more than half. Without Vertebrai, an estimated 46% of potential
wind generation would have been curtailed. By using on-site computing to absorb power that otherwise would have gone
unused, Vertebrai reduced that figure to 22%, putting more of the farm’s generation to productive use and creating an
additional source of revenue.
SHAREHOLDER LETTER Q3 2026 8
We now see a similar opportunity with data center developers, who often secure power 18 to 24 months before their
facilities can use it while paying for a minimum share of it regardless. With Vertebrai now live, we are focused on bringing
this model to additional power producers and data center developers.
Balance Sheet and Capital Allocation
Each of these priorities depends on a strong balance sheet.
Our balance sheet has to support the obligations we have today and the opportunities we are building for tomorrow. So
we manage cash, bitcoin, debt, and access to capital as parts of one balance sheet. Since the beginning of the year, we
have reduced our total debt by $1.4 billion, or 37%.
We view bitcoin as a strategic asset and a source of financial flexibility. Depending on market conditions and the expected
return on the use of proceeds, we may hold it, monetize a portion, or borrow against it. That capital can support operations,
reduce debt, fund acquisitions, or advance projects we believe will increase long-term shareholder value. We used this
flexibility earlier in the year to repurchase convertible notes at a discount, and we continue to monitor the put dates on our
remaining obligations.
We will keep balancing growth against leverage and dilution. The Starwood model reduces the corporate equity required
for qualifying data center projects, and our bitcoin holdings and other sources of liquidity add capacity. We expect our
direct spending to stay focused on site control, interconnection, development work, targeted infrastructure upgrades, and
selected project equity where the prospective return warrants it.
The capital markets remain open for well-structured developments. We price each project to reflect the customer’s credit,
the support available from a parent or technology provider, and the financing needed to build the facility.
Looking Ahead
The next stage will be measured by execution. Demand for compute capacity remains strong, but the market is becoming
more selective about how that demand is financed and delivered. We believe that selectivity is constructive. It should
favor companies with real power, credible sites, strong partners, and the patience to structure projects properly. MARA
has spent years building exactly that.
When we think about MARA’s future, the opportunity is bigger than monetizing the megawatt. It is about increasing the
value we can capture from that megawatt as we move from power to infrastructure to compute, and ultimately to fully
integrated cloud solutions.
We entered 2026 focused on expanding the platform. We are ending the year focused on converting that platform into
contracted leases and free cash flow. Bitcoin built the foundation and our power portfolio broadened the opportunity. Our
partnerships expand the ways we can capture value from each megawatt. Our responsibility now is to execute with
discipline and to show you the returns these assets can produce.
Thank you for your continued support.

MARA Chairman & CEO
SHAREHOLDER LETTER Q3 2026 9
Third Quarter Financial and Operational Discussion |
Highlights
–Our energized hashrate was 71.2 EH/s, increasing
18% from 60.4 EH/s as of Q3 2025.
–Revenue was $164.2 million, a decrease of 35% from
$252.4 million in Q3 2025.
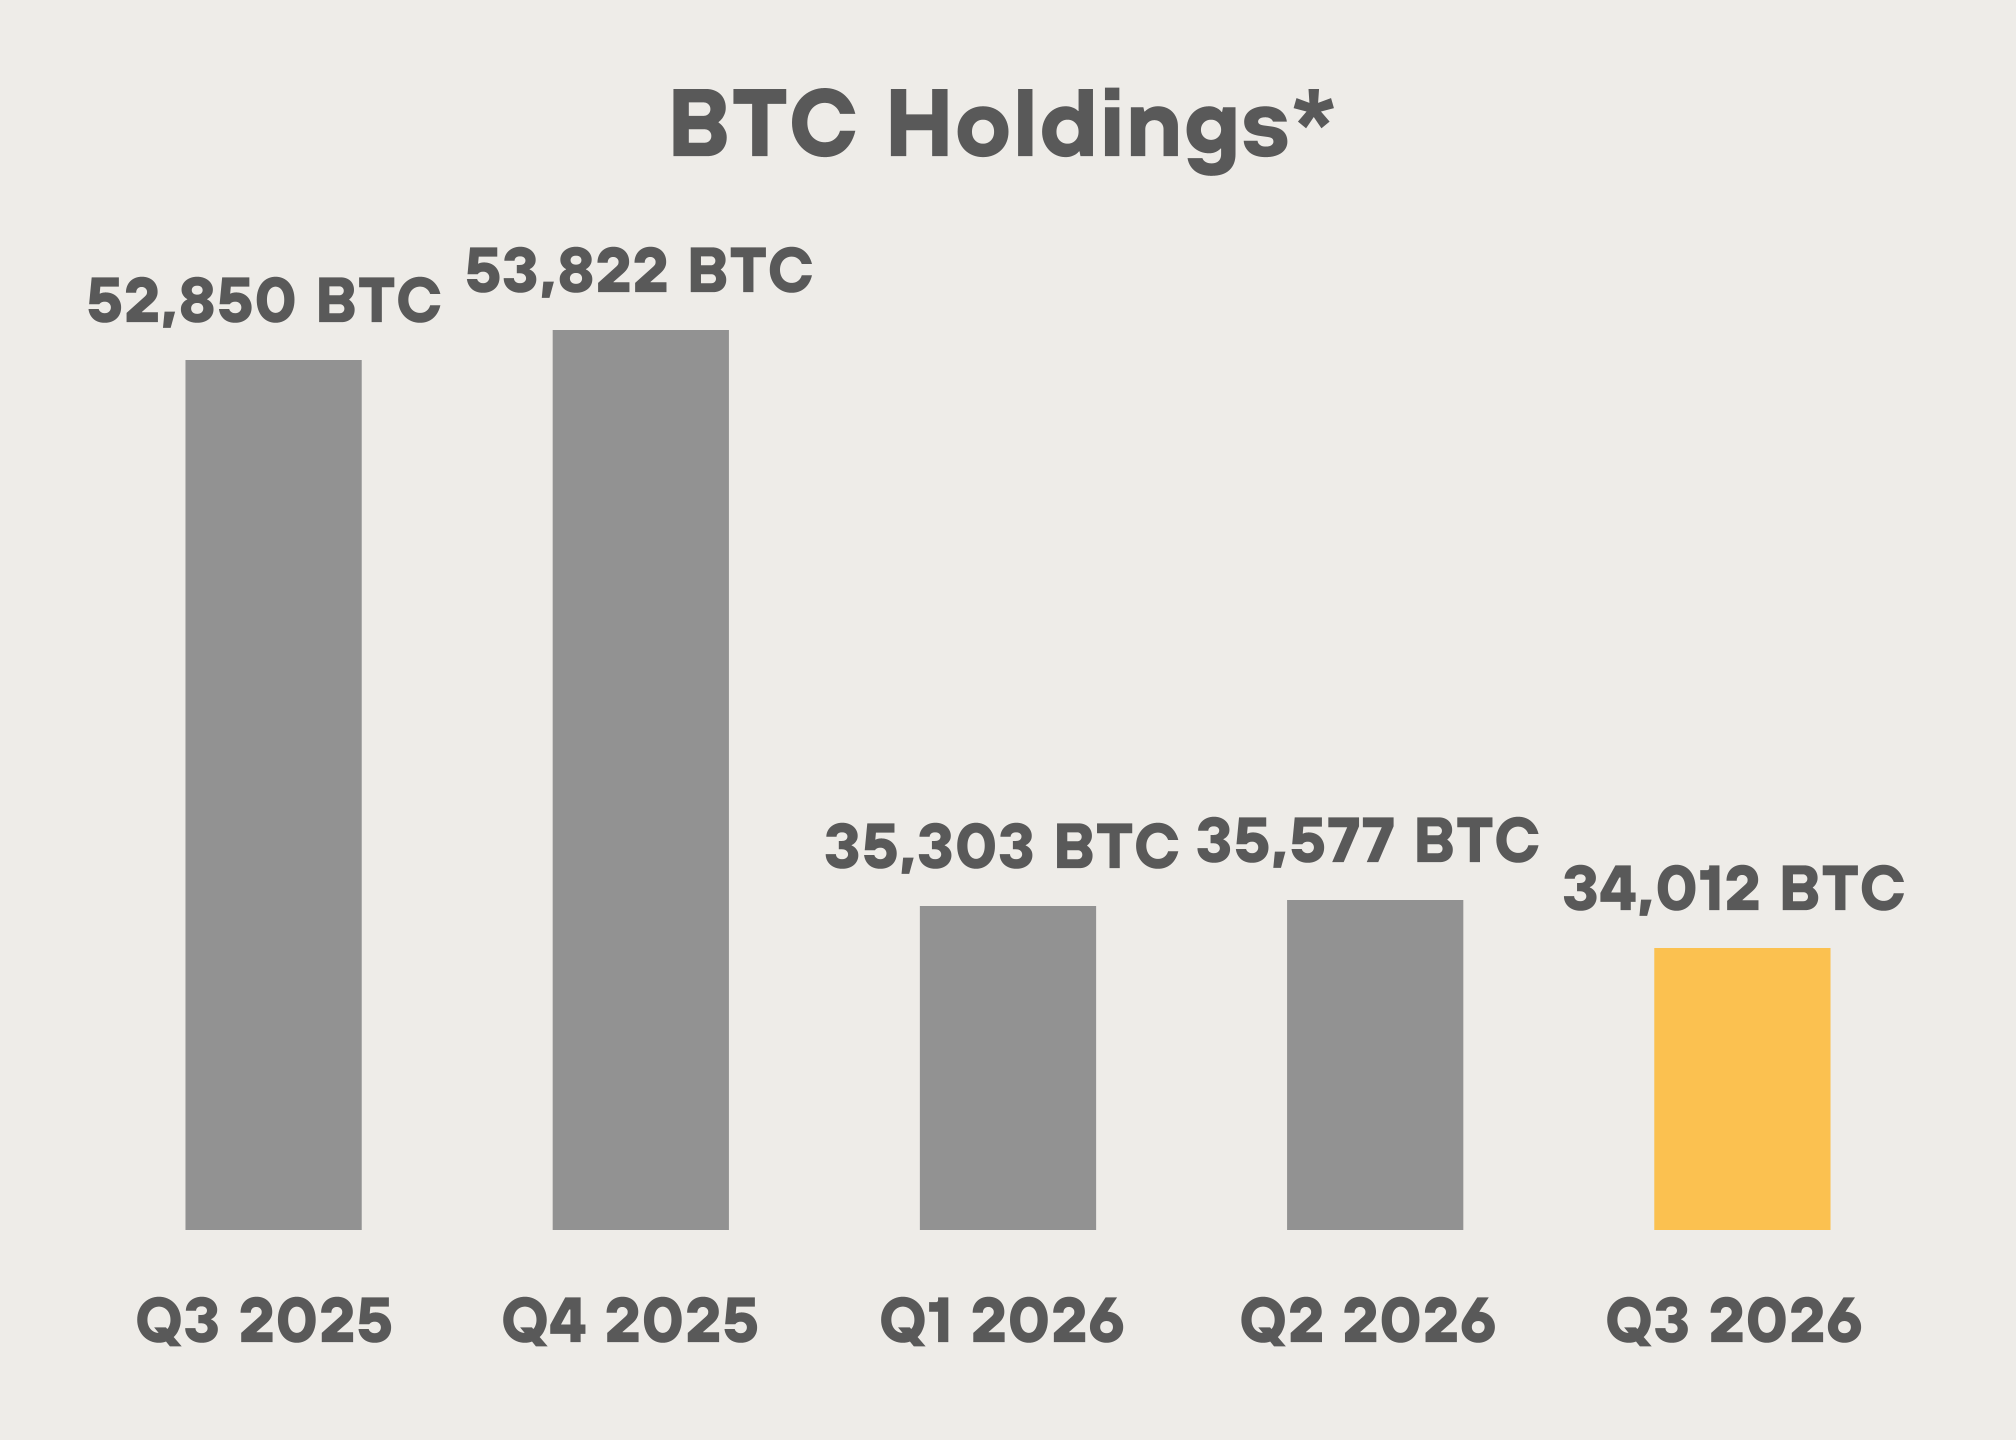
–We held 34,012 BTC (including digital assets -
receivable, net) and produced 2,247 BTC at an
average price of $71,688. We sold 3,891 BTC at an
average price of $75,300.
–Total blocks won increased 2% to 644 from 633 in
Q3 2025.
–Our cost per kWh was $0.04 for our owned sites.
Purchased energy cost per bitcoin was $39,674,
slightly up from $39,235 in Q3 2025.
–Cost per petahash per day improved 2% to $30.8
from $31.3 in Q3 2025.
–Net income was $632.1 million, or $1.28 per diluted
share, compared to $123.1 million, or $0.27 per
diluted share, in Q3 2025. Net income during the
quarter includes an $885.3 million gain related to
the fair value of digital assets.
–Adjusted EBITDA was $857.7 million, compared to
$395.6 million in Q3 2025.
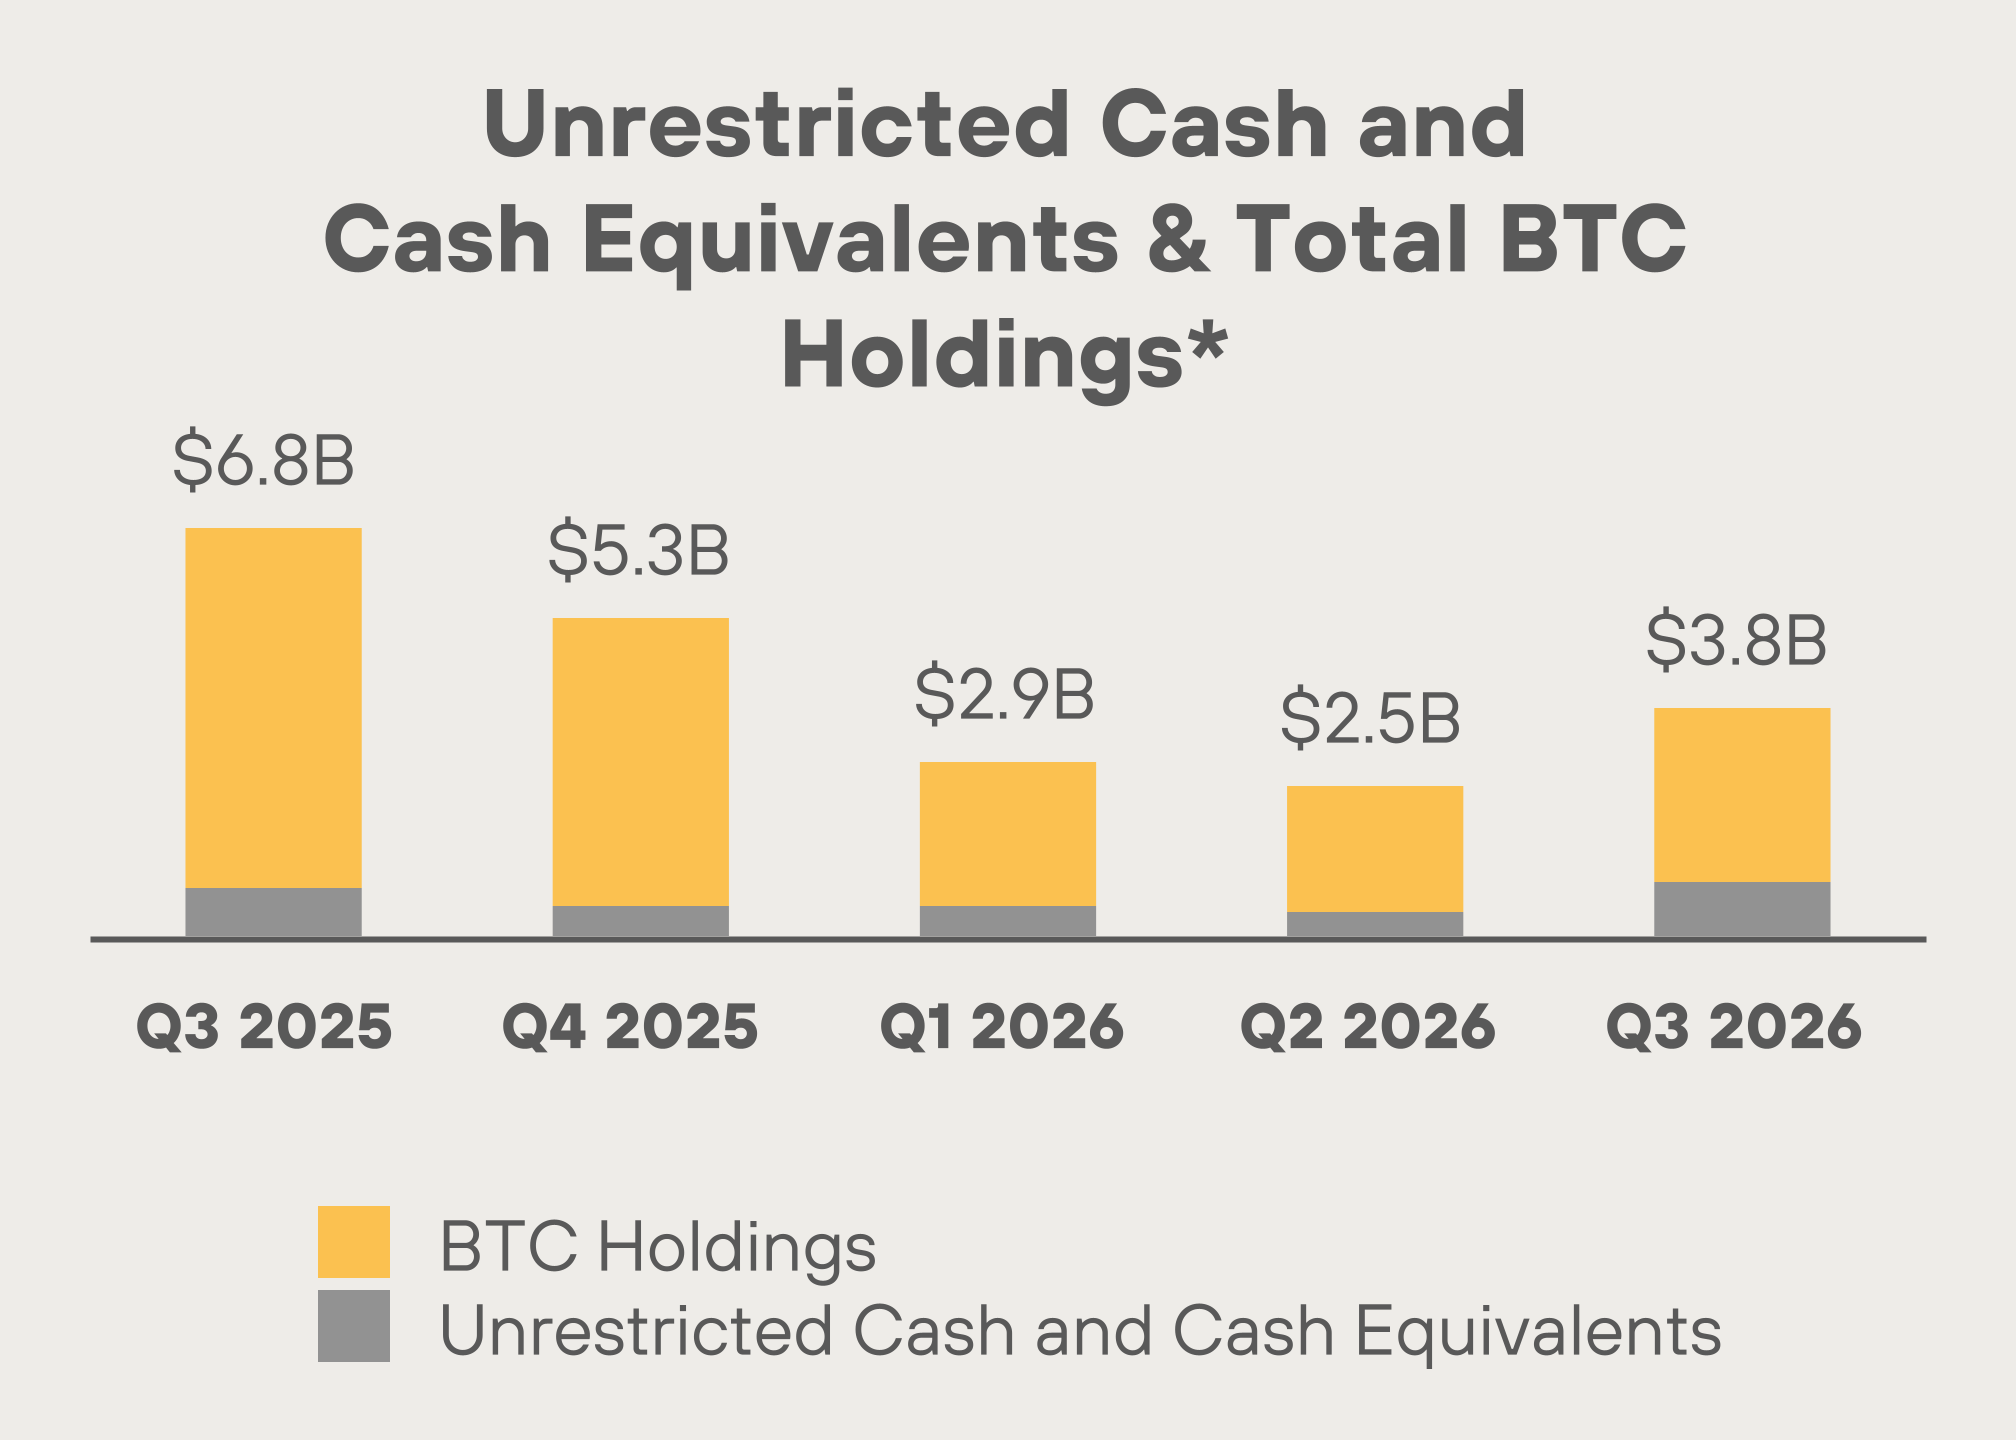
–$3.8 billion of combined unrestricted cash and cash
equivalents and BTC (including bitcoin loaned or
pledged as collateral)
–Loaned 1,408 BTC under our digital asset
management strategy, generating approximately
$2.5 million of interest income for the quarter.
–We advanced our power portfolio by securing the
rights to develop a Matagorda County, Texas site
with up to 2 GW, structured so that payments
follow regulatory approvals and development
progress. The site was classified as a studied load
by ERCOT in the Batch Zero process. After quarter-
end, we obtained a $100.0 million letter of credit for
the interconnection study deposit.
–After quarter-end, we received FERC approval for
our Long Ridge acquisition, which we expect to
close by year end. Once completed, Long Ridge is
expected to generate significant adjusted EBITDA,
with roughly 70% of its output under long-term
contracts.
–After quarter-end, we sold 13,597 bitcoin around
$81,039, with proceeds of approximately $1.1 billion.
We used $750.0 million to fully repay our Bitcoin-
collateralized term loans. The repayment resulted in
the return of 17,477 bitcoin previously pledged as
collateral.
–Year to date, we deleveraged our balance sheet by
reducing $1.4 billion, or 37% of total debt.
–After quarter-end, our Board authorized MARA’s
share repurchase program of up to $500.0 million,
reflecting confidence in our long-term strategy and
adding a tool to enhance shareholder returns.
Third Quarter Production Highlights
Prior Quarter Comparison | Prior Year Period Comparison | ||||
Metric | Q3 2026 | Q2 2026 | % Δ | Q3 2025 | % Δ |
Number of Blocks Won | 644 | 700 | (8%) | 633 | 2% |
BTC Produced | 2,247 | 2,422 | (7%) | 2,144 | 5% |
Average BTC Produced per Day | 24.4 | 26.6 | (8%) | 23.3 | 5% |
Share of Available Miners Rewards (1) | 5.4% | 5.9% | (9%) | 5.0% | 9% |
Energized Hashrate (EH/s) (2) | 71.2 | 70.3 | 1% | 60.4 | 18% |
1.Defined as the total amount of block rewards including transaction fees that MARA earned during the period divided by the total amount of block rewards and transaction fees awarded by
the Bitcoin network during the period.
2.Defined as the amount of hashrate that could theoretically be generated if all miners that have been energized are currently in operation including miners that may be temporarily offline.
Hashrates are estimates based on the manufacturers’ specifications. All figures are rounded.
SHAREHOLDER LETTER Q3 2026 10
REVENUE
Revenue was $164.2 million, a decrease of
$88.2 million, or approximately 35%, from
$252.4 million in the prior year period. Bitcoin
mining revenue accounted for $83.1 million of
the decrease. A 37% decline in the average
price of bitcoin mined lowered revenue by
$94.8 million, partially offset by an $11.7 million
benefit from higher bitcoin production.
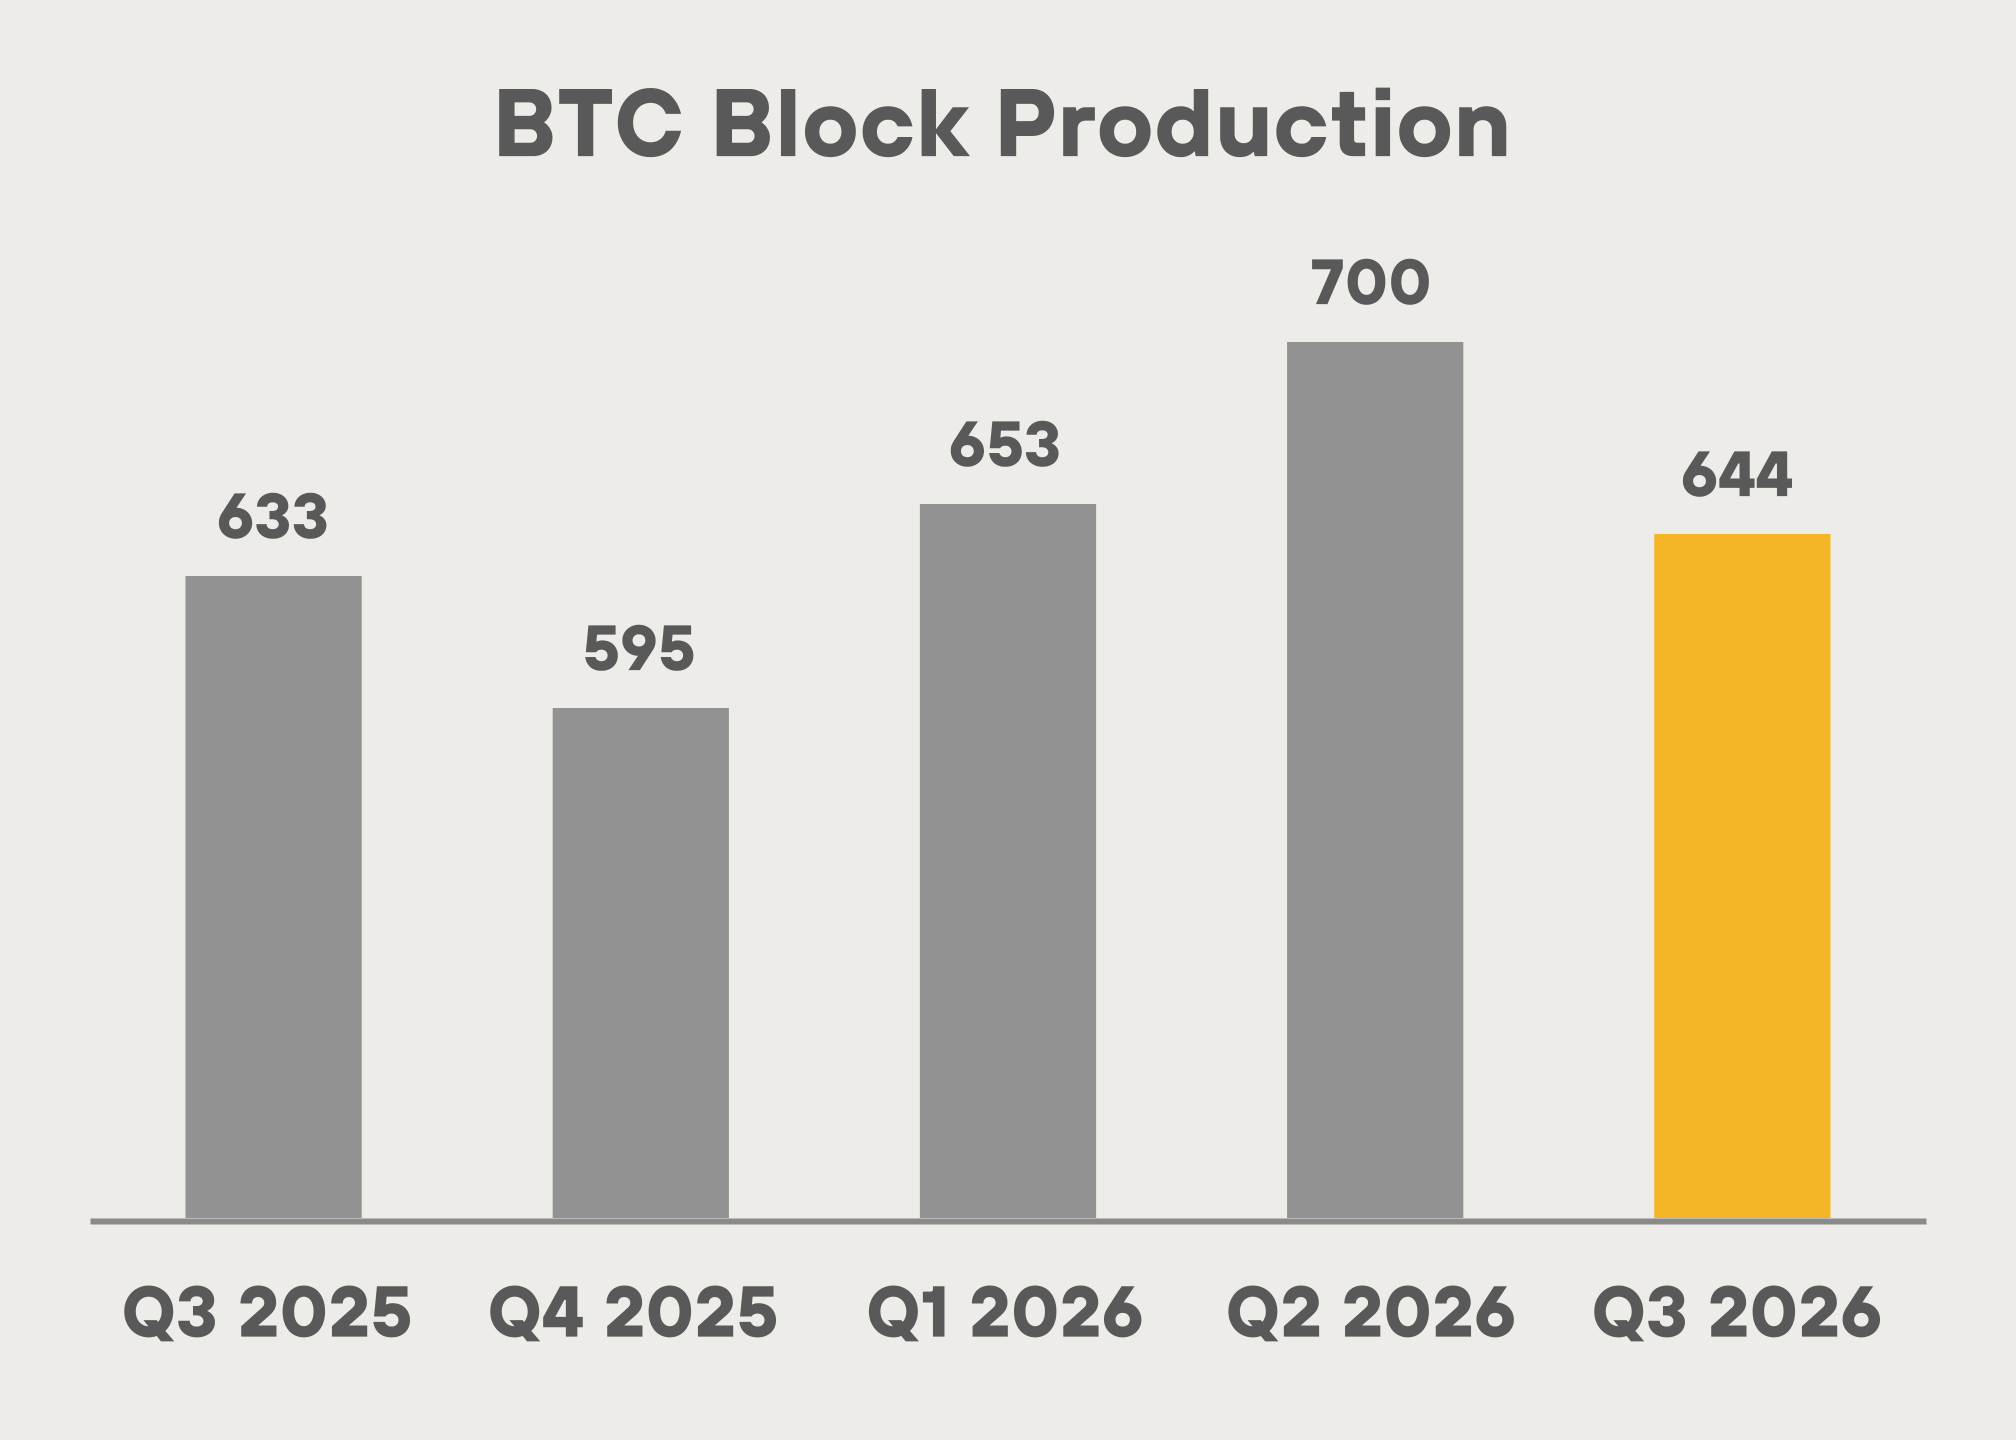
We produced an average of 24.4 BTC per day,
up from 23.3 BTC in Q3 2025, resulting in 2,247
BTC mined compared to 2,144 or 5% more BTC
mined year-over-year. Blocks won also
increased 2% over the same period.
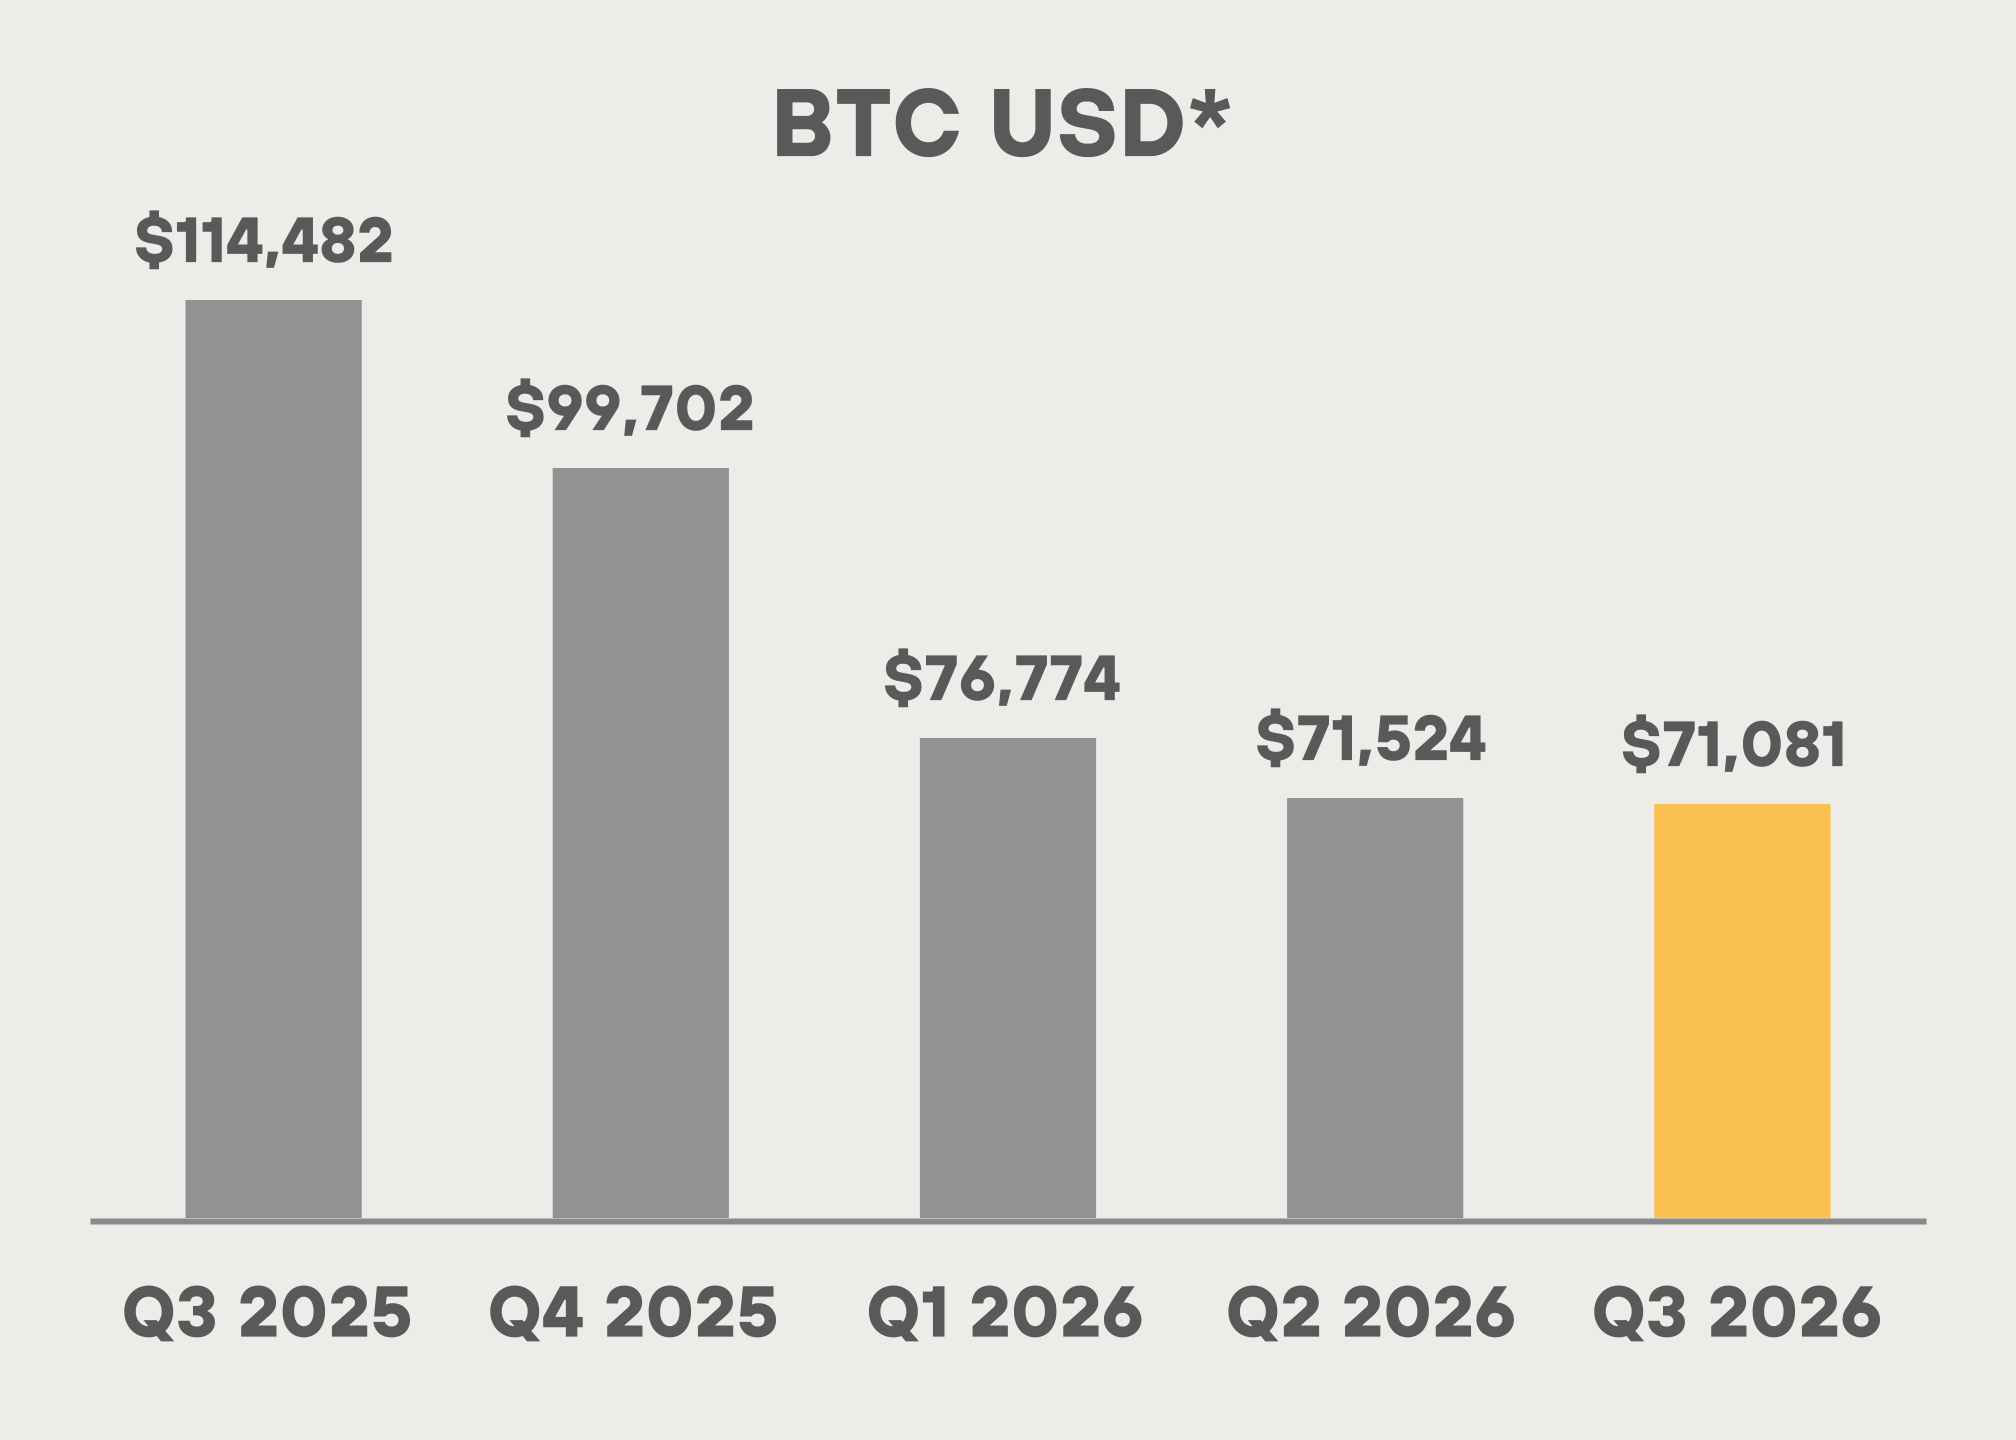
*Average Price of BTC over the quarter
NET INCOME
We reported net income of $632.1 million, or
$1.28 per diluted share, compared to net
income of $123.1 million, or $0.27 per diluted
share, in the third quarter of 2025.
The $508.9 million increase in net income was
primarily driven by an $885.3 million unrealized
bitcoin mark-to-market gain in Q3 2026,
compared to a $343.1 million gain in the prior
year period, representing approximately $542.2
million year-over-year change, reflecting a 27%
improvement in BTC price during the quarter.
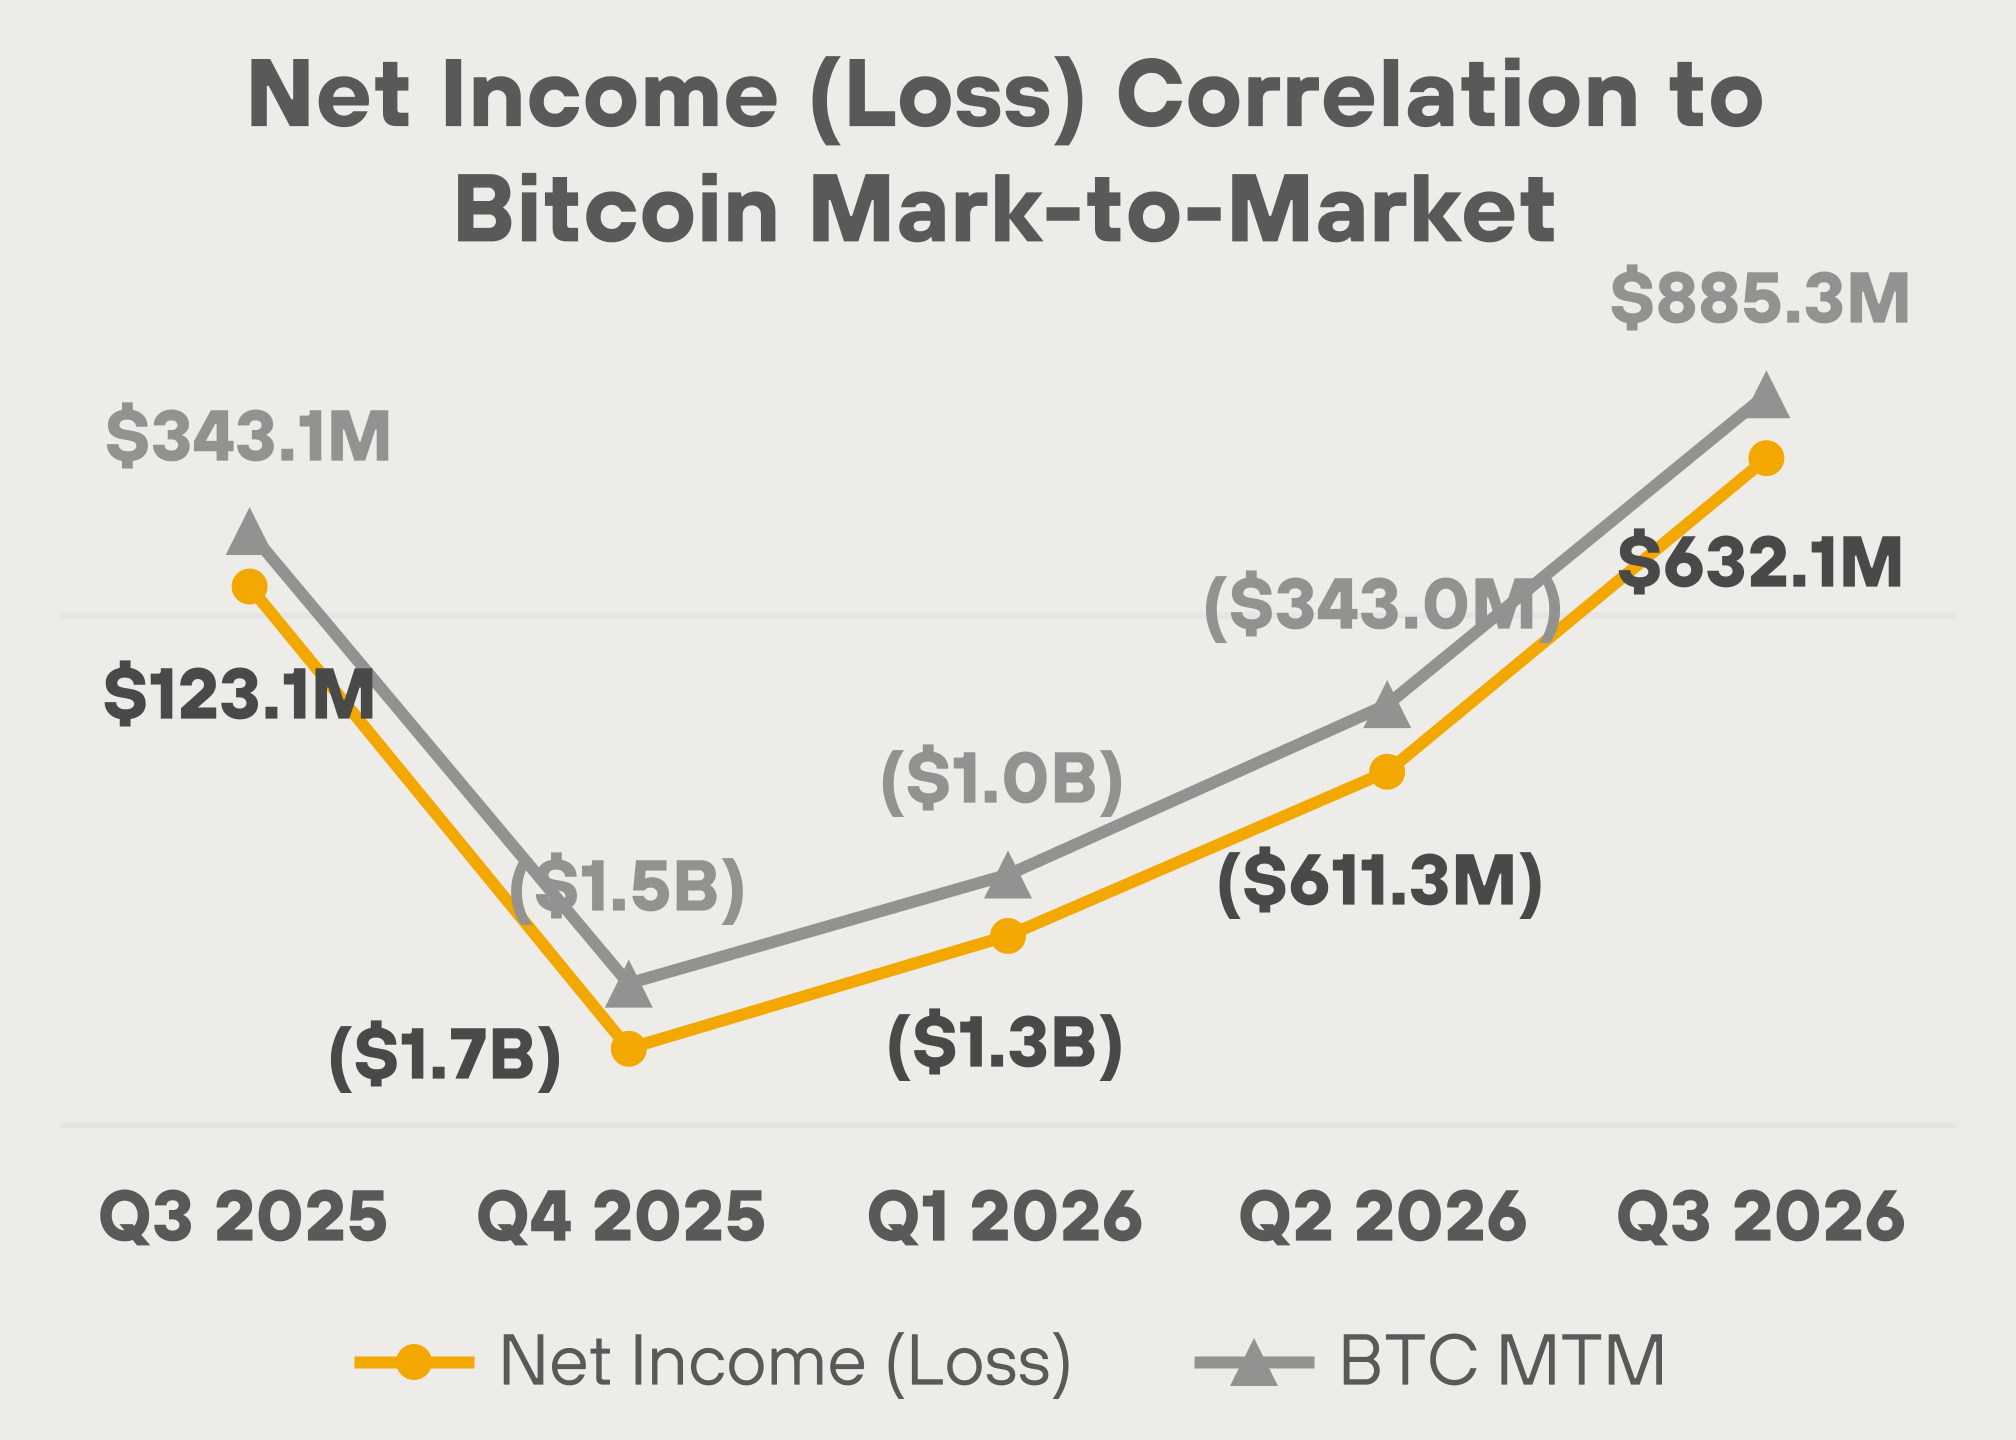
This chart illustrates the close relationship between the mark-to-
market impact on the company's bitcoin holdings relative to its
reported net income (loss).
SHAREHOLDER LETTER Q3 2026 11
PURCHASED ENERGY COSTS
We define purchased energy costs as the
amount paid to power providers for power
consumed related to our owned Bitcoin mining
operations. Our purchased energy costs were
$48.1 million, compared to $43.1 million in the
prior year period. The 12% increase was
primarily driven by the growth of our owned
mining operations through a site acquisition
during the year and increased utilization of
capacity at our newest Central Nebraska and
our Central Ohio sites, partially offset primarily
by weather-related downtime at certain sites.
Total energized hashrate increased 18% to 71.2
EH/s from 60.4 EH/s in Q3 2025, primarily
through improvements in miner efficiency.
Our owned sites maintained a cost per kWh of
$0.04. Purchased energy cost per bitcoin for
our owned and operated sites was $39,674,
compared to $39,235 in Q3 2025, primarily
driven by higher power costs and global
network difficulty outpacing our hashrate
growth.
OPERATING AND MAINTENANCE COSTS
Operating and maintenance costs were $21.5
million compared to $26.3 million in the prior
year period, a decrease of $4.8 million. The
decrease was primarily due to realized gains
from energy derivative contracts and lower
shipping costs, partially offset by higher site
and miner repair and maintenance costs.
THIRD-PARTY HOSTING AND OTHER
ENERGY COSTS
Third-party hosting and other energy costs
primarily consist of colocation services related
to third-party hosted sites. Third-party hosting
and other energy costs were $71.5 million,
compared to $75.7 million in Q3 2025, a $4.2
million decrease driven by lower hosting costs,
partially offset by higher energy consumption
at certain third-party hosted sites.
Our most significant third-party hosting
arrangements, representing approximately 29%
of our total energy capacity, are scheduled to
expire, beginning in the third quarter of 2027
and expected to fully conclude during the first
quarter of 2028. These expirations are
expected to eliminate third-party hosting costs
and improve our cost per kWh over time as the
arrangements expire.
COST PER PETAHASH
Our cost per petahash per day improved 2% to
$30.8 from $31.3 in Q3 2025, and has improved
20% over the past eight quarters.
GENERAL AND ADMINISTRATIVE
General and administrative ("G&A") expenses
were $75.8 million compared to $85.3 million in
the prior year period. The $9.5 million or 11%
decrease primarily reflects a $9.8 million
reduction in stock-based compensation
expense. This was partially offset by G&A
SHAREHOLDER LETTER Q3 2026 12
expenses from the operating costs of our
recently acquired majority-owned subsidiary,
Exaion, and administrative costs supporting our
expanded footprint.
DEPRECIATION AND AMORTIZATION
Depreciation and amortization was $150.9
million, a $16.5 million decrease compared to
the prior year period. The 10% decrease was
driven by lower depreciation as certain mining
rigs reached the end of their useful lives.
ADJUSTED EBITDA
Adjusted EBITDA increased to $857.7 million,
*including BTC loaned, actively managed or pledged as collateral
up 117%, from $395.6 million compared to Q3
2025. The increase was primarily driven by a
mark-to-market change in the fair value of
digital assets, primarily reflecting a larger
increase in bitcoin prices during the quarter.
BALANCE SHEET
At quarter end, we held 34,012 bitcoin,
including 19,260 bitcoin loaned or pledged as
collateral. During Q3 2026, we mined 2,247
BTC. As of September 30, 2026, our BTC
holdings were valued at approximately $2.8
billion based on a spot price of $83,556 per
bitcoin.
15,133 BTC sold
to retire ~$1.0B
of converts

Cash and cash equivalents totaled $946.5
million, up from $547.1 million as of December
31, 2025. Combined, our balance of cash and
BTC (including bitcoin loaned and pledged as
collateral) was approximately $3.8 billion at
quarter end.
In July, we sold 3.8 million shares of common
stock representing our year-to-date ATM
usage. We had approximately $1.5 billion of
capacity remaining as of September 30, 2026.
We believe our existing liquidity resources
provide us with sufficient flexibility to meet our
obligations and fund our growth initiatives over
the next twelve months and beyond.
SHAREHOLDER LETTER Q3 2026 13
*including BTC loaned, actively managed and pledged as collateral
DIGITAL ASSET MANAGEMENT
We held a total of 34,012 bitcoin, including
19,260 bitcoin that were loaned or pledged as
collateral. As such, approximately 57% of our
total holdings were activated through our
digital asset management strategy. Under our
lending arrangements, a total of 1,408 bitcoin
were loaned to counterparties, generating
approximately $2.5 million of interest income
during the quarter.
MARA's BTC Holdings | |
As of September 30, 2026 | Quantity |
Bitcoin, unrestricted | 14,752 |
Bitcoin - Receivable | |
Bitcoin - Loaned | 1,408 |
Bitcoin - Pledged as Collateral | 17,852 |
19,260 | |
Total | 34,012 |
For the nine months ended September 30,
2026, we sold approximately 26,984 bitcoin for
$1.9 billion in proceeds. Subsequent to quarter-
end, we sold 13,597 bitcoin at approximately
$81,039, with proceeds of approximately
$1.1 billion. In 2025, we changed our strategy to
permit sales of bitcoin generated from
operations and in 2026 we expanded this
strategy to allow for sales of bitcoin held on our
balance sheet. We expect to continue to
monetize bitcoin to enhance our financial
flexibility, including to provide liquidity or to
fund capital projects and other initiatives that
we believe enhance long-term shareholder
value, subject to market conditions and our
capital allocation priorities.
CAPITAL ALLOCATION
During the quarter, we entered into
$750.0 million of Bitcoin-collateralized
borrowings, consisting of $600.0 million of new
capital and $150.0 million that refinanced an
existing facility, to fund the Long Ridge
acquisition. Subsequent to quarter end, we
fully repaid the loans, releasing all bitcoin
previously pledged as collateral. We borrowed
against bitcoin while it was trading around
$64,000, and after quarter-end, sold 13,597
bitcoin at an average price of approximately
$81,039 , generating $1.1 billion in proceeds.
Disciplined and patient execution enabled us to
capture an estimated net benefit of $170.0
million.
Since the beginning of 2026, we have
deleveraged our balance sheet by $1.4 billion,
or 37% of total debt, lowering our exposure to
bitcoin price volatility while funding the
acquisition on a non-dilutive basis.
By using our bitcoin to fund Long Ridge and
then reduce leverage, we put our digital assets
to work while strengthening our balance sheet.
Alongside lending and monetization, Bitcoin-
backed financing remains one more tool we
have and can use in the future to support
growth with the same discipline.
SHAREHOLDER LETTER Q3 2026 14
After the quarter-end, our Board of Directors
authorized MARA’s share repurchase program
of up to $500.0 million of our common stock. It
reflects the Board’s and management’s
confidence in our long-term strategy and is an
additional tool in our capital allocation toolkit to
enhance shareholder returns. Under the
program, we may repurchase shares from time
to time through open market purchases,
privately negotiated transactions or other
means in accordance with SEC regulations.
The timing and amount of any repurchases will
depend on market conditions, share price,
capital availability and other factors. The
program does not obligate us to repurchase
any particular amount and may be modified,
suspended or terminated at any time.
Every capital decision we make follows the
same discipline: deploy capital where we
believe it can create the greatest value for
you.
Power remains the foundation of our strategy.
We have built a portfolio of approximately 1.9
GW, with a clear path to 4.8 GW. We have
secured the foundation of MARA's digital
infrastructure transformation. With power,
partners, and capital in place, we are executing
our strategy to deliver long term shareholder
value.
MARA Chief Financial Officer
SHAREHOLDER LETTER Q3 2026 15
Earnings Webcast and Conference Call |
MARA will hold a webcast and conference call today,
November 9, 2026, at 5:00 p.m. Eastern Time (2:00 p.m.
Pacific Time) to discuss its financial results for the
quarter ended September 30, 2026.
To register to participate in the conference call or to
listen to the live audio webcast, please use this link. The
webcast will also be broadcast live and available for
replay via the investor relations section of our website.
Earnings Webcast and Conference Call Details
Date: Monday, November 9, 2026
Time: 5:00 p.m. Eastern Time (2:00 p.m. Pacific
Time)
Registration link: LINK
If you have any difficulty connecting with the conference
call, please contact MARA's investor relations team at
ir@mara.com
About MARA
MARA Holdings, Inc. (NASDAQ: MARA) is a global,
energy-backed digital infrastructure enterprise. We
acquire, develop, and operate scarce powered assets at
scale, with 1.9 GW of energized capacity today across
nearly 20 sites on 4 continents, and a clear path to
approximately 4.8 GW. Our vertically integrated model
spans power, land, and compute, designed to deliver the
speed, certainty, and reliability that AI, HPC, cloud, and
enterprise customers need. Backed by almost a decade
of operating power-intensive compute at industrial scale,
Bitcoin mining is our operating foundation, providing a
source of flexibility and keeping sites operating and
generating revenue while we develop higher-value
infrastructure paths.
For more information, visit www.mara.com, or follow us
on:
X | @MARA |
LinkedIn | MARAHoldings |
Facebook | MARAHoldings |
Instagram | @MARAHoldingsInc |
MARA Company Contacts:
Telephone: 1.800.804.1690
Email: ir@mara.com
MARA Media Contact:
Email: mara-jf@joelefrank.com
SHAREHOLDER LETTER Q3 2026 16
MARA Holdings, Inc. and Subsidiaries
Condensed Consolidated Statements of Operations (unaudited)
Three Months Ended September 30, | Nine Months Ended September 30, | |||||||
(in thousands, except share and per share data) | 2026 | 2025 | 2026 | 2025 | ||||
Revenues | $164,233 | $252,410 | $513,728 | $704,779 | ||||
Costs and operating expenses (income) | ||||||||
Purchased energy costs | 48,124 | 43,080 | 141,606 | 128,291 | ||||
Operating and maintenance costs | 21,481 | 26,310 | 79,018 | 68,466 | ||||
Third-party hosting and other energy costs | 71,511 | 75,664 | 210,715 | 212,876 | ||||
General and administrative | 75,815 | 85,296 | 277,373 | 264,109 | ||||
Depreciation and amortization | 150,851 | 167,312 | 517,071 | 486,950 | ||||
Change in fair value of digital assets | (421,853) | (234,240) | 542,383 | (686,105) | ||||
Change in fair value of derivative instrument | 18,952 | 4,422 | 61,766 | (42,717) | ||||
Impairment of goodwill and other assets | — | — | — | 26,253 | ||||
Taxes other than on income | 1,333 | 2,354 | 5,284 | 7,886 | ||||
Early termination expenses | — | 5,000 | — | 5,000 | ||||
Research and development | 2,495 | 8,716 | 17,916 | 26,560 | ||||
Restructuring costs | 18,979 | 20,905 | 66,617 | 20,905 | ||||
Total costs and operating expenses (income) | (12,312) | 204,819 | 1,919,749 | 518,474 | ||||
Operating income (loss) | 176,545 | 47,591 | (1,406,021) | 186,305 | ||||
Other income | ||||||||
Change in fair value of digital assets - receivable, net | 463,478 | 108,859 | 66,110 | 339,339 | ||||
Net gain from extinguishment of debt | — | 1,029 | 70,557 | 1,029 | ||||
Interest income | 9,268 | 17,689 | 30,063 | 39,315 | ||||
Interest expense | (13,472) | (12,760) | (30,456) | (35,536) | ||||
Equity in net earnings of unconsolidated affiliate | (2,822) | (1,711) | (7,849) | (2,626) | ||||
Other | (1,931) | 115 | 4,596 | (2,920) | ||||
Total other income | 454,521 | 113,221 | 133,021 | 338,601 | ||||
Income (loss) before income taxes | 631,066 | 160,812 | (1,273,000) | 524,906 | ||||
Income tax benefit (expense) | 1,005 | (37,678) | 31,357 | (127,010) | ||||
Net income (loss) | $632,071 | $123,134 | $(1,241,643) | $397,896 | ||||
Less: net (income) loss attributable to noncontrolling interest, including redeemable noncontrolling interest | 2,286 | (6) | 6,696 | 268 | ||||
Net income (loss) attributable to common stockholders | $634,357 | $123,128 | $(1,234,947) | $398,164 | ||||
Net income (loss) per share of common stock - basic | $1.64 | $0.33 | $(3.23) | $1.13 | ||||
Weighted average shares of common stock - basic | 385,698,449 | 372,073,173 | 382,494,083 | 352,315,857 | ||||
Net income (loss) per share of common stock - diluted | $1.28 | $0.27 | $(3.23) | $0.90 | ||||
Weighted average shares of common stock - diluted | 496,385,479 | 470,126,290 | 382,494,083 | 450,081,096 | ||||
SHAREHOLDER LETTER Q3 2026 17
Three Months Ended September 30, | Nine Months Ended September 30, | |||||||
(in thousands) | 2026 | 2025 | 2026 | 2025 | ||||
Reconciliation to Adjusted EBITDA: | ||||||||
Net income (loss) attributable to common stockholders | $634,357 | $123,128 | $(1,234,947) | $398,164 | ||||
Net income (loss) attributable to noncontrolling interests | (2,286) | 6 | (6,696) | (268) | ||||
Net income (loss) | 632,071 | 123,134 | (1,241,643) | 397,896 | ||||
Interest expense (income), net | 4,204 | (4,929) | 393 | (3,779) | ||||
Income tax expense (benefit) | (1,005) | 37,678 | (31,357) | 127,010 | ||||
Depreciation and amortization | 154,068 | 170,521 | 526,759 | 496,437 | ||||
EBITDA | 789,338 | 326,404 | (745,848) | 1,017,564 | ||||
Stock-based compensation expense | 28,446 | 38,466 | 105,635 | 142,237 | ||||
Change in fair value of derivative instrument | 18,952 | 4,422 | 61,766 | (42,717) | ||||
Impairment of goodwill and other assets | — | — | — | 26,253 | ||||
Restructuring costs | 18,979 | 20,905 | 66,617 | 20,905 | ||||
Acquisition and integration costs | 1,944 | 1,475 | 28,407 | 1,475 | ||||
Litigation settlement | — | — | 10,200 | — | ||||
Net gain from extinguishment of debt | — | (1,029) | (70,557) | (1,029) | ||||
Net gain on investments | — | — | — | (12,429) | ||||
Early termination expenses | — | 5,000 | — | 5,000 | ||||
Adjusted EBITDA (1) | $857,659 | $395,643 | $(543,780) | $1,157,259 | ||||
SHAREHOLDER LETTER Q3 2026 18
(1) Non-GAAP Financial Measures. In order to provide a more
comprehensive understanding of the information used by our
management team in financial and operational decision-making, we
supplement our Condensed Consolidated Financial Statements that
have been prepared in accordance with generally accepted
accounting principles in the United States ("GAAP") with the non-
GAAP financial measure of Adjusted EBITDA.
The Company defines Adjusted EBITDA as GAAP net income (loss)
plus adjustments to add back the impacts of (1) interest, (2) income
taxes, (3) depreciation and amortization and (4) adjustments for non-
cash and/or non-recurring items, which currently include (i) stock-
based compensation expense, (ii) change in fair value of derivative
instrument, (iii) impairment of goodwill and other assets, (iv)
restructuring costs, (v) acquisition and integration costs, (vi) litigation
settlement, (vii) net gain from extinguishment of debt, (viii) net gain on
investments, and (ix) early termination expenses.
Management uses Adjusted EBITDA, together with the supplemental
information provided herein, to understand, manage and evaluate
business performance and to inform operating decision-making. The
Company relies primarily on its Condensed Consolidated Financial
Statements to evaluate financial performance and uses non-GAAP
financial measures only supplementally.
We believe that Adjusted EBITDA is useful to us and to our investors
because it excludes certain financial, capital structure and/or non-cash
items that we do not believe directly reflect our core operations or may
not be indicative of our recurring operations. These items may vary
significantly over time and across companies within our industry
independent of core operating performance. We believe that excluding
these items allows for more meaningful period-over-period
comparisons and improved comparability relative to other companies.
Adjusted EBITDA is not a recognized financial measure under GAAP.
Investors should consider Adjusted EBITDA in addition to, but not as a
substitute for, the most directly comparable financial results calculated
and presented in accordance with GAAP. Because our calculation of
Adjusted EBITDA may differ from that of other companies, our
presentation of Adjusted EBITDA may not be comparable to similarly
titled measures of other companies.
SHAREHOLDER LETTER Q3 2026 19
Investor Notice
Investing in our securities involves a high degree of risk. Before making an investment decision, you should carefully
consider the risks, uncertainties and forward-looking statements described under the heading "Risk Factors" in our most
recent annual report on Form 10-K and any other periodic reports that we may file with the U.S. Securities and Exchange
Commission (the "SEC"). If any of these risks were to occur, our business, financial condition or results of operations would
likely suffer. In that event, the value of our securities could decline, and you could lose part or all of your investment. The
risks and uncertainties we describe are not the only ones facing us. Additional risks not presently known to us or that we
currently deem immaterial may also impair our business operations. In addition, our past financial performance may not be
a reliable indicator of future performance, and historical trends should not be used to anticipate results in the future. See
"Forward-Looking Statements" below.
Forward-Looking Statements |
This shareholder letter contains forward-looking statements within the meaning of the federal securities laws. All
statements, other than statements of historical fact, included in this shareholder letter are forward-looking statements.
The words "may," "will," "could," "anticipate," "expect," "intend," "believe," "continue," "target" and similar expressions or
variations or negatives of these words are intended to identify forward-looking statements, although not all forward-
looking statements contain these identifying words. Such forward-looking statements include, among other things,
statements relating to our strategic joint venture with Starwood, including the structure, timing and expected benefits of
the partnership; plans to develop, finance and operate digital infrastructure projects, including at our Kearney and
Hannibal sites; our ability to fund, scale and allocate capital to joint venture projects; our target of signing leases with
tenants by year-end; the expected closing, timing, financing and benefits of our acquisition of Long Ridge, including its
expected generation capacity, contracted output and contribution to Adjusted EBITDA; the development of the site in
Matagorda County, Texas, including the outcome and timing of ERCOT’s Batch Zero interconnection study process and
the verification and audit directed by the Governor of Texas, the amount and timing of any power allocated to the site and
the milestone payments under our purchase agreement with HIF; the expected growth of our power portfolio; expected
demand from enterprise, hyperscale and AI customers, including Exaion’s customer pipeline; expansion into artificial
intelligence, inference and high-performance compute; anticipated benefits of our investment in Exaion, including its
GPU-as-a-service business; the deployment and expected benefits of Vertebrai; our share repurchase program, including
the timing and amount of any repurchases; our bitcoin strategy, including holdings, sales, lending and borrowing and the
use of proceeds; our ability to satisfy holder put rights under our convertible notes; our capital allocation priorities and
liquidity; and potential domestic and international expansion opportunities. Such forward-looking statements are based on
management's current expectations about future events as of the date hereof and involve many risks and uncertainties
that could cause our actual results to differ materially from those expressed or implied in our forward-looking statements.
Subsequent events and developments, including actual results or changes in our assumptions, may cause our views to
change. We do not undertake to update our forward-looking statements except to the extent required by applicable law.
Readers are cautioned not to place undue reliance on such forward-looking statements. All forward-looking statements
included herein are expressly qualified in their entirety by these cautionary statements. Our actual results and outcomes
could differ materially from those included in these forward-looking statements as a result of various factors, including, but
not limited to, the factors set forth under the heading "Risk Factors" in our most recent annual report on Form 10-K and any
other periodic reports that we may file with the SEC.