
Exhibit 99.2
Management’s Discussion and Analysis (“MD&A”)
Quarterly Report on the Third Quarter of 2026
This portion of the Quarterly Report provides management’s discussion and analysis (“MD&A”) of the financial condition and results of operations, to enable a reader to assess material changes in financial condition and results of operations as at, and for the three and nine month period ended September 30, 2026, in comparison to the corresponding prior-year periods. The MD&A is intended to help the reader understand Barrick Mining Corporation (“Barrick”, “we”, “our”, the “Company” or the “Group”), our operations, financial performance as well as our present and future business environment. This MD&A, which has been prepared as of November 6, 2026, is intended to supplement and complement the condensed unaudited interim consolidated financial statements and notes thereto, prepared in accordance with IFRS Accounting Standards as issued by the International Accounting Standards Board applicable to the preparation of interim financial statements, under International Accounting Standard 34, Interim Financial Reporting, for the three and nine month period ended September 30, 2026 (collectively, the “Financial Statements”), which are included in this Quarterly Report on pages 60 to 64. You are encouraged to review the Financial Statements in conjunction with your review of this MD&A. This MD&A should be read in conjunction with both the
annual audited consolidated financial statements for the two years ended December 31, 2025, the related annual MD&A included in the 2025 Annual Report, and the most recent Form 40–F/Annual Information Form on file with the U.S. Securities and Exchange Commission (“SEC”) and Canadian provincial securities regulatory authorities. These documents and additional information relating to the Company are available on SEDAR+ at www.sedarplus.ca and EDGAR at www.sec.gov. Certain notes to the Financial Statements are specifically referred to in this MD&A and such notes are incorporated by reference herein. All dollar amounts in this MD&A are in millions of United States dollars (“$” or “US$”), unless otherwise specified.
For the purposes of preparing our MD&A, we consider the materiality of information. Information is considered material if: (i) such information results in, or would reasonably be expected to result in, a significant change in the market price or value of our shares; (ii) there is a substantial likelihood that a reasonable investor would consider it important in making an investment decision; or (iii) it would significantly alter the total mix of information available to investors. We evaluate materiality with reference to all relevant circumstances, including potential market sensitivity.
Abbreviations
| AISC |
All-in Sustaining Costs | |
| CCV |
Critical Control Verifications | |
| CEO |
Chief Executive Officer | |
| COS |
Cost of Sales | |
| DRC |
Democratic Republic of Congo | |
| EPCM |
Engineering, Procurement, and Construction Management | |
| GHG |
Greenhouse Gas | |
| GoT |
Government of Tanzania | |
| IASB |
International Accounting Standards Board | |
| IFRS |
IFRS Accounting Standards as issued by the International Accounting Standards Board | |
| Ktpa |
Thousand tonnes per annum | |
| Lb |
Pound | |
| LME |
London Metal Exchange | |
| LTI |
Lost Time Injury | |
| LTIFR |
Lost Time Injury Frequency Rate | |
| Mtpa |
Million tonnes per annum |
| MW |
Megawatt | |
| Newmont |
Newmont Corporation | |
| NGM |
Nevada Gold Mines | |
| OECD |
Organisation for Economic Co-operation and Development | |
| Oz |
Ounce | |
| PFS |
Pre-Feasibility Study | |
| Randgold |
Randgold Resources Limited | |
| SMPP |
Structural, Mechanical, Platework and Piping | |
| STATCOM |
Static Synchronous Compensator | |
| TCC |
Total Cash Costs | |
| TRIFR |
Total Recordable Injury Frequency Rate | |
| TSF |
Tailings Storage Facilities | |
| TWMS |
Temporary Water Management Structures | |
| VAT |
Value-Added Tax | |
| WGC |
World Gold Council | |
| WTI |
West Texas Intermediate | |
| YTD |
Year to date September 30 |
| BARRICK THIRD QUARTER 2026 | 1 | MANAGEMENT’S DISCUSSION AND ANALYSIS |
Cautionary Statement on Forward-Looking Information
Certain information contained or incorporated by reference in this MD&A, including any information as to our strategy, projects, plans or future financial or operating performance, constitutes “forward-looking statements”. All statements, other than statements of historical fact, are forward-looking statements. The words “believe”, “expect”, “anticipated”, “aim”, “strategy”, “ramp up”, “target”, “plan”, “opportunities”, “guidance”, “forecast”, “outlook”, “project”, “intend”, “develop”, “progress”, “continue”, “temporary”, “estimate”, “potential”, “future”, “focus”, “ongoing”, “following”, “subject to”, “on track”, “scheduled”, “may”, “will”, “can”, “could”, “would”, “should” and similar expressions identify forward-looking statements. In particular, this MD&A contains forward-looking statements including, without limitation, with respect to: Barrick’s forward-looking production and cost guidance, including our ability to meet our 2026 guidance and changes to expected production and cost metrics; anticipated production growth from Barrick’s organic project pipeline and reserve replacement; estimates of future cost of sales per ounce for gold and per pound for copper, total cash costs per ounce and C1 cash costs per pound, and all-in sustaining costs per ounce/pound; cash flow forecasts; projected capital, operating and exploration expenditures; the share buyback program and dividend policy; mine life and production rates; our plans, timelines, and expected completion and benefits of our growth projects, including the Goldrush Project, Fourmile, Ren, Pueblo Viejo plant expansion and mine life extension project, the Nevada Gold Mines Autonomous Haulage Program, Barrick’s Andean portfolio, Veladero Phase 8 Leach Pad, Reko Diq, the Lumwana Super Pit Expansion and the Zaldívar Water Project; anticipated production at Goldrush, Ren, and Lumwana; timing for first production and 2026 and 2027 estimated spend profile on the Lumwana Super Pit Expansion project; Barrick’s decision to slow development activity and reduce capital expenditures at Reko Diq; the ongoing project review of Reko Diq; the development and operation of the Reko Diq project, including project scope, anticipated costs, and timeline for construction and first production; potential significant increases to previously disclosed total estimated capital budget and timeline for the Reko Diq project; capital expenditures related to upgrades and ongoing management initiatives; Barrick’s global exploration strategy and planned exploration activities; Barrick’s copper strategy; the continued ramp up of operations at Loulo-Gounkoto following the resolution of disputes with the Government of Mali, including adoption of the 2023 Mining Code; our pipeline of high confidence projects at or near existing operations; the potential for existing assets to attain Tier One status, including Fourmile; potential mineralization and metal or mineral recoveries; Barrick’s intention to pursue and the expected timing for an initial public offering (“IPO”) of Barrick’s North American gold assets; our ability to convert resources into reserves and future reserve replacement; asset sales, joint ventures and partnerships; Barrick’s strategy, plans, targets and goals in respect of sustainability issues, including climate change, greenhouse gas (“GHG”) emissions reduction targets, safety performance, community development and resettlement, and responsible water use; and expectations regarding future price assumptions, financial performance and other outlook or guidance.
Forward-looking statements are necessarily based upon a number of estimates and assumptions including material estimates and assumptions related to the factors set forth below that, while considered reasonable by the
Company as at the date of this MD&A in light of management’s experience and perception of current conditions and expected developments, are inherently subject to significant business, economic and competitive uncertainties and contingencies. Known and unknown factors could cause actual results to differ materially from those projected in the forward-looking statements and undue reliance should not be placed on such statements and information. Such factors include, but are not limited to: fluctuations in the spot and forward price of gold, copper or certain other commodities (such as silver, diesel fuel, natural gas and electricity); risks associated with projects in the early stages of evaluation and for which additional engineering and other analysis is required; risks related to the possibility that future exploration results will not be consistent with the Company’s expectations, that quantities or grades of reserves will be diminished, and that resources may not be converted to reserves; risks associated with the fact that certain of the initiatives described in this MD&A are still in the early stages and may not materialize; changes in mineral production performance, exploitation and exploration successes; risks that exploration data may be incomplete and considerable additional work may be required to complete further evaluation, including but not limited to drilling, engineering and socioeconomic studies and investment; the speculative nature of mineral exploration and development; lack of certainty with respect to foreign legal systems, corruption and other factors that are inconsistent with the rule of law; changes in national and local government legislation, taxation, controls or regulations and/or changes in the administration of laws, policies and practices, including the expropriation or nationalization of property and political or economic developments in Canada, the United States, or other countries in which Barrick does or may carry on business in the future; risks relating to the proposed IPO of an entity that will hold Barrick’s North American assets; risks relating to political instability in certain of the jurisdictions in which Barrick operates; timing of receipt of, or failure to comply with, necessary permits and approvals; non-renewal of key licenses by governmental authorities; failure to comply with environmental and health and safety laws and regulations; increased costs and physical and transition risks related to climate change, including extreme weather events, resource shortages, emerging policies and increased regulations related to GHG emission levels, energy efficiency and reporting of risks; the Company’s ability to achieve its sustainability goals, including its climate-related goals and GHG emissions reduction targets, in particular its ability to achieve its Scope 3 emissions targets which require reliance on entities within Barrick’s value chain, but outside of the Company’s direct control, to achieve such targets within the specified time frames; contests over title to properties, particularly title to undeveloped properties, or over access to water, power and other required infrastructure; the liability associated with risks and hazards in the mining industry, and the ability to maintain insurance to cover such losses; damage to the Company’s reputation due to the actual or perceived occurrence of any number of events, including negative publicity with respect to the Company’s handling of environmental matters or dealings with community groups, whether true or not; risks related to operations near communities that may regard Barrick’s operations as being detrimental to them; litigation and legal and administrative proceedings; operating or technical difficulties in connection with mining or development activities, including geotechnical challenges, tailings dam
| BARRICK THIRD QUARTER 2026 | 2 | MANAGEMENT’S DISCUSSION AND ANALYSIS |
and storage facilities failures, and disruptions in the maintenance or provision of required infrastructure and information technology systems; increased costs, delays, suspensions and technical challenges associated with the construction of capital projects; risks associated with working with partners in jointly controlled assets; risks related to disruption of supply routes which may cause delays in construction and mining activities, including disruptions in the supply of key mining inputs due to the invasion of Ukraine by Russia and conflicts in the Middle East; risk of loss due to acts of war, terrorism, sabotage and civil disturbances; risks associated with artisanal and illegal mining; risks associated with Barrick’s infrastructure, information technology systems and the implementation of Barrick’s technological initiatives, including risks related to cybersecurity incidents, including those caused by computer viruses, malware, ransomware and other cyberattacks, or similar information technology system failures, delays and/or disruptions; the impact of global liquidity and credit availability on the timing of cash flows and the values of assets and liabilities based on projected future cash flows; the impact of inflation, including global inflationary pressures driven by ongoing global supply chain disruptions, global energy cost increases following the invasion of Ukraine by Russia and country-specific political and economic factors in Argentina and uncertainty related to Venezuela; adverse changes in our credit ratings; fluctuations in the currency markets; changes in U.S. dollar interest rates; changes in U.S. trade, tariff and other controls on imports and exports, tax, immigration or other policies that may impact relations with foreign countries, result in retaliatory policies, lead to increased costs for raw materials and components, or impact Barrick’s existing operations and material growth projects; risks arising from holding derivative instruments (such as credit risk, market liquidity risk and mark-to-market risk); risks related to the demands placed on the Company’s management, the ability of management to implement its business strategy and enhanced political risk in certain jurisdictions; uncertainty whether some or all of Barrick’s targeted investments and projects will meet the Company’s capital allocation objectives and internal hurdle rate; whether benefits expected from recent transactions are realized; business opportunities that may be presented to, or pursued by, the Company; our ability to successfully integrate acquisitions or complete divestitures; risks related to competition in the mining industry; employee relations including loss of key employees; availability and increased costs associated with mining inputs and labor; risks associated with diseases, epidemics and pandemics; risks related to the failure of internal controls; and risks related to the impairment of the Company’s goodwill and assets. In addition, there are risks and hazards associated with the business of mineral exploration, development and mining, including environmental hazards, industrial accidents, unusual or unexpected formations, pressures, cave-ins, flooding and gold bullion, copper cathode or gold or copper concentrate losses (and the risk of inadequate insurance, or inability to obtain insurance, to cover these risks).
Many of these uncertainties and contingencies can affect our actual results and could cause actual results to differ materially from those expressed or implied in any forward-looking statements made by, or on behalf of, us. Readers are cautioned that forward-looking statements are not guarantees of future performance. All of the forward-looking statements made in this MD&A are qualified by these cautionary statements. Specific reference is made to the most recent Form 40-F/Annual Information Form on file with the SEC and Canadian provincial securities regulatory
authorities for a more detailed discussion of some of the factors underlying forward-looking statements and the risks that may affect Barrick’s ability to achieve the expectations set forth in the forward-looking statements contained in this MD&A. We disclaim any intention or obligation to update or revise any forward-looking statements whether as a result of new information, future events or otherwise, except as required by applicable law.
| BARRICK THIRD QUARTER 2026 | 3 | MANAGEMENT’S DISCUSSION AND ANALYSIS |
Use of Non-GAAP Financial Measures
We use the following non-GAAP financial measures and ratios in our MD&A:
| ∎ | “adjusted net earnings” |
| ∎ | “free cash flow” |
| ∎ | “attributable free cash flow” |
| ∎ | “attributable operating cash flow” |
| ∎ | “EBITDA” |
| ∎ | “adjusted EBITDA” |
| ∎ | “attributable adjusted EBITDA” |
| ∎ | “attributable adjusted EBITDA margin” |
| ∎ | “net leverage” |
| ∎ | “minesite sustaining capital expenditures” |
| ∎ | “project capital expenditures” |
| ∎ | “TCC/oz” |
| ∎ | “C1 cash costs/lb” |
| ∎ | “AISC per oz/lb” and |
| ∎ | “realized price per oz/lb” |
For a detailed description of each of the non-GAAP financial measures used in this MD&A and a detailed reconciliation to the most directly comparable measure under IFRS, please refer to the Non-GAAP Financial Measures section of this MD&A on pages 44 to 56. Each non-GAAP financial measure has been annotated with a reference to an endnote on page 57. The non-GAAP financial measures set out in this MD&A are intended to provide additional information to investors and do not have any standardized meaning under IFRS, and therefore may not be comparable to other issuers, and should not be considered in isolation or as a substitute for measures of performance prepared in accordance with IFRS.
Changes in Presentation of Non-GAAP Financial Measures
Attributable Adjusted EBITDA and Attributable Adjusted EBITDA Margin
Starting with our Q2 2026 MD&A, we have renamed attributable EBITDA and attributable EBITDA margin to attributable adjusted EBITDA and attributable adjusted EBITDA margin, respectively. There is no change in the way these measures are calculated.
Attributable Operating Cash Flow
Starting with our Q1 2026 MD&A, we are presenting attributable operating cash flow. Attributable operating cash flow starts with cash provided by operating activities and adds our attributable share of cash provided by operating activities from our equity investees and subtracts the cash provided by operating activities attributable to the non-controlling interests. Management believes this to be a useful indicator of the amount of cash provided by operating activities to Barrick’s ownership share.
Index
|
5 Overview |
|
5 Financial and Operating Highlights |
|
7 Key Business Developments |
|
8 Sustainability |
|
9 Outlook |
|
11 Operating Performance |
|
11 Nevada Gold Mines |
|
12 Carlin |
|
14 Cortez |
|
16 Turquoise Ridge |
|
18 Pueblo Viejo |
|
20 Loulo-Gounkoto |
|
21 Kibali |
|
23 North Mara |
|
25 Bulyanhulu |
|
26 Other Mines - Gold |
|
27 Lumwana |
|
29 Other Mines - Copper |
|
30 Future Growth |
|
34 Review of Financial Results |
|
34 Revenue |
|
35 Production Costs |
|
36 General and Administrative Expenses |
|
36 Exploration, Evaluation and Project Expenses |
|
37 Finance Costs, Net |
|
37 Additional Statement of Income Items |
|
37 Income Tax Expense |
|
38 Net Earnings and Adjusted Net Earnings1 |
|
39 Financial Condition Review |
|
39 Balance Sheet Review |
|
39 Financial Position and Liquidity |
|
40 Summary of Cash Inflow (Outflow) |
|
42 Commitments and Contingencies |
|
43 Review of Quarterly Results |
|
43 Internal Control over Financial Reporting and Disclosure Controls and Procedures |
|
44 IFRS Critical Accounting Policies and Accounting Estimates |
|
44 Non-GAAP Financial Measures |
|
57 Technical Information |
|
57 Endnotes |
|
59 Financial Statements |
|
64 Notes to Consolidated Financial Statements |
| BARRICK THIRD QUARTER 2026 | 4 | MANAGEMENT’S DISCUSSION AND ANALYSIS |
| OVERVIEW | OPERATING PERFORMANCE
|
FUTURE GROWTH
|
REVIEW OF FINANCIAL RESULTS
|
OTHER INFORMATION & NON-GAAP RECONCILIATIONS |
FINANCIAL STATEMENTS | |||||
Overview
Financial and Operating Highlights
| For the three months ended | For the nine months ended | |||||||||||||||||||||||||||||||
| 9/30/26 | 6/30/26 | % Change | 9/30/25 | % Change | 9/30/26 | 9/30/25 | % Change | |||||||||||||||||||||||||
| Financial Results ($ millions) |
||||||||||||||||||||||||||||||||
| Revenues |
5,073 | 5,292 | (4)% | 4,148 | 22 % | 15,583 | 10,959 | 42 % | ||||||||||||||||||||||||
| Cost of sales |
2,361 | 2,395 | (1)% | 1,890 | 25 % | 6,855 | 5,553 | 23 % | ||||||||||||||||||||||||
| Net earningsa |
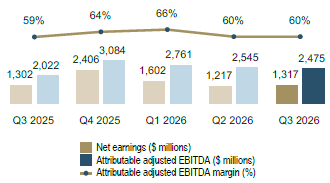
1,317 | 1,217 | 8 % | 1,302 | 1 % | 4,136 | 2,587 | 60 % | ||||||||||||||||||||||||
| Adjusted net earningsb |
1,347 | 1,363 | (1)% | 982 | 37 % | 4,358 | 2,385 | 83 % | ||||||||||||||||||||||||
| Attributable adjusted EBITDAb |
2,475 | 2,545 | (3)% | 2,022 | 22 % | 7,781 | 5,073 | 53 % | ||||||||||||||||||||||||
| Attributable adjusted EBITDA marginb |
60 % | 60 % | 0 % | 59 % | 2 % | 62 % | 56 % | 11 % | ||||||||||||||||||||||||
| Minesite sustaining capital expendituresb,c |
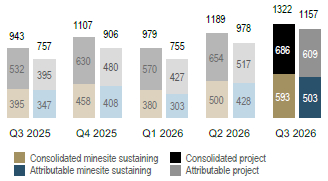
593 | 500 | 19 % | 395 | 50 % | 1,473 | 1,438 | 2 % | ||||||||||||||||||||||||
| Project capital expendituresb,c |
686 | 654 | 5 % | 532 | 29 % | 1,910 | 1,240 | 54 % | ||||||||||||||||||||||||
| Total consolidated capital expendituresc,d |
1,322 | 1,189 | 11 % | 943 | 40 % | 3,490 | 2,714 | 29 % | ||||||||||||||||||||||||
| Total attributable capital expenditurese |
1,157 | 978 | 18 % | 757 | 53 % | 2,890 | 2,105 | 37 % | ||||||||||||||||||||||||
| Net cash provided by operating activities |
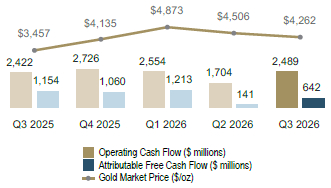
2,489 | 1,704 | 46 % | 2,422 | 3 % | 6,747 | 4,963 | 36 % | ||||||||||||||||||||||||
| Net cash provided by operating activities marginf |
49 % | 32 % | 53 % | 58 % | (16)% | 43 % | 45 % | (4)% | ||||||||||||||||||||||||
| Attributable operating cash flowb |
1,799 | 1,119 | 61 % | 1,911 | (6)% | 4,886 | 3,882 | 26 % | ||||||||||||||||||||||||
| Free cash flowb |
1,167 | 515 | 127 % | 1,479 | (21)% | 3,257 | 2,249 | 45 % | ||||||||||||||||||||||||
| Attributable free cash flowb |
642 | 141 | 355 % | 1,154 | (44)% | 1,996 | 1,777 | 12 % | ||||||||||||||||||||||||
| Net earnings per share (basic and diluted) |
0.80 | 0.73 | 10 % | 0.76 | 5 % | 2.49 | 1.51 | 65 % | ||||||||||||||||||||||||
| Adjusted net earnings (basic)b per share |
0.82 | 0.82 | 0 % | 0.58 | 41 % | 2.62 | 1.39 | 88 % | ||||||||||||||||||||||||
| Weighted average diluted common shares (millions of shares) |
1,641 | 1,666 | (2)% | 1,703 | (4)% | 1,661 | 1,715 | (3)% | ||||||||||||||||||||||||
| Operating Results |
||||||||||||||||||||||||||||||||
| Gold productiong (thousands of ounces) |
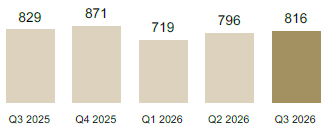
816 | 796 | 3 % | 829 | (2)% | 2,331 | 2,384 | (2)% | ||||||||||||||||||||||||
| Gold soldg (thousands of ounces) |
810 | 801 | 1 % | 837 | (3)% | 2,359 | 2,358 | 0 % | ||||||||||||||||||||||||
| Market gold price ($/oz) |
4,262 | 4,506 | (5)% | 3,457 | 23 % | 4,545 | 3,201 | 42 % | ||||||||||||||||||||||||
| Realized gold priceb,g ($/oz) |
4,243 | 4,417 | (4)% | 3,457 | 23 % | 4,486 | 3,226 | 39 % | ||||||||||||||||||||||||
| Gold COSg,h ($/oz) |
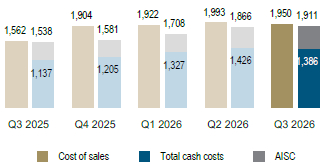
1,950 | 1,993 | (2)% | 1,562 | 25 % | 1,956 | 1,613 | 21 % | ||||||||||||||||||||||||
| Gold TCCb,g ($/oz) |
1,386 | 1,426 | (3)% | 1,137 | 22 % | 1,381 | 1,197 | 15 % | ||||||||||||||||||||||||
| Gold AISCb,g ($/oz) |
1,911 | 1,866 | 2 % | 1,538 | 24 % | 1,831 | 1,660 | 10 % | ||||||||||||||||||||||||
| Copper production (thousands of tonnes)g |
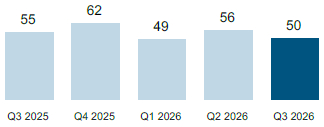
50 | 56 | (11)% | 55 | (9)% | 155 | 158 | (2)% | ||||||||||||||||||||||||
| Copper sold (thousands of tonnes)g |
49 | 54 | (9)% | 52 | (6)% | 148 | 157 | (6)% | ||||||||||||||||||||||||
| Market copper price ($/lb) |
6.40 | 6.05 | 6 % | 4.44 | 44 % | 6.09 | 4.33 | 41 % | ||||||||||||||||||||||||
| Realized copper priceb,g ($/lb) |
6.54 | 6.15 | 6 % | 4.39 | 49 % | 6.17 | 4.42 | 40 % | ||||||||||||||||||||||||
| Copper COS (Barrick’s share)g,i ($/lb) |
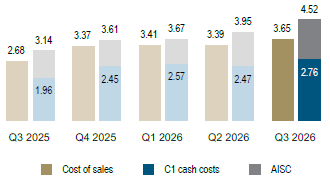
3.65 | 3.39 | 8 % | 2.68 | 36 % | 3.48 | 2.72 | 28 % | ||||||||||||||||||||||||
| Copper C1 cash costsb,g ($/lb) |
2.76 | 2.47 | 12 % | 1.96 | 41 % | 2.60 | 2.00 | 30 % | ||||||||||||||||||||||||
| Copper AISCb,g ($/lb) |
4.52 | 3.95 | 14 % | 3.14 | 44 % | 4.05 | 3.03 | 34 % | ||||||||||||||||||||||||
| |
As at 9/30/26 |
|
|
As at 6/30/26 |
|
% Change | |
As at 9/30/25 |
|
% Change | ||||||||||||||||||||||
| Financial Position ($ millions) |
||||||||||||||||||||||||||||||||
| Debt (current and long-term) |
4,680 | 4,682 | 0 % | 4,714 | (1)% | |||||||||||||||||||||||||||
| Cash and equivalents |
5,589 | 5,927 | (6)% | 5,037 | 11 % | |||||||||||||||||||||||||||
| Debt, net of cash |
(909) | (1,245) | (27)% | (323) | 181 % | |||||||||||||||||||||||||||
| a. | Net earnings represents net earnings attributable to the equity holders of the Company. |
| b. | Further information on these non-GAAP financial measures, including detailed reconciliations, is included on pages 44 to 56 of this MD&A. |
| c. | Amounts presented on a consolidated cash basis. Project capital expenditures are not included in our calculation of AISC. |
| d. | Total consolidated capital expenditures also includes capitalized interest of $43 million and $107 million for Q3 2026 and YTD 2026 (Q2 2026: $35 million; Q3 2025: $16 million, YTD 2025: $36 million). |
| e. | These amounts are presented on the same basis as our guidance. |
| f. | Represents net cash provided by operating activities divided by revenue. |
| g. | On an attributable basis. |
| h. | Gold COS/oz is calculated as cost of sales across our gold operations (excluding sites in closure or care and maintenance) divided by ounces sold (both on an attributable basis using Barrick’s ownership share). |
| i. | Copper COS/lb is calculated as cost of sales across our copper operations divided by pounds sold (both on an attributable basis using Barrick’s ownership share). |
| BARRICK THIRD QUARTER 2026 | 5 | MANAGEMENT’S DISCUSSION AND ANALYSIS |
| OVERVIEW | OPERATING PERFORMANCE
|
FUTURE GROWTH
|
REVIEW OF FINANCIAL RESULTS
|
OTHER INFORMATION & NON-GAAP RECONCILIATIONS |
FINANCIAL STATEMENTS | |||||
GOLD PRODUCTIONa (thousands of ounces)
COPPER PRODUCTIONa (thousands of tonnes)
GOLD COST OF SALESb, TOTAL CASH COSTSc, AND ALL-IN SUSTAINING COSTSc ($ per ounce)
COPPER COST OF SALESb, C1 CASH COSTSc, AND ALL-IN SUSTAINING COSTSc ($ per pound)
NET EARNINGS, ATTRIBUTABLE ADJUSTED EBITDAc,
AND ATTRIBUTABLE ADJUSTED EBITDA MARGINc
CAPITAL EXPENDITURESc,d
($ millions)
OPERATING CASH FLOW AND ATTRIBUTABLE FREE CASH FLOWc
RETURNS TO SHAREHOLDERSe ($ millions)
| a. | On an attributable basis. |
| b. | Gold COS/oz is calculated as cost of sales across our gold operations (excluding sites in closure or care and maintenance) divided by ounces sold (both on an attributable basis using Barrick’s ownership share). Copper COS/lb is calculated as cost of sales across our copper operations divided by pounds sold (both on an attributable basis using Barrick’s ownership share). Refer to endnote 2 for further details. |
| c. | Further information on these non-GAAP financial measures, including detailed reconciliations, is included on pages 44 to 56 of this MD&A. |
| d. | Capital expenditures also includes capitalized interest. |
| e. | Dividends declared are inclusive of the performance dividend. |
| BARRICK THIRD QUARTER 2026 | 6 | MANAGEMENT’S DISCUSSION AND ANALYSIS |
| OVERVIEW | OPERATING PERFORMANCE
|
FUTURE GROWTH
|
REVIEW OF FINANCIAL RESULTS
|
OTHER INFORMATION & NON-GAAP RECONCILIATIONS |
FINANCIAL STATEMENTS | |||||
Key Business Developments
Nevada Gold Mines
On August 10, 2026, Barrick entered into an agreement with Newmont to expand the assets in the Nevada Gold Mines Joint Venture by agreeing to vend-in their excluded properties: Fourmile from Barrick; Mike and Fiberline from Newmont. Newmont will pay Barrick a top-up payment of $1.95 billion in cash. The agreement resolves all outstanding disputes related to NGM and includes revisions to the NGM joint venture agreement. The agreement also secures Newmont’s consent to Barrick’s proposed North American IPO of its North American gold assets. The members’ interests in NGM will remain unchanged at 61.5% for Barrick and 38.5% for Newmont. We expect the contributions to occur in Q4 2026.
North American Barrick IPO
In April 2026, Barrick announced several executive appointments, dedicated exclusively to our North American gold assets. These assets are comprised of four Tier One Gold Assets5 located in premier mining jurisdictions in North America: Carlin, Cortez, and Turquoise Ridge in the NGM complex, and the Pueblo Viejo mine in the Dominican Republic. North American Barrick will also include the Fourmile, Mike and Fiberline gold projects, located adjacent to NGM, which are expected to be contributed to NGM in Q4 2026, as discussed above.
North American Barrick is expected to be listed on the New York Stock Exchange, subject to satisfaction of customary listing conditions and SEC registration processes. Mark Hill will be the CEO of North American Barrick. Barrick plans to file a S-1 registration statement with respect to the IPO in November, and expects to complete the IPO in the fourth quarter of 2026 or early 2027, subject to market and other conditions and necessary approvals.
New Share Buyback Program
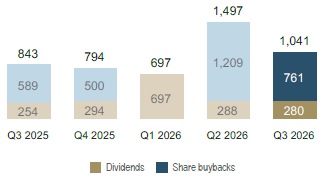
At the May 8, 2026 meeting, the Board of Directors authorized a new share buyback program for the purchase of up to $3 billion of Barrick’s outstanding common shares over the next 12 months. Barrick repurchased $761 million of shares in Q3 2026, following repurchases of $1.209 billion in Q2 2026, bringing the YTD 2026 to $1.970 billion purchased under this share buyback program.
The actual number of common shares that may be purchased, and the timing of any such purchases, will be determined by Barrick based on a number of factors, including the Company’s financial performance, the availability of cash flows, and the consideration of other uses of cash, including capital investment opportunities, returns to shareholders, and debt reduction.
The repurchase program does not obligate the Company to acquire any particular number of common shares, and the repurchase program may be suspended or discontinued at any time at the Company’s discretion.
Executive Leadership Changes
On February 4, 2026, Mark Hill was appointed as President and Chief Executive Officer, following his appointment as Group Chief Operating Officer and Interim President and Chief Executive Officer on September 29, 2025.
Mr. Hill, who was previously responsible for Barrick’s LATAM & Asia Pacific region, is a seasoned mining executive with 30 years of experience. He joined Barrick in 2006 and has experience in strategy, corporate development and leading major projects across the world,
and was also integral in the initial decision to undertake exploration at the Fourmile gold project in Nevada.
On August 11, 2026, Sebastian Bock was appointed as Chief Executive Officer, Rest of World, reporting to Mark Hill. This portfolio combines Barrick’s AME and South America & Asia Pacific regions, and will now be referred to as Barrick International. He joined Barrick in January 2019 as SVP and CFO, Africa and Middle East, and was appointed COO for the region in July 2022.
On March 1, 2026, Helen Cai was appointed as Senior Executive Vice President and Chief Financial Officer, following the departure of Graham Shuttleworth. Ms. Cai has served on the Barrick Board of Directors since November 2021 and brings more than two decades of experience in equity research, corporate finance, strategic planning, capital markets, and M&A across the mining, industrial, and technology sectors, primarily with Goldman Sachs and China International Capital Corporation.
On February 24, 2026, we announced the appointments of James J. McGuire as Chief Legal and Policy Officer and Woo Lee as Chief Global Affairs Officer. Both Mr. McGuire and Mr. Lee report to Barrick’s President and Chief Executive Officer, Mark Hill, and are now members of the Executive Committee.
Mr. McGuire brings over 30 years of legal (civil and criminal) experience representing leading corporations, financial institutions, and individuals on a wide range of complex legal and policy matters. Effective June 1, 2026, Mr. McGuire became the Chief Legal, Compliance and Policy Officer, and oversees Barrick’s legal, compliance, regulatory, and public policy functions. Poupak Bahamin (most recently Barrick’s General Counsel and Chief Compliance Officer) departed Barrick on June 5, 2026.
Mr. Lee has worked at Barrick for over 11 years, most recently as Senior Vice President and Head of Government & Corporate Affairs, Asia Pacific, where he worked with government officials, business and community leaders to advance the Company’s strategic objectives. As Chief Global Affairs Officer, Mr. Lee leads Barrick’s global government affairs strategy in all markets as well as manages government and sovereign relationships.
On August 7, 2026, Barrick appointed Sarah Ball Teslik as Chief Corporate Affairs Officer and Daniel Wilner as Senior Vice President, Corporate Affairs and Capital Markets, both reporting to Mark Hill, President and Chief Executive Officer. Ms. Teslik joined Barrick from Greenspoon Marder LLP, where she was a Partner and President of its affiliate, Value(s) Management and Investing, and previously served as a Partner at Joele Frank and Senior Vice President at Apache Corporation. Mr. Wilner previously founded and led Stone Pine, a strategic advisory firm serving clients across mining and critical minerals, finance, climate technology, fintech and media, where he advised boards and senior executives on strategy, proxy communications, ESG disclosure, and institutional investor relations.
On September 14, 2026, Barrick made additional changes to the leadership structure. Grant Beringer, Group Sustainability Executive, departed Barrick on September 1, 2026. Ms. Teslik now leads ESG, Governance and Sustainability and Mr. Wilner was appointed Senior Vice President, Chief Communications Officer. Both Ms. Teslik and Mr. Wilner report to Barrick’s President and Chief
| BARRICK THIRD QUARTER 2026 | 7 | MANAGEMENT’S DISCUSSION AND ANALYSIS |
| OVERVIEW | OPERATING PERFORMANCE
|
FUTURE GROWTH
|
REVIEW OF FINANCIAL RESULTS
|
OTHER INFORMATION & NON-GAAP RECONCILIATIONS |
FINANCIAL STATEMENTS | |||||
Executive Officer, Mark Hill, and are now members of the Executive Committee.
Board of Directors Changes
At the February 4, 2026 meeting, Robert Samek was appointed to the Board of Directors and has joined the Audit & Risk and Compensation Committees. In addition, Mark Hill, President and Chief Executive Officer, has joined the Company’s Board of Directors as a Non-Independent Director.
Reko Diq
Following the preliminary findings of the review initiated in February 2026 and the further escalation of security issues in the region, on April 2, 2026, the Company announced that it considers it necessary to slow development activity and extend the project review. The continued review will allow the Company to assess in a comprehensive manner the evolving security situation, capital requirements, project financing, project scope and timeline.
Sustainability
Sustainability, including our license to operate, is entrenched in our DNA: our sustainability strategy is our business plan. Please refer to page 17 of our 2025 Annual Report and our 2025 Sustainability Report for a full description of governance, strategy, risk management and targets. Key updates for 2026 are summarized below:
Safety remains our priority. During Q3 2026, the group recorded no fatalities. The TRIFR3 improved quarter on quarter from 0.77 to 0.71, reflecting positive progress in reducing the overall rate of recordable injuries across the group. However, eight LTIs were recorded across the group during the quarter, with the majority being classified as not high potential. The LTIFR3 increased slightly quarter over quarter from 0.15 to 0.19, underscoring the need for continued focus on critical risks and the effectiveness of controls to prevent these outcomes. Prevention of fatalities and life-changing injuries requires sustained focus on critical risks and the effectiveness of critical controls.
Leadership engagement in the field remains strong, with managers and superintendents actively completing CCVs. During Q3 2026, over 24,000 CCVs were completed, with 25% identifying at-risk conditions. Importantly, 79% of these at-risk conditions were resolved in the field, demonstrating effective intervention at the point of risk and reinforcing the desired focus on eliminating hazards before they lead to serious incidents. Improvements in the quality of these activities is a focus and we are making progress in this regard.
During Q3 2026, the Group’s total Scope 1 and 2 (location-based) GHG emissions were 1,848 kt CO2. YTD absolute emissions are trending 5% lower than 2025 due to the divestments of Hemlo and Tongon, and lower emissions from the Goldstrike Roaster and TS Power Plant, partially offset by the restart of Loulo-Gounkoto.
| For the three months ended | ||||||||||||
| 9/30/2026a | 6/30/2026a | 9/30/2025 | a | |||||||||
| LTIFR3 |
0.19 | 0.15 | 0.11 | |||||||||
| TRIFR3 |
0.71 | 0.77 | 0.76 | |||||||||
| Community Development Spend ($ millions) |
8 | 10 | 17 | |||||||||
| Class 14 Environmental Incidents |
0 | 0 | 0 | |||||||||
| GHG Scope 1 and 2 emissions (kt CO2-e) (location based) |
1,848 | 1,797 | 2,001 | |||||||||
| Water Recycling and Reuse Rate |
80 % | 78 % | 81 % | |||||||||
| a. | Data presented is provisional data and is subject to change as a result of external assurance during annual reporting. |
| BARRICK THIRD QUARTER 2026 | 8 | MANAGEMENT’S DISCUSSION AND ANALYSIS |
| OVERVIEW | OPERATING PERFORMANCE
|
FUTURE GROWTH
|
REVIEW OF FINANCIAL RESULTS
|
OTHER INFORMATION & NON-GAAP RECONCILIATIONS |
FINANCIAL STATEMENTS | |||||
Full Year 2026 Outlook
We continue to expect our 2026 gold production to be in the range of 2.90 to 3.25 million ounces with Q4 2026 expected to be slightly higher than Q3 2026. Gold production for the 9 months YTD continues to be closely aligned with the plan aside from disruptions related to severe weather events at Veladero and Porgera and local grid power instability which has impacted underground performance at North Mara. Consequently, all three sites are expected to be around or below the low end of their respective production guidance ranges.
Our 2026 gold cost guidance remains unchanged noting the ranges in the table to the right are based on a gold price assumption of $4,500/oz which compares to the YTD average realized gold price1 of $4,486/oz. We have previously disclosed that our cost sensitivity is $5/oz for every $100/oz change in the gold price. Higher diesel prices continue to impact our operating costs in particular at our open pit operations, although we have been able to partially offset some of that cost pressure through productivity improvements.
We continue to expect 2026 copper production to be in the range of 190 to 220 thousand tonnes. We also expect that our copper cost guidance metrics for 2026 will be at or slightly above the top end of the ranges given the impact of higher diesel prices and local currency appreciation. Our copper cost guidance provided in February was based on a WTI oil price assumption of $70/bbl and an LME copper price assumption of $5.50/lb which compares to the YTD market average WTI oil price of $86/bbl and realized copper price1 of $6.17/lb. We have previously disclosed that our cost sensitivity is $0.01/lb per $0.25/lb change in the copper price.
In terms of the sensitivity of our costs to the oil price assumptions, we have calculated that for every $10/ barrel change in these oil prices, the direct impact on our costs associated with our diesel consumption is $12/oz across our gold operations and $0.04/lb across our copper sites.
We previously disclosed that our guidance for 2026 total attributable capital expenditure was reduced to $3.8 to $4.2 billion, reflecting a lower current year spend of $450-500 million (50% basis) for the Reko Diq project. This change is reflected in the table to the right and also includes the consequential impact on the copper capital expenditure ranges for 2026. Note that the timing and quantum of capital expenditures for the Reko Diq project remains under review as part of the overall project review.
Further detail on our 2026 company guidance is provided below and on the next page, inclusive of the key assumptions that were used as the basis for this guidance as released on February 5, 2026 and as qualified by the comments above.
| Company Guidance |
2026 | |||
| ($ millions, except per oz/lb data) |
Estimate | |||
| Gold production (millions of ounces) |
2.90 - 3.25 | |||
| Gold cost metrics |
||||
| COS - gold ($/oz) |
1,870 - 2,070 | |||
| TCC ($/oz)a |
1,330 - 1,470 | |||
| Depreciation ($/oz) |
470 - 520 | |||
| AISC ($/oz)a |
1,760 - 1,950 | |||
| Attributable minesite sustaininga |
1,100 - 1,250 | |||
| Attributable projecta |
900 - 1,000 | |||
| Total attributable capital expenditures |
2,000 - 2,250 | |||
| Copper production (thousands of tonnes) |
190 - 220 | |||
| Copper cost metrics |
||||
| COS - copper ($/lb) |
3.05 - 3.35 | |||
| C1 cash costs ($/lb)a |
2.20 - 2.45 | |||
| Depreciation ($/lb) |
0.90 - 1.00 | |||
| AISC ($/lb)a |
3.45 - 3.75 | |||
| Attributable minesite sustaininga |
400 - 450 | |||
| Attributable projecta,d |
1,400 - 1,500 | |||
| Total attributable capital expendituresd |
1,800 - 1,950 | |||
| Exploration and project expenses |
450 - 500 | |||
| Exploration and evaluation |
320 - 350 | |||
| Project expenses |
130 - 150 | |||
| General and administrative expenses |
~180 | |||
| Corporate administration |
~120 | |||
| Share-based compensationb |
~60 | |||
| Other expense |
70 - 90 | |||
| Finance costs, net |
230 - 250 | |||
| Effective income tax ratec |
24% - 28% | |||
| Key assumptions (used for guidance) |
||||
| Gold Price ($/oz) |
4,500 | |||
| Copper Price ($/lb) |
5.50 | |||
| Oil Price (WTI) ($/barrel) |
70 | |||
| Oil Price (Brent) ($/barrel) |
75 | |||
| AUD Exchange Rate (AUD:USD) |
0.75 | |||
| ARS Exchange Rate (USD:ARS) |
1,513 | |||
| CAD Exchange Rate (USD:CAD) |
1.30 | |||
| CLP Exchange Rate (USD:CLP) |
900 | |||
| EUR Exchange Rate (EUR:USD) |
1.10 | |||
| a. | Further information on these non-GAAP financial measures, including detailed reconciliations, is included on pages 44 to 56 of this MD&A. |
| b. | Based on a share price of US$45.76. |
| c. | Based on key assumptions included in this table. |
| d. | Amended as disclosed in our Q2 report. |
| BARRICK THIRD QUARTER 2026 | 9 | MANAGEMENT’S DISCUSSION AND ANALYSIS |
| OVERVIEW | OPERATING PERFORMANCE
|
FUTURE GROWTH
|
REVIEW OF FINANCIAL RESULTS
|
OTHER INFORMATION & NON-GAAP RECONCILIATIONS |
FINANCIAL STATEMENTS | |||||
Operating Division Guidance
Our 2026 forecast gold and copper production, COSa, TCCb, AISCb, and C1 cash costsb ranges by operating division were originally released on February 5, 2026 as follows:
| Operating Division | 2026 forecast attributable production (koz) |
2026 forecast COSa ($/oz) |
2026 forecast TCCb ($/oz) |
2026 forecast AISCb ($/oz) |
||||||||||||
| Gold | ||||||||||||||||
| Carlin (61.5%) |
600 - 670 | 1,770 - 1,960 | 1,340 - 1,490 | 1,900 - 2,100 | ||||||||||||
| Cortez (61.5%) |
430 - 480 | 1,980 - 2,190 | 1,390 - 1,540 | 1,690 - 1,870 | ||||||||||||
| Turquoise Ridge (61.5%) |
300 - 330 | 1,610 - 1,790 | 1,220 - 1,360 | 1,490 - 1,650 | ||||||||||||
| Phoenix (61.5%) |
80 - 100 | 2,440 - 2,710 | 900 - 1,000 | 1,180 - 1,310 | ||||||||||||
| Nevada Gold Mines (61.5%) |
1,420 - 1,580 | 1,850 - 2,050 | 1,300 - 1,440 | 1,720 - 1,900 | ||||||||||||
| Pueblo Viejo (60%) |
350 - 400 | 1,720 - 1,910 | 1,160 - 1,290 | 1,590 - 1,760 | ||||||||||||
| North America | 1,770 - 1,980 | 1,820 - 2,010 | 1,270 - 1,410 | 1,690 - 1,870 | ||||||||||||
| Veladero (50%) |
180 - 200 | 2,000 - 2,210 | 1,160 - 1,280 | 1,460 - 1,620 | ||||||||||||
| Porgera (24.5%) |
80 - 100 | 1,610 - 1,790 | 1,190 - 1,320 | 1,610 - 1,780 | ||||||||||||
| Loulo-Gounkoto (80%)c |
260 - 290 | 2,860 - 3,140 | 2,180 - 2,390 | 2,640 - 2,900 | ||||||||||||
| Kibali (45%) |
270 - 310 | 1,520 - 1,680 | 1,130 - 1,250 | 1,330 - 1,470 | ||||||||||||
| North Mara (84%) |
200 - 230 | 1,700 - 1,880 | 1,300 - 1,430 | 1,520 - 1,680 | ||||||||||||
| Bulyanhulu (84%) |
140 - 160 | 1,750 - 1,940 | 1,230 - 1,360 | 1,870 - 2,070 | ||||||||||||
| Barrick Internationald | 1,130 - 1,270 | 1,960 - 2,170 | 1,420 - 1,560 | 1,760 - 1,950 | ||||||||||||
| Total Attributable to Barricke,f,g | 2,900 - 3,250 | 1,870 - 2,070 | 1,330 - 1,470 | 1,760 - 1,950 | ||||||||||||
| 2026 forecast attributable production (kt) |
2026 forecast COSa ($/lb) |
2026 forecast C1 cash costsb ($/lb) |
2026 forecast AISCb ($/lb) |
|||||||||||||
| Copper | ||||||||||||||||
| Lumwana |
130 - 150 | 2.85 - 3.15 | 2.05 - 2.30 | 3.40 - 3.75 | ||||||||||||
| Zaldívar (50%) |
30 - 35 | 4.80 - 5.10 | 3.70 - 3.90 | 5.40 - 5.70 | ||||||||||||
| Jabal Sayid (50%) |
25 - 30 | 2.10 - 2.30 | 1.25 - 1.45 | 1.45 - 1.65 | ||||||||||||
| Total Copperg | 190 - 220 | 3.05 - 3.35 | 2.20 - 2.45 | 3.45 - 3.75 | ||||||||||||
| a. | Gold COS/oz is calculated as cost of sales across our gold operations (excluding sites in closure or care and maintenance) divided by ounces sold (both on an attributable basis using Barrick’s ownership share). Copper COS/lb is calculated as cost of sales across our copper operations divided by pounds sold (both on an attributable basis using Barrick’s ownership share). |
| b. | Further information on these non-GAAP financial measures, including detailed reconciliations, is included on pages 44 to 56 of this MD&A. |
| c. | 2026 forecast cost of sales does not include the impact of the Loulo-Gounkoto purchase price allocation. Refer to note 4 to the Financial Statements for further information. |
| d. | Following the change in our operating structure as announced on August 11, 2026, guidance for Barrick International represents the combination of the guidance released in February 2026 for the South America & Asia Pacific and AME regions. Operating Division and the overall guidance ranges for the company are unchanged. |
| e. | TCC/oz and AISC/oz include costs allocated to non-operating sites. |
| f. | Operating division guidance ranges reflect expectations at each individual operating division and may not add up to the company-wide guidance range total. |
| g. | AISC/oz and AISC/lb includes corporate administration costs. |
| BARRICK THIRD QUARTER 2026 | 10 | MANAGEMENT’S DISCUSSION AND ANALYSIS |
| OVERVIEW | OPERATING PERFORMANCE
|
FUTURE GROWTH
|
REVIEW OF FINANCIAL RESULTS
|
OTHER INFORMATION & NON-GAAP RECONCILIATIONS |
FINANCIAL STATEMENTS | |||||
Our presentation of reportable operating segments consists of eight gold mines (Carlin, Cortez, Turquoise Ridge, Pueblo Viejo, Loulo-Gounkoto, Kibali, North Mara and Bulyanhulu) and one copper mine (Lumwana). The remaining operating segments, including our remaining gold and copper mines, have been grouped into an “Other
Mines” category and will not be reported on individually. Segment performance is evaluated based on a number of measures including operating income before tax, production levels and unit production costs. Certain costs are managed on a consolidated basis and are therefore not reflected in segment income.
Nevada Gold Mines (61.5%)a, Nevada, USA
Summary of Operating and Financial Data
| For the three months ended | For the nine months ended | |||||||||||||||||||||||||||
| 9/30/26 | 6/30/26 | % Change | 9/30/25 | % Change | 9/30/26 | 9/30/25 | % Change | |||||||||||||||||||||
| Total tonnes mined (000s) |
31,795 | 33,789 | (6)% | 34,963 | (9)% | 95,531 | 109,228 | (13)% | ||||||||||||||||||||
| Open pit ore |
4,564 | 4,994 | (9)% | 5,080 | (10)% | 16,586 | 13,042 | 27 % | ||||||||||||||||||||
| Open pit waste |
25,593 | 27,127 | (6)% | 28,239 | (9)% | 73,993 | 91,497 | (19)% | ||||||||||||||||||||
| Underground |
1,638 | 1,668 | (2)% | 1,644 | 0 % | 4,952 | 4,689 | 6 % | ||||||||||||||||||||
| Average grade (grams/tonne) |
||||||||||||||||||||||||||||
| Open pit mined |
1.13 | 0.57 | 98 % | 0.96 | 18 % | 0.75 | 0.97 | (23)% | ||||||||||||||||||||
| Underground mined |
7.27 | 7.86 | (8)% | 8.46 | (14)% | 7.80 | 8.10 | (4)% | ||||||||||||||||||||
| Processed |
2.41 | 1.93 | 25 % | 2.75 | (12)% | 2.04 | 2.74 | (26)% | ||||||||||||||||||||
| Ore tonnes processed (000s) |
6,333 | 8,454 | (25)% | 6,247 | 1 % | 23,706 | 18,331 | 29 % | ||||||||||||||||||||
| Oxide mill |
1,879 | 2,005 | (6)% | 1,906 | (1)% | 5,771 | 5,633 | 2 % | ||||||||||||||||||||
| Roaster |
1,363 | 1,329 | 3 % | 1,329 | 3 % | 4,029 | 3,817 | 6 % | ||||||||||||||||||||
| Autoclave |
1,298 | 1,128 | 15 % | 1,126 | 15 % | 3,586 | 3,153 | 14 % | ||||||||||||||||||||
| Heap leach |
1,793 | 3,992 | (55)% | 1,886 | (5)% | 10,320 | 5,728 | 80 % | ||||||||||||||||||||
| Recovery rate |
82 % | 82 % | 0 % | 83 % | (1)% | 82 % | 82 % | 0 % | ||||||||||||||||||||
| Oxide Mill |
80 % | 74 % | 8 % | 82 % | (2)% | 76 % | 79 % | (4)% | ||||||||||||||||||||
| Roaster |
85 % | 85 % | 0 % | 86 % | (1)% | 85 % | 86 % | (1)% | ||||||||||||||||||||
| Autoclave |
80 % | 80 % | 0 % | 78 % | 3 % | 81 % | 79 % | 3 % | ||||||||||||||||||||
| Gold produced (000s oz) |
400 | 382 | 5 % | 402 | 0 % | 1,158 | 1,125 | 3 % | ||||||||||||||||||||
| Oxide mill |
88 | 62 | 42 % | 71 | 24 % | 203 | 220 | (8)% | ||||||||||||||||||||
| Roaster |
201 | 203 | (1)% | 222 | (9)% | 608 | 606 | 0 % | ||||||||||||||||||||
| Autoclave |
100 | 100 | 0 % | 100 | 0 % | 308 | 268 | 15 % | ||||||||||||||||||||
| Heap leach |
11 | 17 | (35)% | 9 | 22 % | 39 | 31 | 26 % | ||||||||||||||||||||
| Gold sold (000s oz) |
392 | 386 | 2 % | 406 | (3)% | 1,158 | 1,127 | 3 % | ||||||||||||||||||||
| Revenue ($ millions) |
1,740 | 1,740 | 0 % | 1,467 | 19 % | 5,405 | 3,769 | 43 % | ||||||||||||||||||||
| Cost of sales ($ millions) |
748 | 759 | (1)% | 633 | 18 % | 2,194 | 1,840 | 19 % | ||||||||||||||||||||
| Income ($ millions) |
992 | 975 | 2 % | 828 | 20 % | 3,200 | 1,905 | 68 % | ||||||||||||||||||||
| EBITDA ($ millions)b,c |
1,168 | 1,141 | 2 % | 962 | 21 % | 3,707 | 2,270 | 63 % | ||||||||||||||||||||
| EBITDA margind |
67 % | 66 % | 2 % | 66 % | 2 % | 69 % | 60 % | 15 % | ||||||||||||||||||||
| Capital expenditures ($ millions)e |
265 | 231 | 15 % | 168 | 58 % | 703 | 626 | 12 % | ||||||||||||||||||||
| Minesite sustainingb |
169 | 155 | 9 % | 107 | 58 % | 464 | 467 | (1)% | ||||||||||||||||||||
| Projectb |
94 | 74 | 27 % | 60 | 57 % | 233 | 156 | 49 % | ||||||||||||||||||||
| COS ($/oz) |
1,908 | 1,961 | (3)% | 1,557 | 23 % | 1,890 | 1,626 | 16 % | ||||||||||||||||||||
| TCC ($/oz)b |
1,340 | 1,418 | (6)% | 1,156 | 16 % | 1,338 | 1,245 | 7 % | ||||||||||||||||||||
| AISC ($/oz)b |
1,792 | 1,843 | (3)% | 1,448 | 24 % | 1,761 | 1,687 | 4 % | ||||||||||||||||||||
| a. | Barrick is the operator of NGM and owns 61.5%, with Newmont owning the remaining 38.5%. NGM is accounted for as a subsidiary with a 38.5% non-controlling interest. These results represent our 61.5% interest in Carlin, Cortez, Turquoise Ridge and Phoenix and non-mine site related activity. |
| b. | Further information on these non-GAAP financial measures, including detailed reconciliations, is included on pages 44 to 56 of this MD&A. |
| c. | EBITDA represents income plus depreciation. Depreciation expense is $176 million and $507 million for Q3 2026 and YTD 2026, respectively (Q2 2026: $166 million, Q3 2025: $134 million, YTD 2025: $365 million). |
| d. | Represents EBITDA divided by revenue. |
| e. | Includes capitalized interest. |
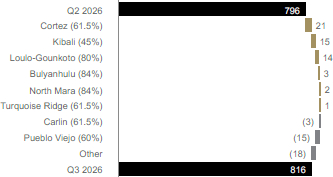
Across the NGM sites, gold production for Q3 2026 was 5% higher than Q2 2026, primarily driven by a stronger performance at Cortez. Highlights were:
| ∎ | Carlin set a new quarterly record for tonnes processed at the Gold Quarry roaster |
| ∎ | Cortez continued to benefit from the Goldrush ramp-up |
| BARRICK THIRD QUARTER 2026 | 11 | MANAGEMENT’S DISCUSSION AND ANALYSIS |
| OVERVIEW |
OPERATING PERFORMANCE |
FUTURE GROWTH |
REVIEW OF FINANCIAL RESULTS |
OTHER INFORMATION & NON-GAAP RECONCILIATIONS |
FINANCIAL STATEMENTS | |||||
Carlin (61.5%), Nevada, USA
Summary of Operating and Financial Data
| For the three months ended | For the nine months ended |
|||||||||||||||||||||||||||||||||||
| 9/30/26 | 6/30/26 | % Change | 9/30/25 | % Change | 9/30/26 | 9/30/25 | % Change | |||||||||||||||||||||||||||||
| Total tonnes mined (000s) |
14,432 | 14,764 | (2)% | 14,692 | (2)% | 39,250 | 47,444 | (17)% | ||||||||||||||||||||||||||||
| Open pit ore |
1,039 | 444 | 134 % | 1,062 | (2)% | 2,437 | 1,568 | 55 % | ||||||||||||||||||||||||||||
| Open pit waste |
12,594 | 13,481 | (7)% | 12,760 | (1)% | 34,309 | 43,360 | (21)% | ||||||||||||||||||||||||||||
| Underground |
799 | 839 | (5)% | 870 | (8)% | 2,504 | 2,516 | 0 % | ||||||||||||||||||||||||||||
| Average grade (grams/tonne) |
||||||||||||||||||||||||||||||||||||
| Open pit mined |
0.41 | 0.36 | 14 % | 2.21 | (81)% | 1.07 | 1.93 | (45)% | ||||||||||||||||||||||||||||
| Underground mined |
6.77 | 7.15 | (5)% | 7.29 | (7)% | 7.02 | 7.28 | (4)% | ||||||||||||||||||||||||||||
| Processed |
2.49 | 3.23 | (23)% | 4.41 | (44)% | 3.22 | 4.30 | (25)% | ||||||||||||||||||||||||||||
| Ore tonnes processed (000s) |
2,519 | 2,016 | 25 % | 1,430 | 76 % | 6,035 | 4,239 | 42 % | ||||||||||||||||||||||||||||
| Roasters |
978 | 982 | 0 % | 926 | 6 % | 2,920 | 2,835 | 3 % | ||||||||||||||||||||||||||||
| Autoclave |
683 | 642 | 6 % | 504 | 36 % | 1,865 | 1,308 | 43 % | ||||||||||||||||||||||||||||
| Heap leach |
858 | 392 | 119 % | 0 | 0 % | 1,250 | 96 | 1,202 % | ||||||||||||||||||||||||||||
| Recovery rate |
81 % | 81 % | 0 % | 80 % | 1 % | 81 % | 81 % | 0 % | ||||||||||||||||||||||||||||
| Roasters |
84 % | 84 % | 0 % | 85 % | (1)% | 84 % | 84 % | 0 % | ||||||||||||||||||||||||||||
| Autoclave |
63 % | 65 % | (3)% | 54 % | 17 % | 65 % | 55 % | 18 % | ||||||||||||||||||||||||||||
| Gold produced (000s oz) |
169 | 172 | (2)% | 165 | 2 % | 514 | 480 | 7 % | ||||||||||||||||||||||||||||
| Roasters |
145 | 147 | (1)% | 149 | (3)% | 443 | 431 | 3 % | ||||||||||||||||||||||||||||
| Autoclave |
22 | 23 | (4)% | 13 | 69 % | 65 | 39 | 67 % | ||||||||||||||||||||||||||||
| Heap leach |
2 | 2 | 0 % | 3 | (33)% | 6 | 10 | (40)% | ||||||||||||||||||||||||||||
| Gold sold (000s oz) |
164 | 173 | (5)% | 170 | (4)% | 510 | 478 | 7 % | ||||||||||||||||||||||||||||
| Revenue ($ millions) |
717 | 769 | (7)% | 602 | 19 % | 2,346 | 1,571 | 49 % | ||||||||||||||||||||||||||||
| Cost of sales ($ millions) |
300 | 322 | (7)% | 254 | 18 % | 933 | 764 | 22 % | ||||||||||||||||||||||||||||
| Income ($ millions) |
415 | 446 | (7)% | 345 | 20 % | 1,408 | 798 | 76 % | ||||||||||||||||||||||||||||
| EBITDA ($ millions)a,b |
485 | 519 | (7)% | 394 | 23 % | 1,628 | 927 | 76 % | ||||||||||||||||||||||||||||
| EBITDA marginc |
68 % | 67 % | 1 % | 65 % | 5 % | 69 % | 59 % | 17 % | ||||||||||||||||||||||||||||
| Capital expenditures ($ millions)d |
131 | 120 | 9 % | 90 | 46 % | 366 | 362 | 1 % | ||||||||||||||||||||||||||||
| Minesite sustaininga |
102 | 96 | 6 % | 71 | 44 % | 285 | 305 | (7)% | ||||||||||||||||||||||||||||
| Projecta |
27 | 23 | 17 % | 18 | 50 % | 75 | 54 | 39 % | ||||||||||||||||||||||||||||
| COS ($/oz) |
1,823 | 1,856 | (2)% | 1,493 | 22 % | 1,824 | 1,594 | 14 % | ||||||||||||||||||||||||||||
| TCC ($/oz)a |
1,375 | 1,405 | (2)% | 1,201 | 14 % | 1,365 | 1,323 | 3 % | ||||||||||||||||||||||||||||
| AISC ($/oz)a |
2,003 | 1,971 | 2 % | 1,643 | 22 % | 1,936 | 1,982 | (2)% | ||||||||||||||||||||||||||||
| a. | Further information on these non-GAAP financial measures, including detailed reconciliations, is included on pages 44 to 56 of this MD&A. |
| b. | EBITDA represents income plus depreciation. Depreciation expense is $70 million and $220 million for Q3 2026 and YTD 2026, respectively (Q2 2026: $73 million, Q3 2025: $49 million, YTD 2025: $129 million). |
| c. | Represents EBITDA divided by revenue. |
| d. | Includes capitalized interest. |
Safety and Environment
| For the three months ended | ||||||||
| 9/30/26 | 6/30/26 | |||||||
| LTI |
1 | 1 | ||||||
| LTIFR3 |
0.42 | 0.41 | ||||||
| TRIFR3 |
2.11 | 1.23 | ||||||
| Class 14 environmental incidents |
0 | 0 | ||||||
Financial Results
Q3 2026 compared to Q2 2026
Gold production in Q3 2026 was 2% lower than Q2 2026 mainly driven by lower underground grades mined and processed with the increased focus on underground development, although this was largely offset by record
tonnes processed at the Gold Quarry roaster following the planned Q2 shutdown.
COS/oz2 and TCC/oz1 in Q3 2026 were both 2% lower than Q2 2026, primarily reflecting lower processing costs following the Gold Quarry shutdown in Q2 2026 although this was offset by lower grades processed. In Q3 2026, AISC/oz1 was 2% higher than Q2 2026, due to higher sustaining capital expenditures1, partially offset by the lower TCC/oz1.
Capital expenditures increased by 9% compared to Q2 2026, mainly driven by higher minesite sustaining capital expenditures1 due to increased underground development, and higher project capital expenditures1 driven by increased expenditures on the open pit autonomous haulage project.
| BARRICK THIRD QUARTER 2026 | 12 | MANAGEMENT’S DISCUSSION AND ANALYSIS |
| OVERVIEW |
OPERATING PERFORMANCE |
FUTURE GROWTH |
REVIEW OF FINANCIAL RESULTS |
OTHER INFORMATION & NON-GAAP RECONCILIATIONS |
FINANCIAL STATEMENTS | |||||
Q3 2026 compared to Q3 2025
Gold production for Q3 2026 was 2% higher than Q3 2025, primarily due to the improved processing performance at the Goldstrike autoclave, in addition to record tonnes at the Gold Quarry roaster benefiting both Carlin and Cortez. This was largely offset by lower grades processed related to the re-entry into the Gold Quarry open pit and the focus on underground development.
COS/oz2 and TCC/oz1 for Q3 2026 were 22% and 14% higher, respectively, than Q3 2025, as a result of the lower grades processed and higher diesel prices, in addition to higher royalties driven by the higher realized gold price1. For Q3 2026, AISC/oz1 was 22% higher than Q3 2025 owing to higher TCC/oz1 combined with higher minesite sustaining capital expenditures1.
Capital expenditures were 46% higher than Q3 2025, mainly due to higher minesite sustaining capital expenditures1 driven by increased open pit waste stripping at the Gold Quarry open pit, following the completion of mining at Arturo in Q1 2026, and higher capitalized drilling. Project capital expenditures1 also increased with the continuation of the Ren project and the open pit autonomous haulage project.
YTD 2026 compared to YTD 2025
Gold production for YTD 2026 was 7% higher than YTD 2025, mainly due to higher throughput and improved recoveries at the Goldstrike autoclave, together with higher roaster throughput. This was partially offset by lower grades processed, with the 25% decrease in average processing grade mainly reflecting: changes in the feed mix; a significant increase in low grade heap leach tonnes placed from the Gold Quarry open pit; a 43% increase in autoclave throughput of lower grade material; together with lower underground grades mined. Higher grades processed in the first three months of the year were driven by the Arturo open pit, where mining was completed in Q1 2026, whereas there was mainly waste stripping in Q1 2025. Underground grades mined were also lower for YTD 2026.
COS/oz2 for YTD 2026 was 14% higher than YTD 2025, mainly reflecting higher depreciation associated with the Arturo open pit. TCC/oz1 for YTD 2026 was 3% higher than YTD 2025, primarily driven by higher diesel prices, tariffs and higher royalties due to the higher realized gold price1. For YTD 2026, AISC/oz1 was 2% lower than YTD 2025 driven by lower minesite sustaining capital expenditures1, partially offset by higher TCC/oz1.
Capital expenditures were in line with YTD 2025 as lower minesite sustaining capital expenditures1 were largely offset by higher project capital expenditures1. The lower minesite sustaining capital expenditures1 were primarily due to the final payment on the Komatsu-930 truck fleet occurring in Q1 2025, whereas higher project capital expenditures1 relate to the continuation of the Ren project, the open pit autonomous haulage project, and the additional investment in growth exploration drilling.
| BARRICK THIRD QUARTER 2026 | 13 | MANAGEMENT’S DISCUSSION AND ANALYSIS |
| OVERVIEW |
OPERATING PERFORMANCE |
FUTURE GROWTH |
REVIEW OF FINANCIAL RESULTS |
OTHER INFORMATION & NON-GAAP RECONCILIATIONS |
FINANCIAL STATEMENTS | |||||
Cortez (61.5%), Nevada, USA
Summary of Operating and Financial Data
| For the three months ended | For the nine months ended | |||||||||||||||||||||||||||
| 9/30/26 | 6/30/26 | % Change | 9/30/25 | % Change | 9/30/26 | 9/30/25 | % Change | |||||||||||||||||||||
| Total tonnes mined (000s) |
11,201 | 12,841 | (13)% | 13,699 | (18)% | 38,100 | 42,735 | (11)% | ||||||||||||||||||||
| Open pit ore |
1,582 | 2,233 | (29)% | 1,777 | (11)% | 8,261 | 4,260 | 94 % | ||||||||||||||||||||
| Open pit waste |
9,040 | 10,028 | (10)% | 11,372 | (21)% | 28,147 | 36,941 | (24)% | ||||||||||||||||||||
| Underground |
579 | 580 | 0 % | 550 | 5 % | 1,692 | 1,534 | 10 % | ||||||||||||||||||||
| Average grade (grams/tonne) |
||||||||||||||||||||||||||||
| Open pit mined |
2.00 | 0.44 | 355 % | 1.16 | 72 % | 0.65 | 1.11 | (41)% | ||||||||||||||||||||
| Underground mined |
7.02 | 7.56 | (7)% | 8.06 | (13)% | 7.50 | 7.51 | 0 % | ||||||||||||||||||||
| Processed |
2.72 | 1.16 | 134 % | 2.26 | 20 % | 1.28 | 2.26 | (43)% | ||||||||||||||||||||
| Ore tonnes processed (000s) |
1,571 | 3,698 | (58)% | 2,028 | (23)% | 9,694 | 5,363 | 81 % | ||||||||||||||||||||
| Oxide mill |
577 | 561 | 3 % | 538 | 7 % | 1,681 | 1,519 | 11 % | ||||||||||||||||||||
| Roasters |
385 | 339 | 14 % | 403 | (4)% | 1,096 | 982 | 12 % | ||||||||||||||||||||
| Autoclave |
3 | 2 | 50 % | 44 | (93)% | 7 | 185 | (96)% | ||||||||||||||||||||
| Heap leach |
606 | 2,796 | (78)% | 1,043 | (42)% | 6,910 | 2,677 | 158 % | ||||||||||||||||||||
| Recovery rate |
84 % | 83 % | 1 % | 83 % | 1 % | 83 % | 83 % | 0 % | ||||||||||||||||||||
| Oxide Mill |
83 % | 79 % | 5 % | 79 % | 5 % | 79 % | 81 % | (2)% | ||||||||||||||||||||
| Roasters |
86 % | 86 % | 0 % | 88 % | (2)% | 86 % | 88 % | (2)% | ||||||||||||||||||||
| Autoclave |
93 % | 86 % | 8 % | 45 % | 107 % | 80 % | 46 % | 74 % | ||||||||||||||||||||
| Gold produced (000s oz) |
125 | 104 | 20 % | 124 | 1 % | 318 | 324 | (2)% | ||||||||||||||||||||
| Oxide Mill |
61 | 34 | 79 % | 40 | 53 % | 123 | 122 | 1 % | ||||||||||||||||||||
| Roasters |
55 | 55 | 0 % | 73 | (25)% | 162 | 174 | (7)% | ||||||||||||||||||||
| Autoclave |
0 | 1 | (100)% | 5 | (100)% | 1 | 7 | (86)% | ||||||||||||||||||||
| Heap leach |
9 | 14 | (36)% | 6 | 50 % | 32 | 21 | 52 % | ||||||||||||||||||||
| Gold sold (000s oz) |
119 | 104 | 14 % | 123 | (3)% | 312 | 326 | (4)% | ||||||||||||||||||||
| Revenue ($ millions) |
515 | 457 | 13 % | 438 | 18 % | 1,414 | 1,075 | 32 % | ||||||||||||||||||||
| Cost of sales ($ millions) |
248 | 235 | 6 % | 198 | 25 % | 675 | 527 | 28 % | ||||||||||||||||||||
| Income ($ millions) |
267 | 220 | 21 % | 238 | 12 % | 736 | 542 | 36 % | ||||||||||||||||||||
| EBITDA ($ millions)a,b |
339 | 276 | 23 % | 283 | 20 % | 914 | 660 | 38 % | ||||||||||||||||||||
| EBITDA marginc |
66 % | 60 % | 10 % | 65 % | 2 % | 65 % | 61 % | 7 % | ||||||||||||||||||||
| Capital expenditures ($ millions) |
77 | 74 | 4 % | 56 | 38 % | 219 | 191 | 15 % | ||||||||||||||||||||
| Minesite sustaininga |
33 | 29 | 14 % | 15 | 120 % | 94 | 92 | 2 % | ||||||||||||||||||||
| Projecta |
44 | 45 | (2)% | 41 | 7 % | 125 | 99 | 26 % | ||||||||||||||||||||
| COS ($/oz) |
2,088 | 2,267 | (8)% | 1,612 | 30 % | 2,165 | 1,616 | 34 % | ||||||||||||||||||||
| TCC ($/oz)a |
1,472 | 1,713 | (14)% | 1,242 | 19 % | 1,580 | 1,249 | 27 % | ||||||||||||||||||||
| AISC ($/oz)a |
1,777 | 2,028 | (12)% | 1,407 | 26 % | 1,912 | 1,566 | 22 % | ||||||||||||||||||||
| a. | Further information on these non-GAAP financial measures, including detailed reconciliations, is included on pages 44 to 56 of this MD&A. |
| b. | EBITDA represents income plus depreciation. Depreciation expense is $72 million and $178 million for Q3 2026 and YTD 2026, respectively (Q2 2026: $56 million, Q3 2025: $45 million, YTD 2025: $118 million). |
| c. | Represents EBITDA divided by revenue. |
Safety and Environment
| For the three months ended | ||||||||
| 9/30/26 | 6/30/26 | |||||||
| LTI |
2 | 0 | ||||||
| LTIFR3 |
1.78 | 0.00 | ||||||
| TRIFR3 |
1.78 | 1.79 | ||||||
| Class 14 environmental incidents |
0 | 0 | ||||||
Financial Results
Q3 2026 compared to Q2 2026
Gold production in Q3 2026 was 20% higher than Q2 2026, primarily driven by higher grade open pit ore mined and processed through both the oxide mill and the Gold Quarry roaster, with the latter achieving record throughput as
mining advanced into the higher grade zones of the Crossroads pit, consistent with the planned mining sequence. This was partially offset by lower heap leach production, reflecting the timing of ounces placed, with significant tonnes placed in the first half of 2026.
COS/oz2 and TCC/oz1 in Q3 2026 were 8% and 14% lower, respectively, than Q2 2026, primarily driven by the higher grades processed, partially offset by higher royalties applicable to the Crossroads ore. In Q3 2026, AISC/oz1 was 12% lower than Q2 2026, driven by lower TCC/oz1, partially offset by slightly higher minesite sustaining capital expenditures1.
Capital expenditures in Q3 2026 were 4% higher than Q2 2026, due to higher minesite sustaining capital
| BARRICK THIRD QUARTER 2026 | 14 | MANAGEMENT’S DISCUSSION AND ANALYSIS |
| OVERVIEW |
OPERATING PERFORMANCE |
FUTURE GROWTH |
REVIEW OF FINANCIAL RESULTS |
OTHER INFORMATION & NON-GAAP RECONCILIATIONS |
FINANCIAL STATEMENTS | |||||
expenditures1 driven by the timing of equipment deliveries, with project capital expenditures1 in line with Q2 2026.
Q3 2026 compared to Q3 2025
Gold production for Q3 2026 was in line with Q3 2025, as higher grade open pit ore from Crossroads processed through the oxide mill at higher recoveries was offset by lower roaster production, driven by lower underground grades mined and processed at the Carlin roasters, in line with the mine sequence.
COS/oz2 and TCC/oz1 for Q3 2026 were 30% and 19% higher, respectively, than Q3 2025, reflecting higher royalties due to the higher realized gold price1 and increased production from higher royalty areas, higher underground mining costs including ground support, contractor and maintenance costs as Goldrush continues to ramp up, higher diesel prices and the impact of higher tariffs. For Q3 2026, AISC/oz1 was 26% higher than Q3 2025 driven by higher TCC/oz1 and higher minesite sustaining capital expenditures1.
Capital expenditures in Q3 2026 were 38% higher than Q3 2025, primarily due to the timing of equipment deliveries and higher minesite sustaining capital expenditures¹ driven by higher capitalized waste stripping, as the prior year quarter benefited from the completion of waste stripping at Crossroads Phase 6, combined with higher project capital expenditures¹ related to the continued ramp-up at Goldrush and the open pit autonomous haulage project.
YTD 2026 compared to YTD 2025
Gold production for YTD 2026 was 2% lower than YTD 2025, primarily driven by open pit mine sequencing with processing of lower grade ore from Crossroads, whereas in the prior year period higher grade ore was processed from Cortez Pits phase 1. This was partially offset by the ongoing ramp-up at Goldrush. Overall, this resulted in lower grade ore processed at the oxide mill, lower refractory production, and an increase in tonnes placed on the leach pad.
COS/oz2 and TCC/oz1 for YTD 2026 were 34% and 27% higher, respectively, than YTD 2025, reflecting lower grades processed, higher royalties due to both the higher realized gold price1 and increased production from higher royalty areas, higher diesel prices, and the impact of higher tariffs. For YTD 2026, AISC/oz1 increased by 22% compared to YTD 2025, due to higher TCC/oz1 and higher minesite sustaining capital expenditures1 on a per ounce basis.
Capital expenditures for YTD 2026 were 15% higher than YTD 2025, due to an increase in project capital expenditures1 driven by the ongoing ramp-up at Goldrush, the open pit autonomous haulage project and accelerated development at KB South, whereas minesite sustaining capital expenditures1 were almost in line.
| BARRICK THIRD QUARTER 2026 | 15 | MANAGEMENT’S DISCUSSION AND ANALYSIS |
| OVERVIEW |
OPERATING PERFORMANCE |
FUTURE GROWTH |
REVIEW OF FINANCIAL RESULTS |
OTHER INFORMATION & NON-GAAP RECONCILIATIONS |
FINANCIAL STATEMENTS | |||||
Turquoise Ridge (61.5%), Nevada, USA
Summary of Operating and Financial Data
| For the three months ended | For the nine months ended | |||||||||||||||||||||||||||
| 9/30/26 | 6/30/26 | % Change | 9/30/25 | % Change | 9/30/26 | 9/30/25 | % Change | |||||||||||||||||||||
| Total tonnes mined (000s) |
1,634 | 1,496 | 9 % | 430 | 280 % | 4,017 | 852 | 371 % | ||||||||||||||||||||
| Open pit ore |
27 | 22 | 23 % | 54 | (50)% | 54 | 54 | 0 % | ||||||||||||||||||||
| Open pit waste |
1,347 | 1,225 | 10 % | 152 | 786 % | 3,207 | 159 | 1,917 % | ||||||||||||||||||||
| Underground |
260 | 249 | 4 % | 224 | 16 % | 756 | 639 | 18 % | ||||||||||||||||||||
| Average grade (grams/tonne) |
||||||||||||||||||||||||||||
| Open pit mined |
1.81 | 1.86 | (3)% | 1.51 | 20 % | 1.71 | 1.51 | 13 % | ||||||||||||||||||||
| Underground mined |
9.00 | 10.60 | (15)% | 13.02 | (31)% | 10.61 | 11.91 | (11)% | ||||||||||||||||||||
| Processed |
4.18 | 4.88 | (14)% | 4.61 | (9)% | 4.57 | 4.46 | 2 % | ||||||||||||||||||||
| Ore tonnes processed (000s) |
701 | 572 | 23 % | 650 | 8 % | 1,986 | 1,875 | 6 % | ||||||||||||||||||||
| Oxide Mill |
89 | 80 | 11 % | 72 | 24 % | 259 | 215 | 20 % | ||||||||||||||||||||
| Roasters |
0 | 8 | (100)% | n/a | n/a | 13 | n/a | n/a | ||||||||||||||||||||
| Autoclave |
612 | 484 | 26 % | 578 | 6 % | 1,714 | 1,660 | 3 % | ||||||||||||||||||||
| Recovery rate |
85 % | 86 % | (1)% | 87 % | (2)% | 86 % | 87 % | (1)% | ||||||||||||||||||||
| Oxide Mill |
81 % | 81 % | 0 % | 86 % | (6)% | 81 % | 85 % | (5)% | ||||||||||||||||||||
| Roasters |
88 % | 90 % | (2)% | n/a | n/a | 90 % | n/a | n/a | ||||||||||||||||||||
| Autoclave |
85 % | 86 % | (1)% | 87 % | (2)% | 86 % | 87 % | (1)% | ||||||||||||||||||||
| Gold produced (000s oz) |
81 | 80 | 1 % | 86 | (6)% | 252 | 236 | 7 % | ||||||||||||||||||||
| Oxide Mill |
4 | 4 | 0 % | 4 | 0 % | 11 | 14 | (21)% | ||||||||||||||||||||
| Autoclave |
77 | 75 | 3 % | 82 | (6)% | 240 | 222 | 8 % | ||||||||||||||||||||
| Heap leach |
0 | 1 | (100)% | 0 | 0 % | 1 | 0 | 100 % | ||||||||||||||||||||
| Gold sold (000s oz) |
84 | 82 | 2 % | 85 | (1)% | 262 | 238 | 10 % | ||||||||||||||||||||
| Revenue ($ millions) |
361 | 363 | (1)% | 301 | 20 % | 1,199 | 777 | 54 % | ||||||||||||||||||||
| Cost of sales ($ millions) |
137 | 136 | 1 % | 123 | 11 % | 401 | 381 | 5 % | ||||||||||||||||||||
| Income ($ millions) |
225 | 228 | (1)% | 180 | 25 % | 803 | 401 | 100 % | ||||||||||||||||||||
| EBITDA ($ millions)a,b |
250 | 254 | (2)% | 209 | 20 % | 883 | 486 | 82 % | ||||||||||||||||||||
| EBITDA marginc |
69 % | 70 % | (1)% | 69 % | 0 % | 74 % | 63 % | 17 % | ||||||||||||||||||||
| Capital expenditures ($ millions) |
29 | 24 | 21 % | 14 | 107 % | 70 | 44 | 59 % | ||||||||||||||||||||
| Minesite sustaininga |
20 | 18 | 11 % | 13 | 54 % | 51 | 42 | 21 % | ||||||||||||||||||||
| Projecta |
9 | 6 | 50 % | 1 | 800 % | 19 | 2 | 850 % | ||||||||||||||||||||
| COS ($/oz) |
1,647 | 1,657 | (1)% | 1,452 | 13 % | 1,533 | 1,600 | (4)% | ||||||||||||||||||||
| TCC ($/oz)a |
1,325 | 1,319 | 0 % | 1,099 | 21 % | 1,208 | 1,234 | (2)% | ||||||||||||||||||||
| AISC ($/oz)a |
1,579 | 1,552 | 2 % | 1,244 | 27 % | 1,414 | 1,417 | 0 % | ||||||||||||||||||||
| a. | Further information on these non-GAAP financial measures, including detailed reconciliations, is included on pages 44 to 56 of this MD&A. |
| b. | EBITDA represents income plus depreciation. Depreciation expense is $25 million and $80 million for Q3 2026 and YTD 2026, respectively (Q2 2026: $26 million, Q3 2025: $29 million, YTD 2025: $85 million). |
| c. | Represents EBITDA divided by revenue. |
Safety and Environment
| For the three months ended | ||||||||
| 9/30/26 | 6/30/26 | |||||||
| LTI |
1 | 0 | ||||||
| LTIFR3 |
1.43 | 0.00 | ||||||
| TRIFR3 |
1.43 | 1.33 | ||||||
| Class 14 environmental incidents |
0 | 0 | ||||||
Financial Results
Q3 2026 compared to Q2 2026
Gold production in Q3 2026 was in line with Q2 2026, as higher throughput at the Sage autoclave following the planned shutdown in Q2 2026 was offset by lower underground grades mined and processed. Turquoise Ridge Underground delivered record quarterly tonnes mined, with the road header commissioned during the quarter and now ramping up. The road header project
provides additional mining work fronts derisking future ore supply with the potential to increase future tonne delivery.
COS/oz2 and TCC/oz1 in Q3 2026 were 1% lower and in line, respectively, than Q2 2026, primarily driven by lower processing costs following the planned Sage autoclave shutdown in Q2 2026 largely offset by the lower grades processed. AISC/oz1 was 2% higher than Q2 2026, driven by increased minesite sustaining capital expenditures1.
Capital expenditures were 21% higher than Q2 2026, driven by higher minesite sustaining capital expenditures1 due to higher capitalized drilling and the timing of underground mobile equipment deliveries, combined with higher project capital expenditures1 related to the open pit expansion.
| BARRICK THIRD QUARTER 2026 | 16 | MANAGEMENT’S DISCUSSION AND ANALYSIS |
| OVERVIEW |
OPERATING PERFORMANCE |
FUTURE GROWTH |
REVIEW OF FINANCIAL RESULTS |
OTHER INFORMATION & NON-GAAP RECONCILIATIONS |
FINANCIAL STATEMENTS | |||||
Q3 2026 compared to Q3 2025
Gold production for Q3 2026 was 6% lower than Q3 2025, due to lower underground grades mined and processed, as the prior year quarter benefited from mining in a high grade zone of the Turquoise Ridge underground. This was partially offset by higher underground tonnes mined and higher throughput at the Sage autoclave.
COS/oz2 and TCC/oz1 for Q3 2026 were 13% and 21% higher than Q3 2025, primarily owing to lower grades processed, combined with the impact of higher tariffs. AISC/ oz1 was 27% higher than Q3 2025, reflecting higher TCC/ oz1 and higher minesite sustaining capital expenditures1.
Capital expenditures were 107% higher than Q3 2025 driven by higher minesite sustaining capital expenditures1, primarily reflecting higher underground development, as well as higher project capital expenditures1 to expand open pit operations.
YTD 2026 compared to YTD 2025
Gold production for YTD 2026 was 7% higher compared to YTD 2025, primarily due to higher tonnes processed at the Sage autoclave, combined with higher mining rates at Turquoise Ridge underground, increasing the average grade processed.
COS/oz2 and TCC/oz1 for YTD 2026 were 4% and 2% lower, respectively, due to higher productivities and higher average grades processed compared to YTD 2025, partially offset by the impact of higher tariffs. AISC/oz1 was in line with YTD 2025, driven by higher minesite sustaining capital expenditures1, partially offset by lower TCC/oz1.
Capital expenditures for YTD 2026 were 59% higher than YTD 2025, driven by higher minesite sustaining capital expenditures1 and higher project capital expenditures1 to expand open pit operations.
| BARRICK THIRD QUARTER 2026 | 17 | MANAGEMENT’S DISCUSSION AND ANALYSIS |
| OVERVIEW |
OPERATING PERFORMANCE |
FUTURE GROWTH |
REVIEW OF FINANCIAL RESULTS |
OTHER INFORMATION & NON-GAAP RECONCILIATIONS |
FINANCIAL STATEMENTS | |||||
Pueblo Viejo (60%)a, Dominican Republic
Summary of Operating and Financial Data
| For the three months ended | For the nine months ended | |||||||||||||||||||||||||||
| 9/30/26 | 6/30/26 | % Change | 9/30/25 | % Change | 9/30/26 | 9/30/25 | % Change | |||||||||||||||||||||
| Open pit tonnes mined (000s) |
6,438 | 6,261 | 3 % |
6,303 | 2 % |
17,064 | 11,561 | 48 % | ||||||||||||||||||||
| Open pit ore |
1,925 | 1,301 | 48 % | 1,682 | 14 % | 3,581 | 2,444 | 47 % | ||||||||||||||||||||
| Open pit waste |
4,513 | 4,960 | (9)% | 4,621 | (2)% | 13,483 | 9,117 | 48 % | ||||||||||||||||||||
| Average grade (grams/tonne) |
||||||||||||||||||||||||||||
| Open pit mined |
1.90 | 2.22 | (14)% |
2.12 | (10)% |
2.04 | 2.15 | (5)% | ||||||||||||||||||||
| Processed |
2.40 | 2.28 | 5 % | 2.59 | (7)% | 2.32 | 2.39 | (3)% | ||||||||||||||||||||
| Autoclave ore tonnes processed (000s) |
1,648 | 1,862 | (11)% | 1,717 | (4)% | 5,084 | 4,622 | 10 % | ||||||||||||||||||||
| Recovery rate |
75 % | 75 % | 0 % | 77 % | (3)% | 74 % | 78 % | (5)% | ||||||||||||||||||||
| Gold produced (000s oz) |
97 | 112 | (13)% |
107 | (9)% |
290 | 276 | 5 % | ||||||||||||||||||||
| Gold sold (000s oz) |
96 | 108 | (11)% | 108 | (11)% | 286 | 277 | 3 % | ||||||||||||||||||||
| Revenue ($ millions) |
413 | 463 | (11)% | 378 | 9 % | 1,271 | 912 | 39 % | ||||||||||||||||||||
| Cost of sales ($ millions) |
161 | 182 | (12)% | 157 | 3 % | 482 | 458 | 5 % | ||||||||||||||||||||
| Income ($ millions) |
249 | 277 | (10)% | 216 | 15 % | 779 | 442 | 76 % | ||||||||||||||||||||
| EBITDA ($ millions)b,c |
296 | 328 | (10)% | 263 | 13 % | 917 | 579 | 58 % | ||||||||||||||||||||
| EBITDA margind |
72 % | 71 % | 1 % | 70 % | 3 % | 72 % | 63 % | 14 % | ||||||||||||||||||||
| Capital expenditures ($ millions)e |
77 | 62 | 24 % | 47 | 64 % | 200 | 149 | 34 % | ||||||||||||||||||||
| Minesite sustainingb |
45 | 32 | 41 % | 27 | 67 % | 112 | 100 | 12 % | ||||||||||||||||||||
| Projectb |
24 | 30 | (20)% | 18 | 33 % | 80 | 42 | 90 % | ||||||||||||||||||||
| COS ($/oz) |
1,668 | 1,683 | (1)% | 1,451 | 15 % | 1,683 | 1,653 | 2 % | ||||||||||||||||||||
| TCC ($/oz)b |
1,004 | 1,016 | (1)% | 929 | 8 % | 1,013 | 1,074 | (6)% | ||||||||||||||||||||
| AISC ($/oz)b |
1,486 | 1,322 | 12 % | 1,198 | 24 % | 1,416 | 1,446 | (2)% | ||||||||||||||||||||
| a. | Barrick is the operator of Pueblo Viejo and owns 60%, with Newmont owning the remaining 40%. Pueblo Viejo is accounted for as a subsidiary with a 40% non-controlling interest. The results in the table and the discussion that follows are based on our 60% share only. |
| b. | Further information on these non-GAAP financial measures, including detailed reconciliations, is included on pages 44 to 56 of this MD&A. |
| c. | EBITDA represents income plus depreciation. Depreciation expense is $47 million and $138 million for Q3 2026 and YTD 2026, respectively (Q2 2026: $51 million, Q3 2025: $47 million, YTD 2025: $137 million). |
| d. | Represents EBITDA divided by revenue. |
| e. | Includes capitalized interest. |
Safety and Environment
| For the three months ended | ||||||||
| 9/30/26 | 6/30/26 | |||||||
| LTI |
0 | 0 | ||||||
| LTIFR3 |
0.00 | 0.00 | ||||||
| TRIFR3 |
0.93 | 0.49 | ||||||
| Class 14 environmental incidents |
0 | 0 | ||||||
Financial Results
Q3 2026 compared to Q2 2026
Gold production in Q3 2026 decreased 13% over Q2 2026, mainly due to lower autoclave throughput which was impacted by maintenance in the milling circuit, partially offset by higher grades processed resulting from a higher proportion of fresh ore material in the feed.
COS/oz2 and TCC/oz1 for Q3 2026 were both 1% lower than Q2 2026, as a result of higher grades processed and lower royalties due to a lower realized gold price1, partially offset by lower costs allocated to by-products. For Q3 2026, AISC/oz1 was 12% higher than Q2 2026, driven primarily by higher minesite sustaining capital expenditures1.
Capital expenditures for Q3 2026 increased by 24% compared to Q2 2026, driven by higher minesite sustaining capital expenditures1 related to the El Llagal TSF.
Q3 2026 compared to Q3 2025
Gold production for Q3 2026 was 9% lower than Q3 2025, driven by lower throughput combined with lower grades processed in line with the mine and stockpile feed sequence.
COS/oz2 and TCC/oz1 for Q3 2026 were 15% and 8% higher, respectively, compared to Q3 2025, primarily reflecting lower grades processed and higher royalties driven by the increase in the realized gold price1. For Q3 2026, AISC/oz1 was 24% higher than Q3 2025, driven by higher TCC/oz1 and higher minesite sustaining capital expenditures1.
Capital expenditures for Q3 2026 increased by 64% compared to Q3 2025, primarily due to increased minesite sustaining capital expenditures1 relating to the construction of the El Llagal TSF, combined with higher project capital expenditures¹ related to the Naranjo TSF.
YTD 2026 compared to YTD 2025
Gold production for YTD 2026 was 5% higher than YTD 2025, reflecting an increase in autoclave tonnes processed, partially offset by lower grades processed and lower recovery.
COS/oz2 for YTD 2026 was 2% higher than YTD 2025, primarily reflecting higher royalties driven by the higher realized gold price1 and the lower grades processed. TCC/oz1 was 6% lower than YTD 2025, primarily reflecting
| BARRICK THIRD QUARTER 2026 | 18 | MANAGEMENT’S DISCUSSION AND ANALYSIS |
| OVERVIEW |
OPERATING PERFORMANCE |
FUTURE GROWTH |
REVIEW OF FINANCIAL RESULTS |
OTHER INFORMATION & NON-GAAP RECONCILIATIONS |
FINANCIAL STATEMENTS | |||||
higher costs allocated to by-products. For YTD 2026, AISC/ oz1 decreased by 2% compared to YTD 2025, primarily reflecting lower TCC/oz1, partially offset by higher minesite sustaining capital expenditures1.
Capital expenditures for YTD 2026 increased by 34% compared to YTD 2025, primarily due to higher minesite sustaining capital expenditures¹ relating to the El Llagal TSF, together with higher project capital expenditures¹ related to the Naranjo TSF.
| BARRICK THIRD QUARTER 2026 | 19 | MANAGEMENT’S DISCUSSION AND ANALYSIS |
| OVERVIEW |
OPERATING PERFORMANCE |
FUTURE GROWTH |
REVIEW OF FINANCIAL RESULTS |
OTHER INFORMATION & NON-GAAP RECONCILIATIONS |
FINANCIAL STATEMENTS | |||||
Loulo-Gounkoto (80%)a,b, Mali
Summary of Operating and Financial Data
| For the three months ended | For the nine months ended | |||||||||||||||||||||||||||
| 9/30/26 | 6/30/26 | % Change | 9/30/25 | % Change | 9/30/26 | 9/30/25 | % Change | |||||||||||||||||||||
| Total tonnes mined (000s) |
2,503 | 2,738 | (9)% |
— | 100 % |
5,631 | 1,709 | 229 % | ||||||||||||||||||||
| Open pit ore |
192 | 149 | 29 % | — | 100 % | 341 | 57 | 498 % | ||||||||||||||||||||
| Open pit waste |
1,633 | 2,052 | (20)% | — | 100 % | 3,685 | 1,366 | 170 % | ||||||||||||||||||||
| Underground |
678 | 537 | 26 % | — | 100 % | 1,605 | 286 | 461 % | ||||||||||||||||||||
| Average grade (grams/tonne) |
||||||||||||||||||||||||||||
| Open pit mined |
1.96 | 1.69 | 16 % | — | 100 % | 1.84 | 1.98 | (7)% | ||||||||||||||||||||
| Underground mined |
5.18 | 5.04 | 3 % | — | 100 % | 5.00 | 6.66 | (25)% | ||||||||||||||||||||
| Processed |
3.62 | 3.25 | 11 % | — | 100 % | 3.36 | 3.54 | (5)% | ||||||||||||||||||||
| Ore tonnes processed (000s) |
974 | 914 | 7 % |
— | 100 % |
2,577 | 169 | 1,425 % | ||||||||||||||||||||
| Recovery rate |
90 % | 92 % | (2)% | — | 100 % | 91 % | 91 % | 0 % | ||||||||||||||||||||
| Gold produced (000s oz) |
102 | 88 | 16 % | — | 100 % | 254 | 18 | 1,311 % | ||||||||||||||||||||
| Gold sold (000s oz) |
101 | 86 | 17 % | — | 100 % | 256 | — | 100 % | ||||||||||||||||||||
| Revenue ($ millions) |
427 | 385 | 11 % | — | 100 % | 1,153 | — | 100 % | ||||||||||||||||||||
| Cost of sales ($ millions) |
234 | 203 | 15 % | — | 100 % | 630 | 11 | 5,627 % | ||||||||||||||||||||
| Income ($ millions) |
187 | 171 | 9 % | — | 100 % | 469 | (117 | ) | 501 % | |||||||||||||||||||
| EBITDA ($ millions)c,d |
226 | 204 | 11 % | — | 100 % | 571 | (106 | ) | 639 % | |||||||||||||||||||
| EBITDA margine |
53 % | 53 % | — % | — | 100 % | 50 % | — | 100 % | ||||||||||||||||||||
| Capital expenditures ($ millions)c,f |
77 | 30 | 157 % | — | 100 % | 107 | 18 | 494 % | ||||||||||||||||||||
| Minesite sustainingc |
31 | 28 | 11 % | — | 100 % | 59 | 13 | 354 % | ||||||||||||||||||||
| Projectc,f |
46 | 2 | 2,200 % | — | 100 % | 48 | 3 | 1,500 % | ||||||||||||||||||||
| COS ($/oz) |
2,321 | 2,352 | (1)% | — | 100 % | 2,461 | — | 100 % | ||||||||||||||||||||
| TCC ($/oz)c |
1,911 | 1,897 | 1 % | — | 100 % | 1,908 | — | 100 % | ||||||||||||||||||||
| AISC ($/oz)c |
2,220 | 2,240 | (1)% | — | 100 % | 2,149 | — | 100 % | ||||||||||||||||||||
| a. | Barrick owns 80% of Société des Mines de Loulo SA and Société des Mines de Gounkoto with the Republic of Mali owning 20%. Loulo-Gounkoto is accounted for as a subsidiary with a 20% non-controlling interest on the basis that Barrick controls the asset. The results in the table and the discussion that follows are based on our 80% share. |
| b. | As a result of temporary suspension of operations at Loulo-Gounkoto starting January 14, 2025, and subsequent loss of control on June 16, 2025, no operating data or per ounce data was provided for Q1 2025 to Q3 2025. On November 24, 2025, Barrick announced that an agreement had been entered into with the Government of the Republic of Mali to put an end to all disputes regarding the Loulo and Gounkoto mines. The provisional administration of the Loulo-Gounkoto complex was terminated on December 16, 2025, at which point operational control was handed back to Somilo and Gounkoto’s management. |
| c. | Further information on these non-GAAP financial measures, including detailed reconciliations, is included on pages 44 to 56 of this MD&A. |
| d. | EBITDA represents income plus depreciation. Depreciation expense is $39 million and $102 million for Q3 2026 and YTD 2026, respectively (Q2 2026: $33 million, Q3 2025: $nil, YTD 2025: $nil). |
| e. | Represents EBITDA divided by revenue. |
| f. | Includes capitalized interest. |
Safety and Environment
| For the three months ended | ||||||||
| 9/30/26 | 6/30/26 | |||||||
| LTI |
0 | 0 | ||||||
| LTIFR3 |
0.00 | 0.00 | ||||||
| TRIFR3 |
0.00 | 0.25 | ||||||
| Class 14 environmental incidents |
0 | 0 | ||||||
Financial Results
Q3 2026 compared to Q2 2026
Gold production for Q3 2026 was 16% higher than Q2 2026, driven by increased throughput and higher grades processed. The operational ramp-up remains ahead of schedule, supported by the mining and processing performance exceeding the restart plan.
COS/oz2, TCC/oz1 and AISC/oz1 for Q3 2026 were almost in line with Q2 2026. The benefit from higher grades processed was offset by the impact of increased mining and processing activity in addition to cost pressures on key consumables.
Q3 2026 compared to Q3 2025
There was no gold production in Q3 2025 due to the suspension of operations midway through January 2025 as a result of the dispute with the Government of Mali that was ultimately resolved in December 2025. This resulted in no gold sales in Q3 2025 and, consequently, no TCC/oz1, AISC/oz1 and COS/oz2 were reported for the period.
YTD 2026 compared to YTD 2025
Gold production for YTD 2025 was also impacted by the suspension of operations discussed above. This resulted in no gold sales in YTD 2025 and consequently, no TCC/oz1, AISC/oz1 and COS/oz2 were reported for the period.
Capital expenditures for YTD 2026 relates to the resumption of operations and spend on critical capital items such as mobile mining equipment and underground development expenditure.
| BARRICK THIRD QUARTER 2026 | 20 | MANAGEMENT’S DISCUSSION AND ANALYSIS |
| OVERVIEW |
OPERATING PERFORMANCE |
FUTURE GROWTH |
REVIEW OF FINANCIAL RESULTS |
OTHER INFORMATION & NON-GAAP RECONCILIATIONS |
FINANCIAL STATEMENTS | |||||
Kibali (45%)a, Democratic Republic of Congo
Summary of Operating and Financial Data
| For the three months ended | For the nine months ended | |||||||||||||||||||||||||||
| 9/30/26 | 6/30/26 | % Change | 9/30/25 | % Change | 9/30/26 | 9/30/25 | % Change | |||||||||||||||||||||
| Total tonnes mined (000s) |
7,199 | 6,701 | 7 % |
6,089 | 18 % |
20,734 | 16,756 | 24 % | ||||||||||||||||||||
| Open pit ore |
726 | 674 | 8 % | 959 | (24)% | 2,094 | 1,975 | 6 % | ||||||||||||||||||||
| Open pit waste |
6,001 | 5,626 | 7 % | 4,723 | 27 % | 17,417 | 13,588 | 28 % | ||||||||||||||||||||
| Underground |
472 | 401 | 18 % | 407 | 16 % | 1,223 | 1,193 | 3 % | ||||||||||||||||||||
| Average grade (grams/tonne) |
||||||||||||||||||||||||||||
| Open pit mined |
1.63 | 1.43 | 14 % | 1.49 | 9 % | 1.50 | 1.48 | 1 % | ||||||||||||||||||||
| Underground mined |
4.72 | 4.30 | 10 % | 4.96 | (5)% | 4.59 | 5.11 | (10)% | ||||||||||||||||||||
| Processed |
3.29 | 2.82 | 17 % | 3.15 | 4 % | 2.79 | 2.75 | 1 % | ||||||||||||||||||||
| Ore tonnes processed (000s) |
936 | 923 | 1 % |
935 | 0 % |
2,769 | 2,812 | (2)% | ||||||||||||||||||||
| Recovery rate |
92 % | 90 % | 2 % | 90 % | 2 % | 91 % | 90 % | 1 % | ||||||||||||||||||||
| Gold produced (000s oz) |
91 | 76 | 20 % | 86 | 6 % | 225 | 224 | 0 % | ||||||||||||||||||||
| Gold sold (000s oz) |
93 | 71 | 31 % | 84 | 11 % | 233 | 220 | 6 % | ||||||||||||||||||||
| Revenue ($ millions) |
396 | 314 | 26 % | 294 | 35 % | 1,052 | 712 | 48 % | ||||||||||||||||||||
| Cost of sales ($ millions) |
144 | 133 | 8 % | 124 | 16 % | 409 | 345 | 19 % | ||||||||||||||||||||
| Income ($ millions) |
245 | 172 | 42 % | 161 | 52 % | 615 | 322 | 91 % | ||||||||||||||||||||
| EBITDA ($ millions)b,c |
285 | 206 | 38 % | 199 | 43 % | 722 | 424 | 70 % | ||||||||||||||||||||
| EBITDA margind |
72 % | 66 % | 9 % | 68 % | 6 % | 69 % | 60 % | 15 % | ||||||||||||||||||||
| Capital expenditures ($ millions) |
65 | 60 | 8 % | 39 | 67 % | 163 | 101 | 61 % | ||||||||||||||||||||
| Minesite sustainingb |
27 | 20 | 35 % | 19 | 42 % | 58 | 41 | 41 % | ||||||||||||||||||||
| Projectb |
38 | 40 | (5)% | 20 | 90 % | 105 | 60 | 75 % | ||||||||||||||||||||
| COS ($/oz) |
1,555 | 1,873 | (17)% | 1,482 | 5 % | 1,756 | 1,572 | 12 % | ||||||||||||||||||||
| TCC ($/oz)b |
1,105 | 1,381 | (20)% | 1,019 | 8 % | 1,282 | 1,101 | 16 % | ||||||||||||||||||||
| AISC ($/oz)b |
1,430 | 1,702 | (16)% | 1,286 | 11 % | 1,568 | 1,325 | 18 % | ||||||||||||||||||||
| a. | Barrick owns 45% of Kibali Goldmines SA with the Government of DRC and our joint venture partner, AngloGold Ashanti, owning 10% and 45%, respectively. The figures presented in this table and the discussion that follows are based on our 45% effective interest in Kibali Goldmines SA held through our 50% interest in Kibali (Jersey) Limited and its other subsidiaries (collectively “Kibali”), inclusive of the impact of the purchase price allocation resulting from the merger with Randgold. Kibali is accounted for as an equity method investment on the basis that the joint venture partners that have joint control have rights to the net assets of the joint venture. |
| b. | Further information on these non-GAAP financial measures, including detailed reconciliations, is included on pages 44 to 56 of this MD&A. |
| c. | EBITDA represents income plus depreciation. Depreciation expense is $40 million and $107 million for Q3 2026 and YTD 2026, respectively (Q2 2026: $34 million, Q3 2025: $38 million, YTD 2025: $102 million). |
| d. | Represents EBITDA divided by revenue. |
Safety and Environment
| For the three months ended | ||||||||
| 9/30/26 | 6/30/26 | |||||||
| LTI |
1 | 0 | ||||||
| LTIFR3 |
0.17 | 0.00 | ||||||
| TRIFR3 |
0.50 | 0.35 | ||||||
| Class 14 environmental incidents |
0 | 0 | ||||||
Financial Results
Q3 2026 compared to Q2 2026
Gold production for Q3 2026 was 20% higher than Q2 2026, reflecting improved mine to mill operational performance and higher grades processed. Higher underground mining rates delivered 18% more ore at a 10% higher grade compared to Q2 2026, materially increasing the average grade fed to the processing plant. Open pit mining volumes also increased, providing operational flexibility through stockpile management and supporting a sustained increase in throughput.
COS/oz2 and TCC/oz1 for Q3 2026 were 17% and 20% lower, respectively, primarily reflecting higher grades processed, increased recovery and lower royalty costs due to a lower realized gold price1. For Q3 2026, AISC/oz1 was 16% lower than in Q2 2026, primarily reflecting the lower
TCC/oz1 partially offset by higher minesite sustaining capital expenditures1.
Capital expenditures for Q3 2026 were 8% higher than Q2 2026, driven by higher minesite sustaining capital expenditures1 partially offset by marginally lower project capital expenditures1. The higher minesite sustaining capital expenditures1 were associated with increased capitalized stripping activity in the open pits.
Q3 2026 compared to Q3 2025
Gold production for Q3 2026 was 6% higher than Q3 2025, driven by higher grades processed, resulting from an improved blended feed grade and increased recovery. The stronger blended grade was supported by the strong performance from the underground, which delivered 16% more ore tonnes and enhanced operational flexibility.
COS/oz2 and TCC/oz1 for Q3 2026 were 5% and 8% higher, respectively, compared to Q3 2025, driven by increased labour costs and diesel prices, driving higher unit costs coupled with higher royalties resulting from a higher realized gold price1. For Q3 2026, AISC/oz1 was 11% higher than Q3 2025, driven by higher TCC/oz1 and increased minesite sustaining capital expenditures1.
Capital expenditures for Q3 2026 were 67% higher than Q3 2025, driven by higher minesite sustaining capital
| BARRICK THIRD QUARTER 2026 | 21 | MANAGEMENT’S DISCUSSION AND ANALYSIS |
| OVERVIEW |
OPERATING PERFORMANCE |
FUTURE GROWTH |
REVIEW OF FINANCIAL RESULTS |
OTHER INFORMATION & NON-GAAP RECONCILIATIONS |
FINANCIAL STATEMENTS | |||||
expenditures1 in order to expand underground haulage capacity, increased waste stripping activity as we enter higher strip ratio pits, as well as increased project capital expenditures1 related to the development of new underground mining areas and construction of the Pamao TSF project.
YTD 2026 compared to YTD 2025
Gold production for YTD 2026 was in line with YTD 2025, with higher feed grade and recovery compensating for the slightly lower throughput.
COS/oz2 and TCC/oz1 for YTD 2026 were 12% and 16% higher, respectively, than YTD 2025. The increase was driven by higher labour costs and diesel prices, and increased royalty costs resulting from a higher realized gold price1.
For YTD 2026, AISC/oz1 was 18% higher compared to YTD 2025, mainly due to the higher TCC/oz1, and higher minesite sustaining capital expenditures1.
Capital expenditures in YTD 2026 were 61% higher than YTD 2025, mainly due to an increase in project capital expenditures1 related to the construction of the Pamao TSF project and the development of new underground mining areas, as well as increased minesite sustaining capital expenditures1 resulting from increased capitalized waste stripping costs as we move more waste to unlock the ore from the open pits.
| BARRICK THIRD QUARTER 2026 | 22 | MANAGEMENT’S DISCUSSION AND ANALYSIS |
| OVERVIEW |
OPERATING PERFORMANCE |
FUTURE GROWTH |
REVIEW OF FINANCIAL RESULTS |
OTHER INFORMATION & NON-GAAP RECONCILIATIONS |
FINANCIAL STATEMENTS | |||||
North Mara (84%)a, Tanzania
Summary of Operating and Financial Data
| For the three months ended | For the nine months ended | |||||||||||||||||||||||||||
| 9/30/26 | 6/30/26 | % Change | 9/30/25 | % Change | 9/30/26 | 9/30/25 | % Change | |||||||||||||||||||||
| Total tonnes mined (000s) |
5,212 | 5,043 | 3 % |
4,189 | 24 % |
14,207 | 11,303 | 26 % | ||||||||||||||||||||
| Open pit ore |
249 | 109 | 128 % | 0 | n/a | 365 | 1,545 | (76)% | ||||||||||||||||||||
| Open pit waste |
4,634 | 4,628 | 0 % | 3,721 | 25 % | 12,861 | 8,517 | 51 % | ||||||||||||||||||||
| Underground |
329 | 306 | 8 % | 468 | (30)% | 981 | 1,241 | (21)% | ||||||||||||||||||||
| Average grade (grams/tonne) |
||||||||||||||||||||||||||||
| Open pit mined |
2.46 | 1.29 | 91 % | n/a | n/a | 2.08 | 2.00 | 4 % | ||||||||||||||||||||
| Underground mined |
2.51 | 2.65 | (5)% | 4.09 | (39)% | 2.60 | 3.87 | (33)% | ||||||||||||||||||||
| Processed |
2.07 | 1.80 | 15 % | 2.99 | (31)% | 1.89 | 3.23 | (41)% | ||||||||||||||||||||
| Ore tonnes processed (000s) |
668 | 688 | (3)% |
729 | (8)% |
2,020 | 2,099 | (4)% | ||||||||||||||||||||
| Recovery rate |
86 % | 85 % | 1 % | 89 % | (3)% | 85 % | 88 % | (3)% | ||||||||||||||||||||
| Gold produced (000s oz) |
37 | 35 | 6 % | 64 | (42)% | 105 | 193 | (46)% | ||||||||||||||||||||
| Gold sold (000s oz) |
38 | 37 | 3 % | 72 | (47)% | 111 | 190 | (42)% | ||||||||||||||||||||
| Revenue ($ millions) |
166 | 163 | 2 % | 260 | (36)% | 512 | 626 | (18)% | ||||||||||||||||||||
| Cost of sales ($ millions) |
108 | 99 | 9 % | 108 | 0 % | 290 | 265 | 9 % | ||||||||||||||||||||
| Income ($ millions) |
45 | 61 | (26)% | 149 | (70)% | 203 | 346 | (41)% | ||||||||||||||||||||
| EBITDA ($ millions)b,c |
66 | 80 | (18)% | 178 | (63)% | 261 | 409 | (36)% | ||||||||||||||||||||
| EBITDA margind |
40 % | 49 % | (18)% | 68 % | (41)% | 51 % | 65 % | (22)% | ||||||||||||||||||||
| Capital expenditures ($ millions) |
45 | 53 | (15)% | 41 | 10 % | 142 | 118 | 20 % | ||||||||||||||||||||
| Minesite sustainingb |
27 | 14 | 93 % | 13 | 108 % | 48 | 40 | 20 % | ||||||||||||||||||||
| Projectb |
18 | 39 | (54)% | 28 | (36)% | 94 | 78 | 21 % | ||||||||||||||||||||
| COS ($/oz) |
2,830 | 2,736 | 3 % | 1,497 | 89 % | 2,622 | 1,393 | 88 % | ||||||||||||||||||||
| TCC ($/oz)b |
2,260 | 2,164 | 4 % | 1,069 | 111 % | 2,064 | 1,040 | 98 % | ||||||||||||||||||||
| AISC ($/oz)b |
2,972 | 2,577 | 15 % | 1,268 | 134 % | 2,521 | 1,270 | 99 % | ||||||||||||||||||||
| a. | Barrick owns 84% of North Mara, with the GoT owning 16%. North Mara is accounted for as a subsidiary with a 16% non-controlling interest on the basis that Barrick controls the asset. The results in the table and the discussion that follows are based on our 84% share. |
| b. | Further information on these non-GAAP financial measures, including detailed reconciliations, is included on pages 44 to 56 of this MD&A. |
| c. | EBITDA represents income plus depreciation. Depreciation expense is $21 million and $58 million for Q3 2026 and YTD 2026, respectively (Q2 2026: $19 million, Q3 2025: $29 million, YTD 2025: $63 million). |
| d. | Represents EBITDA divided by revenue. |
Safety and Environment
| For the three months ended | ||||||||
| 9/30/26 | 6/30/26 | |||||||
| LTI |
1 | 0 | ||||||
| LTIFR3 |
0.31 | 0.00 | ||||||
| TRIFR3 |
0.31 | 0.47 | ||||||
| Class 14 environmental incidents |
0 | 0 | ||||||
Financial Results
Q3 2026 compared to Q2 2026
In Q3 2026, the focus at North Mara was on open pit mining activity centered around waste material movement in the Gokona pit while addressing delayed delivery of ore from the underground operations. Gold production in Q3 2026 was 6% higher than Q2 2026, mainly driven by an increase in grades processed through the plant, together with higher open pit tonnes.
COS/oz2 and TCC/oz1 for Q3 2026 were 3% and 4% higher, respectively, compared to Q2 2026, mainly due to the impact of additional contractor costs supporting the increased open pit activity. AISC/oz1 in Q3 2026 was 15% higher than Q2 2026, mainly due to higher TCC/oz1 and higher minesite sustaining capital expenditures1.
Capital expenditures for Q3 2026 were 15% lower compared to Q2 2026 mainly driven by lower project capital
expenditures1 related to Gokona pre-stripping activities coming to an end. This was partially offset by higher waste stripping, which was driven by higher unit costs, and higher underground development costs resulting from increased development meters.
Q3 2026 compared to Q3 2025
Gold production for Q3 2026 was 42% lower compared to Q3 2025 mainly due to lower grades processed, lower throughput and lower recoveries, together with a plant shutdown which was used to execute on planned and unplanned maintenance. Grade was impacted by underground sequencing, while lower throughput was driven by local grid instability. We are mitigating the grid instability through multiple projects, including STATCOM installation which is expected to be completed mid next year.
COS/oz2 and TCC/oz1 for Q3 2026 were 89% and 111% higher, respectively, compared to Q3 2025, mainly due to the lower grades processed, combined with higher diesel prices and higher royalties associated with the higher realized gold price1. AISC/oz1 in Q3 2026 was 134% higher than Q3 2025, mainly due to the higher TCC/oz1 and higher minesite sustaining capital expenditures1 than Q3 2025.
For Q3 2026, capital expenditures increased by 10% compared to Q3 2025, mainly due to higher capitalized waste stripping and higher underground development.
| BARRICK THIRD QUARTER 2026 | 23 | MANAGEMENT’S DISCUSSION AND ANALYSIS |
| OVERVIEW |
OPERATING PERFORMANCE |
FUTURE GROWTH |
REVIEW OF FINANCIAL RESULTS |
OTHER INFORMATION & NON-GAAP RECONCILIATIONS |
FINANCIAL STATEMENTS | |||||
YTD 2026 compared to YTD 2025
For YTD 2026, gold production was 46% lower than YTD 2025, as a result of a reduction in underground volumes and grade delivered. The decline in underground performance was primarily driven by grid power instability, which also impacted runtime of the plant. In Q4 2026, we expect to increase mining of higher-grade open pit material. As explained above, projects are underway to address the power instability.
COS/oz2 and TCC/oz1 for YTD 2026 were 88% and 98% higher, respectively, than YTD 2025, mainly driven by the impact of lower grades processed, combined with higher diesel prices and higher royalties associated with the higher realized gold price1. AISC/oz1 for YTD 2026 was 99% higher than YTD 2025, reflecting the increase in TCC/oz1, combined with higher minesite sustaining capital expenditures1 on a per ounce basis.
For YTD 2026, capital expenditures increased by 20% compared to YTD 2025, mainly driven by higher project capital expenditures1 reflecting the ramp-up of the Gokona open pit and second crushing line.
| BARRICK THIRD QUARTER 2026 | 24 | MANAGEMENT’S DISCUSSION AND ANALYSIS |
| OVERVIEW |
OPERATING PERFORMANCE |
FUTURE GROWTH |
REVIEW OF FINANCIAL RESULTS |
OTHER INFORMATION & NON-GAAP RECONCILIATIONS |
FINANCIAL STATEMENTS | |||||
Bulyanhulu (84%)a, Tanzania
Summary of Operating and Financial Data
| For the three months ended | For the nine months ended | |||||||||||||||||||||||||||
| 9/30/26 | 6/30/26 | % Change | 9/30/25 | % Change | 9/30/26 | 9/30/25 | % Change | |||||||||||||||||||||
| Underground tonnes mined (000s) |
439 | 401 | 9 % | 416 | 6 % | 1,189 | 1,097 | 8 % | ||||||||||||||||||||
| Average grade (grams/tonne) |
||||||||||||||||||||||||||||
| Underground mined |
5.75 | 5.95 | (3)% | 4.95 | 16 % | 5.74 | 5.16 | 11 % | ||||||||||||||||||||
| Processed |
6.12 | 6.03 | 1 % | 4.87 | 26 % | 5.80 | 5.16 | 12 % | ||||||||||||||||||||
| Ore tonnes processed (000s) |
248 | 236 | 5 % | 255 | (3)% | 688 | 723 | (5)% | ||||||||||||||||||||
| Recovery rate |
96 % | 97 % | (1)% | 94 % | 2 % | 96 % | 94 % | 2 % | ||||||||||||||||||||
| Gold produced (000s oz) |
47 | 44 | 7 % | 38 | 24 % | 124 | 113 | 10 % | ||||||||||||||||||||
| Gold sold (000s oz) |
45 | 45 | 0 % | 40 | 13 % | 126 | 109 | 16 % | ||||||||||||||||||||
| Revenue ($ millions) |
198 | 198 | 0 % | 144 | 38 % | 583 | 379 | 54 % | ||||||||||||||||||||
| Cost of sales ($ millions) |
79 | 82 | (4)% | 73 | 8 % | 234 | 191 | 23 % | ||||||||||||||||||||
| Income ($ millions) |
115 | 116 | (1)% | 69 | 67 % | 343 | 183 | 87 % | ||||||||||||||||||||
| EBITDA ($ millions)b,c |
132 | 133 | (1)% | 84 | 57 % | 392 | 223 | 76 % | ||||||||||||||||||||
| EBITDA margind |
67 % | 67 % | 0 % | 58 % | 16 % | 67 % | 59 % | 14 % | ||||||||||||||||||||
| Capital expenditures ($ millions) |
45 | 43 | 5 % | 32 | 41 % | 124 | 103 | 20 % | ||||||||||||||||||||
| Minesite sustainingb |
28 | 23 | 22 % | 18 | 56 % | 70 | 63 | 11 % | ||||||||||||||||||||
| Projectb |
17 | 20 | (15)% | 14 | 21 % | 54 | 40 | 35 % | ||||||||||||||||||||
| COS ($/oz) |
1,751 | 1,854 | (6)% | 1,817 | (4)% | 1,861 | 1,754 | 6 % | ||||||||||||||||||||
| TCC ($/oz)b |
1,189 | 1,249 | (5)% | 1,334 | (11)% | 1,265 | 1,250 | 1 % | ||||||||||||||||||||
| AISC ($/oz)b |
1,813 | 1,748 | 4 % | 1,790 | 1 % | 1,821 | 1,831 | (1)% | ||||||||||||||||||||
| a. | Barrick owns 84% of Bulyanhulu, with the GoT owning 16%. Bulyanhulu is accounted for as a subsidiary with a 16% non-controlling interest on the basis that Barrick controls the asset. The results in the table and the discussion that follows are based on our 84% share. |
| b. | Further information on these non-GAAP financial measures, including detailed reconciliations, is included on pages 44 to 56 of this MD&A. |
| c. | EBITDA represents income plus depreciation. Depreciation expense is $17 million and $49 million for Q3 2026 and YTD 2026, respectively (Q2 2026: $17 million, Q3 2025: $15 million, YTD 2025: $40 million). |
| d. | Represents EBITDA divided by revenue. |
Safety and Environment
| For the three months ended | ||||||||
| 9/30/26 | 6/30/26 | |||||||
| LTI |
0 | 0 | ||||||
| LTIFR3 |
0.00 | 0.00 | ||||||
| TRIFR3 |
0.46 | 0.38 | ||||||
| Class 14 environmental incidents |
0 | 0 | ||||||
Financial Results
Q3 2026 compared to Q2 2026
Q3 2026 production was 7% higher than Q2 2026 driven by higher grades processed and increased throughput. The Upper West development continues to advance well and has brought flexibility to the mining operations.
COS/oz2 and TCC/oz1 in Q3 2026 were 6% and 5% lower than Q2 2026, respectively, due to the impact of the higher grades processed and lower unit costs in the underground. AISC/oz1 in Q3 2026 was 4% higher than Q2 2026, primarily due to higher minesite sustaining capital expenditures1 related to a catch up post mining commission approval of key sustaining projects partially offset by the lower TCC/oz1.
Capital expenditures in Q3 2026 were 5% higher compared to Q2 2026, reflecting higher minesite sustaining capital expenditures1 driven by the timing of spend on key projects.
Q3 2026 compared to Q3 2025
For Q3 2026, gold production was 24% higher than Q3 2025 mainly driven by higher grades processed and due to strong mining performance in the form of higher volumes, development and grade.
COS/oz2 and TCC/oz1 for Q3 2026 were 4% and 11% lower, respectively, compared to Q3 2025, due to the higher grades processed, partially offset by higher royalties associated with the higher realized gold price1. AISC/oz1 in Q3 2026 was 1% higher than Q3 2025, due to higher sustaining capital spend on a per ounce basis offset by lower TCC/oz1.
For Q3 2026, capital expenditures were 41% higher than Q3 2025, mainly due to higher minesite sustaining capital expenditures1 related to timing of spend on key projects.
YTD 2026 compared to YTD 2025
For YTD 2026, gold production was 10% higher than YTD 2025, due to higher grades processed, partially offset by lower throughput.
COS/oz2 and TCC/oz1 in YTD 2026 were 6% and 1% higher, respectively, than YTD 2025, due to higher royalties associated with the higher realized gold price1 partially offset by higher grades processed. AISC/oz1 for YTD 2026 was 1% lower than YTD 2025, mainly due to lower minesite sustaining capital expenditures on a per ounce basis, partially offset by higher TCC/oz1.
For YTD 2026, capital expenditures increased by 20% compared to YTD 2025, mainly due to higher project capital expenditures1 related to the Upper West project.
| BARRICK THIRD QUARTER 2026 | 25 | MANAGEMENT’S DISCUSSION AND ANALYSIS |
| OVERVIEW |
OPERATING PERFORMANCE |
FUTURE GROWTH |
REVIEW OF FINANCIAL RESULTS |
OTHER INFORMATION & NON-GAAP RECONCILIATIONS |
FINANCIAL STATEMENTS | |||||
Other Mines - Gold
Summary of Operating and Financial Data
| For the three months ended | ||||||||||||||||||||||||||||||||||||||||
| 9/30/26 | 6/30/26 | |||||||||||||||||||||||||||||||||||||||
| Gold produced (000s oz) |
COS ($/oz) |
TCC ($/oz)a |
AISC ($/oz)a |
Capital Expend- ituresb |
Gold produced (000s oz) |
COS ($/oz) |
TCC ($/oz)a |
AISC ($/oz)a |
Capital Expend- ituresb |
|||||||||||||||||||||||||||||||
| Phoenix (61.5%) |
25 | 2,460 | 506 | 814 | 6 | 26 | 2,343 | 640 | 917 | 6 | ||||||||||||||||||||||||||||||
| Veladero (50%) |
27 | 2,606 | 1,486 | 1,788 | 14 | 36 | 2,098 | 1,176 | 1,487 | 20 | ||||||||||||||||||||||||||||||
| Porgera (24.5%) |
15 | 1,837 | 1,467 | 2,169 | 12 | 23 | 1,899 | 1,385 | 1,811 | 14 | ||||||||||||||||||||||||||||||
| a. | Further information on these non-GAAP financial measures, including detailed reconciliations, is included on pages 44 to 56 of this MD&A. |
| b. | Includes both minesite sustaining and project capital expenditures1. |
Phoenix (61.5%), Nevada, USA
Gold production for Phoenix in Q3 2026 was 4% lower than Q2 2026 due to lower throughput and grades mined. COS/ oz2 was 5% higher due to lower fixed cost dilution driven by lower sales volume compared to Q2 2026 while TCC/oz1 in Q3 2026 was 21% lower, mainly due to higher costs allocated to by-products. In Q3 2026, AISC/oz1 decreased by 11% compared to Q2 2026 due to lower TCC/oz1 partially offset by higher minesite sustaining capital expenditures1 on a per ounce basis.
Veladero (50%), Argentina
Gold production for Veladero in Q3 2026 was 25% lower compared to Q2 2026 driven by lower throughput and fewer recoverable ounces placed on the leach pad, as severe winter storms resulted in the temporary suspension of operations on multiple occasions during the quarter. COS/ oz2 and TCC/oz1 in Q3 2026 were 24% and 26% higher, respectively, mainly driven by lower fixed cost dilution as a result of lower sales volume and lower capitalized waste stripping, combined with higher labor costs and road-clearing costs associated with the adverse weather conditions. AISC/oz1 increased by 20% due to higher TCC/ oz1, partially offset by lower minesite sustaining capital expenditures1 due to lower stripping and the timing of expenditure.
Porgera (24.5%), Papua New Guinea
Gold production in Q3 2026 was 35% lower than Q2 2026 driven by lower throughput as water shortages associated with the El Niño weather event reduced processing plant operating rates. This was partially offset by higher grades processed. COS/oz2 was 3% lower than Q2 2026 due to lower depreciation partially offset by higher TCC/oz1. TCC/ oz1 increased by 6% compared to Q2 2026, mainly due to lower fixed cost dilution as a result of lower sales volume together with higher transport and freight costs. AISC/oz1 increased by 20% due to higher TCC/oz1 and higher minesite sustaining capital expenditures1 related to capitalized waste stripping and underground development.
| BARRICK THIRD QUARTER 2026 | 26 | MANAGEMENT’S DISCUSSION AND ANALYSIS |
| OVERVIEW |
OPERATING PERFORMANCE |
FUTURE GROWTH |
REVIEW OF FINANCIAL RESULTS |
OTHER INFORMATION & NON-GAAP RECONCILIATIONS |
FINANCIAL STATEMENTS | |||||
Lumwana (100%), Zambia
Summary of Operating and Financial Data
| For the three months ended | For the nine months ended | |||||||||||||||||||||||||||
| 9/30/26 | 6/30/26 | % Change | 9/30/25 | % Change | 9/30/26 | 9/30/25 | % Change | |||||||||||||||||||||
| Open pit tonnes mined (000s) |
47,397 | 41,542 | 14 % | 41,678 | 14 % | 120,003 | 109,469 | 10 % | ||||||||||||||||||||
| Open pit ore |
6,457 | 6,164 | 5 % | 10,505 | (39)% | 18,405 | 24,176 | (24)% | ||||||||||||||||||||
| Open pit waste |
40,940 | 35,378 | 16 % | 31,173 | 31 % | 101,598 | 85,293 | 19 % | ||||||||||||||||||||
| Average grade |
||||||||||||||||||||||||||||
| Open pit mined |
0.62 % | 0.72 % | (14)% | 0.58 % | 7 % | 0.64 % | 0.60 % | 7 % | ||||||||||||||||||||
| Processed |
0.54 % | 0.64 % | (16)% | 0.66 % | (18)% | 0.59 % | 0.64 % | (8)% | ||||||||||||||||||||
| Tonnes processed (000s) |
6,947 | 6,946 | 0 % | 6,392 | 9 % | 19,804 | 18,711 | 6 % | ||||||||||||||||||||
| Recovery rate |
92 % | 91 % | 1 % | 92 % | 0 % | 92 % | 92 % | 0 % | ||||||||||||||||||||
| Copper produced (kt) |
35 | 41 | (15)% | 38 | (8)% | 108 | 109 | (1)% | ||||||||||||||||||||
| Copper sold (kt) |
35 | 40 | (13)% | 37 | (5)% | 105 | 110 | (5)% | ||||||||||||||||||||
| Revenue ($ millions) |
465 | 505 | (8)% | 322 | 44 % | 1,317 | 967 | 36 % | ||||||||||||||||||||
| Cost of sales ($ millions) |
268 | 280 | (4)% | 193 | 39 % | 765 | 595 | 29 % | ||||||||||||||||||||
| Income ($ millions) |
192 | 222 | (14)% | 124 | 55 % | 538 | 363 | 48 % | ||||||||||||||||||||
| EBITDA ($ millions)a,b |
257 | 293 | (12)% | 192 | 34 % | 717 | 560 | 28 % | ||||||||||||||||||||
| EBITDA marginc |
55 % | 58 % | (5)% | 60 % | (8)% | 54 % | 58 % | (7)% | ||||||||||||||||||||
| Capital expenditures ($ millions)d |
333 | 242 | 38 % | 200 | 67 % | 730 | 421 | 73 % | ||||||||||||||||||||
| Minesite sustaininga |
110 | 87 | 26 % | 78 | 41 % | 242 | 206 | 17 % | ||||||||||||||||||||
| Projecta |
212 | 146 | 45 % | 119 | 78 % | 462 | 211 | 119 % | ||||||||||||||||||||
| COS ($/lb) |
3.49 | 3.14 | 11 % | 2.32 | 50 % | 3.31 | 2.44 | 36 % | ||||||||||||||||||||
| C1 cash costs ($/lb)a |
2.68 | 2.35 | 14 % | 1.68 | 60 % | 2.55 | 1.81 | 41 % | ||||||||||||||||||||
| AISC ($/lb)a |
4.61 | 3.83 | 20 % | 2.93 | 57 % | 4.09 | 2.97 | 38 % | ||||||||||||||||||||
| a. | Further information on these non-GAAP financial measures, including detailed reconciliations, is included on pages 44 to 56 of this MD&A. |
| b. | EBITDA represents income plus depreciation. Depreciation expense is $65 million and $179 million for Q3 2026 and YTD 2026, respectively (Q2 2026: $71 million, Q3 2025: $68 million, YTD 2025: $197 million). |
| c. | Represents EBITDA divided by revenue. |
| d. | Includes capitalized interest. |
Safety and Environment
| For the three months ended | ||||||||
| 9/30/26 | 6/30/26 | |||||||
| LTI |
0 | 2 | ||||||
| LTIFR3 |
0.00 | 0.29 | ||||||
| TRIFR3 |
0.53 | 0.86 | ||||||
| Class 14 environmental incidents |
0 | 0 | ||||||
Financial Results
Q3 2026 compared to Q2 2026
Copper production in Q3 2026 was 15% lower than in Q2 2026 mainly due to lower grades processed driven by the rescheduling of the planned mill reline into September which deferred the processing of high grade ore into October.
COS/lb2 and C1 cash costs/lb1 were 11% and 14% higher, respectively, than Q2 2026. This is predominantly due to higher diesel prices which impacted mining costs. In addition, increased maintenance costs were incurred on preventative maintenance to improve fleet availabilities and address premature equipment failures. In Q3 2026, AISC/ lb1 was 20% higher than Q2 2026, driven by the higher C1 cash costs/lb1 mentioned above as well as elevated royalty costs from a higher realized copper price1 in Q3 and higher minesite sustaining capital expenditures1.
Capital expenditures for Q3 2026 were 38% higher than Q2 2026. This was attributable to a higher spend on the Super Pit Expansion project as per the project
execution plan with increased spending on fleet, EPCM costs, SMPP works (wet and dry plant) as well as cabling. Minesite sustaining capital expenditures1 were 26% higher than Q2 2026 driven by higher stripping costs which were attributable to the higher diesel prices as discussed above.
Q3 2026 compared to Q3 2025
Copper production for Q3 2026 was 8% lower than Q3 2025, mainly due to lower grades processed driven by the rescheduling of the planned mill reline into September which deferred the processing of high grade ore into October. This was offset by a higher throughput rate attributable to the improved power stability and the addition of the new pebble crusher.
COS/lb2 and C1 cash costs/lb1 for Q3 2026 increased by 50% and 60%, respectively, compared to Q3 2025, mainly due to the higher diesel prices as well as the local currency appreciation driving higher labour costs. For Q3 2026, AISC/lb1 was 57% higher than Q3 2025 due to increased C1 cash costs/lb1 as well as higher royalties from higher realized copper prices and higher minesite sustaining capital expenditures1.
Capital expenditures for Q3 2026 were 67% higher than Q3 2025, mainly due to increased project capital expenditures1 on the Super Pit Expansion project. Minesite sustaining capital expenditures1 were 41% higher than Q3 2025 mainly driven by higher stripping costs caused by the same C1 cash cost pressures referred to above (diesel and currency appreciation).
| BARRICK THIRD QUARTER 2026 | 27 | MANAGEMENT’S DISCUSSION AND ANALYSIS |
| OVERVIEW |
OPERATING PERFORMANCE |
FUTURE GROWTH |
REVIEW OF FINANCIAL RESULTS |
OTHER INFORMATION & NON-GAAP RECONCILIATIONS |
FINANCIAL STATEMENTS | |||||
YTD 2026 compared to YTD 2025
Copper production for YTD 2026 was almost in line with YTD 2025 with lower grades processed largely offset by higher throughput.
COS/lb2 and C1 cash costs/lb1 for YTD 2026 increased by 36% and 41%, respectively, compared to YTD 2025, mainly as a result of higher diesel prices and local currency appreciation as discussed above. For YTD 2026, AISC/lb1 increased by 38% compared to YTD 2025, mainly due to higher C1 cash costs/lb1 and higher royalty costs driven by the higher realized copper price1.
Capital expenditures for YTD 2026 were 73% higher than YTD 2025 due to higher project capital expenditures1 on the Super Pit Expansion project, as described above (2026 and 2027 are expected to have the highest spend profiles across the four year project execution period).
| BARRICK THIRD QUARTER 2026 | 28 | MANAGEMENT’S DISCUSSION AND ANALYSIS |
| OVERVIEW |
OPERATING PERFORMANCE |
FUTURE GROWTH |
REVIEW OF FINANCIAL RESULTS |
OTHER INFORMATION & NON-GAAP RECONCILIATIONS |
FINANCIAL STATEMENTS | |||||
Other Mines - Copper
Summary of Operating and Financial Data
| For the three months ended | ||||||||||||||||||||||||||||||||||||||||
| 9/30/26 | 6/30/26 | |||||||||||||||||||||||||||||||||||||||
| Copper production (kt) |
COS ($/lb) |
C1 cash costs ($/lb)a |
AISC ($/lb)a |
Capital Expend- ituresb |
Copper production (kt) |
COS ($/lb) |
C1 cash costs ($/lb)a |
AISC ($/lb)a |
Capital Expend- ituresb |
|||||||||||||||||||||||||||||||
| Zaldívar (50%) |
7 | 5.92 | 4.59 | 6.49 | 82 | 9 | 4.89 | 3.71 | 5.50 | 53 | ||||||||||||||||||||||||||||||
| Jabal Sayid (50%) |
8 | 2.11 | 1.29 | 1.43 | 3 | 6 | 2.63 | 1.08 | 1.42 | 4 | ||||||||||||||||||||||||||||||
| a. | Further information on these non-GAAP financial measures, including detailed reconciliations, is included on pages 44 to 56 of this MD&A. |
| b. | Includes both minesite sustaining and project capital expenditures1. |
Zaldívar (50%), Chile
Copper production for Zaldívar in Q3 2026 was 22% lower than Q2 2026, driven by lower throughput and grade, partially offset by higher recovery. COS/lb2 and C1 cash costs/lb1 were 21% and 24% higher, respectively, than Q2 2026, mainly due to the conclusion of a three-year labour agreement during the period, combined with lower sales volumes resulting in lower fixed cost dilution. AISC/lb1 in Q3 2026 was 18% higher compared to Q2 2026, mainly due to the higher C1 cash costs/lb1 and higher minesite sustaining capital expenditures1.
Our investment in this asset, of which we are not the operator, continues to be a non-core part of our portfolio.
Jabal Sayid (50%), Saudi Arabia
Jabal Sayid’s copper production in Q3 2026 was 33% higher than Q2 2026 driven by higher grades mined and processed coupled with marginally higher recoveries. The higher grades were due to the mining sequence change that resulted in the deferral of higher grade stopes from Q2 into Q3 as previously disclosed. COS/lb2 for Q3 2026 was 20% lower than Q2 2026 driven by the higher grades processed. C1 cash costs/lb1 increased by 19% as delays in concentrate shipments resulted in lower costs allocated to by-products during the quarter. AISC/lb1 in Q3 2026 was broadly in line with Q2 2026, as higher C1 cash costs/lb1 were largely offset by lower sustaining capital expenditures1.
| BARRICK THIRD QUARTER 2026 | 29 | MANAGEMENT’S DISCUSSION AND ANALYSIS |
| OVERVIEW | OPERATING PERFORMANCE |
FUTURE GROWTH |
REVIEW OF FINANCIAL RESULTS |
OTHER INFORMATION & NON-GAAP RECONCILIATIONS |
FINANCIAL STATEMENTS | |||||
Future Growth
Fourmile, Nevada, USA
Fourmile is a 100% Barrick-owned asset in Nevada, located adjacent to Goldrush, that has the potential to be a Tier One Gold Asset5. In Q3 2026 Barrick announced that an agreement had been reached with Newmont to contribute Fourmile into the NGM joint venture. Barrick continues advanced studies to support ongoing resource development with expected completion in 2029.
Drilling activities continued in Q3 2026, and step-out drilling intersected significant intercepts outside of the current resource. Infill and resource definition drilling remained a priority during the quarter to support the ongoing PFS. Drilling will focus on the southern zones ahead of the planned winter drilling program.
The Fourmile studies continued to advance ventilation, mine design, paste backfill, geotechnical, hydrogeology, and metallurgical workstreams throughout Q3 2026.
Early works to support the Bullion Hill Decline are underway, with a ramp up expected in Q4 2026 pending permits. Barminco mobilization is underway in preparation for the start of decline development.
Across drilling, studies, and capital activities, we spent $53 million in Q3 2026 and $123 million year to date. Total spend for 2026 includes an anticipated drilling spend of $150 to $160 million together with ~$15 million of spend on studies work (both expensed) and ~$30 million on construction and decline commencement (capital). This phase of the project has been approved with an estimated total cost of $360 to $430 million extending through mid-2030.
Goldrush Project, Nevada, USA6
Goldrush, which is included within Cortez, is expected to be a long-life underground mine with anticipated annual production in excess of 400,000 ounces of gold per year (100% basis) once in full production by 2028.
In Q3 2026, execution planning continued for key infrastructure projects. Ventilation modeling and optimization for the third surface ventilation shaft was completed in Q2 2026 and geotechnical drilling was completed in Q3 2026 to validate shaft location and provide contractual details for shaft sinking contract negotiations.
Detailed engineering for the underground paste backfill plant progressed and major equipment procurement commenced in Q3 2026. The surface and underground mixing plant locations were finalized and development underground is planned to start early in 2027. Contract negotiations for an EPCM agreement were concluded in Q3 2026.
The portal pad access road widening started and is expected to be completed in Q4 2026 to improve traffic flow and allow for optimized ore hauling to mill staging stockpile pads near Cortez Hills Underground.
Construction of the second surface ventilation shaft progressed slower than scheduled due to lost time associated with a safety incident and stand down although the construction remains on track and is expected to be completed early in Q4 2026. The main underground fans are scheduled to be commissioned in early 2027.
Goldrush completed the underground water filtration system design, finished development of the top level of the system, and plans to mobilize contractors in Q4 2026 to construct sumps and pump foundations for the two-
stage water treatment system. Completion of an additional cement storage silo will support mining operations, while trailers have been secured and will expand existing dry and office buildings, and utility connections (scheduled for Q4 2026).
As of September 30, 2026, project spend was $531 million on a 100% basis (including $14 million in Q3 2026) inclusive of the exploration declines. This capital spent to date, together with the remaining expected pre-production capital, is in line with the approximate $1 billion initial capital estimate for the Goldrush project (100% basis).
Ren, Nevada, USA7
Ren is a new ore deposit at Goldstrike Underground and a key expansion project at Carlin. Located north of Goldstrike Underground’s Meikle and Banshee deposits, Ren is anticipated to produce an average of 140,000 ounces per year (contained ounces, 100% basis) once in full production in 2027.
To develop the deposit, the existing exploration drift has been duplicated, allowing for increased ventilation and secondary egress into the working area. Additional exploration drilling platforms have been constructed from the duplicate drift to support further drilling for both existing resource conversion and further deposit growth. Work has been started on installing paste backfilling infrastructure from Meikle to the new stope locations.
To support production mining of the deposit, an additional set of twin declines will be driven from the Betze-Post West Barrel open pit layback, extending to the north with the intent to provide life of mine ventilation and a direct path for material to be hauled and hoisted out via the existing Meikle Headframe. To complete the project, a ventilation shaft will be sunk 550 meters to serve as an exhaust raise and utility conduit for mining the orebody.
For Q3 2026, resource conversion drilling continued, with approximately 13,300 meters of indicated conversion drilling and 6,400 meters of inventory conversion drilling completed year-to-date. Results continue to support the geological interpretation of discrete mineralized domains across JB North and JB South, with strong intercepts within the existing gold domains. Exploration is increasingly focused on growth opportunities along the Corona corridor and the newly identified Medusa mineralization. Resource modeling is underway, with an updated estimate expected in Q4 2026. Work at the West Barrel declines continued with 735 meters of decline development. The Ren ventilation shaft completed sinking infrastructure commissioning and started ramp up of the main sinking phase, reaching a sinking depth of 215 meters below collar. Production sinking commenced in early Q2 2026 with expected fan commissioning completion and ventilation benefit to be realized in Q3 2027.
As of September 30, 2026, project spend was $246 million (including $28 million in Q3 2026) out of an estimated capital cost of $410 to $470 million (100% basis).
Autonomous Haulage Program, Nevada, USA
The Autonomous Haulage Program is a strategic NGM initiative to improve safety, productivity, and operating consistency. This will be a phased deployment, starting at Cortez and expanding to other NGM operations as fleet, infrastructure, and site readiness milestones are met.
| BARRICK THIRD QUARTER 2026 | 30 | MANAGEMENT’S DISCUSSION AND ANALYSIS |
| OVERVIEW | OPERATING PERFORMANCE |
FUTURE GROWTH |
REVIEW OF FINANCIAL RESULTS |
OTHER INFORMATION & NON-GAAP RECONCILIATIONS |
FINANCIAL STATEMENTS | |||||
At Cortez, the retrofit of 23 haul trucks was completed in May 2026. The transition to the new Fleet Management System for the primary production fleet has been completed, and the fleet is running in satellite pits for production and training with over 11 million tonnes hauled to date. The transition to the new Fleet Management System is expected to be completed for all Support Equipment in Q4 2026 ahead of the H1 2027 site-wide rollout.
At Carlin, we plan to undertake 40 truck retrofits with the work having commenced in Q2 2026, and 9 of the 40 trucks have been converted to date. Fleet conversion, mine planning, traffic controls, and workforce engagement are advancing with autonomous operations planned to commence in Q1 2027.
At Turquoise Ridge, 20 haul trucks have been ordered as “Autonomous Ready”. Similar to Carlin, fleet conversion, mine planning, traffic controls and workforce engagement have begun. Following delivery, assembly of the first units of the fleet at Turquoise Ridge are expected in Q1 2027. Autonomous operations at the site are expected to commence by mid 2027 and ramp up through the remainder of 2027 as the rest of the fleet is delivered and assembled.
As of September 30, 2026, Cortez had spent $41 million of an approved capital budget of ~$50 million (100% basis). Carlin project expenditures are progressing in line with the planned retrofit schedule, with expected 2026 expenditure of ~$30 million and total program spending through 2027 of ~$65 million (100% basis). Similarly, Turquoise Ridge project expenditures are progressing in line with the planned delivery schedule, with expected 2026 expenditure to be ~$70 million and total program spending through 2027 to be ~$120 million (100% basis).
Pueblo Viejo Expansion, Dominican Republic8
The Pueblo Viejo life of mine expansion continues to advance with resettlement nearing completion and efforts focused on the Naranjo TSF and associated facilities. The TWMS has surpassed 20% completion while Starter Dam detailed design is progressing on schedule to support a full permitting package submission in Q1 2027. Haul Roads 19 and 17 continue to advance, with two of the four bridges now under construction. The remaining self-perform fleet required for Starter Dam construction is also beginning to arrive on site. Construction of the new effluent treatment plant and diorite crusher continues to progress, alongside development of the diorite quarry. In parallel, the site water management PFS has been initiated with Fluor and Piteau, incorporating a new water treatment system aligned with the site long term sustainability plan.
The EPCM contract for the addition of a 4th Lime Kiln has been advanced in Q3 2026 together with the PFS work to improve the flotation circuit with the addition of high shear float cells and upgrades to the existing float cells.
The housing project at Pueblo Viejo continues with our current area of focus being advancing the church and polytechnical school design, along with the agreed 63 government houses. 99% of resettlement packages have now been accepted.
As at September 30, 2026, total project spend was $1,336 million (including $35 million in Q3 2026) on a 100% basis. The estimated capital cost of the plant expansion and mine life extension project remains approximately $2.6 billion (100% basis).
Andean Portfolio9
Barrick continued its early-stage review of development options across its Andean portfolio in Argentina and Chile, which includes the Veladero mine, as well as the El Alto and Lama districts, which encompass the mineralized system historically explored as part of the Pascua-Lama project, and the Norte Abierto project. These deposits (El Alto, Lama and Norte Abierto) represent one of the largest undeveloped gold resource bases in the region, holding more than 42 million ounces of gold in attributable measured and indicated resources as at December 31, 2025, together with approximately 2.3 million tonnes of copper and 788 million ounces of silver, as reported in Barrick’s year-end 2025 mineral reserves and resources statement. The drilling, studies and permitting now underway are intended to define the development pathway that best realizes this opportunity.
At El Alto, in Alto del Carmen, Chile, a two-season drilling campaign is scheduled to commence in Q4 2026 under an approved environmental permit.
At Norte Abierto, a 50/50 joint venture with Newmont in Chile’s Maricunga belt, pre-feasibility studies continued to evaluate the preferred project scope. Studies are expected to progress into 2027 to further define the potential development pathway.
Finally, at Lama, in Argentina, infill drilling and potential deposit extensions have been incorporated into an upcoming campaign to support the advancement of studies and define the scope of work for 2027.
Veladero Phase 8 Leach Pad, Argentina
The construction of the Phase 8 leach pad is being executed in three phases which are named 8A, 8B and 8C. Phases 8A and 8B have been completed on schedule. The phased execution of the project provides flexibility to align future stages with economic conditions and the applicable regulatory framework. Construction of the project includes cutting, filling, sub-drainage and monitoring, leak collection and recirculation, waterproofing, as well as pregnant leaching solution collection.
Overall, the total Phase 8 leach pad project spend at September 30, 2026 was $140 million ($9 million in Q3 2026) out of an estimated capital cost of approximately $250 million (100% basis).
Reko Diq Project, Pakistan10
On February 5, 2026, the Company announced that it was reviewing all aspects of the Reko Diq project in light of the escalation of security risks and increased security incidents. On April 2, 2026, Barrick announced that following the preliminary findings of the review and further escalation of security issues in the region, the Company considers it necessary to slow the development activity and extend the project review. This review is ongoing and will assess in a comprehensive manner the evolving security situation, capital requirements, project financing, project scope and timeline.
Capital expenditures commenced in Q2 2024, with total capitalized spend to date of $1,497 million (including $159 million in Q3 2026) (100% basis).
As previously disclosed, the expected range for 2026 attributable capital expenditure was reduced to $450 to $500 million (50% basis). It is anticipated that there could be significant increases to the previously disclosed total estimated capital budget and timeline for the project. The previously disclosed total estimated capital cost of Phase 1 was between $5.6 billion and $6.0 billion (100% basis, exclusive of capitalization of financing costs) and of Phase
| BARRICK THIRD QUARTER 2026 | 31 | MANAGEMENT’S DISCUSSION AND ANALYSIS |
| OVERVIEW | OPERATING PERFORMANCE |
FUTURE GROWTH |
REVIEW OF FINANCIAL RESULTS |
OTHER INFORMATION & NON-GAAP RECONCILIATIONS |
FINANCIAL STATEMENTS | |||||
2 was between $3.3 billion and $3.6 billion (100% basis, exclusive of capitalization of financing costs), with first production targeted by the end of 2028. These estimates were based on the feasibility study completed at the end of 2024.
Kibali Solar Project, DRC
This project entailed the design, supply and installation of a 16 MW photovoltaic solar farm with a 15 MW battery energy storage system to complement the existing hydroelectric power stations, increasing the renewable component of the mine’s energy mix. The project was completed in Q1 2026, and the solar photovoltaic power plant generated 22,58 GWh of electrical energy year-to-date, which resulted in estimated year-to-date fuel savings of around 5.65 million liters. The project spend was $46 million, which was below the estimated capital cost of $55 million (100% basis).
Lumwana Super Pit Expansion, Zambia11
The Lumwana Super Pit Expansion is projected to deliver 240,000 tonnes of copper production per annum, from a 52Mtpa process plant expansion, with a mine life of more than 30 years.
The project is on schedule with the target of first copper production at the end of Q1 2028. The critical path for the process plant expansion, the mill building, has been maintained and the final wall lifts are expected to be completed in Q4 2026. The primary crusher construction remains on track with its third level nearing completion and civil construction of the overland conveyors and transfer towers progressing well. The manufacturing and delivery of structural steel are advancing as planned and is sustained by the critical path structural engineering that is expected to be completed in Q4 2026. Procurement of all major long-lead equipment is complete. Deliveries to site continue as per schedule. The third phase of on-site accommodation showed steady progress and continues to support the expansion’s ramp-up. The TSF expansion contract was awarded in Q3 2026 and works are on track to commence in Q4 2026. Road construction supporting the future Kamisengo mining development, where the Kamisengo inflow control dam is being constructed, is on track. Expansion of the mine fleet continues, with the primary mine fleet for 2026 complete. Planned deliveries for next year are well advanced with a PC7000 Komatsu to be commissioned in Q4 2026 and eight Komatsu 930E dump trucks on track for delivery in Q4 2026 with commissioning expected in Q1 2027.
With ongoing progress on the detailed engineering, procurement, and construction, the overall project remains on schedule and is focused on delivery of critical milestones in line with the execution plan. As at September 30, 2026, the total spend on the expansion project was $795 million (including $185 million in Q3 2026 and noting this is inclusive of $38 million spent on the feasibility study completed in 2024). The forecast for 2026 expenditure is now expected to be at the lower end of the $750 to $850 million range. The total project capital cost (exclusive of capitalized stripping) is expected to be $2 billion based on the approved feasibility study.
Zaldívar Water Project, Chile
The Third-Party Water Supply Project, involving the construction of an approximately 160 km pipeline and pumping system to deliver around 200 liters per second of reprocessed wastewater from Antofagasta, has been approved. The project will enable the transition away from continental water sources by mid-2028, as required under
the environmental permit approved in 2025, securing a long-term water supply and supporting a potential extension of the mine life to 2051.
As at September 30, 2026, the total spend on the water project was $145 million (including $72 million in Q3 2026). The estimated capital cost is anticipated to be approximately $950 million (100% basis).
Exploration12, 13
During Q3 2026, Barrick’s exploration teams have been active across all our operations, with strong results returned from drilling across NGM, and at Fourmile, and Kibali in the DRC.
In North America, following the establishment of dedicated greenfield exploration teams for the Great Basin and Western Cordillera, Barrick continued to identify new exploration opportunities and advance its consolidated district-scale land positions during Q3 2026. In the Great Basin, Barrick initiated an extensive geophysical campaign to acquire new datasets over the next 12 months, aiming to improve the understanding of geological and structural controls on mineralization, and support the generation and advancement of new and current exploration targets. During the quarter, gravity surveys were completed at Buckhorn, Goldfield Hills and Patty, with additional surveys progressing across priority areas. Framework drilling advanced at Toiyabe, while permits were secured for initial drilling at other early-stage targets. Regional geological mapping and extensive soil and rock-chip sampling programs also progressed, aimed at identifying and delineating Carlin-type geochemical anomalies and refining the extent of prospective target areas. This work supported additional land consolidation in selected areas. Barrick also executed an earn-in agreement with Greenlight Metals for the Kalium Canyon Project, securing an opportunity to advance a prospective epithermal gold system within the Walker Lane corridor. Collectively, these activities reflect the acceleration of greenfield exploration across the Great Basin, one of Barrick’s key strategic exploration priorities. In the Superior Province, Barrick executed an earn-in agreement with GFG Resources in August covering approximately 475 km2 of consolidated ground along a prospective structural corridor with potential to host greenstone-hosted gold mineralization. Initial geological mapping and sampling are underway, with geophysical surveys planned to support target delineation. Exploration also progressed across other priority districts in the Superior Province through geological mapping and sampling, ground geophysical surveys, till sampling programs and framework drilling. These activities support the systematic advancement of the Superior Province as another key focus area for Barrick’s greenfield exploration strategy.
In Jamaica, exploration continued across three prioritized camp-scale areas targeting epithermal gold and porphyry copper–gold systems. Two drill-ready targets have been defined, with permits secured for the first target and drilling expected to commence during Q4 2026. At Pueblo Viejo in the Dominican Republic, a large-scale induced polarization (IP) geophysical survey was completed to identify concealed chargeability anomalies potentially associated with sulfide mineralization. Results will be integrated with existing geological and geophysical datasets to refine exploration targets and guide follow-up activities. Brownfields exploration at NGM continued across all districts during Q3 2026, with significant drilling results returned from the Carlin and Cortez districts. In the Carlin District, drilling along the approximately two-kilometer-long
| BARRICK THIRD QUARTER 2026 | 32 | MANAGEMENT’S DISCUSSION AND ANALYSIS |
| OVERVIEW | OPERATING PERFORMANCE |
FUTURE GROWTH |
REVIEW OF FINANCIAL RESULTS |
OTHER INFORMATION & NON-GAAP RECONCILIATIONS |
FINANCIAL STATEMENTS | |||||
Pathfinder corridor, located approximately 500 meters from Goldstrike Underground, intersected high-grade gold mineralization in an area with limited historical drilling. Hole PFX-26011 returned 18.3 meters at 6.45 g/t Au from 347.47 meters, including 1.5 meters at 16.18 g/t Au from 347.47 meters, and 9.1 meters at 12.97 g/t Au from 400.81 meters, while PFX-26005 returned 10.7 meters at 7.80 g/t Au from 522.73 meters. These holes, located more than 500 meters apart, demonstrate the potential for additional high-grade mineralization beyond the existing Goldstrike Underground resource areas. Further north, underground drilling at Ren intersected previously unidentified high-grade mineralization more than 700 meters from existing development. Hole MRC-26034 returned 39.3 meters at 7.32 g/t Au from 740.10 meters, highlighting the potential for further discoveries along the North Carlin Trend. Follow-up surface drilling is planned for Q4 2026. In the Cortez District, deep surface drilling at North Crow, between the Rose and Goldrush orebodies, returned significant high-grade intercepts in a previously underexplored corridor. Hole GRC-26001 intersected 58.7 meters at 24.40 g/t Au from 602.10 meters, 21.6 meters at 35.45 g/t Au from 672.70 meters, and 48.3 meters at 20.14 g/t Au from 707.10 meters. These results confirm the presence of high-grade mineralization between the northern extent of Goldrush and the Rose orebody, supporting the potential for further resource growth in the district. Follow-up drilling is ongoing. At Turquoise Ridge, underground drilling continued at the Dune target to evaluate extensions of the high-grade mineralization identified earlier in 2026.
In South America, early-stage exploration continued in Peru. In the Yauri District, the potential within the district was confirmed by fieldwork with four targets delineated with drill permitting now underway - which is expected to commence in late Q1 2027, after the wet season. In the Tartaro District of northern Peru, land consolidation was completed, securing an 861 km² district-scale position. Early-stage exploration is well advanced, with four target-scale areas of interest identified. One of these areas has been prioritized for target delineation work, while further field validation of the remaining three areas is expected to commence next. In Argentina, within the Veladero District, a further drilling campaign at Porfiada is planned for Q4 2026 to fully define the extent of the known, open mineralization. A detailed safety assessment is underway to confirm appropriate operating conditions following the winter season.
In Africa and the Middle East, field work and drilling continued across the portfolio through the third quarter. In Tanzania, large-scale ground geophysical and drilling programs commenced around North Mara and across Barrick’s expansive and highly prospective greenfield portfolio. Most assay results are still pending, but initial observations are encouraging, with indications of significant deformation, lithological complexity and signs of alteration normally associated with a prospective geological setting. Programs will continue to accelerate through the rest of the field season. Drilling has commenced on the highly prospective copper exploration portfolio in the Copperbelt in DRC, testing a range of large soil anomalies whilst delineation programs advance to define the next phase of targets. At Kibali, the next chapter of growth continued to take shape close to the existing KCD deposit, consistent with the continued ARK growth reported last quarter. The project is rapidly advancing, with conversion and study work well under way, and with drilling continuing to further extend the system of multiple, open, high-grade ore-shoots. As planned, this quarter, drilling began across several high-potential targets in the core KCD corridor to the north-west, south-east and underneath the main
mineralized system, and early results indicate significant discovery potential for additional open pit and underground resources. Drilling in the fourth quarter is planned to progress these near-mine targets. In Saudi Arabia, exploration commenced in earnest on the new greenfield North Siham project, located on the extension of the Central Arabian Gold Belt. Early indications are positive, with signs of mineralization in surface samples, and work is progressing to generate targets for more focused follow-up. Meanwhile, near the Jabal Sayid mine, drilling is progressing on the Khamsa target, with a geological model update planned for the fourth quarter to vector toward the parts of the system with the highest potential for a significant satellite deposit.
| BARRICK THIRD QUARTER 2026 | 33 | MANAGEMENT’S DISCUSSION AND ANALYSIS |
| OVERVIEW | OPERATING PERFORMANCE |
FUTURE GROWTH |
REVIEW OF FINANCIAL RESULTS |
OTHER INFORMATION & NON-GAAP RECONCILIATIONS |
FINANCIAL STATEMENTS | |||||
Review of Financial Results
Revenue
| ($ millions, except per oz/lb data in dollars) |
For the three months ended |
For the nine months ended |
||||||||||||||||||
| 9/30/26 | 6/30/26 | 9/30/25 | 9/30/26 | 9/30/25 | ||||||||||||||||
| Gold |
||||||||||||||||||||
| 000s oz solda |
810 | 801 | 837 | 2,359 | 2,358 | |||||||||||||||
| 000s oz produceda |
816 | 796 | 829 | 2,331 | 2,384 | |||||||||||||||
| Market price ($/oz) |
4,262 | 4,506 | 3,457 | 4,545 | 3,201 | |||||||||||||||
| Realized price ($/oz)b |
4,243 | 4,417 | 3,457 | 4,486 | 3,226 | |||||||||||||||
| Revenue |
4,489 | 4,665 | 3,748 | 13,910 | 9,794 | |||||||||||||||
| Copper |
||||||||||||||||||||
| 000s tonnes solda |
49 | 54 | 52 | 148 | 157 | |||||||||||||||
| 000s tonnes produceda |
50 | 56 | 55 | 155 | 158 | |||||||||||||||
| Market price ($/lb) |
6.40 | 6.05 | 4.44 | 6.09 | 4.33 | |||||||||||||||
| Realized price ($/lb)b |
6.54 | 6.15 | 4.39 | 6.17 | 4.42 | |||||||||||||||
| Revenue |
459 | 499 | 320 | 1,301 | 961 | |||||||||||||||
| Other sales |
125 | 128 | 80 | 372 | 204 | |||||||||||||||
| Total revenue |
5,073 | 5,292 | 4,148 | 15,583 | 10,959 | |||||||||||||||
| a. | On an attributable basis. |
| b. | Further information on these non-GAAP financial measures, including detailed reconciliations, is included on pages 44 to 56 of this MD&A. |
Q3 2026 compared to Q2 2026
In Q3 2026, gold revenues on a consolidated basis decreased by 4% compared to Q2 2026, driven by a lower realized gold price1, partially offset by higher sales volumes. The average market price for Q3 2026 was $4,262/oz, representing a 5% decrease versus the $4,506/oz average in Q2 2026. During Q3 2026, the gold price ranged from $3,960/oz to $4,697/oz, and closed the quarter at $4,176/ oz. Gold price volatility in Q3 2026 was driven primarily by economic and geopolitical concerns, in particular the ongoing conflict in the Middle East.
In Q3 2026, gold production on an attributable basis increased by 3% compared to Q2 2026 mainly due to higher grade open pit ore mined and processed at Cortez, improved mine to mill operational performance and higher grades processed at Kibali, and increased throughput and higher grades processed at Loulo-Gounkoto, partially offset by lower throughput at Pueblo Viejo and at Veladero (included within “Other” in the chart above) as severe winter storms resulted in the temporary suspension of operations on multiple occasions during the quarter.
ATTRIBUTABLE GOLD PRODUCTION VARIANCE (000s oz)
Q3 2026 compared to Q2 2026
In Q3 2026, copper revenues on a consolidated basis decreased by 8% compared to Q2 2026, primarily due to lower sales volumes, partially offset by a higher realized copper price1. The average market price in Q3 2026 was $6.40/lb, representing an all-time high quarterly average and an increase of 6% from the $6.05/lb average in Q2 2026. The realized copper price1 in both Q3 2026 and Q2 2026 was higher than the market copper price due to the timing of sales. During Q3 2026, the copper price traded in a range of $5.94/lb to $6.75/lb, and closed the quarter at $6.57/lb. Copper prices in Q3 2026 were impacted by concerns about the global economy resulting from global trade disputes, supply disruptions, the ongoing conflict in the Middle East, and demand forecasts in China, which is the world’s largest consumer of copper.
Attributable copper production in Q3 2026 was 6 thousand tonnes lower compared to Q2 2026 driven by a planned shutdown for a mill reline at Lumwana that was brought forward to late September, deferring the processing of high-grade ore to October.
Q3 2026 compared to Q3 2025
For Q3 2026, gold revenues on a consolidated basis increased by 20% compared to Q3 2025, primarily due to a higher realized gold price1, partially offset by lower sales volumes. The average market price for Q3 2026 was $4,262/oz versus $3,457/oz for Q3 2025.
ATTRIBUTABLE GOLD PRODUCTION VARIANCE (000s oz)
Q3 2026 compared to Q3 2025
| a. | Divested mines refer to the ounces produced by Hemlo and Tongon in Q3 2025. |
| BARRICK THIRD QUARTER 2026 | 34 | MANAGEMENT’S DISCUSSION AND ANALYSIS |
| OVERVIEW | OPERATING PERFORMANCE |
FUTURE GROWTH |
REVIEW OF FINANCIAL RESULTS |
OTHER INFORMATION & NON-GAAP RECONCILIATIONS |
FINANCIAL STATEMENTS | |||||
For Q3 2026, attributable gold production (excluding the divested mines) was 6% higher than Q3 2025, primarily due to the ramp up of operations at Loulo-Gounkoto following the resolution of the dispute with the Government of Mali that was ultimately resolved in December 2025 and had shutdown the mine for close to 12 months commencing in January 2025. This was partially offset by lower production at North Mara, driven by lower grades processed, lower throughput and lower recoveries, and at Veladero (included within “Other” in the chart above) as severe winter storms resulted in the temporary suspension of operations on multiple occasions during the quarter.
For Q3 2026, copper revenues on a consolidated basis increased by 43% compared to Q3 2025, primarily due to a higher realized copper price1, partially offset by lower sales volumes. In Q3 2026, the realized copper price1 was higher than the market copper price, as discussed above, whereas the realized copper price1 was lower than the market copper price in Q3 2025 due to the impact of negative provisional pricing adjustments.
Attributable copper production for Q3 2026 was 5 thousand tonnes lower than Q3 2025, mainly due to lower grades processed at Lumwana driven by the planned shutdown for a mill reline.
YTD 2026 compared to YTD 2025
For YTD 2026, gold revenues increased by 42% compared to YTD 2025, primarily due to a higher realized gold price1. The average market price for YTD 2026 was $4,545/oz versus $3,201/oz for YTD 2025. The realized gold price1 in Q3 2026 was lower than the market gold price due to the timing of sales and the realized loss impact of the zero cost collars (refer to note 13 for further details).
For YTD 2026, attributable gold production (excluding the divested mines) was 6% higher than YTD 2025, primarily due to the ramp-up of operations at Loulo-Gounkoto, as discussed above. This was partially offset by lower production at North Mara, mainly due to lower grades processed driven by lower grades mined.
Copper revenues for YTD 2026 increased by 35% compared to YTD 2025, primarily due to a higher realized copper price1, partially offset by lower sales volumes. For YTD 2026, the realized copper price1 was higher than the market copper price due to the timing of sales, whereas the increase in YTD 2025 was due to the impact of positive provisional pricing adjustments.
Attributable copper production for YTD 2026 decreased by 2% compared to YTD 2025, due to slight decreases across all three copper sites.
Production Costs
| ($ millions, except per oz/lb data in dollars) |
For the three months ended |
For the nine months ended |
||||||||||||||||||
| 9/30/26 | 6/30/26 | 9/30/25 | 9/30/26 | 9/30/25 | ||||||||||||||||
| Gold |
||||||||||||||||||||
| Site operating costs |
1,318 | 1,357 | 1,157 | 3,854 | 3,433 | |||||||||||||||
| Depreciation |
493 | 478 | 384 | 1,420 | 1,085 | |||||||||||||||
| Royalty expense |
203 | 196 | 113 | 592 | 311 | |||||||||||||||
| Mining and production taxes |
65 | 68 | 29 | 179 | 77 | |||||||||||||||
| Community relations |
6 | 10 | 7 | 23 | 28 | |||||||||||||||
| Cost of sales |
2,085 | 2,109 | 1,690 | 6,068 | 4,934 | |||||||||||||||
| COS ($/oz)a |
1,950 | 1,993 | 1,562 | 1,956 | 1,613 | |||||||||||||||
| TCC ($/oz)b |
1,386 | 1,426 | 1,137 | 1,381 | 1,197 | |||||||||||||||
| AISC ($/oz)b |
1,911 | 1,866 | 1,538 | 1,831 | 1,660 | |||||||||||||||
| Copper |
||||||||||||||||||||
| Site operating costs |
163 | 165 | 98 | 471 | 323 | |||||||||||||||
| Depreciation |
65 | 71 | 69 | 179 | 197 | |||||||||||||||
| Royalty expense |
37 | 43 | 25 | 110 | 71 | |||||||||||||||
| Community relations |
2 | 1 | 1 | 4 | 3 | |||||||||||||||
| Cost of sales |
267 | 280 | 193 | 764 | 594 | |||||||||||||||
| COS ($/lb)a |
3.65 | 3.39 | 2.68 | 3.48 | 2.72 | |||||||||||||||
| C1 cash costs ($/lb)b |
2.76 | 2.47 | 1.96 | 2.60 | 2.00 | |||||||||||||||
| AISC ($/lb)b |
4.52 | 3.95 | 3.14 | 4.05 | 3.03 | |||||||||||||||
| a. | Gold COS/oz is calculated as cost of sales across our gold operations (excluding sites in closure or care and maintenance) divided by ounces sold (both on an attributable basis using Barrick’s ownership share). Copper COS/lb is calculated as cost of sales across our copper operations divided by pounds sold (both on an attributable basis using Barrick’s ownership share). |
| b. | Further information on these non-GAAP financial measures, including detailed reconciliations, is included on pages 44 to 56 of this MD&A. |
Q3 2026 compared to Q2 2026
In Q3 2026, gold cost of sales on a consolidated basis was 1% lower than Q2 2026, primarily due to lower unit costs as described below. Our 45% interest in Kibali and 24.5% interest in Porgera are equity accounted, and therefore each mine’s cost of sales is excluded from our consolidated gold cost of sales. Our per ounce metrics, gold COS/oz2 and TCC/oz1, include our proportionate share of cost of sales at our equity method investees, and were 2% and 3% lower, respectively, compared to Q2 2026 primarily driven by changes in the sales mix across the portfolio, the shutdown activity in Q2 2026 and the impact of lower royalties due to a lower realized gold price1.
In Q3 2026, gold AISC/oz1, which also includes our proportionate share of equity method investees, was 2% higher than Q2 2026, as higher minesite sustaining capital expenditures1 were partially offset by lower TCC/oz1, as explained above.
In Q3 2026, copper cost of sales on a consolidated basis was 5% lower than Q2 2026, primarily due to lower sales volumes. Our 50% interests in Zaldívar and Jabal Sayid are equity accounted and therefore, we do not include their cost of sales in our consolidated copper cost of sales. Our per pound metrics, copper COS/lb2 and C1 cash costs/lb1, include our proportionate share of cost of sales at our equity method investees. Copper COS/lb2 and C1 cash costs/lb1 were 8% and 12% higher, respectively, compared to Q2 2026, primarily driven by higher diesel prices and
| BARRICK THIRD QUARTER 2026 | 35 | MANAGEMENT’S DISCUSSION AND ANALYSIS |
| OVERVIEW | OPERATING PERFORMANCE |
FUTURE GROWTH |
REVIEW OF FINANCIAL RESULTS |
OTHER INFORMATION & NON-GAAP RECONCILIATIONS |
FINANCIAL STATEMENTS | |||||
increased maintenance costs at Lumwana, as well as lower fixed cost dilution resulting from lower sales volumes at Zaldívar.
In Q3 2026, copper AISC/lb1, which also includes our proportionate share of equity method investees, was 14% higher compared to Q2 2026, mainly due to higher C1 cash costs/lb1, as discussed above, and higher minesite sustaining capital expenditures1 at Lumwana.
Q3 2026 compared to Q3 2025
For Q3 2026, gold cost of sales on a consolidated basis was 23% higher than Q3 2025, mainly due to increased site operating costs, higher depreciation and increased royalties driven by the higher realized gold price1. This was partially offset by lower sales volumes. As described above, our per ounce metrics, gold COS/oz2 and TCC/oz1, include our proportionate share of cost of sales at our equity method investees, and were 25% and 22% higher, respectively, compared to Q3 2025. This was mainly due to the impact of higher diesel prices across all operations, higher royalties associated with the higher realized gold price1 (impact approximately $60/oz), the change in the sales mix by site, higher tariffs at the NGM operations and the impacts related to adverse weather conditions at Veladero and Porgera.
For Q3 2026, gold AISC/oz1 was 24% higher than Q3 2025, primarily due to higher TCC/oz1, combined with higher minesite sustaining capital expenditures1.
For Q3 2026, copper cost of sales on a consolidated basis was 38% higher than Q3 2025, primarily due to higher site operating costs, partially offset by lower sales volumes. As described above, our per pound metrics, copper COS/lb2 and C1 cash costs/lb1, include our proportionate share of cost of sales at our equity method investees. Copper COS/lb2 and C1 cash costs/lb1 were 36% and 41% higher, respectively, compared to Q3 2025, mainly due to higher diesel prices as well as the local currency appreciation driving up higher labour costs.
For Q3 2026, copper AISC/lb1 was 44% higher than Q3 2025, mainly due to higher C1 cash costs/lb1, increased royalties due to the higher realized copper price1 and increased minesite sustaining capital expenditures1 primarily at Lumwana.
YTD 2026 compared to YTD 2025
For YTD 2026, gold cost of sales on a consolidated basis was 23% higher than YTD 2025, mainly due to higher site operating costs, increased depreciation, and higher royalties and mining and production taxes associated with the higher realized gold price1. On a per ounce basis, gold COS/oz2 and TCC/oz1, after including our proportionate share of COS at our equity method investees (refer to explanation above), were 21% and 15% higher, respectively, than YTD 2025. This was primarily due to higher diesel prices across all operations, higher royalties (impact approximately $75/oz) associated with the higher realized gold price1, the change in the sales mix by site, lower grades processed at Cortez and North Mara, and higher costs associated with the adverse weather conditions at Veladero and Porgera.
For YTD 2026, gold AISC/oz1 increased by 10% compared to YTD 2025, primarily due to an increase in TCC/oz1, partially offset by lower minesite sustaining capital expenditures1 on a per ounce basis.
For YTD 2026, copper cost of sales on a consolidated basis was 29% higher than YTD 2025,
primarily due to higher site operating costs and increased royalties associated with the higher realized copper price1, partially offset by lower sales volumes. Our per pound metrics, copper COS/lb2 and C1 cash costs/lb1, include our proportionate share of COS at our equity method investees (refer to explanation above). Copper COS/lb2 and C1 cash costs/lb1 were 28% and 30% higher, respectively, compared to YTD 2025, due to higher diesel prices and local currency appreciation at Lumwana as discussed above.
For YTD 2026, copper AISC/lb1 was 34% higher than YTD 2025, primarily due to higher C1 cash costs/lb1, as discussed above, as well as higher royalties due to the higher realized copper price1.
General and Administrative Expenses
| ($ millions) | For the three months ended |
For the nine months ended |
||||||||||||||||||
| 9/30/26 | 6/30/26 | 9/30/25 | 9/30/26 | 9/30/25 | ||||||||||||||||
| Corporate administration |
31 | 22 | 25 | 77 | 78 | |||||||||||||||
| Share-based compensationa |
20 | 9 | 52 | 44 | 80 | |||||||||||||||
| General & administrative expenses |
51 | 31 | 77 | 121 | 158 | |||||||||||||||
| a. | Based on a US$42.56 share price as at September 30, 2026 (June 30, 2026: US$37.13 and September 30, 2025: US$34.12). |
General and administrative expenses for Q3 2026 increased by $20 million compared to Q2 2026 due to higher share-based compensation driven by an increase in our share price, combined with higher corporate administration expenses primarily due to higher labour and external services costs.
For Q3 2026 and YTD 2026, general and administrative expenses decreased by $26 million and $37 million compared to Q3 2025 and YTD 2025, respectively, mainly due to lower share-based compensation expenses, reflecting lower share price appreciation in Q3 2026 compared to Q3 2025 and a decline in our share price during YTD 2026 compared to an increase in YTD 2025.
Exploration, Evaluation and Project Expenses
| ($ millions) | For the three months ended |
For the nine months ended |
||||||||||||||||||
| 9/30/26 | 6/30/26 | 9/30/25 | 9/30/26 | 9/30/25 | ||||||||||||||||
| Global exploration and evaluation |
105 | 87 | 58 | 252 | 138 | |||||||||||||||
| Project costs |
20 | 22 | 27 | 63 | 71 | |||||||||||||||
| IPO costs |
— | 21 | — | 52 | — | |||||||||||||||
| Global exploration and evaluation and project expense |
125 | 130 | 85 | 367 | 209 | |||||||||||||||
| Minesite exploration and evaluation |
1 | 4 | 7 | 9 | 19 | |||||||||||||||
| Total exploration, evaluation and project expenses |
126 | 134 | 92 | 376 | 228 | |||||||||||||||
Exploration, evaluation and project expenses for Q3 2026 decreased by $8 million compared to Q2 2026 mainly as the North America IPO project costs are now being capitalized. This was partially offset by higher global exploration and evaluation costs primarily related to
| BARRICK THIRD QUARTER 2026 | 36 | MANAGEMENT’S DISCUSSION AND ANALYSIS |
| OVERVIEW | OPERATING PERFORMANCE |
FUTURE GROWTH |
REVIEW OF FINANCIAL RESULTS |
OTHER INFORMATION & NON-GAAP RECONCILIATIONS |
FINANCIAL STATEMENTS | |||||
permitting in the DRC, and at NGM due to schedule changes and expanded drill programs.
Exploration, evaluation and project expenses for Q3 2026 and YTD 2026 increased by $34 million and $148 million respectively compared to Q3 2025 and YTD 2025, primarily due to higher global exploration and evaluation costs mainly driven by increased drilling activities at Fourmile (refer to Future Growth section) and NGM, and higher permitting costs in the DRC. For YTD 2026, the increase was further driven by the North America IPO project costs incurred prior to their capitalization in Q3 2026.
Finance Costs, Net
| ($ millions) | For the three months ended |
For the nine months ended |
||||||||||||||||||
| 9/30/26 | 6/30/26 | 9/30/25 | 9/30/26 | 9/30/25 | ||||||||||||||||
| Interest expensea |
108 | 101 | 93 | 318 | 290 | |||||||||||||||
| Accretion |
20 | 20 | 22 | 60 | 67 | |||||||||||||||
| Interest capitalized |
(43 | ) | (35 | ) | (16 | ) | (107 | ) | (36 | ) | ||||||||||
| Other finance costs |
2 | 1 | 4 | 4 | 5 | |||||||||||||||
| Finance income |
(49 | ) | (61 | ) | (60 | ) | (172 | ) | (163 | ) | ||||||||||
| Finance costs, net |
38 | 26 | 43 | 103 | 163 | |||||||||||||||
| a. | For Q3 2026 and YTD 2026, interest expense includes $7 million and $22 million, respectively, of non-cash interest expense primarily relating to the Pueblo Viejo streaming agreement with Royal Gold Inc. (Q2 2026: $8 million; Q3 2025: $8 million; YTD 2025: $24 million). Interest expense also includes $1 million and $9 million, respectively, relating to finance costs in Argentina (Q2 2026: $nil; Q3 2025: $1 million; YTD 2025: $10 million). |
In Q3 2026, finance costs, net increased compared to Q2 2026, primarily due to lower finance income, partially offset by higher interest capitalized.
For Q3 2026 and YTD 2026, finance costs, net were lower than the prior year periods, mainly due to higher interest capitalized, primarily relating to Reko Diq and Lumwana, partially offset by higher interest expense. Q3 2026 was further impacted by lower finance income.
Additional Statement of Income Items
| ($ millions) | For the three months ended |
For the nine months ended |
||||||||||||||||||
| 9/30/26 | 6/30/26 | 9/30/25 | 9/30/26 | 9/30/25 | ||||||||||||||||
| Impairment (reversals) charges |
(1 | ) | (1 | ) | 3 | (2 | ) | 7 | ||||||||||||
| Loss (gain) on currency translation |
1 | 14 | (3 | ) | 35 | (3 | ) | |||||||||||||
| Closed mine rehabilitation |
(4 | ) | 15 | 4 | 8 | 15 | ||||||||||||||
| Other expense (income) |
66 | 209 | (193 | ) | 271 | 330 | ||||||||||||||
Other Expense (Income)
Other expense in both Q3 2026 and Q2 2026 of $66 million and $209 million, respectively, mainly related to additional royalties, penalties and interest related to the retrospective application of the 2023 Mining Code to Loulo-Gounkoto for 2024 and 2025, combined with remobilization costs at Loulo-Gounkoto. In Q3 2026, other expense was partially offset by a gain on the sale of non-current assets, in particular our share in the Bambadji project in Senegal, whereas other expense in Q2 2026 was partially offset by a positive revaluation of the Hemlo contingent consideration.
This compares to other income in Q3 2025 of $193 million, which primarily related to the revaluation of our 80% equity investment in Loulo-Gounkoto, as it was deconsolidated and an investment at fair value was initially recognized in Q2 2025.
For YTD 2026, other expense was $271 million, compared to $330 million in YTD 2025. Other expense in YTD 2026 mainly related to Loulo-Gounkoto, as discussed above, and a loss on the revaluation of our Kibali JV receivable. This was partially offset by a gain on the sale of non-current assets, in particular our share in the Bambadji project in Senegal, and the positive revaluation of the Hemlo contingent consideration. Other expense in YTD 2025 primarily reflected the net loss of $785 million (pretax) on the deconsolidation and recognition of our 80% equity investment in Loulo-Gounkoto, partially offset by a gain on the sale of our 50% interest in the Donlin Gold project.
For a further breakdown of other expense, refer to note 9 to the Financial Statements.
Income Tax Expense
Income tax expense was $601 million in Q3 2026. The unadjusted effective income tax rate in Q3 2026 was 23% of income before income taxes.
The underlying effective income tax rate on ordinary income in Q3 2026 was 23% after adjusting for the impact of foreign currency translation losses on current and deferred tax balances, changes in rehabilitation provisions relating to non-operating mines, non-deductible foreign exchange losses, the remeasurement of the Hemlo contingent consideration; the impact of Loulo-Gounkoto, gains and losses on the sale of assets, and other non-recurring tax and non-tax adjustments.
We record deferred tax charges or credits if changes in facts or circumstances affect the estimated tax basis of assets and therefore, the expectations of our ability to realize deferred tax assets. The interpretation of tax regulations and legislation as well as their application to our business is complex and subject to change. We also have significant amounts of unrecognized deferred tax assets (e.g. for tax losses in Canada). Potential changes in any of these amounts, as well as our ability to realize deferred tax assets, could significantly affect net income or cash flow in future periods. For further details on income tax expense, refer to note 10 of the Financial Statements.
Withholding Taxes
In Q3 2026, we recorded $36 million of dividend withholding taxes related to the distributed and undistributed earnings of our subsidiaries in Mali, Saudi Arabia and the United States.
OECD Pillar Two model rules
Consistent with the amendments to IAS 12 Income Taxes issued by the IASB in May 2023, the Group has applied the mandatory temporary exception from the recognition and disclosure of deferred tax assets and liabilities arising from Pillar Two income taxes. Accordingly, no deferred tax assets or liabilities have been recognized or disclosed in respect of Pillar Two legislation.
Based on the Group’s assessment of the OECD Transitional Safe Harbor rules, no material Pillar Two current tax expense or liability was identified for Q3 2026.
As the law is evolving, both in Canada and elsewhere, we will continue to monitor the impact of this legislation.
| BARRICK THIRD QUARTER 2026 | 37 | MANAGEMENT’S DISCUSSION AND ANALYSIS |
| OVERVIEW | OPERATING PERFORMANCE |
FUTURE GROWTH |
REVIEW OF FINANCIAL RESULTS |
OTHER INFORMATION & NON-GAAP RECONCILIATIONS |
FINANCIAL STATEMENTS | |||||
Net Earnings and Adjusted Net Earnings1
Factors affecting net earnings and adjusted net earnings1 - Q3 2026 versus Q2 2026
Net earnings attributable to equity holders of Barrick (“net earnings”) for Q3 2026 were $1,317 million compared to $1,217 million in Q2 2026. The increase was impacted by the significant adjusting items as discussed below. After adjusting for items that are not indicative of future operating earnings, adjusted net earnings1 of $1,347 million for Q3 2026 was relatively in line with Q2 2026 of $1,363 million as a lower realized gold price1 was largely offset by lower gold COS/oz2 and higher gold sales volumes. The Q3 2026 realized gold price1 was 4% lower compared to Q2 2026. The increase in gold sales volumes was mainly due to higher grade open pit ore mined and processed at Cortez, improved mine to mill operational performance and higher grades processed at Kibali, and increased throughput and higher grades processed at Loulo-Gounkoto, partially offset by lower throughput at Pueblo Viejo. Lower gold COS/oz2 was primarily driven by changes in the sales mix across the portfolio, the shutdown activity in Q2 2026 and the impact of lower royalties due to a lower realized gold price1.
Factors affecting net earnings and adjusted net earnings1 - Q3 2026 versus Q3 2025
Net earnings and adjusted net earnings1 for Q3 2026 were $1,317 million and $1,347 million, respectively, compared to $1,302 million and $982 million, respectively in Q3 2025. The primary drivers of the increase were higher realized gold and copper prices1, as Q3 2026 realized gold and copper prices1 were 23% and 49% higher, respectively, when compared to Q3 2025. This was partially offset by a higher gold COS/oz2, mainly due to the impact of higher diesel prices across all operations, higher royalties associated with the higher realized gold price1 (impact approximately $60/oz), the change in the sales mix by site, higher tariffs at the NGM operations and the impacts related to adverse weather conditions at Veladero and Porgera.
YTD 2026 versus YTD 2025
Net earnings and adjusted net earnings1 for YTD 2026 were $4,136 million and $4,358 million, respectively, up from $2,587 million and $2,385 million in YTD 2025. The primary drivers of the increase were higher realized gold and copper prices1. YTD 2026 realized gold prices1 were 39% higher when compared to YTD 2025. This was partially offset by increases in gold COS/oz2 and copper COS/lb2. The increase in gold COS/oz2 compared to YTD 2025 was primarily due to higher diesel prices across all operations, higher royalties (impact approximately $75/oz) associated with the higher realized gold price1, the change in the sales mix by site, lower grades processed at Cortez and North Mara, and higher costs associated with the adverse weather conditions at Veladero and Porgera. The increase in copper COS/lb2 was due to higher diesel prices and local currency appreciation at Lumwana.
Significant adjusting items for both Q3 2026 and YTD 2026 include:
| ∎ | Other expense adjustments of $104 million and $358 million, respectively, mainly related to additional royalties, penalties and interest related to the retrospective application of the 2023 Mining Code to Loulo-Gounkoto for 2024 and 2025 and the remobilization costs at Loulo-Gounkoto. Other expense adjustments for YTD 2026 were further impacted by the gold inventory fair value adjustment after regaining control of Loulo-Gounkoto and costs associated with our North America IPO project which were expensed in H1 2026, partially offset by income related to the revaluation of the Hemlo contingent consideration. |
| ∎ | Acquisition/disposition gains/losses of $102 million and $111 million, respectively, mainly related to the sale of our share in the Bambadji project in Senegal. |
Refer to page 45 for a full list of reconciling items between net earnings and adjusted net earnings1 for the current and previous periods.
| BARRICK THIRD QUARTER 2026 | 38 | MANAGEMENT’S DISCUSSION AND ANALYSIS |
| OVERVIEW | OPERATING PERFORMANCE |
FUTURE GROWTH |
REVIEW OF FINANCIAL RESULTS |
OTHER INFORMATION & NON-GAAP RECONCILIATIONS |
FINANCIAL STATEMENTS | |||||
Financial Condition Review
Summary Balance Sheet and Key Financial Ratios
| ($ millions, except ratios and share amounts) |
As at 9/30/26 | As at 12/31/2025a | ||||||
| Total cash and equivalents |
5,589 | 6,706 | ||||||
| Current assets |
3,707 | 3,525 | ||||||
| Non-current assets |
43,551 | 41,425 | ||||||
| Total Assets |
52,847 | 51,656 | ||||||
| Current liabilities excluding short-term debt |
3,386 | 3,661 | ||||||
| Non-current liabilities excluding long-term debtb |
7,438 | 7,376 | ||||||
| Debt (current and long-term) |
4,680 | 4,703 | ||||||
| Total Liabilities |
15,504 | 15,740 | ||||||
| Total shareholders’ equity |
27,574 | 26,484 | ||||||
| Non-controlling interests |
9,769 | 9,432 | ||||||
| Total Equity |
37,343 | 35,916 | ||||||
| Total common shares outstanding (millions of shares)c |
1,629 | 1,675 | ||||||
| Debt, net of cash |
(909) | (2,003) | ||||||
| Key Financial Ratios: |
||||||||
| Current ratiod |
2.73:1 | 2.75:1 | ||||||
| Debt-to-equitye |
0.13:1 | 0.13:1 | ||||||
| Net leveragef |
-0.1:1 | -0.2:1 | ||||||
| a. | 2025 figures have been revised to reflect an update to the provisional purchase price allocation relating to Loulo-Gounkoto. |
| b. | Non-current financial liabilities as at September 30, 2026 were $5,471 million (December 31, 2025: $5,684 million). |
| c. | As of October 27, 2026, the number of common shares outstanding is 1,628,632,690. |
| d. | Represents current assets divided by current liabilities (including short-term debt) as at September 30, 2026 and December 31, 2025. |
| e. | Represents debt divided by total shareholders’ equity (including minority interest) as at September 30, 2026 and December 31, 2025. |
| f. | Further information on these non-GAAP financial measures, including detailed reconciliations, is included on pages 44 to 56 of this MD&A. |
Balance Sheet Review
Total assets were $52.8 billion as at September 30, 2026, slightly higher than total assets as at December 31, 2025.
Our asset base is primarily comprised of non-current assets such as property, plant and equipment and equity method investments, reflecting the capital-intensive nature of the mining business and our history of growing through acquisitions and creation of joint ventures with other mining companies. Other significant assets include production inventories, indirect taxes recoverable and receivable, concentrate sales receivable, other government and joint venture related receivables, as well as cash and equivalents.
Total liabilities as at September 30, 2026, were $15.5 billion, marginally lower than total liabilities at December 31, 2025, as we have settled various liabilities. Our liabilities are primarily comprised of debt, other non-current liabilities (such as provisions and deferred income tax liabilities), and accounts payable.
Financial Position and Liquidity
We believe we have sufficient financial resources to meet our business requirements for the foreseeable future, including capital expenditures, working capital requirements, interest payments, environmental rehabilitation, share buybacks and dividends.
Total cash and cash equivalents, as at September 30, 2026 were $5.6 billion. Our capital structure comprises a mix of debt, non-controlling interest (primarily at NGM) and shareholders’ equity. As at September 30, 2026, our total debt was $4.7 billion (cash and equivalents, net of debt was $909 million) and our debt-to-equity ratio was 0.13:1. This compares to total debt as at December 31,
2025, of $4.7 billion (cash and equivalents, net of debt was $2,003 million), and a debt-to-equity ratio of 0.13:1.
Uses of cash for the remainder of 2026 include capital commitments of $1.1 billion, and based on our annual guidance range on page 9, we expect to incur attributable capital expenditures1 for the year of $3.8 to $4.2 billion, of which we have spent $2.9 billion YTD 2026. For the remainder of 2026, we have contractual obligations and commitments of $0.9 billion for supplies and consumables. In addition, we have $124 million in interest payments and other amounts as detailed in the table on page 42. At the May 8, 2026 meeting, the Board of Directors authorized a new share buyback program, where we may purchase up to $3 billion of Barrick shares over the next 12 months. As at September 30, 2026, we have purchased $1.97 billion of shares under this program. We expect to fund these commitments through operating cash flow, which is our primary source of liquidity, as well as our existing cash balances as necessary.
The Company’s dividend policy targets a total payout of 50% of attributable free cash flow1 on an annualized basis, comprised of a fixed base quarterly dividend of $0.175 per share and a performance top-up component at each year end based on the attributable free cash flow during the year. The dividend paid in any given year may be higher or lower than the 50% target based on the strength of cash flow, capital needs, balance sheet considerations, and other factors.
The declaration and payment of dividends is at the discretion of the Board of Directors, and will depend on the Company’s financial results, cash requirements, future prospects, the number of outstanding common shares, and other factors deemed relevant by the Board.
| BARRICK THIRD QUARTER 2026 | 39 | MANAGEMENT’S DISCUSSION AND ANALYSIS |
| OVERVIEW | OPERATING PERFORMANCE |
FUTURE GROWTH |
REVIEW OF FINANCIAL RESULTS |
OTHER INFORMATION & NON-GAAP RECONCILIATIONS |
FINANCIAL STATEMENTS | |||||
Our operating cash flow is dependent on the ability of our operations to deliver projected future cash flows. The sale of the gold and copper we produce and the market price of gold and, to a lesser extent, copper, are the primary drivers of our operating cash flow. Other options to enhance liquidity include portfolio optimization; issuance of equity or long-term debt securities in the public markets or to private investors (Moody’s and S&P currently rate Barrick’s outstanding long-term debt as investment grade, with ratings of A3 and BBB+, respectively); and drawing on the $3.0 billion available under our undrawn Credit Facility (subject to compliance with covenants and the making of certain representations and warranties, this facility is available for drawdown as a source of financing). The revolving Credit Facility has a termination date of May 2030 and incorporates sustainability-linked metrics comprising annual environmental and social performance targets directly influenced by Barrick’s actions, rather than based on external ratings. The performance targets include Scope 1 and Scope 2 GHG emissions intensity, water use efficiency (reuse and recycling rates), and TRIFR3. Barrick may incur positive or negative pricing adjustments on drawn credit spreads and standby fees based on its sustainability performance versus the targets that have been set. The key financial covenant in our undrawn Credit Facility requires Barrick to maintain a net debt to total capitalization ratio of less than 0.60:1. Barrick’s net debt to total capitalization ratio was negative 0.02:1 as at September 30, 2026 (negative 0.06:1 as at December 31, 2025).
Summary of Cash Inflow (Outflow)
| ($ millions) |
For the three months ended |
For the nine months ended |
||||||||||||||||||
| 9/30/26 | 6/30/26 | 9/30/25 | 9/30/26 | 9/30/25 | ||||||||||||||||
| Net cash provided by operating activities |
2,489 | 1,704 | 2,422 | 6,747 | 4,963 | |||||||||||||||
| Investing activities |
||||||||||||||||||||
| Capital expenditures |
(1,322 | ) | (1,189 | ) | (943 | ) | (3,490 | ) | (2,714 | ) | ||||||||||
| Divestitures |
98 | 41 | 0 | 135 | 999 | |||||||||||||||
| Income taxes paid on divestitures |
(13 | ) | (7 | ) | (44 | ) | (20 | ) | (131 | ) | ||||||||||
| Funding of equity method investments |
0 | (2 | ) | (1 | ) | (2 | ) | (1 | ) | |||||||||||
| Dividends received from equity method investments |
100 | 167 | 63 | 377 | 154 | |||||||||||||||
| Shareholder loans to equity method investments |
(16 | ) | 84 | 64 | 215 | 177 | ||||||||||||||
| Investment (purchases) sales |
(15 | ) | 0 | 0 | 95 | 0 | ||||||||||||||
| Other |
7 | 6 | 0 | 15 | 2 | |||||||||||||||
| Total investing outflows |
(1,161 | ) | (900 | ) | (861 | ) | (2,675 | ) | (1,514 | ) | ||||||||||
| Net change in debta |
(3 | ) | (52 | ) | (3 | ) | (60 | ) | (22 | ) | ||||||||||
| Dividendsb |
(280 | ) | (288 | ) | (254 | ) | (1,265 | ) | (596 | ) | ||||||||||
| Net disbursements to non-controlling interests |
(619 | ) | (491 | ) | (423 | ) | (1,914 | ) | (828 | ) | ||||||||||
| Share buyback program |
(761 | ) | (1,209 | ) | (589 | ) | (1,970 | ) | (1,000 | ) | ||||||||||
| Other |
(3 | ) | 32 | (26 | ) | 20 | (9 | ) | ||||||||||||
| Total financing outflows |
(1,666 | ) | (2,008 | ) | (1,295 | ) | (5,189 | ) | (2,455 | ) | ||||||||||
| Effect of exchange rate |
0 | 0 | 1 | 0 | 1 | |||||||||||||||
| (Decrease) increase in cash and equivalents |
(338 | ) | (1,204 | ) | 267 | (1,117 | ) | 995 | ||||||||||||
| a. | The difference between the net change in debt on a cash basis and the net change on the balance sheet is due to changes in non-cash charges, specifically the unwinding of discounts and amortization of debt issue costs. |
| b. | For Q3 2026 and YTD 2026, we declared and paid dividends per share in US dollars totaling $0.175 and $0.77 respectively (Q2 2026: declared and paid $0.175; Q3 2025: declared and paid $0.15; YTD 2025 declared and paid $0.35). |
Q3 2026 compared to Q2 2026
In Q3 2026, we generated $2,489 million in operating cash flow, compared to $1,704 million in Q2 2026. The increase of $785 million was primarily due to lower cash taxes paid (primarily in the US and Argentina) and Q2 2026 also included a payment to the Government of Mali in relation to Loulo-Gounkoto due to the retrospective application of the 2023 Mining Code. This was further impacted by a favourable change in working capital, mainly in other current liabilities and accounts receivable.
Cash outflows from investing activities in Q3 2026 were $1,161 million compared to $900 million in Q2 2026. The increase of $261 million was primarily due to higher capital expenditures, primarily at Lumwana due to the Super Pit Expansion project and increased capitalized stripping, as well as the ramp up of operations at Loulo-Gounkoto.
In Q3 2026, we recorded free cash flow1 of $1,167 million, compared to $515 million in Q2 2026, reflecting
| BARRICK THIRD QUARTER 2026 | 40 | MANAGEMENT’S DISCUSSION AND ANALYSIS |
| OVERVIEW | OPERATING PERFORMANCE |
FUTURE GROWTH |
REVIEW OF FINANCIAL RESULTS |
OTHER INFORMATION & NON-GAAP RECONCILIATIONS |
FINANCIAL STATEMENTS | |||||
higher operating cash flows, partially offset by higher capital expenditures than Q2 2026, as explained above.
Net financing cash outflows for Q3 2026 amounted to $1,666 million, compared to $2,008 million in Q2 2026. The decrease of $342 million was primarily due to lower share buybacks, partially offset by higher disbursements paid to non-controlling interests, primarily to Newmont in relation to their interest in NGM.
Q3 2026 compared to Q3 2025
In Q3 2026, we generated $2,489 million in operating cash flow, compared to $2,422 million in Q3 2025. The increase of $67 million was primarily due to a higher realized gold price1, partially offset by higher gold TCC/oz1 and increased cash taxes paid.
Cash outflows from investing activities in Q3 2026 were $1,161 million compared to cash outflows of $861 million in Q3 2025. The increase of $300 million was mainly due to higher capital expenditures primarily at Lumwana relating to the Super Pit Expansion project, as well as the ramp up of operations at Loulo-Gounkoto.
In Q3 2026, we recorded free cash flow1 of $1,167 million, compared to $1,479 million in Q3 2025, mainly due to higher capital expenditures than Q3 2025, as explained above.
Net financing cash outflows for Q3 2026 amounted to $1,666 million compared to $1,295 million in Q3 2025. The increase of $371 million is primarily due to increased repurchases of shares under our share buyback program, combined with higher net disbursements paid to non-controlling interests, primarily to Newmont in relation to their interest in NGM.
YTD 2026 compared to YTD 2025
For YTD 2026, we generated $6,747 million in operating cash flow, compared to $4,963 million in YTD 2025. The increase of $1,784 million was primarily due to a higher realized gold price1, partially offset by higher TCC/oz1. This was further impacted by an unfavorable change in working capital mainly in accounts receivable, higher cash taxes paid (in particular in the United States, Argentina, Zambia and the Dominican Republic) and payments made at Loulo-Gounkoto in relation to the retrospective application of the 2023 Mining Code.
Cash outflows from investing activities for YTD 2026 were $2,675 million compared to $1,514 million in YTD 2025. The increase of $1,161 million was primarily due to proceeds received in 2025 from the sale of our 50% interest in the Donlin Gold project. This was combined with higher project capital expenditures1 mainly related to Lumwana’s Super Pit Expansion project and at Loulo-Gounkoto due to the ramp up of operations.
In YTD 2026, we recorded free cash flow1 of $3,257 million, compared to $2,249 million in YTD 2025, mainly reflecting higher operating cash flows, partially offset by higher capital expenditures than YTD 2025, as explained above.
Net financing cash outflows for YTD 2026 amounted to $5,189 million, compared to $2,455 million in YTD 2025. The increased outflow of $2,734 million is primarily due to higher net disbursements paid to non-controlling interests, primarily to Newmont in relation to their interest in NGM, as well as increased repurchases of shares under our share buyback program and higher dividends paid as a result of our new dividend policy.
| BARRICK THIRD QUARTER 2026 | 41 | MANAGEMENT’S DISCUSSION AND ANALYSIS |
| OVERVIEW | OPERATING PERFORMANCE |
FUTURE GROWTH |
REVIEW OF FINANCIAL RESULTS |
OTHER INFORMATION & NON-GAAP RECONCILIATIONS |
FINANCIAL STATEMENTS | |||||
Commitments and Contingencies
Litigation and Claims
We are currently subject to various litigation proceedings as disclosed in note 17 to the Financial Statements, and we may be involved in disputes with other parties in the future that may result in litigation. If we are unable to resolve these disputes favorably, it may have a material adverse impact on our financial condition, cash flow and results of operations.
Contractual Obligations and Commitments
In the normal course of business, we enter into contracts that give rise to commitments for future minimum payments. The following table summarizes the remaining contractual maturities of our financial liabilities and operating and capital commitments shown on an undiscounted basis:
| ($ millions) |
Payments due as at 9/30/26 | |||||||||||||||||||||||||||
| 2026 | 2027 | 2028 | 2029 | 2030 | 2031 and thereafter |
Total | ||||||||||||||||||||||
| Debta |
||||||||||||||||||||||||||||
| Repayment of principal |
0 | 0 | 0 | 0 | 0 | 4,630 | 4,630 | |||||||||||||||||||||
| Capital leases |
4 | 16 | 9 | 6 | 5 | 30 | 70 | |||||||||||||||||||||
| Interest |
124 | 282 | 281 | 280 | 280 | 2,412 | 3,659 | |||||||||||||||||||||
| Provisions for environmental rehabilitationb |
88 | 122 | 83 | 85 | 65 | 1,920 | 2,363 | |||||||||||||||||||||
| Restricted share units |
34 | 53 | 8 | 0 | 0 | 0 | 95 | |||||||||||||||||||||
| Pension benefits and other post-retirement benefits |
4 | 5 | 5 | 4 | 4 | 72 | 94 | |||||||||||||||||||||
| Purchase obligations for supplies and consumablesc |
896 | 508 | 308 | 160 | 148 | 1,890 | 3,910 | |||||||||||||||||||||
| Capital commitmentsd |
1,119 | 688 | 467 | 99 | 2 | 0 | 2,375 | |||||||||||||||||||||
| Social development costse |
55 | 26 | 20 | 9 | 6 | 54 | 170 | |||||||||||||||||||||
| Other obligationsf |
88 | 81 | 78 | 86 | 69 | 512 | 914 | |||||||||||||||||||||
| Total |
2,412 | 1,781 | 1,259 | 729 | 579 | 11,520 | 18,280 | |||||||||||||||||||||
| a. | Debt and Interest: Our debt obligations do not include any subjective acceleration clauses or other clauses that enable the holder of the debt to call for early repayment, except in the event that we breach any of the terms and conditions of the debt or for other customary events of default. We are not required to post any collateral under any debt obligations. Projected interest payments on variable rate debt were based on interest rates in effect at September 30, 2026. Interest is calculated on our long-term debt obligations using both fixed and variable rates. |
| b. | Provisions for environmental rehabilitation: Amounts presented in the table represent the undiscounted uninflated future payments for the expected cost of environmental rehabilitation. |
| c. | Purchase obligations for supplies and consumables: Includes commitments related to new purchase obligations to secure supplies of consumables such as liquid natural gas, acid, tires and cyanide for our production process and spares for heavy mining equipment. |
| d. | Capital commitments: Purchase obligations for capital expenditures include only those items where binding commitments have been entered into. |
| e. | Social development costs: Includes a commitment of $14 million in 2031 and thereafter, related to the funding of a power transmission line in Argentina. |
| f. | Other obligations includes the Pueblo Viejo joint venture partner shareholder loan, the deposit on the Pascua-Lama silver sale agreement with Wheaton Precious Metals Corp. due in 2039, the settlement of legacy legal matters in the Philippines related to Placer Dome Inc., the royalties, penalties and applicable interest on the amounts payable to the Government of Mali for the application of the 2023 Mining Code, and minimum royalty payments. |
| BARRICK THIRD QUARTER 2026 | 42 | MANAGEMENT’S DISCUSSION AND ANALYSIS |
| OVERVIEW | OPERATING PERFORMANCE |
FUTURE GROWTH |
REVIEW OF FINANCIAL RESULTS |
OTHER INFORMATION & NON-GAAP RECONCILIATIONS |
FINANCIAL STATEMENTS | |||||
Review of Quarterly Results
Quarterly Informationa
| ($ millions, except where indicated) |
2026 | 2026 | 2026 | 2025 | 2025 | 2025 | 2025 | 2024 | ||||||||||||||||||||||||
| Q3 | Q2 | Q1 | Q4 | Q3 | Q2 | Q1 | Q4 | |||||||||||||||||||||||||
| Revenues |
5,073 | 5,292 | 5,218 | 5,997 | 4,148 | 3,681 | 3,130 | 3,645 | ||||||||||||||||||||||||
| Realized price/oz – goldb |
4,243 | 4,417 | 4,823 | 4,177 | 3,457 | 3,295 | 2,898 | 2,657 | ||||||||||||||||||||||||
| Realized price/lb – copperb |
6.54 | 6.15 | 5.79 | 5.42 | 4.39 | 4.36 | 4.51 | 3.96 | ||||||||||||||||||||||||
| Cost of sales |
2,361 | 2,395 | 2,099 | 2,712 | 1,890 | 1,878 | 1,785 | 1,995 | ||||||||||||||||||||||||
| Net earnings |
1,317 | 1,217 | 1,602 | 2,406 | 1,302 | 811 | 474 | 996 | ||||||||||||||||||||||||
| Per share (dollars)c |
0.80 | 0.73 | 0.96 | 1.43 | 0.76 | 0.47 | 0.27 | 0.57 | ||||||||||||||||||||||||
| Adjusted net earningsb |
1,347 | 1,363 | 1,648 | 1,754 | 982 | 800 | 603 | 794 | ||||||||||||||||||||||||
| Per share (dollars)b,c |
0.82 | 0.82 | 0.98 | 1.04 | 0.58 | 0.47 | 0.35 | 0.46 | ||||||||||||||||||||||||
| Operating cash flow |
2,489 | 1,704 | 2,554 | 2,726 | 2,422 | 1,329 | 1,212 | 1,392 | ||||||||||||||||||||||||
| Attributable operating cash flowb |
1,799 | 1,119 | 1,968 | 1,966 | 1,911 | 929 | 1,042 | 1,263 | ||||||||||||||||||||||||
| Consolidated capital expendituresd |
1,322 | 1,189 | 979 | 1,107 | 943 | 934 | 837 | 891 | ||||||||||||||||||||||||
| Free cash flowb |
1,167 | 515 | 1,575 | 1,619 | 1,479 | 395 | 375 | 501 | ||||||||||||||||||||||||
| Attributable free cash flowb |
642 | 141 | 1,213 | 1,060 | 1,154 | 212 | 411 | 505 | ||||||||||||||||||||||||
| a. | Sum of all the quarters may not add up to the annual total due to rounding. |
| b. | Further information on these non-GAAP financial measures, including detailed reconciliations, is included on pages 44 to 56 of this MD&A. |
| c. | Calculated using weighted average number of shares outstanding under the basic method of earnings per share. |
| d. | Amounts presented on a consolidated cash basis. |
Our recent financial results reflect the significant increase in the gold price and ongoing strength in the copper price, resulting in strong cash flows over the past several quarters. The positive operating cash flow generated has allowed us to continue to reinvest in our business including our key growth projects, maintain a strong balance sheet and increase returns to shareholders.
In addition to the strength in metal prices, net earnings have also been impacted by the following items in each quarter, which have been excluded from adjusted net earnings1. In 2025, we recorded a net loss of $625 million on the deconsolidation of Loulo-Gounkoto following the change of control after it was placed under a temporary provisional administration on June 16, 2025 and subsequent accounting impact of regaining control on December 16, 2025, which impacted Q2, Q3 and Q4 of
2025. In addition, in Q4 2025, we recorded a gain on the sale of our Hemlo gold mine ($545 million), our interest in the Tongon gold mine ($134 million) and the Alturas project ($53 million). In Q2 2025, we recorded a net loss of $1,035 million on the deconsolidation of Loulo-Gounkoto following the change of control after it was placed under a temporary provisional administration on June 16, 2025, which was partially offset by the recognition of our 80% equity investment in Loulo-Gounkoto. In addition, we recorded a gain of $745 million on the sale of our 50% interest in the Donlin Gold project. In Q4 2024, we recorded non-current asset impairment reversals of $655 million at Lumwana and $437 million at Veladero. In addition, we recorded a goodwill impairment of $484 million related to Loulo-Gounkoto.
Internal Control Over Financial Reporting and Disclosure Controls and Procedures
Management is responsible for establishing and maintaining adequate internal control over financial reporting and disclosure controls and procedures as defined in our 2025 annual MD&A.
Together, the internal control frameworks provide internal control over financial reporting and disclosure. Due to its inherent limitations, internal control over financial reporting and disclosure may not prevent or detect all misstatements. Further, the effectiveness of internal control is subject to the risk that controls may become inadequate because of changes in conditions, or that the degree of compliance with policies or procedures may change.
There were no changes in our internal controls over financial reporting during the three months ended September 30, 2026 that have materially affected, or are reasonably likely to materially affect, our internal controls over financial reporting.
Under the supervision and with the participation of management, including the President and Chief Executive Officer, and Senior Executive Vice-President, Chief Financial Officer, management will continue to monitor and evaluate the design and effectiveness of its internal control over financial reporting and disclosure controls and procedures, and may make modifications from time to time as considered necessary.
| BARRICK THIRD QUARTER 2026 | 43 | MANAGEMENT’S DISCUSSION AND ANALYSIS |
| OVERVIEW | OPERATING PERFORMANCE |
FUTURE GROWTH |
REVIEW OF FINANCIAL RESULTS |
OTHER INFORMATION & NON-GAAP RECONCILIATIONS |
FINANCIAL STATEMENTS | |||||
IFRS Critical Accounting Policies and Accounting Estimates
Management has discussed the development and selection of our critical accounting estimates with the Audit & Risk Committee of the Board of Directors, and the Audit & Risk Committee has reviewed the disclosure relating to such estimates in conjunction with its review of this MD&A. The accounting policies and methods we utilize determine how we report our financial condition and results of operations, and they may require management to make estimates or rely on assumptions about matters that are inherently uncertain. The consolidated financial statements have been prepared in accordance with IFRS. Our material accounting policies are disclosed in note 2 of the Financial Statements, including a summary of current and future changes in accounting policies.
Critical Accounting Estimates and Judgments
Certain accounting estimates have been identified as being “critical” to the presentation of our financial condition and results of operations because they require us to make subjective and/or complex judgments about matters that are inherently uncertain; or there is a reasonable likelihood that materially different amounts could be reported under different conditions or using different assumptions and estimates. Our significant accounting judgments, estimates and assumptions are disclosed in note 3 of the accompanying Financial Statements.
Non-GAAP Financial Measures
Adjusted Net Earnings and Adjusted Net Earnings per Share
Adjusted net earnings is a non-GAAP financial measure which excludes the following from net earnings:
| ∎ | Impairment charges (reversals) related to intangibles, goodwill, property, plant and equipment, and investments; |
| ∎ | Acquisition/disposition gains/losses; |
| ∎ | Foreign currency translation gains/losses; |
| ∎ | Significant tax adjustments; |
| ∎ | Other items that are not indicative of the underlying operating performance of our core mining business; and |
| ∎ | Tax effect and non-controlling interest of the above items. |
Management uses this measure internally to evaluate our underlying operating performance for the reporting periods presented and to assist with the planning and forecasting of future operating results. Management believes that adjusted net earnings is a useful measure of our performance because impairment charges, acquisition/ disposition gains/losses and significant tax adjustments do not reflect the underlying operating performance of our core mining business and are not necessarily indicative of future operating results. Furthermore, foreign currency translation gains/losses are not necessarily reflective of the underlying operating results for the reporting periods presented. The tax effect and non-controlling interest of the adjusting items are also excluded to reconcile the amounts to Barrick’s share on a post-tax basis, consistent with net earnings.
As noted, we use this measure for internal purposes. Management’s internal budgets and forecasts and public guidance do not reflect the types of items we adjust for. Consequently, the presentation of adjusted net earnings enables investors and analysts to better understand the underlying operating performance of our core mining business through the eyes of management. Management periodically evaluates the components of adjusted net earnings based on an internal assessment of performance measures that are useful for evaluating the operating performance of our business segments and a review of the non-GAAP financial measures used by mining industry analysts and other mining companies.
Adjusted net earnings is intended to provide additional information only and does not have any standardized definition under IFRS and should not be considered in isolation or as a substitute for measures of performance prepared in accordance with IFRS. The measures are not necessarily indicative of operating profit or cash flow from operations as determined under IFRS. Other companies may calculate these measures differently. The following table reconciles these non-GAAP financial measures to the most directly comparable IFRS measure.
| BARRICK THIRD QUARTER 2026 | 44 | MANAGEMENT’S DISCUSSION AND ANALYSIS |
| OVERVIEW | OPERATING PERFORMANCE |
FUTURE GROWTH |
REVIEW OF FINANCIAL RESULTS |
OTHER INFORMATION & NON-GAAP RECONCILIATIONS |
FINANCIAL STATEMENTS | |||||
Reconciliation of Net Earnings to Net Earnings per Share, Adjusted Net Earnings and Adjusted Net Earnings per Share
| ($ millions, except per share amounts in dollars) |
For the three months ended | For the nine months ended | ||||||||||||||||||
| 9/30/26 | 6/30/26 | 9/30/25 | 9/30/26 | 9/30/25 | ||||||||||||||||
| Net earnings attributable to equity holders of the Company |
1,317 | 1,217 | 1,302 | 4,136 | 2,587 | |||||||||||||||
| Impairment (reversals) charges related to intangibles, goodwill, property, plant and equipment, and investmentsa |
(1 | ) | (1 | ) | 3 | (2 | ) | 7 | ||||||||||||
| Acquisition/disposition (gains) lossesb |
(102 | ) | (10 | ) | (250 | ) | (111 | ) | 39 | |||||||||||
| (Gain) loss on currency translation |
1 | 14 | (3 | ) | 35 | (3 | ) | |||||||||||||
| Significant tax adjustmentsc |
31 | (6 | ) | (119 | ) | 60 | (169 | ) | ||||||||||||
| Other expense adjustmentsd |
104 | 236 | 47 | 358 | 264 | |||||||||||||||
| Non-controlling interest |
(2 | ) | (77 | ) | 0 | (87 | ) | (15 | ) | |||||||||||
| Tax effecte |
(1 | ) | (10 | ) | 2 | (31 | ) | (325 | ) | |||||||||||
| Adjusted net earnings |
1,347 | 1,363 | 982 | 4,358 | 2,385 | |||||||||||||||
| Net earnings per sharef |
0.80 | 0.73 | 0.76 | 2.49 | 1.51 | |||||||||||||||
| Adjusted net earnings per sharef |
0.82 | 0.82 | 0.58 | 2.62 | 1.39 | |||||||||||||||
| a. | There were no significant impairment charges or reversals in the current period or prior periods. |
| b. | Acquisition/disposition (gains) losses for Q3 2026 and YTD 2026 mainly relate to the sale of our share in the Bambadji project in Senegal. For Q3 2025, acquisition/disposition (gains) losses mainly relate to the $250 million revaluation of our 80% equity investment in Loulo-Gounkoto, following its deconsolidation and recognition as an investment at fair value in Q2 2025. For YTD 2025, this was combined with the $1,035 million loss recognized on the deconsolidation of Loulo-Gounkoto in Q2 2025 and a gain of $745 million on the sale of our 50% interest in the Donlin Gold project. |
| c. | Significant tax adjustments for Q3 2026 and YTD 2026 primarily include adjustments in respect of prior years, the re-measurement of current and deferred tax balances and the impact of uncertain tax positions. Significant tax adjustments for Q3 2025 and YTD 2025 include the re-measurement of deferred tax balances and adjustments in respect of prior years. |
| d. | Other expense adjustments for the Q3 2026 and YTD 2026 periods mainly related to additional royalties, penalties and interest related to the retrospective application of the 2023 Mining Code to Loulo-Gounkoto for 2024 and 2025 and the remobilization costs at Loulo-Gounkoto. YTD 2026 was further impacted by the gold inventory fair value adjustment after regaining control of Loulo-Gounkoto, and costs associated with our North America IPO project which were expensed in H1 2026, partially offset by income related to the revaluation of the Hemlo contingent consideration. Other expense adjustments for the 2025 periods mainly relate to reduced operations costs at Loulo-Gounkoto, and costs related to the signing of agreements to settle legacy legal matters in the Philippines related to Placer Dome Inc. |
| e. | Tax effect for Q3 2026 and YTD 2026 mainly relates to other expense adjustments. For Q3 2025 and YTD 2025 tax effect primarily relates to acquisition/disposition losses (gains). |
| f. | Calculated using weighted average number of shares outstanding under the basic method of earnings per share. |
Free Cash Flow, Attributable Free Cash Flow and Attributable Operating Cash Flow
Free cash flow is a non-GAAP financial measure that deducts capital expenditures from net cash provided by operating activities. Attributable free cash flow starts with free cash flow and adds our attributable share of free cash flow from our equity investees and subtracts the free cash flow attributable to the non-controlling interests. Management believes these to be useful indicators of our ability to operate without reliance on additional borrowing or usage of existing cash.
Starting with our Q1 2026 MD&A, we are presenting attributable operating cash flow. Attributable operating cash flow starts with cash provided by operating activities and adds our attributable share of cash provided by operating activities from our equity investees and subtracts the cash provided by operating activities
attributable to the non-controlling interests. Management believes this to be a useful indicator of the amount of cash provided by operating activities to Barrick’s ownership share.
Free cash flow, attributable free cash flow and attributable operating cash flow are intended to provide additional information only and do not have any standardized definition under IFRS and should not be considered in isolation or as a substitute for measures of performance prepared in accordance with IFRS. These measures are not necessarily indicative of operating profit or cash flow from operations as determined under IFRS. Other companies may calculate these measures differently. The following table reconciles these non-GAAP financial measures to the most directly comparable IFRS measure.
Reconciliation of Net Cash Provided by Operating Activities to Free Cash Flow, Attributable Free Cash Flow and Attributable Operating Cash Flow
| ($ millions) |
For the three months ended | For the nine months ended | ||||||||||||||||||
| 9/30/26 | 6/30/26 | 9/30/25 | 9/30/26 | 9/30/25 | ||||||||||||||||
| Net cash provided by operating activities |
2,489 | 1,704 | 2,422 | 6,747 | 4,963 | |||||||||||||||
| Capital expenditures |
(1,322 | ) | (1,189 | ) | (943 | ) | (3,490 | ) | (2,714 | ) | ||||||||||
| Free cash flow (consolidated) |
1,167 | 515 | 1,479 | 3,257 | 2,249 | |||||||||||||||
| Free cash flow applicable to equity investees |
80 | 113 | 191 | 523 | 413 | |||||||||||||||
| Non-controlling interests |
(605 | ) | (487 | ) | (516 | ) | (1,784 | ) | (885 | ) | ||||||||||
| Attributable free cash flow |
642 | 141 | 1,154 | 1,996 | 1,777 | |||||||||||||||
| Attributable capital expenditures |
1,157 | 978 | 757 | 2,890 | 2,105 | |||||||||||||||
| Attributable operating cash flow |
1,799 | 1,119 | 1,911 | 4,886 | 3,882 | |||||||||||||||
| BARRICK THIRD QUARTER 2026 | 45 | MANAGEMENT’S DISCUSSION AND ANALYSIS |
| OVERVIEW | OPERATING PERFORMANCE |
FUTURE GROWTH |
REVIEW OF FINANCIAL RESULTS |
OTHER INFORMATION & NON-GAAP RECONCILIATIONS |
FINANCIAL STATEMENTS | |||||
Capital Expenditures
Capital expenditures are classified into minesite sustaining capital expenditures or project capital expenditures depending on the nature of the expenditure. Minesite sustaining capital expenditures is the capital spending required to support current production levels. Project capital expenditures represent the capital spending at new projects and major, discrete projects at existing operations intended to increase net present value through higher production or longer mine life. Management believes this to be a useful indicator of the purpose of capital expenditures
and this distinction is an input into the calculation of all-in sustaining costs per ounce/pound.
Classifying capital expenditures is intended to provide additional information only and does not have any standardized definition under IFRS, and should not be considered in isolation or as a substitute for measures of performance prepared in accordance with IFRS. Other companies may calculate these measures differently. The following table reconciles these non-GAAP financial measures to the most directly comparable IFRS measure.
Reconciliation of the Classification of Capital Expenditures
| ($ millions) |
For the three months ended | For the nine months ended | ||||||||||||||||||
| 9/30/26 | 6/30/26 | 9/30/25 | 9/30/26 | 9/30/25 | ||||||||||||||||
| Minesite sustaining capital expenditures |
593 | 500 | 395 | 1,473 | 1,438 | |||||||||||||||
| Project capital expenditures |
686 | 654 | 532 | 1,910 | 1,240 | |||||||||||||||
| Capitalized interest |
43 | 35 | 16 | 107 | 36 | |||||||||||||||
| Total consolidated capital expenditures |
1,322 | 1,189 | 943 | 3,490 | 2,714 | |||||||||||||||
Total cash costs per ounce, All-in sustaining costs per ounce, C1 cash costs per pound and All-in sustaining costs per pound
TCC/oz and AISC/oz are non-GAAP financial measures which are calculated based on the definition published by the WGC (a market development organization for the gold industry comprised of and funded by gold mining companies from around the world, including Barrick). The WGC is not a regulatory organization. Management uses these measures to monitor the performance of our gold mining operations and their ability to generate positive cash flow, both on an individual site basis and an overall gold operations basis.
TCC/oz starts with our cost of sales related to gold production and removes depreciation, the non-controlling interest of cost of sales and costs allocated to by-products. AISC/oz starts with TCC/oz and includes sustaining capital expenditures, sustaining leases, general and administrative costs, minesite exploration and evaluation costs related to the current mine plan and reclamation cost accretion and amortization. These additional costs reflect the expenditures made to maintain current production levels.
We believe that our use of TCC/oz and AISC/oz will assist analysts, investors and other stakeholders of Barrick in understanding the costs associated with producing gold, understanding the economics of gold mining, assessing our operating performance and also our ability to generate free cash flow from the gold operations portion of our business. Due to the capital-intensive nature of the industry and the long useful lives over which these items are depreciated, there can be a significant timing difference between net earnings calculated in accordance with IFRS and the amount of free cash flow that is being generated by a mine and therefore we believe these measures are useful non-GAAP operating metrics and supplement our IFRS disclosures. These measures are not
representative of all of our cash expenditures as they do not include income tax payments, interest costs or dividend payments. These measures do not include depreciation or amortization.
TCC/oz and AISC/oz are intended to provide additional information only and do not have standardized definitions under IFRS and should not be considered in isolation or as a substitute for measures of performance prepared in accordance with IFRS. These measures are not equivalent to net income or cash flow from operations as determined under IFRS. Although the WGC has published a standardized definition, other companies may calculate these measures differently.
C1 cash costs/lb and AISC/lb are non-GAAP financial measures related to our copper mine operations. We believe that C1 cash costs/lb enables investors to better understand the performance of our copper operations in comparison to other copper producers who present results on a similar basis. C1 cash costs/lb excludes royalties and production taxes and non-routine charges as they are not direct production costs. AISC/lb is similar to the gold AISC metric and management uses this to better evaluate the costs of copper production. We believe this measure enables investors to better understand the operating performance of the copper portion of our business as this measure reflects all of the sustaining expenditures incurred in order to produce copper. AISC/lb includes C1 cash costs, sustaining capital expenditures, sustaining leases, general and administrative costs, minesite exploration and evaluation costs, royalties and production taxes, reclamation cost accretion and amortization and write-downs taken on inventory to net realizable value.
| BARRICK THIRD QUARTER 2026 | 46 | MANAGEMENT’S DISCUSSION AND ANALYSIS |
| OVERVIEW | OPERATING PERFORMANCE |
FUTURE GROWTH |
REVIEW OF FINANCIAL RESULTS |
OTHER INFORMATION & NON-GAAP RECONCILIATIONS |
FINANCIAL STATEMENTS | |||||
Reconciliation of Gold Cost of Sales to Total cash costs and All-in sustaining costs, including on a per ounce basis
| ($ millions, except per oz information in dollars) |
For the three months ended | For the nine months ended | ||||||||||||||||||||
| Footnote | 9/30/26 | 6/30/26 | 9/30/25 | 9/30/26 | 9/30/25 | |||||||||||||||||
| COS applicable to gold production |
2,085 | 2,109 | 1,690 | 6,068 | 4,934 | |||||||||||||||||
| Depreciation |
(493 | ) | (478 | ) | (384 | ) | (1,420 | ) | (1,085 | ) | ||||||||||||
| Total cash costs applicable to equity method investments |
123 | 130 | 114 | 381 | 324 | |||||||||||||||||
| Costs allocated to by-products |
(125 | ) | (128 | ) | (80 | ) | (372 | ) | (204 | ) | ||||||||||||
| Other |
a | 4 | (8 | ) | 5 | (37 | ) | 21 | ||||||||||||||
| Non-controlling interests |
b | (470 | ) | (484 | ) | (393 | ) | (1,363 | ) | (1,168 | ) | |||||||||||
| Total cash costs |
1,124 | 1,141 | 952 | 3,257 | 2,822 | |||||||||||||||||
| General & administrative costs |
51 | 31 | 77 | 121 | 158 | |||||||||||||||||
| Minesite exploration and evaluation costs |
c | 1 | 4 | 7 | 9 | 19 | ||||||||||||||||
| Minesite sustaining capital expenditures |
d | 593 | 500 | 395 | 1,473 | 1,438 | ||||||||||||||||
| Sustaining leases |
8 | 2 | 7 | 16 | 22 | |||||||||||||||||
| Rehabilitation - accretion and amortization (operating sites) |
e | 17 | 17 | 17 | 50 | 50 | ||||||||||||||||
| Non-controlling interest, copper operations and other |
f | (247 | ) | (201 | ) | (171 | ) | (607 | ) | (596 | ) | |||||||||||
| All-in sustaining costs |
1,547 | 1,494 | 1,284 | 4,319 | 3,913 | |||||||||||||||||
| Ounces sold - attributable basis (koz) |
g | 810 | 801 | 837 | 2,359 | 2,358 | ||||||||||||||||
| COS/oz |
h,i | 1,950 | 1,993 | 1,562 | 1,956 | 1,613 | ||||||||||||||||
| TCC/oz |
i | 1,386 | 1,426 | 1,137 | 1,381 | 1,197 | ||||||||||||||||
| AISC/oz |
i | 1,911 | 1,866 | 1,538 | 1,831 | 1,660 | ||||||||||||||||
| a. | Other - Other adjustments mainly relate to treatment and refining charges. |
| b. | Non-controlling interests - Non-controlling interests include non-controlling interests related to gold production of $669 million and $1,951 million for Q3 2026 and YTD 2026, respectively, (Q2 2026: $682 million; Q3 2025: $540 million, YTD 2025 $1,567 million ). Non-controlling interests include NGM, Pueblo Viejo, Loulo-Gounkoto, Tongon, North Mara and Bulyanhulu. Refer to Note 5 to the Financial Statements for further information. |
| c. | Exploration and evaluation costs - Exploration, evaluation and project expenses are included in AISC if they support current mine operations. |
| d. | Capital expenditures - Capital expenditures are related to our gold sites only and are split between minesite sustaining and project capital expenditures. |
| e. | Rehabilitation—accretion and amortization - Includes depreciation on the assets related to rehabilitation provisions of our gold operations and accretion on the rehabilitation provision of our gold operations, split between operating and non-operating sites. |
| f. | Non-controlling interest and copper operations - Removes general and administrative costs related to non-controlling interests and copper based on a percentage allocation of revenue. Also removes exploration, evaluation and project expenses, rehabilitation costs and capital expenditures incurred by our copper sites and the non-controlling interests related to NGM, Pueblo Viejo, Loulo-Gounkoto, Tongon, North Mara and Bulyanhulu operating segments. It also includes capital expenditures applicable to our equity method investment in Kibali. The impact is summarized as the following: |
| ($ millions) |
For the three months ended | For the nine months ended | ||||||||||||||||||
| Non-controlling interest, copper operations and other |
9/30/26 | 6/30/26 | 9/30/25 | 9/30/26 | 9/30/25 | |||||||||||||||
| General & administrative costs |
(5 | ) | (5 | ) | (13 | ) | (16 | ) | (25 | ) | ||||||||||
| Minesite exploration and evaluation expenses |
0 | (1 | ) | (1 | ) | (2 | ) | (4 | ) | |||||||||||
| Rehabilitation - accretion and amortization (operating sites) |
(8 | ) | (9 | ) | (5 | ) | (22 | ) | (16 | ) | ||||||||||
| Minesite sustaining capital expenditures |
(234 | ) | (186 | ) | (152 | ) | (567 | ) | (551 | ) | ||||||||||
| All-in sustaining costs total |
(247 | ) | (201 | ) | (171 | ) | (607 | ) | (596 | ) | ||||||||||
| g. | Ounces sold - attributable basis - Excludes Long Canyon, which is producing residual ounces from the leach pad while in closure. |
| h. | COS/oz - Gold COS/oz is calculated as cost of sales across our gold operations (excluding sites in closure or care and maintenance) divided by ounces sold (both on an attributable basis using Barrick’s ownership share). |
| i. | Per ounce figures - COS/oz, TCC/oz and AISC/oz may not calculate based on amounts presented in this table due to rounding. |
| . |
| BARRICK THIRD QUARTER 2026 | 47 | MANAGEMENT’S DISCUSSION AND ANALYSIS |
| OVERVIEW | OPERATING PERFORMANCE |
FUTURE GROWTH |
REVIEW OF FINANCIAL RESULTS |
OTHER INFORMATION & NON-GAAP RECONCILIATIONS |
FINANCIAL STATEMENTS | |||||
Reconciliation of Gold Cost of Sales to Total cash costs and All-in sustaining costs, including on a per ounce basis, by operating segment
| ($ millions, except per oz information in dollars) |
For the three months ended 9/30/26 | |||||||||||||||||||||||||
| Footnote | Carlin | Cortez | Turquoise Ridge |
Phoenix | Nevada Gold Minesa |
Pueblo Viejo |
||||||||||||||||||||
| COS applicable to gold production |
488 | 405 | 225 | 99 | 1,218 | 268 | ||||||||||||||||||||
| Depreciation |
(114 | ) | (118 | ) | (42 | ) | (15 | ) | (288 | ) | (78 | ) | ||||||||||||||
| Costs allocated to by-products |
(5 | ) | (2 | ) | (2 | ) | (72 | ) | (81 | ) | (27 | ) | ||||||||||||||
| Other |
c | 0 | 0 | 0 | 8 | 8 | 0 | |||||||||||||||||||
| Non-controlling interests |
(143 | ) | (109 | ) | (71 | ) | (7 | ) | (332 | ) | (66 | ) | ||||||||||||||
| Total cash costs |
226 | 176 | 110 | 13 | 525 | 97 | ||||||||||||||||||||
| General & administrative costs |
0 | 0 | 0 | 0 | 0 | 0 | ||||||||||||||||||||
| Minesite exploration and evaluation costs |
d | 0 | 0 | 1 | 0 | 2 | 2 | |||||||||||||||||||
| Minesite sustaining capital expenditures |
e | 165 | 53 | 32 | 10 | 273 | 76 | |||||||||||||||||||
| Sustaining capital leases |
0 | 0 | 0 | 0 | 0 | 0 | ||||||||||||||||||||
| Rehabilitation - accretion and amortization (operating sites) |
f | 6 | 5 | 1 | 0 | 12 | 1 | |||||||||||||||||||
| Non-controlling interests |
(68 | ) | (22 | ) | (12 | ) | (3 | ) | (110 | ) | (33 | ) | ||||||||||||||
| All-in sustaining costs |
329 | 212 | 132 | 20 | 702 | 143 | ||||||||||||||||||||
| Ounces sold - attributable basis (000s ounces) |
164 | 119 | 84 | 25 | 392 | 96 | ||||||||||||||||||||
| COS/oz |
g,h | 1,823 | 2,088 | 1,647 | 2,460 | 1,908 | 1,668 | |||||||||||||||||||
| TCC/oz |
h | 1,375 | 1,472 | 1,325 | 506 | 1,340 | 1,004 | |||||||||||||||||||
| AISC/oz |
h | 2,003 | 1,777 | 1,579 | 814 | 1,792 | 1,486 | |||||||||||||||||||
| ($ millions, except per oz information in dollars) |
For the three months ended 9/30/26 | |||||||||||||||||||||||||
| Footnote | Veladero | Porgera | Loulo- Gounkotoi |
Kibali | North Mara |
Bulyanhulu | ||||||||||||||||||||
| COS applicable to gold production |
81 | 26 | 291 | 144 | 129 | 94 | ||||||||||||||||||||
| Depreciation |
(30 | ) | (5 | ) | (48 | ) | (40 | ) | (25 | ) | (20 | ) | ||||||||||||||
| Costs allocated to by-products |
(5 | ) | 0 | (1 | ) | (1 | ) | (1 | ) | (5 | ) | |||||||||||||||
| Other |
c | 0 | 0 | (3 | ) | 0 | 0 | (5 | ) | |||||||||||||||||
| Non-controlling interests |
0 | 0 | (47 | ) | 0 | (17 | ) | (10 | ) | |||||||||||||||||
| Total cash costs |
46 | 21 | 192 | 103 | 86 | 54 | ||||||||||||||||||||
| General & administrative costs |
0 | 0 | 0 | 0 | 0 | 0 | ||||||||||||||||||||
| Minesite exploration and evaluation costs |
d | 1 | 0 | 0 | 0 | 1 | 0 | |||||||||||||||||||
| Minesite sustaining capital expenditures |
e | 8 | 9 | 39 | 27 | 31 | 34 | |||||||||||||||||||
| Sustaining capital leases |
0 | 0 | (1 | ) | 0 | 1 | 0 | |||||||||||||||||||
| Rehabilitation - accretion and amortization (operating sites) |
f | 0 | 1 | 0 | 0 | 0 | 1 | |||||||||||||||||||
| Non-controlling interests |
0 | 0 | (7 | ) | 3 | (5 | ) | (7 | ) | |||||||||||||||||
| All-in sustaining costs |
55 | 31 | 223 | 133 | 114 | 82 | ||||||||||||||||||||
| Ounces sold - attributable basis (000s ounces) |
31 | 14 | 101 | 93 | 38 | 45 | ||||||||||||||||||||
| COS/oz |
g,h | 2,606 | 1,837 | 2,321 | 1,555 | 2,830 | 1,751 | |||||||||||||||||||
| TCC/oz |
h | 1,486 | 1,467 | 1,911 | 1,105 | 2,260 | 1,189 | |||||||||||||||||||
| AISC/oz |
h | 1,788 | 2,169 | 2,220 | 1,430 | 2,972 | 1,813 | |||||||||||||||||||
| BARRICK THIRD QUARTER 2026 | 48 | MANAGEMENT’S DISCUSSION AND ANALYSIS |
| OVERVIEW | OPERATING PERFORMANCE |
FUTURE GROWTH |
REVIEW OF FINANCIAL RESULTS |
OTHER INFORMATION & NON-GAAP RECONCILIATIONS |
FINANCIAL STATEMENTS | |||||
| ($ millions, except per oz information in dollars) |
For the three months ended 6/30/26 | |||||||||||||||||||||||||
| Footnote | Carlin | Cortez | Turquoise Ridge |
Phoenix | Nevada Gold Minesa |
Pueblo Viejo |
||||||||||||||||||||
| COS applicable to gold production |
524 | 381 | 221 | 104 | 1,232 | 304 | ||||||||||||||||||||
| Depreciation |
(119 | ) | (91 | ) | (43 | ) | (17 | ) | (271 | ) | (86 | ) | ||||||||||||||
| Costs allocated to by-products |
(8 | ) | (2 | ) | (2 | ) | (68 | ) | (80 | ) | (34 | ) | ||||||||||||||
| Other |
c | (2 | ) | 0 | 0 | 9 | 7 | 0 | ||||||||||||||||||
| Non-controlling interests |
(152 | ) | (111 | ) | (67 | ) | (11 | ) | (341 | ) | (74 | ) | ||||||||||||||
| Total cash costs |
243 | 177 | 109 | 17 | 547 | 110 | ||||||||||||||||||||
| General & administrative costs |
0 | 0 | 0 | 0 | 0 | 0 | ||||||||||||||||||||
| Minesite exploration and evaluation costs |
d | 0 | 2 | 0 | 1 | 4 | 0 | |||||||||||||||||||
| Minesite sustaining capital expenditures |
e | 156 | 48 | 30 | 10 | 254 | 53 | |||||||||||||||||||
| Sustaining capital leases |
0 | 0 | 0 | 1 | 2 | 0 | ||||||||||||||||||||
| Rehabilitation - accretion and amortization (operating sites) |
f | 4 | 3 | 1 | 1 | 9 | 2 | |||||||||||||||||||
| Non-controlling interests |
(62 | ) | (20 | ) | (13 | ) | (5 | ) | (104 | ) | (22 | ) | ||||||||||||||
| All-in sustaining costs |
341 | 210 | 127 | 25 | 712 | 143 | ||||||||||||||||||||
| Ounces sold - attributable basis (000s ounces) |
173 | 104 | 82 | 27 | 386 | 108 | ||||||||||||||||||||
| COS/oz |
g,h | 1,856 | 2,267 | 1,657 | 2,343 | 1,961 | 1,683 | |||||||||||||||||||
| TCC/oz |
h | 1,405 | 1,713 | 1,319 | 640 | 1,418 | 1,016 | |||||||||||||||||||
| AISC/oz |
h | 1,971 | 2,028 | 1,552 | 917 | 1,843 | 1,322 | |||||||||||||||||||
| ($ millions, except per oz information in dollars) |
For the three months ended 6/30/26 | |||||||||||||||||||||||||
| Footnote | Veladero | Porgera | Loulo- Gounkotoi |
Kibali | North Mara |
Bulyanhulu | ||||||||||||||||||||
| COS applicable to gold production |
95 | 44 | 254 | 133 | 117 | 100 | ||||||||||||||||||||
| Depreciation |
(36 | ) | (11 | ) | (41 | ) | (34 | ) | (23 | ) | (21 | ) | ||||||||||||||
| Costs allocated to by-products |
(6 | ) | (1 | ) | 0 | (1 | ) | (1 | ) | (13 | ) | |||||||||||||||
| Other |
c | 0 | 0 | (8 | ) | 0 | 0 | 1 | ||||||||||||||||||
| Non-controlling interests |
0 | 0 | (41 | ) | 0 | (15 | ) | (11 | ) | |||||||||||||||||
| Total cash costs |
53 | 32 | 164 | 98 | 78 | 56 | ||||||||||||||||||||
| General & administrative costs |
0 | 0 | 0 | 0 | 0 | 0 | ||||||||||||||||||||
| Minesite exploration and evaluation costs |
d | 1 | 0 | 0 | 0 | 0 | 0 | |||||||||||||||||||
| Minesite sustaining capital expenditures |
e | 11 | 9 | 35 | 20 | 17 | 26 | |||||||||||||||||||
| Sustaining capital leases |
1 | 1 | 1 | 2 | 0 | 0 | ||||||||||||||||||||
| Rehabilitation - accretion and amortization (operating sites) |
f | 1 | 0 | 1 | 0 | 1 | 0 | |||||||||||||||||||
| Non-controlling interests |
0 | 0 | (7 | ) | 0 | (3 | ) | (4 | ) | |||||||||||||||||
| All-in sustaining costs |
67 | 42 | 194 | 120 | 93 | 78 | ||||||||||||||||||||
| Ounces sold - attributable basis (000s ounces) |
45 | 23 | 86 | 71 | 37 | 45 | ||||||||||||||||||||
| COS/oz |
g,h | 2,098 | 1,899 | 2,352 | 1,873 | 2,736 | 1,854 | |||||||||||||||||||
| TCC/oz |
h | 1,176 | 1,385 | 1,897 | 1,381 | 2,164 | 1,249 | |||||||||||||||||||
| AISC/oz |
h | 1,487 | 1,811 | 2,240 | 1,702 | 2,577 | 1,748 | |||||||||||||||||||
| BARRICK THIRD QUARTER 2026 | 49 | MANAGEMENT’S DISCUSSION AND ANALYSIS |
| OVERVIEW | OPERATING PERFORMANCE |
FUTURE GROWTH |
REVIEW OF FINANCIAL RESULTS |
OTHER INFORMATION & NON-GAAP RECONCILIATIONS |
FINANCIAL STATEMENTS | |||||
| ($ millions, except per oz information in dollars) |
For the three months ended 9/30/2025 | |||||||||||||||||||||||||||||
| Footnote | Carlin | Cortez | Turquoise Ridge |
Phoenix | Nevada Gold Minesa |
Hemlob | Pueblo Viejo |
|||||||||||||||||||||||
| COS applicable to gold production |
413 | 322 | 201 | 91 | 1,029 | 63 | 260 | |||||||||||||||||||||||
| Depreciation |
(80 | ) | (73 | ) | (48 | ) | (18 | ) | (220 | ) | (7 | ) | (77 | ) | ||||||||||||||||
| Costs allocated to by-products |
(1 | ) | (1 | ) | (1 | ) | (49 | ) | (52 | ) | (1 | ) | (16 | ) | ||||||||||||||||
| Other |
c | 0 | 0 | 0 | 6 | 6 | 0 | 0 | ||||||||||||||||||||||
| Non-controlling interests |
(129 | ) | (95 | ) | (58 | ) | (12 | ) | (294 | ) | 0 | (66 | ) | |||||||||||||||||
| Total cash costs |
203 | 153 | 94 | 18 | 469 | 55 | 101 | |||||||||||||||||||||||
| General & administrative costs |
0 | 0 | 0 | 0 | 0 | 0 | 0 | |||||||||||||||||||||||
| Minesite exploration and evaluation costs |
d | 3 | 1 | 0 | 1 | 5 | 0 | 0 | ||||||||||||||||||||||
| Minesite sustaining capital expenditures |
e | 116 | 26 | 20 | 10 | 176 | 14 | 47 | ||||||||||||||||||||||
| Sustaining capital leases |
0 | 0 | 0 | 1 | 1 | 0 | 0 | |||||||||||||||||||||||
| Rehabilitation - accretion and amortization (operating sites) |
f | 3 | 5 | 1 | 1 | 10 | 0 | 2 | ||||||||||||||||||||||
| Non-controlling interests |
(46 | ) | (12 | ) | (9 | ) | (5 | ) | (74 | ) | 0 | (21 | ) | |||||||||||||||||
| All-in sustaining costs |
279 | 173 | 106 | 26 | 587 | 69 | 129 | |||||||||||||||||||||||
| Ounces sold - attributable basis (000s ounces) |
170 | 123 | 85 | 28 | 406 | 29 | 108 | |||||||||||||||||||||||
| COS/oz |
g,h | 1,493 | 1,612 | 1,452 | 2,010 | 1,557 | 2,145 | 1,451 | ||||||||||||||||||||||
| TCC/oz |
h | 1,201 | 1,242 | 1,099 | 664 | 1,156 | 1,874 | 929 | ||||||||||||||||||||||
| AISC/oz |
h | 1,643 | 1,407 | 1,244 | 935 | 1,448 | 2,417 | 1,198 | ||||||||||||||||||||||
| ($ millions, except per oz information in dollars) |
For the three months ended 9/30/25 | |||||||||||||||||||||||||||||
| Footnote | Veladero | Porgera | Loulo- Gounkotoi |
Kibali | North Mara | Tongonj | Bulyanhulu | |||||||||||||||||||||||
| COS applicable to gold production |
60 | 38 | — | 124 | 130 | 60 | 87 | |||||||||||||||||||||||
| Depreciation |
(23 | ) | (9 | ) | — | (38 | ) | (35 | ) | (6 | ) | (18 | ) | |||||||||||||||||
| Costs allocated to by-products |
(2 | ) | (1 | ) | — | 0 | (2 | ) | 0 | (6 | ) | |||||||||||||||||||
| Other |
c | 0 | 0 | — | 0 | 0 | 0 | 0 | ||||||||||||||||||||||
| Non-controlling interests |
0 | 0 | — | 0 | (16 | ) | (5 | ) | (10 | ) | ||||||||||||||||||||
| Total cash costs |
35 | 28 | — | 86 | 77 | 49 | 53 | |||||||||||||||||||||||
| General & administrative costs |
0 | 0 | — | 0 | 0 | 0 | 0 | |||||||||||||||||||||||
| Minesite exploration and evaluation costs |
d | 0 | 0 | — | 0 | 0 | 0 | 0 | ||||||||||||||||||||||
| Minesite sustaining capital expenditures |
e | 30 | 8 | — | 19 | 16 | 1 | 21 | ||||||||||||||||||||||
| Sustaining capital leases |
0 | 0 | — | 2 | 0 | 1 | 0 | |||||||||||||||||||||||
| Rehabilitation - accretion and amortization (operating sites) |
f | 1 | 1 | — | 1 | 2 | 1 | 0 | ||||||||||||||||||||||
| Non-controlling interests |
0 | 0 | — | 0 | (3 | ) | 0 | (3 | ) | |||||||||||||||||||||
| All-in sustaining costs |
66 | 37 | — | 108 | 92 | 52 | 71 | |||||||||||||||||||||||
| Ounces sold - attributable basis (000s ounces) |
44 | 24 | — | 84 | 72 | 30 | 40 | |||||||||||||||||||||||
| COS/oz |
g,h | 1,352 | 1,599 | — | 1,482 | 1,497 | 1,787 | 1,817 | ||||||||||||||||||||||
| TCC/oz |
h | 787 | 1,200 | — | 1,019 | 1,069 | 1,605 | 1,334 | ||||||||||||||||||||||
| AISC/oz |
h | 1,498 | 1,594 | — | 1,286 | 1,268 | 1,692 | 1,790 | ||||||||||||||||||||||
| BARRICK THIRD QUARTER 2026 | 50 | MANAGEMENT’S DISCUSSION AND ANALYSIS |
| OVERVIEW | OPERATING PERFORMANCE |
FUTURE GROWTH |
REVIEW OF FINANCIAL RESULTS |
OTHER INFORMATION & NON-GAAP RECONCILIATIONS |
FINANCIAL STATEMENTS | |||||
| ($ millions, except per oz information in dollars) |
For the nine months ended 9/30/2026 | |||||||||||||||||||||||||
| Footnote | Carlin | Cortez | Turquoise Ridge |
Phoenix | Nevada Gold Minesa |
Pueblo Viejo |
||||||||||||||||||||
| COS applicable to gold production |
1,517 | 1,098 | 653 | 292 | 3,563 | 805 | ||||||||||||||||||||
| Depreciation |
(358 | ) | (290 | ) | (131 | ) | (47 | ) | (826 | ) | (231 | ) | ||||||||||||||
| Costs allocated to by-products |
(23 | ) | (7 | ) | (7 | ) | (201 | ) | (238 | ) | (90 | ) | ||||||||||||||
| Other |
c | (3 | ) | 0 | 0 | 25 | 22 | 0 | ||||||||||||||||||
| Non-controlling interests |
(437 | ) | (308 | ) | (199 | ) | (26 | ) | (972 | ) | (194 | ) | ||||||||||||||
| Total cash costs |
696 | 493 | 316 | 43 | 1,549 | 290 | ||||||||||||||||||||
| General & administrative costs |
0 | 0 | 0 | 0 | 0 | 0 | ||||||||||||||||||||
| Minesite exploration and evaluation costs |
d | 1 | 2 | 1 | 2 | 8 | 2 | |||||||||||||||||||
| Minesite sustaining capital expenditures |
e | 463 | 153 | 83 | 28 | 755 | 187 | |||||||||||||||||||
| Sustaining capital leases |
0 | 0 | 0 | 1 | 2 | 0 | ||||||||||||||||||||
| Rehabilitation - accretion and amortization (operating sites) |
f | 13 | 12 | 3 | 2 | 30 | 5 | |||||||||||||||||||
| Non-controlling interests |
(186 | ) | (64 | ) | (33 | ) | (12 | ) | (306 | ) | (79 | ) | ||||||||||||||
| All-in sustaining costs |
987 | 596 | 370 | 64 | 2,038 | 405 | ||||||||||||||||||||
| Ounces sold - attributable basis (000s ounces) |
510 | 312 | 262 | 74 | 1,158 | 286 | ||||||||||||||||||||
| COS/oz |
g,h | 1,824 | 2,165 | 1,533 | 2,425 | 1,890 | 1,683 | |||||||||||||||||||
| TCC/oz |
h | 1,365 | 1,580 | 1,208 | 576 | 1,338 | 1,013 | |||||||||||||||||||
| AISC/oz |
h | 1,936 | 1,912 | 1,414 | 866 | 1,761 | 1,416 | |||||||||||||||||||
| ($ millions, except per oz information in dollars) |
For the nine months ended 9/30/2026 | |||||||||||||||||||||||||
| Footnote
|
Veladero
|
Porgera
|
Loulo-
|
Kibali
|
North Mara
|
Bulyanhulu
|
||||||||||||||||||||
| COS applicable to gold production |
274 | 106 | 786 | 409 | 345 | 280 | ||||||||||||||||||||
| Depreciation |
(102 | ) | (23 | ) | (127 | ) | (107 | ) | (69 | ) | (59 | ) | ||||||||||||||
| Costs allocated to by-products |
(17 | ) | (1 | ) | (1 | ) | (3 | ) | (4 | ) | (28 | ) | ||||||||||||||
| Other |
c | 0 | 0 | (49 | ) | 0 | 0 | (3 | ) | |||||||||||||||||
| Non-controlling interests |
0 | 0 | (121 | ) | 0 | (44 | ) | (30 | ) | |||||||||||||||||
| Total cash costs |
155 | 82 | 488 | 299 | 228 | 160 | ||||||||||||||||||||
| General & administrative costs |
0 | 0 | 0 | 0 | 0 | 0 | ||||||||||||||||||||
| Minesite exploration and evaluation costs |
d | 2 | 1 | 0 | 0 | 1 | 0 | |||||||||||||||||||
| Minesite sustaining capital expenditures |
e | 30 | 26 | 74 | 58 | 57 | 83 | |||||||||||||||||||
| Sustaining capital leases |
1 | 1 | 1 | 5 | 1 | 0 | ||||||||||||||||||||
| Rehabilitation - accretion and amortization (operating sites) |
f | 2 | 1 | 1 | 0 | 2 | 1 | |||||||||||||||||||
| Non-controlling interests |
0 | 0 | (14 | ) | 3 | (10 | ) | (14 | ) | |||||||||||||||||
| All-in sustaining costs |
190 | 111 | 550 | 365 | 279 | 230 | ||||||||||||||||||||
| Ounces sold - attributable basis (000s ounces) |
130 | 59 | 256 | 233 | 111 | 126 | ||||||||||||||||||||
| COS/oz |
g,h | 2,102 | 1,798 | 2,461 | 1,756 | 2,622 | 1,861 | |||||||||||||||||||
| TCC/oz |
h | 1,192 | 1,391 | 1,908 | 1,282 | 2,064 | 1,265 | |||||||||||||||||||
| AISC/oz |
h | 1,461 | 1,871 | 2,149 | 1,568 | 2,521 | 1,821 | |||||||||||||||||||
| BARRICK THIRD QUARTER 2026 | 51 | MANAGEMENT’S DISCUSSION AND ANALYSIS |
| OVERVIEW | OPERATING PERFORMANCE |
FUTURE GROWTH |
REVIEW OF FINANCIAL RESULTS |
OTHER INFORMATION & NON-GAAP RECONCILIATIONS |
FINANCIAL STATEMENTS | |||||
| ($ millions, except per oz information in dollars) |
For the nine months ended 9/30/2025 | |||||||||||||||||||||||||||||
| Footnote | Carlin | Cortez | Turquoise Ridge |
Phoenix | Nevada Gold Minesa |
Hemlob | Pueblo Viejo |
|||||||||||||||||||||||
| COS applicable to gold production |
1,243 | 857 | 620 | 262 | 2,985 | 188 | 764 | |||||||||||||||||||||||
| Depreciation |
(210 | ) | (192 | ) | (139 | ) | (53 | ) | (595 | ) | (27 | ) | (229 | ) | ||||||||||||||||
| Costs allocated to by-products |
(4 | ) | (3 | ) | (3 | ) | (116 | ) | (126 | ) | (1 | ) | (39 | ) | ||||||||||||||||
| Other |
c | 0 | 0 | 0 | 18 | 18 | 0 | 0 | ||||||||||||||||||||||
| Non-controlling interests |
(397 | ) | (254 | ) | (184 | ) | (43 | ) | (879 | ) | 0 | (198 | ) | |||||||||||||||||
| Total cash costs |
632 | 408 | 294 | 68 | 1,403 | 160 | 298 | |||||||||||||||||||||||
| General & administrative costs |
0 | 0 | 0 | 0 | 0 | 0 | 0 | |||||||||||||||||||||||
| Minesite exploration and evaluation costs |
d | 8 | 4 | 0 | 2 | 15 | 0 | 0 | ||||||||||||||||||||||
| Minesite sustaining capital expenditures |
e | 497 | 150 | 68 | 33 | 762 | 29 | 167 | ||||||||||||||||||||||
| Sustaining capital leases |
0 | 0 | 0 | 1 | 2 | 2 | 0 | |||||||||||||||||||||||
| Rehabilitation - accretion and amortization (operating sites) |
f | 8 | 13 | 3 | 5 | 29 | 1 | 5 | ||||||||||||||||||||||
| Non-controlling interests |
(197 | ) | (64 | ) | (27 | ) | (16 | ) | (310 | ) | 0 | (69 | ) | |||||||||||||||||
| All-in sustaining costs |
948 | 511 | 338 | 93 | 1,901 | 192 | 401 | |||||||||||||||||||||||
| Ounces sold - attributable basis (000s ounces) |
478 | 326 | 238 | 85 | 1,127 | 100 | 277 | |||||||||||||||||||||||
| COS/oz |
g,h | 1,594 | 1,616 | 1,600 | 1,907 | 1,626 | 1,884 | 1,653 | ||||||||||||||||||||||
| TCC/oz |
h | 1,323 | 1,249 | 1,234 | 807 | 1,245 | 1,596 | 1,074 | ||||||||||||||||||||||
| AISC/oz |
h | 1,982 | 1,566 | 1,417 | 1,107 | 1,687 | 1,925 | 1,446 | ||||||||||||||||||||||
| ($ millions, except per oz information in dollars) |
For the nine months ended 9/30/2025 | |||||||||||||||||||||||||||||
| Footnote | Veladero | Porgera | Loulo- Gounkotoi |
Kibali | North Mara | Tongonj | Bulyanhulu | |||||||||||||||||||||||
| COS applicable to gold production |
221 | 106 | — | 345 | 316 | 204 | 228 | |||||||||||||||||||||||
| Depreciation |
(79 | ) | (23 | ) | — | (102 | ) | (75 | ) | (18 | ) | (48 | ) | |||||||||||||||||
| Costs allocated to by-products |
(5 | ) | (1 | ) | — | (1 | ) | (5 | ) | 0 | (20 | ) | ||||||||||||||||||
| Other |
c | 0 | 0 | — | 0 | 0 | 0 | 2 | ||||||||||||||||||||||
| Non-controlling interests |
0 | 0 | — | 0 | (38 | ) | (19 | ) | (26 | ) | ||||||||||||||||||||
| Total cash costs |
137 | 82 | — | 242 | 198 | 167 | 136 | |||||||||||||||||||||||
| General & administrative costs |
0 | 0 | — | 0 | 0 | 0 | 0 | |||||||||||||||||||||||
| Minesite exploration and evaluation costs |
d | 3 | 1 | — | 0 | 0 | 0 | 0 | ||||||||||||||||||||||
| Minesite sustaining capital expenditures |
e | 97 | 22 | — | 41 | 48 | 8 | 74 | ||||||||||||||||||||||
| Sustaining capital leases |
1 | 1 | — | 7 | 0 | 1 | 0 | |||||||||||||||||||||||
| Rehabilitation - accretion and amortization (operating sites) |
f | 2 | 1 | — | 1 | 4 | 5 | 1 | ||||||||||||||||||||||
| Non-controlling interests |
0 | 0 | — | 0 | (8 | ) | (1 | ) | (12 | ) | ||||||||||||||||||||
| All-in sustaining costs |
240 | 107 | — | 291 | 242 | 180 | 199 | |||||||||||||||||||||||
| Ounces sold - attributable basis (000s ounces) |
179 | 69 | — | 220 | 190 | 87 | 109 | |||||||||||||||||||||||
| COS/oz |
g,h | 1,227 | 1,536 | — | 1,572 | 1,393 | 2,101 | 1,754 | ||||||||||||||||||||||
| TCC/oz |
h | 761 | 1,186 | — | 1,101 | 1,040 | 1,916 | 1,250 | ||||||||||||||||||||||
| AISC/oz |
h | 1,336 | 1,555 | — | 1,325 | 1,270 | 2,063 | 1,831 | ||||||||||||||||||||||
| a. | These results represent our 61.5% interest in Carlin, Cortez, Turquoise Ridge and Phoenix and non-mine site related activity. |
| b. | On September 10, 2025, we reached an agreement to sell the Hemlo gold mine to Carcetti Capital Corp. for gross proceeds of up to $1.09 billion. The transaction closed on November 26, 2025. Accordingly, operating and financial results provided are up to the closing date. |
| c. | Other - Other adjustments at Carlin include the removal of TCC associated with Emigrant, which is producing incidental ounces. |
| d. | Exploration and evaluation costs - Exploration, evaluation and project expenses are included in AISC if they support current mine operations. |
| e. | Capital expenditures - Capital expenditures are related to our gold sites only and are split between minesite sustaining and project capital expenditures. |
| f. | Rehabilitation - accretion and amortization - Includes depreciation on the assets related to rehabilitation provisions of our gold operations and accretion on the rehabilitation provision of our gold operations, split between operating and non-operating sites. |
| g. | COS/oz - Gold COS/oz is calculated as cost of sales across our gold operations (excluding sites in closure or care and maintenance) divided by ounces sold (both on an attributable basis using Barrick’s ownership share). |
| h. | Per ounce figures - COS/oz, TCC/oz and AISC/oz may not calculate based on amounts presented in this table due to rounding. |
| i. | As a result of temporary suspension of operations at Loulo-Gounkoto starting January 14, 2025, and subsequent loss of control on June 16, 2025, no operating data or per ounce data was provided for Q1 2025 to Q3 2025. On November 24, 2025, Barrick announced that an agreement had been entered into with the Government of the Republic of Mali to put an end to all disputes regarding the Loulo and Gounkoto mines. The provisional administration of the Loulo-Gounkoto complex was terminated on December 16, 2025, at which point operational control was handed back to Somilo and Gounkoto’s management. |
| BARRICK THIRD QUARTER 2026 | 52 | MANAGEMENT’S DISCUSSION AND ANALYSIS |
| OVERVIEW | OPERATING PERFORMANCE |
FUTURE GROWTH |
REVIEW OF FINANCIAL RESULTS |
OTHER INFORMATION & NON-GAAP RECONCILIATIONS |
FINANCIAL STATEMENTS | |||||
| j. | On October 6, 2025, we reached an agreement to sell our interest in the Tongon gold mine and certain of its exploration properties to the Atlantic Group for total consideration of up to $305 million. The transaction closed on December 1, 2025. Accordingly, operating and financial results provided are up to the closing date. |
Reconciliation of Copper Cost of Sales to C1 cash costs and All-in sustaining costs, including on a per pound basis
| ($ millions, except per lb information in dollars) |
For the three months ended | For the nine months ended | ||||||||||||||||||
| 9/30/26 | 6/30/26 | 9/30/25 | 9/30/26 | 9/30/25 | ||||||||||||||||
| Cost of sales |
267 | 280 | 193 | 764 | 594 | |||||||||||||||
| Depreciation/amortization |
(65 | ) | (71 | ) | (69 | ) | (179 | ) | (197 | ) | ||||||||||
| Treatment and refinement charges |
47 | 49 | 44 | 131 | 126 | |||||||||||||||
| C1 cash costs applicable to equity method investments |
102 | 95 | 91 | 292 | 265 | |||||||||||||||
| Less: royalties |
(37 | ) | (43 | ) | (25 | ) | (110 | ) | (71 | ) | ||||||||||
| Costs allocated to by-products |
(15 | ) | (15 | ) | (7 | ) | (48 | ) | (24 | ) | ||||||||||
| C1 cash costs of sales |
299 | 295 | 227 | 850 | 693 | |||||||||||||||
| General & administrative costs |
10 | 6 | 12 | 22 | 28 | |||||||||||||||
| Rehabilitation - accretion and amortization |
1 | 1 | 1 | 3 | 5 | |||||||||||||||
| Royalties |
37 | 43 | 25 | 110 | 71 | |||||||||||||||
| Minesite exploration and evaluation costs |
3 | 3 | 1 | 8 | 4 | |||||||||||||||
| Minesite sustaining capital expenditures |
138 | 120 | 93 | 324 | 240 | |||||||||||||||
| Sustaining leases |
3 | 2 | 2 | 6 | 7 | |||||||||||||||
| All-in sustaining costs |
491 | 470 | 361 | 1,323 | 1,048 | |||||||||||||||
| Tonnes sold - attributable basis (thousands of tonnes) |
49 | 54 | 52 | 148 | 157 | |||||||||||||||
| Pounds sold - attributable basis (millions pounds) |
108 | 119 | 116 | 326 | 347 | |||||||||||||||
| COS/lba,b |
3.65 | 3.39 | 2.68 | 3.48 | 2.72 | |||||||||||||||
| C1 cash costs per pounda |
2.76 | 2.47 | 1.96 | 2.60 | 2.00 | |||||||||||||||
|
AISC/lba |
4.52 | 3.95 | 3.14 | 4.05 | 3.03 | |||||||||||||||
| a. | COS/lb, C1 cash costs/lb and AISC/lb may not calculate based on amounts presented in this table due to rounding. |
| b. | Copper COS/lb is calculated as cost of sales across our copper operations divided by pounds sold (both on an attributable basis using Barrick’s ownership share). |
Reconciliation of Copper Cost of Sales to C1 cash costs and All-in sustaining costs, including on a per pound basis, by operating segment
| ($ millions, except per lb information in dollars) |
For the three months ended | |||||||||||||||||||||||||||||||||||
| 9/30/26 | 6/30/26 | 9/30/25 | ||||||||||||||||||||||||||||||||||
| Zaldívar | Lumwana | Jabal Sayid |
Zaldívar | Lumwana | Jabal Sayid |
||||||||||||||||||||||||||||
| Cost of sales |
95 | 268 | 33 | 96 | 280 | 27 | 85 | 193 | 33 | |||||||||||||||||||||||||||
| Depreciation/amortization |
(20 | ) | (65 | ) | (5 | ) | (22 | ) | (71 | ) | (6 | ) | (20 | ) | (68 | ) | (7 | ) | ||||||||||||||||||
| Treatment and refinement charges |
0 | 46 | 1 | 0 | 50 | (1 | ) | 0 | 42 | 2 | ||||||||||||||||||||||||||
| Less: royalties |
(2 | ) | (38 | ) | 0 | (1 | ) | (43 | ) | 0 | 0 | (25 | ) | 0 | ||||||||||||||||||||||
| Costs allocated to by-products |
0 | (6 | ) | (9 | ) | 0 | (6 | ) | (9 | ) | (1 | ) | (2 | ) | (4 | ) | ||||||||||||||||||||
| Other |
0 | 0 | 0 | 0 | 0 | 0 | 0 | 0 | 0 | |||||||||||||||||||||||||||
| C1 cash costs of sales |
73 | 205 | 20 | 73 | 210 | 11 | 64 | 140 | 24 | |||||||||||||||||||||||||||
| Rehabilitation - accretion and amortization |
0 | 0 | 0 | 0 | 1 | 0 | 0 | 1 | 0 | |||||||||||||||||||||||||||
| Royalties |
2 | 38 | 0 | 1 | 43 | 0 | 0 | 25 | 0 | |||||||||||||||||||||||||||
| Minesite exploration and evaluation costs |
3 | 0 | 0 | 3 | 0 | 0 | 1 | 0 | 0 | |||||||||||||||||||||||||||
| Minesite sustaining capital expenditures |
25 | 110 | 2 | 30 | 87 | 2 | 13 | 78 | 2 | |||||||||||||||||||||||||||
| Sustaining leases |
1 | 0 | 1 | 1 | 0 | 1 | 2 | 0 | 0 | |||||||||||||||||||||||||||
| Inventory write-downs |
0 | 0 | 0 | 0 | 0 | 0 | 0 | 0 | 0 | |||||||||||||||||||||||||||
| All-in sustaining costs |
104 | 353 | 23 | 108 | 341 | 14 | 80 | 244 | 26 | |||||||||||||||||||||||||||
| Tonnes sold - attributable basis (thousands of tonnes) |
7 | 35 | 7 | 9 | 40 | 5 | 8 | 37 | 7 | |||||||||||||||||||||||||||
| Pounds sold - attributable basis (millions of pounds) |
16 | 76 | 16 | 20 | 89 | 10 | 17 | 83 | 16 | |||||||||||||||||||||||||||
| COS/lba,b |
5.92 | 3.49 | 2.11 | 4.89 | 3.14 | 2.63 | 5.02 | 2.32 | 2.08 | |||||||||||||||||||||||||||
| C1 cash costs/lba |
4.59 | 2.68 | 1.29 | 3.71 | 2.35 | 1.08 | 3.80 | 1.68 | 1.47 | |||||||||||||||||||||||||||
|
AISC/lba |
6.49 | 4.61 | 1.43 | 5.50 | 3.83 | 1.42 | 4.82 | 2.93 | 1.65 | |||||||||||||||||||||||||||
| BARRICK THIRD QUARTER 2026 | 53 | MANAGEMENT’S DISCUSSION AND ANALYSIS |
| OVERVIEW | OPERATING PERFORMANCE |
FUTURE GROWTH |
REVIEW OF FINANCIAL RESULTS |
OTHER INFORMATION & NON-GAAP RECONCILIATIONS |
FINANCIAL STATEMENTS | |||||
| ($ millions, except per lb information in dollars) |
For the nine months ended | |||||||||||||||||||||||
| 9/30/26 | 9/30/25 | |||||||||||||||||||||||
| Zaldívar | Lumwana | Jabal Sayid | Zaldívar | Lumwana | Jabal Sayid | |||||||||||||||||||
| Cost of sales |
280 | 765 | 91 | 248 | 595 | 99 | ||||||||||||||||||
| Depreciation/amortization |
(62 | ) | (179 | ) | (17 | ) | (62 | ) | (197 | ) | (20 | ) | ||||||||||||
| Treatment and refinement charges |
0 | 131 | 0 | 0 | 120 | 6 | ||||||||||||||||||
| Less: royalties |
(4 | ) | (111 | ) | 0 | 0 | (71 | ) | 0 | |||||||||||||||
| Costs allocated to by-products |
0 | (16 | ) | (31 | ) | (1 | ) | (6 | ) | (17 | ) | |||||||||||||
| Other |
0 | 0 | 0 | 0 | 0 | 0 | ||||||||||||||||||
| C1 cash costs |
214 | 590 | 43 | 185 | 441 | 68 | ||||||||||||||||||
| Rehabilitation - accretion and amortization |
0 | 2 | 0 | 1 | 3 | 0 | ||||||||||||||||||
| Royalties |
4 | 111 | 0 | 0 | 71 | 0 | ||||||||||||||||||
| Minesite exploration and evaluation costs |
8 | 0 | 0 | 4 | 0 | 0 | ||||||||||||||||||
| Minesite sustaining capital expenditures |
75 | 242 | 6 | 28 | 206 | 6 | ||||||||||||||||||
| Sustaining leases |
3 | 0 | 2 | 5 | 1 | 1 | ||||||||||||||||||
| All-in sustaining costs |
304 | 945 | 51 | 223 | 722 | 75 | ||||||||||||||||||
| Tonnes sold - attributable basis (thousands of tonnes) |
24 | 105 | 19 | 25 | 110 | 22 | ||||||||||||||||||
| Pounds sold - attributable basis (millions pounds) |
54 | 231 | 41 | 55 | 243 | 49 | ||||||||||||||||||
| COS/lba,b |
5.19 | 3.31 | 2.23 | 4.53 | 2.44 | 2.05 | ||||||||||||||||||
| C1 cash cost/lba |
3.97 | 2.55 | 1.05 | 3.38 | 1.81 | 1.40 | ||||||||||||||||||
|
AISC/lba |
5.63 | 4.09 | 1.25 | 4.11 | 2.97 | 1.55 | ||||||||||||||||||
| a. | COS/lb, C1 cash costs/lb and AISC/lb may not calculate based on amounts presented in this table due to rounding. |
| b. | Copper COS/lb is calculated as cost of sales across our copper operations divided by pounds sold (both on an attributable basis using Barrick’s ownership share). |
| BARRICK THIRD QUARTER 2026 | 54 | MANAGEMENT’S DISCUSSION AND ANALYSIS |
| OVERVIEW | OPERATING PERFORMANCE |
FUTURE GROWTH |
REVIEW OF FINANCIAL RESULTS |
OTHER INFORMATION & NON-GAAP RECONCILIATIONS |
FINANCIAL STATEMENTS | |||||
EBITDA, Adjusted EBITDA, Attributable Adjusted EBITDA, Attributable Adjusted EBITDA Margin and Net Leverage
EBITDA is a non-GAAP financial measure, which excludes the following from net earnings:
| ∎ | Income tax expense; |
| ∎ | Finance costs; |
| ∎ | Finance income; and |
| ∎ | Depreciation. |
Management believes that EBITDA is a valuable indicator of our ability to generate liquidity by producing operating cash flow to fund working capital needs, service debt obligations, and fund capital expenditures. Management uses EBITDA for this purpose. EBITDA is also frequently used by investors and analysts for valuation purposes whereby EBITDA is multiplied by a factor or “EBITDA multiple” that is based on an observed or inferred relationship between EBITDA and market values to determine the approximate total enterprise value of a company.
Starting with our Q2 2026 MD&A, we have renamed attributable EBITDA and attributable EBITDA margin to attributable adjusted EBITDA and attributable adjusted EBITDA margin, respectively. There is no change in the way these measures are calculated.
Adjusted EBITDA removes the effect of impairment charges; acquisition/disposition gains/losses; foreign currency translation gains/losses; and other expense adjustments. We also remove the impact of income tax expense, finance costs, finance income and depreciation incurred in our equity method accounted investments. Attributable adjusted EBITDA further removes the non-controlling interest portion. We believe these items provide a greater level of consistency with the adjusting items included in our adjusted net earnings reconciliation, with the exception that these amounts are adjusted to remove any impact on finance costs/income, income tax expense and/or depreciation as they do not affect EBITDA. We believe this additional information will assist analysts,
investors and other stakeholders of Barrick in better understanding our ability to generate liquidity from our attributable business, including equity method investments, by excluding these amounts from the calculation as they are not indicative of the performance of our core mining business and do not necessarily reflect the underlying operating results for the periods presented. Additionally, it is aligned with how we present our forward-looking guidance on gold ounces and copper pounds produced.
Attributable adjusted EBITDA margin is calculated as attributable adjusted EBITDA divided by revenues - as adjusted. We believe this ratio will assist analysts, investors and other stakeholders of Barrick to better understand the relationship between revenues and EBITDA or operating profit.
Net leverage is calculated as debt, net of cash divided by the sum of adjusted EBITDA of the last four consecutive quarters. We believe this ratio will assist analysts, investors and other stakeholders of Barrick in monitoring our leverage and evaluating our balance sheet.
EBITDA, adjusted EBITDA, attributable adjusted EBITDA, attributable adjusted EBITDA margin and net leverage are intended to provide additional information to investors and analysts and do not have any standardized definition under IFRS, and should not be considered in isolation or as a substitute for measures of performance prepared in accordance with IFRS. EBITDA, adjusted EBITDA and attributable adjusted EBITDA exclude the impact of cash costs of financing activities and taxes, and the effects of changes in operating working capital balances, and therefore are not necessarily indicative of operating profit or cash flow from operations as determined under IFRS. Other companies may calculate EBITDA, adjusted EBITDA, attributable adjusted EBITDA, attributable adjusted EBITDA margin and net leverage differently.
Reconciliation of Net Earnings to EBITDA, Adjusted EBITDA and Attributable Adjusted EBITDA
| ($ millions) |
For the three months ended | For the nine months ended | ||||||||||||||||||
| 9/30/26 | 6/30/26 | 9/30/25 | 9/30/26 | 9/30/25 | ||||||||||||||||
| Net earnings |
2,038 | 1,892 | 1,904 | 6,411 | 3,941 | |||||||||||||||
| Income tax expense |
601 | 732 | 477 | 2,080 | 857 | |||||||||||||||
| Finance costs, neta |
18 | 6 | 21 | 43 | 96 | |||||||||||||||
| Depreciation |
567 | 555 | 460 | 1,622 | 1,307 | |||||||||||||||
| EBITDA |
3,224 | 3,185 | 2,862 | 10,156 | 6,201 | |||||||||||||||
| Impairment (reversals) charges of non-current assetsb |
(1) | (1) | 3 | (2) | 7 | |||||||||||||||
| Acquisition/disposition losses (gains)c |
(102) | (10) | (250) | (111) | 39 | |||||||||||||||
| (Gain) loss on currency translation |
1 | 14 | (3) | 35 | (3) | |||||||||||||||
| Other expense adjustmentsd |
104 | 236 | 47 | 358 | 264 | |||||||||||||||
| Income tax expense, net finance costsa and depreciation from equity investees |
238 | 204 | 197 | 590 | 494 | |||||||||||||||
| Adjusted EBITDA |
3,464 | 3,628 | 2,856 | 11,026 | 7,002 | |||||||||||||||
| Non-controlling Interests |
(989) | (1,083) | (834) | (3,245) | (1,929) | |||||||||||||||
| Attributable adjusted EBITDA |
2,475 | 2,545 | 2,022 | 7,781 | 5,073 | |||||||||||||||
| Revenues - as adjustede |
4,147 | 4,267 | 3,405 | 12,595 | 9,140 | |||||||||||||||
| Attributable adjusted EBITDA marginf |
60 % | 60 % | 59 % | 62 % | 56 % | |||||||||||||||
| As at 9/30/26 | As at 12/31/25 | As at 9/30/25 | As at 9/30/26 | As at 12/31/25 | ||||||||||||||||
| Net Leverageg |
-0.1:1 | -0.2:1 | 0.0:1 | -0.1:1 | -0.2:1 | |||||||||||||||
| a. | Finance costs exclude accretion. |
| b. | There were no significant impairment charges or reversals in the current period or prior periods. |
| c. | Acquisition/disposition (gains) losses for Q3 2026 and YTD 2026 mainly relate to the sale of our share in the Bambadji project in Senegal. For Q3 2025, acquisition/disposition (gains) losses mainly relate to the $250 million revaluation of our 80% equity investment in Loulo-Gounkoto, following its deconsolidation and recognition as an investment at fair value in Q2 2025. For YTD 2025, this was combined with the $1,035 million loss recognized on the deconsolidation of Loulo-Gounkoto in Q2 2025 and a gain of $745 million on the sale of our 50% interest in the Donlin Gold project. |
| d. | Other expense adjustments for the Q3 2026 and YTD 2026 periods mainly related to additional royalties, penalties and interest related to the retrospective application of the 2023 Mining Code to Loulo-Gounkoto for 2024 and 2025 and the remobilization costs at Loulo-Gounkoto. YTD 2026 was further impacted by the gold inventory fair value adjustment after regaining control of Loulo-Gounkoto, and costs associated with our North America IPO project which were expensed in H1 2026, partially offset by income related to the revaluation of the Hemlo contingent consideration. Other expense adjustments for the 2025 periods mainly relate to reduced operations costs at Loulo-Gounkoto, and costs related to the signing of agreements to settle legacy legal matters in the Philippines related to Placer Dome Inc. |
| e. | Refer to Reconciliation of Sales to Realized Price per oz/pound on page 56 of this MD&A. |
| f. | Represents attributable adjusted EBITDA divided by revenues - as adjusted. |
| g. | Represents debt, net of cash, divided by adjusted EBITDA of the last four consecutive quarters. |
| BARRICK THIRD QUARTER 2026 | 55 | MANAGEMENT’S DISCUSSION AND ANALYSIS |
| OVERVIEW | OPERATING PERFORMANCE |
FUTURE GROWTH |
REVIEW OF FINANCIAL RESULTS |
OTHER INFORMATION & NON-GAAP RECONCILIATIONS |
FINANCIAL STATEMENTS | |||||
Realized Price
Realized price is a non-GAAP financial measure which excludes from sales:
| ∎ | Treatment and refining charges; and |
| ∎ | Cumulative catch-up adjustment to revenue relating to our streaming arrangements. |
We believe this provides investors and analysts with a more accurate measure with which to compare to market gold and copper prices and to assess our gold and copper sales performance. For those reasons, management believes that this measure provides a more accurate reflection of our
Company’s past performance and is a better indicator of its expected performance in future periods.
The realized price measure is intended to provide additional information and does not have any standardized definition under IFRS and should not be considered in isolation or as a substitute for measures of performance prepared in accordance with IFRS. The measure is not necessarily indicative of sales as determined under IFRS. Other companies may calculate this measure differently. The following table reconciles realized prices to the most directly comparable IFRS measure.
Reconciliation of Sales to Realized Price per ounce/pound
| ($ millions, except per oz/lb information in dollars) |
Gold | Copper | Gold | Copper | ||||||||||||||||||||||||||||||||||||
| For the three months ended | For the nine months ended | |||||||||||||||||||||||||||||||||||||||
| 9/30/26 | 6/30/26 | 9/30/25 | 9/30/26 | 6/30/26 | 9/30/25 | 9/30/26 | 9/30/25 | 9/30/26 | 9/30/25 | |||||||||||||||||||||||||||||||
| Sales |
4,489 | 4,665 | 3,748 | 459 | 499 | 320 | 13,910 | 9,794 | 1,301 | 961 | ||||||||||||||||||||||||||||||
| Sales applicable to non-controlling interests |
(1,507 | ) | (1,553 | ) | (1,237 | ) | 0 | 0 | 0 | (4,651 | ) | (3,139 | ) | 0 | 0 | |||||||||||||||||||||||||
| Sales applicable to equity method investmentsa,b |
454 | 416 | 377 | 203 | 182 | 147 | 1,316 | 935 | 581 | 446 | ||||||||||||||||||||||||||||||
| Sales applicable to sites in closure or care and maintenancec |
(7 | ) | (2 | ) | (1 | ) | 0 | 0 | 0 | (22 | ) | (3 | ) | 0 | 0 | |||||||||||||||||||||||||
| Treatment and refinement charges |
9 | 11 | 7 | 47 | 49 | 44 | 29 | 20 | 131 | 126 | ||||||||||||||||||||||||||||||
|
Otherd |
0 | 0 | 0 | 0 | 0 | 0 | 0 | 0 | 0 | 0 | ||||||||||||||||||||||||||||||
| Revenues – as adjusted |
3,438 | 3,537 | 2,894 | 709 | 730 | 511 | 10,582 | 7,607 | 2,013 | 1,533 | ||||||||||||||||||||||||||||||
| Ounces/pounds sold (koz/Mlb)c |
810 | 801 | 837 | 108 | 119 | 116 | 2,359 | 2,358 | 326 | 347 | ||||||||||||||||||||||||||||||
| Realized gold/copper price per oz/lbe |
4,243 | 4,417 | 3,457 | 6.54 | 6.15 | 4.39 | 4,486 | 3,226 | 6.17 | 4.42 | ||||||||||||||||||||||||||||||
| a. | Represents sales of $394 million for Q3 2026 and YTD 2026 $1,048 million (Q2 2026: $313 million; Q3 2025: $294 million; YTD 2025: $711 million) applicable to our 45% equity method investment in Kibali and $60 million for Q3 2026 and YTD 2026 $268 million (Q2 2026: $103 million; Q3 2025: $83 million; YTD 2025: $224 million) applicable to our 24.5% equity method investment in Porgera for gold. Represents sales of $105 million for Q3 2026 and YTD 2026 $338 million (Q2 2026: $123 million; Q3 2025: $77 million; YTD 2025: $243 million) applicable to our 50% equity method investment in Zaldívar and $98 million and $243 million for Q3 2026 and YTD 2026, respectively (Q2 2026: $60 million; Q3 2025: $71 million; YTD 2025: $208 million), applicable to our 50% equity method investment in Jabal Sayid for copper. |
| b. | Sales applicable to equity method investments are net of treatment and refinement charges. |
| c. | On an attributable basis. Excludes Long Canyon, which is producing residual ounces from the leach pad while in closure. |
| d. | Represents cumulative catch-up adjustment to revenue relating to our streaming arrangements. Refer to note 2e of the 2025 Annual Financial Statements for more information. |
| e. | Realized price per oz/lb may not calculate based on amounts presented in this table due to rounding. |
| BARRICK THIRD QUARTER 2026 | 56 | MANAGEMENT’S DISCUSSION AND ANALYSIS |
| OVERVIEW | OPERATING PERFORMANCE |
FUTURE GROWTH |
REVIEW OF FINANCIAL RESULTS |
OTHER INFORMATION & NON-GAAP RECONCILIATIONS |
FINANCIAL STATEMENTS | |||||
Technical Information
The scientific and technical information contained in this MD&A has been reviewed and approved by Richard Peattie, MPhil, FAusIMM, Chief Technical Officer; Javier Ortuzar, FAusIMM, Senior Vice President, Exploration; Sam Baldwin, Vice President Geology, MSc, MAIG; Joel Holliday, FAusIMM, Executive Vice President, Exploration; and Russell Owen, FAusIMM, Vice President, Technical Services – each a “Qualified Person” as defined in National Instrument 43-101 – Standards of Disclosure for Mineral Projects.
All mineral reserve and mineral resource estimates are estimated in accordance with National Instrument 43-101 – Standards of Disclosure for Mineral Projects. Unless otherwise noted, such mineral reserve and mineral resource estimates are as of December 31, 2025.
Endnotes
| 1 | Further information on these non-GAAP financial measures, including detailed reconciliations, is included on pages 44 to 56 of this MD&A. |
| 2 | Gold COS/oz is calculated as cost of sales across our gold operations (excluding sites in closure or care and maintenance) divided by ounces sold (both on an attributable basis using Barrick’s ownership share). Copper COS/lb is calculated as cost of sales across our copper operations divided by pounds sold (both on an attributable basis using Barrick’s ownership share). References to attributable basis means our 100% share of Hemlo (prior to its divestiture in Q4 2025) and Lumwana, our 61.5% share of NGM, our 60% share of Pueblo Viejo, our 80% share of Loulo-Gounkoto, our 89.7% share of Tongon (prior to its divestiture in Q4 2025), our 84% share of North Mara and Bulyanhulu, our 50% share of Veladero, Zaldívar and Jabal Sayid, our 24.5% share of Porgera and our 45% share of Kibali. |
| 3 | Total reportable incident frequency rate (“TRIFR”) is a ratio calculated as follows: number of reportable injuries x 1,000,000 hours divided by the total number of hours worked. Reportable injuries include fatalities, lost time injuries, restricted duty injuries, and medically treated injuries. Lost time injury frequency rate (“LTIFR”) is a ratio calculated as follows: number of lost time injuries x 1,000,000 hours divided by the total number of hours worked. |
| 4 | Class 1 - High Significance is defined as an incident that causes significant negative impacts on human health or the environment or an incident that extends onto publicly accessible land and has the potential to cause significant adverse impact to surrounding communities, livestock or wildlife. |
| 5 | A Tier One Gold Asset is an asset with a $1,500/oz reserve with potential to deliver a minimum 10-year life, annual production of at least 500,000 ounces of gold and with projected costs per ounce in the lower half of the industry cost curve. A Tier One Copper Asset/Project is an asset with a $3.25/lb reserve with potential for +5Mt contained copper in support at least 20 years life, annual production of at least 200ktpa, with costs per pound in the lower half of the industry cost curve. Tier One Assets must be located in a world-class geological district with potential for organic reserve growth and long-term geologically driven addition. |
| 6 | Refer to the Technical Report on the Cortez Complex, Lander and Eureka Counties, State of Nevada, USA, dated December 31, 2021, and filed on SEDAR+ at www.sedarplus.ca and EDGAR at www.sec.gov on March 18, 2022. |
| 7 | Refer to the Technical Report on the Carlin Complex, Eureka and Elko County, Nevada, USA, dated December 31, 2024, and filed on SEDAR+ at www.sedarplus.ca and EDGAR at www.sec.gov on March 14, 2025. |
| 8 | Refer to the Technical Report on the Pueblo Viejo mine, Dominican Republic, dated December 31, 2025, and filed on SEDAR+ at www.sedarplus.ca and EDGAR at www.sec.gov on February 27, 2026. |
| 9 | Mineral resources (“resources”) have been estimated as at December 31, 2025 (unless otherwise noted) in accordance with National Instrument 43-101 - Standards of Disclosure for Mineral Projects (“NI 43-101”) as required by Canadian securities regulatory authorities. |
| | El Alto-Lama (formerly Pascua-Lama) Surface: Measured mineral resources of 43 million tonnes, grading 1.86 g/t, representing 2.6 million ounces of gold and 43 million tonnes, grading 57.21 g/t, representing 79 million ounces of silver. Indicated mineral resources of 390 million tonnes, grading 1.49 g/t, representing 19 million ounces of gold and 390 million tonnes, grading 52.22 g/t, representing 660 million ounces of silver. |
| | Norte Abierto Surface: Measured mineral resources of 320 million tonnes, grading 0.67 g/t, representing 6.9 million ounces of gold; 300 million tonnes, grading 0.24%, representing 0.74 million tonnes of copper; and 320 million tonnes, grading 1.72 g/t, representing 18 million ounces of silver. Indicated mineral resources: 800 million tonnes, grading 0.54 g/t, representing 14 million ounces of gold; 760 million tonnes, grading 0.21%, representing 1.6 million tonnes of copper; and 800 million tonnes, grading 1.18 g/t, representing 30 million ounces of silver. |
| Complete mineral reserve and mineral resource data for all mines and projects referenced in this MD&A, including tonnes, grades, and ounces, can be found on pages 36-46 of Barrick’s 2025 Annual Information Form filed on SEDAR+ at www.sedarplus.ca and on EDGAR at www.sec.gov. |
| 10 | Refer to the Technical Report on the Reko Diq Project, Balochistan, Pakistan, dated December 31, 2024, and filed on SEDAR+ at www.sedarplus.ca and EDGAR at www.sec.gov on February 19, 2025. |
| BARRICK THIRD QUARTER 2026 | 57 | MANAGEMENT’S DISCUSSION AND ANALYSIS |
| OVERVIEW | OPERATING PERFORMANCE |
FUTURE GROWTH |
REVIEW OF FINANCIAL RESULTS |
OTHER INFORMATION & NON-GAAP RECONCILIATIONS |
FINANCIAL STATEMENTS | |||||
| 11 | Refer to the Technical Report on the Lumwana Expansion Project, Republic of Zambia, dated December 31, 2024, and filed on SEDAR+ at www.sedarplus.ca and EDGAR at www.sec.gov on February 19, 2025. |
| 12 | Q3 2026 Carlin Significant Intercepts: |
|
Pathfinder | ||||||||||||||||
| Goldstrike Districta |
||||||||||||||||
| Core Drill Holeb |
Azimuth | Dip | Interval (m) | Width (m)c | Au (g/t) | Interval (m) | Includingd Width (m)c |
Au (g/t) | ||||||||
|
PFX-26005 |
86 | -65 | 522.73 – 533.4 | 10.7 | 7.80 | 525.8 – 530.4 | 4.60 | 12.42 | ||||||||
| 537.97 – 542.54 | 4.6 | 4.37 | ||||||||||||||
|
PFX-26011 |
95 | -65 | 347.47 – 365.76 | 18.3 | 6.45 | 347.47 – 349 | 1.50 | 16.18 | ||||||||
| 394.72 – 397.76 | 3.0 | 5.79 | ||||||||||||||
| 400.81 – 409.96 | 9.1 | 12.97 | 402.34 – 406.91 | 4.60 | 22.75 | |||||||||||
| a. | All intercepts calculated using a 3.4 g/t Au cutoff and are uncapped; minimum intercept width is 3.0 meters; internal dilution is less than 20% total width. |
| b. | Drill hole nomenclature: PFX denotes Greater Goldstrike, related to the Pathfinder Project; the year (26 for 2026) followed by the hole number. |
| c. | True width of intercepts are uncertain at this stage. |
| d. | Included intervals calculated using a 10 g/t Au cutoff and are uncapped; minimum intercept width is 1.0 meters; internal dilution is less than 20% total width. |
Rena Drill Results from Q1 2026 to Date
| Core Drill Holeb |
Azimuth | Dip | From (m) | Width (m)c | Au (g/t) | |||||
|
MRC-26034 |
270 | -15 | 715.7 - 726.0 | 10.3 | 4.81 | |||||
| 740.1 - 779.4 | 39.3 | 7.32 | ||||||||
| a. | All intercepts calculated using a 3.05 g/t Au cutoff and are uncapped; minimum intercept width is 3.0 meters; internal dilution is less than 20% total width. |
| b. | Carlin Trend drill hole nomenclature: Project area (MRC - MRC Ren Core); the year (26 for 2026) followed by the hole number. |
| c. | True width of intercepts are uncertain at this stage. |
The drilling results for the Carlin Trend contained in this MD&A have been prepared in accordance with National Instrument 43-101 – Standards of Disclosure for Mineral Projects. All drill hole assay information has been manually reviewed and approved by staff geologists and re-checked by the project manager. Sample preparation and analyses are conducted by ALS Minerals, MSA Labs, American Assay Laboratories, and Bureau Veritas North America, all independent laboratories. Procedures are employed to ensure security of samples during their delivery from the drill rig to the laboratory. The quality assurance procedures, data verification and assay protocols used in connection with drilling and sampling on the Carlin Trend conform to industry accepted quality control methods.
| 13 | Q3 2026 Cortez Significant Intercepts: |
|
Cortez | ||||||||||||||||
|
Goldrush Complex Drill Resultsa | ||||||||||||||||
| Core Drill Holeb |
Azimuth | Dip | Interval (m) | Width (m)c | Au (g/t) | Interval (m) | Includingd Width (m)c |
Au (g/t) | ||||||||
|
GRC-26001 |
73 | -66 | 602.1-660.8 | 58.7 | 24.40 | 613.6-635.1 | 21.60 | 37.56 | ||||||||
| 651.7-659.3 | 7.60 | 34.82 | ||||||||||||||
| 672.7-694.3 | 21.6 | 35.45 | 674.5-677.6 | 3.00 | 53.23 | |||||||||||
| 680.6-692.7 | 12.00 | 42.93 | ||||||||||||||
| 707.1-755.4 | 48.3 | 20.14 | 707.7-712.5 | 4.70 | 50.46 | |||||||||||
| 719.3-722.4 | 3.00 | 34.54 | ||||||||||||||
| 740.2-743 | 2.70 | 32.14 | ||||||||||||||
| 752.9-755.5 | 2.60 | 34.06 | ||||||||||||||
|
GRC-26002 |
87 | -61 | 901.6-903.1 | 1.5 | 7.92 | |||||||||||
|
GRC-26008 |
28 | -61 | 466.3-477 | 10.7 | 6.99 | |||||||||||
|
GRC-26009 |
70 | -53 | 625-628.3 | 3.3 | 5.07 | |||||||||||
| a. | All intercepts calculated using a 3.4 g/t Au cutoff and are uncapped; minimum intercept width is 1.0 meters; internal dilution is less than 20% total width. |
| b. | Drill hole nomenclature: GRC Project area Goldrush; the year (26 for 2026) followed by the hole number. |
| c. | True width of intercepts are uncertain at this stage. |
| d. | Included intervals calculated using a 20 g/t Au cutoff and are uncapped; minimum intercept width is 1.0 meters; internal dilution is less than 20% total width |
The drilling results contained in this MD&A have been prepared in accordance with National Instrument 43-101 – Standards of Disclosure for Mineral Projects. All drill hole assay information has been manually reviewed and approved by staff geologists and re-checked by the project manager. Sample preparation and analyses are conducted by ALS Minerals, an independent laboratory. Procedures are employed to ensure security of samples during their delivery from the drill rig to the laboratory. The quality assurance procedures, data verification and assay protocols used in connection with drilling and sampling at Cortez conform to industry accepted quality control methods.
| BARRICK THIRD QUARTER 2026 | 58 | MANAGEMENT’S DISCUSSION AND ANALYSIS |
| OVERVIEW | OPERATING PERFORMANCE |
FUTURE GROWTH |
REVIEW OF FINANCIAL RESULTS |
OTHER INFORMATION & NON-GAAP RECONCILIATIONS |
FINANCIAL STATEMENTS | |||||
Consolidated Statements of Income
| Barrick Mining Corporation (in millions of United States dollars, except per share data) (Unaudited) |
Three months ended September 30, |
Nine months ended September 30, |
||||||||||||||
| 2026 | 2025 | 2026 | 2025 | |||||||||||||
| Revenue (notes 5 and 6) |
$5,073 | $4,148 | $15,583 | $10,959 | ||||||||||||
| Costs and expenses (income) |
||||||||||||||||
| Cost of sales (notes 5 and 7) |
2,361 | 1,890 | 6,855 | 5,553 | ||||||||||||
| General and administrative expenses |
51 | 77 | 121 | 158 | ||||||||||||
| Exploration, evaluation and project expenses |
126 | 92 | 376 | 228 | ||||||||||||
| Impairment (reversals) charges |
(1 | ) | 3 | (2 | ) | 7 | ||||||||||
| Loss (gain) on currency translation |
1 | (3 | ) | 35 | (3 | ) | ||||||||||
| Closed mine rehabilitation |
(4 | ) | 4 | 8 | 15 | |||||||||||
| Income from equity investees (note 12) |
(204 | ) | (146 | ) | (675 | ) | (290 | ) | ||||||||
| Other expense (income) (note 9) |
66 | (193 | ) | 271 | 330 | |||||||||||
| Income before finance costs and income taxes |
$2,677 | $2,424 | $8,594 | $4,961 | ||||||||||||
| Finance costs, net |
(38 | ) | (43 | ) | (103 | ) | (163 | ) | ||||||||
| Income before income taxes |
$2,639 | $2,381 | $8,491 | $4,798 | ||||||||||||
| Income tax expense (note 10) |
(601 | ) | (477 | ) | (2,080 | ) | (857 | ) | ||||||||
| Net income |
$2,038 | $1,904 | $6,411 | $3,941 | ||||||||||||
| Attributable to: |
||||||||||||||||
| Equity holders of Barrick Mining Corporation |
$1,317 | $1,302 | $4,136 | $2,587 | ||||||||||||
| Non-controlling interests (note 16) |
$721 | $602 | $2,275 | $1,354 | ||||||||||||
| Earnings per share attributable to the equity holders of Barrick Mining Corporation (note 8) |
||||||||||||||||
| Net income |
||||||||||||||||
| Basic |
$0.80 | $0.76 | $2.49 | $1.51 | ||||||||||||
| Diluted |
$0.80 | $0.76 | $2.49 | $1.51 | ||||||||||||
The accompanying notes are an integral part of these condensed interim consolidated financial statements.
| BARRICK THIRD QUARTER 2026 | 59 | FINANCIAL STATEMENTS (UNAUDITED) |
| OVERVIEW | OPERATING PERFORMANCE |
FUTURE GROWTH |
REVIEW OF FINANCIAL RESULTS |
OTHER INFORMATION & NON-GAAP RECONCILIATIONS |
FINANCIAL STATEMENTS | |||||
Consolidated Statements
of Comprehensive Income
| Barrick Mining Corporation (in millions of United States dollars) (Unaudited) |
Three months ended September 30, |
Nine months ended September 30, |
||||||||||||||
| 2026 | 2025 | 2026 | 2025 | |||||||||||||
| Net income |
$2,038 | $1,904 | $6,411 | $3,941 | ||||||||||||
| Other comprehensive income, net of taxes |
||||||||||||||||
| Items that may be reclassified subsequently to profit or loss: |
||||||||||||||||
| Unrealized (loss) gain on derivatives designated as cash flow hedges, net of tax $nil, $nil, $nil and $nil |
(17 | ) | (150 | ) | 134 | (150 | ) | |||||||||
| Realized losses on derivatives designated as cash flow hedges, net of tax $nil, $nil, $nil and $nil |
3 | — | 63 | — | ||||||||||||
| Items that will not be reclassified to profit or loss: |
||||||||||||||||
| Actuarial loss on post employment benefit obligations, net of tax $nil, $nil, $nil and $nil |
— | 1 | — | (1 | ) | |||||||||||
| Net unrealized change on equity investments, net of tax $(3), $(1), $3 and $(2) |
21 | 24 | (20 | ) | 41 | |||||||||||
| Net realized change on equity investments, net of tax $nil, $(1), $(9) and $(1) |
— | — | 51 | — | ||||||||||||
| Total other comprehensive income (loss) |
7 | (125 | ) | 228 | (110 | ) | ||||||||||
| Total comprehensive income |
$2,045 | $1,779 | $6,639 | $3,831 | ||||||||||||
| Attributable to: |
||||||||||||||||
| Equity holders of Barrick Mining Corporation |
$1,324 | $1,177 | $4,364 | $2,477 | ||||||||||||
| Non-controlling interests |
$721 | $602 | $2,275 | $1,354 | ||||||||||||
The accompanying notes are an integral part of these condensed interim consolidated financial statements.
| BARRICK THIRD QUARTER 2026 | 60 | FINANCIAL STATEMENTS (UNAUDITED) |
| OVERVIEW | OPERATING PERFORMANCE |
FUTURE GROWTH |
REVIEW OF FINANCIAL RESULTS |
OTHER INFORMATION & NON-GAAP RECONCILIATIONS |
FINANCIAL STATEMENTS | |||||
Consolidated Statements of Cash Flow
| Barrick Mining Corporation (in millions of United States dollars) (Unaudited) |
Three months ended September 30, |
Nine months ended September 30, |
||||||||||||||
| 2026 | 2025 | 2026 | 2025 | |||||||||||||
| OPERATING ACTIVITIES |
||||||||||||||||
| Net income |
$2,038 | $1,904 | $6,411 | $3,941 | ||||||||||||
| Adjustments for the following items: |
||||||||||||||||
| Depreciation |
567 | 460 | 1,622 | 1,307 | ||||||||||||
| Finance costs, net |
38 | 43 | 103 | 163 | ||||||||||||
| Impairment (reversals) charges |
(1 | ) | 3 | (2 | ) | 7 | ||||||||||
| Income tax expense (note 10) |
601 | 477 | 2,080 | 857 | ||||||||||||
| Income from equity investees (note 12) |
(204 | ) | (146 | ) | (675 | ) | (290 | ) | ||||||||
| Gain on sale of non-current assets (note 9) |
(102 | ) | — | (111 | ) | (745 | ) | |||||||||
| Loulo-Gounkoto (note 4 and 9) |
106 | (250 | ) | 316 | 785 | |||||||||||
| Loss (gain) on currency translation |
1 | (3 | ) | 35 | (3 | ) | ||||||||||
| Change in working capital (note 11) |
(100 | ) | 184 | (781 | ) | (50 | ) | |||||||||
| Other operating activities (note 11) |
(69 | ) | (24 | ) | (439 | ) | (136 | ) | ||||||||
| Operating cash flows before interest and income taxes |
2,875 | 2,648 | 8,559 | 5,836 | ||||||||||||
| Interest paid |
(25 | ) | (18 | ) | (166 | ) | (157 | ) | ||||||||
| Interest received |
52 | 53 | 157 | 136 | ||||||||||||
| Income taxes paid1 |
(413 | ) | (261 | ) | (1,803 | ) | (852 | ) | ||||||||
| Net cash provided by operating activities |
2,489 | 2,422 | 6,747 | 4,963 | ||||||||||||
| INVESTING ACTIVITIES |
||||||||||||||||
| Property, plant and equipment |
||||||||||||||||
| Capital expenditures (note 5) |
(1,322 | ) | (943 | ) | (3,490 | ) | (2,714 | ) | ||||||||
| Sales proceeds |
7 | — | 15 | 2 | ||||||||||||
| Divestitures |
98 | — | 135 | 999 | ||||||||||||
| Income taxes paid on divestitures |
(13 | ) | (44 | ) | (20 | ) | (131 | ) | ||||||||
| Investment (purchases) sales |
(15 | ) | — | 95 | — | |||||||||||
| Funding of equity method investments (note 12) |
— | (1 | ) | (2 | ) | (1 | ) | |||||||||
| Dividends received from equity method investments (note 12) |
100 | 63 | 377 | 154 | ||||||||||||
| Shareholder loans to equity method investments |
(16 | ) | 64 | 215 | 177 | |||||||||||
| Net cash used in investing activities |
(1,161 | ) | (861 | ) | (2,675 | ) | (1,514 | ) | ||||||||
| FINANCING ACTIVITIES |
||||||||||||||||
| Lease repayments |
(3 | ) | (3 | ) | (13 | ) | (20 | ) | ||||||||
| Debt repayments |
— | — | (47 | ) | (2 | ) | ||||||||||
| Dividends |
(280 | ) | (254 | ) | (1,265 | ) | (596 | ) | ||||||||
| Share buyback program (note 15) |
(761 | ) | (589 | ) | (1,970 | ) | (1,000 | ) | ||||||||
| Funding from Reko Diq non-controlling interests (note 16) |
128 | 101 | 321 | 228 | ||||||||||||
| Disbursements to non-controlling interests (note 16) |
(747 | ) | (524 | ) | (2,235 | ) | (1,056 | ) | ||||||||
| Pueblo Viejo JV partner shareholder loan |
(3 | ) | (26 | ) | 20 | (9 | ) | |||||||||
| Net cash used in financing activities |
(1,666 | ) | (1,295 | ) | (5,189 | ) | (2,455 | ) | ||||||||
| Effect of exchange rate changes on cash and equivalents |
— | 1 | — | 1 | ||||||||||||
| Net increase (decrease) in cash and equivalents |
(338 | ) | 267 | (1,117 | ) | 995 | ||||||||||
| Cash and equivalents at the beginning of period |
5,927 | 4,802 | 6,706 | 4,074 | ||||||||||||
| Cash and equivalents at the end of period |
$5,589 | $5,069 | $5,589 | $5,069 | ||||||||||||
| Less: cash and equivalents classified as held for sale at the end of period |
— | 32 | — | 32 | ||||||||||||
| Cash and equivalents excluding assets classified as held for sale at the end of period |
$5,589 | $5,037 | $5,589 | $5,037 | ||||||||||||
| 1 | Income taxes paid excludes $61 million (Q3 2025: $53 million) for Q3 2026 and $135 million (YTD 2025: $128 million) for YTD 2026 of income taxes payable that were settled against offsetting value added tax (“VAT”) receivables. |
The accompanying notes are an integral part of these condensed interim consolidated financial statements.
| BARRICK THIRD QUARTER 2026 | 61 | FINANCIAL STATEMENTS (UNAUDITED) |
| OVERVIEW | OPERATING PERFORMANCE |
FUTURE GROWTH |
REVIEW OF FINANCIAL RESULTS |
OTHER INFORMATION & NON-GAAP RECONCILIATIONS |
FINANCIAL STATEMENTS | |||||
Consolidated Balance Sheets
| Barrick Mining Corporation (in millions of United States dollars) (Unaudited) |
As at September 30, 2026 |
As at December 31, 2025 (Revised)1 |
||||||
| ASSETS |
||||||||
| Current assets |
||||||||
| Cash and equivalents |
$5,589 | $6,706 | ||||||
| Accounts receivable |
814 | 803 | ||||||
| Inventories |
2,116 | 2,070 | ||||||
| Other current assets |
777 | 652 | ||||||
| Total current assets |
$9,296 | $10,231 | ||||||
| Non-current assets |
||||||||
| Non-current portion of inventory |
2,898 | 2,792 | ||||||
| Equity in investees (note 12) |
4,325 | 4,216 | ||||||
| Property, plant and equipment |
31,107 | 29,351 | ||||||
| Intangible assets |
148 | 148 | ||||||
| Goodwill |
3,034 | 3,034 | ||||||
| Deferred income tax assets |
52 | 43 | ||||||
| Other assets |
1,987 | 1,841 | ||||||
| Total assets |
$52,847 | $51,656 | ||||||
| LIABILITIES AND EQUITY |
||||||||
| Current liabilities |
||||||||
| Accounts payable |
$2,028 | $1,907 | ||||||
| Debt |
15 | 56 | ||||||
| Current income tax liabilities |
735 | 842 | ||||||
| Other current liabilities |
623 | 912 | ||||||
| Total current liabilities |
$3,401 | $3,717 | ||||||
| Non-current liabilities |
||||||||
| Debt |
4,665 | 4,647 | ||||||
| Provisions |
1,649 | 1,846 | ||||||
| Deferred income tax liabilities |
4,402 | 3,909 | ||||||
| Other liabilities |
1,387 | 1,621 | ||||||
| Total liabilities |
$15,504 | $15,740 | ||||||
| Equity |
||||||||
| Capital stock (note 15) |
$26,095 | $26,834 | ||||||
| Retained earnings (deficit) |
1,486 | (1,243 | ) | |||||
| Accumulated other comprehensive loss |
(45 | ) | (273 | ) | ||||
| Other |
38 | 1,166 | ||||||
| Total equity attributable to Barrick Mining Corporation shareholders |
$27,574 | $26,484 | ||||||
| Non-controlling interests (note 16) |
9,769 | 9,432 | ||||||
| Total equity |
$37,343 | $35,916 | ||||||
| Contingencies and commitments (notes 5 and 17) |
||||||||
| Total liabilities and equity |
$52,847 | $51,656 | ||||||
| 1. | 2025 figures have been revised to reflect an update to the provisional purchase price allocation relating to Loulo-Gounkoto. Refer to note 4 for further details. |
The accompanying notes are an integral part of these condensed interim consolidated financial statements.
| BARRICK THIRD QUARTER 2026 | 62 | FINANCIAL STATEMENTS (UNAUDITED) |
| OVERVIEW | OPERATING PERFORMANCE |
FUTURE GROWTH |
REVIEW OF FINANCIAL RESULTS |
OTHER INFORMATION & NON-GAAP RECONCILIATIONS |
FINANCIAL STATEMENTS | |||||
Consolidated Statements of Changes in Equity
| Barrick Mining Corporation |
Attributable to equity holders of the company | |||||||||||||||||||||||||||||||
| (in millions of United States dollars) (Unaudited) |
Common Shares (in thousands) |
Capital stock |
Retained earnings (deficit) |
Accumulated income (loss)1 |
Other2 | Total equity attributable to shareholders |
Non- controlling interests |
Total equity |
||||||||||||||||||||||||
| At January 1, 2026 (Revised)3 |
1,675,360 | $26,834 | ($1,243 | ) | ($273 | ) | $1,166 | $26,484 | $9,432 | $35,916 | ||||||||||||||||||||||
| Net income |
— | — | 4,136 | — | — | 4,136 | 2,275 | 6,411 | ||||||||||||||||||||||||
| Total other comprehensive income |
— | — | — | 228 | — | 228 | — | 228 | ||||||||||||||||||||||||
| Total comprehensive income |
— | — | 4,136 | 228 | — | 4,364 | 2,275 | 6,639 | ||||||||||||||||||||||||
| Transactions with owners |
||||||||||||||||||||||||||||||||
| Dividends |
— | — | (1,265 | ) | — | — | (1,265 | ) | — | (1,265 | ) | |||||||||||||||||||||
| Funding from non-controlling interests (note 16) |
— | — | — | — | — | — | 321 | 321 | ||||||||||||||||||||||||
| Disbursements to non-controlling interests (note 16) |
— | — | — | — | — | — | (2,259 | ) | (2,259 | ) | ||||||||||||||||||||||
| Dividend reinvestment plan (note 15) |
356 | 15 | (15 | ) | — | — | — | — | — | |||||||||||||||||||||||
| Share buyback program |
(47,083 | ) | (754 | ) | (127 | ) | — | (1,128 | ) | (2,009 | ) | — | (2,009 | ) | ||||||||||||||||||
| Total transactions with owners |
(46,727 | ) | (739 | ) | (1,407 | ) | — | (1,128 | ) | (3,274 | ) | (1,938 | ) | (5,212 | ) | |||||||||||||||||
| At September 30, 2026 |
1,628,633 | $26,095 | $1,486 | ($45 | ) | $38 | $27,574 | $9,769 | $37,343 | |||||||||||||||||||||||
| At January 1, 2025 |
1,727,100 | $27,661 | ($5,269 | ) | $33 | $1,865 | $24,290 | $8,966 | $33,256 | |||||||||||||||||||||||
| Net income |
— | — | 2,587 | — | — | 2,587 | 1,354 | 3,941 | ||||||||||||||||||||||||
| Total other comprehensive income |
— | — | — | (110 | ) | — | (110 | ) | — | (110 | ) | |||||||||||||||||||||
| Total comprehensive income (loss) |
— | — | 2,587 | (110 | ) | — | 2,477 | 1,354 | 3,831 | |||||||||||||||||||||||
| Transactions with owners |
||||||||||||||||||||||||||||||||
| Dividends |
— | — | (596 | ) | — | — | (596 | ) | — | (596 | ) | |||||||||||||||||||||
| Loulo-Gounkoto loss of control (note 4) |
— | — | — | — | — | — | (686 | ) | (686 | ) | ||||||||||||||||||||||
| Funding from non-controlling interests |
— | — | — | — | — | — | 228 | 228 | ||||||||||||||||||||||||
| Disbursements to non-controlling interests |
— | — | — | — | — | — | (1,096 | ) | (1,096 | ) | ||||||||||||||||||||||
| Dividend reinvestment plan |
125 | 3 | (3 | ) | — | — | — | — | — | |||||||||||||||||||||||
| Share buyback program |
(39,791 | ) | (638 | ) | — | — | (383 | ) | (1,021 | ) | — | (1,021 | ) | |||||||||||||||||||
| Total transactions with owners |
(39,666 | ) | (635 | ) | (599 | ) | — | (383 | ) | (1,617 | ) | (1,554 | ) | (3,171 | ) | |||||||||||||||||
| At September 30, 2025 |
1,687,434 | $27,026 | ($3,281 | ) | ($77 | ) | $1,482 | $25,150 | $8,766 | $33,916 | ||||||||||||||||||||||
| 1 | Includes cumulative translation losses as at September 30, 2026: $95 million (December 31, 2025: $95 million; September 30, 2025: $95 million). |
| 2 | Includes additional paid-in capital as at September 30, 2026: $nil (December 31, 2025: $1,128 million; September 30, 2025: $1,444 million). |
| 3 | Figures have been revised to reflect an update to the provisional purchase price allocation recorded in the fourth quarter of 2025 relating to Loulo-Gounkoto. Refer to note 4 for further details. |
The accompanying notes are an integral part of these condensed interim consolidated financial statements.
| BARRICK THIRD QUARTER 2026 | 63 | FINANCIAL STATEMENTS (UNAUDITED) |
| OVERVIEW | OPERATING PERFORMANCE |
FUTURE GROWTH |
REVIEW OF FINANCIAL RESULTS |
OTHER INFORMATION & NON-GAAP RECONCILIATIONS |
FINANCIAL STATEMENTS | |||||
Notes to Consolidated Financial Statements
Barrick Mining Corporation. Tabular dollar amounts in millions of United States dollars, unless otherwise shown.
1 ∎ Corporate Information
Barrick Mining Corporation (“Barrick”, “we” or the “Company”) is a corporation governed by the Business Corporations Act (British Columbia). The Company’s corporate office is located at Brookfield Place, TD Canada Trust Tower, 161 Bay Street, Suite 3700, Toronto, Ontario, M5J 2S1. The Company’s registered office is 925 West Georgia Street, Suite 1600, Vancouver, British Columbia, V6C 3L2. Barrick shares trade on the New York Stock Exchange under the symbol B and the Toronto Stock Exchange under the symbol ABX. We are principally engaged in the production and sale of gold and copper, as well as related activities such as exploration and mine development. We sell our gold and copper into the world market.
We have ownership interests in producing gold mines that are located in Argentina, the Democratic Republic of the Congo, the Dominican Republic, Mali, Papua New Guinea, Tanzania and the United States. We have ownership interests in producing copper mines in Chile, Saudi Arabia and Zambia. We also have various projects located throughout the Americas, Asia and Africa.
2 ∎ Material Accounting Policy Information
a) Statement of Compliance
These condensed interim consolidated financial statements have been prepared in accordance with IFRS Accounting Standards as issued by the International Accounting Standards Board (“IASB”) applicable to the preparation of interim financial statements, under International Accounting Standard 34, Interim Financial Reporting. These interim financial statements should be read in conjunction with Barrick’s most recently issued Annual Report, which includes information necessary or useful to understanding the Company’s business and financial statement presentation. In particular, the Company’s material accounting policy information was presented in note 2 of the Annual Consolidated Financial Statements for the year ended December 31, 2025 (“2025 Annual Financial Statements”), and have been consistently applied in the preparation of these interim financial statements. These condensed interim consolidated financial statements were authorized for issuance by the Board of Directors on November 6, 2026.
b) New Accounting Standards Issued
Certain new accounting standards and interpretations have been published that are either applicable in the current year or not mandatory for the current period. We have assessed these standards and determined they do not have a material impact on Barrick in the current reporting period. In particular, the following standards have been issued by the IASB.
| ∎ | Amendments to the Classification and Measurement of Financial Instruments (IFRS 9 and IFRS 7) with mandatory application of the standard in annual reporting periods beginning on or after January 1, 2026. The amendment clarifies the date of recognition and derecognition of some financial assets and liabilities, and updates the disclosures for equity instruments designated at fair value through other |
| comprehensive income. This did not have a material impact on the financial statements. |
| ∎ | IFRS 18 Presentation and Disclosure in Financial Statements with mandatory application of the standard in annual reporting periods beginning on or after January 1, 2027. Even though IFRS 18 will not impact the recognition or measurement of items in the financial statements, it will impact presentation and disclosure of certain aspects of the financial statements including management-defined performance measures (MPM) within the financial statements. We are currently assessing the detailed implications of applying the new standard on the financial statements. Based on our preliminary assessment, items of income and expenses in the statement of income will be grouped into new categories resulting in new subtotals and/or line items being presented and changes in how certain existing subtotals are calculated; operating profit will be the starting point for determining cash flows from operating activities instead of net income and interest paid will be presented as financing cash flows and interest received as investing cash flows; and new disclosures will be required for MPMs, of which we believe that the following will meet the MPM definition: adjusted net earnings, EBITDA, adjusted EBITDA and attributable adjusted EBITDA. |
No standards have been early adopted in the current period.
3 ∎ Critical Judgments, Estimates, Assumptions and Risks
The judgments, estimates, assumptions and risks discussed here reflect updates from the 2025 Annual Financial Statements. For judgments, estimates, assumptions and risks related to other areas not discussed in these interim consolidated financial statements, please refer to Notes 3 and 28 of the 2025 Annual Financial Statements.
a) Provision for Environmental Rehabilitation (“PER”)
Provisions are updated each reporting period for changes to expected cash flows and for the effect of changes in the discount rate and foreign exchange rates. The change in estimate is added or deducted from the related asset and depreciated over the expected economic life of the operation to which it relates. In the case of closed sites, changes in estimates and assumptions are recognized immediately in the consolidated statements of income. For Q3 2026, we recorded a net decrease of $111 million (Q3 2025: $68 million net decrease) to the PER at our minesites and for YTD 2026, a net decrease of $190 million (YTD 2025: $150 million net decrease) primarily due to spending incurred during the year and an increase in the discount rate, partially offset by accretion.
Adjustments to the estimated amount and timing of future closure and rehabilitation cash flows are a normal occurrence in light of the significant judgments and estimates involved. Rehabilitation provisions are adjusted as a result of changes in estimates and assumptions and are accounted for prospectively. In Q4 of each year, our life of mine plans are updated and that typically results in an update to the rehabilitation provision.
| BARRICK THIRD QUARTER 2026 | 64 | NOTES TO FINANCIAL STATEMENTS (UNAUDITED) |
| OVERVIEW | OPERATING PERFORMANCE |
FUTURE GROWTH |
REVIEW OF FINANCIAL RESULTS |
OTHER INFORMATION & NON-GAAP RECONCILIATIONS |
FINANCIAL STATEMENTS | |||||
b) Contingencies
Contingencies can be either possible assets or possible liabilities arising from past events which, by their nature, will be resolved only when one or more future events, not wholly within our control, occur or fail to occur. The assessment of such contingencies inherently involves the exercise of significant judgment and estimates of the outcome of future events. Refer to note 17 for further details on contingencies.
4 ∎ Acquisitions and Divestitures
a) Loulo-Gounkoto
On June 16, 2025, the Bamako Commercial Tribunal placed Loulo-Gounkoto under temporary provisional administration. While Barrick retained its 80% legal ownership of the mining complex, control over operations transferred to an external administrator. Following this action by the Malian courts, management concluded that Barrick had lost control of the subsidiaries that hold our interest in Loulo-Gounkoto because we could not effectively exercise power over the relevant activities related to the mine, nor could we affect the returns of the mine through managerial involvement. As a result of the loss of control event in Q2 2025, we deconsolidated the subsidiaries, and derecognized the assets, liabilities and non-controlling interest of Loulo-Gounkoto at their carrying amounts at the date when control was lost.
On November 24, 2025, Barrick announced that an agreement had been entered into with the Government of the Republic of Mali to put an end to all disputes regarding the Loulo and Gounkoto mines. The provisional administration of the Loulo-Gounkoto complex was terminated on December 16, 2025, at which point operational control was handed back to the management of Société des Mines de Loulo SA (“Somilo”) and Société des Mines de Gounkoto SA (“Gounkoto”).
We have determined that this represents a business combination with Barrick identified as the acquirer. We have determined the acquisition price should be equal to the fair value of Barrick’s 80% investment in the equity of Somilo and Gounkoto.
We have determined the fair value of Barrick’s existing interest in Loulo-Gounkoto immediately before the acquisition of control, which represents the fair value of the consideration in the transaction. We have also determined the fair value of the non-controlling interest and performed a provisional allocation of the purchase price to identified assets and liabilities.
The table below presents the provisional allocation of the purchase price to the assets and liabilities acquired, as initially recorded in the fourth quarter of 2025. A measurement period update was recorded in the second quarter of 2026, primarily due to additional royalties, penalties and interest related to the periods prior to obtaining control. This resulted in adjustments to those provisional fair values effective as at the acquisition date in December 2025, as well as the net expense related to Loulo-Gounkoto recognized in Q4 2025. Refer to note 17 for further details.
| ($ millions) |
Preliminary | Change | Revised | |||||||||
| Fair value (100%) |
$ | 3,220 | $ | (91 | ) | $ | 3,129 | |||||
| Fair value (80%) |
2,576 | (73 | ) | 2,503 | ||||||||
| Provisional fair value allocation at acquisition |
| |||||||||||
| Cash |
$ | 71 | $ | — | $ | 71 | ||||||
| Other current assets |
154 | 12 | 166 | |||||||||
| Inventory |
629 | 2 | 631 | |||||||||
| Property, plant and equipment |
3,131 | (3 | ) | 3,128 | ||||||||
| Other long-term assets |
120 | 68 | 188 | |||||||||
| Total assets |
$ | 4,105 | $ | 79 | $ | 4,184 | ||||||
| Current liabilities |
$ | 347 | $ | 244 | $ | 591 | ||||||
| Deferred income tax liabilities |
474 | (75 | ) | 399 | ||||||||
| Lease liabilities |
17 | — | 17 | |||||||||
| Provisions |
47 | — | 47 | |||||||||
| Other liability to NCI |
240 | (90 | ) | 150 | ||||||||
| Total liabilities |
$ | 1,125 | $ | 79 | $ | 1,204 | ||||||
| Non-controlling interests |
404 | 73 | 477 | |||||||||
| Net assets acquired |
$ | 2,576 | $ | (73 | ) | $ | 2,503 | |||||
We primarily used a discounted cash flow model (being the net present value of expected future cash flows) to determine the fair value of the mining interests and used a depreciated replacement cost approach in determining the fair value of property, plant and equipment. Expected future cash flows are based on estimates of future gold prices inclusive of a $3,000/oz long-term gold price and projected future revenues, estimated quantities of ore reserves and mineral resources, including expected conversions of resources to reserves, expected future production costs and capital expenditures based on the life of mine plans for the mines as at the acquisition date. A WACC of 16% was applied in the discounted cash flow model.
Since it was consolidated from December 16, 2025, Loulo-Gounkoto contributed revenue of $505 million and net income of $16 million for the year ended December 31, 2025. If the acquisition had occurred on January 1, 2025, consolidated revenue and consolidated net income for the year ended December 31, 2025, would have been $1,036 million and $484 million, respectively. For the nine months ended September 30, 2026, revenue and net income were $1,441 million and $587 million, respectively, and excludes other expenses relating to additional royalties, penalties and interest paid to the Government of Mali due to the retrospective application of the 2023 Mining Code to 2024 and 2025. Refer to note 9 for further details. The fair value of accounts receivable was $104 million (included in other current assets) as at December 16, 2025, which was equivalent to the contractual amount.
| BARRICK THIRD QUARTER 2026 | 65 | NOTES TO FINANCIAL STATEMENTS (UNAUDITED) |
| OVERVIEW | OPERATING PERFORMANCE |
FUTURE GROWTH |
REVIEW OF FINANCIAL RESULTS |
OTHER INFORMATION & NON-GAAP RECONCILIATIONS |
FINANCIAL STATEMENTS | |||||
5 ∎ Segment Information
Barrick’s business is organized into fourteen minesites. Barrick’s Chief Operating Decision Maker (“CODM”) (Mark Hill, President and Chief Executive Officer) reviews the operating results, assesses performance and makes capital allocation decisions at the minesite level. Our presentation of our reportable operating segments consists of eight gold mines (Carlin, Cortez, Turquoise Ridge, Pueblo Viejo, Loulo-Gounkoto, Kibali, North Mara and Bulyanhulu) and one copper mine (Lumwana). The remaining operating segments, including our remaining gold mines, have been grouped into an “Other Mines” category and will not be reported on individually. Segment performance is evaluated based on a number of measures including operating income before tax, production levels and unit production costs. Certain costs are managed on a consolidated basis and are therefore not reflected in segment income.
Consolidated Statement of Income Information
| Cost of Sales | ||||||||||||||||||||||||
| For the three months ended September 30, 2026 |
Revenue | Site operating costs, royalties and community relations |
Depreciation | Exploration, evaluation and project expenses |
Other expenses (income)1 |
Segment income | ||||||||||||||||||
| Carlin2 |
$1,165 | $374 | $114 | $— | $3 | $674 | ||||||||||||||||||
| Cortez2 |
839 | 287 | 118 | — | — | 434 | ||||||||||||||||||
| Turquoise Ridge2 |
587 | 183 | 42 | 1 | (3 | ) | 364 | |||||||||||||||||
| Pueblo Viejo2 |
694 | 190 | 78 | — | 3 | 423 | ||||||||||||||||||
| Loulo-Gounkoto2,3 |
534 | 243 | 48 | — | 8 | 235 | ||||||||||||||||||
| Kibali4 |
396 | 104 | 40 | — | 6 | 246 | ||||||||||||||||||
| Lumwana |
465 | 203 | 65 | — | 5 | 192 | ||||||||||||||||||
| North Mara2 |
198 | 104 | 25 | 1 | 13 | 55 | ||||||||||||||||||
| Bulyanhulu2 |
235 | 74 | 20 | — | 4 | 137 | ||||||||||||||||||
| Reportable segment total |
$5,113 | $1,762 | $550 | $2 | $39 | $2,760 | ||||||||||||||||||
| Other Mines2 |
376 | 135 | 45 | 1 | (4 | ) | 199 | |||||||||||||||||
| Share of equity investees4 |
(396 | ) | (104 | ) | (40 | ) | — | (6 | ) | (246 | ) | |||||||||||||
| Segment total |
$5,093 | $1,793 | $555 | $3 | $29 | $2,713 | ||||||||||||||||||
Consolidated Statement of Income Information
| Cost of Sales | ||||||||||||||||||||||||
| For the three months ended September 30, 2025 |
Revenue | Site operating costs, royalties and community relations |
Depreciation | Exploration, evaluation and project expenses |
Other expenses (income)1 |
Segment income | ||||||||||||||||||
| Carlin2 |
$979 | $333 | $80 | $3 | $3 | $560 | ||||||||||||||||||
| Cortez2 |
712 | 249 | 73 | 2 | 1 | 387 | ||||||||||||||||||
| Turquoise Ridge2 |
490 | 153 | 48 | — | (4 | ) | 293 | |||||||||||||||||
| Pueblo Viejo2 |
631 | 183 | 77 | 1 | 4 | 366 | ||||||||||||||||||
| Loulo-Gounkoto2,3 |
— | — | — | — | — | — | ||||||||||||||||||
| Kibali4 |
294 | 86 | 38 | — | 9 | 161 | ||||||||||||||||||
| Lumwana |
322 | 125 | 68 | — | 5 | 124 | ||||||||||||||||||
| North Mara2 |
309 | 95 | 35 | — | 4 | 175 | ||||||||||||||||||
| Bulyanhulu2 |
173 | 69 | 18 | — | 2 | 84 | ||||||||||||||||||
| Reportable segment total |
$3,910 | $1,293 | $437 | $6 | $24 | $2,150 | ||||||||||||||||||
| Other Mines2 |
582 | 219 | 54 | 2 | 6 | 301 | ||||||||||||||||||
| Share of equity investees4 |
(294 | ) | (86 | ) | (38 | ) | — | (9 | ) | (161 | ) | |||||||||||||
| Segment total |
$4,198 | $1,426 | $453 | $8 | $21 | $2,290 | ||||||||||||||||||
| BARRICK THIRD QUARTER 2026 | 66 | NOTES TO FINANCIAL STATEMENTS (UNAUDITED) |
| OVERVIEW | OPERATING PERFORMANCE |
FUTURE GROWTH |
REVIEW OF FINANCIAL RESULTS |
OTHER INFORMATION & NON-GAAP RECONCILIATIONS |
FINANCIAL STATEMENTS | |||||
Consolidated Statement of Income Information
| Cost of Sales | ||||||||||||||||||||||||
| For the nine months ended September 30, 2026 |
Revenue | Site operating costs, royalties and community relations |
Depreciation | Exploration, evaluation and project expenses |
Other expenses (income)1 |
Segment income | ||||||||||||||||||
| Carlin2 |
$3,814 | $1,159 | $358 | $1 | $7 | $2,289 | ||||||||||||||||||
| Cortez2 |
2,300 | 808 | 290 | 2 | 3 | 1,197 | ||||||||||||||||||
| Turquoise Ridge2 |
1,949 | 522 | 131 | 1 | (10 | ) | 1,305 | |||||||||||||||||
| Pueblo Viejo2 |
2,165 | 574 | 231 | 3 | 9 | 1,348 | ||||||||||||||||||
| Loulo-Gounkoto2,3 |
1,441 | 659 | 127 | — | 68 | 587 | ||||||||||||||||||
| Kibali4 |
1,052 | 302 | 107 | — | 25 | 618 | ||||||||||||||||||
| Lumwana |
1,317 | 586 | 179 | — | 14 | 538 | ||||||||||||||||||
| North Mara2 |
610 | 276 | 69 | 1 | 21 | 243 | ||||||||||||||||||
| Bulyanhulu2 |
694 | 221 | 59 | — | 7 | 407 | ||||||||||||||||||
| Reportable segment total |
$15,342 | $5,107 | $1,551 | $8 | $144 | $8,532 | ||||||||||||||||||
| Other Mines2 |
1,334 | 417 | 149 | 5 | (3 | ) | 766 | |||||||||||||||||
| Share of equity investees4 |
(1,052 | ) | (302 | ) | (107 | ) | — | (25 | ) | (618 | ) | |||||||||||||
| Segment total |
$15,624 | $5,222 | $1,593 | $13 | $116 | $8,680 | ||||||||||||||||||
Consolidated Statement of Income Information
| Cost of Sales | ||||||||||||||||||||||||
| For the nine months ended September 30, 2025 |
Revenue | Site operating costs, royalties and community relations |
Depreciation | Exploration, evaluation and project expenses |
Other expenses (income)1 |
Segment income (loss) |
||||||||||||||||||
| Carlin2 |
$2,555 | $1,033 | $210 | $8 | $7 | $1,297 | ||||||||||||||||||
| Cortez2 |
1,747 | 665 | 192 | 5 | 5 | 880 | ||||||||||||||||||
| Turquoise Ridge2 |
1,264 | 481 | 139 | — | (8 | ) | 652 | |||||||||||||||||
| Pueblo Viejo2 |
1,525 | 535 | 229 | 2 | 10 | 749 | ||||||||||||||||||
| Loulo-Gounkoto2,3 |
— | — | 14 | 1 | 142 | (157 | ) | |||||||||||||||||
| Kibali4 |
712 | 243 | 102 | — | 45 | 322 | ||||||||||||||||||
| Lumwana |
967 | 398 | 197 | — | 9 | 363 | ||||||||||||||||||
| North Mara2 |
745 | 241 | 75 | — | 18 | 411 | ||||||||||||||||||
| Bulyanhulu2 |
452 | 180 | 48 | — | 6 | 218 | ||||||||||||||||||
| Reportable segment total |
$9,967 | $3,776 | $1,206 | $16 | $234 | $4,735 | ||||||||||||||||||
| Other Mines2 |
1,775 | 698 | 177 | 5 | 18 | 877 | ||||||||||||||||||
| Share of equity investees4 |
(712 | ) | (243 | ) | (102 | ) | — | (45 | ) | (322 | ) | |||||||||||||
| Segment total |
$11,030 | $4,231 | $1,281 | $21 | $207 | $5,290 | ||||||||||||||||||
| 1 | Includes accretion expense, which is included within finance costs in the consolidated statement of income. For Q3 2026, accretion expense was $12 million (Q3 2025: $13 million) and for YTD 2026, accretion expense was $35 million (YTD 2025: $39 million). |
| 2 | Includes non-controlling interest portion of revenues, cost of sales and segment income (loss) for Q3 2026 for Nevada Gold Mines $1,090 million, $468 million, $623 million (Q3 2025: $918 million, $395 million, $519 million), Pueblo Viejo $281 million, $107 million, $174 million (Q3 2025: $254 million, $104 million, $150 million), Loulo-Gounkoto $107 million, $58 million, $18 million (Q3 2025: $nil, $nil, $nil), North Mara and Bulyanhulu $69 million, $36 million, $31 million (Q3 2025: $77 million, $35 million, $41 million), and Tongon $nil, $nil, $nil (Q3 2025: $13 million, $6 million, $6 million), and for YTD 2026 for Nevada Gold Mines $3,381 million, $1,370 million, $2,009 million (YTD 2025: $2,357 million, $1,148 million, $1,199 million), Pueblo Viejo $894 million, $323 million, $569 million (YTD 2025: $613 million, $307 million, $306 million), Loulo-Gounkoto $288 million, $157 million, $56 million (YTD 2025: $nil, $3 million, $(29) million), North Mara and Bulyanhulu $208 million, $100 million, $104 million (YTD 2025: $191 million, $87 million, $102 million), and Tongon $nil, $nil, $nil (YTD 2025: $33 million, $21 million, $11 million), respectively. |
| 3 | For Q3 2026 and YTD 2026, segment income for Loulo-Gounkoto excludes other expenses relating to additional royalties, penalties and interest paid to the Government of Mali due to the retrospective application of the 2023 Mining Code to 2024 and 2025. Refer to note 9 for further details. |
| 4 | Our 45% share of Kibali is accounted for using the equity method. |
| BARRICK THIRD QUARTER 2026 | 67 | NOTES TO FINANCIAL STATEMENTS (UNAUDITED) |
| OVERVIEW | OPERATING PERFORMANCE |
FUTURE GROWTH |
REVIEW OF FINANCIAL RESULTS |
OTHER INFORMATION & NON-GAAP RECONCILIATIONS |
FINANCIAL STATEMENTS | |||||
Reconciliation of Segment Income to Income Before Income Taxes
| For the three months ended September 30 |
For the nine months ended September 30 |
|||||||||||||||
| 2026 | 2025 | 2026 | 2025 | |||||||||||||
| Reportable segment income |
$2,760 | $2,150 | $8,532 | $4,735 | ||||||||||||
| Segment income from Other Mines |
199 | 301 | 766 | 877 | ||||||||||||
| Share of equity investees in reportable segment income |
(246 | ) | (161 | ) | (618 | ) | (322 | ) | ||||||||
| Other revenue |
(20 | ) | (50 | ) | (41 | ) | (71 | ) | ||||||||
| Other cost of sales/amortization |
(13 | ) | (11 | ) | (40 | ) | (41 | ) | ||||||||
| Exploration, evaluation and project expenses not attributable to segments |
(123 | ) | (84 | ) | (363 | ) | (207 | ) | ||||||||
| General and administrative expenses |
(51 | ) | (77 | ) | (121 | ) | (158 | ) | ||||||||
| Other income (expense) not attributable to segments |
(49 | ) | 201 | (190 | ) | (161 | ) | |||||||||
| Impairment reversals (charges) |
1 | (3 | ) | 2 | (7 | ) | ||||||||||
| (Loss) gain on currency translation |
(1 | ) | 3 | (35 | ) | 3 | ||||||||||
| Closed mine rehabilitation |
4 | (4 | ) | (8 | ) | (15 | ) | |||||||||
| Income from equity investees |
204 | 146 | 675 | 290 | ||||||||||||
| Finance costs, net (includes non-segment accretion) |
(26 | ) | (30 | ) | (68 | ) | (124 | ) | ||||||||
| Loss on non-hedge derivatives |
— | — | — | (1 | ) | |||||||||||
| Income before income taxes |
$2,639 | $2,381 | $8,491 | $4,798 | ||||||||||||
|
Capital Expenditures Information |
Segment capital expenditures1 | |||||||||||||||
| For the three months ended September 30 |
For the nine months ended September 30 |
|||||||||||||||
| 2026 | 2025 | 2026 | 2025 | |||||||||||||
| Carlin |
$219 | $150 | $600 | $510 | ||||||||||||
| Cortez |
134 | 92 | 371 | 311 | ||||||||||||
| Turquoise Ridge |
61 | 23 | 129 | 71 | ||||||||||||
| Pueblo Viejo |
110 | 87 | 343 | 258 | ||||||||||||
| Loulo-Gounkoto |
97 | — | 134 | 23 | ||||||||||||
| Kibali |
66 | 44 | 166 | 111 | ||||||||||||
| Lumwana |
333 | 199 | 740 | 452 | ||||||||||||
| North Mara |
55 | 46 | 168 | 139 | ||||||||||||
| Bulyanhulu |
56 | 42 | 148 | 116 | ||||||||||||
| Other Mines |
24 | 71 | 103 | 213 | ||||||||||||
| Segment total |
$1,155 | $754 | $2,902 | $2,204 | ||||||||||||
| Other items not allocated to segments |
234 | 254 | 869 | 622 | ||||||||||||
| Total |
$1,389 | $1,008 | $3,771 | $2,826 | ||||||||||||
| Share of equity investees |
(66 | ) | (44 | ) | (166 | ) | (111 | ) | ||||||||
| Total |
$1,323 | $964 | $3,605 | $2,715 | ||||||||||||
| 1 | Segment capital expenditures are presented for internal management reporting purposes on an accrual basis. Capital expenditures in the Consolidated Statements of Cash Flow are presented on a cash basis. For Q3 2026, cash expenditures were $1,322 million (Q3 2025: $943 million) and the increase in accrued expenditures was $1 million (Q3 2025: $21 million increase). For YTD 2026, cash expenditures were $3,490 million (YTD 2025: $2,714 million) and the increase in accrued expenditures was $115 million (YTD 2025: $1 million increase). |
Purchase Commitments
At September 30, 2026, we had purchase obligations for supplies and consumables of $3,910 million (December 31, 2025: $3,837 million).
Capital Commitments
In addition to entering into various operational commitments in the normal course of business, we had capital commitments of $2,375 million at September 30, 2026 (December 31, 2025: $2,329 million).
| BARRICK THIRD QUARTER 2026 | 68 | NOTES TO FINANCIAL STATEMENTS (UNAUDITED) |
| OVERVIEW | OPERATING PERFORMANCE |
FUTURE GROWTH |
REVIEW OF FINANCIAL RESULTS |
OTHER INFORMATION & NON-GAAP RECONCILIATIONS |
FINANCIAL STATEMENTS | |||||
6 ∎ Revenue
| For the three months ended September 30 |
For the nine months ended September 30 |
|||||||||||||||
| 2026 | 2025 | 2026 | 2025 | |||||||||||||
| Gold sales |
||||||||||||||||
| Spot market sales1 |
$4,278 | $3,577 | $13,259 | $9,295 | ||||||||||||
| Concentrate sales |
216 | 173 | 666 | 477 | ||||||||||||
| Provisional pricing adjustments |
(5 | ) | (2 | ) | (15 | ) | 22 | |||||||||
| $4,489 | $3,748 | $13,910 | $9,794 | |||||||||||||
| Copper sales |
||||||||||||||||
| Concentrate sales |
$254 | $197 | $693 | $580 | ||||||||||||
| Cathode and anode sales2 |
205 | 131 | 647 | 360 | ||||||||||||
| Provisional pricing adjustments |
— | (8 | ) | (39 | ) | 21 | ||||||||||
| $459 | $320 | $1,301 | $961 | |||||||||||||
| Other sales3 |
125 | 80 | 372 | 204 | ||||||||||||
| Total |
$5,073 | $4,148 | $15,583 | $10,959 | ||||||||||||
| 1 | Includes realized losses on gold contracts of $3 million for Q3 2026 (Q3 2025: $nil) and $63 million for YTD 2026 (YTD 2025: $nil). Refer to note 13 for further details. |
| 2 | 2025 figures have been changed to present cathode and anode sales separately from concentrate sales. |
| 3 | Revenues include the sale of by-products for our gold and copper mines. |
7 ∎ Cost of Sales
| Gold | Copper | Other3 | Total | |||||||||||||||||||||||||||||
| For the three months ended September 30 |
2026 | 2025 | 2026 | 2025 | 2026 | 2025 | 2026 | 2025 | ||||||||||||||||||||||||
| Site operating costs1,2 |
$1,318 | $1,157 | $163 | $98 | $— | $— | $1,481 | $1,255 | ||||||||||||||||||||||||
| Depreciation1 |
493 | 384 | 65 | 69 | 9 | 7 | 567 | 460 | ||||||||||||||||||||||||
| Royalty expense |
203 | 113 | 37 | 25 | — | — | 240 | 138 | ||||||||||||||||||||||||
| Mining and production taxes |
65 | 29 | — | — | — | — | 65 | 29 | ||||||||||||||||||||||||
| Community relations |
6 | 7 | 2 | 1 | — | — | 8 | 8 | ||||||||||||||||||||||||
| $2,085 | $1,690 | $267 | $193 | $9 | $7 | $2,361 | $1,890 | |||||||||||||||||||||||||
| Gold | Copper | Other3 | Total | |||||||||||||||||||||||||||||
| For the nine months ended September 30 |
2026 | 2025 | 2026 | 2025 | 2026 | 2025 | 2026 | 2025 | ||||||||||||||||||||||||
| Site operating costs1,2 |
$3,854 | $3,433 | $471 | $323 | $— | $— | $4,325 | $3,756 | ||||||||||||||||||||||||
| Depreciation1 |
1,420 | 1,085 | 179 | 197 | 23 | 25 | 1,622 | 1,307 | ||||||||||||||||||||||||
| Royalty expense |
592 | 311 | 110 | 71 | — | — | 702 | 382 | ||||||||||||||||||||||||
| Mining and production taxes |
179 | 77 | — | — | — | — | 179 | 77 | ||||||||||||||||||||||||
| Community relations |
23 | 28 | 4 | 3 | — | — | 27 | 31 | ||||||||||||||||||||||||
| $6,068 | $4,934 | $764 | $594 | $23 | $25 | $6,855 | $5,553 | |||||||||||||||||||||||||
| 1 | Site operating costs and depreciation include charges to reduce the cost of inventory to net realizable value as follows: $nil for Q3 2026 (Q3 2025: $nil) and $64 million for YTD 2026 (YTD 2025: $1 million). |
| 2 | Site operating costs includes the costs of extracting by-products. |
| 3 | Other includes corporate amortization. |
8 ∎ Earnings Per Share
| For the three months ended September 30 | For the nine months ended September 30 | |||||||||||||||||||||||||||||||
| 2026 | 2025 | 2026 | 2025 | |||||||||||||||||||||||||||||
| Basic | Diluted | Basic | Diluted | Basic | Diluted | Basic | Diluted | |||||||||||||||||||||||||
| Net income |
$2,038 | $2,038 | $1,904 | $1,904 | $6,411 | $6,411 | $3,941 | $3,941 | ||||||||||||||||||||||||
| Net income attributable to non-controlling interests |
(721 | ) | (721 | ) | (602 | ) | (602 | ) | (2,275 | ) | (2,275 | ) | (1,354 | ) | (1,354 | ) | ||||||||||||||||
| Net income attributable to equity holders of Barrick Mining Corporation |
$1,317 | $1,317 | $1,302 | $1,302 | $4,136 | $4,136 | $2,587 | $2,587 | ||||||||||||||||||||||||
| Weighted average shares outstanding |
1,641 | 1,641 | 1,703 | 1,703 | 1,661 | 1,661 | 1,715 | 1,715 | ||||||||||||||||||||||||
| Basic and diluted earnings per share attributable to the equity holders of Barrick Mining Corporation |
$0.80 | $0.80 | $0.76 | $0.76 | $2.49 | $2.49 | $1.51 | $1.51 | ||||||||||||||||||||||||
| BARRICK THIRD QUARTER 2026 | 69 | NOTES TO FINANCIAL STATEMENTS (UNAUDITED) |
| OVERVIEW | OPERATING PERFORMANCE |
FUTURE GROWTH |
REVIEW OF FINANCIAL RESULTS |
OTHER INFORMATION & NON-GAAP RECONCILIATIONS |
FINANCIAL STATEMENTS | |||||
9 ∎ Other Expense (Income)
| For the three months ended September 30 |
For the nine months ended September 30 |
|||||||||||||||
| 2026 | 2025 | 2026 | 2025 | |||||||||||||
| Other expense: |
||||||||||||||||
| Loulo-Gounkoto1 |
$106 | ($250 | ) | $316 | $785 | |||||||||||
| Loulo-Gounkoto reduced operations costs2 |
15 | 15 | 69 | 140 | ||||||||||||
| Loss on Kibali JV |
||||||||||||||||
| Receivable |
— | — | 46 | — | ||||||||||||
| Write-offs3 |
25 | 6 | 27 | 9 | ||||||||||||
| Litigation legal expenses |
14 | 9 | 22 | 29 | ||||||||||||
| Bank charges |
2 | 2 | 5 | 5 | ||||||||||||
| Severance costs |
3 | 29 | 4 | 29 | ||||||||||||
| Litigation settlement accruals |
— | — | — | 91 | ||||||||||||
| Loss on non-hedge derivatives |
— | — | — | 1 | ||||||||||||
| Loss (gain) on warrant investments at FVPL |
— | — | — | (1 | ) | |||||||||||
| Other |
8 | 7 | 12 | 21 | ||||||||||||
| Total other expense |
$173 | ($182 | ) | $501 | $1,109 | |||||||||||
| Other income: |
||||||||||||||||
| Gain on sale of non-current assets |
($102 | ) | $— | ($111 | ) | ($745 | ) | |||||||||
| Remeasurement of contingent consideration |
9 | — | (87 | ) | — | |||||||||||
| Interest income on other assets |
(9 | ) | (11 | ) | (27 | ) | (34 | ) | ||||||||
| Other |
(5 | ) | — | (5 | ) | — | ||||||||||
| Total other income |
($107 | ) | ($11 | ) | ($230 | ) | ($779 | ) | ||||||||
| Total other expense (income) |
$66 | ($193 | ) | $271 | $330 | |||||||||||
| 1 | 2026 expenses relate to additional royalties, penalties and interest paid to the Government of Mali due to the retrospective application of the 2023 Mining Code to 2024 and 2025, while 2025 reflects the net loss recognized due to the change of control in Q2 2025, partially offset by the value of the retained investment in Loulo-Gounkoto. Refer to note 4 for further details. |
| 2 | 2026 expenses relate to remobilization costs. Refer to note 4 for further details. |
| 3 | 2025 figures have been changed to present write-offs separately from other. |
10 ∎ Income Tax Expense
| For the three months ended September 30 |
For the nine months ended September 30 |
|||||||||||||||
| 2026 | 2025 | 2026 | 2025 | |||||||||||||
| Current |
$602 | $521 | $1,668 | $1,273 | ||||||||||||
| Deferred |
(1 | ) | (44 | ) | 412 | (416 | ) | |||||||||
| Total |
$601 | $477 | $2,080 | $857 | ||||||||||||
Income tax expense was $2,080 million for YTD 2026 (YTD 2025: $857 million). The unadjusted effective income tax rate for YTD 2026 was 24% of income before income taxes.
The underlying effective income tax rate on ordinary income for YTD 2026 was 24% after adjusting for the impact of foreign currency translation losses on current and deferred tax balances, changes in rehabilitation provisions relating to non-operating mines, non-deductible foreign exchange losses, the remeasurement of the Hemlo contingent consideration; the impact of Loulo-Gounkoto, gains and losses on the sale of assets, and other non-recurring tax and non-tax adjustments.
Currency Translation
Current and deferred tax balances are subject to remeasurement for changes in foreign currency exchange rates each period. This is required in countries where tax is paid in local currency and the subsidiary has a different functional currency (typically US dollars). The most significant balances relate to Argentine, Malian and Zambian tax balances.
In YTD 2026, a tax expense of $60 million (YTD 2025: $31 million tax recovery) arose primarily from net translation losses on current tax balances due to the strengthening of the Zambian Kwacha as well as translation losses on deferred tax balances due to the weakening of the West African CFA and the Argentine peso against the US dollar. These net translation losses are included within income tax expense.
Withholding Taxes
For YTD 2026, we have recorded $145 million (YTD 2025: $116 million related to Argentina, Saudi Arabia, Tanzania, and the United States) of dividend withholding taxes related to the distributed earnings of our subsidiaries in Argentina and Tanzania, and undistributed earnings of our subsidiaries in Mali, Saudi Arabia and the United States.
United States Tax Reform
Under the Inflation Reduction Act signed in August 2022, the United States implemented a 15% corporate alternative minimum tax (“CAMT”) on applicable financial statement income, effective for tax years beginning after December 31, 2022, with CAMT credit carryforwards having an indefinite life. Barrick is subject to CAMT as it meets the requisite income thresholds for a foreign-parented multinational group.
Since its introduction, we have recognized a deferred tax asset (DTA) from the CAMT credit carryforwards, anticipating recovery against future US Federal Income Tax liabilities. In Q1 2026, the IRS outlined additional interim guidance on the CAMT to allow several new adjustments to adjusted financial statement income (AFSI) and modify the scope of certain AFSI adjustments in prior interim guidance. Given potential future developments, the timing and amount of such CAMT recovery may be subject to change pending issuance of final regulations.
Organization for Economic Co-operation and Development (“OECD”) Pillar Two model rules
These rules apply to multi-national enterprises with annual consolidated revenues of at least 750 million in at least two of the prior four fiscal years immediately preceding the relevant fiscal year, which is reflective of our status.
Canada enacted Pillar Two legislation through the Global Minimum Tax Act (“GMTA”), effective for fiscal years beginning on or after December 31, 2023. Certain jurisdictions in which the Group operates have also enacted, or are in the process of enacting, legislation implementing the Pillar Two framework. In accordance with the GMTA, the Group filed its first GloBE Information Return and the related Canadian tax returns for the 2024 fiscal year on June 30, 2026.
Consistent with the amendments to IAS 12 Income Taxes issued by the IASB in May 2023, the Group has applied the mandatory temporary exception from the recognition and disclosure of deferred tax assets and liabilities arising from Pillar Two income taxes. Accordingly, no deferred tax assets or liabilities have been recognized or disclosed in respect of Pillar Two legislation.
Based on the Group’s assessment of the OECD Transitional Safe Harbor rules, no material Pillar Two
| BARRICK THIRD QUARTER 2026 | 70 | NOTES TO FINANCIAL STATEMENTS (UNAUDITED) |
| OVERVIEW | OPERATING PERFORMANCE |
FUTURE GROWTH |
REVIEW OF FINANCIAL RESULTS |
OTHER INFORMATION & NON-GAAP RECONCILIATIONS |
FINANCIAL STATEMENTS | |||||
current tax expense or liability was identified for Q3 2026. As the law is evolving, both in Canada and elsewhere, we will continue to monitor the impact of this legislation.
11 ∎ Cash Flow - Other Items
| Operating Cash Flows – Other Items |
For the three months ended September 30 |
For the nine months ended September 30 |
||||||||||||||
| 2026 | 2025 | 2026 | 2025 | |||||||||||||
| Adjustments for non-cash income statement items: |
||||||||||||||||
| Loss on Kibali JV receivable |
$— | $— | $46 | $— | ||||||||||||
| Share-based compensation expense |
53 | 98 | 115 | 167 | ||||||||||||
| Inventory impairment charges |
— | — | 33 | 1 | ||||||||||||
| Non-cash revenue recognized on Pueblo Viejo gold and silver streaming agreement |
(10 | ) | (10 | ) | (27 | ) | (25 | ) | ||||||||
| Change in estimate of rehabilitation costs at closed mines |
(16 | ) | (3 | ) | (31 | ) | (10 | ) | ||||||||
| Remeasurement of contingent consideration |
9 | — | (87 | ) | — | |||||||||||
| Litigation settlement accruals |
— | — | — | 91 | ||||||||||||
| Loss on non-hedge derivatives |
— | — | — | 1 | ||||||||||||
| Gain on warrant investments at FVPL |
— | — | — | (1 | ) | |||||||||||
| Change in other assets and liabilities |
(50 | ) | (60 | ) | (209 | ) | (168 | ) | ||||||||
| Settlement of share-based compensation |
(16 | ) | (9 | ) | (170 | ) | (62 | ) | ||||||||
| Settlement of rehabilitation obligations |
(39 | ) | (40 | ) | (109 | ) | (130 | ) | ||||||||
| Other operating activities |
($69 | ) | ($24 | ) | ($439 | ) | ($136 | ) | ||||||||
| Cash flow arising from changes in: |
||||||||||||||||
| Accounts receivable |
$29 | $316 | $10 | $112 | ||||||||||||
| Inventory |
(54 | ) | (68 | ) | (164 | ) | (133 | ) | ||||||||
| Value added taxes receivable1 |
(63 | ) | (37 | ) | (213 | ) | (133 | ) | ||||||||
| Other current assets |
(12 | ) | (1 | ) | (85 | ) | (18 | ) | ||||||||
| Accounts payable |
22 | (53 | ) | (114 | ) | (13 | ) | |||||||||
| Other current liabilities |
(22 | ) | 27 | (215 | ) | 135 | ||||||||||
| Change in working capital |
($100 | ) | $184 | ($781 | ) | ($50 | ) | |||||||||
| 1 | Excludes $61 million (Q3 2025: $53 million) for Q3 2026 and $135 million (YTD 2025: $128 million) for YTD 2026 of VAT receivables that were settled against offsetting of income taxes payable and $23 million (Q3 2025: $6 million) for Q3 2026 and $39 million (YTD 2025: $54 million) for YTD 2026 of VAT receivables that were settled against offsetting of other duties and liabilities. |
12 ∎ Equity Accounting Method Investment Continuity
| Kibali | Jabal Sayid | Zaldívar | Porgera | Other | Total | |||||||||||||||||||
| At January 1, 2025 |
$2,015 | $401 | $875 | $780 | $41 | $4,112 | ||||||||||||||||||
| Equity pick-up (loss) from equity investees |
203 | 139 | (26 | ) | 121 | — | 437 | |||||||||||||||||
| Funds invested |
— | — | — | — | 1 | 1 | ||||||||||||||||||
| Dividends received from equity investees |
(67 | ) | (130 | ) | — | — | (2 | ) | (199 | ) | ||||||||||||||
| Equity earnings adjustment |
— | — | — | 7 | — | 7 | ||||||||||||||||||
| Shareholder loan repayment |
— | — | — | (138 | ) | (4 | ) | (142 | ) | |||||||||||||||
| At December 31, 2025 |
$2,151 | $410 | $849 | $770 | $36 | $4,216 | ||||||||||||||||||
| Equity pick-up (loss) from equity investees |
399 | 143 | 31 | 104 | (2 | ) | 675 | |||||||||||||||||
| Funds invested |
— | — | — | — | 2 | 2 | ||||||||||||||||||
| Dividends received from equity investees |
(250 | ) | (127 | ) | — | — | — | (377 | ) | |||||||||||||||
| Shareholder loan repayment |
— | — | — | (170 | ) | (21 | ) | (191 | ) | |||||||||||||||
| At September 30, 2026 |
$2,300 | $426 | $880 | $704 | $15 | $4,325 | ||||||||||||||||||
| BARRICK THIRD QUARTER 2026 | 71 | NOTES TO FINANCIAL STATEMENTS (UNAUDITED) |
| OVERVIEW | OPERATING PERFORMANCE |
FUTURE GROWTH |
REVIEW OF FINANCIAL RESULTS |
OTHER INFORMATION & NON-GAAP RECONCILIATIONS |
FINANCIAL STATEMENTS | |||||
13 ∎ Financial Instruments
Financial instruments include cash; evidence of ownership in an entity; or a contract that imposes an obligation on one party and conveys a right to a second party to deliver/ receive cash or another financial instrument.
Gold Contracts
In Q3 2025, we entered into 25,000 ounces of zero cost gold collars that mature every month between September 2025 and August 2028 for a total of 900,000 ounces. These contracts contain purchased put and sold call options with strike prices of $3,100/oz and $4,310/oz, respectively. These contracts are designated as cash flow hedges, with the effective portion of the hedge recognized in other comprehensive income and the ineffective portion recognized as loss (gain) on non-hedge derivatives. The realized loss related to these positions was $3 million (Q3 2025: $nil) for Q3 2026 and $63 million (YTD 2025: $nil) for YTD 2026, and was recorded in revenue. As at September 30, 2026, the fair value of the remaining derivatives is a loss of $190 million (December 31, 2025: $386 million), with $63 million recorded as other current liabilities and $127 million recorded as other non-current liabilities (December 31, 2025: $89 million and $297 million, respectively). As at September 30, 2026, 575,000 ounces of gold collars remain outstanding.
14 ∎ Fair Value Measurements
a) Assets and Liabilities Measured at Fair Value on a Recurring Basis
| As at September 30, 2026 |
Quoted prices in
(Level 1) |
Significant
(Level 2) |
Significant
(Level 3) |
Aggregate
|
||||||||||||
| Other investments1 |
$76 | $— | $— | $76 | ||||||||||||
| Derivatives2 |
— | (190 | ) | — | (190 | ) | ||||||||||
| Receivables from provisional copper and gold sales |
— | 179 | — | 179 | ||||||||||||
| Receivable from NOVAGOLD |
— | — | 179 | 179 | ||||||||||||
| Contingent consideration3 |
— | — | 340 | 340 | ||||||||||||
| $76 | ($11 | ) | $519 | $584 | ||||||||||||
| 1 | Includes equity investments in other mining companies. |
| 2 | Refer to note 13 for further details. |
| 3 | Primarily includes contingent consideration relating to the Tongon mine, Norte Abierto project, Hemlo mine and Alturas project. |
b) Fair Values of Financial Assets and Liabilities
| As at September 30, 2026 |
As at December 31, 2025 |
|||||||||||||||
| Carrying amount |
Estimated fair value |
Carrying amount |
Estimated fair value |
|||||||||||||
| Financial assets |
||||||||||||||||
| Other assets1 |
$1,019 | $1,019 | $940 | $940 | ||||||||||||
| Other investments2 |
76 | 76 | 131 | 131 | ||||||||||||
| Contingent consideration3 |
340 | 340 | 240 | 240 | ||||||||||||
| $1,435 | $1,435 | $1,311 | $1,311 | |||||||||||||
| Financial liabilities |
||||||||||||||||
| Debt4 |
$4,680 | $4,541 | $4,703 | $4,970 | ||||||||||||
| Derivative liabilities5 |
190 | 190 | 386 | 386 | ||||||||||||
| Other liabilities |
766 | 766 | 803 | 803 | ||||||||||||
| $5,636 | $5,497 | $5,892 | $6,159 | |||||||||||||
| 1 | Includes restricted cash and amounts due from our partners. |
| 2 | Includes equity investments in other mining companies. Recorded at fair value. Quoted market prices are used to determine fair value. |
| 3 | Primarily includes contingent consideration relating to the Tongon mine, Norte Abierto project, Hemlo mine and Alturas project. |
| 4 | Debt is generally recorded at amortized cost. The fair value of debt is primarily determined using quoted market prices. Balance includes both current and long-term portions of debt. |
| 5 | Refer to note 13 for further details. |
The Company’s valuation techniques for our remaining financial assets and liabilities were presented in note 26 of the 2025 Annual Financial Statements and have been consistently applied in these interim financial statements.
15 ∎ Capital Stock
a) Authorized Capital Stock
Our authorized capital stock is composed of an unlimited number of common shares (issued 1,628,632,690 common shares as at September 30, 2026). Our common shares have no par value.
b) Dividends
The Company’s practice has been to declare dividends after a quarter as part of the announcement of the results for the quarter. Dividends declared are paid in the same quarter.
The Company’s dividend reinvestment plan resulted in 356,136 common shares being issued to shareholders for YTD 2026.
At the November 6, 2026 meeting, the Board of Directors approved a dividend of $0.175 per share (approximately $300 million) to be paid on December 15, 2026 to shareholders of record at the close of business on November 30, 2026.
c) Share Buyback Program
At the May 8, 2026 meeting, the Board of Directors authorized a new share buyback program for the purchase of up to $3 billion of Barrick’s outstanding common shares over the next 12 months. During YTD 2026, Barrick purchased 47.1 million common shares for a total cash amount of $1,970 million under this program and accrued $39 million in related taxes.
The actual number of common shares that may be purchased, and the timing of any such purchases, will be determined by Barrick based on a number of factors,
| BARRICK THIRD QUARTER 2026 | 72 | NOTES TO FINANCIAL STATEMENTS (UNAUDITED) |
| OVERVIEW | OPERATING PERFORMANCE |
FUTURE GROWTH |
REVIEW OF FINANCIAL RESULTS |
OTHER INFORMATION & NON-GAAP RECONCILIATIONS |
FINANCIAL STATEMENTS | |||||
including the Company’s financial performance, the availability of cash flows, and the consideration of other uses of cash, including capital investment opportunities, returns to shareholders, and debt reduction.
The share buyback program does not obligate the Company to acquire any particular number of common shares, and the share buyback program may be suspended or discontinued at any time at the Company’s discretion.
16 ∎ Non-controlling Interests Continuity
| Nevada Gold Mines |
Pueblo Viejo |
Tanzania Mines1 |
Loulo- Gounkoto |
Tongon2 | Reko Diq |
Other | Total | |||||||||||||||||||||||||
| NCI in subsidiary at September 30, 2026 |
38.5% | 40% | 16% | 20% | — | 50% | Various | |||||||||||||||||||||||||
| At January 1, 2025 |
$6,379 | $1,160 | $375 | $695 | $16 | $421 | ($80 | ) | $8,966 | |||||||||||||||||||||||
| Share of income (loss) |
1,851 | 272 | 95 | (57 | ) | 10 | (10 | ) | — | 2,161 | ||||||||||||||||||||||
| Cash contributed |
— | — | — | — | — | 362 | — | 362 | ||||||||||||||||||||||||
| Loss of control3 |
— | — | — | (686 | ) | — | — | — | (686 | ) | ||||||||||||||||||||||
| Acquisitions (divestitures)3 |
— | — | — | 477 | (19 | ) | — | — | 458 | |||||||||||||||||||||||
| Disbursements |
(1,579 | ) | (168 | ) | (75 | ) | — | (7 | ) | — | — | (1,829 | ) | |||||||||||||||||||
| At December 31, 2025 |
$6,651 | $1,264 | $395 | $429 | $— | $773 | ($80 | ) | $9,432 | |||||||||||||||||||||||
| Share of income (loss) |
1,885 | 306 | 67 | 18 | — | (1 | ) | — | 2,275 | |||||||||||||||||||||||
| Cash contributed |
— | — | — | — | — | 321 | — | 321 | ||||||||||||||||||||||||
| Disbursements |
(1,860 | ) | (299 | ) | (48 | ) | (52 | ) | — | — | — | (2,259 | ) | |||||||||||||||||||
| At September 30, 2026 |
$6,676 | $1,271 | $414 | $395 | $— | $1,093 | ($80 | ) | $9,769 | |||||||||||||||||||||||
| 1 | Tanzania mines consist of the two operating mines, North Mara and Bulyanhulu. |
| 2 | On October 6, 2025, we reached an agreement to sell our interest in the Tongon gold mine and certain of its exploration properties to the Atlantic Group for total consideration of up to $305 million. The transaction closed on December 1, 2025. |
| 3 | Refer to note 4 for further details. Acquisitions (divestitures) have been revised to reflect an update to the provisional purchase price allocation relating to Loulo-Gounkoto. |
17 ∎ Contingencies
Certain conditions may exist as of the date the financial statements are issued that may result in a loss to the Company, but which will only be resolved when one or more future events occur or fail to occur. The impact of any resulting loss from such matters affecting these financial statements and noted below may be material.
Except as noted below, no material changes have occurred with respect to the matters disclosed in note 36 “Contingencies” to the 2025 Annual Financial Statements, and no new contingencies have occurred that are material to the Company since the issuance of the 2025 Annual Financial Statements.
The description set out below should be read in conjunction with note 36 “Contingencies” to the 2025 Annual Financial Statements.
Litigation and Claims Update
Pascua-Lama — Proposed Canadian Securities Class Actions
In the Ontario proceeding, the Ontario Superior Court of Justice issued its decision on the plaintiffs’ motion for class certification on March 4, 2026. The Court certified the plaintiffs’ statutory secondary market and common law misrepresentation claims but declined to certify the plaintiffs’ primary market claims.
In the Quebec proceeding, both parties have delivered expert reports. Trial is scheduled for April 18 to May 15, 2028.
Pascua-Lama — SMA Regulatory Sanctions
On June 23, 2026, the SMA dismissed the appeal filed by the group of local farmers and indigenous communities opposing
the SMA’s November 13, 2024 decision not to assess any additional fines against CMN.
On July 17, 2026, the same group of indigenous communities filed a claim with the Antofagasta Environmental Court, challenging the SMA’s dismissal of their appeal. The SMA filed its response on August 31, 2026 and the decision of the Antofagasta Environmental Court is pending.
Veladero — Operational Incidents and Associated Proceedings
On June 5, 2026, the Federal Court dismissed the previously disclosed Federal Amparo Action. The National Minister did not appeal this decision. The previously disclosed Provincial Amparo Action remains pending.
Writ of Kalikasan
On October 2, 2026, the Department of Environment and Natural Resources delivered the confirmations required under the Marcopper settlement agreement, satisfying the final condition to the settlement. On October 5, 2026, Barrick authorized payment of the first $50 million installment of the $100 million settlement amount to the Provincial Government of Marinduque, with the remainder to be paid over a period of three years. Barrick recorded the total settlement amount as part of Other Expense in Q1 2025.
North Mara — Ontario Litigation
On April 7, 2026, the Court of Appeal for Ontario dismissed the plaintiffs’ appeal, upholding Barrick’s motion to permanently stay both actions on the grounds that Tanzania is a more appropriate forum in which to litigate this matter. On June 8, 2026, the plaintiffs filed an application for leave
| BARRICK THIRD QUARTER 2026 | 73 | NOTES TO FINANCIAL STATEMENTS (UNAUDITED) |
| OVERVIEW | OPERATING PERFORMANCE |
FUTURE GROWTH |
REVIEW OF FINANCIAL RESULTS |
OTHER INFORMATION & NON-GAAP RECONCILIATIONS |
FINANCIAL STATEMENTS | |||||
to appeal to the Supreme Court of Canada. Barrick filed its response on August 11, 2026, opposing the leave application. The plaintiffs delivered their reply on August 21, 2026. The Supreme Court of Canada’s decision on the leave application is pending.
Loulo-Gounkoto Mining Conventions Dispute
Further to the terms of the settlement agreement announced on November 24, 2025, the 10-year renewal of the Somilo Exploitation Permit was granted under the 2023 Mining Code on February 13, 2026. Also further to the settlement agreement, the senior judge at the Pôle National Économique et Financier issued a ruling dated March 25, 2026 dismissing the criminal proceedings previously issued against Somilo, Gounkoto and certain individuals. This matter is now closed.
Pursuant to a tax reconciliation process contemplated by the settlement agreement, a total of $200 million was paid to the Government of Mali in April 2026 in respect of additional royalties, penalties and interest related to the retrospective application of the 2023 Mining Code to Loulo-Gounkoto for 2024 and 2025. Also as part of this tax reconciliation process, on July 1, 2026, the Government of Mali notified Somilo that approximately $48 million in additional penalties was owed in respect of the 2024 and 2025 tax years. This tax reconciliation process is now complete.
18 ∎ Subsequent Events
On August 10, 2026, Barrick entered into an agreement with Newmont to expand the assets in the Nevada Gold Mines Joint Venture by agreeing to vend-in their excluded properties early: Fourmile from Barrick, Mike and Fiberline from Newmont. Newmont will pay Barrick a top-up payment of $1.95 billion in cash. The agreement resolves all outstanding disputes related to NGM and includes revisions to the NGM joint venture agreement. The members’ interests in NGM will remain unchanged at 61.5% for Barrick and 38.5% for Newmont. Barrick will continue to account for Fourmile at historical cost and consolidate it with a non-controlling interest. Mike and Fiberline will be accounted for as an asset acquisition and recorded at fair value. As at September 30, 2026, the contributions of the Fourmile, Mike and Fiberline projects had not closed; accordingly, the transaction represents a non-adjusting subsequent event, and no related amounts have been recognized in the financial statements. We expect the contribution to occur in Q4 2026.
| BARRICK THIRD QUARTER 2026 | 74 | NOTES TO FINANCIAL STATEMENTS (UNAUDITED) |