Shareholder Report
|
12 Months Ended |
|
Aug. 31, 2026
USD ($)
|
|---|
| Shareholder Report [Line Items] |
|
| Document Type |
N-CSR
|
| Amendment Flag |
false
|
| Registrant Name |
Goldman Sachs ETF Trust II
|
| Entity Central Index Key |
0001882879
|
| Entity Investment Company Type |
N-1A
|
| Document Period End Date |
Aug. 31, 2026
|
| Shareholder Report Annual or Semi-Annual |
Annual Shareholder Report
|
| C000239677 |
|
| Shareholder Report [Line Items] |
|
| Fund Name |
Goldman Sachs MarketBeta<sup style="inset: 1.5px 0px 4px; box-sizing: border-box; color: rgb(33, 120, 196); display: inline; flex-wrap: nowrap; font-size: 14px; font-weight: 700; grid-area: auto; line-height: 0px; margin: 0px; overflow: visible; position: relative; text-align: left; text-align-last: auto; white-space-collapse: preserve-breaks;">®</sup> Total International Equity ETF
|
| Trading Symbol |
GXUS
|
| Security Exchange Name |
NYSEArca
|
| Annual or Semi-Annual Statement [Text Block] |
This annual shareholder report contains important information about Goldman Sachs MarketBeta® Total International Equity ETF (the “Fund”) for the period of September 1, 2025 to August 31, 2026 (the “Period”).
|
| Additional Information [Text Block] |
You can find additional information about the Fund at am.gs.com or dfinview.com/GoldmanSachs. You can also request this information by contacting us at 1-800-621-2550.
|
| Additional Information Phone Number |
1-800-621-2550
|
| Expenses [Text Block] |
What were the Fund costs for the Period?Based on a hypothetical $10,000 investment.
Table Summary
Fund |
Costs of a $10,000 investment |
Costs paid as a percentage of a $10,000 investment |
GXUS |
$19 |
0.17% | |
| Expenses Paid, Amount |
$ 19
|
| Expense Ratio, Percent |
0.17%
|
| Factors Affecting Performance [Text Block] |
How did the Fund perform and what affected its performance?The broad international equity market posted double-digit positive returns for the Period but experienced varied performance, influenced by diverse economic conditions, central bank policies and political and geopolitical developments. Still, strong performance overall was supported by a broad-based economic recovery in developed markets, a softening U.S. dollar that provided a material tailwind to U.S. dollar-denominated returns, an artificial intelligence ("AI") investment theme that moved beyond pure-play technology into the wider industrial value chain, and resilient corporate earnings. Top Contributors to Performance: Solactive GBS Global Markets ex United States Large & Mid Cap Index (Index) constituents in the information technology, financials and industrials sectors contributed most positively to the Index’s results during the Period. Taiwan, South Korea and Japan were the top country contributors to the Index’s results. Positions in Taiwan-based semiconductor company Taiwan Semiconductor Manufacturing and South Korea-based technology companies Samsung Electronics and SK Hynix contributed most positively to the Index’s returns during the Period (4.62%, 2.53% and 1.75% of Fund net assets as of August 31, 2026, respectively).
Top Detractors from Performance: Index constituents in the communication services, consumer discretionary and real estate sectors detracted from the Index’s results during the Period. China, India and Indonesia detracted most from the Index’s results from a country perspective. Positions in China-based technology conglomerate Tencent Holdings, China-based consumer electronics and smart manufacturing company Xiaomi and Germany-based enterprise application software and business AI company SAP contributed least to the Index’s results during the Period (0.91%, 0.15% and 0.57% of Fund net assets as of August 31, 2026, respectively).
|
| Performance Past Does Not Indicate Future [Text] |
Performance data quoted above represents past performance. Past performance does not guarantee future results.
|
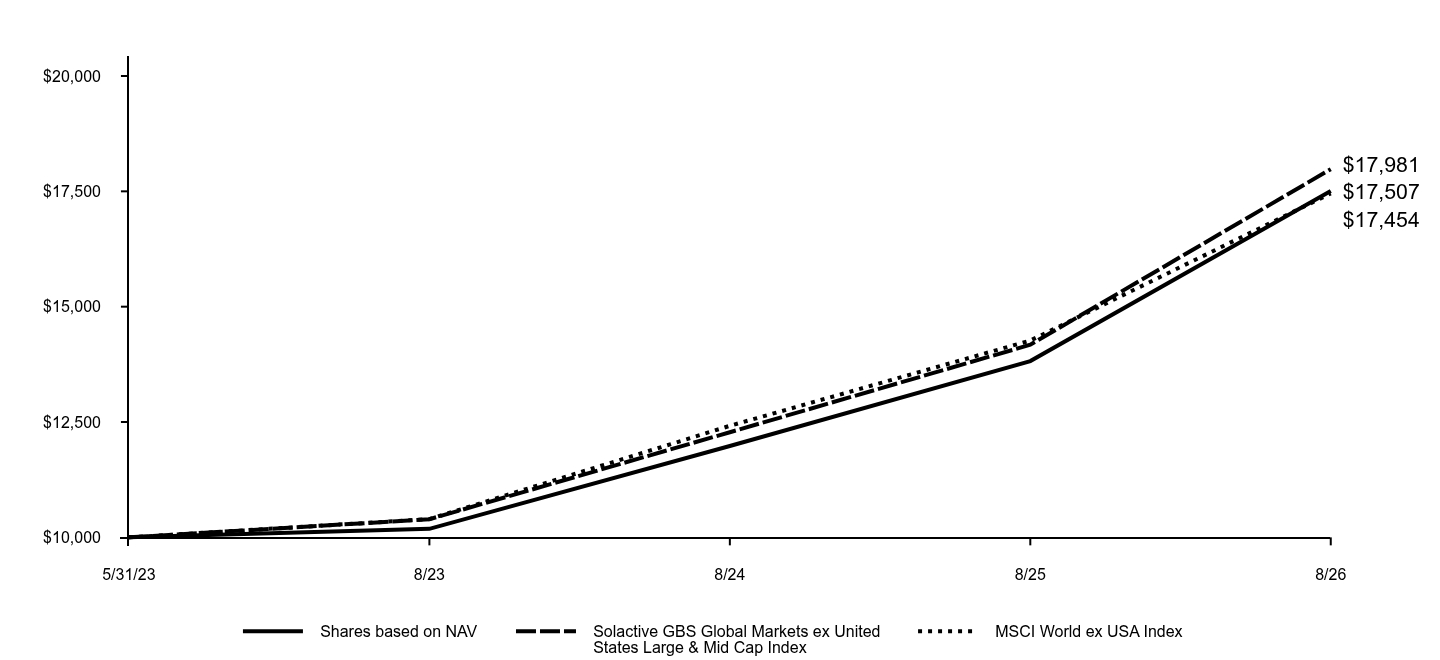
| Line Graph [Table Text Block] |
Table Summary
|
Shares based on NAV |
Solactive GBS Global Markets ex United States Large & Mid Cap Index |
MSCI World ex USA Index |
5/31/23 |
$10,000 |
$10,000 |
$10,000 |
8/23 |
$10,185 |
$10,393 |
$10,396 |
8/24 |
$11,981 |
$12,279 |
$12,418 |
8/25 |
$13,821 |
$14,175 |
$14,266 |
8/26 |
$17,507 |
$17,981 |
$17,454 |
|
| Performance Inception Date |
May 31, 2023
|
| AssetsNet |
$ 647,238,816
|
| Advisory Fees Paid, Amount |
$ 994,646
|
| InvestmentCompanyPortfolioTurnover |
14.00%
|
| Additional Fund Statistics [Text Block] |
Table Summary
Total Net Assets as of Period End |
$647,238,816 |
# of Portfolio Holdings as of Period End |
2,580 |
Portfolio Turnover Rate for the Period |
14% |
Total Net Advisory Fees Paid for the Period |
$994,646 | |
| Holdings [Text Block] |
Table Summary
Financials |
24.5% |
Information Technology |
20.2% |
Industrials |
14.4% |
Consumer Discretionary |
7.9% |
Materials |
6.8% |
Health Care |
6.7% |
Consumer Staples |
5.0% |
Energy |
4.7% |
Communication Services |
4.5% |
Other |
5.0% | |
| Material Fund Change [Text Block] |
|
| Updated Prospectus Phone Number |
1-800-621-2550
|
| Updated Prospectus Web Address |
<span style="box-sizing: border-box; color: rgb(0, 0, 0); display: inline; flex-wrap: nowrap; font-size: 12px; font-weight: 400; grid-area: auto; line-height: 12px; margin: 0px; overflow: visible; text-align: left; text-align-last: auto; white-space-collapse: preserve-breaks;">dfinview.com/GoldmanSachs</span>
|
| C000234252 |
|
| Shareholder Report [Line Items] |
|
| Fund Name |
Goldman Sachs MarketBeta<sup style="inset: 1.5px 0px 4px; box-sizing: border-box; color: rgb(33, 120, 196); display: inline; flex-wrap: nowrap; font-size: 14px; font-weight: 700; grid-area: auto; line-height: 0px; margin: 0px; overflow: visible; position: relative; text-align: left; text-align-last: auto; white-space-collapse: preserve-breaks;">®</sup> U.S. 1000 Equity ETF
|
| Trading Symbol |
GUSA
|
| Security Exchange Name |
NYSEArca
|
| Annual or Semi-Annual Statement [Text Block] |
This annual shareholder report contains important information about Goldman Sachs MarketBeta® U.S. 1000 Equity ETF (the “Fund”) for the period of September 1, 2025 to August 31, 2026 (the “Period”).
|
| Additional Information [Text Block] |
You can find additional information about the Fund at am.gs.com or dfinview.com/GoldmanSachs. You can also request this information by contacting us at 1-800-621-2550.
|
| Additional Information Phone Number |
1-800-621-2550
|
| Expenses [Text Block] |
What were the Fund costs for the Period?Based on a hypothetical $10,000 investment.
Table Summary
Fund |
Costs of a $10,000 investment |
Costs paid as a percentage of a $10,000 investment |
GUSA |
$11 |
0.10% | |
| Expenses Paid, Amount |
$ 11
|
| Expense Ratio, Percent |
0.10%
|
| Factors Affecting Performance [Text Block] |
How did the Fund perform and what affected its performance?The broad U.S. equity market delivered strong gains overall, driven by resilient corporate earnings, solid labor data and expanding artificial intelligence ("AI") infrastructure. Monetary policy also played a crucial role, with the Federal Reserve implementing interest rate cuts in the last months of 2025 and then holding steady, as it weighed inflation that remained above target. Still, U.S. equities faced periodic volatility around AI monetization, returns on investment and debt issuance. Concurrently, geopolitical tensions, including maritime shipping disruptions and trade tariffs, drove commodity and energy market volatility. Corporate fundamentals cushioned pullbacks, with profit margins and earnings rather consistently beating consensus expectations across the information technology, industrials and health care sectors. Top Contributors to Performance: The information technology, health care and industrials sectors contributed most positively to the Solactive GBS United States 1000 Index’s (Index) relative results. Positions in information technology companies Apple, NVIDIA and Micron Technology contributed most positively to the Index’s returns during the Period (6.37%, 7.23% and 1.52% of Fund net assets as of August 31, 2026, respectively).
Top Detractors from Performance: No sectors detracted from the Index’s relative results during the Period. Positions in social media platforms giant Meta Platforms, entertainment services provider Netflix and information technology company Oracle contributed least to the Index’s results during the Period (1.77%, 0.48% and 0.35% of Fund net assets as of August 31, 2026, respectively).
|
| Performance Past Does Not Indicate Future [Text] |
Performance data quoted above represents past performance. Past performance does not guarantee future results.
|
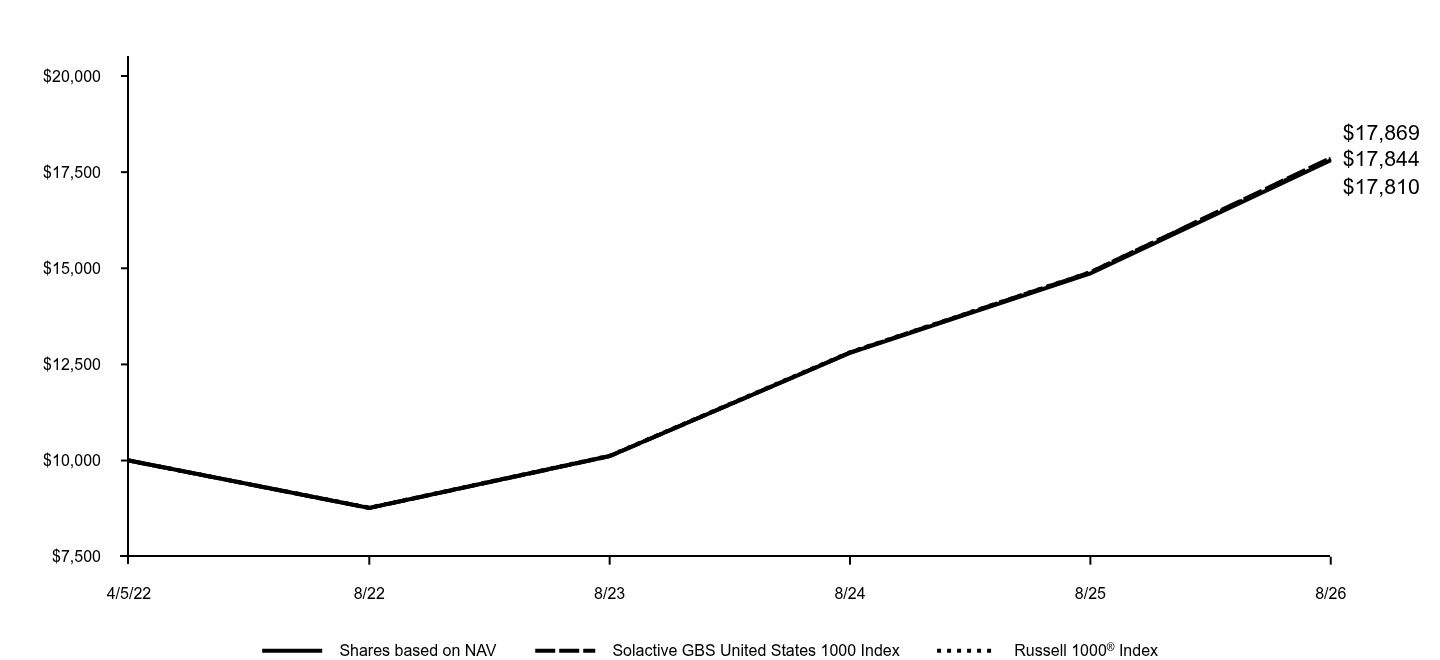
| Line Graph [Table Text Block] |
Table Summary
|
Shares based on NAV |
Solactive GBS United States 1000 Index |
Russell 1000® Index |
4/5/22 |
$10,000 |
$10,000 |
$10,000 |
8/22 |
$8,764 |
$8,765 |
$8,773 |
8/23 |
$10,117 |
$10,113 |
$10,124 |
8/24 |
$12,798 |
$12,809 |
$12,817 |
8/25 |
$14,864 |
$14,895 |
$14,899 |
8/26 |
$17,810 |
$17,869 |
$17,844 |
|
| Performance Inception Date |
Apr. 05, 2022
|
| AssetsNet |
$ 2,397,904,387
|
| Advisory Fees Paid, Amount |
$ 2,184,271
|
| InvestmentCompanyPortfolioTurnover |
3.00%
|
| Additional Fund Statistics [Text Block] |
Table Summary
Total Net Assets as of Period End |
$2,397,904,387 |
# of Portfolio Holdings as of Period End |
1,007 |
Portfolio Turnover Rate for the Period |
3% |
Total Net Advisory Fees Paid for the Period |
$2,184,271 | |
| Holdings [Text Block] |
Table Summary
Information Technology |
36.1% |
Financials |
12.1% |
Health Care |
9.7% |
Communication Services |
9.4% |
Consumer Discretionary |
9.3% |
Industrials |
9.2% |
Consumer Staples |
4.4% |
Energy |
3.6% |
Materials |
2.1% |
Other |
4.1% | |
| Material Fund Change [Text Block] |
|
| Updated Prospectus Phone Number |
1-800-621-2550
|
| Updated Prospectus Web Address |
<span style="box-sizing: border-box; color: rgb(0, 0, 0); display: inline; flex-wrap: nowrap; font-size: 12px; font-weight: 400; grid-area: auto; line-height: 12px; margin: 0px; overflow: visible; text-align: left; text-align-last: auto; white-space-collapse: preserve-breaks;">dfinview.com/GoldmanSachs</span>
|