Shareholder Report
|
12 Months Ended |
|
Aug. 31, 2026
USD ($)
Holding
|
|---|
| Shareholder Report [Line Items] |
|
| Document Type |
N-CSR
|
| Amendment Flag |
false
|
| Registrant Name |
Ultimus Managers Trust
|
| Entity Central Index Key |
0001545440
|
| Entity Investment Company Type |
N-1A
|
| Document Period End Date |
Aug. 31, 2026
|
| Shareholder Report Annual or Semi-Annual |
Annual Shareholder Report
|
| C000145852 |
|
| Shareholder Report [Line Items] |
|
| Class Name |
Institutional Class
|
| Trading Symbol |
BCGDX
|
| Annual or Semi-Annual Statement [Text Block] |
This annual shareholder report contains important information about Blue Current Global Dividend Fund (the "Fund") for the period of September 1, 2025 to August 31, 2026.
|
| Additional Information [Text Block] |
You can find additional information about the Fund at https://bluecurrentfunds.com/resources/. You can also request this information by contacting us at (800) 514-3583.
|
| Additional Information Phone Number |
(800) 514-3583
|
| Additional Information Website |
<span style="font-weight: 700; box-sizing: border-box; color: rgb(0, 0, 0); display: inline; flex-wrap: nowrap; font-size: 12px; grid-area: auto; line-height: 14.4px; margin: 0px; overflow: visible; text-align: left; text-align-last: left; white-space-collapse: preserve-breaks;">https://bluecurrentfunds.com/resources/</span>
|
| Expenses [Text Block] |
What were the Fund’s annualized costs for the last year?(based on a hypothetical $10,000 investment)Table SummaryClass Name | Costs of a $10,000 investment | Costs paid as a percentage of a $10,000 investment |
|---|
Institutional Class | $110 | 0.99% |
|---|
|
| Expenses Paid, Amount |
$ 110
|
| Expense Ratio, Percent |
0.99%
|
| Performance Past Does Not Indicate Future [Text] |
The Fund's past performance is not a good predictor of how the Fund will perform in the future.
|
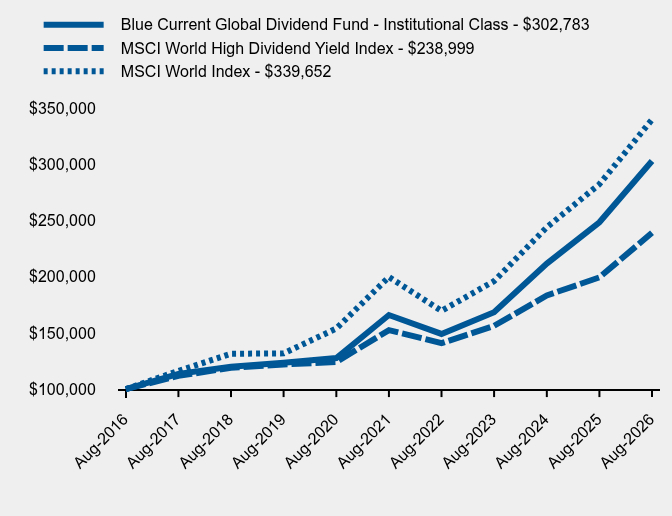
| Line Graph [Table Text Block] |
Table Summary | Blue Current Global Dividend Fund - Institutional Class | MSCI World High Dividend Yield Index | MSCI World Index |
|---|
Aug-2016 | $100,000 | $100,000 | $100,000 |
|---|
Aug-2017 | $113,571 | $111,739 | $116,185 |
|---|
Aug-2018 | $119,908 | $118,927 | $131,411 |
|---|
Aug-2019 | $123,393 | $121,923 | $131,754 |
|---|
Aug-2020 | $127,663 | $124,079 | $153,869 |
|---|
Aug-2021 | $165,848 | $152,427 | $199,668 |
|---|
Aug-2022 | $149,056 | $140,862 | $169,568 |
|---|
Aug-2023 | $168,338 | $156,284 | $196,027 |
|---|
Aug-2024 | $211,624 | $183,294 | $243,926 |
|---|
Aug-2025 | $248,353 | $199,341 | $282,166 |
|---|
Aug-2026 | $302,783 | $238,999 | $339,652 |
|---|
|
| Average Annual Return [Table Text Block] |
Average Annual Total Returns Table Summary | 1 Year | 5 Years | 10 Years |
|---|
Blue Current Global Dividend Fund - Institutional Class | 21.92% | 12.79% | 11.72% |
|---|
MSCI World Index | 20.37% | 11.21% | 13.01% |
|---|
MSCI World High Dividend Yield Index | 19.89% | 9.41% | 9.10% |
|---|
The Fund's past performance is not a good predictor of how the Fund will perform in the future. The graph and table do not reflect the deduction of taxes that a shareholder would pay on fund distributions or redemption of fund shares. Call (800) 514-3583 or visit https://bluecurrentfunds.com/ for updated performance information. |
| No Deduction of Taxes [Text Block] |
The graph and table do not reflect the deduction of taxes that a shareholder would pay on fund distributions or redemption of fund shares.
|
| Updated Performance Information Location [Text Block] |
Call (800) 514-3583 or visit https://bluecurrentfunds.com/ for updated performance information.
|
| AssetsNet |
$ 98,430,653
|
| Holdings Count | Holding |
43
|
| Advisory Fees Paid, Amount |
$ 600,811
|
| InvestmentCompanyPortfolioTurnover |
29.00%
|
| Additional Fund Statistics [Text Block] |
- Net Assets$98,430,653
- Number of Portfolio Holdings43
- Advisory Fee (net of waivers)$600,811
- Portfolio Turnover29%
|
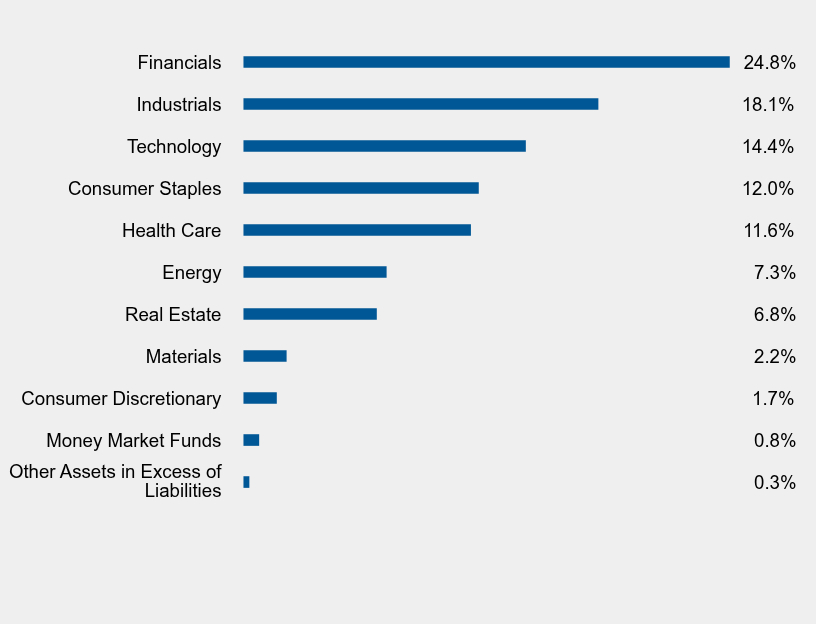
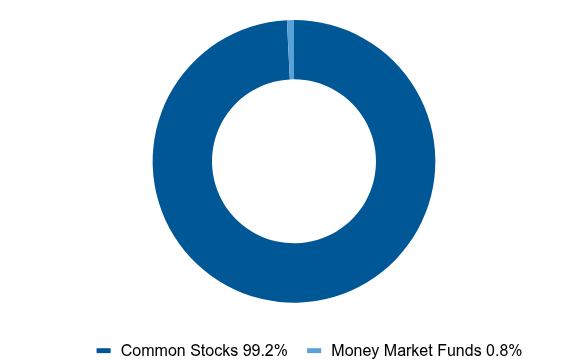
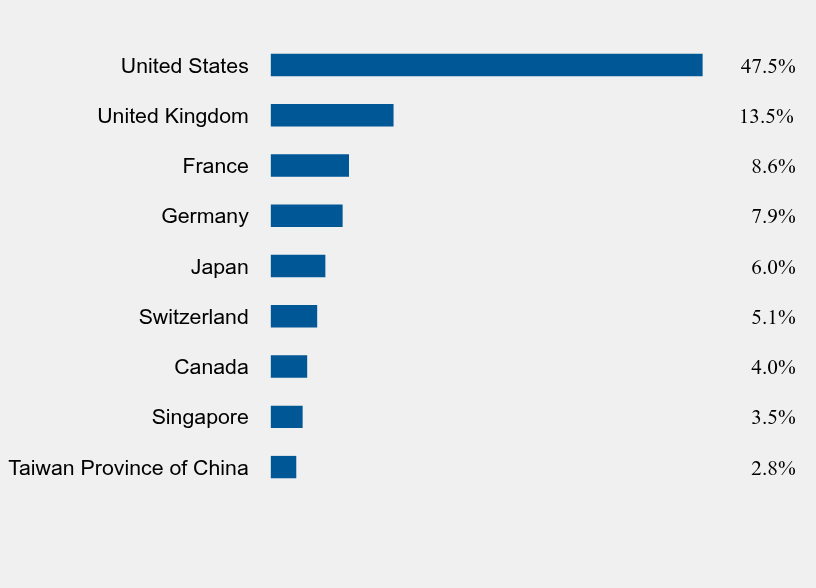
| Holdings [Text Block] |
Sector Weighting (% of net assets)Table SummaryValue | Value |
|---|
Other Assets in Excess of Liabilities | 0.3% | Money Market Funds | 0.8% | Consumer Discretionary | 1.7% | Materials | 2.2% | Real Estate | 6.8% | Energy | 7.3% | Health Care | 11.6% | Consumer Staples | 12.0% | Technology | 14.4% | Industrials | 18.1% | Financials | 24.8% | Asset Weighting (% of total investments)Table SummaryValue | Value |
|---|
Common Stocks | 99.2% | Money Market Funds | 0.8% | Country Weighting (% of net assets)Table SummaryValue | Value |
|---|
Taiwan Province of China | 2.8% | Singapore | 3.5% | Canada | 4.0% | Switzerland | 5.1% | Japan | 6.0% | Germany | 7.9% | France | 8.6% | United Kingdom | 13.5% | United States | 47.5% | Top 10 Holdings (% of net assets)Table SummaryHolding Name | % of Net Assets |
|---|
DBS Group Holdings Ltd. - ADR | 3.5% |
|---|
Sandoz Group AG | 3.5% |
|---|
Broadcom, Inc. | 3.4% |
|---|
Ventas, Inc. | 3.3% |
|---|
Mitsubishi UFJ Financial Group, Inc. - ADR | 3.2% |
|---|
Microsoft Corporation | 3.2% |
|---|
Morgan Stanley | 3.2% |
|---|
JPMorgan Chase & Company | 3.2% |
|---|
Siemens AG | 3.1% |
|---|
Coca-Cola Company (The) | 3.1% |
|---|
|
| Material Fund Change [Text Block] |
No material changes occurred during the year ended August 31, 2026. |
| C000164234 |
|
| Shareholder Report [Line Items] |
|
| Fund Name |
Marshfield Concentrated Opportunity Fund
|
| Trading Symbol |
MRFOX
|
| Annual or Semi-Annual Statement [Text Block] |
This annual shareholder report contains important information about Marshfield Concentrated Opportunity Fund (the "Fund") for the period of September 1, 2025 to August 31, 2026.
|
| Additional Information [Text Block] |
You can find additional information about the Fund at https://marshfieldfunds.com/fund-documents/. You can also request this information by contacting us at (855) 691-5288.
|
| Additional Information Phone Number |
(855) 691-5288
|
| Additional Information Website |
<span style="font-weight: 700; box-sizing: border-box; color: rgb(0, 0, 0); display: inline; flex-wrap: nowrap; font-size: 12px; grid-area: auto; line-height: 18px; margin: 0px; overflow: visible; text-align: left; text-align-last: left; white-space-collapse: preserve-breaks;">https://marshfieldfunds.com/fund-documents/</span>
|
| Expenses [Text Block] |
What were the Fund’s annualized costs for the last year?(based on a hypothetical $10,000 investment) Table SummaryFund Name | Costs of a $10,000 investment | Costs paid as a percentage of a $10,000 investment |
|---|
Marshfield Concentrated Opportunity Fund | $102 | 0.99% |
|---|
|
| Expenses Paid, Amount |
$ 102
|
| Expense Ratio, Percent |
0.99%
|
| Performance Past Does Not Indicate Future [Text] |
The Fund's past performance is not a good predictor of how the Fund will perform in the future.
|
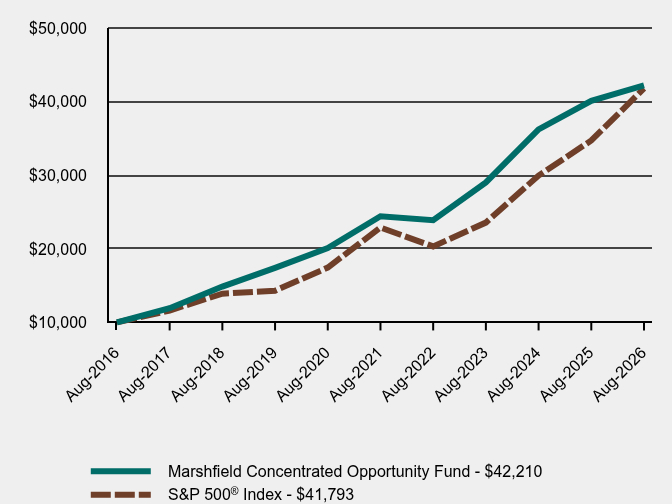
| Line Graph [Table Text Block] |
Table Summary | Marshfield Concentrated Opportunity Fund | S&P 500® Index |
|---|
Aug-2016 | $10,000 | $10,000 |
|---|
Aug-2017 | $11,927 | $11,623 |
|---|
Aug-2018 | $14,874 | $13,909 |
|---|
Aug-2019 | $17,421 | $14,315 |
|---|
Aug-2020 | $20,115 | $17,455 |
|---|
Aug-2021 | $24,428 | $22,895 |
|---|
Aug-2022 | $23,888 | $20,325 |
|---|
Aug-2023 | $29,014 | $23,566 |
|---|
Aug-2024 | $36,222 | $29,960 |
|---|
Aug-2025 | $40,100 | $34,718 |
|---|
Aug-2026 | $42,210 | $41,793 |
|---|
|
| Average Annual Return [Table Text Block] |
Average Annual Total Returns Table Summary | 1 Year | 5 Years | 10 Years |
|---|
Marshfield Concentrated Opportunity Fund | 5.26% | 11.56% | 15.49% |
|---|
S&P 500® Index | 20.38% | 12.79% | 15.37% |
|---|
The Fund's past performance is not a good predictor of how the Fund will perform in the future. The graph and table do not reflect the deduction of taxes that a shareholder would pay on fund distributions or redemption of fund shares. Call (855) 691-5288 or visit https://marshfieldfunds.com/fund-facts/ for updated performance information. |
| No Deduction of Taxes [Text Block] |
The graph and table do not reflect the deduction of taxes that a shareholder would pay on fund distributions or redemption of fund shares.
|
| Updated Performance Information Location [Text Block] |
Call (855) 691-5288 or visit https://marshfieldfunds.com/fund-facts/ for updated performance information.
|
| AssetsNet |
$ 1,279,347,040
|
| Holdings Count | Holding |
19
|
| Advisory Fees Paid, Amount |
$ 11,323,705
|
| InvestmentCompanyPortfolioTurnover |
18.00%
|
| Additional Fund Statistics [Text Block] |
- Net Assets$1,279,347,040
- Number of Portfolio Holdings19
- Advisory Fee (net of waivers)$11,323,705
- Portfolio Turnover18%
|
| Holdings [Text Block] |
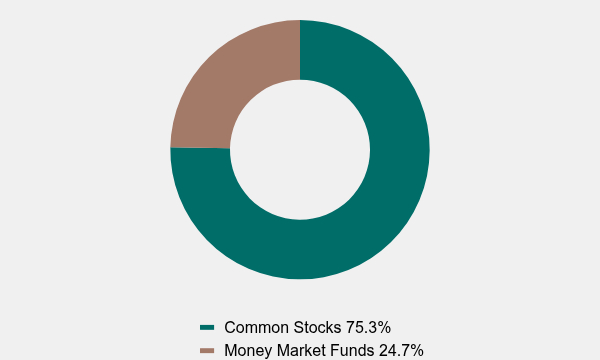
Asset Weighting (% of total investments)Table SummaryValue | Value |
|---|
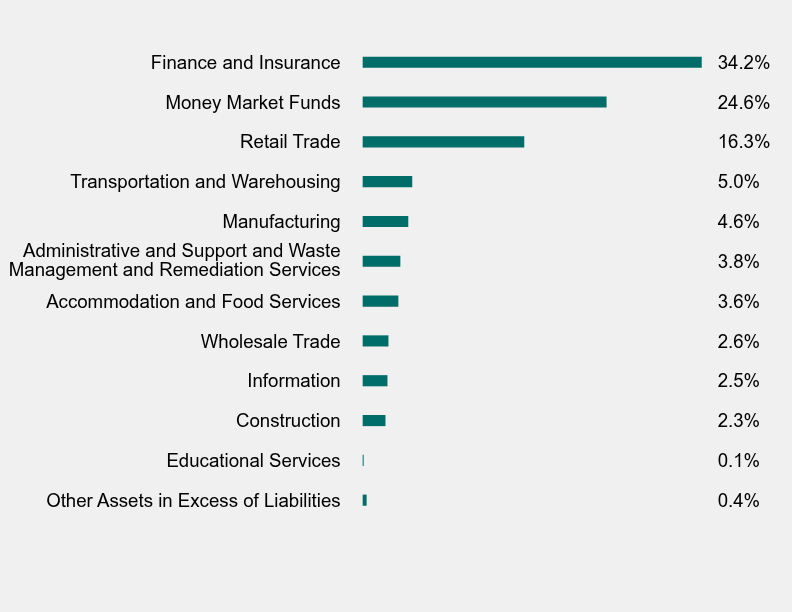
Common Stocks | 75.3% | Money Market Funds | 24.7% | Sector Weighting (% of net assets)Table SummaryValue | Value |
|---|
Other Assets in Excess of Liabilities | 0.4% | Educational Services | 0.1% | Construction | 2.3% | Information | 2.5% | Wholesale Trade | 2.6% | Accommodation and Food Services | 3.6% | Administrative and Support and Waste Management and Remediation Services | 3.8% | Manufacturing | 4.6% | Transportation and Warehousing | 5.0% | Retail Trade | 16.3% | Money Market Funds | 24.6% | Finance and Insurance | 34.2% | Top 10 Holdings (% of net assets)Table SummaryHolding Name | % of Net Assets |
|---|
UnitedHealth Group, Inc. | 9.6% |
|---|
AutoZone, Inc. | 7.8% |
|---|
Progressive Corporation (The) | 7.5% |
|---|
Visa, Inc. - Class A | 6.1% |
|---|
Mastercard, Inc. - Class A | 5.7% |
|---|
Arch Capital Group Ltd. | 5.3% |
|---|
Expeditors International of Washington, Inc. | 5.0% |
|---|
NIKE, Inc. - Class B | 4.6% |
|---|
O'Reilly Automotive, Inc. | 4.6% |
|---|
Moody's Corporation | 3.8% |
|---|
|
| Material Fund Change [Text Block] |
No material changes occurred during the year ended August 31, 2026. |
| C000179800 |
|
| Shareholder Report [Line Items] |
|
| Fund Name |
Meehan Focus Fund
|
| Trading Symbol |
MEFOX
|
| Annual or Semi-Annual Statement [Text Block] |
This annual shareholder report contains important information about Meehan Focus Fund (the "Fund") for the period of September 1, 2025 to August 31, 2026.
|
| Additional Information [Text Block] |
You can find additional information about the Fund at www.meehanmutualfunds.com. You can also request this information by contacting us at (866) 884-5968.
|
| Additional Information Phone Number |
(866) 884-5968
|
| Additional Information Website |
<span style="font-weight: 700; box-sizing: border-box; color: rgb(0, 0, 0); display: inline; flex-wrap: nowrap; font-size: 12px; grid-area: auto; line-height: 14.4px; margin: 0px; overflow: visible; text-align: left; text-align-last: left; white-space-collapse: preserve-breaks;">www.meehanmutualfunds.com</span>
|
| Expenses [Text Block] |
What were the Fund’s annualized costs for the last year?(based on a hypothetical $10,000 investment) Table SummaryFund Name | Costs of a $10,000 investment | Costs paid as a percentage of a $10,000 investment |
|---|
Meehan Focus Fund | $111 | 1.00% |
|---|
|
| Expenses Paid, Amount |
$ 111
|
| Expense Ratio, Percent |
1.00%
|
| Performance Past Does Not Indicate Future [Text] |
The Fund’s past performance is not a good predictor of how the Fund will perform in the future.
|
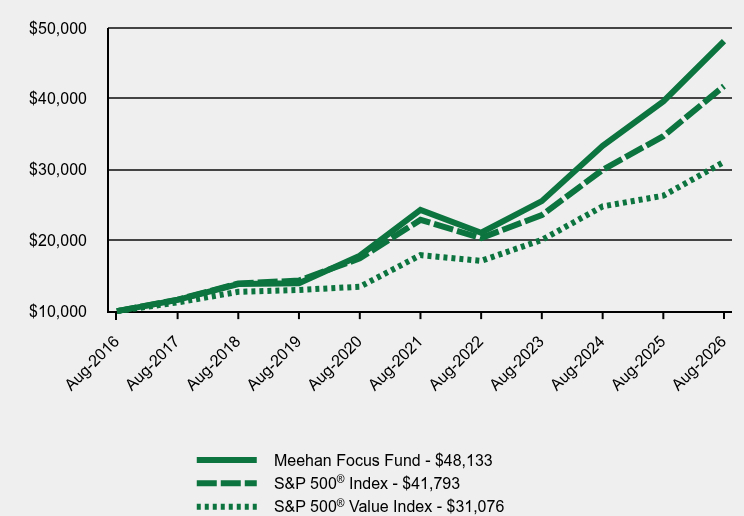
| Line Graph [Table Text Block] |
Table Summary | Meehan Focus Fund | S&P 500® Index | S&P 500® Value Index |
|---|
Aug-2016 | $10,000 | $10,000 | $10,000 |
|---|
Aug-2017 | $11,581 | $11,623 | $11,235 |
|---|
Aug-2018 | $13,821 | $13,909 | $12,723 |
|---|
Aug-2019 | $13,926 | $14,315 | $12,995 |
|---|
Aug-2020 | $17,827 | $17,455 | $13,442 |
|---|
Aug-2021 | $24,290 | $22,895 | $17,911 |
|---|
Aug-2022 | $21,075 | $20,325 | $17,103 |
|---|
Aug-2023 | $25,538 | $23,566 | $20,058 |
|---|
Aug-2024 | $33,366 | $29,960 | $24,797 |
|---|
Aug-2025 | $39,625 | $34,718 | $26,305 |
|---|
Aug-2026 | $48,133 | $41,793 | $31,076 |
|---|
|
| Average Annual Return [Table Text Block] |
Average Annual Total Returns Table Summary | 1 Year | 5 Years | 10 Years |
|---|
Meehan Focus Fund | 21.47% | 14.66% | 17.02% |
|---|
S&P 500® Index | 20.38% | 12.79% | 15.37% |
|---|
S&P 500® Value Index | 18.14% | 11.65% | 12.01% |
|---|
The Fund’s past performance is not a good predictor of how the Fund will perform in the future. The graph and table do not reflect the deduction of taxes that a shareholder would pay on fund distributions or redemption of fund shares. For updated performance call (866) 884-5968. |
| No Deduction of Taxes [Text Block] |
The graph and table do not reflect the deduction of taxes that a shareholder would pay on fund distributions or redemption of fund shares.
|
| AssetsNet |
$ 220,386,910
|
| Holdings Count | Holding |
28
|
| Advisory Fees Paid, Amount |
$ 1,536,399
|
| InvestmentCompanyPortfolioTurnover |
1.00%
|
| Additional Fund Statistics [Text Block] |
- Net Assets$220,386,910
- Number of Portfolio Holdings28
- Advisory Fee (net of waivers & recoupments)$1,536,399
- Portfolio Turnover1%
|
| Holdings [Text Block] |
Asset Weighting (% of total investments)Table SummaryValue | Value |
|---|
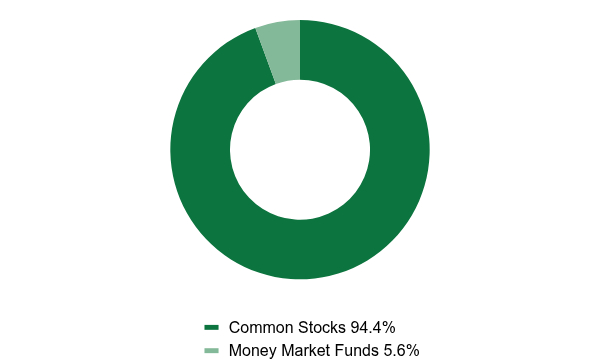
Common Stocks | 94.4% | Money Market Funds | 5.6% | Sector Weighting (% of net assets)Table SummaryValue | Value |
|---|
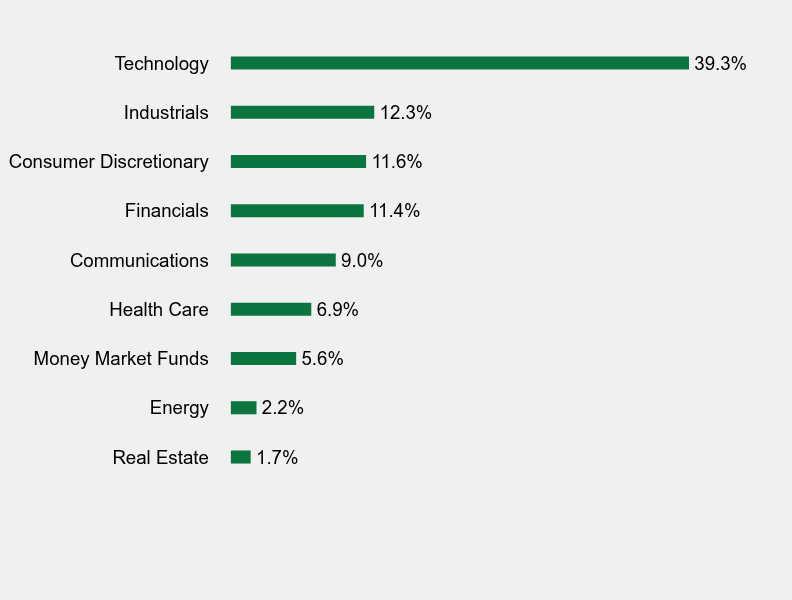
Real Estate | 1.7% | Energy | 2.2% | Money Market Funds | 5.6% | Health Care | 6.9% | Communications | 9.0% | Financials | 11.4% | Consumer Discretionary | 11.6% | Industrials | 12.3% | Technology | 39.3% | Top 10 Holdings (% of net assets)Table SummaryHolding Name | % of Net Assets |
|---|
Broadcom, Inc. | 9.6% |
|---|
Alphabet, Inc. - Classes A & C | 9.0% |
|---|
Apple, Inc. | 8.0% |
|---|
Applied Materials, Inc. | 7.4% |
|---|
United Rentals, Inc. | 7.2% |
|---|
Microsoft Corporation | 6.9% |
|---|
Berkshire Hathaway, Inc. - Class B | 5.7% |
|---|
NVIDIA Corporation | 5.5% |
|---|
Amazon.com, Inc. | 4.9% |
|---|
Lowe's Companies, Inc. | 3.7% |
|---|
|
| Material Fund Change [Text Block] |
No material changes occurred during the year ended August 31, 2026. |