v3.26.3
Shareholder Report
6 Months Ended
Aug. 31, 2026
USD ($)
Holdings
Shareholder Report [Line Items]  
Document Type N-CSRS
Amendment Flag false
Registrant Name Tidal Trust III
Entity Central Index Key 0001722388
Entity Investment Company Type N-1A
Document Period End Date Aug. 31, 2026
Shareholder Report Annual or Semi-Annual Semi-annual shareholder report
RCN Pareto Strategic Allocation ETF  
Shareholder Report [Line Items]  
Fund Name RCN Pareto Strategic Allocation ETF
Class Name RCN Pareto Strategic Allocation ETF
Trading Symbol PRTO
Security Exchange Name NYSEArca
Annual or Semi-Annual Statement [Text Block] This semi-annual shareholder report contains important information about the RCN Pareto Strategic Allocation ETF (the "Fund") for the period March 24, 2026 (the Fund's "Inception") to August 31, 2026.
Shareholder Report Annual or Semi-Annual semi-annual shareholder report
Additional Information [Text Block] You can find additional information about the Fund at www.paretoetf.com. You can also request this information by contacting us at (888) 808-2280 or by writing the Fund at RCN Pareto Strategic Allocation ETF, c/o U.S. Bank Global Fund Services, P.O. Box 701, Milwaukee, Wisconsin 53201‑0701.
Additional Information Phone Number (888) 808-2280
Additional Information Website www.paretoetf.com
Expenses [Text Block]

What were the Fund costs since inception?

(based on a hypothetical $10,000 investment)

Fund Name
Costs of a $10,000 investment
Costs paid as a percentage of a $10,000 investment*
RCN Pareto Strategic Allocation ETF
$32
0.69%
*Costs paid as a percentage of investment are annualized.
Expenses Paid, Amount $ 32
Expense Ratio, Percent 0.69% [1]
Net Assets $ 17,621,000
Holdings Count | Holdings 19
Advisory Fees Paid, Amount $ 49,349
Investment Company, Portfolio Turnover 26.00%
Additional Fund Statistics [Text Block]

Key Fund Statistics

(as of August 31, 2026)

Fund Size (Thousands)
$17,621
Number of Holdings
19
Total Advisory Fee
$49,349
Portfolio Turnover Rate
26%
Holdings [Text Block]

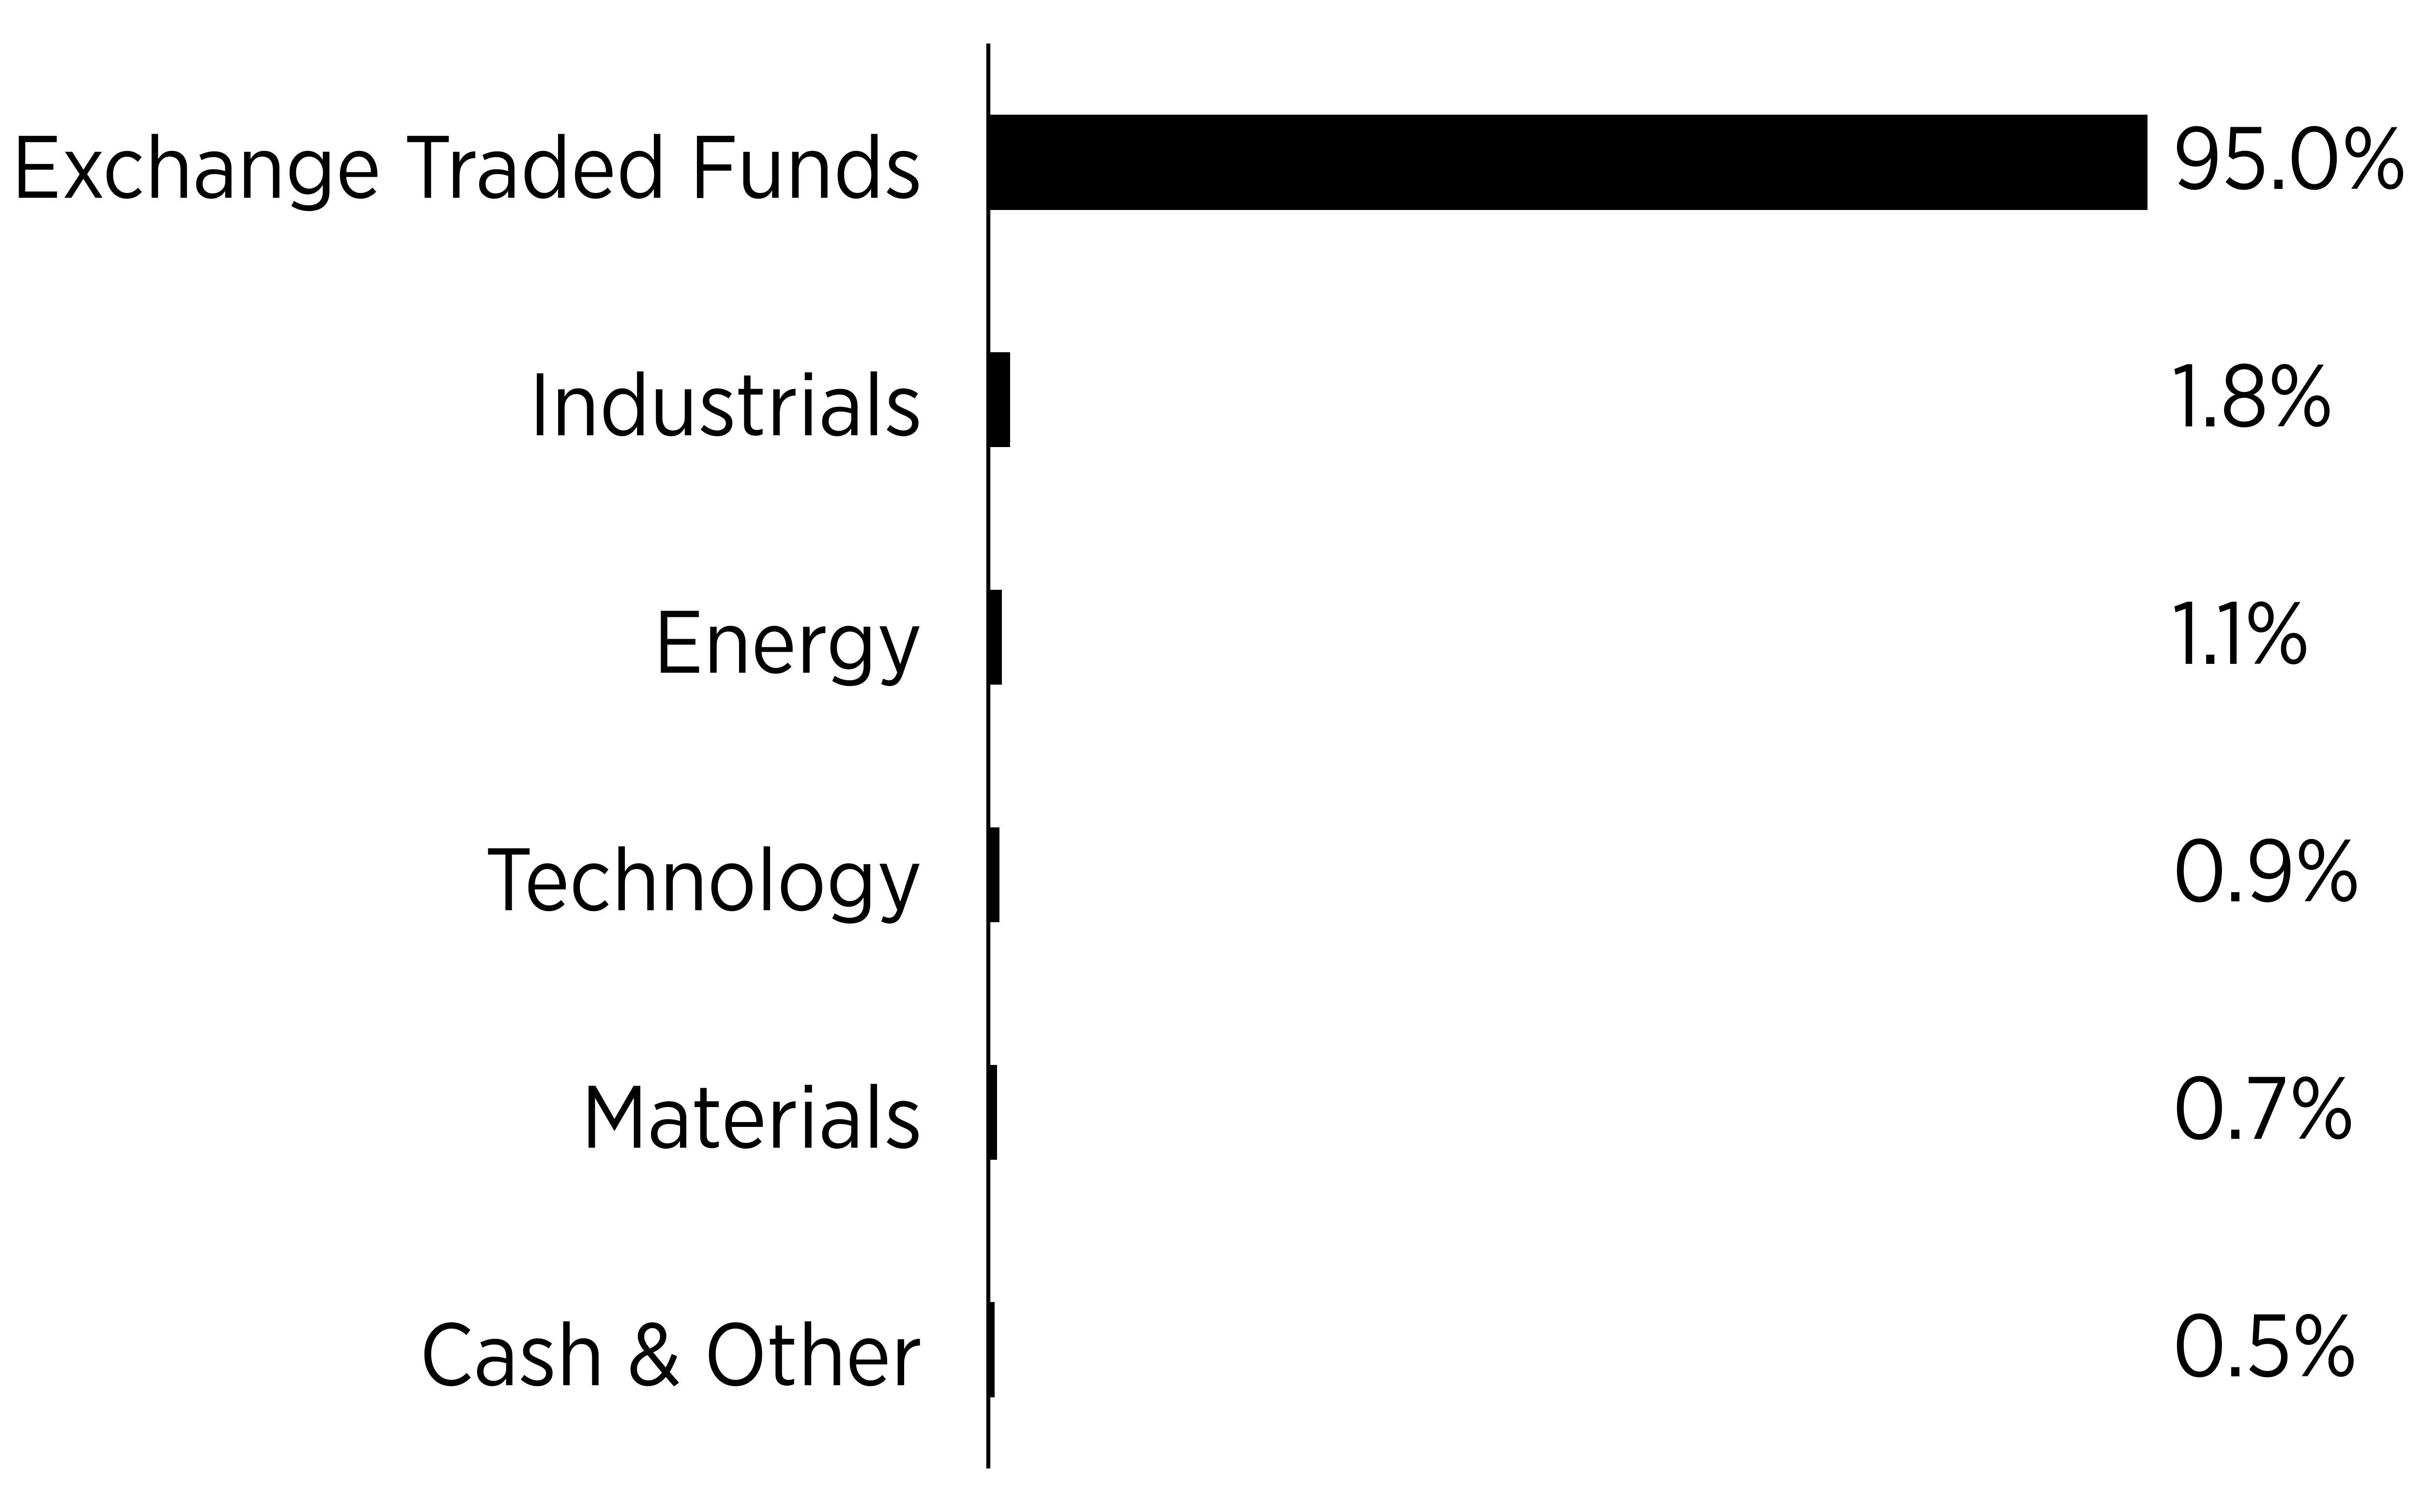
Sector Breakdown

(% of Total Net Assets)
sector
%
Exchange Traded Funds
95.0%
Industrials
1.8%
Energy
1.1%
Technology
0.9%
Materials
0.7%
Cash & Other
0.5%
bar
Largest Holdings [Text Block]

What did the Fund invest in?

(as of August 31, 2026)


Top Ten Holdings
(% of Total
Net Assets)
iShares Russell 2000 ETF
21.2%
Schwab U.S. Small-Cap ETF
21.0%
abrdn Physical Gold Shares ETF
12.7%
Invesco QQQ Trust, Series 1
7.8%
State Street SPDR S&P 500 ETF Trust
7.8%
SPDR Gold MiniShares Trust
7.1%
Schwab U.S. Dividend Equity ETF
4.5%
Simplify Managed Futures Strategy ETF
3.5%
Vanguard Total International Stock ETF
2.5%
State Street Technology Select Sector
SPDR ETF
2.5%
[1] Costs paid as a percentage of investment are annualized.