What were the Fund costs for the past year?
(based on a hypothetical $10,000 investment)
|
Fund
Name |
Costs
of a $10,000 investment |
Costs
paid as a percentage of a $10,000 investment |
|---|---|---|
|
TradersAI
Large Cap Equity & Cash ETF |
$108 |
1.25% |
1. Market Review
The past twelve months can be described as a year of earnings-led strength, sustained AI capital spending, and broadening sector leadership. The S&P 500 Index advanced +20.38% over the reporting period and set new all-time highs, underpinned by exceptionally strong corporate profitability, with roughly 86% of S&P 500 companies beating consensus earnings estimates.
Mega-cap technology remained the primary engine of the advance, supported by robust artificial intelligence investment and solid quarterly cash flows. Leadership broadened as the period progressed: heading into late summer 2026, gains extended into cyclical sectors such as Materials and Energy alongside Technology. Notably, equities climbed even as 10-year Treasury yields rose toward 4.75%–4.80% and the Federal Reserve maintained a cautious policy stance.
In contrast to the episodic, tariff-driven volatility of 2025, this period was defined largely by a persistent, steady uptrend with compressed volatility, interrupted by one meaningful pullback in March 2026 (S&P 500 −5.09%). As discussed below, this regime was particularly unfavorable for HFSP’s intraday strategy.
2. Fund Performance Summary
The HFSP ETF faced performance headwinds amid a challenging backdrop for intraday and tactical trading strategies to navigate episodic volatility while capitalizing on intraday market inefficiencies:
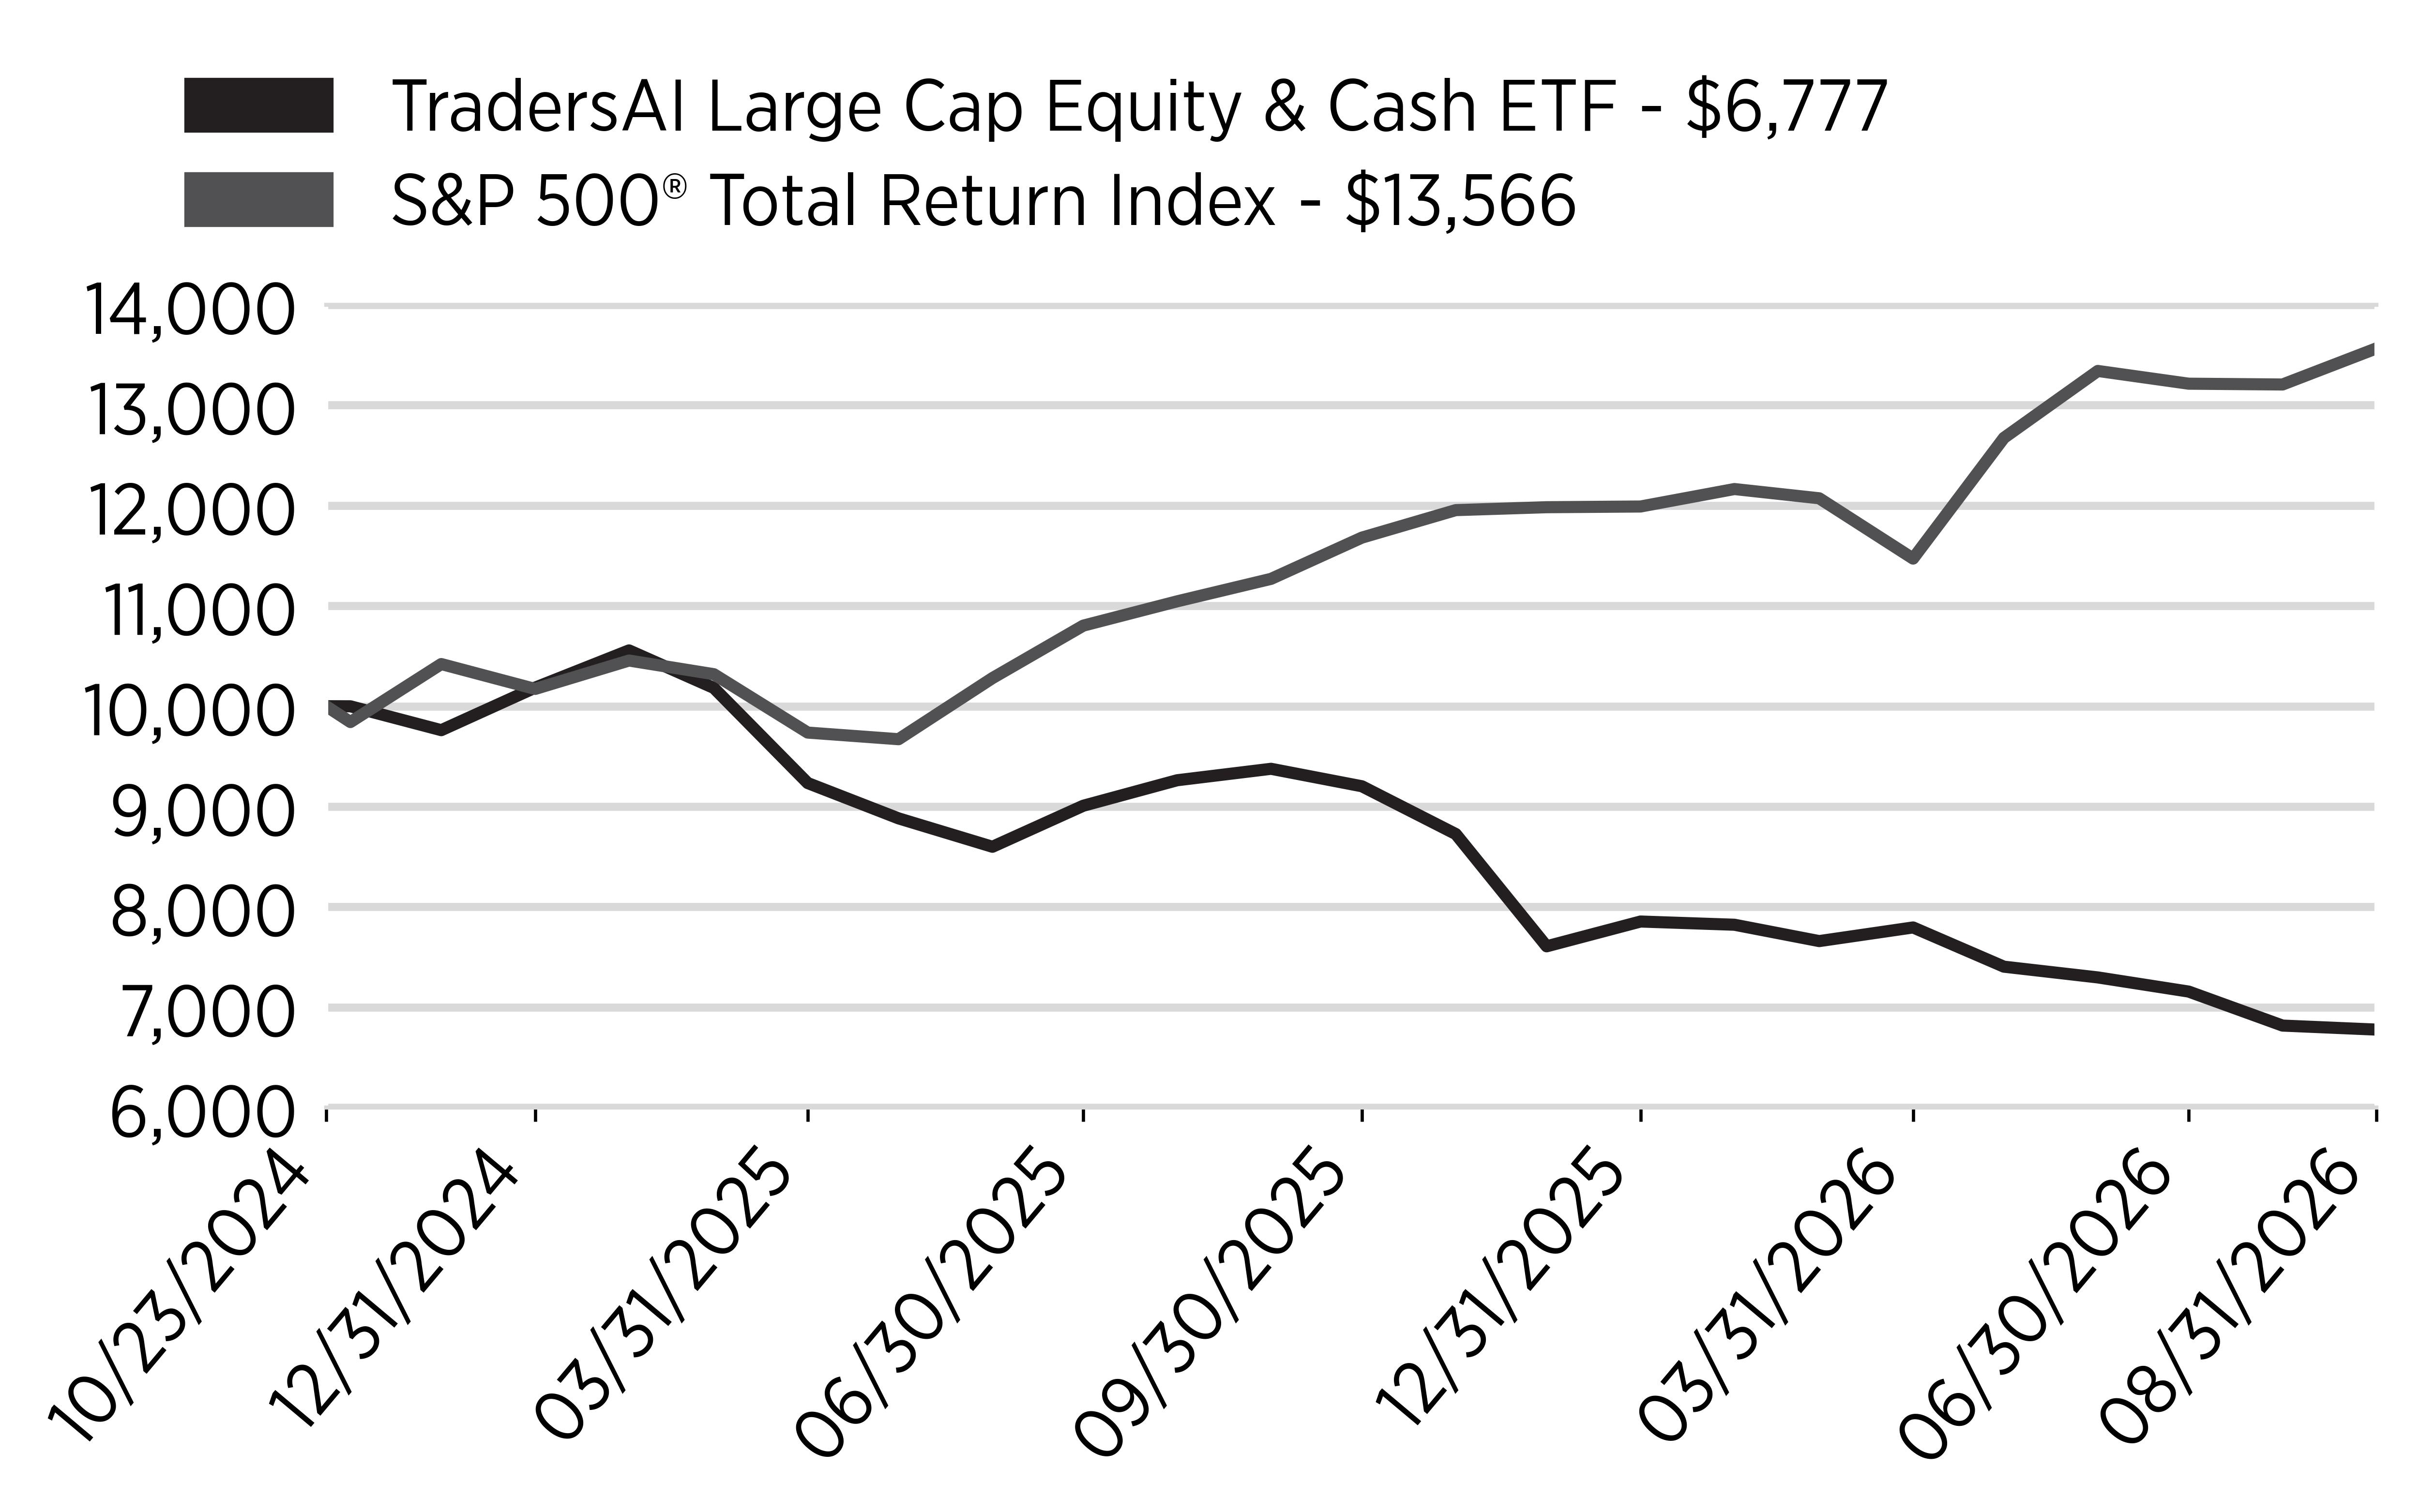
For the twelve months ended August 2026, HFSP returned −27.86% at NAV, compared with +20.38% for the S&P 500 Index and −15.67% for the ProShares Short S&P 500 ETF ("SH"), a passive 1x inverse benchmark. HFSP underperformed both the long equity market and the inverse benchmark.
3. Key Detractors
Whipsaw Costs in a Persistent Trend Market
HFSP’s proprietary quantitative models trade long and short positions in e-mini futures contracts and options on both futures based on the S&P 500 Index and options on Underlying ETFs. Last year, the challenge was volatility that fell outside our models’ normal distribution ranges. This year the challenge was a steady, low-volatility, multi-day uptrend. In this environment, intraday short hedges and tactical position shifts were repeatedly overtaken by continued market advances, producing a sequence of realized losses relative to a buy-and-hold exposure. HFSP’s volatility and maximum drawdown both exceeded those of the S&P 500, while its losses occurred during both sustained advances and temporary pullbacks.
Turnover, Path-Dependency, and Execution Friction
Near-daily turnover and the path-dependency of compounding intraday results created substantial drag, most acutely in sideways, range-bound months. November 2025 was the weakest month of the period, with a NAV decline of −12.82%. Transaction costs, together with the fund’s 1.25% expense ratio, further widened the gap against low-cost passive exposure.
Fund Scale and Secondary-Market Liquidity
With total net assets of approximately $700,000 and limited trading volume, HFSP periodically experienced spreads between its market price and underlying NAV. Shareholders transacting on exchange may therefore have realized returns that differed from the NAV returns shown above.
4. Positive Contributions and Strategy Characteristics
Down-Market Cushion
The strategy continued to demonstrate its intended behavior during market pullbacks, generating absolute gains in months when the S&P 500 declined:
- March 2026: S&P 500 −5.09%; HFSP +1.77% NAV.
- December 2025: S&P 500 −0.05%; HFSP +3.25% NAV.
- December 2024 (since inception): S&P 500 −2.50%; HFSP +0.08% NAV.
Since inception, HFSP posted positive daily returns on 53.6% of days on which the S&P 500 closed lower (111 of 207 down days).
Periods of Rally Capture
The strategy has shown it can participate in stable, orderly advances. In January 2025, HFSP returned +6.43% at NAV versus +2.70% for the S&P 500, outperforming by 373 basis points. From June through August 2025, HFSP delivered three consecutive positive months (+4.76%, +2.81%, and +1.24%). These results demonstrate the model’s potential in favorable regimes, though they were not sustained through the current reporting period.
Low Correlation to Equity Markets
HFSP continued to deliver returns with low correlation to the S&P 500: a daily return correlation of +0.255 and a beta of 0.31 since inception, with correlation turning negative (−0.04 to −0.28) over multi-month spans from Q4 2025 through Q3 2026.
5. Management Outlook
HFSP remains committed to its quantitative, intraday approach and to the fund’s objective of providing a low-correlated return stream with daily liquidity. We believe the strategy’s behavior in down markets and orderly rallies shows it has a role to play, but we also recognize that it must deliver positive absolute returns across a broader range of market regimes, including the persistent uptrends that characterized this period.
Cumulative Performance
(Initial Investment of $10,000)
Annual Performance
|
Average
Annual Returns for the Periods
Ended
August 31, 2026: |
1
Year |
Since
Inception
(10/23/2024) |
|---|---|---|
|
TradersAI
Large Cap Equity & Cash ETF |
-27.86% |
-18.92% |
|
S&P
500® Total Return Index |
20.38% |
17.87% |
Key Fund Statistics
(as of August 31, 2026)
|
Fund
Size (Thousands) |
$668 |
|
Number
of Holdings |
1 |
|
Total
Advisory Fee |
$9,603 |
|
Portfolio
Turnover Rate |
0% |
What did the Fund invest in?
(as of August 31, 2026)
Security Type (% of net assets)

|
Top
Holdings |
(%
of total
net
assets) |
|---|---|
|
First
American Government Obligations Fund -
Class
X, 3.59% |
|
|
Other
Assets in Excess of Liabilities |