

Management Letter
November 6, 2026
Just as the lingering effects of government job cuts began to abate this summer, we saw a resurgence of inflation and upward pressure on long-term interest rates. Higher long-term interest rates have increased borrowing costs, widened bid-ask spreads, and placed renewed pressure on real estate valuations. While these factors create a clear headwind to private capital markets investment activity, the underlying fundamentals picture continues to improve in both the multifamily and office sectors, particularly in markets where the expanding defense tech industry continues to drive job growth and demand.
Against this backdrop, performance within our core markets is improving. During this summer’s peak leasing season, our Same Store multifamily portfolio re-stabilized and demonstrated encouraging demand even after the economic disruption the region experienced over the past year. Across the DC metro region, and especially in Northern Virginia, multifamily fundamentals continue to benefit from historically low levels of new supply and the region’s long-term demand drivers, including growing investment in the defense, intelligence, and technology sectors. The office market is showing similar signs of strength. Demand for space in National Landing and throughout Northern Virginia remains strong, particularly among defense technology, cybersecurity, artificial intelligence, and government contracting companies. Our leasing pipeline continues to strengthen and increasingly reflects the growth of these sectors, with tenants seeking proximity to the Pentagon, secure facilities, technical talent, and the highly amenitized environment we have created. As a result, we believe Northern Virginia remains well-positioned to benefit from demand drivers tied to defense modernization and national security investment that have historically enjoyed broad bipartisan support.
The following are highlights since last quarter:
Successfully recast our $690.0 million Revolving Credit Facility and $243.9 million of our Tranche A-2 Term Loan with fully extended maturity dates in August 2031. We are very pleased with lender demand to participate in the recast, which solidifies our strong balance sheet and provides us financial flexibility.
Recapitalized two office assets, 800 North Glebe and Dulles View, subsequent to quarter end. These strategic joint ventures advance our strategy of attracting private capital partners to grow and diversify our office investment platform while also creating opportunities for incremental fee revenue and potential carried interest income.
Executed 74,000 square feet of new office leases, 69,000 square feet of which was in National Landing. Despite a seasonally slower third quarter, demand in National Landing remains strong and our pipeline continues to grow. Entering the fourth quarter, we believe we are on track for our strongest year of new leasing since 2019.
1
Capital Allocation
Since inception, our capital allocation strategy has focused on maximizing long-term NAV per share growth. Last year we advanced that strategy by recycling out of efficiently valued multifamily assets into more accretive uses, including distressed office acquisitions and share repurchases, increasing our exposure to our portfolio of defense-tech-driven office assets in National Landing. This approach provided shareholders with an opportunity to realize liquidity at increasing prices in the short term, while allowing those who remain invested to participate in the highly accretive reduction of shares at a substantial discount to NAV and gain additional exposure to office, which we believe offers substantially higher expected returns.
In the first half of this year, the knock-on effects of the 2025 federal workforce reductions temporarily disrupted multifamily fundamentals across the region and slowed transaction activity as investors assessed the durability of these reductions’ impact on demand. Losing over 100,000 jobs was the largest annual employment downturn in the DC region’s history, and the rapid multifamily occupancy decline that followed was jarring. While this uncertainty paused portions of our capital recycling program, operating performance is improving meaningfully in the second half of 2026 as job growth has resumed and multifamily fundamentals stabilized. The DC metro area, particularly Northern Virginia, continues to benefit from growth in defense spending, and our multifamily portfolio has recovered all of the occupancy and most of the rent declines that were suffered earlier this year.
Accordingly, we are currently in the market to recapitalize several multifamily assets where private market values exceed those implied by the public market. We intend to recycle that capital into a combination of deleveraging and more accretive uses, including acquisitions of high-growth, defense-tech office assets and share repurchases. We expect this strategy to offer the same win-win proposition to investors who favor the value of capital returned through repurchases as well as those who favor longer-term NAV per share accretion and share our conviction in the defense-spending-driven recovery of our National Landing office portfolio. As we have previously articulated, we expect to continue pursuing this approach for the foreseeable future. As this is a relative capital allocation and return strategy, the impact of rising rates will be less significant when the consequence of higher rates is felt in both public and private markets. In other words, if the discount on what we’re buying equals or exceeds any discount on what we’re selling, the allocation is still accretive, and possibly more so.
As we recycle capital, our DNA as a mixed-use operator will continue to serve as the foundation for how we protect and create value. Over multiple cycles, we believe our ability to allocate capital between product types and unlock development opportunities in ways that single-asset-class investors cannot remains a competitive advantage. Had we been multifamily-only investors, we would not have been able to attract Amazon HQ2. Had we been office-only investors, we would not have been able to unlock millions of square feet of valuable land from obsolete office buildings in National Landing and develop some of the most valuable apartment assets in the submarket, if not the region. These skill sets enable and add value to one another, but the ownership need not be concentrated in our public currency. Either asset type can be owned in the private capital markets while the other can be owned by our public shareholders. Owning a portfolio of liquid and highly valuable multifamily assets alongside a portfolio of illiquid and disfavored office assets enables us to privately capitalize one (multifamily) for the benefit of highly accretive investment in the other (office) through share repurchases and opportunistic office acquisitions.
While we believe significant value exists within our office portfolio, further improvement in occupancy and private market demand for office investment is likely necessary to realize that value. We expect operating performance to continue to improve in the short run, but a recovery in the private capital markets for office will likely require a longer time horizon. In the meantime, we see compelling opportunities to concentrate capital in attractively priced office acquisitions and our own portfolio of office assets benefiting from the durable growth of defense, intelligence, and technology spending in Northern Virginia. We believe recycling capital out of higher-priced multifamily assets into these opportunities is the surest path to long-term NAV per share growth, which has been our clearly articulated
2
strategy from day one. Since launching our share repurchase program in 2020, we have repurchased 86.5 million shares, approximately 65% of the shares outstanding as of December 31, 2019, for $1.6 billion. As the largest group of investors, representing one-quarter of the company, we believe management and unitholders are well aligned with all shareholders in pursuit of this goal.
Subsequent to quarter end, we sold a 90% interest in 800 North Glebe, an approximately 306,200-square-foot commercial asset in the Ballston submarket of Arlington, Virginia. Additionally, like the recapitalization of Tysons Dulles Plaza earlier this year, we sold 50% of our interest in Dulles View, an approximately 360,500-square-foot commercial asset in Dulles, Virginia. As part of these recapitalizations and despite a challenging financing environment, we secured mortgage financing on both assets at attractive pricing and leverage levels. These joint ventures further our strategy of attracting third-party capital partners to expand and diversify our office investment platform while enhancing the efficiency of our business through incremental fee revenue and potential carried interest opportunities. More broadly, they demonstrate our ability to create value through our operating platform while maintaining the potential for future upside and preserving capital and financial flexibility for additional investment opportunities.
Financial and Operating Metrics
For the three months ended September 30, 2026, we reported Core FFO attributable to common shares of $12.7 million, or $0.22 per diluted share. Annualized NOI increased 2.9% or $7.2 million quarter over quarter to $256.4 million. Our multifamily portfolio ended the quarter at 92.9% leased and 91.5% occupied. Our office portfolio ended the quarter at 78.5% leased and 76.8% occupied. Our Same Store NOI increased 3.3% for the three months ended September 30, 2026.
As of September 30, 2026, our Net Debt to Annualized Adjusted EBITDA was 11.6x, an improvement from the prior quarter, as we continued to lease up and stabilize our newly constructed multifamily assets and grow commercial revenue through the commencement of signed leases and conversion of our leasing pipeline. Our floating rate exposure remains low, with 83.9% of our debt fixed or hedged as of the end of the third quarter, after accounting for in-place interest rate swaps and caps. The floating rate exposure is tied to our revolving credit facility and assets where the business plan warrants preserving flexibility. We continue to be well positioned with respect to our near-term debt maturities. Our debt has a weighted average maturity of 2.7 years, after adjusting for by-right extension options. Our non-recourse asset-level financing strategy continues to be most valuable in an environment like today, providing a floor on our downside risk.
Operating Portfolio
The Same Store multifamily portfolio ended the quarter at 94.4% leased, up 90 basis points quarter over quarter, and 93.1% occupied, up 270 basis points quarter over quarter. September asking rents increased 1.7% from June 2026 and 3.7% from December 2025. Our multifamily portfolio NOI increased approximately 3.4% from the second quarter.
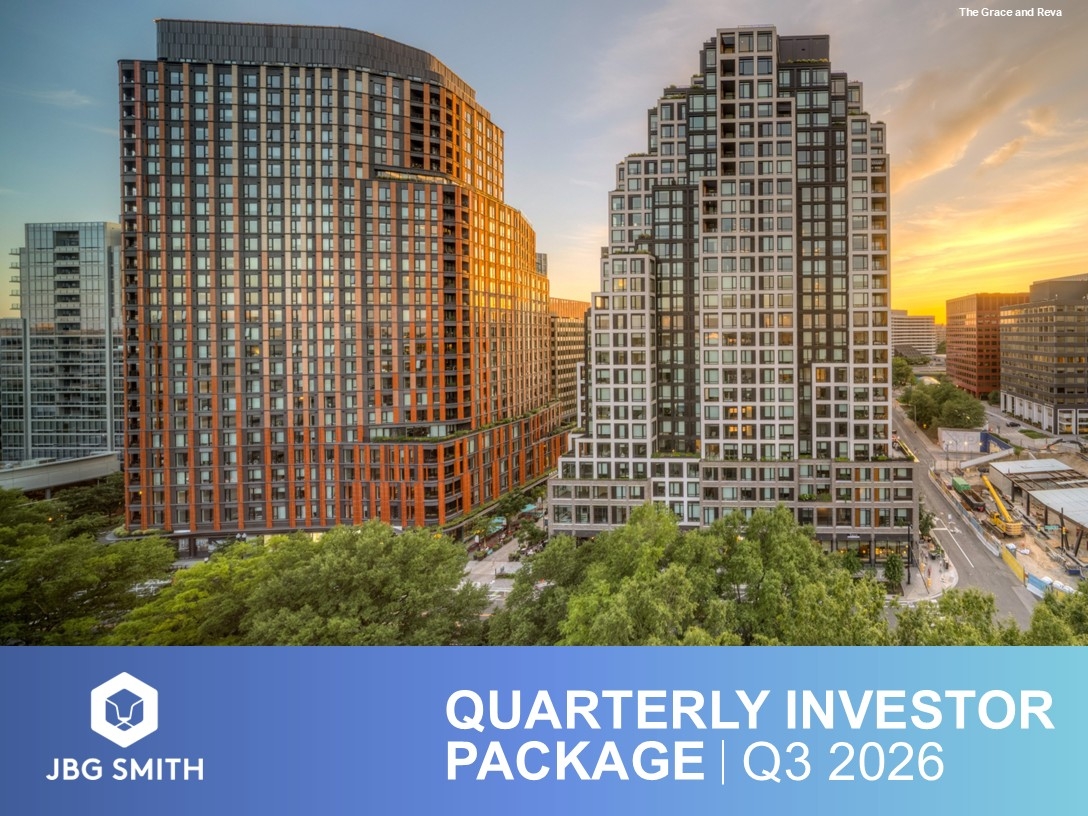
We continue to make progress leasing our recently completed assets — The Grace and Reva were 94.7% leased and The Zoe and Valen were 81.1% leased as of quarter end. We believe that the amenity-rich environment we have developed in National Landing and proximity to transit are key factors contributing to the successful leasing performance of these assets.
DC Metro Multifamily Trends (based on CoStar, Apartment List, and BLS data)
The DC metro region’s multifamily market continues along a path of recovery from the disruptions caused by the federal workforce reductions and contractor layoffs last fall and winter; in many ways it is ahead of the broader jobs
3
recovery. As of September, Apartment List reported regional vacancy at 6.4%, flat relative to the same period last year, before most of the federal workforce reductions took effect, and improved from a peak of 6.9% earlier this year. While the market responded to the demand shock by reducing rents and introducing concessions, we have seen that trend stabilize alongside the occupancy recovery. Year-over-year rent growth was essentially flat at negative 0.6%, and rents continued to climb during the third quarter, rising 2.3% year-to-date.
With the employment market not yet fully recovered, a large part of the recovery story remains the lack of new competitive supply. Although there was a modest pickup in new starts this quarter with 3,389 units starting construction compared to 2,259 in the second quarter, only approximately 2% of the region’s inventory is currently under construction, still a strikingly low level from a historical perspective. Against the backdrop of an elevated and rising rate environment, we expect this supply pipeline will remain significantly constrained which should support a longer runway for recovery and growth.
Office Trends
Our office portfolio ended the quarter at 78.5% leased, up 50 basis points quarter over quarter, and 76.8% occupied, up 140 basis points quarter over quarter, and NOI increased 2.6% from the second quarter. The spread between our leased and occupied percentages represents approximately $8.8 million of contractual annualized rent which is expected to commence over the next 12 months. In the third quarter, we executed 193,000 square feet of leases (188,000 square feet in National Landing), including 74,000 square feet of new leases. For second generation leases, the rental rate mark-to-market was negative 1.9%. Our year-to-date leasing activity represents over 93% of our 2025 leasing activity, underscoring the continued momentum in our office leasing demand.
Looking forward, lease rollover in National Landing is modest, averaging approximately 7% annually over the next five years. We expect our tenant retention rate to improve, as defense-tech tenants comprise approximately 70% of the portfolio’s tenancy. Since the beginning of 2025, we have achieved an 81% retention rate among these tenants and have expanded their footprints by an average of 14% upon renewal. We continue to execute upon our leasing pipeline, which currently stands at over 235,000 square feet sought by tenants looking to occupy space in National Landing. Leasing activity in National Landing continues to be driven primarily by three categories of office users: (i) companies requiring a Sensitive Compartmented Information Facility (SCIF) or other forms of secure facilities; (ii) technology-related tenants attracted by the recent delivery of our placemaking interventions; and (iii) defense-related tenants who have long called this submarket home. 99% of our third quarter leasing activity was with tenants in the defense and technology industries. Demand for office space that has a SCIF is particularly strong, since these facilities require significant capital investments which can exceed $500 per square foot and extended construction timelines which can stretch to over 18 months driven by security and certification requirements. The ability to deliver new SCIF or assign existing SCIF continues to be a key differentiator in our tenant discussions — 65% of our defense-tech tenancy has a SCIF or secure facility in their space, which we believe represents a lasting competitive advantage that is difficult to replicate elsewhere in the market.
To support a healthier long-term office market in National Landing, we have reduced our office inventory by more than 25% since our formation by repurposing older, underutilized office buildings for redevelopment or conversion to multifamily housing, hospitality, and other complementary uses that create a vibrant mixed-use environment. Over the past year, we expanded this strategy through adaptive reuse and conversion of four obsolete office buildings. We entitled 2100 Crystal Drive for conversion into a 345-key, dual-branded hotel before selling the asset to a hotel developer. We recapitalized and commenced construction on the conversion of 2200 Crystal Drive into a 195-unit multifamily asset. We recently received entitlement approval to convert 1800 and 1901 South Bell Street into multifamily, advancing the next phase of inventory reduction and repositioning within the submarket. Our leasing efforts continue to focus on buildings with long-term potential, concentrating occupancy in areas of National Landing
4
that are accessible via multi-modal transportation and that we have enhanced through our placemaking interventions, including the recent delivery of our new office amenity hub at 2011 Crystal Drive.
Northern Virginia Office Trends (based on JLL and CBRE data)
Mirroring what we’ve seen in our own portfolio, the brokerage prints for the third quarter were uniformly positive for the Northern Virginia office environment. Both CBRE and JLL recorded strong quarters for leasing in Northern Virginia, with nearly 1 million square feet of year-to-date absorption according to CBRE’s latest data — a remarkable figure, the best the market has seen since 2019. The same data set shows year-to-date leasing activity is in line with the long-term historical average, a meaningful milestone after years of COVID-driven reduction in office demand. Overall market vacancy ended the quarter at approximately 21%, but that headline masks the real story. Trophy vacancy has now fallen to 12.9% — the lowest CBRE has recorded since tracking began — and pockets of scarcity are beginning to emerge, particularly in buildings and locations such as National Landing with strong amenities and appeal for defense and technology firms. Those firms, many of whom are new entrants to the Northern Virginia market, often start small, establish a footprint, and grow as the Pentagon demands rapid delivery of cutting-edge solutions backed by a $1 trillion budget which we expect will grow next year. This comes alongside increasingly stringent security requirements for SCIFs, which are driving demand in our portfolio both from users who have existing, often older, SCIFs that need to modernize and from users seeking to establish their first SCIF in the market.
Beyond the strengthening demand environment, the supply picture continues to improve through inventory reduction, with over 17 million square feet in various stages of planned or actual redevelopment according to JLL. That is over 10% of the market’s inventory and, once removed, will reduce functional vacancy significantly. Even as a rising rate environment may slow conversions of office to multifamily, it also puts additional pressure on some “on the bubble” office assets, pushing them out of contention for successful leasing; it will likely be some time before their cost basis resets to competitive levels, further limiting effective supply. This dynamic also creates net new investment opportunities for groups like us who can selectively target the best distressed office assets to take advantage of what appears to be a rapidly improving market backdrop. As such, we remain optimistic about the opportunity in office.
* * *
As we look ahead, our priorities remain clear and consistent: execute with discipline, preserve balance sheet flexibility, and allocate capital toward opportunities that offer compelling long-term risk-adjusted returns. While elevated interest rates continue to weigh on transaction activity and portions of the real estate capital markets, we believe they are also creating attractive opportunities for patient, well-capitalized investors. We remain focused on allocating capital where we believe it can create the greatest long-term value, with maximizing long-term NAV per share growth serving as our North Star.
We are encouraged by the continued improvement in the fundamentals of our business, which reinforces our conviction that our markets are benefiting from durable demand drivers that should support enduring growth. Northern Virginia remains at the intersection of several growth drivers, including national security, technological innovation, and federal investment. We believe these drivers, combined with our disciplined approach to capital allocation, position us well to create long-term value for our shareholders.
The successful recast of our Revolving Credit Facility and Tranche A-2 Term Loan further strengthens our liquidity position and financial flexibility while reinforcing the breadth and quality of our banking relationships. We deeply appreciate the conviction these leading banks and financial institutions have shown JBG SMITH, our strategy, and our team across multiple market cycles, and we are grateful for their continued partnership and support.
5
Thank you for your continued trust and confidence.
Sincerely,

W. Matthew Kelly
Chief Executive Officer
6
 Section Two – Earnings Release
FOR IMMEDIATE RELEASE | |
| | |
gs Release
CONTACT
Kevin Connolly
Executive Vice President, Portfolio Management & Investor Relations
(240) 333-3837
kconnolly@jbgsmith.com
JBG SMITH ANNOUNCES THIRD QUARTER 2026 RESULTS
Bethesda, MD (November 6, 2026) - JBG SMITH (NYSE: JBGS), a leading owner, operator, and developer of mixed-use properties in the Washington, DC market, today filed its Form 10-Q for the quarter ended September 30, 2026 and reported its financial results.
Additional information regarding our results of operations, properties, and tenants can be found in our Third Quarter 2026 Investor Package, which is posted in the Investor Relations section of our website at www.jbgsmith.com. We encourage investors to consider the information presented here with the information in that document.
Third Quarter 2026 Highlights
| ● | Net loss, Funds from Operations ("FFO"), and Core FFO attributable to common shareholders were: |
| THIRD QUARTER AND YEAR-TO-DATE COMPARISON | ||||||||||||||||||||
in millions, except per share amounts | | Three Months Ended | | Nine Months Ended | |||||||||||||||||
| | | September 30, 2026 | | September 30, 2025 | | September 30, 2026 | | September 30, 2025 | ||||||||||||
| | | Amount | Per Diluted Share | | Amount | Per Diluted Share | | Amount | Per Diluted Share | | Amount | Per Diluted Share | ||||||||
| Net loss (1) | | $ | (82.0) | $ | (1.41) | | $ | (28.6) | $ | (0.48) | | $ | (159.9) | $ | (2.75) | | $ | (93.5) | $ | (1.35) |
| FFO | | $ | 10.4 | $ | 0.18 | | $ | 10.1 | $ | 0.17 | | $ | 25.0 | $ | 0.42 | | $ | 20.9 | $ | 0.30 |
| Core FFO | | $ | 12.7 | $ | 0.22 | | $ | 9.1 | $ | 0.15 | | $ | 33.0 | $ | 0.56 | | $ | 29.0 | $ | 0.41 |
_____________
| (1) | Includes gains on the sale of real estate of $4.7 million for the three months ended September 30, 2025, and $20.6 million and $47.0 million for the nine months ended September 30, 2026 and 2025. Includes impairment losses of $69.2 million and $4.8 million for the three months ended September 30, 2026 and 2025, and $114.7 million and $45.1 million for the nine months ended September 30, 2026 and 2025. |
| ● | Annualized Net Operating Income ("Annualized NOI") for the three months ended September 30, 2026 was $256.4 million, compared to $249.3 million for the three months ended June 30, 2026, at our share. |
| o | The increase in Annualized NOI was substantially attributable to (i) higher occupancy and lower real estate taxes, partially offset by higher concessions and utilities expense in our multifamily portfolio; and (ii) abatement burn off and lower real estate taxes in our commercial portfolio. |
2
| ● | Same Store NOI ("SSNOI") at our share increased 3.3% to $60.8 million for the three months ended September 30, 2026 compared to September 30, 2025. |
| o | The increase in our commercial portfolio SSNOI was substantially attributable to higher rental revenue and lower real estate taxes, partially offset by higher utilities expense, and the decrease in our multifamily portfolio SSNOI was substantially attributable to lower rental revenue. |
Operating Portfolio
| ● | The operating multifamily portfolio was 92.9% leased and 91.5% occupied as of September 30, 2026, compared to 89.6% and 86.6% as of June 30, 2026, at our share. Our Same Store multifamily portfolio was 94.4% leased and 93.1% occupied as of September 30, 2026, compared to 93.5% leased and 90.4% occupied as of June 30, 2026, at our share. |
| ● | In our Same Store multifamily portfolio, effective rents decreased by 9.6% for new leases and increased by 2.7% upon renewal while achieving a 56.8% renewal rate during the third quarter. |
| ● | The operating commercial portfolio was 78.5% leased and 76.8% occupied as of September 30, 2026, compared to 78.0% and 75.4% as of June 30, 2026, at our share. |
| ● | Executed approximately 193,000 square feet of office leases at our share during the three months ended September 30, 2026, including approximately 74,000 square feet of new leases. Second-generation leases generated a 1.9% rental rate decrease on a cash basis and a 1.6% rental rate increase on a GAAP basis. |
| ● | Executed approximately 674,000 square feet of office leases at our share during the nine months ended September 30, 2026, including approximately 189,000 square feet of new leases. Second-generation leases generated a 4.7% rental rate decrease on a cash basis and a 1.1% rental rate increase on a GAAP basis. |
Development Portfolio
Under-Construction
| ● | As of September 30, 2026, one asset was under construction, 2200 Crystal Drive in National Landing, an obsolete office building that is being converted into a 195-unit multifamily asset, 59 units at our share. |
Development Pipeline
| ● | As of September 30, 2026, our development pipeline consisted of 3.5 million square feet of Estimated Potential Development Density at our share. |
Third-Party Real Estate Services Business
| ● | For the three months ended September 30, 2026, revenue from third-party real estate services, including reimbursements, was $18.3 million. Excluding reimbursements and service revenue from our interests in real estate ventures, revenue from our third-party real estate services business was $8.0 million, primarily driven by $4.6 million of property and asset management fees, and $1.7 million of other service revenue. |
3
Balance Sheet
| ● | As of September 30, 2026, our total enterprise value was approximately $3.2 billion, comprising 71.5 million common shares and units valued at $718.2 million, and debt (net of premium / (discount) and deferred financing costs) at our share of $2.6 billion, less cash and cash equivalents at our share of $77.7 million. |
| ● | As of September 30, 2026, we had $78.5 million of cash and cash equivalents ($77.7 million of cash and cash equivalents at our share), and $454.2 million of undrawn capacity under our revolving credit facility. |
| ● | Net Debt to Annualized Adjusted EBITDA at our share for the three months ended September 30, 2026 was 11.6x. |
Investing and Financing Activities
| ● | In August 2026, we amended and extended the revolving credit facility from June 2027 to August 2030 with two six-month extension options, which may extend the maturity to August 2031. The amended facility provides for aggregate commitments of $690.0 million. |
| ● | In August 2026, our Tranche A‑2 Term Loan was amended to increase its borrowing capacity by $15.0 million to $415.0 million and extend $243.9 million of the term loan to August 2028 with three 12-month extension options that may extend the maturity to August 2031. The remaining $171.1 million of the term loan will mature in January 2028. |
Dividends
| ● | On October 29, 2026, our Board of Trustees declared a quarterly dividend of $0.175 per common share, which will be paid on November 25, 2026 to shareholders of record as of November 12, 2026. |
Subsequent to September 30, 2026
| ● | In October 2026, we formed a real estate venture to recapitalize 800 North Glebe Road, a 306,210-square-foot commercial asset in Arlington, Virginia, in which we sold a 90.0% interest. In connection with the transaction, the real estate venture entered into a three-year, interest-only $61.3 million mortgage loan with an interest rate of SOFR plus 3.70%, of which $52.7 million was drawn at closing. We retained management and leasing of the asset and will account for the asset as an unconsolidated real estate venture. |
| ● | In October 2026, we formed a real estate venture to recapitalize our interest in Dulles View, a 360,482-square-foot commercial asset in Dulles, Virginia, in which we retained a 30.0% interest. Additionally, the real estate venture entered into a three-year, interest-only $40.9 million mortgage loan with an interest rate of SOFR plus 3.35%, of which $17.4 million was drawn at closing. |
| ● | In October 2026, we repaid $67.0 million under the revolving credit facility. |
| ● | Through October 30, 2026, we repurchased and retired 1.0 million common shares for $11.5 million, a weighted average purchase price per share of $11.07, pursuant to a repurchase plan under Rule 10b5-1 of the Securities Exchange Act of 1934, as amended. |
About JBG SMITH
JBG SMITH owns, operates, and develops mixed-use properties concentrated in amenity-rich, Metro-served submarkets in and around Washington, DC, most notably National Landing, where through our focus on
4
placemaking, we cultivate vibrant, highly amenitized, walkable neighborhoods. JBG SMITH's portfolio at share comprises 11.8 million square feet of multifamily, office, and retail assets, and a 3.5 million square-foot development pipeline. For more information on JBG SMITH please visit www.jbgsmith.com.
Forward-Looking Statements
Certain statements contained herein may constitute "forward-looking statements" as such term is defined in Section 27A of the Securities Act of 1933, as amended, and Section 21E of the Securities Exchange Act of 1934, as amended. Forward-looking statements are not guarantees of performance. They represent our intentions, plans, expectations and beliefs and are subject to numerous assumptions, risks and uncertainties. Consequently, the future results, financial condition and business of JBG SMITH Properties ("JBG SMITH," the "Company," "we," "us," "our" or similar terms) may differ materially from those expressed in these forward-looking statements. You can find many of these statements by looking for words such as "approximate," "hypothetical," "potential," "believes," "expects," "anticipates," "estimates," "intends," "plans," "would," "may" or similar expressions in this earnings release. We also note the following forward-looking statements: whether in the case of our under-construction assets and assets in the development pipeline, estimated square feet and estimated number of units are accurate; and whether expected timing, completion, and delivery dates for our under-construction assets are accurate.
Many of the factors that will determine the outcome of these and our other forward-looking statements are beyond our ability to control or predict. These factors include, among others: adverse economic conditions in the Washington, DC metropolitan area, including reductions in federal government spending, headcount, or leasing, trends in multifamily housing demand in the Washington, DC metropolitan area, the impacts and ultimate outcome of the Wardman Tower litigation, the potential need for one or more bonds to be posted by the defendants and the extent to which we would be required to collateralize any portion of such bonds in connection with the Wardman Tower litigation, the timing of and costs associated with development and property improvements, financing commitments, and general competitive factors. For further discussion of factors that could materially affect the outcome of our forward-looking statements and other risks and uncertainties, see "Risk Factors," "Management's Discussion and Analysis of Financial Condition and Results of Operations" and the Cautionary Statement Concerning Forward-Looking Statements in the Company's Annual Report on Form 10-K for the year ended December 31, 2025 and other periodic reports the Company files with the Securities and Exchange Commission. For these statements, we claim the protection of the safe harbor for forward-looking statements contained in the Private Securities Litigation Reform Act of 1995. You are cautioned not to place undue reliance on our forward-looking statements. All subsequent written and oral forward-looking statements attributable to us or any person acting on our behalf are expressly qualified in their entirety by the cautionary statements contained or referred to in this section. We do not undertake any obligation to release publicly any revisions to our forward-looking statements to reflect events or circumstances occurring after the date hereof.
Pro Rata Information
We present certain financial information and metrics in this release "at JBG SMITH Share," which refers to our ownership percentage of consolidated and unconsolidated assets in real estate ventures (collectively, "real estate ventures") as applied to these financial measures and metrics. Financial information "at JBG SMITH Share" is calculated on an asset-by-asset basis by applying our percentage economic interest to each applicable line item of that asset's financial information. "At JBG SMITH Share" information, which we also refer to as being "at share,"
5
"our pro rata share" or "our share," is not, and is not intended to be, a presentation in accordance with GAAP. Given that a portion of our assets are held through real estate ventures, we believe this form of presentation, which presents our economic interests in the partially owned entities, provides investors valuable information regarding a significant component of our portfolio, its composition, performance and capitalization.
We do not control the unconsolidated real estate ventures and do not have a legal claim to our co-venturers' share of assets, liabilities, revenue and expenses. The operating agreements of the unconsolidated real estate ventures generally allow each co-venturer to receive cash distributions to the extent there is available cash from operations. The amount of cash each investor receives is based upon specific provisions of each operating agreement and varies depending on certain factors including the amount of capital contributed by each investor and whether any investors are entitled to preferential distributions.
With respect to any such third-party arrangement, we would not be in a position to exercise sole decision-making authority regarding the property, real estate venture or other entity, and may, under certain circumstances, be exposed to economic risks not present were a third-party not involved. We and our respective co-venturers may each have the right to trigger a buy-sell or forced sale arrangement, which could cause us to sell our interest, or acquire our co-venturers' interests, or to sell the underlying asset, either on unfavorable terms or at a time when we otherwise would not have initiated such a transaction. Our real estate ventures may be subject to debt, and the repayment or refinancing of such debt may require equity capital calls. To the extent our co-venturers do not meet their obligations to us or our real estate ventures or they act inconsistent with the interests of the real estate venture, we may be adversely affected. Because of these limitations, the non-GAAP "at JBG SMITH Share" financial information should not be considered in isolation or as a substitute for our consolidated financial statements as reported under GAAP.
Occupancy, non-GAAP financial measures, leverage metrics, operating assets and operating metrics presented in this release and our Investor Package exclude our 33.5% subordinated interest in four commercial buildings, as well as the associated non-recourse mortgage loans, held through an unconsolidated real estate venture, as our investment in the real estate venture is zero, we do not anticipate receiving any near-term cash flow distributions from the real estate venture, and we have not guaranteed its obligations or otherwise committed to providing financial support.
Non-GAAP Financial Measures
This release includes non-GAAP financial measures. For these measures, we have provided an explanation of how these non-GAAP measures are calculated and why JBG SMITH's management believes that the presentation of these measures provides useful information to investors regarding JBG SMITH's financial condition and results of operations. Reconciliations of certain non-GAAP measures to the most directly comparable GAAP financial measure are included in this earnings release. Our presentation of non-GAAP financial measures may not be comparable to similar non-GAAP measures used by other companies. In addition to "at share" financial information, the following non-GAAP measures are included in this release:
Earnings Before Interest, Taxes, Depreciation and Amortization ("EBITDA"), EBITDA for Real Estate ("EBITDAre") and "Adjusted EBITDA" are non-GAAP financial measures. EBITDA and EBITDAre are used by management as supplemental operating performance measures, which we believe help investors and lenders meaningfully evaluate and compare our operating performance from period-to-period by removing from our
6
operating results the impact of our capital structure (primarily interest charges from our outstanding debt and the impact of our interest rate swaps and caps) and certain non-cash expenses (primarily depreciation and amortization expense on our assets). EBITDAre is computed in accordance with the definition established by the National Association of Real Estate Investment Trusts ("Nareit"). Nareit defines EBITDAre as GAAP net income (loss) adjusted to exclude interest expense, income taxes, depreciation and amortization expense, gains (losses) on sales of real estate and impairment write-downs of certain real estate assets and investments in entities when the impairment is directly attributable to decreases in the value of depreciable real estate held by the entity, including our share of such adjustments for unconsolidated real estate ventures. These supplemental measures may help investors and lenders understand our ability to incur and service debt and to make capital expenditures. EBITDA and EBITDAre are not substitutes for net income (loss) (computed in accordance with GAAP) and may not be comparable to similarly titled measures used by other companies.
Adjusted EBITDA represents EBITDAre adjusted for items we believe are not representative of ongoing operating results, such as Transaction and Other Costs, gain (loss) on the extinguishment of debt, earnings (losses) and distributions in excess of our investment in unconsolidated real estate ventures, litigation costs and income (loss) from investments. We believe that adjusting such items not considered part of our comparable operations provides a meaningful measure to evaluate and compare our performance from period-to-period.
Because EBITDA, EBITDAre and Adjusted EBITDA have limitations as analytical tools, we use EBITDA, EBITDAre and Adjusted EBITDA to supplement GAAP financial measures. Additionally, we believe that users of these measures should consider EBITDA, EBITDAre and Adjusted EBITDA in conjunction with net income (loss) and other GAAP measures in understanding our operating results.
Funds from Operations ("FFO"), "Core FFO" and Funds Available for Distribution ("FAD") are non-GAAP financial measures. FFO is computed in accordance with the definition established by Nareit in the Nareit FFO White Paper - 2018 Restatement. Nareit defines FFO as net income (loss) (computed in accordance with GAAP), excluding depreciation and amortization expense related to real estate, gains (losses) from the sale of certain real estate assets, gains (losses) from change in control and impairment write-downs of certain real estate assets and investments in entities when the impairment is directly attributable to decreases in the value of depreciable real estate held by the entity, including our share of such adjustments for unconsolidated real estate ventures.
Core FFO represents FFO adjusted to exclude items which we believe are not representative of ongoing operating results, such as Transaction and Other Costs, gain (loss) on the extinguishment of debt, earnings (losses) and distributions in excess of our investment in unconsolidated real estate ventures, litigation costs, income (loss) from investments, amortization of the management contracts intangible and the mark-to-market of derivative instruments, including our share of such adjustments for unconsolidated real estate ventures.
FAD represents Core FFO adjusted for recurring capital expenditures and Second-generation tenant improvements and leasing commissions, net deferred rent activity, lease incentive amortization, accretion of acquired below-market leases, amortization of acquired above-market leases, recurring share-based compensation expense, amortization of debt issuance costs and other non-cash income and charges, including our share of such adjustments for unconsolidated real estate ventures. FAD is presented solely as a supplemental disclosure that management believes provides useful information as it relates to our ability to fund dividends.
7
We believe FFO, Core FFO and FAD are meaningful non-GAAP financial measures useful in comparing our levered operating performance from period-to-period and as compared to similar real estate companies because these non-GAAP measures exclude real estate depreciation and amortization expense, which implicitly assumes that the value of real estate diminishes predictably over time rather than fluctuating based on market conditions, and other non-comparable income and expenses. FFO, Core FFO and FAD do not represent cash generated from operating activities and are not necessarily indicative of cash available to fund cash requirements and should not be considered as an alternative to net income (loss) (computed in accordance with GAAP) as a performance measure or cash flow as a liquidity measure. FFO, Core FFO and FAD may not be comparable to similarly titled measures used by other companies.
"Net Debt" is a non-GAAP financial measurement. Net Debt represents our total consolidated and unconsolidated indebtedness less cash and cash equivalents at our share. Net Debt is an important component in the calculation of Net Debt to Annualized Adjusted EBITDA. We believe that Net Debt is a meaningful non-GAAP financial measure useful to investors because we review Net Debt as part of the management of our overall financial flexibility, capital structure and leverage. We may utilize a considerable portion of our cash and cash equivalents at any given time for purposes other than debt reduction. In addition, cash and cash equivalents at our share may not be solely controlled by us. The deduction of cash and cash equivalents at our share from consolidated and unconsolidated indebtedness in the calculation of Net Debt, therefore, should not be understood to mean that it is available exclusively for debt reduction at any given time.
Net Operating Income ("NOI"), "Same Store NOI" and "Annualized NOI" are non-GAAP financial measures management uses to assess an asset's performance. The most directly comparable GAAP measure is net income (loss) attributable to common shareholders. We use NOI internally as a performance measure and believe NOI, Same Store NOI and Annualized NOI provide useful information to investors regarding our financial condition and results of operations because it reflects only property related revenue (which includes base rent, tenant reimbursements and other operating revenue, net of Free Rent) less operating expenses and ground rent for operating leases, if applicable. NOI excludes deferred (straight-line) rent, commercial lease termination revenue, related party management fees, interest expense, and certain other non-cash adjustments, including the accretion of acquired below-market leases and the amortization of acquired above-market leases and below-market ground lease intangibles. Management uses NOI, which includes our proportionate share of revenue and expenses attributable to real estate ventures, as a supplemental performance measure and believes it provides useful information to investors because it reflects only those revenue and expense items that are incurred at the asset level, excluding non-cash items. In addition, NOI is considered by many in the real estate industry to be a useful starting point for determining the value of a real estate asset or group of assets. However, because NOI excludes depreciation and amortization expense and captures neither the changes in the value of our assets that result from use or market conditions, nor the level of capital expenditures and capitalized leasing commissions necessary to maintain the operating performance of our assets, all of which have real economic effect and could materially impact the financial performance of our assets, the utility of NOI as a measure of the operating performance of our assets is limited. NOI presented by us may not be comparable to NOI reported by other real estate investment trusts that define these measures differently. We believe to facilitate a clear understanding of our operating results, NOI should be examined in conjunction with net income (loss) attributable to common shareholders as presented in our consolidated financial statements. NOI should not be considered as an alternative to net income (loss) attributable to common shareholders as an indication of our performance or to cash flows as a measure of liquidity
8
or our ability to make distributions. Annualized NOI represents NOI for the three months ended September 30, 2026 multiplied by four. Management believes Annualized NOI provides useful information in understanding our financial performance over a 12-month period, however, investors and other users are cautioned against attributing undue certainty to our calculation of Annualized NOI. Actual NOI for any 12-month period will depend on a number of factors beyond our ability to control or predict, including general capital markets and economic conditions, any bankruptcy, insolvency, default or other failure to pay rent by one or more of our tenants and the destruction of one or more of our assets due to terrorist attack, natural disaster or other casualty, among others. We do not undertake any obligation to update our calculation to reflect events or circumstances occurring after the date of this earnings release. There can be no assurance that the Annualized NOI shown will reflect our actual results of operations over any 12-month period.
Definitions
"Development Pipeline" refers to owned and entitled land on which we have the potential to commence construction subject to completion of design and/or market conditions. Excludes unentitled land parcels.
"Estimated Potential Development Density" reflects management's estimate of developable gross square feet based on our current business plans with respect to real estate owned as of September 30, 2026. Our current business plans may contemplate development of less than the maximum potential development density for individual assets. As market conditions change, our business plans, and therefore, the Estimated Potential Development Density, could change accordingly. Given timing, zoning requirements and other factors, we make no assurance that Estimated Potential Development Density amounts will become actual density to the extent we complete development of assets for which we have made such estimates.
"First-generation" is a lease on space that had been vacant for at least nine months or a lease on newly delivered space.
"Free Rent" means the amount of base rent and tenant reimbursements that are abated according to the applicable lease agreement(s).
"GAAP" means accounting principles generally accepted in the United States of America.
"In-Service" refers to multifamily or commercial operating assets that are at or above 90% leased or have been operating and collecting rent for more than 12 months as of September 30, 2026.
"Non-Same Store" refers to all operating assets excluded from the Same Store pool.
"Same Store" refers to the pool of assets that were In-Service for the entirety of both periods being compared, excluding assets for which significant redevelopment, renovation or repositioning occurred during either of the periods being compared.
"Second-generation" is a lease on space that had been vacant for less than nine months.
"Transaction and Other Costs" include costs related to completed, potential and pursued transactions, and other costs, including expenses related to the Wardman Tower litigation.
"Under-Construction" refers to assets that were under construction during the period.
9
CONDENSED CONSOLIDATED BALANCE SHEETS
(Unaudited)
| in thousands | | September 30, 2026 | | December 31, 2025 |
| ||
| | | | | | | |
|
| ASSETS | | | | | | |
|
| Real estate, at cost: | | | | | | | |
| Land and improvements | | $ | 956,369 | | $ | 1,019,967 | |
| Buildings and improvements | |
| 3,882,816 | |
| 3,973,514 | |
| Construction in progress, including land | |
| 107,009 | |
| 175,673 | |
| | |
| 4,946,194 | |
| 5,169,154 | |
| Less: accumulated depreciation | |
| (1,469,388) | |
| (1,408,641) | |
| Real estate, net | |
| 3,476,806 | |
| 3,760,513 | |
| Cash and cash equivalents | |
| 78,535 | |
| 75,270 | |
| Restricted cash | |
| 25,498 | |
| 28,020 | |
| Tenant and other receivables | |
| 27,814 | |
| 21,810 | |
| Deferred rent receivable | |
| 180,748 | |
| 182,891 | |
| Investments in unconsolidated real estate ventures | |
| 114,545 | |
| 105,711 | |
| Deferred leasing costs, net | | | 52,962 | | | 66,356 | |
| Intangible assets, net | | | 10,403 | | | 30,333 | |
| Other assets, net | |
| 149,629 | |
| 117,287 | |
| Assets held for sale | | | 84,278 | | | — | |
| TOTAL ASSETS | | $ | 4,201,218 | | $ | 4,388,191 | |
| | | | | | | | |
| LIABILITIES, REDEEMABLE NONCONTROLLING INTERESTS AND EQUITY | |
| | |
| | |
| Liabilities: | |
| | |
| | |
| Mortgage loans, net | | $ | 1,602,125 | | $ | 1,579,158 | |
| Revolving credit facility | |
| 222,000 | |
| 205,000 | |
| Term loans, net | |
| 733,311 | |
| 718,408 | |
| Accounts payable and accrued expenses | |
| 72,941 | |
| 84,748 | |
| Other liabilities, net | |
| 99,036 | |
| 131,945 | |
| Liabilities related to assets held for sale | |
| 6,268 | |
| — | |
| Total liabilities | |
| 2,735,681 | |
| 2,719,259 | |
| Commitments and contingencies | |
| | |
| | |
| Redeemable noncontrolling interests | |
| 449,300 | |
| 511,342 | |
| Total equity | |
| 1,016,237 | |
| 1,157,590 | |
| TOTAL LIABILITIES, REDEEMABLE NONCONTROLLING INTERESTS AND EQUITY | | $ | 4,201,218 | | $ | 4,388,191 | |
Note: For complete financial statements, please refer to our Quarterly Report on Form 10-Q for the quarter ended September 30, 2026.
10
CONDENSED CONSOLIDATED STATEMENTS OF OPERATIONS
(Unaudited)
in thousands, except per share data | | Three Months Ended September 30, | | Nine Months Ended September 30, | ||||||||
| | 2026 | | 2025 | | 2026 | | 2025 | ||||
REVENUE | | | | | | | | | | | | |
Property rental | | $ | 108,082 | | $ | 103,981 | | $ | 320,570 | | $ | 311,989 |
Third-party real estate services, including reimbursements | |
| 18,270 | |
| 14,711 | |
| 52,480 | |
| 44,430 |
Other revenue | |
| 6,061 | |
| 5,178 | |
| 16,340 | |
| 14,616 |
Total revenue | |
| 132,413 | |
| 123,870 | |
| 389,390 | |
| 371,035 |
EXPENSES | |
| | |
| | |
| | |
| |
Depreciation and amortization | |
| 44,589 | |
| 48,164 | |
| 134,685 | |
| 143,311 |
Property operating | |
| 39,950 | |
| 36,564 | |
| 112,132 | |
| 104,876 |
Real estate taxes | |
| 10,335 | |
| 12,284 | |
| 34,690 | |
| 37,107 |
General and administrative: | |
| | |
| | |
| | |
| |
Corporate and other | |
| 12,546 | |
| 13,214 | |
| 43,237 | |
| 45,491 |
Third-party real estate services | |
| 16,440 | |
| 14,058 | |
| 49,802 | |
| 43,691 |
Transaction and other costs | |
| 964 | |
| 494 | |
| 11,490 | |
| 5,251 |
Total expenses | |
| 124,824 | |
| 124,778 | |
| 386,036 | |
| 379,727 |
OTHER INCOME (EXPENSE) | |
| | |
| | |
| | |
| |
Loss from unconsolidated real estate ventures, net | |
| (237) | |
| (664) | |
| (1,197) | |
| (165) |
Interest and other income, net | |
| 760 | |
| 2,378 | |
| 6,818 | |
| 3,601 |
Interest expense | |
| (36,838) | |
| (34,781) | |
| (108,415) | |
| (105,552) |
Gain (loss) on the sale of real estate, net | |
| (213) | |
| 4,660 | |
| 20,577 | |
| 47,029 |
Loss on the extinguishment of debt, net | |
| (2,107) | |
| — | |
| (2,107) | |
| (2,402) |
Impairment loss | | | (69,175) | | | (4,771) | | | (114,740) | | | (45,067) |
Total other income (expense) | |
| (107,810) | |
| (33,178) | |
| (199,064) | |
| (102,556) |
LOSS BEFORE INCOME TAX EXPENSE | |
| (100,221) | |
| (34,086) | |
| (195,710) | |
| (111,248) |
Income tax expense | |
| — | |
| (926) | |
| (7) | |
| (643) |
NET LOSS | |
| (100,221) | |
| (35,012) | |
| (195,717) | |
| (111,891) |
Net loss attributable to redeemable noncontrolling interests | |
| 18,262 | |
| 6,457 | |
| 35,993 | |
| 18,375 |
Net income attributable to noncontrolling interests | | | (47) | |
| — | | | (134) | | | — |
NET LOSS ATTRIBUTABLE TO COMMON SHAREHOLDERS | | $ | (82,006) | | $ | (28,555) | | $ | (159,858) | | $ | (93,516) |
LOSS PER COMMON SHARE - BASIC AND DILUTED | | $ | (1.41) | | $ | (0.48) | | $ | (2.75) | | $ | (1.35) |
WEIGHTED AVERAGE NUMBER OF COMMON SHARES OUTSTANDING - BASIC AND DILUTED | |
| 58,635 | |
| 60,606 | |
| 58,662 | |
| 70,062 |
Note: For complete financial statements, please refer to our Quarterly Report on Form 10-Q for the quarter ended September 30, 2026.
11
EBITDA, EBITDAre AND ADJUSTED EBITDA RECONCILIATIONS (NON-GAAP)
(Unaudited)
| dollars in thousands | | Three Months Ended September 30, | | Nine Months Ended September 30, |
| ||||||||
| | | 2026 | | 2025 | | 2026 | | 2025 |
| ||||
| | | | | | | | | | | | | |
|
| EBITDA, EBITDAre and Adjusted EBITDA |
| | | | | | | | | | | | |
| Net loss | | $ | (100,221) | | $ | (35,012) | | $ | (195,717) | | $ | (111,891) | |
| Depreciation and amortization expense | | | 44,589 | | | 48,164 | | | 134,685 | | | 143,311 | |
| Interest expense | | | 36,838 | | | 34,781 | | | 108,415 | | | 105,552 | |
| Income tax expense | | | — | | | 926 | | | 7 | | | 643 | |
| Unconsolidated real estate ventures allocated share of above adjustments | | | 1,555 | | | 1,853 | | | 4,677 | | | 5,470 | |
| EBITDA attributable to noncontrolling interests in consolidated real estate ventures | | | (1,429) | | | (905) | | | (3,732) | | | (1,175) | |
| EBITDA | | $ | (18,668) | | $ | 49,807 | | $ | 48,335 | | $ | 141,910 | |
| (Gain) loss on the sale of real estate, net | | | 213 | | | (4,660) | | | (20,577) | | | (47,029) | |
| Pro rata share of (gain) loss on the sale of unconsolidated real estate assets | | | — | | | — | | | 39 | | | (1,500) | |
| Impairment loss related to real estate | | | 69,175 | | | 4,771 | | | 114,740 | | | 45,067 | |
| | | | | | | | | | | | | | |
| EBITDAre | | $ | 50,720 | | $ | 49,918 | | $ | 142,537 | | $ | 138,448 | |
| Transaction and other costs, net of noncontrolling interests (1) | | | 958 | | | 494 | | | 11,350 | | | 5,251 | |
| Litigation costs (2) | | | 153 | | | — | | | 833 | | | 2,500 | |
| Income from investments, net | | | (328) | | | (2,232) | | | (4,527) | | | (1,954) | |
| Loss on the extinguishment of debt, net | | | 2,107 | | | — | | | 2,107 | | | 2,402 | |
| Earnings and distributions in excess of our investment in unconsolidated real estate venture | | | — | | | (173) | | | — | | | (574) | |
| Unconsolidated real estate ventures allocated share of above adjustments | | | (9) | | | — | | | 208 | | | — | |
| | | | | | | | | | | | | | |
| Adjusted EBITDA | | $ | 53,601 | | $ | 48,007 | | $ | 152,508 | | $ | 146,073 | |
| | | | | | | | | | | | | | |
| Net Debt to Annualized Adjusted EBITDA (3) | | | 11.6 | x | | 12.6 | x | | 12.3 | x | | 12.4 | x |
| | | | | | | | | | | | | | |
| | | | | | | | | September 30, 2026 | | September 30, 2025 | | ||
| Net Debt (at JBG SMITH Share) | | | | | | | | | | | | | |
| Consolidated indebtedness (4) | | | | | | | | $ | 2,536,421 | | $ | 2,451,155 | |
| Unconsolidated indebtedness (4) | | | | | | | | | 33,983 | | | 34,248 | |
| Total consolidated and unconsolidated indebtedness | | | | | | | | | 2,570,404 | | | 2,485,403 | |
| Less: cash and cash equivalents | | | | | | | | | 77,692 | | | 65,859 | |
| Net Debt (at JBG SMITH Share) | | | | | | | | $ | 2,492,712 | | $ | 2,419,544 | |
Note: All EBITDA measures as shown above are attributable to common limited partnership units ("OP Units") and certain fully vested incentive equity awards that may be convertible into OP Units. The prior year EBITDAre amounts have been restated to conform to the current year presentation. There was no change to EBITDA or Adjusted EBITDA.
| (1) | Includes costs related to completed, potential and pursued transactions, and other costs, including expenses related to the Wardman Tower litigation. |
| (2) | Included in “Corporate and other general and administrative expense” in the Condensed Consolidated Statements of Operations. |
| (3) | Quarterly Adjusted EBITDA is annualized by multiplying by four. Adjusted EBITDA for the nine months ended September 30, 2026 and 2025 is annualized by multiplying by 1.33. |
| (4) | Net of premium/discount and deferred financing costs. |
12
FFO, CORE FFO AND FAD RECONCILIATIONS (NON-GAAP)
(Unaudited)
| in thousands, except per share data | Three Months Ended September 30, | | Nine Months Ended September 30, |
| ||||||||
| | 2026 | | 2025 | XX | 2026 | | 2025 | | ||||
| | | | | | | | | | | | | |
| FFO and Core FFO | | | | | | | | | | | | |
| Net loss attributable to common shareholders | $ | (82,006) |
| $ | (28,555) | | $ | (159,858) |
| $ | (93,516) | |
| Net loss attributable to redeemable noncontrolling interests |
| (18,262) |
| | (6,457) | |
| (35,993) |
| | (18,375) | |
| Net income attributable to noncontrolling interests |
| 47 |
| | — | |
| 134 |
| | — | |
| Net loss |
| (100,221) |
| | (35,012) | |
| (195,717) |
| | (111,891) | |
| (Gain) loss on the sale of real estate, net |
| 213 |
| | (4,660) | |
| (20,577) |
| | (47,029) | |
| Pro rata share of (gain) loss on the sale of unconsolidated real estate assets |
| — |
| | — | |
| 39 |
| | (1,500) | |
| Real estate depreciation and amortization |
| 44,305 |
| | 47,837 | |
| 133,832 |
| | 140,306 | |
| Impairment loss related to real estate | | 69,175 | | | 4,771 | | | 114,740 | | | 45,067 | |
| Pro rata share of real estate depreciation and amortization from unconsolidated real estate ventures |
| 970 |
| | 777 | |
| 2,919 |
| | 2,342 | |
| FFO attributable to noncontrolling interests in consolidated real estate ventures |
| (1,245) |
| | (905) | |
| (3,425) |
| | (1,175) | |
| FFO Attributable to OP Units | $ | 13,197 |
| $ | 12,808 | | $ | 31,811 |
| $ | 26,120 | |
| FFO attributable to redeemable noncontrolling interests |
| (2,790) |
| | (2,679) | |
| (6,808) |
| | (5,217) | |
| FFO Attributable to Common Shareholders | $ | 10,407 |
| $ | 10,129 | | $ | 25,003 |
| $ | 20,903 | |
| | | | | | | | | | | | | |
| FFO attributable to OP Units | $ | 13,197 |
| $ | 12,808 | | $ | 31,811 |
| $ | 26,120 | |
| Transaction and other costs, net of noncontrolling interests (1) |
| 958 |
| | 494 | |
| 11,350 |
| | 5,251 | |
| Litigation costs (2) | | 153 | | | — | | | 833 | | | 2,500 | |
| Income from investments, net of tax | | (328) | | | (1,691) | | | (4,527) | | | (1,480) | |
| Gain from mark-to-market on derivative instruments |
| (21) |
| | (3) | |
| (37) |
| | (59) | |
| Loss on the extinguishment of debt, net |
| 2,107 |
| | — | |
| 2,107 |
| | 2,402 | |
| Earnings and distributions in excess of our investment in unconsolidated real estate venture |
| — |
| | (173) | |
| — |
| | (574) | |
| Amortization of management contracts intangible, net of tax |
| 74 |
| | 74 | |
| 221 |
| | 1,752 | |
| Unconsolidated real estate ventures allocated share of above adjustments |
| (9) |
| | (2) | |
| 208 |
| | (2) | |
| Core FFO Attributable to OP Units | $ | 16,131 |
| $ | 11,507 | | $ | 41,966 |
| $ | 35,910 | |
| Core FFO attributable to redeemable noncontrolling interests |
| (3,410) |
| | (2,407) | |
| (8,990) |
| | (6,898) | |
| Core FFO Attributable to Common Shareholders | $ | 12,721 |
| $ | 9,100 | | $ | 32,976 |
| $ | 29,012 | |
| FFO per common share - diluted | $ | 0.18 |
| $ | 0.17 | | $ | 0.42 |
| $ | 0.30 | |
| Core FFO per common share - diluted | $ | 0.22 |
| $ | 0.15 | | $ | 0.56 |
| $ | 0.41 | |
| Weighted average shares - diluted (FFO and Core FFO) |
| 58,807 |
| | 60,965 | |
| 58,872 |
| | 70,272 | |
See footnotes on page 14.
13
FFO, CORE FFO AND FAD RECONCILIATIONS (NON-GAAP)
(Unaudited)
| in thousands, except per share data | | Three Months Ended September 30, | | Nine Months Ended September 30, |
| ||||||||
| | | 2026 | | 2025 | | 2026 | | 2025 | | ||||
| | | | | | | | | | | | | | |
| FAD | | | | | | | | | | | | | |
| Core FFO attributable to OP Units | | $ | 16,131 | | $ | 11,507 | | $ | 41,966 | | $ | 35,910 | |
| Recurring capital expenditures and Second-generation tenant improvements and leasing commissions, at share | |
| (6,915) | |
| (9,851) | |
| (16,022) | |
| (30,737) | |
| Straight-line and other rent adjustments (3) | |
| (2,129) | |
| 1,561 | |
| (6,774) | |
| 4,071 | |
| Share-based compensation expense | |
| 5,316 | |
| 4,808 | |
| 22,093 | |
| 18,685 | |
| Amortization of debt issuance costs | |
| 3,168 | |
| 3,554 | |
| 9,335 | |
| 11,389 | |
| Unconsolidated real estate ventures allocated share of above adjustments | |
| 105 | |
| 321 | |
| 276 | |
| 676 | |
| Non-real estate depreciation and amortization | |
| 209 | |
| 250 | |
| 631 | |
| 759 | |
| FAD Available to OP Units (A) | | $ | 15,885 | | $ | 12,150 | | $ | 51,505 | | $ | 40,753 | |
| Distributions to common shareholders and unitholders (B) | | $ | 13,133 | | $ | 13,712 | | $ | 39,414 | | $ | 46,654 | |
| FAD Payout Ratio (B÷A) (4) | |
| 82.7 | % |
| 112.9 | % |
| 76.5 | % |
| 114.5 | % |
| | | | | | | | | | | | | | |
| Capital Expenditures | | | | | | | | | | | | | |
| Maintenance and recurring capital expenditures | | $ | 3,965 | | $ | 4,059 | | $ | 9,715 | | $ | 10,915 | |
| Share of maintenance and recurring capital expenditures from unconsolidated real estate ventures | |
| 3 | |
| 9 | |
| 7 | |
| 18 | |
| Second-generation tenant improvements and leasing commissions | |
| 2,905 | |
| 5,646 | |
| 6,258 | |
| 19,410 | |
| Share of Second-generation tenant improvements and leasing commissions from unconsolidated real estate ventures | |
| 42 | |
| 137 | |
| 42 | |
| 394 | |
| Recurring capital expenditures and Second-generation tenant improvements and leasing commissions | |
| 6,915 | |
| 9,851 | |
| 16,022 | |
| 30,737 | |
| Non-recurring capital expenditures | |
| 6,485 | |
| 11,487 | |
| 17,884 | |
| 25,638 | |
| Share of non-recurring capital expenditures from unconsolidated real estate ventures | |
| — | |
| 8 | |
| — | |
| 8 | |
| First-generation tenant improvements and leasing commissions | |
| 5,500 | |
| 1,660 | |
| 15,856 | |
| 7,580 | |
| Share of First-generation tenant improvements and leasing commissions from unconsolidated real estate ventures | |
| — | |
| 136 | |
| 73 | |
| 219 | |
| Non-recurring capital expenditures and First-generation tenant improvements and leasing commissions | |
| 11,985 | |
| 13,291 | |
| 33,813 | |
| 33,445 | |
| Total JBG SMITH Share of Capital Expenditures | | $ | 18,900 | | $ | 23,142 | | $ | 49,835 | | $ | 64,182 | |
Note: The prior year FFO amounts have been restated to conform to the current year presentation. There was no change to Core FFO.
| (1) | Includes costs related to completed, potential and pursued transactions, and other costs, including expenses related to the Wardman Tower litigation. |
| (2) | Included in “Corporate and other general and administrative expense” in the Condensed Consolidated Statements of Operations. |
| (3) | Includes straight-line rent, above/below market lease amortization/accretion and lease incentive amortization. |
| (4) | The quarterly FAD payout ratio is not necessarily indicative of an amount for the full year due to fluctuation in the timing of capital expenditures, the commencement of new leases and the seasonality of our operations. |
14
NOI RECONCILIATIONS (NON-GAAP)
(Unaudited)
| dollars in thousands | | Three Months Ended September 30, | | Nine Months Ended September 30, |
| ||||||||
| | | 2026 | | 2025 | | 2026 | | 2025 | | ||||
| | | | | | | | | | | | | | |
| Net loss attributable to common shareholders | | $ | (82,006) | | $ | (28,555) | | $ | (159,858) | | $ | (93,516) | |
| Net loss attributable to redeemable noncontrolling interests | |
| (18,262) | |
| (6,457) | |
| (35,993) | |
| (18,375) | |
| Net income attributable to noncontrolling interests | | | 47 | |
| — | | | 134 | | | — | |
| Net loss | | | (100,221) | | | (35,012) | | | (195,717) | | | (111,891) | |
| Add: | |
| | |
| | |
| | |
| | |
| Depreciation and amortization expense | |
| 44,589 | |
| 48,164 | |
| 134,685 | |
| 143,311 | |
| General and administrative expense: | |
| | |
| | |
| | |
| | |
| Corporate and other | |
| 12,546 | |
| 13,214 | |
| 43,237 | |
| 45,491 | |
| Third-party real estate services | |
| 16,440 | |
| 14,058 | |
| 49,802 | |
| 43,691 | |
| Transaction and other costs | |
| 964 | |
| 494 | |
| 11,490 | |
| 5,251 | |
| Interest expense | |
| 36,838 | |
| 34,781 | |
| 108,415 | |
| 105,552 | |
| Loss on the extinguishment of debt, net | |
| 2,107 | |
| — | |
| 2,107 | |
| 2,402 | |
| Impairment loss | | | 69,175 | | | 4,771 | | | 114,740 | | | 45,067 | |
| Income tax expense | |
| — | |
| 926 | |
| 7 | |
| 643 | |
| Less: | |
| | |
| | |
| | |
| | |
| Third-party real estate services, including reimbursements revenue | |
| 18,270 | |
| 14,711 | |
| 52,480 | |
| 44,430 | |
| Loss from unconsolidated real estate ventures, net | |
| (237) | |
| (664) | |
| (1,197) | |
| (165) | |
| Interest and other income, net | |
| 760 | |
| 2,378 | |
| 6,818 | |
| 3,601 | |
| Gain (loss) on the sale of real estate, net | |
| (213) | |
| 4,660 | |
| 20,577 | |
| 47,029 | |
| | | | | | | | | | | | | | |
| Adjustments: | | | | | | | | | | | | | |
| NOI attributable to unconsolidated real estate ventures at our share | |
| 1,293 | |
| 1,012 | |
| 3,690 | |
| 3,289 | |
| Real estate venture partners' share of NOI attributable to consolidated real estate ventures | | | (1,580) | | | (915) | | | (4,203) | | | (1,187) | |
| Non-cash rent adjustments (1) | |
| (2,129) | |
| 1,561 | |
| (6,774) | |
| 4,071 | |
| Other adjustments (2) | |
| 1,794 | |
| (3,083) | |
| 2,433 | |
| (984) | |
| Total adjustments | |
| (622) | |
| (1,425) | |
| (4,854) | |
| 5,189 | |
| NOI | | $ | 63,236 | | $ | 58,886 | | $ | 185,234 | | $ | 189,811 | |
| Less: out-of-service NOI loss (3) | |
| (875) | |
| (1,677) | |
| (3,628) | |
| (5,366) | |
| Operating Portfolio NOI | | $ | 64,111 | | $ | 60,563 | | $ | 188,862 | | $ | 195,177 | |
| Non-Same Store NOI (4) | |
| 3,342 | |
| 1,743 | |
| 24,898 | |
| 27,351 | |
| Same Store NOI (5) | | $ | 60,769 | | $ | 58,820 | | $ | 163,964 | | $ | 167,826 | |
| | | | | | | | | | | | | | |
| Change in Same Store NOI | | | 3.3 | % | | | |
| (2.3) | % |
| | |
| Number of properties in Same Store pool | | | 35 | | | | |
| 32 | |
| | |
| (1) | Adjustment to exclude deferred (straight-line) rent, above/below market lease amortization/accretion and lease incentive amortization. |
| (2) | Adjustment to exclude commercial lease termination revenue, related party management fees and corporate entity activity. |
| (3) | Includes the results of our Under-Construction assets, assets in the Development Pipeline, and other land assets. |
| (4) | Includes the results of properties that were not In-Service for the entirety of both periods being compared, including disposed properties, and properties for which significant redevelopment, renovation or repositioning occurred during either of the periods being compared. |
| (5) | Includes the results of the properties that are owned, operated and In-Service for the entirety of both periods being compared. |
15

TABLE OF CONTENTS | SEPTEMBER 30, 2026 |
Table of Contents
| Page |
Overview | |
3-5 | |
6 | |
7 | |
8 | |
Financial Information | |
9 | |
10 | |
Unconsolidated Real Estate Ventures - Balance Sheet and Operating Information | 11 |
12 | |
EBITDA, EBITDAre and Adjusted EBITDA Reconciliations (Non-GAAP) | 13 |
14-15 | |
16 | |
Pro Rata Adjusted General and Administrative Expenses (Non-GAAP) | 17 |
18 | |
19 | |
20 | |
21 | |
Leasing Activity | |
22 | |
23 | |
24 | |
25 | |
26 | |
27 | |
Property Data | |
Property Tables: | |
28-29 | |
30-31 | |
32 | |
33 | |
34 | |
Debt | |
35 | |
37-37 | |
39-42 | |
Appendix – Interest Expense and NOI Reconciliations (Non-GAAP) | 43-44 |
| | Page 2 |
Disclosures
Certain statements contained herein may constitute "forward-looking statements" as such term is defined in Section 27A of the Securities Act of 1933, as amended, and Section 21E of the Securities Exchange Act of 1934, as amended. Forward-looking statements are not guarantees of performance. They represent our intentions, plans, expectations and beliefs and are subject to numerous assumptions, risks and uncertainties. Consequently, the future results, financial condition and business of JBG SMITH Properties ("JBG SMITH," the "Company," "we," "us," "our" or similar terms) may differ materially from those expressed in these forward-looking statements. You can find many of these statements by looking for words such as "approximate," "hypothetical," "potential," "believes," "expects," "anticipates," "estimates," "intends," "plans," "would," "may" or similar expressions in this Investor Package. We also note the following forward-looking statements: whether demand in the multifamily and office sectors, including in the Washington DC region, will continue to improve and the expected timeline for such improvement; whether our new leasing and lease rollover rates will perform as anticipated; whether the Washington DC region will return to more typical labor market conditions; the impact of the federal budget, including defense and intelligence spending on our demand drivers, leasing pipeline and the Washington DC region; the ability of our National Landing assets to capture growth and demand from defense and technology companies; potential Net Operating Income growth and the assumptions on which such growth is premised; our estimated future leverage profile and our ability to moderate our leverage; trends in occupancy, supply and demand for housing (including multifamily) and the ability of constrained supply to drive occupancy and rent growth; whether we will be well-positioned to weather volatility and capitalize on rent growth, land sales, asset recycling, ground leases, and joint ventures; the timeline to complete asset recycling and the impact of reducing competitive stock in National Landing; whether high levels of office inventory removal and limited new office projects will benefit our portfolio; whether the strength of our prospective tenant pipeline will result in increases in new leasing activity; whether our expected contractual annualized rent will commence on the timeline anticipated; whether we will experience an improvement in the retention rate of our office and residential tenants (including in National Landing); annualized Net Operating Income; adjusted and expected annualized Net Operating Income; the ability of any or all of our demand drivers to materialize and increase performance of, foot traffic around, and demand for our multifamily and commercial portfolios in the Northern Virginia submarket (including National Landing); whether the value of our portfolio holdings will increase due to their location, demand drivers, our placemaking efforts and use diversification; whether we will be successful in our efforts to repurchase shares; whether we will succeed in recycling our assets to fund new investments, including development projects, acquisitions, distressed office investments and other opportunistic investments in partnership with third-party capital, and share repurchases; whether we will be able to recapitalize certain assets and generate incremental fee revenue and carried interest income through joint ventures with third-party investors; the returns from our capital allocation strategy; the expected impact of rising interest rates on our capital allocation strategy; our beliefs regarding our competitive advantages, including our capital allocation strategy over multiple cycles and ability to offer Sensitive Compartmented Information Facilities for tenants; whether our assets can be disposed of for values at or above NAV; whether in the case of our Under-Construction assets and assets in our development pipeline, estimated square feet, estimated number of units, timeline, Estimated Incremental Investment, Estimated Total Investment, Projected NOI Yield and Estimated Stabilized NOI are accurate; whether our Under-Construction assets will deliver the Annualized NOI that we anticipate; whether the estimated square feet in our Development Pipeline is accurate; and whether the number of multifamily units and retailers in Northern Virginia (including National Landing) will increase to the levels anticipated or open on the timelines anticipated.
Many of the factors that will determine the outcome of these and our other forward-looking statements are beyond our ability to control or predict. These factors include, among others: adverse economic conditions in the Washington, DC metropolitan area, including reductions in federal government spending, headcount, or leasing, trends in multifamily housing demand in the Washington, DC metropolitan area, the impacts and ultimate outcome of the Wardman Tower litigation, the potential need for one or more bonds to be posted by the defendants and the extent to which we would be required to collateralize any portion of such bonds in connection with the Wardman Tower litigation, the timing of and costs associated with development and property improvements, financing commitments, and general competitive factors. For further discussion of factors that could materially affect the outcome of our forward-looking statements and other risks and uncertainties, see "Risk Factors," "Management's Discussion and Analysis of Financial Condition and Results of Operations" and the Cautionary Statement Concerning Forward-Looking Statements in the Company's Annual Report on Form 10-K for the year ended December 31, 2025 and other periodic reports the Company files with the Securities and Exchange Commission. For these statements, we claim the protection of the safe harbor for forward-looking statements contained in the Private Securities Litigation Reform Act of 1995. You are cautioned not to place undue reliance on our forward-looking statements. All subsequent written and oral forward-looking statements attributable to us or any person acting on our behalf are expressly qualified in their entirety by the cautionary statements contained or referred to in this section. We do not undertake any obligation to release publicly any revisions to our forward-looking statements to reflect events or circumstances occurring after the date hereof.
| | Page 3 |
Organization and Basis of Presentation
JBG SMITH, a Maryland real estate investment trust, owns, operates, and develops mixed-use properties concentrated in amenity-rich, Metro-served submarkets in and around Washington, DC, most notably National Landing, where through our focus on placemaking, we cultivate vibrant, highly amenitized, walkable neighborhoods. JBG SMITH's portfolio at share comprises 11.8 million square feet of multifamily, office, and retail assets, and a 3.5 million square-foot development pipeline. In addition, our third-party real estate services business provides fee-based real estate services.
The information contained in this Investor Package does not purport to disclose all items required by the accounting principles generally accepted in the United States of America ("GAAP") and is unaudited information, unless otherwise indicated.
Pro Rata Information
We present certain financial information and metrics in this Investor Package "at JBG SMITH Share," which refers to our ownership percentage of consolidated and unconsolidated assets in real estate ventures (collectively, "real estate ventures") as applied to these financial measures and metrics. Financial information "at JBG SMITH Share" is calculated on an asset-by-asset basis by applying our percentage economic interest to each applicable line item of that asset's financial information. "At JBG SMITH Share" information, which we also refer to as being "at share," "our pro rata share" or "our share," is not, and is not intended to be, a presentation in accordance with GAAP. Given that a portion of our assets are held through real estate ventures, we believe this form of presentation, which presents our economic interests in the partially owned entities, provides investors valuable information regarding a significant component of our portfolio, its composition, performance and capitalization.
We do not control the unconsolidated real estate ventures and do not have a legal claim to our co-venturers' share of assets, liabilities, revenue and expenses. The operating agreements of the unconsolidated real estate ventures generally allow each co-venturer to receive cash distributions to the extent there is available cash from operations. The amount of cash each investor receives is based upon specific provisions of each operating agreement and varies depending on certain factors including the amount of capital contributed by each investor and whether any investors are entitled to preferential distributions.
With respect to any such third-party arrangement, we would not be in a position to exercise sole decision-making authority regarding the property, real estate venture or other entity, and may, under certain circumstances, be exposed to economic risks not present were a third-party not involved. We and our respective co-venturers may each have the right to trigger a buy-sell or forced sale arrangement, which could cause us to sell our interest, or acquire our co-venturers' interests, or to sell the underlying asset, either on unfavorable terms or at a time when we otherwise would not have initiated such a transaction. Our real estate ventures may be subject to debt, and the repayment or refinancing of such debt may require equity capital calls. To the extent our co-venturers do not meet their obligations to us or our real estate ventures, or they act inconsistent with the interests of the real estate venture, we may be adversely affected. Because of these limitations, the non-GAAP "at JBG SMITH Share" financial information should not be considered in isolation or as a substitute for our consolidated financial statements as reported under GAAP.
Occupancy, non-GAAP financial measures, leverage metrics, operating assets and operating metrics presented in this Investor Package exclude our 33.5% subordinated interest in four commercial buildings, as well as the associated non-recourse mortgage loans, held through an unconsolidated real estate venture, as our investment in the real estate venture is zero, we do not anticipate receiving any near-term cash flow distributions from the real estate venture, and we have not guaranteed its obligations or otherwise committed to providing financial support.
| | Page 4 |
Definitions
See pages 38-41 for definitions of terms used in this Investor Package.
Non-GAAP Measures
This Investor Package includes non-GAAP measures. For these measures, we have provided an explanation of how these non-GAAP measures are calculated and why our management believes that the presentation of these measures provides useful information to investors regarding our financial condition and results of operations. Reconciliations of certain non-GAAP measures to the most directly comparable GAAP financial measure are included in this Investor Package. Our presentation of non-GAAP financial measures may not be comparable to similar non-GAAP measures used by other companies.
In addition to "at share" financial information, the following non-GAAP measures are included in this Investor Package:
| ● | Earnings Before Interest, Taxes, Depreciation and Amortization ("EBITDA") |
| ● | EBITDA for Real Estate ("EBITDAre") |
| ● | Adjusted EBITDA |
| ● | Funds from Operations ("FFO") |
| ● | Core FFO |
| ● | Funds Available for Distribution ("FAD") |
| ● | Third-Party Real Estate Services Business |
| ● | Pro Rata Adjusted General and Administrative Expenses |
| ● | Net Operating Income ("NOI") |
| ● | Annualized NOI |
| ● | Estimated Stabilized NOI |
| ● | Projected NOI Yield |
| ● | Same Store NOI |
| ● | Consolidated and Unconsolidated Indebtedness |
| ● | Consolidated and Unconsolidated Interest Expense |
| ● | Net Debt |
| ● | Historical Cost |
| | Page 5 |
COMPANY PROFILE | SEPTEMBER 30, 2026 |
Executive Officers | | Company Snapshot as of September 30, 2026 | |||||||
| | | | | | | | | |
W. Matthew Kelly | | Chairman and Chief Executive Officer | | | Exchange/ticker | | | NYSE: JBGS | |
M. Moina Banerjee |
| Co-President and Chief Financial Officer |
| | Indicated annual dividend per share (1) | | $ | 0.70 | |
George L. Xanders | | Co-President and Chief Investment Officer |
| | Dividend yield | |
| 7.0 | % |
Evan Regan-Levine | | Chief Strategy Officer |
| | | |
| | |
Steven A. Museles |
| Chief Legal Officer |
| | Total Enterprise Value (dollars in millions, except share price) | |
| | |
| | |
| | Common share price | | $ | 10.04 | |
| | |
| | Common shares and common limited partnership units ("OP Units") | |
| 71,537 | |
| | |
| | Total market capitalization | | $ | 718.2 | |
| | |
| | Total consolidated and unconsolidated indebtedness at JBG SMITH Share | |
| 2,570.4 | |
| | |
| | Less: cash and cash equivalents at JBG SMITH Share | |
| (77.7) | |
| | |
| | Net Debt | | $ | 2,492.7 | |
| | |
| | Total Enterprise Value | | $ | 3,210.9 | |
| (1) | Based on the latest dividend declaration. |
| (2) | Includes certain fully vested incentive equity awards that may be convertible into OP Units. |
| | Page 6 |
FINANCIAL HIGHLIGHTS | SEPTEMBER 30, 2026 |
| dollars in thousands, except per share data | | Three Months Ended | | | Nine Months Ended | | ||
| | | September 30, 2026 | | | September 30, 2026 | | ||
| | | | | | | | | |
| Summary Financial Results | | | | | | | | |
| Total revenue | | $ | 132,413 | | | $ | 389,390 | |
| Net loss attributable to common shareholders | | $ | (82,006) | | | $ | (159,858) | |
| Per diluted common share | | $ | (1.41) | | | $ | (2.75) | |
| Operating portfolio NOI | | $ | 64,111 | | | $ | 188,862 | |
| FFO (1) | | $ | 13,197 | | | $ | 31,811 | |
| Core FFO (1) | | $ | 16,131 | | | $ | 41,966 | |
| FAD (1) | | $ | 15,885 | | | $ | 51,505 | |
| FAD payout ratio | |
| 82.7 | % | |
| 76.5 | % |
| EBITDA (1) | | $ | (18,668) | | | $ | 48,335 | |
| EBITDAre (1) | | $ | 50,720 | | | $ | 142,537 | |
| Adjusted EBITDA (1) | | $ | 53,601 | | | $ | 152,508 | |
| Net Debt to Annualized Adjusted EBITDA | |
| 11.6 | x | |
| 12.3 | x |
| | | | | | | | | |
| | | | | | | September 30, 2026 | | |
| | | | | | | | | |
| Debt Summary (at JBG SMITH Share) | | | | | |
| | |
| Total consolidated indebtedness (2) | | | | | | $ | 2,536,421 | |
| Total consolidated and unconsolidated indebtedness (2) | | | | | | $ | 2,570,404 | |
| Weighted average interest rates: | | | | | |
| | |
| Variable rate debt (3) | | | | | |
| 5.36 | % |
| Fixed rate debt | | | | | |
| 4.99 | % |
| Total debt | | | | | |
| 5.11 | % |
| Cash and cash equivalents | | | | | | $ | 77,692 | |
| (1) | Attributable to OP Units, which include units owned by JBG SMITH, and certain incentive equity awards that may be convertible into OP Units. |
| (2) | Net of premium/discount and deferred financing costs. |
| (3) | For floating rate loans with interest rate caps, the weighted average interest rate cap strike for consolidated debt and debt at JBG SMITH Share was 3.20% and 3.29%, and the weighted average maturity date of the interest rate caps is in Q2 2027. The interest rate cap strike is exclusive of the credit spreads associated with the loans. |
| | Page 7 |
PORTFOLIO OVERVIEW | SEPTEMBER 30, 2026 |
| dollars in thousands | | | | 100% Share | | At JBG SMITH Share | |||||||||||
| | | | | | | | | | | | | | | | | | |
| | | | | | | | | | | | | | | | | | |
| | | | | | | | | | | | | | | | | ||
| | | Number of | | Units / | | Units / | | % | | % | | Annualized | | Annualized | | ||
| | | Assets | | Square Feet | | Square Feet | | Leased | | Occupied (1) | | Rent | | NOI (2) | | ||
| | | | | | | | | | | | | | | | | | |
| Operating | | | | | | | | | | | | | | | | | |
| Multifamily (3) |
| |
| |
| |
| |
| | |
| | |
| | |
| National Landing | | 7 | | 4,084 | | 4,084 | | 93.6% | | 91.9% | | $ | 116,706 | | $ | 73,876 | |
| DC | | 7 | | 2,080 | | 1,894 | | 94.6% | | 93.6% | | | 61,907 | | | 31,076 | |
| In-Service |
| 14 |
| 6,164 | | 5,978 |
| 93.9% | | 92.5% | | | 178,613 | | | 104,952 | |
| Recently Delivered |
| 1 |
| 355 | | 355 | | 76.8% | | 76.1% | | | 10,988 | | | 4,988 | |
| Multifamily – total / weighted average |
| 15 |
| 6,519 |
| 6,333 |
| 92.9% | | 91.5% | | $ | 189,601 | | $ | 109,940 | |
| | | | | | | | | | | | | | | | | | |
| Commercial | | | | | | | | | | | | | | | | | |
| National Landing Unlevered | | 13 | | 4,444,965 | | 4,444,965 | | 77.8% | | 75.2% | | $ | 158,309 | | $ | 94,784 | |
| National Landing Levered | | 3 | | 997,031 | | 997,031 | | 85.2% | | 84.7% | | | 33,282 | | | 24,628 | |
| Other | | 6 | | 1,882,632 | | 1,252,264 | | 75.9% | | 76.0% | | | 43,907 | | | 21,976 | |
| Commercial - total / weighted average | | 22 | | 7,324,628 | | 6,694,260 | | 78.5% | | 76.8% | | $ | 235,498 | | $ | 141,388 | |
| | | | | | | | | | | | | | | | | | |
| Ground Lease (4) | | 1 | | — | | — | | — | | — | | $ | — | | $ | 5,116 | |
| |
| | | | | | | | | | | | | | | | |
| Operating - In-Service |
| 37 |
| 6,164 Units/ 7,324,628 SF |
| 5,978 Units/ 6,694,260 SF |
| 84.8% | | 83.2% | | $ | 414,111 | | $ | 251,456 | |
| Operating - Recently Delivered | | 1 | | 355 Units | | 355 Units | | 76.8% | | 76.1% | | $ | 10,988 | | $ | 4,988 | |
| Operating - Total / Weighted Average | | 38 | | 6,519 Units/ 7,324,628 SF | | 6,333 Units/ 6,694,260 SF | | 84.6% | | 83.1% | | $ | 425,099 | | $ | 256,444 | |
| | | | | | | | | | | | | | | | | | |
| Development (5) |
| |
| |
| |
| |
| | |
| | |
| | |
| | | | | | | | | | | | | | | | | | |
| | | | | | | | | | | | | | | | | | |
| Under-Construction |
| 1 |
| 195 Units |
| 59 Units |
| |
| | |
| | |
| | |
| | | | | | | | | | | | | | | | | | |
| Development Pipeline |
| |
| 4,809,200 |
| 3,511,300 |
| |
| | |
| | |
| | |
| (1) | Percent Occupied excludes retail square footage. |
| (2) | Annualized NOI includes $4.6 million from 1101 17th Street and $24.6 million from 1215, 1225 and 1235 S. Clark Street. |
| (3) | 2221 S. Clark Street - Residential is excluded from Percent Leased, Percent Occupied and Annualized Rent metrics as it is operated as a short-term rental property. |
| (4) | 1700 M Street, for which we are the ground lessor, is excluded from Percent Leased, Percent Occupied and Annualized Rent metrics. See footnote (7) on page 19 for more information. |
| (5) | Refer to pages 32 – 33 for detail of Under-Construction asset and assets in the Development Pipeline. |
| | Page 8 |
CONDENSED CONSOLIDATED BALANCE SHEETS | SEPTEMBER 30, 2026 |
Condensed Consolidated Balance Sheets
| in thousands | | September 30, 2026 | | December 31, 2025 |
| ||
| | | | | | | |
|
| ASSETS | | | | | | | |
| Real estate, at cost: | | | | | | | |
| Land and improvements | | $ | 956,369 | | $ | 1,019,967 | |
| Buildings and improvements | |
| 3,882,816 | |
| 3,973,514 | |
| Construction in progress, including land | |
| 107,009 | |
| 175,673 | |
| | |
| 4,946,194 | |
| 5,169,154 | |
| Less: accumulated depreciation | |
| (1,469,388) | |
| (1,408,641) | |
| Real estate, net | |
| 3,476,806 | |
| 3,760,513 | |
| Cash and cash equivalents | |
| 78,535 | |
| 75,270 | |
| Restricted cash | |
| 25,498 | |
| 28,020 | |
| Tenant and other receivables | |
| 27,814 | |
| 21,810 | |
| Deferred rent receivable | |
| 180,748 | |
| 182,891 | |
| Investments in unconsolidated real estate ventures | |
| 114,545 | |
| 105,711 | |
| Deferred leasing costs, net | | | 52,962 | | | 66,356 | |
| Intangible assets, net | | | 10,403 | | | 30,333 | |
| Other assets, net | |
| 149,629 | |
| 117,287 | |
| Assets held for sale | | | 84,278 | | | — | |
| TOTAL ASSETS | | $ | 4,201,218 | | $ | 4,388,191 | |
| | | | | | | | |
| LIABILITIES, REDEEMABLE NONCONTROLLING INTERESTS AND EQUITY | |
| | |
| | |
| Liabilities: | |
| | |
| | |
| Mortgage loans, net | | $ | 1,602,125 | | $ | 1,579,158 | |
| Revolving credit facility | |
| 222,000 | |
| 205,000 | |
| Term loans, net | |
| 733,311 | |
| 718,408 | |
| Accounts payable and accrued expenses | |
| 72,941 | |
| 84,748 | |
| Other liabilities, net | |
| 99,036 | |
| 131,945 | |
| Liabilities related to assets held for sale | |
| 6,268 | |
| — | |
| Total liabilities | |
| 2,735,681 | |
| 2,719,259 | |
| Commitments and contingencies | |
| | |
| | |
| Redeemable noncontrolling interests | |
| 449,300 | |
| 511,342 | |
| Total equity | |
| 1,016,237 | |
| 1,157,590 | |
| TOTAL LIABILITIES, REDEEMABLE NONCONTROLLING INTERESTS AND EQUITY | | $ | 4,201,218 | | $ | 4,388,191 | |
Note: For complete financial statements, please refer to our Quarterly Report on Form 10-Q for the quarter ended September 30, 2026.
| | Page 9 |
CONDENSED CONSOLIDATED STATEMENTS OF OPERATIONS | SEPTEMBER 30, 2026 |
Condensed Consolidated Statements of Operations
| in thousands, except per share data | | Three Months Ended September 30, | | Nine Months Ended September 30, |
| ||||||||
| | | 2026 | | 2025 | | 2026 | | 2025 |
| ||||
| REVENUE | | | | | | | | | | | | | |
| Property rental | | $ | 108,082 | | $ | 103,981 | | $ | 320,570 | | $ | 311,989 | |
| Third-party real estate services, including reimbursements (1) | |
| 18,270 | |
| 14,711 | |
| 52,480 | |
| 44,430 | |
| Other revenue | |
| 6,061 | |
| 5,178 | |
| 16,340 | |
| 14,616 | |
| Total revenue | |
| 132,413 | |
| 123,870 | |
| 389,390 | |
| 371,035 | |
| EXPENSES | |
| | |
| | |
| | |
| | |
| Depreciation and amortization | |
| 44,589 | |
| 48,164 | |
| 134,685 | |
| 143,311 | |
| Property operating | |
| 39,950 | |
| 36,564 | |
| 112,132 | |
| 104,876 | |
| Real estate taxes | |
| 10,335 | |
| 12,284 | |
| 34,690 | |
| 37,107 | |
| General and administrative: | |
| | |
| | |
| | |
| | |
| Corporate and other | |
| 12,546 | |
| 13,214 | |
| 43,237 | |
| 45,491 | |
| Third-party real estate services (1) | |
| 16,440 | |
| 14,058 | |
| 49,802 | |
| 43,691 | |
| Transaction and Other Costs | |
| 964 | |
| 494 | |
| 11,490 | |
| 5,251 | |
| Total expenses | |
| 124,824 | |
| 124,778 | |
| 386,036 | |
| 379,727 | |
| OTHER INCOME (EXPENSE) | |
| | |
| | |
| | |
| | |
| Loss from unconsolidated real estate ventures, net | |
| (237) | |
| (664) | |
| (1,197) | |
| (165) | |
| Interest and other income, net | |
| 760 | |
| 2,378 | |
| 6,818 | |
| 3,601 | |
| Interest expense | |
| (36,838) | |
| (34,781) | |
| (108,415) | |
| (105,552) | |
| Gain (loss) on the sale of real estate, net | |
| (213) | |
| 4,660 | |
| 20,577 | |
| 47,029 | |
| Loss on the extinguishment of debt, net | |
| (2,107) | |
| — | |
| (2,107) | |
| (2,402) | |
| Impairment loss | | | (69,175) | |
| (4,771) | |
| (114,740) | |
| (45,067) | |
| Total other income (expense) | |
| (107,810) | |
| (33,178) | |
| (199,064) | |
| (102,556) | |
| LOSS BEFORE INCOME TAX EXPENSE | |
| (100,221) | |
| (34,086) | |
| (195,710) | |
| (111,248) | |
| Income tax expense | |
| — | |
| (926) | |
| (7) | |
| (643) | |
| NET LOSS | |
| (100,221) | |
| (35,012) | |
| (195,717) | |
| (111,891) | |
| Net loss attributable to redeemable noncontrolling interests | |
| 18,262 | |
| 6,457 | |
| 35,993 | |
| 18,375 | |
| Net income attributable to noncontrolling interests | | | (47) | | | — | | | (134) | |
| — | |
| NET LOSS ATTRIBUTABLE TO COMMON SHAREHOLDERS | | $ | (82,006) | | $ | (28,555) | | $ | (159,858) | | $ | (93,516) | |
| LOSS PER COMMON SHARE - BASIC AND DILUTED | | $ | (1.41) | | $ | (0.48) | | $ | (2.75) | | $ | (1.35) | |
| WEIGHTED AVERAGE NUMBER OF COMMON SHARES OUTSTANDING - BASIC AND DILUTED | |
| 58,635 | |
| 60,606 | |
| 58,662 | |
| 70,062 | |
Note: For complete financial statements, please refer to our Quarterly Report on Form 10-Q for the quarter ended September 30, 2026.
| (1) | Includes $10.4 million and $8.1 million for the three months ended September 30, 2026 and 2025, and $31.1 million and $24.3 million for the nine months ended September 30, 2026 and 2025, of revenue and expenses reimbursed by third-party owners of real estate we manage. |
| | Page 10 |
UNCONSOLIDATED REAL ESTATE VENTURES | SEPTEMBER 30, 2026 |
Unconsolidated Real Estate Ventures
| in thousands, at JBG SMITH Share | | | | |
| | | September 30, 2026 | | |
| | | | | |
| BALANCE SHEET INFORMATION | | |
| |
| Total real estate, at cost | | $ | 146,774 | |
| Less: accumulated depreciation | |
| (4,563) | |
| Real estate, net | |
| 142,211 | |
| Cash and cash equivalents | |
| 2,069 | |
| Other assets, net | |
| 14,408 | |
| Total assets | | $ | 158,688 | |
| Borrowings, net | | $ | 34,787 | |
| Other liabilities, net | |
| 11,357 | |
| Total liabilities | | $ | 46,144 | |
| | | Three Months Ended | | Nine Months Ended | | ||
| | | September 30, 2026 | | September 30, 2026 | | ||
| | | | | | | ||
| | | | | | | |
|
| OPERATING INFORMATION | | | | | | |
|
| Total revenue | | $ | 2,338 | | $ | 7,064 | |
| Expenses: | |
| | |
| | |
| Depreciation and amortization | |
| 970 | |
| 2,919 | |
| Property operating | |
| 727 | |
| 2,583 | |
| Real estate taxes | |
| 409 | |
| 1,136 | |
| Total expenses | |
| 2,106 | |
| 6,638 | |
| Other income (expense): | |
| | |
| | |
| Interest expense | |
| (586) | |
| (1,758) | |
| Loss on the sale of real estate | |
| — | |
| (39) | |
| Interest and other income, net | |
| 114 | |
| 163 | |
| | | | | | | | |
| Net Loss | | $ | (240) | | $ | (1,208) | |
| Other | |
| 3 | |
| 11 | |
| Loss from unconsolidated real estate ventures, net | | $ | (237) | | $ | (1,197) | |
| | Page 11 |
OTHER TANGIBLE ASSETS AND LIABILITIES | SEPTEMBER 30, 2026 |
Other Tangible Assets and Liabilities
| in thousands, at JBG SMITH Share | | September 30, 2026 |
| |
| | | | | |
| Other Tangible Assets, Net (1) (2) | | | | |
| Restricted cash | | $ | 25,737 | |
| Tenant and other receivables | |
| 27,863 | |
| Other assets, net | |
| 98,921 | |
| Total Other Tangible Assets, Net | | $ | 152,521 | |
| | | | | |
| Other Tangible Liabilities, Net (3) | |
| | |
| Accounts payable and accrued expenses | | $ | 74,065 | |
| Other liabilities, net (4) | |
| 66,794 | |
| Total Other Tangible Liabilities, Net | | $ | 140,859 | |
| (1) | Excludes cash and cash equivalents. |
| (2) | Excludes assets held for sale. |
| (3) | Excludes liabilities related to assets held for sale. |
| (4) | Includes lease incentive liabilities totaling $2.3 million but excludes committed tenant-related obligations totaling $44.1 million. The timing and amounts of payments for tenant-related obligations are uncertain and may only be due upon satisfactory performance of certain conditions. |
| | Page 12 |
EBITDA, EBITDAre AND ADJUSTED EBITDA RECONCILIATIONS (NON-GAAP) | SEPTEMBER 30, 2026 |
EBITDA, EBITDAre and Adjusted EBITDA
| dollars in thousands | | Three Months Ended September 30, | | Nine Months Ended September 30, | | ||||||||
| | | 2026 | | 2025 | | 2026 | | 2025 | | ||||
| | | | | | | | | | | | | |
|
| EBITDA, EBITDAre and Adjusted EBITDA | | | | | | | | | | | | | |
| Net loss | | $ | (100,221) | | $ | (35,012) | | $ | (195,717) | | $ | (111,891) | |
| Depreciation and amortization expense | | | 44,589 | | | 48,164 | | | 134,685 | | | 143,311 | |
| Interest expense | | | 36,838 | | | 34,781 | | | 108,415 | | | 105,552 | |
| Income tax expense | | | — | | | 926 | | | 7 | | | 643 | |
| Unconsolidated real estate ventures allocated share of above adjustments | | | 1,555 | | | 1,853 | | | 4,677 | | | 5,470 | |
| EBITDA attributable to noncontrolling interests in consolidated real estate ventures | | | (1,429) | | | (905) | | | (3,732) | | | (1,175) | |
| EBITDA | | $ | (18,668) | | $ | 49,807 | | $ | 48,335 | | $ | 141,910 | |
| (Gain) loss on the sale of real estate, net | | | 213 | | | (4,660) | | | (20,577) | | | (47,029) | |
| Pro rata share of (gain) loss on the sale of unconsolidated real estate assets | | | — | | | — | | | 39 | | | (1,500) | |
| Impairment loss related to real estate | | | 69,175 | | | 4,771 | | | 114,740 | | | 45,067 | |
| | | | | | | | | | | | | | |
| EBITDAre | | $ | 50,720 | | $ | 49,918 | | $ | 142,537 | | $ | 138,448 | |
| Transaction and Other Costs, net of noncontrolling interests (1) | | | 958 | | | 494 | | | 11,350 | | | 5,251 | |
| Litigation costs (2) | | | 153 | | | — | | | 833 | | | 2,500 | |
| Income from investments, net | | | (328) | | | (2,232) | | | (4,527) | | | (1,954) | |
| Loss on the extinguishment of debt, net | | | 2,107 | | | — | | | 2,107 | | | 2,402 | |
| Earnings and distributions in excess of our investment in unconsolidated real estate venture | | | — | | | (173) | | | — | | | (574) | |
| Unconsolidated real estate ventures allocated share of above adjustments | | | (9) | | | — | | | 208 | | | — | |
| | | | | | | | | | | | | | |
| Adjusted EBITDA | | $ | 53,601 | | $ | 48,007 | | $ | 152,508 | | $ | 146,073 | |
| | | | | | | | | | | | | | |
| Net Debt to Annualized Adjusted EBITDA (3) | | | 11.6 | x | | 12.6 | x | | 12.3 | x | | 12.4 | x |
| | | | | | | | | | | | | | |
| Net Debt (at JBG SMITH Share) | | | | | | | | September 30, 2026 | | September 30, 2025 | | ||
| Consolidated indebtedness (4) | | | | | | | | $ | 2,536,421 | | $ | 2,451,155 | |
| Unconsolidated indebtedness (4) | | | | | | | | | 33,983 | | | 34,248 | |
| Total consolidated and unconsolidated indebtedness | | | | | | | | | 2,570,404 | | | 2,485,403 | |
| Less: cash and cash equivalents | | | | | | | | | 77,692 | | | 65,859 | |
| Net Debt (at JBG SMITH Share) | | | | | | | | $ | 2,492,712 | | $ | 2,419,544 | |
Note: All EBITDA measures as shown above are attributable to OP Units and certain fully vested incentive equity awards that may be convertible into OP Units. The prior year EBITDAre amounts have been restated to conform to the current year presentation. There was no change to EBITDA or Adjusted EBITDA.
| (1) | Includes costs related to completed, potential and pursued transactions, and other costs, including expenses related to the Wardman Tower litigation. |
| (2) | Included in “Corporate and other general and administrative expense” in the Condensed Consolidated Statements of Operations. |
| (3) | Quarterly Adjusted EBITDA is annualized by multiplying by four. Adjusted EBITDA for the nine months ended September 30, 2026 and 2025 is annualized by multiplying by 1.33. |
| (4) | Net of premium/discount and deferred financing costs. |
| | Page 13 |
FFO, CORE FFO AND FAD RECONCILIATIONS (NON-GAAP) | SEPTEMBER 30, 2026 |
| in thousands, except per share data | | Three Months Ended September 30, | | Nine Months Ended September 30, | | ||||||||
| | | 2026 | | 2025 | | 2026 | | 2025 | | ||||
| | | | | | | | | | | | | |
|
| FFO and Core FFO | | | | | | | | | | | | | |
| Net loss attributable to common shareholders | | $ | (82,006) |
| $ | (28,555) | | $ | (159,858) |
| $ | (93,516) | |
| Net loss attributable to redeemable noncontrolling interests | |
| (18,262) |
| | (6,457) | |
| (35,993) |
| | (18,375) | |
| Net income attributable to noncontrolling interests | |
| 47 |
| | — | |
| 134 |
| | — | |
| Net loss | |
| (100,221) |
| | (35,012) | |
| (195,717) |
| | (111,891) | |
| (Gain) loss on the sale of real estate, net | |
| 213 |
| | (4,660) | |
| (20,577) |
| | (47,029) | |
| Pro rata share of (gain) loss on the sale of unconsolidated real estate assets | |
| — |
| | — | |
| 39 |
| | (1,500) | |
| Real estate depreciation and amortization | |
| 44,305 |
| | 47,837 | |
| 133,832 |
| | 140,306 | |
| Impairment loss related to real estate | | | 69,175 |
| | 4,771 | |
| 114,740 |
| | 45,067 | |
| Pro rata share of real estate depreciation and amortization from unconsolidated real estate ventures | |
| 970 |
| | 777 | |
| 2,919 |
| | 2,342 | |
| FFO attributable to noncontrolling interests in consolidated real estate ventures | |
| (1,245) |
| | (905) | |
| (3,425) |
| | (1,175) | |
| FFO Attributable to OP Units | | $ | 13,197 |
| $ | 12,808 | | $ | 31,811 |
| $ | 26,120 | |
| FFO attributable to redeemable noncontrolling interests | |
| (2,790) |
| | (2,679) | |
| (6,808) |
| | (5,217) | |
| FFO Attributable to Common Shareholders | | $ | 10,407 |
| $ | 10,129 | | $ | 25,003 |
| $ | 20,903 | |
| | | | | | | | | | | | | | |
| FFO attributable to OP Units | | $ | 13,197 |
| $ | 12,808 | | $ | 31,811 |
| $ | 26,120 | |
| Transaction and Other Costs, net of noncontrolling interests (1) | |
| 958 |
| | 494 | |
| 11,350 |
| | 5,251 | |
| Litigation costs (2) | | | 153 |
| | — | |
| 833 |
| | 2,500 | |
| Income from investments, net of tax | | | (328) |
| | (1,691) | |
| (4,527) |
| | (1,480) | |
| Gain from mark-to-market on derivative instruments | |
| (21) |
| | (3) | |
| (37) |
| | (59) | |
| Loss on the extinguishment of debt, net | |
| 2,107 |
| | — | |
| 2,107 |
| | 2,402 | |
| Earnings and distributions in excess of our investment in unconsolidated real estate venture | |
| — |
| | (173) | |
| — |
| | (574) | |
| Amortization of management contracts intangible, net of tax | |
| 74 |
| | 74 | |
| 221 |
| | 1,752 | |
| Unconsolidated real estate ventures allocated share of above adjustments | |
| (9) |
| | (2) | |
| 208 |
| | (2) | |
| Core FFO Attributable to OP Units | | $ | 16,131 |
| $ | 11,507 | | $ | 41,966 |
| $ | 35,910 | |
| Core FFO attributable to redeemable noncontrolling interests | |
| (3,410) |
| | (2,407) | |
| (8,990) |
| | (6,898) | |
| Core FFO Attributable to Common Shareholders | | $ | 12,721 |
| $ | 9,100 | | $ | 32,976 |
| $ | 29,012 | |
| FFO per common share - diluted | | $ | 0.18 |
| $ | 0.17 | | $ | 0.42 |
| $ | 0.30 | |
| Core FFO per common share - diluted | | $ | 0.22 |
| $ | 0.15 | | $ | 0.56 |
| $ | 0.41 | |
| Weighted average shares - diluted (FFO and Core FFO) | |
| 58,807 |
| | 60,965 | |
| 58,872 |
| | 70,272 | |
See footnotes on page 15.
| | Page 14 |
FFO, CORE FFO AND FAD RECONCILIATIONS (NON-GAAP) | SEPTEMBER 30, 2026 |
| in thousands, except per share data | | Three Months Ended September 30, | | Nine Months Ended September 30, |
| ||||||||
| | | 2026 | | 2025 | | 2026 | | 2025 | | ||||
| | | | | | | | | | | | | | |
| FAD | | | | | | | | | | | | | |
| Core FFO attributable to OP Units | | $ | 16,131 | | $ | 11,507 | | $ | 41,966 | | $ | 35,910 | |
| Recurring capital expenditures and Second-generation tenant improvements and leasing commissions, at share | |
| (6,915) | |
| (9,851) | |
| (16,022) | |
| (30,737) | |
| Straight-line and other rent adjustments (3) | |
| (2,129) | |
| 1,561 | |
| (6,774) | |
| 4,071 | |
| Share-based compensation expense | |
| 5,316 | |
| 4,808 | |
| 22,093 | |
| 18,685 | |
| Amortization of debt issuance costs | |
| 3,168 | |
| 3,554 | |
| 9,335 | |
| 11,389 | |
| Unconsolidated real estate ventures allocated share of above adjustments | |
| 105 | |
| 321 | |
| 276 | |
| 676 | |
| Non-real estate depreciation and amortization | |
| 209 | |
| 250 | |
| 631 | |
| 759 | |
| FAD Available to OP Units (A) | | $ | 15,885 | | $ | 12,150 | | $ | 51,505 | | $ | 40,753 | |
| Distributions to common shareholders and unitholders (B) | | $ | 13,133 | | $ | 13,712 | | $ | 39,414 | | $ | 46,654 | |
| FAD Payout Ratio (B÷A) (4) | |
| 82.7 | % |
| 112.9 | % |
| 76.5 | % |
| 114.5 | % |
| | | | | | | | | | | | | | |
| Capital Expenditures | | | | | | | | | | | | | |
| Maintenance and recurring capital expenditures | | $ | 3,965 | | $ | 4,059 | | $ | 9,715 | | $ | 10,915 | |
| Share of maintenance and recurring capital expenditures from unconsolidated real estate ventures | |
| 3 | |
| 9 | |
| 7 | |
| 18 | |
| Second-generation tenant improvements and leasing commissions | |
| 2,905 | |
| 5,646 | |
| 6,258 | |
| 19,410 | |
| Share of Second-generation tenant improvements and leasing commissions from unconsolidated real estate ventures | |
| 42 | |
| 137 | |
| 42 | |
| 394 | |
| Recurring capital expenditures and Second-generation tenant improvements and leasing commissions | |
| 6,915 | |
| 9,851 | |
| 16,022 | |
| 30,737 | |
| Non-recurring capital expenditures | |
| 6,485 | |
| 11,487 | |
| 17,884 | |
| 25,638 | |
| Share of non-recurring capital expenditures from unconsolidated real estate ventures | |
| — | |
| 8 | |
| — | |
| 8 | |
| First-generation tenant improvements and leasing commissions | |
| 5,500 | |
| 1,660 | |
| 15,856 | |
| 7,580 | |
| Share of First-generation tenant improvements and leasing commissions from unconsolidated real estate ventures | |
| — | |
| 136 | |
| 73 | |
| 219 | |
| Non-recurring capital expenditures and First-generation tenant improvements and leasing commissions | |
| 11,985 | |
| 13,291 | |
| 33,813 | |
| 33,445 | |
| Total JBG SMITH Share of Capital Expenditures | | $ | 18,900 | | $ | 23,142 | | $ | 49,835 | | $ | 64,182 | |
Note: The prior year FFO amounts have been restated to conform to the current year presentation. There was no change to Core FFO.
| (1) | Includes costs related to completed, potential and pursued transactions, and other costs, including expenses related to the Wardman Tower litigation. |
| (2) | Included in “Corporate and other general and administrative expense” in the Condensed Consolidated Statements of Operations. |
| (3) | Includes straight-line rent, above/below market lease amortization/accretion and lease incentive amortization. |
| (4) | The quarterly FAD payout ratio is not necessarily indicative of an amount for the full year due to fluctuation in the timing of capital expenditures, the commencement of new leases and the seasonality of our operations. |
| | Page 15 |
THIRD-PARTY REAL ESTATE SERVICES BUSINESS (NON-GAAP) | SEPTEMBER 30, 2026 |
Third-Party Asset Mgmt and Real Estate Services Business
| in thousands, at JBG SMITH Share | | | Three Months Ended September 30, 2026 | |
| | | | | |
| Service Revenue | | | | |
| Property management fees | | $ | 3,438 | |
| Asset management fees | |
| 1,142 | |
| Development fees | |
| 701 | |
| Leasing fees | |
| 651 | |
| Construction management fees | |
| 396 | |
| Other service revenue | |
| 1,654 | |
| Third-Party Real Estate Service Revenue, Excluding Reimbursements (1) | | $ | 7,982 | |
| Third-party real estate services expenses, excluding reimbursements (2) | |
| (5,798) | |
| Net Third-Party Real Estate Services, Excluding Reimbursements (3) | | $ | 2,184 | |
| (1) | Service revenue from real estate ventures is calculated on an asset-by-asset basis by applying our real estate venture partners' respective economic interests to the fees we earned from each real estate venture. For unconsolidated ventures, our share of such revenue is included in “Third-party real estate services, including reimbursements” in our Condensed Consolidated Statement of Operations but excluded from this table. For consolidated ventures, our real estate venture partners' share of such revenue is not included in “Third-party real estate services, including reimbursements” in our Condensed Consolidated Statement of Operations as it is eliminated in consolidation but is included in this table. For the three months ended September 30, 2026, $10.4 million of reimbursement revenue and $0.1 million of service revenue are excluded from this table but included in “Third-party real estate services, including reimbursements,” and $0.3 million of service revenue is included in this table but excluded from “Third-party real estate services, including reimbursements” in our Condensed Consolidated Statement of Operations. |
| (2) | Our personnel perform services for wholly owned properties and properties we manage on behalf of third parties and real estate ventures. We allocate personnel and other costs to wholly owned properties (included in "Property operating expenses" and "General and administrative expense: corporate and other" in our Condensed Consolidated Statement of Operations) and to properties owned by the third parties and real estate ventures (included in "General and administrative expense: third-party real estate services" in our Condensed Consolidated Statement of Operations) using estimates of the time spent performing services related to properties in the respective portfolios and other allocation methodologies. |
Allocated general and administrative expenses related to real estate ventures are calculated on an asset-by-asset basis by applying our real estate venture partners' respective economic interests to the total general and administrative expenses allocated to each asset. See "Pro Rata Adjusted General and Administrative Expenses" on the next page for a reconciliation of "General and administrative expenses: third-party real estate services" to "Pro Rata Adjusted General and Administrative Expenses."
| (3) | Service revenue, excluding reimbursement revenue and service revenue from our economic interest in real estate ventures, less allocated general and administrative expenses. Management uses this measure as a supplemental performance measure of its third-party real estate services business and believes it provides useful information to investors because it reflects only those revenue and expense items incurred by us and can be used to assess the profitability of the third-party real estate services business. |
| | Page 16 |
PRO RATA ADJUSTED GENERAL AND ADMINISTRATIVE EXPENSES | SEPTEMBER 30, 2026 |
| in thousands | | Three Months Ended September 30, 2026 | | ||||||||||
| | | | | | Adjustments (1) | | | |
| ||||
| | | Per Statement | | | | | | | | Pro Rata |
| ||
| | | of Operations | | A | | B | | Adjusted |
| ||||
| | | | | | | | | | | | | | |
| General and Administrative Expenses | | | | | | | | | | | | | |
| Corporate and other | | $ | 12,546 | | $ | — | | $ | 202 | | $ | 12,748 | |
| Third-party real estate services | |
| 16,440 | |
| (10,440) | |
| (202) | |
| 5,798 | |
| | | | | | | | | | | | | | |
| Total | | $ | 28,986 | | $ | (10,440) | | $ | — | | $ | 18,546 | |
| (1) | Adjustments: |
A - Removes $10.4 million of general and administrative expenses reimbursed by third-party owners of real estate we manage related to revenue which has been excluded from service revenue on page 16. Revenue from reimbursements is included in "Third-party real estate services, including reimbursements" in our Condensed Consolidated Statement of Operations.
B - Reflects an adjustment to allocate our share of general and administrative expenses of unconsolidated real estate ventures from "Third-party real estate services" to "Corporate and other."
| | Page 17 |
SAME STORE NOI (NON-GAAP) | SEPTEMBER 30, 2026 |
c
| dollars in thousands, at JBG SMITH Share | | | | | | | | | | | | | | | | | |
| | | Three Months Ended September 30, | | Nine Months Ended September 30, | | ||||||||||||
| | | 2026 | | 2025 | | % Change | | 2026 | | 2025 | | % Change | | ||||
| | | | | | | | | | | | | | | | | | |
| Same Store (1) | | | | | | | | | | | | | | | | | |
| Multifamily | | | | | | | | | | | | | | | | | |
| Revenue | | $ | 45,745 | | $ | 46,494 | | (1.6%) | | $ | 114,394 | | $ | 117,280 | | (2.5%) | |
| Expenses | | | (20,518) | | | (20,563) | | (0.2%) | | | (51,670) | | | (49,337) | | 4.7% | |
| Same Store NOI | | $ | 25,227 | | $ | 25,931 | | (2.7%) | | $ | 62,724 | | $ | 67,943 | | (7.7%) | |
| | | | | | | | | | | | | | | | | | |
| Commercial | | | | | | | | | | | | | | | | | |
| Revenue | | $ | 59,462 | | $ | 55,057 | | 8.0% | | $ | 166,008 | | $ | 161,042 | | 3.1% | |
| Expenses | | | (25,199) | | | (23,003) | | 9.5% | | | (68,616) | | | (63,673) | | 7.8% | |
| Same Store NOI | | $ | 34,263 | | $ | 32,054 | | 6.9% | | $ | 97,392 | | $ | 97,369 | | — | |
| | | | | | | | | | | | | | | | | | |
| Ground Lease | | | | | | | | | | | | | | | | | |
| Same Store NOI | | $ | 1,279 | | $ | 835 | | 53.2% | | $ | 3,848 | | $ | 2,514 | | 53.1% | |
| | | | | | | | | | | | | | | | | | |
| Total Same Store NOI | | $ | 60,769 | | $ | 58,820 | | 3.3% | | $ | 163,964 | | $ | 167,826 | | (2.3%) | |
| Non-Same Store NOI | | | 3,342 | | | 1,743 | | 91.7% | | | 24,898 | | | 27,351 | | (9.0%) | |
| Total Operating Portfolio NOI | | $ | 64,111 | | $ | 60,563 | | 5.9% | | $ | 188,862 | | $ | 195,177 | | (3.2%) | |
| (1) | Same Store refers to the pool of assets that were owned, operated and In-Service for the entirety of both periods being compared, excluding assets for which significant redevelopment, renovation or repositioning occurred during either of the periods being compared. |
| | Page 18 |
SUMMARY NOI (NON-GAAP) | SEPTEMBER 30, 2026 |
| dollars in thousands | | NOI for the Three Months Ended September 30, 2026 at JBG SMITH Share | |||||||||||||||||
| | | Consolidated | | Unconsolidated | | Multifamily | | Commercial | | Ground Lease (7) | | Total |
| ||||||
| Number of operating assets |
| | 36 |
| | 2 |
| | 15 |
| | 22 |
| | 1 |
| | 38 | |
| Property rental (1) | | $ | 94,786 | | $ | 2,102 | | $ | 45,732 | | $ | 49,869 | | $ | 1,287 | | $ | 96,888 | |
| Tenant expense reimbursement | |
| 10,374 | |
| 179 | |
| 3,891 | |
| 6,662 | |
| — | |
| 10,553 | |
| Other revenue | |
| 5,882 | |
| 41 | |
| 804 | |
| 5,119 | |
| — | |
| 5,923 | |
| Total revenue | |
| 111,042 | |
| 2,322 | |
| 50,427 | |
| 61,650 | |
| 1,287 | |
| 113,364 | |
| | | | | | | | | | | | | | | | | | | | |
| Operating expenses | |
| (48,083) | |
| (849) | |
| (22,942) | |
| (25,982) | |
| (8) | |
| (48,932) | |
| Ground rent expense | |
| (321) | |
| — | |
| — | |
| (321) | |
| — | |
| (321) | |
| Total expenses | |
| (48,404) | |
| (849) | |
| (22,942) | |
| (26,303) | |
| (8) | |
| (49,253) | |
| | | | | | | | | | | | | | | | | | | | |
| Operating Portfolio NOI (2) | | $ | 62,638 | | $ | 1,473 | | $ | 27,485 | | $ | 35,347 | | $ | 1,279 | | $ | 64,111 | |
| | | | | | | | | | | | | | | | | | | | |
| Annualized NOI (3) | | $ | 250,552 | | $ | 5,892 | | $ | 109,940 | | $ | 141,388 | | $ | 5,116 | | $ | 256,444 | |
| Additional Information | |
| | |
| | |
| | |
| | |
| | |
| | |
| Free Rent (at 100% share) | | $ | 8,274 | | $ | 73 | | $ | 3,368 | | $ | 4,979 | | $ | — | | $ | 8,347 | |
| Free Rent (at JBG SMITH Share) | | $ | 7,918 | | $ | 15 | | $ | 3,051 | | $ | 4,882 | | $ | — | | $ | 7,933 | |
| Annualized Free Rent (at JBG SMITH Share) (4) | | $ | 31,672 | | $ | 60 | | $ | 12,204 | | $ | 19,528 | | $ | — | | $ | 31,732 | |
| % occupied (at JBG SMITH Share) (5) | |
| 83.3 | % |
| 73.0 | % |
| 91.5 | % |
| 76.8 | % |
| — | |
| 83.1 | % |
| Annualized base rent of signed leases, not commenced (at 100% share) (6) | | $ | 8,784 | | $ | 2,164 | | $ | 1,272 | | $ | 9,676 | | $ | — | | $ | 10,948 | |
| Annualized base rent of signed leases, not commenced (at JBG SMITH Share) (6) | | $ | 8,688 | | $ | 1,300 | | $ | 1,176 | | $ | 8,812 | | $ | — | | $ | 9,988 | |
| (1) | Property rental revenue excludes straight-line rent adjustments, commercial lease termination revenue and other non-cash GAAP adjustments. |
| (2) | NOI excludes $3.2 million of related party management fees at JBG SMITH Share. See definition of NOI on page 40. |
| (3) | Annualized NOI includes $4.6 million from 1101 17th Street and $24.6 million from 1215, 1225 and 1235 S. Clark Street. |
| (4) | Represents JBG SMITH's share of Free Rent for the three months ended September 30, 2026 multiplied by four. |
| (5) | 2221 S. Clark Street - Residential, a short-term rental property, and 1700 M Street, for which we are the ground lessor, are excluded from the Percent Occupied metric. |
| (6) | Represents monthly base rent before Free Rent and straight-line rent adjustments, plus estimated tenant reimbursements for the month in which the lease commences, multiplied by 12. Includes only leases for office and retail spaces for which rent had not yet commenced as of September 30, 2026. |
| (7) | Includes 1700 M Street, for which we are the ground lessor. The ground rent on 1700 M Street is currently $5.1 million per annum and includes market escalations and CPI resets. The ground lease expires on December 4, 2117. |
| | Page 19 |
SUMMARY NOI - MULTIFAMILY (NON-GAAP) | SEPTEMBER 30, 2026 |
Summary NOI – Multifamily
| dollars in thousands | | NOI for the Three Months Ended September 30, 2026 at JBG SMITH Share |
| ||||||||||
| | | Consolidated | | National Landing | | DC | | Total | | ||||
| Number of operating assets |
| | 15 |
| | 8 |
| | 7 |
| | 15 | |
| Property rental (1) | | $ | 45,732 | | $ | 31,790 | | $ | 13,942 | | $ | 45,732 | |
| Tenant expense reimbursement | |
| 3,891 | |
| 2,401 | |
| 1,490 | |
| 3,891 | |
| Other revenue | |
| 804 | |
| 424 | |
| 380 | |
| 804 | |
| Total revenue | |
| 50,427 | |
| 34,615 | |
| 15,812 | |
| 50,427 | |
| | | | | | | | | | | | | | |
| Operating expenses | |
| (22,942) | |
| (14,899) | |
| (8,043) | |
| (22,942) | |
| Ground rent expense | |
| — | |
| — | |
| — | |
| — | |
| Total expenses | |
| (22,942) | |
| (14,899) | |
| (8,043) | |
| (22,942) | |
| | | | | | | | | | | | | | |
| Operating Portfolio NOI (2) | | $ | 27,485 | | $ | 19,716 | | $ | 7,769 | | $ | 27,485 | |
| | | | | | | | | | | | | | |
| Annualized NOI | | $ | 109,940 | | $ | 78,864 | | $ | 31,076 | | $ | 109,940 | |
| Additional Information | |
| | |
| | |
| | |
| | |
| Free Rent (at 100% share) | | $ | 3,368 | | $ | 1,652 | | $ | 1,716 | | $ | 3,368 | |
| Free Rent (at JBG SMITH Share) | | $ | 3,051 | | $ | 1,652 | | $ | 1,399 | | $ | 3,051 | |
| Annualized Free Rent (at JBG SMITH Share) (3) | | $ | 12,204 | | $ | 6,608 | | $ | 5,596 | | $ | 12,204 | |
| % occupied (at JBG SMITH Share) (4) | |
| 91.5 | % |
| 90.6 | % |
| 93.6 | % |
| 91.5 | % |
| Annualized base rent of signed leases, not commenced (at 100% share) (5) | | $ | 1,272 | | $ | 740 | | $ | 532 | | $ | 1,272 | |
| Annualized base rent of signed leases, not commenced (at JBG SMITH Share) (5) | | $ | 1,176 | | $ | 740 | | $ | 436 | | $ | 1,176 | |
| (1) | Property rental revenue excludes straight-line rent adjustments, retail lease termination revenue and other non-cash GAAP adjustments. |
| (2) | NOI excludes $1.4 million of related party management fees at JBG SMITH Share. See definition of NOI on page 40. |
| (3) | Represents JBG SMITH's share of Free Rent for the three months ended September 30, 2026 multiplied by four. |
| (4) | 2221 S. Clark Street – Residential is excluded from the Percent Occupied metric as it is operated as a short-term rental property. |
| (5) | Represents monthly base rent before Free Rent and straight-line rent adjustments, plus estimated tenant reimbursements for the month in which the lease commences, multiplied by 12. Includes only leases for retail spaces for which rent had not yet commenced as of September 30, 2026. |
| | Page 20 |
SUMMARY NOI - COMMERCIAL (NON-GAAP) | SEPTEMBER 30, 2026 |
| dollars in thousands | | NOI for the Three Months Ended September 30, 2026 at JBG SMITH Share | ||||||||||||||
| | | Consolidated | | Unconsolidated | | National Landing | | Other | | Total | | |||||
| Number of operating assets |
| | 20 |
| | 2 |
| | 16 | | | 6 | | | 22 | |
| Property rental (1) | | $ | 47,767 | | $ | 2,102 | | $ | 41,213 | | $ | 8,656 | | $ | 49,869 | |
| Tenant expense reimbursement | |
| 6,483 | |
| 179 | |
| 5,441 | |
| 1,221 | |
| 6,662 | |
| Other revenue | |
| 5,078 | |
| 41 | |
| 4,743 | |
| 376 | |
| 5,119 | |
| Total revenue | |
| 59,328 | |
| 2,322 | |
| 51,397 | |
| 10,253 | |
| 61,650 | |
| | | | | | | | | | | | | | | | | |
| Operating expenses | |
| (25,133) | |
| (849) | |
| (21,544) | |
| (4,438) | |
| (25,982) | |
| Ground rent expense | |
| (321) | |
| — | |
| — | |
| (321) | |
| (321) | |
| Total expenses | |
| (25,454) | |
| (849) | |
| (21,544) | |
| (4,759) | |
| (26,303) | |
| | | | | | | | | | | | | | | | | |
| Operating Portfolio NOI (2) | | $ | 33,874 | | $ | 1,473 | | $ | 29,853 | | $ | 5,494 | | $ | 35,347 | |
| | | | | | | | | | | | | | | | | |
| Annualized NOI (3) | | $ | 135,496 | | $ | 5,892 | | $ | 119,412 | | $ | 21,976 | | $ | 141,388 | |
| Additional Information | |
| | |
| | |
| | |
| | |
| | |
| Free Rent (at 100% share) | | $ | 4,906 | | $ | 73 | | $ | 4,324 | | $ | 655 | | $ | 4,979 | |
| Free Rent (at JBG SMITH Share) | | $ | 4,867 | | $ | 15 | | $ | 4,324 | | $ | 558 | | $ | 4,882 | |
| Annualized Free Rent (at JBG SMITH Share) (4) | | $ | 19,468 | | $ | 60 | | $ | 17,296 | | $ | 2,232 | | $ | 19,528 | |
| % occupied (at JBG SMITH Share) | |
| 76.9 | % |
| 73.0 | % |
| 76.9 | % |
| 76.0 | % |
| 76.8 | % |
| Annualized base rent of signed leases, not commenced (at 100% share) (5) | | $ | 7,512 | | $ | 2,164 | | $ | 5,984 | | $ | 3,692 | | $ | 9,676 | |
| Annualized base rent of signed leases, not commenced (at JBG SMITH Share) (5) | | $ | 7,512 | | $ | 1,300 | | $ | 5,984 | | $ | 2,828 | | $ | 8,812 | |
| (1) | Property rental revenue excludes straight-line rent adjustments, commercial lease termination revenue and other non-cash GAAP adjustments. |
| (2) | NOI excludes $1.8 million of related party management fees at JBG SMITH Share. See definition of NOI on page 40. |
| (3) | Annualized NOI includes $4.6 million from 1101 17th Street and $24.6 million from 1215, 1225 and 1235 S. Clark Street. |
| (4) | Represents JBG SMITH's share of Free Rent for the three months ended September 30, 2026 multiplied by four. |
| (5) | Represents monthly base rent before Free Rent and straight-line rent adjustments, plus estimated tenant reimbursements for the month in which the lease commences, multiplied by 12. Includes only leases for office and retail spaces for which rent had not yet commenced as of September 30, 2026. |
| | Page 21 |
SIGNED BUT NOT YET COMMENCED LEASES | SEPTEMBER 30, 2026 |
Signed But Not Yet Commenced Leases
| in thousands, at JBG SMITH Share | | Total | | | | | | | | | | | | | | | | | | |
| |||
| | | | | Annualized | | | | | | | | | | | | | | | | | | | | |
| | | | | Estimated | | Estimated Rent (1) for the Quarter Ending | | |||||||||||||||||
| Assets | | C/U (2) | | Rent (3) | | December 31, 2026 | | March 31, 2027 | | June 30, 2027 | | September 30, 2027 | | December 31, 2027 | | March 31, 2028 |
| |||||||
| | | | | | | | | | | | | | | | | | | | | | | | |
|
| Multifamily | | | |
| | |
| | |
| | |
| | |
| | |
| | |
| | |
| Operating | | C | | $ | 1,176 | | $ | 168 | | $ | 259 | | $ | 282 | | $ | 294 | | $ | 294 | | $ | 294 | |
| | | | | | | | | | | | | | | | | | | | | | | | | |
| Commercial |
| |
| | |
| | |
| | |
| | |
| | |
| | |
| | | |
| Operating |
| C | | $ | 7,512 | | $ | 378 | | $ | 990 | | $ | 1,102 | | $ | 1,224 | | $ | 1,693 | | $ | 1,878 | |
| Operating | | U | | | 1,300 | | | — | | | 174 | | | 281 | | | 325 | | | 325 | | | 325 | |
| Total | | | | $ | 8,812 | | $ | 378 | | $ | 1,164 | | $ | 1,383 | | $ | 1,549 | | $ | 2,018 | | $ | 2,203 | |
| | | | | | | | | | | | | | | | | | | | | | | | | |
| Total | | | | $ | 9,988 | | $ | 546 | | $ | 1,423 | | $ | 1,665 | | $ | 1,843 | | $ | 2,312 | | $ | 2,497 | |
Note: Includes only leases for office and retail spaces for which rent had not yet commenced as of September 30, 2026.
| (1) | Represents contractual monthly base rent before Free Rent, plus estimated tenant reimbursements for the month in which the lease is estimated to commence, multiplied by the applicable number of months for each quarter based on the lease's estimated commencement date. |
| (2) | "C" denotes a consolidated interest. "U" denotes an unconsolidated interest. |
| (3) | Represents contractual monthly base rent before Free Rent, plus estimated tenant reimbursements for the month in which the lease is expected to commence, multiplied by 12. |
| | Page 22 |
LEASING ACTIVITY - MULTIFAMILY | SEPTEMBER 30, 2026 |
Leasing Activity - Multifamily
| | | Three Months Ended September 30, 2026 | | Nine Months Ended September 30, 2026 |
| Effective new lease rates (1) | | (9.6%) | | (9.8%) |
| Effective renewal lease rates (1) | | 2.7% | | 2.8% |
| Effective blended lease rates (1) | | (2.9%) | | (3.4%) |
| | | | | |
| Renewal rate | | 56.8% | | 57.9% |
Note: At JBG SMITH Share. Includes assets that were In-Service for the entirety of both periods being compared, excluding assets for which significant redevelopment, renovation or repositioning occurred during either of the periods being compared. Excludes non-market units and 2221 S. Clark Street - Residential, which is operated as a short-term rental property.
| (1) | Average change in rent versus expiring rent, net of concessions. Excludes leases with lease terms of less than nine months. |
| | Page 23 |
LEASING ACTIVITY - OFFICE | SEPTEMBER 30, 2026 |
| square feet in thousands, at JBG SMITH Share | | Three Months Ended | | | Nine Months Ended |
| ||
| | | September 30, 2026 | | | September 30, 2026 |
| ||
| New Leasing: | | | | | | | | |
| Square feet leased | | | 74 | | | | 189 | |
| Initial rent (1) | | $ | 47.35 | | | $ | 45.30 | |
| Straight-line rent (2) | | $ | 48.69 | | | $ | 45.02 | |
| Weighted average lease term (years) | | | 9.6 | | | | 7.5 | |
| Weighted average Free Rent period (months) | | | 11.6 | | | | 9.5 | |
| Tenant improvements and leasing commissions per square foot per annum | | $ | 13.18 | | | $ | 13.12 | |
| Renewal Leasing: |
| | | | | | | |
| Square feet leased | | | 119 | | | | 485 | |
| Initial rent (1) | | $ | 54.74 | | | $ | 49.46 | |
| Straight-line rent (2) | | $ | 55.34 | | | $ | 49.09 | |
| Weighted average lease term (years) | | | 6.9 | | | | 5.1 | |
| Weighted average Free Rent period (months) | | | 3.6 | | | | 3.2 | |
| Tenant improvements and leasing commissions per square foot per annum | | $ | 2.52 | | | $ | 3.55 | |
| Total Leasing: | | | | | | | | |
| Square feet leased | | | 193 | | | | 674 | |
| Initial rent (1) | | $ | 51.91 | | | $ | 48.29 | |
| Straight-line rent (2) | | $ | 52.79 | | | $ | 47.95 | |
| Weighted average lease term (years) | | | 7.9 | | | | 5.8 | |
| Weighted average Free Rent period (months) | | | 6.4 | | | | 4.9 | |
| Tenant improvements and leasing commissions per square foot per annum | | $ | 7.46 | | | $ | 7.04 | |
| Mark-to-Market on Second-generation space: | |
| | | |
| | |
| Square feet leased | | | 119 | | | | 504 | |
| Cash basis: | |
| | | |
| | |
| Initial rent (1) | | $ | 54.74 | | | $ | 49.34 | |
| Prior escalated rent | | $ | 55.82 | | | $ | 51.79 | |
| % change | |
| (1.9) | % | |
| (4.7) | % |
| GAAP basis: | |
| | | |
| | |
| Straight-line rent (2) | | $ | 51.41 | | | $ | 48.06 | |
| Prior straight-line rent | | $ | 50.59 | | | $ | 47.51 | |
| % change | |
| 1.6 | % | |
| 1.1 | % |
Note: The leasing activity and related statistics are based on leases signed during the period and are not intended to coincide with the commencement of the recognition of property rental revenue in accordance with GAAP. Second-generation space represents square footage that was vacant for less than nine months. Weighted average lease term is weighted by square footage, and weighted average Free Rent period is weighted by Annualized Rent. Percentage rent is excluded from the initial rent, straight-line rent, Free Rent, and mark-to-market metrics.
| (1) | Represents the cash basis weighted average starting rent per square foot, which is generally indicative of market rents. Triple net leases are converted to a gross basis by adding estimated tenant reimbursements to monthly base rent. Most leases include Free Rent and periodic step-ups in rent which are not included in the initial cash basis rent per square foot but are included in the GAAP basis rent per square foot. |
| (2) | Represents the GAAP basis weighted average rent per square foot that is recognized over the term of the respective leases, including the effect of Free Rent and fixed step-ups in rent. |
| | Page 24 |
LEASE EXPIRATIONS | SEPTEMBER 30, 2026 |
| | | | | At JBG SMITH Share | | |||||||||||||
| | | | | | | | | | | | | | | | | Estimated |
| |
| | | | | | | | | | | | % of | | | | | Annualized |
| |
| | | | | | | % of | | Annualized | | Total | | Annualized | | Rent Per |
| |||
| | | Number | | | | Total | | Rent | | Annualized | | Rent Per | | Square Foot at |
| |||
| Year of Lease Expiration | | of Leases | | Square Feet | | Square Feet | | (in thousands) | | Rent | | Square Foot | | Expiration (1) |
| |||
| Month-to-Month |
| 11 |
| 44,570 |
| 0.8 | % | $ | 1,642 |
| 0.7 | % | $ | 36.84 | | $ | 36.84 | |
| 2026 |
| 18 |
| 109,542 |
| 2.0 | % |
| 5,555 |
| 2.2 | % |
| 50.71 | |
| 50.72 | |
| 2027 |
| 77 |
| 608,232 |
| 11.2 | % |
| 28,662 |
| 11.6 | % |
| 47.12 | |
| 47.73 | |
| 2028 |
| 42 |
| 412,123 |
| 7.6 | % |
| 19,544 |
| 7.9 | % |
| 47.42 | |
| 49.12 | |
| 2029 |
| 51 |
| 433,981 |
| 8.0 | % |
| 21,142 |
| 8.5 | % |
| 48.72 | |
| 50.93 | |
| 2030 |
| 33 |
| 618,182 |
| 11.4 | % |
| 29,827 |
| 12.0 | % |
| 48.25 | |
| 52.96 | |
| 2031 |
| 44 |
| 645,784 |
| 11.9 | % |
| 25,008 |
| 10.1 | % |
| 38.73 | |
| 40.88 | |
| 2032 |
| 21 |
| 869,200 |
| 16.0 | % |
| 37,748 |
| 15.2 | % |
| 43.43 | |
| 45.55 | |
| 2033 |
| 29 |
| 380,575 |
| 7.0 | % |
| 17,084 |
| 6.9 | % |
| 50.03 | |
| 58.63 | |
| 2034 |
| 26 |
| 245,900 |
| 4.5 | % |
| 12,992 |
| 5.2 | % |
| 52.83 | |
| 61.07 | |
| Thereafter |
| 57 |
| 1,055,063 |
| 19.6 | % |
| 48,846 |
| 19.7 | % |
| 46.30 | |
| 58.51 | |
| Total / Weighted Average |
| 409 |
| 5,423,152 |
| 100.0 | % | $ | 248,050 |
| 100.0 | % | $ | 46.07 | | $ | 50.90 | |
Note: Includes all leases as of September 30, 2026 for which a tenant has taken occupancy for office and retail space within our operating portfolio and assuming no exercise of renewal options or early termination rights. The weighted average remaining lease term for the entire portfolio is 5.3 years.
| (1) | Represents monthly base rent before Free Rent, plus tenant reimbursements, as of lease expiration multiplied by 12 and divided by square footage. Triple net leases are converted to a gross basis by adding tenant reimbursements to monthly base rent. Tenant reimbursements at lease expiration are estimated by escalating tenant reimbursements as of September 30, 2026, or management's estimate thereof, by 2.75% annually through the lease expiration year. |
| | Page 25 |
TENANT CONCENTRATION | SEPTEMBER 30, 2026 |
dollars in thousands | | | | At JBG SMITH Share |
| |||||||||
| | Tenant | | Number of Leases | | Square Feet | | % of Total Square Feet | | Annualized | | % of Total Annualized Rent |
| |
1 | | U.S. Government (GSA) | | 29 | | 1,430,498 | | 26.4 | % | $ | 57,457 | | 23.2 | % |
2 |
| Amazon | | 3 | | 357,339 |
| 6.6 | % | | 16,747 |
| 6.8 | % |
3 |
| Lockheed Martin Corporation | | 2 | | 183,442 |
| 3.4 | % | | 9,752 |
| 3.9 | % |
4 |
| Accenture Federal Services LLC | | 2 | | 123,706 |
| 2.3 | % | | 5,895 |
| 2.4 | % |
5 |
| SAIC | | 2 | | 109,510 |
| 2.0 | % | | 5,573 |
| 2.2 | % |
6 |
| Public Broadcasting Service | | 1 | | 120,328 |
| 2.2 | % | | 5,353 |
| 2.2 | % |
7 |
| Whole Foods Market Group Inc | | 3 | | 98,625 |
| 1.8 | % | | 4,019 |
| 1.6 | % |
8 |
| American Diabetes Association | | 1 | | 80,998 |
| 1.5 | % | | 3,972 |
| 1.6 | % |
9 |
| Nooks LLC | | 3 | | 76,328 |
| 1.4 | % | | 3,848 |
| 1.6 | % |
10 |
| Booz Allen Hamilton Inc | | 2 | | 69,328 |
| 1.3 | % | | 3,601 |
| 1.5 | % |
11 |
| National Consumer Cooperative | | 1 | | 65,736 |
| 1.2 | % | | 3,592 |
| 1.4 | % |
12 |
| Technomics Inc | | 1 | | 64,353 |
| 1.2 | % | | 3,018 |
| 1.2 | % |
13 | | Na Ali'i Consulting & Sales LLC | | 1 | | 53,645 | | 1.0 | % | | 2,660 | | 1.1 | % |
14 |
| DRS Tech Inc dba Finmeccanica | | 1 | | 46,184 |
| 0.9 | % | | 2,334 |
| 0.9 | % |
15 |
| The Aerospace Corporation | | 1 | | 43,402 |
| 0.8 | % | | 2,204 |
| 0.9 | % |
16 |
| Conservation International Foundation | | 1 | | 43,483 |
| 0.8 | % | | 2,158 |
| 0.9 | % |
17 |
| The Cadmus Group LLC | | 1 | | 42,361 |
| 0.8 | % | | 2,101 |
| 0.8 | % |
18 |
| American Systems | | 1 | | 42,743 |
| 0.8 | % | | 1,956 |
| 0.8 | % |
19 |
| Alamo Drafthouse Cinemas | | 1 | | 52,453 |
| 1.0 | % | | 1,925 |
| 0.8 | % |
20 |
| Winrock International | | 1 | | 30,616 |
| 0.6 | % | | 1,904 |
| 0.8 | % |
|
| Other | | 351 | | 2,288,074 |
| 42.0 | % | | 107,981 |
| 43.4 | % |
|
| Total | | 409 | | 5,423,152 |
| 100.0 | % | $ | 248,050 |
| 100.0 | % |
Note: Includes all leases as of September 30, 2026 for which a tenant has taken occupancy for office and retail space within our operating portfolio.
| | Page 26 |
INDUSTRY DIVERSITY | SEPTEMBER 30, 2026 |
dollars in thousands | | | | At JBG SMITH Share |
| |||||||||
| | | | Number of | | | | % of Total | | Annualized | | % of Total |
| |
| | Industry | | Leases | | Square Feet | | Square Feet | | Rent | | Annualized Rent |
| |
1 |
| Government Contractors |
| 92 |
| 1,437,829 |
| 26.5 | % | $ | 71,681 |
| 28.9 | % |
2 |
| Government |
| 31 |
| 1,438,909 |
| 26.5 | % | | 57,934 |
| 23.4 | % |
3 |
| Business Services |
| 43 |
| 851,751 |
| 15.7 | % |
| 39,552 |
| 15.9 | % |
4 |
| Member Organizations |
| 28 |
| 382,654 |
| 7.1 | % |
| 20,011 |
| 8.1 | % |
5 |
| Food and Beverage |
| 60 |
| 186,592 |
| 3.4 | % |
| 10,033 |
| 4.0 | % |
6 |
| Communications |
| 3 |
| 160,690 |
| 3.0 | % |
| 7,377 |
| 3.0 | % |
7 |
| Health Services |
| 26 |
| 168,262 |
| 3.1 | % |
| 6,221 |
| 2.5 | % |
8 |
| Real Estate |
| 21 |
| 119,739 |
| 2.2 | % |
| 3,526 |
| 1.4 | % |
9 |
| Legal Services |
| 11 |
| 65,653 |
| 1.2 | % |
| 3,407 |
| 1.4 | % |
10 |
| Educational Services |
| 4 |
| 41,699 |
| 0.8 | % |
| 1,694 |
| 0.7 | % |
|
| Other |
| 90 |
| 569,374 |
| 10.5 | % |
| 26,614 |
| 10.7 | % |
|
| Total |
| 409 |
| 5,423,152 |
| 100.0 | % | $ | 248,050 |
| 100.0 | % |
Note: Includes all leases as of September 30, 2026 for which a tenant has taken occupancy for office and retail space within our operating portfolio.
| | Page 27 |
PROPERTY TABLE - MULTIFAMILY | SEPTEMBER 30, 2026 |
Property Table – Multifamily
| | | | | | | | | | | | | | | | | | | | | | | | | | | | | | | | | |
| | | | | | | | | | | | | | | | | | | | | | | | | | | | | | Monthly | | | Monthly |
| | | | | | | | Same Store (2): | | | | Number | | Total | | Multifamily | | Retail | | | | Multifamily | | Retail | | | Annualized | | | Rent | | | Rent Per |
| | | | % | | | | Q3 2025 ‑ 2026 / | | Year Built / | | of | | Square | | Square | | Square | | | | % | | % | | | Rent | | | Per | | | Square |
Multifamily Assets | | Submarket | | Ownership | | C/U (1) | | YTD 2025 - 2026 | | Renovated | | Units | | Feet | | Feet | | Feet | | % Leased | | Occupied | | Occupied | | | (in thousands) | | | Unit (3) | | | Foot (4) |
| | | | | | | | | | | | | | | | | | | | | | | | | | | | | | | | | |
National Landing |
| |
| |
| |
| |
| |
| |
| |
| |
| |
| | | | | | |
| | |
| | |
| |
RiverHouse Apartments |
| National Landing |
| 100.0 | % | C |
| Y / Y |
| 1960 / 2014 |
| 1,676 |
| 1,326,219 |
| 1,324,889 |
| 1,330 |
| 92.4% | | 90.8% | | 100.0% | | $ | 39,188 | | $ | 2,144 | | $ | 2.72 |
The Bartlett |
| National Landing |
| 100.0 | % | C |
| Y / Y |
| 2016 / N/A |
| 699 |
| 619,372 |
| 577,295 |
| 42,077 |
| 97.5% | | 96.4% | | 100.0% | |
| 26,626 | |
| 3,080 | |
| 3.75 |
Reva | | National Landing | | 100.0 | % | C | | Y / N | | 2024 / N/A | | 471 | | 324,188 | | 310,417 | | 13,771 | | 94.1% | | 93.4% | | 79.7% | | | 15,082 | | | 2,729 | | | 4.18 |
The Grace | | National Landing | | 100.0 | % | C | | Y / N | | 2024 / N/A | | 337 | | 311,903 | | 287,229 | | 24,674 | | 95.4% | | 94.7% | | 100.0% | | | 15,359 | | | 3,654 | | | 4.27 |
The Zoe | | National Landing | | 100.0 | % | C | | N / N | | 2025 / N/A | | 420 | | 274,995 | | 266,879 | | 8,116 | | 85.9% | | 83.6% | | 100.0% | | | 11,157 | | | 2,577 | | | 4.21 |
220 20th Street |
| National Landing |
| 100.0 | % | C |
| Y / Y |
| 2009 / N/A |
| 265 |
| 271,476 |
| 269,913 |
| 1,563 |
| 95.9% | | 94.0% | | 100.0% | |
| 9,294 | |
| 3,091 | |
| 3.06 |
2221 S. Clark Street - |
| National Landing |
| 100.0 | % | C |
| Y / Y |
| 1964 / 2016 |
| 216 |
| 96,948 |
| 96,948 |
| — |
| 75.8% | | 72.9% | | — | |
| 3,930 | |
| 2,081 | |
| 4.52 |
| | | | | | | | | | | | | | | | | | | | | | | | | | | | | | | | | |
DC | | |
| |
| |
| |
| |
| |
| |
| |
| |
| | | |
| |
| | |
| | |
| | |
The Wren | | U Street/Shaw | | 100.0 | % | C | | Y / Y | | 2020 / N/A | | 433 | | 332,682 | | 289,686 | | 42,996 | | 95.0% | | 93.3% | | 100.0% | | $ | 12,277 | | $ | 2,258 | | $ | 3.38 |
F1RST Residences |
| Ballpark |
| 100.0 | % | C |
| Y / Y |
| 2017 / N/A |
| 325 |
| 270,929 |
| 249,456 |
| 21,473 |
| 96.2% | | 95.7% | | 83.6% | |
| 10,568 | |
| 2,472 | |
| 3.22 |
Atlantic Plumbing |
| U Street/Shaw |
| 100.0 | % | C |
| Y / Y |
| 2015 / N/A |
| 310 |
| 245,228 |
| 221,788 |
| 23,440 |
| 95.0% | | 94.5% | | 90.7% | |
| 10,633 | |
| 2,709 | |
| 3.77 |
1221 Van Street |
| Ballpark |
| 100.0 | % | C |
| Y / Y |
| 2018 / N/A |
| 291 |
| 225,592 |
| 202,715 |
| 22,877 |
| 96.6% | | 95.2% | | 100.0% | |
| 9,648 | |
| 2,457 | |
| 3.52 |
901 W Street | | U Street/Shaw | | 100.0 | % | C | | Y / Y | | 2019 / N/A | | 161 | | 154,340 | | 135,499 | | 18,841 | | 95.2% | | 95.7% | | 87.9% | | | 6,263 | | | 2,760 | | | 3.28 |
900 W Street | | U Street/Shaw | | 100.0 | % | C | | Y / Y | | 2019 / N/A | | 95 | | 71,053 | | 71,053 | | — | | 73.7% | | 72.6% | | — | | | 2,442 | | | 2,949 | | | 4.02 |
West Half |
| Ballpark |
| 60.0 | % | C |
| Y / Y |
| 2019 / N/A |
| 465 |
| 385,381 |
| 343,089 |
| 42,292 |
| 95.5% | | 94.6% | | 92.4% | | | 16,793 | | | 2,627 | | | 3.60 |
| | | | | | | | | | | | | | | | | | | | | | | | | | | | | | | | | |
Total / Weighted Average (5) |
| |
| |
| |
| |
| |
| 6,164 |
| 4,910,306 |
| 4,646,856 |
| 263,450 |
| 94.0% | | 92.5% | | 94.7% | | $ | 185,330 | | $ | 2,602 | | $ | 3.42 |
| | | | | | | | | | | | | | | | | | | | | | | | | | | | | | | | | |
Recently Delivered |
| |
| |
| |
| |
| |
| |
| |
| |
| |
| |
| | | | |
| | |
| | |
| |
| | | | | | | | | | | | | | | | | | | | | | | | | | | | | | | | | |
National Landing | | | | | | | | | | | | | | | | | | | | | | | | | | | | | | | | | |
Valen | | National Landing | | 100.0 | % | C | | N / N | | 2025 / N/A | | 355 | | 302,803 | | 291,707 | | 11,096 | | 76.8% | | 76.1% | | 30.5% | | $ | 10,988 | | $ | 3,322 | | $ | 3.96 |
| | | | | | | | | | | | | | | | | | | | | | | | | | | | | | | | | |
Operating - Total / Weighted Average (5) |
| |
| |
| |
| |
| 6,519 |
| 5,213,109 |
| 4,938,563 |
| 274,546 |
| 92.9% | | 91.6% | | 92.1% | | $ | 196,318 | | $ | 2,636 | | $ | 3.44 | ||
| | | | | | | | | | | | | | | | | | | | | | | | | | | | | | | | | |
Under-Construction |
| |
| |
| |
| |
| |
| |
| |
| |
| |
| |
| |
| | |
| | |
| | |
| |
| | | | | | | | | | | | | | | | | | | | | | | | | | | | | | | | | |
National Landing |
| |
| |
| |
| |
| |
| |
| |
| |
| | | | | | | | | | | | | | | | |
2200 Crystal Drive (6) | | National Landing | | 30.0 | % | U | | | | | | 195 | | 213,132 | | 213,132 | | — | | | | | | | | | | | | | | | |
| | | | | | | | | | | | | | | | | | | | | | | | | | | | | | | | | |
Total |
| |
| |
| |
| |
| |
| 6,714 |
| 5,426,241 |
| 5,151,695 |
| 274,546 |
| |
| |
| |
| | |
| | |
| | |
| | Page 28 |
PROPERTY TABLE - MULTIFAMILY | SEPTEMBER 30, 2026 |
| | | | | | | | | | | | | | | | | | | | | | | | | | | | | | | | | |
| | | | | | | | | | | | | | | | | | | | | | | | | | | | | | Monthly | | | Monthly |
| | | | | | | | Same Store (2): | | | | Number | | Total | | Multifamily | | Retail | | | | Multifamily | | Retail | | | Annualized | | | Rent | | | Rent Per |
| | | | % | | | | Q3 2025 ‑ 2026 / | | Year Built / | | of | | Square | | Square | | Square | | | | % | | % | | | Rent | | | Per | | | Square |
Multifamily Assets | | Submarket | | Ownership | | C/U (1) | | YTD 2025 - 2026 | | Renovated | | Units | | Feet | | Feet | | Feet | | % Leased | | Occupied | | Occupied | | | (in thousands) | | | Unit (3) | | | Foot (4) |
| | | | | | | | | | | | | | | | | | | | | | | | | | | | | | | | | |
Totals at JBG SMITH Share (5) |
| |
| |
| |
| |
| |
| |
| |
| |
| |
| |
| |
| |
| | |
| | |
| | |
| | | | | | | | | | | | | | | | | | | | | | | | | | | | | | | | | |
National Landing | | | | | | | | | | | | 4,084 | | 3,225,101 | | 3,133,570 | | 91,531 | | 93.6% | | 91.9% | | 96.9% | | $ | 116,706 | | $ | 2,638 | | $ | 3.38 |
DC | | | | | | | | | | | | 1,894 | | 1,531,053 | | 1,376,050 | | 155,002 | | 94.6% | | 93.6% | | 93.6% | | | 61,907 | | | 2,527 | | | 3.48 |
In-Service assets |
| |
| |
| |
| |
| |
| 5,978 |
| 4,756,154 |
| 4,509,620 |
| 246,533 |
| 93.9% | | 92.5% | | 94.8% | | $ | 178,613 | | $ | 2,601 | | $ | 3.41 |
Recently Delivered asset |
| |
| |
| |
| |
| |
| 355 | | 302,803 | | 291,707 | | 11,096 | | 76.8% | | 76.1% | | 30.5% | | | 10,988 | | | 3,322 | | | 3.96 |
Operating - Total / Weighted Average |
| |
| |
| |
| |
| 6,333 |
| 5,058,957 |
| 4,801,327 |
| 257,629 |
| 92.9% | | 91.5% | | 92.1% | | $ | 189,601 | | $ | 2,636 | | $ | 3.44 | ||
Under-Construction asset |
| |
| |
| |
| |
| |
| 59 |
| 63,940 |
| 63,940 |
| — |
| | | |
| | |
| | |
| | |
| |
| Number of Assets and Total Square Feet/Units Reconciliation |
| ||||||
| | | Number of | | At 100% Share | | At JBG SMITH Share |
|
| Operating Assets | | Assets | | Square Feet/Units | | Square Feet/Units | |
| Q2 2026 |
| 15 |
| 5,213,108 SF/ |
| 5,058,956 SF/ | |
| Acquisitions |
| — |
| — |
| — | |
| Placed into service |
| — |
| — |
| — | |
| Dispositions | | — |
| — | | — | |
| Out-of-service adjustment | | — |
| — | | — | |
| Portfolio reclassification | | — | | — | | — | |
| Building re-measurements | | — |
| 1 SF |
| 1 SF | |
| Q3 2026 |
| 15 |
| 5,213,109 SF/ |
| 5,058,957 SF/ | |
Note: At 100% share, unless otherwise noted.
| (1) | "C" denotes a consolidated interest and "U" denotes an unconsolidated interest. |
| (2) | "Y" denotes an asset as Same Store and "N" denotes an asset as Non-Same Store. |
| (3) | Represents multifamily rent divided by occupied multifamily units; retail rent is excluded from this metric. Occupied units may differ from leased units because leased units include leases that have been signed but the tenant has not yet taken occupancy (not yet included in Percent Occupied metrics). |
| (4) | Represents multifamily rent divided by occupied multifamily square footage; retail rent and retail square footage are excluded from this metric. Occupied multifamily square footage may differ from leased multifamily square footage because leased multifamily square footage includes space for leases that have been signed but the tenant has not yet taken occupancy (not yet included in Percent Occupied metrics). |
| (5) | 2221 S. Clark Street - Residential is excluded from Percent Leased, Percent Occupied, Annualized Rent, Monthly Rent Per Unit and Monthly Rent per Square Foot metrics as it is operated as a short-term rental property. |
| (6) | See footnote (2) on page 32. |
| | Page 29 |
PROPERTY TABLE - COMMERCIAL | SEPTEMBER 30, 2026 |
| | | | | | | | | | | | | | | | | | | | | | | | | | | | Office |
| | | | | | | | | | | | | | | | | | | | | | | | | | | | Annualized |
| | | | | | | | Same Store (2): | | | | | | | | | | | | | | | | | Annualized | | | Rent Per |
| | | | % | | | Q3 2025 ‑ 2026 / | | Year Built / | | Total | | Office | | Retail | | % | | Office % | | Retail % | | | Rent | | | Square | |
Commercial Assets | | Submarket | | Ownership | | C/U (1) | | YTD 2025 - 2026 | | Renovated | | Square Feet | | Square Feet | | Square Feet | | Leased | | Occupied | | Occupied | | | (in thousands) | | | Foot (3) |
| | | | | | | | | | | | | | | | | | | | | | | | | | | | |
National Landing |
| |
| |
| |
| |
| |
| |
| | | | | | | | | | |
| | |
| |
1550 Crystal Drive (4) | | National Landing |
| 100.0 | % | C |
| Y / Y |
| 1980 / 2020 |
| 553,884 |
| 449,839 | | 104,045 | | 91.1% | | 85.8% | | 99.7% | | $ | 22,802 | | $ | 46.51 |
2121 Crystal Drive |
| National Landing |
| 100.0 | % | C |
| Y / Y |
| 1985 / 2006 |
| 509,429 |
| 503,842 | | 5,587 | | 78.3% | | 68.8% | | 100.0% | |
| 18,203 | |
| 52.39 |
2345 Crystal Drive |
| National Landing |
| 100.0 | % | C |
| Y / Y |
| 1988 / 2019 |
| 499,686 |
| 489,061 | | 10,625 | | 33.4% | | 32.5% | | 74.3% | |
| 7,431 | |
| 46.70 |
2231 Crystal Drive |
| National Landing |
| 100.0 | % | C |
| Y / Y |
| 1987 / 2009 |
| 468,267 |
| 416,340 | | 51,927 | | 74.3% | | 71.4% | | 97.4% | |
| 16,588 | |
| 48.96 |
2011 Crystal Drive |
| National Landing |
| 100.0 | % | C |
| Y / Y |
| 1984 / 2026 |
| 445,365 |
| 425,074 | | 20,291 | | 68.1% | | 65.0% | | 100.0% | |
| 13,934 | |
| 50.32 |
2451 Crystal Drive |
| National Landing |
| 100.0 | % | C |
| Y / Y |
| 1990 / 2019 |
| 402,276 |
| 390,219 | | 12,057 | | 85.4% | | 85.2% | | 92.6% | |
| 15,663 | |
| 51.51 |
241 18th Street S. (4) |
| National Landing |
| 100.0 | % | C |
| Y / Y |
| 1977 / 2013 |
| 337,041 |
| 334,030 | | 3,011 | | 90.0% | | 89.9% | | 100.0% | |
| 13,718 | |
| 45.51 |
201 12th Street S. |
| National Landing |
| 100.0 | % | C |
| Y / Y |
| 1987 / 2014 |
| 335,340 |
| 323,127 | | 12,213 | | 92.1% | | 91.8% | | 100.0% | |
| 12,932 | |
| 41.68 |
251 18th Street S. (4) |
| National Landing |
| 100.0 | % | C |
| Y / Y |
| 1975 / 2013 |
| 301,049 |
| 297,511 | | 3,538 | | 99.0% | | 100.0% | | 15.1% | |
| 14,667 | |
| 49.19 |
1770 Crystal Drive | | National Landing | | 100.0 | % | C | | Y / Y | | 2020 / N/A | | 273,787 | | 259,651 | | 14,136 | | 98.3% | | 100.0% | | 67.8% | | | 12,716 | | | 46.60 |
200 12th Street S. |
| National Landing |
| 100.0 | % | C |
| Y / Y |
| 1985 / 2013 |
| 202,761 |
| 202,761 | | — | | 52.8% | | 52.8% | | — | |
| 5,072 | |
| 47.34 |
1901 South Bell Street (4) |
| National Landing |
| 100.0 | % | C |
| Y / Y |
| 1968 / 2008 |
| 71,986 |
| 71,986 | | — | | 100.0% | | 100.0% | | — | |
| 2,837 | |
| 39.41 |
Crystal Drive Retail (4) |
| National Landing |
| 100.0 | % | C |
| Y / Y |
| 2003 / 2004 |
| 44,094 |
| — | | 44,094 | | 75.2% | | — | | 75.2% | |
| 1,747 | |
| — |
| | | | | | | | | | | | | | | | | | | | | | | | | | | | |
1235 S. Clark Street |
| National Landing |
| 100.0 | % | C |
| Y / Y |
| 1981 / 2007 |
| 384,688 |
| 336,342 | | 48,346 | | 63.5% | | 58.5% | | 97.8% | |
| 9,914 | |
| 44.28 |
1215 S. Clark Street |
| National Landing |
| 100.0 | % | C |
| Y / Y |
| 1983 / 2016 |
| 336,159 |
| 333,546 | | 2,613 | | 99.6% | | 100.0% | | 44.5% | |
| 11,557 | |
| 34.56 |
1225 S. Clark Street |
| National Landing |
| 100.0 | % | C |
| Y / Y |
| 1982 / 2013 |
| 276,184 |
| 263,334 | | 12,850 | | 97.8% | | 98.7% | | 80.9% | |
| 11,811 | |
| 44.58 |
| | | | | | | | | | | | | | | | | | | | | | | | | | | | |
Other |
| |
| |
| |
| |
| |
| |
| | | | | | | | | | |
| | |
| |
Tysons Dulles Plaza | | Tysons | | 50.0 | % | C | | Y / N | | 1988 / 2020 | | 491,494 | | 450,721 | | 40,773 | | 63.8% | | 63.2% | | 70.1% | | $ | 13,525 | | $ | 43.43 |
800 North Glebe Road (5) |
| Ballston |
| 100.0 | % | C |
| Y / Y |
| 2012 / N/A |
| 306,210 |
| 279,848 | | 26,362 | | 81.2% | | 82.2% | | 70.5% | | | 12,259 | | | 48.98 |
One Democracy Plaza (6) (7) |
| Bethesda - Rock Spring |
| 100.0 | % | C |
| Y / Y |
| 1987 / 2013 |
| 213,417 |
| 211,249 | | 2,168 | | 80.4% | | 80.5% | | 69.6% | | | 5,125 | | | 29.95 |
1101 17th Street |
| DC CBD |
| 100.0 | % | C |
| Y / Y |
| 1964 / 1999 |
| 210,494 |
| 200,740 | | 9,754 | | 81.5% | | 81.2% | | 64.0% | |
| 9,808 | |
| 57.34 |
Dulles View (7) (8) | | Dulles | | 60.0 | % | U | | N / N | | 2008 / N/A | | 360,482 | | 360,482 | | — | | 67.9% | | 67.9% | | — | | | 9,261 | | | 37.84 |
4747 Bethesda Avenue (9) | | Bethesda CBD | | 20.0 | % | U | | Y / Y | | 2019 / N/A | | 300,535 | | 286,226 | | 14,309 | | 92.8% | | 92.4% | | 100.0% | | | 21,974 | | | 76.22 |
| | | | | | | | | | | | | | | | | | | | | | | | | | | | |
Operating - Total / Weighted Average |
| |
| |
| |
| |
| 7,324,628 |
| 6,885,929 | | 438,699 | | 78.3% | | 76.6% | | 87.9% | | $ | 263,544 | | $ | 47.16 | ||
| | | | | | | | | | | | | | | | | | | | | | | | | | | | |
Totals at JBG SMITH Share |
| |
| |
| |
| |
| |
| |
| |
| |
| |
| |
| |
| | |
| | |
National Landing Unlevered |
| |
| |
| |
| |
| |
| 4,444,965 |
| 4,163,441 | | 281,524 | | 77.8% | | 75.2% | | 91.6% | | $ | 158,309 | | $ | 47.80 |
National Landing Levered | | | | | | | | | | | | 997,031 | | 933,222 | | 63,809 | | 85.2% | | 84.7% | | 92.2% | | | 33,282 | | | 40.28 |
Other | | | | | | | | | | | | 1,252,264 | | 1,190,732 | | 61,532 | | 75.9% | | 76.0% | | 70.6% | | | 43,907 | | | 45.82 |
Operating - Total / Weighted Average |
| |
| |
| |
| |
| 6,694,260 |
| 6,287,395 | | 406,865 | | 78.5% | | 76.8% | | 88.5% | | $ | 235,498 | | $ | 46.18 | ||
| | Page 30 |
PROPERTY TABLE - COMMERCIAL | SEPTEMBER 30, 2026 |
| Number of Assets and Total Square Feet Reconciliation | | | | |
| ||
| | | Number of | | At 100% Share | | At JBG SMITH Share |
|
| Operating Assets | | Assets | | Square Feet | | Square Feet |
|
| Q2 2026 |
| 22 |
| 7,324,889 |
| 6,694,521 | |
| Acquisitions | | — | | — | | — | |
| Placed into service |
| — |
| — |
| — | |
| Dispositions |
| — |
| — |
| — | |
| Out-of-service adjustment |
| — |
| — |
| — | |
| Portfolio reclassification | | — |
| — |
| — | |
| Building re-measurements |
| — |
| (261) |
| (261) | |
| Other | | — | | — | | — | |
| | | | | | | | |
| Q3 2026 |
| 22 |
| 7,324,628 |
| 6,694,260 | |
Note: At 100% share, unless otherwise noted.
| (1) | "C" denotes a consolidated interest and "U" denotes an unconsolidated interest. |
| (2) | "Y" denotes an asset as Same Store and "N" denotes an asset as Non-Same Store. |
| (3) | Represents annualized office rent divided by occupied office square footage; annualized retail rent and retail square footage are excluded from this metric. Annualized Rent and Annualized Rent per Square Foot exclude percentage rent and the square footage of tenants that only pay percentage rent. Occupied office square footage may differ from leased office square footage because leased office square footage includes space for leases that have been signed but the tenant has not yet taken occupancy (not yet included in Percent Occupied metrics). |
| (4) | The following assets contain space that is held for development or not otherwise available for lease. This out-of-service square footage is excluded from Square Feet, leased, and occupancy metrics. |
| | | | | Not Available | |
| Commercial Asset | | In-Service | | for Lease |
|
| 1550 Crystal Drive | | 553,884 | | 5,625 | |
| 241 18th Street S. | | 337,041 | | 26,557 | |
| 251 18th Street S. | | 301,049 | | 39,520 | |
| 1901 South Bell Street | | 71,986 | | 202,926 | |
| Crystal Drive Retail | | 44,094 | | 85,052 | |
| 2221 S. Clark Street - Office | | - | | 35,182 | |
| (5) | In October 2026, we formed a real estate venture to recapitalize 800 North Glebe Road, in which we retained a 10.0% interest. |
| (6) | Subject to a ground lease with an expiration date of 11/17/2084. |
| (7) | Not Metro-Served. |
| (8) | In October 2026, we formed a real estate venture to recapitalize our interest in Dulles View, in which we retained a 30.0% interest. |
| (9) | Includes JBG SMITH's corporate office lease of 62,645 square feet. |
| | Page 31 |
PROPERTY TABLE – UNDER-CONSTRUCTION | SEPTEMBER 30, 2026 |
| dollars in thousands | | | | | | | | | | | | | | | | | | | | |
| ||||
| | | | | | | | | | | Schedule | | At JBG SMITH Share | | ||||||||||||
| | | | | | | Estimated | | Estimated | | | | Estimated | | Estimated | | | | | Estimated | | Estimated |
| |||
| | | | | % | | Square | | Number of | | Construction | | Completion | | Stabilization | | Historical | | Incremental | | Total | | ||||
| Asset | | Submarket | | Ownership | | Feet | | Units | | Start Date | | Date | | Date | | Cost (1) | | Investment | | Investment | | ||||
| | | | | | | | | | | | | | | | | | | | | | | | | | |
| Multifamily | | | | | | | | | | | | | | | | | | | | | | | | | |
| National Landing |
| |
| |
| |
| |
| |
| | |
| | |
| | |
| | |
| | |
| 2200 Crystal Drive (2) | | National Landing | | 30.0% | | 213,132 | | 195 | | Q2 2026 | | | Q2 2028 | | Q4 2028 | | $ | 10,019 | | $ | 17,406 | | $ | 27,425 | |
| | | | | | | | | | | | | | | | | | | | | | | | | | |
| | | | | | | | | | | | | | | | | | | | | | | | | | |
| Under-Construction at JBG SMITH Share | 63,940 |
| 59 |
| | | | | | | | | | | | | | | | | |||||
Weighted average Projected NOI Yield at JBG SMITH Share: | | Multifamily | ||
Estimated Total Investment |
| | 7.5 | % |
Estimated Incremental Investment |
| | 11.8 | % |
Estimated Stabilized NOI at JBG SMITH Share (dollars in millions) | | $ | 2.0 | |
Note: At 100% share, unless otherwise noted.
| (1) | Historical Cost excludes certain GAAP adjustments such as capitalized interest and ground lease costs. See definition of Historical Cost on page 39. |
| (2) | Ownership percentage reflects expected dilution of our ownership interest as contributions are funded by our real estate venture partner during the construction of the asset. As of September 30, 2026, our ownership interest was 63.3%, which is the ownership percentage used to calculate Historical Cost at JBG SMITH Share. |
| | Page 32 |
PROPERTY TABLE – DEVELOPMENT PIPELINE | SEPTEMBER 30, 2026 |
Property Table – Development
| dollars in thousands, at JBG SMITH Share | | | | | | |
| ||
| | | | | | | | | |
|
| | | | | | | | | |
|
| | | | | | | | | | |
| | | Estimated Potential Development Density (SF) | | ||||||
| Submarket |
| Total |
| Multifamily | | Office |
| Retail |
|
| | | | | | | | | | |
| National Landing | | 3,182,900 | | 2,440,600 | | 656,400 | | 85,900 | |
| DC | | 175,700 | | 42,700 | | 133,000 | | — | |
| Other VA | | 152,700 | | — | | 152,700 | | — | |
| | | 3,511,300 | | 2,483,300 | | 942,100 | | 85,900 | |
| | | | | | | | | | |
| Historical Cost (1) |
| $ 301,192 | | | | | | | |
| (1) | Historical Cost excludes certain GAAP adjustments, such as capitalized interest and ground lease costs. See definition of Historical Cost on page 39. |
| | Page 33 |
DISPOSITION AND RECAPITALIZATION ACTIVITY | SEPTEMBER 30, 2026 |
| dollars in thousands, at JBG SMITH Share | | | | | | | | | | | | | | | |
| | | | | | | | | | | | | | | | |
| | | | | | | | | | | | | | | | |
| | | | | | | | | | | | | | | | |
| | | | | | | | | | | | Units / | | Gross Sales | | |
| Assets | | % Ownership | | Asset Type | | Location | | Date Disposed | | Total Square Feet | | Price |
| ||
| | | | | | | | | | | | | | | | |
| Q1 2026 | | | | | | | | | | | | | | | |
| Potomac Yard Landbay H | | 100.0% | | Development Pipeline | | Alexandria, VA | | | February 11, 2026 | | 347,700 SF | (1) | $ | 50,700 | |
| | | | | | | | | | | | | | | | |
| Q2 2026 | | | | | | | | | | | | | | | |
| None | | | | | | | | | | | | | | | |
| | | | | | | | | | | | | | | | |
| Q3 2026 | | | | | | | | | | | | | | | |
| Development Parcel (2) | | 100.0% | | Development Pipeline | | Arlington, VA | | | July 16, 2026 | | — | | | 3,600 | |
| | | | | | | | | | | | | | | | |
| | | | | | | | | | | | | | | | |
| Total |
| |
| |
| | |
| |
| | | $ | 54,300 | |
| | | | | | | | | | | | | | | | |
| (1) | Square footage represents Estimated Potential Development Density. |
| (2) | One of the parcels that was acquired in December 2020 along with the development pipeline parcel formerly occupied by the Americana Hotel. |
Recapitalization Activity:
In April 2026, we formed a real estate venture to recapitalize Tysons Dulles Plaza, a 491,494-square-foot commercial asset in Tysons, Virginia, in which we sold a 50.0% interest. We retained management of the asset and continue to account for the asset on a consolidated basis.
In May 2026, we formed an unconsolidated real estate venture to recapitalize 2200 Crystal Drive, an office building in Arlington, Virginia, which the venture is converting into a 195-unit multifamily asset. We contributed 2200 Crystal Drive to the real estate venture, and our venture partner has committed to contribute the equity required to fund the construction for a 70.0% interest, which is expected to reduce our ownership interest from 100.0% at the formation of the real estate venture to 30.0% when all contributions are funded.
In October 2026, we formed a real estate venture to recapitalize 800 North Glebe Road, a 306,210-square-foot commercial asset in Arlington, Virginia, in which we sold a 90.0% interest. We retained management and leasing of the asset and will account for the asset as an unconsolidated real estate venture.
In October 2026, we formed a real estate venture to recapitalize our 60.0% interest in Dulles View, a 360,482-square-foot commercial asset in Dulles, Virginia, in which we retained a 30.0% interest.
| | Page 34 |
DEBT SUMMARY | SEPTEMBER 30, 2026 |
Debt Summary
| dollars in thousands, at JBG SMITH Share | | | | | | | | | | | | | | | | | | | |
| | | 2026 | | 2027 | | 2028 | | 2029 | | 2030 | | Total |
| ||||||
| | | | | | | | | | | | | | | | | | | | |
| Consolidated and Unconsolidated Principal Balance | | | | | | | | | | | | | | | | | | | |
| Unsecured Debt: | | | | | | | | | | | | | | | | | | | |
| Revolving credit facility ($690.0 million commitment) (1) | | $ | — | | $ | — | | $ | — | | $ | — | | $ | 222,000 | | $ | 222,000 | |
| Term loans ($735.0 million commitment) | |
| — | |
| 200,000 | |
| 535,000 | |
| — | |
| — | |
| 735,000 | |
| Total unsecured debt | |
| — | |
| 200,000 | |
| 535,000 | |
| — | |
| 222,000 | |
| 957,000 | |
| Secured Debt: | |
| | |
| | |
| | |
| | |
| | |
| | |
| Consolidated principal balance | |
| 105,000 | |
| 331,664 | |
| 85,000 | |
| 283,620 | |
| 827,180 | |
| 1,632,464 | |
| Unconsolidated principal balance | |
| — | |
| 35,000 | |
| — | |
| — | |
| — | |
| 35,000 | |
| Total secured debt | |
| 105,000 | |
| 366,664 | |
| 85,000 | |
| 283,620 | |
| 827,180 | |
| 1,667,464 | |
| | | | | | | | | | | | | | | | | | | | |
| Total Consolidated and Unconsolidated Principal Balance | | $ | 105,000 | | $ | 566,664 | | $ | 620,000 | | $ | 283,620 | | $ | 1,049,180 | | $ | 2,624,464 | |
| | | | | | | | | | | | | | | | | | | | |
| % of total debt maturing | |
| 4.0 | % |
| 21.6 | % |
| 23.6 | % |
| 10.8 | % |
| 40.0 | % |
| 100.0 | % |
| % floating rate (2) | |
| 100.0 | % |
| 41.4 | % |
| 13.7 | % |
| 3.5 | % |
| 41.7 | % |
| 33.2 | % |
| % fixed rate (3) | |
| — | |
| 58.6 | % |
| 86.3 | % |
| 96.5 | % |
| 58.3 | % |
| 66.8 | % |
| | | | | | | | | | | | | | | | | | | | |
| Weighted Average Interest Rates | |
| | |
| | |
| | |
| | |
| | |
| | |
| Variable rate (4) | |
| 5.26 | % |
| 6.03 | % |
| 5.61 | % |
| 6.01 | % |
| 4.96 | % |
| 5.36 | % |
| Fixed rate | |
| — | |
| 4.57 | % |
| 4.58 | % |
| 5.19 | % |
| 5.48 | % |
| 4.99 | % |
| Total Weighted Average Interest Rates | |
| 5.26 | % |
| 5.17 | % |
| 4.72 | % |
| 5.22 | % |
| 5.27 | % |
| 5.11 | % |
| | Revolving Credit Facility and Term Loans | ||||||||||||||||||||||||||||
| | Revolving | | | | Tranche A-2 | | | | Tranche A-2 | | Total/ | | |||||||||||||||||
| | Credit | | Tranche A-1 | | Term Loan | | 2023 | | Term Loan | | Weighted | | |||||||||||||||||
| | Facility (1) | | Term Loan | | Non-Extending | | Term Loan | | Extending | | Average | | |||||||||||||||||
Credit limit | | $ | 690,000 | | $ | 200,000 | | $ | 171,143 | | $ | 120,000 | | $ | 243,857 | | $ | 1,425,000 | | |||||||||||
Outstanding principal balance | | $ | 222,000 | | $ | 200,000 | | $ | 171,143 | | $ | 120,000 | | $ | 243,857 | | $ | 957,000 | | |||||||||||
Letters of credit | | $ | 13,844 | | $ | — | | $ | — | | $ | — | | $ | — | | $ | 13,844 | | |||||||||||
Undrawn capacity | | $ | 454,156 | | $ | — | | $ | — | | $ | — | | $ | — | | $ | 454,156 | | |||||||||||
Interest rate spread (5) | | | 1.50 | % | | 1.35 | % | | 1.50 | % | | 1.40 | % | | 1.50 | % | | 1.46 | % | |||||||||||
All-In interest rate (6) | | | 5.40 | % | | 5.35 | % | | 4.31 | % | | 5.41 | % | | 4.37 | % | | 4.93 | % | |||||||||||
Initial maturity date | | | Aug‑30 | | | Jan‑27 | | | Jan‑28 | | | Jun‑28 | | | Aug‑28 | | | — | | |||||||||||
Note: Amounts shown based on initial maturity date.
| (1) | Subsequent to quarter end, we repaid $67.0 million under the revolving credit facility. |
| (2) | Floating rate debt includes floating rate loans with interest rate caps. |
| (3) | Fixed rate debt includes floating rate loans with interest rate swaps. Including interest rate caps, 83.9% of our debt is fixed or hedged. |
| | Page 35 |
DEBT SUMMARY | SEPTEMBER 30, 2026 |
| (5) | The interest rate for the revolving credit facility excludes a 0.20% facility fee. In January 2028, the interest rate spread on the Tranche A-2 Term Loan-Extending will increase by 0.25%, the 0.10% credit spread adjustment will be removed, and interest rate swaps will commence that fix SOFR at 4.43%. |
| (6) | The all-in interest rate is inclusive of interest rate swaps. As of September 30, 2026, we had interest rate swaps for the Tranche A-1 Term Loan and the 2023 Term Loan, and we had interest rate swaps with a total notional value of $400.0 million for the Tranche A-2 Term Loan. |
| | Page 36 |
DEBT BY INSTRUMENT | SEPTEMBER 30, 2026 |
| dollars in thousands | | | | | | | Stated | | Interest | | Current | | | Initial | | Extended | |
| | | % | | Principal | | Interest | | Rate | | Annual | | | Maturity | | Maturity |
| |
| Asset | | Ownership | | Balance | | Rate | | Hedge (1) |
| Interest Rate (2) | | | Date | | Date (3) | | |
| | | | | | | | | | | | | | | | | |
|
| Consolidated | | | | | | | | | | | | | | | | | |
| 1215 S. Clark Street | | 100.0 | % | $ | 105,000 | | S + 1.35 | % | — | | 5.26 | % | | 12/22/26 | | 12/22/26 | |
| Tranche A-1 Term Loan |
| 100.0 | % | | 200,000 |
| S + 1.35 | % | Swap |
| 5.35 | % | | 01/14/27 | | 01/14/27 | |
| The Zoe and Valen (4) | | 100.0 | % | | 199,468 | | S + 2.25 | % | Cap | | 6.16 | % | | 01/22/27 | | 01/22/27 | |
| 1101 17th Street | | 100.0 | % | | 59,650 | | 2.70 | % | Fixed | | 2.70 | % | | 07/14/27 | | 07/14/27 | |
| 1235 S. Clark Street |
| 100.0 | % |
| 72,546 |
| 3.94 | % | Fixed |
| 3.94 | % | | 11/01/27 | | 11/01/27 | |
| Tranche A-2 Term Loan - Non-Extending |
| 100.0 | % |
| 171,143 |
| S + 1.50 | % | Swap |
| 4.31 | % | | 01/13/28 | | 01/13/28 | |
| 2023 Term Loan | | 100.0 | % | | 120,000 | | S + 1.40 | % | Swap | | 5.41 | % | | 06/29/28 | | 06/29/28 | |
| 1225 S. Clark Street |
| 100.0 | % |
| 85,000 |
| S + 1.70 | % | — |
| 5.61 | % | | 07/27/28 | | 07/27/28 | |
| The Grace and Reva | | 100.0 | % | | 273,620 | | 5.19 | % | Fixed | | 5.19 | % | | 12/01/29 | | 12/01/29 | |
| Multifamily Credit Facility (The Wren and F1RST Residences) | | 100.0 | % | | 187,557 | | 5.13 | % | Fixed | | 5.13 | % | | 02/01/30 | | 02/01/30 | |
| RiverHouse Apartments (Ashley and Potomac) |
| 100.0 | % | | 258,936 |
| 5.03 | % | Fixed |
| 5.03 | % | | 04/01/30 | | 04/01/30 | |
| 1221 Van Street | | 100.0 | % | | 86,288 | | S + 2.62 | % | Swap | | 6.59 | % | | 08/01/30 | | 08/01/30 | |
| 220 20th Street | | 100.0 | % | | 79,352 | | S + 2.62 | % | Swap | | 6.60 | % | | 08/01/30 | | 08/01/30 | |
| The Bartlett (5) | | 100.0 | % | | 215,047 | | S + 2.62 | % | Cap | | 4.50 | % | | 08/01/30 | | 08/01/30 | |
| Tysons Dulles Plaza (6) | | 50.0 | % | | 20,000 | | S + 2.10 | % | — | | 6.01 | % | | 04/28/29 | | 04/28/31 | |
| Tranche A-2 Term Loan - Extending (7) | | 100.0 | % | | 243,857 | | S + 1.50 | % | Swap | | 4.37 | % | | 08/25/28 | | 08/25/31 | |
| Revolving Credit Facility (8) |
| 100.0 | % |
| 222,000 |
| S + 1.50 | % | — |
| 5.40 | % | | 08/27/30 | | 08/27/31 | |
| Total Consolidated Principal Balance |
| | |
| 2,599,464 |
| |
| |
| |
| | |
| | |
| Deferred financing costs and premium / (discount) - mortgage loans |
| | |
| (40,339) | | |
| |
| |
| | |
| | |
| Deferred financing costs - revolving credit facility and term loans |
| | |
| (13,074) | | |
| |
| |
| | |
| | |
| Total Consolidated Indebtedness | | | | $ | 2,546,051 | | |
| |
| |
| | |
| | |
| | | | | | | | | | | | | | | | | | |
| Total Consolidated Indebtedness (net of premium / (discount) and deferred financing costs) |
| |
| |
| |
| | |
| | | |||||
| Mortgage loans | | | | $ | 1,602,125 |
| |
| |
| |
| | |
| | |
| Revolving credit facility | | | |
| 222,000 |
| |
| |
| |
| | |
| | |
| Deferred financing costs, net (included in other assets) | | | |
| (11,385) |
| |
| |
| |
| | |
| | |
| Term loans | | | |
| 733,311 |
| |
| |
| |
| | |
| | |
| Total Consolidated Indebtedness | | | | $ | 2,546,051 |
| |
| |
| |
| | |
| | |
| | Page 37 |
DEBT BY INSTRUMENT | SEPTEMBER 30, 2026 |
| dollars in thousands | | | | | | | Stated | | Interest | | Current | | | Initial | | Extended | |
| | | % | | Principal | | Interest | | Rate | | Annual | | | Maturity | | Maturity | | |
| Asset | | Ownership | | Balance | | Rate | | Hedge (1) |
| Interest Rate (2) | | | Date | | Date (3) |
| |
| | | | | | | | | | | | | | | | | | |
| Unconsolidated | | | | | | | | | | | | | | | | | |
| 4747 Bethesda Avenue (9) | | 20.0 | % | $ | 175,000 | | S + 1.35 | % | Cap | | 5.26 | % | | 02/20/27 | | 02/20/27 | |
| 2200 Crystal Drive (10) | | 30.0 | % | | — | | S + 2.00 | % | — | | 5.91 | % | | 05/20/30 | | 05/20/31 | |
| Total Unconsolidated Principal Balance | | | |
| 175,000 | | |
| |
| |
| | |
| | |
| Deferred financing costs and premium / (discount) - mortgage loans (11) |
| | | | (2,334) | | |
| |
| |
| | |
| | |
| Total Unconsolidated Indebtedness | | | | $ | 172,666 | | | | | | | | | | | | |
| | | | | | | | | | | | | | | | | | |
| Principal Balance at JBG SMITH Share | | | |
|
|
| |
| |
| |
| | |
| | |
| Consolidated principal balance at JBG SMITH Share |
| | | $ | 2,589,464 |
| |
| |
| |
| | |
| | |
| Unconsolidated principal balance at JBG SMITH Share | | | |
| 35,000 |
| |
| |
| |
| | |
| | |
| Total Consolidated and Unconsolidated Principal Balance at JBG SMITH Share | | $ | 2,624,464 |
| |
| |
| |
| | |
| | | ||
| | | | | | | | | | | | | | | | | | |
| Indebtedness at JBG SMITH Share (net of premium / (discount) and deferred financing costs) |
| |
| |
| |
| | |
| | | |||||
| Consolidated indebtedness at JBG SMITH Share |
| | | $ | 2,536,421 |
| |
| |
| |
| | |
| | |
| Unconsolidated indebtedness at JBG SMITH Share (11) | | | | | 33,983 | | | | | | | | | | | | |
| Total Consolidated and Unconsolidated Indebtedness at JBG SMITH Share (11) | | $ | 2,570,404 | | | | | | | | | | | | | ||
| (1) | For floating rate loans with interest rate caps, the weighted average interest rate cap strike for consolidated debt and debt at JBG SMITH Share was 3.20% and 3.29%, and the weighted average maturity date of the interest rate caps is in Q2 2027. The interest rate cap strike is exclusive of the credit spreads associated with the loans. |
| (2) | September 30, 2026 one-month term SOFR of 3.91% applied to loans which are denoted as floating (no swap) or floating with a cap, except as otherwise noted. |
| (3) | Represents the maturity date based on execution of all extension options. Many of these extensions are subject to lender covenant tests. |
| (4) | The maximum principal balance of this loan is $208.5 million. The cap strike rate for this loan is 4.50%. |
| (5) | The cap strike rate for this loan is 1.99%. |
| (6) | The maximum principal balance of this loan is $37.9 million. |
| (7) | In January 2028, the interest rate spread will increase by 0.25%, the 0.10% credit spread adjustment will be removed, and interest rate swaps will commence that fix SOFR at 4.43%. |
| (8) | September 30, 2026 daily SOFR of 3.90% applied to the revolving credit facility. Subsequent to quarter end, we repaid $67.0 million under the revolving credit facility. |
| (9) | The cap strike rate for this loan is 4.38%. |
| (10) | The maximum principal balance of this loan is $55.0 million. See footnote (2) on page 32. |
| (11) | Includes $1.3 million ($0.8 million at JBG SMITH Share) of net deferred financing costs that were included in other assets in the balance sheet information of our unconsolidated real estate ventures presented on page 11. |
| | Page 38 |
DEFINITIONS | SEPTEMBER 30, 2026 |
"Annualized Rent" is defined as (i) for multifamily assets, or the multifamily component of a mixed-use asset, the in-place monthly base rent before Free Rent as of September 30, 2026, multiplied by 12, and (ii) for commercial assets, or the retail component of a mixed-use asset, the in-place monthly base rent before Free Rent, plus tenant reimbursements as of September 30, 2026, multiplied by 12. Annualized Rent excludes rent from leases that have been signed but the tenant has not yet taken occupancy (not yet included in Percent Occupied metrics) and percentage rent.
"Annualized Rent per Square Foot" is defined as (i) for multifamily assets, in-place monthly base rent before Free Rent divided by occupied multifamily square feet; annualized retail rent and retail square feet are excluded from this metric and (ii) for commercial assets, annualized office rent divided by occupied office square feet and annualized retail rent divided by occupied retail square feet. Excludes percentage rent and the square footage of tenants that only pay percentage rent. Occupied square footage may differ from leased square footage because leased square footage includes leases that have been signed but the tenant has not yet taken occupancy (not yet included in Percent Occupied metrics).
"Development Pipeline" refers to owned and entitled land on which we have the potential to commence construction subject to completion of design and/or market conditions. Excludes unentitled land parcels.
Earnings Before Interest, Taxes, Depreciation and Amortization ("EBITDA"), EBITDA for Real Estate ("EBITDAre") and "Adjusted EBITDA" are non-GAAP financial measures. EBITDA and EBITDAre are used by management as supplemental operating performance measures, which we believe help investors and lenders meaningfully evaluate and compare our operating performance from period-to-period by removing from our operating results the impact of our capital structure (primarily interest charges from our outstanding debt and the impact of our interest rate swaps and caps) and certain non-cash expenses (primarily depreciation and amortization expense on our assets). EBITDAre is computed in accordance with the definition established by the National Association of Real Estate Investment Trusts ("Nareit"). Nareit defines EBITDAre as GAAP net income (loss) adjusted to exclude interest expense, income taxes, depreciation and amortization expense, gains (losses) on sales of real estate and impairment write-downs of certain real estate assets and investments in entities when the impairment is directly attributable to decreases in the value of depreciable real estate held by the entity, including our share of such adjustments for unconsolidated real estate ventures. These supplemental measures may help investors and lenders understand our ability to incur and service debt and to make capital expenditures. EBITDA and EBITDAre are not substitutes for net income (loss) (computed in accordance with GAAP) and may not be comparable to similarly titled measures used by other companies.
Adjusted EBITDA represents EBITDAre adjusted for items we believe are not representative of ongoing operating results, such as Transaction and Other Costs, gain (loss) on the extinguishment of debt, earnings (losses) and distributions in excess of our investment in unconsolidated real estate ventures, litigation costs and income (loss) from investments. We believe that adjusting such items not considered part of our comparable operations provides a meaningful measure to evaluate and compare our performance from period-to-period.
Because EBITDA, EBITDAre and Adjusted EBITDA have limitations as analytical tools, we use EBITDA, EBITDAre and Adjusted EBITDA to supplement GAAP financial measures. Additionally, we believe that users of these measures should consider EBITDA, EBITDAre and Adjusted EBITDA in conjunction with net income (loss) and other GAAP measures in understanding our operating results. A reconciliation of net income (loss) to EBITDA, EBITDAre and Adjusted EBITDA is presented on page 13.
"Estimated Incremental Investment" means management's estimate of the remaining cost to be incurred in connection with the development of an asset as of September 30, 2026, including all remaining acquisition costs, hard costs, soft costs, tenant improvements (excluding Free Rent converted to tenant improvement allowances), leasing costs and other similar costs to develop and stabilize the asset but excluding any financing costs and ground rent expenses. Actual incremental investment may differ substantially from our estimates due to numerous factors, including unanticipated expenses, delays in the estimated completion date, changes in design and other contingencies.
"Estimated Potential Development Density" reflects management's estimate of developable gross square feet based on our current business plans with respect to real estate owned as of September 30, 2026. Our current business plans may contemplate development of less than the maximum potential development density for individual assets. As market conditions change, our business plans, and therefore, the Estimated Potential Development Density, could change accordingly. Given timing, zoning requirements and other factors, we make no assurance that Estimated Potential Development Density amounts will become actual density to the extent we complete development of assets for which we have made such estimates.
| | Page 39 |
DEFINITIONS | SEPTEMBER 30, 2026 |
"Estimated Total Investment" means, with respect to the development of an asset, the sum of the Historical Cost in such asset and the Estimated Incremental Investment for such asset. Actual total investment may differ substantially from our estimates due to numerous factors, including unanticipated expenses, delays in the estimated completion date, changes in design and other contingencies.
"First-generation" is a lease on space that had been vacant for at least nine months or a lease on newly delivered space.
"Free Rent" means the amount of base rent and tenant reimbursements that are abated according to the applicable lease agreement(s).
Funds from Operations ("FFO"), "Core FFO" and Funds Available for Distribution ("FAD") are non-GAAP financial measures. FFO is computed in accordance with the definition established by Nareit in the Nareit FFO White Paper - 2018 Restatement. Nareit defines FFO as net income (loss) (computed in accordance with GAAP), excluding depreciation and amortization expense related to real estate, gains (losses) from the sale of certain real estate assets, gains (losses) from change in control and impairment write-downs of certain real estate assets and investments in entities when the impairment is directly attributable to decreases in the value of depreciable real estate held by the entity, including our share of such adjustments for unconsolidated real estate ventures.
Core FFO represents FFO adjusted to exclude items which we believe are not representative of ongoing operating results, such as Transaction and Other Costs, gain (loss) on the extinguishment of debt, earnings (losses) and distributions in excess of our investment in unconsolidated real estate ventures, litigation costs, income (loss) from investments, amortization of the management contracts intangible and the mark-to-market of derivative instruments, including our share of such adjustments for unconsolidated real estate ventures.
FAD represents Core FFO adjusted for recurring capital expenditures and Second-generation tenant improvements and leasing commissions, net deferred rent activity, lease incentive amortization, accretion of acquired below-market leases, amortization of acquired above-market leases, recurring share-based compensation expense, amortization of debt issuance costs and other non-cash income and charges, including our share of such adjustments for unconsolidated real estate ventures. FAD is presented solely as a supplemental disclosure that management believes provides useful information as it relates to our ability to fund dividends.
We believe FFO, Core FFO and FAD are meaningful non-GAAP financial measures useful in comparing our levered operating performance from period-to-period and as compared to similar real estate companies because these non-GAAP measures exclude real estate depreciation and amortization expense, which implicitly assumes that the value of real estate diminishes predictably over time rather than fluctuating based on market conditions, and other non-comparable income and expenses. FFO, Core FFO and FAD do not represent cash generated from operating activities and are not necessarily indicative of cash available to fund cash requirements and should not be considered as an alternative to net income (loss) (computed in accordance with GAAP) as a performance measure or cash flow as a liquidity measure. FFO, Core FFO and FAD may not be comparable to similarly titled measures used by other companies. A reconciliation of net income (loss) to FFO, Core FFO and FAD is presented on pages 14-15.
"GAAP" means accounting principles generally accepted in the United States of America.
"Historical Cost" is a non-GAAP measure which includes the total Historical Cost incurred by JBG SMITH with respect to the development of an asset, including any acquisition costs, hard costs, soft costs, tenant improvements (excluding Free Rent converted to tenant improvement allowances), leasing costs and other similar costs, but excluding any financing costs and ground rent expenses incurred as of September 30, 2026.
"In-Service" refers to multifamily or commercial operating assets that are at or above 90% leased or have been operating and collecting rent for more than 12 months as of September 30, 2026.
"JBG SMITH Share" or "our share" refer to our ownership percentage of consolidated and unconsolidated assets in real estate ventures, but exclude our 33.5% subordinated interest in four commercial buildings, as well as the associated non-recourse mortgage loans, held through an unconsolidated real estate venture; the interest and debt are excluded because our investment in the real estate venture is zero, we do not anticipate receiving any near-term cash flow distributions from the real estate venture, and we have not guaranteed its obligations or otherwise committed to providing financial support.
| | Page 40 |
DEFINITIONS | SEPTEMBER 30, 2026 |
"Metro-Served" means locations, submarkets or assets that are within 0.5 miles of an existing or planned Metro station.
"Monthly Rent Per Unit" represents multifamily rent for the month ended September 30, 2026 divided by occupied units; retail rent is excluded from this metric.
"Net Debt" is a non-GAAP financial measurement. Net Debt represents our total consolidated and unconsolidated indebtedness less cash and cash equivalents at our share. Net Debt is an important component in the calculation of Net Debt to Annualized Adjusted EBITDA. We believe that Net Debt is a meaningful non-GAAP financial measure useful to investors because we review Net Debt as part of the management of our overall financial flexibility, capital structure and leverage. We may utilize a considerable portion of our cash and cash equivalents at any given time for purposes other than debt reduction. In addition, cash and cash equivalents at our share may not be solely controlled by us. The deduction of cash and cash equivalents at our share from consolidated and unconsolidated indebtedness in the calculation of Net Debt, therefore, should not be understood to mean that it is available exclusively for debt reduction at any given time.
Net Operating Income ("NOI"), "Same Store NOI", "Annualized NOI", "Estimated Stabilized NOI" and "Projected NOI Yield" are non-GAAP financial measures management uses to assess an asset's performance. The most directly comparable GAAP measure is net income (loss) attributable to common shareholders. We use NOI internally as a performance measure and believe NOI, Same Store NOI, Annualized NOI, Estimated Stabilized NOI and Projected NOI Yield provide useful information to investors regarding our financial condition and results of operations because it reflects only property related revenue (which includes base rent, tenant reimbursements and other operating revenue, net of Free Rent) less operating expenses and ground rent for operating leases, if applicable. NOI excludes deferred (straight-line) rent, commercial lease termination revenue, related party management fees, interest expense, and certain other non-cash adjustments, including the accretion of acquired below-market leases and the amortization of acquired above-market leases and below-market ground lease intangibles. Management uses NOI, which includes our proportionate share of revenue and expenses attributable to real estate ventures, as a supplemental performance measure and believes it provides useful information to investors because it reflects only those revenue and expense items that are incurred at the asset level, excluding non-cash items. In addition, NOI is considered by many in the real estate industry to be a useful starting point for determining the value of a real estate asset or group of assets. However, because NOI excludes depreciation and amortization expense and captures neither the changes in the value of our assets that result from use or market conditions, nor the level of capital expenditures and capitalized leasing commissions necessary to maintain the operating performance of our assets, all of which have real economic effect and could materially impact the financial performance of our assets, the utility of NOI as a measure of the operating performance of our assets is limited. NOI presented by us may not be comparable to NOI reported by other real estate investment trusts that define these measures differently. We believe to facilitate a clear understanding of our operating results, NOI should be examined in conjunction with net income (loss) attributable to common shareholders as presented in our consolidated financial statements. NOI should not be considered as an alternative to net income (loss) attributable to common shareholders as an indication of our performance or to cash flows as a measure of liquidity or our ability to make distributions. Annualized NOI represents NOI for the three months ended September 30, 2026 multiplied by four. Management believes Annualized NOI provides useful information in understanding our financial performance over a 12-month period, however, investors and other users are cautioned against attributing undue certainty to our calculation of Annualized NOI. Actual NOI for any 12-month period will depend on a number of factors beyond our ability to control or predict, including general capital markets and economic conditions, any bankruptcy, insolvency, default or other failure to pay rent by one or more of our tenants and the destruction of one or more of our assets due to terrorist attack, natural disaster or other casualty, among others. We do not undertake any obligation to update our calculation to reflect events or circumstances occurring after the date of this Investor Package. There can be no assurance that the Annualized NOI shown will reflect our actual results of operations over any 12-month period.
This Investor Package also contains management's estimate of stabilized NOI and projections of NOI yield for Under-Construction assets, which are based on management's estimates of property-related revenue and operating expenses for each asset. These estimates are inherently uncertain and represent management's plans, expectations and beliefs and are subject to numerous assumptions, risks and uncertainties. The actual property-related revenue and operating expenses for our assets may differ materially from the estimates included in this Investor Package. Management's projections of NOI yield are not projections of our overall financial performance or cash flow, and there can be no assurance that the Projected NOI Yield set forth in this Investor Package will be achieved.
Projected NOI Yield means our Estimated Stabilized NOI reported as a percentage of (i) Estimated Total Investment and (ii) Estimated Incremental Investment. Actual initial full year stabilized NOI yield may vary from the Projected NOI Yield based on the actual incremental investment to complete the asset and its actual initial full year stabilized NOI, and there can be no assurance that we will achieve the Projected NOI Yields described in this Investor Package.
| | Page 41 |
DEFINITIONS | SEPTEMBER 30, 2026 |
We do not provide reconciliations for non-GAAP estimates on a future basis, including Estimated Stabilized NOI and expected Annualized NOI because we are unable to provide a meaningful or accurate calculation or estimate of reconciling items and the information is not available without unreasonable effort. This inability is due to the inherent difficulty of forecasting the timing and/or amounts of various items that would impact net income (loss). Additionally, no reconciliation of Projected NOI Yield to the most directly comparable GAAP measure is included in this Investor Package because we are unable to quantify certain amounts that would be required to be included in the comparable GAAP financial measures without unreasonable efforts because such data is not currently available or cannot be currently estimated with confidence. Accordingly, we believe such reconciliations would imply a degree of precision that would be confusing or misleading to investors.
"Non-Same Store" refers to all operating assets excluded from the Same Store pool.
"Percent Leased" is based on leases signed as of September 30, 2026, and is calculated as total rentable square feet less rentable square feet available for lease divided by total rentable square feet expressed as a percentage. Out-of-service square feet are excluded from this calculation.
"Percent Occupied" is based on occupied rentable square feet/units as of September 30, 2026, and is calculated as: (i) for multifamily space, total units less unoccupied units divided by total units, expressed as a percentage, and (ii) for office and retail space, total rentable square feet less unoccupied square feet divided by total rentable square feet, expressed as a percentage. Out-of-service square feet and units are excluded from this calculation.
"Pro Rata Adjusted General and Administrative Expenses," a non-GAAP financial measure, represents general and administrative expenses adjusted for the general and administrative expenses of our third-party real estate services business that are directly reimbursed. We believe that adjusting such items not considered part of our comparable operations provides a meaningful measure to assess our general and administrative expenses as compared to similar real estate companies and in general.
"Recently Delivered" refers to multifamily and commercial assets that are below 90% leased and have been delivered within the 12 months ended September 30, 2026.
"Same Store" refers to the pool of assets that were In-Service for the entirety of both periods being compared, excluding assets for which significant redevelopment, renovation or repositioning occurred during either of the periods being compared.
"Second-generation" is a lease on space that had been vacant for less than nine months.
"Signed But Not Yet Commenced Leases" means leases that, as of September 30, 2026, have been executed but for which rent has not commenced.
"SOFR" means the Secured Overnight Financing Rate.
"Square Feet" or "SF" refers to the area that can be rented to tenants, defined as (i) for multifamily assets, management's estimate of approximate rentable square feet, (ii) for commercial assets, rentable square footage defined in the current lease and for vacant space the rentable square footage defined in the previous lease for that space, (iii) for Under-Construction assets, management's estimate of approximate rentable square feet based on current design plans as of September 30, 2026, and (iv) for assets in the Development Pipeline, management's estimate of developable gross square feet based on current business plans with respect to real estate owned as of September 30, 2026.
"Transaction and Other Costs" include costs related to completed, potential and pursued transactions, and other costs, including expenses related to the Wardman Tower litigation.
"Under-Construction" refers to assets that were under construction during the period.
| | Page 42 |
APPENDIX – INTEREST EXPENSE | SEPTEMBER 30, 2026 |
Appendix – Interest Expense
| | | Three Months Ended September 30, 2026 | | |||||||
| in thousands | | Consolidated (1) | | Unconsolidated Real Estate Ventures (2) | X | Total | | |||
| | | | | | | | | | | |
| Interest Expense |
| | |
| | | | | | |
| Interest expense before capitalized interest | | $ | 33,782 | | $ | 451 | | $ | 34,233 | |
| Amortization of deferred financing costs | | | 3,193 | | | 135 | | | 3,328 | |
| Net unrealized gain on non-designated derivatives (3) | | | (21) | | | — | | | (21) | |
| Capitalized interest | | | (116) | | | — | | | (116) | |
| Total | | $ | 36,838 | | $ | 586 | | $ | 37,424 | |
| | | | | | | | | | | |
| | | | | | | | | | | |
| | | Nine Months Ended September 30, 2026 | | |||||||
| in thousands | | Consolidated (1) | | Unconsolidated Real Estate Ventures (2) | X | Total | | |||
| | | | | | | | | | | |
| Interest Expense |
| | |
| | | | | | |
| Interest expense before capitalized interest | | $ | 99,977 | | $ | 1,330 | | $ | 101,307 | |
| Amortization of deferred financing costs | | | 9,369 | | | 428 | | | 9,797 | |
| Net unrealized gain on non-designated derivatives (3) | | | (37) | | | — | | | (37) | |
| Capitalized interest | | | (894) | | | — | | | (894) | |
| Total | | $ | 108,415 | | $ | 1,758 | | $ | 110,173 | |
| (1) | Includes $183,000 and $307,000 for the three and nine months ended September 30, 2026 of interest expense related to our partners' share of consolidated real estate ventures. |
| (2) | At JBG SMITH Share. |
| (3) | Non-designated derivatives refer to certain derivative financial instruments, consisting of interest rate cap agreements, that do not meet the accounting requirements to be classified as hedging instruments. These derivatives are carried at their estimated fair value with realized and unrealized gains and losses recorded in "Interest expense" in our Condensed Consolidated Statements of Operations. |
| | Page 43 |
APPENDIX – NOI RECONCILIATIONS (NON-GAAP) | SEPTEMBER 30, 2026 |
Appendix - NOI Reconciliations
| dollars in thousands | | Three Months Ended September 30, | | Nine Months Ended September 30, |
| ||||||||
| | | 2026 | | 2025 | | 2026 | | 2025 | | ||||
| Net loss attributable to common shareholders | | $ | (82,006) | | $ | (28,555) | | $ | (159,858) | | $ | (93,516) | |
| Net loss attributable to redeemable noncontrolling interests | | | (18,262) | | | (6,457) | | | (35,993) | | | (18,375) | |
| Net income attributable to noncontrolling interests | | | 47 | | | — | | | 134 | | | — | |
| Net loss | | | (100,221) | | | (35,012) | | | (195,717) | | | (111,891) | |
| Add: | | | | | | | | | | | | | |
| Depreciation and amortization expense | | | 44,589 | | | 48,164 | | | 134,685 | | | 143,311 | |
| General and administrative expense: | | | | | | | | | | | | | |
| Corporate and other | | | 12,546 | | | 13,214 | | | 43,237 | | | 45,491 | |
| Third-party real estate services | | | 16,440 | | | 14,058 | | | 49,802 | | | 43,691 | |
| Transaction and Other Costs | | | 964 | | | 494 | | | 11,490 | | | 5,251 | |
| Interest expense | | | 36,838 | | | 34,781 | | | 108,415 | | | 105,552 | |
| Loss on the extinguishment of debt, net | | | 2,107 | | | — | | | 2,107 | | | 2,402 | |
| Impairment loss | | | 69,175 | | | 4,771 | | | 114,740 | | | 45,067 | |
| Income tax expense | | | — | | | 926 | | | 7 | | | 643 | |
| Less: | | | | | | | | | | | | | |
| Third-party real estate services, including reimbursements revenue | | | 18,270 | | | 14,711 | | | 52,480 | | | 44,430 | |
| Loss from unconsolidated real estate ventures, net | | | (237) | | | (664) | | | (1,197) | | | (165) | |
| Interest and other income, net | | | 760 | | | 2,378 | | | 6,818 | | | 3,601 | |
| Gain (loss) on the sale of real estate, net | | | (213) | | | 4,660 | | | 20,577 | | | 47,029 | |
| Adjustments: | | | | | | | | | | | | | |
| NOI attributable to unconsolidated real estate ventures at our share | | | 1,293 | | | 1,012 | | | 3,690 | | | 3,289 | |
| Real estate venture partners' share of NOI attributable to consolidated real estate ventures | | | (1,580) | | | (915) | | | (4,203) | | | (1,187) | |
| Non-cash rent adjustments (1) | | | (2,129) | | | 1,561 | | | (6,774) | | | 4,071 | |
| Other adjustments (2) | | | 1,794 | | | (3,083) | | | 2,433 | | | (984) | |
| Total adjustments | | | (622) | | | (1,425) | | | (4,854) | | | 5,189 | |
| NOI | | $ | 63,236 | | $ | 58,886 | | $ | 185,234 | | $ | 189,811 | |
| Less: out-of-service NOI loss (3) | | | (875) | | | (1,677) | | | (3,628) | | | (5,366) | |
| Operating Portfolio NOI | | $ | 64,111 | | $ | 60,563 | | $ | 188,862 | | $ | 195,177 | |
| Non-Same Store NOI (4) | | | 3,342 | | | 1,743 | | | 24,898 | | | 27,351 | |
| Same Store NOI (5) | | $ | 60,769 | | $ | 58,820 | | $ | 163,964 | | $ | 167,826 | |
| | | | | | | | | | | | | | |
| Change in Same Store NOI | | | 3.3 | % | | | | | (2.3) | % | | | |
| Number of properties in Same Store pool | | | 35 | | | | | | 32 | | | | |
| (1) | Adjustment to exclude deferred (straight-line) rent, above/below market lease amortization/accretion and lease incentive amortization. |
| (2) | Adjustment to exclude commercial lease termination revenue, related party management fees and corporate entity activity. |
| (3) | Includes the results of our Under-Construction assets, assets in the Development Pipeline, and other land assets. |
| (4) | Includes the results of properties that were not In-Service for the entirety of both periods being compared, including disposed properties, and properties for which significant redevelopment, renovation or repositioning occurred during either of the periods being compared. |
| (5) | Includes the results of the properties that are owned, operated and In-Service for the entirety of both periods being compared. |
| | Page 44 |

JBGS Divider
