
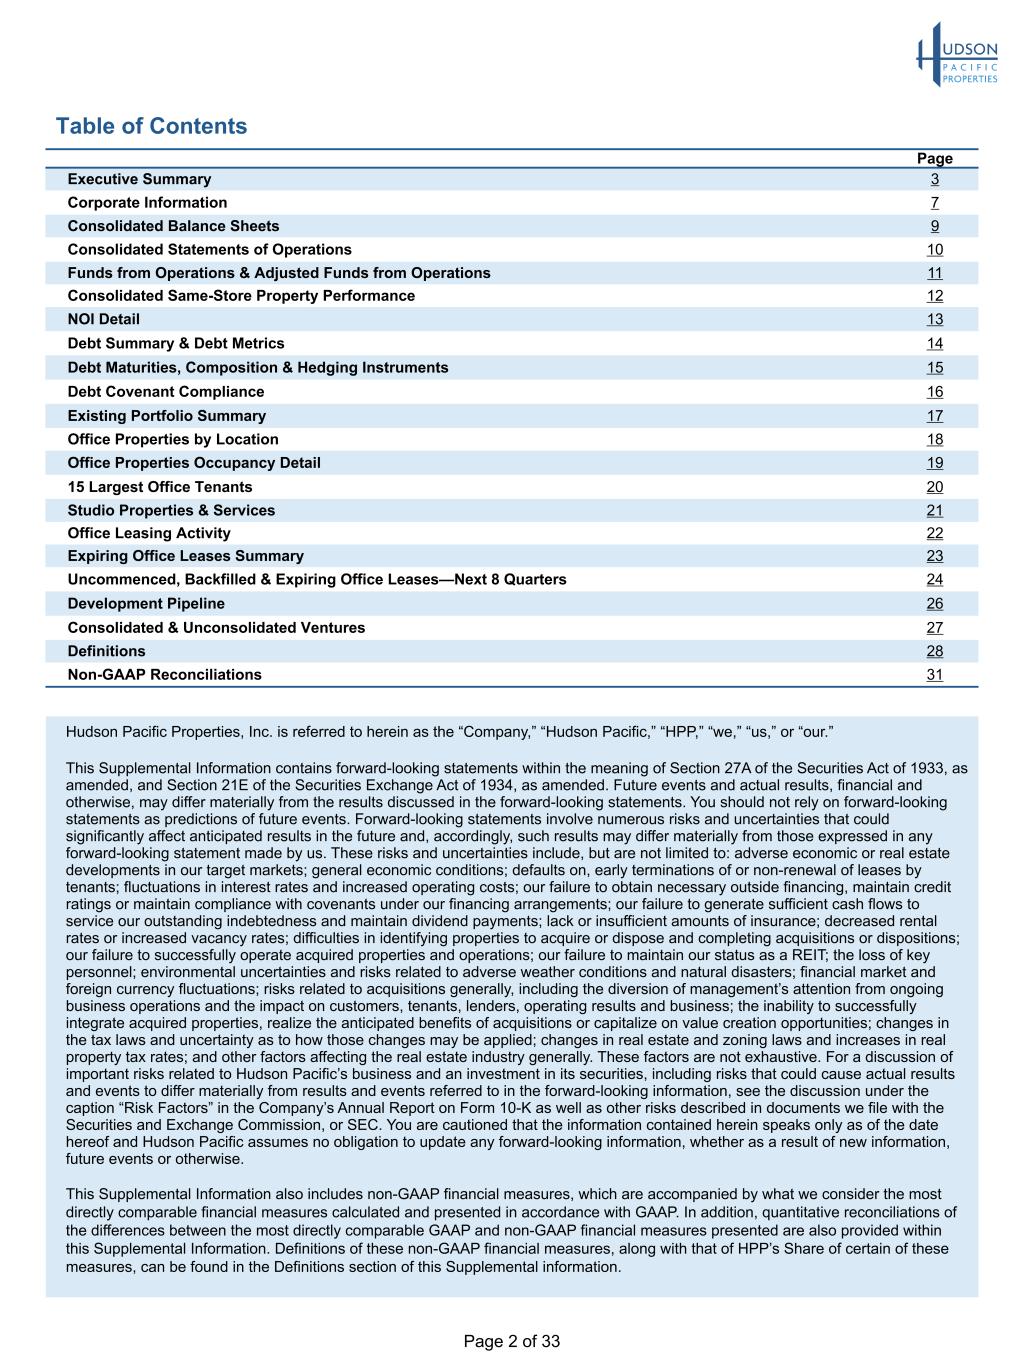
Page 2 of 33 Table of Contents Page Executive Summary 3 Corporate Information 7 Consolidated Balance Sheets 9 Consolidated Statements of Operations 10 Funds from Operations & Adjusted Funds from Operations 11 Consolidated Same-Store Property Performance 12 NOI Detail 13 Debt Summary & Debt Metrics 14 Debt Maturities, Composition & Hedging Instruments 15 Debt Covenant Compliance 16 Existing Portfolio Summary 17 Office Properties by Location 18 Office Properties Occupancy Detail 19 15 Largest Office Tenants 20 Studio Properties & Services 21 Office Leasing Activity 22 Expiring Office Leases Summary 23 Uncommenced, Backfilled & Expiring Office Leases—Next 8 Quarters 24 Development Pipeline 26 Consolidated & Unconsolidated Ventures 27 Definitions 28 Non-GAAP Reconciliations 31 Hudson Pacific Properties, Inc. is referred to herein as the “Company,” “Hudson Pacific,” “HPP,” “we,” “us,” or “our.” This Supplemental Information contains forward-looking statements within the meaning of Section 27A of the Securities Act of 1933, as amended, and Section 21E of the Securities Exchange Act of 1934, as amended. Future events and actual results, financial and otherwise, may differ materially from the results discussed in the forward-looking statements. You should not rely on forward-looking statements as predictions of future events. Forward-looking statements involve numerous risks and uncertainties that could significantly affect anticipated results in the future and, accordingly, such results may differ materially from those expressed in any forward-looking statement made by us. These risks and uncertainties include, but are not limited to: adverse economic or real estate developments in our target markets; general economic conditions; defaults on, early terminations of or non-renewal of leases by tenants; fluctuations in interest rates and increased operating costs; our failure to obtain necessary outside financing, maintain credit ratings or maintain compliance with covenants under our financing arrangements; our failure to generate sufficient cash flows to service our outstanding indebtedness and maintain dividend payments; lack or insufficient amounts of insurance; decreased rental rates or increased vacancy rates; difficulties in identifying properties to acquire or dispose and completing acquisitions or dispositions; our failure to successfully operate acquired properties and operations; our failure to maintain our status as a REIT; the loss of key personnel; environmental uncertainties and risks related to adverse weather conditions and natural disasters; financial market and foreign currency fluctuations; risks related to acquisitions generally, including the diversion of management’s attention from ongoing business operations and the impact on customers, tenants, lenders, operating results and business; the inability to successfully integrate acquired properties, realize the anticipated benefits of acquisitions or capitalize on value creation opportunities; changes in the tax laws and uncertainty as to how those changes may be applied; changes in real estate and zoning laws and increases in real property tax rates; and other factors affecting the real estate industry generally. These factors are not exhaustive. For a discussion of important risks related to Hudson Pacific’s business and an investment in its securities, including risks that could cause actual results and events to differ materially from results and events referred to in the forward-looking information, see the discussion under the caption “Risk Factors” in the Company’s Annual Report on Form 10-K as well as other risks described in documents we file with the Securities and Exchange Commission, or SEC. You are cautioned that the information contained herein speaks only as of the date hereof and Hudson Pacific assumes no obligation to update any forward-looking information, whether as a result of new information, future events or otherwise. This Supplemental Information also includes non-GAAP financial measures, which are accompanied by what we consider the most directly comparable financial measures calculated and presented in accordance with GAAP. In addition, quantitative reconciliations of the differences between the most directly comparable GAAP and non-GAAP financial measures presented are also provided within this Supplemental Information. Definitions of these non-GAAP financial measures, along with that of HPP’s Share of certain of these measures, can be found in the Definitions section of this Supplemental information.
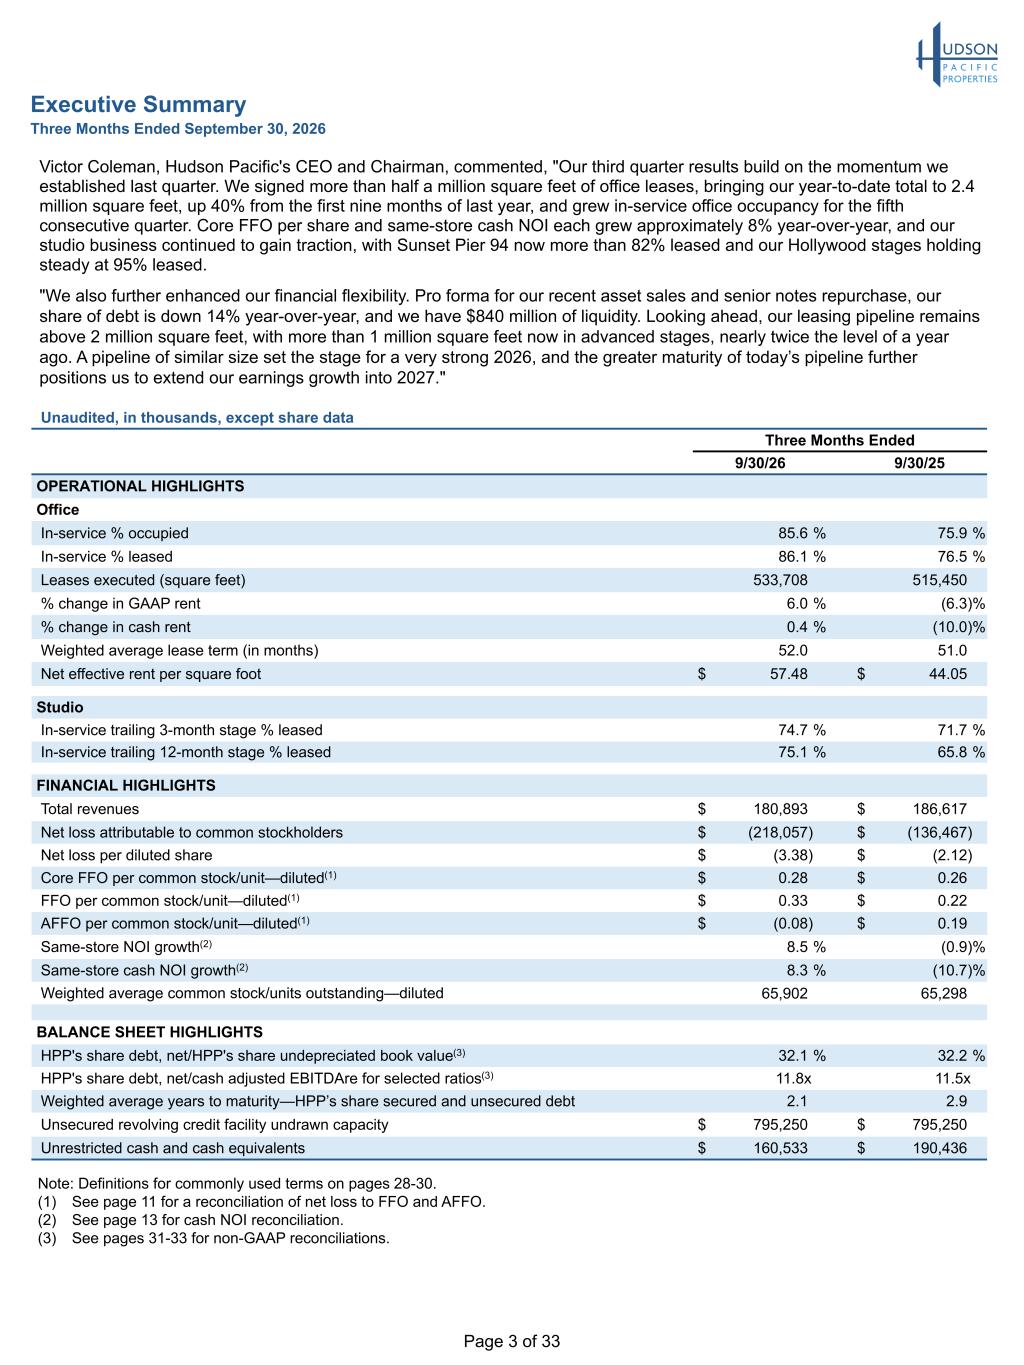
Page 3 of 33 Executive Summary Three Months Ended September 30, 2026 Victor Coleman, Hudson Pacific's CEO and Chairman, commented, "Our third quarter results build on the momentum we established last quarter. We signed more than half a million square feet of office leases, bringing our year-to-date total to 2.4 million square feet, up 40% from the first nine months of last year, and grew in-service office occupancy for the fifth consecutive quarter. Core FFO per share and same-store cash NOI each grew approximately 8% year-over-year, and our studio business continued to gain traction, with Sunset Pier 94 now more than 82% leased and our Hollywood stages holding steady at 95% leased. "We also further enhanced our financial flexibility. Pro forma for our recent asset sales and senior notes repurchase, our share of debt is down 14% year-over-year, and we have $840 million of liquidity. Looking ahead, our leasing pipeline remains above 2 million square feet, with more than 1 million square feet now in advanced stages, nearly twice the level of a year ago. A pipeline of similar size set the stage for a very strong 2026, and the greater maturity of today’s pipeline further positions us to extend our earnings growth into 2027." Unaudited, in thousands, except share data Three Months Ended 9/30/26 9/30/25 OPERATIONAL HIGHLIGHTS Office In-service % occupied 85.6 % 75.9 % In-service % leased 86.1 % 76.5 % Leases executed (square feet) 533,708 515,450 % change in GAAP rent 6.0 % (6.3) % % change in cash rent 0.4 % (10.0) % Weighted average lease term (in months) 52.0 51.0 Net effective rent per square foot $ 57.48 $ 44.05 Studio In-service trailing 3-month stage % leased 74.7 % 71.7 % In-service trailing 12-month stage % leased 75.1 % 65.8 % FINANCIAL HIGHLIGHTS Total revenues $ 180,893 $ 186,617 Net loss attributable to common stockholders $ (218,057) $ (136,467) Net loss per diluted share $ (3.38) $ (2.12) Core FFO per common stock/unit—diluted(1) $ 0.28 $ 0.26 FFO per common stock/unit—diluted(1) $ 0.33 $ 0.22 AFFO per common stock/unit—diluted(1) $ (0.08) $ 0.19 Same-store NOI growth(2) 8.5 % (0.9) % Same-store cash NOI growth(2) 8.3 % (10.7) % Weighted average common stock/units outstanding—diluted 65,902 65,298 BALANCE SHEET HIGHLIGHTS HPP's share debt, net/HPP's share undepreciated book value(3) 32.1 % 32.2 % HPP's share debt, net/cash adjusted EBITDAre for selected ratios(3) 11.8x 11.5x Weighted average years to maturity—HPP’s share secured and unsecured debt 2.1 2.9 Unsecured revolving credit facility undrawn capacity $ 795,250 $ 795,250 Unrestricted cash and cash equivalents $ 160,533 $ 190,436 Note: Definitions for commonly used terms on pages 28-30. (1) See page 11 for a reconciliation of net loss to FFO and AFFO. (2) See page 13 for cash NOI reconciliation. (3) See pages 31-33 for non-GAAP reconciliations.
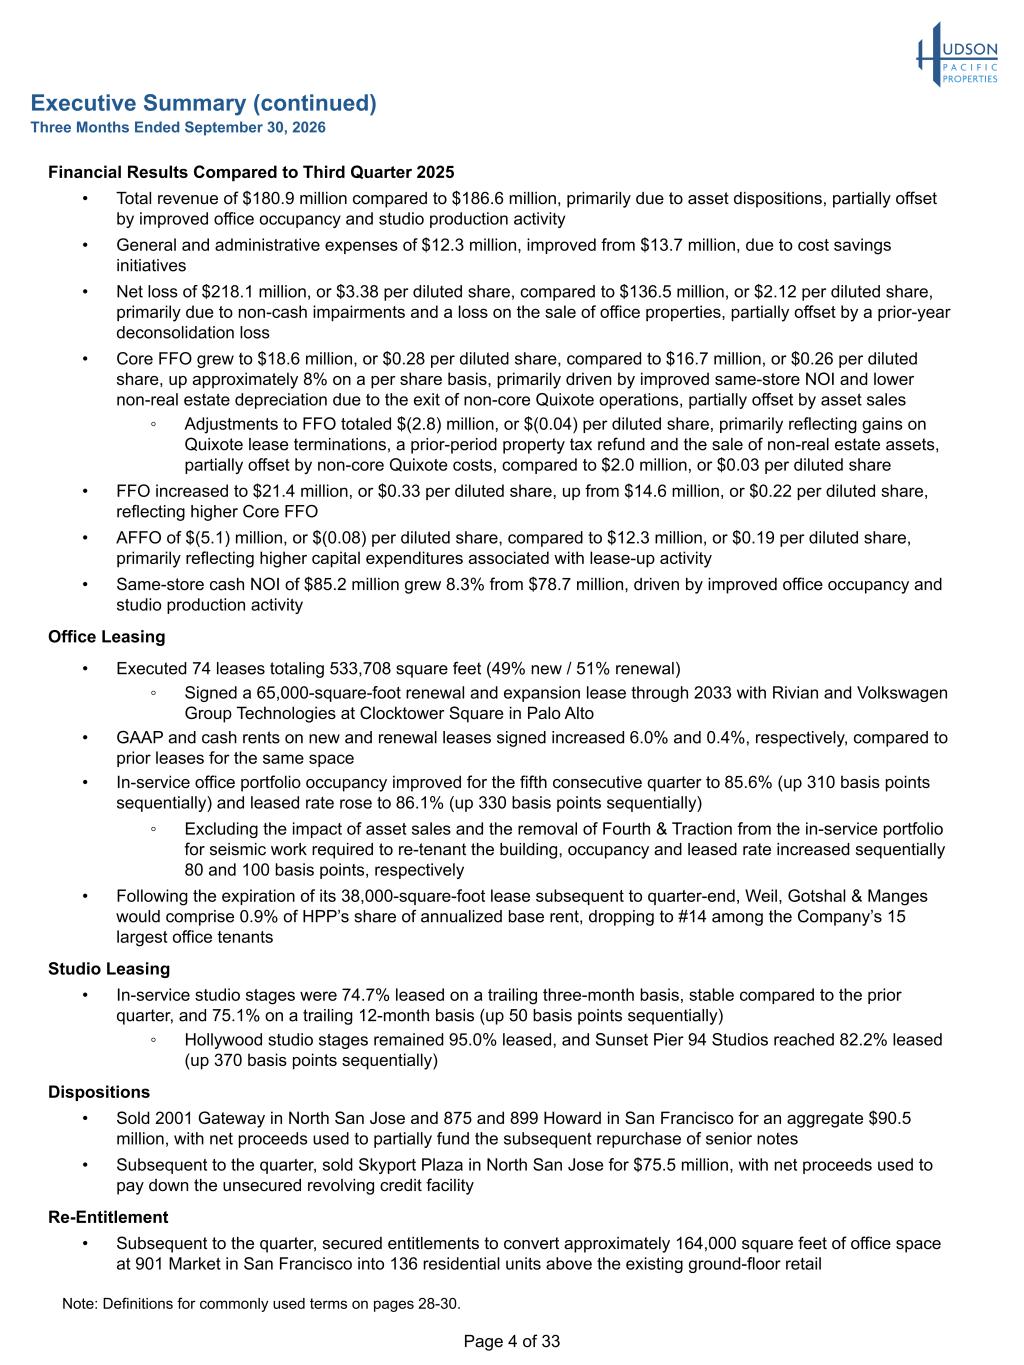
Page 4 of 33 Financial Results Compared to Third Quarter 2025 • Total revenue of $180.9 million compared to $186.6 million, primarily due to asset dispositions, partially offset by improved office occupancy and studio production activity • General and administrative expenses of $12.3 million, improved from $13.7 million, due to cost savings initiatives • Net loss of $218.1 million, or $3.38 per diluted share, compared to $136.5 million, or $2.12 per diluted share, primarily due to non-cash impairments and a loss on the sale of office properties, partially offset by a prior-year deconsolidation loss • Core FFO grew to $18.6 million, or $0.28 per diluted share, compared to $16.7 million, or $0.26 per diluted share, up approximately 8% on a per share basis, primarily driven by improved same-store NOI and lower non-real estate depreciation due to the exit of non-core Quixote operations, partially offset by asset sales ◦ Adjustments to FFO totaled $(2.8) million, or $(0.04) per diluted share, primarily reflecting gains on Quixote lease terminations, a prior-period property tax refund and the sale of non-real estate assets, partially offset by non-core Quixote costs, compared to $2.0 million, or $0.03 per diluted share • FFO increased to $21.4 million, or $0.33 per diluted share, up from $14.6 million, or $0.22 per diluted share, reflecting higher Core FFO • AFFO of $(5.1) million, or $(0.08) per diluted share, compared to $12.3 million, or $0.19 per diluted share, primarily reflecting higher capital expenditures associated with lease-up activity • Same-store cash NOI of $85.2 million grew 8.3% from $78.7 million, driven by improved office occupancy and studio production activity Office Leasing • Executed 74 leases totaling 533,708 square feet (49% new / 51% renewal) ◦ Signed a 65,000-square-foot renewal and expansion lease through 2033 with Rivian and Volkswagen Group Technologies at Clocktower Square in Palo Alto • GAAP and cash rents on new and renewal leases signed increased 6.0% and 0.4%, respectively, compared to prior leases for the same space • In-service office portfolio occupancy improved for the fifth consecutive quarter to 85.6% (up 310 basis points sequentially) and leased rate rose to 86.1% (up 330 basis points sequentially) ◦ Excluding the impact of asset sales and the removal of Fourth & Traction from the in-service portfolio for seismic work required to re-tenant the building, occupancy and leased rate increased sequentially 80 and 100 basis points, respectively • Following the expiration of its 38,000-square-foot lease subsequent to quarter-end, Weil, Gotshal & Manges would comprise 0.9% of HPP’s share of annualized base rent, dropping to #14 among the Company’s 15 largest office tenants Studio Leasing • In-service studio stages were 74.7% leased on a trailing three-month basis, stable compared to the prior quarter, and 75.1% on a trailing 12-month basis (up 50 basis points sequentially) ◦ Hollywood studio stages remained 95.0% leased, and Sunset Pier 94 Studios reached 82.2% leased (up 370 basis points sequentially) Dispositions • Sold 2001 Gateway in North San Jose and 875 and 899 Howard in San Francisco for an aggregate $90.5 million, with net proceeds used to partially fund the subsequent repurchase of senior notes • Subsequent to the quarter, sold Skyport Plaza in North San Jose for $75.5 million, with net proceeds used to pay down the unsecured revolving credit facility Re-Entitlement • Subsequent to the quarter, secured entitlements to convert approximately 164,000 square feet of office space at 901 Market in San Francisco into 136 residential units above the existing ground-floor retail Executive Summary (continued) Three Months Ended September 30, 2026 Note: Definitions for commonly used terms on pages 28-30.
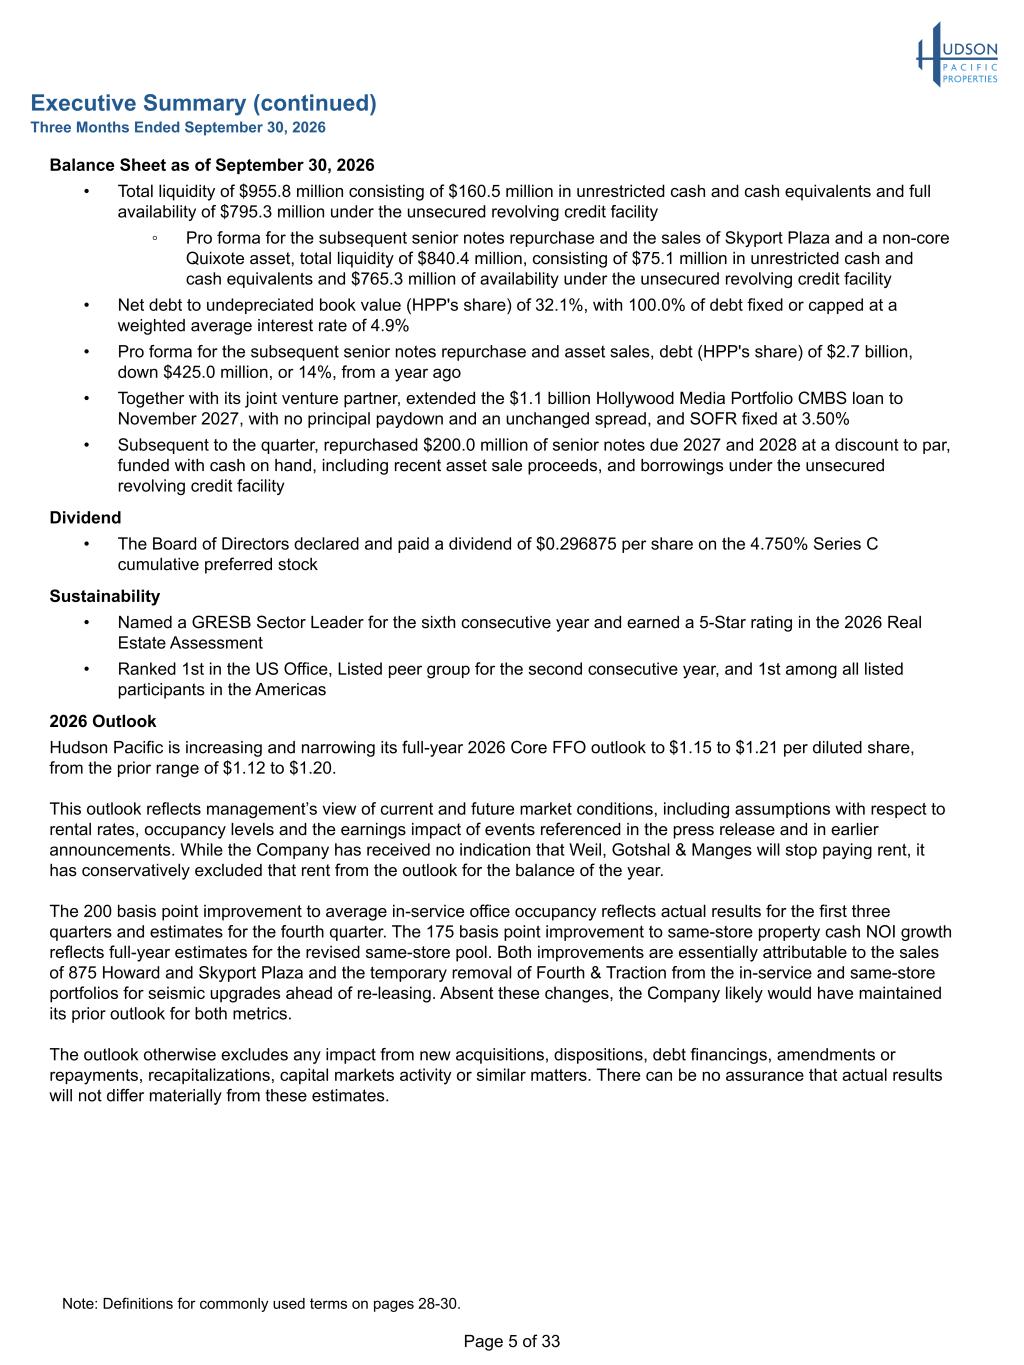
Page 5 of 33 Executive Summary (continued) Three Months Ended September 30, 2026 Note: Definitions for commonly used terms on pages 28-30. Balance Sheet as of September 30, 2026 • Total liquidity of $955.8 million consisting of $160.5 million in unrestricted cash and cash equivalents and full availability of $795.3 million under the unsecured revolving credit facility ◦ Pro forma for the subsequent senior notes repurchase and the sales of Skyport Plaza and a non-core Quixote asset, total liquidity of $840.4 million, consisting of $75.1 million in unrestricted cash and cash equivalents and $765.3 million of availability under the unsecured revolving credit facility • Net debt to undepreciated book value (HPP's share) of 32.1%, with 100.0% of debt fixed or capped at a weighted average interest rate of 4.9% • Pro forma for the subsequent senior notes repurchase and asset sales, debt (HPP's share) of $2.7 billion, down $425.0 million, or 14%, from a year ago • Together with its joint venture partner, extended the $1.1 billion Hollywood Media Portfolio CMBS loan to November 2027, with no principal paydown and an unchanged spread, and SOFR fixed at 3.50% • Subsequent to the quarter, repurchased $200.0 million of senior notes due 2027 and 2028 at a discount to par, funded with cash on hand, including recent asset sale proceeds, and borrowings under the unsecured revolving credit facility Dividend • The Board of Directors declared and paid a dividend of $0.296875 per share on the 4.750% Series C cumulative preferred stock Sustainability • Named a GRESB Sector Leader for the sixth consecutive year and earned a 5-Star rating in the 2026 Real Estate Assessment • Ranked 1st in the US Office, Listed peer group for the second consecutive year, and 1st among all listed participants in the Americas 2026 Outlook Hudson Pacific is increasing and narrowing its full-year 2026 Core FFO outlook to $1.15 to $1.21 per diluted share, from the prior range of $1.12 to $1.20. This outlook reflects management’s view of current and future market conditions, including assumptions with respect to rental rates, occupancy levels and the earnings impact of events referenced in the press release and in earlier announcements. While the Company has received no indication that Weil, Gotshal & Manges will stop paying rent, it has conservatively excluded that rent from the outlook for the balance of the year. The 200 basis point improvement to average in-service office occupancy reflects actual results for the first three quarters and estimates for the fourth quarter. The 175 basis point improvement to same-store property cash NOI growth reflects full-year estimates for the revised same-store pool. Both improvements are essentially attributable to the sales of 875 Howard and Skyport Plaza and the temporary removal of Fourth & Traction from the in-service and same-store portfolios for seismic upgrades ahead of re-leasing. Absent these changes, the Company likely would have maintained its prior outlook for both metrics. The outlook otherwise excludes any impact from new acquisitions, dispositions, debt financings, amendments or repayments, recapitalizations, capital markets activity or similar matters. There can be no assurance that actual results will not differ materially from these estimates.
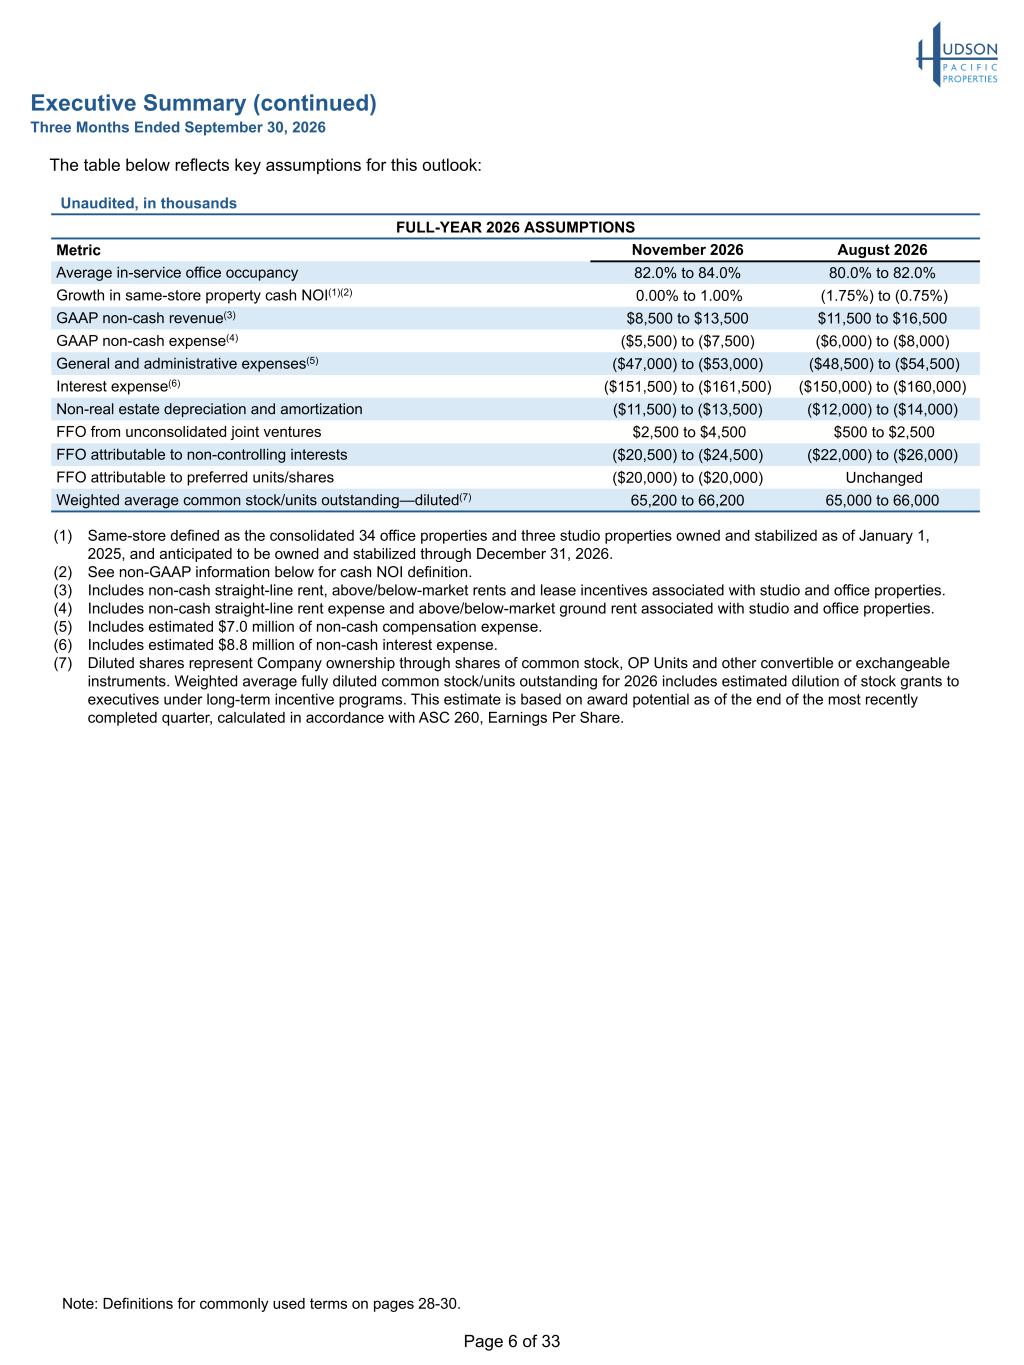
Page 6 of 33 Executive Summary (continued) Three Months Ended September 30, 2026 Note: Definitions for commonly used terms on pages 28-30. The table below reflects key assumptions for this outlook: (1) Same-store defined as the consolidated 34 office properties and three studio properties owned and stabilized as of January 1, 2025, and anticipated to be owned and stabilized through December 31, 2026. (2) See non-GAAP information below for cash NOI definition. (3) Includes non-cash straight-line rent, above/below-market rents and lease incentives associated with studio and office properties. (4) Includes non-cash straight-line rent expense and above/below-market ground rent associated with studio and office properties. (5) Includes estimated $7.0 million of non-cash compensation expense. (6) Includes estimated $8.8 million of non-cash interest expense. (7) Diluted shares represent Company ownership through shares of common stock, OP Units and other convertible or exchangeable instruments. Weighted average fully diluted common stock/units outstanding for 2026 includes estimated dilution of stock grants to executives under long-term incentive programs. This estimate is based on award potential as of the end of the most recently completed quarter, calculated in accordance with ASC 260, Earnings Per Share. Unaudited, in thousands FULL-YEAR 2026 ASSUMPTIONS Metric November 2026 August 2026 Average in-service office occupancy 82.0% to 84.0% 80.0% to 82.0% Growth in same-store property cash NOI(1)(2) 0.00% to 1.00% (1.75%) to (0.75%) GAAP non-cash revenue(3) $8,500 to $13,500 $11,500 to $16,500 GAAP non-cash expense(4) ($5,500) to ($7,500) ($6,000) to ($8,000) General and administrative expenses(5) ($47,000) to ($53,000) ($48,500) to ($54,500) Interest expense(6) ($151,500) to ($161,500) ($150,000) to ($160,000) Non-real estate depreciation and amortization ($11,500) to ($13,500) ($12,000) to ($14,000) FFO from unconsolidated joint ventures $2,500 to $4,500 $500 to $2,500 FFO attributable to non-controlling interests ($20,500) to ($24,500) ($22,000) to ($26,000) FFO attributable to preferred units/shares ($20,000) to ($20,000) Unchanged Weighted average common stock/units outstanding—diluted(7) 65,200 to 66,200 65,000 to 66,000
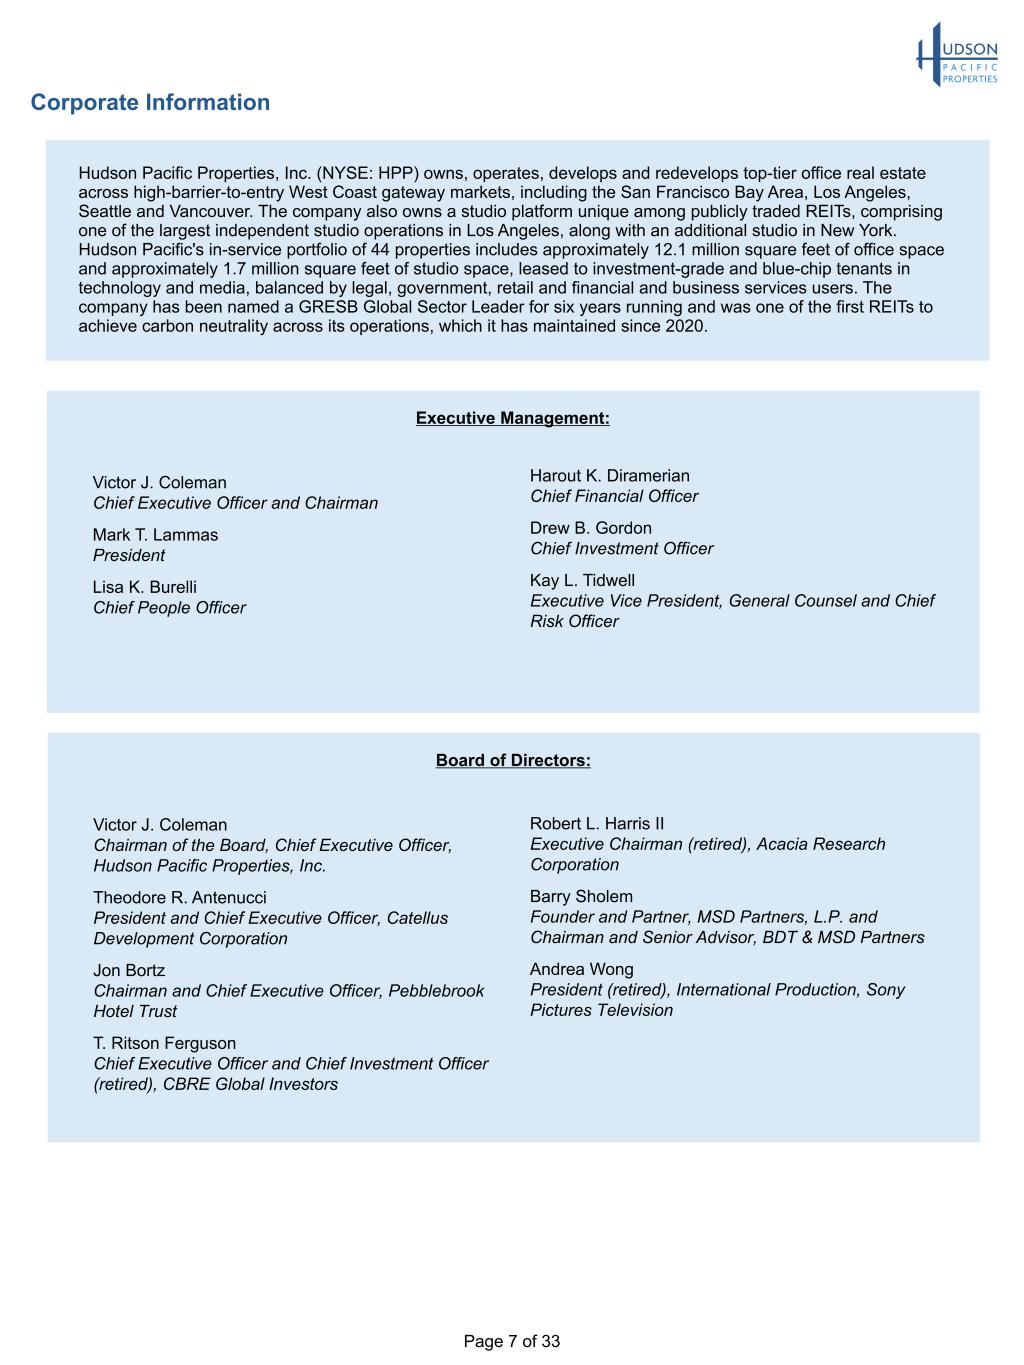
Page 7 of 33 Corporate Information Hudson Pacific Properties, Inc. (NYSE: HPP) owns, operates, develops and redevelops top-tier office real estate across high-barrier-to-entry West Coast gateway markets, including the San Francisco Bay Area, Los Angeles, Seattle and Vancouver. The company also owns a studio platform unique among publicly traded REITs, comprising one of the largest independent studio operations in Los Angeles, along with an additional studio in New York. Hudson Pacific's in-service portfolio of 44 properties includes approximately 12.1 million square feet of office space and approximately 1.7 million square feet of studio space, leased to investment-grade and blue-chip tenants in technology and media, balanced by legal, government, retail and financial and business services users. The company has been named a GRESB Global Sector Leader for six years running and was one of the first REITs to achieve carbon neutrality across its operations, which it has maintained since 2020. Robert L. Harris II Executive Chairman (retired), Acacia Research Corporation Barry Sholem Founder and Partner, MSD Partners, L.P. and Chairman and Senior Advisor, BDT & MSD Partners Andrea Wong President (retired), International Production, Sony Pictures Television Victor J. Coleman Chairman of the Board, Chief Executive Officer, Hudson Pacific Properties, Inc. Theodore R. Antenucci President and Chief Executive Officer, Catellus Development Corporation Jon Bortz Chairman and Chief Executive Officer, Pebblebrook Hotel Trust T. Ritson Ferguson Chief Executive Officer and Chief Investment Officer (retired), CBRE Global Investors Board of Directors: Harout K. Diramerian Chief Financial Officer Drew B. Gordon Chief Investment Officer Kay L. Tidwell Executive Vice President, General Counsel and Chief Risk Officer Victor J. Coleman Chief Executive Officer and Chairman Mark T. Lammas President Lisa K. Burelli Chief People Officer Executive Management:
Page 8 of 33 Corporate Information (continued) BofA Securities Jana Galan (646) 855-5042 BMO Capital Markets John Kim (212) 885-4115 BTIG Tom Catherwood (212) 738-6140 Cantor Fitzgerald Richard Anderson (929) 441-6927 Citigroup Global Markets Seth Bergey (212) 816-2066 Wells Fargo Securities Blaine Heck (443) 263-6529 Wolfe Research Ally Yaseen (646) 582-9253 Fitch Ratings Peter Siciliano (646) 582-4760 Moody’s Investors Service Ranjini Venkatesan (212) 553-3828 Standard & Poor’s Hannah Gray (646) 784-0134 Equity Research Coverage: Goldman Sachs Caitlin Burrows (212) 902-4736 Green Street Advisors Dylan Burzinski (949) 640-8780 Mizuho Securities Vikram Malhotra (212) 282-3827 Morgan Stanley Ronald Kamdem (212) 296-8319 Piper Sandler & Company Alexander Goldfarb (212) 466-7937 Rating Agencies: Corporate Contact: Corporate Headquarters 11601 Wilshire Boulevard Ninth Floor Los Angeles, CA 90025 (310) 445-5700 Website www.hudsonpacificproperties.com Investor Relations Laura Campbell Executive Vice President, Investor Relations and Marketing (310) 622-1702
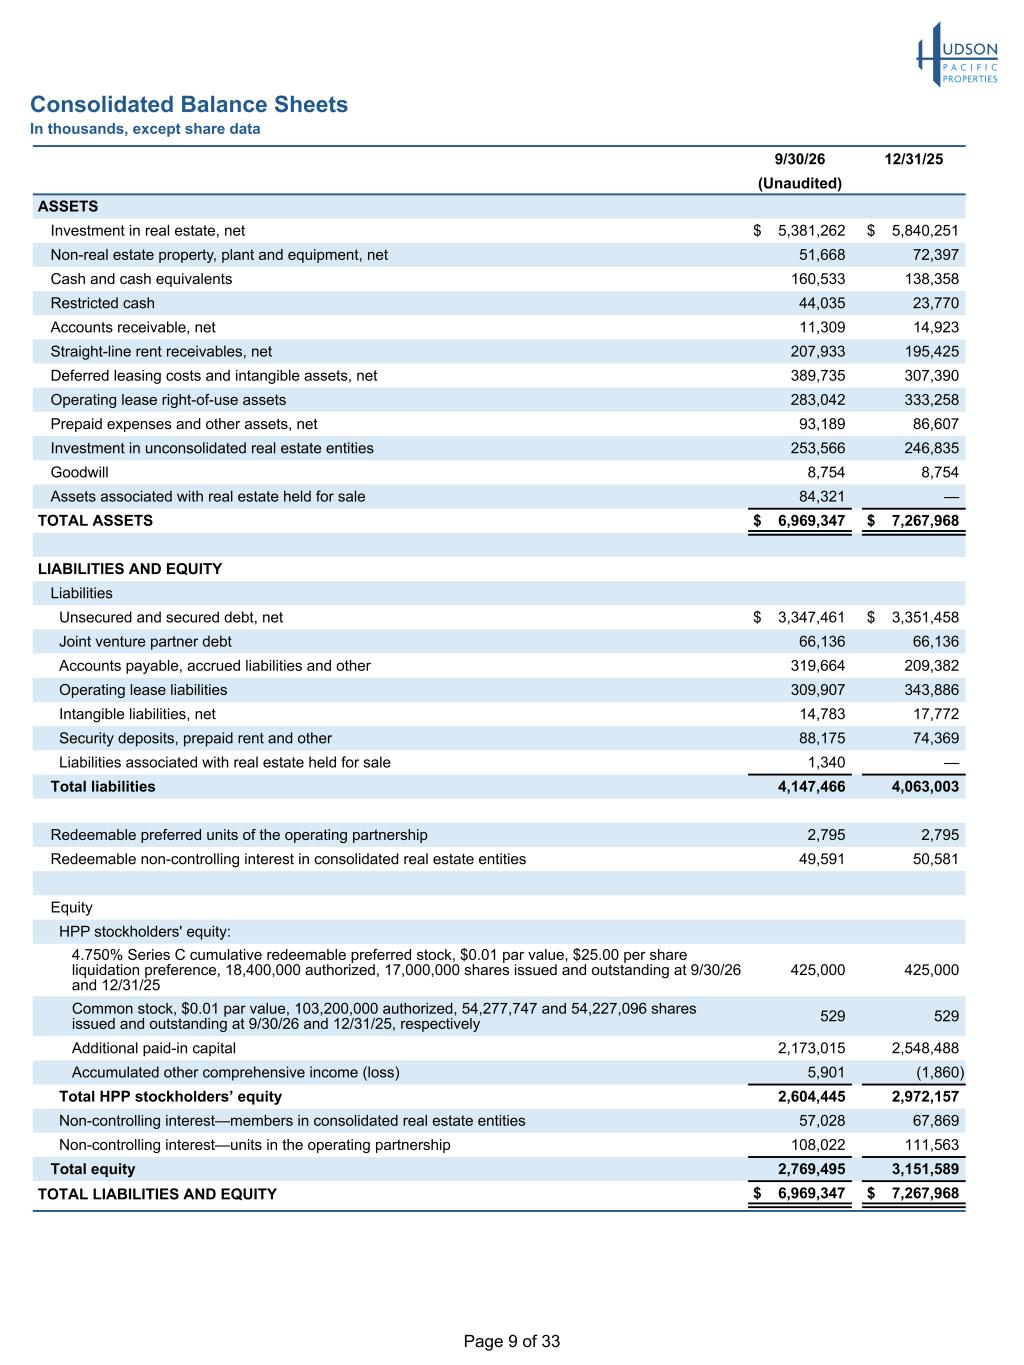
Page 9 of 33 Consolidated Balance Sheets In thousands, except share data 9/30/26 12/31/25 (Unaudited) ASSETS Investment in real estate, net $ 5,381,262 $ 5,840,251 Non-real estate property, plant and equipment, net 51,668 72,397 Cash and cash equivalents 160,533 138,358 Restricted cash 44,035 23,770 Accounts receivable, net 11,309 14,923 Straight-line rent receivables, net 207,933 195,425 Deferred leasing costs and intangible assets, net 389,735 307,390 Operating lease right-of-use assets 283,042 333,258 Prepaid expenses and other assets, net 93,189 86,607 Investment in unconsolidated real estate entities 253,566 246,835 Goodwill 8,754 8,754 Assets associated with real estate held for sale 84,321 — TOTAL ASSETS $ 6,969,347 $ 7,267,968 LIABILITIES AND EQUITY Liabilities Unsecured and secured debt, net $ 3,347,461 $ 3,351,458 Joint venture partner debt 66,136 66,136 Accounts payable, accrued liabilities and other 319,664 209,382 Operating lease liabilities 309,907 343,886 Intangible liabilities, net 14,783 17,772 Security deposits, prepaid rent and other 88,175 74,369 Liabilities associated with real estate held for sale 1,340 — Total liabilities 4,147,466 4,063,003 Redeemable preferred units of the operating partnership 2,795 2,795 Redeemable non-controlling interest in consolidated real estate entities 49,591 50,581 Equity HPP stockholders' equity: 4.750% Series C cumulative redeemable preferred stock, $0.01 par value, $25.00 per share liquidation preference, 18,400,000 authorized, 17,000,000 shares issued and outstanding at 9/30/26 and 12/31/25 425,000 425,000 Common stock, $0.01 par value, 103,200,000 authorized, 54,277,747 and 54,227,096 shares issued and outstanding at 9/30/26 and 12/31/25, respectively 529 529 Additional paid-in capital 2,173,015 2,548,488 Accumulated other comprehensive income (loss) 5,901 (1,860) Total HPP stockholders’ equity 2,604,445 2,972,157 Non-controlling interest—members in consolidated real estate entities 57,028 67,869 Non-controlling interest—units in the operating partnership 108,022 111,563 Total equity 2,769,495 3,151,589 TOTAL LIABILITIES AND EQUITY $ 6,969,347 $ 7,267,968
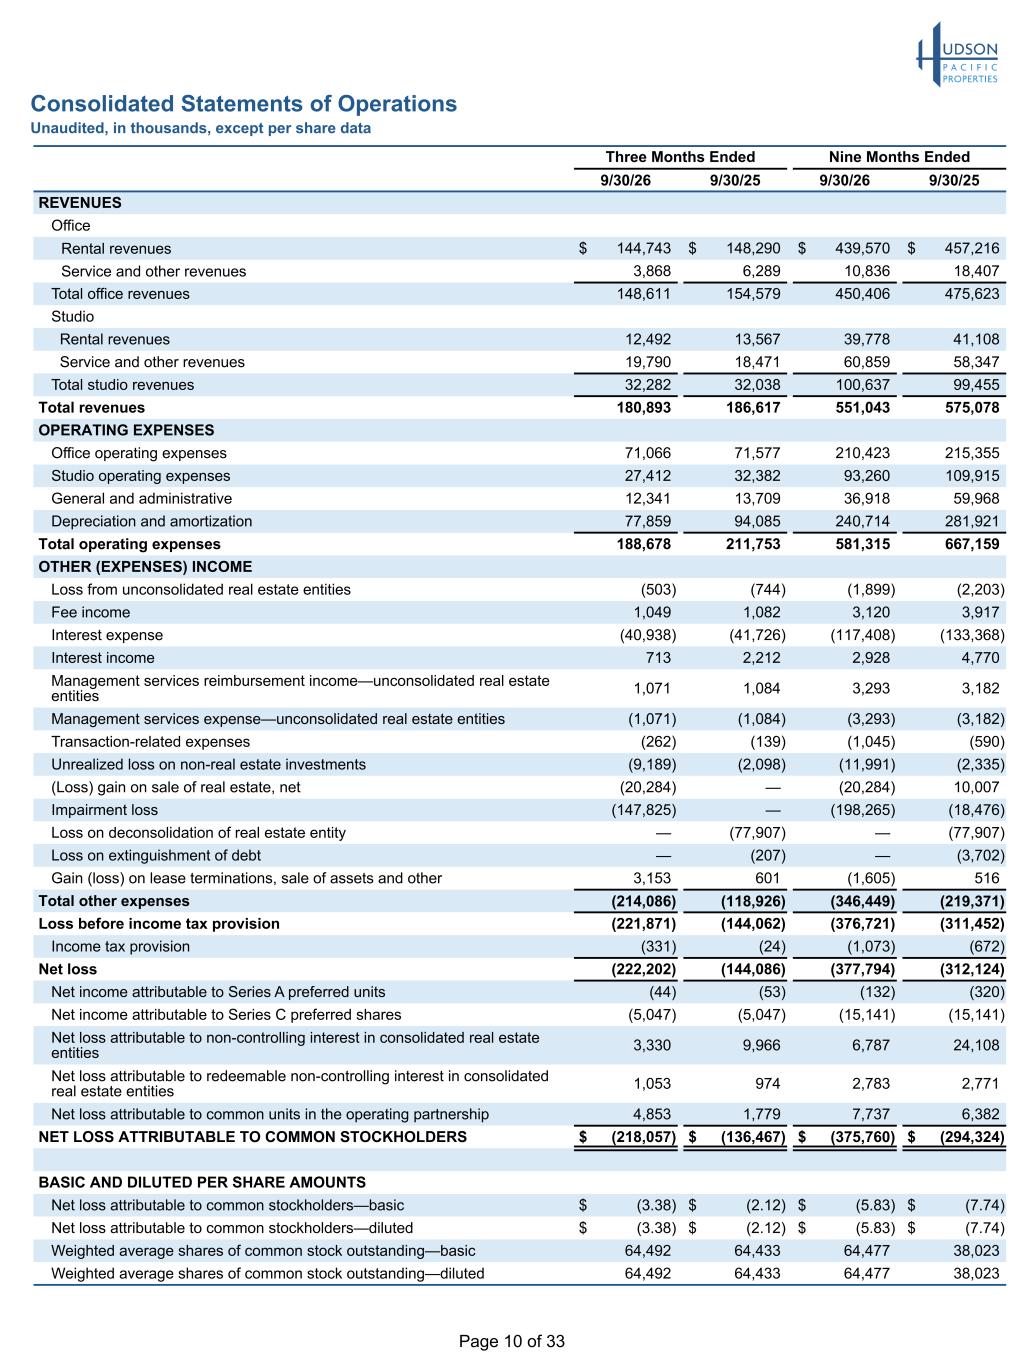
Page 10 of 33 Consolidated Statements of Operations Unaudited, in thousands, except per share data Three Months Ended Nine Months Ended 9/30/26 9/30/25 9/30/26 9/30/25 REVENUES Office Rental revenues $ 144,743 $ 148,290 $ 439,570 $ 457,216 Service and other revenues 3,868 6,289 10,836 18,407 Total office revenues 148,611 154,579 450,406 475,623 Studio Rental revenues 12,492 13,567 39,778 41,108 Service and other revenues 19,790 18,471 60,859 58,347 Total studio revenues 32,282 32,038 100,637 99,455 Total revenues 180,893 186,617 551,043 575,078 OPERATING EXPENSES Office operating expenses 71,066 71,577 210,423 215,355 Studio operating expenses 27,412 32,382 93,260 109,915 General and administrative 12,341 13,709 36,918 59,968 Depreciation and amortization 77,859 94,085 240,714 281,921 Total operating expenses 188,678 211,753 581,315 667,159 OTHER (EXPENSES) INCOME Loss from unconsolidated real estate entities (503) (744) (1,899) (2,203) Fee income 1,049 1,082 3,120 3,917 Interest expense (40,938) (41,726) (117,408) (133,368) Interest income 713 2,212 2,928 4,770 Management services reimbursement income—unconsolidated real estate entities 1,071 1,084 3,293 3,182 Management services expense—unconsolidated real estate entities (1,071) (1,084) (3,293) (3,182) Transaction-related expenses (262) (139) (1,045) (590) Unrealized loss on non-real estate investments (9,189) (2,098) (11,991) (2,335) (Loss) gain on sale of real estate, net (20,284) — (20,284) 10,007 Impairment loss (147,825) — (198,265) (18,476) Loss on deconsolidation of real estate entity — (77,907) — (77,907) Loss on extinguishment of debt — (207) — (3,702) Gain (loss) on lease terminations, sale of assets and other 3,153 601 (1,605) 516 Total other expenses (214,086) (118,926) (346,449) (219,371) Loss before income tax provision (221,871) (144,062) (376,721) (311,452) Income tax provision (331) (24) (1,073) (672) Net loss (222,202) (144,086) (377,794) (312,124) Net income attributable to Series A preferred units (44) (53) (132) (320) Net income attributable to Series C preferred shares (5,047) (5,047) (15,141) (15,141) Net loss attributable to non-controlling interest in consolidated real estate entities 3,330 9,966 6,787 24,108 Net loss attributable to redeemable non-controlling interest in consolidated real estate entities 1,053 974 2,783 2,771 Net loss attributable to common units in the operating partnership 4,853 1,779 7,737 6,382 NET LOSS ATTRIBUTABLE TO COMMON STOCKHOLDERS $ (218,057) $ (136,467) $ (375,760) $ (294,324) BASIC AND DILUTED PER SHARE AMOUNTS Net loss attributable to common stockholders—basic $ (3.38) $ (2.12) $ (5.83) $ (7.74) Net loss attributable to common stockholders—diluted $ (3.38) $ (2.12) $ (5.83) $ (7.74) Weighted average shares of common stock outstanding—basic 64,492 64,433 64,477 38,023 Weighted average shares of common stock outstanding—diluted 64,492 64,433 64,477 38,023
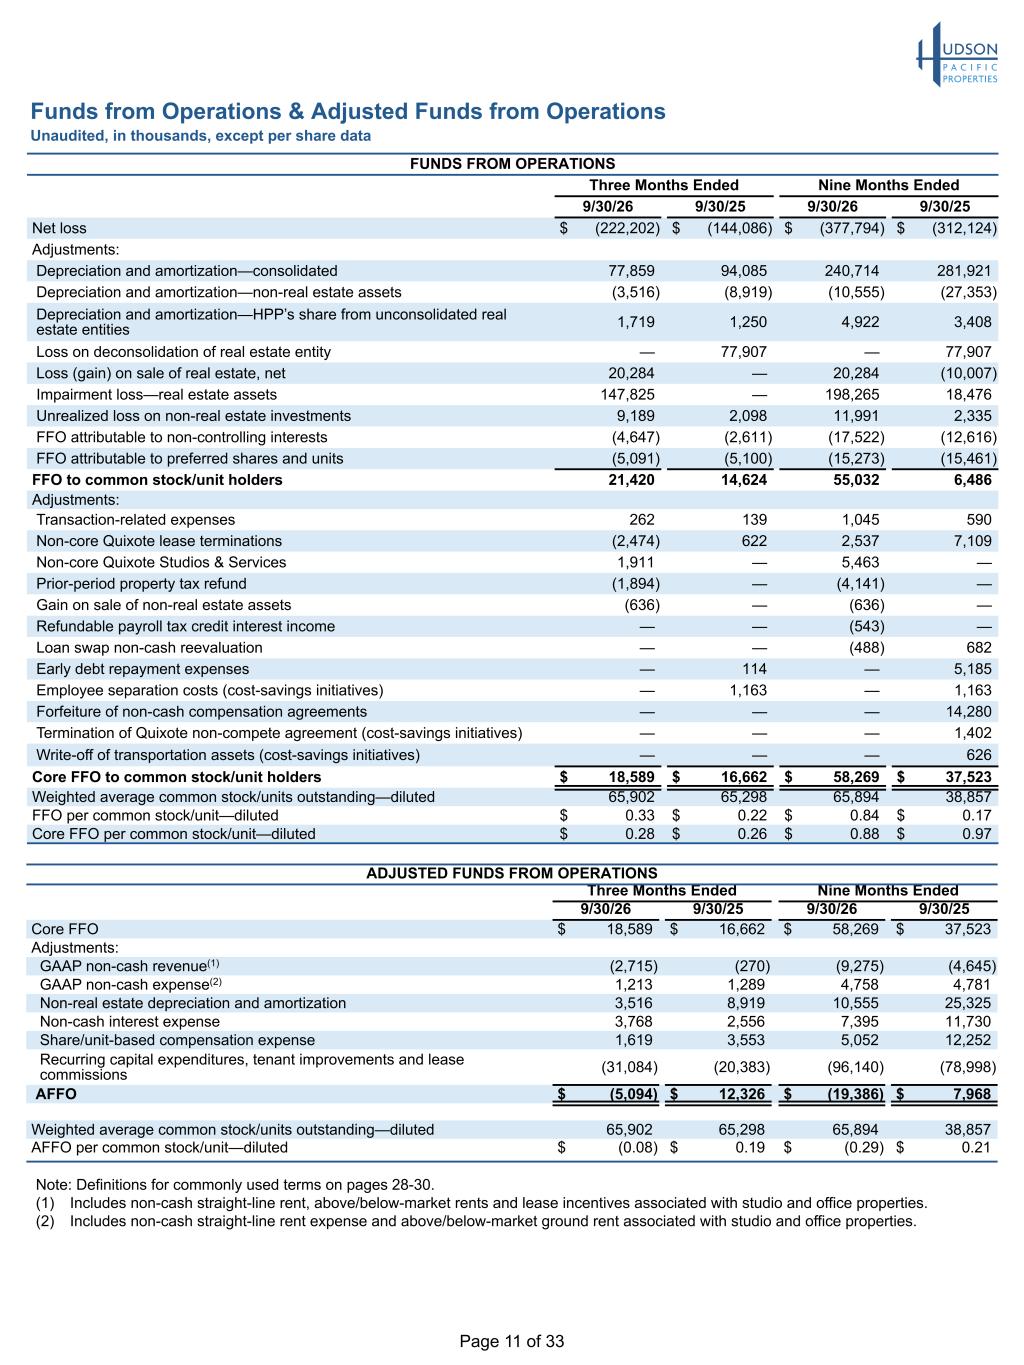
Page 11 of 33 Funds from Operations & Adjusted Funds from Operations Unaudited, in thousands, except per share data ADJUSTED FUNDS FROM OPERATIONS Three Months Ended Nine Months Ended 9/30/26 9/30/25 9/30/26 9/30/25 Core FFO $ 18,589 $ 16,662 $ 58,269 $ 37,523 Adjustments: GAAP non-cash revenue(1) (2,715) (270) (9,275) (4,645) GAAP non-cash expense(2) 1,213 1,289 4,758 4,781 Non-real estate depreciation and amortization 3,516 8,919 10,555 25,325 Non-cash interest expense 3,768 2,556 7,395 11,730 Share/unit-based compensation expense 1,619 3,553 5,052 12,252 Recurring capital expenditures, tenant improvements and lease commissions (31,084) (20,383) (96,140) (78,998) AFFO $ (5,094) $ 12,326 $ (19,386) $ 7,968 Weighted average common stock/units outstanding—diluted 65,902 65,298 65,894 38,857 AFFO per common stock/unit—diluted $ (0.08) $ 0.19 $ (0.29) $ 0.21 FUNDS FROM OPERATIONS Three Months Ended Nine Months Ended 9/30/26 9/30/25 9/30/26 9/30/25 Net loss $ (222,202) $ (144,086) $ (377,794) $ (312,124) Adjustments: Depreciation and amortization—consolidated 77,859 94,085 240,714 281,921 Depreciation and amortization—non-real estate assets (3,516) (8,919) (10,555) (27,353) Depreciation and amortization—HPP’s share from unconsolidated real estate entities 1,719 1,250 4,922 3,408 Loss on deconsolidation of real estate entity — 77,907 — 77,907 Loss (gain) on sale of real estate, net 20,284 — 20,284 (10,007) Impairment loss—real estate assets 147,825 — 198,265 18,476 Unrealized loss on non-real estate investments 9,189 2,098 11,991 2,335 FFO attributable to non-controlling interests (4,647) (2,611) (17,522) (12,616) FFO attributable to preferred shares and units (5,091) (5,100) (15,273) (15,461) FFO to common stock/unit holders 21,420 14,624 55,032 6,486 Adjustments: Transaction-related expenses 262 139 1,045 590 Non-core Quixote lease terminations (2,474) 622 2,537 7,109 Non-core Quixote Studios & Services 1,911 — 5,463 — Prior-period property tax refund (1,894) — (4,141) — Gain on sale of non-real estate assets (636) — (636) — Refundable payroll tax credit interest income — — (543) — Loan swap non-cash reevaluation — — (488) 682 Early debt repayment expenses — 114 — 5,185 Employee separation costs (cost-savings initiatives) — 1,163 — 1,163 Forfeiture of non-cash compensation agreements — — — 14,280 Termination of Quixote non-compete agreement (cost-savings initiatives) — — — 1,402 Write-off of transportation assets (cost-savings initiatives) — — — 626 Core FFO to common stock/unit holders $ 18,589 $ 16,662 $ 58,269 $ 37,523 Weighted average common stock/units outstanding—diluted 65,902 65,298 65,894 38,857 FFO per common stock/unit—diluted $ 0.33 $ 0.22 $ 0.84 $ 0.17 Core FFO per common stock/unit—diluted $ 0.28 $ 0.26 $ 0.88 $ 0.97 Note: Definitions for commonly used terms on pages 28-30. (1) Includes non-cash straight-line rent, above/below-market rents and lease incentives associated with studio and office properties. (2) Includes non-cash straight-line rent expense and above/below-market ground rent associated with studio and office properties.
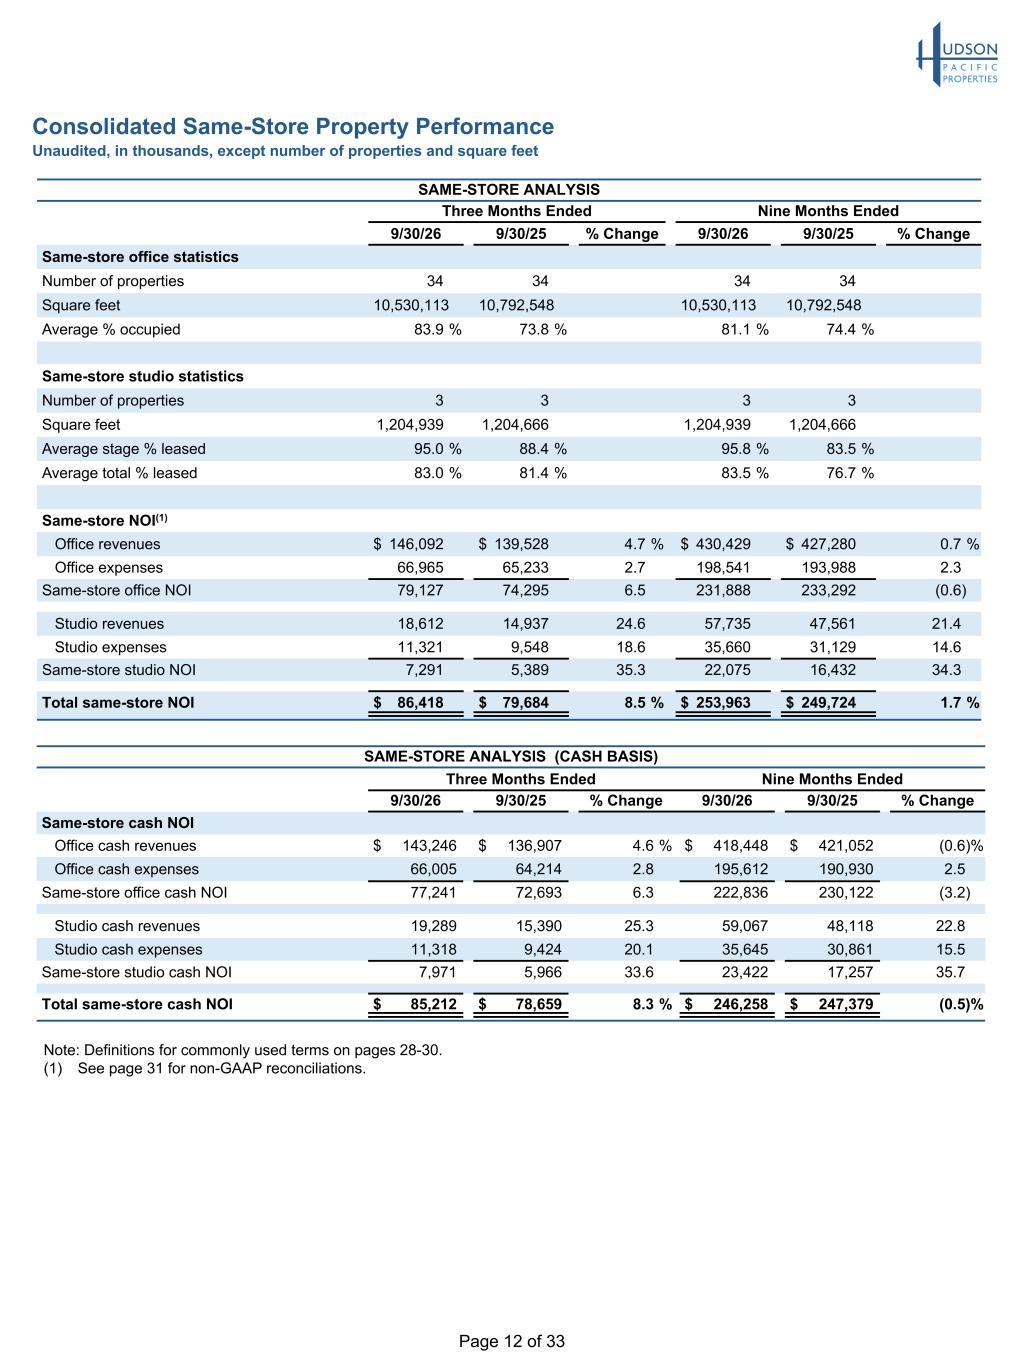
Page 12 of 33 Consolidated Same-Store Property Performance Unaudited, in thousands, except number of properties and square feet SAME-STORE ANALYSIS Three Months Ended Nine Months Ended 9/30/26 9/30/25 % Change 9/30/26 9/30/25 % Change Same-store office statistics Number of properties 34 34 34 34 Square feet 10,530,113 10,792,548 10,530,113 10,792,548 Average % occupied 83.9 % 73.8 % 81.1 % 74.4 % Same-store studio statistics Number of properties 3 3 3 3 Square feet 1,204,939 1,204,666 1,204,939 1,204,666 Average stage % leased 95.0 % 88.4 % 95.8 % 83.5 % Average total % leased 83.0 % 81.4 % 83.5 % 76.7 % Same-store NOI(1) Office revenues $ 146,092 $ 139,528 4.7 % $ 430,429 $ 427,280 0.7 % Office expenses 66,965 65,233 2.7 198,541 193,988 2.3 Same-store office NOI 79,127 74,295 6.5 231,888 233,292 (0.6) Studio revenues 18,612 14,937 24.6 57,735 47,561 21.4 Studio expenses 11,321 9,548 18.6 35,660 31,129 14.6 Same-store studio NOI 7,291 5,389 35.3 22,075 16,432 34.3 Total same-store NOI $ 86,418 $ 79,684 8.5 % $ 253,963 $ 249,724 1.7 % SAME-STORE ANALYSIS (CASH BASIS) Three Months Ended Nine Months Ended 9/30/26 9/30/25 % Change 9/30/26 9/30/25 % Change Same-store cash NOI Office cash revenues $ 143,246 $ 136,907 4.6 % $ 418,448 $ 421,052 (0.6) % Office cash expenses 66,005 64,214 2.8 195,612 190,930 2.5 Same-store office cash NOI 77,241 72,693 6.3 222,836 230,122 (3.2) Studio cash revenues 19,289 15,390 25.3 59,067 48,118 22.8 Studio cash expenses 11,318 9,424 20.1 35,645 30,861 15.5 Same-store studio cash NOI 7,971 5,966 33.6 23,422 17,257 35.7 Total same-store cash NOI $ 85,212 $ 78,659 8.3 % $ 246,258 $ 247,379 (0.5) % Note: Definitions for commonly used terms on pages 28-30. (1) See page 31 for non-GAAP reconciliations.
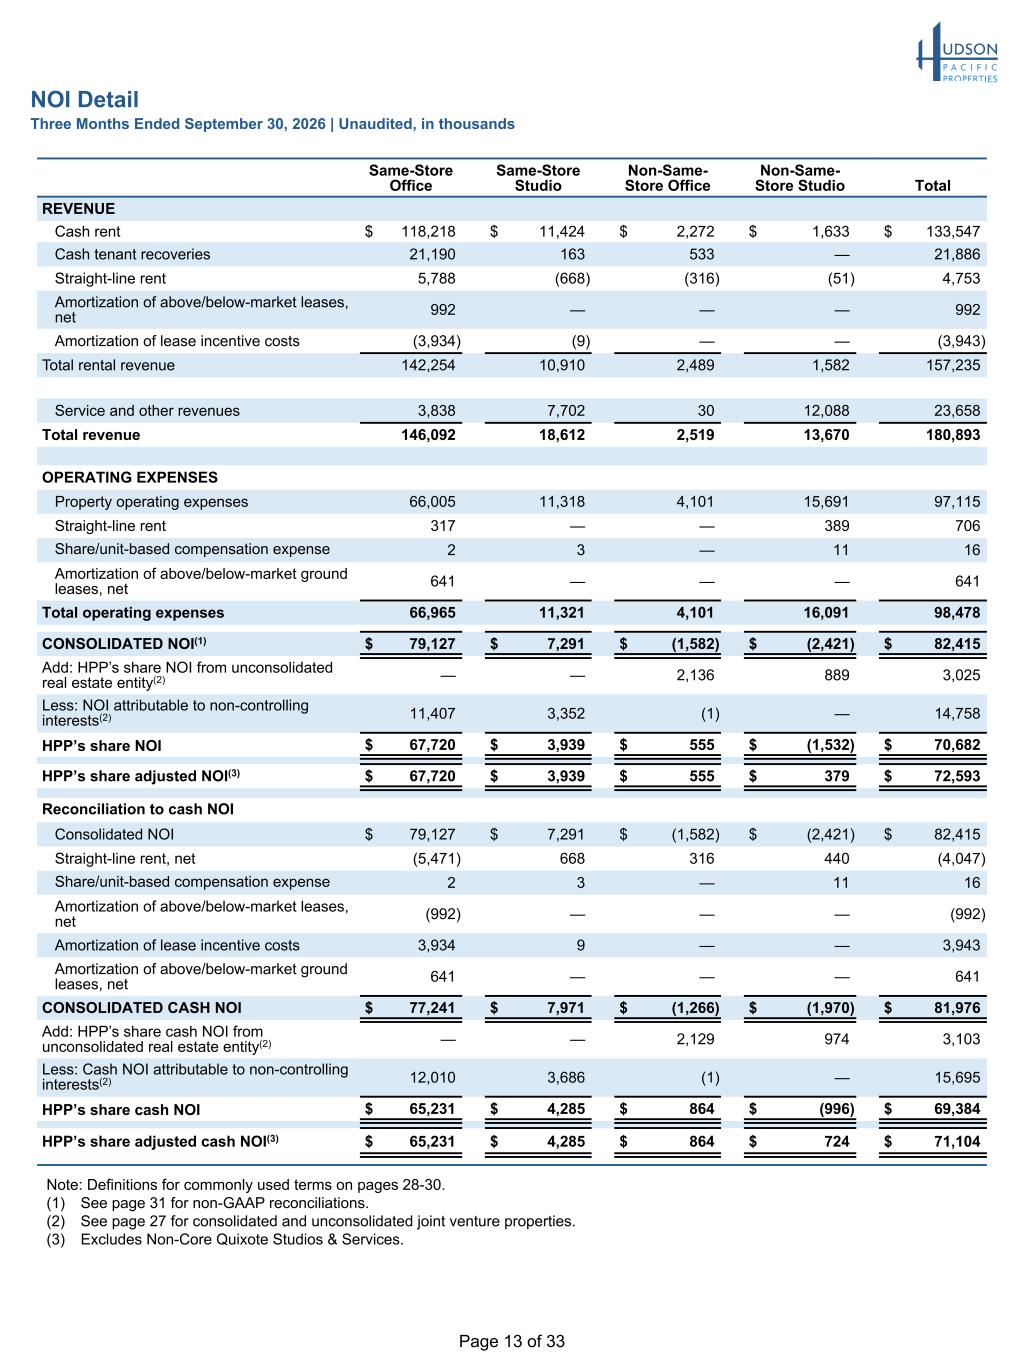
Page 13 of 33 NOI Detail Three Months Ended September 30, 2026 | Unaudited, in thousands Same-Store Office Same-Store Studio Non-Same- Store Office Non-Same- Store Studio Total REVENUE Cash rent $ 118,218 $ 11,424 $ 2,272 $ 1,633 $ 133,547 Cash tenant recoveries 21,190 163 533 — 21,886 Straight-line rent 5,788 (668) (316) (51) 4,753 Amortization of above/below-market leases, net 992 — — — 992 Amortization of lease incentive costs (3,934) (9) — — (3,943) Total rental revenue 142,254 10,910 2,489 1,582 157,235 Service and other revenues 3,838 7,702 30 12,088 23,658 Total revenue 146,092 18,612 2,519 13,670 180,893 OPERATING EXPENSES Property operating expenses 66,005 11,318 4,101 15,691 97,115 Straight-line rent 317 — — 389 706 Share/unit-based compensation expense 2 3 — 11 16 Amortization of above/below-market ground leases, net 641 — — — 641 Total operating expenses 66,965 11,321 4,101 16,091 98,478 CONSOLIDATED NOI(1) $ 79,127 $ 7,291 $ (1,582) $ (2,421) $ 82,415 Add: HPP’s share NOI from unconsolidated real estate entity(2) — — 2,136 889 3,025 Less: NOI attributable to non-controlling interests(2) 11,407 3,352 (1) — 14,758 HPP’s share NOI $ 67,720 $ 3,939 $ 555 $ (1,532) $ 70,682 HPP’s share adjusted NOI(3) $ 67,720 $ 3,939 $ 555 $ 379 $ 72,593 Reconciliation to cash NOI Consolidated NOI $ 79,127 $ 7,291 $ (1,582) $ (2,421) $ 82,415 Straight-line rent, net (5,471) 668 316 440 (4,047) Share/unit-based compensation expense 2 3 — 11 16 Amortization of above/below-market leases, net (992) — — — (992) Amortization of lease incentive costs 3,934 9 — — 3,943 Amortization of above/below-market ground leases, net 641 — — — 641 CONSOLIDATED CASH NOI $ 77,241 $ 7,971 $ (1,266) $ (1,970) $ 81,976 Add: HPP’s share cash NOI from unconsolidated real estate entity(2) — — 2,129 974 3,103 Less: Cash NOI attributable to non-controlling interests(2) 12,010 3,686 (1) — 15,695 HPP’s share cash NOI $ 65,231 $ 4,285 $ 864 $ (996) $ 69,384 HPP’s share adjusted cash NOI(3) $ 65,231 $ 4,285 $ 864 $ 724 $ 71,104 Note: Definitions for commonly used terms on pages 28-30. (1) See page 31 for non-GAAP reconciliations. (2) See page 27 for consolidated and unconsolidated joint venture properties. (3) Excludes Non-Core Quixote Studios & Services.
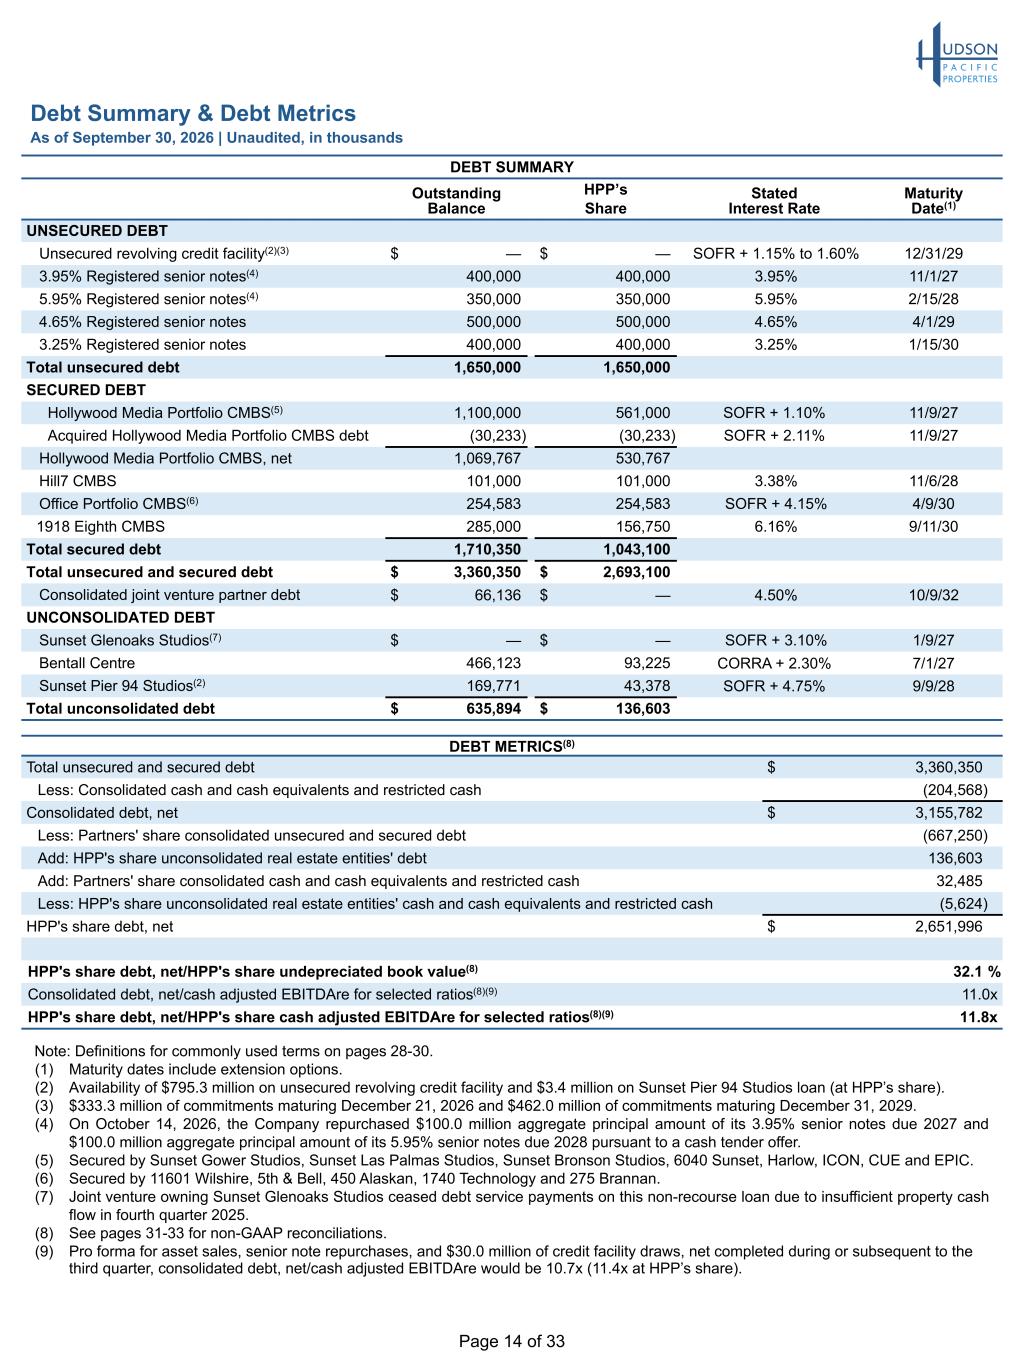
Page 14 of 33 Debt Summary & Debt Metrics As of September 30, 2026 | Unaudited, in thousands DEBT SUMMARY Outstanding Balance HPP’s Share Stated Interest Rate Maturity Date(1) UNSECURED DEBT Unsecured revolving credit facility(2)(3) $ — $ — SOFR + 1.15% to 1.60% 12/31/29 3.95% Registered senior notes(4) 400,000 400,000 3.95% 11/1/27 5.95% Registered senior notes(4) 350,000 350,000 5.95% 2/15/28 4.65% Registered senior notes 500,000 500,000 4.65% 4/1/29 3.25% Registered senior notes 400,000 400,000 3.25% 1/15/30 Total unsecured debt 1,650,000 1,650,000 SECURED DEBT Hollywood Media Portfolio CMBS(5) 1,100,000 561,000 SOFR + 1.10% 11/9/27 Acquired Hollywood Media Portfolio CMBS debt (30,233) (30,233) SOFR + 2.11% 11/9/27 Hollywood Media Portfolio CMBS, net 1,069,767 530,767 Hill7 CMBS 101,000 101,000 3.38% 11/6/28 Office Portfolio CMBS(6) 254,583 254,583 SOFR + 4.15% 4/9/30 1918 Eighth CMBS 285,000 156,750 6.16% 9/11/30 Total secured debt 1,710,350 1,043,100 Total unsecured and secured debt $ 3,360,350 $ 2,693,100 Consolidated joint venture partner debt $ 66,136 $ — 4.50% 10/9/32 UNCONSOLIDATED DEBT Sunset Glenoaks Studios(7) $ — $ — SOFR + 3.10% 1/9/27 Bentall Centre 466,123 93,225 CORRA + 2.30% 7/1/27 Sunset Pier 94 Studios(2) 169,771 43,378 SOFR + 4.75% 9/9/28 Total unconsolidated debt $ 635,894 $ 136,603 Note: Definitions for commonly used terms on pages 28-30. (1) Maturity dates include extension options. (2) Availability of $795.3 million on unsecured revolving credit facility and $3.4 million on Sunset Pier 94 Studios loan (at HPP’s share). (3) $333.3 million of commitments maturing December 21, 2026 and $462.0 million of commitments maturing December 31, 2029. (4) On October 14, 2026, the Company repurchased $100.0 million aggregate principal amount of its 3.95% senior notes due 2027 and $100.0 million aggregate principal amount of its 5.95% senior notes due 2028 pursuant to a cash tender offer. (5) Secured by Sunset Gower Studios, Sunset Las Palmas Studios, Sunset Bronson Studios, 6040 Sunset, Harlow, ICON, CUE and EPIC. (6) Secured by 11601 Wilshire, 5th & Bell, 450 Alaskan, 1740 Technology and 275 Brannan. (7) Joint venture owning Sunset Glenoaks Studios ceased debt service payments on this non-recourse loan due to insufficient property cash flow in fourth quarter 2025. (8) See pages 31-33 for non-GAAP reconciliations. (9) Pro forma for asset sales, senior note repurchases, and $30.0 million of credit facility draws, net completed during or subsequent to the third quarter, consolidated debt, net/cash adjusted EBITDAre would be 10.7x (11.4x at HPP’s share). DEBT METRICS(8) Total unsecured and secured debt $ 3,360,350 Less: Consolidated cash and cash equivalents and restricted cash (204,568) Consolidated debt, net $ 3,155,782 Less: Partners' share consolidated unsecured and secured debt (667,250) Add: HPP's share unconsolidated real estate entities' debt 136,603 Add: Partners' share consolidated cash and cash equivalents and restricted cash 32,485 Less: HPP's share unconsolidated real estate entities' cash and cash equivalents and restricted cash (5,624) HPP's share debt, net $ 2,651,996 HPP's share debt, net/HPP's share undepreciated book value(8) 32.1 % Consolidated debt, net/cash adjusted EBITDAre for selected ratios(8)(9) 11.0x HPP's share debt, net/HPP's share cash adjusted EBITDAre for selected ratios(8)(9) 11.8x
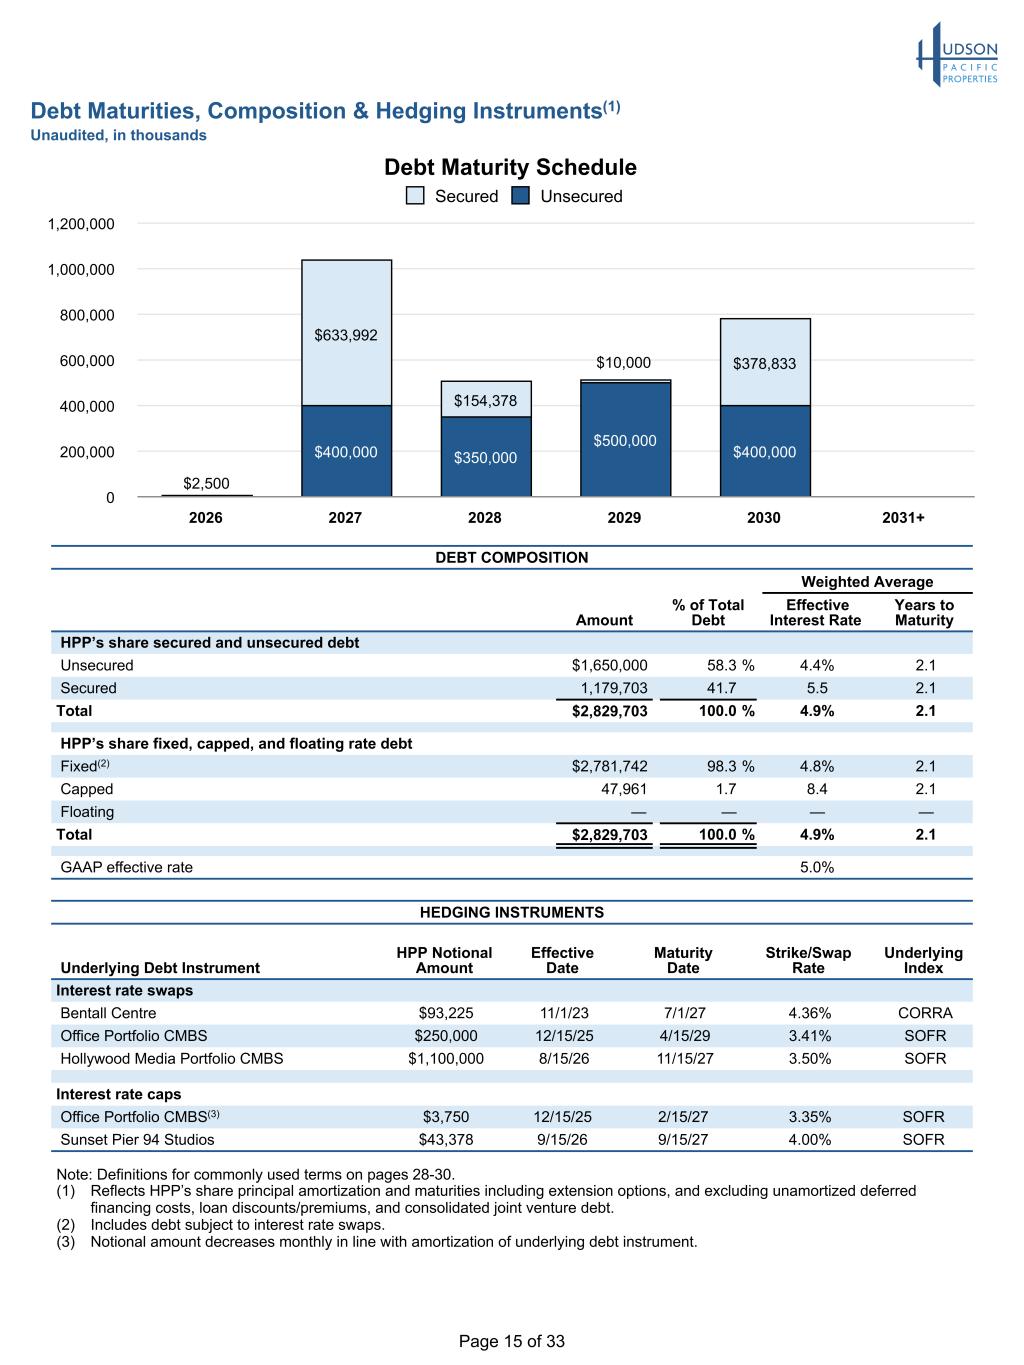
Page 15 of 33 Debt Maturities, Composition & Hedging Instruments(1) Unaudited, in thousands DEBT COMPOSITION Weighted Average Amount % of Total Debt Effective Interest Rate Years to Maturity HPP’s share secured and unsecured debt Unsecured $1,650,000 58.3 % 4.4% 2.1 Secured 1,179,703 41.7 5.5 2.1 Total $2,829,703 100.0 % 4.9% 2.1 HPP’s share fixed, capped, and floating rate debt Fixed(2) $2,781,742 98.3 % 4.8% 2.1 Capped 47,961 1.7 8.4 2.1 Floating — — — — Total $2,829,703 100.0 % 4.9% 2.1 GAAP effective rate 5.0% Debt Maturity Schedule $400,000 $350,000 $500,000 $400,000 $2,500 $633,992 $154,378 $378,833 Secured Unsecured 2026 2027 2028 2029 2030 2031+ 0 200,000 400,000 600,000 800,000 1,000,000 1,200,000 Note: Definitions for commonly used terms on pages 28-30. (1) Reflects HPP’s share principal amortization and maturities including extension options, and excluding unamortized deferred financing costs, loan discounts/premiums, and consolidated joint venture debt. (2) Includes debt subject to interest rate swaps. (3) Notional amount decreases monthly in line with amortization of underlying debt instrument. HEDGING INSTRUMENTS Underlying Debt Instrument HPP Notional Amount Effective Date Maturity Date Strike/Swap Rate Underlying Index Interest rate swaps Bentall Centre $93,225 11/1/23 7/1/27 4.36% CORRA Office Portfolio CMBS $250,000 12/15/25 4/15/29 3.41% SOFR Hollywood Media Portfolio CMBS $1,100,000 8/15/26 11/15/27 3.50% SOFR Interest rate caps Office Portfolio CMBS(3) $3,750 12/15/25 2/15/27 3.35% SOFR Sunset Pier 94 Studios $43,378 9/15/26 9/15/27 4.00% SOFR $10,000
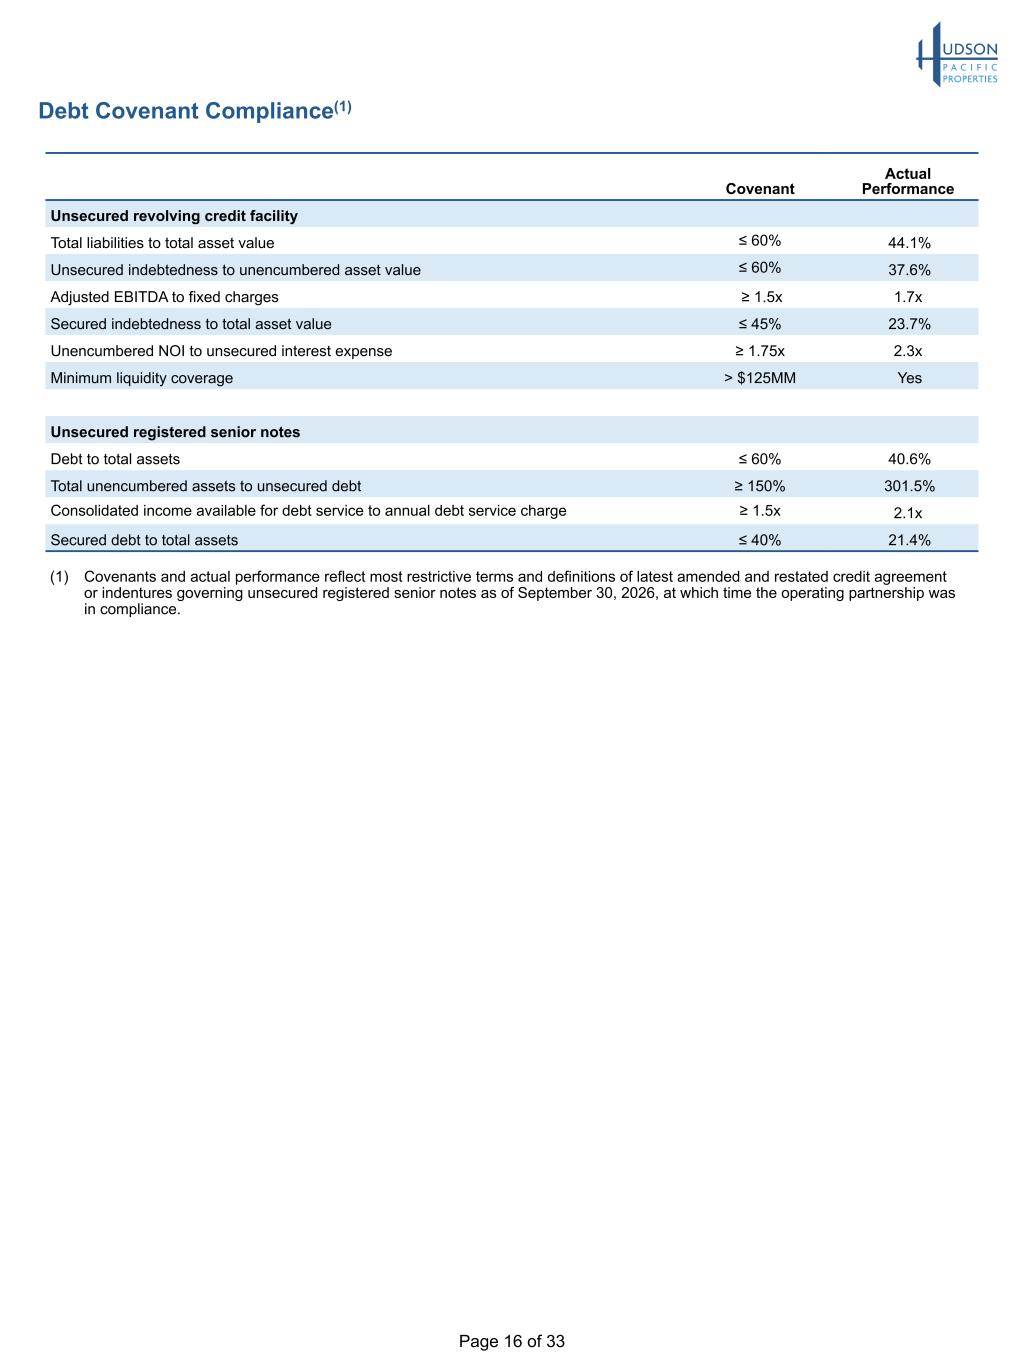
Page 16 of 33 Debt Covenant Compliance(1) Covenant Actual Performance Unsecured revolving credit facility Total liabilities to total asset value ≤ 60% 44.1% Unsecured indebtedness to unencumbered asset value ≤ 60% 37.6% Adjusted EBITDA to fixed charges ≥ 1.5x 1.7x Secured indebtedness to total asset value ≤ 45% 23.7% Unencumbered NOI to unsecured interest expense ≥ 1.75x 2.3x Minimum liquidity coverage > $125MM Yes Unsecured registered senior notes Debt to total assets ≤ 60% 40.6% Total unencumbered assets to unsecured debt ≥ 150% 301.5% Consolidated income available for debt service to annual debt service charge ≥ 1.5x 2.1x Secured debt to total assets ≤ 40% 21.4% (1) Covenants and actual performance reflect most restrictive terms and definitions of latest amended and restated credit agreement or indentures governing unsecured registered senior notes as of September 30, 2026, at which time the operating partnership was in compliance.
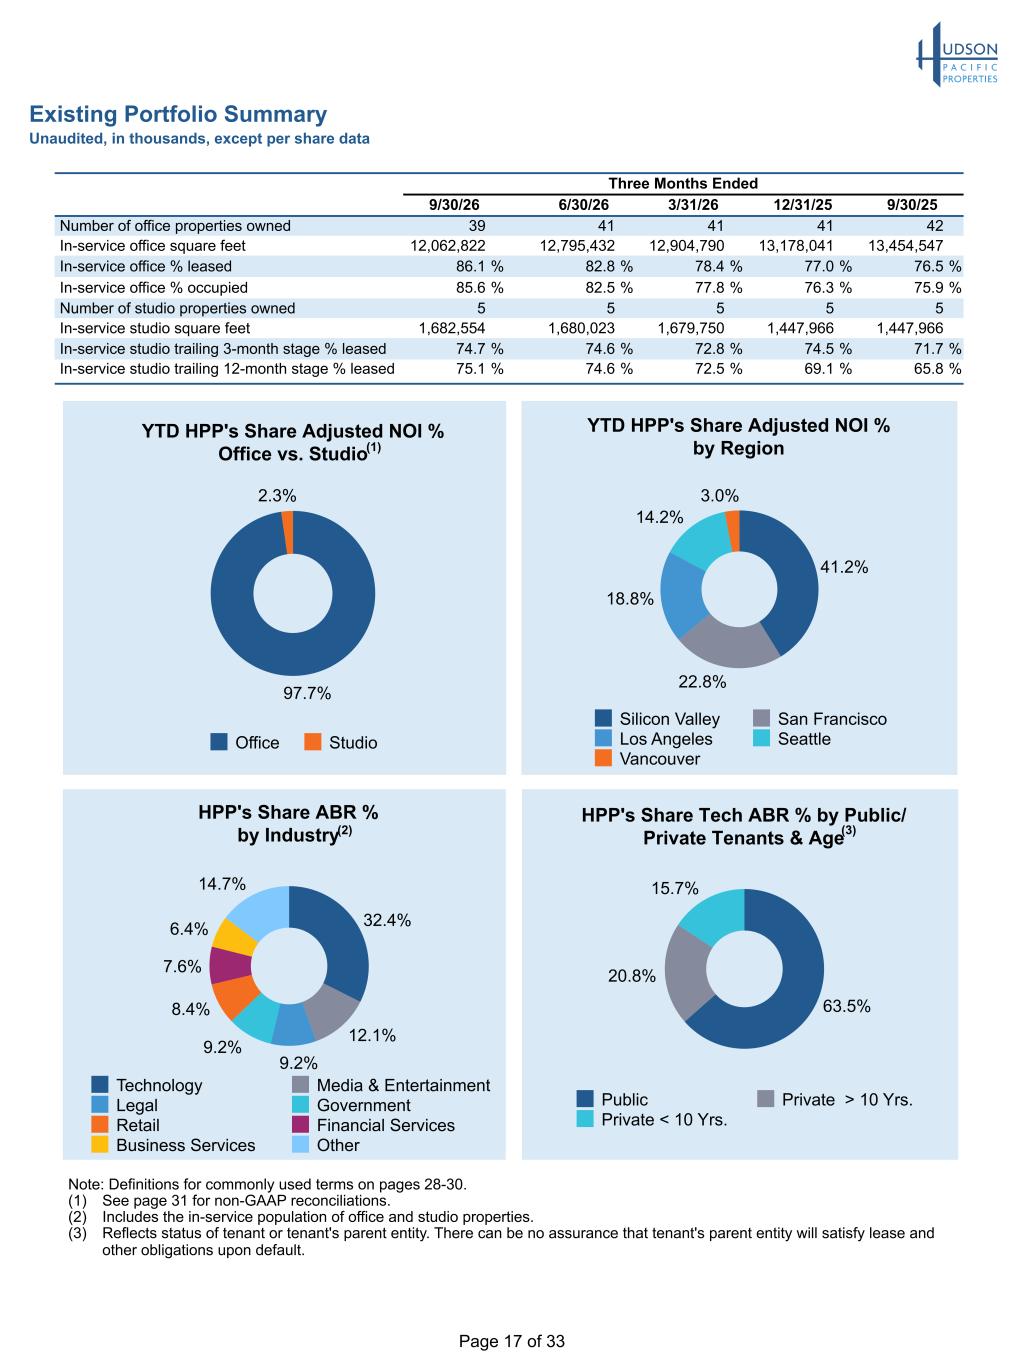
Page 17 of 33 Existing Portfolio Summary Unaudited, in thousands, except per share data Three Months Ended 9/30/26 6/30/26 3/31/26 12/31/25 9/30/25 Number of office properties owned 39 41 41 41 42 In-service office square feet 12,062,822 12,795,432 12,904,790 13,178,041 13,454,547 In-service office % leased 86.1 % 82.8 % 78.4 % 77.0 % 76.5 % In-service office % occupied 85.6 % 82.5 % 77.8 % 76.3 % 75.9 % Number of studio properties owned 5 5 5 5 5 In-service studio square feet 1,682,554 1,680,023 1,679,750 1,447,966 1,447,966 In-service studio trailing 3-month stage % leased 74.7 % 74.6 % 72.8 % 74.5 % 71.7 % In-service studio trailing 12-month stage % leased 75.1 % 74.6 % 72.5 % 69.1 % 65.8 % HPP's Share ABR % by Industry 32.4% 12.1% 9.2% 9.2% 8.4% 7.6% 6.4% 14.7% Technology Media & Entertainment Legal Government Retail Financial Services Business Services Other YTD HPP's Share Adjusted NOI % by Region 41.2% 22.8% 18.8% 14.2% 3.0% Silicon Valley San Francisco Los Angeles Seattle Vancouver HPP's Share Tech ABR % by Public/ Private Tenants & Age 63.5% 20.8% 15.7% Public Private > 10 Yrs. Private < 10 Yrs. YTD HPP's Share Adjusted NOI % Office vs. Studio 97.7% 2.3% Office Studio Note: Definitions for commonly used terms on pages 28-30. (1) See page 31 for non-GAAP reconciliations. (2) Includes the in-service population of office and studio properties. (3) Reflects status of tenant or tenant's parent entity. There can be no assurance that tenant's parent entity will satisfy lease and other obligations upon default. (1) (3)(2)
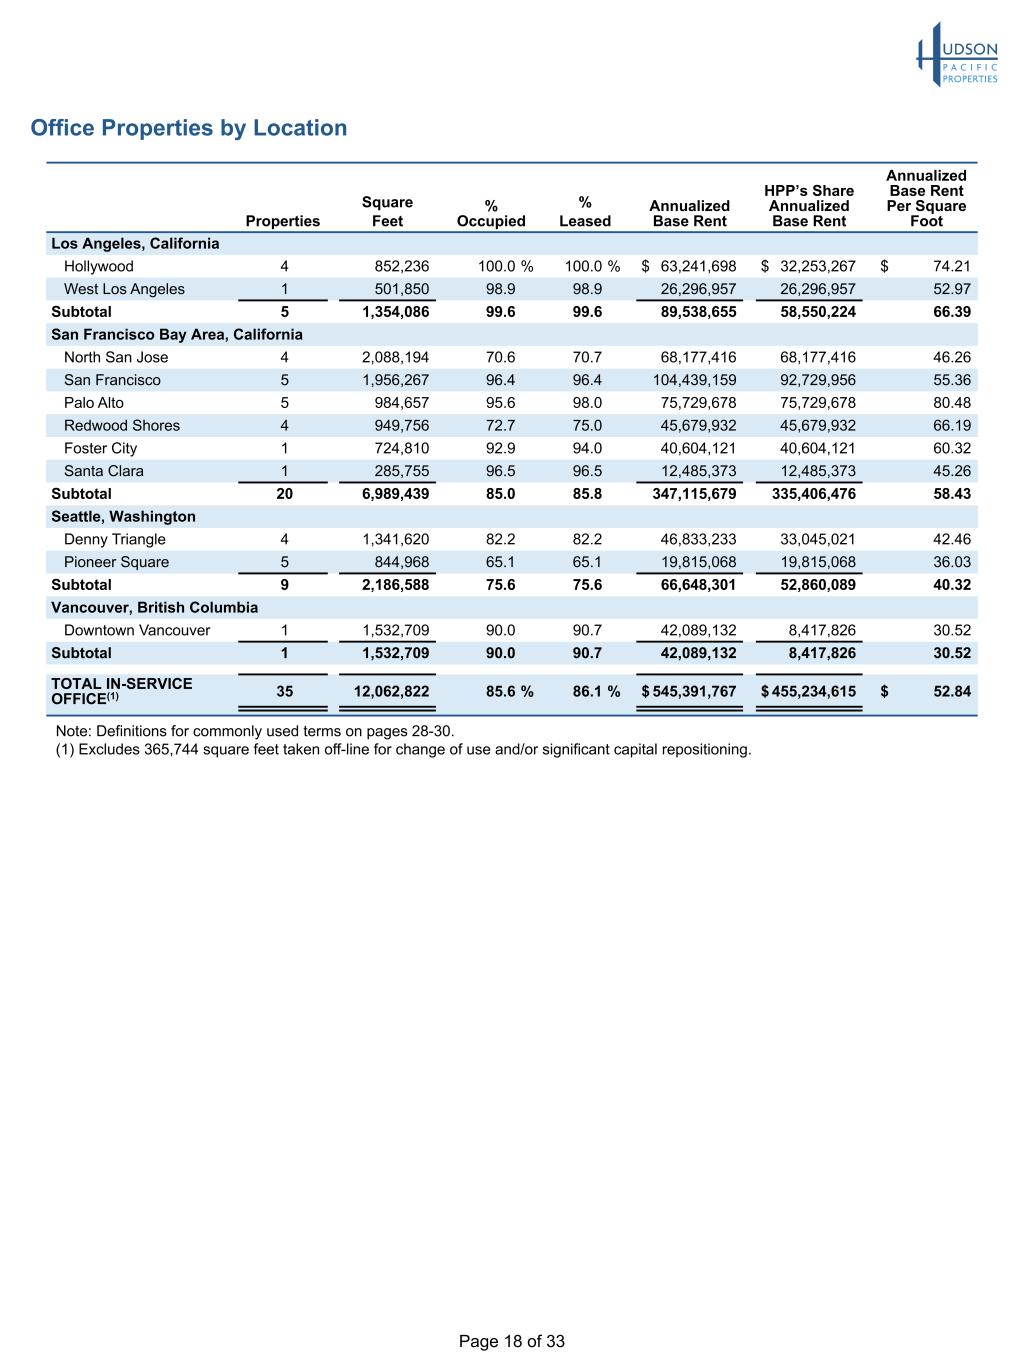
Page 18 of 33 Note: Definitions for commonly used terms on pages 28-30. (1) Excludes 365,744 square feet taken off-line for change of use and/or significant capital repositioning. Office Properties by Location Properties Square Feet % Occupied % Leased Annualized Base Rent HPP’s Share Annualized Base Rent Annualized Base Rent Per Square Foot Los Angeles, California Hollywood 4 852,236 100.0 % 100.0 % $ 63,241,698 $ 32,253,267 $ 74.21 West Los Angeles 1 501,850 98.9 98.9 26,296,957 26,296,957 52.97 Subtotal 5 1,354,086 99.6 99.6 89,538,655 58,550,224 66.39 San Francisco Bay Area, California North San Jose 4 2,088,194 70.6 70.7 68,177,416 68,177,416 46.26 San Francisco 5 1,956,267 96.4 96.4 104,439,159 92,729,956 55.36 Palo Alto 5 984,657 95.6 98.0 75,729,678 75,729,678 80.48 Redwood Shores 4 949,756 72.7 75.0 45,679,932 45,679,932 66.19 Foster City 1 724,810 92.9 94.0 40,604,121 40,604,121 60.32 Santa Clara 1 285,755 96.5 96.5 12,485,373 12,485,373 45.26 Subtotal 20 6,989,439 85.0 85.8 347,115,679 335,406,476 58.43 Seattle, Washington Denny Triangle 4 1,341,620 82.2 82.2 46,833,233 33,045,021 42.46 Pioneer Square 5 844,968 65.1 65.1 19,815,068 19,815,068 36.03 Subtotal 9 2,186,588 75.6 75.6 66,648,301 52,860,089 40.32 Vancouver, British Columbia Downtown Vancouver 1 1,532,709 90.0 90.7 42,089,132 8,417,826 30.52 Subtotal 1 1,532,709 90.0 90.7 42,089,132 8,417,826 30.52 TOTAL IN-SERVICE OFFICE(1) 35 12,062,822 85.6 % 86.1 % $ 545,391,767 $ 455,234,615 $ 52.84
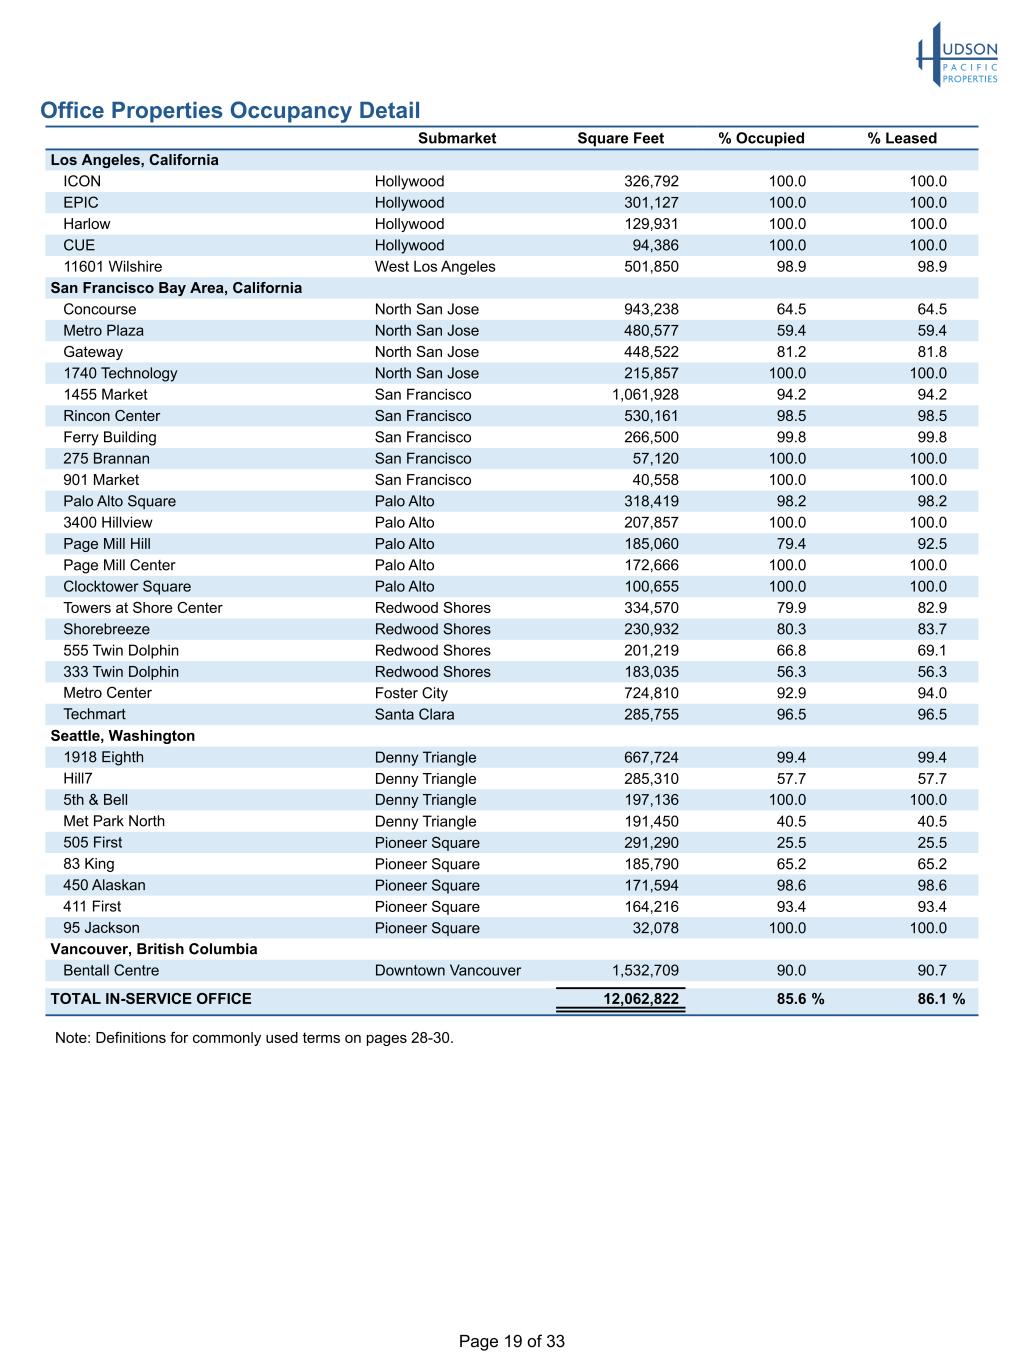
Page 19 of 33 Office Properties Occupancy Detail Submarket Square Feet % Occupied % Leased Los Angeles, California ICON Hollywood 326,792 100.0 100.0 EPIC Hollywood 301,127 100.0 100.0 Harlow Hollywood 129,931 100.0 100.0 CUE Hollywood 94,386 100.0 100.0 11601 Wilshire West Los Angeles 501,850 98.9 98.9 San Francisco Bay Area, California Concourse North San Jose 943,238 64.5 64.5 Metro Plaza North San Jose 480,577 59.4 59.4 Gateway North San Jose 448,522 81.2 81.8 1740 Technology North San Jose 215,857 100.0 100.0 1455 Market San Francisco 1,061,928 94.2 94.2 Rincon Center San Francisco 530,161 98.5 98.5 Ferry Building San Francisco 266,500 99.8 99.8 275 Brannan San Francisco 57,120 100.0 100.0 901 Market San Francisco 40,558 100.0 100.0 Palo Alto Square Palo Alto 318,419 98.2 98.2 3400 Hillview Palo Alto 207,857 100.0 100.0 Page Mill Hill Palo Alto 185,060 79.4 92.5 Page Mill Center Palo Alto 172,666 100.0 100.0 Clocktower Square Palo Alto 100,655 100.0 100.0 Towers at Shore Center Redwood Shores 334,570 79.9 82.9 Shorebreeze Redwood Shores 230,932 80.3 83.7 555 Twin Dolphin Redwood Shores 201,219 66.8 69.1 333 Twin Dolphin Redwood Shores 183,035 56.3 56.3 Metro Center Foster City 724,810 92.9 94.0 Techmart Santa Clara 285,755 96.5 96.5 Seattle, Washington 1918 Eighth Denny Triangle 667,724 99.4 99.4 Hill7 Denny Triangle 285,310 57.7 57.7 5th & Bell Denny Triangle 197,136 100.0 100.0 Met Park North Denny Triangle 191,450 40.5 40.5 505 First Pioneer Square 291,290 25.5 25.5 83 King Pioneer Square 185,790 65.2 65.2 450 Alaskan Pioneer Square 171,594 98.6 98.6 411 First Pioneer Square 164,216 93.4 93.4 95 Jackson Pioneer Square 32,078 100.0 100.0 Vancouver, British Columbia Bentall Centre Downtown Vancouver 1,532,709 90.0 90.7 TOTAL IN-SERVICE OFFICE 12,062,822 85.6 % 86.1 % Note: Definitions for commonly used terms on pages 28-30.
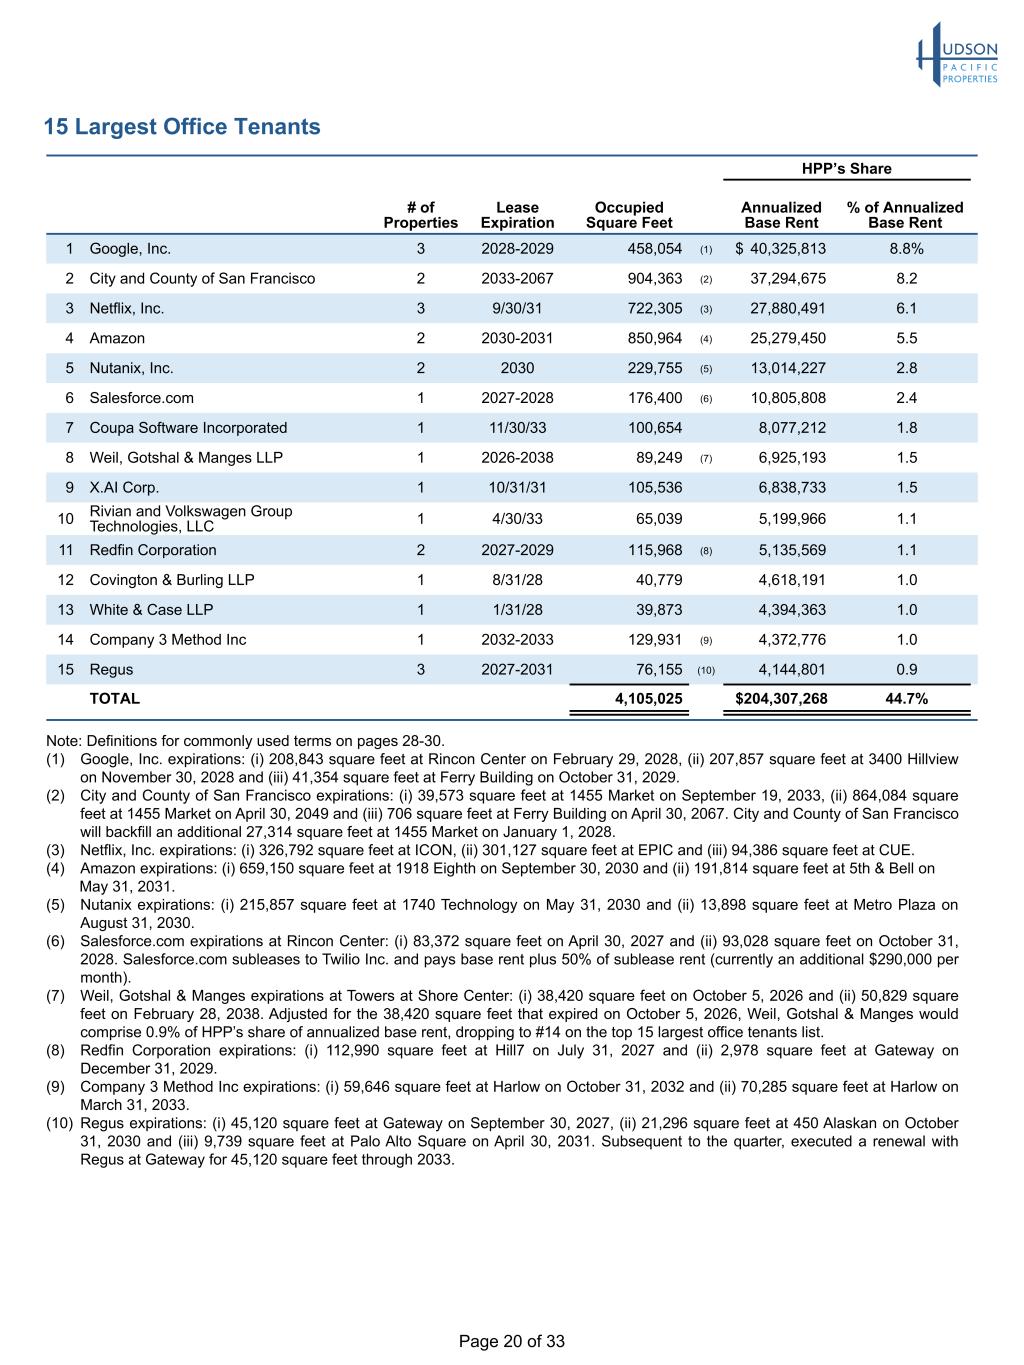
Page 20 of 33 Note: Definitions for commonly used terms on pages 28-30. (1) Google, Inc. expirations: (i) 208,843 square feet at Rincon Center on February 29, 2028, (ii) 207,857 square feet at 3400 Hillview on November 30, 2028 and (iii) 41,354 square feet at Ferry Building on October 31, 2029. (2) City and County of San Francisco expirations: (i) 39,573 square feet at 1455 Market on September 19, 2033, (ii) 864,084 square feet at 1455 Market on April 30, 2049 and (iii) 706 square feet at Ferry Building on April 30, 2067. City and County of San Francisco will backfill an additional 27,314 square feet at 1455 Market on January 1, 2028. (3) Netflix, Inc. expirations: (i) 326,792 square feet at ICON, (ii) 301,127 square feet at EPIC and (iii) 94,386 square feet at CUE. (4) Amazon expirations: (i) 659,150 square feet at 1918 Eighth on September 30, 2030 and (ii) 191,814 square feet at 5th & Bell on May 31, 2031. (5) Nutanix expirations: (i) 215,857 square feet at 1740 Technology on May 31, 2030 and (ii) 13,898 square feet at Metro Plaza on August 31, 2030. (6) Salesforce.com expirations at Rincon Center: (i) 83,372 square feet on April 30, 2027 and (ii) 93,028 square feet on October 31, 2028. Salesforce.com subleases to Twilio Inc. and pays base rent plus 50% of sublease rent (currently an additional $290,000 per month). (7) Weil, Gotshal & Manges expirations at Towers at Shore Center: (i) 38,420 square feet on October 5, 2026 and (ii) 50,829 square feet on February 28, 2038. Adjusted for the 38,420 square feet that expired on October 5, 2026, Weil, Gotshal & Manges would comprise 0.9% of HPP’s share of annualized base rent, dropping to #14 on the top 15 largest office tenants list. (8) Redfin Corporation expirations: (i) 112,990 square feet at Hill7 on July 31, 2027 and (ii) 2,978 square feet at Gateway on December 31, 2029. (9) Company 3 Method Inc expirations: (i) 59,646 square feet at Harlow on October 31, 2032 and (ii) 70,285 square feet at Harlow on March 31, 2033. (10) Regus expirations: (i) 45,120 square feet at Gateway on September 30, 2027, (ii) 21,296 square feet at 450 Alaskan on October 31, 2030 and (iii) 9,739 square feet at Palo Alto Square on April 30, 2031. Subsequent to the quarter, executed a renewal with Regus at Gateway for 45,120 square feet through 2033. HPP’s Share # of Properties Lease Expiration Occupied Square Feet Annualized Base Rent % of Annualized Base Rent 1 Google, Inc. 3 2028-2029 458,054 (1) $ 40,325,813 8.8% 2 City and County of San Francisco 2 2033-2067 904,363 (2) 37,294,675 8.2 3 Netflix, Inc. 3 9/30/31 722,305 (3) 27,880,491 6.1 4 Amazon 2 2030-2031 850,964 (4) 25,279,450 5.5 5 Nutanix, Inc. 2 2030 229,755 (5) 13,014,227 2.8 6 Salesforce.com 1 2027-2028 176,400 (6) 10,805,808 2.4 7 Coupa Software Incorporated 1 11/30/33 100,654 8,077,212 1.8 8 Weil, Gotshal & Manges LLP 1 2026-2038 89,249 (7) 6,925,193 1.5 9 X.AI Corp. 1 10/31/31 105,536 6,838,733 1.5 10 Rivian and Volkswagen Group Technologies, LLC 1 4/30/33 65,039 5,199,966 1.1 11 Redfin Corporation 2 2027-2029 115,968 (8) 5,135,569 1.1 12 Covington & Burling LLP 1 8/31/28 40,779 4,618,191 1.0 13 White & Case LLP 1 1/31/28 39,873 4,394,363 1.0 14 Company 3 Method Inc 1 2032-2033 129,931 (9) 4,372,776 1.0 15 Regus 3 2027-2031 76,155 (10) 4,144,801 0.9 TOTAL 4,105,025 $ 204,307,268 44.7% 15 Largest Office Tenants
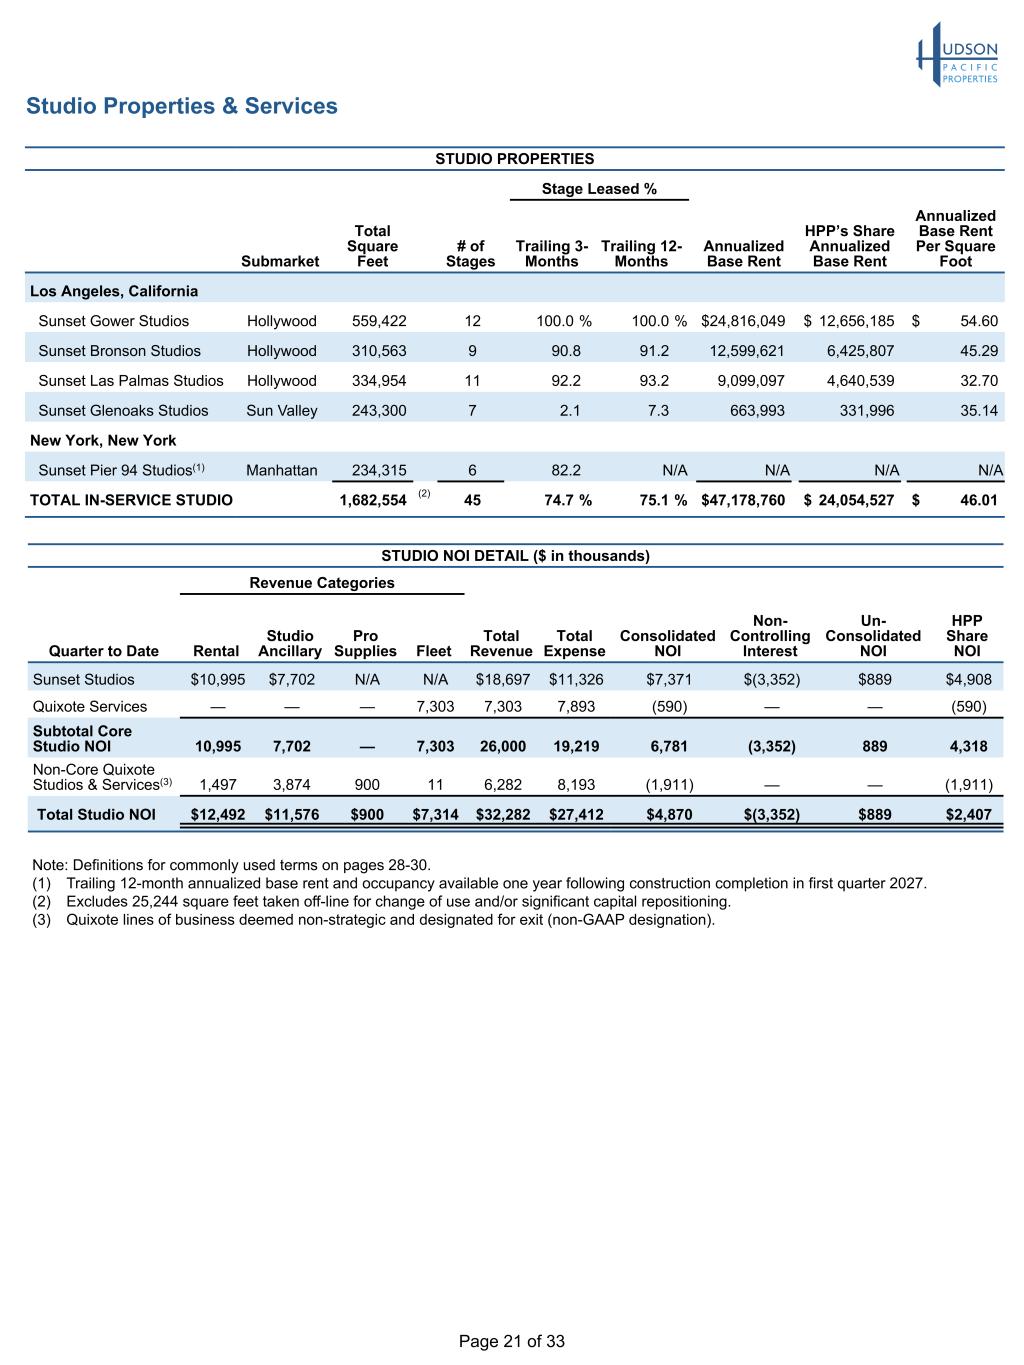
Page 21 of 33 Note: Definitions for commonly used terms on pages 28-30. (1) Trailing 12-month annualized base rent and occupancy available one year following construction completion in first quarter 2027. (2) Excludes 25,244 square feet taken off-line for change of use and/or significant capital repositioning. (3) Quixote lines of business deemed non-strategic and designated for exit (non-GAAP designation). Studio Properties & Services STUDIO NOI DETAIL ($ in thousands) Revenue Categories Quarter to Date Rental Studio Ancillary Pro Supplies Fleet Total Revenue Total Expense Consolidated NOI Non- Controlling Interest Un- Consolidated NOI HPP Share NOI Sunset Studios $10,995 $7,702 N/A N/A $18,697 $11,326 $7,371 $(3,352) $889 $4,908 Quixote Services — — — 7,303 7,303 7,893 (590) — — (590) Subtotal Core Studio NOI 10,995 7,702 — 7,303 26,000 19,219 6,781 (3,352) 889 4,318 Non-Core Quixote Studios & Services(3) 1,497 3,874 900 11 6,282 8,193 (1,911) — — (1,911) Total Studio NOI $12,492 $11,576 $900 $7,314 $32,282 $27,412 $4,870 $(3,352) $889 $2,407 STUDIO PROPERTIES Stage Leased % Submarket Total Square Feet # of Stages Trailing 3- Months Trailing 12- Months Annualized Base Rent HPP’s Share Annualized Base Rent Annualized Base Rent Per Square Foot Los Angeles, California Sunset Gower Studios Hollywood 559,422 12 100.0 % 100.0 % $ 24,816,049 $ 12,656,185 $ 54.60 Sunset Bronson Studios Hollywood 310,563 9 90.8 91.2 12,599,621 6,425,807 45.29 Sunset Las Palmas Studios Hollywood 334,954 11 92.2 93.2 9,099,097 4,640,539 32.70 Sunset Glenoaks Studios Sun Valley 243,300 7 2.1 7.3 663,993 331,996 35.14 New York, New York Sunset Pier 94 Studios(1) Manhattan 234,315 6 82.2 N/A N/A N/A N/A TOTAL IN-SERVICE STUDIO 1,682,554 (2) 45 74.7 % 75.1 % $ 47,178,760 $ 24,054,527 $ 46.01
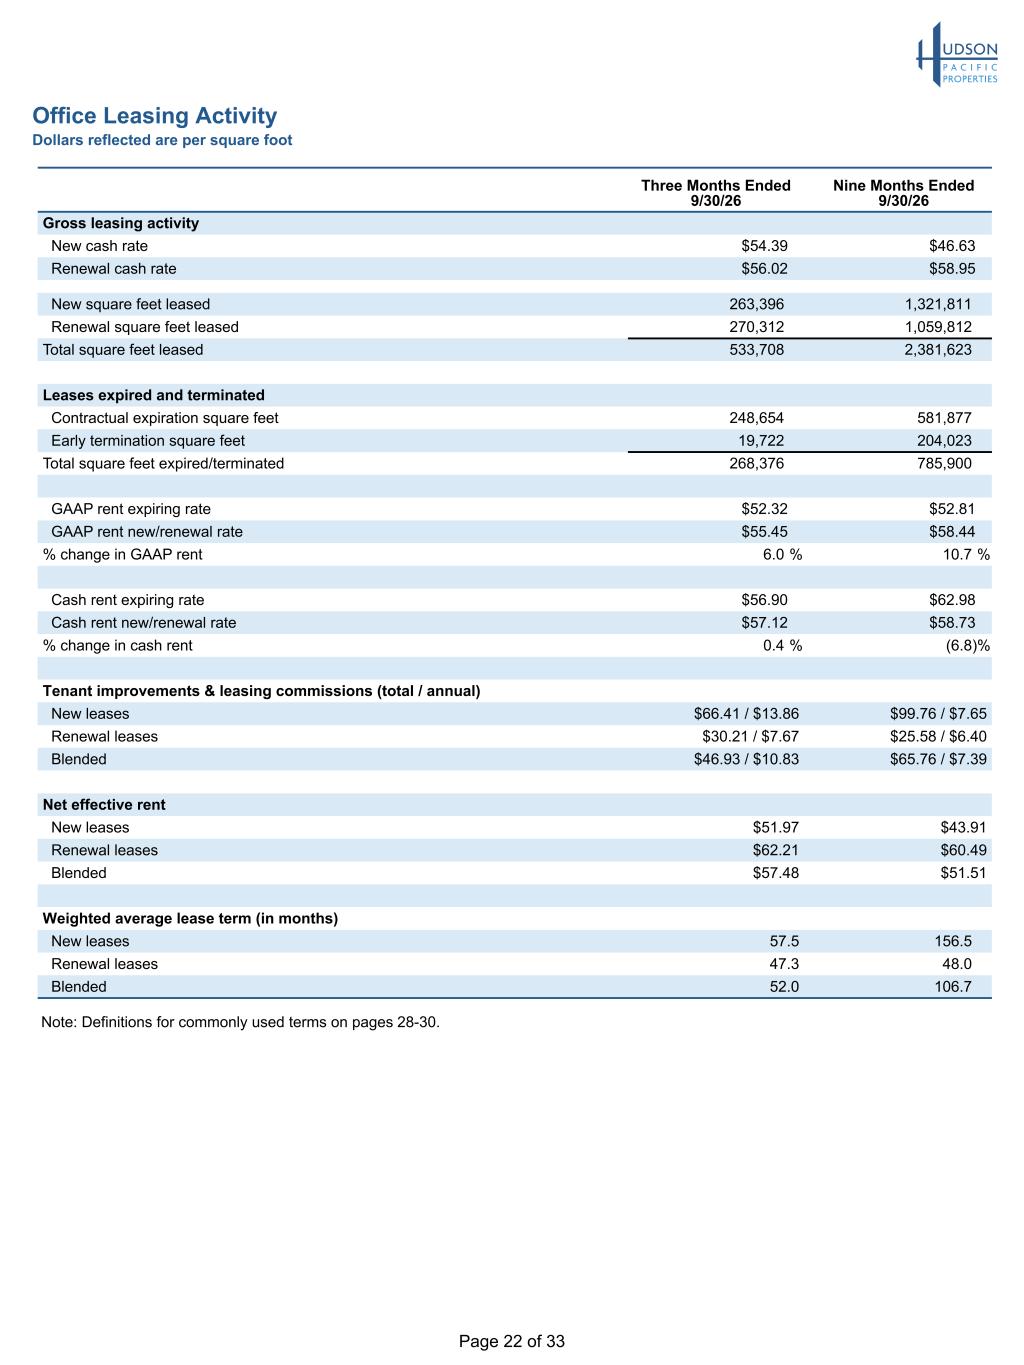
Page 22 of 33 Office Leasing Activity Dollars reflected are per square foot Three Months Ended 9/30/26 Nine Months Ended 9/30/26 Gross leasing activity New cash rate $54.39 $46.63 Renewal cash rate $56.02 $58.95 New square feet leased 263,396 1,321,811 Renewal square feet leased 270,312 1,059,812 Total square feet leased 533,708 2,381,623 Leases expired and terminated Contractual expiration square feet 248,654 581,877 Early termination square feet 19,722 204,023 Total square feet expired/terminated 268,376 785,900 GAAP rent expiring rate $52.32 $52.81 GAAP rent new/renewal rate $55.45 $58.44 % change in GAAP rent 6.0 % 10.7 % Cash rent expiring rate $56.90 $62.98 Cash rent new/renewal rate $57.12 $58.73 % change in cash rent 0.4 % (6.8) % Tenant improvements & leasing commissions (total / annual) New leases $66.41 / $13.86 $99.76 / $7.65 Renewal leases $30.21 / $7.67 $25.58 / $6.40 Blended $46.93 / $10.83 $65.76 / $7.39 Net effective rent New leases $51.97 $43.91 Renewal leases $62.21 $60.49 Blended $57.48 $51.51 Weighted average lease term (in months) New leases 57.5 156.5 Renewal leases 47.3 48.0 Blended 52.0 106.7 Note: Definitions for commonly used terms on pages 28-30.
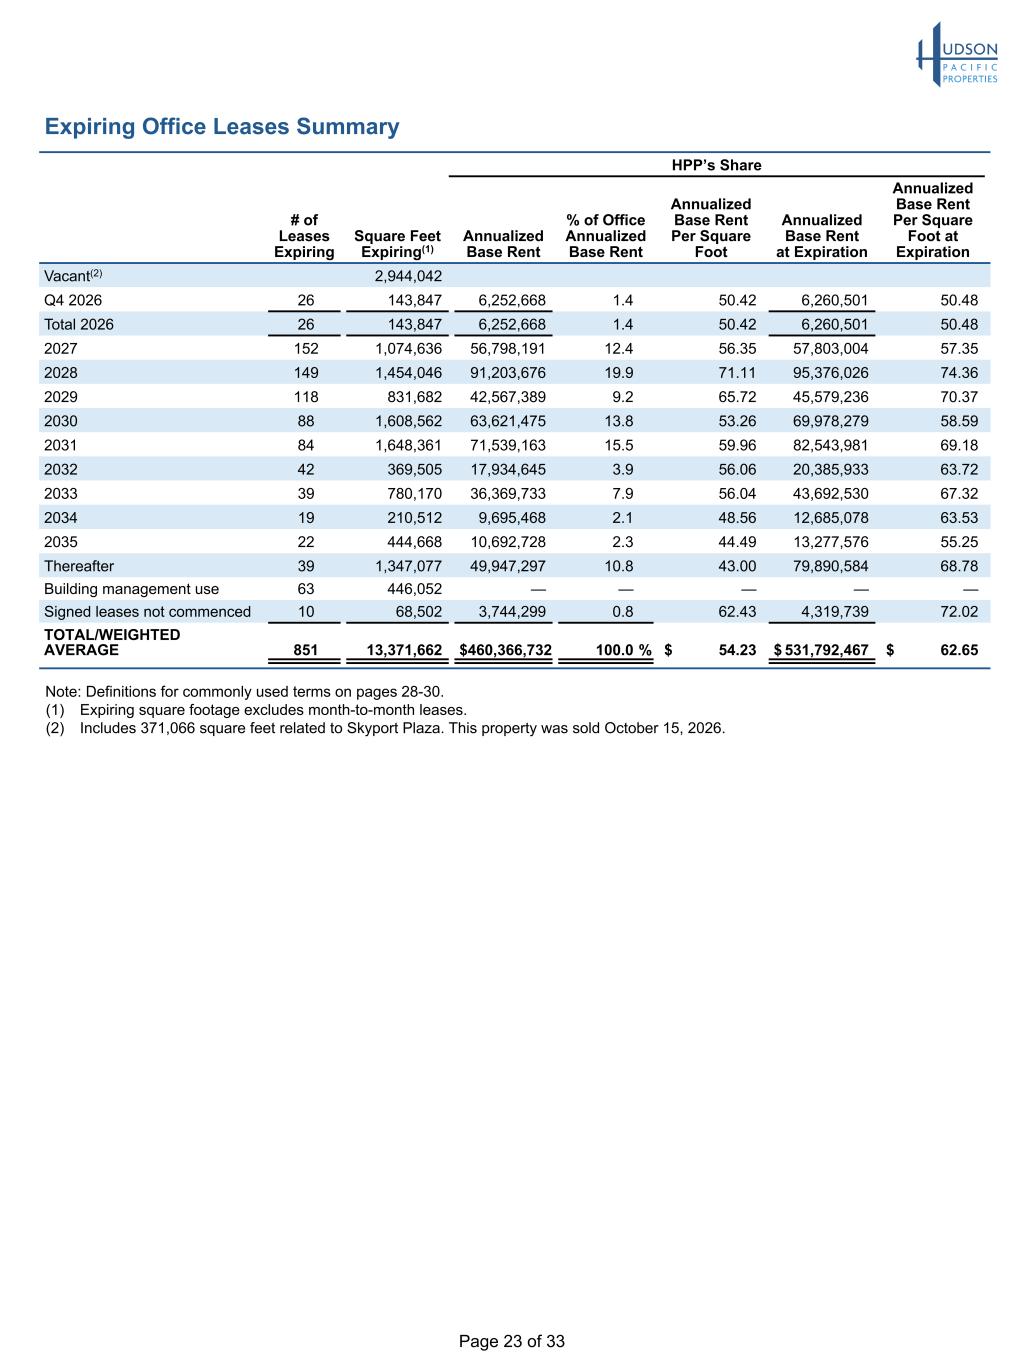
Page 23 of 33 Expiring Office Leases Summary HPP’s Share # of Leases Expiring Square Feet Expiring(1) Annualized Base Rent % of Office Annualized Base Rent Annualized Base Rent Per Square Foot Annualized Base Rent at Expiration Annualized Base Rent Per Square Foot at Expiration Vacant(2) 2,944,042 Q4 2026 26 143,847 6,252,668 1.4 50.42 6,260,501 50.48 Total 2026 26 143,847 6,252,668 1.4 50.42 6,260,501 50.48 2027 152 1,074,636 56,798,191 12.4 56.35 57,803,004 57.35 2028 149 1,454,046 91,203,676 19.9 71.11 95,376,026 74.36 2029 118 831,682 42,567,389 9.2 65.72 45,579,236 70.37 2030 88 1,608,562 63,621,475 13.8 53.26 69,978,279 58.59 2031 84 1,648,361 71,539,163 15.5 59.96 82,543,981 69.18 2032 42 369,505 17,934,645 3.9 56.06 20,385,933 63.72 2033 39 780,170 36,369,733 7.9 56.04 43,692,530 67.32 2034 19 210,512 9,695,468 2.1 48.56 12,685,078 63.53 2035 22 444,668 10,692,728 2.3 44.49 13,277,576 55.25 Thereafter 39 1,347,077 49,947,297 10.8 43.00 79,890,584 68.78 Building management use 63 446,052 — — — — — Signed leases not commenced 10 68,502 3,744,299 0.8 62.43 4,319,739 72.02 TOTAL/WEIGHTED AVERAGE 851 13,371,662 $ 460,366,732 100.0 % $ 54.23 $ 531,792,467 $ 62.65 Note: Definitions for commonly used terms on pages 28-30. (1) Expiring square footage excludes month-to-month leases. (2) Includes 371,066 square feet related to Skyport Plaza. This property was sold October 15, 2026.
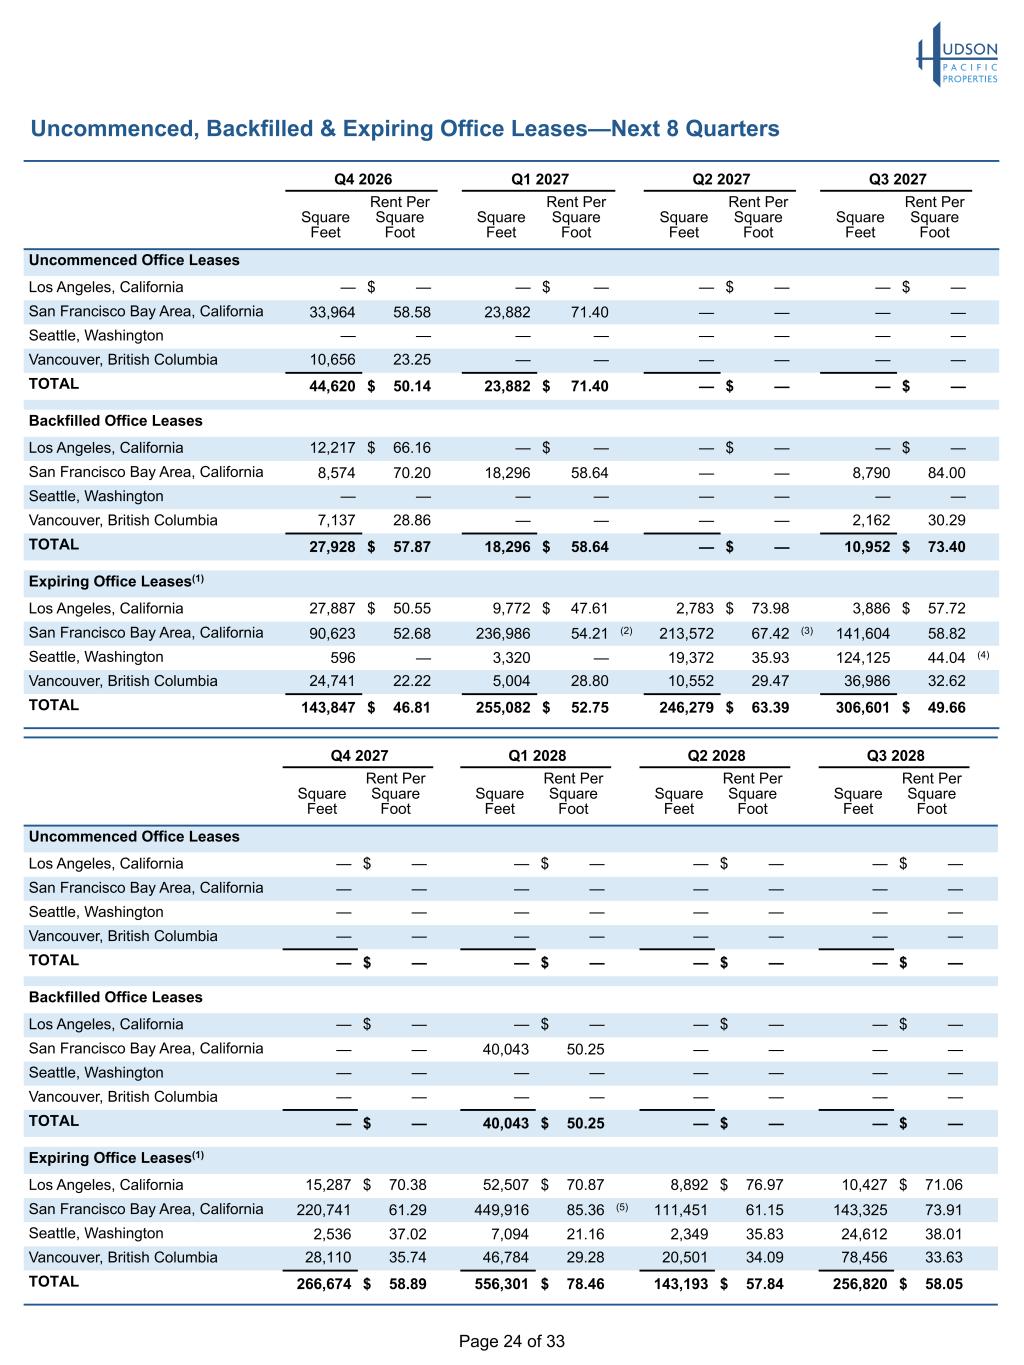
Page 24 of 33 Uncommenced, Backfilled & Expiring Office Leases—Next 8 Quarters Q4 2026 Q1 2027 Q2 2027 Q3 2027 Square Feet Rent Per Square Foot Square Feet Rent Per Square Foot Square Feet Rent Per Square Foot Square Feet Rent Per Square Foot Uncommenced Office Leases Los Angeles, California — $ — — $ — — $ — — $ — San Francisco Bay Area, California 33,964 58.58 23,882 71.40 — — — — Seattle, Washington — — — — — — — — Vancouver, British Columbia 10,656 23.25 — — — — — — TOTAL 44,620 $ 50.14 23,882 $ 71.40 — $ — — $ — Backfilled Office Leases Los Angeles, California 12,217 $ 66.16 — $ — — $ — — $ — San Francisco Bay Area, California 8,574 70.20 18,296 58.64 — — 8,790 84.00 Seattle, Washington — — — — — — — — Vancouver, British Columbia 7,137 28.86 — — — — 2,162 30.29 TOTAL 27,928 $ 57.87 18,296 $ 58.64 — $ — 10,952 $ 73.40 Expiring Office Leases(1) Los Angeles, California 27,887 $ 50.55 9,772 $ 47.61 2,783 $ 73.98 3,886 $ 57.72 San Francisco Bay Area, California 90,623 52.68 236,986 54.21 (2) 213,572 67.42 (3) 141,604 58.82 Seattle, Washington 596 — 3,320 — 19,372 35.93 124,125 44.04 (4) Vancouver, British Columbia 24,741 22.22 5,004 28.80 10,552 29.47 36,986 32.62 TOTAL 143,847 $ 46.81 255,082 $ 52.75 246,279 $ 63.39 306,601 $ 49.66 Q4 2027 Q1 2028 Q2 2028 Q3 2028 Square Feet Rent Per Square Foot Square Feet Rent Per Square Foot Square Feet Rent Per Square Foot Square Feet Rent Per Square Foot Uncommenced Office Leases Los Angeles, California — $ — — $ — — $ — — $ — San Francisco Bay Area, California — — — — — — — — Seattle, Washington — — — — — — — — Vancouver, British Columbia — — — — — — — — TOTAL — $ — — $ — — $ — — $ — Backfilled Office Leases Los Angeles, California — $ — — $ — — $ — — $ — San Francisco Bay Area, California — — 40,043 50.25 — — — — Seattle, Washington — — — — — — — — Vancouver, British Columbia — — — — — — — — TOTAL — $ — 40,043 $ 50.25 — $ — — $ — Expiring Office Leases(1) Los Angeles, California 15,287 $ 70.38 52,507 $ 70.87 8,892 $ 76.97 10,427 $ 71.06 San Francisco Bay Area, California 220,741 61.29 449,916 85.36 (5) 111,451 61.15 143,325 73.91 Seattle, Washington 2,536 37.02 7,094 21.16 2,349 35.83 24,612 38.01 Vancouver, British Columbia 28,110 35.74 46,784 29.28 20,501 34.09 78,456 33.63 TOTAL 266,674 $ 58.89 556,301 $ 78.46 143,193 $ 57.84 256,820 $ 58.05

Page 25 of 33 Uncommenced, Backfilled & Expiring Office Leases—Next Eight Quarters (continued) Note: Definitions for commonly used terms on pages 28-30. (1) Excludes building management uses with various expiration dates. (2) Includes Twilio, Inc. at Rincon Center for 83,016 square feet on December 31, 2026. (3) Includes Salesforce.com at Rincon Center for 83,372 square feet on April 30, 2027. (4) Includes Redfin Corporation at Hill7 for 112,990 square feet on July 31, 2027. (5) Includes Google, Inc. at Rincon Center for 208,843 square feet on February 29, 2028.
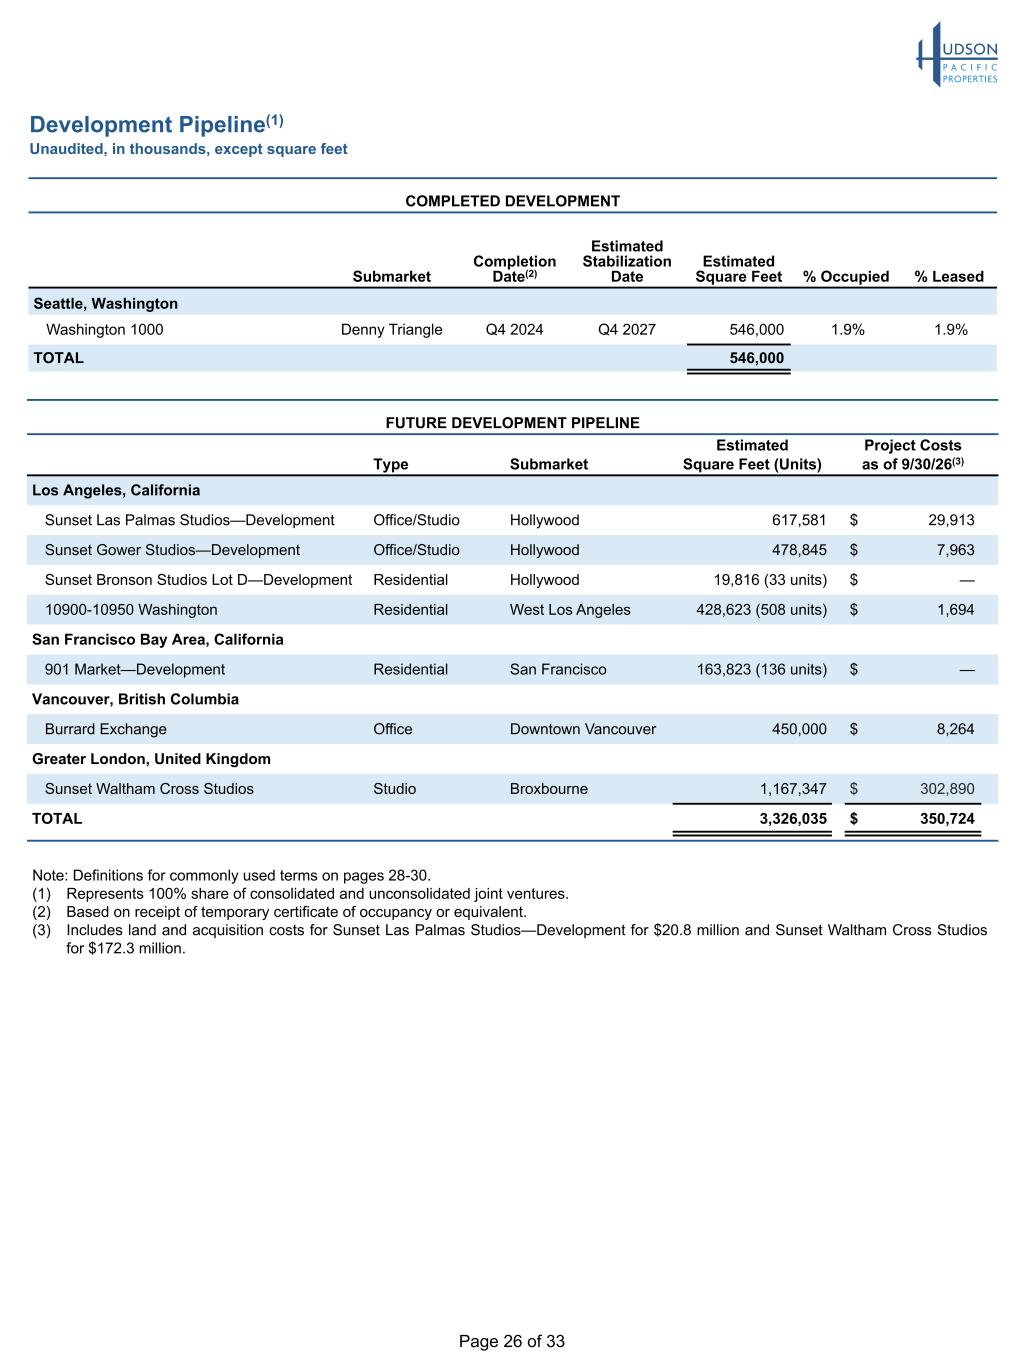
Page 26 of 33 Development Pipeline(1) Unaudited, in thousands, except square feet Note: Definitions for commonly used terms on pages 28-30. (1) Represents 100% share of consolidated and unconsolidated joint ventures. (2) Based on receipt of temporary certificate of occupancy or equivalent. (3) Includes land and acquisition costs for Sunset Las Palmas Studios—Development for $20.8 million and Sunset Waltham Cross Studios for $172.3 million. COMPLETED DEVELOPMENT Submarket Completion Date(2) Estimated Stabilization Date Estimated Square Feet % Occupied % Leased Seattle, Washington Washington 1000 Denny Triangle Q4 2024 Q4 2027 546,000 1.9% 1.9% TOTAL 546,000 FUTURE DEVELOPMENT PIPELINE Type Submarket Estimated Square Feet (Units) Project Costs as of 9/30/26(3) Los Angeles, California Sunset Las Palmas Studios—Development Office/Studio Hollywood 617,581 $ 29,913 Sunset Gower Studios—Development Office/Studio Hollywood 478,845 $ 7,963 Sunset Bronson Studios Lot D—Development Residential Hollywood 19,816 (33 units) $ — 10900-10950 Washington Residential West Los Angeles 428,623 (508 units) $ 1,694 San Francisco Bay Area, California 901 Market—Development Residential San Francisco 163,823 (136 units) $ — Vancouver, British Columbia Burrard Exchange Office Downtown Vancouver 450,000 $ 8,264 Greater London, United Kingdom Sunset Waltham Cross Studios Studio Broxbourne 1,167,347 $ 302,890 TOTAL 3,326,035 $ 350,724
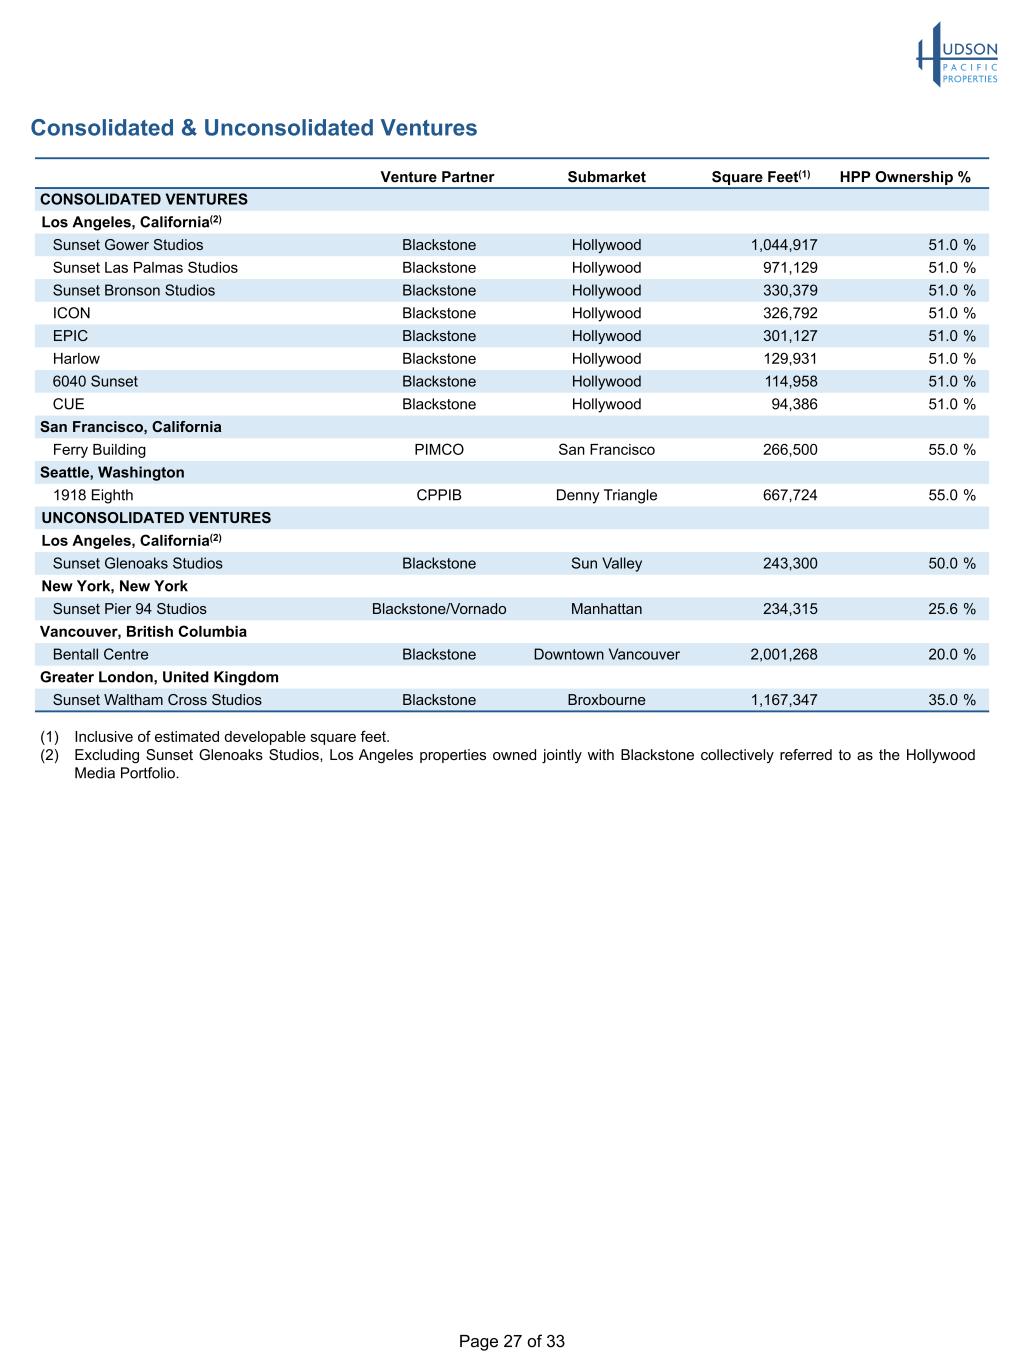
Page 27 of 33 Consolidated & Unconsolidated Ventures Venture Partner Submarket Square Feet(1) HPP Ownership % CONSOLIDATED VENTURES Los Angeles, California(2) Sunset Gower Studios Blackstone Hollywood 1,044,917 51.0 % Sunset Las Palmas Studios Blackstone Hollywood 971,129 51.0 % Sunset Bronson Studios Blackstone Hollywood 330,379 51.0 % ICON Blackstone Hollywood 326,792 51.0 % EPIC Blackstone Hollywood 301,127 51.0 % Harlow Blackstone Hollywood 129,931 51.0 % 6040 Sunset Blackstone Hollywood 114,958 51.0 % CUE Blackstone Hollywood 94,386 51.0 % San Francisco, California Ferry Building PIMCO San Francisco 266,500 55.0 % Seattle, Washington 1918 Eighth CPPIB Denny Triangle 667,724 55.0 % UNCONSOLIDATED VENTURES Los Angeles, California(2) Sunset Glenoaks Studios Blackstone Sun Valley 243,300 50.0 % New York, New York Sunset Pier 94 Studios Blackstone/Vornado Manhattan 234,315 25.6 % Vancouver, British Columbia Bentall Centre Blackstone Downtown Vancouver 2,001,268 20.0 % Greater London, United Kingdom Sunset Waltham Cross Studios Blackstone Broxbourne 1,167,347 35.0 % (1) Inclusive of estimated developable square feet. (2) Excluding Sunset Glenoaks Studios, Los Angeles properties owned jointly with Blackstone collectively referred to as the Hollywood Media Portfolio.
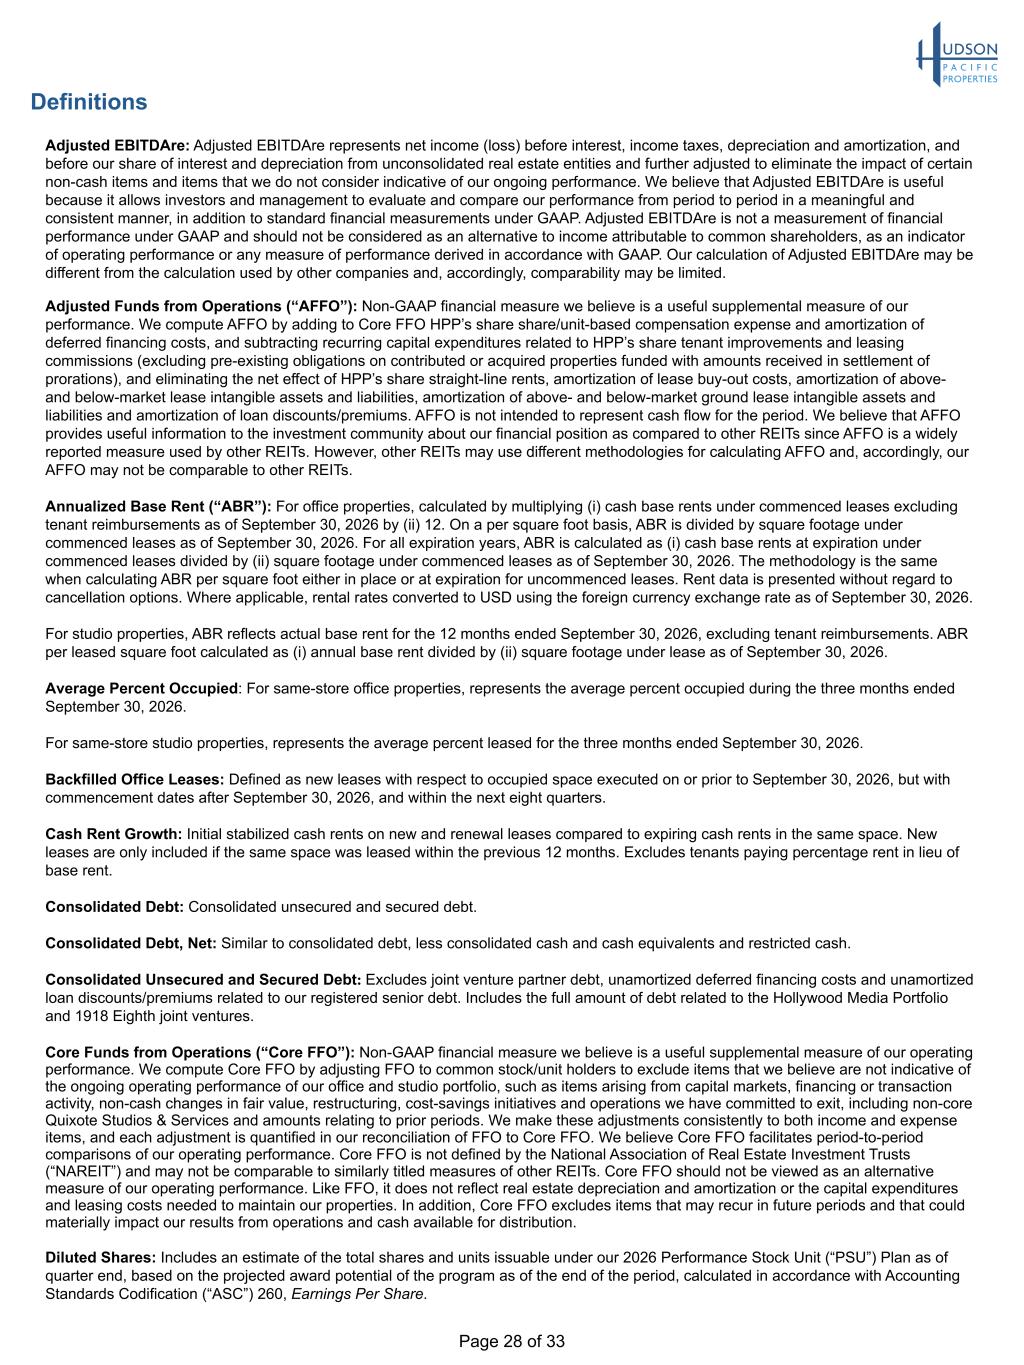
Page 28 of 33 Definitions Adjusted EBITDAre: Adjusted EBITDAre represents net income (loss) before interest, income taxes, depreciation and amortization, and before our share of interest and depreciation from unconsolidated real estate entities and further adjusted to eliminate the impact of certain non-cash items and items that we do not consider indicative of our ongoing performance. We believe that Adjusted EBITDAre is useful because it allows investors and management to evaluate and compare our performance from period to period in a meaningful and consistent manner, in addition to standard financial measurements under GAAP. Adjusted EBITDAre is not a measurement of financial performance under GAAP and should not be considered as an alternative to income attributable to common shareholders, as an indicator of operating performance or any measure of performance derived in accordance with GAAP. Our calculation of Adjusted EBITDAre may be different from the calculation used by other companies and, accordingly, comparability may be limited. Adjusted Funds from Operations (“AFFO”): Non-GAAP financial measure we believe is a useful supplemental measure of our performance. We compute AFFO by adding to Core FFO HPP’s share share/unit-based compensation expense and amortization of deferred financing costs, and subtracting recurring capital expenditures related to HPP’s share tenant improvements and leasing commissions (excluding pre-existing obligations on contributed or acquired properties funded with amounts received in settlement of prorations), and eliminating the net effect of HPP’s share straight-line rents, amortization of lease buy-out costs, amortization of above- and below-market lease intangible assets and liabilities, amortization of above- and below-market ground lease intangible assets and liabilities and amortization of loan discounts/premiums. AFFO is not intended to represent cash flow for the period. We believe that AFFO provides useful information to the investment community about our financial position as compared to other REITs since AFFO is a widely reported measure used by other REITs. However, other REITs may use different methodologies for calculating AFFO and, accordingly, our AFFO may not be comparable to other REITs. Annualized Base Rent (“ABR”): For office properties, calculated by multiplying (i) cash base rents under commenced leases excluding tenant reimbursements as of September 30, 2026 by (ii) 12. On a per square foot basis, ABR is divided by square footage under commenced leases as of September 30, 2026. For all expiration years, ABR is calculated as (i) cash base rents at expiration under commenced leases divided by (ii) square footage under commenced leases as of September 30, 2026. The methodology is the same when calculating ABR per square foot either in place or at expiration for uncommenced leases. Rent data is presented without regard to cancellation options. Where applicable, rental rates converted to USD using the foreign currency exchange rate as of September 30, 2026. For studio properties, ABR reflects actual base rent for the 12 months ended September 30, 2026, excluding tenant reimbursements. ABR per leased square foot calculated as (i) annual base rent divided by (ii) square footage under lease as of September 30, 2026. Average Percent Occupied: For same-store office properties, represents the average percent occupied during the three months ended September 30, 2026. For same-store studio properties, represents the average percent leased for the three months ended September 30, 2026. Backfilled Office Leases: Defined as new leases with respect to occupied space executed on or prior to September 30, 2026, but with commencement dates after September 30, 2026, and within the next eight quarters. Cash Rent Growth: Initial stabilized cash rents on new and renewal leases compared to expiring cash rents in the same space. New leases are only included if the same space was leased within the previous 12 months. Excludes tenants paying percentage rent in lieu of base rent. Consolidated Debt: Consolidated unsecured and secured debt. Consolidated Debt, Net: Similar to consolidated debt, less consolidated cash and cash equivalents and restricted cash. Consolidated Unsecured and Secured Debt: Excludes joint venture partner debt, unamortized deferred financing costs and unamortized loan discounts/premiums related to our registered senior debt. Includes the full amount of debt related to the Hollywood Media Portfolio and 1918 Eighth joint ventures. Core Funds from Operations (“Core FFO”): Non-GAAP financial measure we believe is a useful supplemental measure of our operating performance. We compute Core FFO by adjusting FFO to common stock/unit holders to exclude items that we believe are not indicative of the ongoing operating performance of our office and studio portfolio, such as items arising from capital markets, financing or transaction activity, non-cash changes in fair value, restructuring, cost-savings initiatives and operations we have committed to exit, including non-core Quixote Studios & Services and amounts relating to prior periods. We make these adjustments consistently to both income and expense items, and each adjustment is quantified in our reconciliation of FFO to Core FFO. We believe Core FFO facilitates period-to-period comparisons of our operating performance. Core FFO is not defined by the National Association of Real Estate Investment Trusts (“NAREIT”) and may not be comparable to similarly titled measures of other REITs. Core FFO should not be viewed as an alternative measure of our operating performance. Like FFO, it does not reflect real estate depreciation and amortization or the capital expenditures and leasing costs needed to maintain our properties. In addition, Core FFO excludes items that may recur in future periods and that could materially impact our results from operations and cash available for distribution. Diluted Shares: Includes an estimate of the total shares and units issuable under our 2026 Performance Stock Unit (“PSU”) Plan as of quarter end, based on the projected award potential of the program as of the end of the period, calculated in accordance with Accounting Standards Codification (“ASC”) 260, Earnings Per Share.
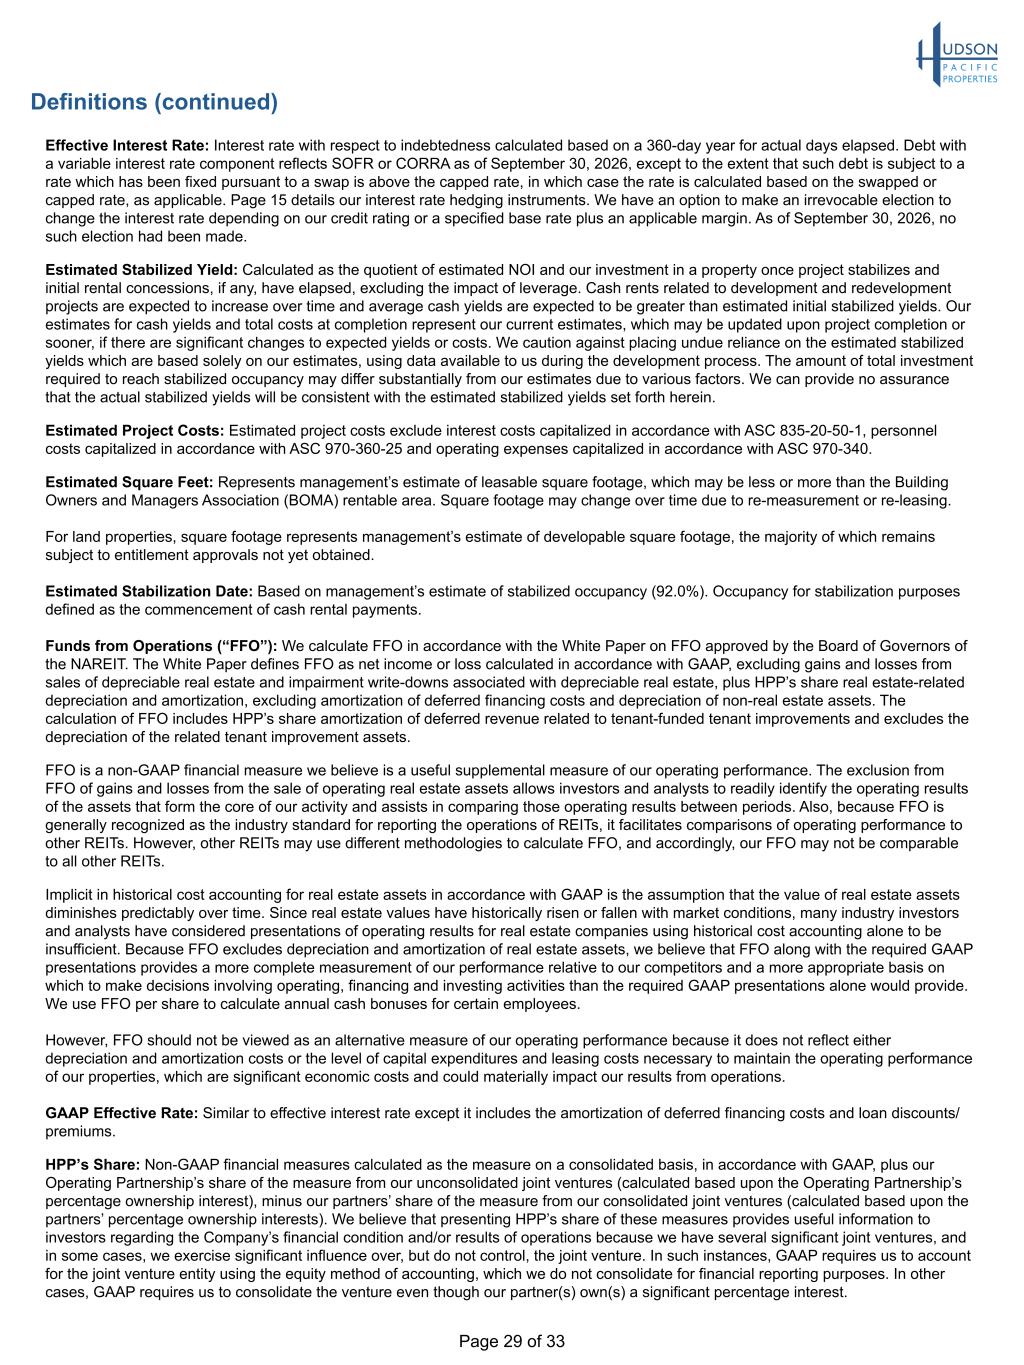
Page 29 of 33 Definitions (continued) Effective Interest Rate: Interest rate with respect to indebtedness calculated based on a 360-day year for actual days elapsed. Debt with a variable interest rate component reflects SOFR or CORRA as of September 30, 2026, except to the extent that such debt is subject to a rate which has been fixed pursuant to a swap is above the capped rate, in which case the rate is calculated based on the swapped or capped rate, as applicable. Page 15 details our interest rate hedging instruments. We have an option to make an irrevocable election to change the interest rate depending on our credit rating or a specified base rate plus an applicable margin. As of September 30, 2026, no such election had been made. Estimated Stabilized Yield: Calculated as the quotient of estimated NOI and our investment in a property once project stabilizes and initial rental concessions, if any, have elapsed, excluding the impact of leverage. Cash rents related to development and redevelopment projects are expected to increase over time and average cash yields are expected to be greater than estimated initial stabilized yields. Our estimates for cash yields and total costs at completion represent our current estimates, which may be updated upon project completion or sooner, if there are significant changes to expected yields or costs. We caution against placing undue reliance on the estimated stabilized yields which are based solely on our estimates, using data available to us during the development process. The amount of total investment required to reach stabilized occupancy may differ substantially from our estimates due to various factors. We can provide no assurance that the actual stabilized yields will be consistent with the estimated stabilized yields set forth herein. Estimated Project Costs: Estimated project costs exclude interest costs capitalized in accordance with ASC 835-20-50-1, personnel costs capitalized in accordance with ASC 970-360-25 and operating expenses capitalized in accordance with ASC 970-340. Estimated Square Feet: Represents management’s estimate of leasable square footage, which may be less or more than the Building Owners and Managers Association (BOMA) rentable area. Square footage may change over time due to re-measurement or re-leasing. For land properties, square footage represents management’s estimate of developable square footage, the majority of which remains subject to entitlement approvals not yet obtained. Estimated Stabilization Date: Based on management’s estimate of stabilized occupancy (92.0%). Occupancy for stabilization purposes defined as the commencement of cash rental payments. Funds from Operations (“FFO”): We calculate FFO in accordance with the White Paper on FFO approved by the Board of Governors of the NAREIT. The White Paper defines FFO as net income or loss calculated in accordance with GAAP, excluding gains and losses from sales of depreciable real estate and impairment write-downs associated with depreciable real estate, plus HPP’s share real estate-related depreciation and amortization, excluding amortization of deferred financing costs and depreciation of non-real estate assets. The calculation of FFO includes HPP’s share amortization of deferred revenue related to tenant-funded tenant improvements and excludes the depreciation of the related tenant improvement assets. FFO is a non-GAAP financial measure we believe is a useful supplemental measure of our operating performance. The exclusion from FFO of gains and losses from the sale of operating real estate assets allows investors and analysts to readily identify the operating results of the assets that form the core of our activity and assists in comparing those operating results between periods. Also, because FFO is generally recognized as the industry standard for reporting the operations of REITs, it facilitates comparisons of operating performance to other REITs. However, other REITs may use different methodologies to calculate FFO, and accordingly, our FFO may not be comparable to all other REITs. Implicit in historical cost accounting for real estate assets in accordance with GAAP is the assumption that the value of real estate assets diminishes predictably over time. Since real estate values have historically risen or fallen with market conditions, many industry investors and analysts have considered presentations of operating results for real estate companies using historical cost accounting alone to be insufficient. Because FFO excludes depreciation and amortization of real estate assets, we believe that FFO along with the required GAAP presentations provides a more complete measurement of our performance relative to our competitors and a more appropriate basis on which to make decisions involving operating, financing and investing activities than the required GAAP presentations alone would provide. We use FFO per share to calculate annual cash bonuses for certain employees. However, FFO should not be viewed as an alternative measure of our operating performance because it does not reflect either depreciation and amortization costs or the level of capital expenditures and leasing costs necessary to maintain the operating performance of our properties, which are significant economic costs and could materially impact our results from operations. GAAP Effective Rate: Similar to effective interest rate except it includes the amortization of deferred financing costs and loan discounts/ premiums. HPP’s Share: Non-GAAP financial measures calculated as the measure on a consolidated basis, in accordance with GAAP, plus our Operating Partnership’s share of the measure from our unconsolidated joint ventures (calculated based upon the Operating Partnership’s percentage ownership interest), minus our partners’ share of the measure from our consolidated joint ventures (calculated based upon the partners’ percentage ownership interests). We believe that presenting HPP’s share of these measures provides useful information to investors regarding the Company’s financial condition and/or results of operations because we have several significant joint ventures, and in some cases, we exercise significant influence over, but do not control, the joint venture. In such instances, GAAP requires us to account for the joint venture entity using the equity method of accounting, which we do not consolidate for financial reporting purposes. In other cases, GAAP requires us to consolidate the venture even though our partner(s) own(s) a significant percentage interest.
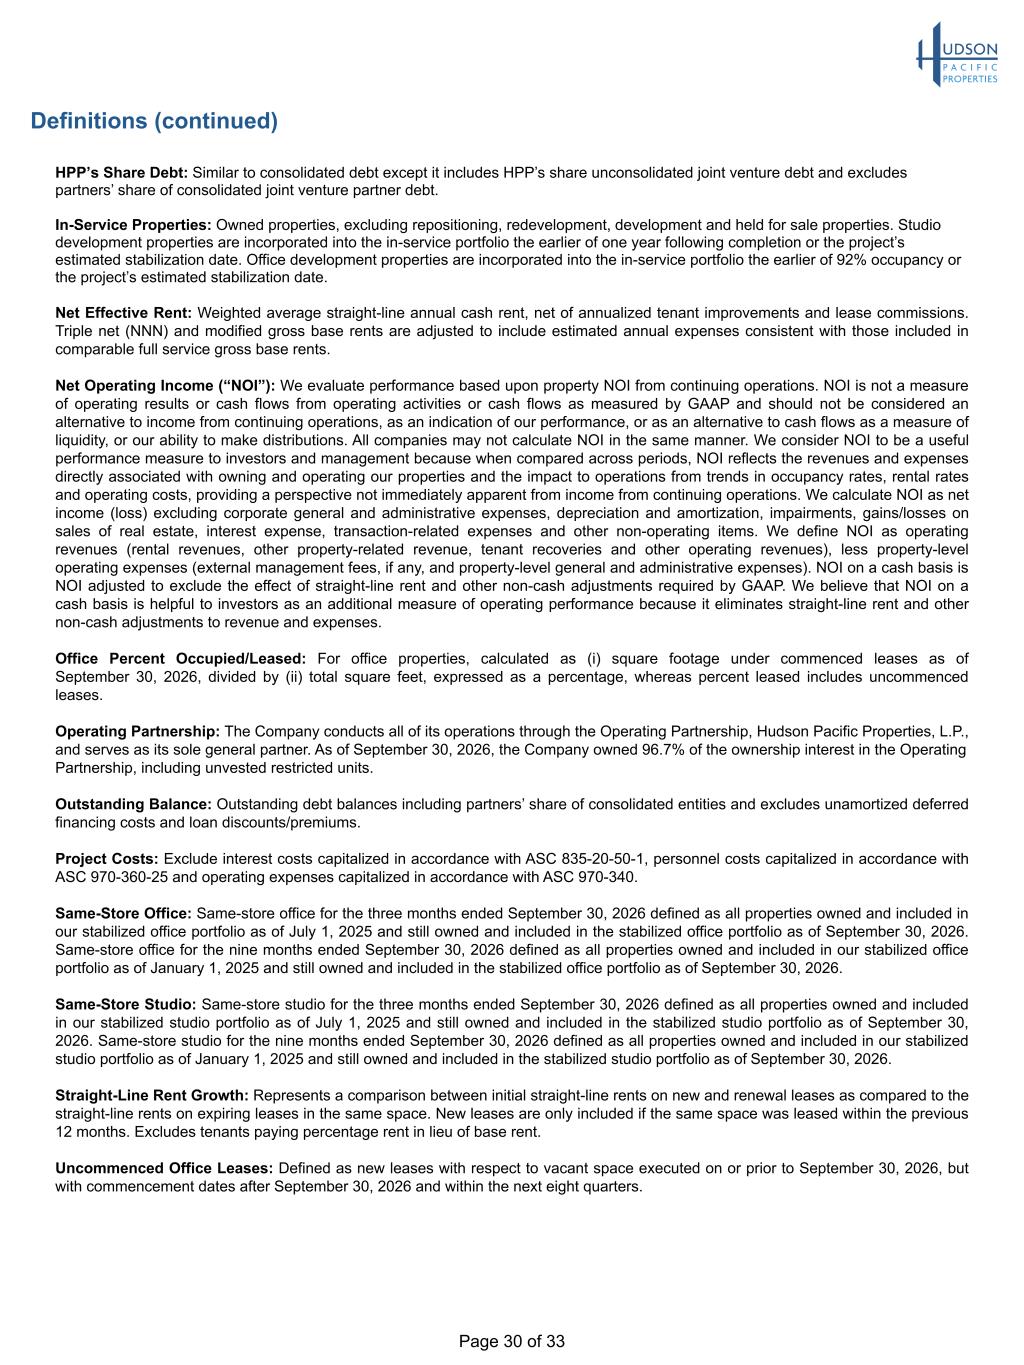
Page 30 of 33 HPP’s Share Debt: Similar to consolidated debt except it includes HPP’s share unconsolidated joint venture debt and excludes partners’ share of consolidated joint venture partner debt. In-Service Properties: Owned properties, excluding repositioning, redevelopment, development and held for sale properties. Studio development properties are incorporated into the in-service portfolio the earlier of one year following completion or the project’s estimated stabilization date. Office development properties are incorporated into the in-service portfolio the earlier of 92% occupancy or the project’s estimated stabilization date. Net Effective Rent: Weighted average straight-line annual cash rent, net of annualized tenant improvements and lease commissions. Triple net (NNN) and modified gross base rents are adjusted to include estimated annual expenses consistent with those included in comparable full service gross base rents. Net Operating Income (“NOI”): We evaluate performance based upon property NOI from continuing operations. NOI is not a measure of operating results or cash flows from operating activities or cash flows as measured by GAAP and should not be considered an alternative to income from continuing operations, as an indication of our performance, or as an alternative to cash flows as a measure of liquidity, or our ability to make distributions. All companies may not calculate NOI in the same manner. We consider NOI to be a useful performance measure to investors and management because when compared across periods, NOI reflects the revenues and expenses directly associated with owning and operating our properties and the impact to operations from trends in occupancy rates, rental rates and operating costs, providing a perspective not immediately apparent from income from continuing operations. We calculate NOI as net income (loss) excluding corporate general and administrative expenses, depreciation and amortization, impairments, gains/losses on sales of real estate, interest expense, transaction-related expenses and other non-operating items. We define NOI as operating revenues (rental revenues, other property-related revenue, tenant recoveries and other operating revenues), less property-level operating expenses (external management fees, if any, and property-level general and administrative expenses). NOI on a cash basis is NOI adjusted to exclude the effect of straight-line rent and other non-cash adjustments required by GAAP. We believe that NOI on a cash basis is helpful to investors as an additional measure of operating performance because it eliminates straight-line rent and other non-cash adjustments to revenue and expenses. Office Percent Occupied/Leased: For office properties, calculated as (i) square footage under commenced leases as of September 30, 2026, divided by (ii) total square feet, expressed as a percentage, whereas percent leased includes uncommenced leases. Operating Partnership: The Company conducts all of its operations through the Operating Partnership, Hudson Pacific Properties, L.P., and serves as its sole general partner. As of September 30, 2026, the Company owned 96.7% of the ownership interest in the Operating Partnership, including unvested restricted units. Outstanding Balance: Outstanding debt balances including partners’ share of consolidated entities and excludes unamortized deferred financing costs and loan discounts/premiums. Project Costs: Exclude interest costs capitalized in accordance with ASC 835-20-50-1, personnel costs capitalized in accordance with ASC 970-360-25 and operating expenses capitalized in accordance with ASC 970-340. Same-Store Office: Same-store office for the three months ended September 30, 2026 defined as all properties owned and included in our stabilized office portfolio as of July 1, 2025 and still owned and included in the stabilized office portfolio as of September 30, 2026. Same-store office for the nine months ended September 30, 2026 defined as all properties owned and included in our stabilized office portfolio as of January 1, 2025 and still owned and included in the stabilized office portfolio as of September 30, 2026. Same-Store Studio: Same-store studio for the three months ended September 30, 2026 defined as all properties owned and included in our stabilized studio portfolio as of July 1, 2025 and still owned and included in the stabilized studio portfolio as of September 30, 2026. Same-store studio for the nine months ended September 30, 2026 defined as all properties owned and included in our stabilized studio portfolio as of January 1, 2025 and still owned and included in the stabilized studio portfolio as of September 30, 2026. Straight-Line Rent Growth: Represents a comparison between initial straight-line rents on new and renewal leases as compared to the straight-line rents on expiring leases in the same space. New leases are only included if the same space was leased within the previous 12 months. Excludes tenants paying percentage rent in lieu of base rent. Uncommenced Office Leases: Defined as new leases with respect to vacant space executed on or prior to September 30, 2026, but with commencement dates after September 30, 2026 and within the next eight quarters. Definitions (continued)
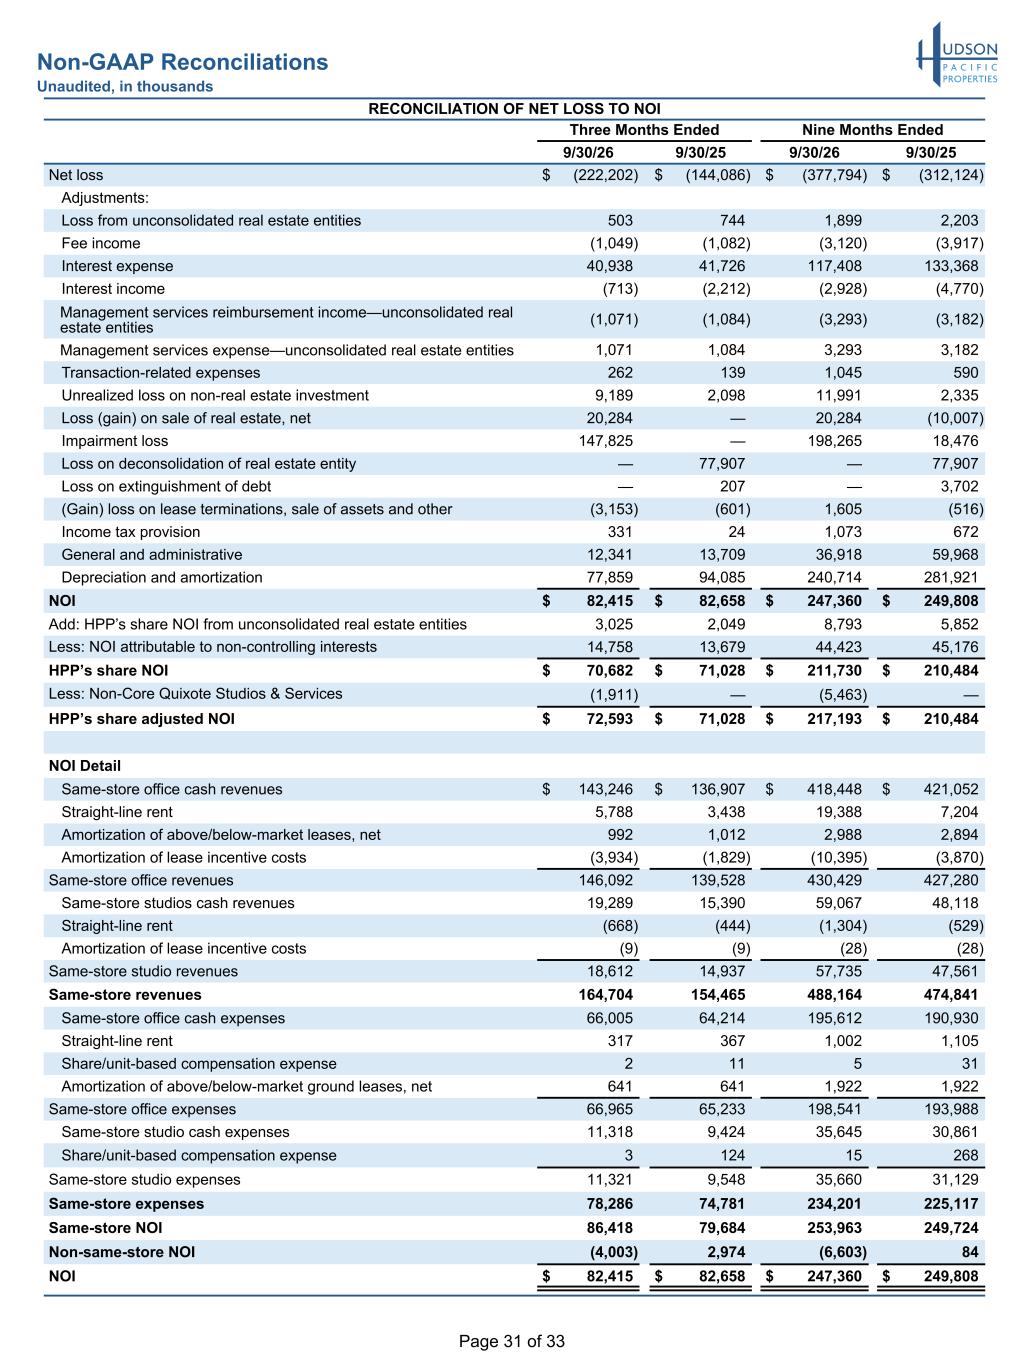
Page 31 of 33 Non-GAAP Reconciliations Unaudited, in thousands RECONCILIATION OF NET LOSS TO NOI Three Months Ended Nine Months Ended 9/30/26 9/30/25 9/30/26 9/30/25 Net loss $ (222,202) $ (144,086) $ (377,794) $ (312,124) Adjustments: Loss from unconsolidated real estate entities 503 744 1,899 2,203 Fee income (1,049) (1,082) (3,120) (3,917) Interest expense 40,938 41,726 117,408 133,368 Interest income (713) (2,212) (2,928) (4,770) Management services reimbursement income—unconsolidated real estate entities (1,071) (1,084) (3,293) (3,182) Management services expense—unconsolidated real estate entities 1,071 1,084 3,293 3,182 Transaction-related expenses 262 139 1,045 590 Unrealized loss on non-real estate investment 9,189 2,098 11,991 2,335 Loss (gain) on sale of real estate, net 20,284 — 20,284 (10,007) Impairment loss 147,825 — 198,265 18,476 Loss on deconsolidation of real estate entity — 77,907 — 77,907 Loss on extinguishment of debt — 207 — 3,702 (Gain) loss on lease terminations, sale of assets and other (3,153) (601) 1,605 (516) Income tax provision 331 24 1,073 672 General and administrative 12,341 13,709 36,918 59,968 Depreciation and amortization 77,859 94,085 240,714 281,921 NOI $ 82,415 $ 82,658 $ 247,360 $ 249,808 Add: HPP’s share NOI from unconsolidated real estate entities 3,025 2,049 8,793 5,852 Less: NOI attributable to non-controlling interests 14,758 13,679 44,423 45,176 HPP’s share NOI $ 70,682 $ 71,028 $ 211,730 $ 210,484 Less: Non-Core Quixote Studios & Services (1,911) — (5,463) — HPP’s share adjusted NOI $ 72,593 $ 71,028 $ 217,193 $ 210,484 NOI Detail Same-store office cash revenues $ 143,246 $ 136,907 $ 418,448 $ 421,052 Straight-line rent 5,788 3,438 19,388 7,204 Amortization of above/below-market leases, net 992 1,012 2,988 2,894 Amortization of lease incentive costs (3,934) (1,829) (10,395) (3,870) Same-store office revenues 146,092 139,528 430,429 427,280 Same-store studios cash revenues 19,289 15,390 59,067 48,118 Straight-line rent (668) (444) (1,304) (529) Amortization of lease incentive costs (9) (9) (28) (28) Same-store studio revenues 18,612 14,937 57,735 47,561 Same-store revenues 164,704 154,465 488,164 474,841 Same-store office cash expenses 66,005 64,214 195,612 190,930 Straight-line rent 317 367 1,002 1,105 Share/unit-based compensation expense 2 11 5 31 Amortization of above/below-market ground leases, net 641 641 1,922 1,922 Same-store office expenses 66,965 65,233 198,541 193,988 Same-store studio cash expenses 11,318 9,424 35,645 30,861 Share/unit-based compensation expense 3 124 15 268 Same-store studio expenses 11,321 9,548 35,660 31,129 Same-store expenses 78,286 74,781 234,201 225,117 Same-store NOI 86,418 79,684 253,963 249,724 Non-same-store NOI (4,003) 2,974 (6,603) 84 NOI $ 82,415 $ 82,658 $ 247,360 $ 249,808
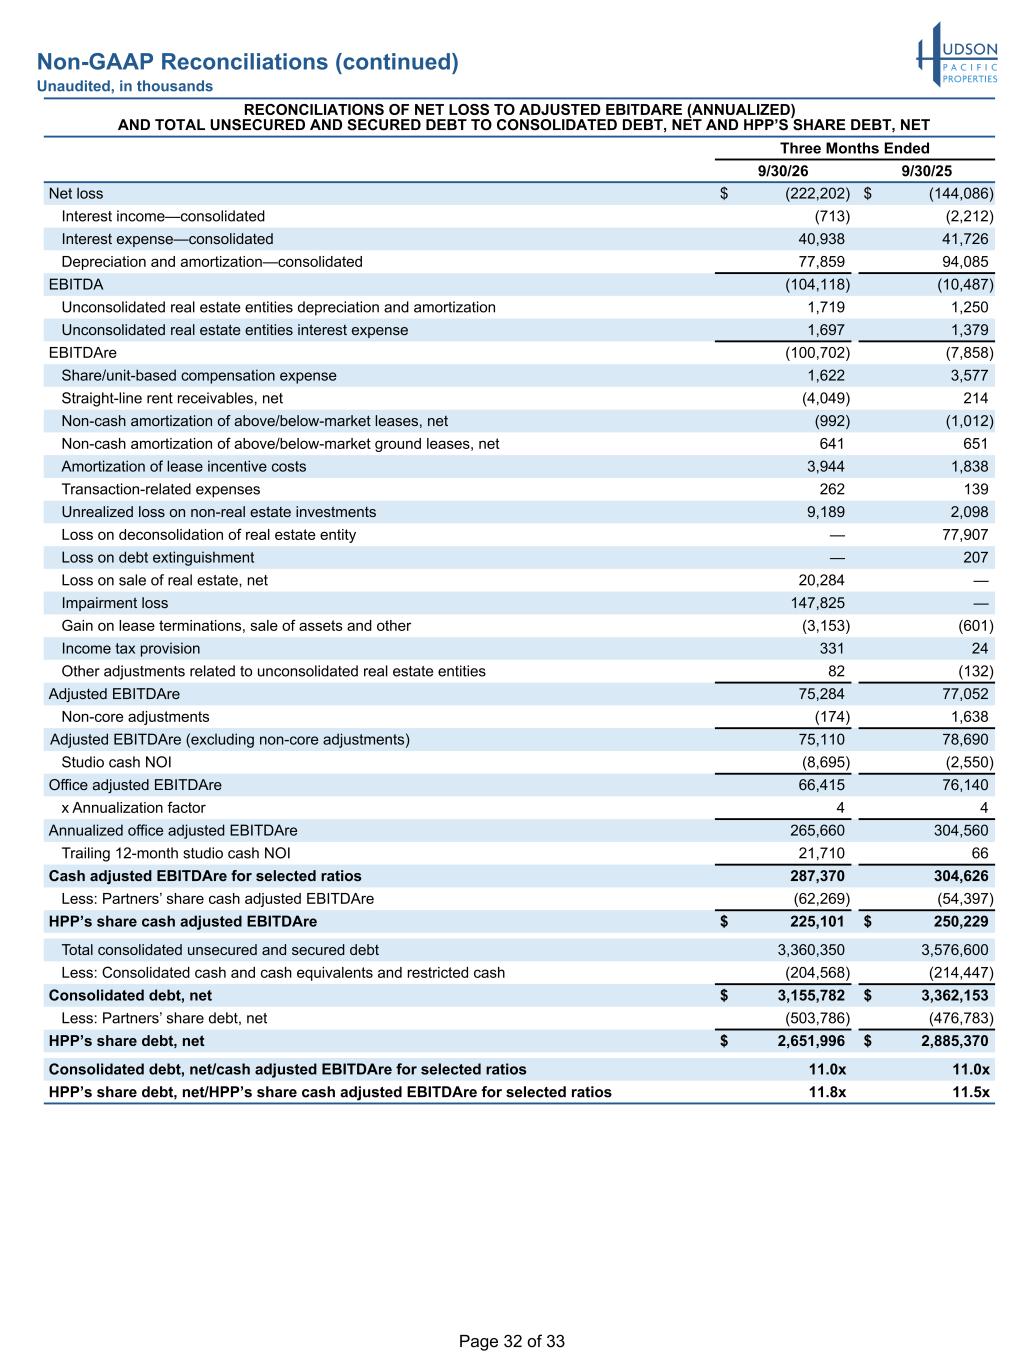
Page 32 of 33 Non-GAAP Reconciliations (continued) Unaudited, in thousands RECONCILIATIONS OF NET LOSS TO ADJUSTED EBITDARE (ANNUALIZED) AND TOTAL UNSECURED AND SECURED DEBT TO CONSOLIDATED DEBT, NET AND HPP’S SHARE DEBT, NET Three Months Ended 9/30/26 9/30/25 Net loss $ (222,202) $ (144,086) Interest income—consolidated (713) (2,212) Interest expense—consolidated 40,938 41,726 Depreciation and amortization—consolidated 77,859 94,085 EBITDA (104,118) (10,487) Unconsolidated real estate entities depreciation and amortization 1,719 1,250 Unconsolidated real estate entities interest expense 1,697 1,379 EBITDAre (100,702) (7,858) Share/unit-based compensation expense 1,622 3,577 Straight-line rent receivables, net (4,049) 214 Non-cash amortization of above/below-market leases, net (992) (1,012) Non-cash amortization of above/below-market ground leases, net 641 651 Amortization of lease incentive costs 3,944 1,838 Transaction-related expenses 262 139 Unrealized loss on non-real estate investments 9,189 2,098 Loss on deconsolidation of real estate entity — 77,907 Loss on debt extinguishment — 207 Loss on sale of real estate, net 20,284 — Impairment loss 147,825 — Gain on lease terminations, sale of assets and other (3,153) (601) Income tax provision 331 24 Other adjustments related to unconsolidated real estate entities 82 (132) Adjusted EBITDAre 75,284 77,052 Non-core adjustments (174) 1,638 Adjusted EBITDAre (excluding non-core adjustments) 75,110 78,690 Studio cash NOI (8,695) (2,550) Office adjusted EBITDAre 66,415 76,140 x Annualization factor 4 4 Annualized office adjusted EBITDAre 265,660 304,560 Trailing 12-month studio cash NOI 21,710 66 Cash adjusted EBITDAre for selected ratios 287,370 304,626 Less: Partners’ share cash adjusted EBITDAre (62,269) (54,397) HPP’s share cash adjusted EBITDAre $ 225,101 $ 250,229 Total consolidated unsecured and secured debt 3,360,350 3,576,600 Less: Consolidated cash and cash equivalents and restricted cash (204,568) (214,447) Consolidated debt, net $ 3,155,782 $ 3,362,153 Less: Partners’ share debt, net (503,786) (476,783) HPP’s share debt, net $ 2,651,996 $ 2,885,370 Consolidated debt, net/cash adjusted EBITDAre for selected ratios 11.0x 11.0x HPP’s share debt, net/HPP’s share cash adjusted EBITDAre for selected ratios 11.8x 11.5x
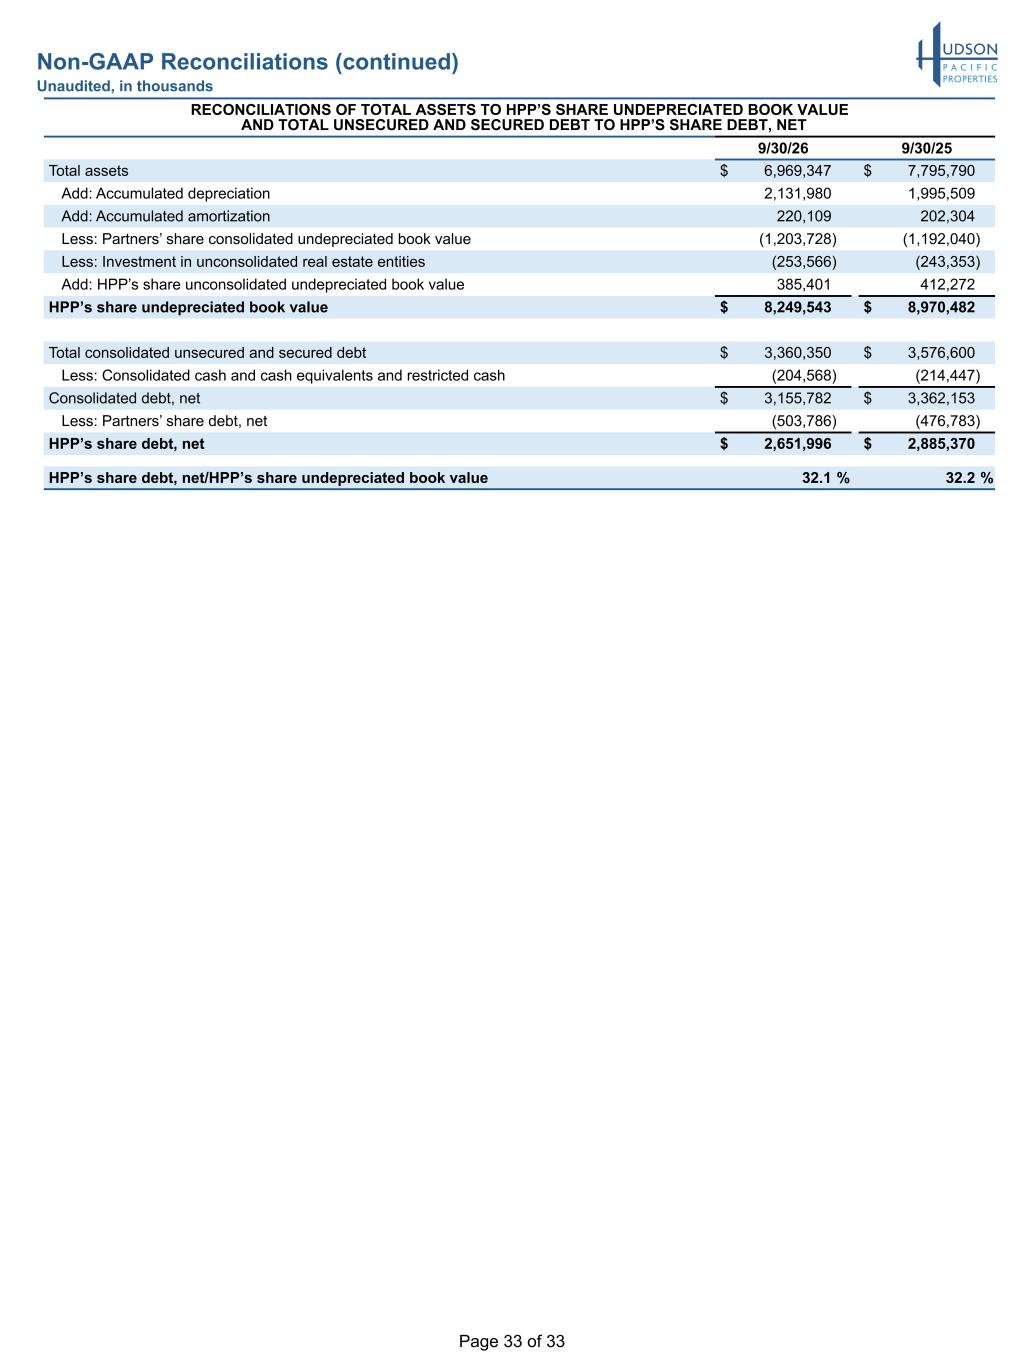
Page 33 of 33 Non-GAAP Reconciliations (continued) Unaudited, in thousands RECONCILIATIONS OF TOTAL ASSETS TO HPP’S SHARE UNDEPRECIATED BOOK VALUE AND TOTAL UNSECURED AND SECURED DEBT TO HPP’S SHARE DEBT, NET 9/30/26 9/30/25 Total assets $ 6,969,347 $ 7,795,790 Add: Accumulated depreciation 2,131,980 1,995,509 Add: Accumulated amortization 220,109 202,304 Less: Partners’ share consolidated undepreciated book value (1,203,728) (1,192,040) Less: Investment in unconsolidated real estate entities (253,566) (243,353) Add: HPP’s share unconsolidated undepreciated book value 385,401 412,272 HPP’s share undepreciated book value $ 8,249,543 $ 8,970,482 Total consolidated unsecured and secured debt $ 3,360,350 $ 3,576,600 Less: Consolidated cash and cash equivalents and restricted cash (204,568) (214,447) Consolidated debt, net $ 3,155,782 $ 3,362,153 Less: Partners’ share debt, net (503,786) (476,783) HPP’s share debt, net $ 2,651,996 $ 2,885,370 HPP’s share debt, net/HPP’s share undepreciated book value 32.1 % 32.2 %