INVESTOR PRESENTATION THIRD QUARTER 2026
FORWARD-LOOKING STATEMENTS This presentation contains forward-looking statements that are based on management’s beliefs, assumptions, current expectations, estimates and projections about the financial services industry, the economy, and ChoiceOne. Words such as “anticipates,” “believes,” “estimates,” “expects,” “forecasts,” “intends,” “is likely,” “plans,” “predicts,” “projects,” “may,” “could,” “look forward,” “continue”, “future”, and variations of such words and similar expressions are intended to identify such forward-looking statements. All statements with references to future time periods are forward-looking. These statements are not guarantees of future performance and involve certain risks, uncertainties and assumptions (“risk factors”) that are difficult to predict with regard to timing, extent, likelihood, and degree of occurrence. Therefore, actual results and outcomes may materially differ from what may be expressed, implied or forecasted in such forward-looking statements. Furthermore, ChoiceOne undertakes no obligation to update, amend, or clarify forward-looking statements, whether as a result of new information, future events, or otherwise. Additional risk factors include, but are not limited to, the risk factors described in Item 1A in ChoiceOne’s Annual Report on Form 10-K for the year ended December 31, 2025. NON-GAAP FINANCIAL MEASURES In addition to results presented in accordance with GAAP, this presentation includes certain non-GAAP financial measures. ChoiceOne believes these non-GAAP financial measures provide additional information that is useful to investors in helping to understand underlying financial performance and condition and trends of ChoiceOne. Non-GAAP financial measures have inherent limitations. Readers should be aware of these limitations and should be cautious with respect to the use of such measures. To compensate for these limitations, we use non-GAAP financial measures as comparative tools, together with GAAP financial measures, to assist in the evaluation of our operating performance or financial condition. Also, we ensure that these measures are calculated using the appropriate GAAP or regulatory components in their entirety and that they are computed in a manner intended to facilitate consistent period-to-period comparisons. ChoiceOne’s method of calculating these non-GAAP financial measures may differ from methods used by other companies. These non-GAAP financial measures should not be considered in isolation or as a substitute for those financial measures prepared in accordance with GAAP or applicable regulatory requirements. Where non-GAAP financial measures are used, the most directly comparable GAAP or regulatory financial measure, as well as the reconciliation to the most directly comparable GAAP or regulatory financial measure, can be found in this presentation. 2
Our mission is to provide superior service, quality advice, and show utmost respect to everyone we meet. Our vision is to be the best bank in Michigan. 3
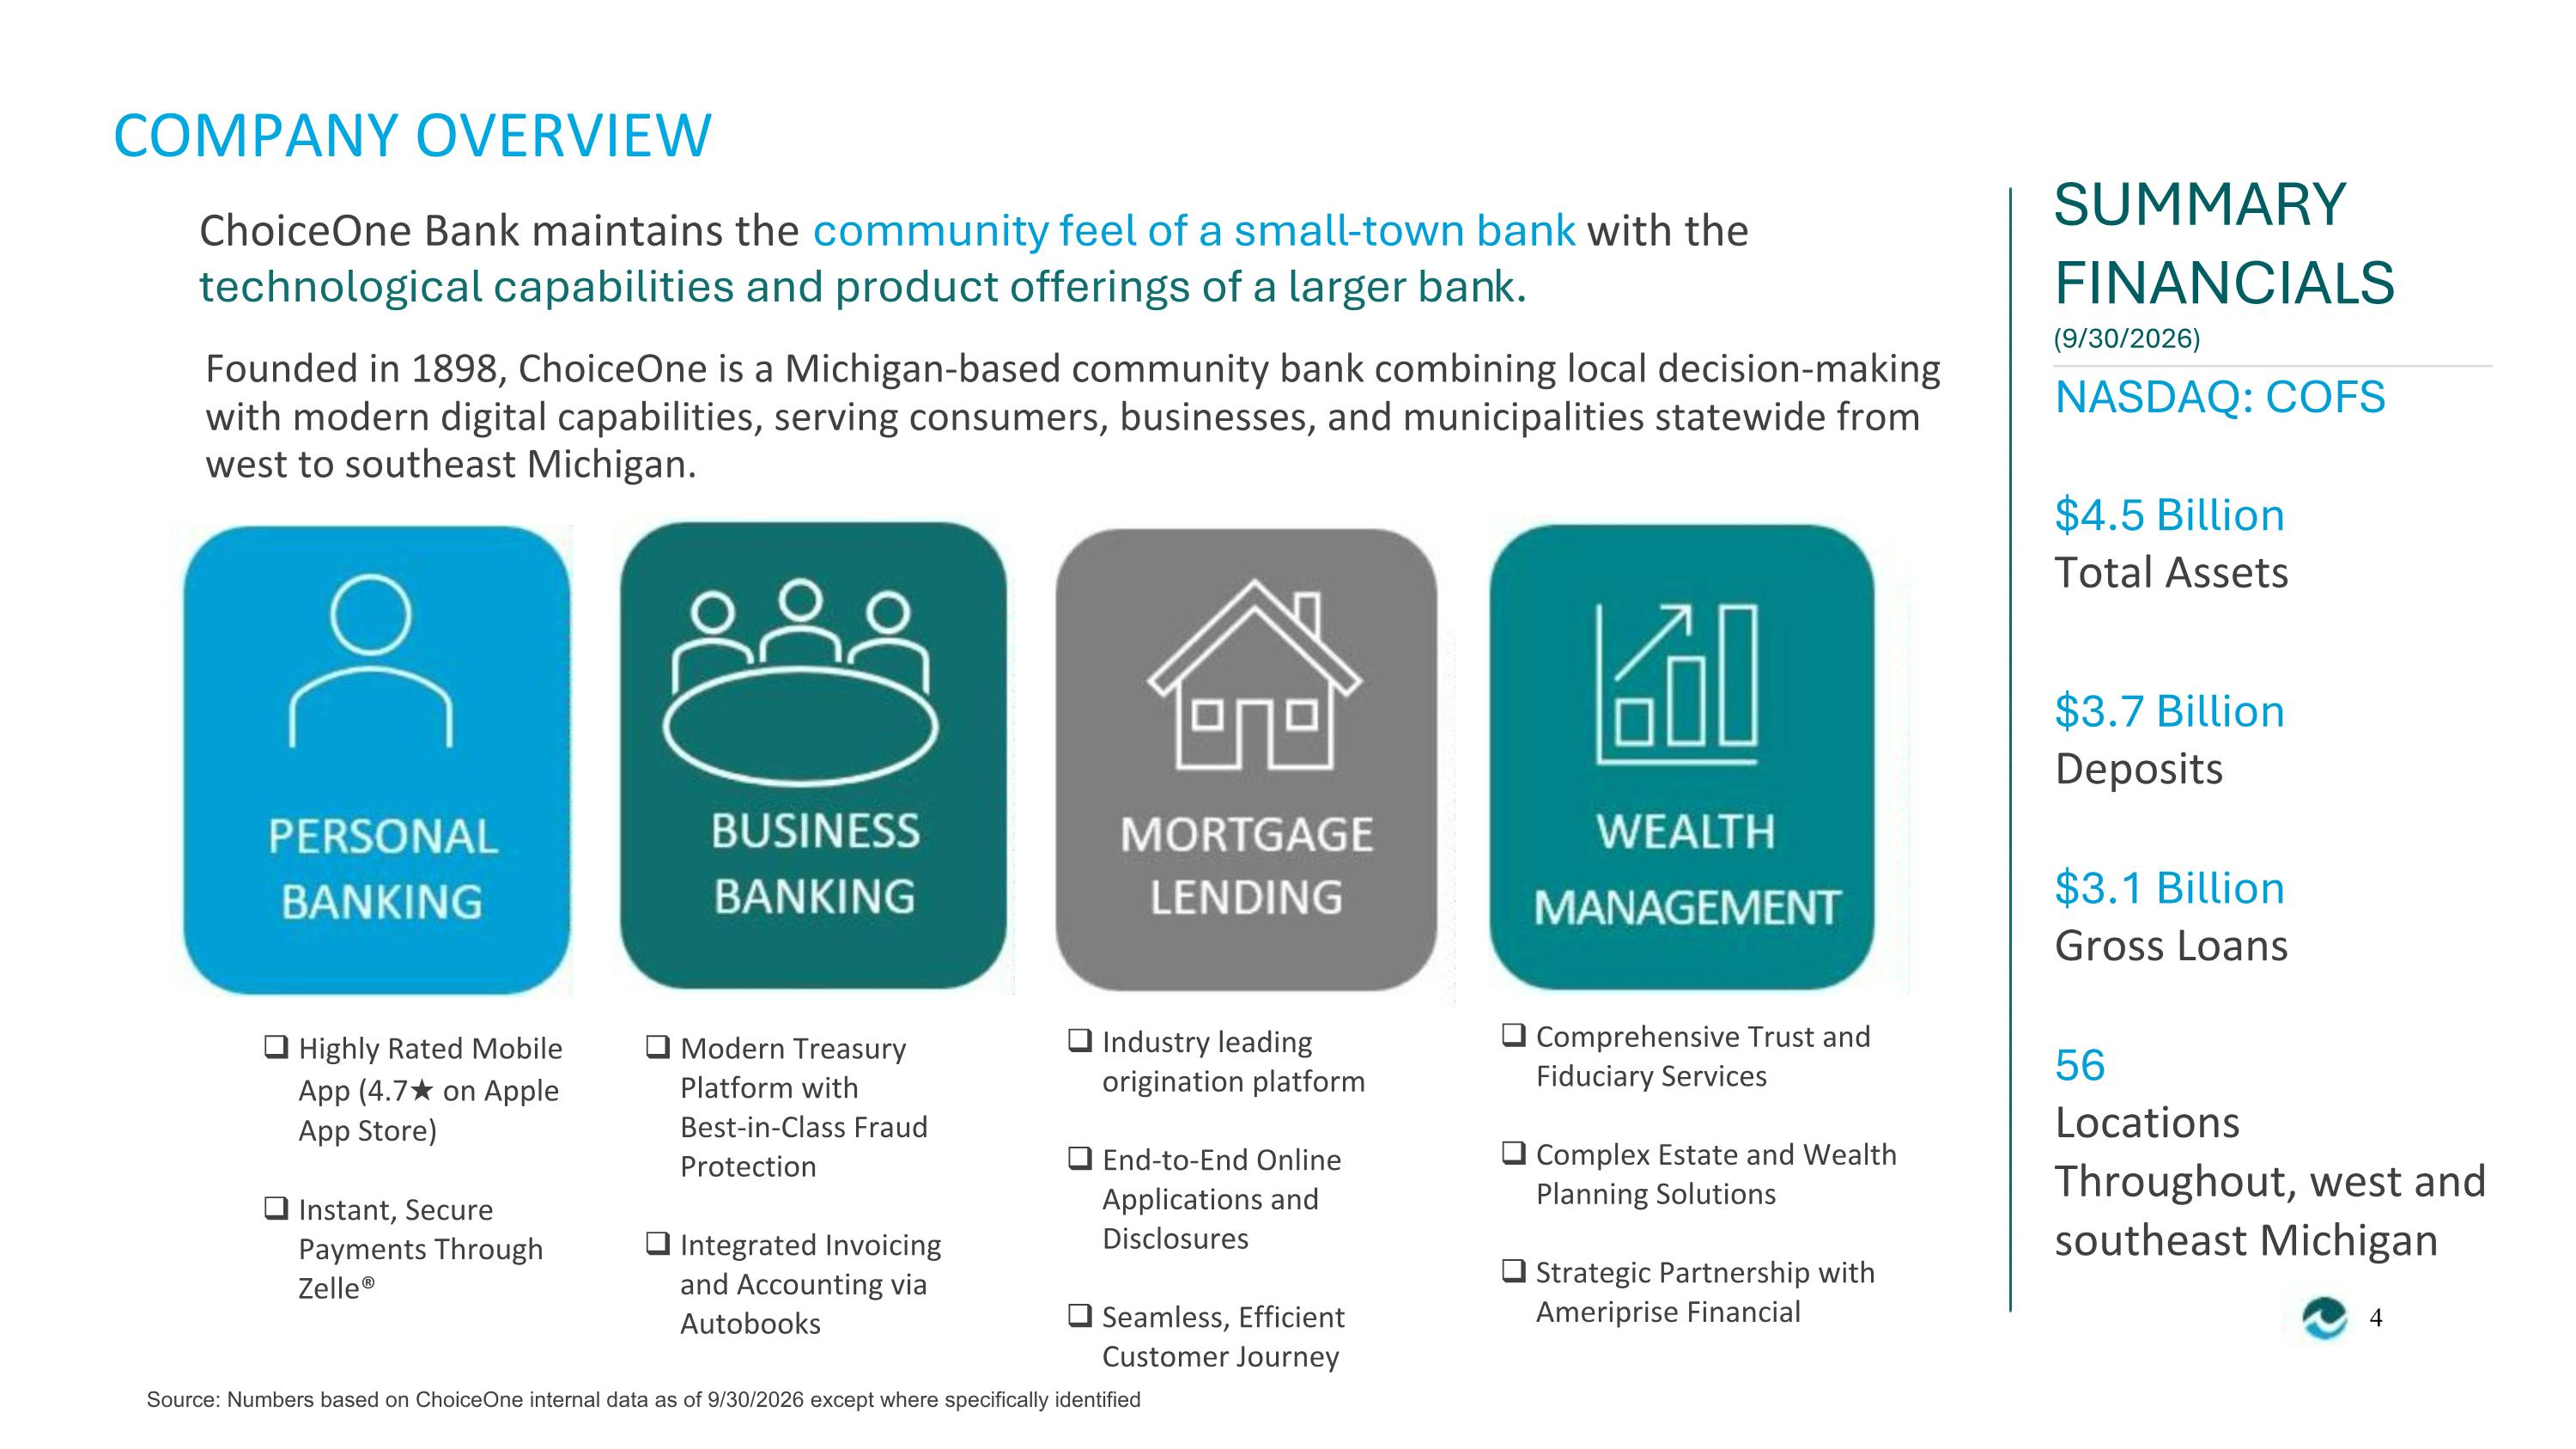
COMPANY OVERVIEW SUMMARY FINANCIALS ChoiceOne Bank maintains the community feel of a small-town bank with the technological capabilities and product offerings of a larger bank. (9/30/2026) Founded in 1898, ChoiceOne is a Michigan-based community bank combining local decision-making with modern digital capabilities, serving consumers, businesses, and municipalities statewide from west to southeast Michigan. NASDAQ: COFS $4.5 Billion Total Assets $3.7 Billion Deposits $3.1 Billion Gross Loans Comprehensive Trust and Industry leading Highly Rated Mobile App (4.7★ on Apple App Store) Modern Treasury Platform with 56 Locations Throughout, west and southeast Michigan Fiduciary Services origination platform Best-in-Class Fraud Protection Complex Estate and Wealth End-to-End Online Applications and Disclosures Planning Solutions Instant, Secure Payments Through Zelle® Integrated Invoicing and Accounting via Autobooks Strategic Partnership with Ameriprise Financial Seamless, Efficient 4 Customer Journey Source: Numbers based on ChoiceOne internal data as of 9/30/2026 except where specifically identified

MANAGEMENT TEAM KELLY J. POTES | CEO MICHAEL J. BURKE, JR. | PRESIDENT Mr. Kelly J. Potes, CFP, joined ChoiceOne Bank in 1984 and has held Mr. Michael J. Burke Jr. has served as President at ChoiceOne since May 2020 and oversees lending and operations. Previously, he served as President, CEO, COO and Director at Lakestone Bank & Trust which was merged into ChoiceOne. Mr. Burke is highly involved in organizations in Southeast Michigan including the Lapeer Development Corporation and McLaren Lapeer Region Board of Trustees. Mr. Burke holds a Bachelor of Arts degree in Finance from the University of Michigan-Flint. various management positions including Assistant Controller, Bank Investment Portfolio Manager, Head of ALCO, Head of Bank Retail Services, and Head of Investment Services. In 1998, he left ChoiceOne Bank to become the President and Owner of Kent-Ottawa Investment Advisors, an investment advisory firm. In 2001, he returned to ChoiceOne Bank as Senior Vice President of Retail Services, and General Manager of ChoiceOne Insurance Agencies, Inc. before being named Chief Executive Officer in 2016. ADOM J. GREENLAND | EVP & CFO BRADLEY A. HENION | EVP & CLO Mr. Adom Greenland is the Executive Vice President, Chief Financial Officer and Treasurer at ChoiceOne. Mr. Greenland joined ChoiceOne in 2013 and prior to his current position held various roles including Chief Operating Officer overseeing technology and bank operations. Mr. Greenland also has over 10 years of prior experience as a Certified Public Accountant at PwC. Mr. Bradley A. Henion is the Executive Vice President and Chief Lending Officer of ChoiceOne Bank. Mr. Henion joined ChoiceOne in 2015 having previously held Senior Vice President positions with GreenStone Farm Credit Services in East Lansing, MI, and Bank of America (formerly LaSalle Bank) in Grand Rapids, MI. Mr. Henion holds a Master of Business Administration in Finance from Baker College and has a Bachelor of Science in Accountancy from Ferris State University. "With a vision to be the best bank in Michigan and a mission to provide superior service, quality advice, and show utmost respect to everyone we meet, our tech-savvy community bank is prepared to meet our customers’ financial needs, however they choose, and build solid personal relationships.” - Kelly J. Potes 5
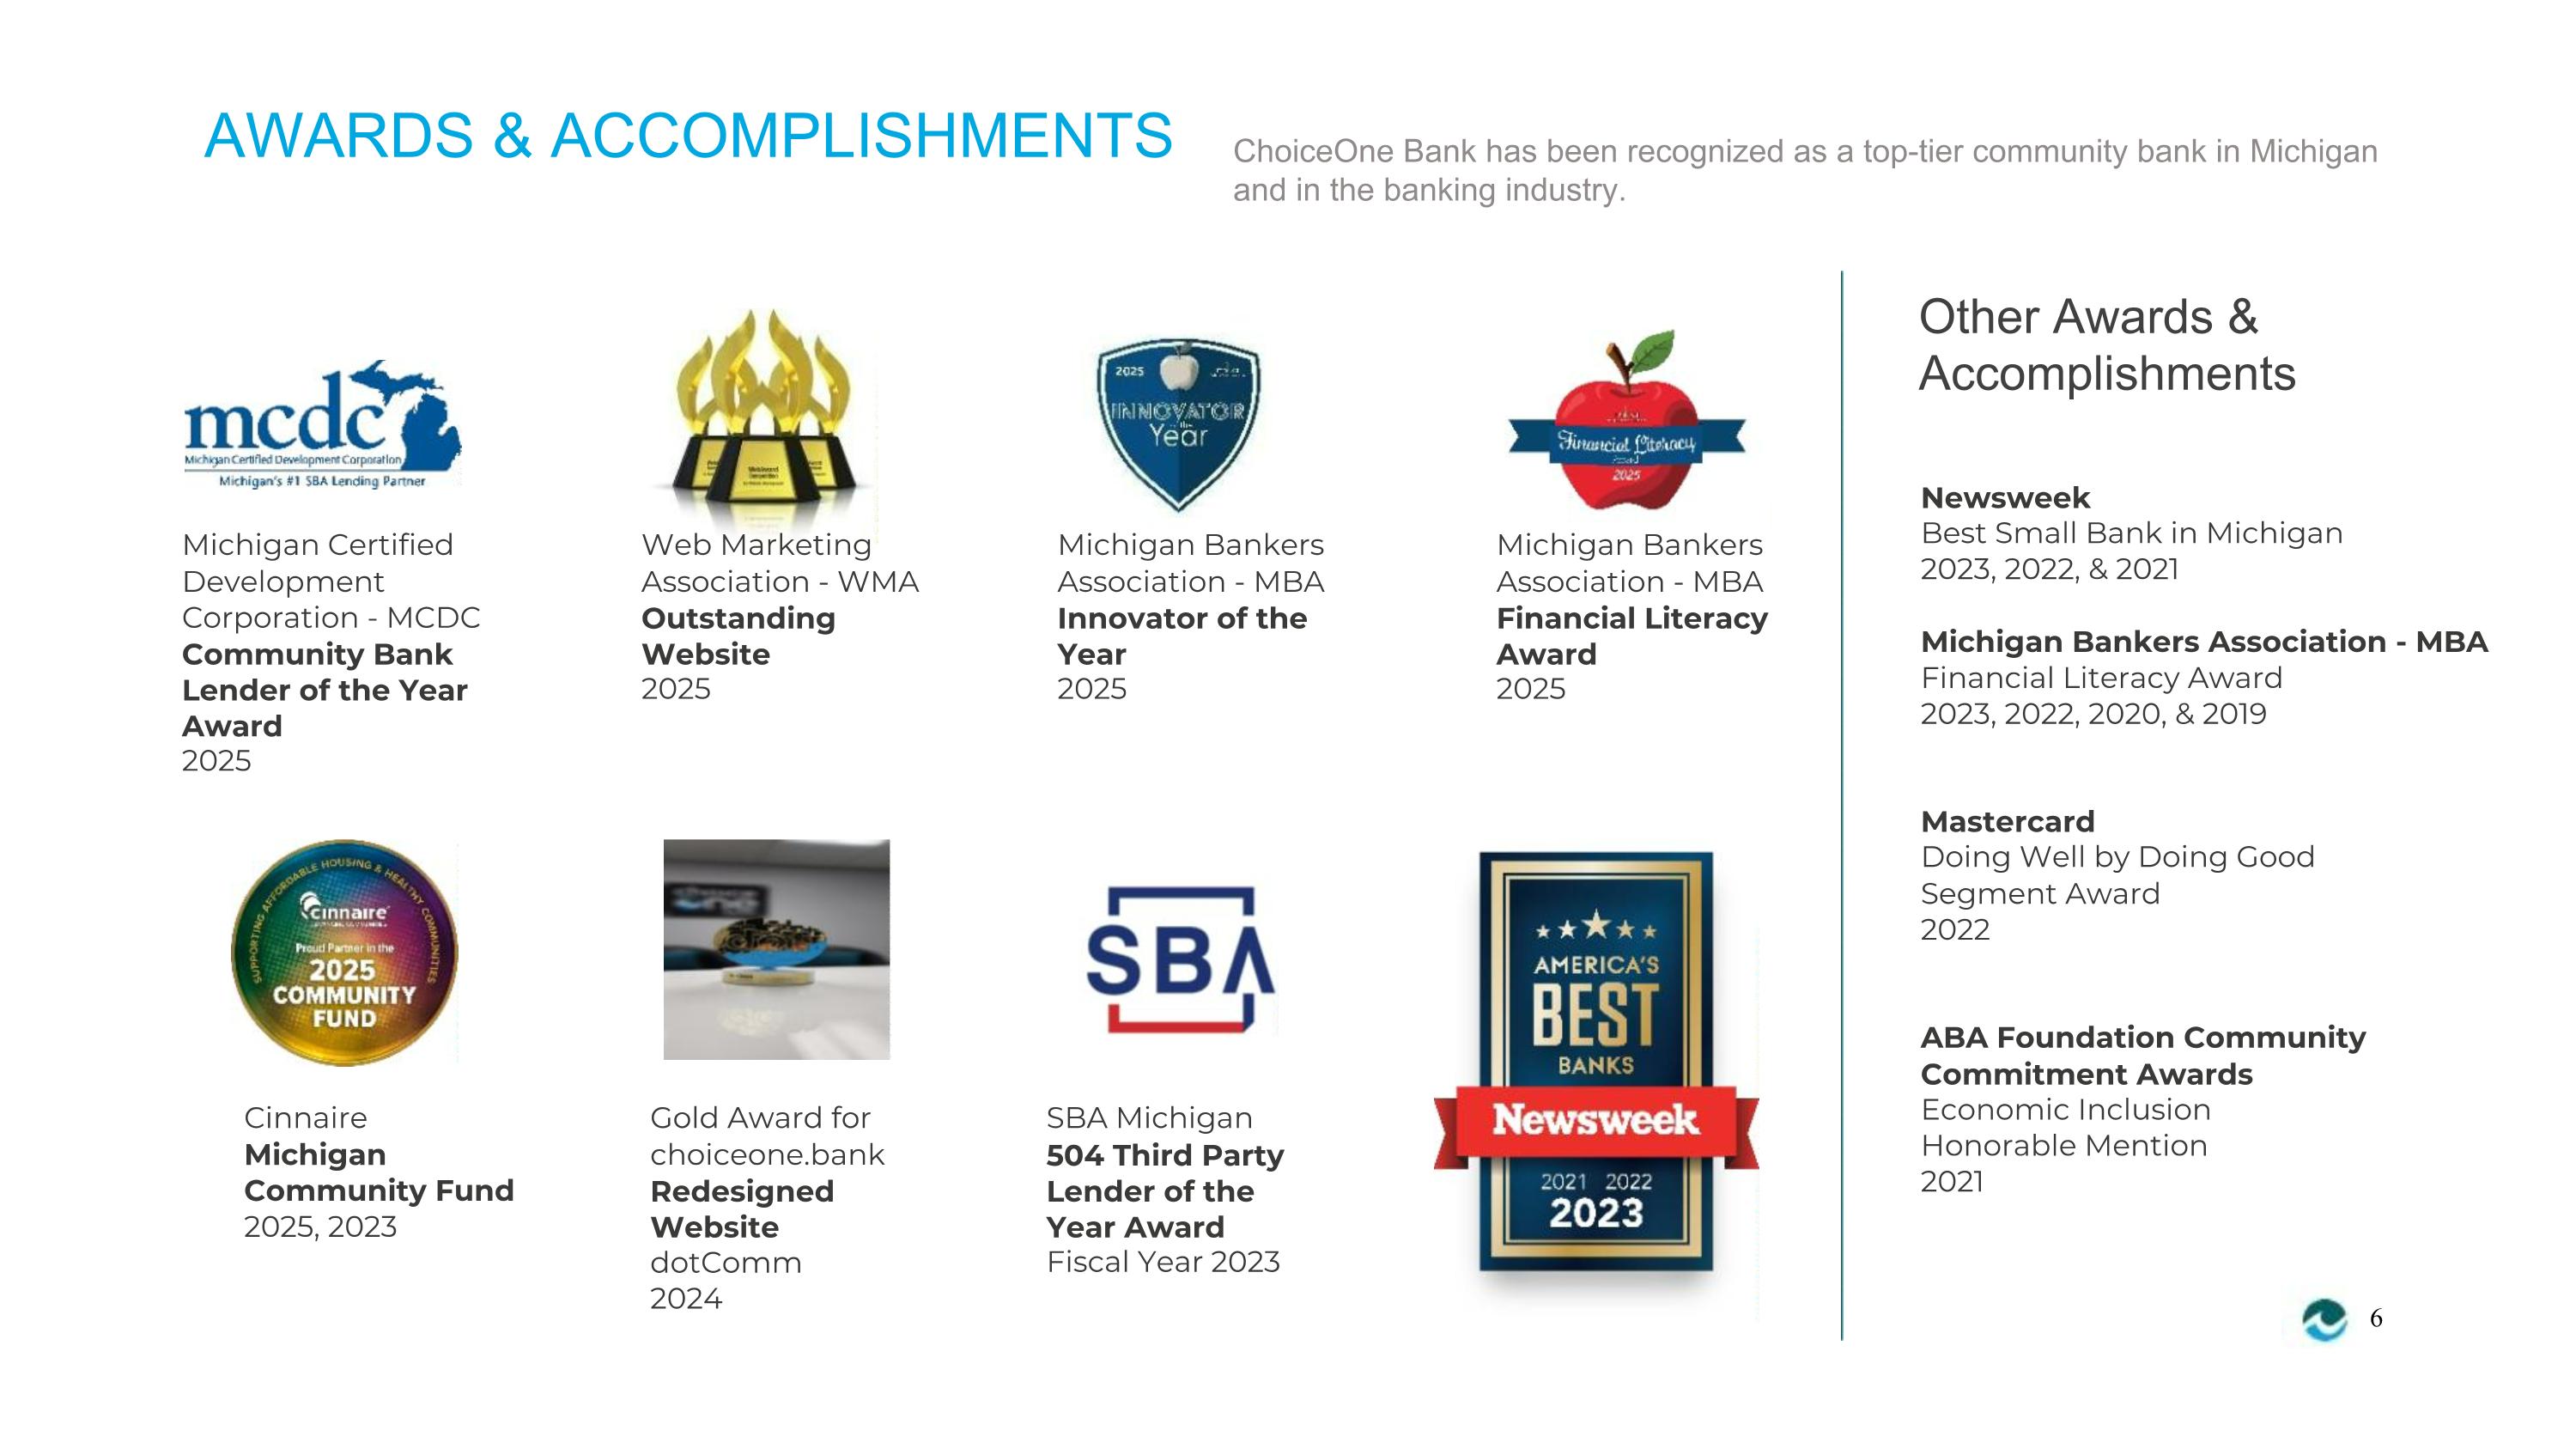
AWARDS & ACCOMPLISHMENTS ChoiceOne Bank has been recognized as a top-tier community bank in Michigan and in the banking industry. Other Awards & Accomplishments Newsweek Best Small Bank in Michigan Michigan Certified Development Corporation - MCDC Community Bank Lender of the Year Award Web Marketing Association - WMA Outstanding Website Michigan Bankers Association - MBA Innovator of the Year Michigan Bankers Association - MBA Financial Literacy Award 2023, 2022, & 2021 Michigan Bankers Association - MBA Financial Literacy Award 2023, 2022, 2020, & 2019 2025 2025 2025 2025 Mastercard Doing Well by Doing Good Segment Award 2022 ABA Foundation Community Commitment Awards Economic Inclusion Honorable Mention 2021 Cinnaire Gold Award for choiceone.bank Redesigned Website dotComm 2024 SBA Michigan 504 Third Party Lender of the Year Award Michigan Community Fund 2025, 2023 Fiscal Year 2023 6
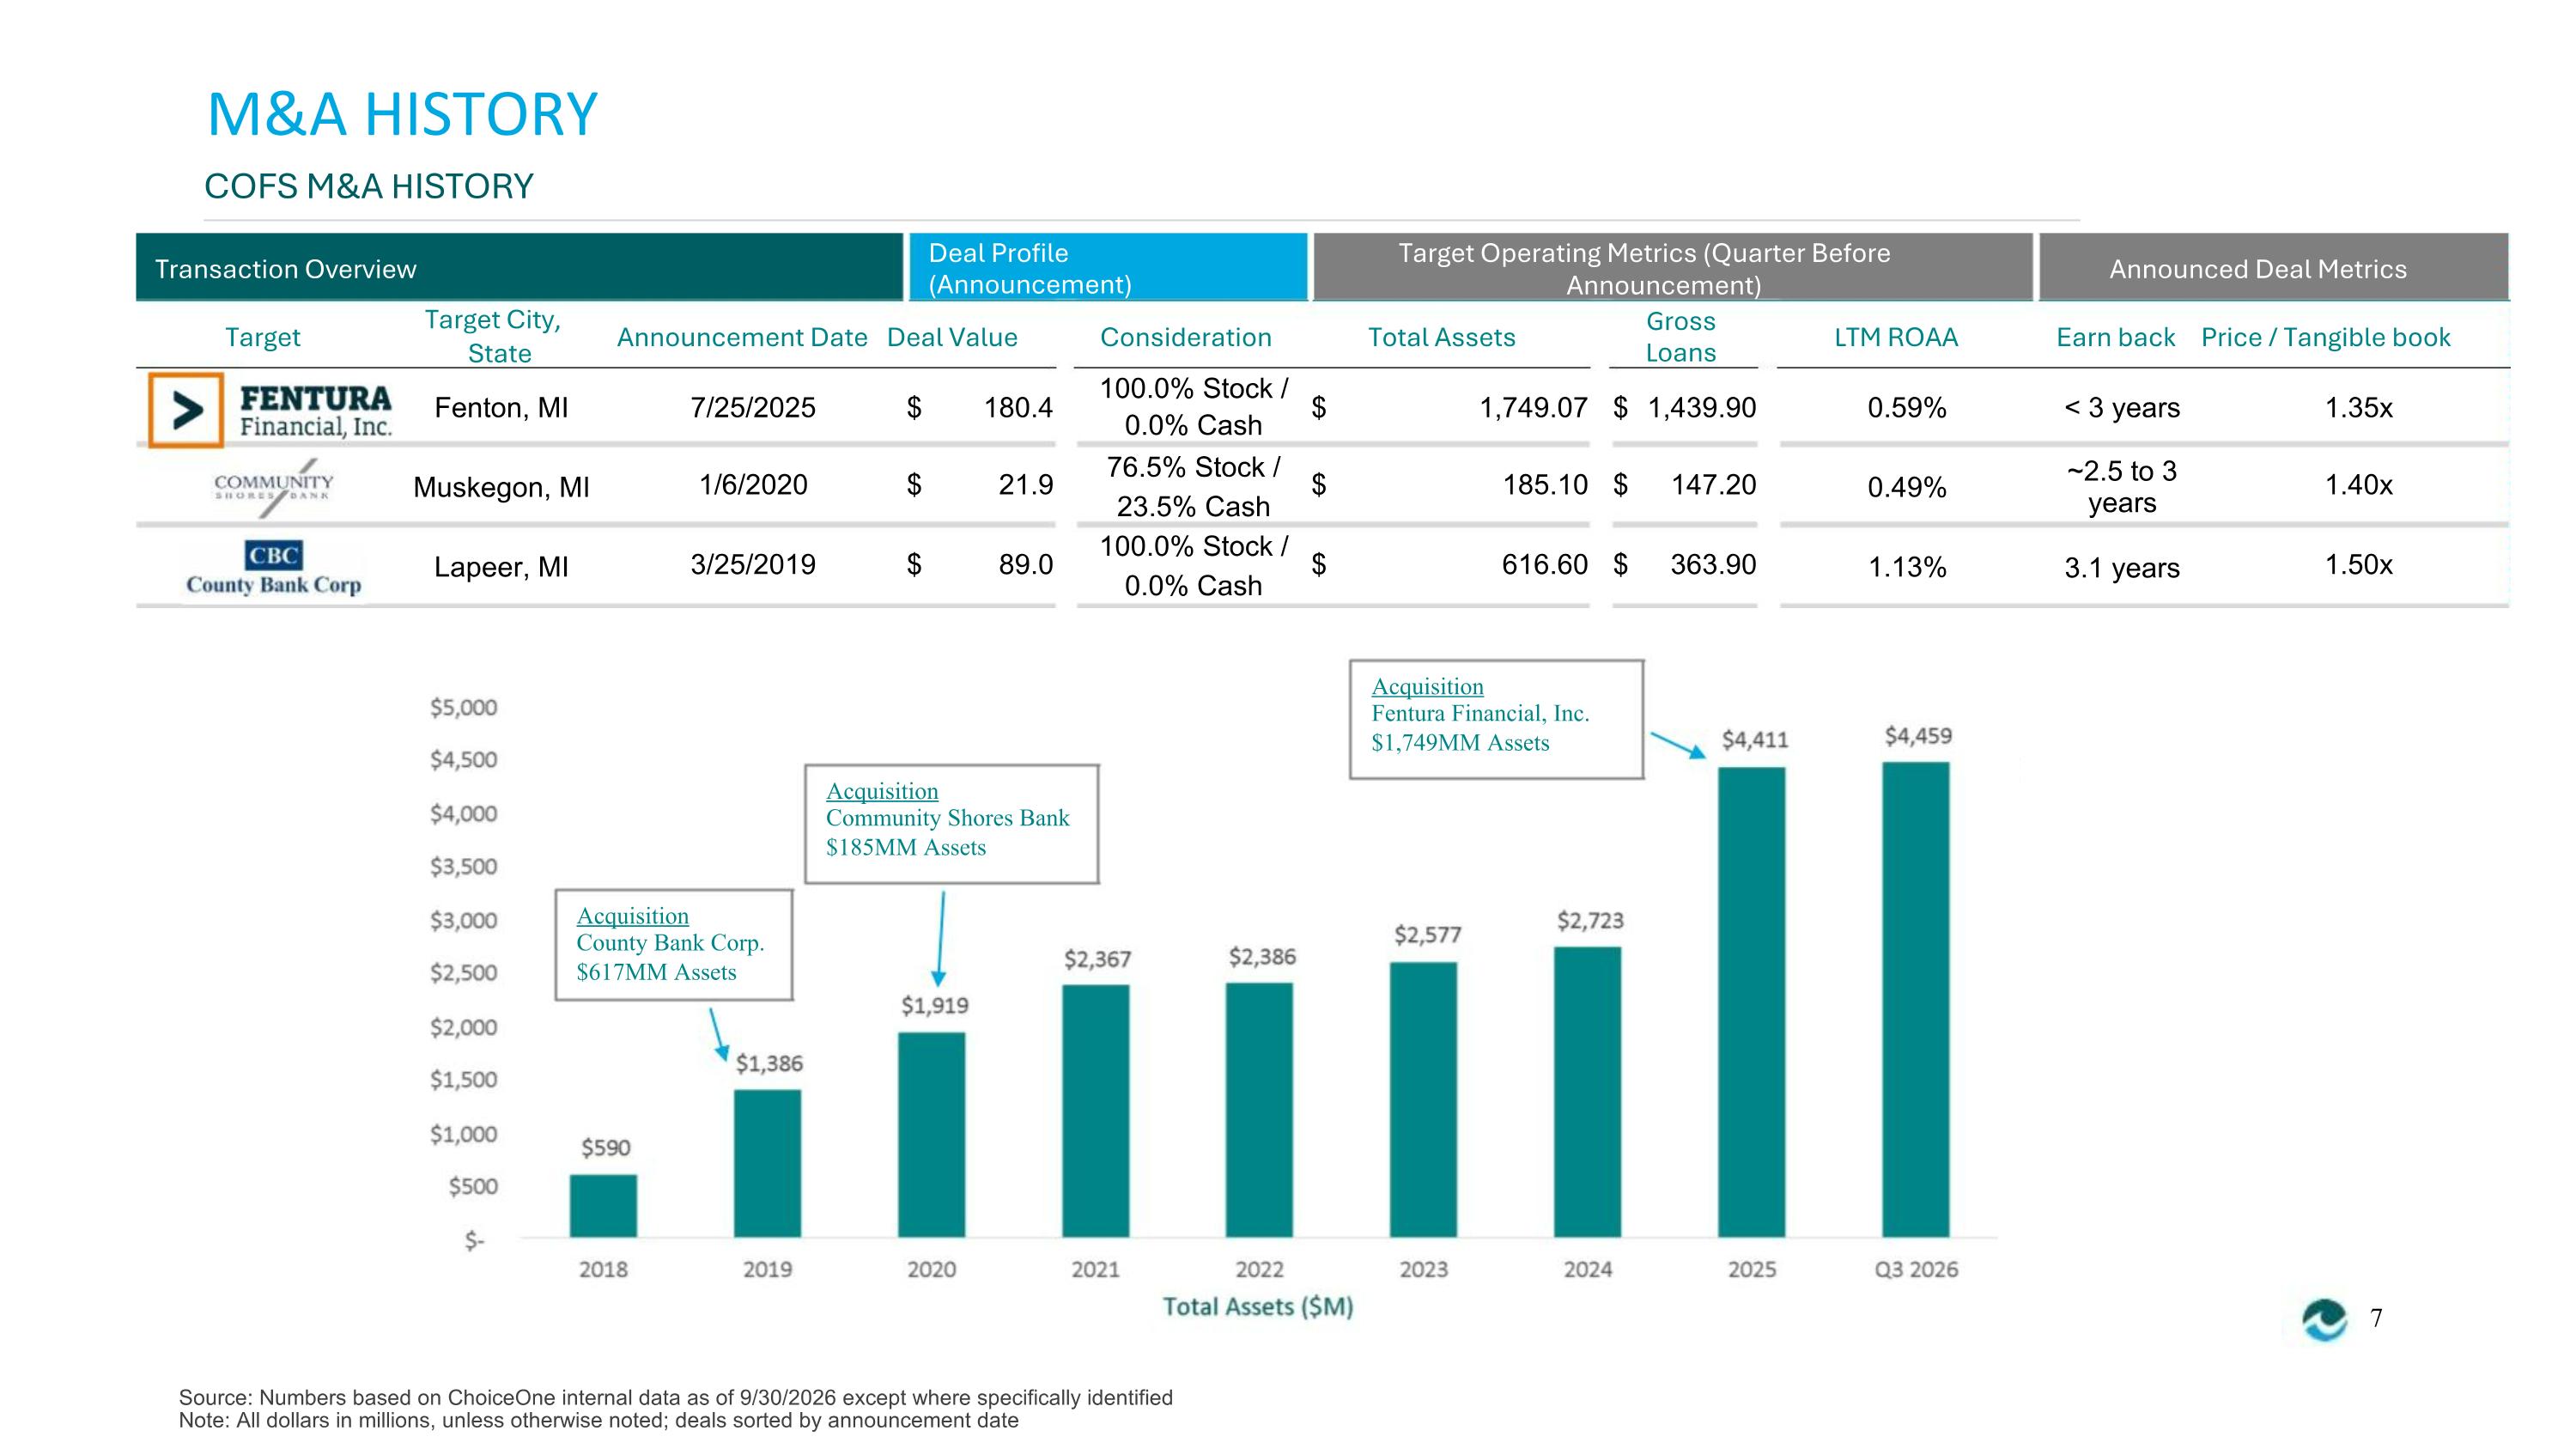
M&A HISTORY COFS M&A HISTORY Deal Profile (Announcement) Target Operating Metrics (Quarter Before Transaction Overview Target City, Announced Deal Metrics Announcement) Gross Loans Target Announcement Date Deal Value Consideration Total Assets LTM ROAA Earn back Price / Tangible book State 100.0% Stock / 0.0% Cash Fenton, MI 7/25/2025 1/6/2020 3/25/2019 $ $ $ 180.4 21.9 89.0 $ $ $ 1,749.07 $ 1,439.90 185.10 $ 147.20 616.60 $ 363.90 0.59% < 3 years 1.35x 1.40x 1.50x 76.5% Stock / 23.5% Cash 100.0% Stock / 0.0% Cash ~2.5 to 3 years Muskegon, MI Lapeer, MI 0.49% 1.13% 3.1 years Acquisition Fentura Financial, Inc. $1,749MM Assets Acquisition Community Shores Bank $185MM Assets Acquisition County Bank Corp. $617MM Assets 7 Source: Numbers based on ChoiceOne internal data as of 9/30/2026 except where specifically identified Note: All dollars in millions, unless otherwise noted; deals sorted by announcement date
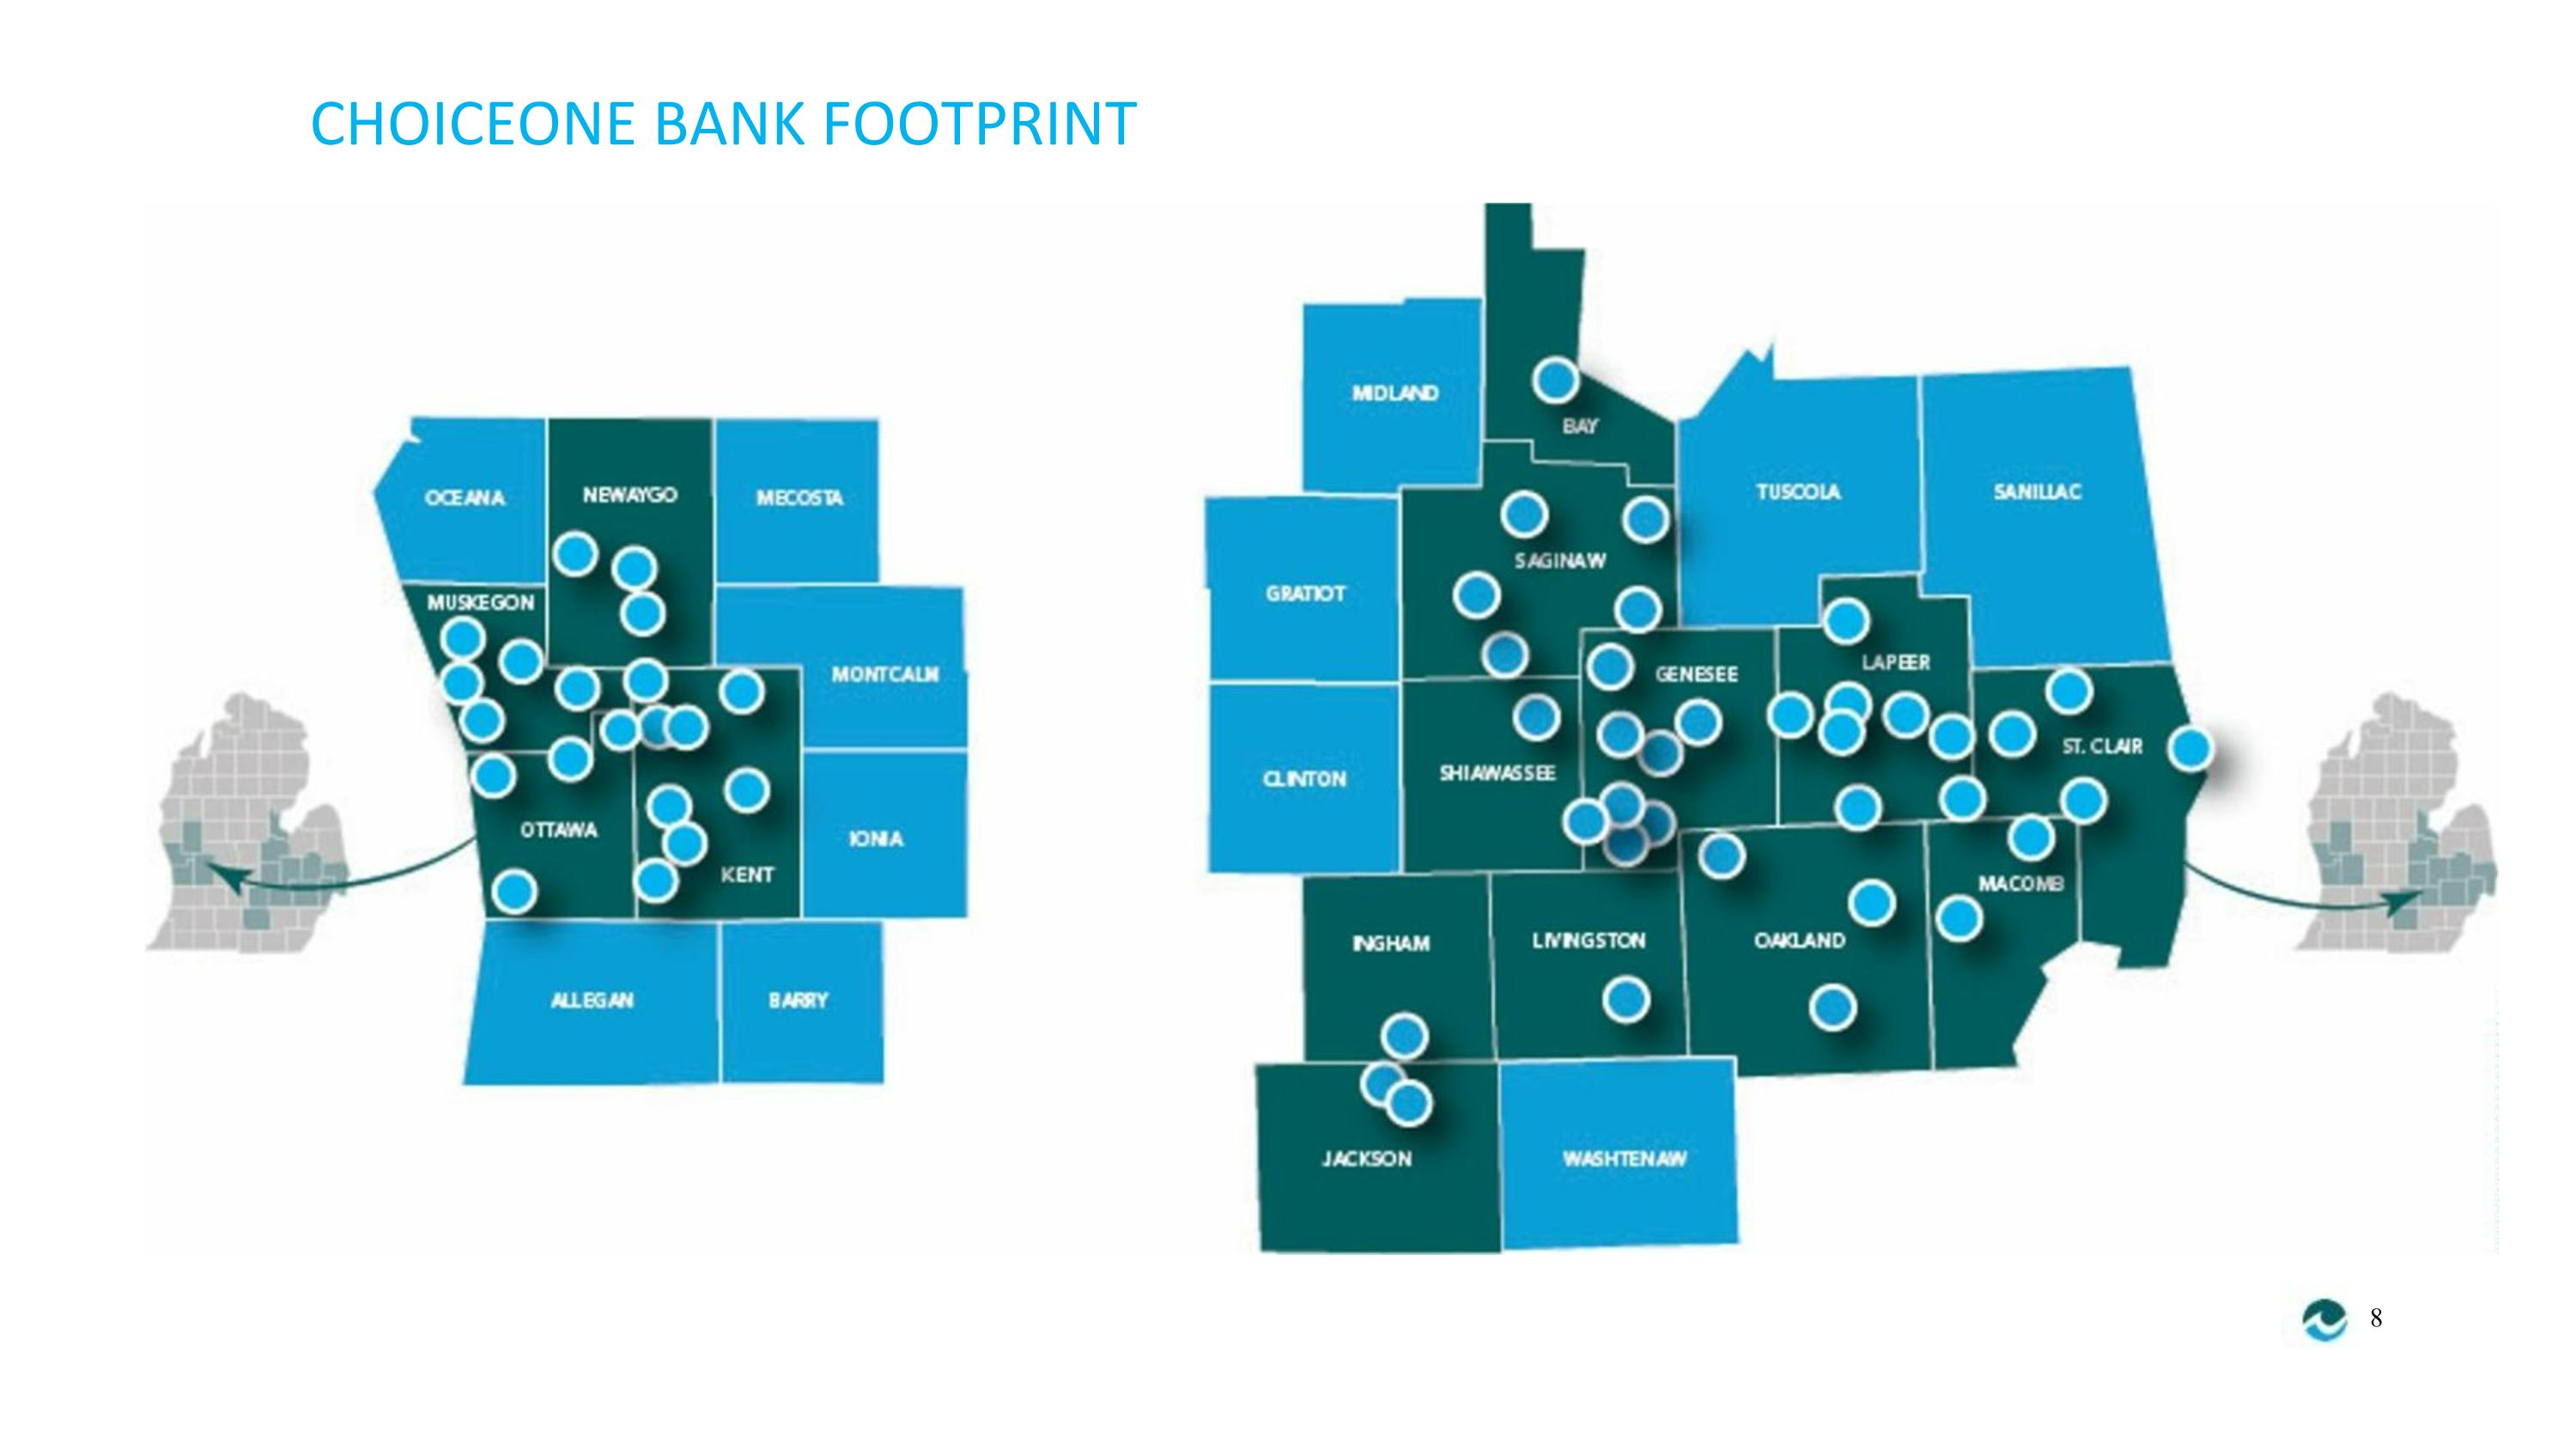
CHOICEONE BANK FOOTPRINT 8
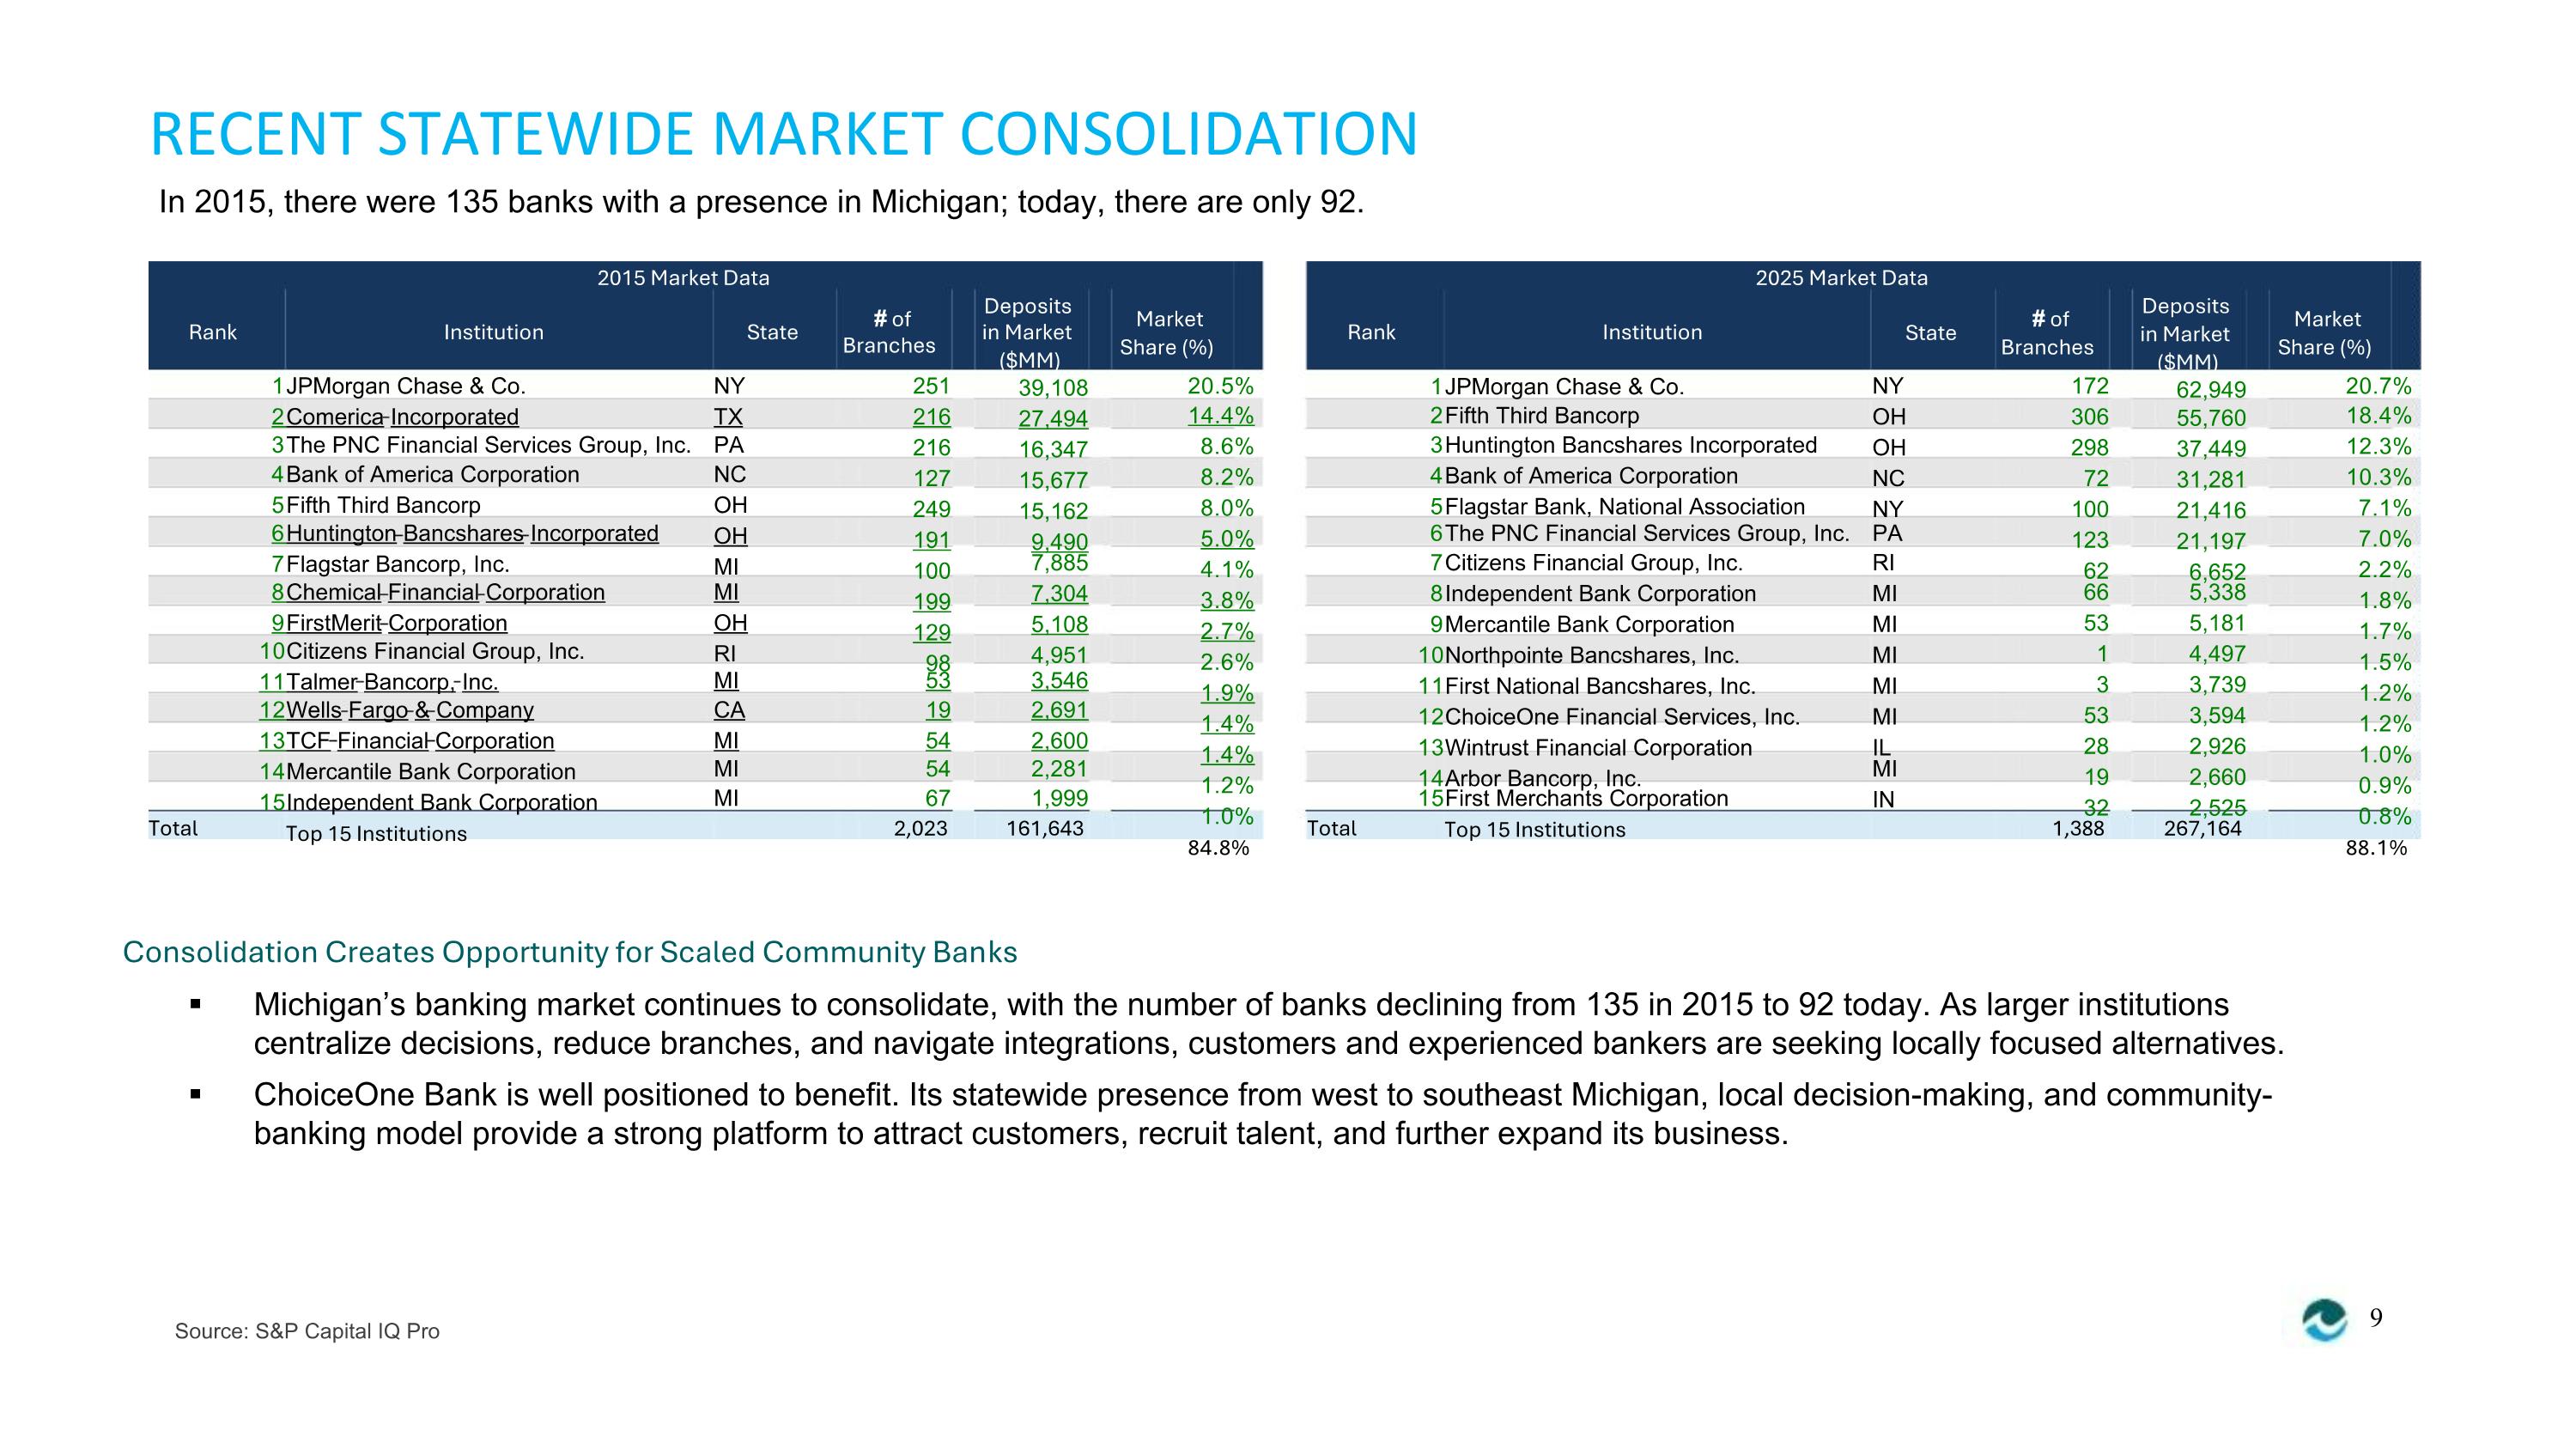
RECENT STATEWIDE MARKET CONSOLIDATION In 2015, there were 135 banks with a presence in Michigan; today, there are only 92. 2015 Market Data Deposits 2025 Market Data State Deposits in Market ($MM) 62,949 55,760 37,449 31,281 21,416 21,197 6,652 # of Market Share (%) # of Branches Market Share (%) Rank Institution State in Market ($MM) 39,108 27,494 16,347 15,677 15,162 9,490 Rank Institution 1JPMorgan Chase & Co. Branches 1JPMorgan Chase & Co. 2Comerica Incorporated NY TX 251 216 216 127 249 191 100 199 129 98 20.5% NY OH OH NC NY 172 306 298 72 100 123 62 20.7% 14.4% 8.6% 8.2% 8.0% 5.0% 4.1% 3.8% 2.7% 2.6% 1.9% 1.4% 1.4% 1.2% 1.0% 84.8% 2Fifth Third Bancorp 18.4% 12.3% 10.3% 7.1% 7.0% 2.2% 1.8% 1.7% 1.5% 1.2% 1.2% 1.0% 0.9% 0.8% 88.1% 3The PNC Financial Services Group, Inc. PA 3Huntington Bancshares Incorporated 4Bank of America Corporation 5Flagstar Bank, National Association 4Bank of America Corporation 5Fifth Third Bancorp NC OH OH MI 6Huntington Bancshares Incorporated 7Flagstar Bancorp, Inc. 6The PNC Financial Services Group, Inc. PA 7,885 7,304 5,108 4,951 7Citizens Financial Group, Inc. 8Independent Bank Corporation 9Mercantile Bank Corporation 10Northpointe Bancshares, Inc. 11First National Bancshares, Inc. 12ChoiceOne Financial Services, Inc. 13Wintrust Financial Corporation 14Arbor Bancorp, Inc. RI MI MI MI MI MI IL 8Chemical Financial Corporation 9FirstMerit Corporation MI OH RI 66 53 1 3 53 28 19 32 5,338 5,181 4,497 3,739 3,594 2,926 2,660 2,525 10Citizens Financial Group, Inc. 11Talmer Bancorp, Inc. MI 53 3,546 12Wells Fargo & Company 13TCF Financial Corporation 14Mercantile Bank Corporation 15Independent Bank Corporation Top 15 Institutions CA MI 19 54 2,691 2,600 MI 54 2,281 MI IN MI 67 1,999 15First Merchants Corporation Top 15 Institutions Total 2,023 161,643 Total 1,388 267,164 Consolidation Creates Opportunity for Scaled Community Banks ▪ Michigan’s banking market continues to consolidate, with the number of banks declining from 135 in 2015 to 92 today. As larger institutions centralize decisions, reduce branches, and navigate integrations, customers and experienced bankers are seeking locally focused alternatives. ▪ ChoiceOne Bank is well positioned to benefit. Its statewide presence from west to southeast Michigan, local decision-making, and community- banking model provide a strong platform to attract customers, recruit talent, and further expand its business. 9 Source: S&P Capital IQ Pro
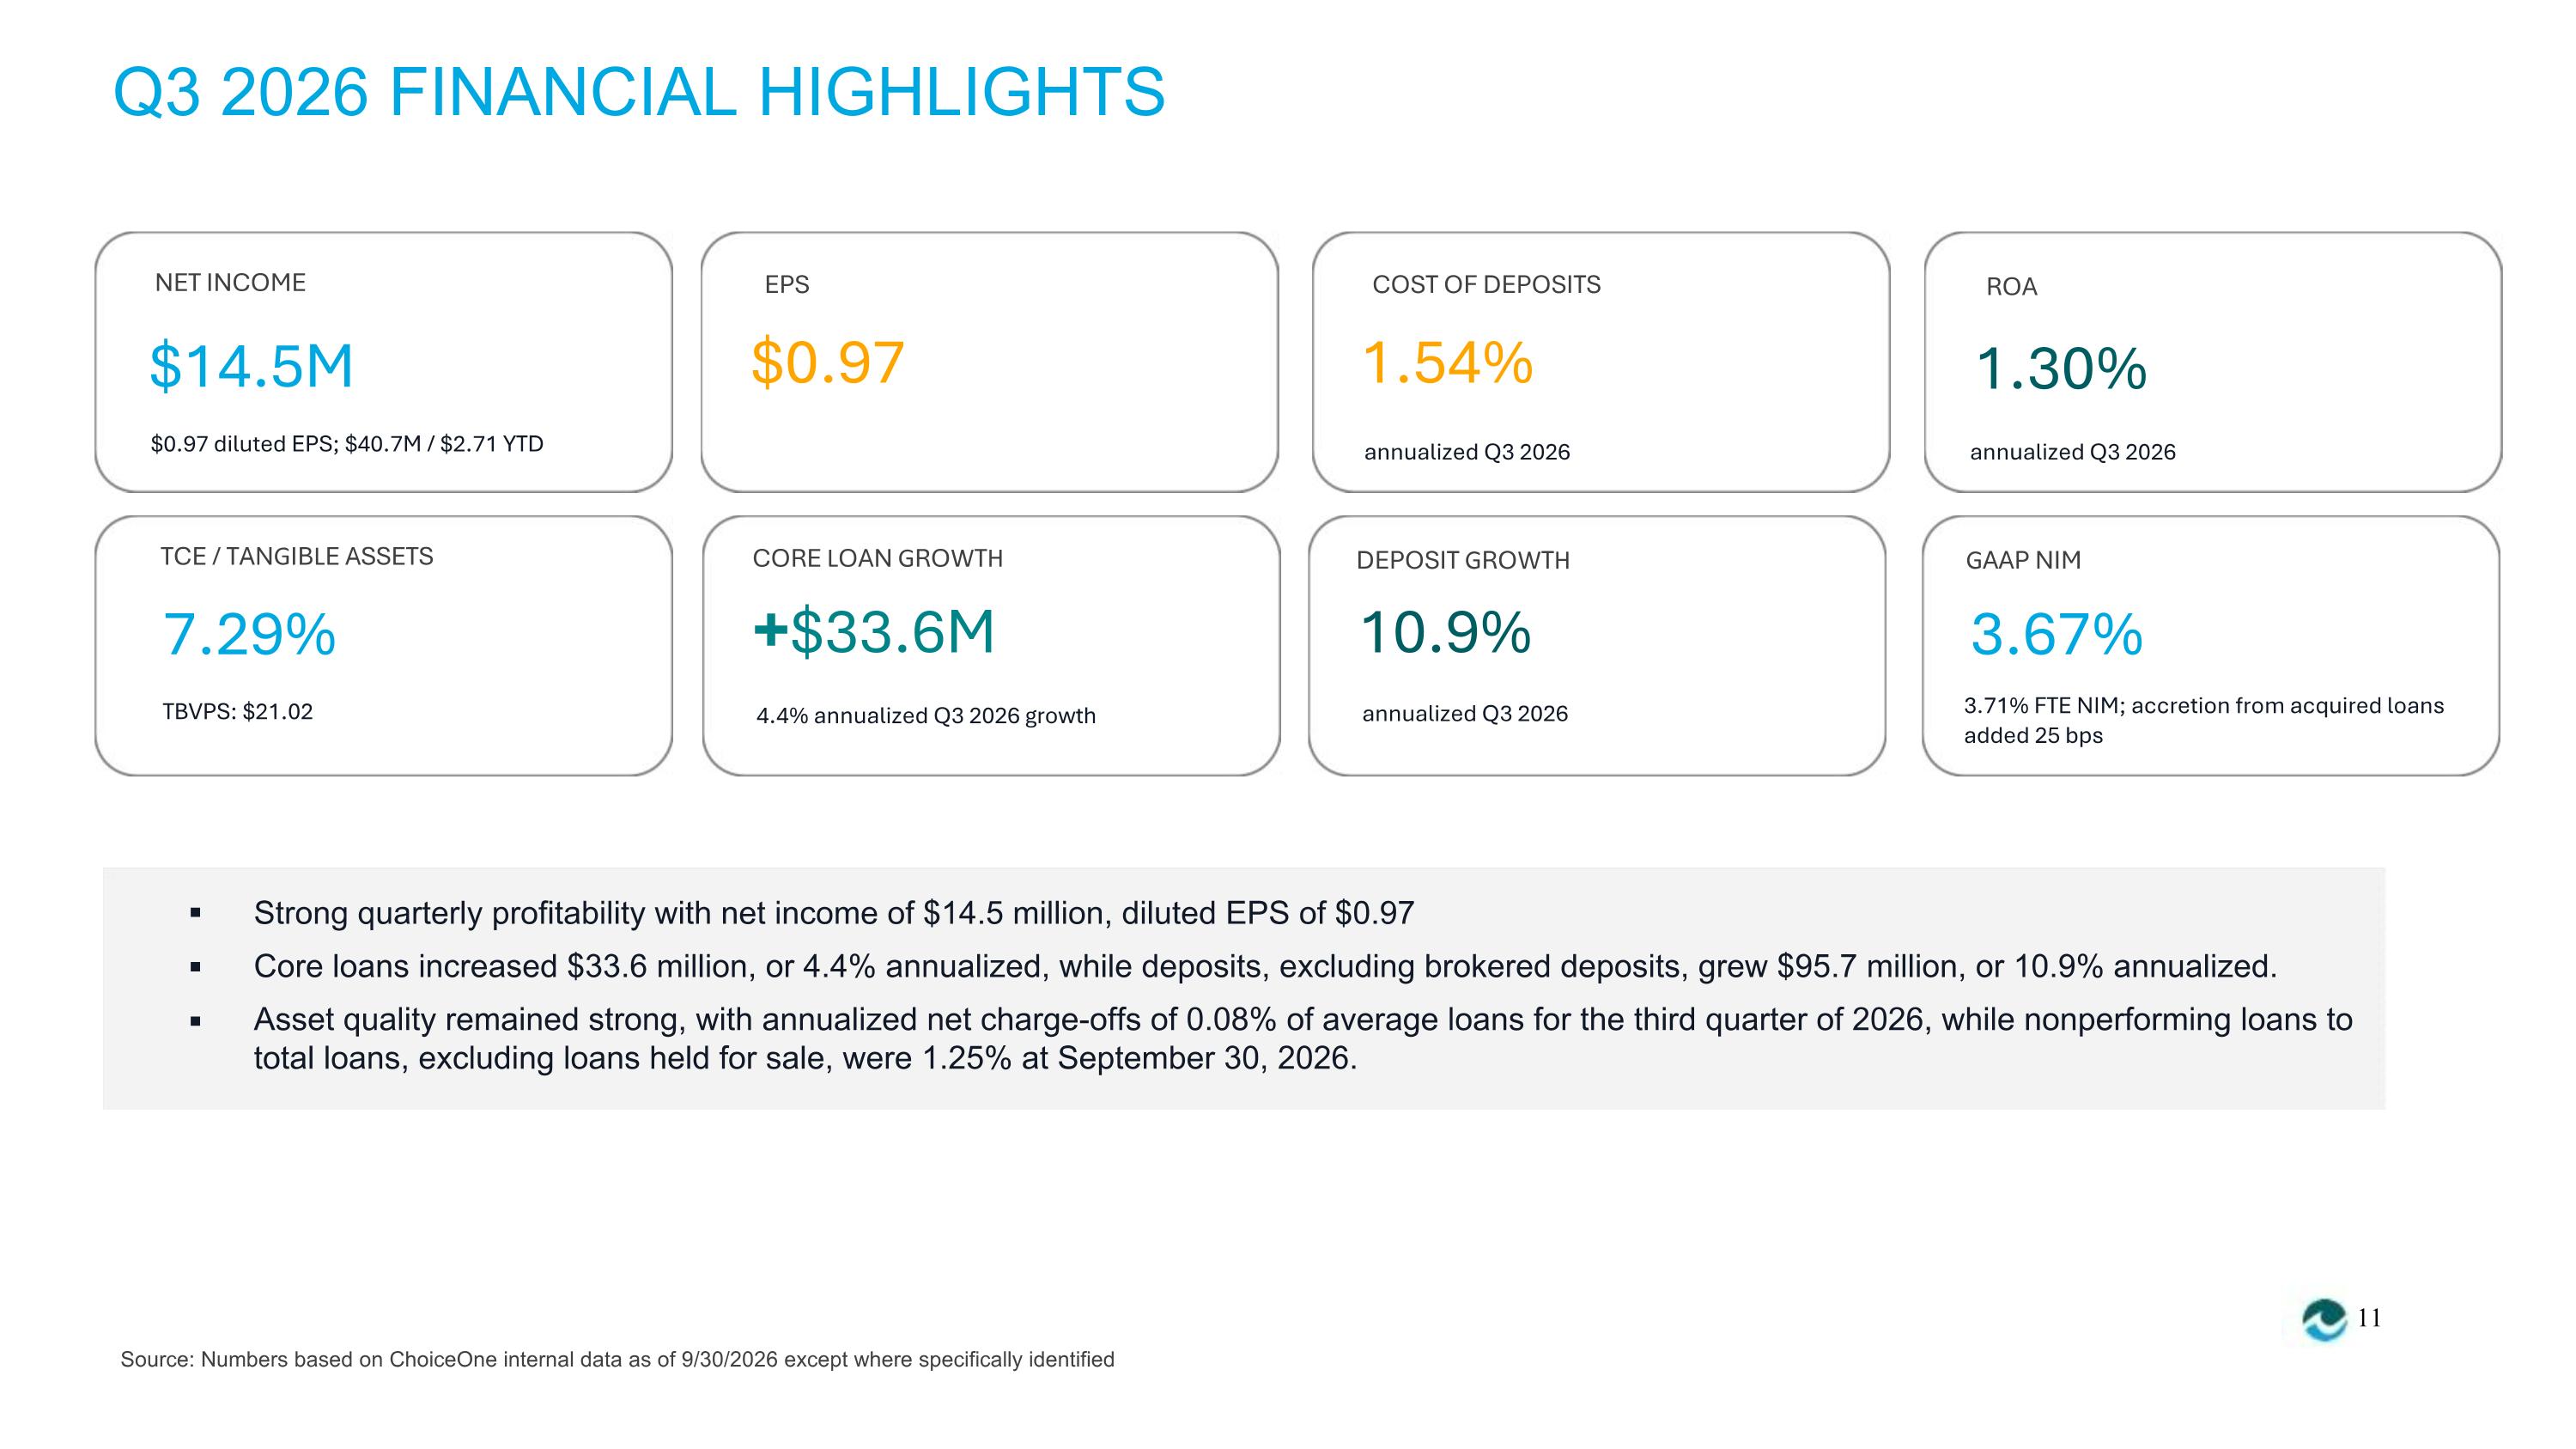
Q3 2026 FINANCIAL HIGHLIGHTS NET INCOME EPS COST OF DEPOSITS ROA $14.5M $0.97 1.54% 1.30% $0.97 diluted EPS; $40.7M / $2.71 YTD annualized Q3 2026 annualized Q3 2026 TCE / TANGIBLE ASSETS CORE LOAN GROWTH DEPOSIT GROWTH GAAP NIM 7.29% +$33.6M 10.9% 3.67% 3.71% FTE NIM; accretion from acquired loans added 25 bps TBVPS: $21.02 4.4% annualized Q3 2026 growth annualized Q3 2026 ▪ ▪ ▪ Strong quarterly profitability with net income of $14.5 million, diluted EPS of $0.97 Core loans increased $33.6 million, or 4.4% annualized, while deposits, excluding brokered deposits, grew $95.7 million, or 10.9% annualized. Asset quality remained strong, with annualized net charge-offs of 0.08% of average loans for the third quarter of 2026, while nonperforming loans to total loans, excluding loans held for sale, were 1.25% at September 30, 2026. 11 Source: Numbers based on ChoiceOne internal data as of 9/30/2026 except where specifically identified
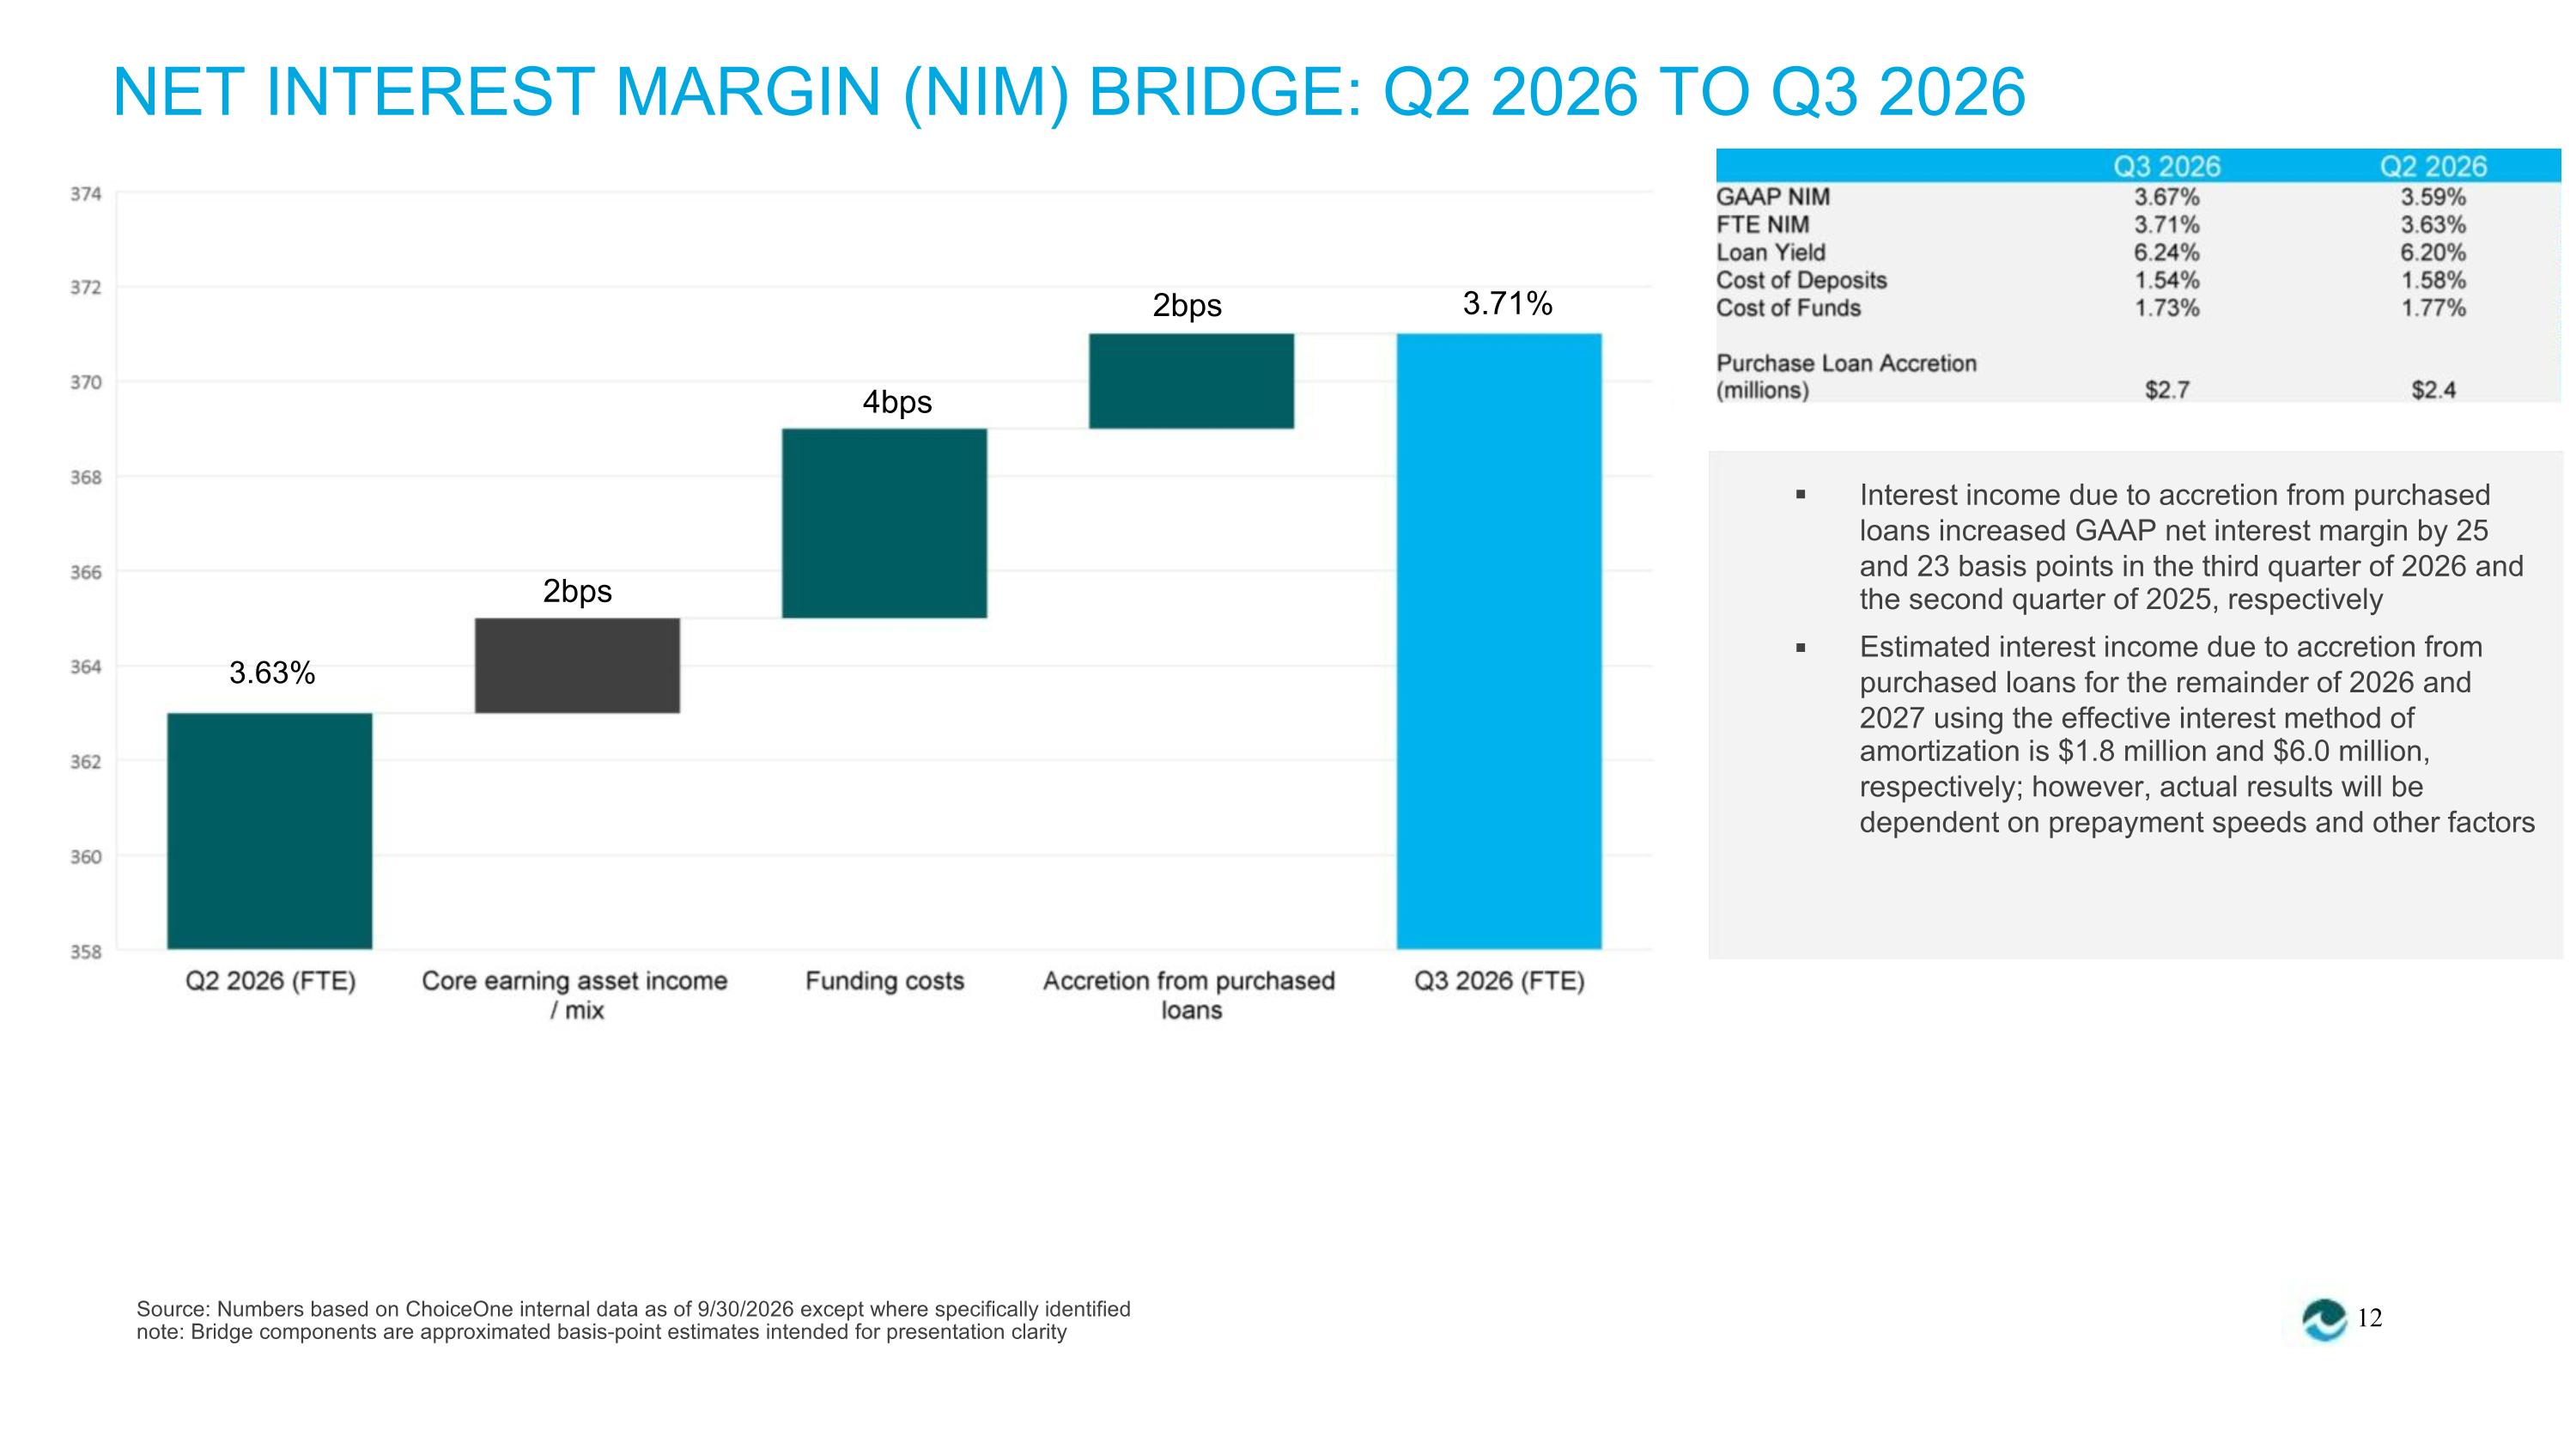
NET INTEREST MARGIN (NIM) BRIDGE: Q2 2026 TO Q3 2026 2bps 3.71% 4bps ▪ ▪ Interest income due to accretion from purchased loans increased GAAP net interest margin by 25 and 23 basis points in the third quarter of 2026 and the second quarter of 2025, respectively 2bps Estimated interest income due to accretion from purchased loans for the remainder of 2026 and 2027 using the effective interest method of amortization is $1.8 million and $6.0 million, respectively; however, actual results will be dependent on prepayment speeds and other factors 3.63% Source: Numbers based on ChoiceOne internal data as of 9/30/2026 except where specifically identified note: Bridge components are approximated basis-point estimates intended for presentation clarity 12
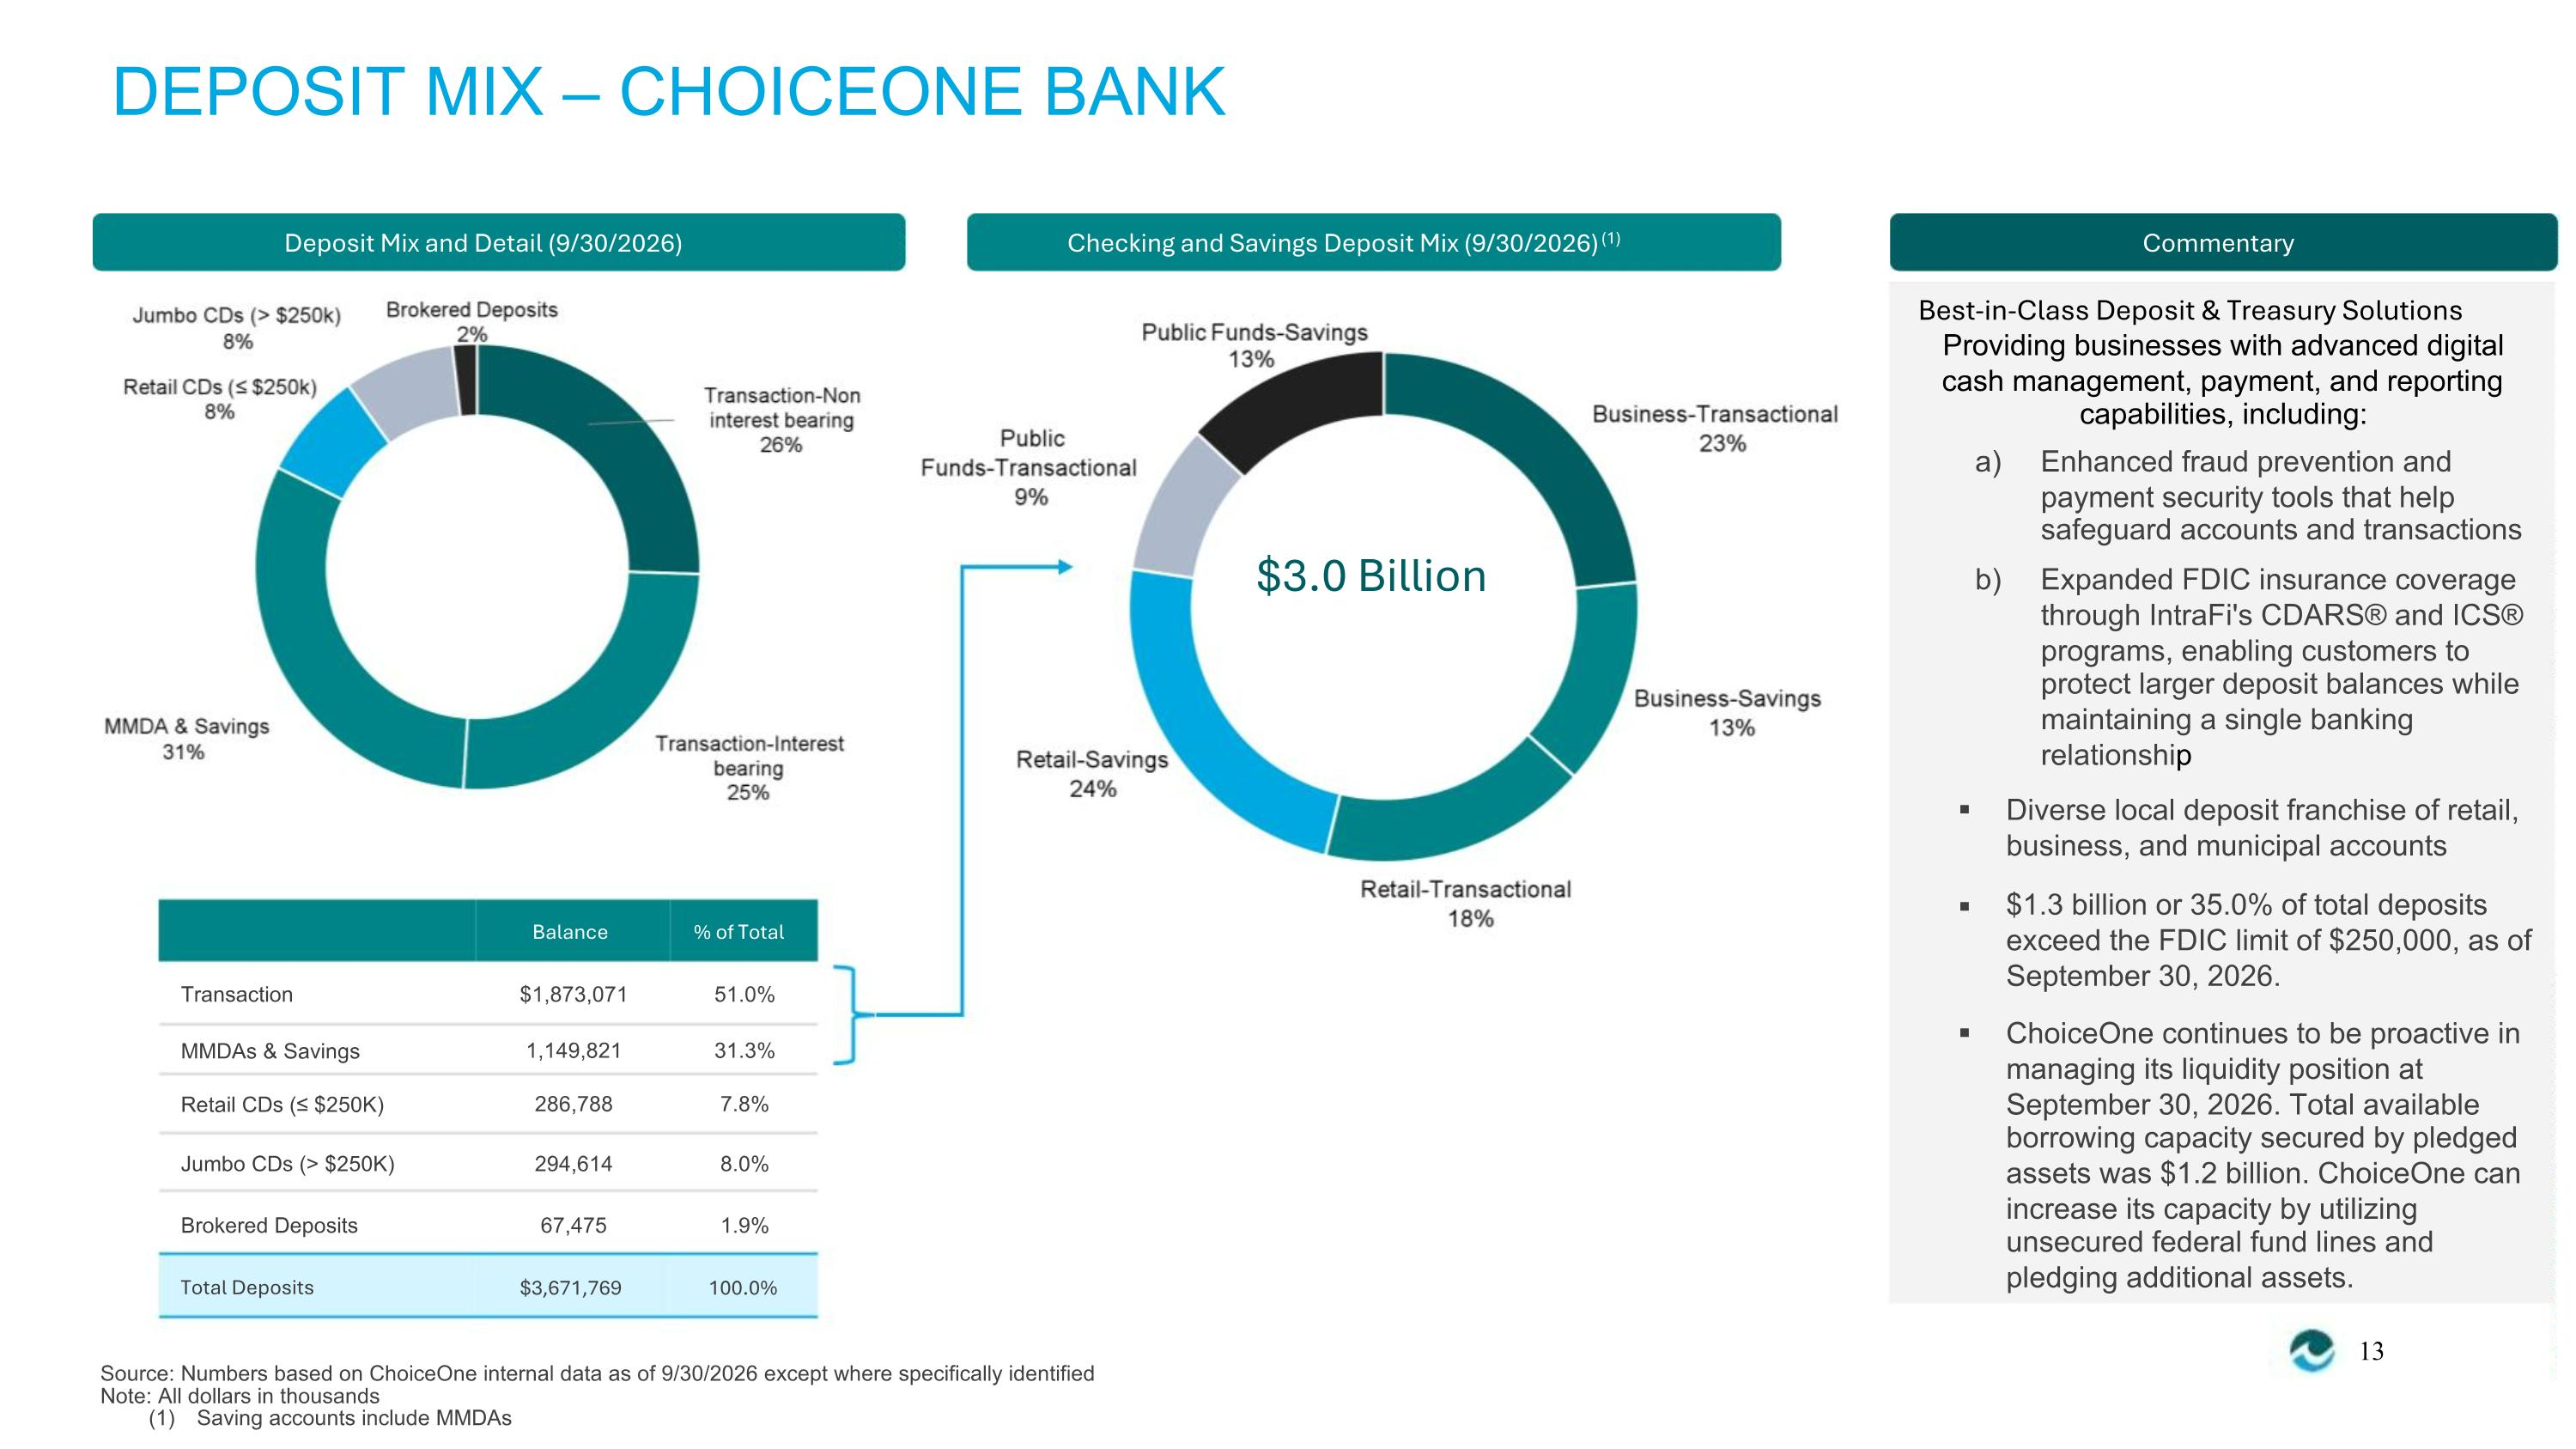
DEPOSIT MIX – CHOICEONE BANK Deposit Mix and Detail (9/30/2026) Checking and Savings Deposit Mix (9/30/2026) (1) Commentary Best-in-Class Deposit & Treasury Solutions Providing businesses with advanced digital cash management, payment, and reporting capabilities, including: a) Enhanced fraud prevention and payment security tools that help safeguard accounts and transactions $3.0 Billion b) Expanded FDIC insurance coverage through IntraFi's CDARS® and ICS® programs, enabling customers to protect larger deposit balances while maintaining a single banking relationship ▪ ▪ Diverse local deposit franchise of retail, business, and municipal accounts $1.3 billion or 35.0% of total deposits exceed the FDIC limit of $250,000, as of September 30, 2026. Balance % of Total Transaction $1,873,071 1,149,821 286,788 51.0% 31.3% 7.8% ▪ ChoiceOne continues to be proactive in managing its liquidity position at September 30, 2026. Total available borrowing capacity secured by pledged assets was $1.2 billion. ChoiceOne can increase its capacity by utilizing unsecured federal fund lines and pledging additional assets. MMDAs & Savings Retail CDs (≤ $250K) Jumbo CDs (> $250K) Brokered Deposits Total Deposits 294,614 67,475 8.0% 1.9% $3,671,769 100.0% 13 Source: Numbers based on ChoiceOne internal data as of 9/30/2026 except where specifically identified Note: All dollars in thousands (1) Saving accounts include MMDAs
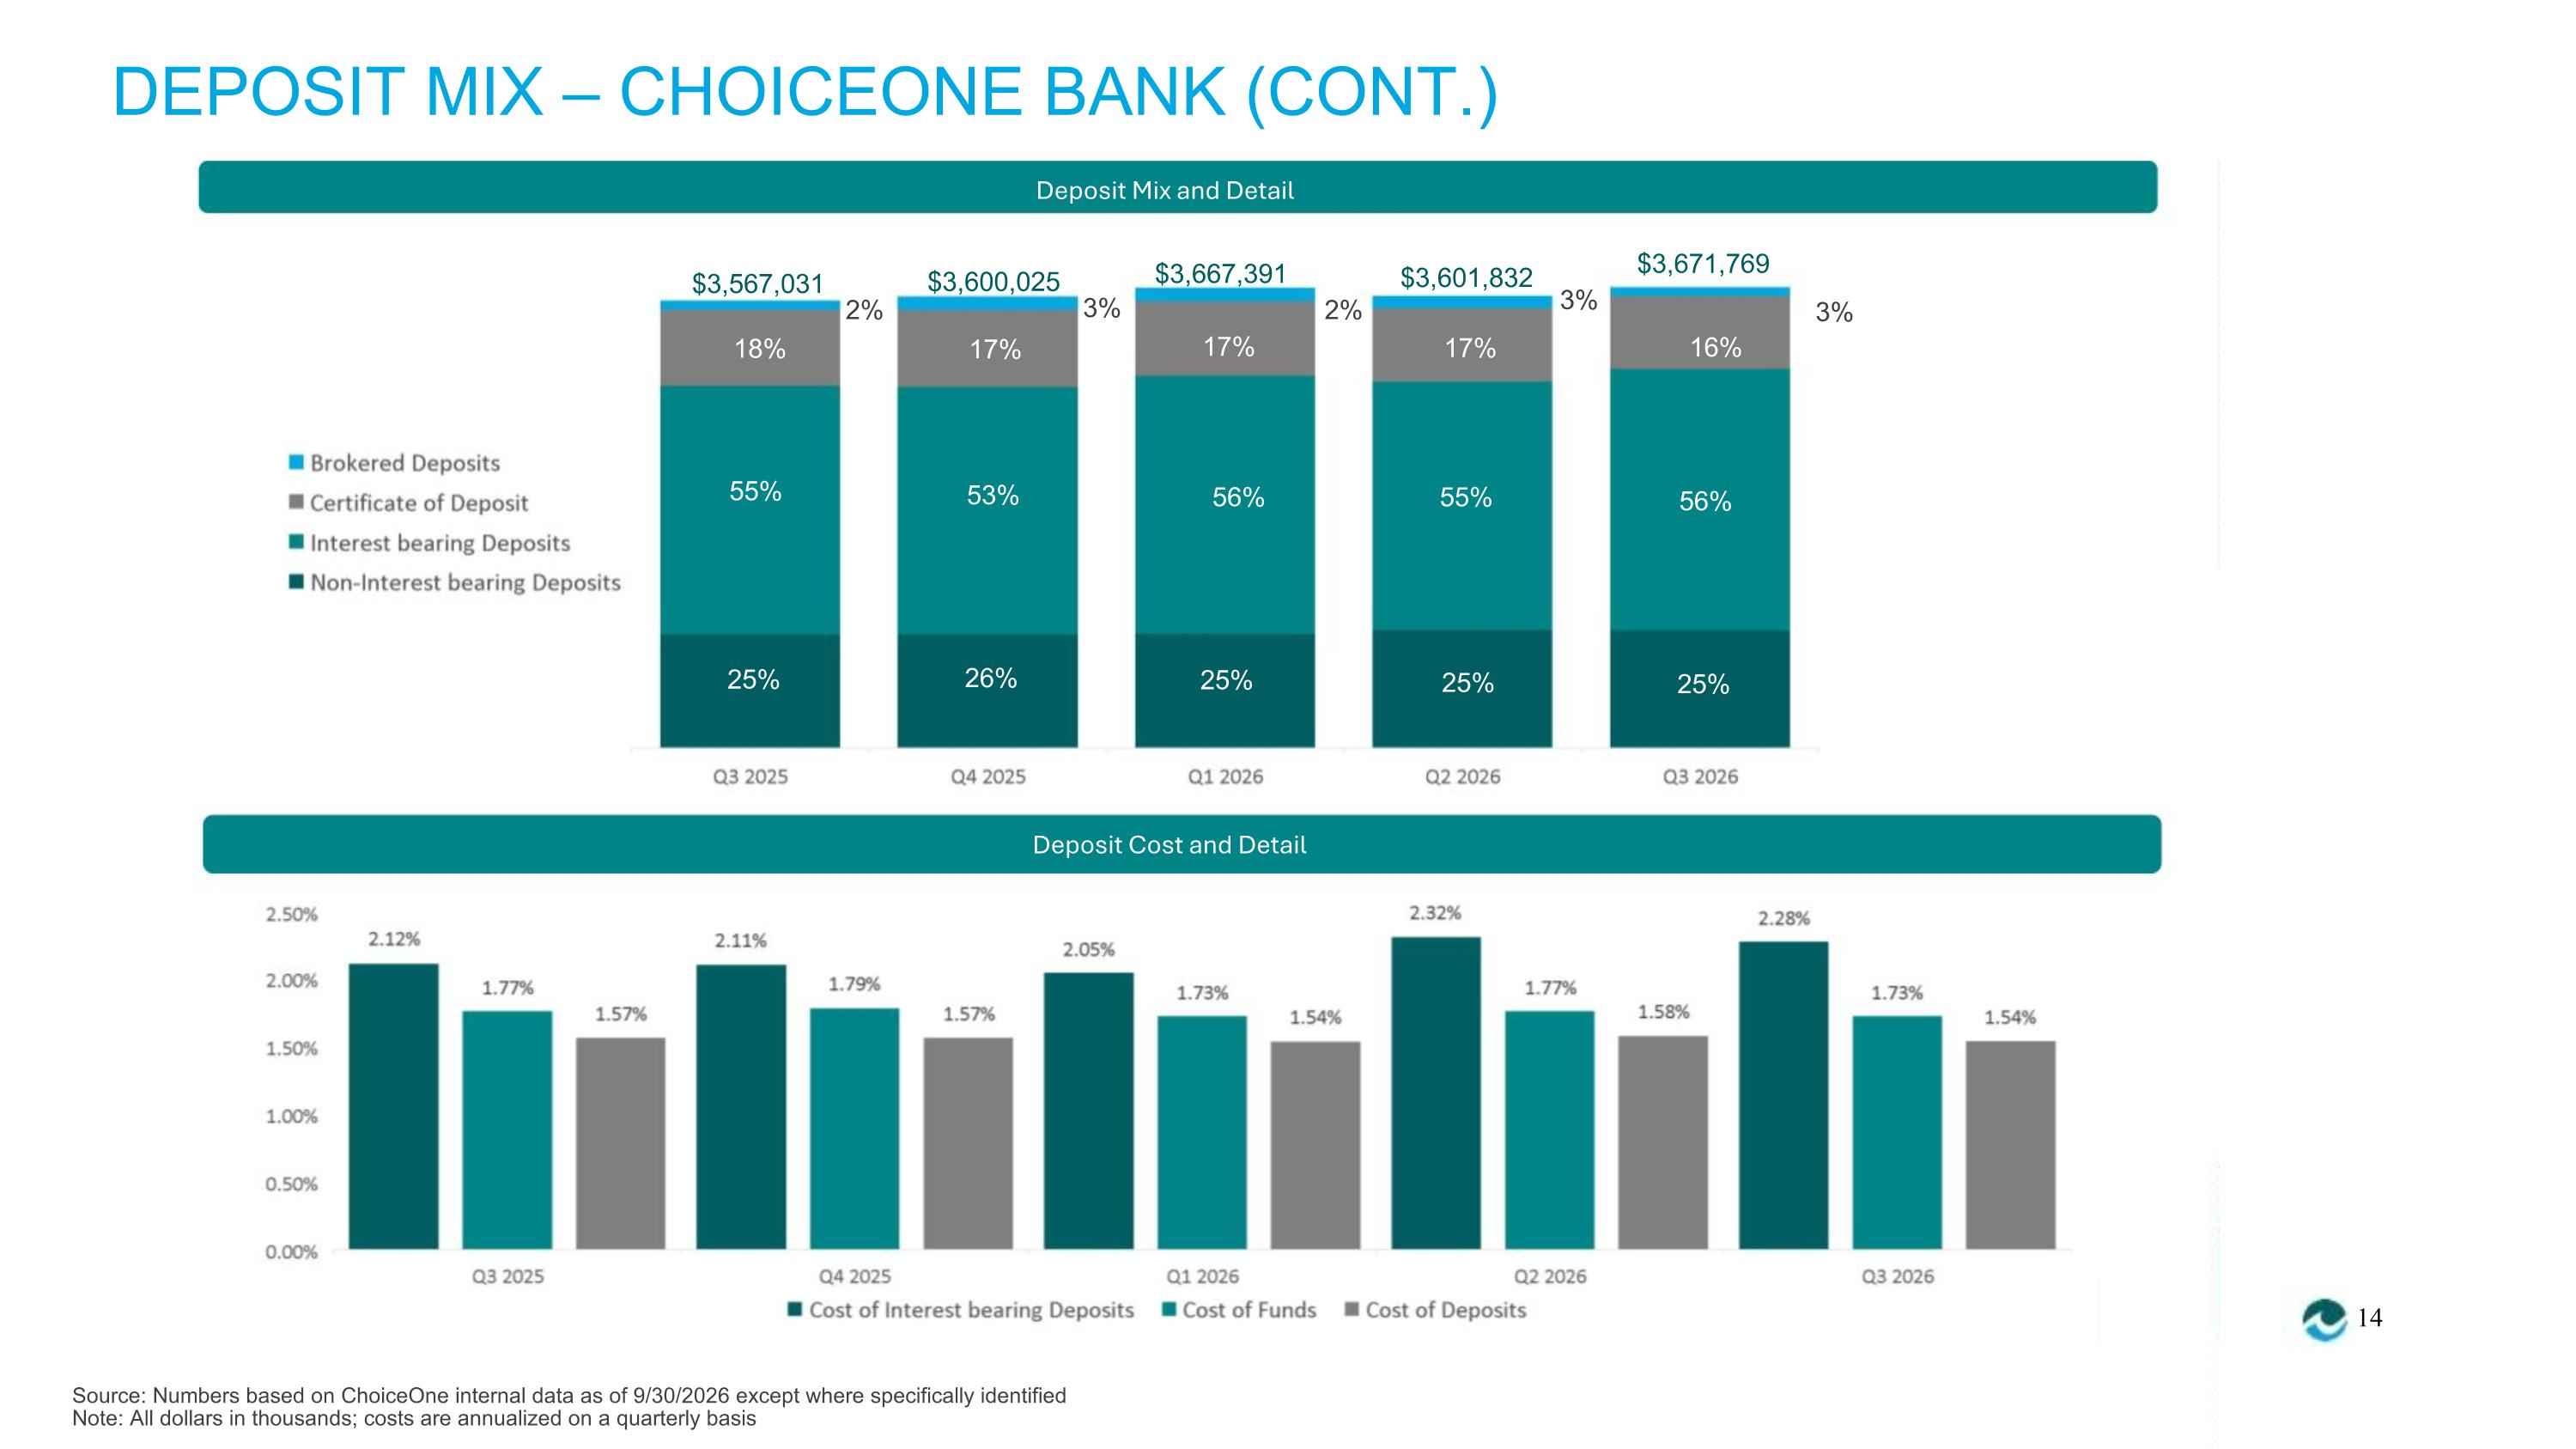
DEPOSIT MIX – CHOICEONE BANK (CONT.) Deposit Mix and Detail $3,671,769 16% $3,667,391 17% $3,601,832 17% $3,567,031 18% $3,600,025 17% 3% 2% 3% 2% 3% 55% 25% 53% 26% 56% 25% 55% 25% 56% 25% Deposit Cost and Detail 14 Source: Numbers based on ChoiceOne internal data as of 9/30/2026 except where specifically identified Note: All dollars in thousands; costs are annualized on a quarterly basis
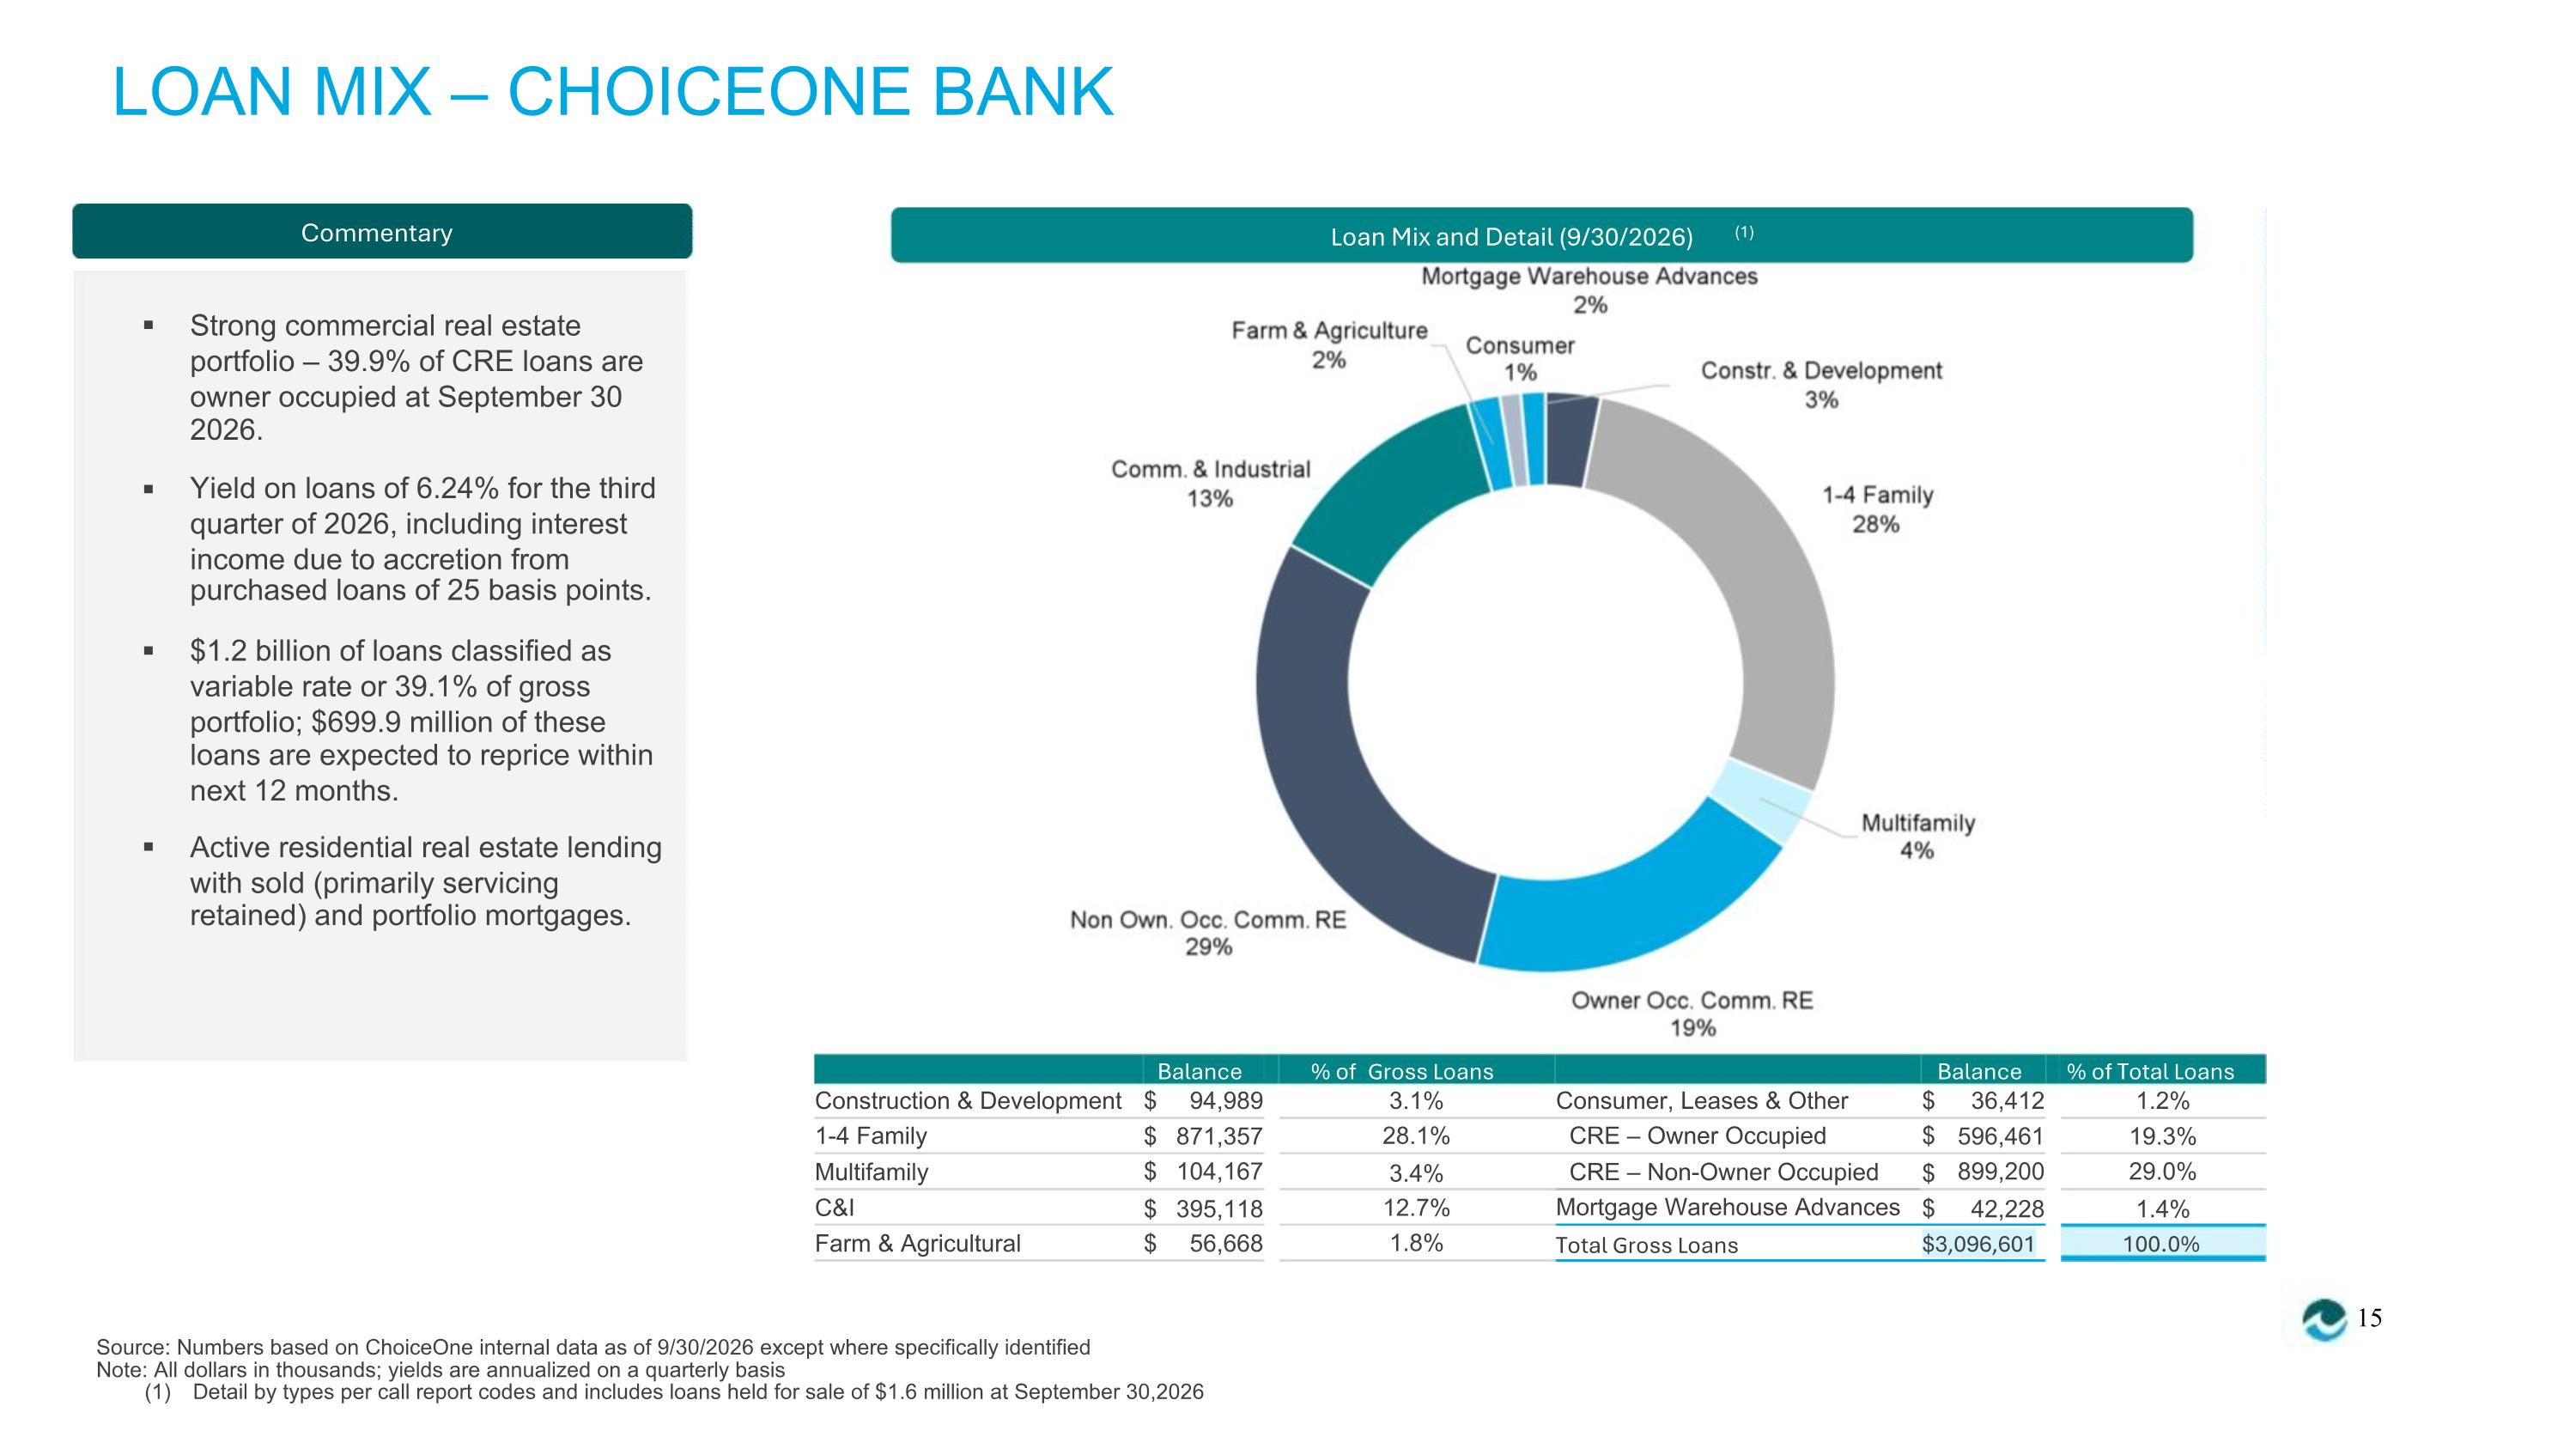
LOAN MIX – CHOICEONE BANK Commentary Loan Mix and Detail (9/30/2026) (1) ▪ ▪ ▪ Strong commercial real estate portfolio – 39.9% of CRE loans are owner occupied at September 30 2026. Yield on loans of 6.24% for the third quarter of 2026, including interest income due to accretion from purchased loans of 25 basis points. $1.2 billion of loans classified as variable rate or 39.1% of gross portfolio; $699.9 million of these loans are expected to reprice within next 12 months. ▪ Active residential real estate lending with sold (primarily servicing retained) and portfolio mortgages. Balance % of Gross Loans Balance % of Total Loans Construction & Development 1-4 Family $ 94,989 3.1% 28.1% 3.4% Consumer, Leases & Other CRE – Owner Occupied $ $ $ $ 36,412 1.2% $ 871,357 $ 104,167 $ 395,118 596,461 899,200 42,228 19.3% 29.0% 1.4% Multifamily CRE – Non-Owner Occupied Mortgage Warehouse Advances Total Gross Loans C&I 12.7% 1.8% Farm & Agricultural $ 56,668 $3,096,601 100.0% 15 Source: Numbers based on ChoiceOne internal data as of 9/30/2026 except where specifically identified Note: All dollars in thousands; yields are annualized on a quarterly basis (1) Detail by types per call report codes and includes loans held for sale of $1.6 million at September 30,2026
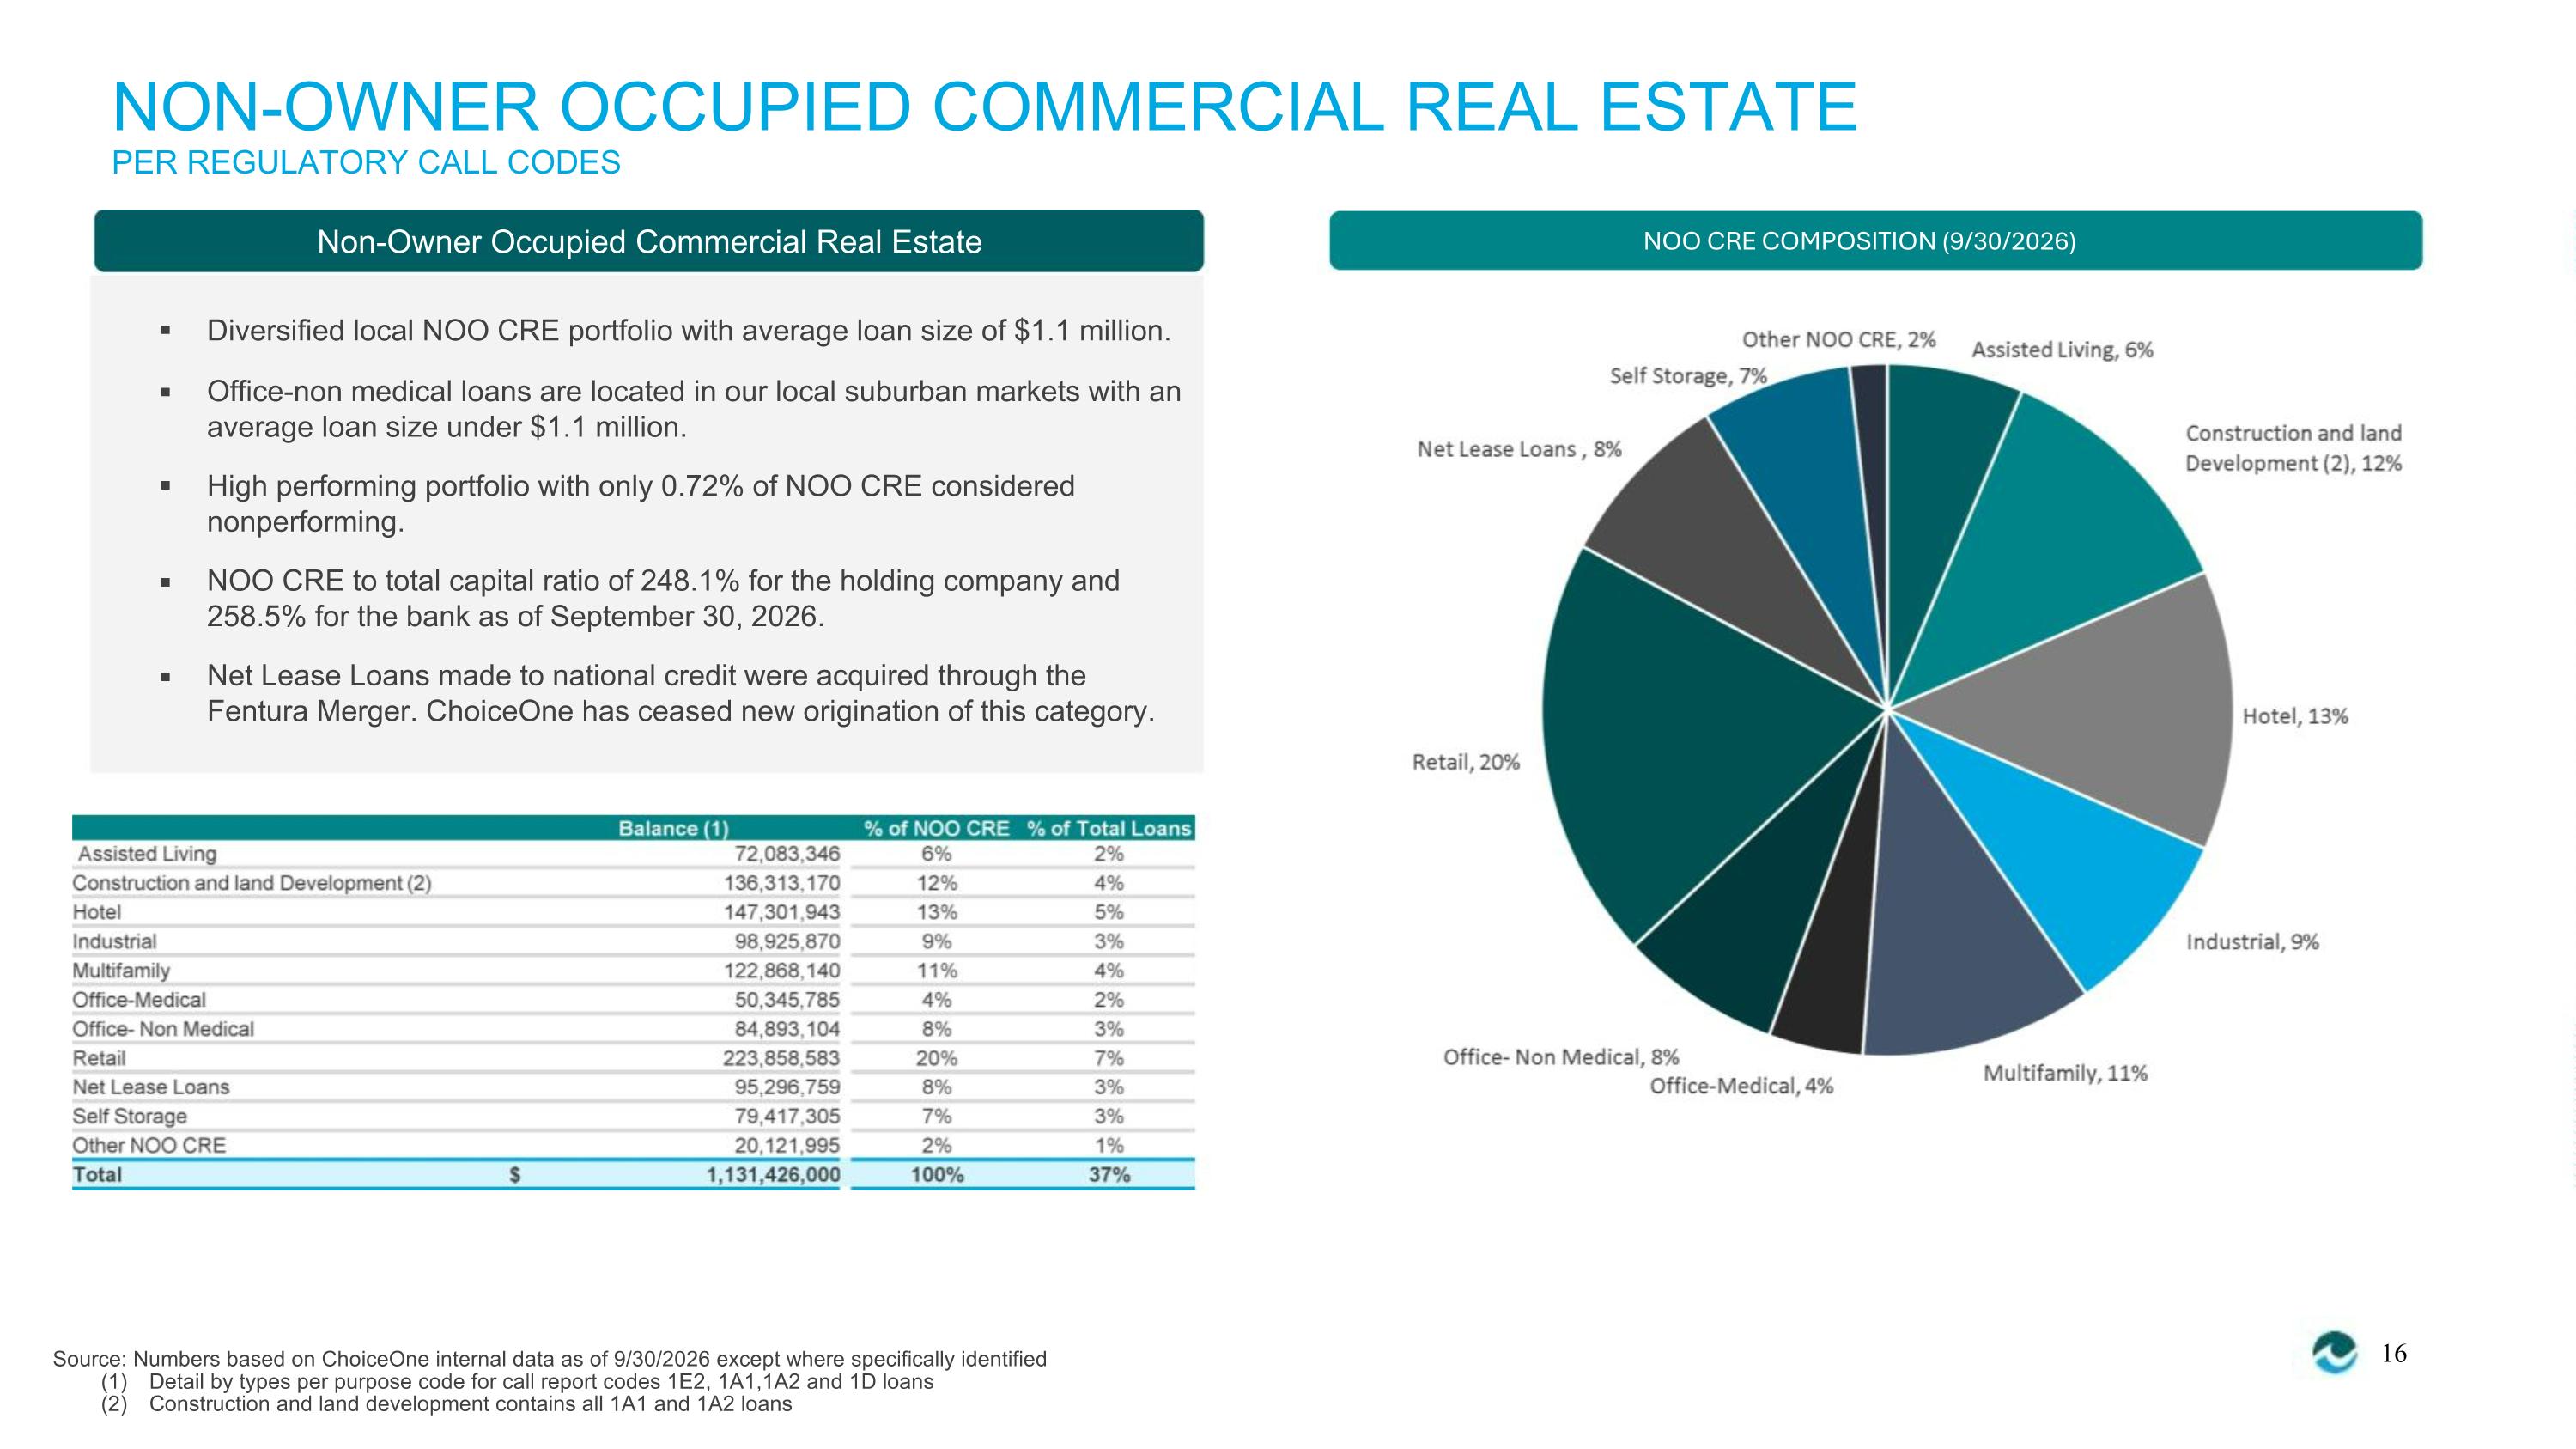
NON-OWNER OCCUPIED COMMERCIAL REAL ESTATE PER REGULATORY CALL CODES Non-Owner Occupied Commercial Real Estate NOO CRE COMPOSITION (9/30/2026) ▪ ▪ Diversified local NOO CRE portfolio with average loan size of $1.1 million. Office-non medical loans are located in our local suburban markets with an average loan size under $1.1 million. ▪ ▪ ▪ High performing portfolio with only 0.72% of NOO CRE considered nonperforming. NOO CRE to total capital ratio of 248.1% for the holding company and 258.5% for the bank as of September 30, 2026. Net Lease Loans made to national credit were acquired through the Fentura Merger. ChoiceOne has ceased new origination of this category. 16 Source: Numbers based on ChoiceOne internal data as of 9/30/2026 except where specifically identified (1) Detail by types per purpose code for call report codes 1E2, 1A1,1A2 and 1D loans (2) Construction and land development contains all 1A1 and 1A2 loans
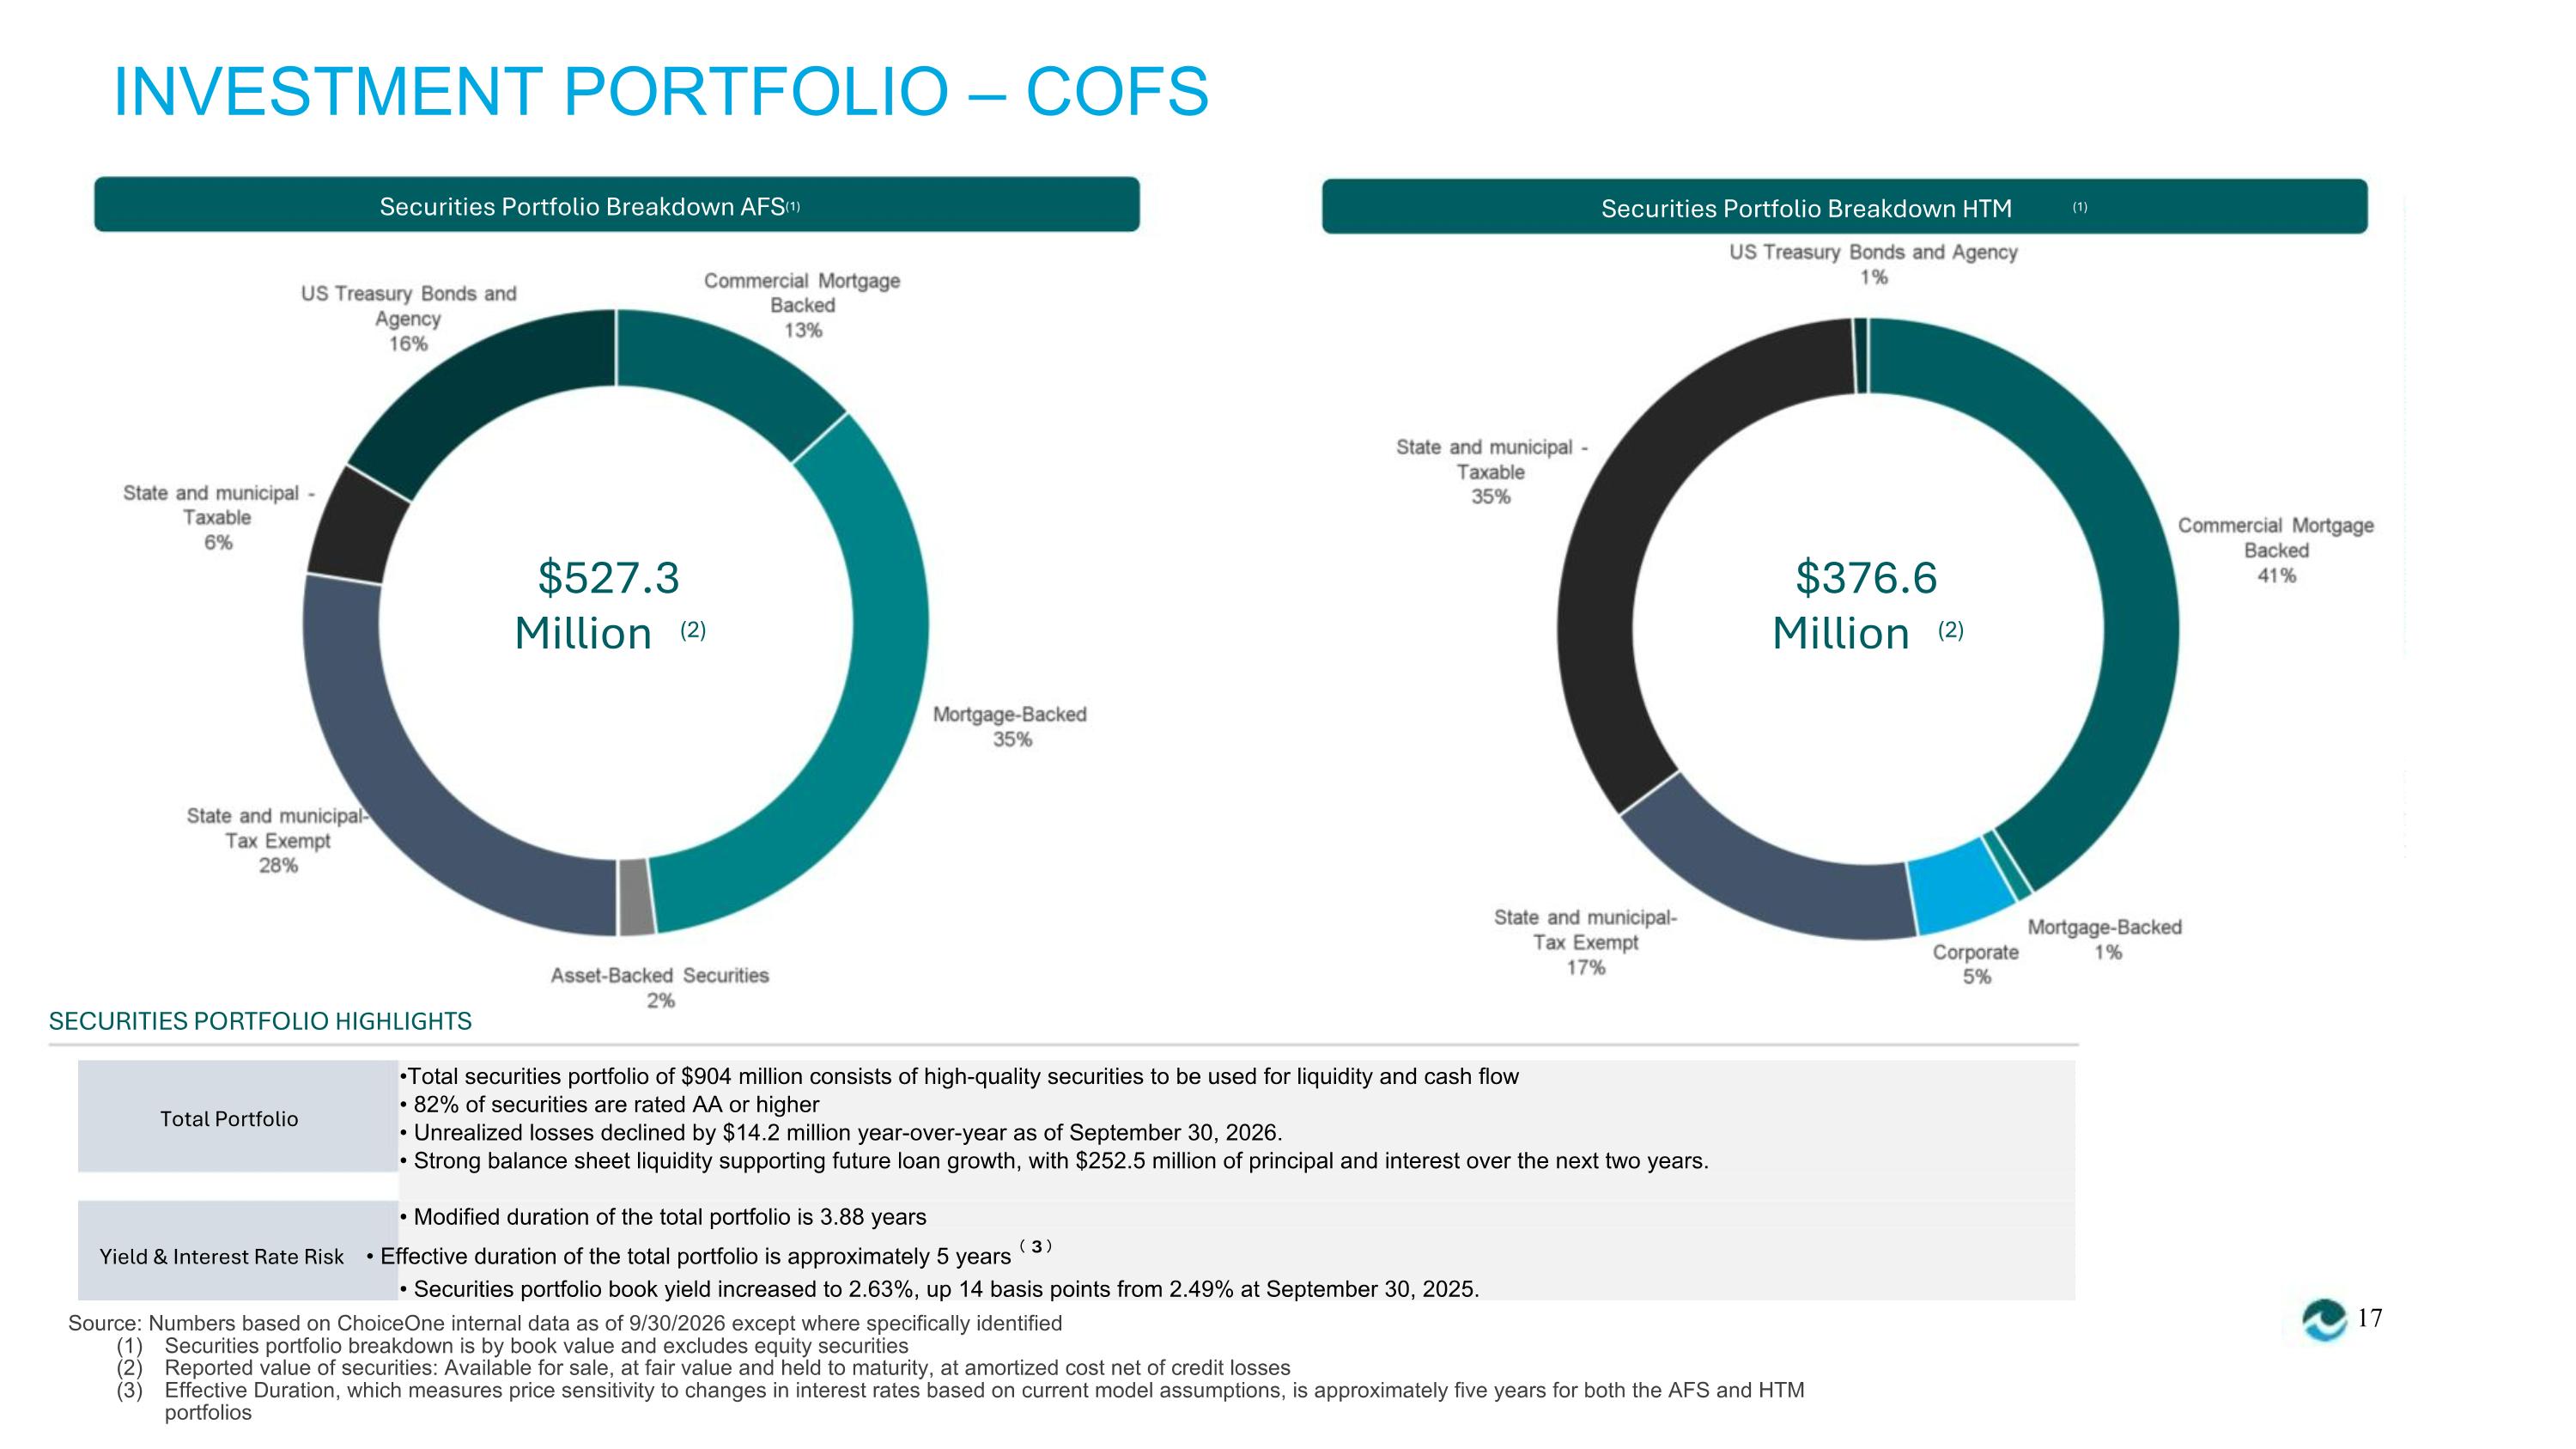
INVESTMENT PORTFOLIO – COFS Securities Portfolio Breakdown AFS(1) Securities Portfolio Breakdown HTM (1) $527.3 $376.6 Million Million (2) (2) SECURITIES PORTFOLIO HIGHLIGHTS •Total securities portfolio of $904 million consists of high-quality securities to be used for liquidity and cash flow • 82% of securities are rated AA or higher • Unrealized losses declined by $14.2 million year-over-year as of September 30, 2026. Total Portfolio • Strong balance sheet liquidity supporting future loan growth, with $252.5 million of principal and interest over the next two years. • Modified duration of the total portfolio is 3.88 years Yield & Interest Rate Risk • Effective duration of the total portfolio is approximately 5 years ⁽³⁾ • Securities portfolio book yield increased to 2.63%, up 14 basis points from 2.49% at September 30, 2025. 17 Source: Numbers based on ChoiceOne internal data as of 9/30/2026 except where specifically identified (1) Securities portfolio breakdown is by book value and excludes equity securities (2) Reported value of securities: Available for sale, at fair value and held to maturity, at amortized cost net of credit losses (3) Effective Duration, which measures price sensitivity to changes in interest rates based on current model assumptions, is approximately five years for both the AFS and HTM portfolios
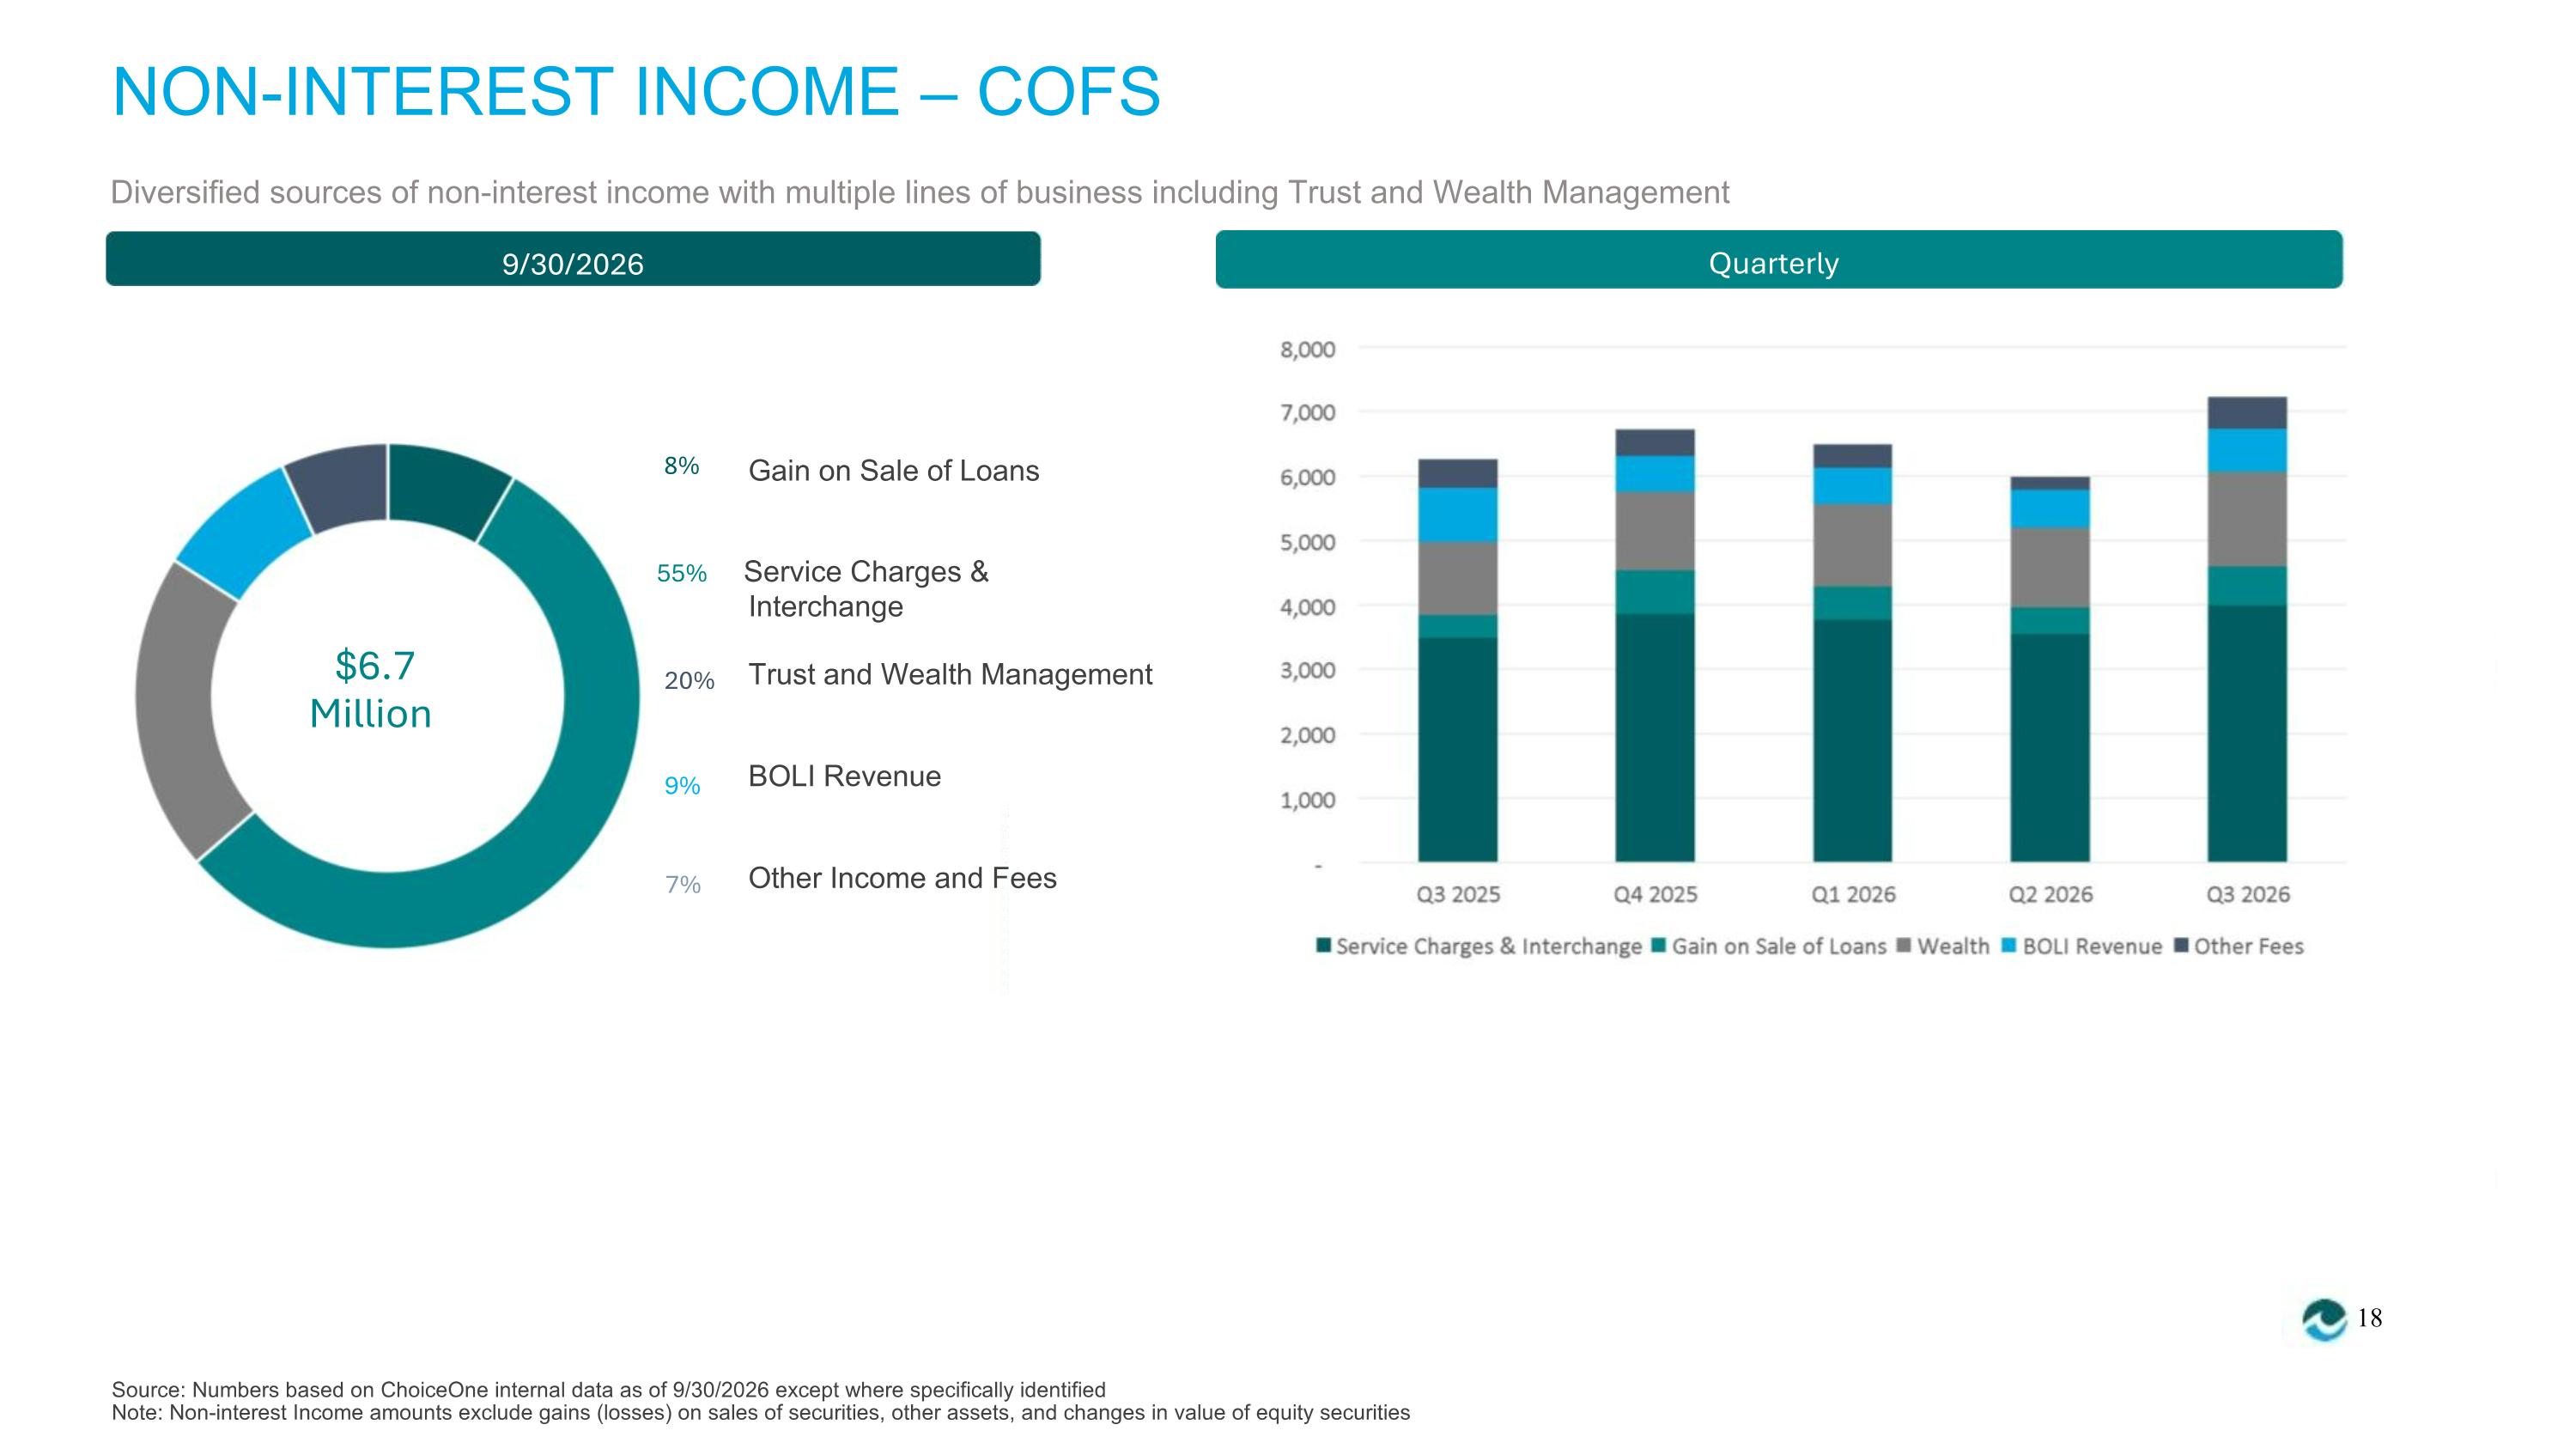
NON-INTEREST INCOME – COFS Diversified sources of non-interest income with multiple lines of business including Trust and Wealth Management 9/30/2026 Quarterly 8% Gain on Sale of Loans 55% Service Charges & Interchange $6.7 Million Trust and Wealth Management 20% 9% BOLI Revenue Other Income and Fees 7% 18 Source: Numbers based on ChoiceOne internal data as of 9/30/2026 except where specifically identified Note: Non-interest Income amounts exclude gains (losses) on sales of securities, other assets, and changes in value of equity securities
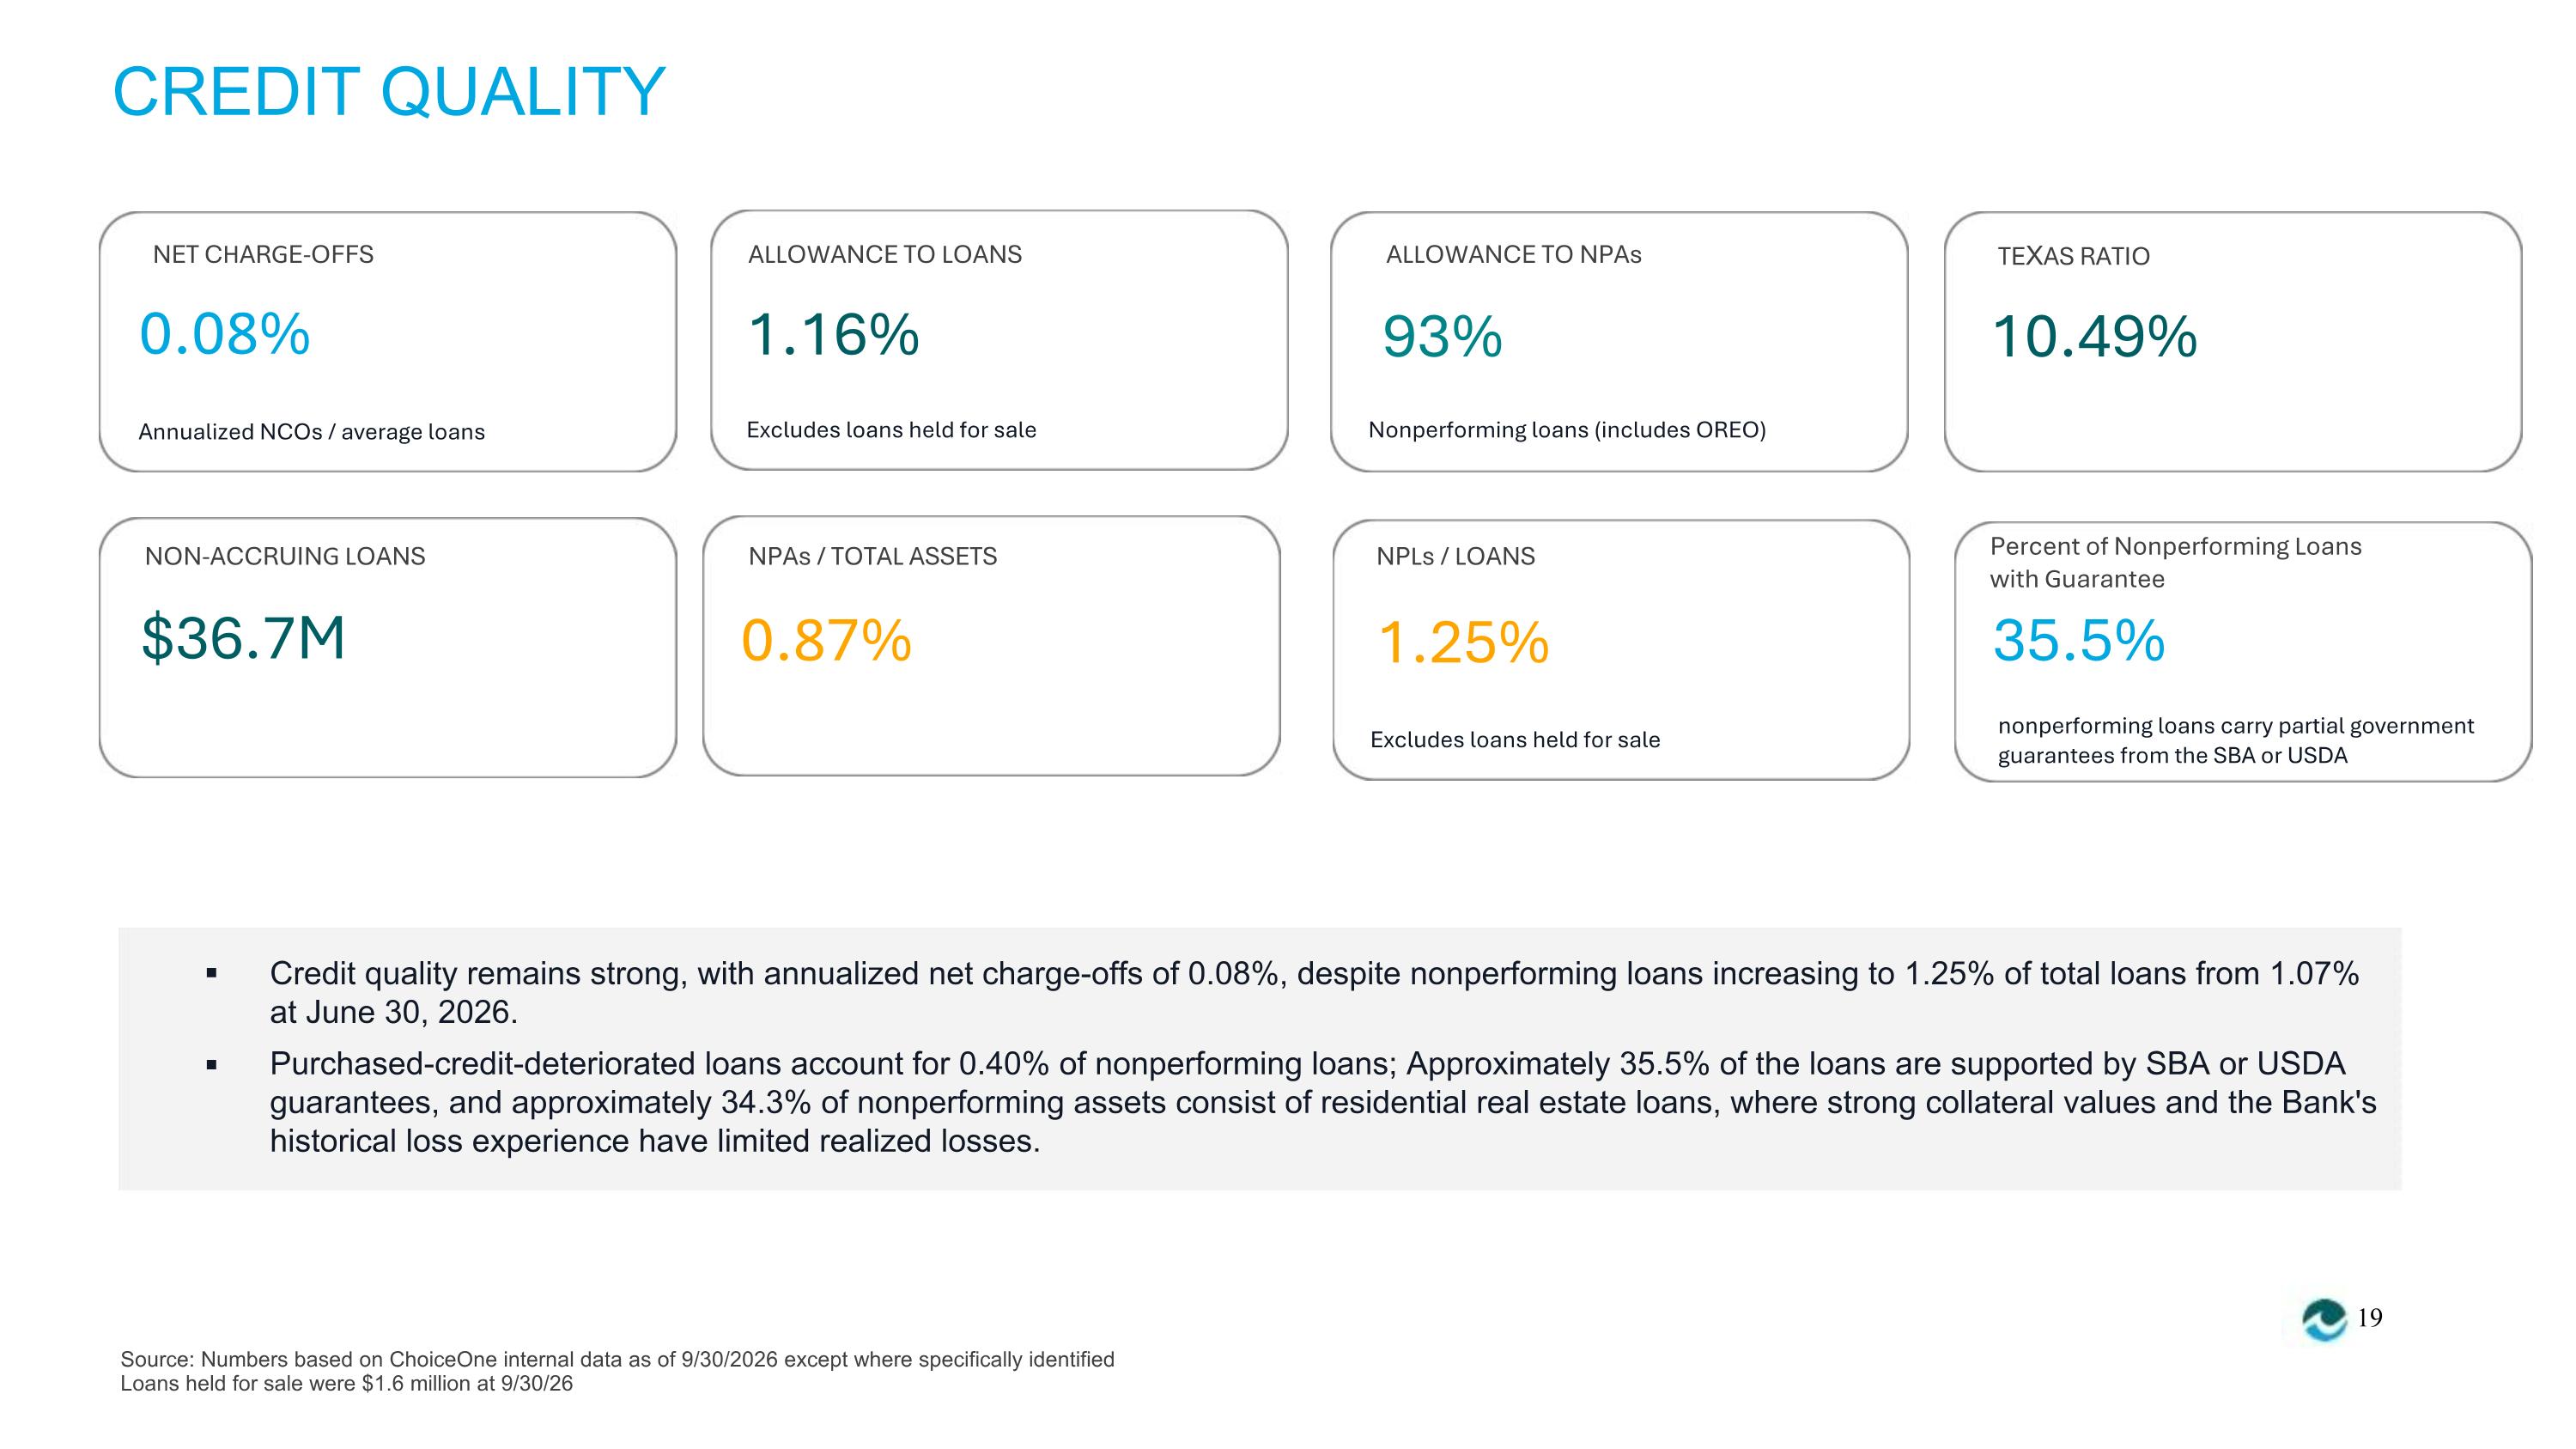
CREDIT QUALITY NET CHARGE-OFFS 0.08% ALLOWANCE TO LOANS ALLOWANCE TO NPAs TEXAS RATIO 1.16% 93% 10.49% Annualized NCOs / average loans Excludes loans held for sale Nonperforming loans (includes OREO) Percent of Nonperforming Loans with Guarantee NON-ACCRUING LOANS NPAs / TOTAL ASSETS NPLs / LOANS $36.7M 0.87% 1.25% 35.5% nonperforming loans carry partial government guarantees from the SBA or USDA Excludes loans held for sale ▪ ▪ Credit quality remains strong, with annualized net charge-offs of 0.08%, despite nonperforming loans increasing to 1.25% of total loans from 1.07% at June 30, 2026. Purchased-credit-deteriorated loans account for 0.40% of nonperforming loans; Approximately 35.5% of the loans are supported by SBA or USDA guarantees, and approximately 34.3% of nonperforming assets consist of residential real estate loans, where strong collateral values and the Bank's historical loss experience have limited realized losses. 19 Source: Numbers based on ChoiceOne internal data as of 9/30/2026 except where specifically identified Loans held for sale were $1.6 million at 9/30/26
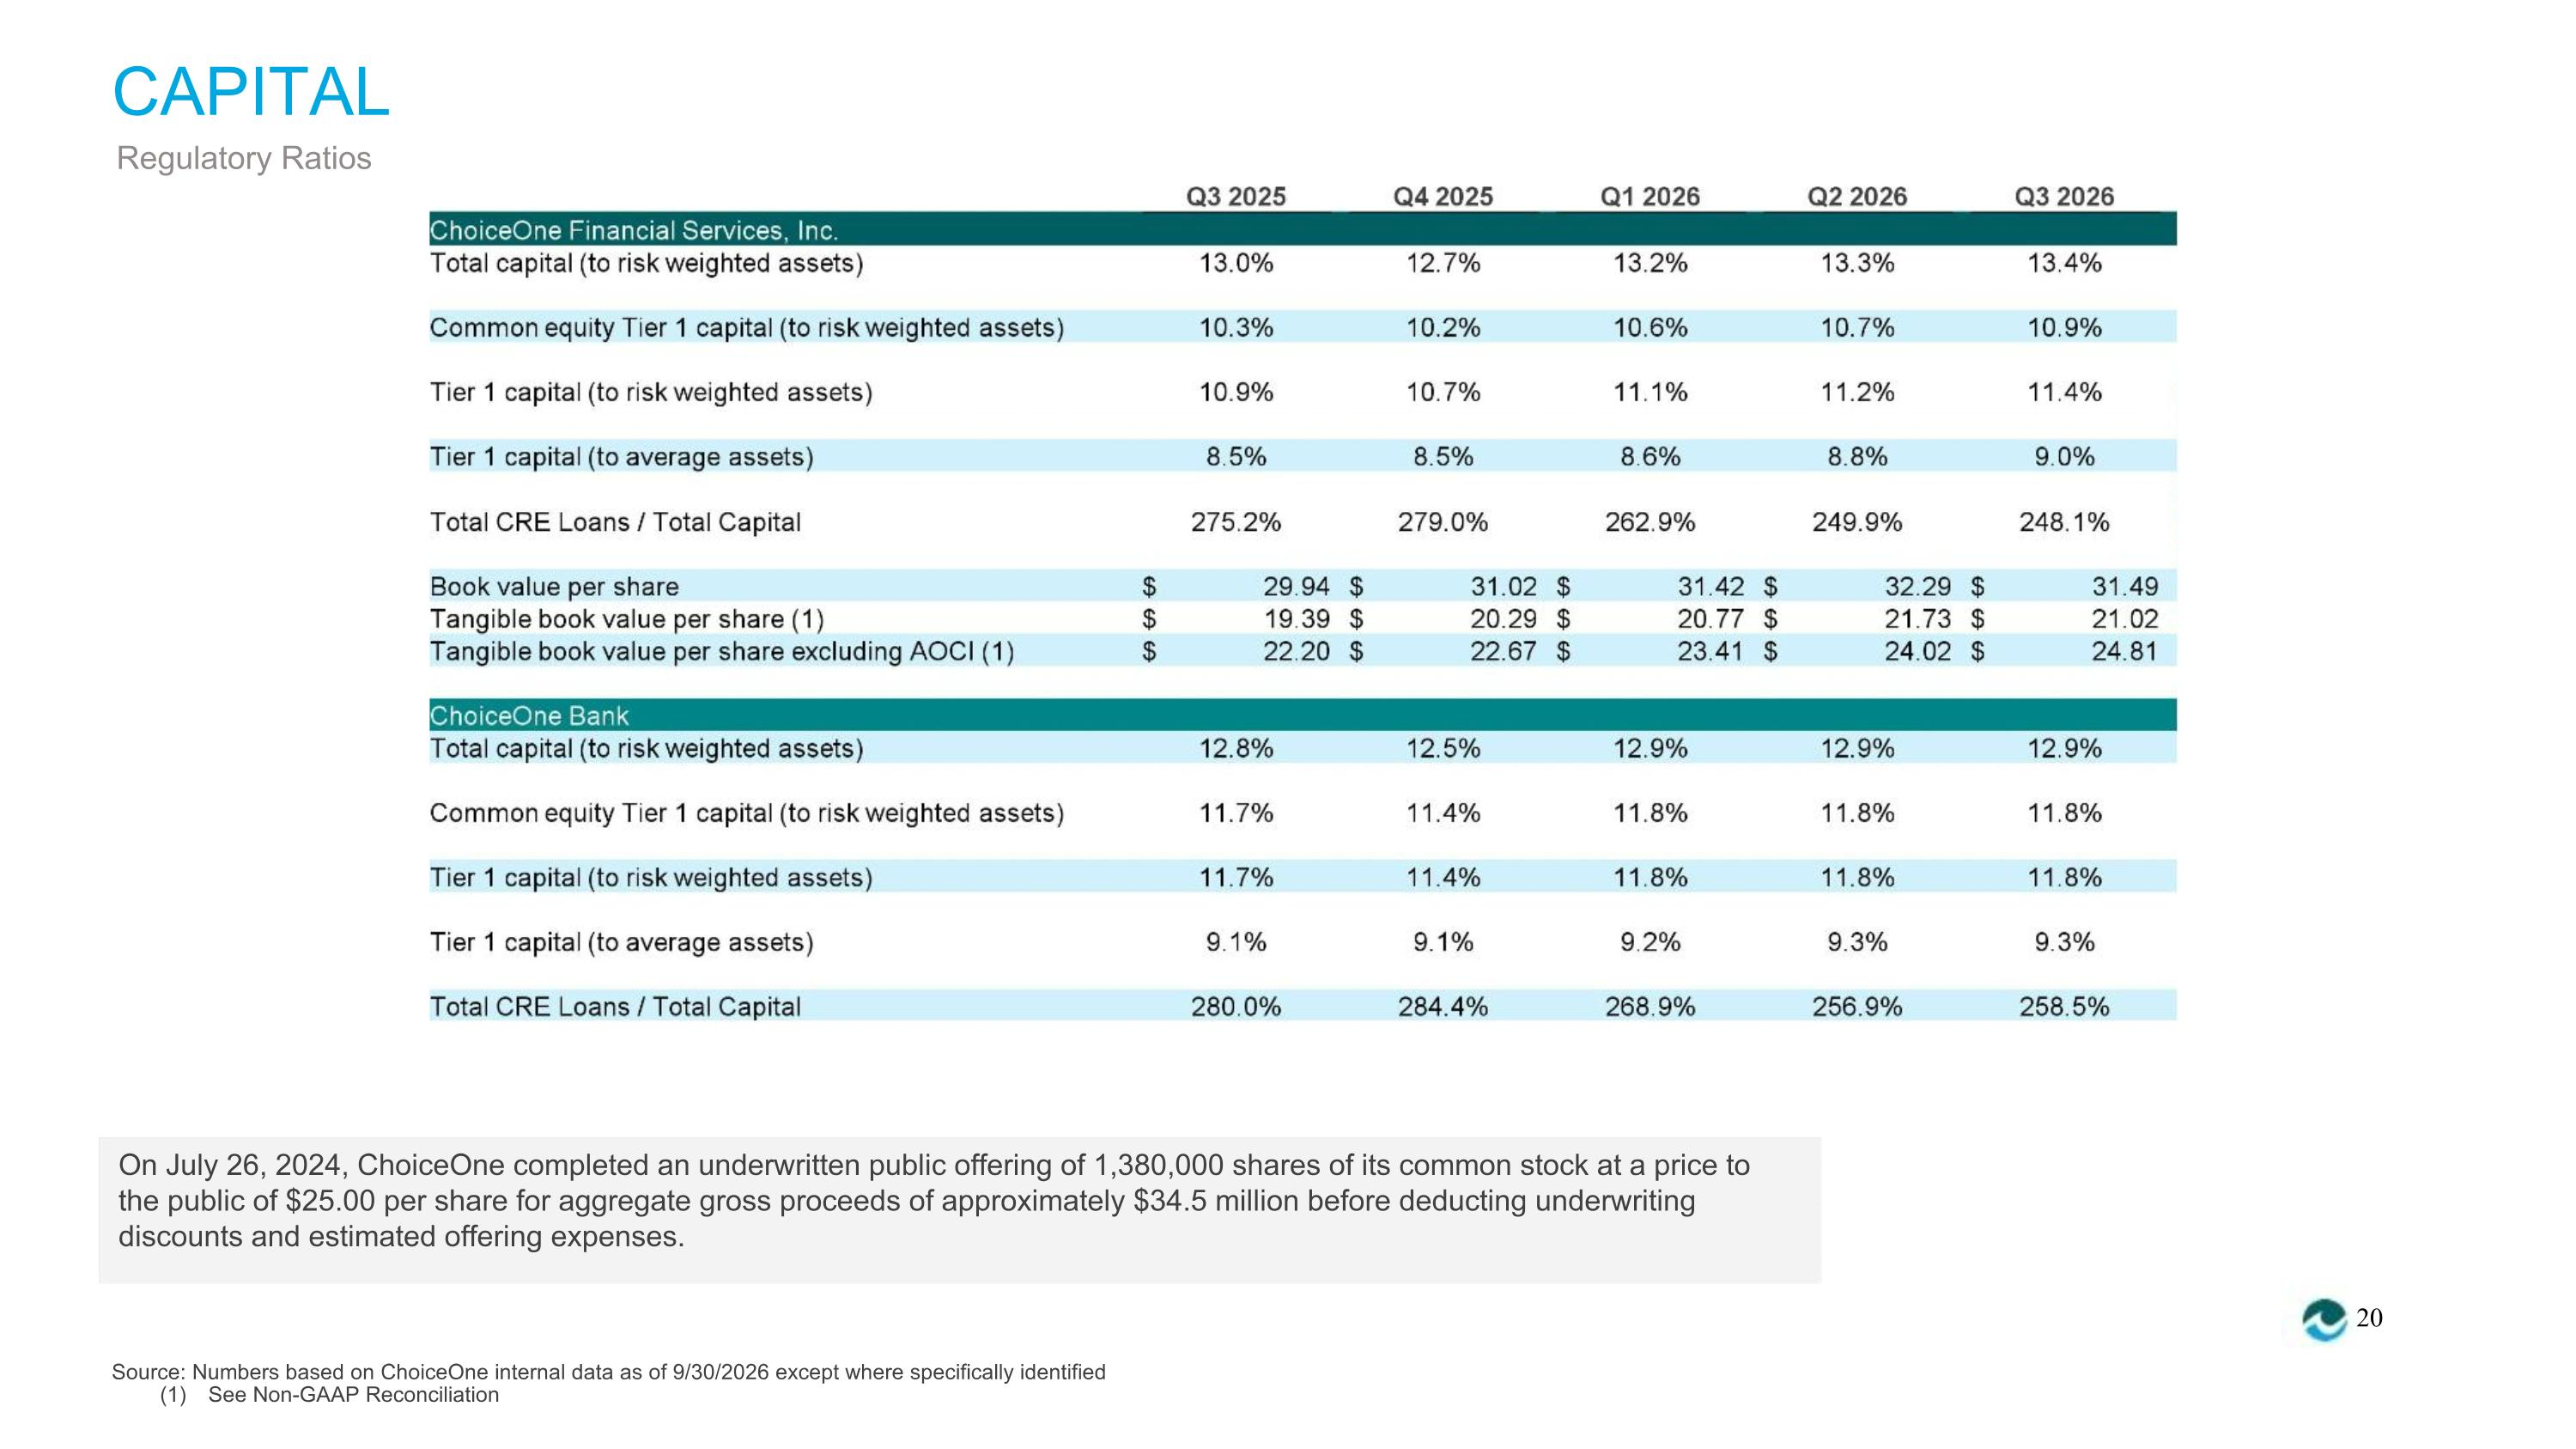
CAPITAL Regulatory Ratios On July 26, 2024, ChoiceOne completed an underwritten public offering of 1,380,000 shares of its common stock at a price to the public of $25.00 per share for aggregate gross proceeds of approximately $34.5 million before deducting underwriting discounts and estimated offering expenses. 20 Source: Numbers based on ChoiceOne internal data as of 9/30/2026 except where specifically identified (1) See Non-GAAP Reconciliation

COFS TRADES ON NASDAQ® ChoiceOne trades on the NASDAQ Stock Exchange under its symbol, “COFS” Analyst Coverage of ChoiceOne Market Makers in ChoiceOne Brean Capital, LLC Daniel Cardenas dcardenas@breancapital.com Brean Capital, LLC Nick Bicking 614.634.4584 D. A. Davidson & Co. Jeff Rulis jrulis@dadco.com Raymond James & Associates Anthony LanFranca 312.655.2961 HOVDE Group Brendan Nosal bnosal@hovdegroup.com Brean Capital, LLC Eugene Bodo 212.655.1114 Stock Registrar & Transfer Agent Continental Stock Transfer & Trust Company 1 State Street Plaza, 30th Floor New York, NY 10004-1561 212.509.4000
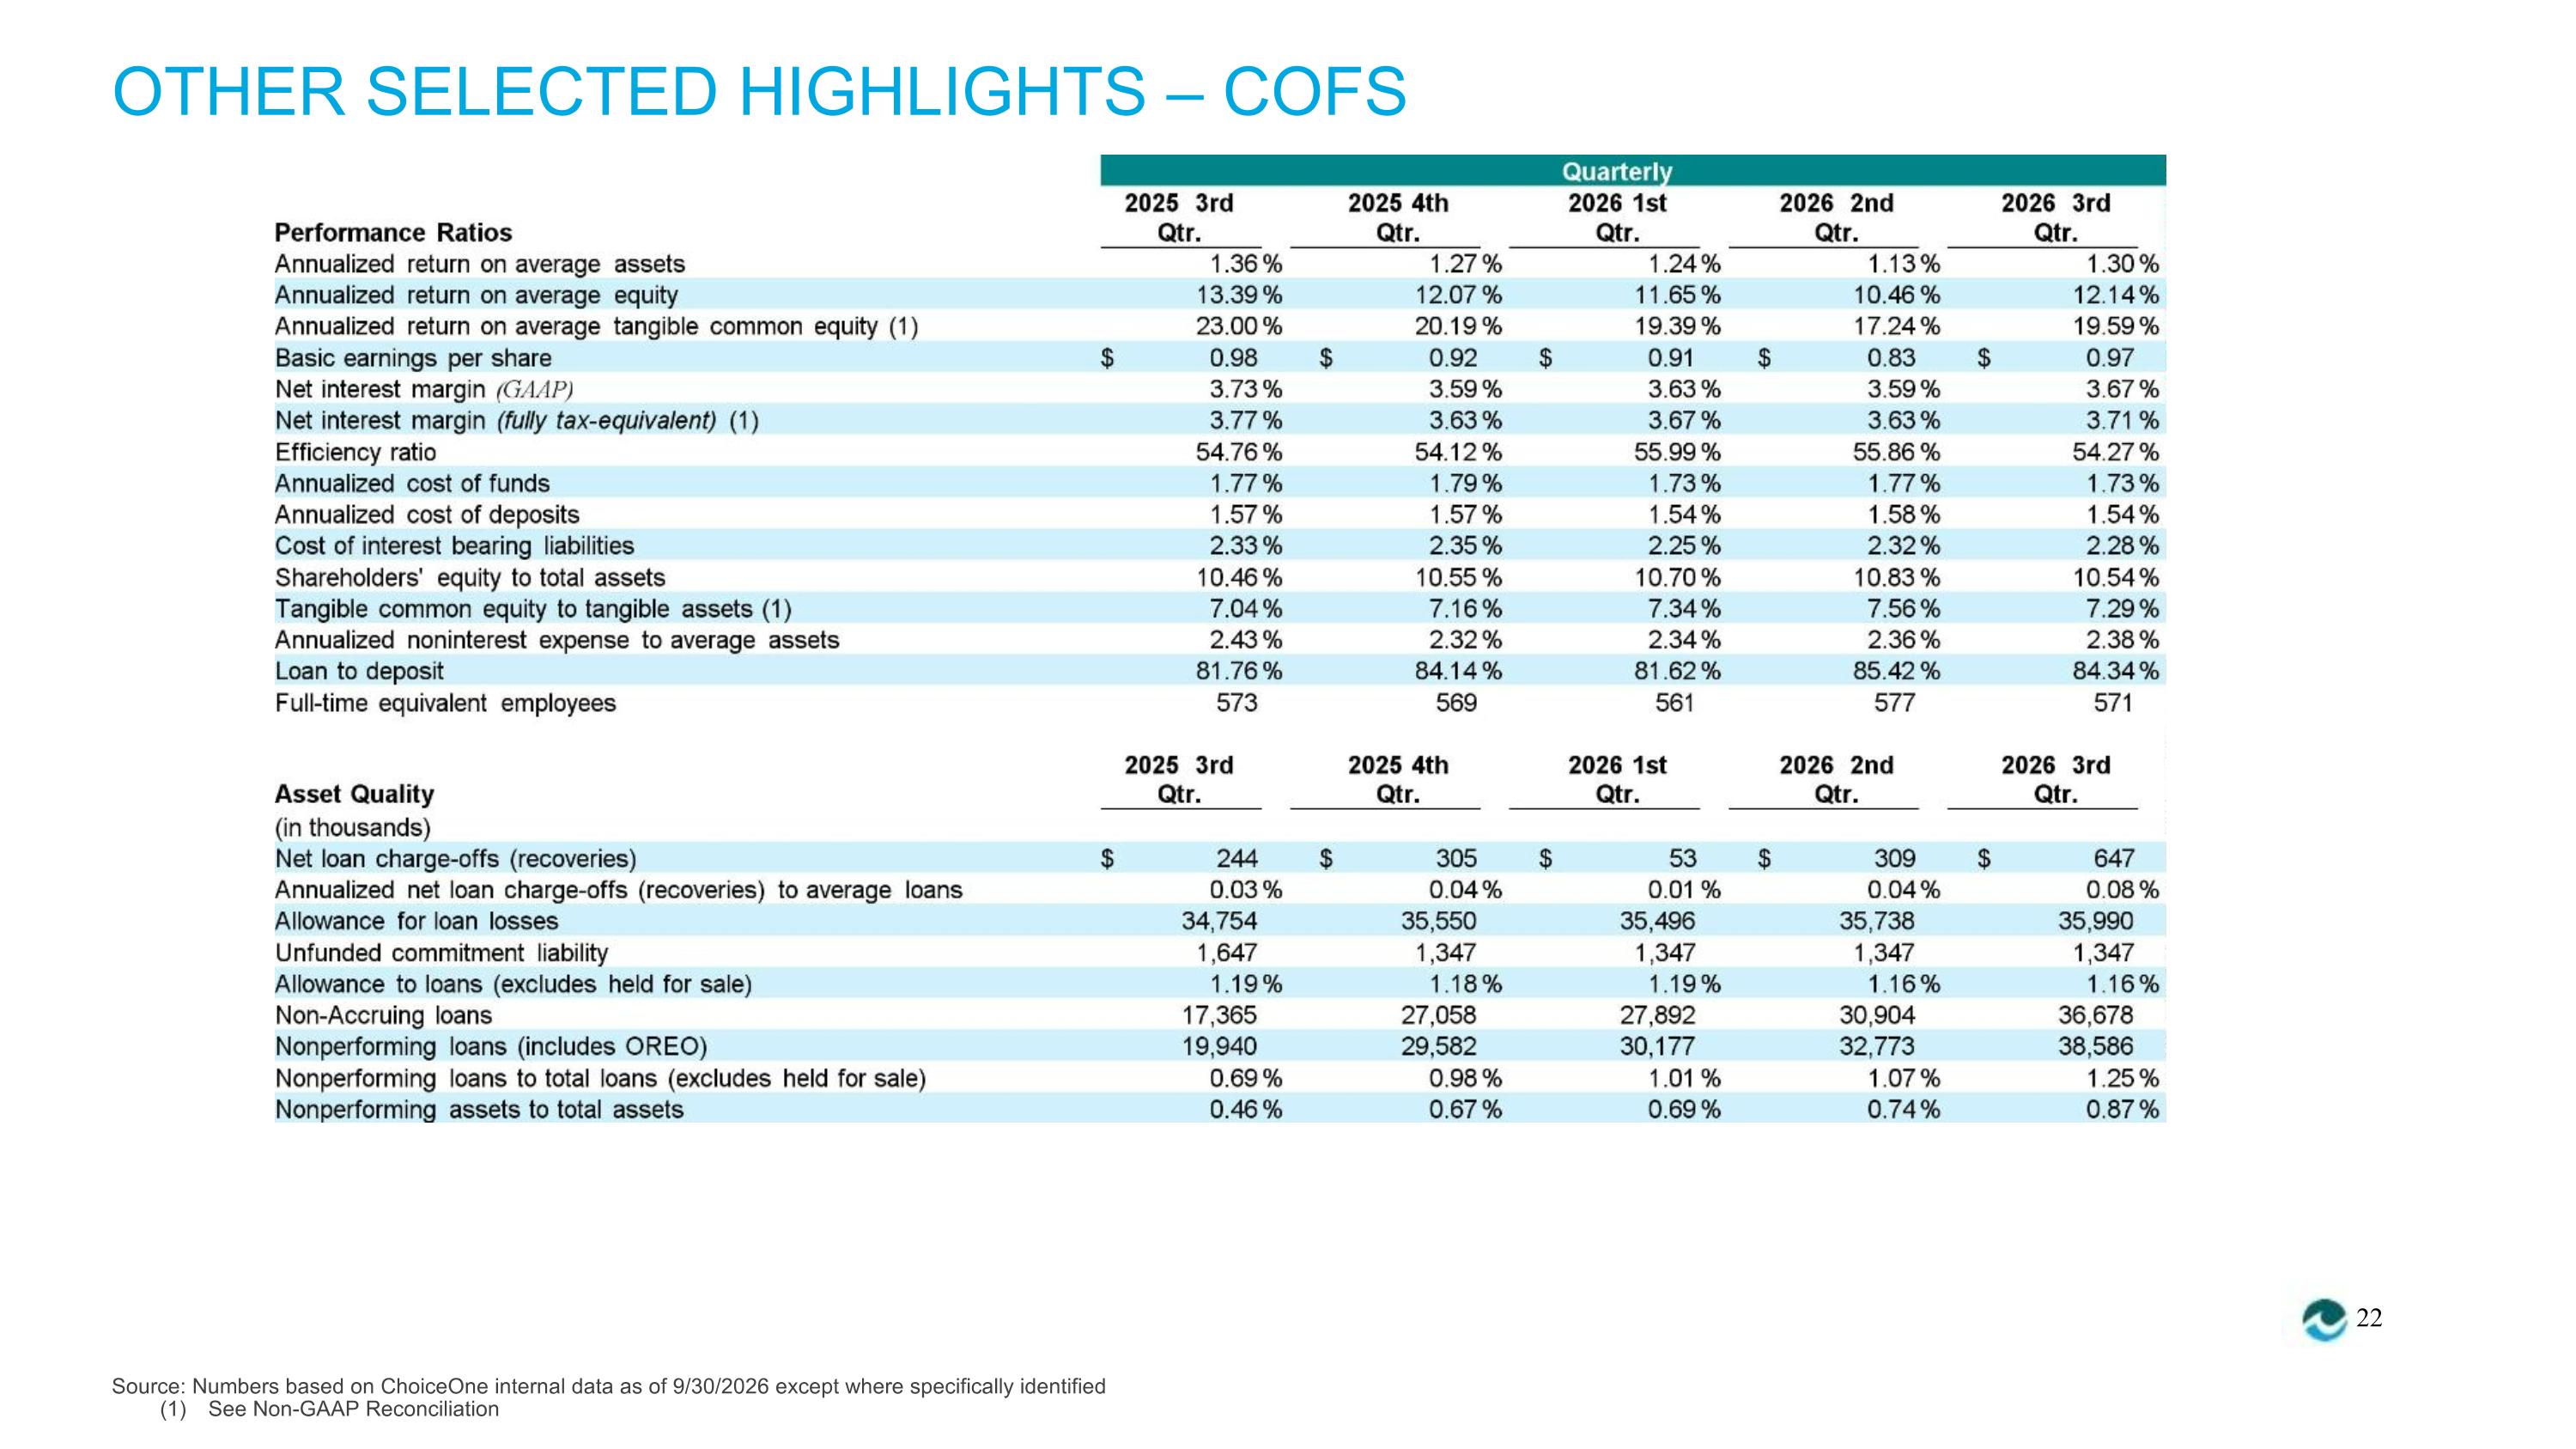
OTHER SELECTED HIGHLIGHTS – COFS 22 Source: Numbers based on ChoiceOne internal data as of 9/30/2026 except where specifically identified (1) See Non-GAAP Reconciliation
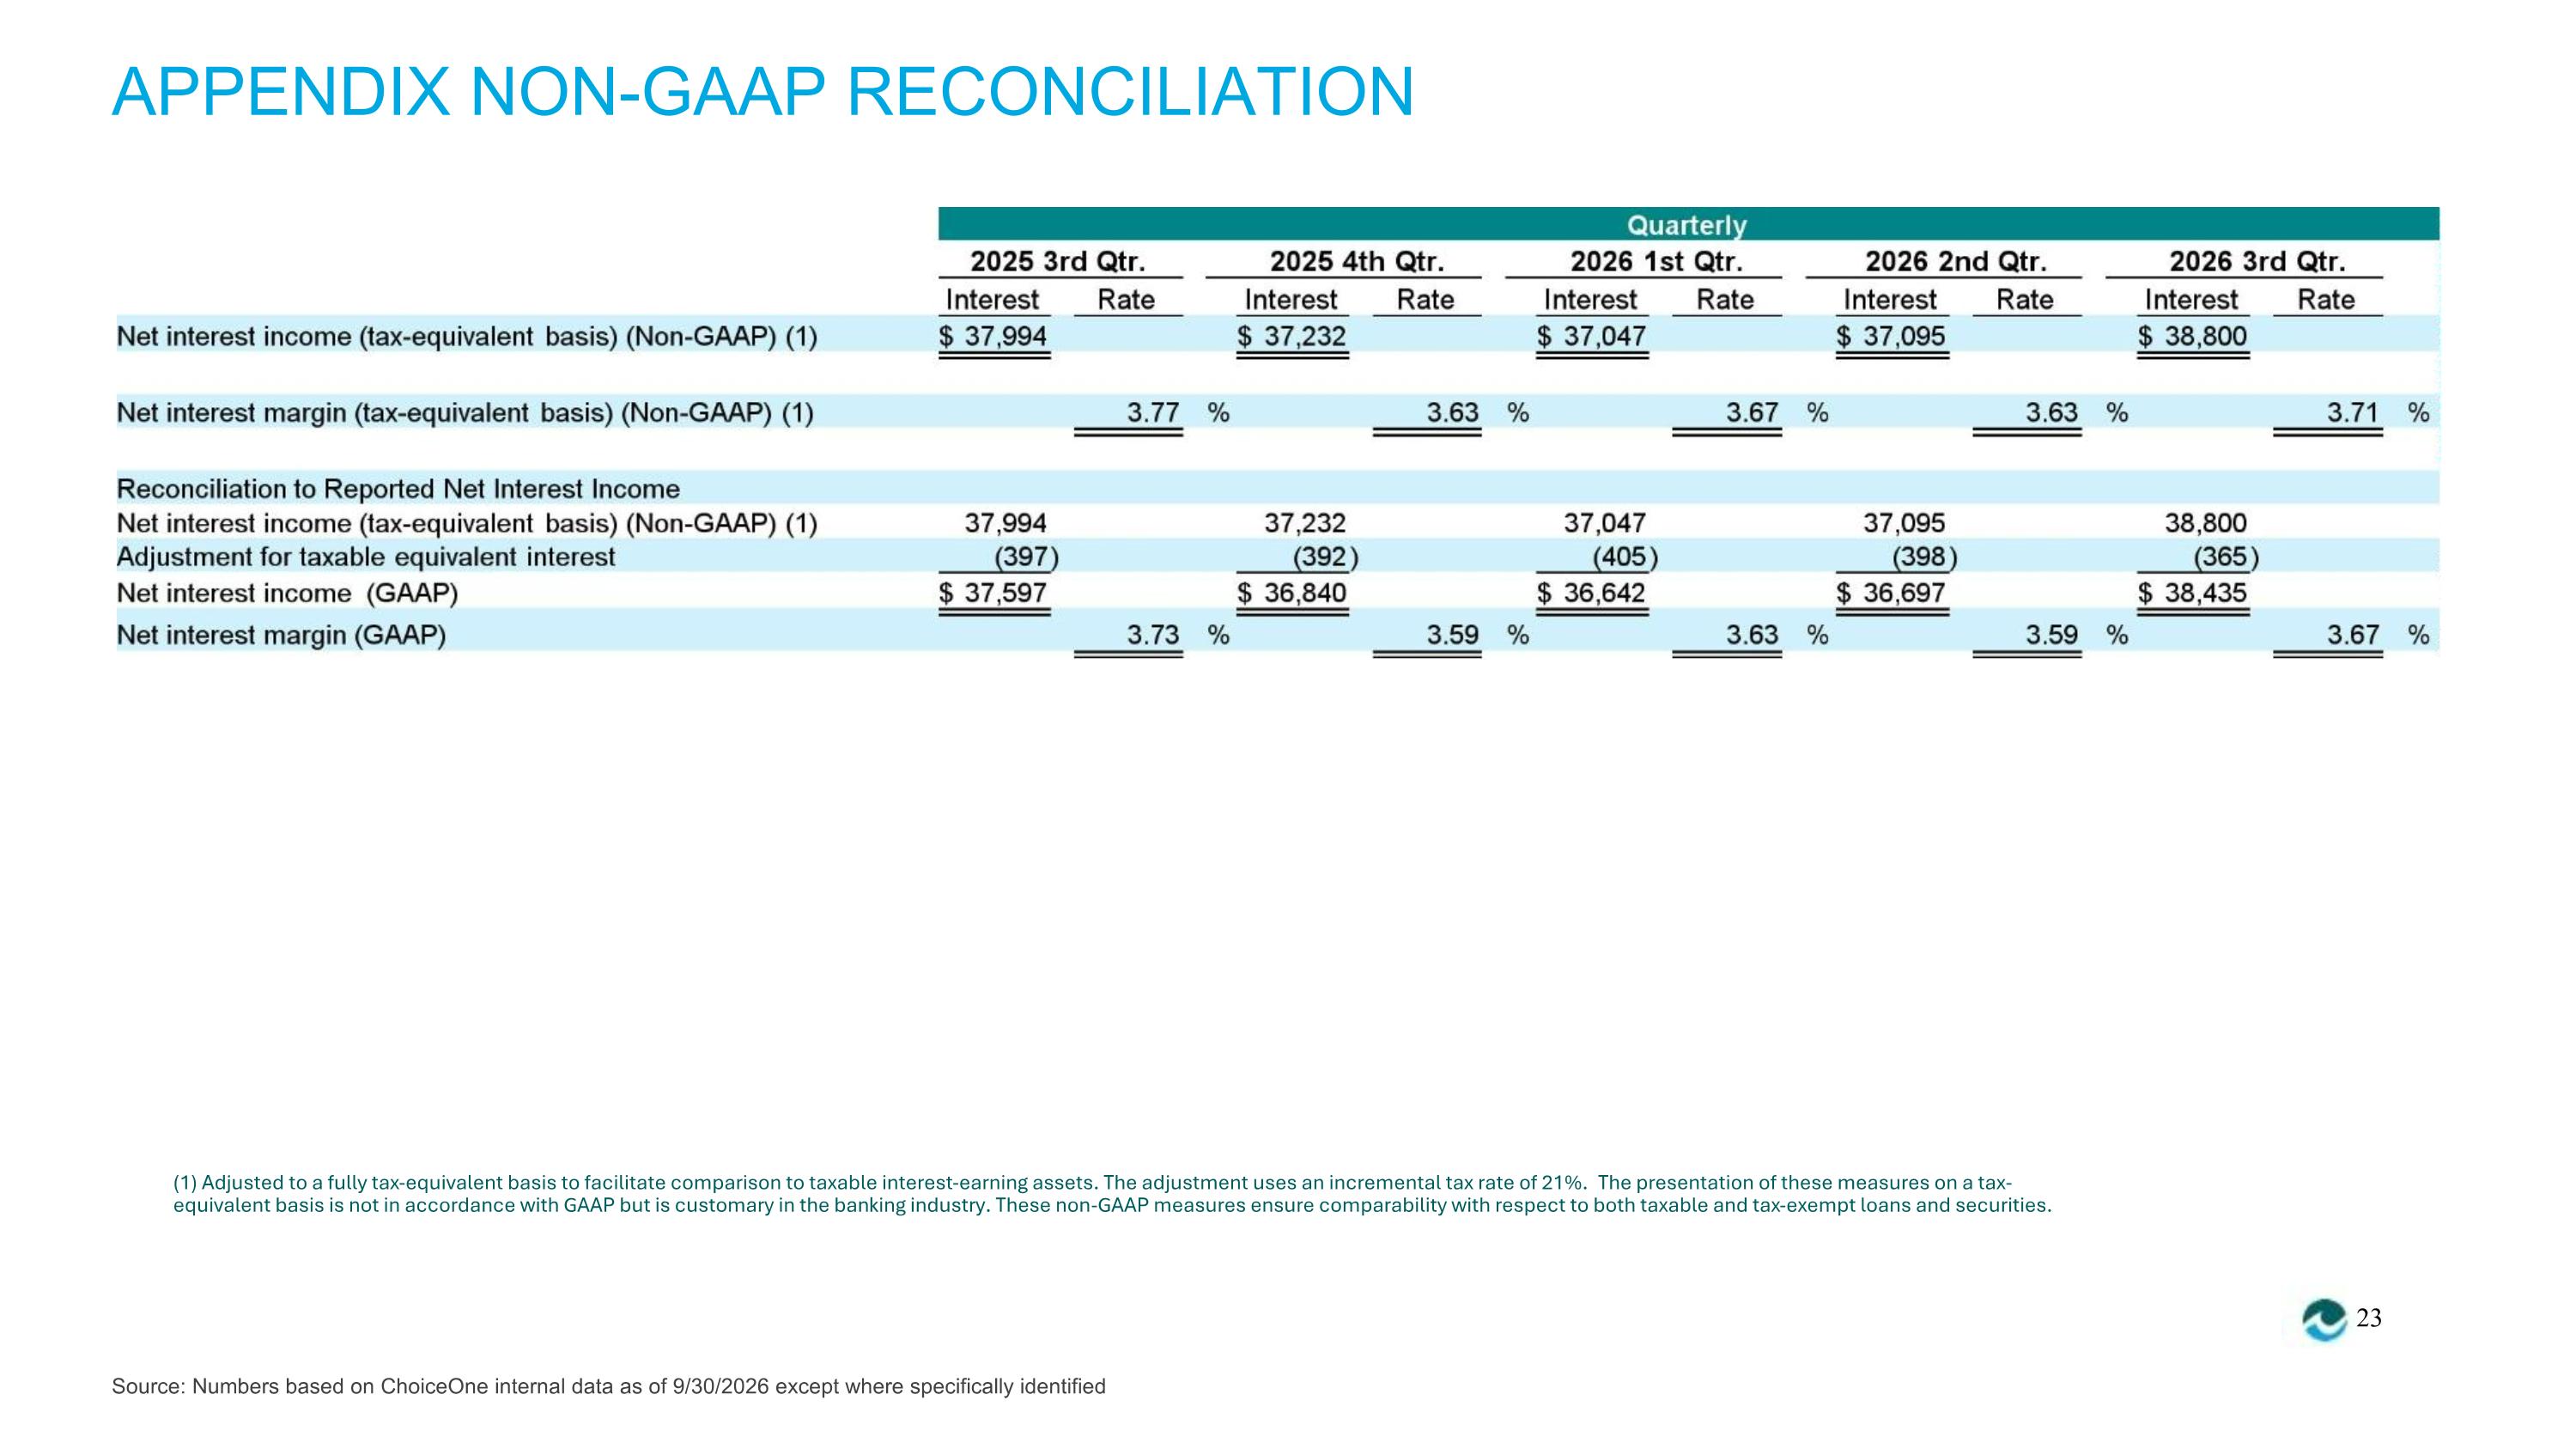
APPENDIX NON-GAAP RECONCILIATION (1) Adjusted to a fully tax-equivalent basis to facilitate comparison to taxable interest-earning assets. The adjustment uses an incremental tax rate of 21%. The presentation of these measures on a tax- equivalent basis is not in accordance with GAAP but is customary in the banking industry. These non-GAAP measures ensure comparability with respect to both taxable and tax-exempt loans and securities. 23 Source: Numbers based on ChoiceOne internal data as of 9/30/2026 except where specifically identified
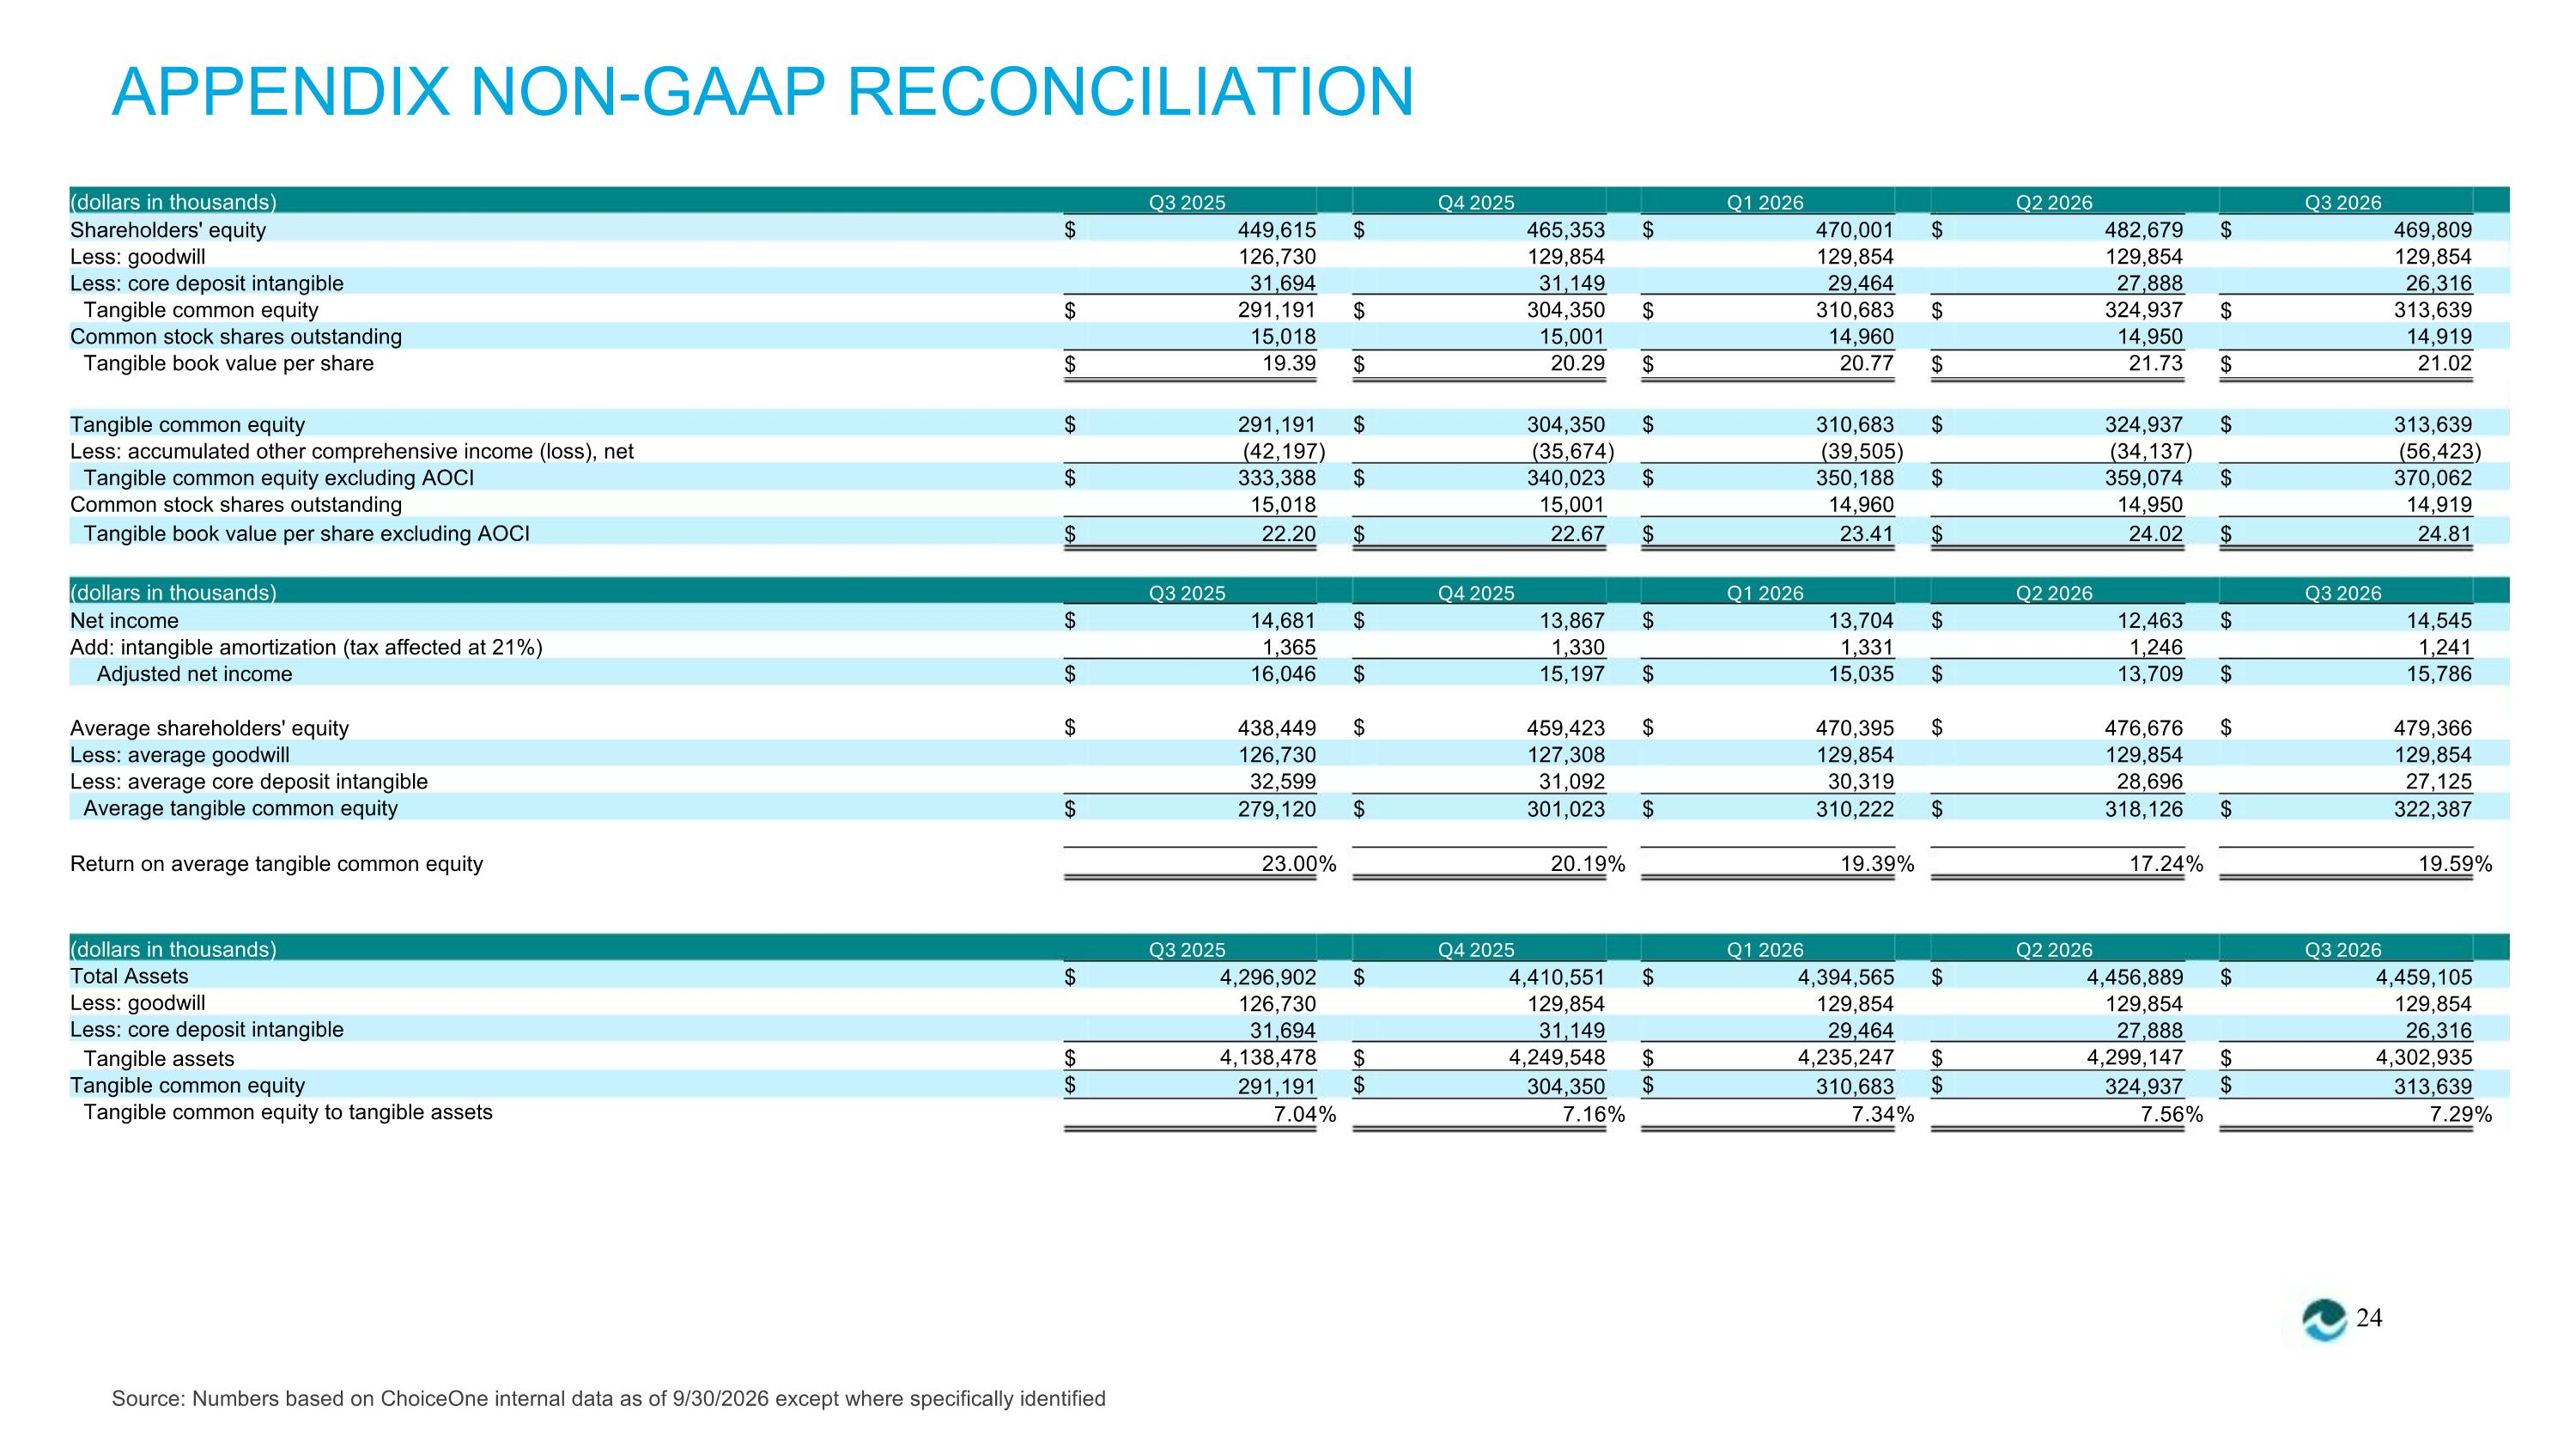
APPENDIX NON-GAAP RECONCILIATION (dollars in thousands) Q3 2025 Q4 2025 Q1 2026 Q2 2026 Q3 2026 Shareholders' equity Less: goodwill Less: core deposit intangible Tangible common equity Common stock shares outstanding Tangible book value per share $ 449,615 126,730 31,694 291,191 15,018 19.39 $ 465,353 129,854 31,149 304,350 15,001 20.29 $ 470,001 129,854 29,464 310,683 14,960 20.77 $ 482,679 129,854 27,888 324,937 14,950 21.73 $ 469,809 129,854 26,316 313,639 14,919 21.02 $ $ $ $ $ $ $ $ $ $ Tangible common equity $ $ $ 291,191 (42,197) 333,388 15,018 22.20 $ $ $ 304,350 (35,674) 340,023 15,001 22.67 $ $ $ 310,683 (39,505) 350,188 14,960 23.41 $ $ $ 324,937 (34,137) 359,074 14,950 24.02 $ $ $ 313,639 (56,423) 370,062 14,919 24.81 Less: accumulated other comprehensive income (loss), net Tangible common equity excluding AOCI Common stock shares outstanding Tangible book value per share excluding AOCI (dollars in thousands) Q3 2025 Q4 2025 Q1 2026 Q2 2026 Q3 2026 Net income $ $ $ 14,681 1,365 16,046 $ $ $ 13,867 1,330 15,197 $ $ $ 13,704 1,331 15,035 $ $ $ 12,463 1,246 13,709 $ $ $ 14,545 1,241 15,786 Add: intangible amortization (tax affected at 21%) Adjusted net income Average shareholders' equity Less: average goodwill Less: average core deposit intangible Average tangible common equity 438,449 126,730 32,599 459,423 127,308 31,092 470,395 129,854 30,319 476,676 129,854 28,696 479,366 129,854 27,125 $ 279,120 $ 301,023 $ 310,222 $ 318,126 $ 322,387 Return on average tangible common equity 23.00% 20.19% 19.39% 17.24% 19.59% (dollars in thousands) Total Assets Less: goodwill Less: core deposit intangible Tangible assets Tangible common equity Tangible common equity to tangible assets Q3 2025 Q4 2025 Q1 2026 Q2 2026 Q3 2026 $ 4,296,902 126,730 31,694 4,138,478 291,191 $ 4,410,551 129,854 31,149 4,249,548 304,350 $ 4,394,565 129,854 29,464 4,235,247 310,683 $ 4,456,889 129,854 27,888 4,299,147 324,937 $ 4,459,105 129,854 26,316 4,302,935 313,639 $ $ $ $ $ $ $ $ $ $ 7.04% 7.16% 7.34% 7.56% 7.29% 24 Source: Numbers based on ChoiceOne internal data as of 9/30/2026 except where specifically identified
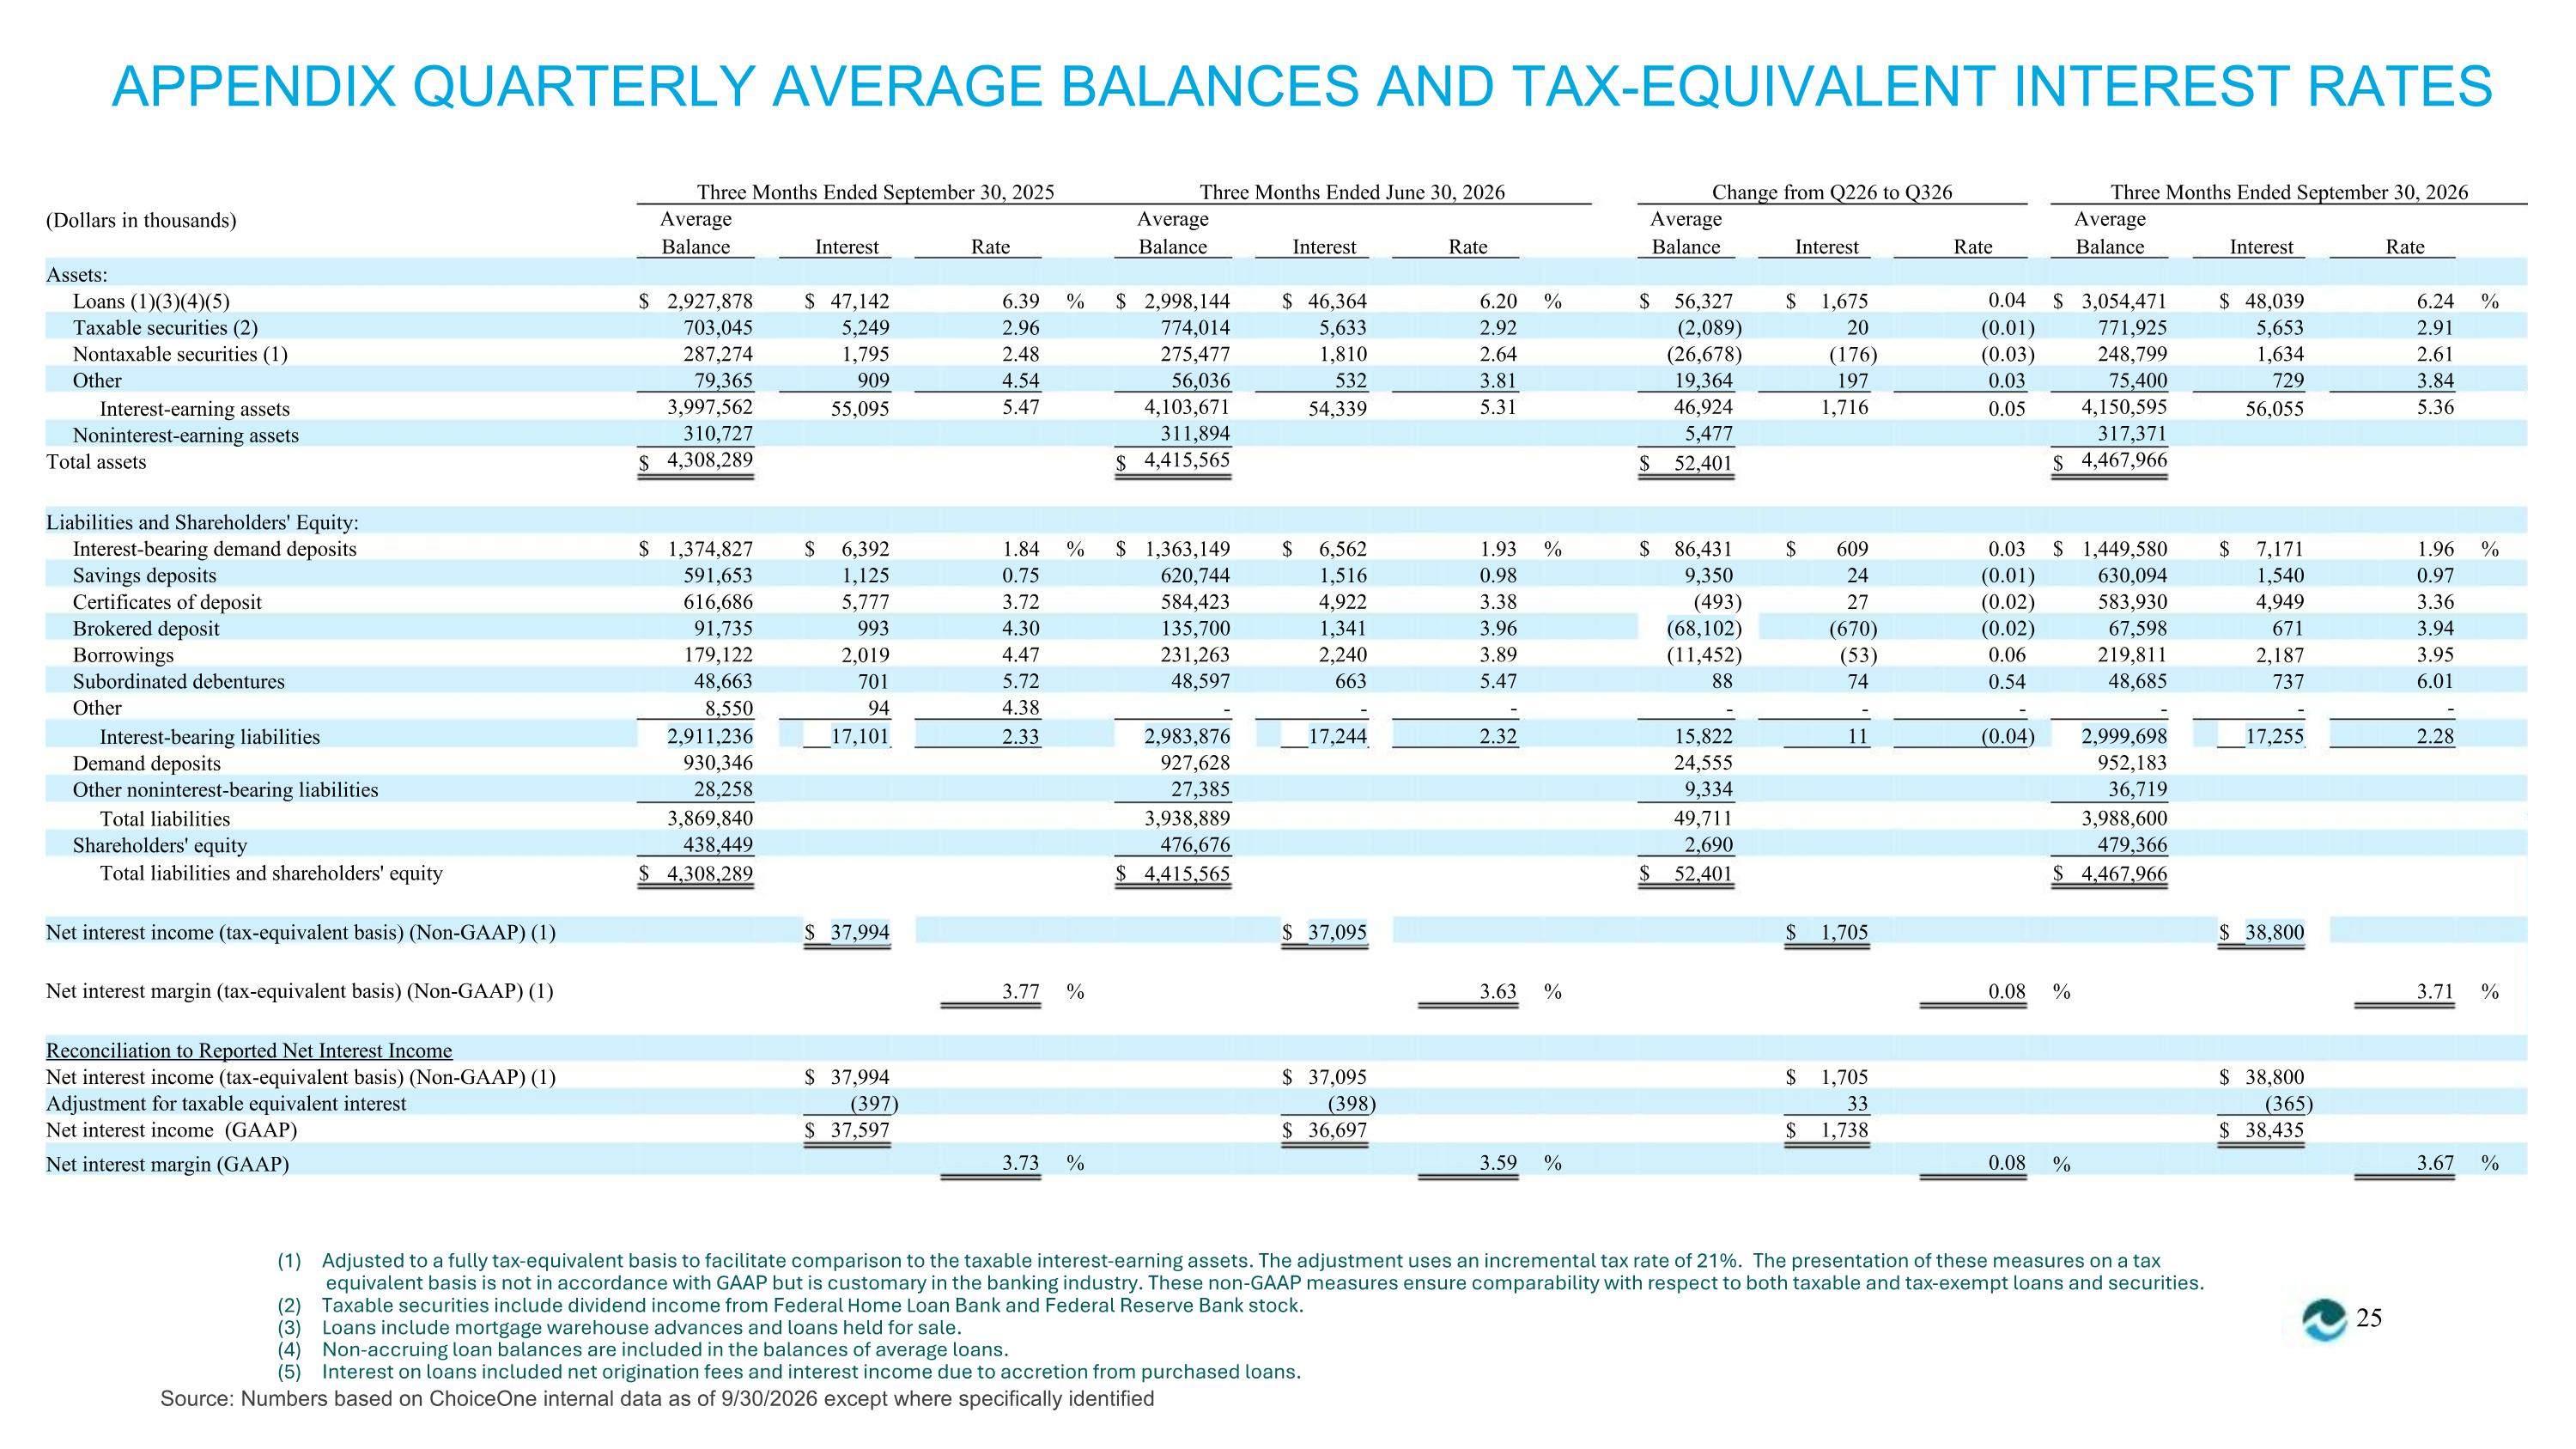
APPENDIX QUARTERLY AVERAGE BALANCES AND TAX-EQUIVALENT INTEREST RATES Three Months Ended September 30, 2025 Average Three Months Ended June 30, 2026 Average Change from Q226 to Q326 Average Three Months Ended September 30, 2026 Average (Dollars in thousands) Balance Interest Rate Balance Interest Rate Balance Interest Rate 0.04 Balance Interest Rate Assets: Loans (1)(3)(4)(5) Taxable securities (2) Nontaxable securities (1) Other $ 2,927,878 703,045 287,274 79,365 3,997,562 310,727 4,308,289 $ 47,142 5,249 1,795 909 6.39 % $ 2,998,144 774,014 275,477 56,036 4,103,671 311,894 4,415,565 $ 46,364 5,633 1,810 532 6.20 % $ 56,327 (2,089) (26,678) 19,364 46,924 5,477 $ 1,675 20 $ 3,054,471 771,925 248,799 75,400 4,150,595 317,371 4,467,966 $ 48,039 5,653 1,634 729 6.24 % 2.96 2.48 4.54 5.47 2.92 2.64 3.81 5.31 (0.01) (0.03) 0.03 2.91 2.61 3.84 5.36 (176) 197 1,716 Interest-earning assets Noninterest-earning assets Total assets 55,095 54,339 0.05 56,055 $ $ $ $ $ $ 52,401 $ $ Liabilities and Shareholders' Equity: Interest-bearing demand deposits Savings deposits 1,374,827 591,653 616,686 91,735 179,122 48,663 $ 6,392 1,125 5,777 993 1.84 0.75 3.72 4.30 4.47 5.72 4.38 2.33 % 1,363,149 620,744 584,423 135,700 231,263 48,597 $ 6,562 1,516 4,922 1,341 2,240 663 1.93 0.98 3.38 3.96 3.89 5.47 - % 86,431 9,350 (493) (68,102) (11,452) 88 $ 609 24 0.03 (0.01) (0.02) (0.02) 0.06 1,449,580 630,094 583,930 67,598 219,811 48,685 $ 7,171 1,540 4,949 671 1.96 0.97 3.36 3.94 3.95 6.01 - % Certificates of deposit Brokered deposit Borrowings Subordinated debentures Other Interest-bearing liabilities Demand deposits Other noninterest-bearing liabilities Total liabilities Shareholders' equity 27 (670) (53) 74 2,019 701 94 2,187 737 0.54 8,550 - - - - - - - 2,911,236 930,346 28,258 3,869,840 438,449 4,308,289 17,101 2,983,876 927,628 27,385 3,938,889 476,676 4,415,565 17,244 2.32 15,822 24,555 9,334 49,711 2,690 52,401 11 (0.04) 2,999,698 952,183 36,719 3,988,600 479,366 4,467,966 17,255 2.28 Total liabilities and shareholders' equity $ $ $ $ Net interest income (tax-equivalent basis) (Non-GAAP) (1) Net interest margin (tax-equivalent basis) (Non-GAAP) (1) $ 37,994 $ 37,095 $ 1,705 $ 38,800 3.77 3.73 % % 3.63 3.59 % % 0.08 0.08 % 3.71 3.67 % % Reconciliation to Reported Net Interest Income Net interest income (tax-equivalent basis) (Non-GAAP) (1) Adjustment for taxable equivalent interest Net interest income (GAAP) $ $ 37,994 (397) 37,597 $ $ 37,095 (398) 36,697 $ $ 1,705 33 1,738 $ $ 38,800 (365) 38,435 Net interest margin (GAAP) % (1) Adjusted to a fully tax-equivalent basis to facilitate comparison to the taxable interest-earning assets. The adjustment uses an incremental tax rate of 21%. The presentation of these measures on a tax equivalent basis is not in accordance with GAAP but is customary in the banking industry. These non-GAAP measures ensure comparability with respect to both taxable and tax-exempt loans and securities. (2) Taxable securities include dividend income from Federal Home Loan Bank and Federal Reserve Bank stock. (3) Loans include mortgage warehouse advances and loans held for sale. 25 (4) Non-accruing loan balances are included in the balances of average loans. (5) Interest on loans included net origination fees and interest income due to accretion from purchased loans. Source: Numbers based on ChoiceOne internal data as of 9/30/2026 except where specifically identified
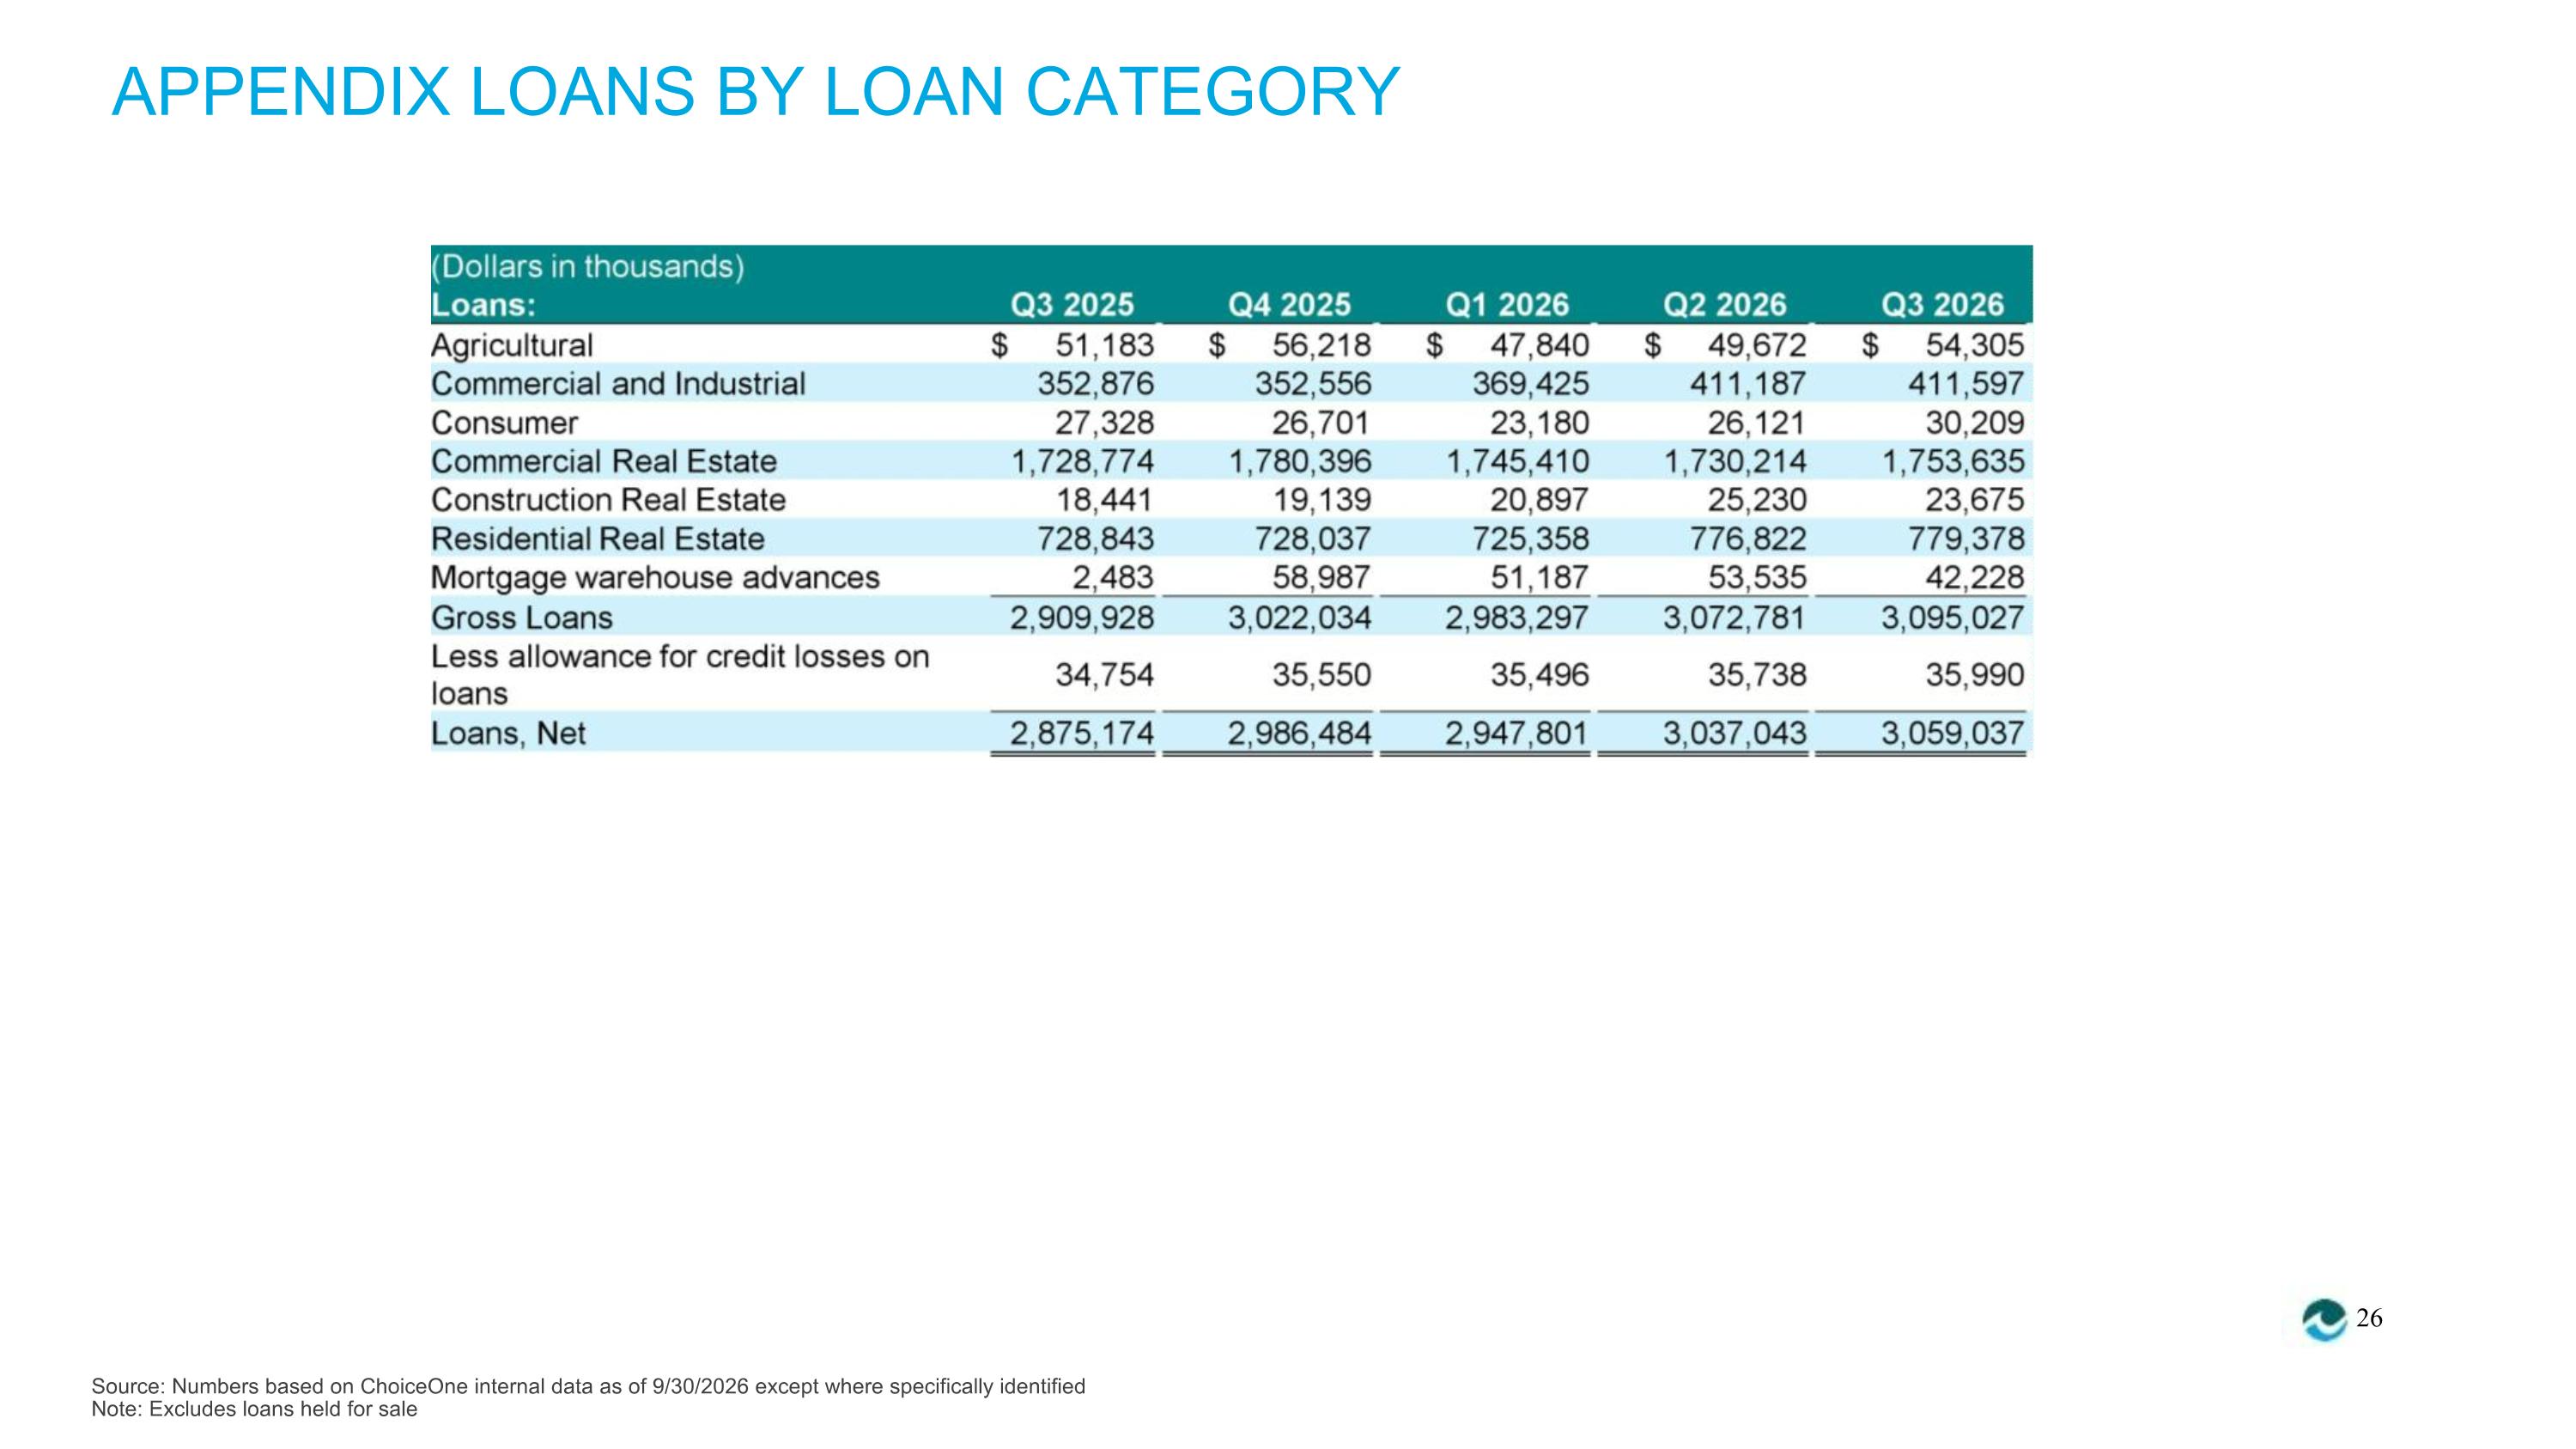
APPENDIX LOANS BY LOAN CATEGORY 26 Source: Numbers based on ChoiceOne internal data as of 9/30/2026 except where specifically identified Note: Excludes loans held for sale