Shareholder Report
|
12 Months Ended |
|
Aug. 31, 2026
USD ($)
Holding
|
|---|
| Shareholder Report [Line Items] |
|
| Document Type |
N-CSR
|
| Amendment Flag |
false
|
| Registrant Name |
SSGA FUNDS
|
| Entity Central Index Key |
0000826686
|
| Entity Investment Company Type |
N-1A
|
| Document Period End Date |
Aug. 31, 2026
|
| Shareholder Report Annual or Semi-Annual |
Annual Shareholder Report
|
| C000143790 |
|
| Shareholder Report [Line Items] |
|
| Fund Name |
State Street International Stock Selection Fund
|
| Class Name |
Class A
|
| Trading Symbol |
SSILX
|
| Annual or Semi-Annual Statement [Text Block] |
This annual shareholder report contains important information about the State Street International Stock Selection Fund (the "Fund") for the period of September 1, 2025 through August 31, 2026.
|
| Additional Information [Text Block] |
You can find additional information about the Fund at www.ssga.com/us/en/institutional/fund-finder?tab=documents&type=mf. You can also request this information about the Fund by contacting us at 1-800-647-7327.
|
| Additional Information Phone Number |
1-800-647-7327
|
| Additional Information Website |
<span style="box-sizing: border-box; color: rgb(0, 0, 0); display: inline; flex-wrap: nowrap; font-size: 12px; font-weight: 400; grid-area: auto; line-height: 14.4px; margin: 0px; overflow: visible; text-align: left; text-align-last: auto; white-space-collapse: preserve-breaks;">www.ssga.com/us/en/institutional/fund-finder?tab=documents&type=mf</span>
|
| Expenses [Text Block] |
What were the Fund costs for the last year? (based on a hypothetical $10,000 Investment)
Table Summary
Class Name |
Costs of a $10,000 investment |
Costs paid as a percentage of a $10,000 investment |
Class A |
$135 |
1.18% | |
| Expenses Paid, Amount |
$ 135
|
| Expense Ratio, Percent |
1.18%
|
| Factors Affecting Performance [Text Block] |
How did the Fund perform last year and what affected its performance?Value and Sentiment factors were the primary contributors to the Fund’s outperformance relative to the Index during the reporting period. Value generated strong returns across regions as attractively valued companies outperformed more expensive counterparts, while Sentiment added value, particularly in Europe, reflecting the strong performance of market-favored companies. Stock selection was broadly positive, with the strongest contributions coming from Industrials, Consumer Discretionary, and Financials. In contrast, stock selection detracted value in Information Technology and Real Estate. Regionally, Europe and Japan were the largest contributors to excess returns from security selection. |
| Performance Past Does Not Indicate Future [Text] |
The Fund’s past performance is not necessarily an indication of how the Fund will perform in the future. The returns do not reflect the deduction of taxes that a shareholder would pay on Fund distributions or on the redemption or sale of Fund shares.
|
| Line Graph [Table Text Block] |
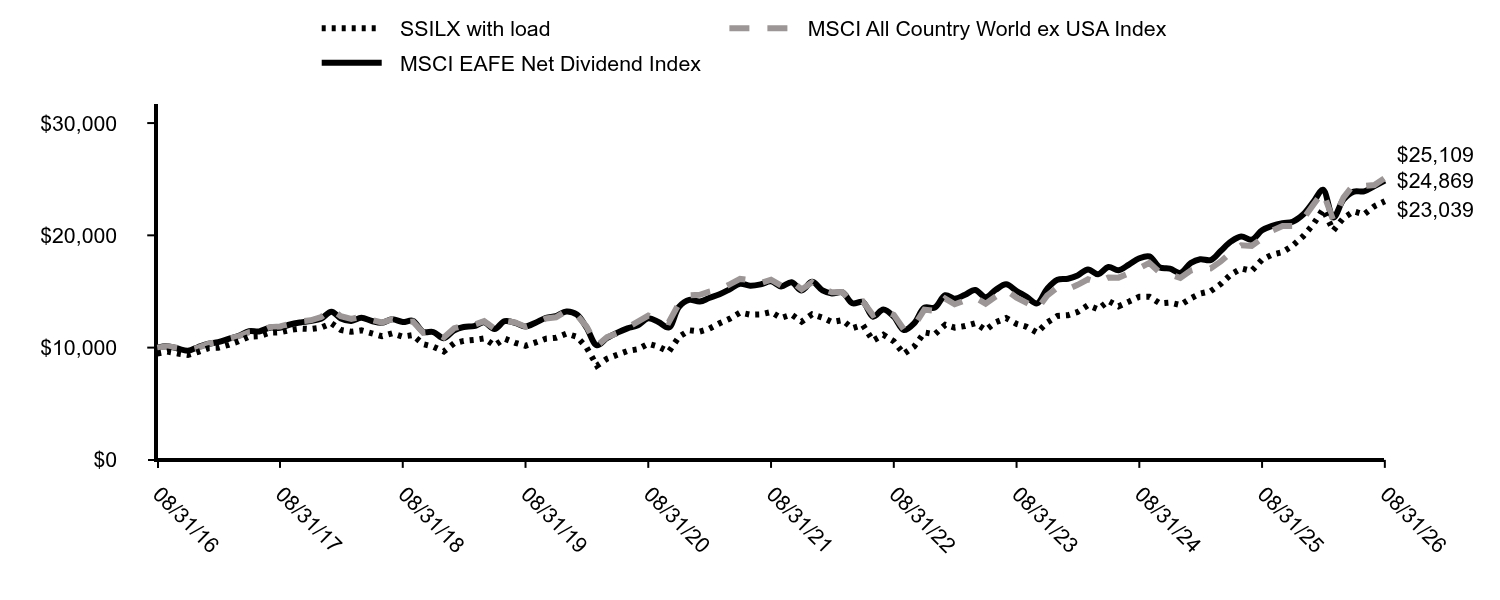
Table Summary
|
SSILX with load |
MSCI All Country World ex USA Index |
MSCI EAFE Net Dividend Index |
08/31/16 |
$9,472 |
$10,000 |
$10,000 |
09/30/16 |
$9,642 |
$10,123 |
$10,123 |
10/31/16 |
$9,472 |
$9,978 |
$9,916 |
11/30/16 |
$9,340 |
$9,747 |
$9,718 |
12/31/16 |
$9,623 |
$9,996 |
$10,051 |
01/31/17 |
$9,952 |
$10,350 |
$10,342 |
02/28/17 |
$9,990 |
$10,515 |
$10,490 |
03/31/17 |
$10,251 |
$10,782 |
$10,779 |
04/30/17 |
$10,560 |
$11,013 |
$11,053 |
05/31/17 |
$10,976 |
$11,370 |
$11,459 |
06/30/17 |
$11,014 |
$11,406 |
$11,439 |
07/31/17 |
$11,324 |
$11,826 |
$11,768 |
08/31/17 |
$11,362 |
$11,888 |
$11,764 |
09/30/17 |
$11,565 |
$12,108 |
$12,057 |
10/31/17 |
$11,700 |
$12,336 |
$12,240 |
11/30/17 |
$11,652 |
$12,436 |
$12,368 |
12/31/17 |
$11,773 |
$12,714 |
$12,567 |
01/31/18 |
$12,164 |
$13,423 |
$13,197 |
02/28/18 |
$11,573 |
$12,790 |
$12,601 |
03/31/18 |
$11,412 |
$12,564 |
$12,374 |
04/30/18 |
$11,533 |
$12,765 |
$12,657 |
05/31/18 |
$11,272 |
$12,470 |
$12,372 |
06/30/18 |
$11,012 |
$12,236 |
$12,221 |
07/31/18 |
$11,272 |
$12,528 |
$12,522 |
08/31/18 |
$10,982 |
$12,266 |
$12,280 |
09/30/18 |
$11,112 |
$12,322 |
$12,387 |
10/31/18 |
$10,300 |
$11,320 |
$11,401 |
11/30/18 |
$10,080 |
$11,427 |
$11,386 |
12/31/18 |
$9,654 |
$10,910 |
$10,834 |
01/31/19 |
$10,385 |
$11,734 |
$11,546 |
02/28/19 |
$10,597 |
$11,963 |
$11,840 |
03/31/19 |
$10,682 |
$12,034 |
$11,915 |
04/30/19 |
$10,820 |
$12,352 |
$12,250 |
05/31/19 |
$10,195 |
$11,689 |
$11,661 |
06/30/19 |
$10,799 |
$12,393 |
$12,353 |
07/31/19 |
$10,428 |
$12,243 |
$12,196 |
08/31/19 |
$10,163 |
$11,865 |
$11,880 |
09/30/19 |
$10,460 |
$12,170 |
$12,221 |
10/31/19 |
$10,799 |
$12,595 |
$12,660 |
11/30/19 |
$10,883 |
$12,706 |
$12,803 |
12/31/19 |
$11,248 |
$13,256 |
$13,219 |
01/31/20 |
$10,963 |
$12,900 |
$12,943 |
02/29/20 |
$10,012 |
$11,881 |
$11,773 |
03/31/20 |
$8,395 |
$10,160 |
$10,201 |
04/30/20 |
$9,007 |
$10,930 |
$10,860 |
05/31/20 |
$9,367 |
$11,288 |
$11,333 |
06/30/20 |
$9,695 |
$11,798 |
$11,719 |
07/31/20 |
$9,859 |
$12,324 |
$11,992 |
08/31/20 |
$10,340 |
$12,852 |
$12,609 |
09/30/20 |
$10,089 |
$12,536 |
$12,281 |
10/31/20 |
$9,630 |
$12,266 |
$11,791 |
11/30/20 |
$10,952 |
$13,916 |
$13,619 |
12/31/20 |
$11,542 |
$14,668 |
$14,252 |
01/31/21 |
$11,431 |
$14,700 |
$14,100 |
02/28/21 |
$11,676 |
$14,991 |
$14,416 |
03/31/21 |
$12,165 |
$15,181 |
$14,748 |
04/30/21 |
$12,565 |
$15,628 |
$15,192 |
05/31/21 |
$13,121 |
$16,117 |
$15,687 |
06/30/21 |
$12,932 |
$16,012 |
$15,510 |
07/31/21 |
$12,955 |
$15,748 |
$15,627 |
08/31/21 |
$13,166 |
$16,048 |
$15,903 |
09/30/21 |
$12,643 |
$15,534 |
$15,441 |
10/31/21 |
$12,943 |
$15,905 |
$15,821 |
11/30/21 |
$12,310 |
$15,188 |
$15,085 |
12/31/21 |
$12,976 |
$15,816 |
$15,857 |
01/31/22 |
$12,675 |
$15,233 |
$15,091 |
02/28/22 |
$12,269 |
$14,932 |
$14,824 |
03/31/22 |
$12,443 |
$14,956 |
$14,919 |
04/30/22 |
$11,724 |
$14,016 |
$13,954 |
05/31/22 |
$12,014 |
$14,117 |
$14,059 |
06/30/22 |
$10,622 |
$12,903 |
$12,754 |
07/31/22 |
$11,144 |
$13,344 |
$13,390 |
08/31/22 |
$10,564 |
$12,915 |
$12,754 |
09/30/22 |
$9,451 |
$11,624 |
$11,561 |
10/31/22 |
$10,112 |
$11,972 |
$12,182 |
11/30/22 |
$11,353 |
$13,385 |
$13,555 |
12/31/22 |
$11,184 |
$13,285 |
$13,565 |
01/31/23 |
$12,034 |
$14,362 |
$14,664 |
02/28/23 |
$11,778 |
$13,858 |
$14,358 |
03/31/23 |
$11,917 |
$14,197 |
$14,714 |
04/30/23 |
$12,173 |
$14,444 |
$15,129 |
05/31/23 |
$11,568 |
$13,918 |
$14,489 |
06/30/23 |
$12,255 |
$14,543 |
$15,148 |
07/31/23 |
$12,627 |
$15,134 |
$15,639 |
08/31/23 |
$12,115 |
$14,451 |
$15,039 |
09/30/23 |
$11,847 |
$13,994 |
$14,526 |
10/31/23 |
$11,335 |
$13,417 |
$13,937 |
11/30/23 |
$12,231 |
$14,625 |
$15,230 |
12/31/23 |
$12,824 |
$15,359 |
$16,040 |
01/31/24 |
$12,884 |
$15,207 |
$16,132 |
02/29/24 |
$13,169 |
$15,592 |
$16,427 |
03/31/24 |
$13,775 |
$16,079 |
$16,967 |
04/30/24 |
$13,419 |
$15,790 |
$16,533 |
05/31/24 |
$14,156 |
$16,249 |
$17,173 |
06/30/24 |
$13,680 |
$16,233 |
$16,896 |
07/31/24 |
$14,096 |
$16,609 |
$17,392 |
08/31/24 |
$14,524 |
$17,082 |
$17,957 |
09/30/24 |
$14,536 |
$17,542 |
$18,123 |
10/31/24 |
$13,942 |
$16,681 |
$17,138 |
11/30/24 |
$14,013 |
$16,530 |
$17,040 |
12/31/24 |
$13,795 |
$16,209 |
$16,653 |
01/31/25 |
$14,385 |
$16,862 |
$17,528 |
02/28/25 |
$14,815 |
$17,096 |
$17,868 |
03/31/25 |
$15,024 |
$17,058 |
$17,796 |
04/30/25 |
$15,663 |
$17,673 |
$18,611 |
05/31/25 |
$16,536 |
$18,483 |
$19,462 |
06/30/25 |
$17,053 |
$19,110 |
$19,891 |
07/31/25 |
$16,831 |
$19,055 |
$19,612 |
08/31/25 |
$17,839 |
$19,717 |
$20,448 |
09/30/25 |
$18,282 |
$20,427 |
$20,839 |
10/31/25 |
$18,503 |
$20,840 |
$21,085 |
11/30/25 |
$19,081 |
$20,834 |
$21,216 |
12/31/25 |
$19,915 |
$21,459 |
$21,852 |
01/31/26 |
$21,006 |
$22,742 |
$22,992 |
02/28/26 |
$22,325 |
$23,885 |
$24,056 |
03/31/26 |
$20,427 |
$21,308 |
$21,581 |
04/30/26 |
$21,544 |
$23,364 |
$23,189 |
05/31/26 |
$22,137 |
$24,540 |
$23,900 |
06/30/26 |
$21,867 |
$24,396 |
$23,916 |
07/31/26 |
$22,595 |
$24,479 |
$24,384 |
08/31/26 |
$23,039 |
$25,109 |
$24,869 |
|
| Average Annual Return [Table Text Block] |
Average Annual Total Returns (%)
Table Summary
Name |
1 Year |
5 Years |
10 Years |
SSILX |
29.15% |
11.84% |
9.30% |
SSILX (Adjusted for the 5.25% Maximum Sales Charge) |
22.40% |
10.63% |
8.70% |
MSCI All Country World ex USA Index |
27.35% |
9.37% |
9.64% |
MSCI EAFE Net Dividend Index |
21.62% |
9.35% |
9.54% | The Fund’s past performance is not necessarily an indication of how the Fund will perform in the future. The returns do not reflect the deduction of taxes that a shareholder would pay on Fund distributions or on the redemption or sale of Fund shares. Updated performance information is available by calling 1-800-647-7327 or visiting our website at www.ssga.com. |
| Updated Performance Information Location [Text Block] |
Updated performance information is available by calling 1-800-647-7327 or visiting our website at www.ssga.com.
|
| AssetsNet |
$ 192,988,432
|
| Holdings Count | Holding |
191
|
| Advisory Fees Paid, Amount |
$ 1,135,461
|
| InvestmentCompanyPortfolioTurnover |
100.00%
|
| Additional Fund Statistics [Text Block] |
Key Fund Statistics as of 8/31/2026- Total Net Assets$192,988,432
- Number of Portfolio Holdings191
- Portfolio Turnover Rate100%
- Total Advisory Fees Paid$1,135,461
|
| Holdings [Text Block] |
Table Summary
Countries |
% |
Japan |
23.7% |
United Kingdom |
11.0% |
Germany |
9.9% |
United States |
8.9% |
France |
6.1% |
Australia |
5.2% |
Netherlands |
5.1% |
Spain |
4.8% |
Italy |
4.8% |
Switzerland |
3.4% | |
| Largest Holdings [Text Block] |
Table Summary
Holdings |
% |
Novartis AG |
2.2% |
Roche Holding AG |
2.2% |
BHP Group Ltd. |
2.1% |
ASML Holding NV |
2.0% |
Banco Santander SA |
1.9% |
Banco Bilbao Vizcaya Argentaria SA |
1.7% |
Deutsche Telekom AG |
1.5% |
Intesa Sanpaolo SpA |
1.5% |
Deutsche Bank AG |
1.4% |
Barclays PLC |
1.4% | |
| Material Fund Change [Text Block] |
|
| C000143792 |
|
| Shareholder Report [Line Items] |
|
| Fund Name |
State Street International Stock Selection Fund
|
| Class Name |
Class I
|
| Trading Symbol |
SSIPX
|
| Annual or Semi-Annual Statement [Text Block] |
This annual shareholder report contains important information about the State Street International Stock Selection Fund (the "Fund") for the period of September 1, 2025 through August 31, 2026.
|
| Additional Information [Text Block] |
You can find additional information about the Fund at www.ssga.com/us/en/institutional/fund-finder?tab=documents&type=mf. You can also request this information about the Fund by contacting us at 1-800-647-7327.
|
| Additional Information Phone Number |
1-800-647-7327
|
| Additional Information Website |
<span style="box-sizing: border-box; color: rgb(0, 0, 0); display: inline; flex-wrap: nowrap; font-size: 12px; font-weight: 400; grid-area: auto; line-height: 14.4px; margin: 0px; overflow: visible; text-align: left; text-align-last: auto; white-space-collapse: preserve-breaks;">www.ssga.com/us/en/institutional/fund-finder?tab=documents&type=mf</span>
|
| Expenses [Text Block] |
What were the Fund costs for the last year? (based on a hypothetical $10,000 Investment)
Table Summary
Class Name |
Costs of a $10,000 investment |
Costs paid as a percentage of a $10,000 investment |
Class I |
$98 |
0.85% | |
| Expenses Paid, Amount |
$ 98
|
| Expense Ratio, Percent |
0.85%
|
| Factors Affecting Performance [Text Block] |
How did the Fund perform last year and what affected its performance?Value and Sentiment factors were the primary contributors to the Fund’s outperformance relative to the Index during the reporting period. Value generated strong returns across regions as attractively valued companies outperformed more expensive counterparts, while Sentiment added value, particularly in Europe, reflecting the strong performance of market-favored companies. Stock selection was broadly positive, with the strongest contributions coming from Industrials, Consumer Discretionary, and Financials. In contrast, stock selection detracted value in Information Technology and Real Estate. Regionally, Europe and Japan were the largest contributors to excess returns from security selection. |
| Performance Past Does Not Indicate Future [Text] |
The Fund’s past performance is not necessarily an indication of how the Fund will perform in the future. The returns do not reflect the deduction of taxes that a shareholder would pay on Fund distributions or on the redemption or sale of Fund shares.
|
| Line Graph [Table Text Block] |
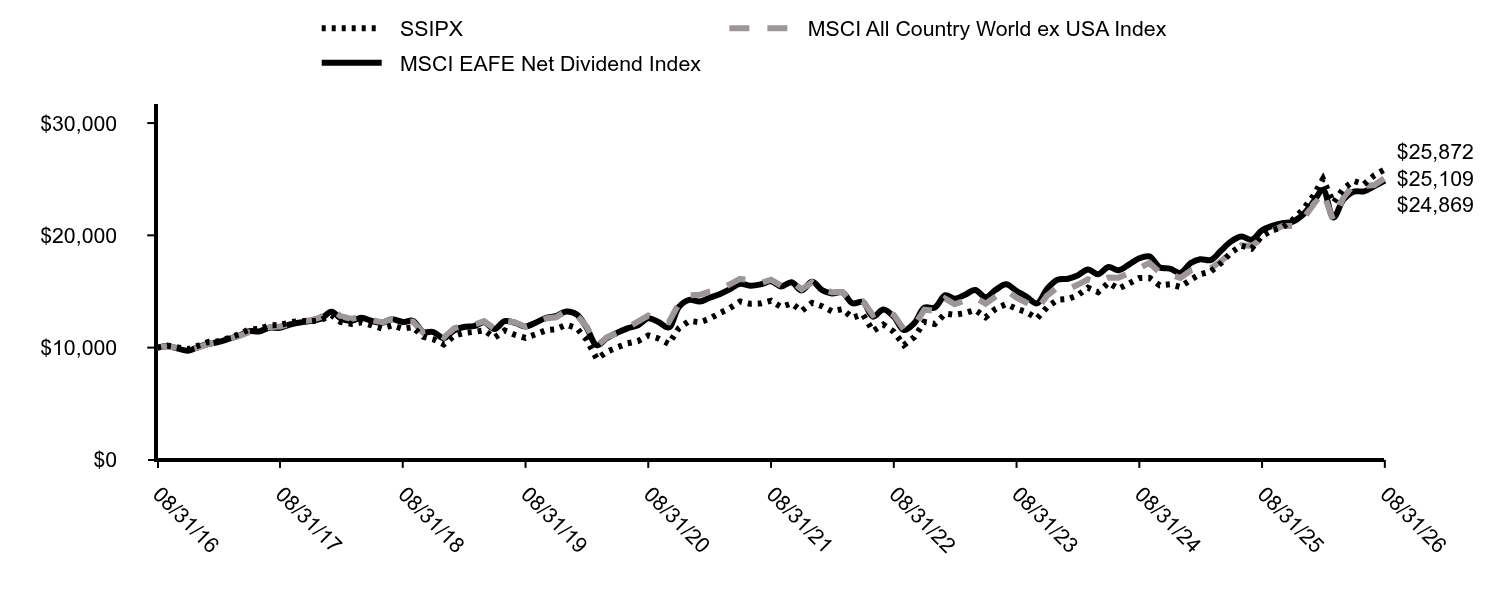
Table Summary
|
SSIPX |
MSCI All Country World ex USA Index |
MSCI EAFE Net Dividend Index |
08/31/16 |
$10,000 |
$10,000 |
$10,000 |
09/30/16 |
$10,178 |
$10,123 |
$10,123 |
10/31/16 |
$10,010 |
$9,978 |
$9,916 |
11/30/16 |
$9,861 |
$9,747 |
$9,718 |
12/31/16 |
$10,170 |
$9,996 |
$10,051 |
01/31/17 |
$10,516 |
$10,350 |
$10,342 |
02/28/17 |
$10,567 |
$10,515 |
$10,490 |
03/31/17 |
$10,842 |
$10,782 |
$10,779 |
04/30/17 |
$11,178 |
$11,013 |
$11,053 |
05/31/17 |
$11,616 |
$11,370 |
$11,459 |
06/30/17 |
$11,656 |
$11,406 |
$11,439 |
07/31/17 |
$11,992 |
$11,826 |
$11,768 |
08/31/17 |
$12,023 |
$11,888 |
$11,764 |
09/30/17 |
$12,247 |
$12,108 |
$12,057 |
10/31/17 |
$12,389 |
$12,336 |
$12,240 |
11/30/17 |
$12,338 |
$12,436 |
$12,368 |
12/31/17 |
$12,465 |
$12,714 |
$12,567 |
01/31/18 |
$12,888 |
$13,423 |
$13,197 |
02/28/18 |
$12,274 |
$12,790 |
$12,601 |
03/31/18 |
$12,115 |
$12,564 |
$12,374 |
04/30/18 |
$12,242 |
$12,765 |
$12,657 |
05/31/18 |
$11,978 |
$12,470 |
$12,372 |
06/30/18 |
$11,713 |
$12,236 |
$12,221 |
07/31/18 |
$11,988 |
$12,528 |
$12,522 |
08/31/18 |
$11,682 |
$12,266 |
$12,280 |
09/30/18 |
$11,819 |
$12,322 |
$12,387 |
10/31/18 |
$10,962 |
$11,320 |
$11,401 |
11/30/18 |
$10,740 |
$11,427 |
$11,386 |
12/31/18 |
$10,287 |
$10,910 |
$10,834 |
01/31/19 |
$11,064 |
$11,734 |
$11,546 |
02/28/19 |
$11,300 |
$11,963 |
$11,840 |
03/31/19 |
$11,401 |
$12,034 |
$11,915 |
04/30/19 |
$11,536 |
$12,352 |
$12,250 |
05/31/19 |
$10,883 |
$11,689 |
$11,661 |
06/30/19 |
$11,525 |
$12,393 |
$12,353 |
07/31/19 |
$11,131 |
$12,243 |
$12,196 |
08/31/19 |
$10,861 |
$11,865 |
$11,880 |
09/30/19 |
$11,187 |
$12,170 |
$12,221 |
10/31/19 |
$11,547 |
$12,595 |
$12,660 |
11/30/19 |
$11,638 |
$12,706 |
$12,803 |
12/31/19 |
$12,035 |
$13,256 |
$13,219 |
01/31/20 |
$11,732 |
$12,900 |
$12,943 |
02/29/20 |
$10,707 |
$11,881 |
$11,773 |
03/31/20 |
$8,983 |
$10,160 |
$10,201 |
04/30/20 |
$9,647 |
$10,930 |
$10,860 |
05/31/20 |
$10,031 |
$11,288 |
$11,333 |
06/30/20 |
$10,381 |
$11,798 |
$11,719 |
07/31/20 |
$10,567 |
$12,324 |
$11,992 |
08/31/20 |
$11,080 |
$12,852 |
$12,609 |
09/30/20 |
$10,812 |
$12,536 |
$12,281 |
10/31/20 |
$10,334 |
$12,266 |
$11,791 |
11/30/20 |
$11,744 |
$13,916 |
$13,619 |
12/31/20 |
$12,381 |
$14,668 |
$14,252 |
01/31/21 |
$12,262 |
$14,700 |
$14,100 |
02/28/21 |
$12,547 |
$14,991 |
$14,416 |
03/31/21 |
$13,070 |
$15,181 |
$14,748 |
04/30/21 |
$13,498 |
$15,628 |
$15,192 |
05/31/21 |
$14,116 |
$16,117 |
$15,687 |
06/30/21 |
$13,902 |
$16,012 |
$15,510 |
07/31/21 |
$13,938 |
$15,748 |
$15,627 |
08/31/21 |
$14,175 |
$16,048 |
$15,903 |
09/30/21 |
$13,617 |
$15,534 |
$15,441 |
10/31/21 |
$13,938 |
$15,905 |
$15,821 |
11/30/21 |
$13,260 |
$15,188 |
$15,085 |
12/31/21 |
$13,992 |
$15,816 |
$15,857 |
01/31/22 |
$13,668 |
$15,233 |
$15,091 |
02/28/22 |
$13,233 |
$14,932 |
$14,824 |
03/31/22 |
$13,432 |
$14,956 |
$14,919 |
04/30/22 |
$12,660 |
$14,016 |
$13,954 |
05/31/22 |
$12,971 |
$14,117 |
$14,059 |
06/30/22 |
$11,477 |
$12,903 |
$12,754 |
07/31/22 |
$12,050 |
$13,344 |
$13,390 |
08/31/22 |
$11,415 |
$12,915 |
$12,754 |
09/30/22 |
$10,220 |
$11,624 |
$11,561 |
10/31/22 |
$10,930 |
$11,972 |
$12,182 |
11/30/22 |
$12,287 |
$13,385 |
$13,555 |
12/31/22 |
$12,107 |
$13,285 |
$13,565 |
01/31/23 |
$13,036 |
$14,362 |
$14,664 |
02/28/23 |
$12,920 |
$13,858 |
$14,358 |
03/31/23 |
$13,075 |
$14,197 |
$14,714 |
04/30/23 |
$13,359 |
$14,444 |
$15,129 |
05/31/23 |
$12,700 |
$13,918 |
$14,489 |
06/30/23 |
$13,462 |
$14,543 |
$15,148 |
07/31/23 |
$13,875 |
$15,134 |
$15,639 |
08/31/23 |
$13,449 |
$14,451 |
$15,039 |
09/30/23 |
$13,152 |
$13,994 |
$14,526 |
10/31/23 |
$12,597 |
$13,417 |
$13,937 |
11/30/23 |
$13,591 |
$14,625 |
$15,230 |
12/31/23 |
$14,258 |
$15,359 |
$16,040 |
01/31/24 |
$14,326 |
$15,207 |
$16,132 |
02/29/24 |
$14,654 |
$15,592 |
$16,427 |
03/31/24 |
$15,337 |
$16,079 |
$16,967 |
04/30/24 |
$14,941 |
$15,790 |
$16,533 |
05/31/24 |
$15,775 |
$16,249 |
$17,173 |
06/30/24 |
$15,242 |
$16,233 |
$16,896 |
07/31/24 |
$15,707 |
$16,609 |
$17,392 |
08/31/24 |
$16,199 |
$17,082 |
$17,957 |
09/30/24 |
$16,212 |
$17,542 |
$18,123 |
10/31/24 |
$15,543 |
$16,681 |
$17,138 |
11/30/24 |
$15,638 |
$16,530 |
$17,040 |
12/31/24 |
$15,400 |
$16,209 |
$16,653 |
01/31/25 |
$16,053 |
$16,862 |
$17,528 |
02/28/25 |
$16,536 |
$17,096 |
$17,868 |
03/31/25 |
$16,777 |
$17,058 |
$17,796 |
04/30/25 |
$17,501 |
$17,673 |
$18,611 |
05/31/25 |
$18,480 |
$18,483 |
$19,462 |
06/30/25 |
$19,076 |
$19,110 |
$19,891 |
07/31/25 |
$18,821 |
$19,055 |
$19,612 |
08/31/25 |
$19,956 |
$19,717 |
$20,448 |
09/30/25 |
$20,453 |
$20,427 |
$20,839 |
10/31/25 |
$20,723 |
$20,840 |
$21,085 |
11/30/25 |
$21,376 |
$20,834 |
$21,216 |
12/31/25 |
$22,308 |
$21,459 |
$21,852 |
01/31/26 |
$23,543 |
$22,742 |
$22,992 |
02/28/26 |
$25,028 |
$23,885 |
$24,056 |
03/31/26 |
$22,902 |
$21,308 |
$21,581 |
04/30/26 |
$24,168 |
$23,364 |
$23,189 |
05/31/26 |
$24,841 |
$24,540 |
$23,900 |
06/30/26 |
$24,544 |
$24,396 |
$23,916 |
07/31/26 |
$25,356 |
$24,479 |
$24,384 |
08/31/26 |
$25,872 |
$25,109 |
$24,869 |
|
| Average Annual Return [Table Text Block] |
Average Annual Total Returns (%)
Table Summary
Name |
1 Year |
5 Years |
10 Years |
SSIPX |
29.65% |
12.79% |
9.97% |
MSCI All Country World ex USA Index |
27.35% |
9.37% |
9.64% |
MSCI EAFE Net Dividend Index |
21.62% |
9.35% |
9.54% | The Fund’s past performance is not necessarily an indication of how the Fund will perform in the future. The returns do not reflect the deduction of taxes that a shareholder would pay on Fund distributions or on the redemption or sale of Fund shares. Updated performance information is available by calling 1-800-647-7327 or visiting our website at www.ssga.com. |
| Updated Performance Information Location [Text Block] |
Updated performance information is available by calling 1-800-647-7327 or visiting our website at www.ssga.com.
|
| AssetsNet |
$ 192,988,432
|
| Holdings Count | Holding |
191
|
| Advisory Fees Paid, Amount |
$ 1,135,461
|
| InvestmentCompanyPortfolioTurnover |
100.00%
|
| Additional Fund Statistics [Text Block] |
Key Fund Statistics as of 8/31/2026- Total Net Assets$192,988,432
- Number of Portfolio Holdings191
- Portfolio Turnover Rate100%
- Total Advisory Fees Paid$1,135,461
|
| Holdings [Text Block] |
Table Summary
Countries |
% |
Japan |
23.7% |
United Kingdom |
11.0% |
Germany |
9.9% |
United States |
8.9% |
France |
6.1% |
Australia |
5.2% |
Netherlands |
5.1% |
Spain |
4.8% |
Italy |
4.8% |
Switzerland |
3.4% | |
| Largest Holdings [Text Block] |
Table Summary
Holdings |
% |
Novartis AG |
2.2% |
Roche Holding AG |
2.2% |
BHP Group Ltd. |
2.1% |
ASML Holding NV |
2.0% |
Banco Santander SA |
1.9% |
Banco Bilbao Vizcaya Argentaria SA |
1.7% |
Deutsche Telekom AG |
1.5% |
Intesa Sanpaolo SpA |
1.5% |
Deutsche Bank AG |
1.4% |
Barclays PLC |
1.4% | |
| Material Fund Change [Text Block] |
|
| C000143793 |
|
| Shareholder Report [Line Items] |
|
| Fund Name |
State Street International Stock Selection Fund
|
| Class Name |
Class K
|
| Trading Symbol |
SSIQX
|
| Annual or Semi-Annual Statement [Text Block] |
This annual shareholder report contains important information about the State Street International Stock Selection Fund (the "Fund") for the period of September 1, 2025 through August 31, 2026.
|
| Additional Information [Text Block] |
You can find additional information about the Fund at www.ssga.com/us/en/institutional/fund-finder?tab=documents&type=mf. You can also request this information about the Fund by contacting us at 1-800-647-7327.
|
| Additional Information Phone Number |
1-800-647-7327
|
| Additional Information Website |
<span style="box-sizing: border-box; color: rgb(0, 0, 0); display: inline; flex-wrap: nowrap; font-size: 12px; font-weight: 400; grid-area: auto; line-height: 14.4px; margin: 0px; overflow: visible; text-align: left; text-align-last: auto; white-space-collapse: preserve-breaks;">www.ssga.com/us/en/institutional/fund-finder?tab=documents&type=mf</span>
|
| Expenses [Text Block] |
What were the Fund costs for the last year? (based on a hypothetical $10,000 Investment)
Table Summary
Class Name |
Costs of a $10,000 investment |
Costs paid as a percentage of a $10,000 investment |
Class K |
$86 |
0.75% | |
| Expenses Paid, Amount |
$ 86
|
| Expense Ratio, Percent |
0.75%
|
| Factors Affecting Performance [Text Block] |
How did the Fund perform last year and what affected its performance?Value and Sentiment factors were the primary contributors to the Fund’s outperformance relative to the Index during the reporting period. Value generated strong returns across regions as attractively valued companies outperformed more expensive counterparts, while Sentiment added value, particularly in Europe, reflecting the strong performance of market-favored companies. Stock selection was broadly positive, with the strongest contributions coming from Industrials, Consumer Discretionary, and Financials. In contrast, stock selection detracted value in Information Technology and Real Estate. Regionally, Europe and Japan were the largest contributors to excess returns from security selection. |
| Performance Past Does Not Indicate Future [Text] |
The Fund’s past performance is not necessarily an indication of how the Fund will perform in the future. The returns do not reflect the deduction of taxes that a shareholder would pay on Fund distributions or on the redemption or sale of Fund shares.
|
| Line Graph [Table Text Block] |
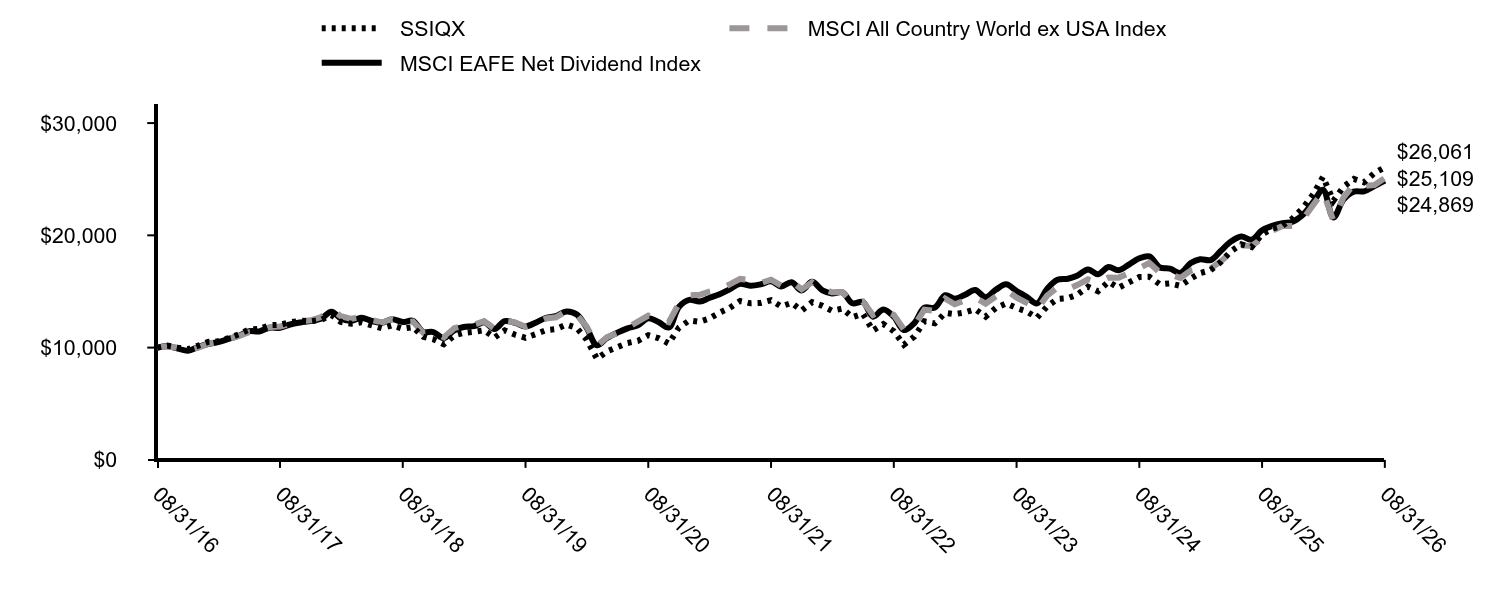
Table Summary
|
SSIQX |
MSCI All Country World ex USA Index |
MSCI EAFE Net Dividend Index |
08/31/16 |
$10,000 |
$10,000 |
$10,000 |
09/30/16 |
$10,178 |
$10,123 |
$10,123 |
10/31/16 |
$10,000 |
$9,978 |
$9,916 |
11/30/16 |
$9,862 |
$9,747 |
$9,718 |
12/31/16 |
$10,172 |
$9,996 |
$10,051 |
01/31/17 |
$10,518 |
$10,350 |
$10,342 |
02/28/17 |
$10,569 |
$10,515 |
$10,490 |
03/31/17 |
$10,844 |
$10,782 |
$10,779 |
04/30/17 |
$11,180 |
$11,013 |
$11,053 |
05/31/17 |
$11,618 |
$11,370 |
$11,459 |
06/30/17 |
$11,659 |
$11,406 |
$11,439 |
07/31/17 |
$11,995 |
$11,826 |
$11,768 |
08/31/17 |
$12,025 |
$11,888 |
$11,764 |
09/30/17 |
$12,260 |
$12,108 |
$12,057 |
10/31/17 |
$12,392 |
$12,336 |
$12,240 |
11/30/17 |
$12,341 |
$12,436 |
$12,368 |
12/31/17 |
$12,472 |
$12,714 |
$12,567 |
01/31/18 |
$12,895 |
$13,423 |
$13,197 |
02/28/18 |
$12,281 |
$12,790 |
$12,601 |
03/31/18 |
$12,122 |
$12,564 |
$12,374 |
04/30/18 |
$12,249 |
$12,765 |
$12,657 |
05/31/18 |
$11,985 |
$12,470 |
$12,372 |
06/30/18 |
$11,720 |
$12,236 |
$12,221 |
07/31/18 |
$11,985 |
$12,528 |
$12,522 |
08/31/18 |
$11,688 |
$12,266 |
$12,280 |
09/30/18 |
$11,826 |
$12,322 |
$12,387 |
10/31/18 |
$10,968 |
$11,320 |
$11,401 |
11/30/18 |
$10,746 |
$11,427 |
$11,386 |
12/31/18 |
$10,297 |
$10,910 |
$10,834 |
01/31/19 |
$11,075 |
$11,734 |
$11,546 |
02/28/19 |
$11,311 |
$11,963 |
$11,840 |
03/31/19 |
$11,413 |
$12,034 |
$11,915 |
04/30/19 |
$11,548 |
$12,352 |
$12,250 |
05/31/19 |
$10,894 |
$11,689 |
$11,661 |
06/30/19 |
$11,536 |
$12,393 |
$12,353 |
07/31/19 |
$11,142 |
$12,243 |
$12,196 |
08/31/19 |
$10,872 |
$11,865 |
$11,880 |
09/30/19 |
$11,198 |
$12,170 |
$12,221 |
10/31/19 |
$11,559 |
$12,595 |
$12,660 |
11/30/19 |
$11,649 |
$12,706 |
$12,803 |
12/31/19 |
$12,058 |
$13,256 |
$13,219 |
01/31/20 |
$11,743 |
$12,900 |
$12,943 |
02/29/20 |
$10,727 |
$11,881 |
$11,773 |
03/31/20 |
$9,000 |
$10,160 |
$10,201 |
04/30/20 |
$9,665 |
$10,930 |
$10,860 |
05/31/20 |
$10,050 |
$11,288 |
$11,333 |
06/30/20 |
$10,412 |
$11,798 |
$11,719 |
07/31/20 |
$10,599 |
$12,324 |
$11,992 |
08/31/20 |
$11,112 |
$12,852 |
$12,609 |
09/30/20 |
$10,844 |
$12,536 |
$12,281 |
10/31/20 |
$10,365 |
$12,266 |
$11,791 |
11/30/20 |
$11,778 |
$13,916 |
$13,619 |
12/31/20 |
$12,421 |
$14,668 |
$14,252 |
01/31/21 |
$12,302 |
$14,700 |
$14,100 |
02/28/21 |
$12,576 |
$14,991 |
$14,416 |
03/31/21 |
$13,112 |
$15,181 |
$14,748 |
04/30/21 |
$13,542 |
$15,628 |
$15,192 |
05/31/21 |
$14,161 |
$16,117 |
$15,687 |
06/30/21 |
$13,947 |
$16,012 |
$15,510 |
07/31/21 |
$13,983 |
$15,748 |
$15,627 |
08/31/21 |
$14,221 |
$16,048 |
$15,903 |
09/30/21 |
$13,673 |
$15,534 |
$15,441 |
10/31/21 |
$13,983 |
$15,905 |
$15,821 |
11/30/21 |
$13,303 |
$15,188 |
$15,085 |
12/31/21 |
$14,046 |
$15,816 |
$15,857 |
01/31/22 |
$13,722 |
$15,233 |
$15,091 |
02/28/22 |
$13,284 |
$14,932 |
$14,824 |
03/31/22 |
$13,472 |
$14,956 |
$14,919 |
04/30/22 |
$12,709 |
$14,016 |
$13,954 |
05/31/22 |
$13,022 |
$14,117 |
$14,059 |
06/30/22 |
$11,522 |
$12,903 |
$12,754 |
07/31/22 |
$12,097 |
$13,344 |
$13,390 |
08/31/22 |
$11,460 |
$12,915 |
$12,754 |
09/30/22 |
$10,260 |
$11,624 |
$11,561 |
10/31/22 |
$10,972 |
$11,972 |
$12,182 |
11/30/22 |
$12,334 |
$13,385 |
$13,555 |
12/31/22 |
$12,162 |
$13,285 |
$13,565 |
01/31/23 |
$13,096 |
$14,362 |
$14,664 |
02/28/23 |
$12,979 |
$13,858 |
$14,358 |
03/31/23 |
$13,135 |
$14,197 |
$14,714 |
04/30/23 |
$13,420 |
$14,444 |
$15,129 |
05/31/23 |
$12,759 |
$13,918 |
$14,489 |
06/30/23 |
$13,524 |
$14,543 |
$15,148 |
07/31/23 |
$13,938 |
$15,134 |
$15,639 |
08/31/23 |
$13,524 |
$14,451 |
$15,039 |
09/30/23 |
$13,225 |
$13,994 |
$14,526 |
10/31/23 |
$12,655 |
$13,417 |
$13,937 |
11/30/23 |
$13,666 |
$14,625 |
$15,230 |
12/31/23 |
$14,337 |
$15,359 |
$16,040 |
01/31/24 |
$14,406 |
$15,207 |
$16,132 |
02/29/24 |
$14,736 |
$15,592 |
$16,427 |
03/31/24 |
$15,423 |
$16,079 |
$16,967 |
04/30/24 |
$15,025 |
$15,790 |
$16,533 |
05/31/24 |
$15,863 |
$16,249 |
$17,173 |
06/30/24 |
$15,327 |
$16,233 |
$16,896 |
07/31/24 |
$15,808 |
$16,609 |
$17,392 |
08/31/24 |
$16,289 |
$17,082 |
$17,957 |
09/30/24 |
$16,303 |
$17,542 |
$18,123 |
10/31/24 |
$15,643 |
$16,681 |
$17,138 |
11/30/24 |
$15,726 |
$16,530 |
$17,040 |
12/31/24 |
$15,499 |
$16,209 |
$16,653 |
01/31/25 |
$16,156 |
$16,862 |
$17,528 |
02/28/25 |
$16,641 |
$17,096 |
$17,868 |
03/31/25 |
$16,899 |
$17,058 |
$17,796 |
04/30/25 |
$17,613 |
$17,673 |
$18,611 |
05/31/25 |
$18,598 |
$18,483 |
$19,462 |
06/30/25 |
$19,198 |
$19,110 |
$19,891 |
07/31/25 |
$18,956 |
$19,055 |
$19,612 |
08/31/25 |
$20,098 |
$19,717 |
$20,448 |
09/30/25 |
$20,598 |
$20,427 |
$20,839 |
10/31/25 |
$20,855 |
$20,840 |
$21,085 |
11/30/25 |
$21,512 |
$20,834 |
$21,216 |
12/31/25 |
$22,457 |
$21,459 |
$21,852 |
01/31/26 |
$23,701 |
$22,742 |
$22,992 |
02/28/26 |
$25,211 |
$23,885 |
$24,056 |
03/31/26 |
$23,071 |
$21,308 |
$21,581 |
04/30/26 |
$24,330 |
$23,364 |
$23,189 |
05/31/26 |
$25,022 |
$24,540 |
$23,900 |
06/30/26 |
$24,723 |
$24,396 |
$23,916 |
07/31/26 |
$25,542 |
$24,479 |
$24,384 |
08/31/26 |
$26,061 |
$25,109 |
$24,869 |
|
| Average Annual Return [Table Text Block] |
Average Annual Total Returns (%)
Table Summary
Name |
1 Year |
5 Years |
10 Years |
SSIQX |
29.67% |
12.88% |
10.05% |
MSCI All Country World ex USA Index |
27.35% |
9.37% |
9.64% |
MSCI EAFE Net Dividend Index |
21.62% |
9.35% |
9.54% | The Fund’s past performance is not necessarily an indication of how the Fund will perform in the future. The returns do not reflect the deduction of taxes that a shareholder would pay on Fund distributions or on the redemption or sale of Fund shares. Updated performance information is available by calling 1-800-647-7327 or visiting our website at www.ssga.com. |
| Updated Performance Information Location [Text Block] |
Updated performance information is available by calling 1-800-647-7327 or visiting our website at www.ssga.com.
|
| AssetsNet |
$ 192,988,432
|
| Holdings Count | Holding |
191
|
| Advisory Fees Paid, Amount |
$ 1,135,461
|
| InvestmentCompanyPortfolioTurnover |
100.00%
|
| Additional Fund Statistics [Text Block] |
Key Fund Statistics as of 8/31/2026- Total Net Assets$192,988,432
- Number of Portfolio Holdings191
- Portfolio Turnover Rate100%
- Total Advisory Fees Paid$1,135,461
|
| Holdings [Text Block] |
Table Summary
Countries |
% |
Japan |
23.7% |
United Kingdom |
11.0% |
Germany |
9.9% |
United States |
8.9% |
France |
6.1% |
Australia |
5.2% |
Netherlands |
5.1% |
Spain |
4.8% |
Italy |
4.8% |
Switzerland |
3.4% | |
| Largest Holdings [Text Block] |
Table Summary
Holdings |
% |
Novartis AG |
2.2% |
Roche Holding AG |
2.2% |
BHP Group Ltd. |
2.1% |
ASML Holding NV |
2.0% |
Banco Santander SA |
1.9% |
Banco Bilbao Vizcaya Argentaria SA |
1.7% |
Deutsche Telekom AG |
1.5% |
Intesa Sanpaolo SpA |
1.5% |
Deutsche Bank AG |
1.4% |
Barclays PLC |
1.4% | |
| Material Fund Change [Text Block] |
|
| C000014139 |
|
| Shareholder Report [Line Items] |
|
| Fund Name |
State Street International Stock Selection Fund
|
| Class Name |
Class N
|
| Trading Symbol |
SSAIX
|
| Annual or Semi-Annual Statement [Text Block] |
This annual shareholder report contains important information about the State Street International Stock Selection Fund (the "Fund") for the period of September 1, 2025 through August 31, 2026.
|
| Additional Information [Text Block] |
You can find additional information about the Fund at www.ssga.com/us/en/institutional/fund-finder?tab=documents&type=mf. You can also request this information about the Fund by contacting us at 1-800-647-7327.
|
| Additional Information Phone Number |
1-800-647-7327
|
| Additional Information Website |
<span style="box-sizing: border-box; color: rgb(0, 0, 0); display: inline; flex-wrap: nowrap; font-size: 12px; font-weight: 400; grid-area: auto; line-height: 14.4px; margin: 0px; overflow: visible; text-align: left; text-align-last: auto; white-space-collapse: preserve-breaks;">www.ssga.com/us/en/institutional/fund-finder?tab=documents&type=mf</span>
|
| Expenses [Text Block] |
What were the Fund costs for the last year? (based on a hypothetical $10,000 Investment)
Table Summary
Class Name |
Costs of a $10,000 investment |
Costs paid as a percentage of a $10,000 investment |
Class N |
$115 |
1.00% | |
| Expenses Paid, Amount |
$ 115
|
| Expense Ratio, Percent |
1.00%
|
| Factors Affecting Performance [Text Block] |
How did the Fund perform last year and what affected its performance?Value and Sentiment factors were the primary contributors to the Fund’s outperformance relative to the Index during the reporting period. Value generated strong returns across regions as attractively valued companies outperformed more expensive counterparts, while Sentiment added value, particularly in Europe, reflecting the strong performance of market-favored companies. Stock selection was broadly positive, with the strongest contributions coming from Industrials, Consumer Discretionary, and Financials. In contrast, stock selection detracted value in Information Technology and Real Estate. Regionally, Europe and Japan were the largest contributors to excess returns from security selection. |
| Performance Past Does Not Indicate Future [Text] |
The Fund’s past performance is not necessarily an indication of how the Fund will perform in the future. The returns do not reflect the deduction of taxes that a shareholder would pay on Fund distributions or on the redemption or sale of Fund shares.
|
| Line Graph [Table Text Block] |
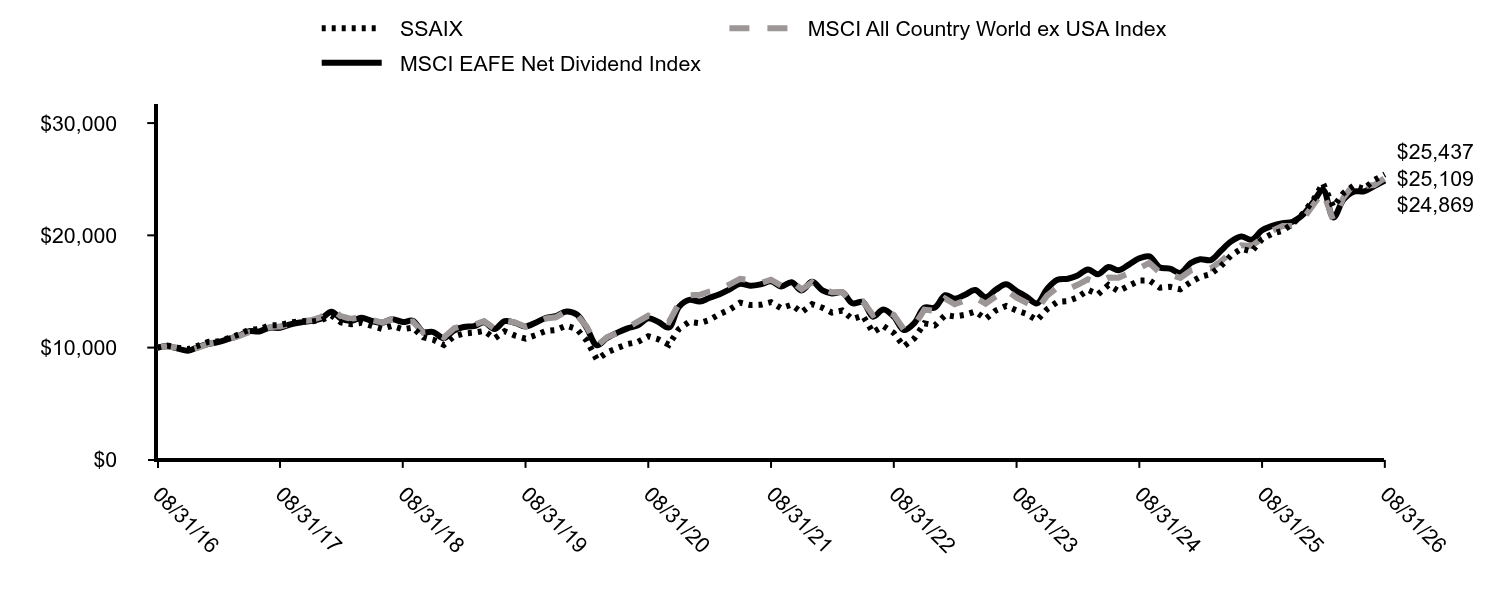
Table Summary
|
SSAIX |
MSCI All Country World ex USA Index |
MSCI EAFE Net Dividend Index |
08/31/16 |
$10,000 |
$10,000 |
$10,000 |
09/30/16 |
$10,178 |
$10,123 |
$10,123 |
10/31/16 |
$10,000 |
$9,978 |
$9,916 |
11/30/16 |
$9,862 |
$9,747 |
$9,718 |
12/31/16 |
$10,174 |
$9,996 |
$10,051 |
01/31/17 |
$10,520 |
$10,350 |
$10,342 |
02/28/17 |
$10,560 |
$10,515 |
$10,490 |
03/31/17 |
$10,835 |
$10,782 |
$10,779 |
04/30/17 |
$11,160 |
$11,013 |
$11,053 |
05/31/17 |
$11,597 |
$11,370 |
$11,459 |
06/30/17 |
$11,648 |
$11,406 |
$11,439 |
07/31/17 |
$11,973 |
$11,826 |
$11,768 |
08/31/17 |
$12,004 |
$11,888 |
$11,764 |
09/30/17 |
$12,227 |
$12,108 |
$12,057 |
10/31/17 |
$12,369 |
$12,336 |
$12,240 |
11/30/17 |
$12,319 |
$12,436 |
$12,368 |
12/31/17 |
$12,438 |
$12,714 |
$12,567 |
01/31/18 |
$12,859 |
$13,423 |
$13,197 |
02/28/18 |
$12,248 |
$12,790 |
$12,601 |
03/31/18 |
$12,079 |
$12,564 |
$12,374 |
04/30/18 |
$12,206 |
$12,765 |
$12,657 |
05/31/18 |
$11,942 |
$12,470 |
$12,372 |
06/30/18 |
$11,668 |
$12,236 |
$12,221 |
07/31/18 |
$11,942 |
$12,528 |
$12,522 |
08/31/18 |
$11,637 |
$12,266 |
$12,280 |
09/30/18 |
$11,774 |
$12,322 |
$12,387 |
10/31/18 |
$10,920 |
$11,320 |
$11,401 |
11/30/18 |
$10,688 |
$11,427 |
$11,386 |
12/31/18 |
$10,241 |
$10,910 |
$10,834 |
01/31/19 |
$11,012 |
$11,734 |
$11,546 |
02/28/19 |
$11,247 |
$11,963 |
$11,840 |
03/31/19 |
$11,336 |
$12,034 |
$11,915 |
04/30/19 |
$11,482 |
$12,352 |
$12,250 |
05/31/19 |
$10,822 |
$11,689 |
$11,661 |
06/30/19 |
$11,459 |
$12,393 |
$12,353 |
07/31/19 |
$11,068 |
$12,243 |
$12,196 |
08/31/19 |
$10,800 |
$11,865 |
$11,880 |
09/30/19 |
$11,113 |
$12,170 |
$12,221 |
10/31/19 |
$11,482 |
$12,595 |
$12,660 |
11/30/19 |
$11,571 |
$12,706 |
$12,803 |
12/31/19 |
$11,956 |
$13,256 |
$13,219 |
01/31/20 |
$11,656 |
$12,900 |
$12,943 |
02/29/20 |
$10,639 |
$11,881 |
$11,773 |
03/31/20 |
$8,930 |
$10,160 |
$10,201 |
04/30/20 |
$9,577 |
$10,930 |
$10,860 |
05/31/20 |
$9,969 |
$11,288 |
$11,333 |
06/30/20 |
$10,316 |
$11,798 |
$11,719 |
07/31/20 |
$10,501 |
$12,324 |
$11,992 |
08/31/20 |
$11,009 |
$12,852 |
$12,609 |
09/30/20 |
$10,743 |
$12,536 |
$12,281 |
10/31/20 |
$10,258 |
$12,266 |
$11,791 |
11/30/20 |
$11,656 |
$13,916 |
$13,619 |
12/31/20 |
$12,298 |
$14,668 |
$14,252 |
01/31/21 |
$12,180 |
$14,700 |
$14,100 |
02/28/21 |
$12,451 |
$14,991 |
$14,416 |
03/31/21 |
$12,980 |
$15,181 |
$14,748 |
04/30/21 |
$13,392 |
$15,628 |
$15,192 |
05/31/21 |
$14,004 |
$16,117 |
$15,687 |
06/30/21 |
$13,792 |
$16,012 |
$15,510 |
07/31/21 |
$13,816 |
$15,748 |
$15,627 |
08/31/21 |
$14,051 |
$16,048 |
$15,903 |
09/30/21 |
$13,510 |
$15,534 |
$15,441 |
10/31/21 |
$13,816 |
$15,905 |
$15,821 |
11/30/21 |
$13,145 |
$15,188 |
$15,085 |
12/31/21 |
$13,867 |
$15,816 |
$15,857 |
01/31/22 |
$13,547 |
$15,233 |
$15,091 |
02/28/22 |
$13,117 |
$14,932 |
$14,824 |
03/31/22 |
$13,301 |
$14,956 |
$14,919 |
04/30/22 |
$12,538 |
$14,016 |
$13,954 |
05/31/22 |
$12,846 |
$14,117 |
$14,059 |
06/30/22 |
$11,357 |
$12,903 |
$12,754 |
07/31/22 |
$11,923 |
$13,344 |
$13,390 |
08/31/22 |
$11,296 |
$12,915 |
$12,754 |
09/30/22 |
$10,114 |
$11,624 |
$11,561 |
10/31/22 |
$10,816 |
$11,972 |
$12,182 |
11/30/22 |
$12,157 |
$13,385 |
$13,555 |
12/31/22 |
$11,981 |
$13,285 |
$13,565 |
01/31/23 |
$12,897 |
$14,362 |
$14,664 |
02/28/23 |
$12,770 |
$13,858 |
$14,358 |
03/31/23 |
$12,923 |
$14,197 |
$14,714 |
04/30/23 |
$13,216 |
$14,444 |
$15,129 |
05/31/23 |
$12,554 |
$13,918 |
$14,489 |
06/30/23 |
$13,305 |
$14,543 |
$15,148 |
07/31/23 |
$13,712 |
$15,134 |
$15,639 |
08/31/23 |
$13,305 |
$14,451 |
$15,039 |
09/30/23 |
$12,999 |
$13,994 |
$14,526 |
10/31/23 |
$12,439 |
$13,417 |
$13,937 |
11/30/23 |
$13,419 |
$14,625 |
$15,230 |
12/31/23 |
$14,080 |
$15,359 |
$16,040 |
01/31/24 |
$14,147 |
$15,207 |
$16,132 |
02/29/24 |
$14,471 |
$15,592 |
$16,427 |
03/31/24 |
$15,144 |
$16,079 |
$16,967 |
04/30/24 |
$14,753 |
$15,790 |
$16,533 |
05/31/24 |
$15,574 |
$16,249 |
$17,173 |
06/30/24 |
$15,036 |
$16,233 |
$16,896 |
07/31/24 |
$15,507 |
$16,609 |
$17,392 |
08/31/24 |
$15,978 |
$17,082 |
$17,957 |
09/30/24 |
$15,992 |
$17,542 |
$18,123 |
10/31/24 |
$15,332 |
$16,681 |
$17,138 |
11/30/24 |
$15,413 |
$16,530 |
$17,040 |
12/31/24 |
$15,191 |
$16,209 |
$16,653 |
01/31/25 |
$15,832 |
$16,862 |
$17,528 |
02/28/25 |
$16,306 |
$17,096 |
$17,868 |
03/31/25 |
$16,544 |
$17,058 |
$17,796 |
04/30/25 |
$17,241 |
$17,673 |
$18,611 |
05/31/25 |
$18,217 |
$18,483 |
$19,462 |
06/30/25 |
$18,803 |
$19,110 |
$19,891 |
07/31/25 |
$18,552 |
$19,055 |
$19,612 |
08/31/25 |
$19,668 |
$19,717 |
$20,448 |
09/30/25 |
$20,142 |
$20,427 |
$20,839 |
10/31/25 |
$20,407 |
$20,840 |
$21,085 |
11/30/25 |
$21,035 |
$20,834 |
$21,216 |
12/31/25 |
$21,957 |
$21,459 |
$21,852 |
01/31/26 |
$23,168 |
$22,742 |
$22,992 |
02/28/26 |
$24,640 |
$23,885 |
$24,056 |
03/31/26 |
$22,539 |
$21,308 |
$21,581 |
04/30/26 |
$23,766 |
$23,364 |
$23,189 |
05/31/26 |
$24,441 |
$24,540 |
$23,900 |
06/30/26 |
$24,134 |
$24,396 |
$23,916 |
07/31/26 |
$24,931 |
$24,479 |
$24,384 |
08/31/26 |
$25,437 |
$25,109 |
$24,869 |
|
| Average Annual Return [Table Text Block] |
Average Annual Total Returns (%)
Table Summary
Name |
1 Year |
5 Years |
10 Years |
SSAIX |
29.33% |
12.60% |
9.79% |
MSCI All Country World ex USA Index |
27.35% |
9.37% |
9.64% |
MSCI EAFE Net Dividend Index |
21.62% |
9.35% |
9.54% | The Fund’s past performance is not necessarily an indication of how the Fund will perform in the future. The returns do not reflect the deduction of taxes that a shareholder would pay on Fund distributions or on the redemption or sale of Fund shares. Updated performance information is available by calling 1-800-647-7327 or visiting our website at www.ssga.com. |
| Updated Performance Information Location [Text Block] |
Updated performance information is available by calling 1-800-647-7327 or visiting our website at www.ssga.com.
|
| AssetsNet |
$ 192,988,432
|
| Holdings Count | Holding |
191
|
| Advisory Fees Paid, Amount |
$ 1,135,461
|
| InvestmentCompanyPortfolioTurnover |
100.00%
|
| Additional Fund Statistics [Text Block] |
Key Fund Statistics as of 8/31/2026- Total Net Assets$192,988,432
- Number of Portfolio Holdings191
- Portfolio Turnover Rate100%
- Total Advisory Fees Paid$1,135,461
|
| Holdings [Text Block] |
Table Summary
Countries |
% |
Japan |
23.7% |
United Kingdom |
11.0% |
Germany |
9.9% |
United States |
8.9% |
France |
6.1% |
Australia |
5.2% |
Netherlands |
5.1% |
Spain |
4.8% |
Italy |
4.8% |
Switzerland |
3.4% | |
| Largest Holdings [Text Block] |
Table Summary
Holdings |
% |
Novartis AG |
2.2% |
Roche Holding AG |
2.2% |
BHP Group Ltd. |
2.1% |
ASML Holding NV |
2.0% |
Banco Santander SA |
1.9% |
Banco Bilbao Vizcaya Argentaria SA |
1.7% |
Deutsche Telekom AG |
1.5% |
Intesa Sanpaolo SpA |
1.5% |
Deutsche Bank AG |
1.4% |
Barclays PLC |
1.4% | |
| Material Fund Change [Text Block] |
|
| C000014159 |
|
| Shareholder Report [Line Items] |
|
| Fund Name |
State Street S&P 500 Index Fund
|
| Class Name |
Class N
|
| Trading Symbol |
SVSPX
|
| Annual or Semi-Annual Statement [Text Block] |
This annual shareholder report contains important information about the State Street S&P 500 Index Fund (the "Fund") for the period of September 1, 2025 through August 31, 2026.
|
| Additional Information [Text Block] |
You can find additional information about the Fund at www.ssga.com/us/en/institutional/fund-finder?tab=documents&type=mf. You can also request this information about the Fund by contacting us at 1-800-647-7327.
|
| Material Fund Change Notice [Text Block] |
This report describes changes to the Fund that occurred during the reporting period.
|
| Additional Information Phone Number |
1-800-647-7327
|
| Additional Information Website |
<span style="box-sizing: border-box; color: rgb(0, 0, 0); display: inline; flex-wrap: nowrap; font-size: 12px; font-weight: 400; grid-area: auto; line-height: 14.4px; margin: 0px; overflow: visible; text-align: left; text-align-last: auto; white-space-collapse: preserve-breaks;">www.ssga.com/us/en/institutional/fund-finder?tab=documents&type=mf</span>
|
| Expenses [Text Block] |
What were the Fund costs for the last year? (based on a hypothetical $10,000 Investment)
Table Summary
Class Name |
Costs of a $10,000 investment |
Costs paid as a percentage of a $10,000 investment |
Class N |
$17 |
0.15% | |
| Expenses Paid, Amount |
$ 17
|
| Expense Ratio, Percent |
0.15%
|
| Factors Affecting Performance [Text Block] |
How did the Fund perform last year and what affected its performance?During the reporting period, U.S. equity markets generated positive returns despite periods of volatility. Investor sentiment was supported by corporate earnings, moderating inflation, and evolving expectations for monetary policy. Market performance was driven largely by continued enthusiasm surrounding Artificial Intelligence ("A.I.")-related technologies, with companies tied to semiconductors, cloud computing, and digital infrastructure benefiting from strong earnings growth and elevated investor demand. External market reports identified A.I.-related investment and favorable earnings results as significant contributors to equity market gains during the period. Market leadership remained concentrated among a relatively small group of large-cap growth companies, particularly within the information technology and communication services sectors. Changes in interest rate expectations and economic growth forecasts contributed to periodic fluctuations in equity valuations; however, improving inflation trends and generally favorable corporate fundamentals supported overall market returns. External market commentary also cited cooling inflation and a stable interest-rate environment as factors supporting investor confidence and equity valuations. |
| Performance Past Does Not Indicate Future [Text] |
The Fund’s past performance is not necessarily an indication of how the Fund will perform in the future. The returns do not reflect the deduction of taxes that a shareholder would pay on Fund distributions or on the redemption or sale of Fund shares.
|
| Line Graph [Table Text Block] |
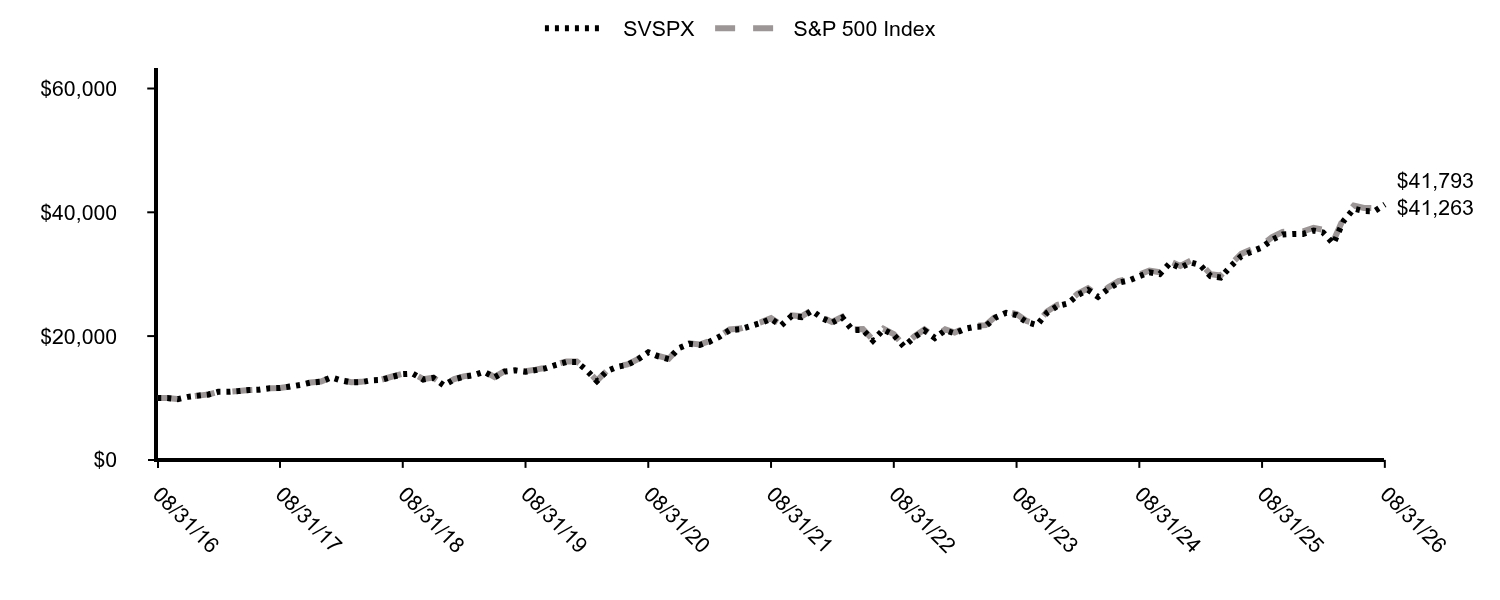
Table Summary
|
SVSPX |
S&P 500 Index |
08/31/16 |
$10,000 |
$10,000 |
09/30/16 |
$10,000 |
$10,002 |
10/31/16 |
$9,816 |
$9,819 |
11/30/16 |
$10,179 |
$10,183 |
12/31/16 |
$10,379 |
$10,384 |
01/31/17 |
$10,573 |
$10,581 |
02/28/17 |
$10,993 |
$11,001 |
03/31/17 |
$11,005 |
$11,014 |
04/30/17 |
$11,117 |
$11,127 |
05/31/17 |
$11,271 |
$11,284 |
06/30/17 |
$11,341 |
$11,354 |
07/31/17 |
$11,570 |
$11,588 |
08/31/17 |
$11,606 |
$11,623 |
09/30/17 |
$11,843 |
$11,863 |
10/31/17 |
$12,118 |
$12,140 |
11/30/17 |
$12,491 |
$12,512 |
12/31/17 |
$12,629 |
$12,651 |
01/31/18 |
$13,348 |
$13,376 |
02/28/18 |
$12,850 |
$12,883 |
03/31/18 |
$12,519 |
$12,555 |
04/30/18 |
$12,566 |
$12,604 |
05/31/18 |
$12,867 |
$12,907 |
06/30/18 |
$12,941 |
$12,987 |
07/31/18 |
$13,423 |
$13,470 |
08/31/18 |
$13,858 |
$13,909 |
09/30/18 |
$13,935 |
$13,988 |
10/31/18 |
$12,983 |
$13,032 |
11/30/18 |
$13,242 |
$13,297 |
12/31/18 |
$12,045 |
$12,097 |
01/31/19 |
$13,010 |
$13,066 |
02/28/19 |
$13,424 |
$13,486 |
03/31/19 |
$13,685 |
$13,748 |
04/30/19 |
$14,237 |
$14,304 |
05/31/19 |
$13,329 |
$13,395 |
06/30/19 |
$14,268 |
$14,339 |
07/31/19 |
$14,472 |
$14,546 |
08/31/19 |
$14,234 |
$14,315 |
09/30/19 |
$14,500 |
$14,583 |
10/31/19 |
$14,813 |
$14,899 |
11/30/19 |
$15,346 |
$15,440 |
12/31/19 |
$15,811 |
$15,906 |
01/31/20 |
$15,799 |
$15,899 |
02/29/20 |
$14,495 |
$14,591 |
03/31/20 |
$12,737 |
$12,788 |
04/30/20 |
$14,367 |
$14,428 |
05/31/20 |
$15,051 |
$15,115 |
06/30/20 |
$15,358 |
$15,416 |
07/31/20 |
$16,223 |
$16,285 |
08/31/20 |
$17,386 |
$17,455 |
09/30/20 |
$16,720 |
$16,792 |
10/31/20 |
$16,276 |
$16,346 |
11/30/20 |
$18,059 |
$18,135 |
12/31/20 |
$18,751 |
$18,832 |
01/31/21 |
$18,557 |
$18,642 |
02/28/21 |
$19,069 |
$19,156 |
03/31/21 |
$19,905 |
$19,995 |
04/30/21 |
$20,966 |
$21,062 |
05/31/21 |
$21,110 |
$21,209 |
06/30/21 |
$21,598 |
$21,704 |
07/31/21 |
$22,107 |
$22,220 |
08/31/21 |
$22,777 |
$22,895 |
09/30/21 |
$21,717 |
$21,831 |
10/31/21 |
$23,237 |
$23,360 |
11/30/21 |
$23,070 |
$23,198 |
12/31/21 |
$24,102 |
$24,238 |
01/31/22 |
$22,851 |
$22,984 |
02/28/22 |
$22,165 |
$22,295 |
03/31/22 |
$22,986 |
$23,123 |
04/30/22 |
$20,975 |
$21,107 |
05/31/22 |
$21,012 |
$21,146 |
06/30/22 |
$19,277 |
$19,400 |
07/31/22 |
$21,054 |
$21,189 |
08/31/22 |
$20,190 |
$20,325 |
09/30/22 |
$18,326 |
$18,453 |
10/31/22 |
$19,808 |
$19,947 |
11/30/22 |
$20,913 |
$21,062 |
12/31/22 |
$19,704 |
$19,848 |
01/31/23 |
$20,942 |
$21,095 |
02/28/23 |
$20,430 |
$20,581 |
03/31/23 |
$21,177 |
$21,336 |
04/30/23 |
$21,505 |
$21,669 |
05/31/23 |
$21,596 |
$21,763 |
06/30/23 |
$23,022 |
$23,201 |
07/31/23 |
$23,762 |
$23,947 |
08/31/23 |
$23,381 |
$23,566 |
09/30/23 |
$22,262 |
$22,442 |
10/31/23 |
$21,787 |
$21,970 |
11/30/23 |
$23,775 |
$23,977 |
12/31/23 |
$24,856 |
$25,066 |
01/31/24 |
$25,270 |
$25,487 |
02/29/24 |
$26,615 |
$26,848 |
03/31/24 |
$27,469 |
$27,712 |
04/30/24 |
$26,343 |
$26,580 |
05/31/24 |
$27,647 |
$27,898 |
06/30/24 |
$28,636 |
$28,899 |
07/31/24 |
$28,979 |
$29,251 |
08/31/24 |
$29,677 |
$29,960 |
09/30/24 |
$30,307 |
$30,600 |
10/31/24 |
$30,026 |
$30,322 |
11/30/24 |
$31,786 |
$32,102 |
12/31/24 |
$31,026 |
$31,337 |
01/31/25 |
$31,886 |
$32,210 |
02/28/25 |
$31,465 |
$31,790 |
03/31/25 |
$29,683 |
$29,998 |
04/30/25 |
$29,471 |
$29,795 |
05/31/25 |
$31,327 |
$31,670 |
06/30/25 |
$32,914 |
$33,281 |
07/31/25 |
$33,652 |
$34,028 |
08/31/25 |
$34,332 |
$34,718 |
09/30/25 |
$35,578 |
$35,985 |
10/31/25 |
$36,405 |
$36,827 |
11/30/25 |
$36,493 |
$36,918 |
12/31/25 |
$36,511 |
$36,940 |
01/31/26 |
$37,038 |
$37,476 |
02/28/26 |
$36,753 |
$37,191 |
03/31/26 |
$34,915 |
$35,339 |
04/30/26 |
$38,570 |
$39,047 |
05/31/26 |
$40,595 |
$41,102 |
06/30/26 |
$40,203 |
$40,711 |
07/31/26 |
$40,179 |
$40,685 |
08/31/26 |
$41,263 |
$41,793 |
|
| Average Annual Return [Table Text Block] |
Average Annual Total Returns (%)
Table Summary
Name |
1 Year |
5 Years |
10 Years |
SVSPX |
20.19% |
12.62% |
15.23% |
S&P 500 Index |
20.38% |
12.79% |
15.37% | The Fund’s past performance is not necessarily an indication of how the Fund will perform in the future. The returns do not reflect the deduction of taxes that a shareholder would pay on Fund distributions or on the redemption or sale of Fund shares. Updated performance information is available by calling 1-800-647-7327 or visiting our website at www.ssga.com. |
| Material Change Date |
Aug. 31, 2026
|
| Updated Performance Information Location [Text Block] |
Updated performance information is available by calling 1-800-647-7327 or visiting our website at www.ssga.com.
|
| AssetsNet |
$ 1,714,894,618
|
| Holdings Count | Holding |
507
|
| Advisory Fees Paid, Amount |
$ 329,001
|
| InvestmentCompanyPortfolioTurnover |
3.00%
|
| Additional Fund Statistics [Text Block] |
Key Fund Statistics as of 8/31/2026- Total Net Assets$1,714,894,618
- Number of Portfolio Holdings507
- Portfolio Turnover Rate3%
- Total Advisory Fees Paid$329,001
|
| Holdings [Text Block] |
Table Summary
Sectors |
% |
Information Technology |
37.8% |
Financials |
12.3% |
Communication Services |
9.5% |
Health Care |
9.3% |
Consumer Discretionary |
9.1% |
Industrials |
8.3% |
Consumer Staples |
4.5% |
Energy |
3.5% |
Utilities |
2.0% |
Materials |
1.8% | |
| Largest Holdings [Text Block] |
Table Summary
Holdings |
% |
NVIDIA Corp. |
8.1% |
Apple, Inc. |
7.0% |
Microsoft Corp. |
5.7% |
Amazon.com, Inc. |
3.8% |
Alphabet, Inc., Class A |
3.0% |
Broadcom, Inc. |
2.7% |
Alphabet, Inc., Class C |
2.4% |
Meta Platforms, Inc., Class A |
1.9% |
Micron Technology, Inc. |
1.6% |
Tesla, Inc. |
1.6% | |
| Material Fund Change [Text Block] |
This is a summary of certain changes of the Fund that occurred during the reporting period ended August 31, 2026. For more information contact 1-800-647-7327 (toll free) or refer to the Prospectus, which can be found on the Fund's website below. Effective February 12, 2026, the Fund's principal investment strategy changed to reflect that although it is classified as “diversified” under the Investment Company Act of 1940, it may become “non‑diversified” solely as a result of tracking the underlying index, which may result in investing a relatively high percentage of its assets in a limited number of issuers. Effective February 12, 2026, the Fund made changes to its principal strategy and added a corresponding risk, so that the Fund may become “non-diversified” solely as a result of tracking the underlying index (e.g., changes in relative market capitalization or index weighting of one or more component securities). To the extent the Fund becomes non-diversified due solely to changes in the composition of its index, it will not seek shareholder approval if and when the Fund shifts from diversified to non-diversified. |
| Material Fund Change Strategies [Text Block] |
Effective February 12, 2026, the Fund's principal investment strategy changed to reflect that although it is classified as “diversified” under the Investment Company Act of 1940, it may become “non‑diversified” solely as a result of tracking the underlying index, which may result in investing a relatively high percentage of its assets in a limited number of issuers.
|
| Material Fund Change Risks Change [Text Block] |
Effective February 12, 2026, the Fund made changes to its principal strategy and added a corresponding risk, so that the Fund may become “non-diversified” solely as a result of tracking the underlying index (e.g., changes in relative market capitalization or index weighting of one or more component securities). To the extent the Fund becomes non-diversified due solely to changes in the composition of its index, it will not seek shareholder approval if and when the Fund shifts from diversified to non-diversified.
|
| Summary of Change Legend [Text Block] |
This is a summary of certain changes of the Fund that occurred during the reporting period ended August 31, 2026. For more information contact 1-800-647-7327 (toll free) or refer to the Prospectus, which can be found on the Fund's website below.
|