Carlyle Secured Lending, Inc. (“CGBD”) Quarterly Earnings Presentation September 30, 2026
Plum R117 G45 B79 Dark Gray R101 G101 B101 Light Green R216 G240 B221 Pale Blue R221 G244 B255 Light Indigo R176 G188 B228 Indigo R49 G71 B143 Brown R96 G70 B60 Taupe R209 G199 B189 Light Gray R230 G230 B230 Dark Blue R22 G32 B64 Green R57 G108 B101 Champagne R251 G246 B237 Sky Blue R149 G218 B255 Salmon R240 G196 B188 2 Disclaimer and Forward-Looking Statement This presentation (the “Presentation”) has been prepared by Carlyle Secured Lending, Inc. (together with its consolidated subsidiaries, “we,” “us,” “our,” “CGBD” or the “Company”) (NASDAQ: CGBD) and may only be used for informational purposes only. This Presentation should be viewed in conjunction with the earnings conference call of the Company held on November 6, 2026 and the Company’s Quarterly Report on Form 10-Q for the period ended September 30, 2026. The information contained herein may not be used, reproduced, referenced, quoted, linked by website, or distributed to others, in whole or in part, except as agreed in writing by the Company. This Presentation does not constitute a prospectus and should under no circumstances be understood as an offer to sell or the solicitation of an offer to buy our common stock or any other securities nor will there be any sale of the common stock or any other securities in any state or jurisdiction in which such offer, solicitation or sale would be unlawful prior to the registration or qualification under the securities laws of such state or jurisdiction. This Presentation provides limited information regarding the Company and is not intended to be taken by, and should not be taken by, any individual recipient as investment advice, a recommendation to buy, hold or sell, or an offer to sell or a solicitation of offers to purchase, our common stock or any other securities that may be issued by the Company, or as legal, accounting or tax advice. An investment in securities of the type described herein presents certain risks. This Presentation may contain forward-looking statements that involve substantial risks and uncertainties. You can identify these statements by the use of forward-looking terminology such as “anticipates,” “believes,” “expects,” “intends,” “will,” “should,” “may,” “plans,” “continue,” “seeks,” “estimates,” “would,” “could,” “targets,” “projects,” “outlook,” “potential,” “predicts” and variations of these words and similar expressions to identify forward-looking statements, although not all forward-looking statements include these words. You should read statements that contain these words carefully because they discuss our plans, strategies, prospects and expectations concerning our business, operating results, financial condition and other similar matters. We believe that it is important to communicate our future expectations to our investors. There may be events in the future, however, that we are not able to predict accurately or control. You should not place undue reliance on these forward-looking statements, which speak only as of the date on which we make them. Factors or events that could cause our actual results to differ, possibly materially from our expectations, include, but are not limited to, the risks, uncertainties and other factors we identify in the sections entitled “Risk Factors” and “Cautionary Statement Regarding Forward-Looking Statements” in filings we make with the Securities and Exchange Commission (the “SEC”), and it is not possible for us to predict or identify all of them. We undertake no obligation to update or revise publicly any forward-looking statements, whether as a result of new information, future events or otherwise, except as required by law. Information throughout the Presentation provided by sources other than the Company (including information relating to portfolio companies) has not been independently verified and, accordingly, the Company makes no representation or warranty in respect of this information. The following slides contain summaries of certain financial and statistical information about the Company. The information contained in this Presentation is summary information that is intended to be considered in the context of our SEC filings and other public announcements that we may make, by press release or otherwise, from time to time. We undertake no duty or obligation to publicly update or revise the information contained in this Presentation. CGBD is managed by Carlyle Global Credit Investment Management L.L.C. (the “Investment Adviser”), an SEC-registered investment adviser and a wholly owned subsidiary of The Carlyle Group Inc. (together with its affiliates, “Carlyle”). This Presentation contains information about the Company and certain of its affiliates and includes the Company’s historical performance. You should not view information related to the past performance of the Company as indicative of the Company’s future results, the achievement of which is dependent on many factors, many of which are beyond the control of the Company and the Investment Adviser and cannot be assured. There can be no assurances that future dividends will match or exceed historical rates or will be paid at all. Further, an investment in the Company is discrete from, and does not represent an interest in, any other Carlyle entity. Nothing contained herein shall be relied upon as a promise or representation whether as to the past or future performance of the Company or any other Carlyle entity.
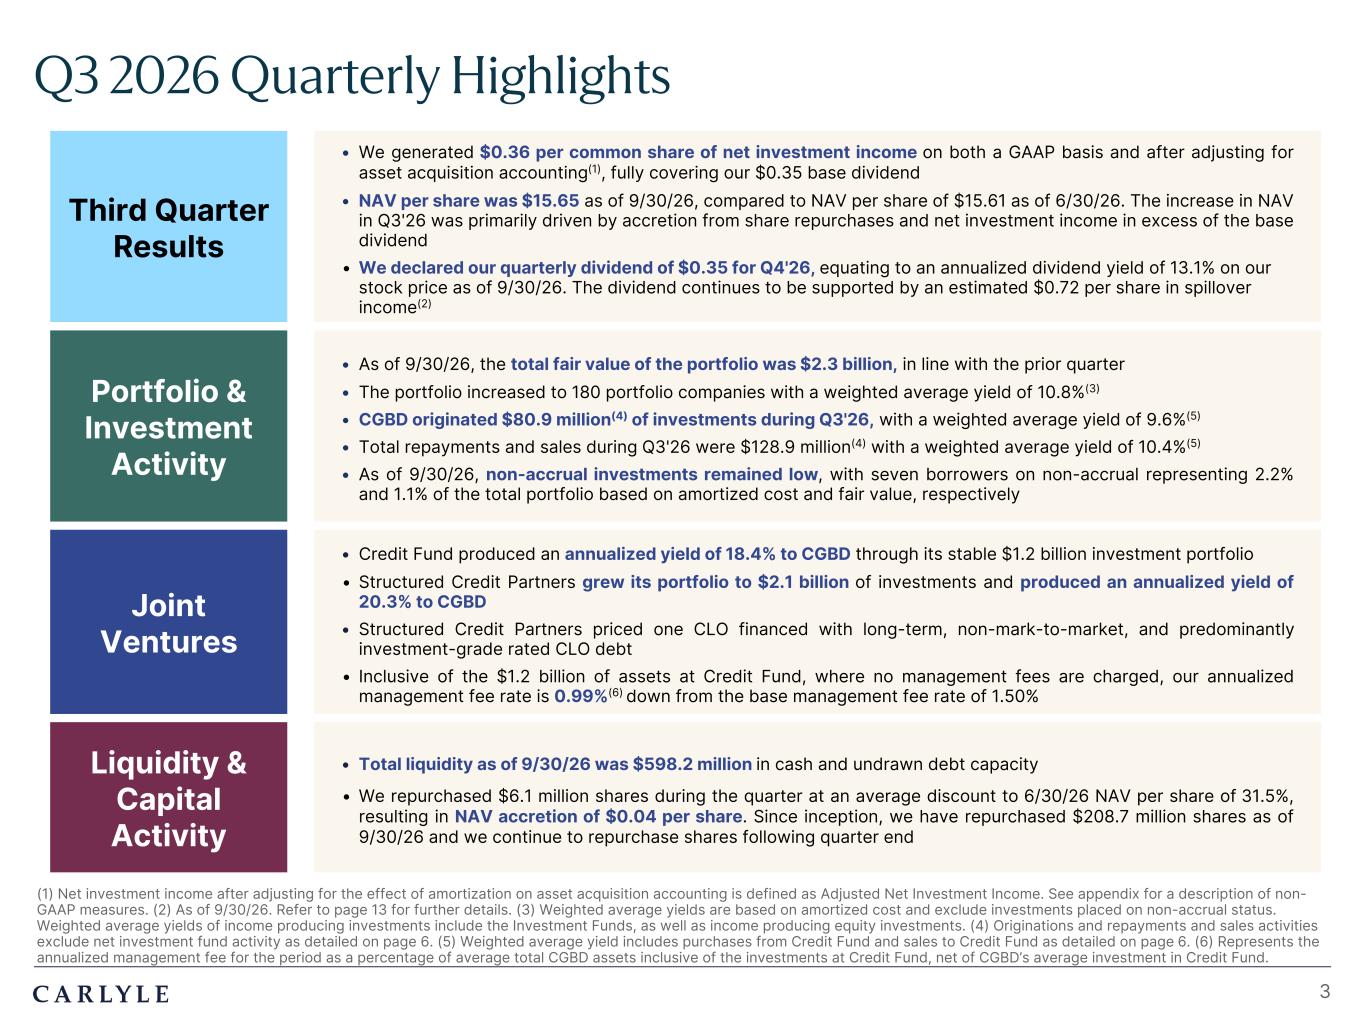
Plum R117 G45 B79 Dark Gray R101 G101 B101 Light Green R216 G240 B221 Pale Blue R221 G244 B255 Light Indigo R176 G188 B228 Indigo R49 G71 B143 Brown R96 G70 B60 Taupe R209 G199 B189 Light Gray R230 G230 B230 Dark Blue R22 G32 B64 Green R57 G108 B101 Champagne R251 G246 B237 Sky Blue R149 G218 B255 Salmon R240 G196 B188 3 Q3 2026 Quarterly Highlights (1) Net investment income after adjusting for the effect of amortization on asset acquisition accounting is defined as Adjusted Net Investment Income. See appendix for a description of non- GAAP measures. (2) As of 9/30/26. Refer to page 13 for further details. (3) Weighted average yields are based on amortized cost and exclude investments placed on non-accrual status. Weighted average yields of income producing investments include the Investment Funds, as well as income producing equity investments. (4) Originations and repayments and sales activities exclude net investment fund activity as detailed on page 6. (5) Weighted average yield includes purchases from Credit Fund and sales to Credit Fund as detailed on page 6. (6) Represents the annualized management fee for the period as a percentage of average total CGBD assets inclusive of the investments at Credit Fund, net of CGBD’s average investment in Credit Fund. Portfolio & Investment Activity • As of 9/30/26, the total fair value of the portfolio was $2.3 billion, in line with the prior quarter • The portfolio increased to 180 portfolio companies with a weighted average yield of 10.8%(3) • CGBD originated $80.9 million(4) of investments during Q3'26, with a weighted average yield of 9.6%(5) • Total repayments and sales during Q3'26 were $128.9 million(4) with a weighted average yield of 10.4%(5) • As of 9/30/26, non-accrual investments remained low, with seven borrowers on non-accrual representing 2.2% and 1.1% of the total portfolio based on amortized cost and fair value, respectively • Total liquidity as of 9/30/26 was $598.2 million in cash and undrawn debt capacity • We repurchased $6.1 million shares during the quarter at an average discount to 6/30/26 NAV per share of 31.5%, resulting in NAV accretion of $0.04 per share. Since inception, we have repurchased $208.7 million shares as of 9/30/26 and we continue to repurchase shares following quarter end Liquidity & Capital Activity Third Quarter Results • We generated $0.36 per common share of net investment income on both a GAAP basis and after adjusting for asset acquisition accounting(1), fully covering our $0.35 base dividend • NAV per share was $15.65 as of 9/30/26, compared to NAV per share of $15.61 as of 6/30/26. The increase in NAV in Q3'26 was primarily driven by accretion from share repurchases and net investment income in excess of the base dividend • We declared our quarterly dividend of $0.35 for Q4'26, equating to an annualized dividend yield of 13.1% on our stock price as of 9/30/26. The dividend continues to be supported by an estimated $0.72 per share in spillover income(2) • Credit Fund produced an annualized yield of 18.4% to CGBD through its stable $1.2 billion investment portfolio • Structured Credit Partners grew its portfolio to $2.1 billion of investments and produced an annualized yield of 20.3% to CGBD • Structured Credit Partners priced one CLO financed with long-term, non-mark-to-market, and predominantly investment-grade rated CLO debt • Inclusive of the $1.2 billion of assets at Credit Fund, where no management fees are charged, our annualized management fee rate is 0.99%(6) down from the base management fee rate of 1.50% Joint Ventures
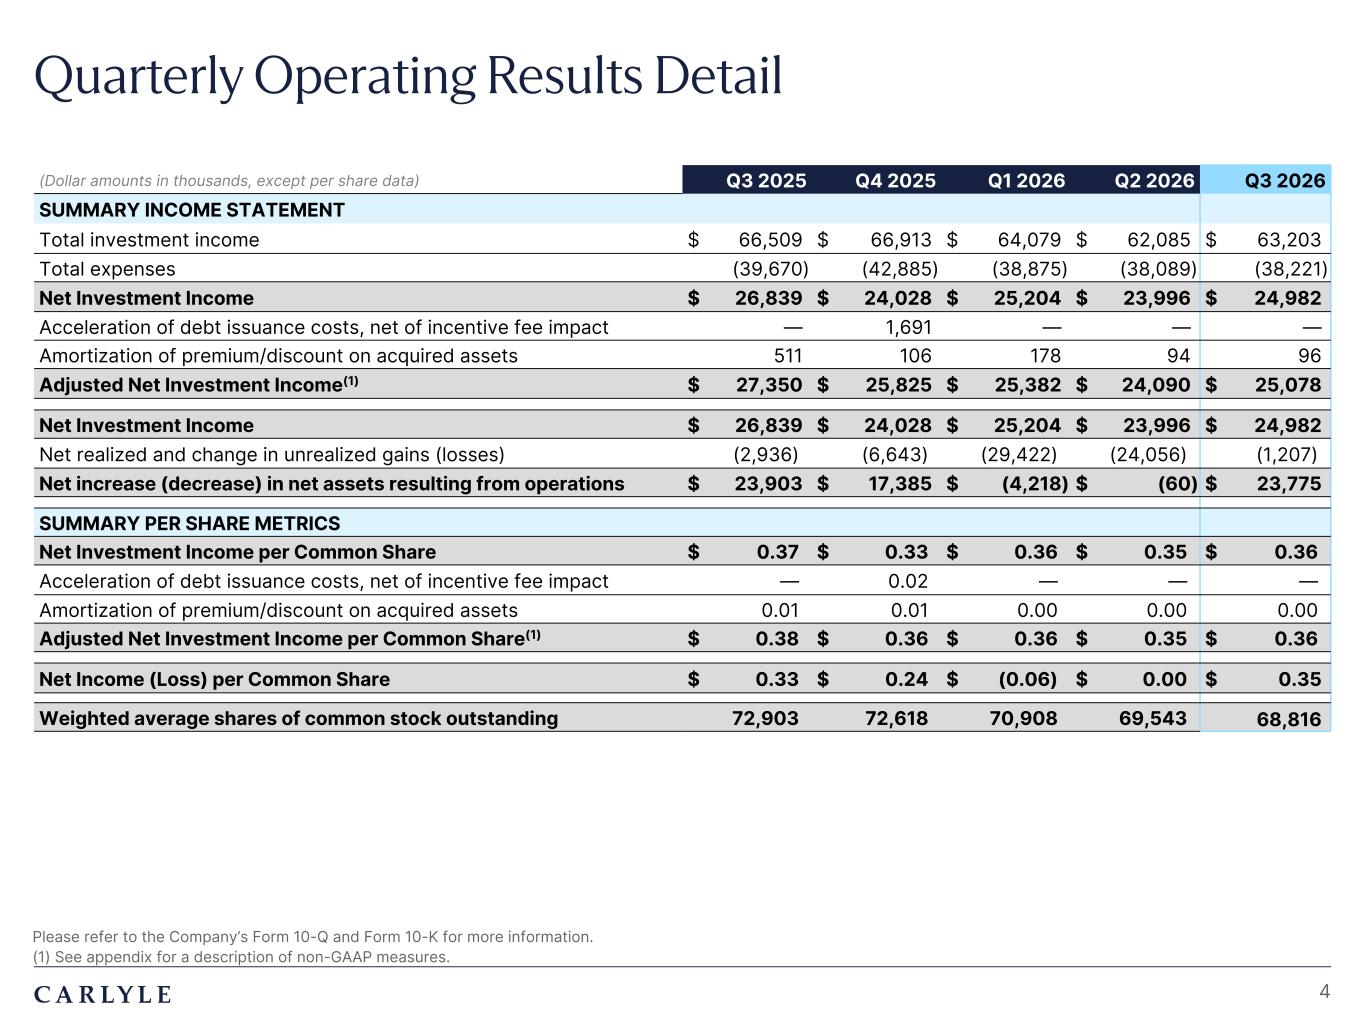
Plum R117 G45 B79 Dark Gray R101 G101 B101 Light Green R216 G240 B221 Pale Blue R221 G244 B255 Light Indigo R176 G188 B228 Indigo R49 G71 B143 Brown R96 G70 B60 Taupe R209 G199 B189 Light Gray R230 G230 B230 Dark Blue R22 G32 B64 Green R57 G108 B101 Champagne R251 G246 B237 Sky Blue R149 G218 B255 Salmon R240 G196 B188 Quarterly Operating Results Detail Please refer to the Company’s Form 10-Q and Form 10-K for more information. (1) See appendix for a description of non-GAAP measures. 4 (Dollar amounts in thousands, except per share data) Q3 2025 Q4 2025 Q1 2026 Q2 2026 Q3 2026 SUMMARY INCOME STATEMENT Total investment income $ 66,509 $ 66,913 $ 64,079 $ 62,085 $ 63,203 Total expenses (39,670) (42,885) (38,875) (38,089) (38,221) Net Investment Income $ 26,839 $ 24,028 $ 25,204 $ 23,996 $ 24,982 Acceleration of debt issuance costs, net of incentive fee impact — 1,691 — — — Amortization of premium/discount on acquired assets 511 106 178 94 96 Adjusted Net Investment Income(1) $ 27,350 $ 25,825 $ 25,382 $ 24,090 $ 25,078 Net Investment Income $ 26,839 $ 24,028 $ 25,204 $ 23,996 $ 24,982 Net realized and change in unrealized gains (losses) (2,936) (6,643) (29,422) (24,056) (1,207) Net increase (decrease) in net assets resulting from operations $ 23,903 $ 17,385 $ (4,218) $ (60) $ 23,775 SUMMARY PER SHARE METRICS Net Investment Income per Common Share $ 0.37 $ 0.33 $ 0.36 $ 0.35 $ 0.36 Acceleration of debt issuance costs, net of incentive fee impact — 0.02 — — — Amortization of premium/discount on acquired assets 0.01 0.01 0.00 0.00 0.00 Adjusted Net Investment Income per Common Share(1) $ 0.38 $ 0.36 $ 0.36 $ 0.35 $ 0.36 Net Income (Loss) per Common Share $ 0.33 $ 0.24 $ (0.06) $ 0.00 $ 0.35 Weighted average shares of common stock outstanding 72,903 72,618 70,908 69,543 68,816
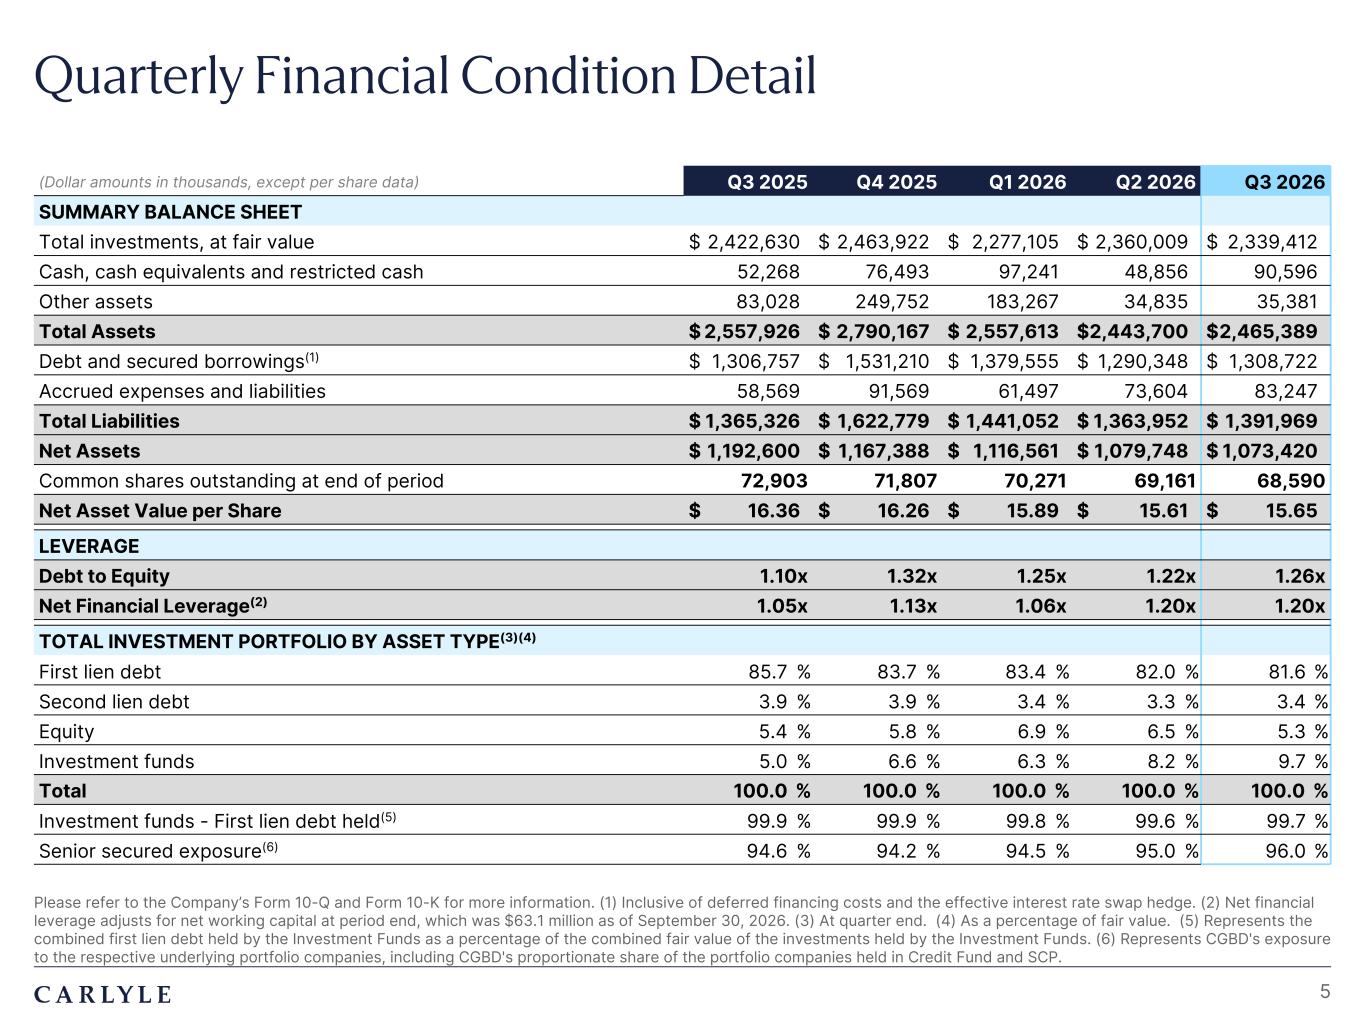
Plum R117 G45 B79 Dark Gray R101 G101 B101 Light Green R216 G240 B221 Pale Blue R221 G244 B255 Light Indigo R176 G188 B228 Indigo R49 G71 B143 Brown R96 G70 B60 Taupe R209 G199 B189 Light Gray R230 G230 B230 Dark Blue R22 G32 B64 Green R57 G108 B101 Champagne R251 G246 B237 Sky Blue R149 G218 B255 Salmon R240 G196 B188 Quarterly Financial Condition Detail 5 (Dollar amounts in thousands, except per share data) Q3 2025 Q4 2025 Q1 2026 Q2 2026 Q3 2026 SUMMARY BALANCE SHEET Total investments, at fair value $ 2,422,630 $ 2,463,922 $ 2,277,105 $ 2,360,009 $ 2,339,412 Cash, cash equivalents and restricted cash 52,268 76,493 97,241 48,856 90,596 Other assets 83,028 249,752 183,267 34,835 35,381 Total Assets $ 2,557,926 $ 2,790,167 $ 2,557,613 $ 2,443,700 $ 2,465,389 Debt and secured borrowings(1) $ 1,306,757 $ 1,531,210 $ 1,379,555 $ 1,290,348 $ 1,308,722 Accrued expenses and liabilities 58,569 91,569 61,497 73,604 83,247 Total Liabilities $ 1,365,326 $ 1,622,779 $ 1,441,052 $ 1,363,952 $ 1,391,969 Net Assets $ 1,192,600 $ 1,167,388 $ 1,116,561 $ 1,079,748 $ 1,073,420 Common shares outstanding at end of period 72,903 71,807 70,271 69,161 68,590 Net Asset Value per Share $ 16.36 $ 16.26 $ 15.89 $ 15.61 $ 15.65 LEVERAGE Debt to Equity 1.10x 1.32x 1.25x 1.22x 1.26x Net Financial Leverage(2) 1.05x 1.13x 1.06x 1.20x 1.20x TOTAL INVESTMENT PORTFOLIO BY ASSET TYPE(3)(4) First lien debt 85.7 % 83.7 % 83.4 % 82.0 % 81.6 % Second lien debt 3.9 % 3.9 % 3.4 % 3.3 % 3.4 % Equity 5.4 % 5.8 % 6.9 % 6.5 % 5.3 % Investment funds 5.0 % 6.6 % 6.3 % 8.2 % 9.7 % Total 100.0 % 100.0 % 100.0 % 100.0 % 100.0 % Investment funds - First lien debt held(5) 99.9 % 99.9 % 99.8 % 99.6 % 99.7 % Senior secured exposure(6) 94.6 % 94.2 % 94.5 % 95.0 % 96.0 % Please refer to the Company’s Form 10-Q and Form 10-K for more information. (1) Inclusive of deferred financing costs and the effective interest rate swap hedge. (2) Net financial leverage adjusts for net working capital at period end, which was $63.1 million as of September 30, 2026. (3) At quarter end. (4) As a percentage of fair value. (5) Represents the combined first lien debt held by the Investment Funds as a percentage of the combined fair value of the investments held by the Investment Funds. (6) Represents CGBD's exposure to the respective underlying portfolio companies, including CGBD's proportionate share of the portfolio companies held in Credit Fund and SCP.
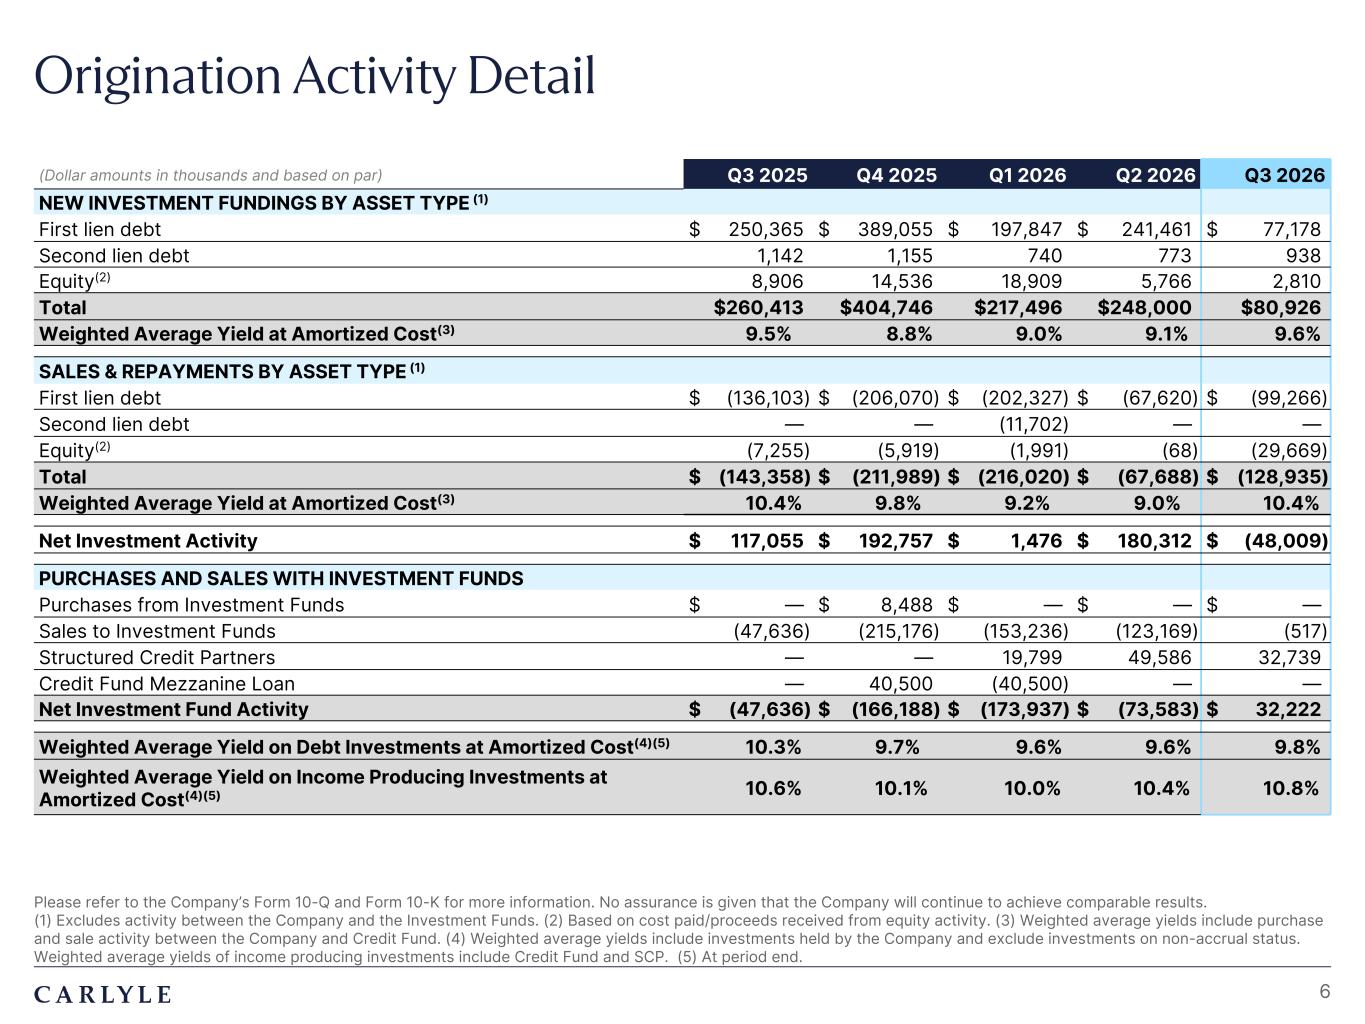
Plum R117 G45 B79 Dark Gray R101 G101 B101 Light Green R216 G240 B221 Pale Blue R221 G244 B255 Light Indigo R176 G188 B228 Indigo R49 G71 B143 Brown R96 G70 B60 Taupe R209 G199 B189 Light Gray R230 G230 B230 Dark Blue R22 G32 B64 Green R57 G108 B101 Champagne R251 G246 B237 Sky Blue R149 G218 B255 Salmon R240 G196 B188 Origination Activity Detail Please refer to the Company’s Form 10-Q and Form 10-K for more information. No assurance is given that the Company will continue to achieve comparable results. (1) Excludes activity between the Company and the Investment Funds. (2) Based on cost paid/proceeds received from equity activity. (3) Weighted average yields include purchase and sale activity between the Company and Credit Fund. (4) Weighted average yields include investments held by the Company and exclude investments on non-accrual status. Weighted average yields of income producing investments include Credit Fund and SCP. (5) At period end. 6 (Dollar amounts in thousands and based on par) Q3 2025 Q4 2025 Q1 2026 Q2 2026 Q3 2026 NEW INVESTMENT FUNDINGS BY ASSET TYPE (1) First lien debt $ 250,365 $ 389,055 $ 197,847 $ 241,461 $ 77,178 Second lien debt 1,142 1,155 740 773 938 Equity(2) 8,906 14,536 18,909 5,766 2,810 Total $260,413 $404,746 $217,496 $248,000 $80,926 Weighted Average Yield at Amortized Cost(3) 9.5% 8.8% 9.0% 9.1% 9.6% SALES & REPAYMENTS BY ASSET TYPE (1) First lien debt $ (136,103) $ (206,070) $ (202,327) $ (67,620) $ (99,266) Second lien debt — — (11,702) — — Equity(2) (7,255) (5,919) (1,991) (68) (29,669) Total $ (143,358) $ (211,989) $ (216,020) $ (67,688) $ (128,935) Weighted Average Yield at Amortized Cost(3) 10.4% 9.8% 9.2% 9.0% 10.4% Net Investment Activity $ 117,055 $ 192,757 $ 1,476 $ 180,312 $ (48,009) PURCHASES AND SALES WITH INVESTMENT FUNDS Purchases from Investment Funds $ — $ 8,488 $ — $ — $ — Sales to Investment Funds (47,636) (215,176) (153,236) (123,169) (517) Structured Credit Partners — — 19,799 49,586 32,739 Credit Fund Mezzanine Loan — 40,500 (40,500) — — Net Investment Fund Activity $ (47,636) $ (166,188) $ (173,937) $ (73,583) $ 32,222 Weighted Average Yield on Debt Investments at Amortized Cost(4)(5) 10.3% 9.7% 9.6% 9.6% 9.8% Weighted Average Yield on Income Producing Investments at Amortized Cost(4)(5) 10.6% 10.1% 10.0% 10.4% 10.8%
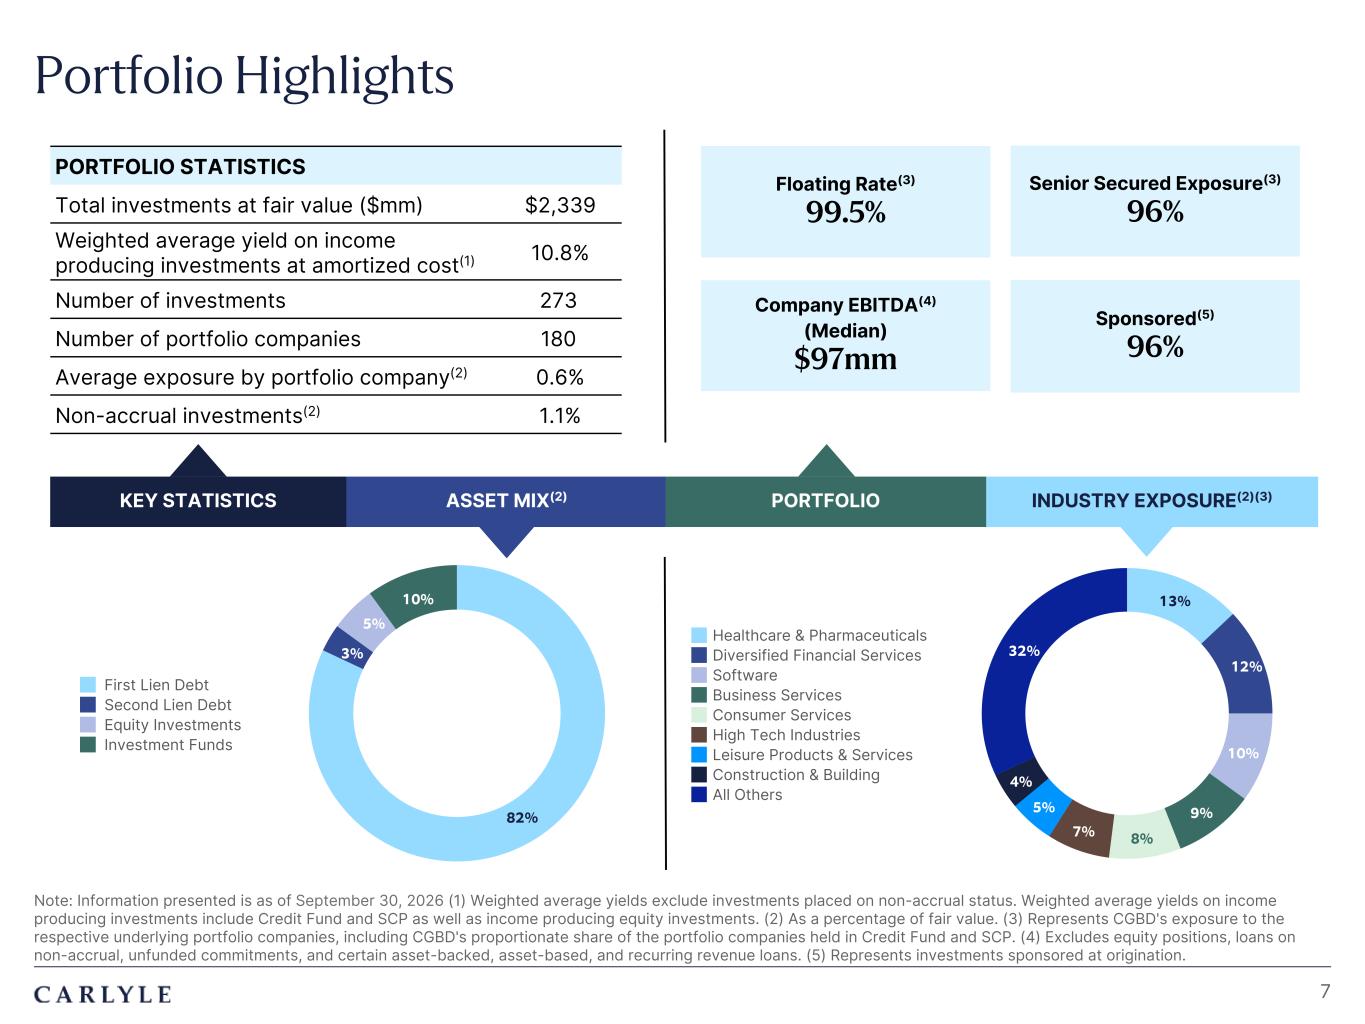
Plum R117 G45 B79 Dark Gray R101 G101 B101 Light Green R216 G240 B221 Pale Blue R221 G244 B255 Light Indigo R176 G188 B228 Indigo R49 G71 B143 Brown R96 G70 B60 Taupe R209 G199 B189 Light Gray R230 G230 B230 Dark Blue R22 G32 B64 Green R57 G108 B101 Champagne R251 G246 B237 Sky Blue R149 G218 B255 Salmon R240 G196 B188 82% 3% 5% 10% First Lien Debt Second Lien Debt Equity Investments Investment Funds 13% 12% 10% 9% 8%7% 5% 4% 32% Healthcare & Pharmaceuticals Diversified Financial Services Software Business Services Consumer Services High Tech Industries Leisure Products & Services Construction & Building All Others Portfolio Highlights Note: Information presented is as of September 30, 2026 (1) Weighted average yields exclude investments placed on non-accrual status. Weighted average yields on income producing investments include Credit Fund and SCP as well as income producing equity investments. (2) As a percentage of fair value. (3) Represents CGBD's exposure to the respective underlying portfolio companies, including CGBD's proportionate share of the portfolio companies held in Credit Fund and SCP. (4) Excludes equity positions, loans on non-accrual, unfunded commitments, and certain asset-backed, asset-based, and recurring revenue loans. (5) Represents investments sponsored at origination. 7 KEY STATISTICS ASSET MIX(2) INDUSTRY EXPOSURE(2)(3) PORTFOLIO STATISTICS Total investments at fair value ($mm) $2,339 Weighted average yield on income producing investments at amortized cost(1) 10.8% Number of investments 273 Number of portfolio companies 180 Average exposure by portfolio company(2) 0.6% Non-accrual investments(2) 1.1% Senior Secured Exposure(3) 96% Floating Rate(3) 99.5% Company EBITDA(4) (Median) $97mm Sponsored(5) 96% PORTFOLIO
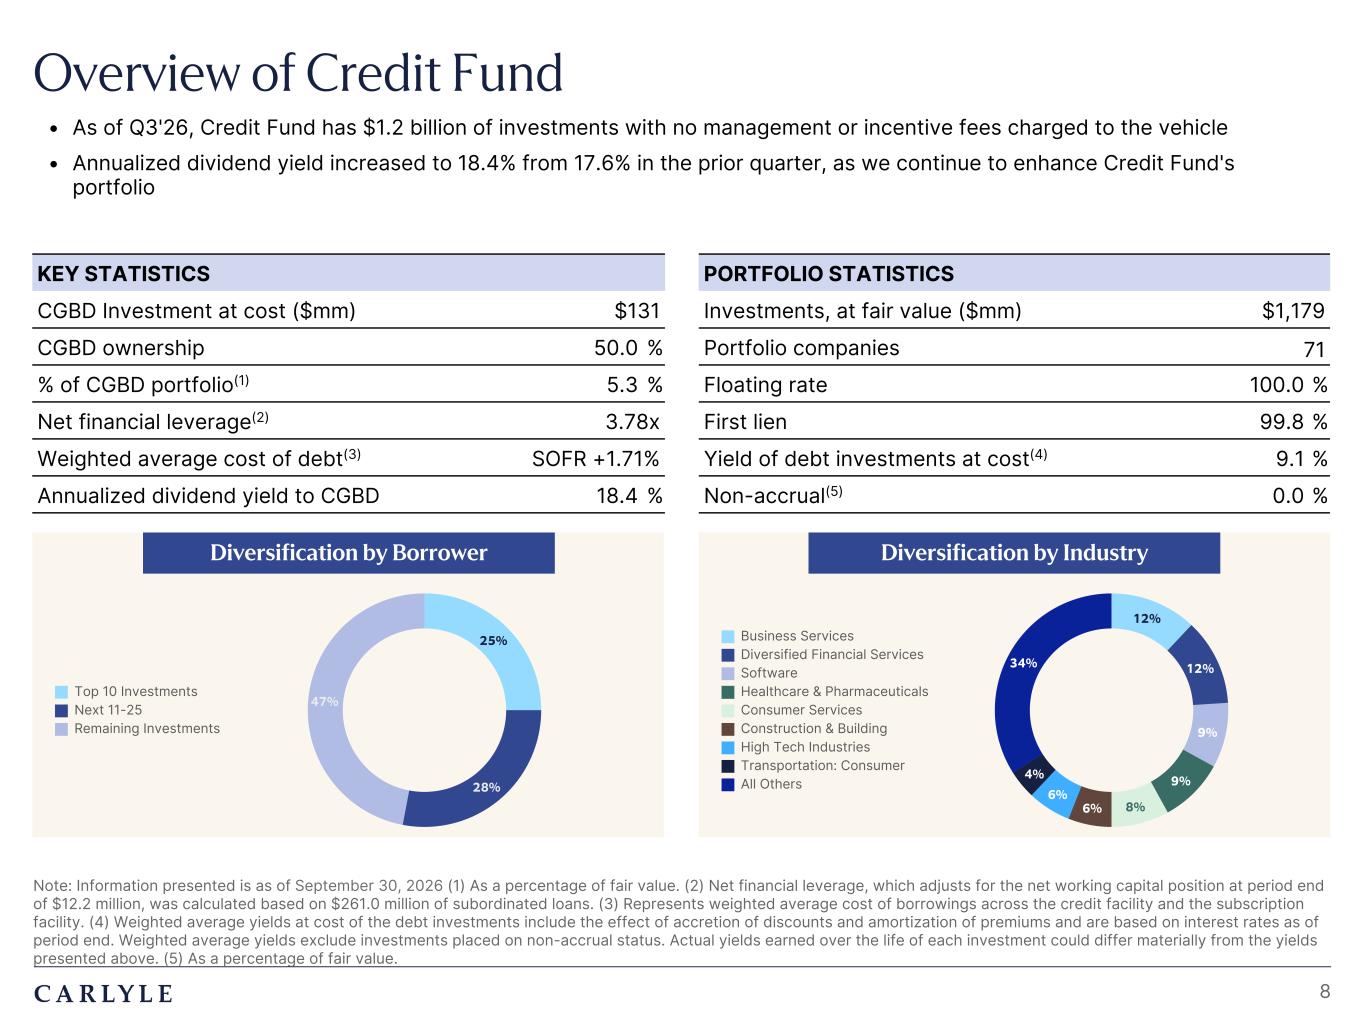
Plum R117 G45 B79 Dark Gray R101 G101 B101 Light Green R216 G240 B221 Pale Blue R221 G244 B255 Light Indigo R176 G188 B228 Indigo R49 G71 B143 Brown R96 G70 B60 Taupe R209 G199 B189 Light Gray R230 G230 B230 Dark Blue R22 G32 B64 Green R57 G108 B101 Champagne R251 G246 B237 Sky Blue R149 G218 B255 Salmon R240 G196 B188 Overview of Credit Fund Note: Information presented is as of September 30, 2026 (1) As a percentage of fair value. (2) Net financial leverage, which adjusts for the net working capital position at period end of $12.2 million, was calculated based on $261.0 million of subordinated loans. (3) Represents weighted average cost of borrowings across the credit facility and the subscription facility. (4) Weighted average yields at cost of the debt investments include the effect of accretion of discounts and amortization of premiums and are based on interest rates as of period end. Weighted average yields exclude investments placed on non-accrual status. Actual yields earned over the life of each investment could differ materially from the yields presented above. (5) As a percentage of fair value. KEY STATISTICS CGBD Investment at cost ($mm) $131 CGBD ownership 50.0 % % of CGBD portfolio(1) 5.3 % Net financial leverage(2) 3.78x Weighted average cost of debt(3) SOFR +1.71% Annualized dividend yield to CGBD 18.4 % PORTFOLIO STATISTICS Investments, at fair value ($mm) $1,179 Portfolio companies 71 Floating rate 100.0 % First lien 99.8 % Yield of debt investments at cost(4) 9.1 % Non-accrual(5) 0.0 % Diversification by Borrower Diversification by Industry 8 25% 28% 47% Top 10 Investments Next 11-25 Remaining Investments 12% 12% 9% 9% 8%6% 6% 4% 34% Business Services Diversified Financial Services Software Healthcare & Pharmaceuticals Consumer Services Construction & Building High Tech Industries Transportation: Consumer All Others • As of Q3'26, Credit Fund has $1.2 billion of investments with no management or incentive fees charged to the vehicle • Annualized dividend yield increased to 18.4% from 17.6% in the prior quarter, as we continue to enhance Credit Fund's portfolio
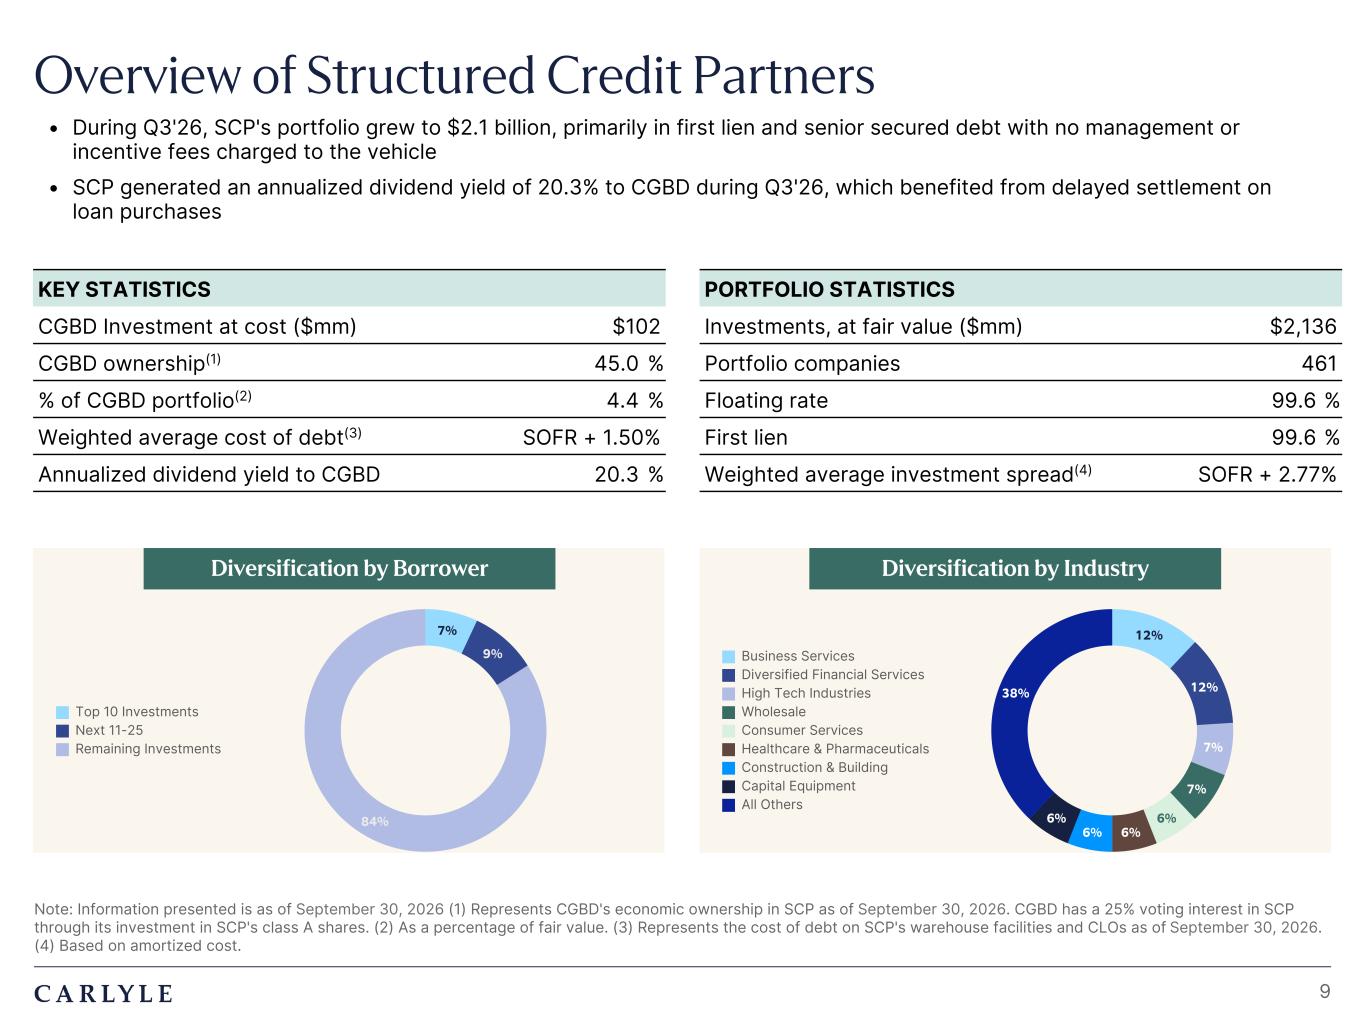
Plum R117 G45 B79 Dark Gray R101 G101 B101 Light Green R216 G240 B221 Pale Blue R221 G244 B255 Light Indigo R176 G188 B228 Indigo R49 G71 B143 Brown R96 G70 B60 Taupe R209 G199 B189 Light Gray R230 G230 B230 Dark Blue R22 G32 B64 Green R57 G108 B101 Champagne R251 G246 B237 Sky Blue R149 G218 B255 Salmon R240 G196 B188 Overview of Structured Credit Partners Note: Information presented is as of September 30, 2026 (1) Represents CGBD's economic ownership in SCP as of September 30, 2026. CGBD has a 25% voting interest in SCP through its investment in SCP's class A shares. (2) As a percentage of fair value. (3) Represents the cost of debt on SCP's warehouse facilities and CLOs as of September 30, 2026. (4) Based on amortized cost. • During Q3'26, SCP's portfolio grew to $2.1 billion, primarily in first lien and senior secured debt with no management or incentive fees charged to the vehicle • SCP generated an annualized dividend yield of 20.3% to CGBD during Q3'26, which benefited from delayed settlement on loan purchases KEY STATISTICS CGBD Investment at cost ($mm) $102 CGBD ownership(1) 45.0 % % of CGBD portfolio(2) 4.4 % Weighted average cost of debt(3) SOFR + 1.50% Annualized dividend yield to CGBD 20.3 % PORTFOLIO STATISTICS Investments, at fair value ($mm) $2,136 Portfolio companies 461 Floating rate 99.6 % First lien 99.6 % Weighted average investment spread(4) SOFR + 2.77% Diversification by Borrower Diversification by Industry 9 7% 9% 84% Top 10 Investments Next 11-25 Remaining Investments 12% 12% 7% 7% 6% 6%6% 6% 38% Business Services Diversified Financial Services High Tech Industries Wholesale Consumer Services Healthcare & Pharmaceuticals Construction & Building Capital Equipment All Others
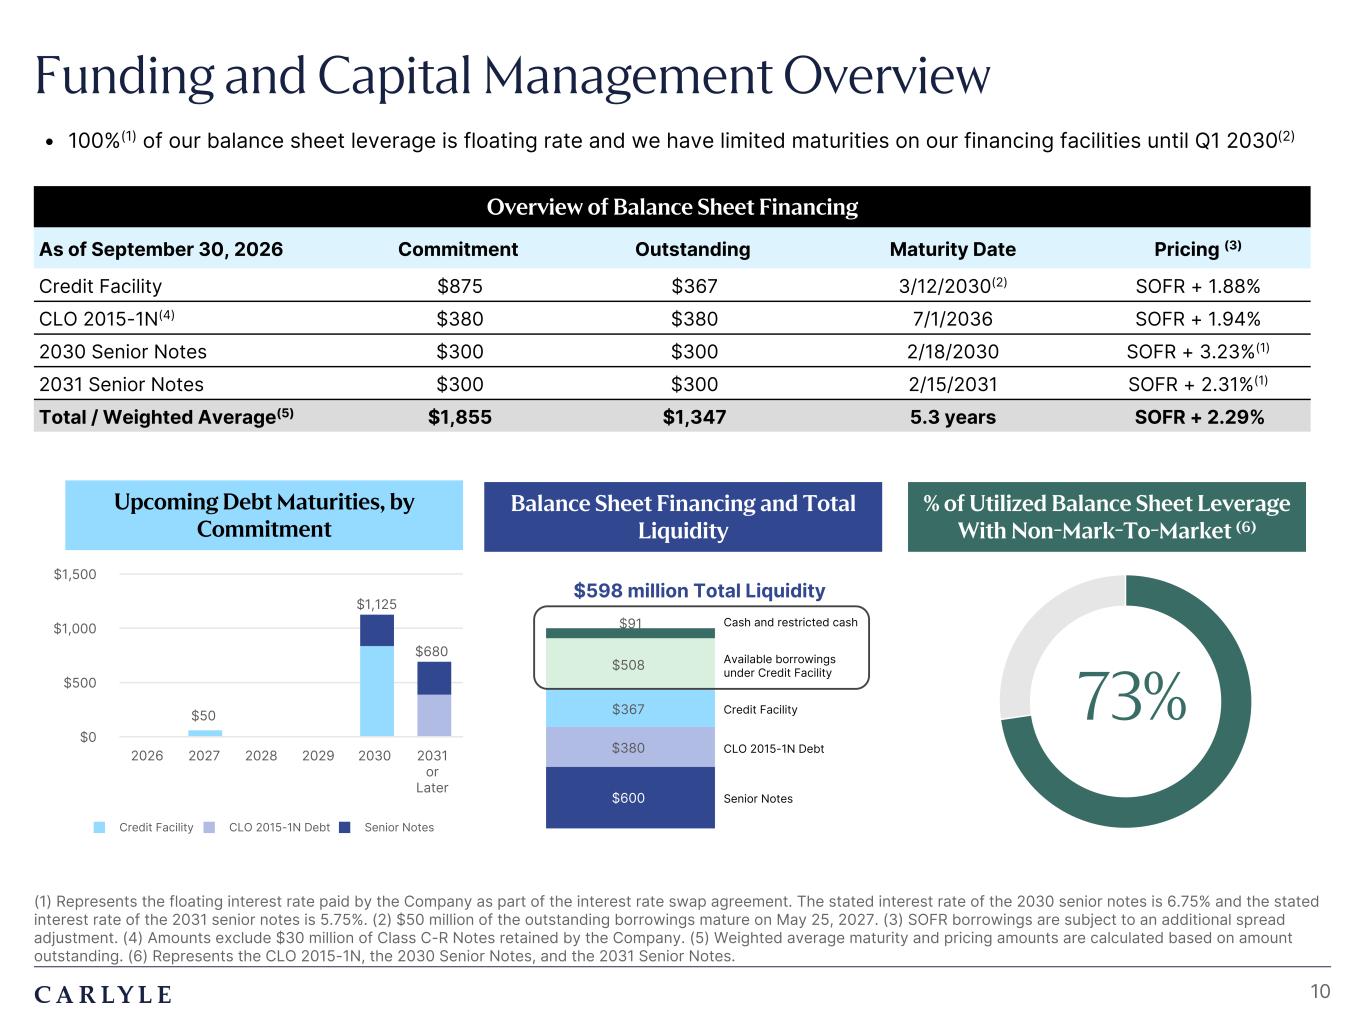
Plum R117 G45 B79 Dark Gray R101 G101 B101 Light Green R216 G240 B221 Pale Blue R221 G244 B255 Light Indigo R176 G188 B228 Indigo R49 G71 B143 Brown R96 G70 B60 Taupe R209 G199 B189 Light Gray R230 G230 B230 Dark Blue R22 G32 B64 Green R57 G108 B101 Champagne R251 G246 B237 Sky Blue R149 G218 B255 Salmon R240 G196 B188 • 100%(1) of our balance sheet leverage is floating rate and we have limited maturities on our financing facilities until Q1 2030(2) Cash and restricted cash $600 $380 $367 $508 $91 Available borrowings under Credit Facility 10 (1) Represents the floating interest rate paid by the Company as part of the interest rate swap agreement. The stated interest rate of the 2030 senior notes is 6.75% and the stated interest rate of the 2031 senior notes is 5.75%. (2) $50 million of the outstanding borrowings mature on May 25, 2027. (3) SOFR borrowings are subject to an additional spread adjustment. (4) Amounts exclude $30 million of Class C-R Notes retained by the Company. (5) Weighted average maturity and pricing amounts are calculated based on amount outstanding. (6) Represents the CLO 2015-1N, the 2030 Senior Notes, and the 2031 Senior Notes. Balance Sheet Financing and Total Liquidity % of Utilized Balance Sheet Leverage With Non-Mark-To-Market (6) Upcoming Debt Maturities, by Commitment Overview of Balance Sheet Financing As of September 30, 2026 Commitment Outstanding Maturity Date Pricing (3) Credit Facility $875 $367 3/12/2030(2) SOFR + 1.88% CLO 2015-1N(4) $380 $380 7/1/2036 SOFR + 1.94% 2030 Senior Notes $300 $300 2/18/2030 SOFR + 3.23%(1) 2031 Senior Notes $300 $300 2/15/2031 SOFR + 2.31%(1) Total / Weighted Average(5) $1,855 $1,347 5.3 years SOFR + 2.29% $50 $1,125 $680 Credit Facility CLO 2015-1N Debt Senior Notes 2026 2027 2028 2029 2030 2031 or Later $0 $500 $1,000 $1,500 73% Senior Notes CLO 2015-1N Debt Credit Facility $598 million Total Liquidity Funding and Capital Management Overview
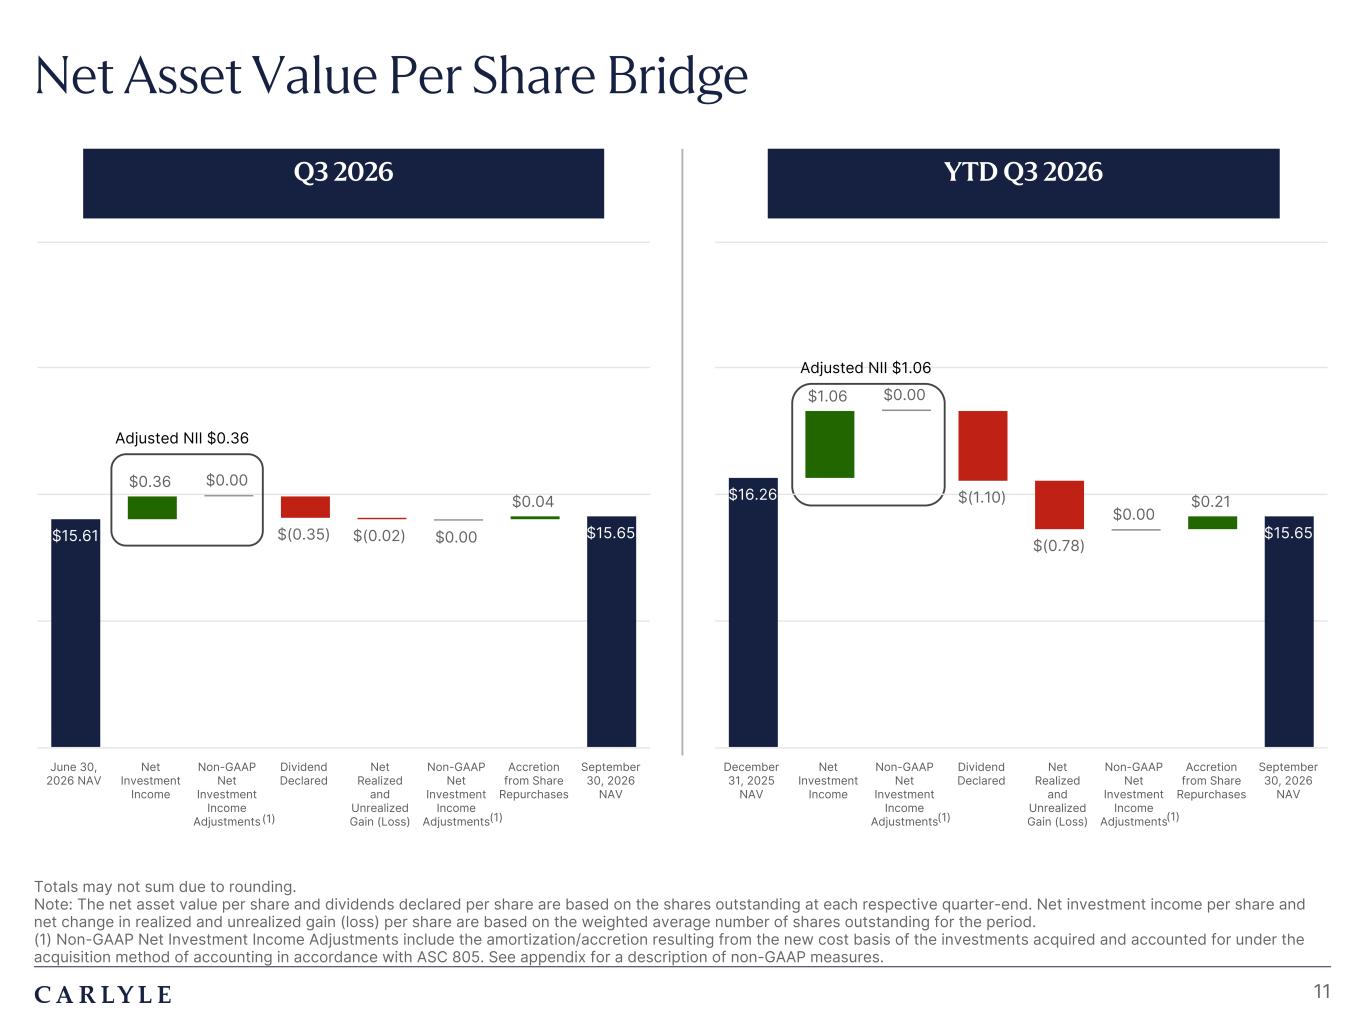
Plum R117 G45 B79 Dark Gray R101 G101 B101 Light Green R216 G240 B221 Pale Blue R221 G244 B255 Light Indigo R176 G188 B228 Indigo R49 G71 B143 Brown R96 G70 B60 Taupe R209 G199 B189 Light Gray R230 G230 B230 Dark Blue R22 G32 B64 Green R57 G108 B101 Champagne R251 G246 B237 Sky Blue R149 G218 B255 Salmon R240 G196 B188 $15.61 $0.36 $0.00 $(0.35) $(0.02) $0.00 $0.04 $15.65 June 30, 2026 NAV Net Investment Income Non-GAAP Net Investment Income Adjustments Dividend Declared Net Realized and Unrealized Gain (Loss) Non-GAAP Net Investment Income Adjustments Accretion from Share Repurchases September 30, 2026 NAV $16.26 $1.06 $0.00 $(1.10) $(0.78) $0.00 $0.21 $15.65 December 31, 2025 NAV Net Investment Income Non-GAAP Net Investment Income Adjustments Dividend Declared Net Realized and Unrealized Gain (Loss) Non-GAAP Net Investment Income Adjustments Accretion from Share Repurchases September 30, 2026 NAV Totals may not sum due to rounding. Note: The net asset value per share and dividends declared per share are based on the shares outstanding at each respective quarter-end. Net investment income per share and net change in realized and unrealized gain (loss) per share are based on the weighted average number of shares outstanding for the period. (1) Non-GAAP Net Investment Income Adjustments include the amortization/accretion resulting from the new cost basis of the investments acquired and accounted for under the acquisition method of accounting in accordance with ASC 805. See appendix for a description of non-GAAP measures. Net Asset Value Per Share Bridge 11 Q3 2026 YTD Q3 2026 Adjusted NII $0.36 Adjusted NII $1.06 (1) (1) (1) (1)
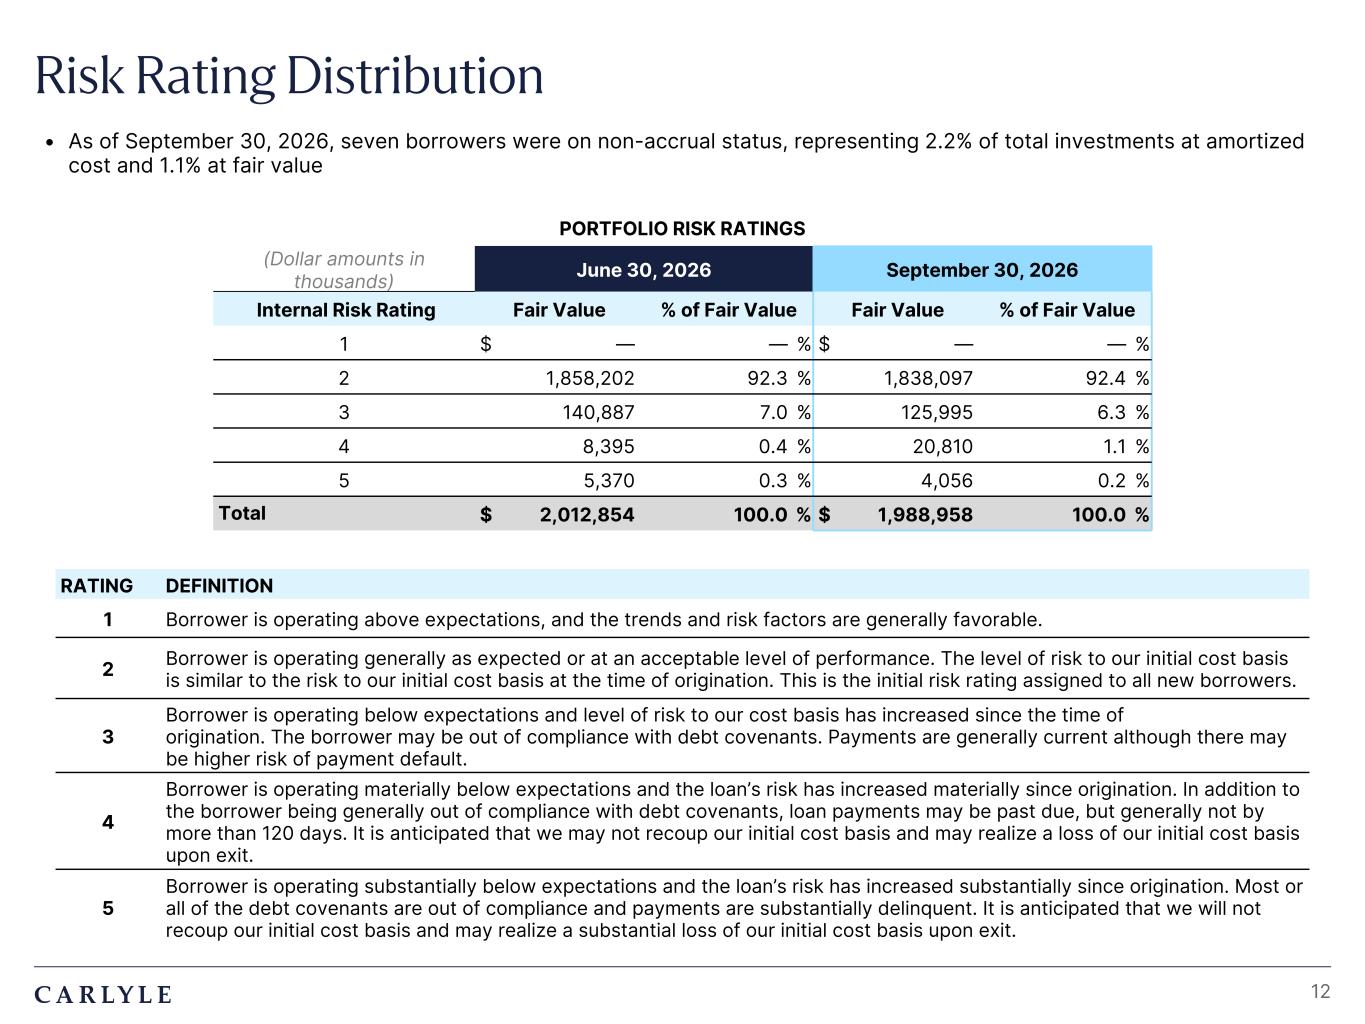
Plum R117 G45 B79 Dark Gray R101 G101 B101 Light Green R216 G240 B221 Pale Blue R221 G244 B255 Light Indigo R176 G188 B228 Indigo R49 G71 B143 Brown R96 G70 B60 Taupe R209 G199 B189 Light Gray R230 G230 B230 Dark Blue R22 G32 B64 Green R57 G108 B101 Champagne R251 G246 B237 Sky Blue R149 G218 B255 Salmon R240 G196 B188 Risk Rating Distribution 12 RATING DEFINITION 1 Borrower is operating above expectations, and the trends and risk factors are generally favorable. 2 Borrower is operating generally as expected or at an acceptable level of performance. The level of risk to our initial cost basis is similar to the risk to our initial cost basis at the time of origination. This is the initial risk rating assigned to all new borrowers. 3 Borrower is operating below expectations and level of risk to our cost basis has increased since the time of origination. The borrower may be out of compliance with debt covenants. Payments are generally current although there may be higher risk of payment default. 4 Borrower is operating materially below expectations and the loan’s risk has increased materially since origination. In addition to the borrower being generally out of compliance with debt covenants, loan payments may be past due, but generally not by more than 120 days. It is anticipated that we may not recoup our initial cost basis and may realize a loss of our initial cost basis upon exit. 5 Borrower is operating substantially below expectations and the loan’s risk has increased substantially since origination. Most or all of the debt covenants are out of compliance and payments are substantially delinquent. It is anticipated that we will not recoup our initial cost basis and may realize a substantial loss of our initial cost basis upon exit. PORTFOLIO RISK RATINGS (Dollar amounts in thousands) June 30, 2026 September 30, 2026 Internal Risk Rating Fair Value % of Fair Value Fair Value % of Fair Value 1 $ — — % $ — — % 2 1,858,202 92.3 % 1,838,097 92.4 % 3 140,887 7.0 % 125,995 6.3 % 4 8,395 0.4 % 20,810 1.1 % 5 5,370 0.3 % 4,056 0.2 % Total $ 2,012,854 100.0 % $ 1,988,958 100.0 % • As of September 30, 2026, seven borrowers were on non-accrual status, representing 2.2% of total investments at amortized cost and 1.1% at fair value
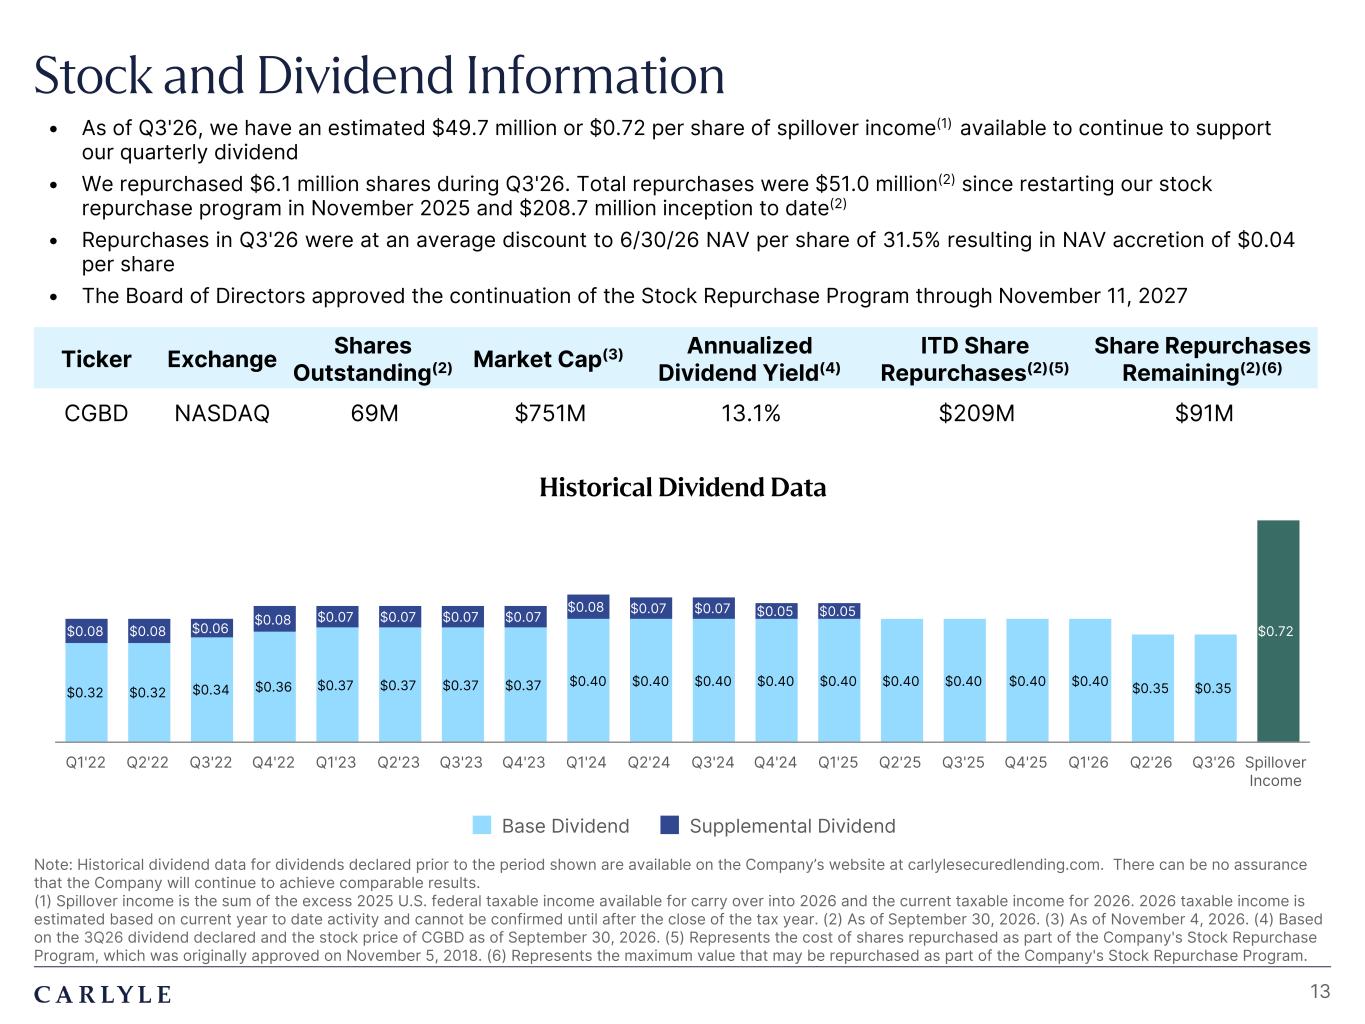
Plum R117 G45 B79 Dark Gray R101 G101 B101 Light Green R216 G240 B221 Pale Blue R221 G244 B255 Light Indigo R176 G188 B228 Indigo R49 G71 B143 Brown R96 G70 B60 Taupe R209 G199 B189 Light Gray R230 G230 B230 Dark Blue R22 G32 B64 Green R57 G108 B101 Champagne R251 G246 B237 Sky Blue R149 G218 B255 Salmon R240 G196 B188 Stock and Dividend Information Note: Historical dividend data for dividends declared prior to the period shown are available on the Company’s website at carlylesecuredlending.com. There can be no assurance that the Company will continue to achieve comparable results. (1) Spillover income is the sum of the excess 2025 U.S. federal taxable income available for carry over into 2026 and the current taxable income for 2026. 2026 taxable income is estimated based on current year to date activity and cannot be confirmed until after the close of the tax year. (2) As of September 30, 2026. (3) As of November 4, 2026. (4) Based on the 3Q26 dividend declared and the stock price of CGBD as of September 30, 2026. (5) Represents the cost of shares repurchased as part of the Company's Stock Repurchase Program, which was originally approved on November 5, 2018. (6) Represents the maximum value that may be repurchased as part of the Company's Stock Repurchase Program. 13 • As of Q3'26, we have an estimated $49.7 million or $0.72 per share of spillover income(1) available to continue to support our quarterly dividend • We repurchased $6.1 million shares during Q3'26. Total repurchases were $51.0 million(2) since restarting our stock repurchase program in November 2025 and $208.7 million inception to date(2) • Repurchases in Q3'26 were at an average discount to 6/30/26 NAV per share of 31.5% resulting in NAV accretion of $0.04 per share • The Board of Directors approved the continuation of the Stock Repurchase Program through November 11, 2027 Ticker Exchange Shares Outstanding(2) Market Cap(3) Annualized Dividend Yield(4) ITD Share Repurchases(2)(5) Share Repurchases Remaining(2)(6) CGBD NASDAQ 69M $751M 13.1% $209M $91M Historical Dividend Data $0.32 $0.32 $0.34 $0.36 $0.37 $0.37 $0.37 $0.37 $0.40 $0.40 $0.40 $0.40 $0.40 $0.40 $0.40 $0.40 $0.40 $0.35 $0.35 $0.72$0.08 $0.08 $0.06 $0.08 $0.07 $0.07 $0.07 $0.07 $0.08 $0.07 $0.07 $0.05 $0.05 Base Dividend Supplemental Dividend Q1'22 Q2'22 Q3'22 Q4'22 Q1'23 Q2'23 Q3'23 Q4'23 Q1'24 Q2'24 Q3'24 Q4'24 Q1'25 Q2'25 Q3'25 Q4'25 Q1'26 Q2'26 Q3'26 Spillover Income
Appendix
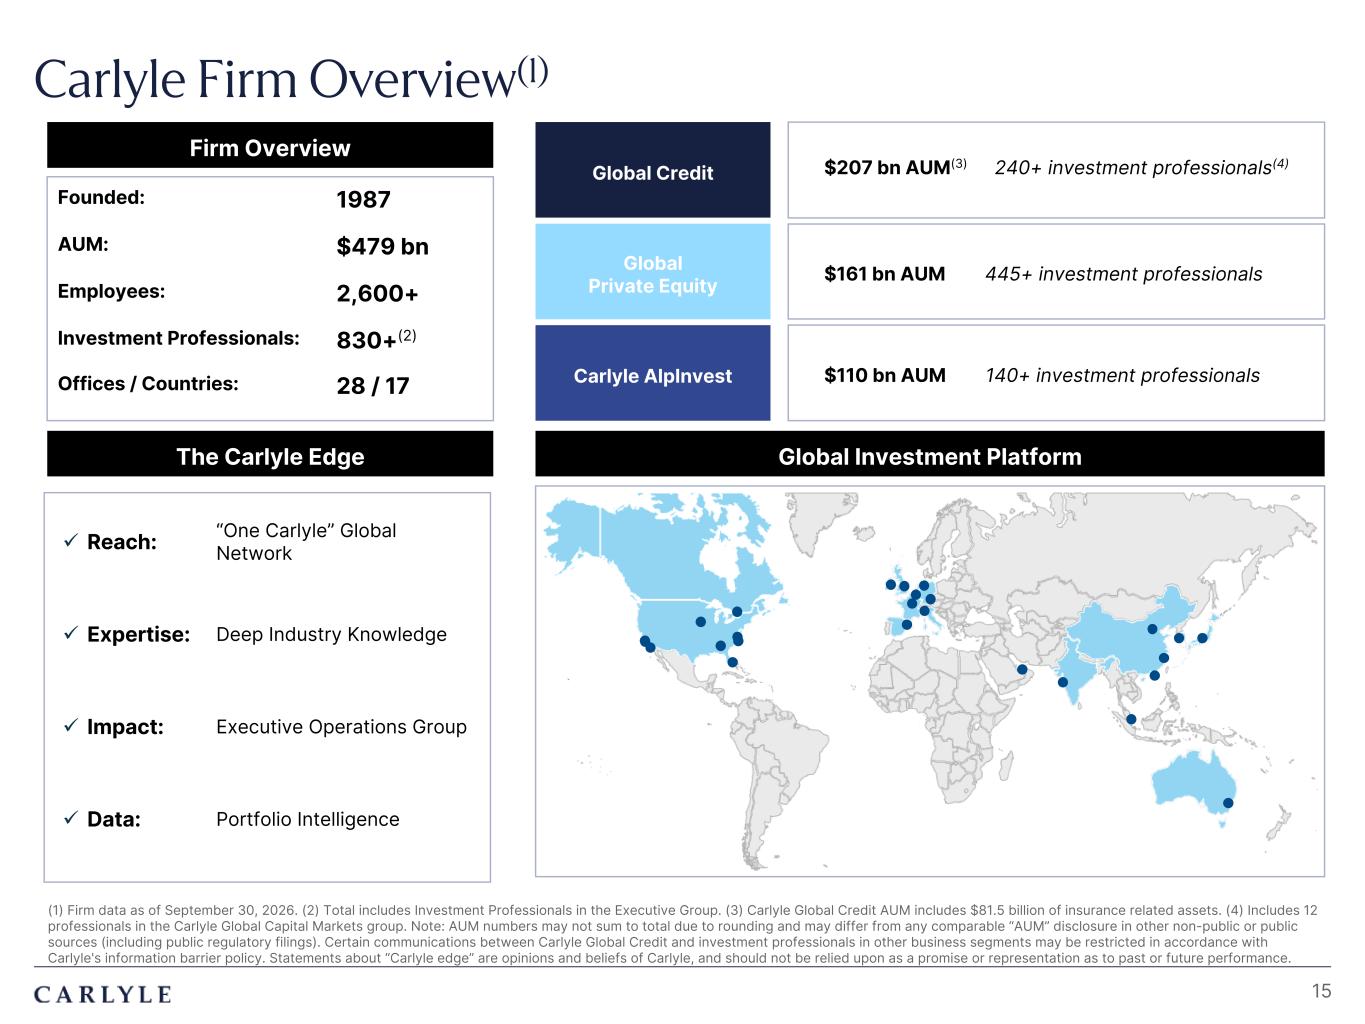
Plum R117 G45 B79 Dark Gray R101 G101 B101 Light Green R216 G240 B221 Pale Blue R221 G244 B255 Light Indigo R176 G188 B228 Indigo R49 G71 B143 Brown R96 G70 B60 Taupe R209 G199 B189 Light Gray R230 G230 B230 Dark Blue R22 G32 B64 Green R57 G108 B101 Champagne R251 G246 B237 Sky Blue R149 G218 B255 Salmon R240 G196 B188 (1) Firm data as of September 30, 2026. (2) Total includes Investment Professionals in the Executive Group. (3) Carlyle Global Credit AUM includes $81.5 billion of insurance related assets. (4) Includes 12 professionals in the Carlyle Global Capital Markets group. Note: AUM numbers may not sum to total due to rounding and may differ from any comparable “AUM” disclosure in other non-public or public sources (including public regulatory filings). Certain communications between Carlyle Global Credit and investment professionals in other business segments may be restricted in accordance with Carlyle's information barrier policy. Statements about “Carlyle edge” are opinions and beliefs of Carlyle, and should not be relied upon as a promise or representation as to past or future performance. Firm Overview The Carlyle Edge ü Reach: “One Carlyle” Global Network ü Expertise: Deep Industry Knowledge ü Impact: Executive Operations Group ü Data: Portfolio Intelligence Global Private Equity Global Credit Carlyle AlpInvest Global Investment Platform Founded: 1987 AUM: $479 bn Employees: 2,600+ Investment Professionals: 830+(2) Offices / Countries: 28 / 17 $161 bn AUM 445+ investment professionals $207 bn AUM(3) 240+ investment professionals(4) $110 bn AUM 140+ investment professionals Carlyle Firm Overview(1) 15
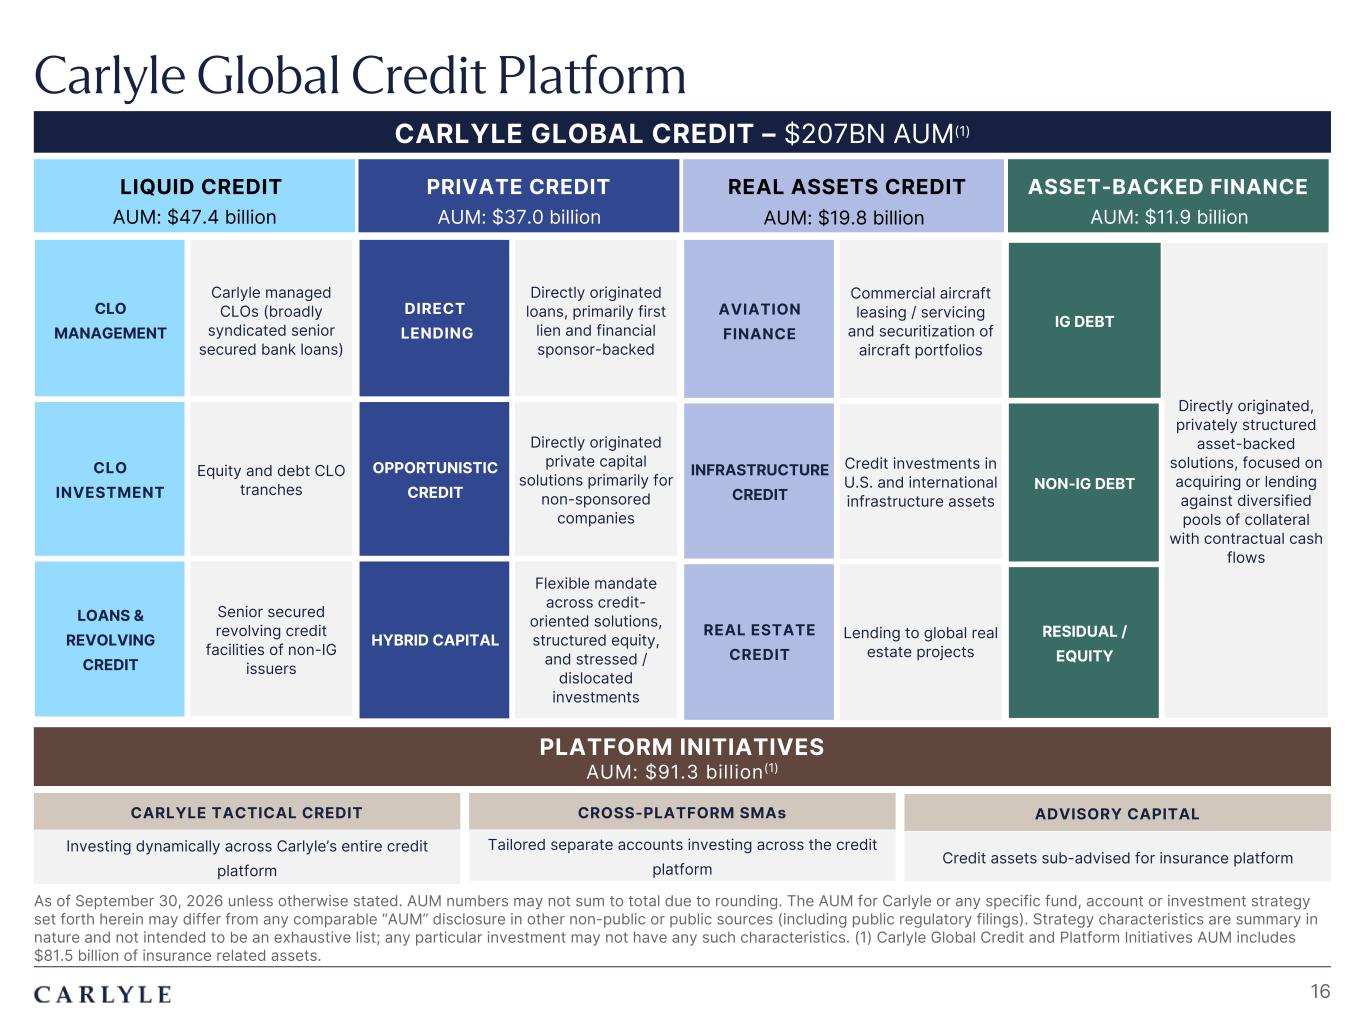
Plum R117 G45 B79 Dark Gray R101 G101 B101 Light Green R216 G240 B221 Pale Blue R221 G244 B255 Light Indigo R176 G188 B228 Indigo R49 G71 B143 Brown R96 G70 B60 Taupe R209 G199 B189 Light Gray R230 G230 B230 Dark Blue R22 G32 B64 Green R57 G108 B101 Champagne R251 G246 B237 Sky Blue R149 G218 B255 Salmon R240 G196 B188 Carlyle Global Credit Platform As of September 30, 2026 unless otherwise stated. AUM numbers may not sum to total due to rounding. The AUM for Carlyle or any specific fund, account or investment strategy set forth herein may differ from any comparable “AUM” disclosure in other non-public or public sources (including public regulatory filings). Strategy characteristics are summary in nature and not intended to be an exhaustive list; any particular investment may not have any such characteristics. (1) Carlyle Global Credit and Platform Initiatives AUM includes $81.5 billion of insurance related assets. 16 CARLYLE GLOBAL CREDIT – $207BN AUM(1) AUM: $47.4 billion LIQUID CREDIT AUM: $37.0 billion PRIVATE CREDIT AUM: $19.8 billion REAL ASSETS CREDIT AUM: $11.9 billion ASSET-BACKED FINANCE CLO MANAGEMENT Carlyle managed CLOs (broadly syndicated senior secured bank loans) CLO INVESTMENT Equity and debt CLO tranches LOANS & REVOLVING CREDIT Senior secured revolving credit facilities of non-IG issuers DIRECT LENDING Directly originated loans, primarily first lien and financial sponsor-backed OPPORTUNISTIC CREDIT Directly originated private capital solutions primarily for non-sponsored companies HYBRID CAPITAL Flexible mandate across credit- oriented solutions, structured equity, and stressed / dislocated investments AVIATION FINANCE Commercial aircraft leasing / servicing and securitization of aircraft portfolios INFRASTRUCTURE CREDIT Credit investments in U.S. and international infrastructure assets REAL ESTATE CREDIT Lending to global real estate projects IG DEBT Directly originated, privately structured asset-backed solutions, focused on acquiring or lending against diversified pools of collateral with contractual cash flows NON-IG DEBT RESIDUAL / EQUITY PLATFORM INITIATIVES AUM: $91.3 billion(1) CARLYLE TACTICAL CREDIT CROSS-PLATFORM SMAs ADVISORY CAPITAL Investing dynamically across Carlyle’s entire credit platform Tailored separate accounts investing across the credit platform Credit assets sub-advised for insurance platform
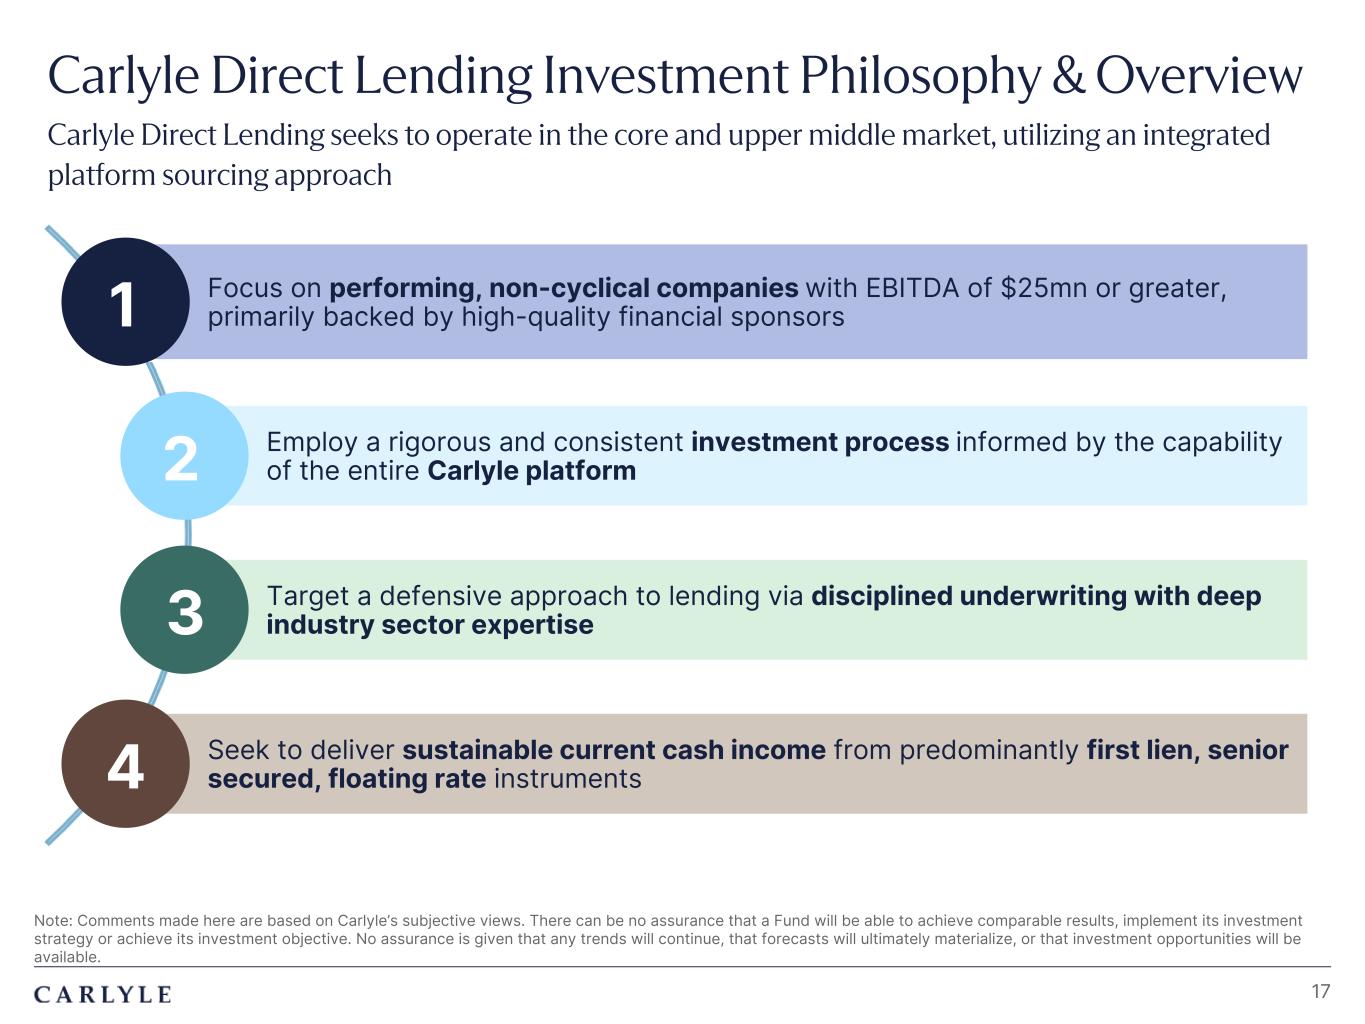
Plum R117 G45 B79 Dark Gray R101 G101 B101 Light Green R216 G240 B221 Pale Blue R221 G244 B255 Light Indigo R176 G188 B228 Indigo R49 G71 B143 Brown R96 G70 B60 Taupe R209 G199 B189 Light Gray R230 G230 B230 Dark Blue R22 G32 B64 Green R57 G108 B101 Champagne R251 G246 B237 Sky Blue R149 G218 B255 Salmon R240 G196 B188 Seek to deliver sustainable current cash income from predominantly first lien, senior secured, floating rate instruments Employ a rigorous and consistent investment process informed by the capability of the entire Carlyle platform Note: Comments made here are based on Carlyle’s subjective views. There can be no assurance that a Fund will be able to achieve comparable results, implement its investment strategy or achieve its investment objective. No assurance is given that any trends will continue, that forecasts will ultimately materialize, or that investment opportunities will be available. 17 Focus on performing, non-cyclical companies with EBITDA of $25mn or greater, primarily backed by high-quality financial sponsors Target a defensive approach to lending via disciplined underwriting with deep industry sector expertise 1 2 3 4 Carlyle Direct Lending Investment Philosophy & Overview Carlyle Direct Lending seeks to operate in the core and upper middle market, utilizing an integrated platform sourcing approach
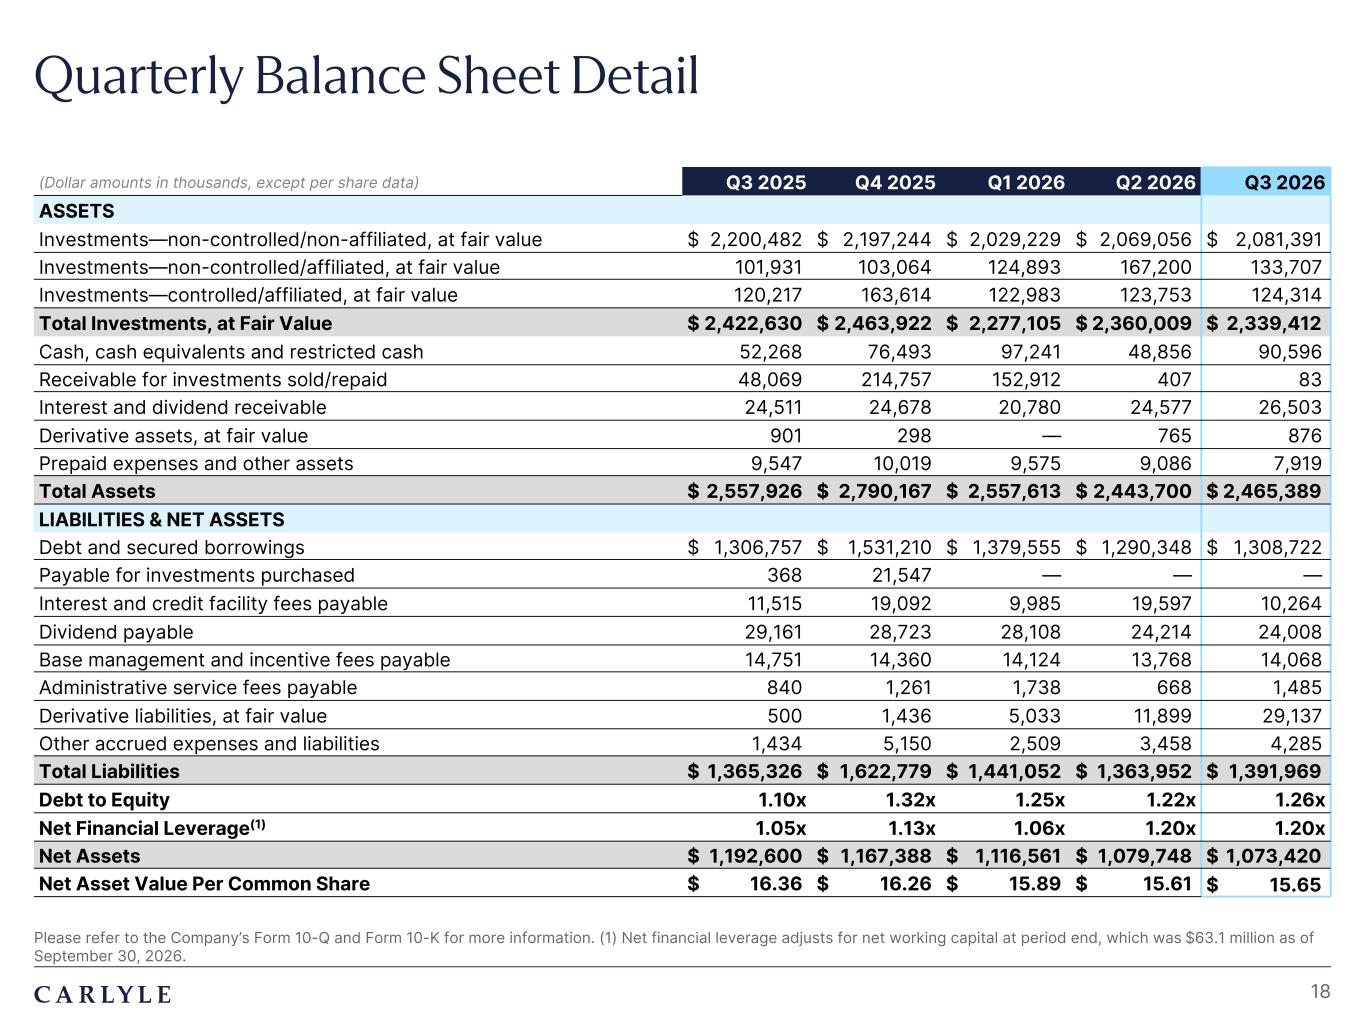
Plum R117 G45 B79 Dark Gray R101 G101 B101 Light Green R216 G240 B221 Pale Blue R221 G244 B255 Light Indigo R176 G188 B228 Indigo R49 G71 B143 Brown R96 G70 B60 Taupe R209 G199 B189 Light Gray R230 G230 B230 Dark Blue R22 G32 B64 Green R57 G108 B101 Champagne R251 G246 B237 Sky Blue R149 G218 B255 Salmon R240 G196 B188 Quarterly Balance Sheet Detail Please refer to the Company’s Form 10-Q and Form 10-K for more information. (1) Net financial leverage adjusts for net working capital at period end, which was $63.1 million as of September 30, 2026. 18 (Dollar amounts in thousands, except per share data) Q3 2025 Q4 2025 Q1 2026 Q2 2026 Q3 2026 ASSETS Investments—non-controlled/non-affiliated, at fair value $ 2,200,482 $ 2,197,244 $ 2,029,229 $ 2,069,056 $ 2,081,391 Investments—non-controlled/affiliated, at fair value 101,931 103,064 124,893 167,200 133,707 Investments—controlled/affiliated, at fair value 120,217 163,614 122,983 123,753 124,314 Total Investments, at Fair Value $ 2,422,630 $ 2,463,922 $ 2,277,105 $ 2,360,009 $ 2,339,412 Cash, cash equivalents and restricted cash 52,268 76,493 97,241 48,856 90,596 Receivable for investments sold/repaid 48,069 214,757 152,912 407 83 Interest and dividend receivable 24,511 24,678 20,780 24,577 26,503 Derivative assets, at fair value 901 298 — 765 876 Prepaid expenses and other assets 9,547 10,019 9,575 9,086 7,919 Total Assets $ 2,557,926 $ 2,790,167 $ 2,557,613 $ 2,443,700 $ 2,465,389 LIABILITIES & NET ASSETS Debt and secured borrowings $ 1,306,757 $ 1,531,210 $ 1,379,555 $ 1,290,348 $ 1,308,722 Payable for investments purchased 368 21,547 — — — Interest and credit facility fees payable 11,515 19,092 9,985 19,597 10,264 Dividend payable 29,161 28,723 28,108 24,214 24,008 Base management and incentive fees payable 14,751 14,360 14,124 13,768 14,068 Administrative service fees payable 840 1,261 1,738 668 1,485 Derivative liabilities, at fair value 500 1,436 5,033 11,899 29,137 Other accrued expenses and liabilities 1,434 5,150 2,509 3,458 4,285 Total Liabilities $ 1,365,326 $ 1,622,779 $ 1,441,052 $ 1,363,952 $ 1,391,969 Debt to Equity 1.10x 1.32x 1.25x 1.22x 1.26x Net Financial Leverage(1) 1.05x 1.13x 1.06x 1.20x 1.20x Net Assets $ 1,192,600 $ 1,167,388 $ 1,116,561 $ 1,079,748 $ 1,073,420 Net Asset Value Per Common Share $ 16.36 $ 16.26 $ 15.89 $ 15.61 $ 15.65
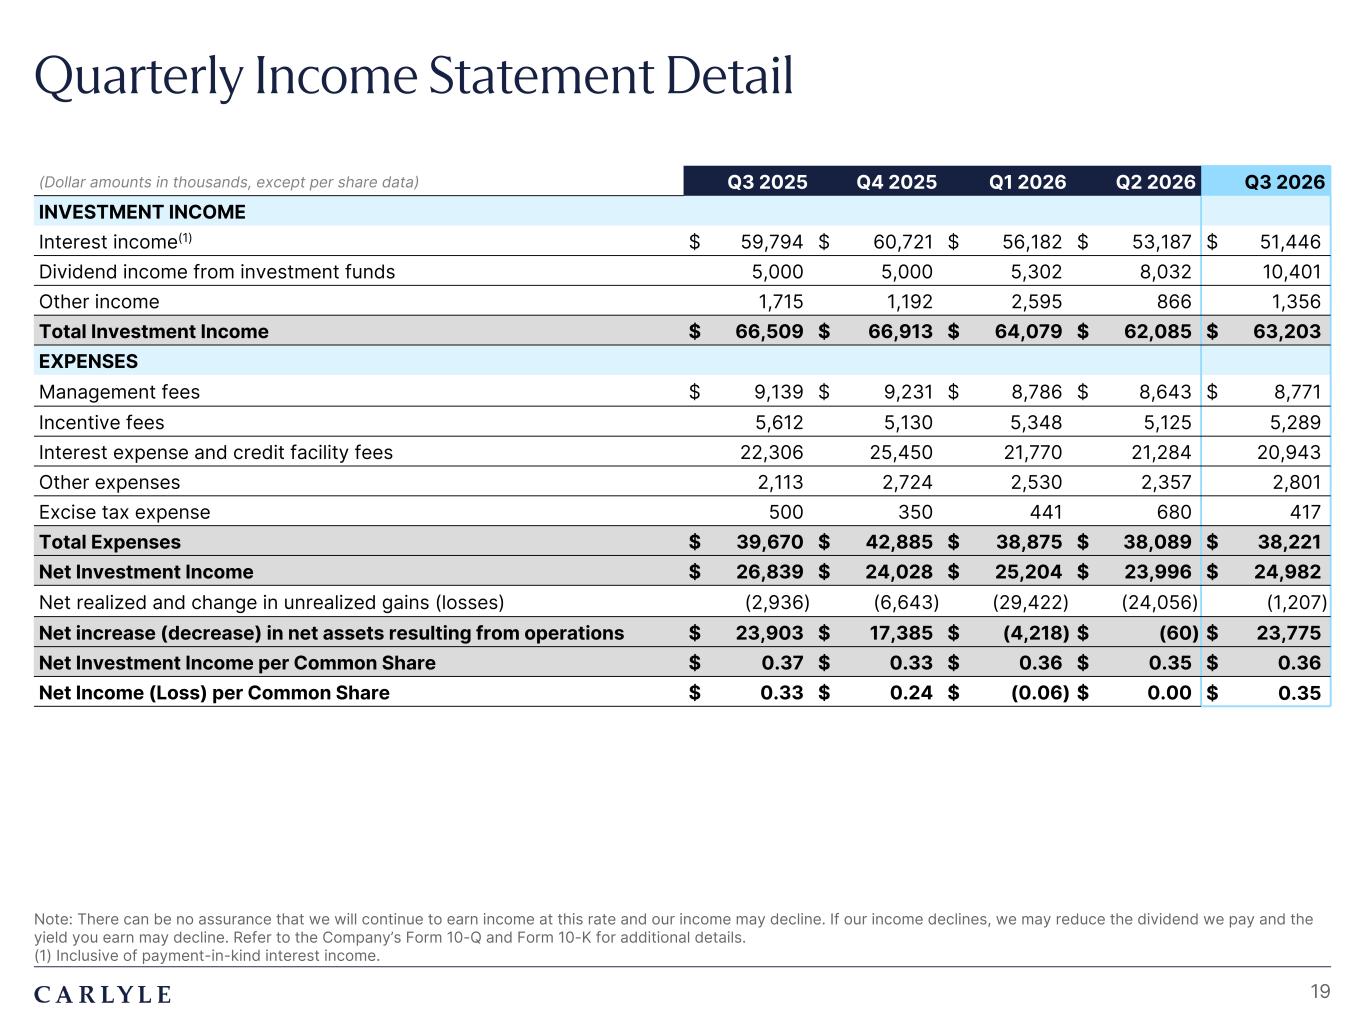
Plum R117 G45 B79 Dark Gray R101 G101 B101 Light Green R216 G240 B221 Pale Blue R221 G244 B255 Light Indigo R176 G188 B228 Indigo R49 G71 B143 Brown R96 G70 B60 Taupe R209 G199 B189 Light Gray R230 G230 B230 Dark Blue R22 G32 B64 Green R57 G108 B101 Champagne R251 G246 B237 Sky Blue R149 G218 B255 Salmon R240 G196 B188 Quarterly Income Statement Detail Note: There can be no assurance that we will continue to earn income at this rate and our income may decline. If our income declines, we may reduce the dividend we pay and the yield you earn may decline. Refer to the Company’s Form 10-Q and Form 10-K for additional details. (1) Inclusive of payment-in-kind interest income. 19 (Dollar amounts in thousands, except per share data) Q3 2025 Q4 2025 Q1 2026 Q2 2026 Q3 2026 INVESTMENT INCOME Interest income(1) $ 59,794 $ 60,721 $ 56,182 $ 53,187 $ 51,446 Dividend income from investment funds 5,000 5,000 5,302 8,032 10,401 Other income 1,715 1,192 2,595 866 1,356 Total Investment Income $ 66,509 $ 66,913 $ 64,079 $ 62,085 $ 63,203 EXPENSES Management fees $ 9,139 $ 9,231 $ 8,786 $ 8,643 $ 8,771 Incentive fees 5,612 5,130 5,348 5,125 5,289 Interest expense and credit facility fees 22,306 25,450 21,770 21,284 20,943 Other expenses 2,113 2,724 2,530 2,357 2,801 Excise tax expense 500 350 441 680 417 Total Expenses $ 39,670 $ 42,885 $ 38,875 $ 38,089 $ 38,221 Net Investment Income $ 26,839 $ 24,028 $ 25,204 $ 23,996 $ 24,982 Net realized and change in unrealized gains (losses) (2,936) (6,643) (29,422) (24,056) (1,207) Net increase (decrease) in net assets resulting from operations $ 23,903 $ 17,385 $ (4,218) $ (60) $ 23,775 Net Investment Income per Common Share $ 0.37 $ 0.33 $ 0.36 $ 0.35 $ 0.36 Net Income (Loss) per Common Share $ 0.33 $ 0.24 $ (0.06) $ 0.00 $ 0.35
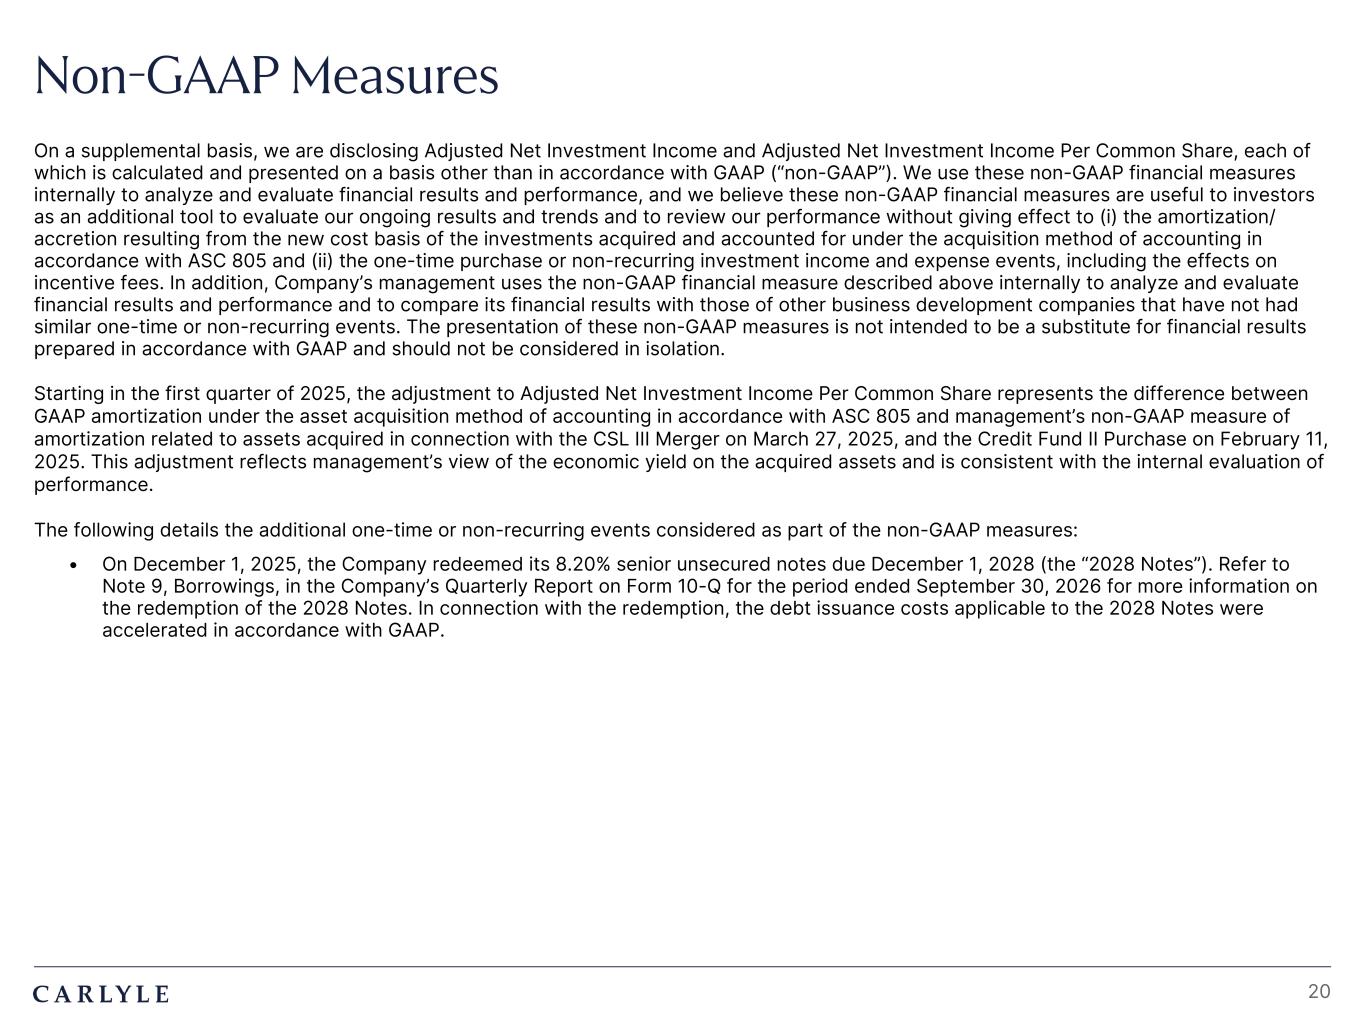
Plum R117 G45 B79 Dark Gray R101 G101 B101 Light Green R216 G240 B221 Pale Blue R221 G244 B255 Light Indigo R176 G188 B228 Indigo R49 G71 B143 Brown R96 G70 B60 Taupe R209 G199 B189 Light Gray R230 G230 B230 Dark Blue R22 G32 B64 Green R57 G108 B101 Champagne R251 G246 B237 Sky Blue R149 G218 B255 Salmon R240 G196 B188 20 Non-GAAP Measures On a supplemental basis, we are disclosing Adjusted Net Investment Income and Adjusted Net Investment Income Per Common Share, each of which is calculated and presented on a basis other than in accordance with GAAP (“non-GAAP”). We use these non-GAAP financial measures internally to analyze and evaluate financial results and performance, and we believe these non-GAAP financial measures are useful to investors as an additional tool to evaluate our ongoing results and trends and to review our performance without giving effect to (i) the amortization/ accretion resulting from the new cost basis of the investments acquired and accounted for under the acquisition method of accounting in accordance with ASC 805 and (ii) the one-time purchase or non-recurring investment income and expense events, including the effects on incentive fees. In addition, Company’s management uses the non-GAAP financial measure described above internally to analyze and evaluate financial results and performance and to compare its financial results with those of other business development companies that have not had similar one-time or non-recurring events. The presentation of these non-GAAP measures is not intended to be a substitute for financial results prepared in accordance with GAAP and should not be considered in isolation. Starting in the first quarter of 2025, the adjustment to Adjusted Net Investment Income Per Common Share represents the difference between GAAP amortization under the asset acquisition method of accounting in accordance with ASC 805 and management’s non-GAAP measure of amortization related to assets acquired in connection with the CSL III Merger on March 27, 2025, and the Credit Fund II Purchase on February 11, 2025. This adjustment reflects management’s view of the economic yield on the acquired assets and is consistent with the internal evaluation of performance. The following details the additional one-time or non-recurring events considered as part of the non-GAAP measures: • On December 1, 2025, the Company redeemed its 8.20% senior unsecured notes due December 1, 2028 (the “2028 Notes”). Refer to Note 9, Borrowings, in the Company’s Quarterly Report on Form 10-Q for the period ended September 30, 2026 for more information on the redemption of the 2028 Notes. In connection with the redemption, the debt issuance costs applicable to the 2028 Notes were accelerated in accordance with GAAP.