
Q3 2026 INVESTOR PRESENTATION November 5, 2026 NYSE: SPNT
Basis of Presentation and Non-GAAP Financial Measures: Unless the context otherwise indicates or requires, as used in this presentation references to “we,” “our,” “us,” the “Company,” and "SiriusPoint" refer to SiriusPoint Ltd. and its directly and indirectly owned subsidiaries, as a combined entity, except where otherwise stated or where it is clear that the terms mean only SiriusPoint Ltd. exclusive of its subsidiaries. We have made rounding adjustments to reach some of the figures included in this presentation and, unless otherwise indicated, percentages presented in this presentation are approximate. In presenting SiriusPoint’s results, management has included financial measures that are not calculated under standards or rules that comprise accounting principles generally accepted in the United States (“GAAP”). SiriusPoint’s management uses this information in its internal analysis of results and believes that this information may be informative to investors in gauging the quality of SiriusPoint’s financial performance, identifying trends in our results and providing meaningful period-to-period comparisons. Core underwriting income, Core net services income, Core income, Core combined ratio, accident year loss ratio, accident year combined ratio, attritional loss ratio and combined ratio ex. catastrophe losses are non-GAAP financial measures. Management believes it is useful to review Core results as it better reflects how management views the business and reflects the Company’s decision to exit the run-off business. Book value per diluted common share excluding accumulated other comprehensive income (loss) ("AOCI") and tangible book value per diluted common share, as presented, are non-GAAP financial measures and the most directly comparable U.S. GAAP measure is book value per diluted common share. Management believes it is useful to exclude AOCI because it may fluctuate significantly between periods based on movements in interest and currency rates. Management believes the effects of intangible assets are not indicative of underlying underwriting results or trends and make book value comparisons to less acquisitive peer companies less meaningful. Operating net income, Core Operating net income, Operating earnings per share and Core Operating earnings per share are non-GAAP financial measures and the most directly comparable U.S. GAAP measures are net income and diluted earnings per share. Operating net income excludes items which we believe are not indicative of the operations of our operating businesses, including realized and unrealized gains (losses) on other investments and liability-classified capital instruments, non-recurring costs associated with acquisitions or sales of subsidiaries, income (expense) related to loss portfolio transfers, deferred tax assets attributable to the enactment of the Bermuda corporate income tax, development on COVID-19 reserves resulting from the COVID-19 reserve study performed concurrently with the settlement of the Series A Preference shares in the third quarter of 2024, amortization of acquisition-related intangible assets, and foreign exchange gains (losses). Core Operating net income also excludes the Corporate (run-off) business. We believe it is useful to review Operating net income and Core Operating net income as they reflect how we view the business, as well as provides investors with an alternative metric that can assist in predicting future earnings and profitability that are complementary to GAAP metrics. Operating ROE is calculated by dividing annualized Operating net income for the period by average common shareholders’ equity, excluding AOCI, and after adjusting for the above noted items to arrive at Operating net income. Core Operating ROE also excludes the results of the Corporate (run-off) business. Prior-period results have been recast to reflect current period presentation. A reconciliation of these non-GAAP financial measures to the most directly comparable GAAP measure is contained in our Form 10-Q, Earnings Release or Financial Supplement for the quarter ended September 30, 2026 and in Appendices B1-5 on slides 32-36 in this deck. Safe Harbor Statement Regarding Forward-Looking Statements: This presentation includes “forward-looking statements” within the meaning of the Private Securities Litigation Reform Act of 1995. Forward-looking statements are subject to known and unknown risks and uncertainties, many of which may be beyond the Company’s control. The Company cautions you that the forward-looking information presented in this presentation is not a guarantee of future events, and that actual events may differ materially from those made in or suggested by the forward-looking information contained in this presentation. In addition, forward-looking statements generally can be identified by the use of forward-looking terminology such as “believes,” “intends,” “seeks,” “anticipates,” “aims,” “plans,” “targets,” “estimates,” “expects,” “assumes,” “continues,” “guidance,” “should,” “could,” “will,” “may” and the negative of these or similar terms and phrases. These risks and uncertainties include, but are not limited to, the "Risk Factors" described in the Company's most recent Annual Report on Form 10-K and other subsequent periodic reports filed with the Securities and Exchange Commission. All forward-looking statements speak only as of the date made and the Company undertakes no obligation to update or revise publicly any forward-looking statements, whether as a result of new information, future events or otherwise, except as required by applicable law. Appendix A5 on slide 30 contains a glossary of abbreviated terms. 2 DISCLAIMER

AGENDA 3 Highlights & Strategic Update Scott Egan, Group CEO Third Quarter & Nine Months Financial Results Jim McKinney, Group CFO Q&A

Highlights & Strategic Update
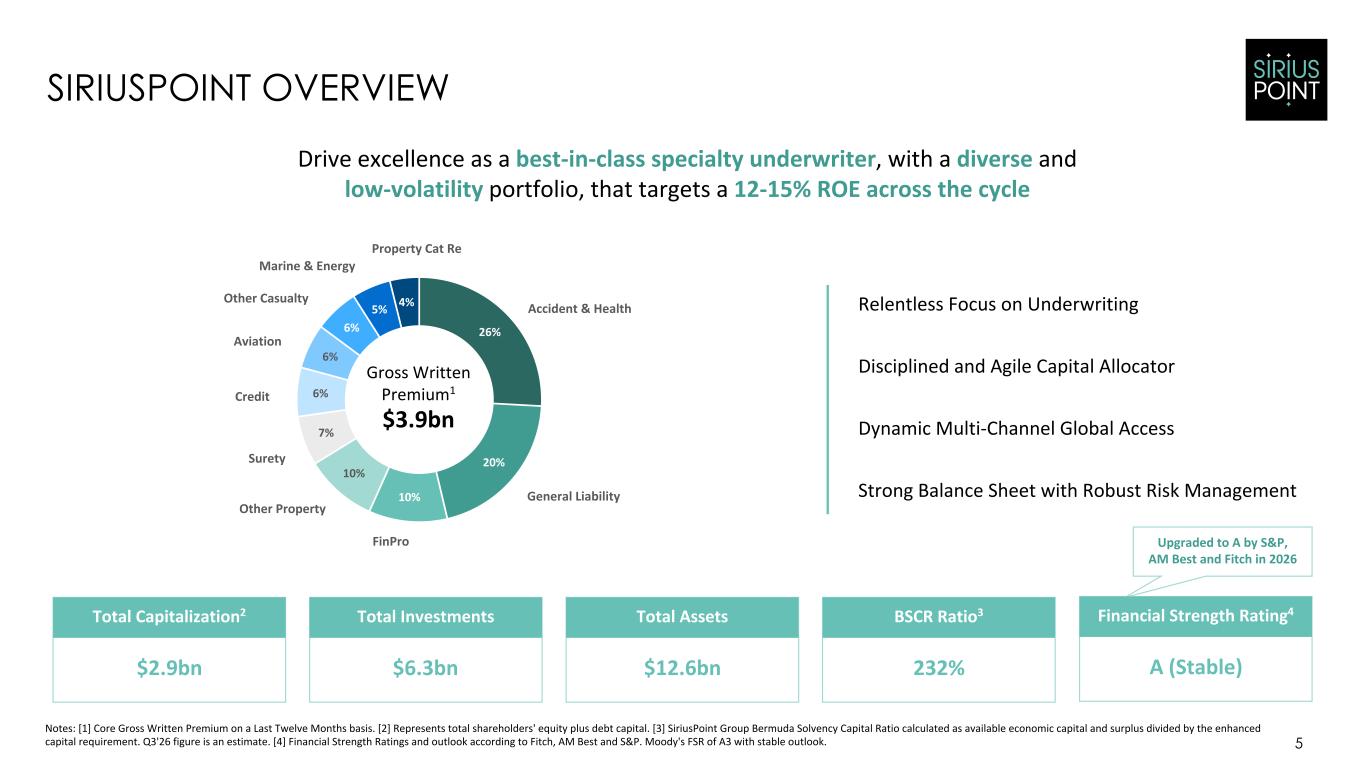
Upgraded to A by S&P, AM Best and Fitch in 2026 5 SIRIUSPOINT OVERVIEW Notes: [1] Core Gross Written Premium on a Last Twelve Months basis. [2] Represents total shareholders' equity plus debt capital. [3] SiriusPoint Group Bermuda Solvency Capital Ratio calculated as available economic capital and surplus divided by the enhanced capital requirement. Q3'26 figure is an estimate. [4] Financial Strength Ratings and outlook according to Fitch, AM Best and S&P. Moody's FSR of A3 with stable outlook. Drive excellence as a best-in-class specialty underwriter, with a diverse and low-volatility portfolio, that targets a 12-15% ROE across the cycle Total AssetsTotal InvestmentsTotal Capitalization2 $2.9bn $6.3bn $12.6bn BSCR Ratio3 232% Financial Strength Rating4 A (Stable) Strong Balance Sheet with Robust Risk Management Relentless Focus on Underwriting Disciplined and Agile Capital Allocator Dynamic Multi-Channel Global Access 26% 20% 10% 10% 7% 6% 6% 6% 5% 4% Accident & Health General Liability FinPro Surety Credit Aviation Other Casualty Marine & Energy Gross Written Premium1 $3.9bn Other Property Property Cat Re
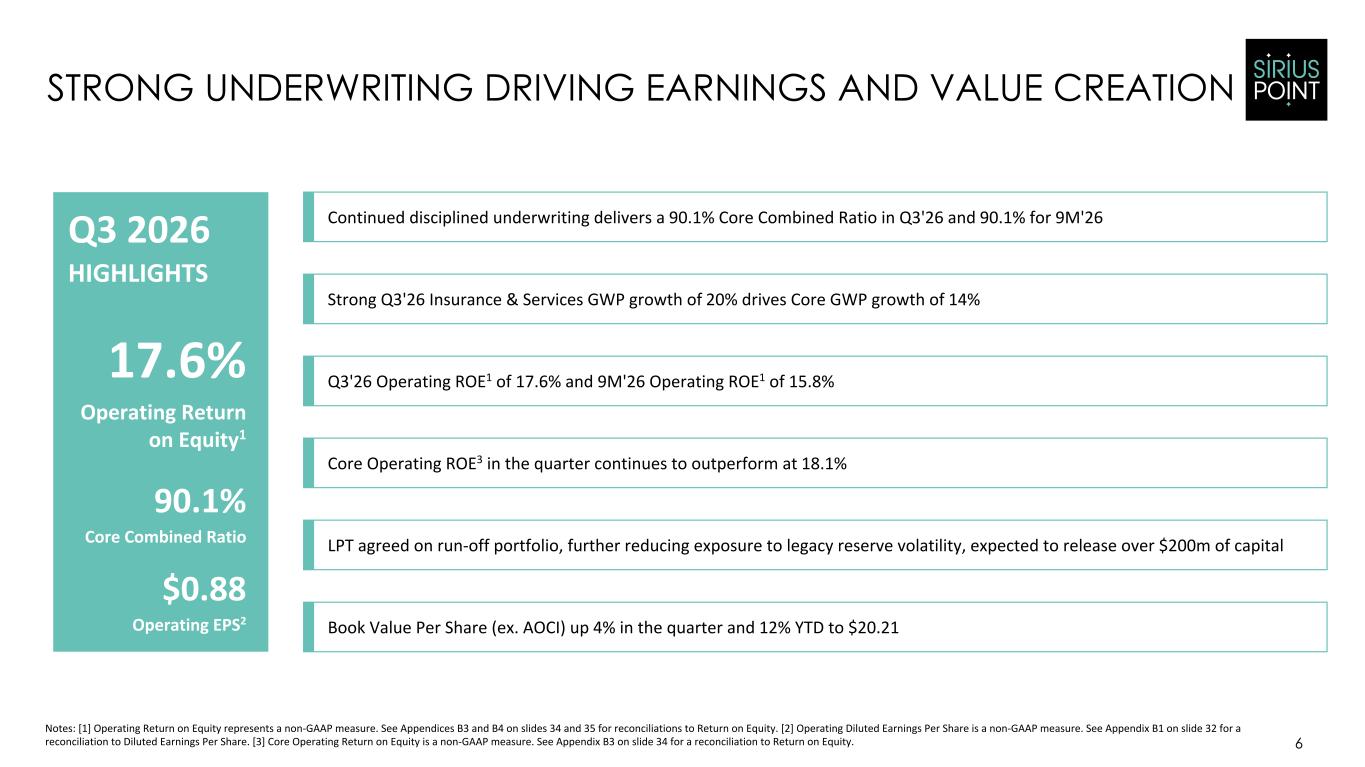
6 STRONG UNDERWRITING DRIVING EARNINGS AND VALUE CREATION Continued disciplined underwriting delivers a 90.1% Core Combined Ratio in Q3'26 and 90.1% for 9M'26 Strong Q3'26 Insurance & Services GWP growth of 20% drives Core GWP growth of 14% Q3'26 Operating ROE1 of 17.6% and 9M'26 Operating ROE1 of 15.8% Core Operating ROE3 in the quarter continues to outperform at 18.1% LPT agreed on run-off portfolio, further reducing exposure to legacy reserve volatility, expected to release over $200m of capital 17.6% Operating Return on Equity1 90.1% Core Combined Ratio $0.88 Operating EPS2 Q3 2026 HIGHLIGHTS Notes: [1] Operating Return on Equity represents a non-GAAP measure. See Appendices B3 and B4 on slides 34 and 35 for reconciliations to Return on Equity. [2] Operating Diluted Earnings Per Share is a non-GAAP measure. See Appendix B1 on slide 32 for a reconciliation to Diluted Earnings Per Share. [3] Core Operating Return on Equity is a non-GAAP measure. See Appendix B3 on slide 34 for a reconciliation to Return on Equity. Book Value Per Share (ex. AOCI) up 4% in the quarter and 12% YTD to $20.21
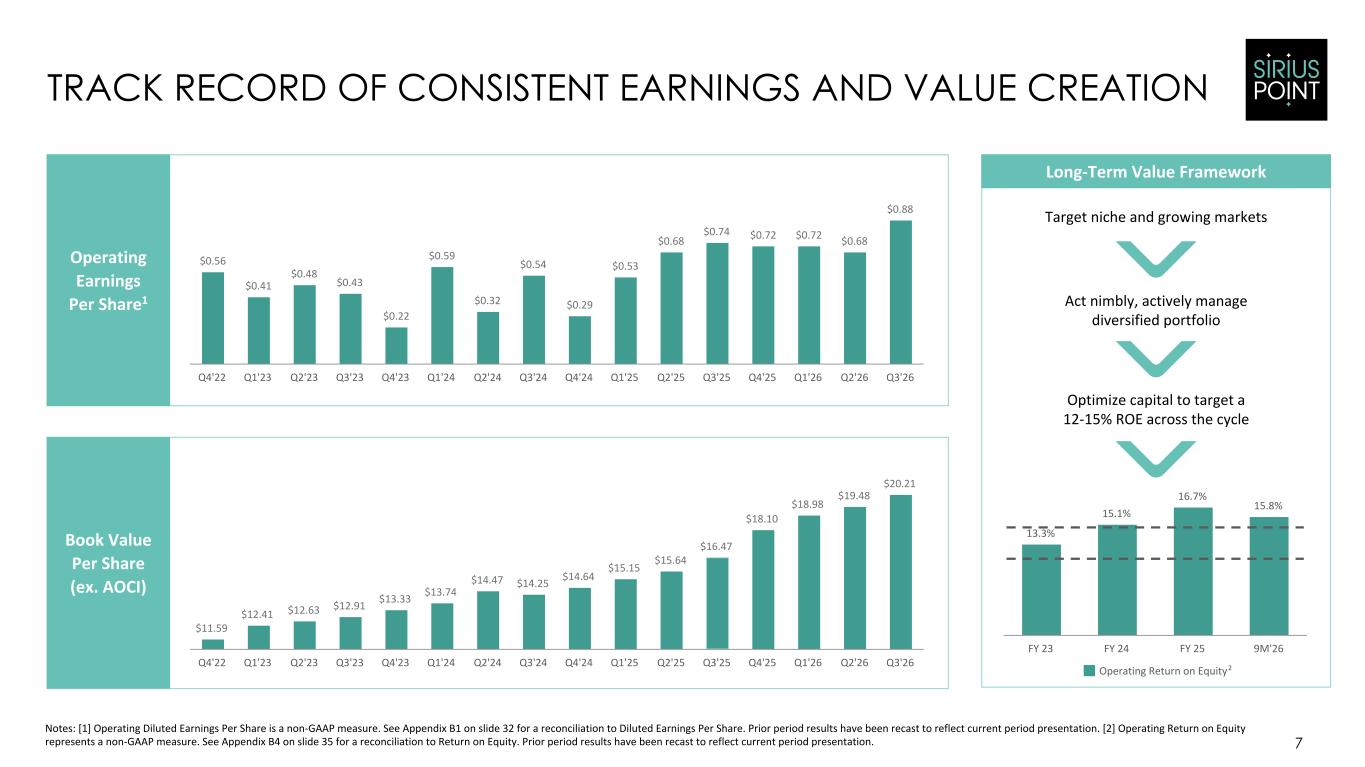
$11.59 $12.41 $12.63 $12.91 $13.33 $13.74 $14.47 $14.25 $14.64 $15.15 $15.64 $16.47 $18.10 $18.98 $19.48 $20.21 Q4'22 Q1'23 Q2'23 Q3'23 Q4'23 Q1'24 Q2'24 Q3'24 Q4'24 Q1'25 Q2'25 Q3'25 Q4'25 Q1'26 Q2'26 Q3'26 $0.56 $0.41 $0.48 $0.43 $0.22 $0.59 $0.32 $0.54 $0.29 $0.53 $0.68 $0.74 $0.72 $0.72 $0.68 $0.88 Q4'22 Q1'23 Q2'23 Q3'23 Q4'23 Q1'24 Q2'24 Q3'24 Q4'24 Q1'25 Q2'25 Q3'25 Q4'25 Q1'26 Q2'26 Q3'26 7 TRACK RECORD OF CONSISTENT EARNINGS AND VALUE CREATION Notes: [1] Operating Diluted Earnings Per Share is a non-GAAP measure. See Appendix B1 on slide 32 for a reconciliation to Diluted Earnings Per Share. Prior period results have been recast to reflect current period presentation. [2] Operating Return on Equity represents a non-GAAP measure. See Appendix B4 on slide 35 for a reconciliation to Return on Equity. Prior period results have been recast to reflect current period presentation. Operating Earnings Per Share1 Book Value Per Share (ex. AOCI) Long-Term Value Framework 13.3% 15.1% 16.7% 15.8% Operating Return on Equity FY 23 FY 24 FY 25 9M'26 Target niche and growing markets Act nimbly, actively manage diversified portfolio Optimize capital to target a 12-15% ROE across the cycle 2
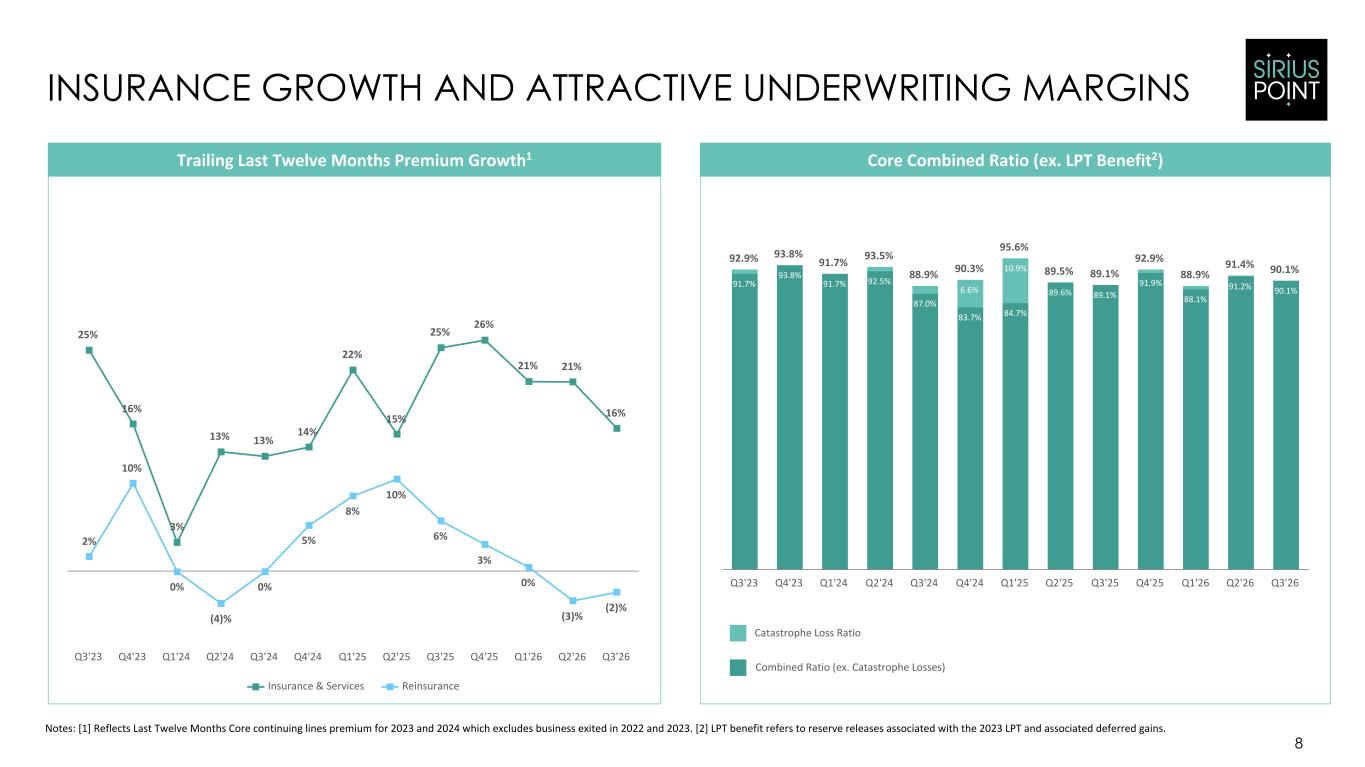
8 INSURANCE GROWTH AND ATTRACTIVE UNDERWRITING MARGINS Core Combined Ratio (ex. LPT Benefit2)Trailing Last Twelve Months Premium Growth1 91.7% 93.8% 91.7% 92.5% 87.0% 83.7% 84.7% 89.6% 89.1% 91.9% 88.1% 91.2% 90.1%6.6% 10.9% 92.9% 93.8% 91.7% 93.5% 88.9% 90.3% 95.6% 89.5% 89.1% 92.9% 88.9% 91.4% 90.1% Q3'23 Q4'23 Q1'24 Q2'24 Q3'24 Q4'24 Q1'25 Q2'25 Q3'25 Q4'25 Q1'26 Q2'26 Q3'26 Catastrophe Loss Ratio Combined Ratio (ex. Catastrophe Losses) 25% 16% 3% 13% 13% 14% 22% 15% 25% 26% 21% 21% 16% 2% 10% 0% (4)% 0% 5% 8% 10% 6% 3% 0% (3)% (2)% Insurance & Services Reinsurance Q3'23 Q4'23 Q1'24 Q2'24 Q3'24 Q4'24 Q1'25 Q2'25 Q3'25 Q4'25 Q1'26 Q2'26 Q3'26 Notes: [1] Reflects Last Twelve Months Core continuing lines premium for 2023 and 2024 which excludes business exited in 2022 and 2023. [2] LPT benefit refers to reserve releases associated with the 2023 LPT and associated deferred gains.
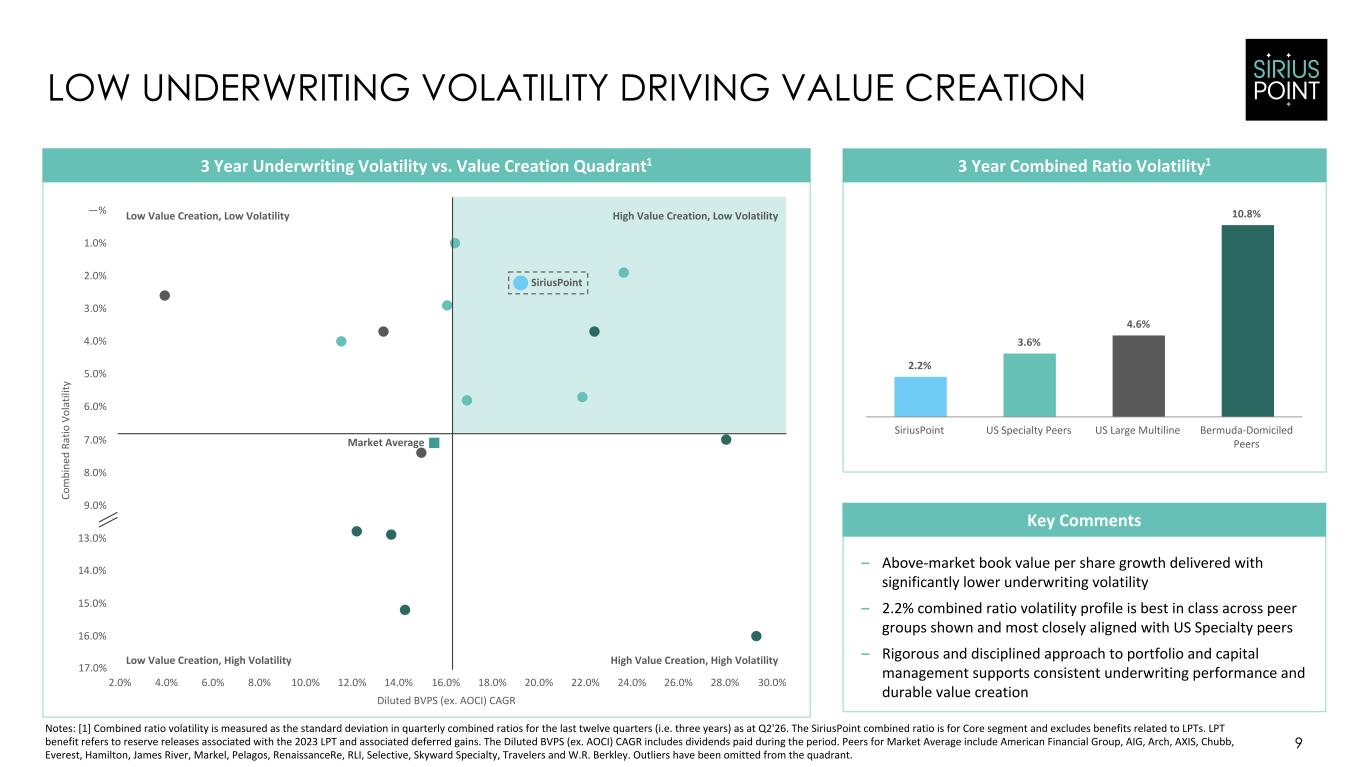
Diluted BVPS (ex. AOCI) CAGR Co m bi ne d Ra tio V ol at ili ty SiriusPoint Market Average 2.0% 4.0% 6.0% 8.0% 10.0% 12.0% 14.0% 16.0% 18.0% 20.0% 22.0% 24.0% 26.0% 28.0% 30.0% —% 1.0% 2.0% 3.0% 4.0% 5.0% 6.0% 7.0% 8.0% 9.0% 10.0% 11.0% 12.0% 13.0% 14.0% 3 Year Combined Ratio Volatility1 9 LOW UNDERWRITING VOLATILITY DRIVING VALUE CREATION Notes: [1] Combined ratio volatility is measured as the standard deviation in quarterly combined ratios for the last twelve quarters (i.e. three years) as at Q2'26. The SiriusPoint combined ratio is for Core segment and excludes benefits related to LPTs. LPT benefit refers to reserve releases associated with the 2023 LPT and associated deferred gains. The Diluted BVPS (ex. AOCI) CAGR includes dividends paid during the period. Peers for Market Average include American Financial Group, AIG, Arch, AXIS, Chubb, Everest, Hamilton, James River, Markel, Pelagos, RenaissanceRe, RLI, Selective, Skyward Specialty, Travelers and W.R. Berkley. Outliers have been omitted from the quadrant. 2.2% 3.6% 4.6% 10.8% SiriusPoint US Specialty Peers US Large Multiline Bermuda-Domiciled Peers Key Comments – Above-market book value per share growth delivered with significantly lower underwriting volatility – 2.2% combined ratio volatility profile is best in class across peer groups shown and most closely aligned with US Specialty peers – Rigorous and disciplined approach to portfolio and capital management supports consistent underwriting performance and durable value creation 3 Year Underwriting Volatility vs. Value Creation Quadrant1 Low Value Creation, Low Volatility High Value Creation, Low Volatility Low Value Creation, High Volatility High Value Creation, High Volatility 3 4 5 6 7
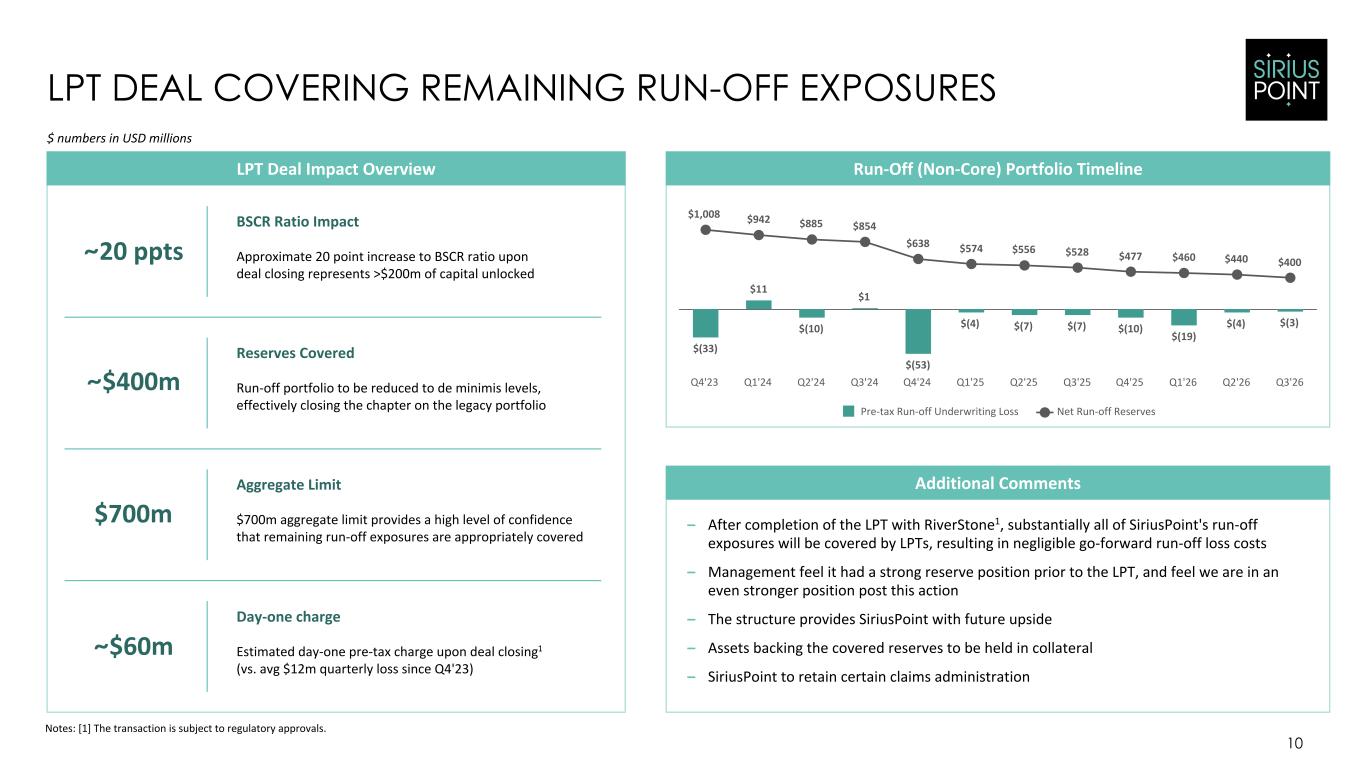
10 LPT DEAL COVERING REMAINING RUN-OFF EXPOSURES Additional Comments – After completion of the LPT with RiverStone1, substantially all of SiriusPoint's run-off exposures will be covered by LPTs, resulting in negligible go-forward run-off loss costs – Management feel it had a strong reserve position prior to the LPT, and feel we are in an even stronger position post this action – The structure provides SiriusPoint with future upside – Assets backing the covered reserves to be held in collateral – SiriusPoint to retain certain claims administration Run-Off (Non-Core) Portfolio Timeline $(33) $11 $(10) $1 $(53) $(4) $(7) $(7) $(10) $(19) $(4) $(3) $1,008 $942 $885 $854 $638 $574 $556 $528 $477 $460 $440 $400 Pre-tax Run-off Underwriting Loss Net Run-off Reserves Q4'23 Q1'24 Q2'24 Q3'24 Q4'24 Q1'25 Q2'25 Q3'25 Q4'25 Q1'26 Q2'26 Q3'26 LPT Deal Impact Overview $ numbers in USD millions ~20 ppts ~$400m $700m ~$60m BSCR Ratio Impact Approximate 20 point increase to BSCR ratio upon deal closing represents >$200m of capital unlocked Reserves Covered Run-off portfolio to be reduced to de minimis levels, effectively closing the chapter on the legacy portfolio Aggregate Limit $700m aggregate limit provides a high level of confidence that remaining run-off exposures are appropriately covered Day-one charge Estimated day-one pre-tax charge upon deal closing1 (vs. avg $12m quarterly loss since Q4'23) Notes: [1] The transaction is subject to regulatory approvals.
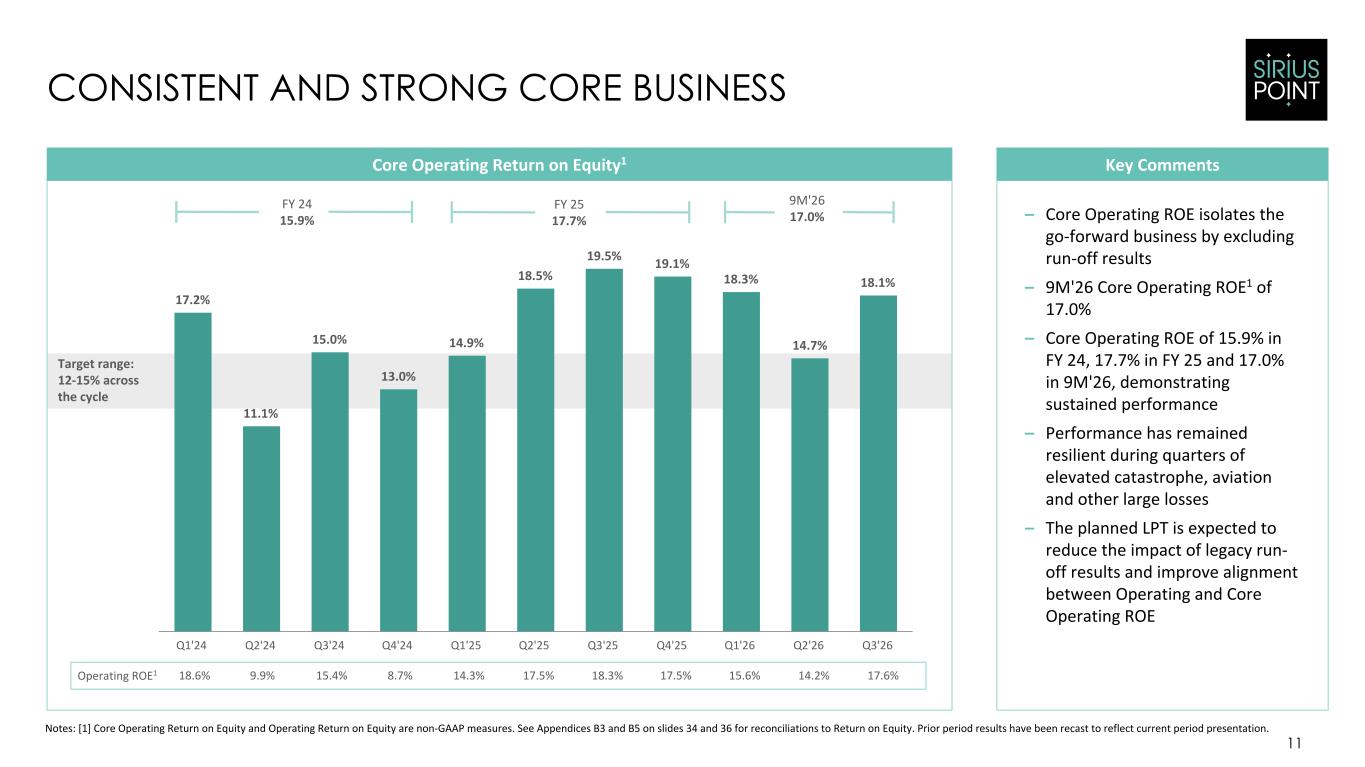
11 CONSISTENT AND STRONG CORE BUSINESS Core Operating Return on Equity1 17.2% 11.1% 15.0% 13.0% 14.9% 18.5% 19.5% 19.1% 18.3% 14.7% 18.1% Q1'24 Q2'24 Q3'24 Q4'24 Q1'25 Q2'25 Q3'25 Q4'25 Q1'26 Q2'26 Q3'26 Notes: [1] Core Operating Return on Equity and Operating Return on Equity are non-GAAP measures. See Appendices B3 and B5 on slides 34 and 36 for reconciliations to Return on Equity. Prior period results have been recast to reflect current period presentation. – Core Operating ROE isolates the go-forward business by excluding run-off results – 9M'26 Core Operating ROE1 of 17.0% – Core Operating ROE of 15.9% in FY 24, 17.7% in FY 25 and 17.0% in 9M'26, demonstrating sustained performance – Performance has remained resilient during quarters of elevated catastrophe, aviation and other large losses – The planned LPT is expected to reduce the impact of legacy run- off results and improve alignment between Operating and Core Operating ROE Key Comments 18.6% 9.9% 15.4% 8.7% 14.3% 17.5% 18.3% 17.5% 15.6% 14.2% 17.6% Target range: 12-15% across the cycle Operating ROE1 FY 25 17.7% FY 24 15.9% 9M'26 17.0%
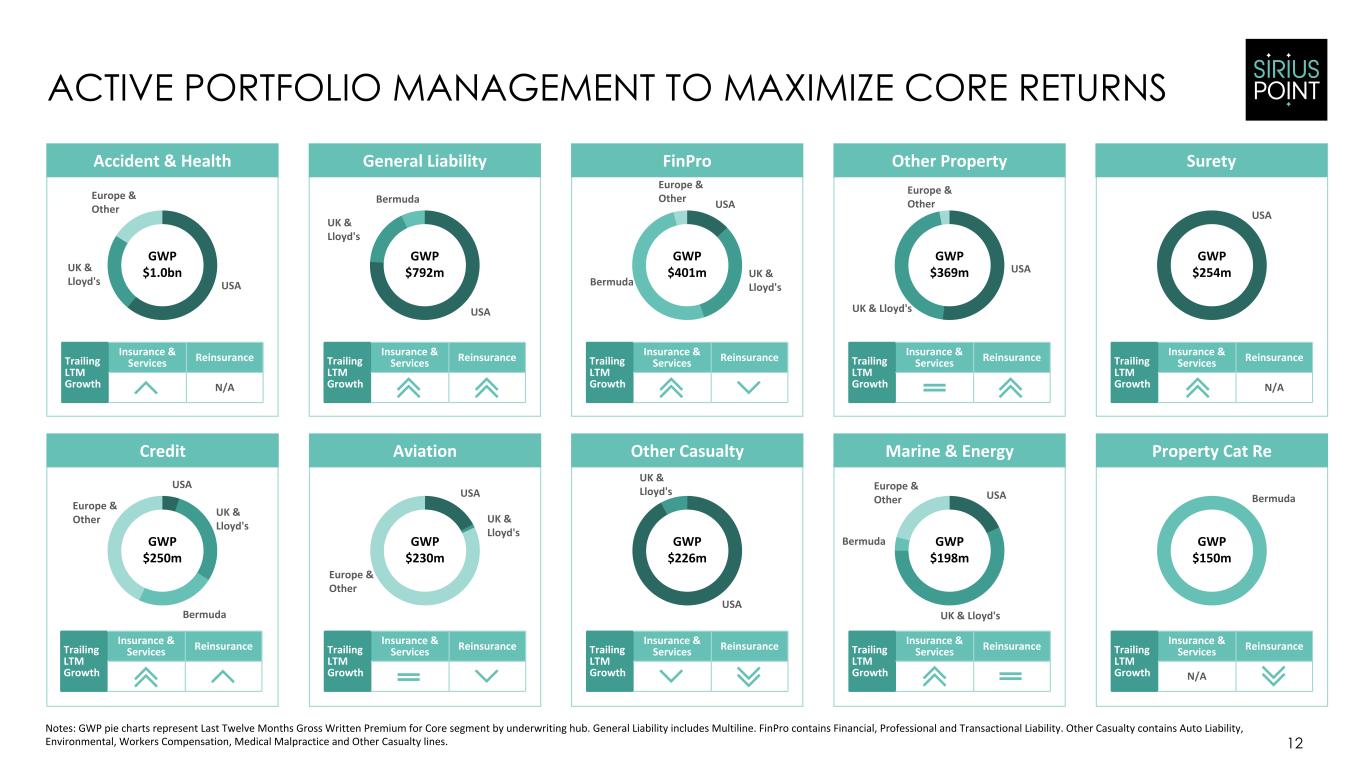
UK & Lloyd's 12 ACTIVE PORTFOLIO MANAGEMENT TO MAXIMIZE CORE RETURNS Accident & Health Property Cat Re Notes: GWP pie charts represent Last Twelve Months Gross Written Premium for Core segment by underwriting hub. General Liability includes Multiline. FinPro contains Financial, Professional and Transactional Liability. Other Casualty contains Auto Liability, Environmental, Workers Compensation, Medical Malpractice and Other Casualty lines. General Liability FinPro Surety Credit Other Casualty USA UK & Lloyd's Europe & Other USA UK & Lloyd's Bermuda USA UK & Lloyd'sBermuda Europe & Other USA USA Europe & Other Bermuda USA UK & Lloyd's Bermuda Europe & Other USA UK & Lloyd's GWP $1.0bn GWP $792m GWP $401m GWP $254m GWP $250m GWP $230m GWP $226m GWP $150m Marine & Energy Other Property USA UK & Lloyd's Europe & Other USA UK & Lloyd's Europe & Other GWP $369m GWP $198m Aviation Bermuda Trailing LTM Growth Insurance & Services Reinsurance N/A Trailing LTM Growth Insurance & Services Reinsurance Trailing LTM Growth Insurance & Services Reinsurance Trailing LTM Growth Insurance & Services Reinsurance Trailing LTM Growth Insurance & Services Reinsurance N/A Trailing LTM Growth Insurance & Services Reinsurance N/A Trailing LTM Growth Insurance & Services ReinsuranceTrailing LTM Growth Insurance & Services ReinsuranceTrailing LTM Growth Insurance & Services ReinsuranceTrailing LTM Growth Insurance & Services Reinsurance
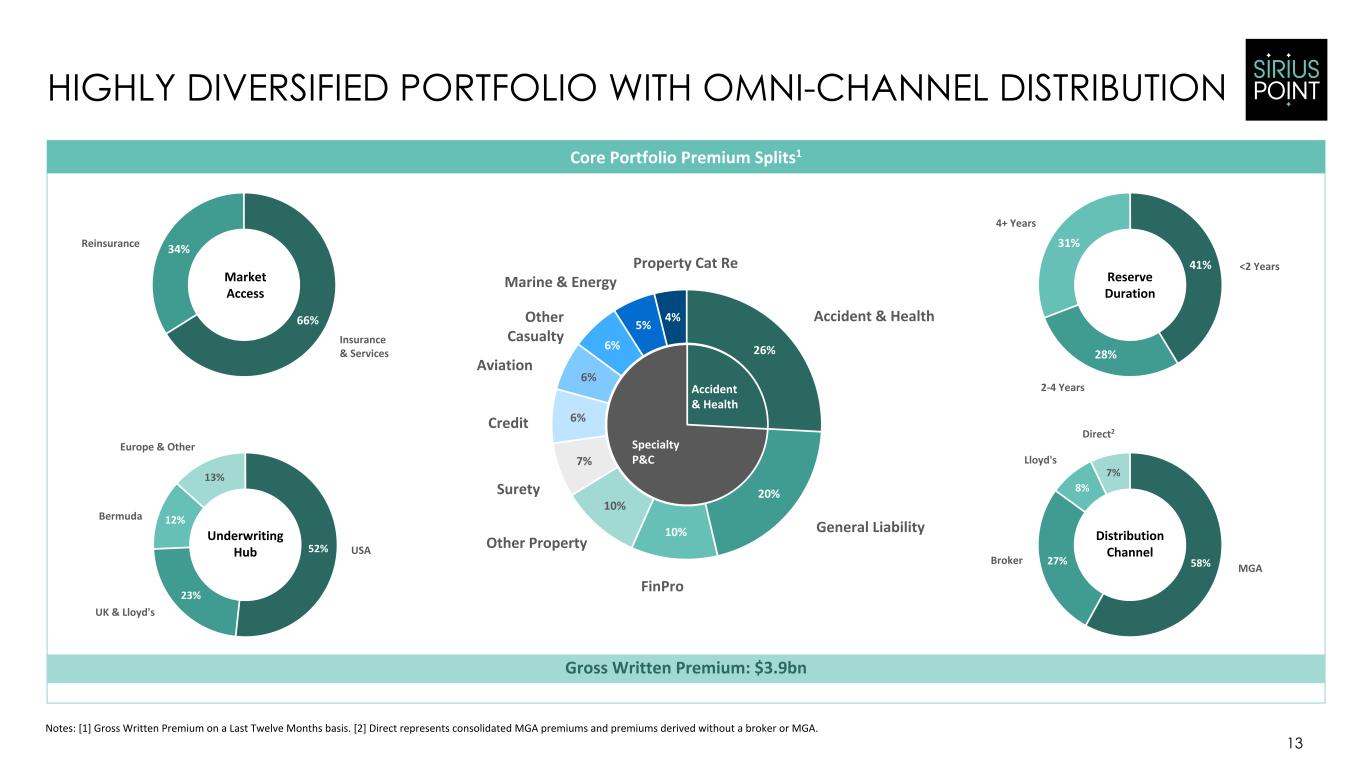
58%27% 8% 7% 13 HIGHLY DIVERSIFIED PORTFOLIO WITH OMNI-CHANNEL DISTRIBUTION Notes: [1] Gross Written Premium on a Last Twelve Months basis. [2] Direct represents consolidated MGA premiums and premiums derived without a broker or MGA. 66% 34% Distribution Channel52% 23% 12% 13% Underwriting Hub Core Portfolio Premium Splits1 26% 20% 10% 10% 7% 6% 6% 6% 5% 4% Accident & Health General Liability FinPro Surety Credit Aviation Other Casualty Marine & Energy Other Property Property Cat Re 41% 28% 31% Reserve Duration Insurance & Services Reinsurance USA UK & Lloyd's Bermuda Europe & Other <2 Years 2-4 Years 4+ Years MGA Broker Lloyd's Direct2 Market Access Accident & Health Specialty P&C Gross Written Premium: $3.9bn
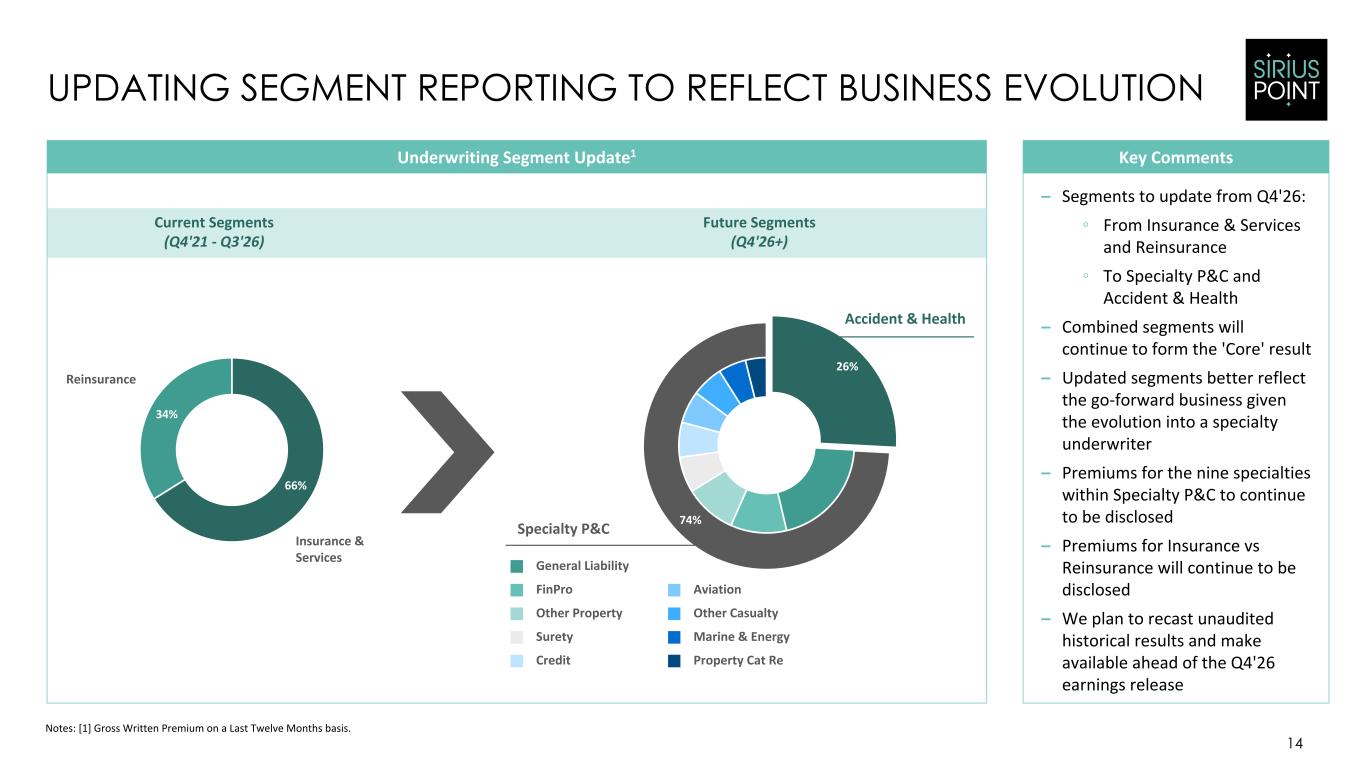
26% 74% 14 UPDATING SEGMENT REPORTING TO REFLECT BUSINESS EVOLUTION Notes: [1] Gross Written Premium on a Last Twelve Months basis. 66% 34% Underwriting Segment Update1 Accident & Health General Liability FinPro Surety Credit Aviation Other Casualty Marine & Energy Other Property Property Cat Re Insurance & Services Reinsurance Key Comments – Segments to update from Q4'26: ◦ From Insurance & Services and Reinsurance ◦ To Specialty P&C and Accident & Health – Combined segments will continue to form the 'Core' result – Updated segments better reflect the go-forward business given the evolution into a specialty underwriter – Premiums for the nine specialties within Specialty P&C to continue to be disclosed – Premiums for Insurance vs Reinsurance will continue to be disclosed – We plan to recast unaudited historical results and make available ahead of the Q4'26 earnings release Current Segments (Q4'21 - Q3'26) Future Segments (Q4'26+) Specialty P&C
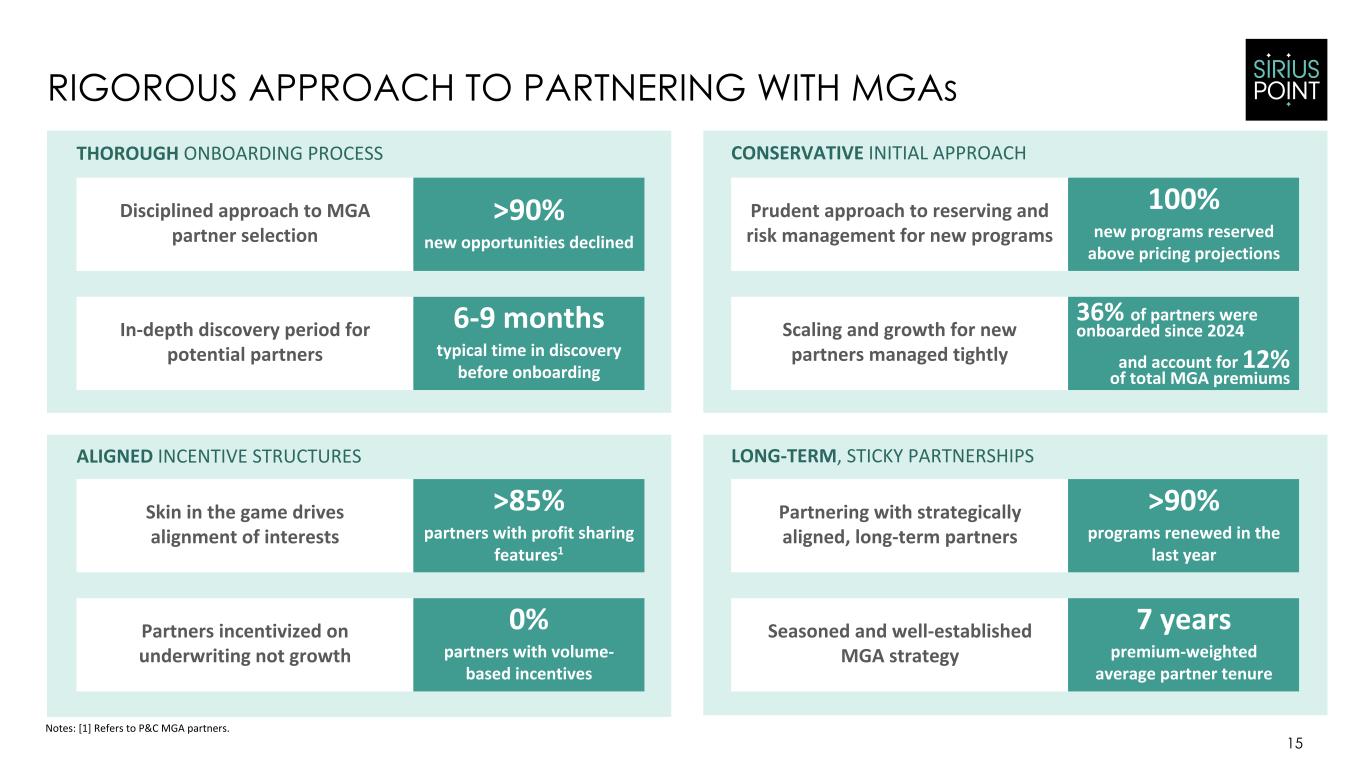
15 RIGOROUS APPROACH TO PARTNERING WITH MGAs Notes: [1] Refers to P&C MGA partners. Disciplined approach to MGA partner selection >90% new opportunities declined In-depth discovery period for potential partners 6-9 months typical time in discovery before onboarding onboarding long term THOROUGH ONBOARDING PROCESS ALIGNED INCENTIVE STRUCTURES LONG-TERM, STICKY PARTNERSHIPS Skin in the game drives alignment of interests >85% partners with profit sharing features1 Partners incentivized on underwriting not growth 0% partners with volume- based incentives Partnering with strategically aligned, long-term partners >90% programs renewed in the last year Seasoned and well-established MGA strategy 7 years premium-weighted average partner tenure Prudent approach to reserving and risk management for new programs 100% new programs reserved above pricing projections Scaling and growth for new partners managed tightly CONSERVATIVE INITIAL APPROACH 36% of partners were onboarded since 2024 and account for 12% of total MGA premiums
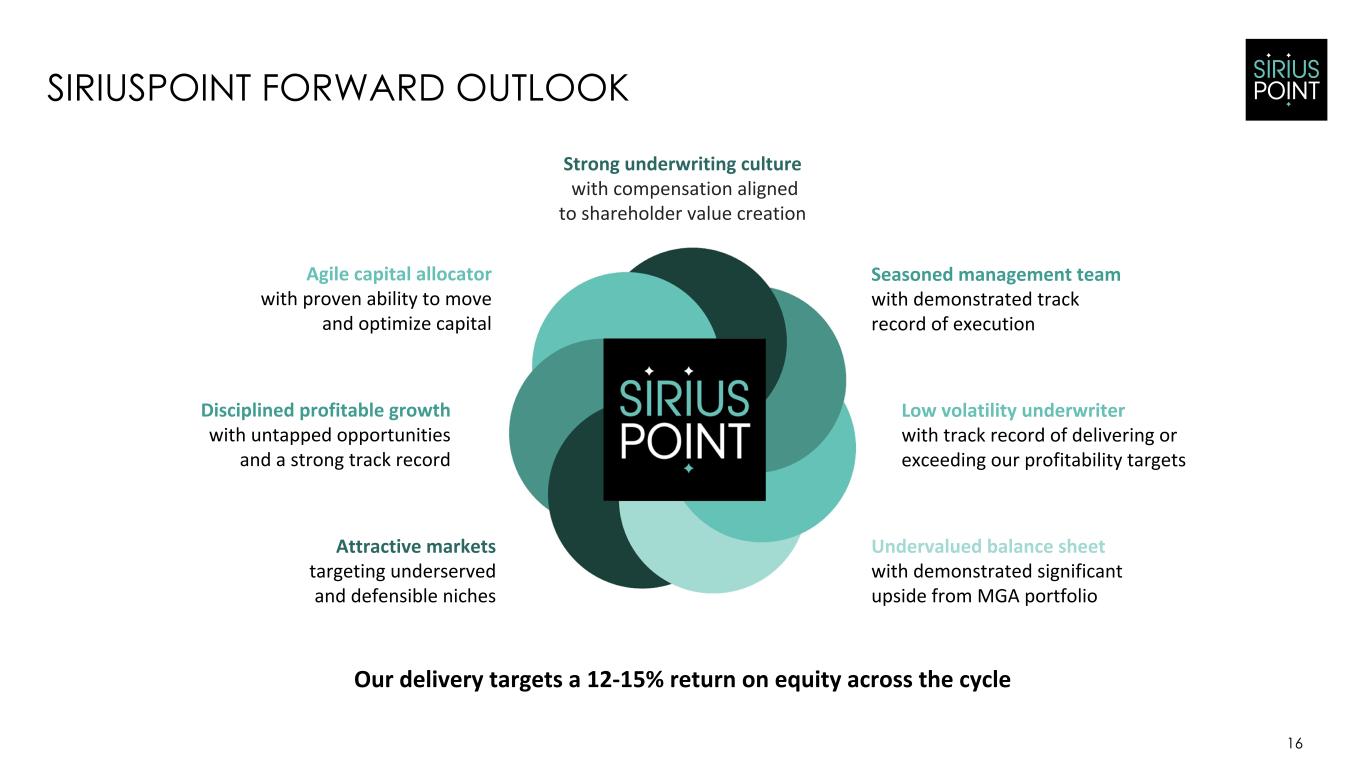
16 SIRIUSPOINT FORWARD OUTLOOK Seasoned management team with demonstrated track record of execution Low volatility underwriter with track record of delivering or exceeding our profitability targets Undervalued balance sheet with demonstrated significant upside from MGA portfolio Agile capital allocator with proven ability to move and optimize capital Disciplined profitable growth with untapped opportunities and a strong track record Attractive markets targeting underserved and defensible niches Our delivery targets a 12-15% return on equity across the cycle Strong underwriting culture with compensation aligned to shareholder value creation

Third Quarter and Nine Months Results Update
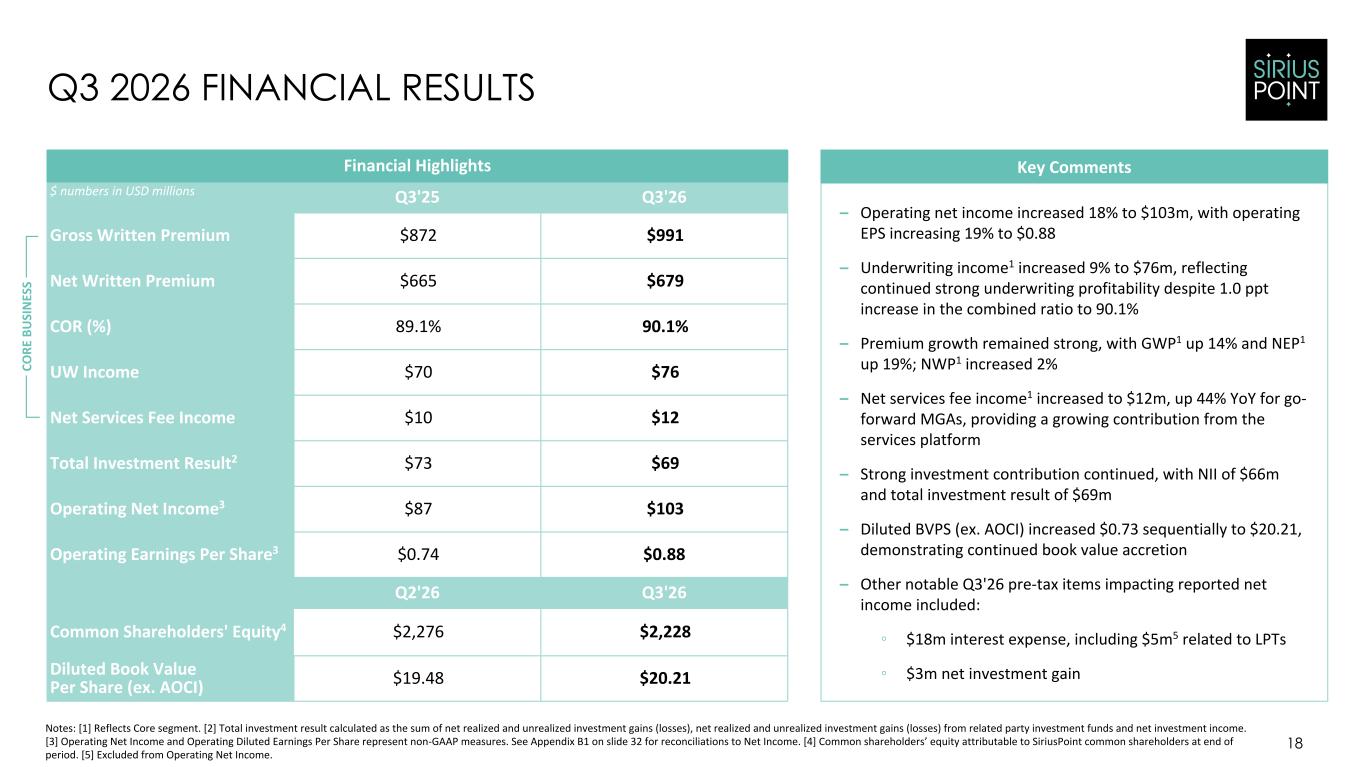
Financial Highlights $ numbers in USD millions Q3'25 Q3'26 Gross Written Premium $872 $991 Net Written Premium $665 $679 COR (%) 89.1% 90.1% UW Income $70 $76 Net Services Fee Income $10 $12 Total Investment Result2 $73 $69 Operating Net Income3 $87 $103 Operating Earnings Per Share3 $0.74 $0.88 Q2'26 Q3'26 Common Shareholders' Equity4 $2,276 $2,228 Diluted Book Value Per Share (ex. AOCI) $19.48 $20.21 Q3 2026 FINANCIAL RESULTS 18 Notes: [1] Reflects Core segment. [2] Total investment result calculated as the sum of net realized and unrealized investment gains (losses), net realized and unrealized investment gains (losses) from related party investment funds and net investment income. [3] Operating Net Income and Operating Diluted Earnings Per Share represent non-GAAP measures. See Appendix B1 on slide 32 for reconciliations to Net Income. [4] Common shareholders’ equity attributable to SiriusPoint common shareholders at end of period. [5] Excluded from Operating Net Income. Key Comments CO RE B U SI N ES S – Operating net income increased 18% to $103m, with operating EPS increasing 19% to $0.88 – Underwriting income1 increased 9% to $76m, reflecting continued strong underwriting profitability despite 1.0 ppt increase in the combined ratio to 90.1% – Premium growth remained strong, with GWP1 up 14% and NEP1 up 19%; NWP1 increased 2% – Net services fee income1 increased to $12m, up 44% YoY for go- forward MGAs, providing a growing contribution from the services platform – Strong investment contribution continued, with NII of $66m and total investment result of $69m – Diluted BVPS (ex. AOCI) increased $0.73 sequentially to $20.21, demonstrating continued book value accretion – Other notable Q3'26 pre-tax items impacting reported net income included: ◦ $18m interest expense, including $5m5 related to LPTs ◦ $3m net investment gain
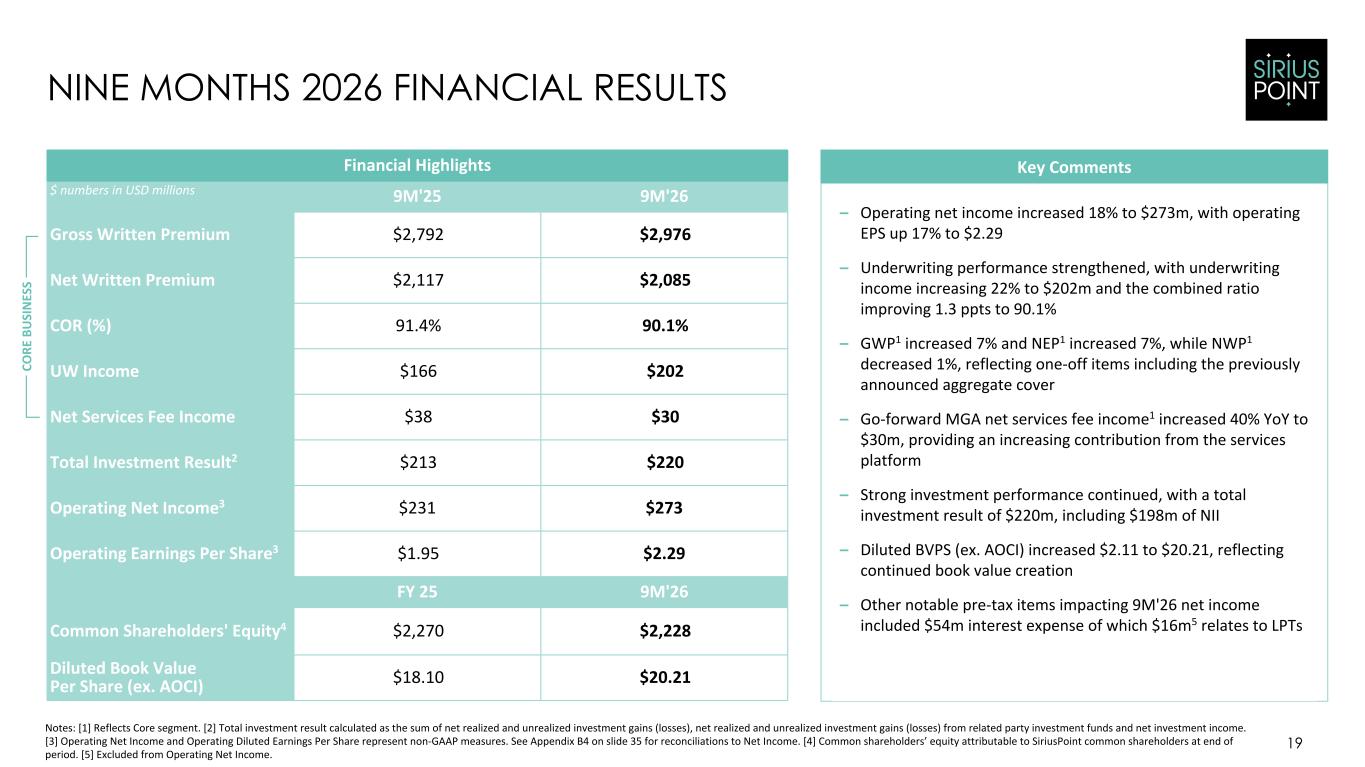
Financial Highlights $ numbers in USD millions 9M'25 9M'26 Gross Written Premium $2,792 $2,976 Net Written Premium $2,117 $2,085 COR (%) 91.4% 90.1% UW Income $166 $202 Net Services Fee Income $38 $30 Total Investment Result2 $213 $220 Operating Net Income3 $231 $273 Operating Earnings Per Share3 $1.95 $2.29 FY 25 9M'26 Common Shareholders' Equity4 $2,270 $2,228 Diluted Book Value Per Share (ex. AOCI) $18.10 $20.21 NINE MONTHS 2026 FINANCIAL RESULTS 19 Notes: [1] Reflects Core segment. [2] Total investment result calculated as the sum of net realized and unrealized investment gains (losses), net realized and unrealized investment gains (losses) from related party investment funds and net investment income. [3] Operating Net Income and Operating Diluted Earnings Per Share represent non-GAAP measures. See Appendix B4 on slide 35 for reconciliations to Net Income. [4] Common shareholders’ equity attributable to SiriusPoint common shareholders at end of period. [5] Excluded from Operating Net Income. – Operating net income increased 18% to $273m, with operating EPS up 17% to $2.29 – Underwriting performance strengthened, with underwriting income increasing 22% to $202m and the combined ratio improving 1.3 ppts to 90.1% – GWP1 increased 7% and NEP1 increased 7%, while NWP1 decreased 1%, reflecting one-off items including the previously announced aggregate cover – Go-forward MGA net services fee income1 increased 40% YoY to $30m, providing an increasing contribution from the services platform – Strong investment performance continued, with a total investment result of $220m, including $198m of NII – Diluted BVPS (ex. AOCI) increased $2.11 to $20.21, reflecting continued book value creation – Other notable pre-tax items impacting 9M'26 net income included $54m interest expense of which $16m5 relates to LPTs Key Comments CO RE B U SI N ES S
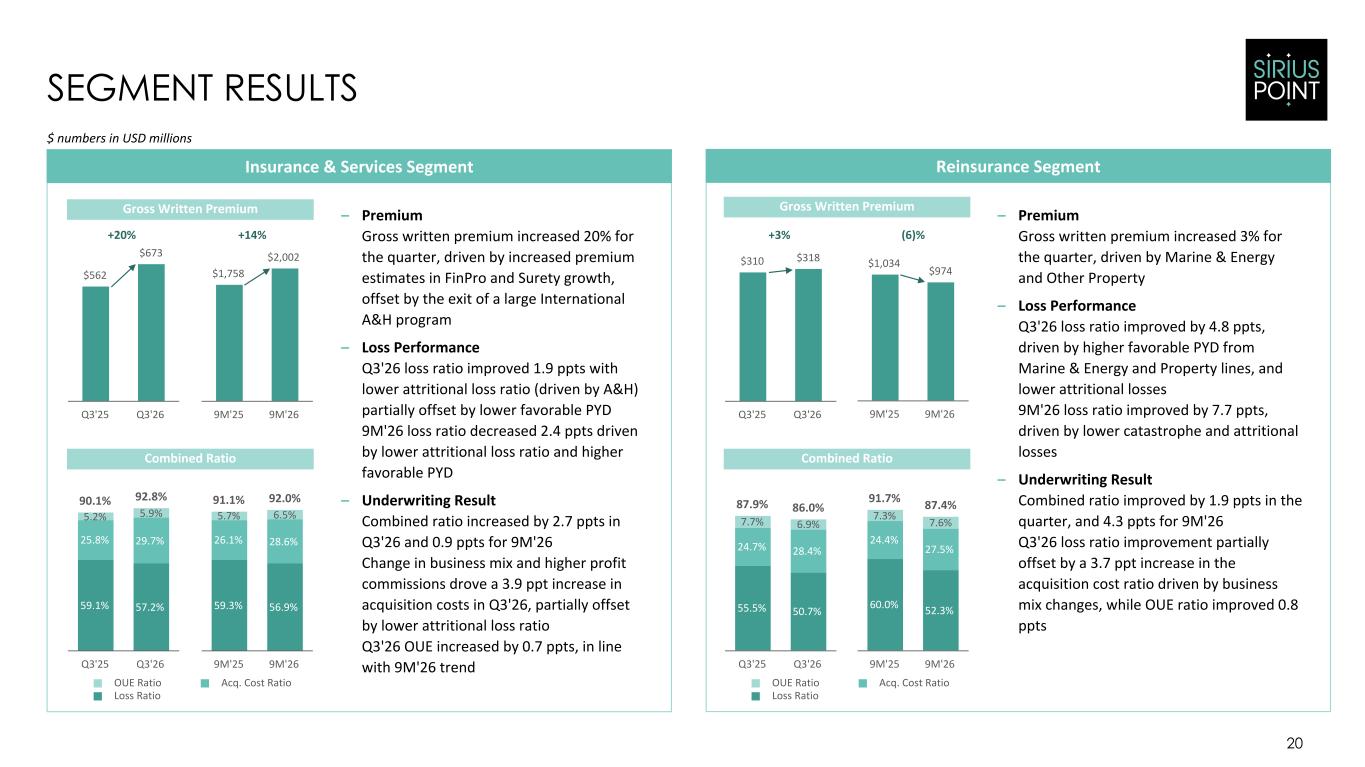
$562 $673 Q3'25 Q3'26 $1,758 $2,002 9M'25 9M'26 – Premium Gross written premium increased 20% for the quarter, driven by increased premium estimates in FinPro and Surety growth, offset by the exit of a large International A&H program – Loss Performance Q3'26 loss ratio improved 1.9 ppts with lower attritional loss ratio (driven by A&H) partially offset by lower favorable PYD 9M'26 loss ratio decreased 2.4 ppts driven by lower attritional loss ratio and higher favorable PYD – Underwriting Result Combined ratio increased by 2.7 ppts in Q3'26 and 0.9 ppts for 9M'26 Change in business mix and higher profit commissions drove a 3.9 ppt increase in acquisition costs in Q3'26, partially offset by lower attritional loss ratio Q3'26 OUE increased by 0.7 ppts, in line with 9M'26 trend 20 SEGMENT RESULTS Insurance & Services Segment Reinsurance Segment 59.1% 57.2% 25.8% 29.7% 5.2% 5.9% 90.1% 92.8% Q3'25 Q3'26 – Premium Gross written premium increased 3% for the quarter, driven by Marine & Energy and Other Property – Loss Performance Q3'26 loss ratio improved by 4.8 ppts, driven by higher favorable PYD from Marine & Energy and Property lines, and lower attritional losses 9M'26 loss ratio improved by 7.7 ppts, driven by lower catastrophe and attritional losses – Underwriting Result Combined ratio improved by 1.9 ppts in the quarter, and 4.3 ppts for 9M'26 Q3'26 loss ratio improvement partially offset by a 3.7 ppt increase in the acquisition cost ratio driven by business mix changes, while OUE ratio improved 0.8 ppts +14% $ numbers in USD millions $310 $318 Q3'25 Q3'26 55.5% 50.7% 24.7% 28.4% 7.7% 6.9% 87.9% 86.0% Q3'25 Q3'26 +3% Gross Written Premium Gross Written Premium Combined Ratio +20% $1,034 $974 9M'25 9M'26 (6)% 59.3% 56.9% 26.1% 28.6% 5.7% 6.5% 91.1% 92.0% 9M'25 9M'26 60.0% 52.3% 24.4% 27.5% 7.3% 7.6% 91.7% 87.4% 9M'25 9M'26 OUE Ratio Acq. Cost Ratio Loss Ratio OUE Ratio Acq. Cost Ratio Loss Ratio Combined Ratio
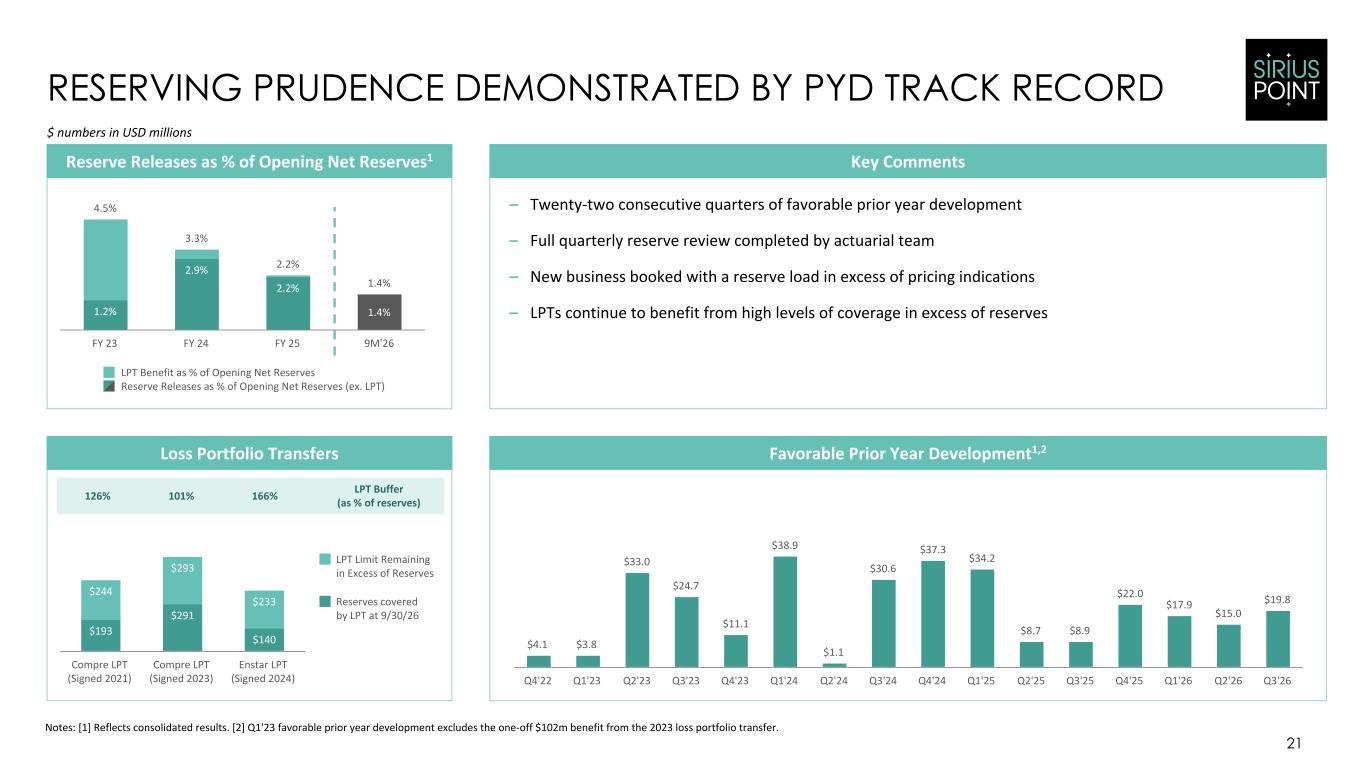
21 RESERVING PRUDENCE DEMONSTRATED BY PYD TRACK RECORD Notes: [1] Reflects consolidated results. [2] Q1'23 favorable prior year development excludes the one-off $102m benefit from the 2023 loss portfolio transfer. Favorable Prior Year Development1,2 $4.1 $3.8 $33.0 $24.7 $11.1 $38.9 $1.1 $30.6 $37.3 $34.2 $8.7 $8.9 $22.0 $17.9 $15.0 $19.8 Q4'22 Q1'23 Q2'23 Q3'23 Q4'23 Q1'24 Q2'24 Q3'24 Q4'24 Q1'25 Q2'25 Q3'25 Q4'25 Q1'26 Q2'26 Q3'26 1.2% 2.9% 2.2% 1.4% 4.5% 3.3% 2.2% 1.4% LPT Benefit as % of Opening Net Reserves Reserve Releases as % of Opening Net Reserves (ex. LPT) FY 23 FY 24 FY 25 9M'26 Reserve Releases as % of Opening Net Reserves1 $ numbers in USD millions – Twenty-two consecutive quarters of favorable prior year development – Full quarterly reserve review completed by actuarial team – New business booked with a reserve load in excess of pricing indications – LPTs continue to benefit from high levels of coverage in excess of reserves Key Comments $193 $291 $140 $244 $293 $233 LPT Limit Remaining in Excess of Reserves Reserves covered by LPT at 9/30/26 Compre LPT (Signed 2021) Compre LPT (Signed 2023) Enstar LPT (Signed 2024) Loss Portfolio Transfers LPT Buffer (as % of reserves) 126% 101% 166%
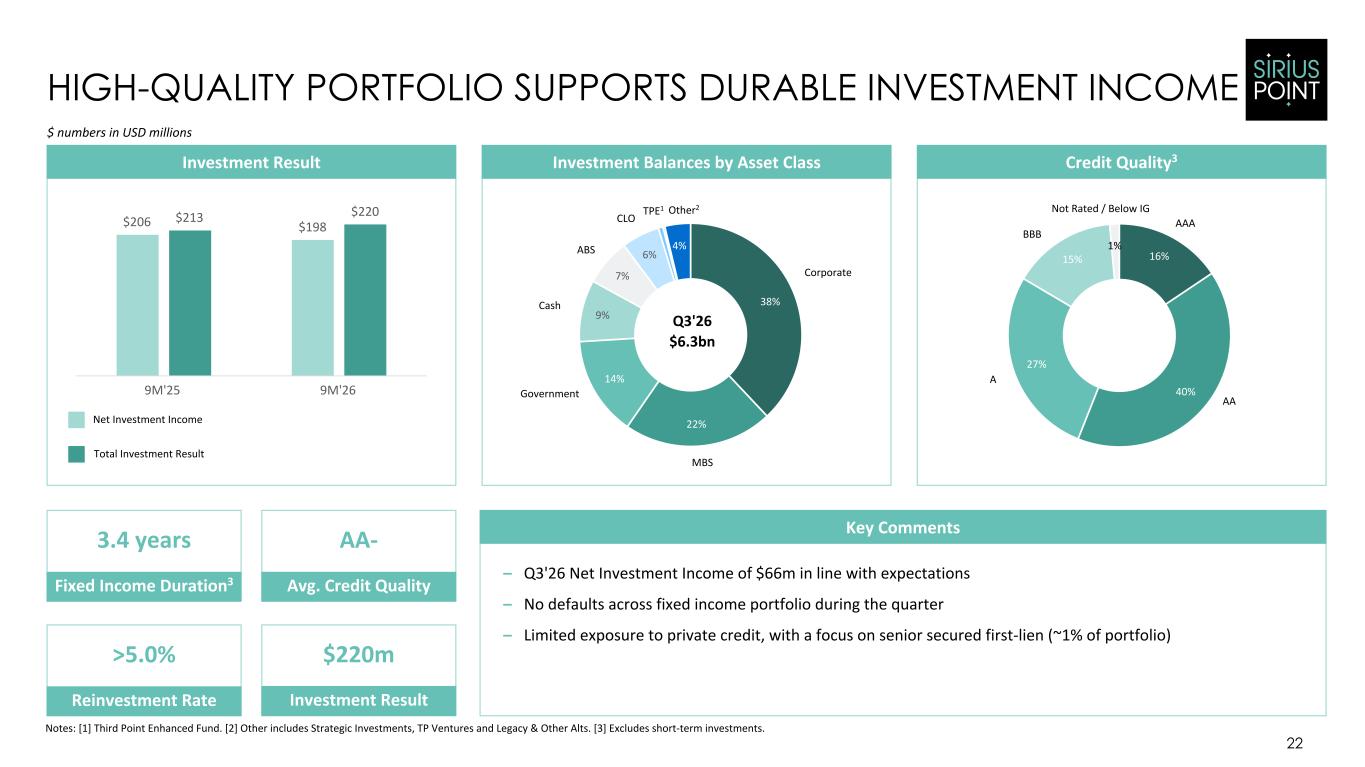
$206 $198 $213 $220 9M'25 9M'26 16% 40% 27% 15% 1% HIGH-QUALITY PORTFOLIO SUPPORTS DURABLE INVESTMENT INCOME 22 $ numbers in USD millions Key Comments Notes: [1] Third Point Enhanced Fund. [2] Other includes Strategic Investments, TP Ventures and Legacy & Other Alts. [3] Excludes short-term investments. Investment Result – Q3'26 Net Investment Income of $66m in line with expectations – No defaults across fixed income portfolio during the quarter – Limited exposure to private credit, with a focus on senior secured first-lien (~1% of portfolio) Credit Quality3Investment Balances by Asset Class 38% 22% 14% 9% 7% 6% 4% AAA AA A BBB Not Rated / Below IG STI Corporate Other2 Fixed Income Duration3 Avg. Credit Quality 3.4 years AA- Reinvestment Rate >5.0% Investment Result $220m MBS Government Cash ABS CLO TPE1 Q3'26 $6.3bn Net Investment Income Total Investment Result
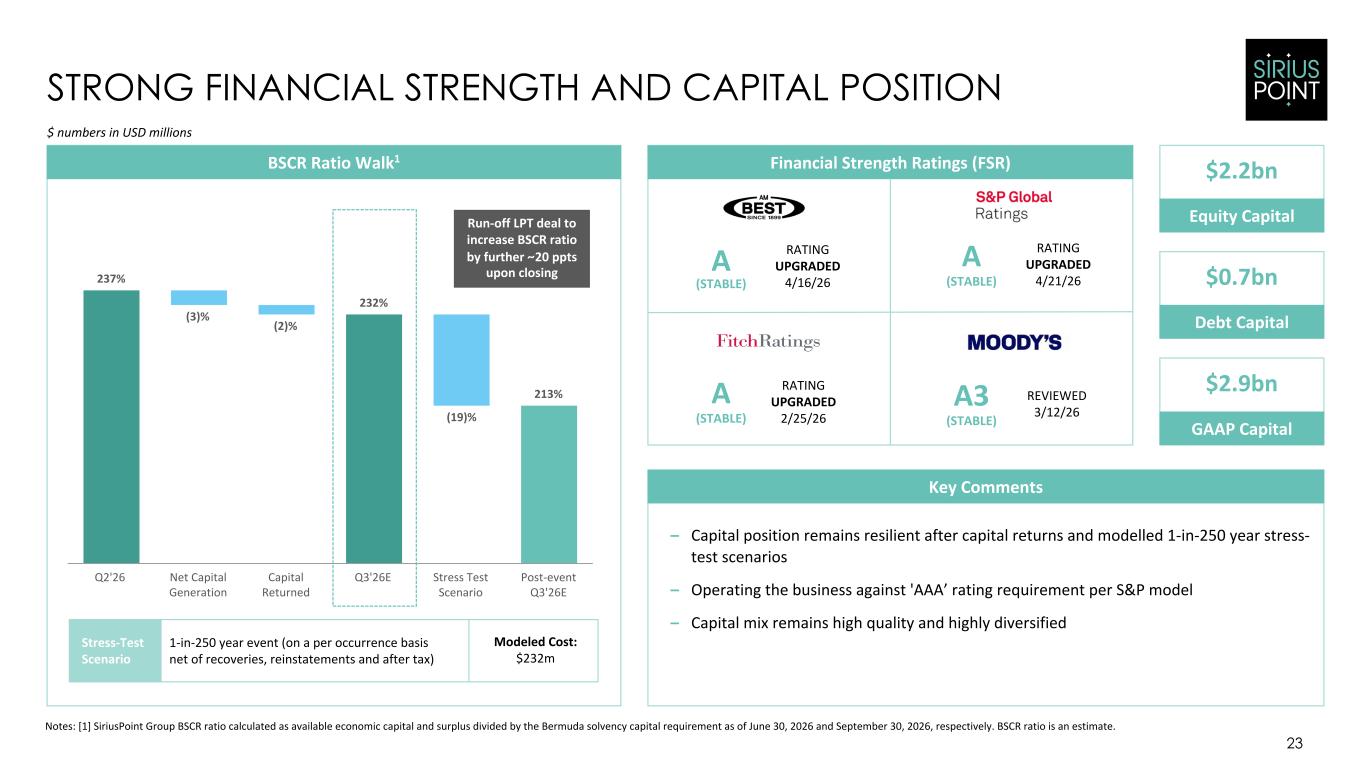
237% (3)% (2)% 232% (19)% 213% Q2'26 Net Capital Generation Capital Returned Q3'26E Stress Test Scenario Post-event Q3'26E 23 STRONG FINANCIAL STRENGTH AND CAPITAL POSITION – Capital position remains resilient after capital returns and modelled 1-in-250 year stress- test scenarios – Operating the business against 'AAA’ rating requirement per S&P model – Capital mix remains high quality and highly diversified BSCR Ratio Walk1 $ numbers in USD millions Stress-Test Scenario 1-in-250 year event (on a per occurrence basis net of recoveries, reinstatements and after tax) Modeled Cost: $232m Financial Strength Ratings (FSR) Key Comments Equity Capital GAAP Capital Debt Capital $2.2bn $0.7bn $2.9bn RATING UPGRADED 4/16/26 REVIEWED 3/12/26 RATING UPGRADED 2/25/26 RATING UPGRADED 4/21/26 A A3 A A (STABLE) (STABLE)(STABLE) (STABLE) Run-off LPT deal to increase BSCR ratio by further ~20 ppts upon closing Notes: [1] SiriusPoint Group BSCR ratio calculated as available economic capital and surplus divided by the Bermuda solvency capital requirement as of June 30, 2026 and September 30, 2026, respectively. BSCR ratio is an estimate.
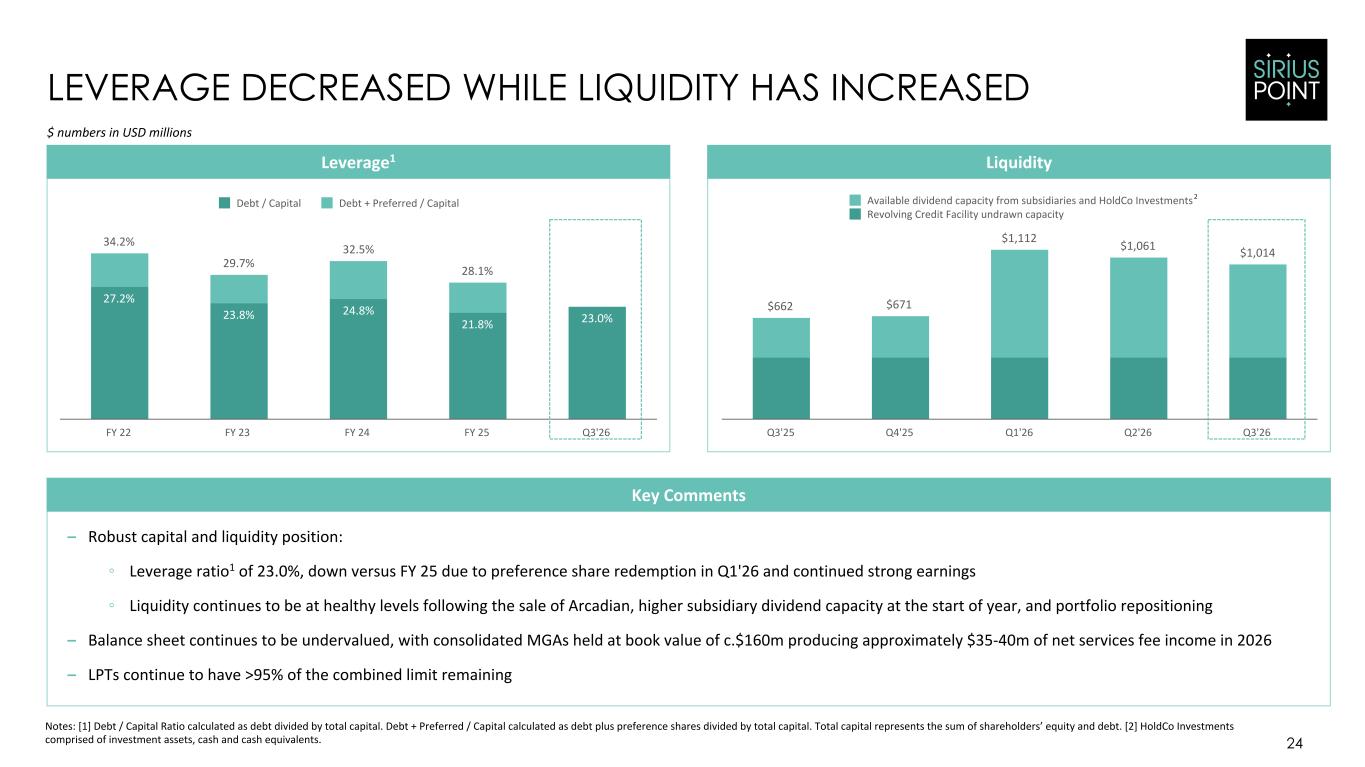
$662 $671 $1,112 $1,061 $1,014 Available dividend capacity from subsidiaries and HoldCo Investments Revolving Credit Facility undrawn capacity Q3'25 Q4'25 Q1'26 Q2'26 Q3'26 24 LEVERAGE DECREASED WHILE LIQUIDITY HAS INCREASED Leverage1 Liquidity $ numbers in USD millions Key Comments 2 27.2% 23.8% 24.8% 21.8% 23.0% 34.2% 29.7% 32.5% 28.1% Debt / Capital Debt + Preferred / Capital FY 22 FY 23 FY 24 FY 25 Q3'26 – Robust capital and liquidity position: ◦ Leverage ratio1 of 23.0%, down versus FY 25 due to preference share redemption in Q1'26 and continued strong earnings ◦ Liquidity continues to be at healthy levels following the sale of Arcadian, higher subsidiary dividend capacity at the start of year, and portfolio repositioning – Balance sheet continues to be undervalued, with consolidated MGAs held at book value of c.$160m producing approximately $35-40m of net services fee income in 2026 – LPTs continue to have >95% of the combined limit remaining Notes: [1] Debt / Capital Ratio calculated as debt divided by total capital. Debt + Preferred / Capital calculated as debt plus preference shares divided by total capital. Total capital represents the sum of shareholders’ equity and debt. [2] HoldCo Investments comprised of investment assets, cash and cash equivalents.

Appendix A: Supplementary Slides
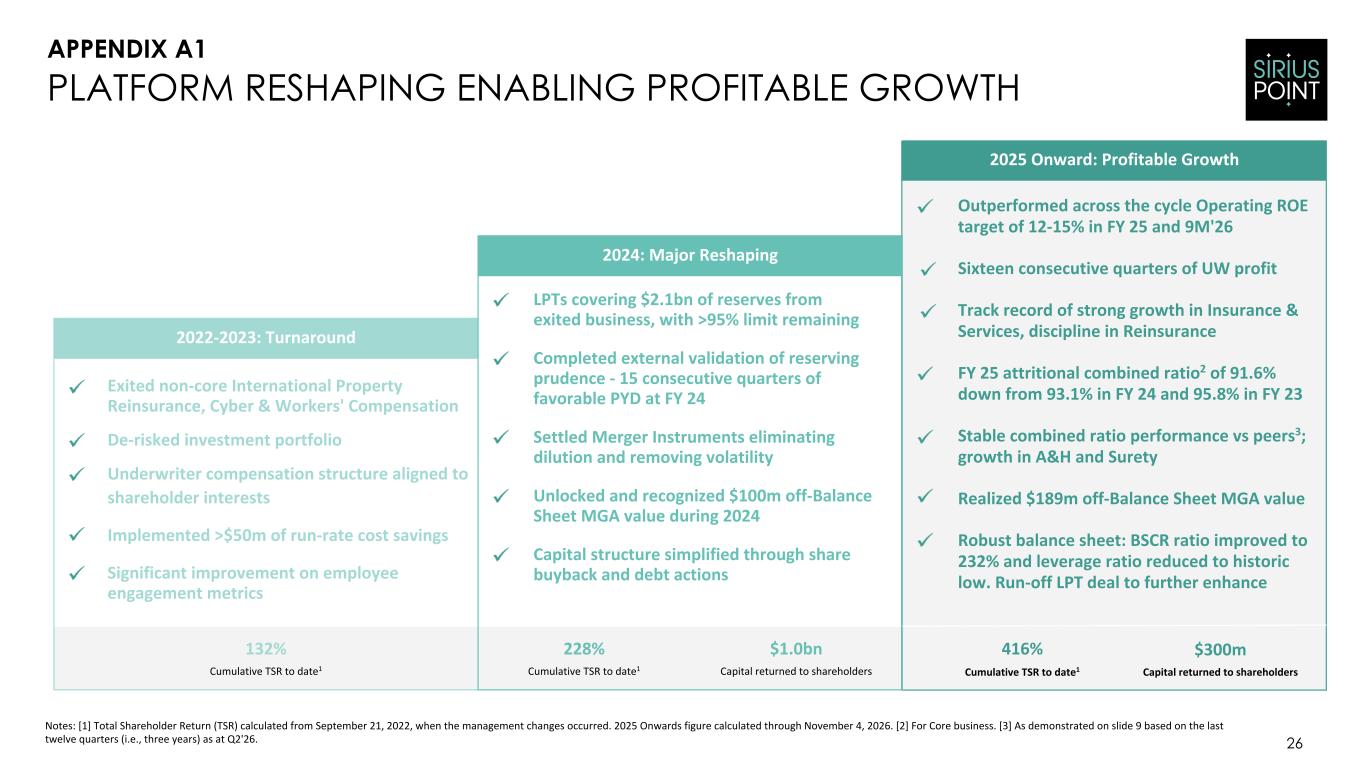
2022-2023: Turnaround 2024: Major Reshaping 26 Notes: [1] Total Shareholder Return (TSR) calculated from September 21, 2022, when the management changes occurred. 2025 Onwards figure calculated through November 4, 2026. [2] For Core business. [3] As demonstrated on slide 9 based on the last twelve quarters (i.e., three years) as at Q2'26. PLATFORM RESHAPING ENABLING PROFITABLE GROWTH 132% Cumulative TSR to date1 228% Cumulative TSR to date1 Exited non-core International Property Reinsurance, Cyber & Workers' Compensation De-risked investment portfolio Underwriter compensation structure aligned to shareholder interests Implemented >$50m of run-rate cost savings Significant improvement on employee engagement metrics LPTs covering $2.1bn of reserves from exited business, with >95% limit remaining Completed external validation of reserving prudence - 15 consecutive quarters of favorable PYD at FY 24 Settled Merger Instruments eliminating dilution and removing volatility Unlocked and recognized $100m off-Balance Sheet MGA value during 2024 Capital structure simplified through share buyback and debt actions 416% Cumulative TSR to date1 $1.0bn Capital returned to shareholders Outperformed across the cycle Operating ROE target of 12-15% in FY 25 and 9M'26 Sixteen consecutive quarters of UW profit Track record of strong growth in Insurance & Services, discipline in Reinsurance FY 25 attritional combined ratio2 of 91.6% down from 93.1% in FY 24 and 95.8% in FY 23 Stable combined ratio performance vs peers3; growth in A&H and Surety Realized $189m off-Balance Sheet MGA value Robust balance sheet: BSCR ratio improved to 232% and leverage ratio reduced to historic low. Run-off LPT deal to further enhance 2025 Onward: Profitable Growth APPENDIX A1 $300m Capital returned to shareholders
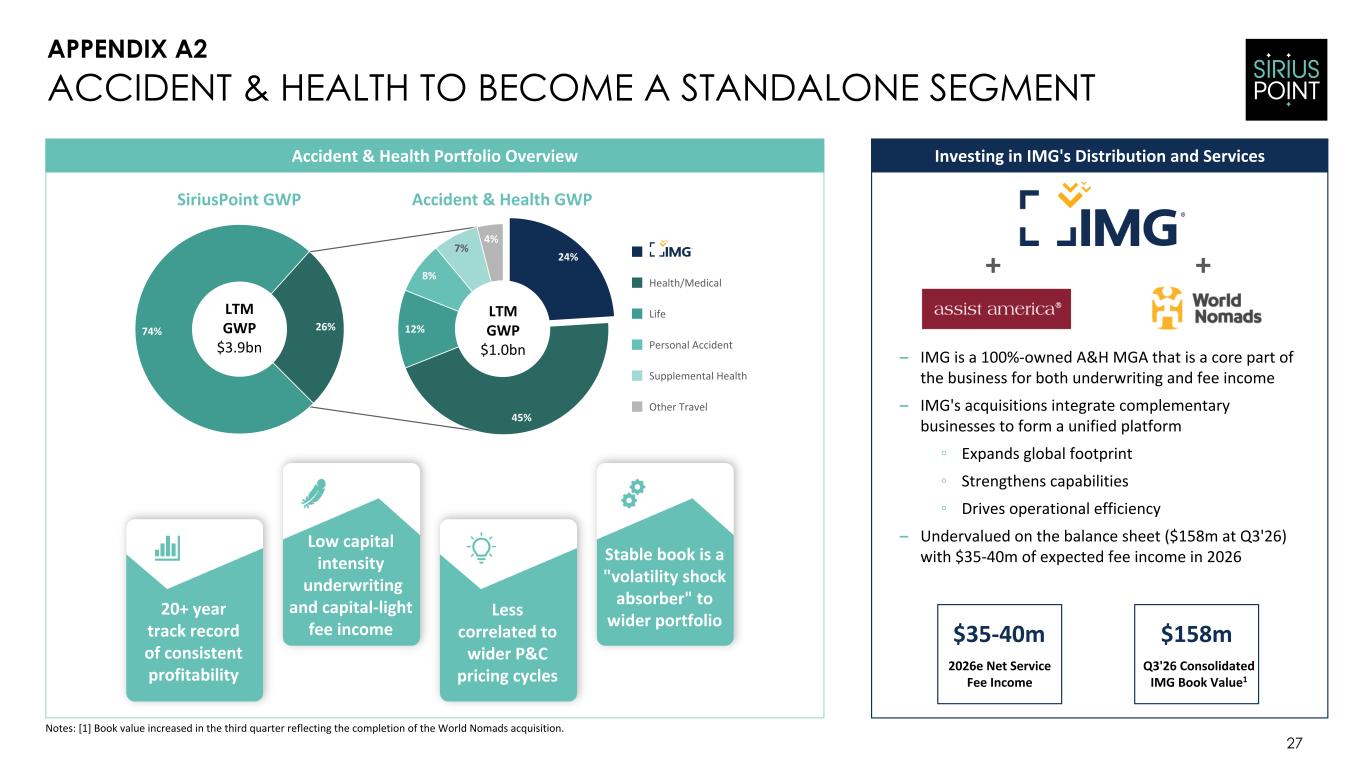
24% 45% 12% 8% 7% 4% IMG Health/Medical Life Personal Accident Supplemental Health Other Travel 27 ACCIDENT & HEALTH TO BECOME A STANDALONE SEGMENT Investing in IMG's Distribution and ServicesAccident & Health Portfolio Overview – IMG is a 100%-owned A&H MGA that is a core part of the business for both underwriting and fee income – IMG's acquisitions integrate complementary businesses to form a unified platform ◦ Expands global footprint ◦ Strengthens capabilities ◦ Drives operational efficiency – Undervalued on the balance sheet ($158m at Q3'26) with $35-40m of expected fee income in 2026 SiriusPoint GWP Accident & Health GWP LTM GWP $1.0bn 20+ year track record of consistent profitability Stable book is a "volatility shock absorber" to wider portfolio Less correlated to wider P&C pricing cycles Low capital intensity underwriting and capital-light fee income + + 2026e Net Service Fee Income $35-40m Q3'26 Consolidated IMG Book Value1 $158m APPENDIX A2 26%74% LTM GWP $3.9bn Notes: [1] Book value increased in the third quarter reflecting the completion of the World Nomads acquisition.
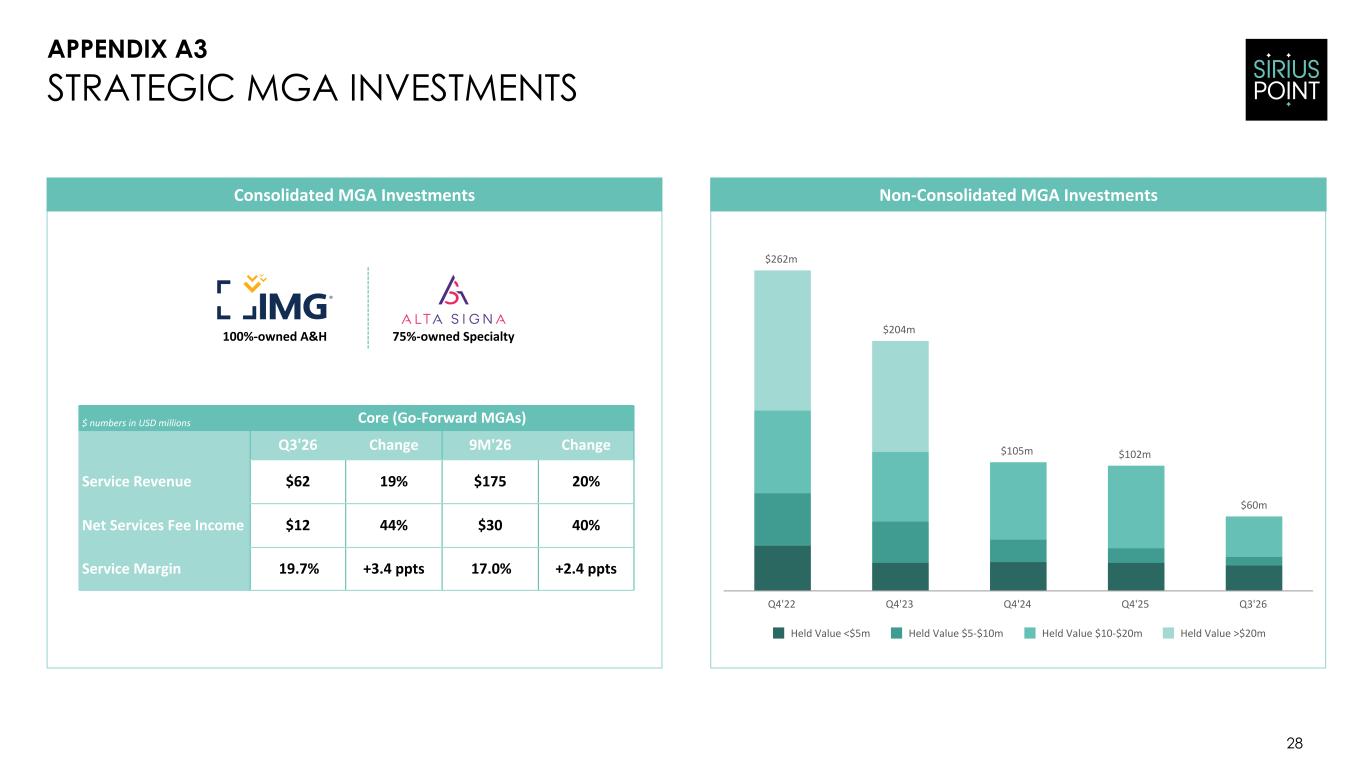
$262m $204m $105m $102m $60m Held Value <$5m Held Value $5-$10m Held Value $10-$20m Held Value >$20m Q4'22 Q4'23 Q4'24 Q4'25 Q3'26 28 STRATEGIC MGA INVESTMENTS Non-Consolidated MGA Investments $ numbers in USD millions Core (Go-Forward MGAs) Q3'26 Change 9M'26 Change Service Revenue $62 19% $175 20% Net Services Fee Income $12 44% $30 40% Service Margin 19.7% +3.4 ppts 17.0% +2.4 ppts APPENDIX A3 Consolidated MGA Investments 100%-owned A&H 75%-owned Specialty
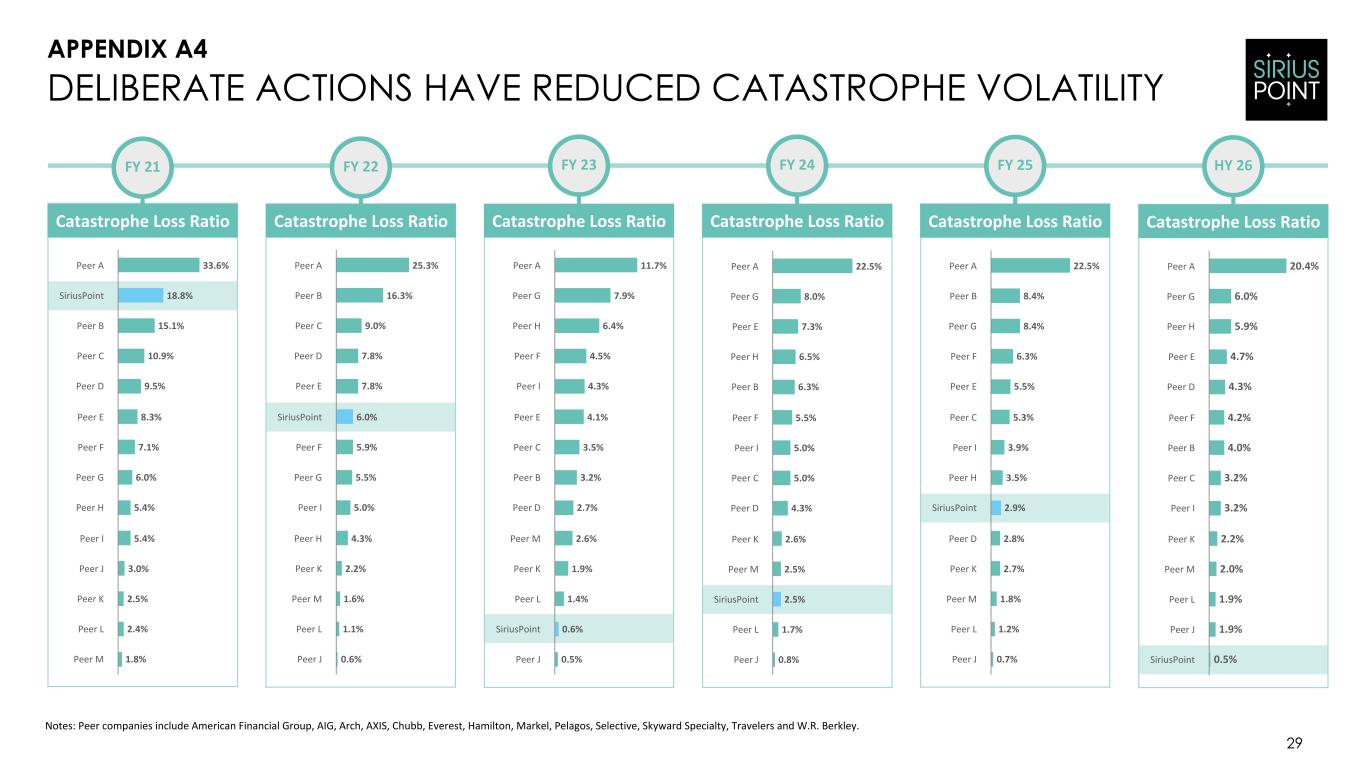
11.7% 7.9% 6.4% 4.5% 4.3% 4.1% 3.5% 3.2% 2.7% 2.6% 1.9% 1.4% 0.6% 0.5% Peer A Peer G Peer H Peer F Peer I Peer E Peer C Peer B Peer D Peer M Peer K Peer L SiriusPoint Peer J 22.5% 8.4% 8.4% 6.3% 5.5% 5.3% 3.9% 3.5% 2.9% 2.8% 2.7% 1.8% 1.2% 0.7% Peer A Peer B Peer G Peer F Peer E Peer C Peer I Peer H SiriusPoint Peer D Peer K Peer M Peer L Peer J 22.5% 8.0% 7.3% 6.5% 6.3% 5.5% 5.0% 5.0% 4.3% 2.6% 2.5% 2.5% 1.7% 0.8% Peer A Peer G Peer E Peer H Peer B Peer F Peer I Peer C Peer D Peer K Peer M SiriusPoint Peer L Peer J 25.3% 16.3% 9.0% 7.8% 7.8% 6.0% 5.9% 5.5% 5.0% 4.3% 2.2% 1.6% 1.1% 0.6% Peer A Peer B Peer C Peer D Peer E SiriusPoint Peer F Peer G Peer I Peer H Peer K Peer M Peer L Peer J 29 DELIBERATE ACTIONS HAVE REDUCED CATASTROPHE VOLATILITY FY 21 Catastrophe Loss Ratio FY 23 Catastrophe Loss Ratio FY 24 Notes: Peer companies include American Financial Group, AIG, Arch, AXIS, Chubb, Everest, Hamilton, Markel, Pelagos, Selective, Skyward Specialty, Travelers and W.R. Berkley. 33.6% 18.8% 15.1% 10.9% 9.5% 8.3% 7.1% 6.0% 5.4% 5.4% 3.0% 2.5% 2.4% 1.8% Peer A SiriusPoint Peer B Peer C Peer D Peer E Peer F Peer G Peer H Peer I Peer J Peer K Peer L Peer M FY 25 Catastrophe Loss RatioCatastrophe Loss Ratio FY 22 Catastrophe Loss Ratio 20.4% 6.0% 5.9% 4.7% 4.3% 4.2% 4.0% 3.2% 3.2% 2.2% 2.0% 1.9% 1.9% 0.5% Peer A Peer G Peer H Peer E Peer D Peer F Peer B Peer C Peer I Peer K Peer M Peer L Peer J SiriusPoint HY 26 Catastrophe Loss Ratio APPENDIX A4
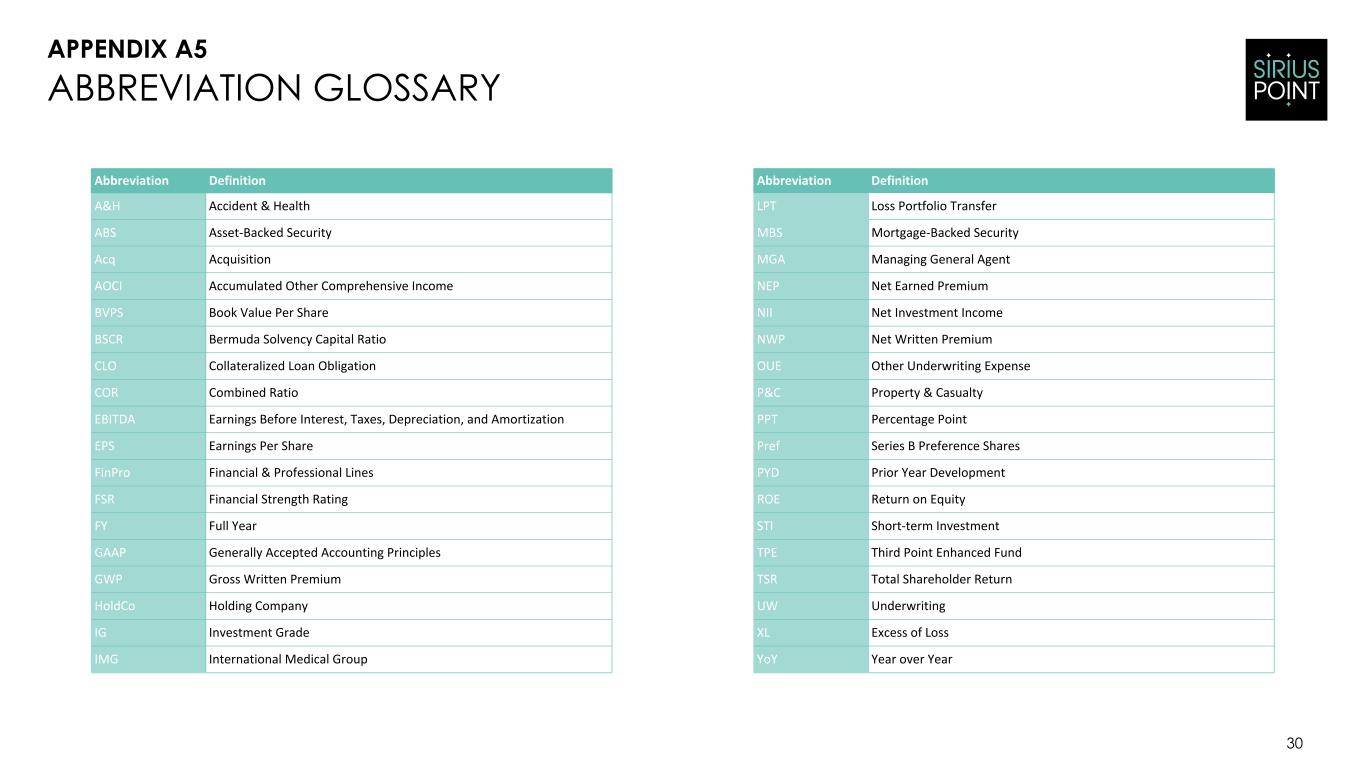
30 ABBREVIATION GLOSSARY APPENDIX A5 Abbreviation Definition Abbreviation Definition A&H Accident & Health LPT Loss Portfolio Transfer ABS Asset-Backed Security MBS Mortgage-Backed Security Acq Acquisition MGA Managing General Agent AOCI Accumulated Other Comprehensive Income NEP Net Earned Premium BVPS Book Value Per Share NII Net Investment Income BSCR Bermuda Solvency Capital Ratio NWP Net Written Premium CLO Collateralized Loan Obligation OUE Other Underwriting Expense COR Combined Ratio P&C Property & Casualty EBITDA Earnings Before Interest, Taxes, Depreciation, and Amortization PPT Percentage Point EPS Earnings Per Share Pref Series B Preference Shares FinPro Financial & Professional Lines PYD Prior Year Development FSR Financial Strength Rating ROE Return on Equity FY Full Year STI Short-term Investment GAAP Generally Accepted Accounting Principles TPE Third Point Enhanced Fund GWP Gross Written Premium TSR Total Shareholder Return HoldCo Holding Company UW Underwriting IG Investment Grade XL Excess of Loss IMG International Medical Group YoY Year over Year

Appendix B: Non-GAAP Reconciliations
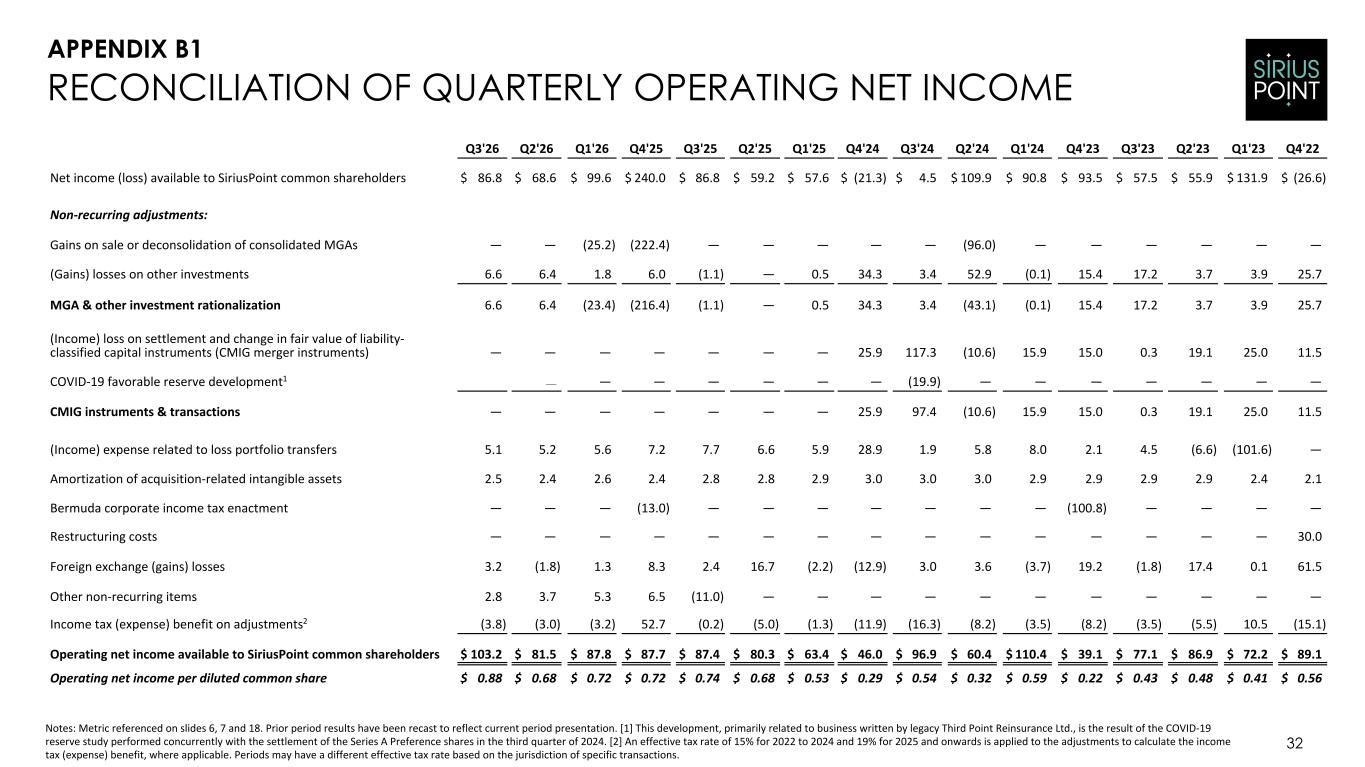
32 RECONCILIATION OF QUARTERLY OPERATING NET INCOME Q3'26 Q2'26 Q1'26 Q4'25 Q3'25 Q2'25 Q1'25 Q4'24 Q3'24 Q2'24 Q1'24 Q4'23 Q3'23 Q2'23 Q1'23 Q4'22 Net income (loss) available to SiriusPoint common shareholders $ 86.8 $ 68.6 $ 99.6 $ 240.0 $ 86.8 $ 59.2 $ 57.6 $ (21.3) $ 4.5 $ 109.9 $ 90.8 $ 93.5 $ 57.5 $ 55.9 $ 131.9 $ (26.6) Non-recurring adjustments: Gains on sale or deconsolidation of consolidated MGAs — — (25.2) (222.4) — — — — — (96.0) — — — — — — (Gains) losses on other investments 6.6 6.4 1.8 6.0 (1.1) — 0.5 34.3 3.4 52.9 (0.1) 15.4 17.2 3.7 3.9 25.7 MGA & other investment rationalization 6.6 6.4 (23.4) (216.4) (1.1) — 0.5 34.3 3.4 (43.1) (0.1) 15.4 17.2 3.7 3.9 25.7 (Income) loss on settlement and change in fair value of liability- classified capital instruments (CMIG merger instruments) — — — — — — — 25.9 117.3 (10.6) 15.9 15.0 0.3 19.1 25.0 11.5 COVID-19 favorable reserve development1 — — — — — — — (19.9) — — — — — — — CMIG instruments & transactions — — — — — — — 25.9 97.4 (10.6) 15.9 15.0 0.3 19.1 25.0 11.5 (Income) expense related to loss portfolio transfers 5.1 5.2 5.6 7.2 7.7 6.6 5.9 28.9 1.9 5.8 8.0 2.1 4.5 (6.6) (101.6) — Amortization of acquisition-related intangible assets 2.5 2.4 2.6 2.4 2.8 2.8 2.9 3.0 3.0 3.0 2.9 2.9 2.9 2.9 2.4 2.1 Bermuda corporate income tax enactment — — — (13.0) — — — — — — — (100.8) — — — — Restructuring costs — — — — — — — — — — — — — — — 30.0 Foreign exchange (gains) losses 3.2 (1.8) 1.3 8.3 2.4 16.7 (2.2) (12.9) 3.0 3.6 (3.7) 19.2 (1.8) 17.4 0.1 61.5 Other non-recurring items 2.8 3.7 5.3 6.5 (11.0) — — — — — — — — — — — Income tax (expense) benefit on adjustments2 (3.8) (3.0) (3.2) 52.7 (0.2) (5.0) (1.3) (11.9) (16.3) (8.2) (3.5) (8.2) (3.5) (5.5) 10.5 (15.1) Operating net income available to SiriusPoint common shareholders $ 103.2 $ 81.5 $ 87.8 $ 87.7 $ 87.4 $ 80.3 $ 63.4 $ 46.0 $ 96.9 $ 60.4 $ 110.4 $ 39.1 $ 77.1 $ 86.9 $ 72.2 $ 89.1 Operating net income per diluted common share $ 0.88 $ 0.68 $ 0.72 $ 0.72 $ 0.74 $ 0.68 $ 0.53 $ 0.29 $ 0.54 $ 0.32 $ 0.59 $ 0.22 $ 0.43 $ 0.48 $ 0.41 $ 0.56 Notes: Metric referenced on slides 6, 7 and 18. Prior period results have been recast to reflect current period presentation. [1] This development, primarily related to business written by legacy Third Point Reinsurance Ltd., is the result of the COVID-19 reserve study performed concurrently with the settlement of the Series A Preference shares in the third quarter of 2024. [2] An effective tax rate of 15% for 2022 to 2024 and 19% for 2025 and onwards is applied to the adjustments to calculate the income tax (expense) benefit, where applicable. Periods may have a different effective tax rate based on the jurisdiction of specific transactions. APPENDIX B1
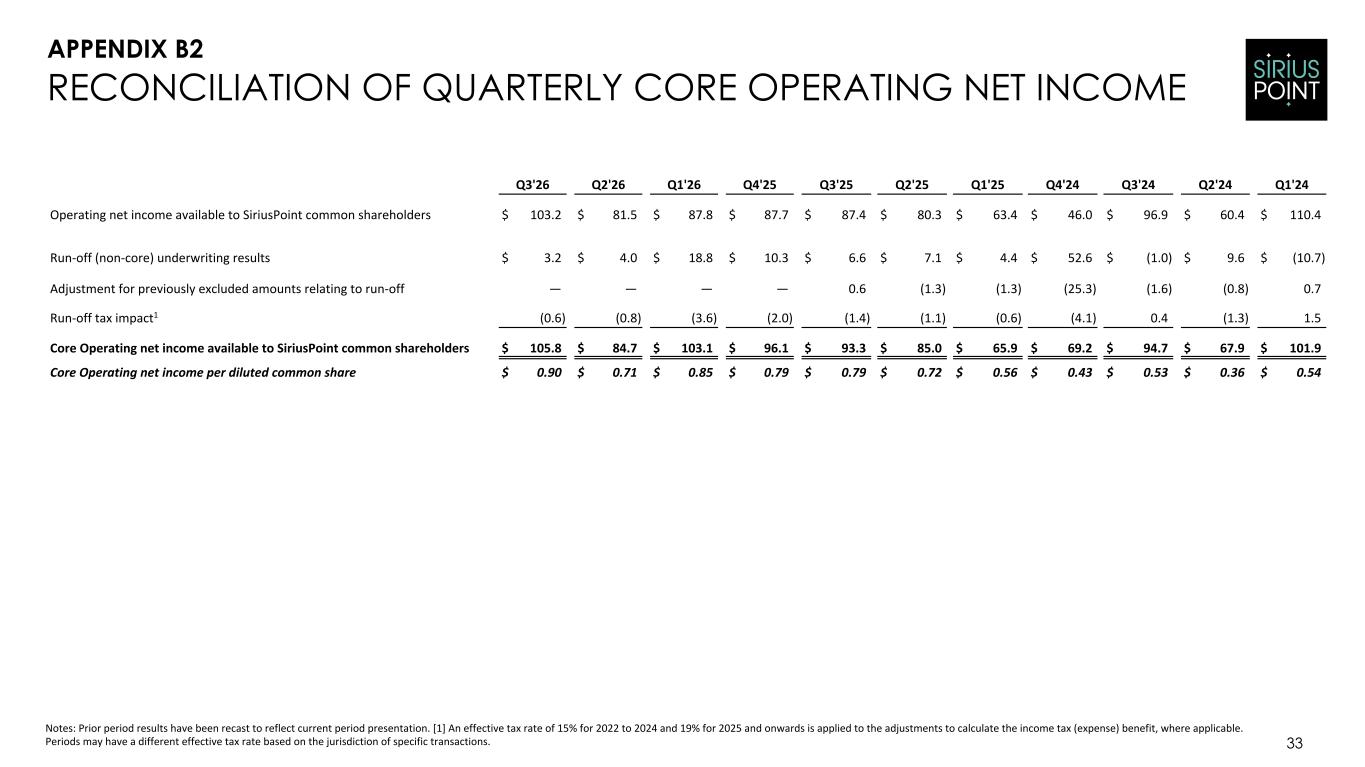
33 RECONCILIATION OF QUARTERLY CORE OPERATING NET INCOME Q3'26 Q2'26 Q1'26 Q4'25 Q3'25 Q2'25 Q1'25 Q4'24 Q3'24 Q2'24 Q1'24 Operating net income available to SiriusPoint common shareholders $ 103.2 $ 81.5 $ 87.8 $ 87.7 $ 87.4 $ 80.3 $ 63.4 $ 46.0 $ 96.9 $ 60.4 $ 110.4 Run-off (non-core) underwriting results $ 3.2 $ 4.0 $ 18.8 $ 10.3 $ 6.6 $ 7.1 $ 4.4 $ 52.6 $ (1.0) $ 9.6 $ (10.7) Adjustment for previously excluded amounts relating to run-off — — — — 0.6 (1.3) (1.3) (25.3) (1.6) (0.8) 0.7 Run-off tax impact1 (0.6) (0.8) (3.6) (2.0) (1.4) (1.1) (0.6) (4.1) 0.4 (1.3) 1.5 Core Operating net income available to SiriusPoint common shareholders $ 105.8 $ 84.7 $ 103.1 $ 96.1 $ 93.3 $ 85.0 $ 65.9 $ 69.2 $ 94.7 $ 67.9 $ 101.9 Core Operating net income per diluted common share $ 0.90 $ 0.71 $ 0.85 $ 0.79 $ 0.79 $ 0.72 $ 0.56 $ 0.43 $ 0.53 $ 0.36 $ 0.54 Notes: Prior period results have been recast to reflect current period presentation. [1] An effective tax rate of 15% for 2022 to 2024 and 19% for 2025 and onwards is applied to the adjustments to calculate the income tax (expense) benefit, where applicable. Periods may have a different effective tax rate based on the jurisdiction of specific transactions. APPENDIX B2
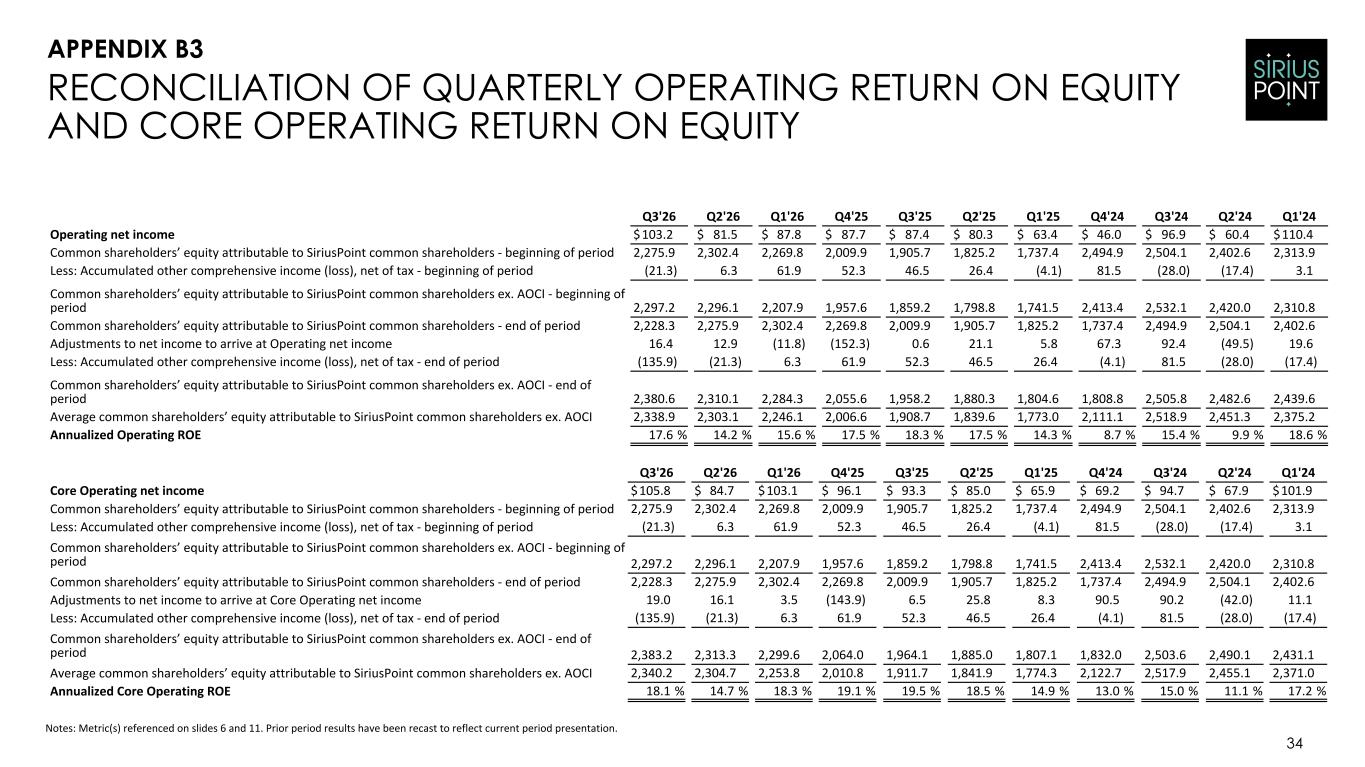
34 RECONCILIATION OF QUARTERLY OPERATING RETURN ON EQUITY AND CORE OPERATING RETURN ON EQUITY Notes: Metric(s) referenced on slides 6 and 11. Prior period results have been recast to reflect current period presentation. APPENDIX B3 Q3'26 Q2'26 Q1'26 Q4'25 Q3'25 Q2'25 Q1'25 Q4'24 Q3'24 Q2'24 Q1'24 Operating net income $ 103.2 $ 81.5 $ 87.8 $ 87.7 $ 87.4 $ 80.3 $ 63.4 $ 46.0 $ 96.9 $ 60.4 $ 110.4 Common shareholders’ equity attributable to SiriusPoint common shareholders - beginning of period 2,275.9 2,302.4 2,269.8 2,009.9 1,905.7 1,825.2 1,737.4 2,494.9 2,504.1 2,402.6 2,313.9 Less: Accumulated other comprehensive income (loss), net of tax - beginning of period (21.3) 6.3 61.9 52.3 46.5 26.4 (4.1) 81.5 (28.0) (17.4) 3.1 Common shareholders’ equity attributable to SiriusPoint common shareholders ex. AOCI - beginning of period 2,297.2 2,296.1 2,207.9 1,957.6 1,859.2 1,798.8 1,741.5 2,413.4 2,532.1 2,420.0 2,310.8 Common shareholders’ equity attributable to SiriusPoint common shareholders - end of period 2,228.3 2,275.9 2,302.4 2,269.8 2,009.9 1,905.7 1,825.2 1,737.4 2,494.9 2,504.1 2,402.6 Adjustments to net income to arrive at Operating net income 16.4 12.9 (11.8) (152.3) 0.6 21.1 5.8 67.3 92.4 (49.5) 19.6 Less: Accumulated other comprehensive income (loss), net of tax - end of period (135.9) (21.3) 6.3 61.9 52.3 46.5 26.4 (4.1) 81.5 (28.0) (17.4) Common shareholders’ equity attributable to SiriusPoint common shareholders ex. AOCI - end of period 2,380.6 2,310.1 2,284.3 2,055.6 1,958.2 1,880.3 1,804.6 1,808.8 2,505.8 2,482.6 2,439.6 Average common shareholders’ equity attributable to SiriusPoint common shareholders ex. AOCI 2,338.9 2,303.1 2,246.1 2,006.6 1,908.7 1,839.6 1,773.0 2,111.1 2,518.9 2,451.3 2,375.2 Annualized Operating ROE 17.6 % 14.2 % 15.6 % 17.5 % 18.3 % 17.5 % 14.3 % 8.7 % 15.4 % 9.9 % 18.6 % Q3'26 Q2'26 Q1'26 Q4'25 Q3'25 Q2'25 Q1'25 Q4'24 Q3'24 Q2'24 Q1'24 Core Operating net income $ 105.8 $ 84.7 $ 103.1 $ 96.1 $ 93.3 $ 85.0 $ 65.9 $ 69.2 $ 94.7 $ 67.9 $ 101.9 Common shareholders’ equity attributable to SiriusPoint common shareholders - beginning of period 2,275.9 2,302.4 2,269.8 2,009.9 1,905.7 1,825.2 1,737.4 2,494.9 2,504.1 2,402.6 2,313.9 Less: Accumulated other comprehensive income (loss), net of tax - beginning of period (21.3) 6.3 61.9 52.3 46.5 26.4 (4.1) 81.5 (28.0) (17.4) 3.1 Common shareholders’ equity attributable to SiriusPoint common shareholders ex. AOCI - beginning of period 2,297.2 2,296.1 2,207.9 1,957.6 1,859.2 1,798.8 1,741.5 2,413.4 2,532.1 2,420.0 2,310.8 Common shareholders’ equity attributable to SiriusPoint common shareholders - end of period 2,228.3 2,275.9 2,302.4 2,269.8 2,009.9 1,905.7 1,825.2 1,737.4 2,494.9 2,504.1 2,402.6 Adjustments to net income to arrive at Core Operating net income 19.0 16.1 3.5 (143.9) 6.5 25.8 8.3 90.5 90.2 (42.0) 11.1 Less: Accumulated other comprehensive income (loss), net of tax - end of period (135.9) (21.3) 6.3 61.9 52.3 46.5 26.4 (4.1) 81.5 (28.0) (17.4) Common shareholders’ equity attributable to SiriusPoint common shareholders ex. AOCI - end of period 2,383.2 2,313.3 2,299.6 2,064.0 1,964.1 1,885.0 1,807.1 1,832.0 2,503.6 2,490.1 2,431.1 Average common shareholders’ equity attributable to SiriusPoint common shareholders ex. AOCI 2,340.2 2,304.7 2,253.8 2,010.8 1,911.7 1,841.9 1,774.3 2,122.7 2,517.9 2,455.1 2,371.0 Annualized Core Operating ROE 18.1 % 14.7 % 18.3 % 19.1 % 19.5 % 18.5 % 14.9 % 13.0 % 15.0 % 11.1 % 17.2 %
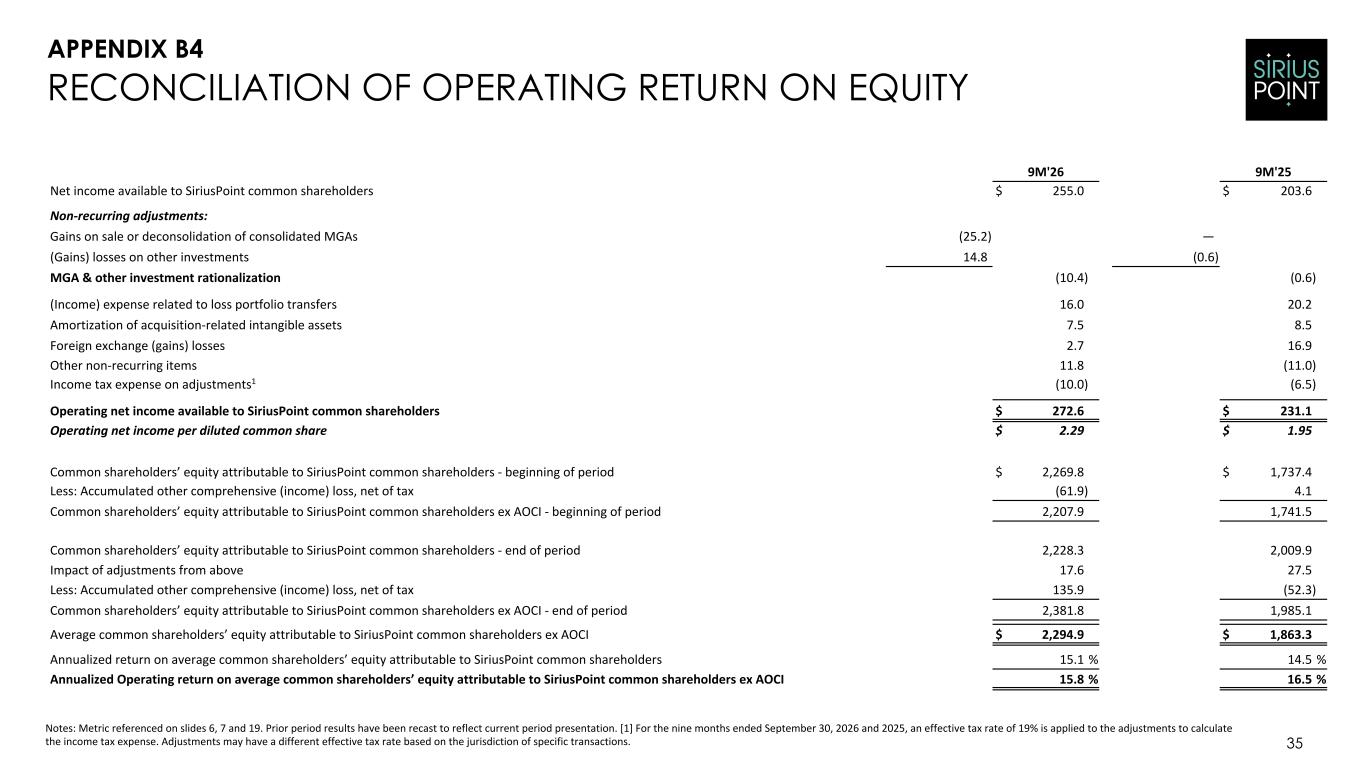
9M'26 9M'25 Net income available to SiriusPoint common shareholders $ 255.0 $ 203.6 Non-recurring adjustments: Gains on sale or deconsolidation of consolidated MGAs (25.2) — (Gains) losses on other investments 14.8 (0.6) MGA & other investment rationalization (10.4) (0.6) (Income) expense related to loss portfolio transfers 16.0 20.2 Amortization of acquisition-related intangible assets 7.5 8.5 Foreign exchange (gains) losses 2.7 16.9 Other non-recurring items 11.8 (11.0) Income tax expense on adjustments1 (10.0) (6.5) Operating net income available to SiriusPoint common shareholders $ 272.6 $ 231.1 Operating net income per diluted common share $ 2.29 $ 1.95 Common shareholders’ equity attributable to SiriusPoint common shareholders - beginning of period $ 2,269.8 $ 1,737.4 Less: Accumulated other comprehensive (income) loss, net of tax (61.9) 4.1 Common shareholders’ equity attributable to SiriusPoint common shareholders ex AOCI - beginning of period 2,207.9 1,741.5 Common shareholders’ equity attributable to SiriusPoint common shareholders - end of period 2,228.3 2,009.9 Impact of adjustments from above 17.6 27.5 Less: Accumulated other comprehensive (income) loss, net of tax 135.9 (52.3) Common shareholders’ equity attributable to SiriusPoint common shareholders ex AOCI - end of period 2,381.8 1,985.1 Average common shareholders’ equity attributable to SiriusPoint common shareholders ex AOCI $ 2,294.9 $ 1,863.3 Annualized return on average common shareholders’ equity attributable to SiriusPoint common shareholders 15.1 % 14.5 % Annualized Operating return on average common shareholders’ equity attributable to SiriusPoint common shareholders ex AOCI 15.8 % 16.5 % 35 RECONCILIATION OF OPERATING RETURN ON EQUITY Notes: Metric referenced on slides 6, 7 and 19. Prior period results have been recast to reflect current period presentation. [1] For the nine months ended September 30, 2026 and 2025, an effective tax rate of 19% is applied to the adjustments to calculate the income tax expense. Adjustments may have a different effective tax rate based on the jurisdiction of specific transactions. APPENDIX B4
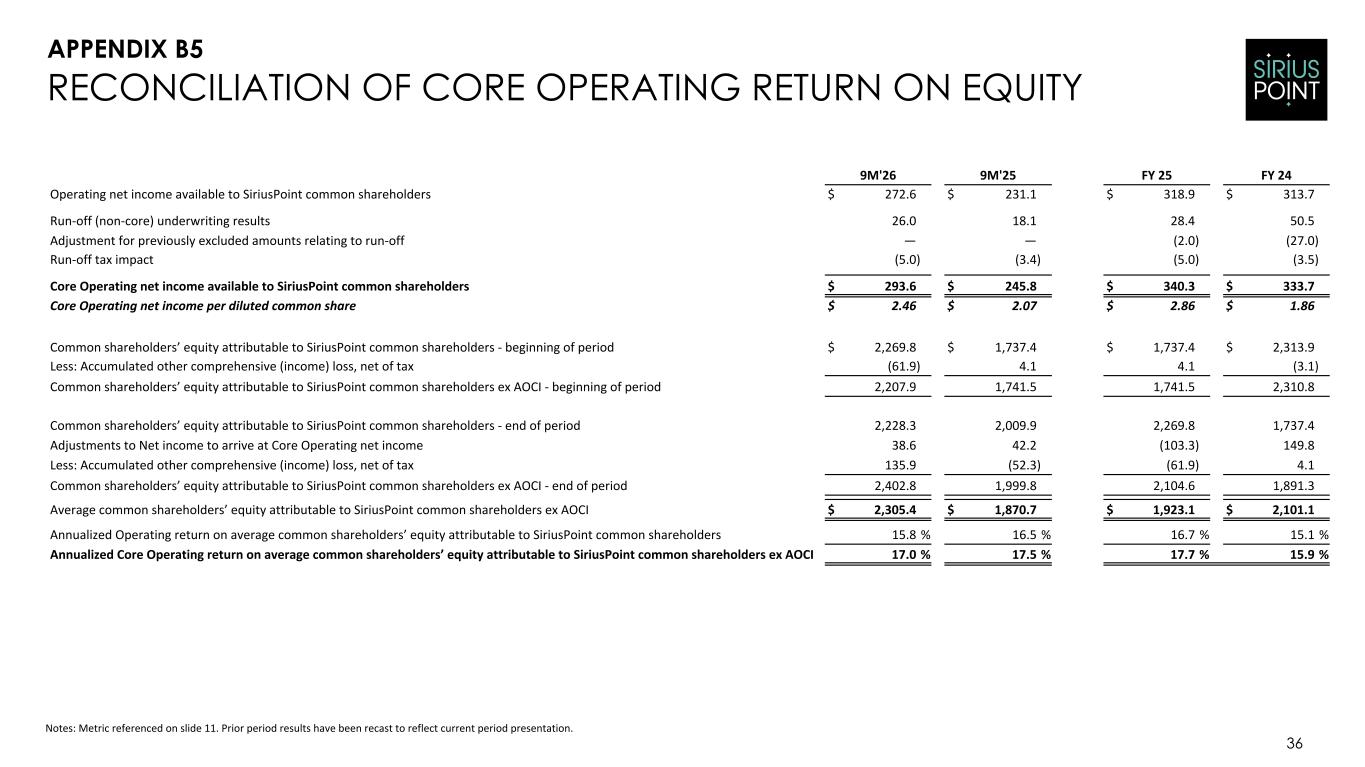
9M'26 9M'25 FY 25 FY 24 Operating net income available to SiriusPoint common shareholders $ 272.6 $ 231.1 $ 318.9 $ 313.7 Run-off (non-core) underwriting results 26.0 18.1 28.4 50.5 Adjustment for previously excluded amounts relating to run-off — — (2.0) (27.0) Run-off tax impact (5.0) (3.4) (5.0) (3.5) Core Operating net income available to SiriusPoint common shareholders $ 293.6 $ 245.8 $ 340.3 $ 333.7 Core Operating net income per diluted common share $ 2.46 $ 2.07 $ 2.86 $ 1.86 Common shareholders’ equity attributable to SiriusPoint common shareholders - beginning of period $ 2,269.8 $ 1,737.4 $ 1,737.4 $ 2,313.9 Less: Accumulated other comprehensive (income) loss, net of tax (61.9) 4.1 4.1 (3.1) Common shareholders’ equity attributable to SiriusPoint common shareholders ex AOCI - beginning of period 2,207.9 1,741.5 1,741.5 2,310.8 Common shareholders’ equity attributable to SiriusPoint common shareholders - end of period 2,228.3 2,009.9 2,269.8 1,737.4 Adjustments to Net income to arrive at Core Operating net income 38.6 42.2 (103.3) 149.8 Less: Accumulated other comprehensive (income) loss, net of tax 135.9 (52.3) (61.9) 4.1 Common shareholders’ equity attributable to SiriusPoint common shareholders ex AOCI - end of period 2,402.8 1,999.8 2,104.6 1,891.3 Average common shareholders’ equity attributable to SiriusPoint common shareholders ex AOCI $ 2,305.4 $ 1,870.7 $ 1,923.1 $ 2,101.1 Annualized Operating return on average common shareholders’ equity attributable to SiriusPoint common shareholders 15.8 % 16.5 % 16.7 % 15.1 % Annualized Core Operating return on average common shareholders’ equity attributable to SiriusPoint common shareholders ex AOCI 17.0 % 17.5 % 17.7 % 15.9 % 36 RECONCILIATION OF CORE OPERATING RETURN ON EQUITY Notes: Metric referenced on slide 11. Prior period results have been recast to reflect current period presentation. APPENDIX B5

investors.siriuspt.com