Shareholder Report
|
6 Months Ended |
|
Aug. 31, 2026
USD ($)
Holding
|
|---|
| Shareholder Report [Line Items] |
|
|
| Document Type |
N-CSRS
|
|
| Amendment Flag |
false
|
|
| Registrant Name |
Northern Lights Fund Trust IV
|
|
| Entity Central Index Key |
0001644419
|
|
| Entity Investment Company Type |
N-1A
|
|
| Document Period End Date |
Aug. 31, 2026
|
|
| Shareholder Report Annual or Semi-Annual |
Semi-Annual Shareholder Report
|
|
| C000226137 |
|
|
| Shareholder Report [Line Items] |
|
|
| Fund Name |
Monarch Ambassador Income Index ETF
|
|
| Trading Symbol |
MAMB
|
|
| Security Exchange Name |
CboeBZX
|
|
| Annual or Semi-Annual Statement [Text Block] |
This semi-annual shareholder report contains important information about Monarch Ambassador Income Index ETF for the period of March 1, 2026 to August 31, 2026.
|
|
| Additional Information [Text Block] |
You can find additional information about the Fund at https://www.monarchfunds.com/resources. You can also request this information by contacting us at 1-541-291-4405.
|
|
| Additional Information Phone Number |
1-541-291-4405
|
|
| Additional Information Website |
https://www.monarchfunds.com/resources
|
|
| Expenses [Text Block] |
What were the Fund’s costs for the last six months?(based on a hypothetical $10,000 investment) Table SummaryFund Name | Costs of a $10,000 investment | Costs paid as a percentage of a $10,000 investment |
|---|
Monarch Ambassador Income Index ETF | $53 | 1.06%Footnote Reference* |
|---|
| Footnote | Description | Footnote* | Annualized |
|
|
| Expenses Paid, Amount |
$ 53
|
|
| Expense Ratio, Percent |
1.06%
|
[1] |
| AssetsNet |
$ 194,113,556
|
|
| Holdings Count | Holding |
10
|
|
| Advisory Fees Paid, Amount |
$ 791,966
|
|
| InvestmentCompanyPortfolioTurnover |
44.00%
|
|
| Additional Fund Statistics [Text Block] |
Table SummaryNet Assets | $194,113,556 |
|---|
Number of Portfolio Holdings | 10 |
|---|
Advisory Fee | $791,966 |
|---|
Portfolio Turnover | 44% |
|---|
|
|
| Holdings [Text Block] |
Asset Weighting (% of total investments)Table SummaryValue | Value |
|---|
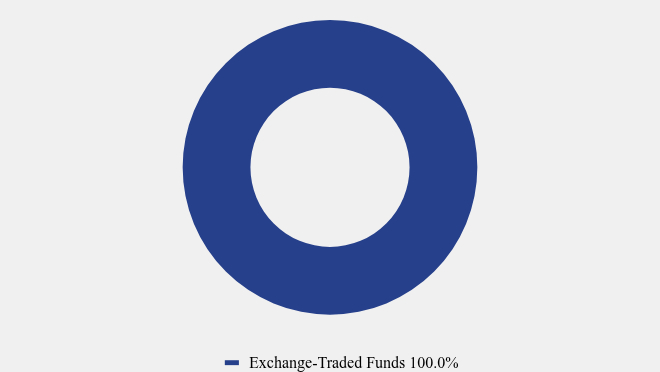
Exchange-Traded Funds | 100.0% | Asset Weighting (% of net assets)Table SummaryValue | Value |
|---|
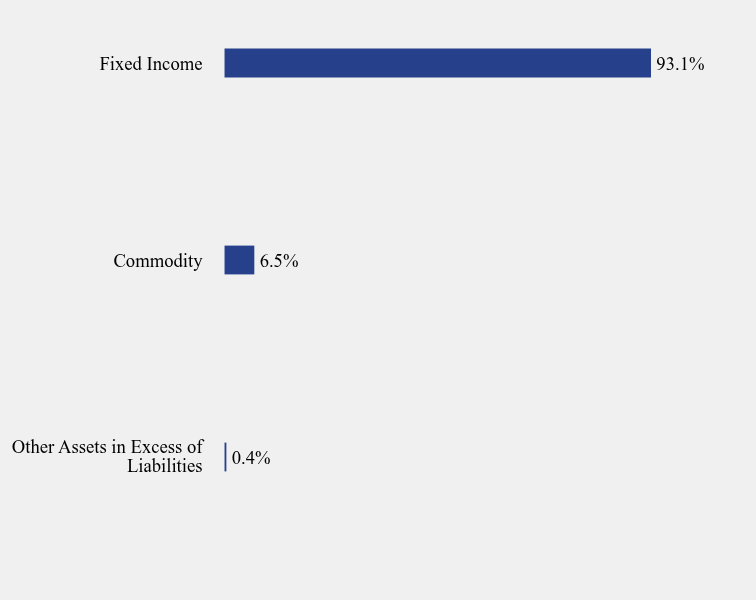
Other Assets in Excess of Liabilities | 0.4% | Commodity | 6.5% | Fixed Income | 93.1% | Top 10 Holdings (% of net assets)Table SummaryHolding Name | % of Net Assets |
|---|
iShares MBS ETF | 18.7% |
|---|
iShares iBoxx $ Investment Grade Corporate Bond ETF | 16.1% |
|---|
iShares 7-10 Year Treasury Bond ETF | 13.6% |
|---|
iShares Core U.S. Aggregate Bond ETF | 12.4% |
|---|
iShares 1-3 Year Treasury Bond ETF | 11.2% |
|---|
iShares Gold Trust | 6.5% |
|---|
iShares 20+ Year Treasury Bond ETF | 6.2% |
|---|
Invesco Taxable Municipal Bond ETF | 6.2% |
|---|
SPDR Bloomberg Convertible Securities
ETF | 6.2% |
|---|
SPDR Portfolio Short Term Corporate Bond ETF | 2.5% |
|---|
|
|
| C000226138 |
|
|
| Shareholder Report [Line Items] |
|
|
| Fund Name |
Monarch Blue Chips Elite Index ETF
|
|
| Trading Symbol |
MBCE
|
|
| Security Exchange Name |
CboeBZX
|
|
| Annual or Semi-Annual Statement [Text Block] |
This semi-annual shareholder report contains important information about Monarch Blue Chips Elite Index ETF for the period of March 1, 2026 to August 31, 2026.
|
|
| Additional Information [Text Block] |
You can find additional information about the Fund at https://www.monarchfunds.com/resources. You can also request this information by contacting us at 1-541-291-4405
|
|
| Material Fund Change Notice [Text Block] |
This report describes changes to the Fund that occurred during the reporting period.
|
|
| Additional Information Phone Number |
1-541-291-4405
|
|
| Additional Information Website |
https://www.monarchfunds.com/resources
|
|
| Expenses [Text Block] |
What were the Fund’s costs for the last six months?(based on a hypothetical $10,000 investment) Table SummaryFund Name | Costs of a $10,000 investment | Costs paid as a percentage of a $10,000 investment |
|---|
Monarch Blue Chips Elite Index ETF | $60 | 1.18%Footnote Reference* |
|---|
| Footnote | Description | Footnote* | Annualized |
|
|
| Expenses Paid, Amount |
$ 60
|
|
| Expense Ratio, Percent |
1.18%
|
[2] |
| AssetsNet |
$ 198,427,158
|
|
| Holdings Count | Holding |
13
|
|
| Advisory Fees Paid, Amount |
$ 755,517
|
|
| InvestmentCompanyPortfolioTurnover |
44.00%
|
|
| Additional Fund Statistics [Text Block] |
Table SummaryNet Assets | $198,427,158 |
|---|
Number of Portfolio Holdings | 13 |
|---|
Advisory Fee | $755,517 |
|---|
Portfolio Turnover | 44% |
|---|
|
|
| Holdings [Text Block] |
Asset Weighting (% of total investments)Table SummaryValue | Value |
|---|
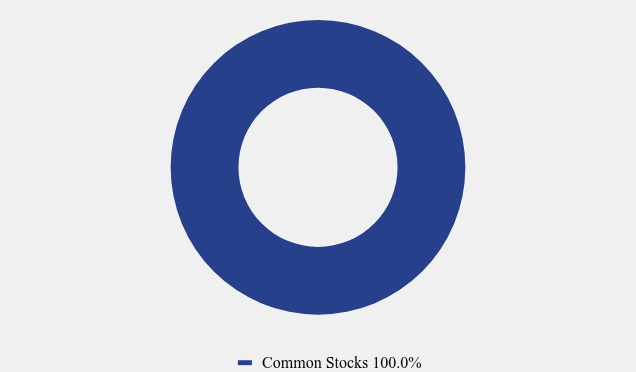
Common Stocks | 100.0% | Sector Weighting (% of net assets)Table SummaryValue | Value |
|---|
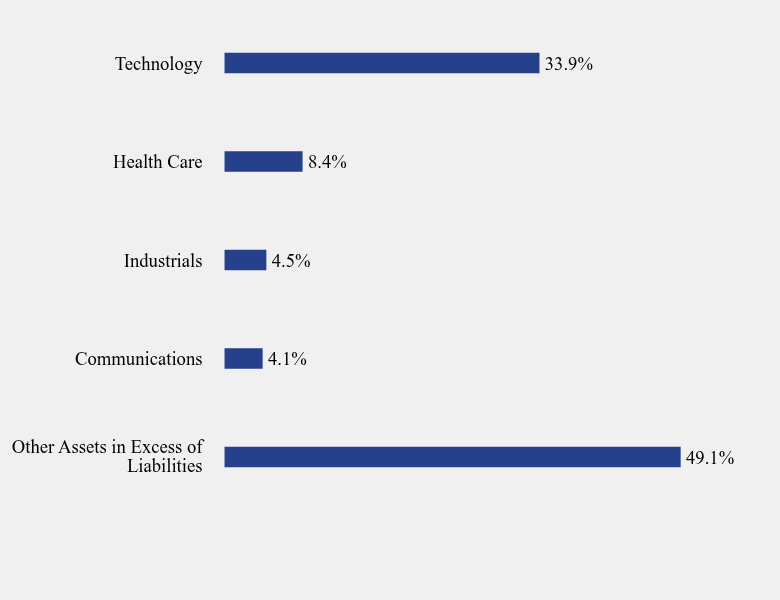
Other Assets in Excess of Liabilities | 49.1% | Communications | 4.1% | Industrials | 4.5% | Health Care | 8.4% | Technology | 33.9% | Top 10 Holdings (% of net assets)Table SummaryHolding Name | % of Net Assets |
|---|
Palantir Technologies, Inc., Class A | 5.2% |
|---|
Eli Lilly & Company | 4.5% |
|---|
NVIDIA Corporation | 4.6% |
|---|
GE Aerospace Company | 4.5% |
|---|
Applied Materials, Inc. | 4.4% |
|---|
Micron Technology, Inc. | 4.3% |
|---|
Lam Research Corporation | 4.1% |
|---|
Netflix, Inc. | 4.1% |
|---|
Advanced Micro Devices, Inc. | 4.0% |
|---|
Intuitive Surgical, Inc. | 3.9% |
|---|
|
|
| S000246990 |
|
|
| Shareholder Report [Line Items] |
|
|
| Fund Name |
Monarch Dividend Plus Index ETF
|
|
| Trading Symbol |
MDPL
|
|
| Security Exchange Name |
CboeBZX
|
|
| Annual or Semi-Annual Statement [Text Block] |
This semi-annual shareholder report contains important information about Monarch Dividend Plus Index ETF for the period of March 1, 2026 to August 31, 2026.
|
|
| Additional Information [Text Block] |
You can find additional information about the Fund at https://www.monarchfunds.com/resources. You can also request this information by contacting us at 1-541-291-4405.
|
|
| Additional Information Phone Number |
1-541-291-4405
|
|
| Additional Information Website |
https://www.monarchfunds.com/resources
|
|
| Expenses [Text Block] |
What were the Fund’s costs for the last six months?(based on a hypothetical $10,000 investment) Table SummaryFund Name | Costs of a $10,000 investment | Costs paid as a percentage of a $10,000 investment |
|---|
Monarch Dividend Plus Index ETF | $66 | 1.22%Footnote Reference* |
|---|
| Footnote | Description | Footnote* | Annualized |
|
|
| Expenses Paid, Amount |
$ 66
|
|
| Expense Ratio, Percent |
1.22%
|
[3] |
| AssetsNet |
$ 64,804,523
|
|
| Holdings Count | Holding |
30
|
|
| Advisory Fees Paid, Amount |
$ 255,524
|
|
| InvestmentCompanyPortfolioTurnover |
43.00%
|
|
| Additional Fund Statistics [Text Block] |
Table SummaryNet Assets | $64,804,523 |
|---|
Number of Portfolio Holdings | 30 |
|---|
Advisory Fee | $255,524 |
|---|
Portfolio Turnover | 43% |
|---|
|
|
| Holdings [Text Block] |
Asset Weighting (% of total investments)Table SummaryValue | Value |
|---|
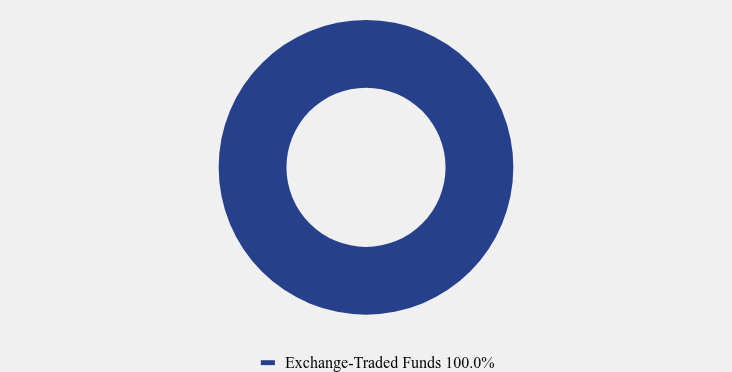
Common Stocks | 100.0% | Sector Weighting (% of net assets)Table SummaryValue | Value |
|---|
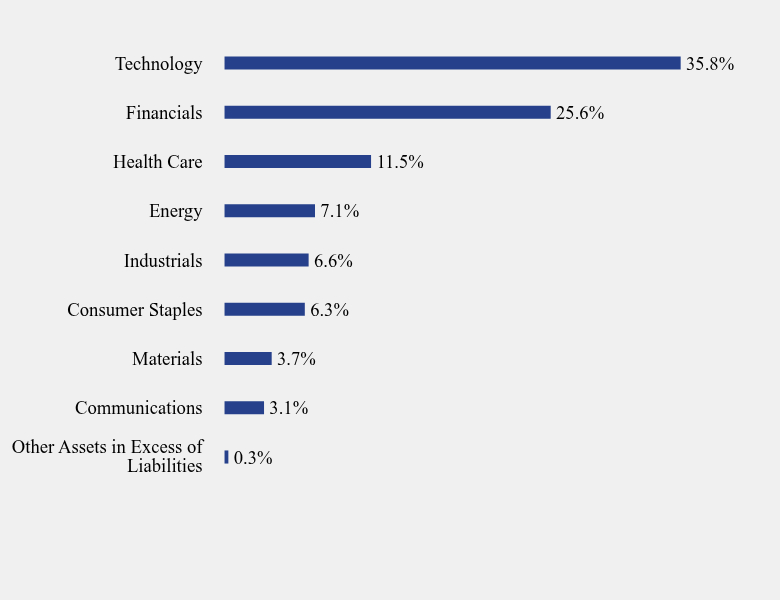
Other Assets in Excess of Liabilities | 0.3% | Communications | 3.1% | Materials | 3.7% | Consumer Staples | 6.3% | Industrials | 6.6% | Energy | 7.1% | Health Care | 11.5% | Financials | 25.6% | Technology | 35.8% | Top 10 Holdings (% of net assets)Table SummaryHolding Name | % of Net Assets |
|---|
Cognizant Technology Solutions Corporation, Class A | 4.3% |
|---|
Marathon Petroleum Corporation | 3.9% |
|---|
Accenture PLC, Class A | 3.9% |
|---|
Hamilton Lane, Inc., Class A | 3.8% |
|---|
AngloGold Ashanti PLC | 3.7% |
|---|
Intuit, Inc. | 3.6% |
|---|
Genpact Ltd. | 3.6% |
|---|
H&R Block, Inc. | 3.6% |
|---|
Leidos Holdings, Inc. | 3.6% |
|---|
SS&C Technologies Holdings, Inc. | 3.5% |
|---|
|
|
| C000226139 |
|
|
| Shareholder Report [Line Items] |
|
|
| Fund Name |
Monarch ProCap Index ETF
|
|
| Trading Symbol |
MPRO
|
|
| Security Exchange Name |
CboeBZX
|
|
| Annual or Semi-Annual Statement [Text Block] |
This semi-annual shareholder report contains important information about Monarch ProCap Index ETF for the period of March 1, 2026 to August 31, 2026.
|
|
| Additional Information [Text Block] |
You can find additional information about the Fund at https://www.monarchfunds.com/resources. You can also request this information by contacting us at 1-541-291-4405.
|
|
| Additional Information Phone Number |
1-541-291-4405
|
|
| Additional Information Website |
https://www.monarchfunds.com/resources
|
|
| Expenses [Text Block] |
What were the Fund’s costs for the last six months?(based on a hypothetical $10,000 investment) Table SummaryFund Name | Costs of a $10,000 investment | Costs paid as a percentage of a $10,000 investment |
|---|
Monarch ProCap Index ETF | $51 | 1.01%Footnote Reference* |
|---|
| Footnote | Description | Footnote* | Annualized |
|
|
| Expenses Paid, Amount |
$ 51
|
|
| Expense Ratio, Percent |
1.01%
|
[4] |
| AssetsNet |
$ 254,796,830
|
|
| Holdings Count | Holding |
9
|
|
| Advisory Fees Paid, Amount |
$ 1,087,300
|
|
| InvestmentCompanyPortfolioTurnover |
64.00%
|
|
| Additional Fund Statistics [Text Block] |
Table SummaryNet Assets | $254,796,830 |
|---|
Number of Portfolio Holdings | 9 |
|---|
Advisory Fee | $1,087,300 |
|---|
Portfolio Turnover | 64% |
|---|
|
|
| Holdings [Text Block] |
Asset Weighting (% of total investments)Table SummaryValue | Value |
|---|
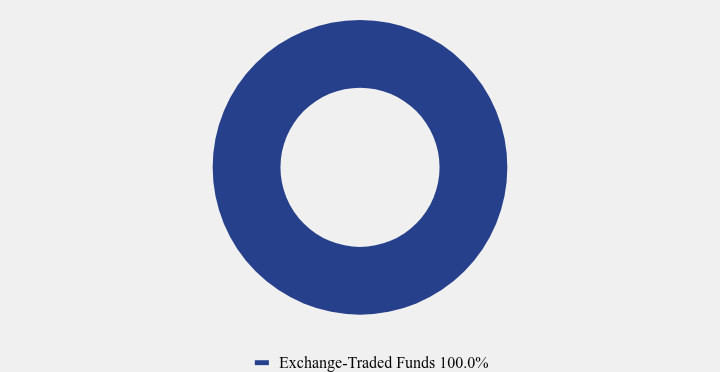
Exchange-Traded Funds | 100.0% | Asset Weighting (% of net assets)Table SummaryValue | Value |
|---|
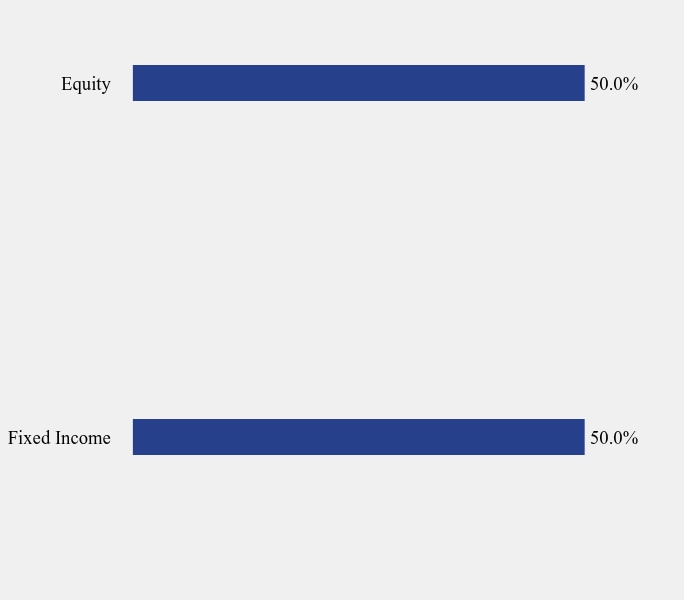
Fixed Income | 50.0% | Equity | 50.0% | Top Holdings (% of net assets)Table SummaryHolding Name | % of Net Assets |
|---|
iShares Core U.S. Aggregate Bond ETF | 50.0% |
|---|
State Street Health Care Select Sector SPDR ETF | 10.4% |
|---|
State Street Communication Services Select Sector SPDR ETF | 10.0% |
|---|
State Street Technology Select Sector SPDR ETF | 5.0% |
|---|
State Street Consumer Staples Select Sector SPDR ETF | 5.0% |
|---|
State Street Financial Select Sector SPDR ETF | 5.0% |
|---|
State Street Consumer Discretionary Select Sector SPDR ETF | 4.9% |
|---|
State Street Real Estate Select Sector SPDR ETF | 4.9% |
|---|
State Street Industrial Select Sector SPDR ETF | 4.8% |
|---|
|
|
| C000246991 |
|
|
| Shareholder Report [Line Items] |
|
|
| Fund Name |
Monarch Select Subsector Index ETF
|
|
| Trading Symbol |
MSSS
|
|
| Security Exchange Name |
CboeBZX
|
|
| Annual or Semi-Annual Statement [Text Block] |
This semi-annual shareholder report contains important information about Monarch Select Subsector Index ETF for the period of March 1, 2026 to August 31, 2026.
|
|
| Additional Information [Text Block] |
You can find additional information about the Fund at https://www.monarchfunds.com/resources. You can also request this information by contacting us at 1-541-291-4405.
|
|
| Additional Information Phone Number |
1-541-291-4405
|
|
| Additional Information Website |
https://www.monarchfunds.com/resources
|
|
| Expenses [Text Block] |
What were the Fund’s costs for the last six months?(based on a hypothetical $10,000 investment) Table SummaryFund Name | Costs of a $10,000 investment | Costs paid as a percentage of a $10,000 investment |
|---|
Monarch Select Subsector Index ETF | $62 | 1.17%Footnote Reference* |
|---|
| Footnote | Description | Footnote* | Annualized |
|
|
| Expenses Paid, Amount |
$ 62
|
|
| Expense Ratio, Percent |
1.17%
|
[5] |
| AssetsNet |
$ 150,413,606
|
|
| Holdings Count | Holding |
10
|
|
| Advisory Fees Paid, Amount |
$ 578,577
|
|
| InvestmentCompanyPortfolioTurnover |
114.00%
|
|
| Additional Fund Statistics [Text Block] |
Table SummaryNet Assets | $150,413,606 |
|---|
Number of Portfolio Holdings | 10 |
|---|
Advisory Fee | $578,577 |
|---|
Portfolio Turnover | 114% |
|---|
|
|
| Holdings [Text Block] |
Asset Weighting (% of total investments)Table SummaryValue | Value |
|---|
Exchange-Traded Funds | 100.0% | Asset Weighting (% of net assets)Table SummaryValue | Value |
|---|
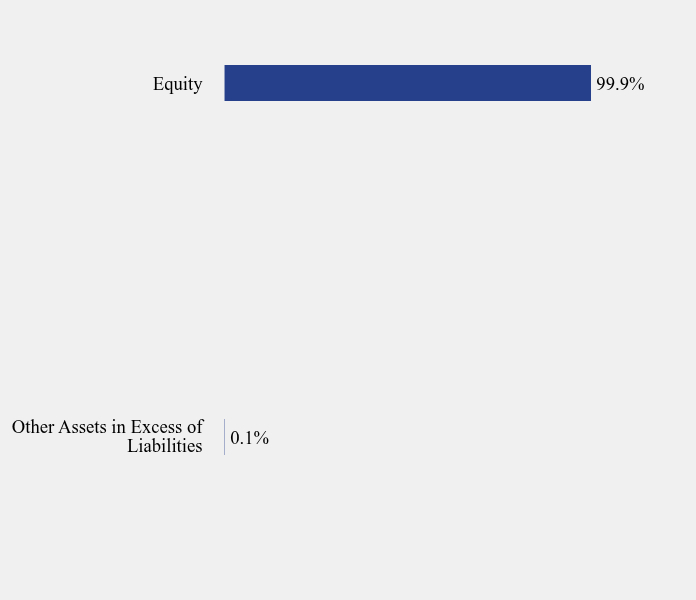
Other Assets in Excess of Liabilities | 0.1% | Equity | 99.9% | Top 10 Holdings (% of net assets)Table SummaryHolding Name | % of Net Assets |
|---|
SPDR S&P Software & Services ETF | 11.1% |
|---|
iShares U.S. Medical Devices ETF | 10.3% |
|---|
iShares U.S. Healthcare Providers ETF | 10.2% |
|---|
SPDR S&P Pharmaceuticals ETF | 10.1% |
|---|
State Street Communication Services Select Sector SPDR ETF | 10.1% |
|---|
Invesco Leisure & Entertainment ETF | 9.9% |
|---|
Invesco KBW Property & Casualty ETF | 9.8% |
|---|
SPDR S&P Insurance ETF | 9.8% |
|---|
State Street SPDR S&P Semiconductor ETF | 9.4% |
|---|
SPDR S&P Aerospace & Defense ETF | 9.2% |
|---|
|
|
| C000246992 |
|
|
| Shareholder Report [Line Items] |
|
|
| Fund Name |
Monarch Volume Factor Dividend Tree Index ETF
|
|
| Trading Symbol |
MVFD
|
|
| Security Exchange Name |
CboeBZX
|
|
| Annual or Semi-Annual Statement [Text Block] |
This semi-annual shareholder report contains important information about Monarch Volume Factor Dividend Tree Index ETF for the period of March 1, 2026 to August 31, 2026.
|
|
| Additional Information [Text Block] |
You can find additional information about the Fund at https://www.monarchfunds.com/resources. You can also request this information by contacting us at 1-541-291-4405.
|
|
| Additional Information Phone Number |
1-541-291-4405
|
|
| Additional Information Website |
https://www.monarchfunds.com/resources
|
|
| Expenses [Text Block] |
What were the Fund’s costs for the last six months?(based on a hypothetical $10,000 investment) Table SummaryFund Name | Costs of a $10,000 investment | Costs paid as a percentage of a $10,000 investment |
|---|
Monarch Volume Factor Dividend Tree Index ETF | $61 | 1.20%Footnote Reference* |
|---|
| Footnote | Description | Footnote* | Annualized |
|
|
| Expenses Paid, Amount |
$ 61
|
|
| Expense Ratio, Percent |
1.20%
|
[6] |
| AssetsNet |
$ 129,982,709
|
|
| Holdings Count | Holding |
40
|
|
| Advisory Fees Paid, Amount |
$ 475,076
|
|
| InvestmentCompanyPortfolioTurnover |
129.00%
|
|
| Additional Fund Statistics [Text Block] |
Table SummaryNet Assets | $129,982,709 |
|---|
Number of Portfolio Holdings | 40 |
|---|
Advisory Fee | $475,076 |
|---|
Portfolio Turnover | 129% |
|---|
|
|
| Holdings [Text Block] |
Asset Weighting (% of total investments)Table SummaryValue | Value |
|---|
Common Stocks | 100.0% | Sector Weighting (% of net assets)Table SummaryValue | Value |
|---|
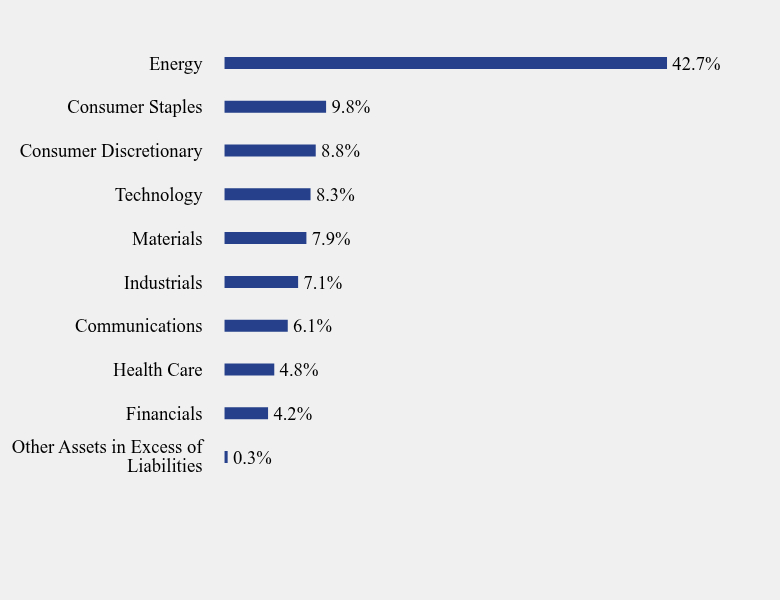
Other Assets in Excess of Liabilities | 0.3% | Financials | 4.2% | Health Care | 4.8% | Communications | 6.1% | Industrials | 7.1% | Materials | 7.9% | Technology | 8.3% | Consumer Discretionary | 8.8% | Consumer Staples | 9.8% | Energy | 42.7% | Top 10 Holdings (% of net assets)Table SummaryHolding Name | % of Net Assets |
|---|
Occidental Petroleum Corporation | 3.8% |
|---|
Marathon Petroleum Corporation | 3.2% |
|---|
Patterson-UTI Energy, Inc. | 3.2% |
|---|
SLB Ltd. | 3.1% |
|---|
APA Corporation | 3.1% |
|---|
Hewlett Packard Enterprise Company | 3.0% |
|---|
SM Energy Company | 3.0% |
|---|
Kinetik Holdings, Inc. | 3.0% |
|---|
Permian Resources Corporation, Class A | 3.0% |
|---|
J.M. Smucker Company (The) | 2.8% |
|---|
|
|
| C000246993 |
|
|
| Shareholder Report [Line Items] |
|
|
| Fund Name |
Monarch Volume Factor Global Unconstrained Index ETF
|
|
| Trading Symbol |
MVFG
|
|
| Security Exchange Name |
CboeBZX
|
|
| Annual or Semi-Annual Statement [Text Block] |
This semi-annual shareholder report contains important information about Monarch Volume Factor Global Unconstrained Index ETF for the period of March 1, 2026 to August 31, 2026.
|
|
| Additional Information [Text Block] |
You can find additional information about the Fund at https://www.monarchfunds.com/resources. You can also request this information by contacting us at 1-541-291-4405.
|
|
| Additional Information Phone Number |
1-541-291-4405
|
|
| Additional Information Website |
https://www.monarchfunds.com/resources
|
|
| Expenses [Text Block] |
What were the Fund’s costs for the last six months?(based on a hypothetical $10,000 investment) Table SummaryFund Name | Costs of a $10,000 investment | Costs paid as a percentage of a $10,000 investment |
|---|
Monarch Volume Factor Global Unconstrained Index ETF | $60 | 1.17%Footnote Reference* |
|---|
| Footnote | Description | Footnote* | Annualized |
|
|
| Expenses Paid, Amount |
$ 60
|
|
| Expense Ratio, Percent |
1.17%
|
[7] |
| AssetsNet |
$ 184,714,647
|
|
| Holdings Count | Holding |
24
|
|
| Advisory Fees Paid, Amount |
$ 692,428
|
|
| InvestmentCompanyPortfolioTurnover |
134.00%
|
|
| Additional Fund Statistics [Text Block] |
Table SummaryNet Assets | $184,714,647 |
|---|
Number of Portfolio Holdings | 24 |
|---|
Advisory Fee | $692,428 |
|---|
Portfolio Turnover | 134% |
|---|
|
|
| Holdings [Text Block] |
Asset Weighting (% of total investments)Table SummaryValue | Value |
|---|
Exchange-Traded Funds | 100.0% | Asset Weighting (% of net assets)Table SummaryValue | Value |
|---|
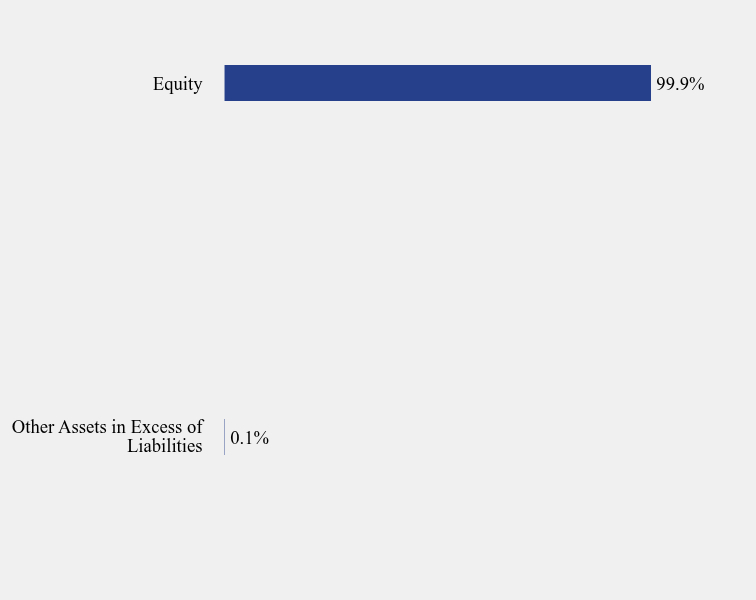
Other Assets in Excess of Liabilities | 0.1% | Equity | 99.9% | Top 10 Holdings (% of net assets)Table SummaryHolding Name | % of Net Assets |
|---|
Xtrackers MSCI Emerging Markets Select ETF | 5.6% |
|---|
ALPS Sector Dividend Dogs ETF | 4.7% |
|---|
BNY Mellon US Mid Cap Core Equity ETF | 4.6% |
|---|
Xtrackers Russell US Multifactor ETF | 4.5% |
|---|
VictoryShares Dividend Accelerator ETF | 4.4% |
|---|
ALPS International Sector Dividend Dogs ETF | 4.2% |
|---|
JPMorgan Diversified Return International Equity ETF | 4.1% |
|---|
SPDR S&P Global Dividend ETF | 4.1% |
|---|
iShares Russell Top 200 Value ETF | 4.1% |
|---|
Invesco S&P 500 Pure Value ETF | 4.1% |
|---|
|
|
|
|