| What were the Fund’s costs for the last year (based on a hypothetical $10,000 investment)? | ||
| Fund | Costs of a $10,000 Investment | Costs paid as a % of a $10,000 Investment |
| Saratoga Large Capitalization Value Fund, Class A | $216 | 2.13% |
| What affected the Fund’s performance this period? |
|
The Fund’s top contributor during the fiscal year was Henry Schein. The company hired a new Chief Executive Officer and implemented a strategic cost optimization plan that led to multiple positive earnings revisions. Quanta Services was the Fund’s second-best performing stock during the period. Its earnings were driven by large projects related to grid and utility infrastructure, and the company had substantial earnings revisions during the fiscal year.
The Fund’s main detractors were Fair Isaac (FICO) and Sallie Mae. FICO was impacted by political scrutiny that called into question its pricing power. Sallie Mae was impacted by concerns that artificial intelligence could weigh on employment prospects for recent graduates, which investors expected to lead to higher net charge-offs and delinquencies. |
How did the Fund perform over the past 10 years?
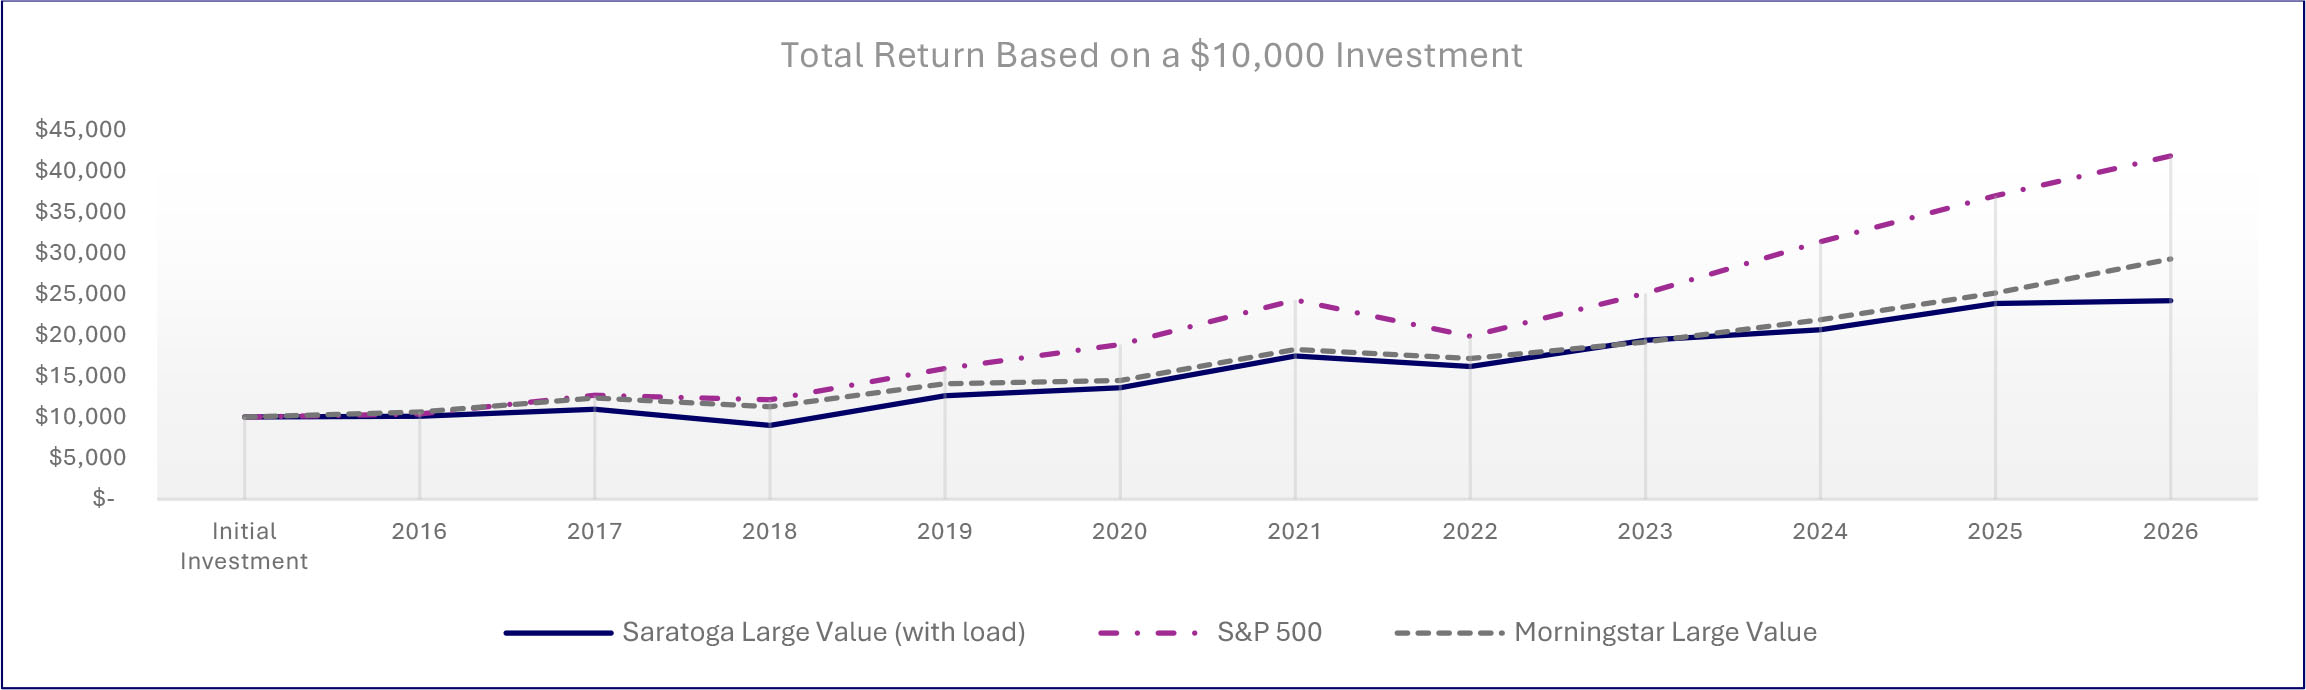
The chart below represents the historical performance of a hypothetical $10,000 investment over the past 10 years in the class of shares noted and assumes the reinvestment of dividends and capital gains and the maximum sales charge, if any. Fund expenses, including management fees, 12b-1 fees, if any, and other expenses were deducted.
| Average Annual Total Returns | |||
| 1 Year | 5 Years | 10 Years | |
| Saratoga Large Capitalization Value Fund, Class A (with load) | -2.94% | 6.61% | 9.23% |
| Saratoga Large Capitalization Value Fund, Class A | 2.98% | 7.88% | 9.87% |
| S&P 500® Index | 20.38% | 12.79% | 15.37% |
| Morningstar US Fund Large Value Category | 21.91% | 10.86% | 11.55% |
| Fund Statistics | |||
| Total Net Assets | $14,607,094 | Advisory Fees Paid by the Fund | $108,701 |
| Number of Portfolio Holdings | 23 | Portfolio Turnover Rate | 84% |
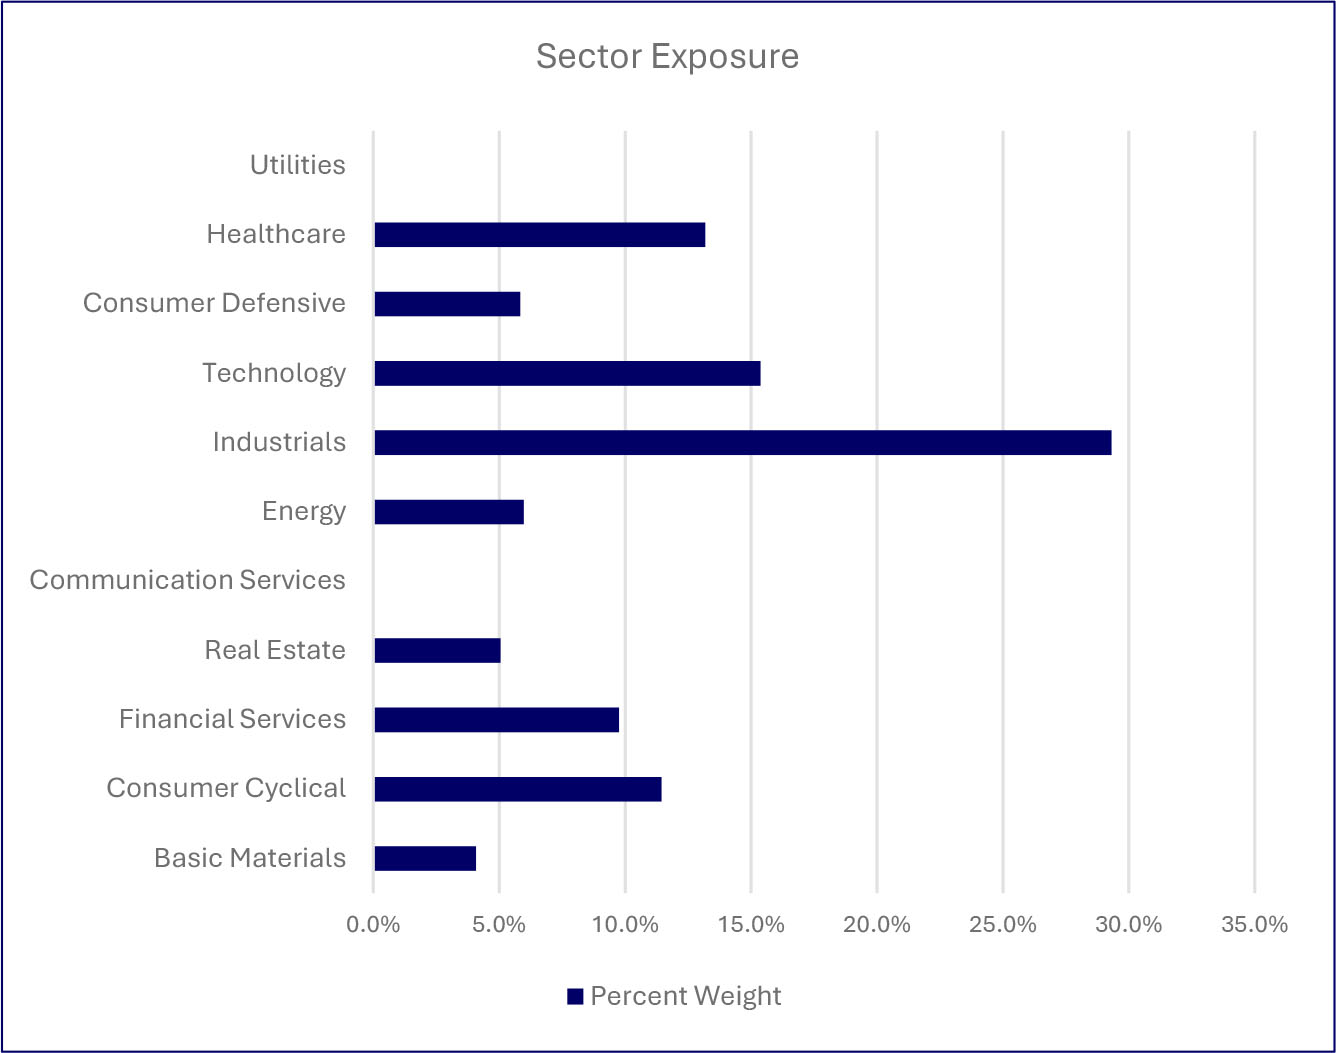
What did the Fund invest in (as a % of the Fund’s net assets)?
| Top Holdings (%) | |
| Henry Schein, Inc | |
| Amazon.com, Inc | |
| Clean Harbors Inc | |
| Quest Diagnostics, Inc | |
| Capital One Financial Corp | |
| Williams Companies, Inc (The) | |
| Primo Brands Corp | |
| AMETEK, Inc | |
| Welltower, Inc | |
| Somnigroup International, Inc | |
| Material Fund changes during the period. |
| Below is a summary of certain changes, and planned changes, to the Fund during the reporting period. For more complete information, you may review the Fund’s next prospectus, which we expect to be available by December 31, 2026, at www.saratogacap.com/fund-reports or upon request at 1-888-672-4839. |
| During the period there were no material changes to the Fund. |
| What were the Fund’s costs for the last year (based on a hypothetical $10,000 investment)? | ||
| Fund | Costs of a $10,000 Investment | Costs paid as a % of a $10,000 Investment |
| Saratoga Large Capitalization Value Fund, Class C | $277 | 2.74% |
| What affected the Fund’s performance this period? |
|
The Fund’s top contributor during the fiscal year was Henry Schein. The company hired a new Chief Executive Officer and implemented a strategic cost optimization plan that led to multiple positive earnings revisions. Quanta Services was the Fund’s second-best performing stock during the period. Its earnings were driven by large projects related to grid and utility infrastructure, and the company had substantial earnings revisions during the fiscal year.
The Fund’s main detractors were Fair Isaac (FICO) and Sallie Mae. FICO was impacted by political scrutiny that called into question its pricing power. Sallie Mae was impacted by concerns that artificial intelligence could weigh on employment prospects for recent graduates, which investors expected to lead to higher net charge-offs and delinquencies. |
How did the Fund perform over the past 10 years?
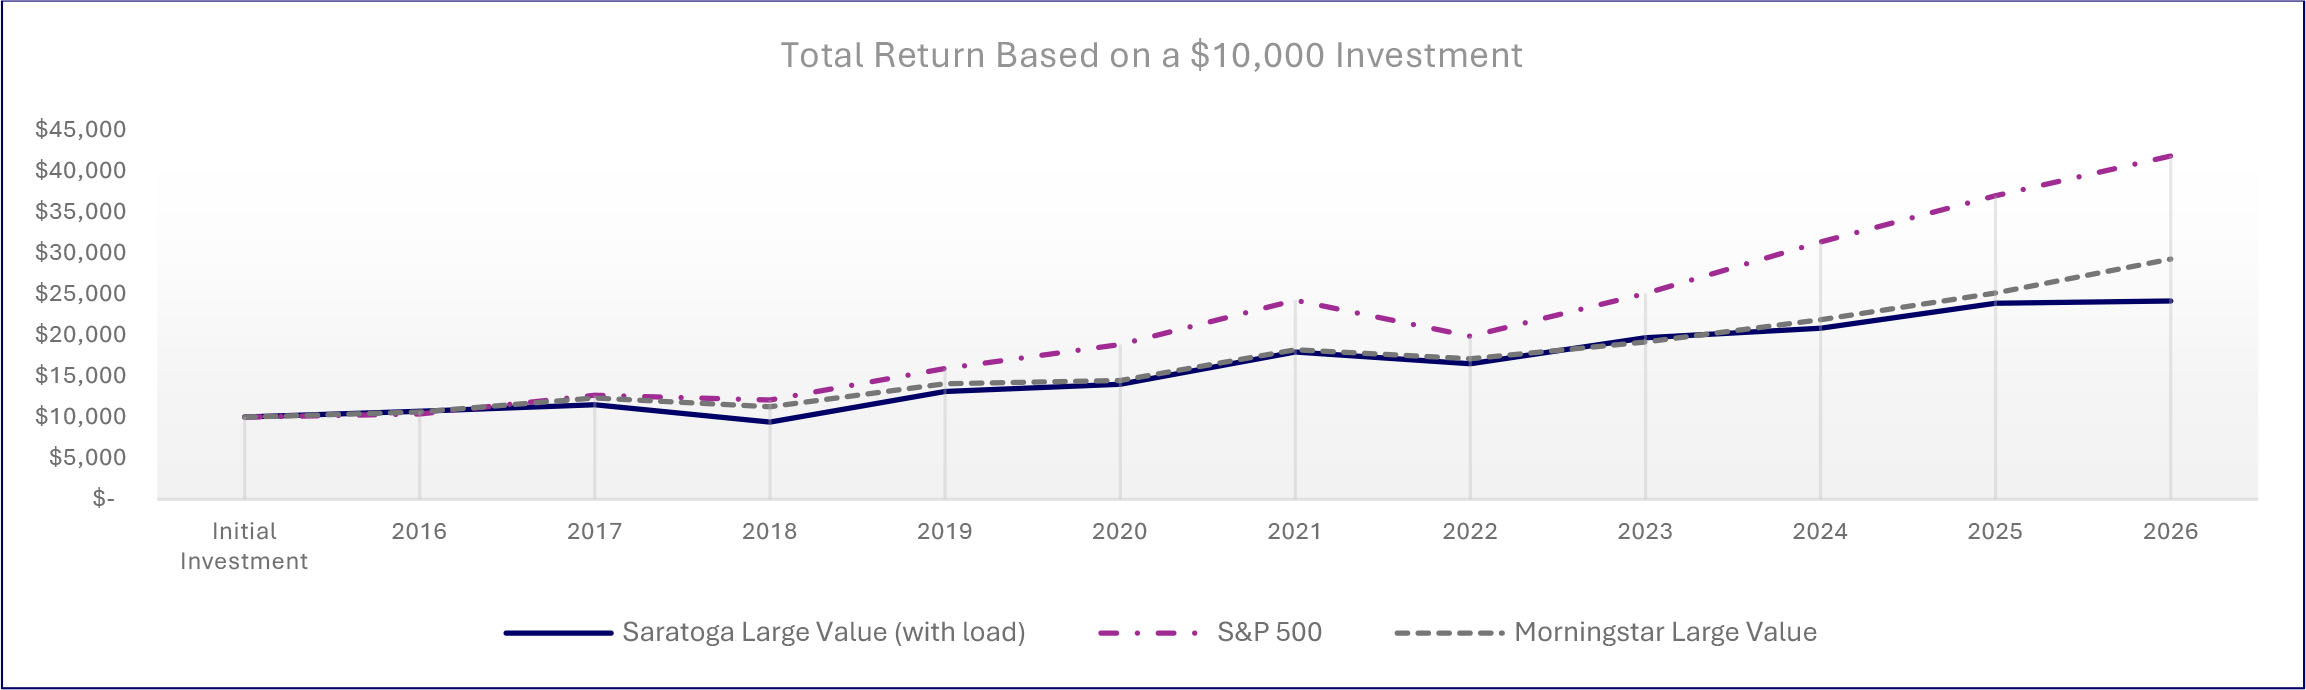
The chart below represents the historical performance of a hypothetical $10,000 investment over the past 10 years in the class of shares noted and assumes the reinvestment of dividends and capital gains and the maximum sales charge, if any. Fund expenses, including management fees, 12b-1 fees, if any, and other expenses were deducted.
| Average Annual Total Returns | |||
| 1 Year | 5 Years | 10 Years | |
| Saratoga Large Capitalization Value Fund, Class C (with load) | 1.32% | 7.24% | 9.21% |
| Saratoga Large Capitalization Value Fund, Class C | 2.37% | 7.24% | 9.21% |
| S&P 500® Index | 20.38% | 12.79% | 15.37% |
| Morningstar US Fund Large Value Category | 21.91% | 10.86% | 11.55% |
| Fund Statistics | |||
| Total Net Assets | $14,607,094 | Advisory Fees Paid by the Fund | $108,701 |
| Number of Portfolio Holdings | 23 | Portfolio Turnover Rate | 84% |
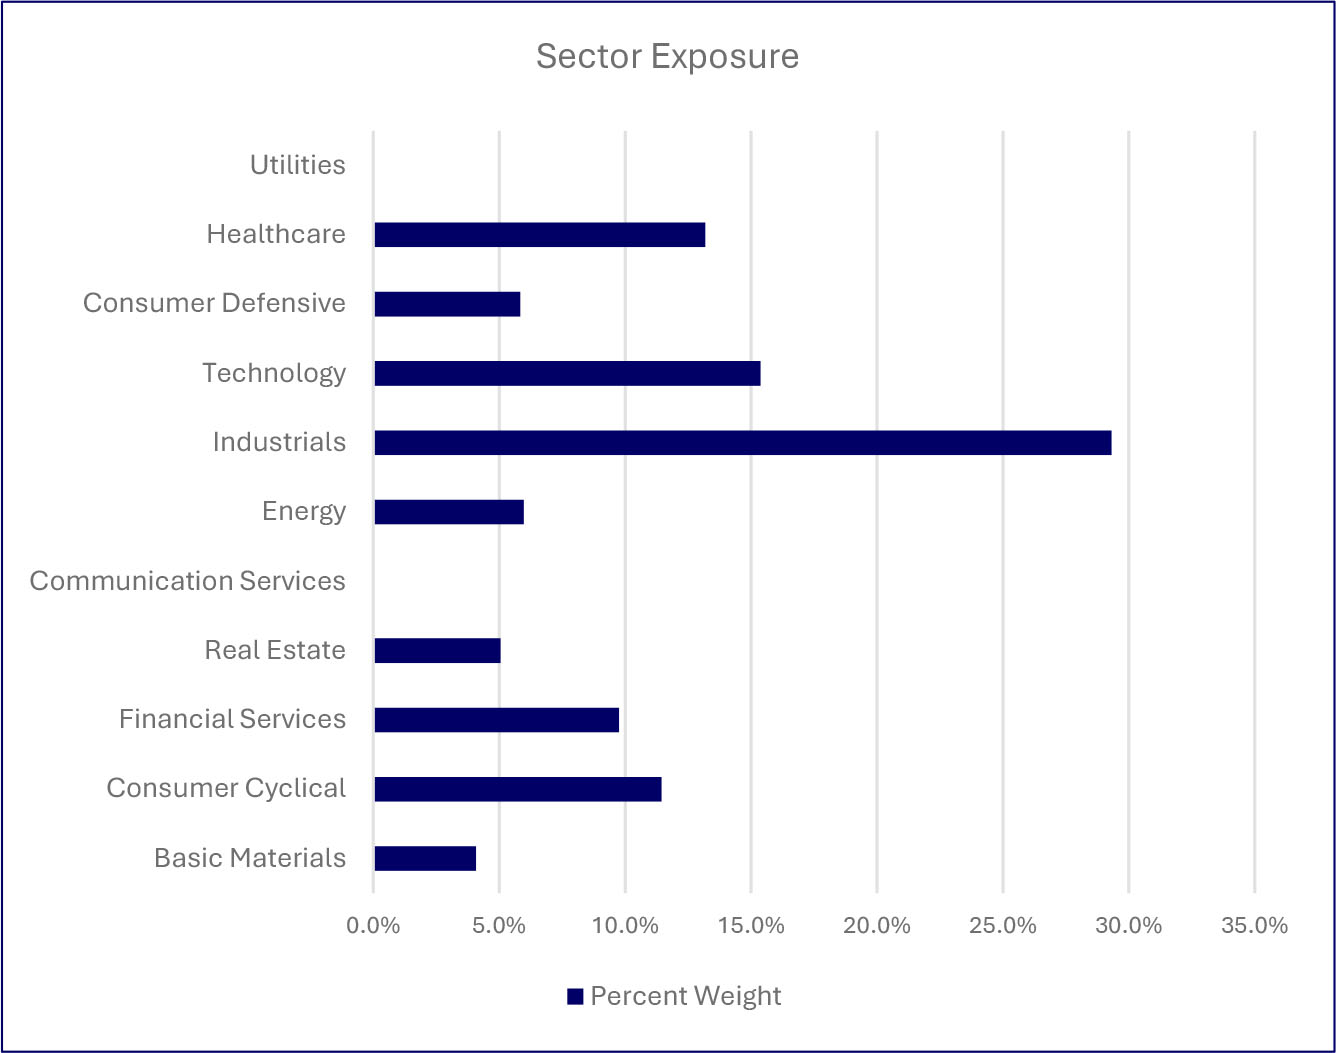
What did the Fund invest in (as a % of the Fund’s net assets)?
| Top Holdings (%) | |
| Henry Schein, Inc | |
| Amazon.com, Inc | |
| Clean Harbors Inc | |
| Quest Diagnostics, Inc | |
| Capital One Financial Corp | |
| Williams Companies, Inc (The) | |
| Primo Brands Corp | |
| AMETEK, Inc | |
| Welltower, Inc | |
| Somnigroup International, Inc | |
| Material Fund changes during the period. |
| Below is a summary of certain changes, and planned changes, to the Fund during the reporting period. For more complete information, you may review the Fund’s next prospectus, which we expect to be available by December 31, 2026, at www.saratogacap.com/fund-reports or upon request at 1-888-672-4839. |
| During the period there were no material changes to the Fund. |
| What were the Fund’s costs for the last year (based on a hypothetical $10,000 investment)? | ||
| Fund | Costs of a $10,000 Investment | Costs paid as a % of a $10,000 Investment |
| Saratoga Large Capitalization Value Fund, Class I | $175 | 1.72% |
| What affected the Fund’s performance this period? |
|
The Fund’s top contributor during the fiscal year was Henry Schein. The company hired a new Chief Executive Officer and implemented a strategic cost optimization plan that led to multiple positive earnings revisions. Quanta Services was the Fund’s second-best performing stock during the period. Its earnings were driven by large projects related to grid and utility infrastructure, and the company had substantial earnings revisions during the fiscal year.
The Fund’s main detractors were Fair Isaac (FICO) and Sallie Mae. FICO was impacted by political scrutiny that called into question its pricing power. Sallie Mae was impacted by concerns that artificial intelligence could weigh on employment prospects for recent graduates, which investors expected to lead to higher net charge-offs and delinquencies. |
How did the Fund perform over the past 10 years?
The chart below represents the historical performance of a hypothetical $10,000 investment over the past 10 years in the class of shares noted and assumes the reinvestment of dividends and capital gains and the maximum sales charge, if any. Fund expenses, including management fees, 12b-1 fees, if any, and other expenses were deducted.
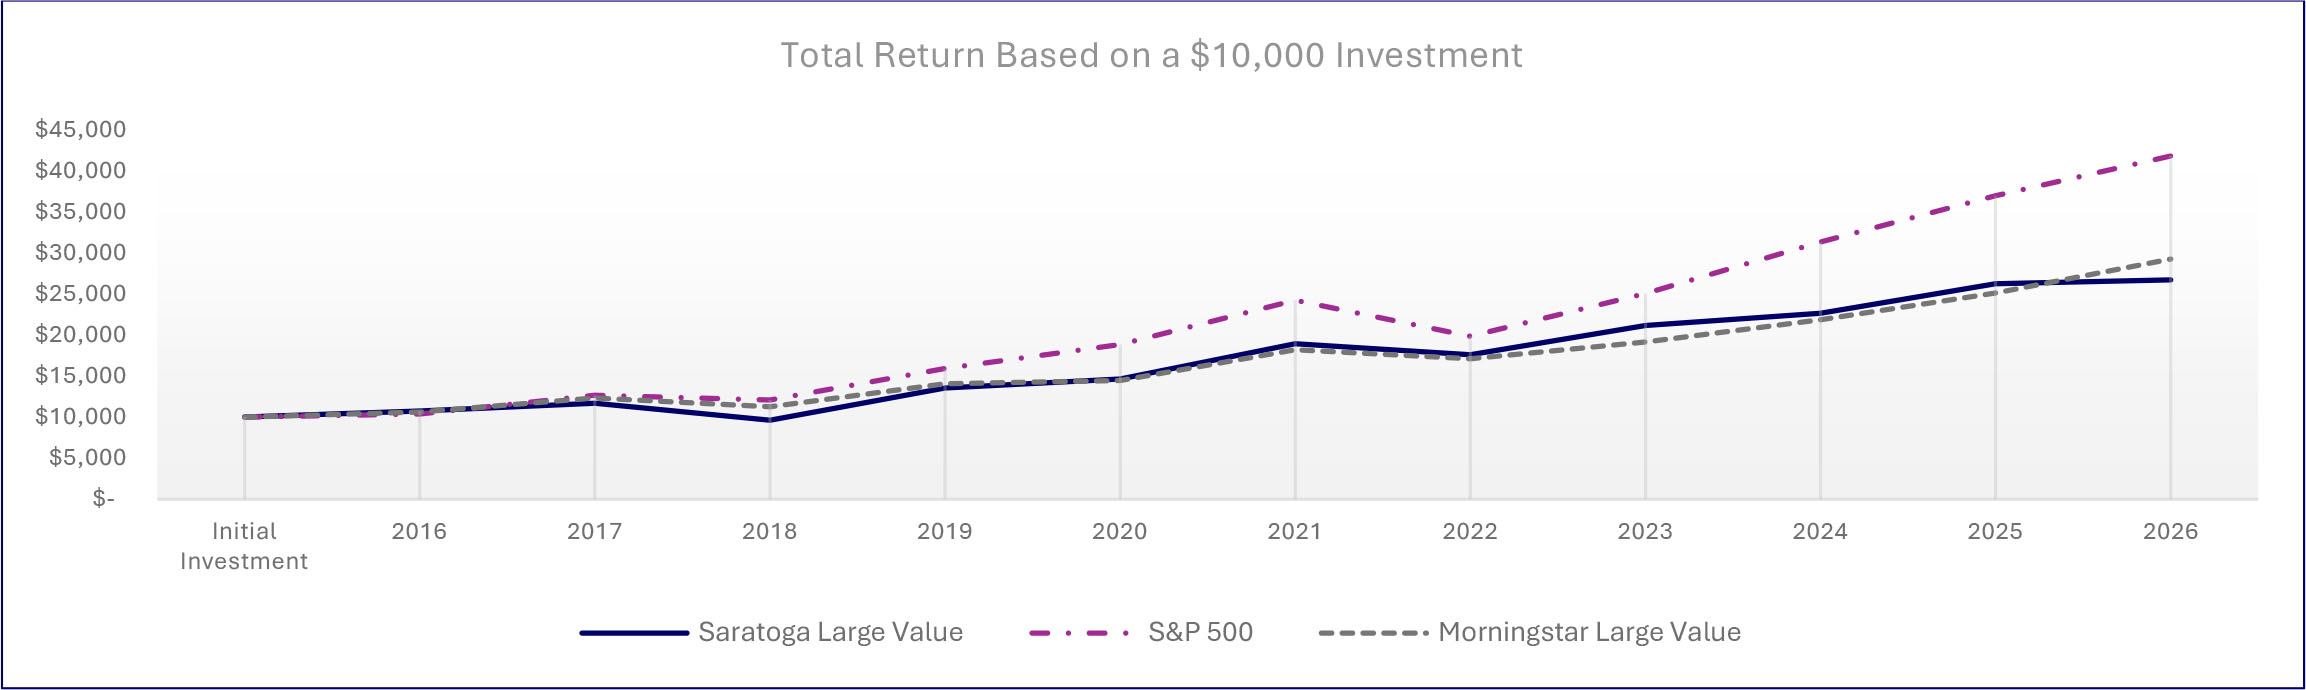
| Average Annual Total Returns | |||
| 1 Year | 5 Years | 10 Years | |
| Saratoga Large Capitalization Value Fund, Class I | 3.40% | 8.32% | 10.32% |
| S&P 500® Index | 20.38% | 12.79% | 15.37% |
| Morningstar US Fund Large Value Category | 21.91% | 10.86% | 11.55% |
| Fund Statistics | |||
| Total Net Assets | $14,607,094 | Advisory Fees Paid by the Fund | $108,701 |
| Number of Portfolio Holdings | 23 | Portfolio Turnover Rate | 84% |
What did the Fund invest in (as a % of the Fund’s net assets)?
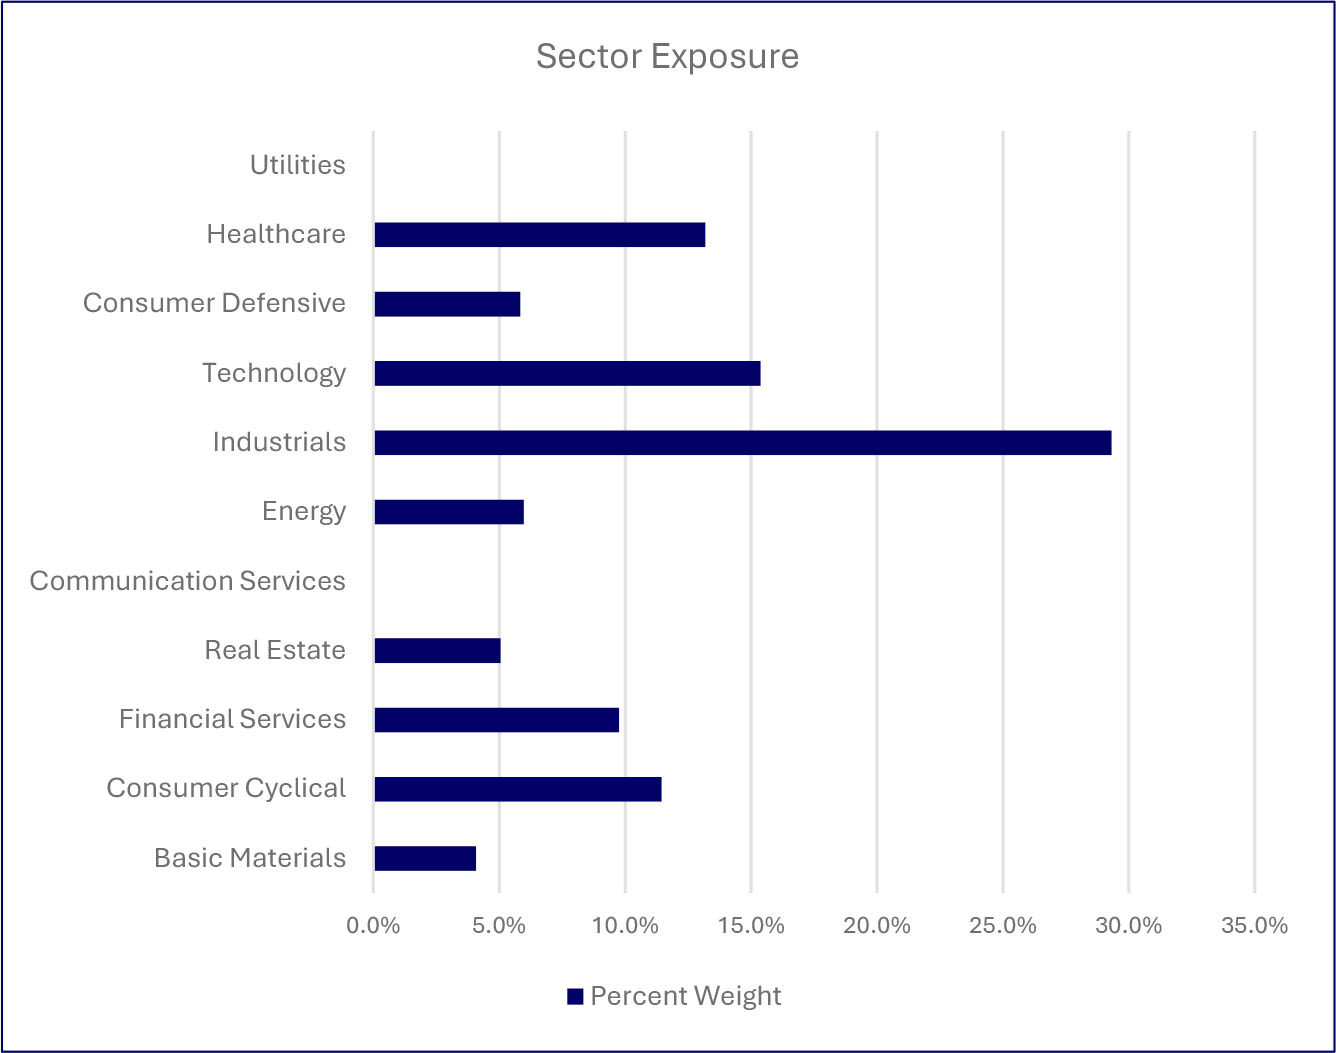
| Top Holdings (%) | |
| Henry Schein, Inc | |
| Amazon.com, Inc | |
| Clean Harbors Inc | |
| Quest Diagnostics, Inc | |
| Capital One Financial Corp | |
| Williams Companies, Inc (The) | |
| Primo Brands Corp | |
| AMETEK, Inc | |
| Welltower, Inc | |
| Somnigroup International, Inc | |
| Material Fund changes during the period. |
| Below is a summary of certain changes, and planned changes, to the Fund during the reporting period. For more complete information, you may review the Fund’s next prospectus, which we expect to be available by December 31, 2026, at www.saratogacap.com/fund-reports or upon request at 1-888-672-4839. |
| During the period there were no material changes to the Fund. |
| What were the Fund’s costs for the last year (based on a hypothetical $10,000 investment)? | ||
| Fund | Costs of a $10,000 Investment | Costs paid as a % of a $10,000 Investment |
| Saratoga Large Capitalization Growth Fund, Class A | $232 | 2.20% |
| What affected the Fund’s performance during this period? |
|
The Fund’s positive returns were largely driven by stock selection in the Information Technology sector. Industrials and Communication Services holdings also made meaningful positive contributions. The Consumer Staples and Health Care sectors were the only sectors with negative stock selection of note.
From a stock selection perspective, Lumentum Holdings was the top contributor; the optical components supplier reported strong revenue growth driven by accelerating demand for data-center optical products used in AI infrastructure. Dell Technologies was the second largest contributor; the computer hardware manufacturer reported strong revenue growth supported by record AI server demand.
Due to threshold limits, the Fund held a significant underweight position in mega-cap technology stocks, which was a headwind to relative performance. Out of Fund holdings, Atlassian had the biggest negative impact; although its quarterly results exceeded expectations, shares fell sharply after management pointed to slower near-term cloud growth and an expected deceleration in Data Center revenue.
Allocation effect was a drag on relative performance, primarily due to overweight positions in the Consumer Staples and Financials sectors. The Fund’s active weight constraints helped reduce exposure to market volatility and sentiment shifts. |
How did the Fund perform over the past 10 years?
The chart below represents the historical performance of a hypothetical $10,000 investment over the past 10 years in the class of shares noted and assumes the reinvestment of dividends and capital gains and the maximum sales charge, if any. Fund expenses, including management fees, 12b-1 fees, if any, and other expenses were deducted.
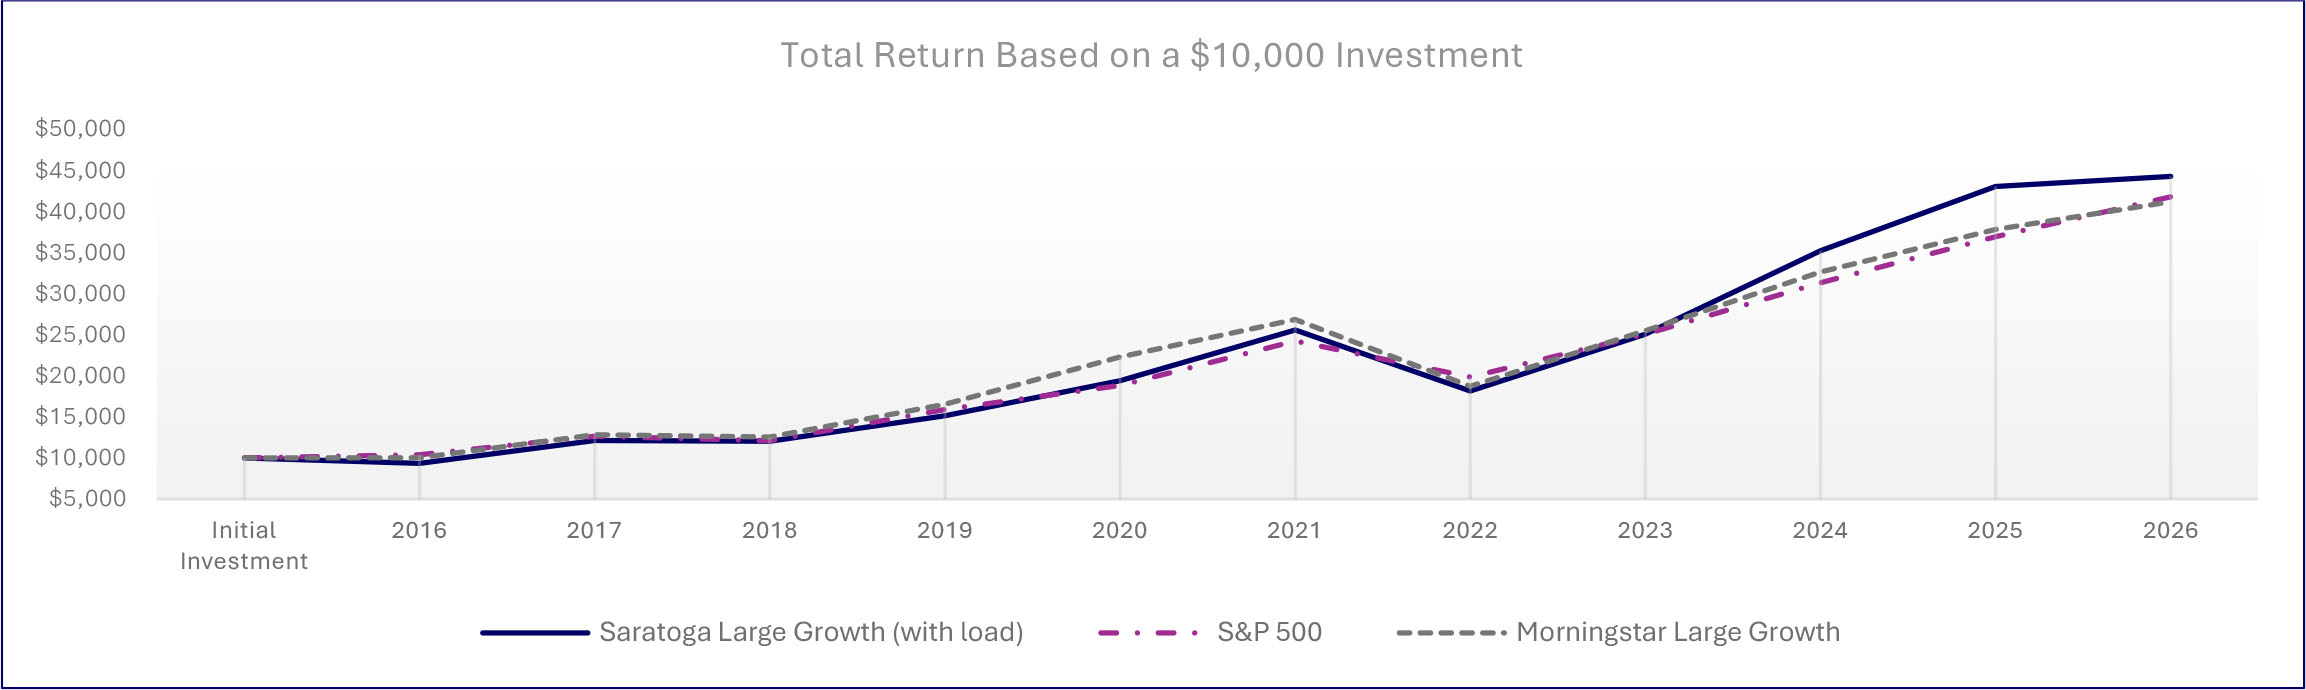
| Average Annual Total Returns | |||
| 1 Year | 5 Years | 10 Years | |
| Saratoga Large Capitalization Growth Fund, Class A (with load) | 4.17% | 11.50% | 16.04% |
| Saratoga Large Capitalization Growth Fund, Class A | 10.54% | 12.83% | 16.73% |
| S&P 500® Index | 20.38% | 12.79% | 15.37% |
| Morningstar US Fund Large Growth Category | 14.28% | 9.22% | 15.87% |
| Fund Statistics | |||
| Total Net Assets | $34,899,657 | Advisory Fees Paid by the Fund | $241,497 |
| Number of Portfolio Holdings | 57 | Portfolio Turnover Rate | 76% |
What did the Fund invest in (as a % of the Fund’s net assets)?
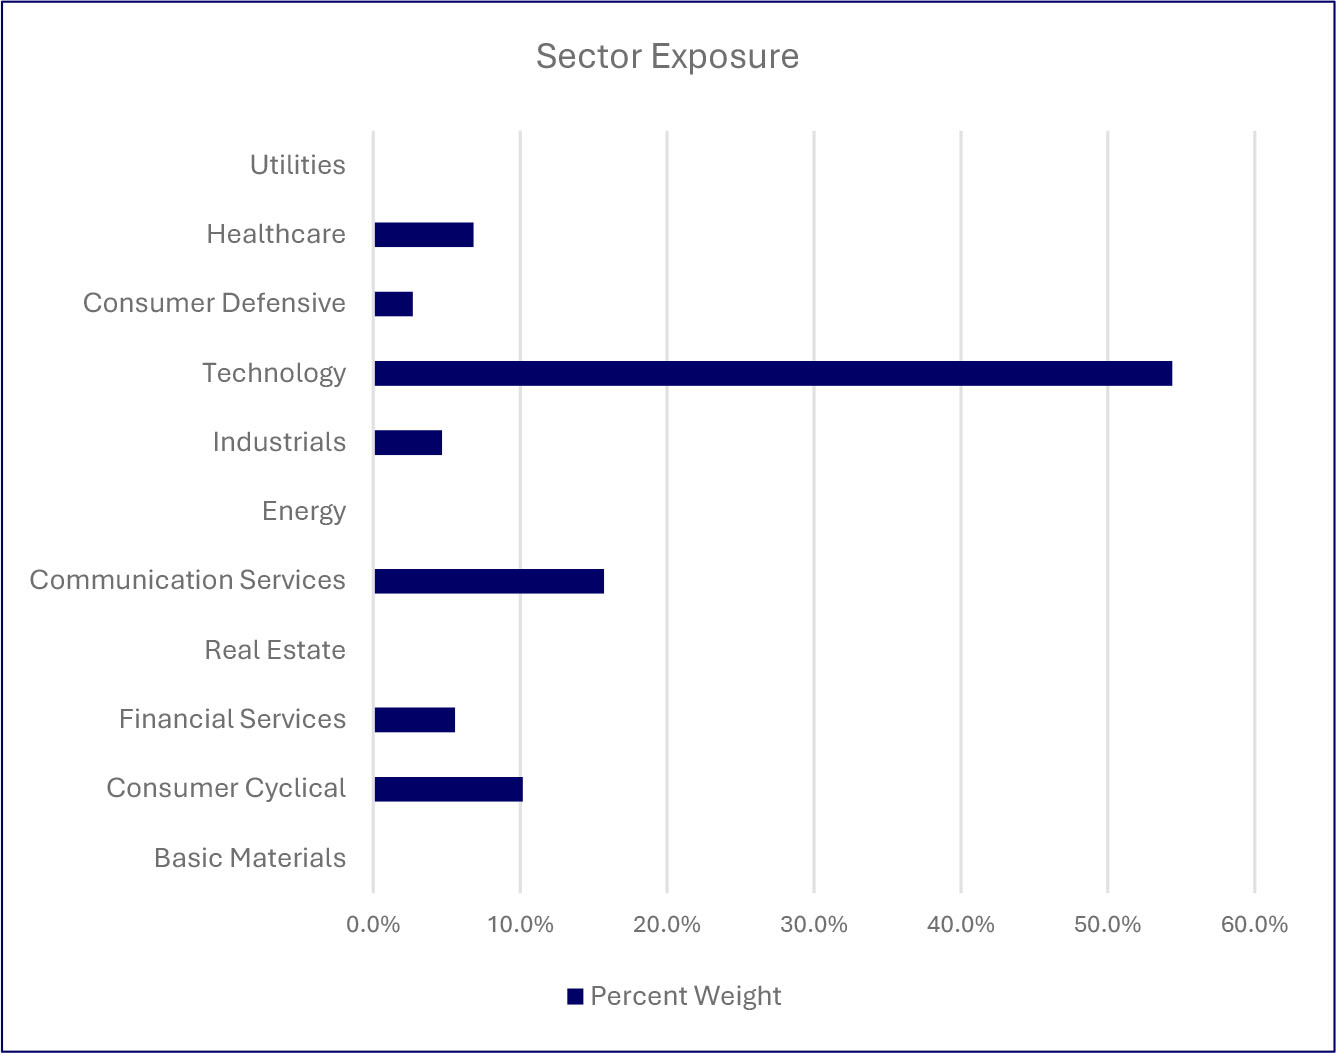
| Top Holdings (%) | |
| NVIDIA Corp | |
| Microsoft Corp | |
| Alphabet Inc, Class A | |
| Alphabet Inc, Class C | |
| Apple Inc | |
| Broadcom, Inc | |
| Roku, Inc | |
| Amazon.com, Inc | |
| Arista Networks, Inc | |
| Airbnb, Inc Class A | |
| Material Fund changes during the period. |
| Below is a summary of certain changes, and planned changes, to the Fund during the reporting period. For more complete information, you may review the Fund’s next prospectus, which we expect to be available by December 31, 2026, at www.saratogacap.com/fund-reports or upon request at 1-888-672-4839. |
| During the period there were no material changes to the Fund. |
| What were the Fund’s costs for the last year (based on a hypothetical $10,000 investment)? | ||
| Fund | Costs of a $10,000 Investment | Costs paid as a % of a $10,000 Investment |
| Saratoga Large Capitalization Growth Fund, Class C | $292 | 2.79% |
| What affected the Fund’s performance during this period? |
|
The Fund’s positive returns were largely driven by stock selection in the Information Technology sector. Industrials and Communication Services holdings also made meaningful positive contributions. The Consumer Staples and Health Care sectors were the only sectors with negative stock selection of note.
From a stock selection perspective, Lumentum Holdings was the top contributor; the optical components supplier reported strong revenue growth driven by accelerating demand for data-center optical products used in AI infrastructure. Dell Technologies was the second largest contributor; the computer hardware manufacturer reported strong revenue growth supported by record AI server demand.
Due to threshold limits, the Fund held a significant underweight position in mega-cap technology stocks, which was a headwind to relative performance. Out of Fund holdings, Atlassian had the biggest negative impact; although its quarterly results exceeded expectations, shares fell sharply after management pointed to slower near-term cloud growth and an expected deceleration in Data Center revenue.
Allocation effect was a drag on relative performance, primarily due to overweight positions in the Consumer Staples and Financials sectors. The Fund’s active weight constraints helped reduce exposure to market volatility and sentiment shifts. |
How did the Fund perform over the past 10 years?
The chart below represents the historical performance of a hypothetical $10,000 investment over the past 10 years in the class of shares noted and assumes the reinvestment of dividends and capital gains and the maximum sales charge, if any. Fund expenses, including management fees, 12b-1 fees, if any, and other expenses were deducted.
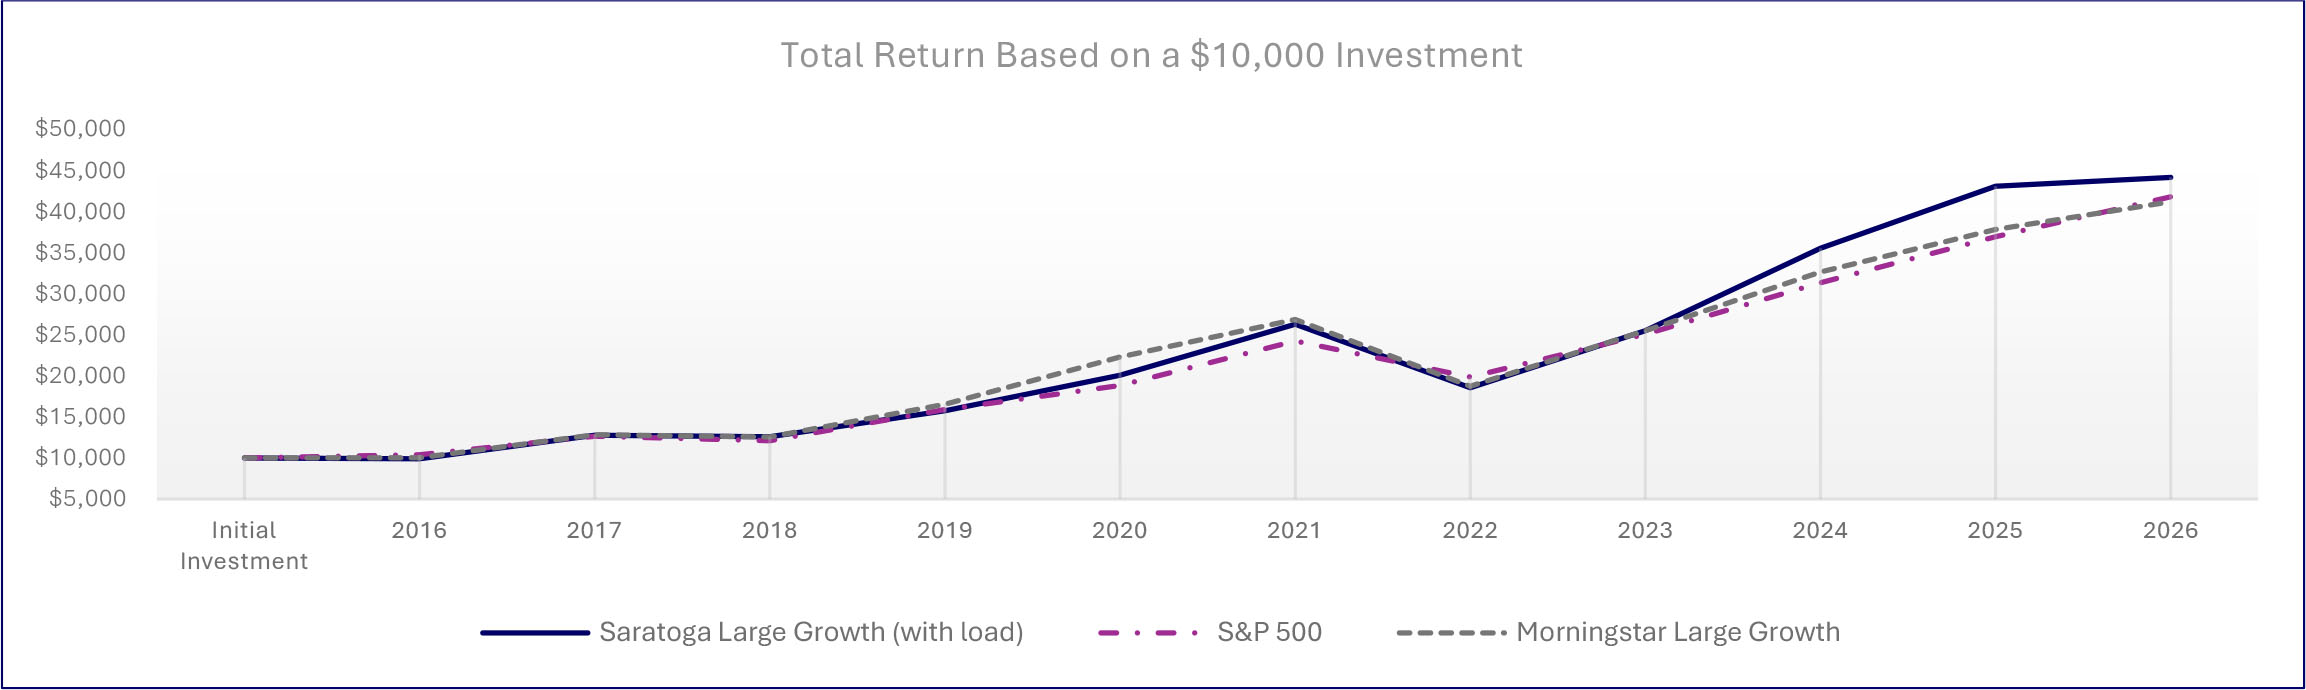
| Average Annual Total Returns | |||
| 1 Year | 5 Years | 10 Years | |
| Saratoga Large Capitalization Growth Fund, Class C (with load) | 8.58% | 12.11% | 16.01% |
| Saratoga Large Capitalization Growth Fund, Class C | 9.58% | 12.11% | 16.01% |
| S&P 500® Index | 20.38% | 12.79% | 15.37% |
| Morningstar US Fund Large Growth Category | 14.28% | 9.22% | 15.87% |
| Fund Statistics | |||
| Total Net Assets | $34,899,657 | Advisory Fees Paid by the Fund | $241,497 |
| Number of Portfolio Holdings | 57 | Portfolio Turnover Rate | 76% |
What did the Fund invest in (as a % of the Fund’s net assets)?
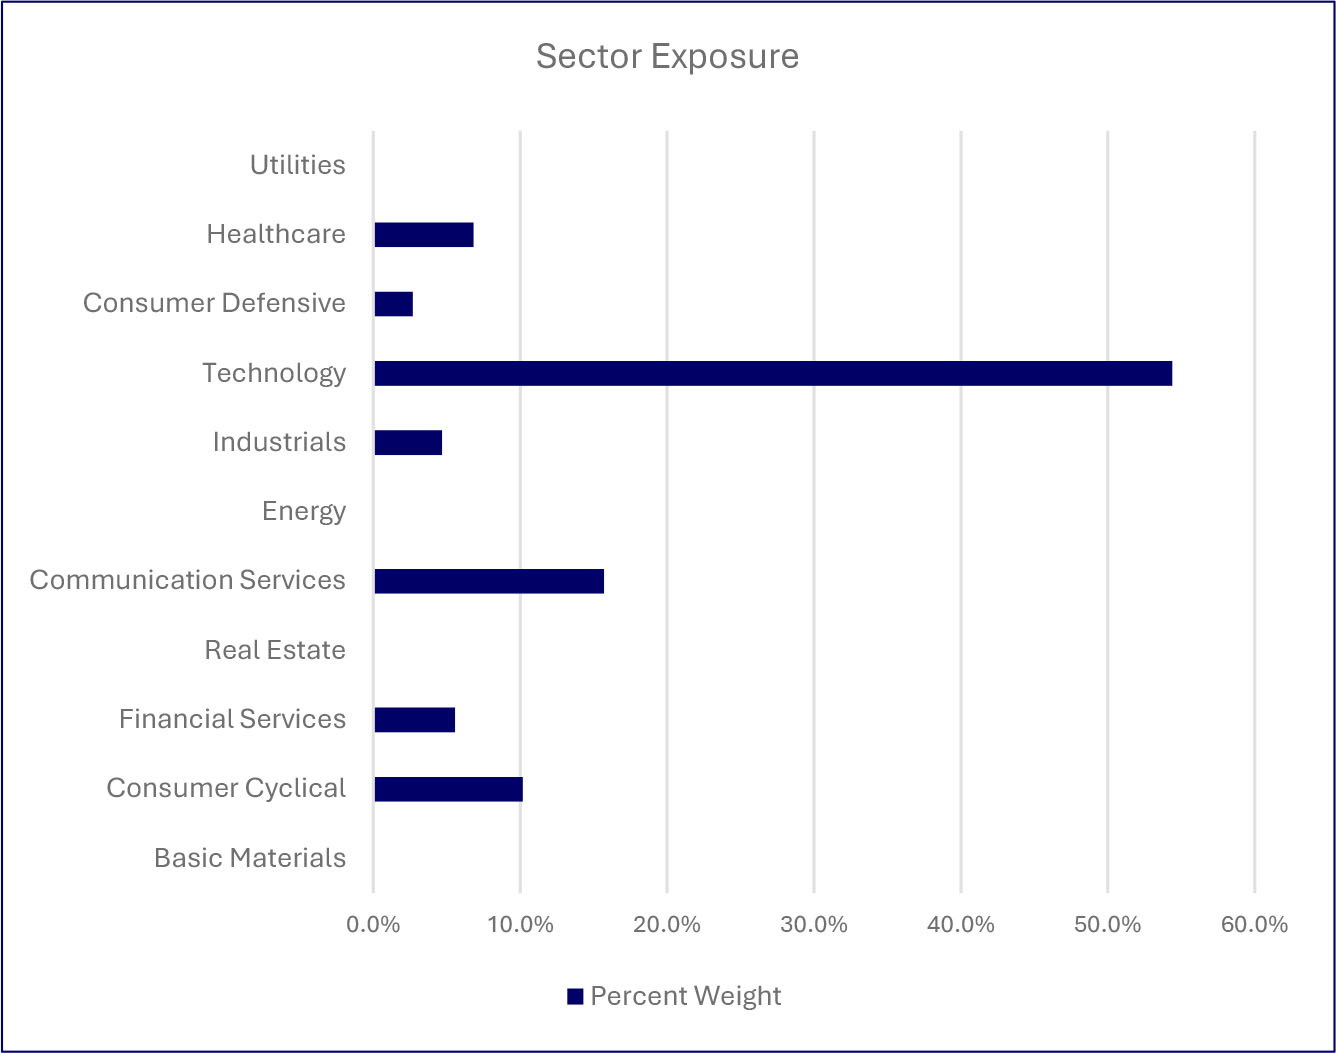
| Top Holdings (%) | |
| NVIDIA Corp | |
| Microsoft Corp | |
| Alphabet Inc, Class A | |
| Alphabet Inc, Class C | |
| Apple Inc | |
| Broadcom, Inc | |
| Roku, Inc | |
| Amazon.com, Inc | |
| Arista Networks, Inc | |
| Airbnb, Inc Class A | |
| Material Fund changes during the period. |
| Below is a summary of certain changes, and planned changes, to the Fund during the reporting period. For more complete information, you may review the Fund’s next prospectus, which we expect to be available by December 31, 2026, at www.saratogacap.com/fund-reports or upon request at 1-888-672-4839. |
| During the period there were no material changes to the Fund. |
| What were the Fund’s costs for the last year (based on a hypothetical $10,000 investment)? | ||
| Fund | Costs of a $10,000 Investment | Costs paid as a % of a $10,000 Investment |
| Saratoga Large Capitalization Growth Fund, Class I | $190 | 1.80% |
| What affected the Fund’s performance during this period? |
|
The Fund’s positive returns were largely driven by stock selection in the Information Technology sector. Industrials and Communication Services holdings also made meaningful positive contributions. The Consumer Staples and Health Care sectors were the only sectors with negative stock selection of note.
From a stock selection perspective, Lumentum Holdings was the top contributor; the optical components supplier reported strong revenue growth driven by accelerating demand for data-center optical products used in AI infrastructure. Dell Technologies was the second largest contributor; the computer hardware manufacturer reported strong revenue growth supported by record AI server demand.
Due to threshold limits, the Fund held a significant underweight position in mega-cap technology stocks, which was a headwind to relative performance. Out of Fund holdings, Atlassian had the biggest negative impact; although its quarterly results exceeded expectations, shares fell sharply after management pointed to slower near-term cloud growth and an expected deceleration in Data Center revenue.
Allocation effect was a drag on relative performance, primarily due to overweight positions in the Consumer Staples and Financials sectors. The Fund’s active weight constraints helped reduce exposure to market volatility and sentiment shifts. |
How did the Fund perform over the past 10 years?
The chart below represents the historical performance of a hypothetical $10,000 investment over the past 10 years in the class of shares noted and assumes the reinvestment of dividends and capital gains and the maximum sales charge, if any. Fund expenses, including management fees, 12b-1 fees, if any, and other expenses were deducted.
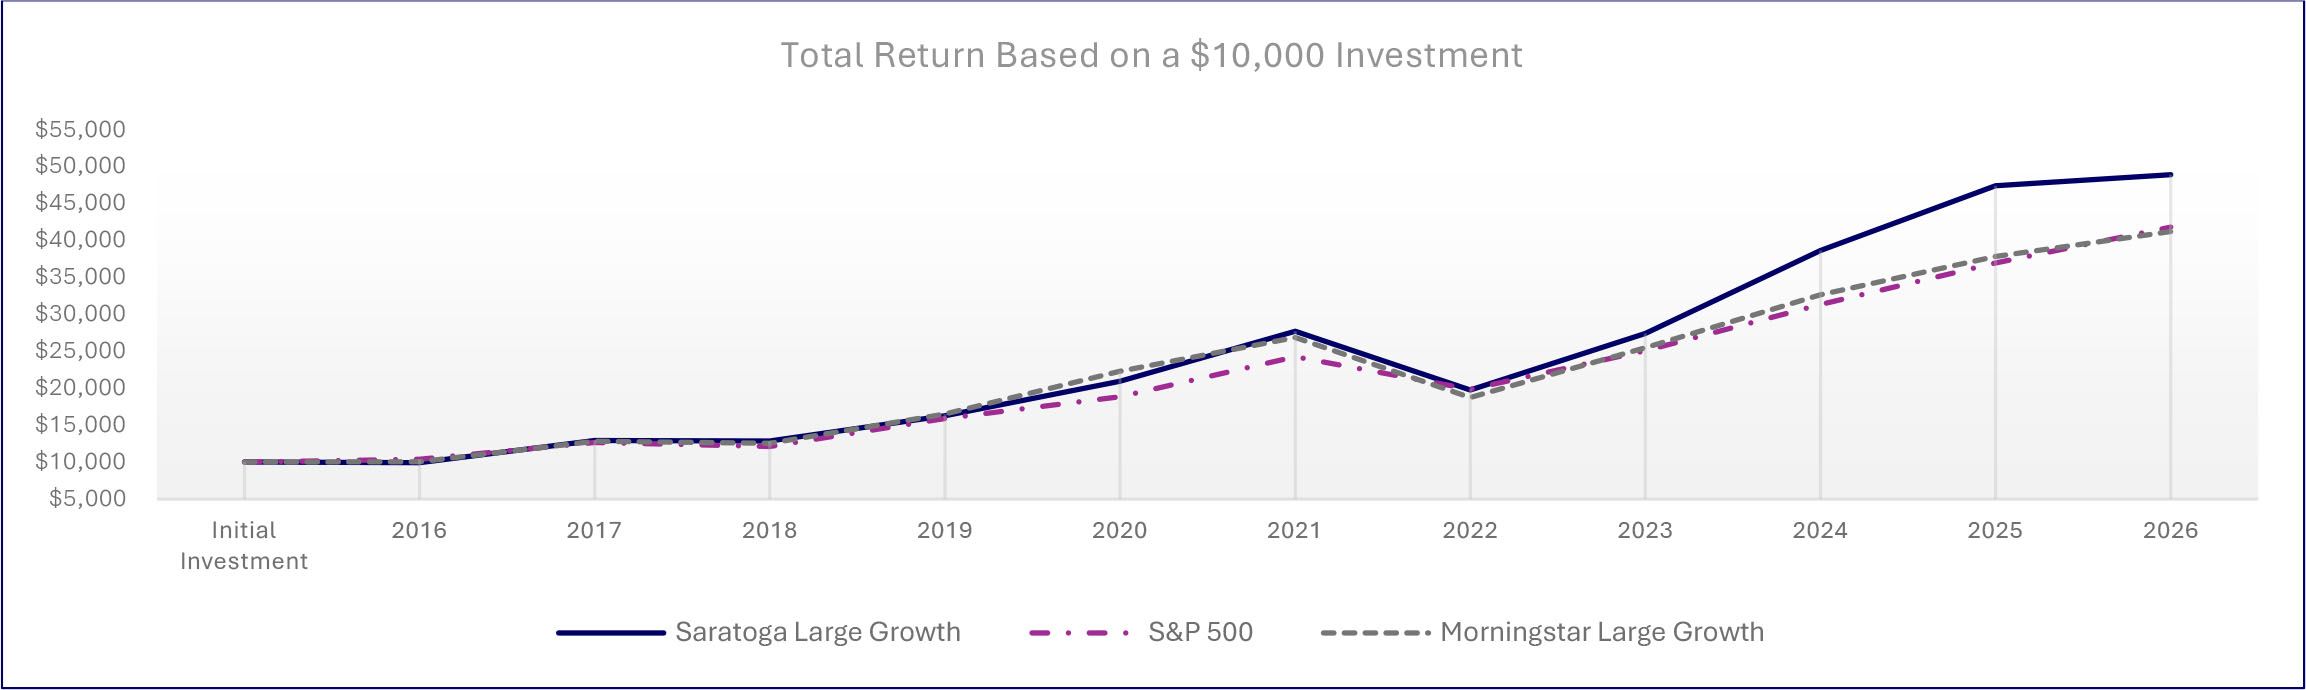
| Average Annual Total Returns | |||
| 1 Year | 5 Years | 10 Years | |
| Saratoga Large Capitalization Growth Fund, Class I | 10.97% | 13.28% | 17.20% |
| S&P 500® Index | 20.38% | 12.79% | 15.37% |
| Morningstar US Fund Large Growth Category | 14.28% | 9.22% | 15.87% |
| Fund Statistics | |||
| Total Net Assets | $34,899,657 | Advisory Fees Paid by the Fund | $241,497 |
| Number of Portfolio Holdings | 57 | Portfolio Turnover Rate | 76% |
What did the Fund invest in (as a % of the Fund’s net assets)?
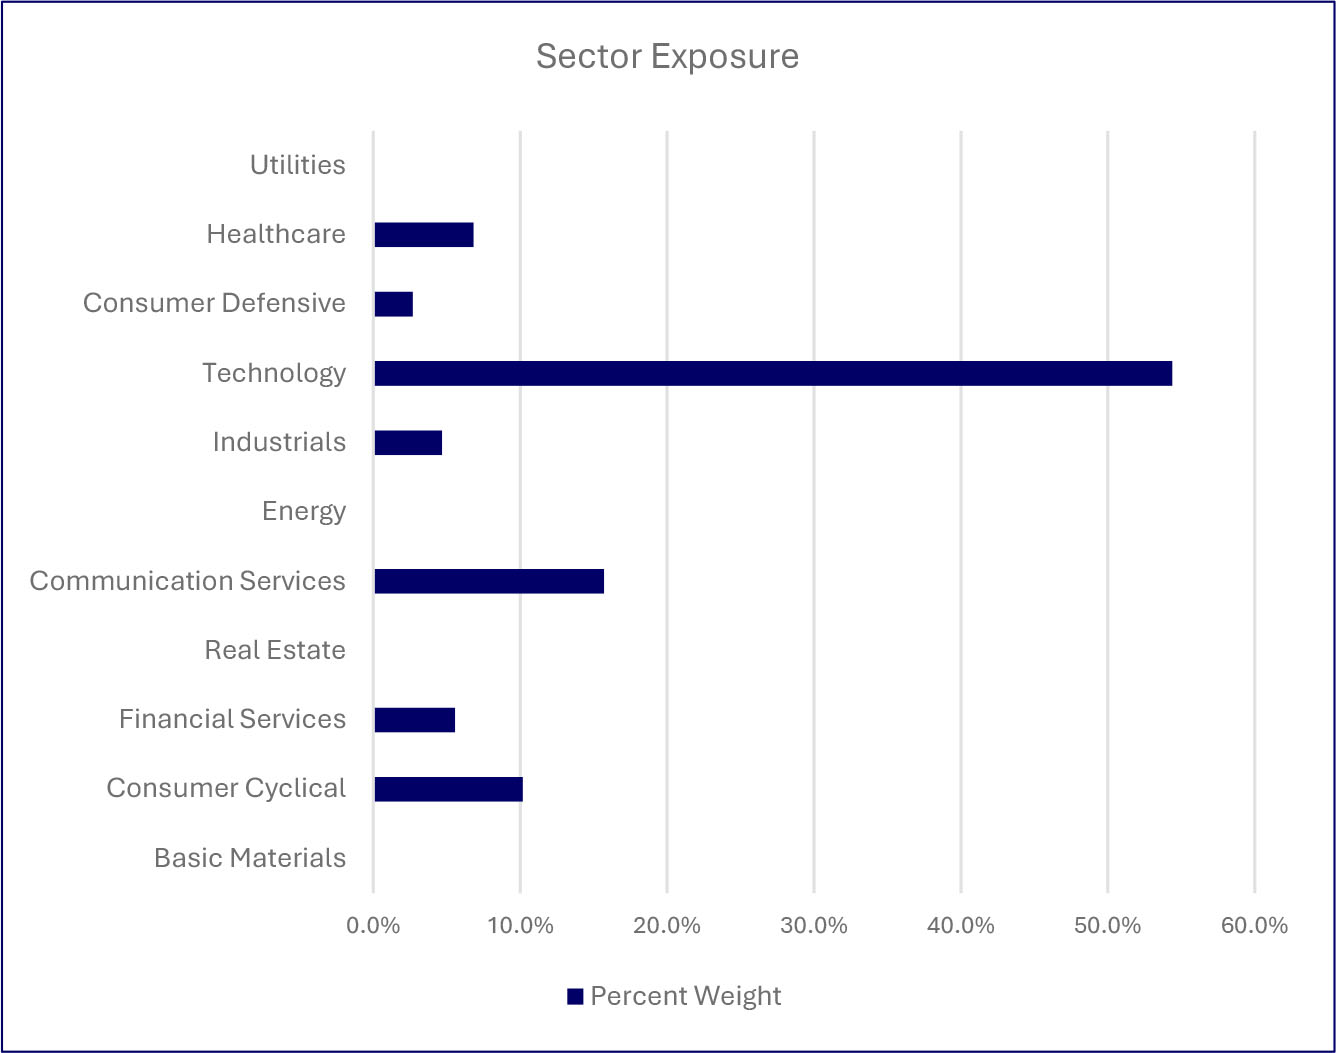
| Top Holdings (%) | |
| NVIDIA Corp | |
| Microsoft Corp | |
| Alphabet Inc, Class A | |
| Alphabet Inc, Class C | |
| Apple Inc | |
| Broadcom, Inc | |
| Roku, Inc | |
| Amazon.com, Inc | |
| Arista Networks, Inc | |
| Airbnb, Inc Class A | |
| Material Fund changes during the period. |
| Below is a summary of certain changes, and planned changes, to the Fund during the reporting period. For more complete information, you may review the Fund’s next prospectus, which we expect to be available by December 31, 2026, at www.saratogacap.com/fund-reports or upon request at 1-888-672-4839. |
| During the period there were no material changes to the Fund. |
| What were the Fund’s costs for the last year (based on a hypothetical $10,000 investment)? | ||
| Fund | Costs of a $10,000 Investment | Costs paid as a % of a $10,000 Investment |
| Saratoga Mid Capitalization Fund, Class A | $305 | 2.84% |
| What affected the Fund’s performance this period? |
|
During the period, stock selection in Information Technology was the largest contributor to performance, with Marvell Technology as the
top name. Underweight positions in Communication Services and Real Estate, both underperforming sectors, also contributed, as did stock
selection within Consumer Staples, led by Dollar General.
The greatest detractor was stock selection in Industrials, with Trex Company as the weakest name. Security selection within Financials also detracted, led by Robinhood Markets. Selection and an overweight position in Consumer Discretionary, an underperforming sector, weighed on performance, with AutoZone as the largest drag, as did selection and an overweight position in Utilities, where CMS Energy was the largest detractor. Selection within Health Care (IQVIA Holdings), Materials (Vulcan Materials) and Energy (Baker Hughes) also detracted. |
How did the Fund perform over the past 10 years?
The chart below represents the historical performance of a hypothetical $10,000 investment over the past 10 years in the class of shares noted and assumes the reinvestment of dividends and capital gains and the maximum sales charge, if any. Fund expenses, including management fees, 12b-1 fees, if any, and other expenses were deducted.
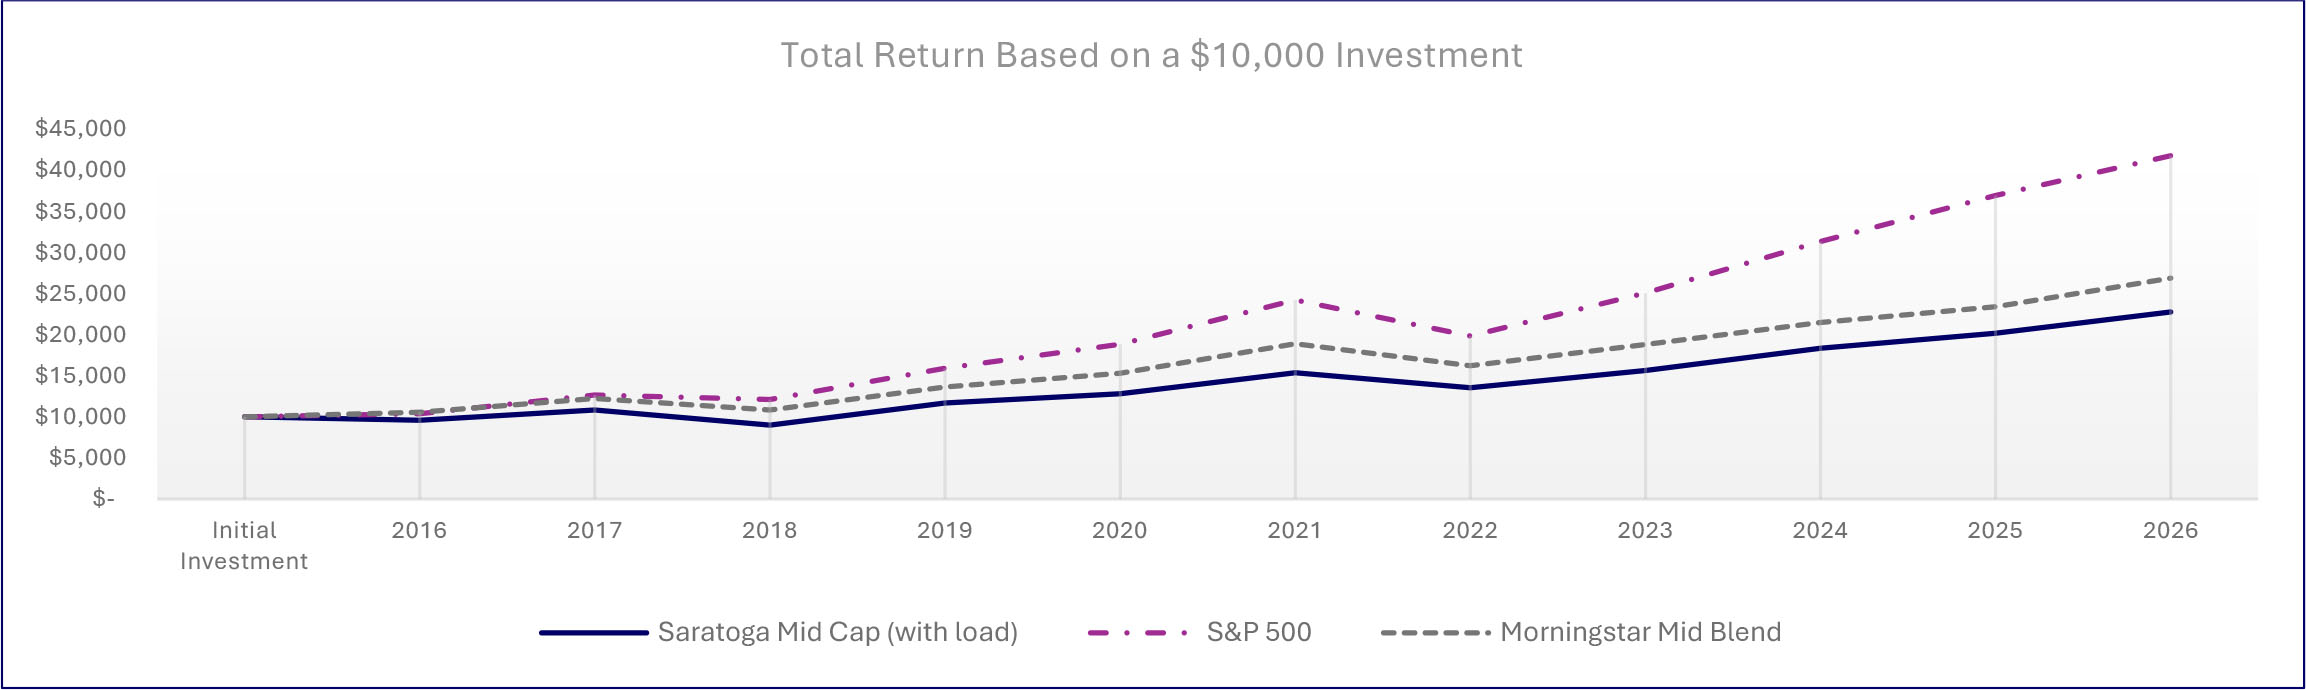
| Average Annual Total Returns | |||
| 1 Year | 5 Years | 10 Years | |
| Saratoga Mid Capitalization Fund, Class A (with load) | 8.23% | 7.28% | 8.58% |
| Saratoga Mid Capitalization Fund, Class A | 14.83% | 8.56% | 9.22% |
| S&P 500® Index | 20.38% | 12.79% | 15.37% |
| Morningstar US Fund Mid Capitalization Blend Category | 17.07% | 7.89% | 10.88% |
| Fund Statistics | |||
| Total Net Assets | $10,497,953 | Advisory Fees Paid by the Fund | $81,607 |
| Number of Portfolio Holdings | 66 | Portfolio Turnover Rate | 126% |
What did the Fund invest in (as a % of the Fund’s net assets)?
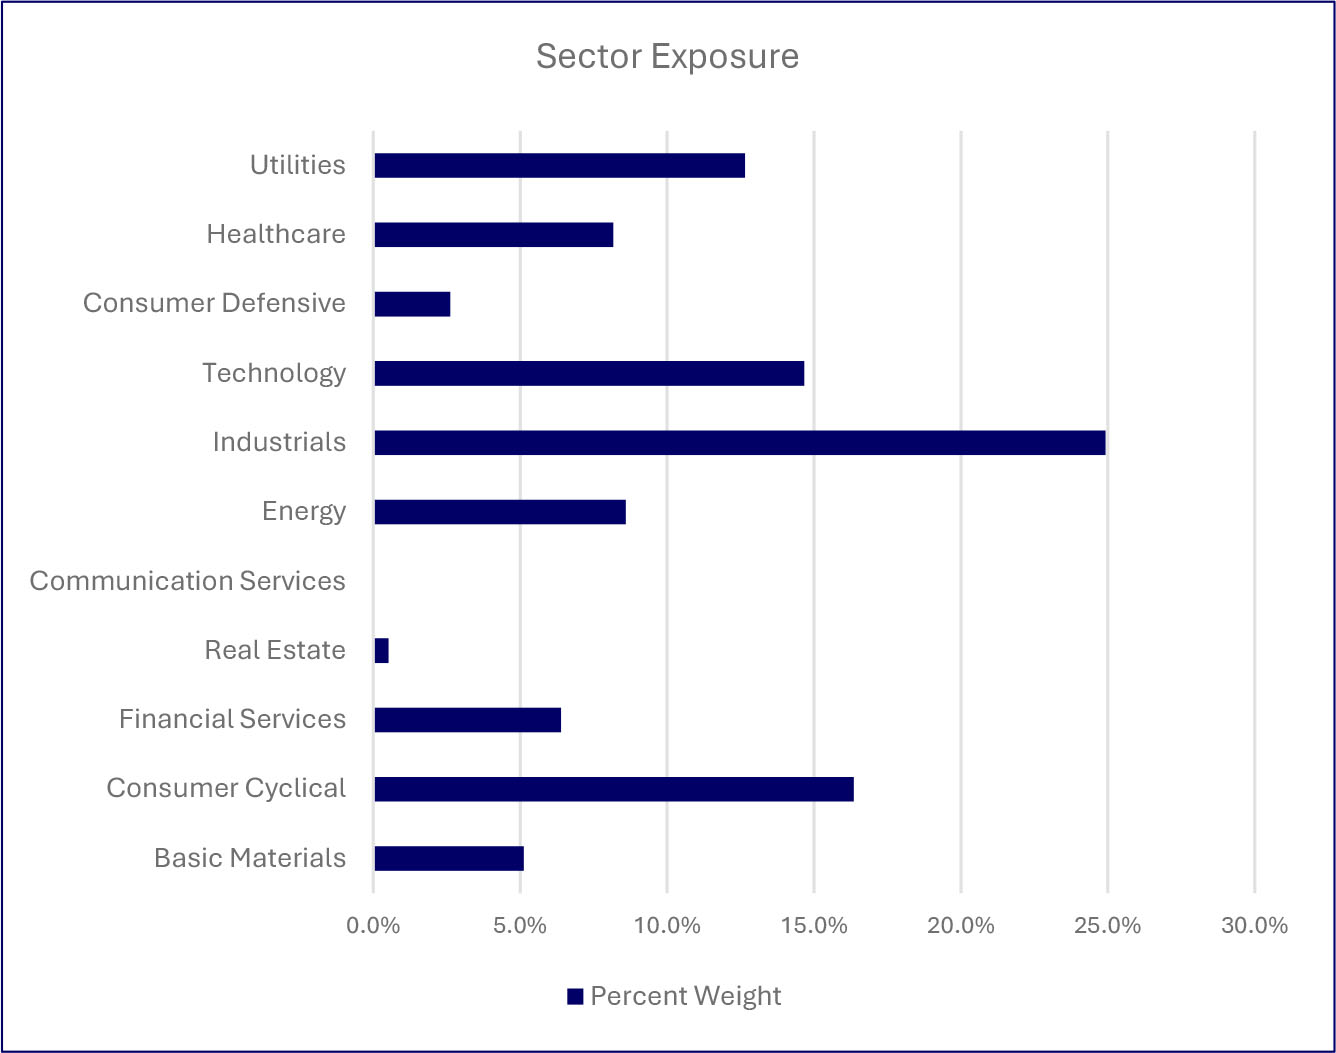
| Top Holdings (%) | |
| Dreyfus Inst Prefer Govt Money Mkt Inst Class | |
| Alliant Energy Corp | |
| Baker Hughes Company | |
| CMS Energy Corp | |
| SLB Ltd | |
| WEC Energy Group, Inc | |
| Evergy, Inc | |
| AutoZone, Inc | |
| Dollar General Corp | |
| Vulcan Materials Company | |
| Material Fund changes during the period. |
| Below is a summary of certain changes, and planned changes, to the Fund during the reporting period. For more complete information, you may review the Fund’s next prospectus, which we expect to be available by December 31, 2026, at www.saratogacap.com/fund-reports or upon request at 1-888-672-4839. |
| During the period there were no material changes to the Fund. |
| What were the Fund’s costs for the last year (based on a hypothetical $10,000 investment)? | ||
| Fund | Costs of a $10,000 Investment | Costs paid as a % of a $10,000 Investment |
| Saratoga Mid Capitalization Fund, Class C | $365 | 3.41% |
| What affected the Fund’s performance this period? |
|
During the period, stock selection in Information Technology was the largest contributor to performance, with Marvell Technology as the
top name. Underweight positions in Communication Services and Real Estate, both underperforming sectors, also contributed, as did stock
selection within Consumer Staples, led by Dollar General.
The greatest detractor was stock selection in Industrials, with Trex Company as the weakest name. Security selection within Financials also detracted, led by Robinhood Markets. Selection and an overweight position in Consumer Discretionary, an underperforming sector, weighed on performance, with AutoZone as the largest drag, as did selection and an overweight position in Utilities, where CMS Energy was the largest detractor. Selection within Health Care (IQVIA Holdings), Materials (Vulcan Materials) and Energy (Baker Hughes) also detracted. |
How did the Fund perform over the past 10 years?
The chart below represents the historical performance of a hypothetical $10,000 investment over the past 10 years in the class of shares noted and assumes the reinvestment of dividends and capital gains and the maximum sales charge, if any. Fund expenses, including management fees, 12b-1 fees, if any, and other expenses were deducted.
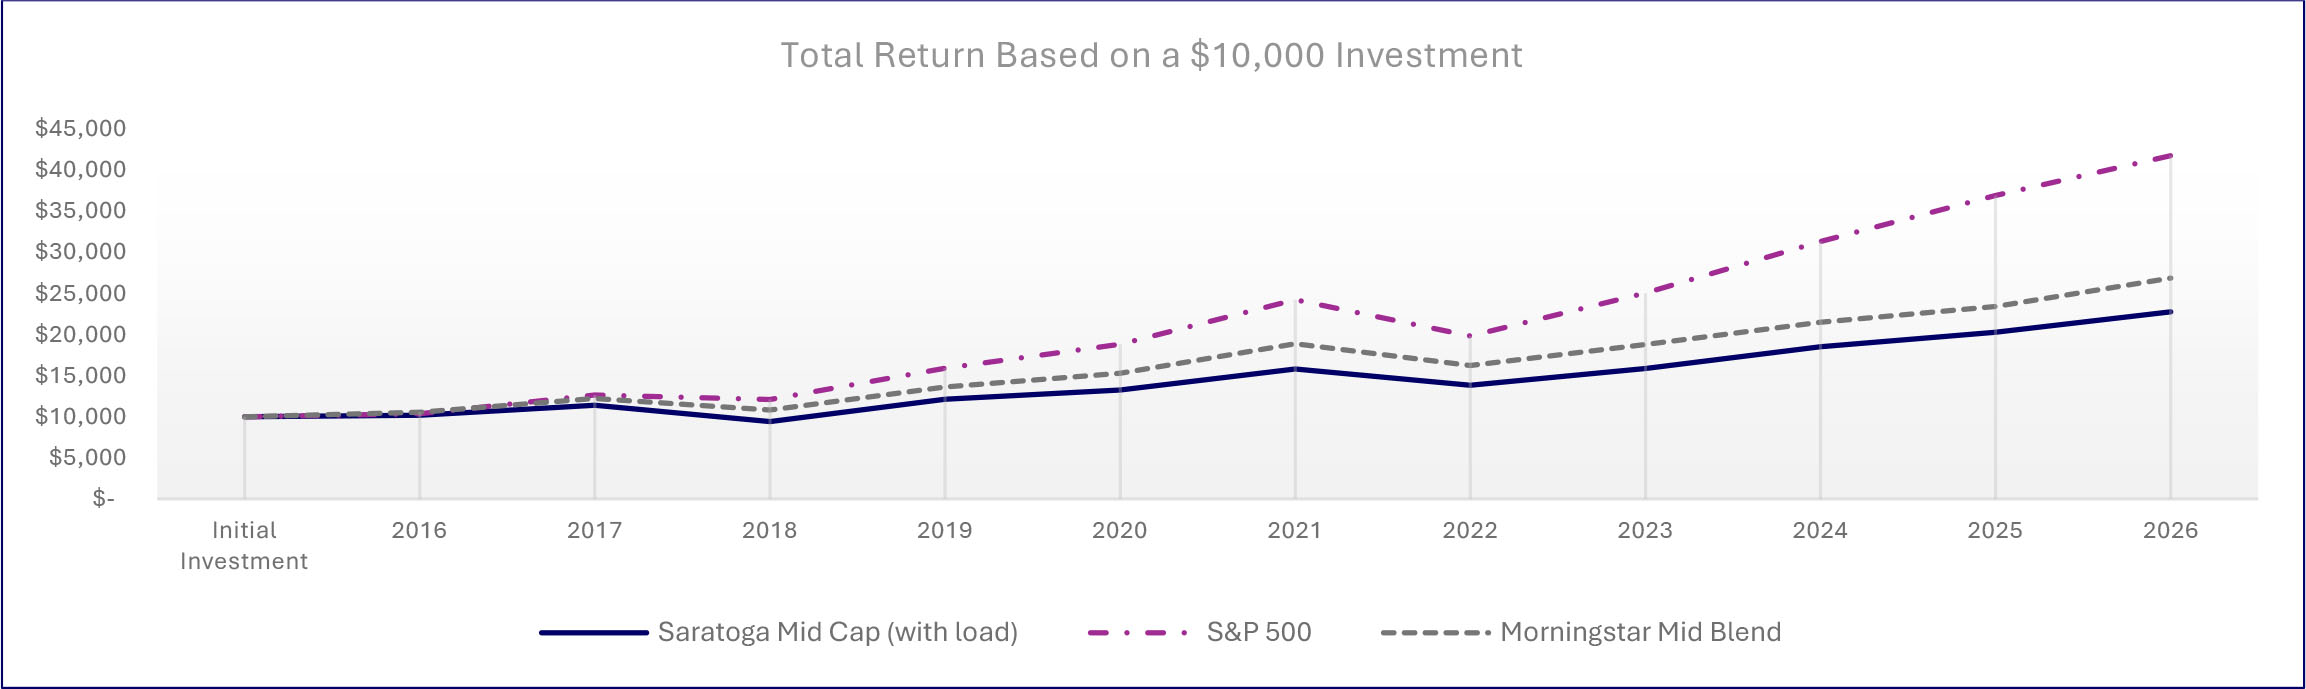
| Average Annual Total Returns | |||
| 1 Year | 5 Years | 10 Years | |
| Saratoga Mid Capitalization Fund, Class C (with load) | 13.05% | 7.92% | 8.58% |
| Saratoga Mid Capitalization Fund, Class C | 14.05% | 7.92% | 8.58% |
| S&P 500® Index | 20.38% | 12.79% | 15.37% |
| Morningstar US Fund Mid Capitalization Blend Category | 17.07% | 7.89% | 10.88% |
| Fund Statistics | |||
| Total Net Assets | $10,497,953 | Advisory Fees Paid by the Fund | $81,607 |
| Number of Portfolio Holdings | 66 | Portfolio Turnover Rate | 126% |
What did the Fund invest in (as a % of the Fund’s net assets)?
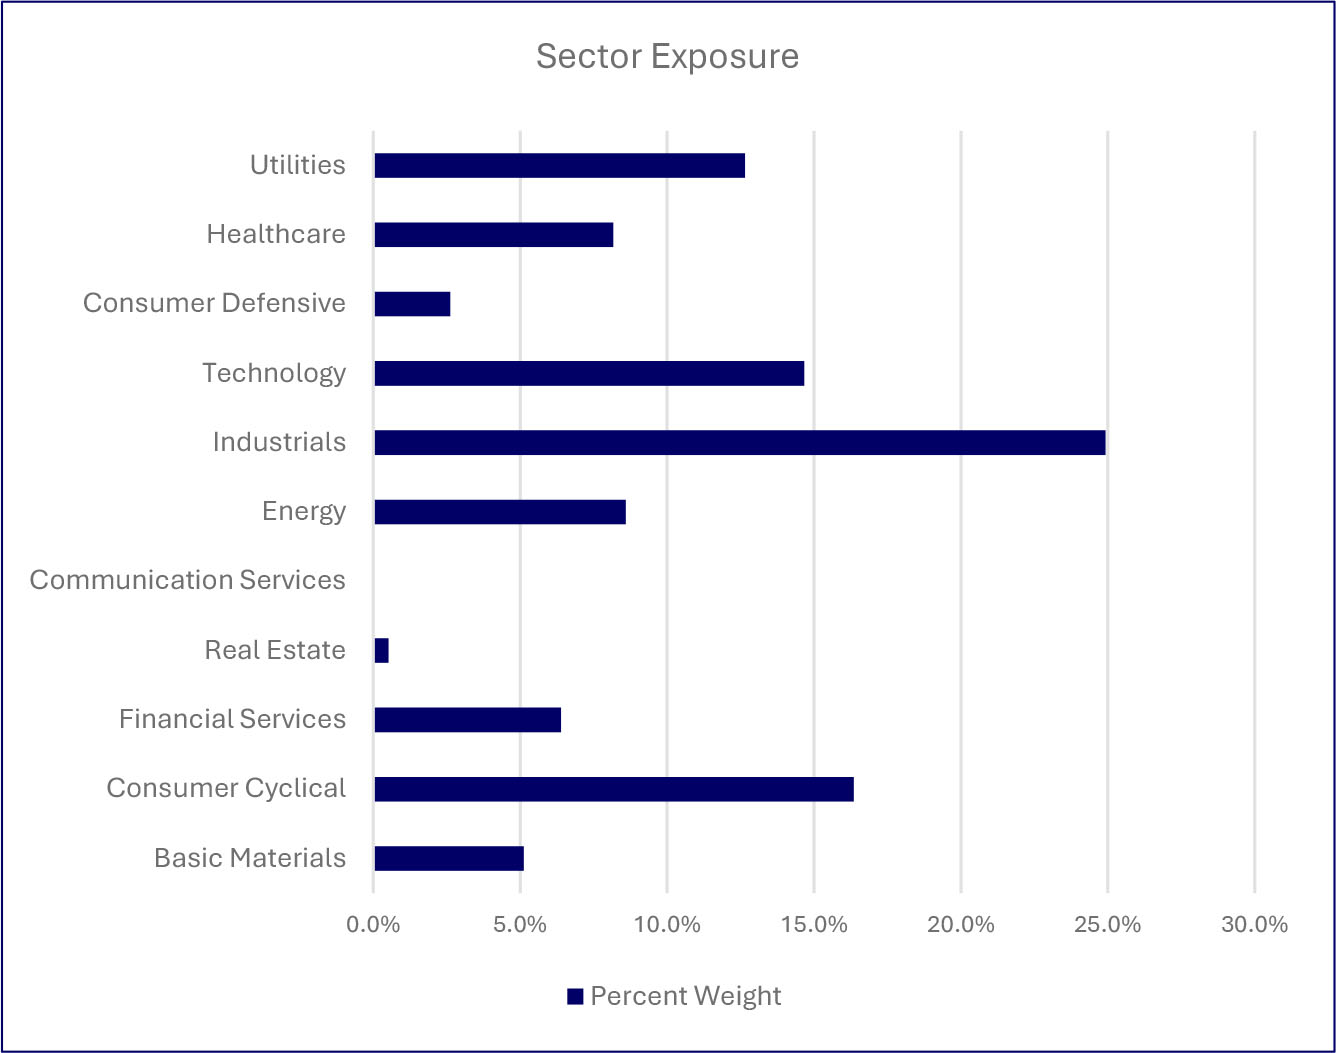
| Top Holdings (%) | |
| Dreyfus Inst Prefer Govt Money Mkt Inst Class | |
| Alliant Energy Corp | |
| Baker Hughes Company | |
| CMS Energy Corp | |
| SLB Ltd | |
| WEC Energy Group, Inc | |
| Evergy, Inc | |
| AutoZone, Inc | |
| Dollar General Corp | |
| Vulcan Materials Company | |
| Material Fund changes during the period. |
| Below is a summary of certain changes, and planned changes, to the Fund during the reporting period. For more complete information, you may review the Fund’s next prospectus, which we expect to be available by December 31, 2026, at www.saratogacap.com/fund-reports or upon request at 1-888-672-4839. |
| During the period there were no material changes to the Fund. |
| What were the Fund’s costs for the last year (based on a hypothetical $10,000 investment)? | ||
| Fund | Costs of a $10,000 Investment | Costs paid as a % of a $10,000 Investment |
| Saratoga Mid Capitalization Fund, Class I | $264 | 2.45% |
| What affected the Fund’s performance this period? |
|
During the period, stock selection in Information Technology was the largest contributor to performance, with Marvell Technology as the
top name. Underweight positions in Communication Services and Real Estate, both underperforming sectors, also contributed, as did stock
selection within Consumer Staples, led by Dollar General.
The greatest detractor was stock selection in Industrials, with Trex Company as the weakest name. Security selection within Financials also detracted, led by Robinhood Markets. Selection and an overweight position in Consumer Discretionary, an underperforming sector, weighed on performance, with AutoZone as the largest drag, as did selection and an overweight position in Utilities, where CMS Energy was the largest detractor. Selection within Health Care (IQVIA Holdings), Materials (Vulcan Materials) and Energy (Baker Hughes) also detracted. |
How did the Fund perform over the past 10 years?
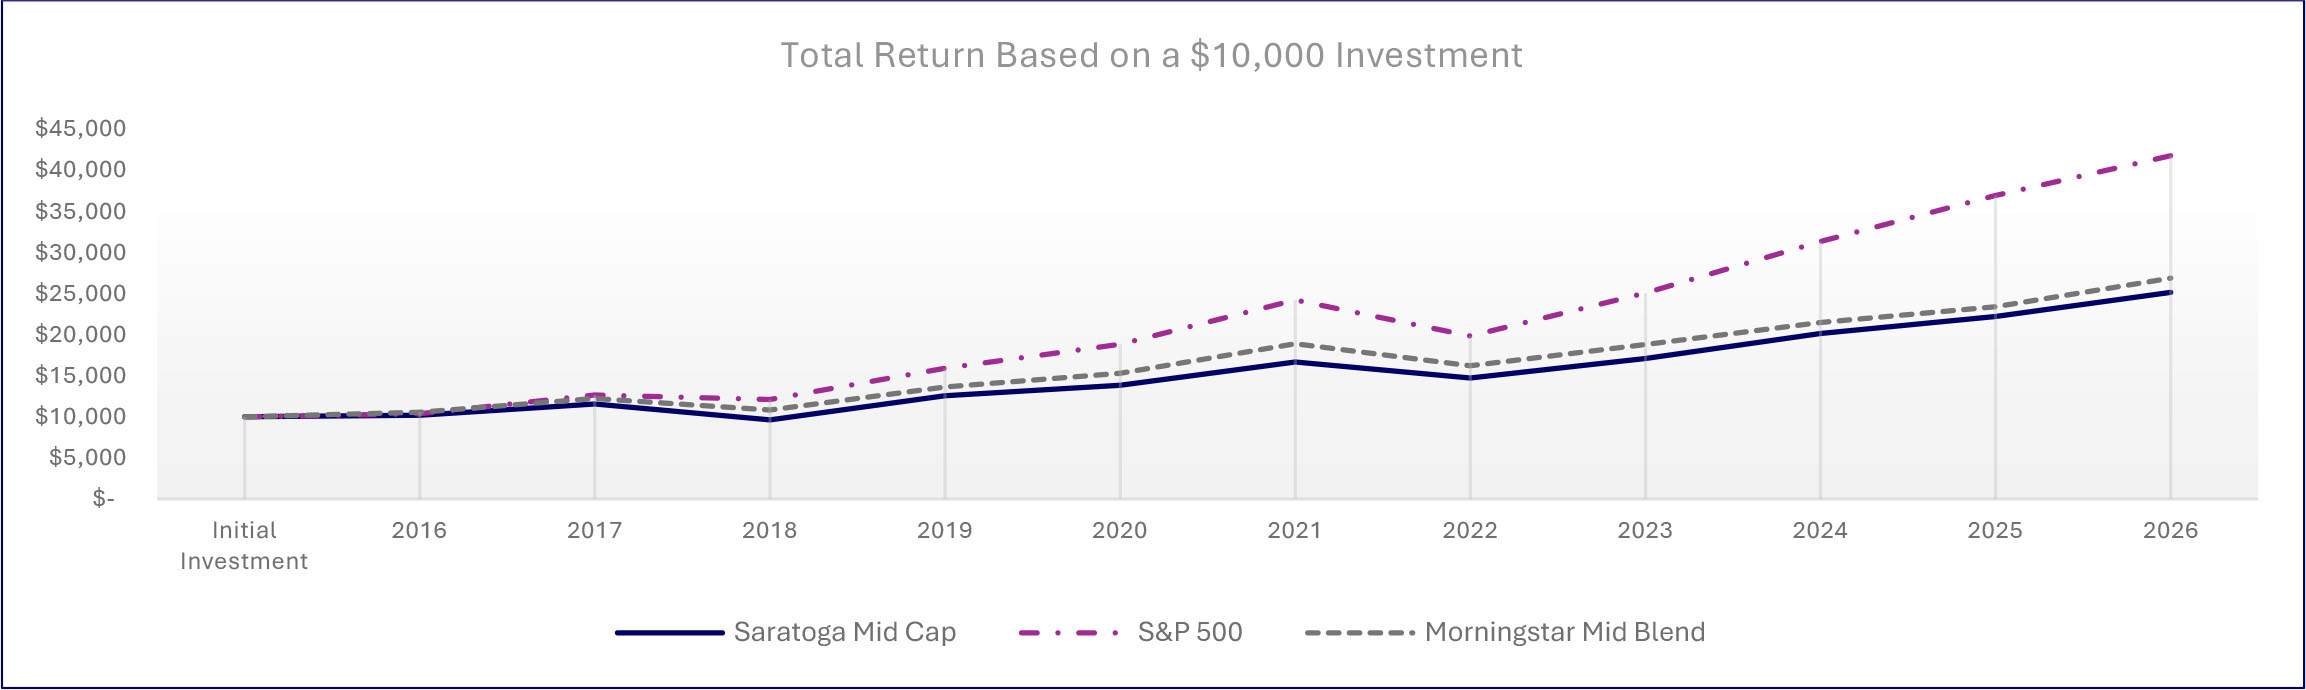
The chart below represents the historical performance of a hypothetical $10,000 investment over the past 10 years in the class of shares noted and assumes the reinvestment of dividends and capital gains and the maximum sales charge, if any. Fund expenses, including management fees, 12b-1 fees, if any, and other expenses were deducted.
| Average Annual Total Returns | |||
| 1 Year | 5 Years | 10 Years | |
| Saratoga Mid Capitalization Fund, Class I | 15.25% | 8.99% | 9.66% |
| S&P 500® Index | 20.38% | 12.79% | 15.37% |
| Morningstar US Fund Mid Capitalization Blend Category | 17.07% | 7.89% | 10.88% |
| Fund Statistics | |||
| Total Net Assets | $10,497,953 | Advisory Fees Paid by the Fund | $81,607 |
| Number of Portfolio Holdings | 66 | Portfolio Turnover Rate | 126% |
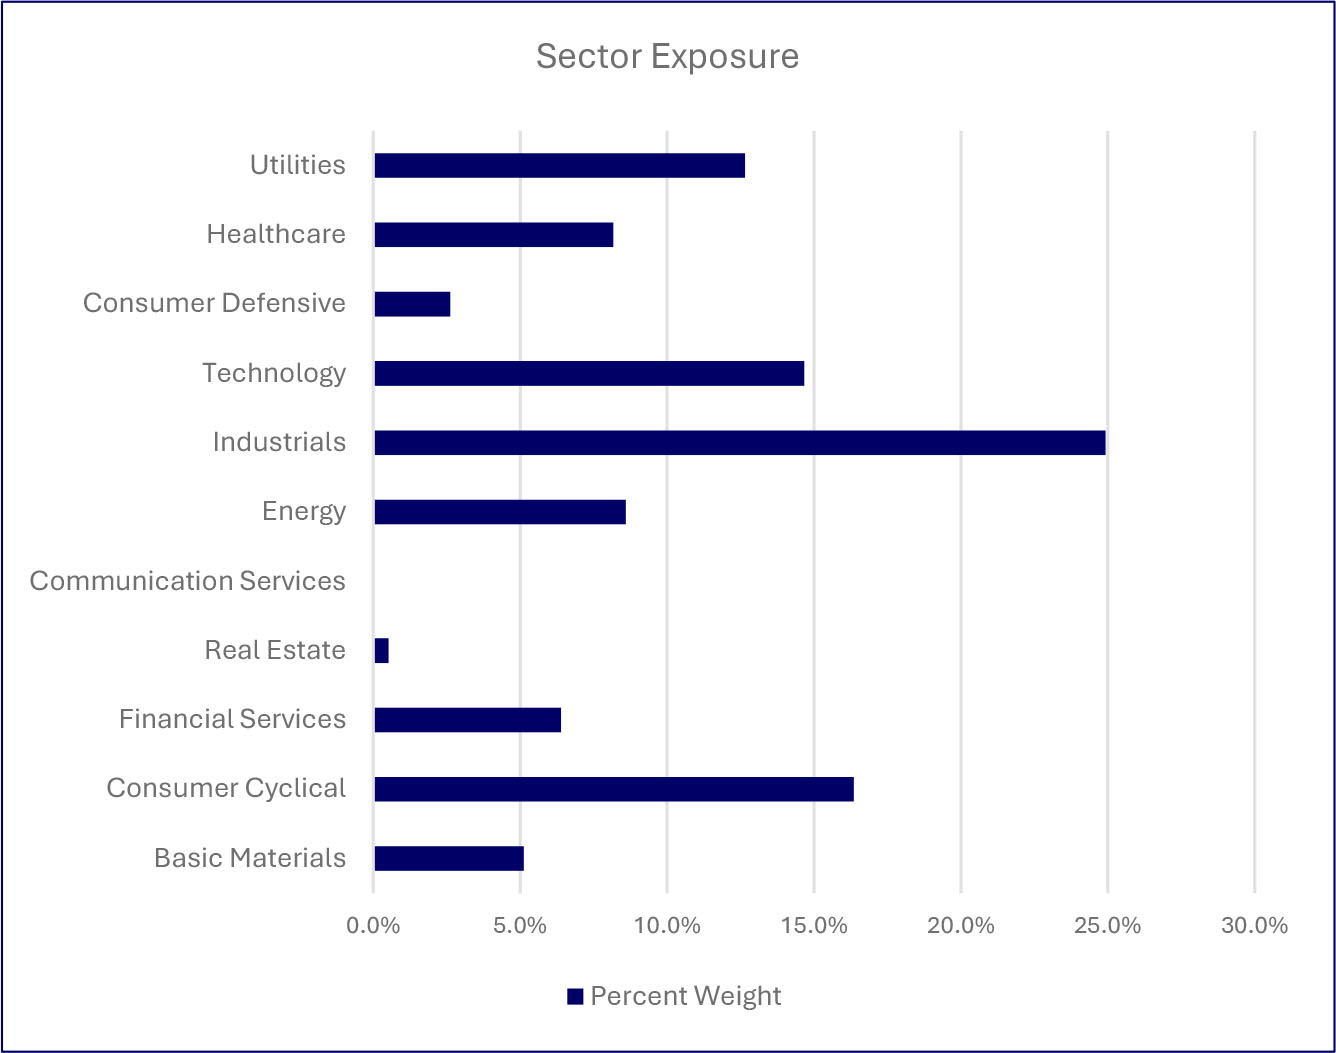
What did the Fund invest in (as a % of the Fund’s net assets)?
| Top Holdings (%) | |
| Dreyfus Inst Prefer Govt Money Mkt Inst Class | |
| Alliant Energy Corp | |
| Baker Hughes Company | |
| CMS Energy Corp | |
| SLB Ltd | |
| WEC Energy Group, Inc | |
| Evergy, Inc | |
| AutoZone, Inc | |
| Dollar General Corp | |
| Vulcan Materials Company | |
| Material Fund changes during the period. |
| Below is a summary of certain changes, and planned changes, to the Fund during the reporting period. For more complete information, you may review the Fund’s next prospectus, which we expect to be available by December 31, 2026, at www.saratogacap.com/fund-reports or upon request at 1-888-672-4839. |
| During the period there were no material changes to the Fund. |
| What were the Fund’s costs for the last year (based on a hypothetical $10,000 investment)? | ||
| Fund | Costs of a $10,000 Investment | Costs paid as a % of a $10,000 Investment |
| Saratoga Small Capitalization Fund, Class A | $254 | 2.34% |
| What affected the Fund’s performance during this period? |
|
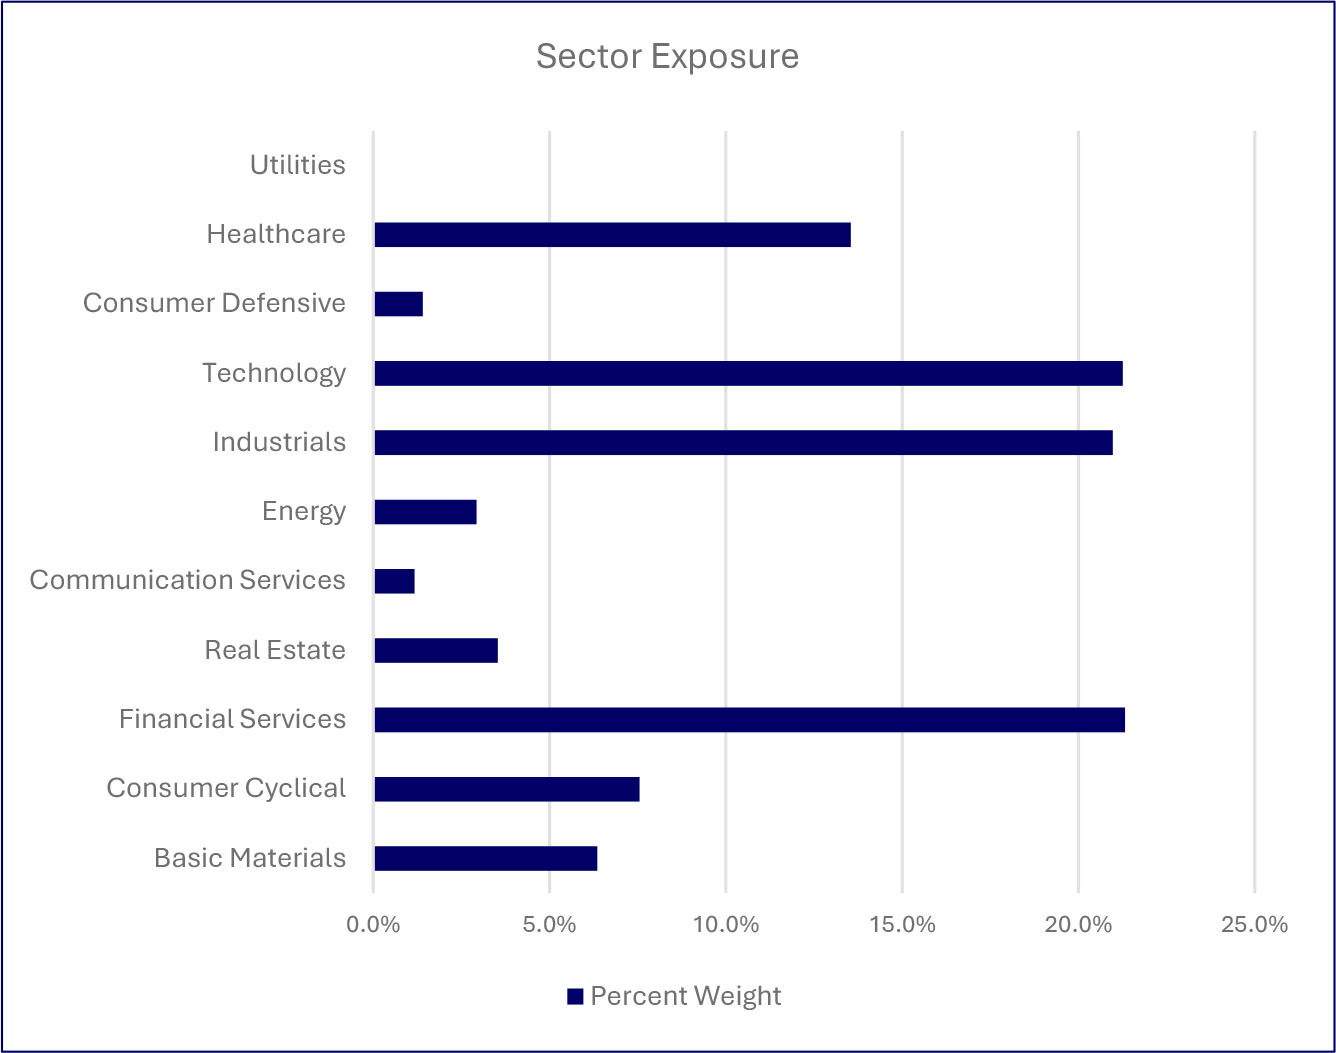
At the sector level, Industrials and Financials remained the Fund’s largest sectors and were overweight relative to the Russell 2000 Index. Stock selection in Industrials was consistently strong, and sector allocation benefited at different points from underweights to Consumer Discretionary and Energy. Health Care led the Fund in late 2025 as several biotech holdings rebounded, while Energy declined amid easing oil prices. Information Technology led during the spring and early summer of 2026, as AI-related demand broadened across more businesses. Detractors included the Fund’s Communication Services holdings, which retreated in the first quarter of 2026 after a long multi-year advance, and its Energy holdings in the second quarter of 2026, as falling oil prices weighed on more leveraged small-cap oil and oil-services companies.
Stock selection was an important source of gains. In late 2025, Rigel Pharmaceuticals rose after raising its revenue outlook and reporting positive clinical-trial results, Hecla Mining benefited from stronger gold and silver prices, and GeneDx advanced as earnings repeatedly exceeded estimates. In early 2026, Advanced Energy Industries benefited from demand in semiconductor and data-center markets, Comfort Systems gained from technology-related mechanical and electrical projects, and Kulicke & Soffa advanced on semiconductor assembly demand. Gains strengthened in the summer of 2026, particularly among holdings connected to AI infrastructure. Credo Technology rose on accelerating demand for AI networking products and stronger-than-expected earnings and guidance. Bloom Energy benefited from demand for reliable power for AI data centers, while Sterling Infrastructure advanced on a robust project backlog and continued spending on data centers and other infrastructure. Kulicke & Soffa and Sanmina also posted strong gains, supported by semiconductor demand and AI-infrastructure-related orders and earnings. |
How did the Fund perform over the past 10 years?
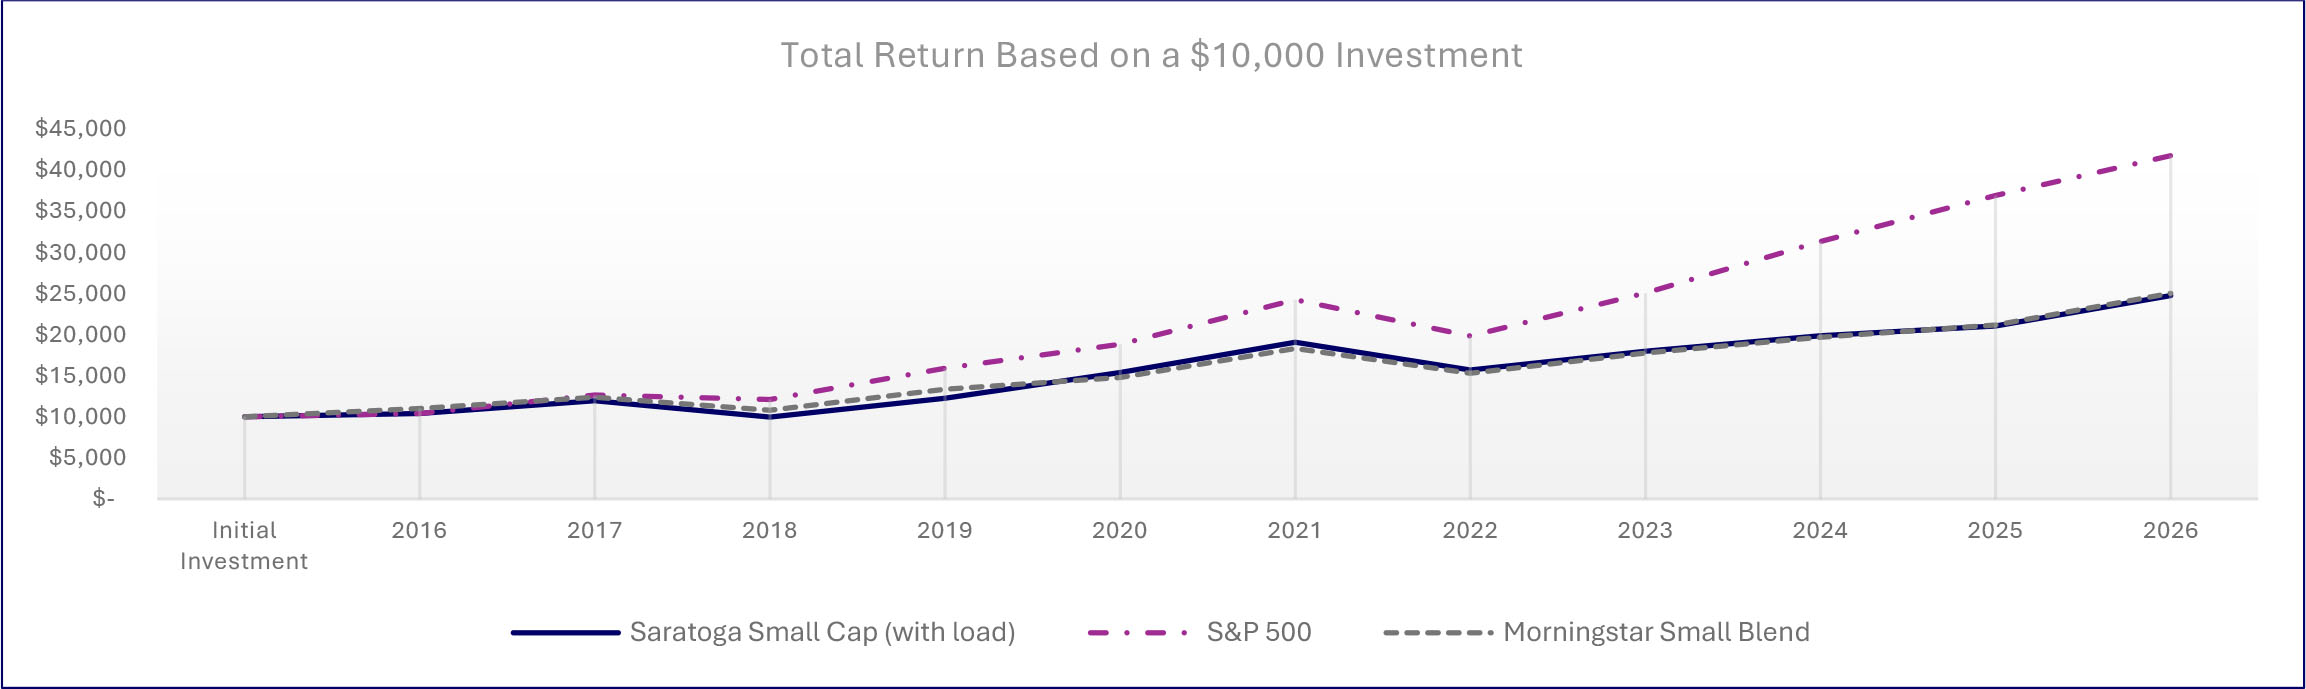
The chart below represents the historical performance of a hypothetical $10,000 investment over the past 10 years in the class of shares noted and assumes the reinvestment of dividends and capital gains and the maximum sales charge, if any. Fund expenses, including management fees, 12b-1 fees, if any, and other expenses were deducted.
| Average Annual Total Returns | |||
| 1 Year | 5 Years | 10 Years | |
| Saratoga Small Capitalization Fund, Class A (with load) | 10.48% | 5.50% | 9.50% |
| Saratoga Small Capitalization Fund, Class A | 17.19% | 6.75% | 10.14% |
| S&P 500® Index | 20.38% | 12.79% | 15.37% |
| Morningstar US Fund Small Capitalization Blend Category | 20.98% | 7.29% | 10.34% |
| Fund Statistics | |||
| Total Net Assets | $7,064,279 | Advisory Fees Paid by the Fund | $44,001 |
| Number of Portfolio Holdings | 103 | Portfolio Turnover Rate | 125% |
What did the Fund invest in (as a % of the Fund’s net assets)?
| Top Holdings (%) | |
| Dreyfus Inst Prefer Govt Money Mkt Inst Class | |
| Vestis Corp | |
| Allient, Inc | |
| Commvault Systems, Inc | |
| Kulicke & Soffa Industries, Inc | |
| International Seaways, Inc | |
| Comfort Systems USA, Inc | |
| Independent Bank Corp | |
| Watts Water Technologies, Inc Class A | |
| Remitly Global, Inc | |
| Material Fund changes during the period. |
| Below is a summary of certain changes, and planned changes, to the Fund during the reporting period. For more complete information, you may review the Fund’s next prospectus, which we expect to be available by December 31, 2026, at www.saratogacap.com/fund-reports or upon request at 1-888-672-4839. |
| During the period there were no material changes to the Fund. |
| What were the Fund’s costs for the last year (based on a hypothetical $10,000 investment)? | ||
| Fund | Costs of a $10,000 Investment | Costs paid as a % of a $10,000 Investment |
| Saratoga Small Capitalization Fund, Class C | $306 | 2.83% |
| What affected the Fund’s performance during this period? |
|
At the sector level, Industrials and Financials remained the Fund’s largest sectors and were overweight relative to the Russell 2000 Index. Stock selection in Industrials was consistently strong, and sector allocation benefited at different points from underweights to Consumer Discretionary and Energy. Health Care led the Fund in late 2025 as several biotech holdings rebounded, while Energy declined amid easing oil prices. Information Technology led during the spring and early summer of 2026, as AI-related demand broadened across more businesses. Detractors included the Fund’s Communication Services holdings, which retreated in the first quarter of 2026 after a long multi-year advance, and its Energy holdings in the second quarter of 2026, as falling oil prices weighed on more leveraged small-cap oil and oil-services companies.
Stock selection was an important source of gains. In late 2025, Rigel Pharmaceuticals rose after raising its revenue outlook and reporting positive clinical-trial results, Hecla Mining benefited from stronger gold and silver prices, and GeneDx advanced as earnings repeatedly exceeded estimates. In early 2026, Advanced Energy Industries benefited from demand in semiconductor and data-center markets, Comfort Systems gained from technology-related mechanical and electrical projects, and Kulicke & Soffa advanced on semiconductor assembly demand. Gains strengthened in the summer of 2026, particularly among holdings connected to AI infrastructure. Credo Technology rose on accelerating demand for AI networking products and stronger-than-expected earnings and guidance. Bloom Energy benefited from demand for reliable power for AI data centers, while Sterling Infrastructure advanced on a robust project backlog and continued spending on data centers and other infrastructure. Kulicke & Soffa and Sanmina also posted strong gains, supported by semiconductor demand and AI-infrastructure-related orders and earnings. |
How did the Fund perform over the past 10 years?
The chart below represents the historical performance of a hypothetical $10,000 investment over the past 10 years in the class of shares noted and assumes the reinvestment of dividends and capital gains and the maximum sales charge, if any. Fund expenses, including management fees, 12b-1 fees, if any, and other expenses were deducted.
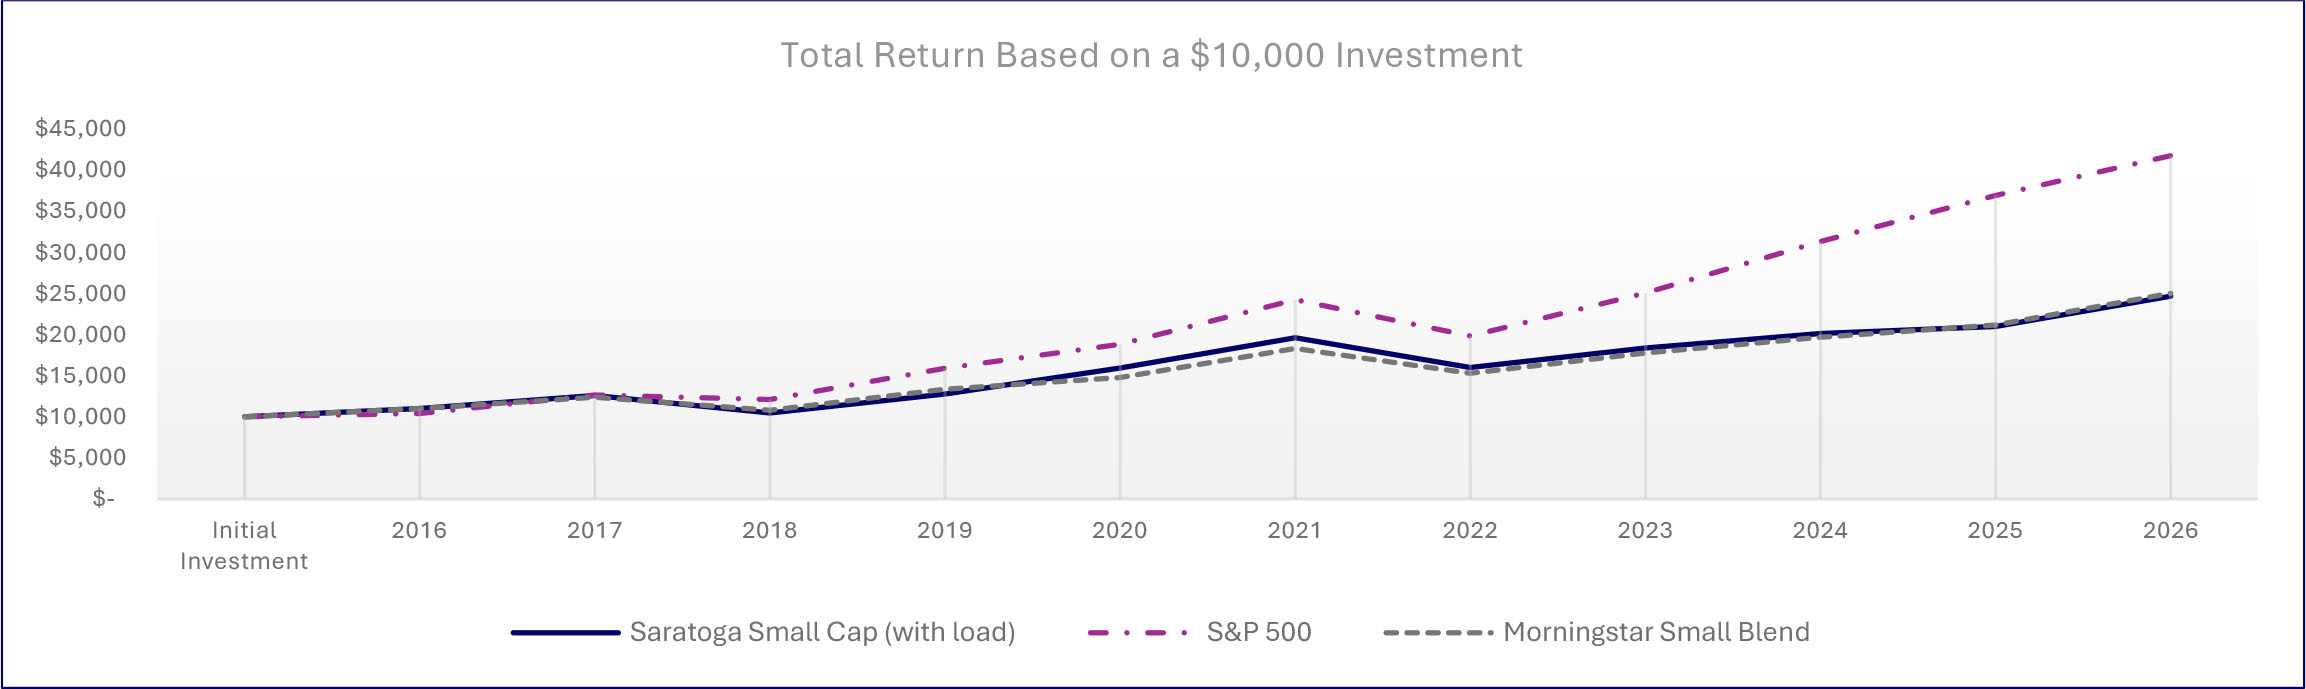
| Average Annual Total Returns | |||
| 1 Year | 5 Years | 10 Years | |
| Saratoga Small Capitalization Fund, Class C (with load) | 15.25% | 6.05% | 9.45% |
| Saratoga Small Capitalization Fund, Class C | 16.25% | 6.05% | 9.45% |
| S&P 500® Index | 20.38% | 12.79% | 15.37% |
| Morningstar US Fund Small Capitalization Blend Category | 20.98% | 7.29% | 10.34% |
| Fund Statistics | |||
| Total Net Assets | $7,064,279 | Advisory Fees Paid by the Fund | $44,001 |
| Number of Portfolio Holdings | 103 | Portfolio Turnover Rate | 125% |
What did the Fund invest in (as a % of the Fund’s net assets)?
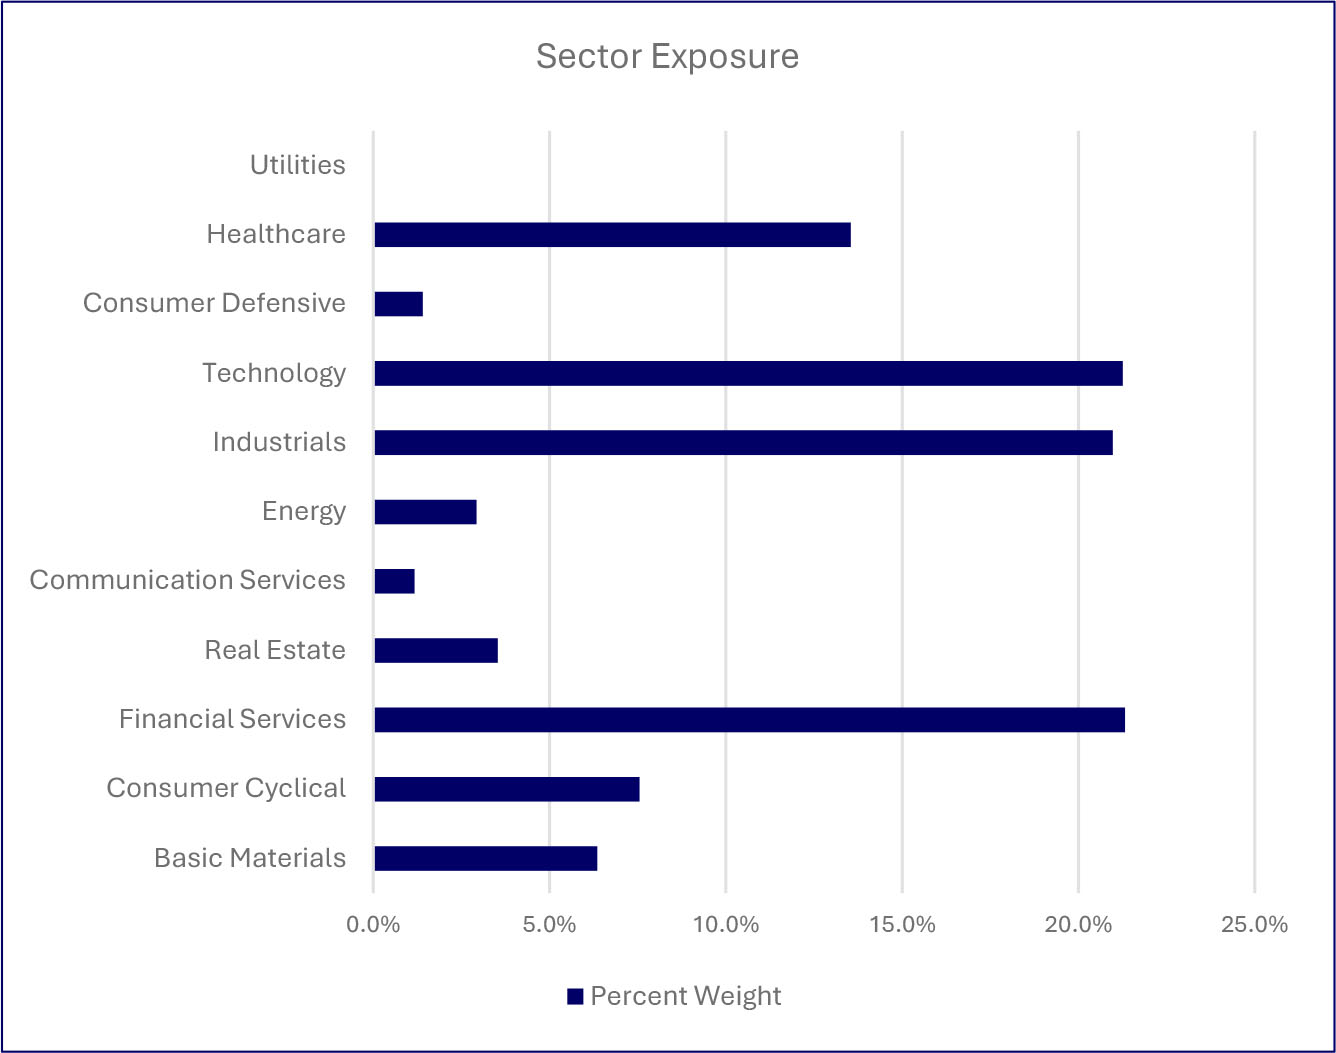
| Top Holdings (%) | |
| Dreyfus Inst Prefer Govt Money Mkt Inst Class | |
| Vestis Corp | |
| Allient, Inc | |
| Commvault Systems, Inc | |
| Kulicke & Soffa Industries, Inc | |
| International Seaways, Inc | |
| Comfort Systems USA, Inc | |
| Independent Bank Corp | |
| Watts Water Technologies, Inc Class A | |
| Remitly Global, Inc | |
| Material Fund changes during the period. |
| Below is a summary of certain changes, and planned changes, to the Fund during the reporting period. For more complete information, you may review the Fund’s next prospectus, which we expect to be available by December 31, 2026, at www.saratogacap.com/fund-reports or upon request at 1-888-672-4839. |
| During the period there were no material changes to the Fund. |
| What were the Fund’s costs for the last year (based on a hypothetical $10,000 investment)? | ||
| Fund | Costs of a $10,000 Investment | Costs paid as a % of a $10,000 Investment |
| Saratoga Small Capitalization Fund, Class I | $210 | 1.93% |
| What affected the Fund’s performance during this period? |
|
At the sector level, Industrials and Financials remained the Fund’s largest sectors and were overweight relative to the Russell 2000 Index. Stock selection in Industrials was consistently strong, and sector allocation benefited at different points from underweights to Consumer Discretionary and Energy. Health Care led the Fund in late 2025 as several biotech holdings rebounded, while Energy declined amid easing oil prices. Information Technology led during the spring and early summer of 2026, as AI-related demand broadened across more businesses. Detractors included the Fund’s Communication Services holdings, which retreated in the first quarter of 2026 after a long multi-year advance, and its Energy holdings in the second quarter of 2026, as falling oil prices weighed on more leveraged small-cap oil and oil-services companies.
Stock selection was an important source of gains. In late 2025, Rigel Pharmaceuticals rose after raising its revenue outlook and reporting positive clinical-trial results, Hecla Mining benefited from stronger gold and silver prices, and GeneDx advanced as earnings repeatedly exceeded estimates. In early 2026, Advanced Energy Industries benefited from demand in semiconductor and data-center markets, Comfort Systems gained from technology-related mechanical and electrical projects, and Kulicke & Soffa advanced on semiconductor assembly demand. Gains strengthened in the summer of 2026, particularly among holdings connected to AI infrastructure. Credo Technology rose on accelerating demand for AI networking products and stronger-than-expected earnings and guidance. Bloom Energy benefited from demand for reliable power for AI data centers, while Sterling Infrastructure advanced on a robust project backlog and continued spending on data centers and other infrastructure. Kulicke & Soffa and Sanmina also posted strong gains, supported by semiconductor demand and AI-infrastructure-related orders and earnings. |
How did the Fund perform over the past 10 years?
The chart below represents the historical performance of a hypothetical $10,000 investment over the past 10 years in the class of shares noted and assumes the reinvestment of dividends and capital gains and the maximum sales charge, if any. Fund expenses, including management fees, 12b-1 fees, if any, and other expenses were deducted.
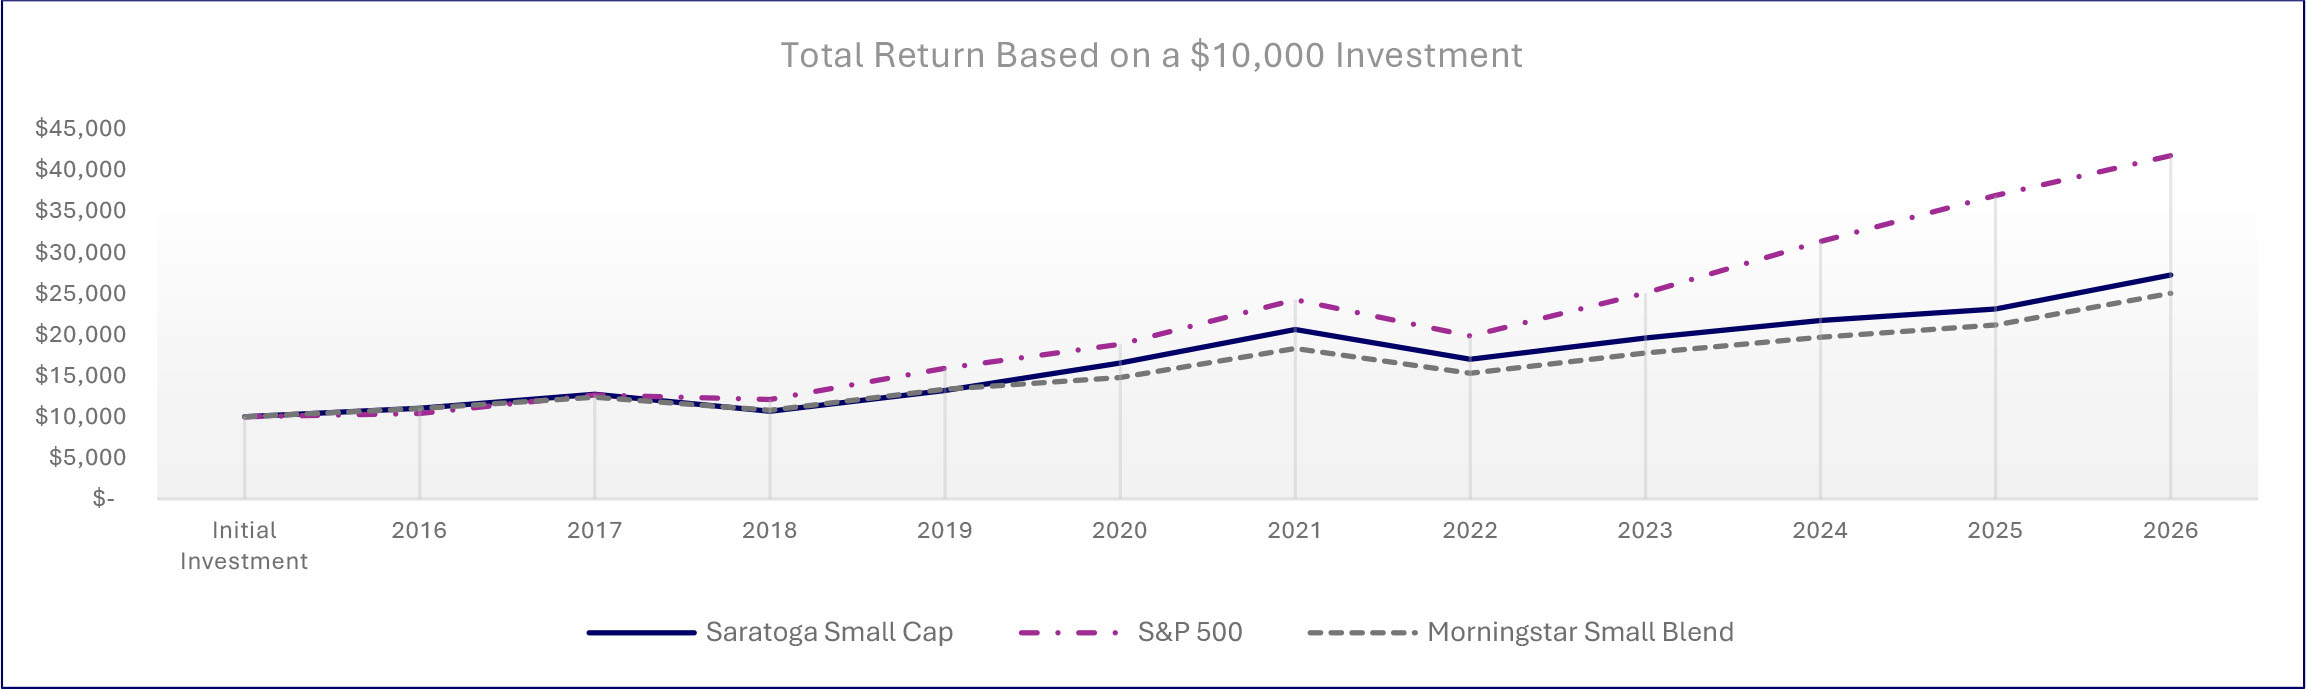
| Average Annual Total Returns | |||
| 1 Year | 5 Years | 10 Years | |
| Saratoga Small Capitalization Fund, Class I | 17.78% | 7.16% | 10.55% |
| S&P 500® Index | 20.38% | 12.79% | 15.37% |
| Morningstar US Fund Small Capitalization Blend Category | 20.98% | 7.29% | 10.34% |
| Fund Statistics | |||
| Total Net Assets | $7,064,279 | Advisory Fees Paid by the Fund | $44,001 |
| Number of Portfolio Holdings | 103 | Portfolio Turnover Rate | 125% |
What did the Fund invest in (as a % of the Fund’s net assets)?
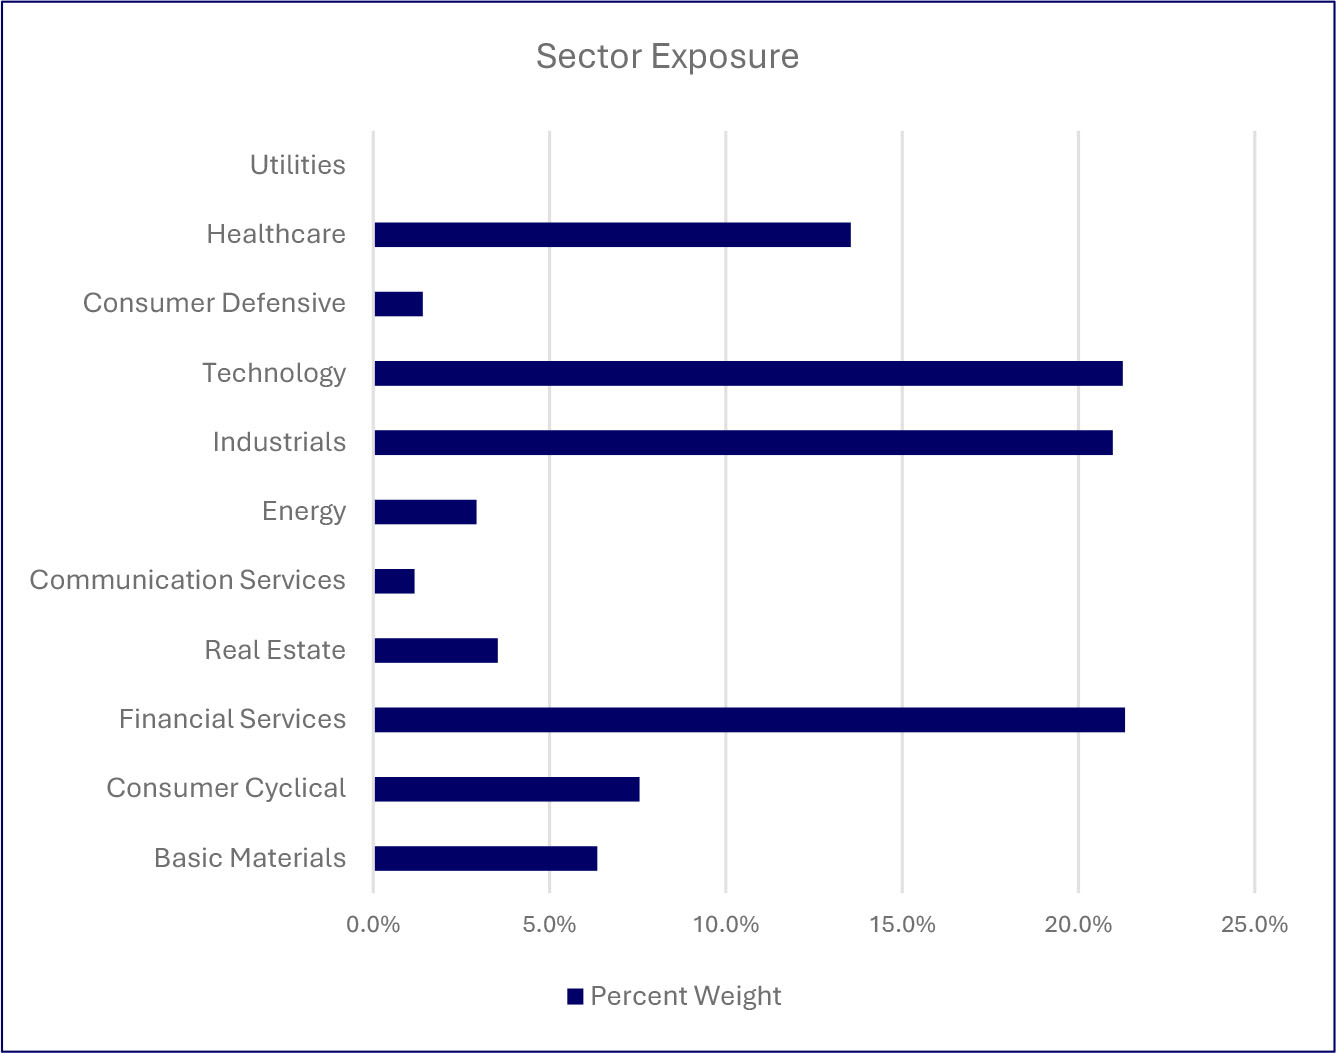
| Top Holdings (%) | |
| Dreyfus Inst Prefer Govt Money Mkt Inst Class | |
| Vestis Corp | |
| Allient, Inc | |
| Commvault Systems, Inc | |
| Kulicke & Soffa Industries, Inc | |
| International Seaways, Inc | |
| Comfort Systems USA, Inc | |
| Independent Bank Corp | |
| Watts Water Technologies, Inc Class A | |
| Remitly Global, Inc | |
| Material Fund changes during the period. |
| Below is a summary of certain changes, and planned changes, to the Fund during the reporting period. For more complete information, you may review the Fund’s next prospectus, which we expect to be available by December 31, 2026, at www.saratogacap.com/fund-reports or upon request at 1-888-672-4839. |
| During the period there were no material changes to the Fund. |
| What were the Fund’s costs for the last year (based on a hypothetical $10,000 investment)? | ||
| Fund | Costs of a $10,000 Investment | Costs paid as a % of a $10,000 Investment |
| Saratoga International Equity Fund, Class A | $373 | 3.29% |
| What affected the Fund’s performance during this period? |
|
From a regional perspective, Developed Europe was the largest positive contributor to relative performance, led by holdings in Spain and Italy. Emerging Asia was the only region with negative stock selection, despite holding the Fund’s top three individual contributors, led by South Korean memory-chip maker SK hynix. China posted the worst relative return, with technology hardware maker Xiaomi and jewelry manufacturer Chow Tai Fook the largest detractors. Allocation effect was negative, largely due to the drag from a small cash position in a strong market, partly offset by an underweight to India and an overweight to South Korea.
From a sector view, Financials had the strongest outperformance, led by Spanish banks CaixaBank and Banco Santander. Health Care was the next largest contributor, with Hansoh Pharmaceutical and Ipsen generating strong relative returns. Information Technology was the largest detracting sector because of Xiaomi, although it also held the Fund’s top contributors: SK hynix, Asia Vital Components and Taiwan Semiconductor. Not holding Samsung Electronics and ASML was a meaningful drag on performance.
Industrials was the second largest detracting sector, due mainly to Compagnie de Saint-Gobain and Hoshizaki. Sector allocation was slightly negative, as the benefit of an underweight to Communication Services was offset by the drag from cash. |
How did the Fund perform over the past 10 years?
The chart below represents the historical performance of a hypothetical $10,000 investment over the past 10 years in the class of shares noted and assumes the reinvestment of dividends and capital gains and the maximum sales charge, if any. Fund expenses, including management fees, 12b-1 fees, if any, and other expenses were deducted.
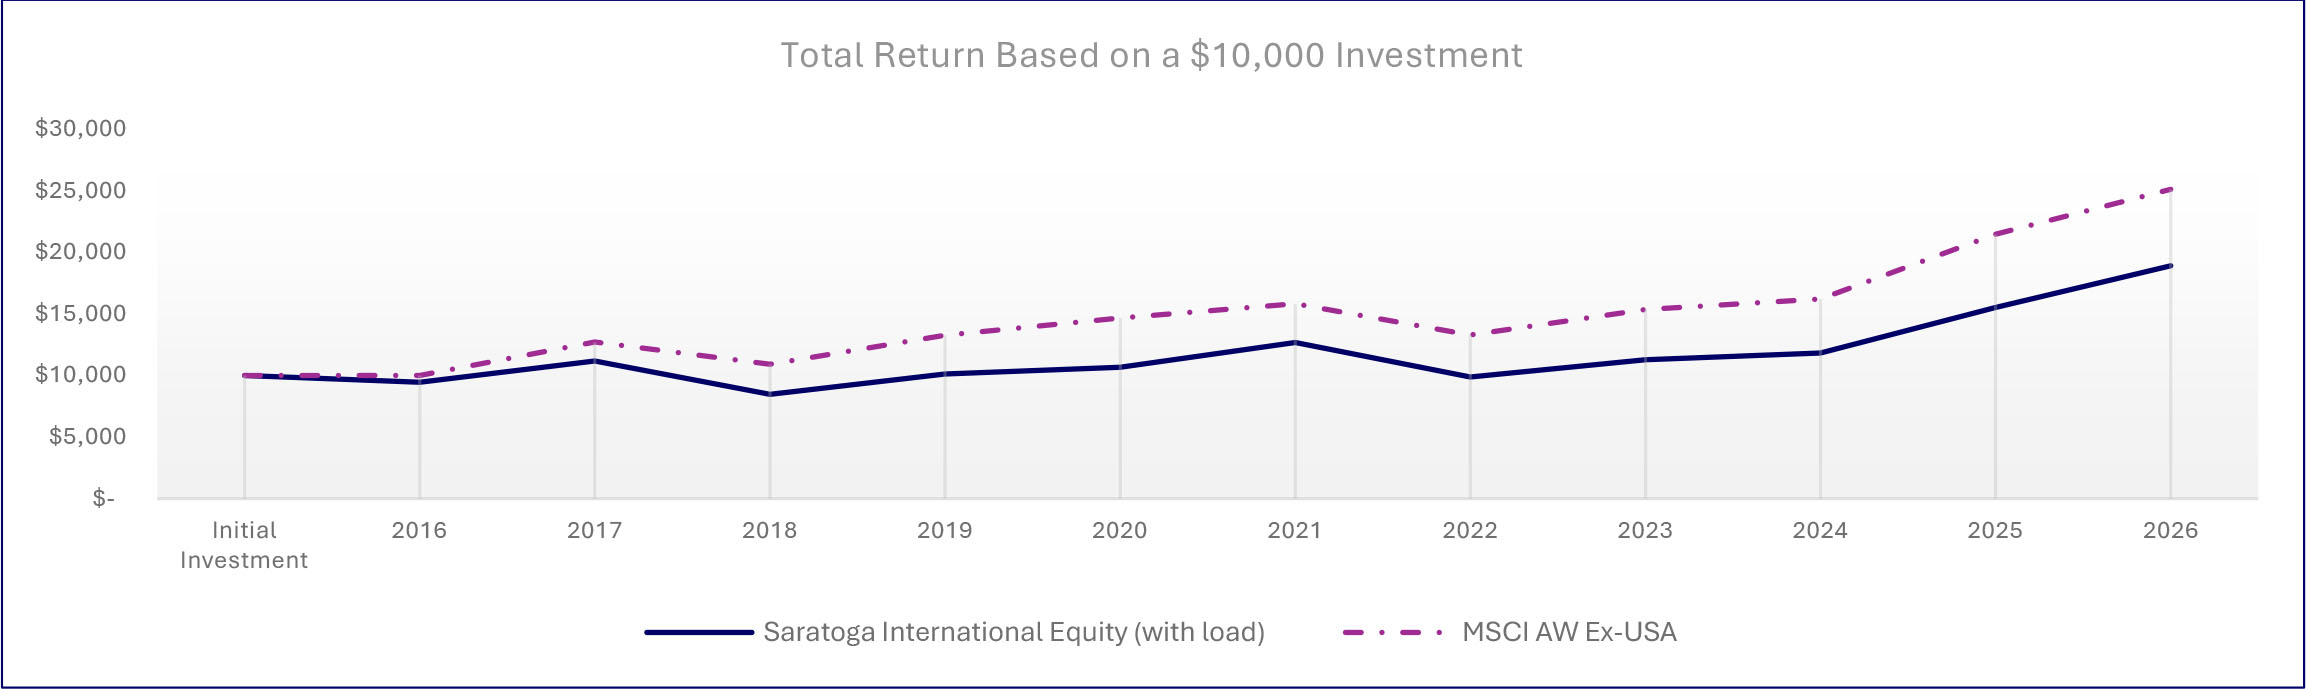
| Average Annual Total Returns | |||
| 1 Year | 5 Years | 10 Years | |
| Saratoga International Equity Fund, Class A (with load) | 19.54% | 7.26% | 6.57% |
| Saratoga International Equity Fund, Class A | 26.82% | 8.54% | 7.20% |
| MSCI ACWI Ex-USA Index | 27.35% | 9.37% | 9.64% |
| Fund Statistics | |||
| Total Net Assets | $3,741,322 | Advisory Fees Paid by the Fund | $26,636 |
| Number of Portfolio Holdings | 44 | Portfolio Turnover Rate | 63% |
What did the Fund invest in (as a % of the Fund’s net assets)?
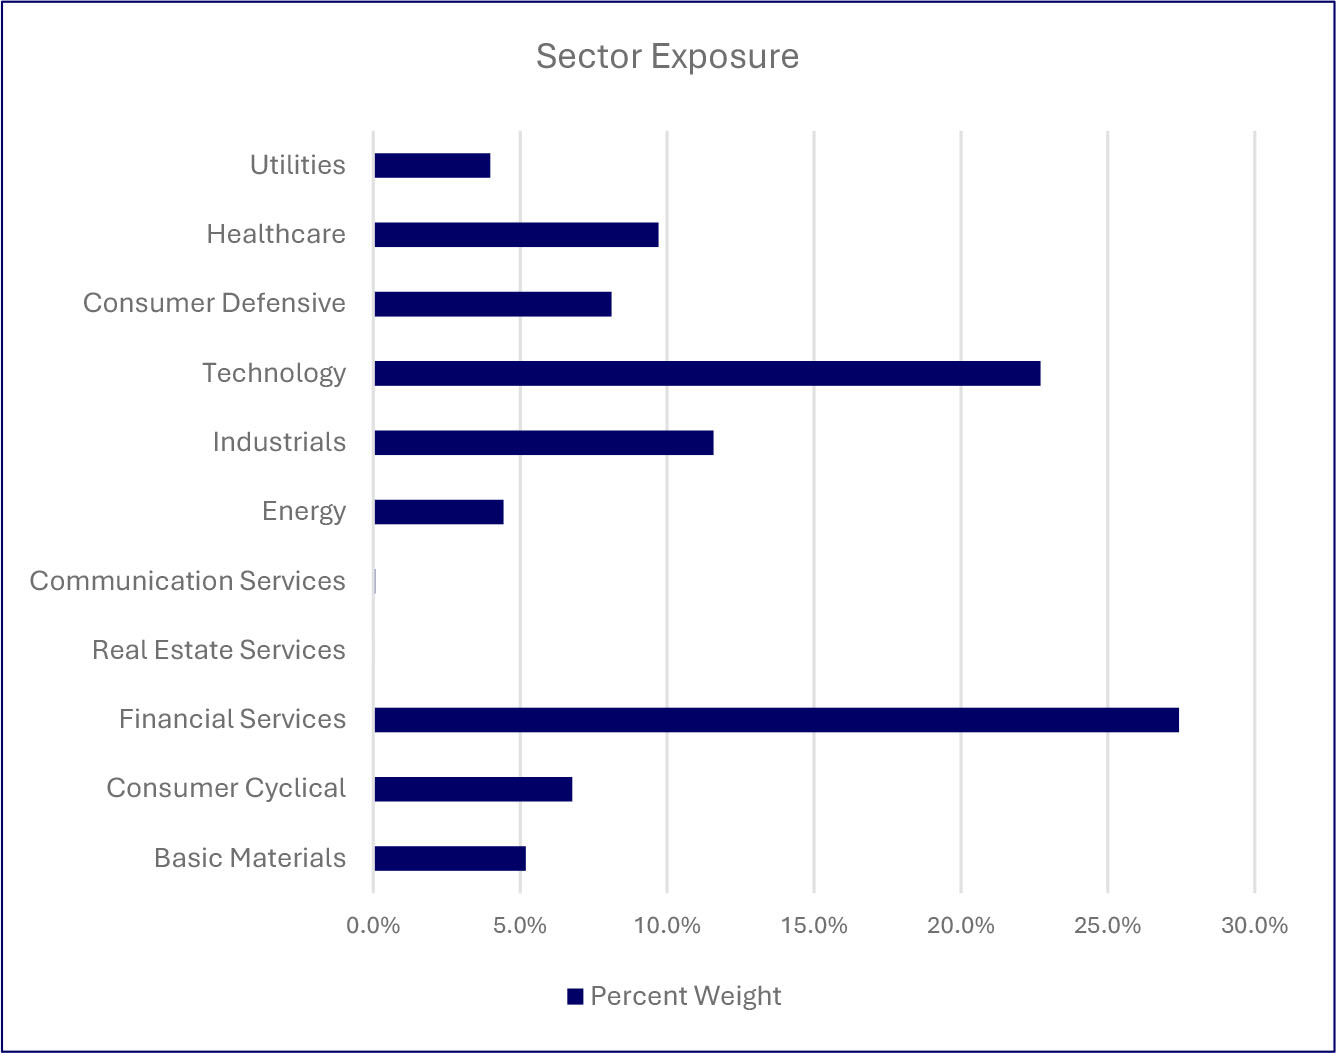
| Top Holdings (%) | |
| Taiwan Semiconductor Manufacturing | |
| Dreyfus Treasury Obligations Cash Management | |
| DBS Group Holdings Ltd | |
| SK Hynix, Inc | |
| Intesa Sanpaolo SpA | |
| Asia Vital Components Company Ltd | |
| KB Financial Group, Inc | |
| Mizuho Financial Group, Inc | |
| Rolls-Royce Holdings plc | |
| Banco Santander SA | |
| Regional Exposure (%) | |
| Americas | |
| Greater Europe | |
| Greater Asia | |
| Material Fund changes during the period. |
| Below is a summary of certain changes, and planned changes, to the Fund during the reporting period. For more complete information, you may review the Fund’s next prospectus, which we expect to be available by December 31, 2026, at www.saratogacap.com/fund-reports or upon request at 1-888-672-4839. |
| During the period there were no material changes to the Fund. |
| What were the Fund’s costs for the last year (based on a hypothetical $10,000 investment)? | ||
| Fund | Costs of a $10,000 Investment | Costs paid as a % of a $10,000 Investment |
| Saratoga International Equity Fund, Class C | $431 | 3.81% |
| What affected the Fund’s performance during this period? |
|
From a regional perspective, Developed Europe was the largest positive contributor to relative performance, led by holdings in Spain and Italy. Emerging Asia was the only region with negative stock selection, despite holding the Fund’s top three individual contributors, led by South Korean memory-chip maker SK hynix. China posted the worst relative return, with technology hardware maker Xiaomi and jewelry manufacturer Chow Tai Fook the largest detractors. Allocation effect was negative, largely due to the drag from a small cash position in a strong market, partly offset by an underweight to India and an overweight to South Korea.
From a sector view, Financials had the strongest outperformance, led by Spanish banks CaixaBank and Banco Santander. Health Care was the next largest contributor, with Hansoh Pharmaceutical and Ipsen generating strong relative returns. Information Technology was the largest detracting sector because of Xiaomi, although it also held the Fund’s top contributors: SK hynix, Asia Vital Components and Taiwan Semiconductor. Not holding Samsung Electronics and ASML was a meaningful drag on performance.
Industrials was the second largest detracting sector, due mainly to Compagnie de Saint-Gobain and Hoshizaki. Sector allocation was slightly negative, as the benefit of an underweight to Communication Services was offset by the drag from cash. |
How did the Fund perform over the past 10 years?
The chart below represents the historical performance of a hypothetical $10,000 investment over the past 10 years in the class of shares noted and assumes the reinvestment of dividends and capital gains and the maximum sales charge, if any. Fund expenses, including management fees, 12b-1 fees, if any, and other expenses were deducted.
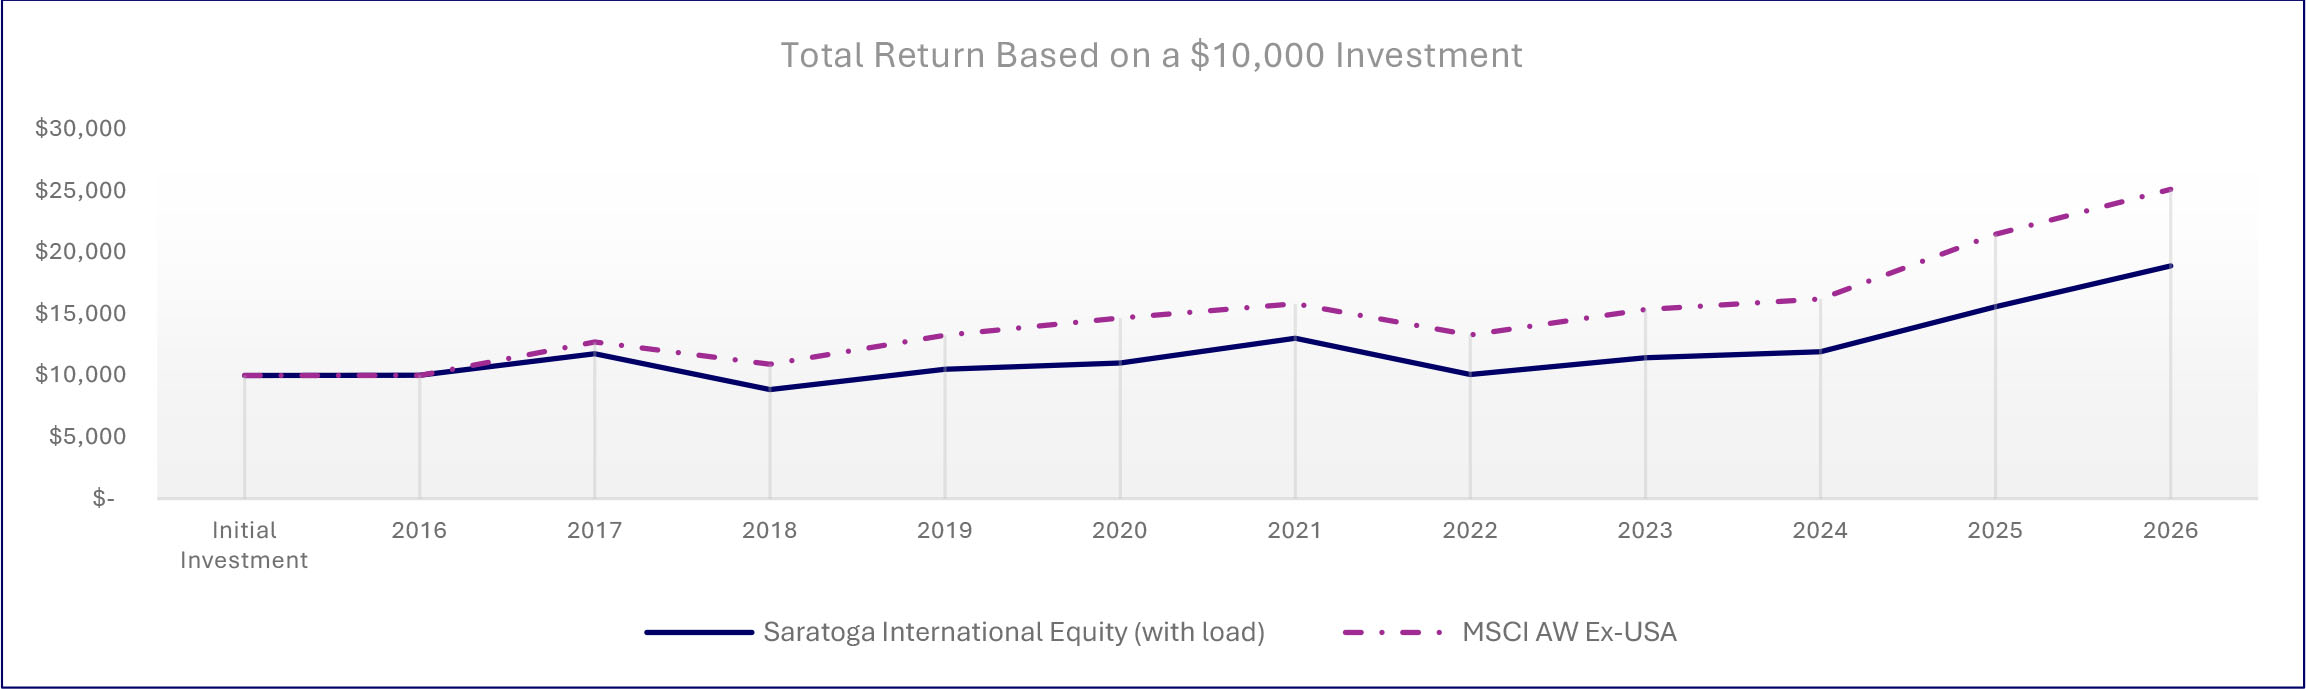
| Average Annual Total Returns | |||
| 1 Year | 5 Years | 10 Years | |
| Saratoga International Equity Fund, Class C (with load) | 25.18% | 7.89% | 6.57% |
| Saratoga International Equity Fund, Class C | 26.18% | 7.89% | 6.57% |
| MSCI ACWI Ex-USA Index | 27.35% | 9.37% | 9.64% |
| Fund Statistics | |||
| Total Net Assets | $3,741,322 | Advisory Fees Paid by the Fund | $26,636 |
| Number of Portfolio Holdings | 44 | Portfolio Turnover Rate | 63% |
What did the Fund invest in (as a % of the Fund’s net assets)?
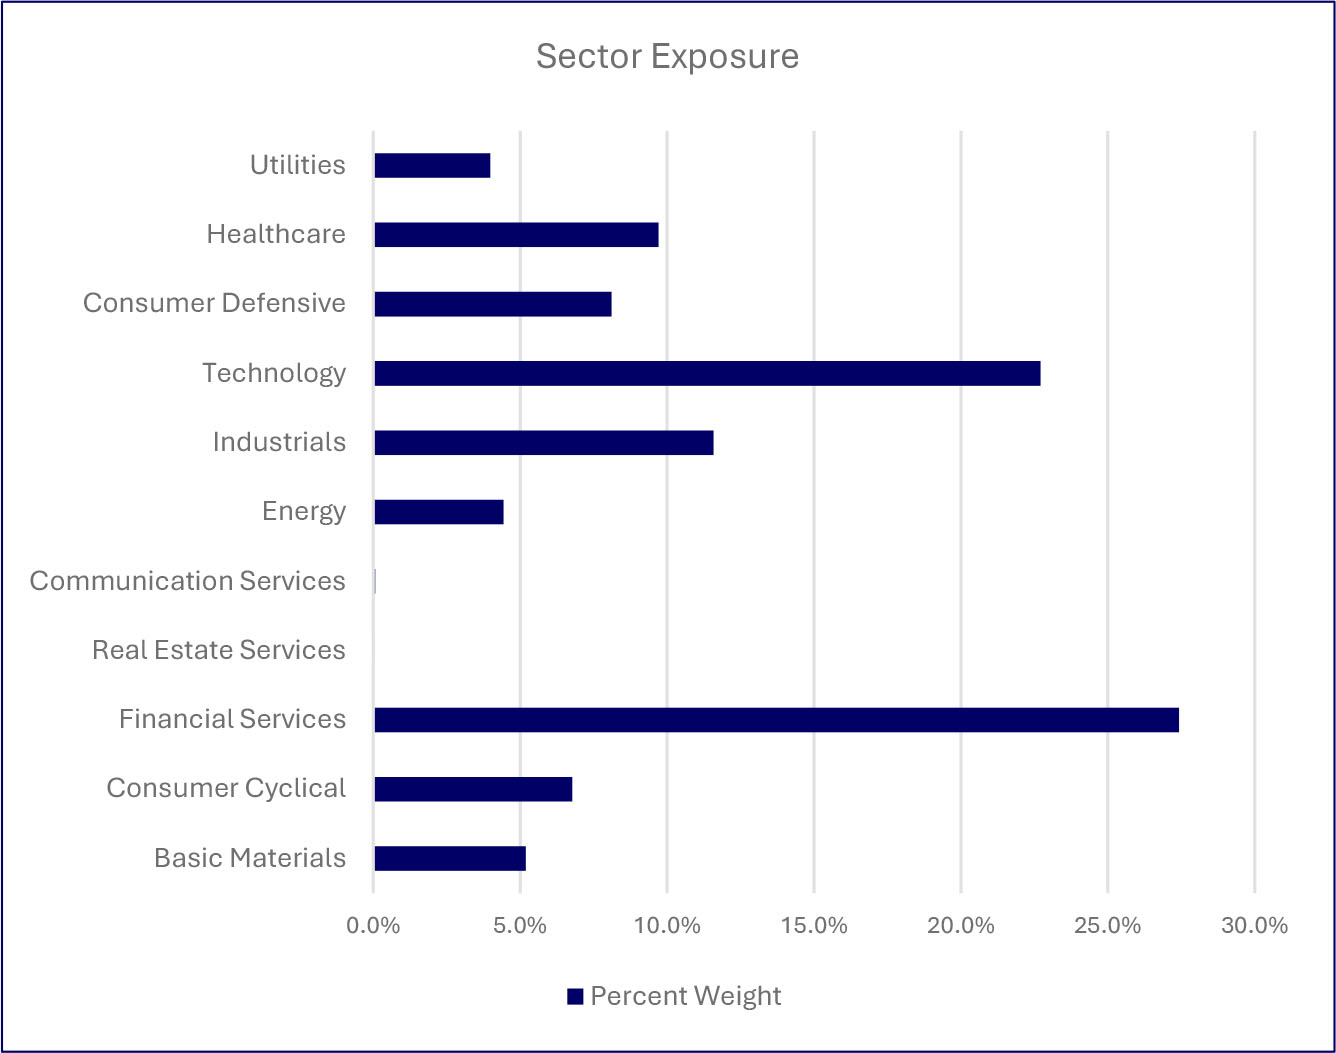
| Top Holdings (%) | |
| Taiwan Semiconductor Manufacturing | |
| Dreyfus Treasury Obligations Cash Management | |
| DBS Group Holdings Ltd | |
| SK Hynix, Inc | |
| Intesa Sanpaolo SpA | |
| Asia Vital Components Company Ltd | |
| KB Financial Group, Inc | |
| Mizuho Financial Group, Inc | |
| Rolls-Royce Holdings plc | |
| Banco Santander SA | |
| Regional Exposure (%) | |
| Americas | |
| Greater Europe | |
| Greater Asia | |
| Material Fund changes during the period. |
| Below is a summary of certain changes, and planned changes, to the Fund during the reporting period. For more complete information, you may review the Fund’s next prospectus, which we expect to be available by December 31, 2026, at www.saratogacap.com/fund-reports or upon request at 1-888-672-4839. |
| During the period there were no material changes to the Fund. |
| What were the Fund’s costs for the last year (based on a hypothetical $10,000 investment)? | ||
| Fund | Costs of a $10,000 Investment | Costs paid as a % of a $10,000 Investment |
| Saratoga International Equity Fund, Class I | $328 | 2.89% |
| What affected the Fund’s performance during this period? |
|
From a regional perspective, Developed Europe was the largest positive contributor to relative performance, led by holdings in Spain and Italy. Emerging Asia was the only region with negative stock selection, despite holding the Fund’s top three individual contributors, led by South Korean memory-chip maker SK hynix. China posted the worst relative return, with technology hardware maker Xiaomi and jewelry manufacturer Chow Tai Fook the largest detractors. Allocation effect was negative, largely due to the drag from a small cash position in a strong market, partly offset by an underweight to India and an overweight to South Korea.
From a sector view, Financials had the strongest outperformance, led by Spanish banks CaixaBank and Banco Santander. Health Care was the next largest contributor, with Hansoh Pharmaceutical and Ipsen generating strong relative returns. Information Technology was the largest detracting sector because of Xiaomi, although it also held the Fund’s top contributors: SK hynix, Asia Vital Components and Taiwan Semiconductor. Not holding Samsung Electronics and ASML was a meaningful drag on performance.
Industrials was the second largest detracting sector, due mainly to Compagnie de Saint-Gobain and Hoshizaki. Sector allocation was slightly negative, as the benefit of an underweight to Communication Services was offset by the drag from cash. |
How did the Fund perform over the past 10 years?
The chart below represents the historical performance of a hypothetical $10,000 investment over the past 10 years in the class of shares noted and assumes the reinvestment of dividends and capital gains and the maximum sales charge, if any. Fund expenses, including management fees, 12b-1 fees, if any, and other expenses were deducted.
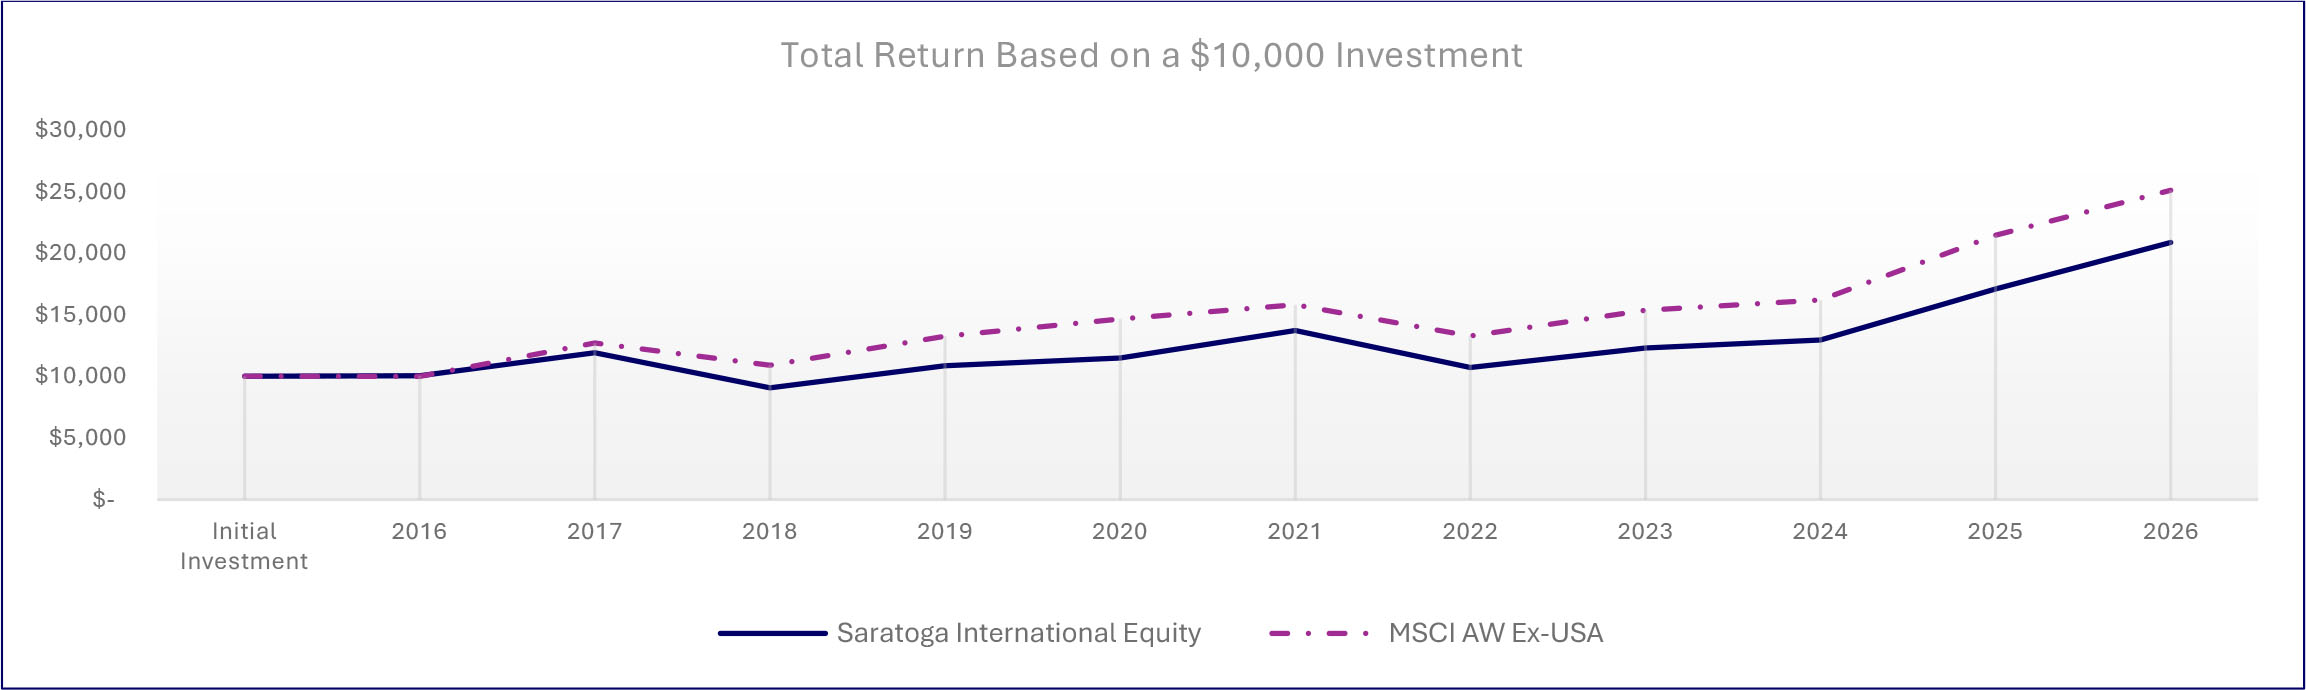
| Average Annual Total Returns | |||
| 1 Year | 5 Years | 10 Years | |
| Saratoga International Equity Fund, Class I | 27.33% | 8.97% | 7.63% |
| MSCI ACWI Ex-USA Index | 27.35% | 9.37% | 9.64% |
| Fund Statistics | |||
| Total Net Assets | $3,741,322 | Advisory Fees Paid by the Fund | $26,636 |
| Number of Portfolio Holdings | 44 | Portfolio Turnover Rate | 63% |
What did the Fund invest in (as a % of the Fund’s net assets)?
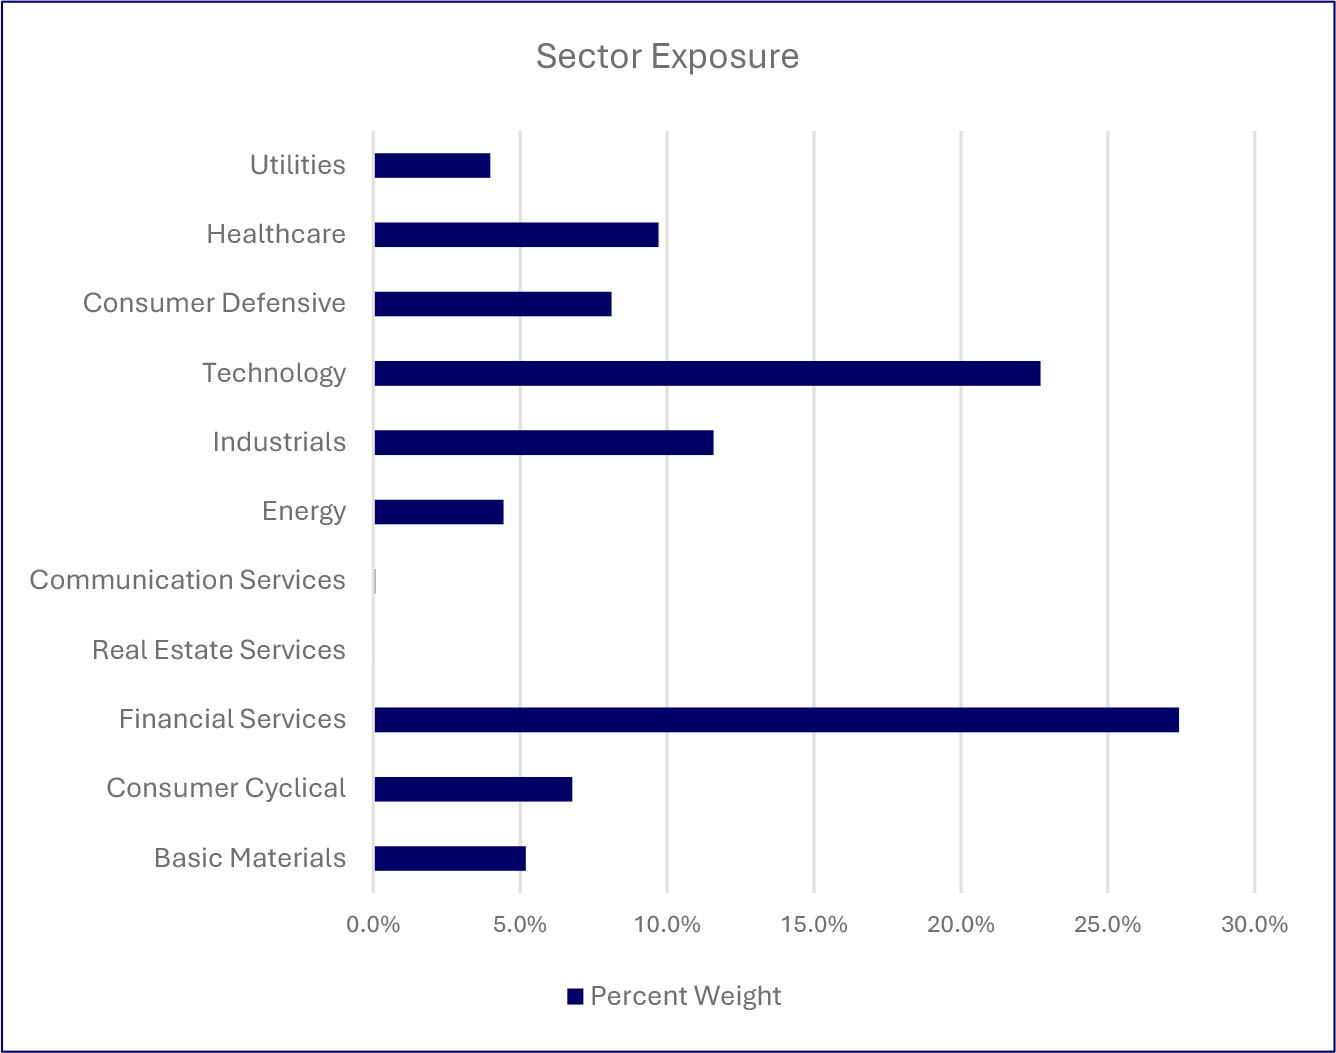
| Top Holdings (%) | |
| Taiwan Semiconductor Manufacturing | |
| Dreyfus Treasury Obligations Cash Management | |
| DBS Group Holdings Ltd | |
| SK Hynix, Inc | |
| Intesa Sanpaolo SpA | |
| Asia Vital Components Company Ltd | |
| KB Financial Group, Inc | |
| Mizuho Financial Group, Inc | |
| Rolls-Royce Holdings plc | |
| Banco Santander SA | |
| Regional Exposure (%) | |
| Americas | |
| Greater Europe | |
| Greater Asia | |
| Material Fund changes during the period. |
| Below is a summary of certain changes, and planned changes, to the Fund during the reporting period. For more complete information, you may review the Fund’s next prospectus, which we expect to be available by December 31, 2026, at www.saratogacap.com/fund-reports or upon request at 1-888-672-4839. |
| During the period there were no material changes to the Fund. |
| What were the Fund’s costs for the last year (based on a hypothetical $10,000 investment)? | ||
| Fund | Costs of a $10,000 Investment | Costs paid as a % of a $10,000 Investment |
| Saratoga Health & Biotechnology Fund, Class A | $335 | 2.93% |
| What affected the Fund’s performance during this period? |
|
The Fund’s holdings benefited from improving fundamentals, attractive valuations and greater clarity around pharmaceutical pricing and tariff policy during the fiscal year, as investor confidence recovered following an extended period of policy, reimbursement and utilization-related uncertainty. However, results varied significantly across the Fund’s sub-industries.
The Fund’s pharmaceutical and biotechnology holdings were among its strongest, supported by positive clinical developments, improving capital markets, increased merger and acquisition activity and continued innovation in areas such as oncology, obesity and immunology. The Fund’s medical device and equipment holdings lagged, as tariff-related cost pressures and limited pricing flexibility weighed on margins. |
How did the Fund perform over the past 10 years?
The chart below represents the historical performance of a hypothetical $10,000 investment over the past 10 years in the class of shares noted and assumes the reinvestment of dividends and capital gains and the maximum sales charge, if any. Fund expenses, including management fees, 12b-1 fees, if any, and other expenses were deducted.
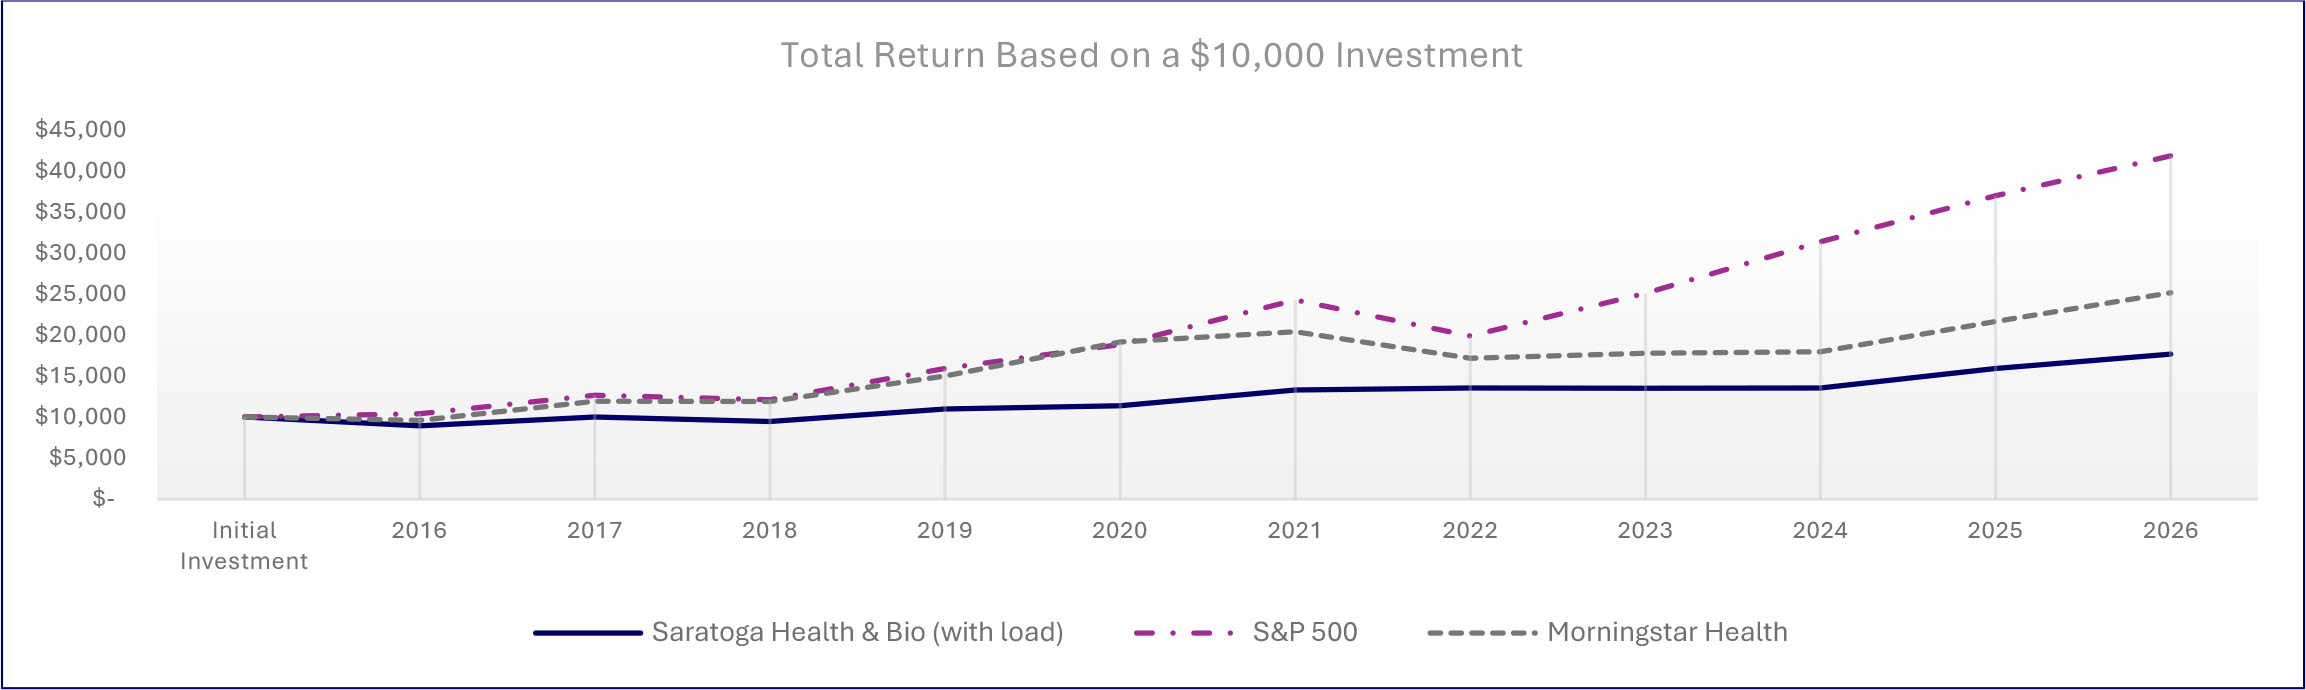
| Average Annual Total Returns | |||
| 1 Year | 5 Years | 10 Years | |
| Saratoga Health & Biotechnology Fund, Class A (with load) | 21.06% | 4.70% | 5.85% |
| Saratoga Health & Biotechnology Fund, Class A | 28.41% | 5.95% | 6.47% |
| S&P 500® Index | 20.38% | 12.79% | 15.37% |
| Morningstar US Fund Health Category | 37.45% | 3.73% | 9.90% |
| Fund Statistics | |||
| Total Net Assets | $11,551,996 | Advisory Fees Paid by the Fund | $136,172 |
| Number of Portfolio Holdings | 29 | Portfolio Turnover Rate | 13% |
What did the Fund invest in (as a % of the Fund’s net assets)?
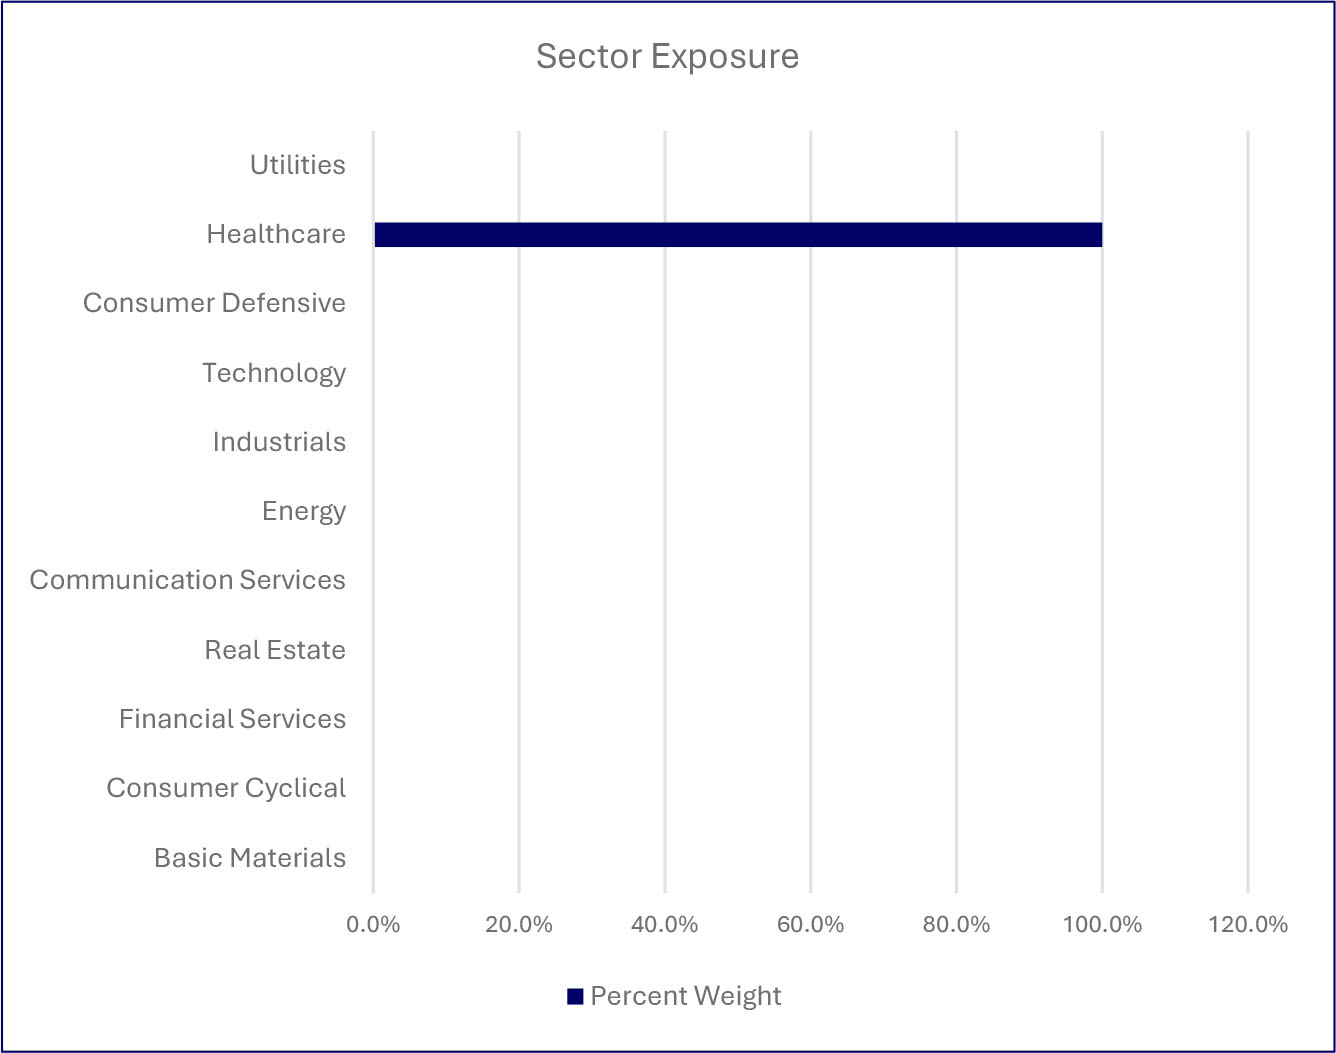
| Top Holdings (%) | |
| Jazz Pharmaceuticals plc | |
| Amgen Inc | |
| McKesson Corp | |
| Cardinal Health, Inc | |
| United Therapeutics Corp | |
| Cencora Inc | |
| Regeneron Pharmaceuticals, Inc | |
| Exelixis Inc | |
| Johnson & Johnson | |
| Novartis A. G. | |
| Material Fund changes during the period. |
| Below is a summary of certain changes, and planned changes, to the Fund during the reporting period. For more complete information, you may review the Fund’s next prospectus, which we expect to be available by December 31, 2026, at www.saratogacap.com/fund-reports or upon request at 1-888-672-4839. |
| During the period there were no material changes to the Fund. |
| What were the Fund’s costs for the last year (based on a hypothetical $10,000 investment)? | ||
| Fund | Costs of a $10,000 Investment | Costs paid as a % of a $10,000 Investment |
| Saratoga Health & Biotechnology Fund, Class C | $405 | 3.56% |
| What affected the Fund’s performance during this period? |
|
The Fund’s holdings benefited from improving fundamentals, attractive valuations and greater clarity around pharmaceutical pricing and tariff policy during the fiscal year, as investor confidence recovered following an extended period of policy, reimbursement and utilization-related uncertainty. However, results varied significantly across the Fund’s sub-industries.
The Fund’s pharmaceutical and biotechnology holdings were among its strongest, supported by positive clinical developments, improving capital markets, increased merger and acquisition activity and continued innovation in areas such as oncology, obesity and immunology. The Fund’s medical device and equipment holdings lagged, as tariff-related cost pressures and limited pricing flexibility weighed on margins. |
How did the Fund perform over the past 10 years?
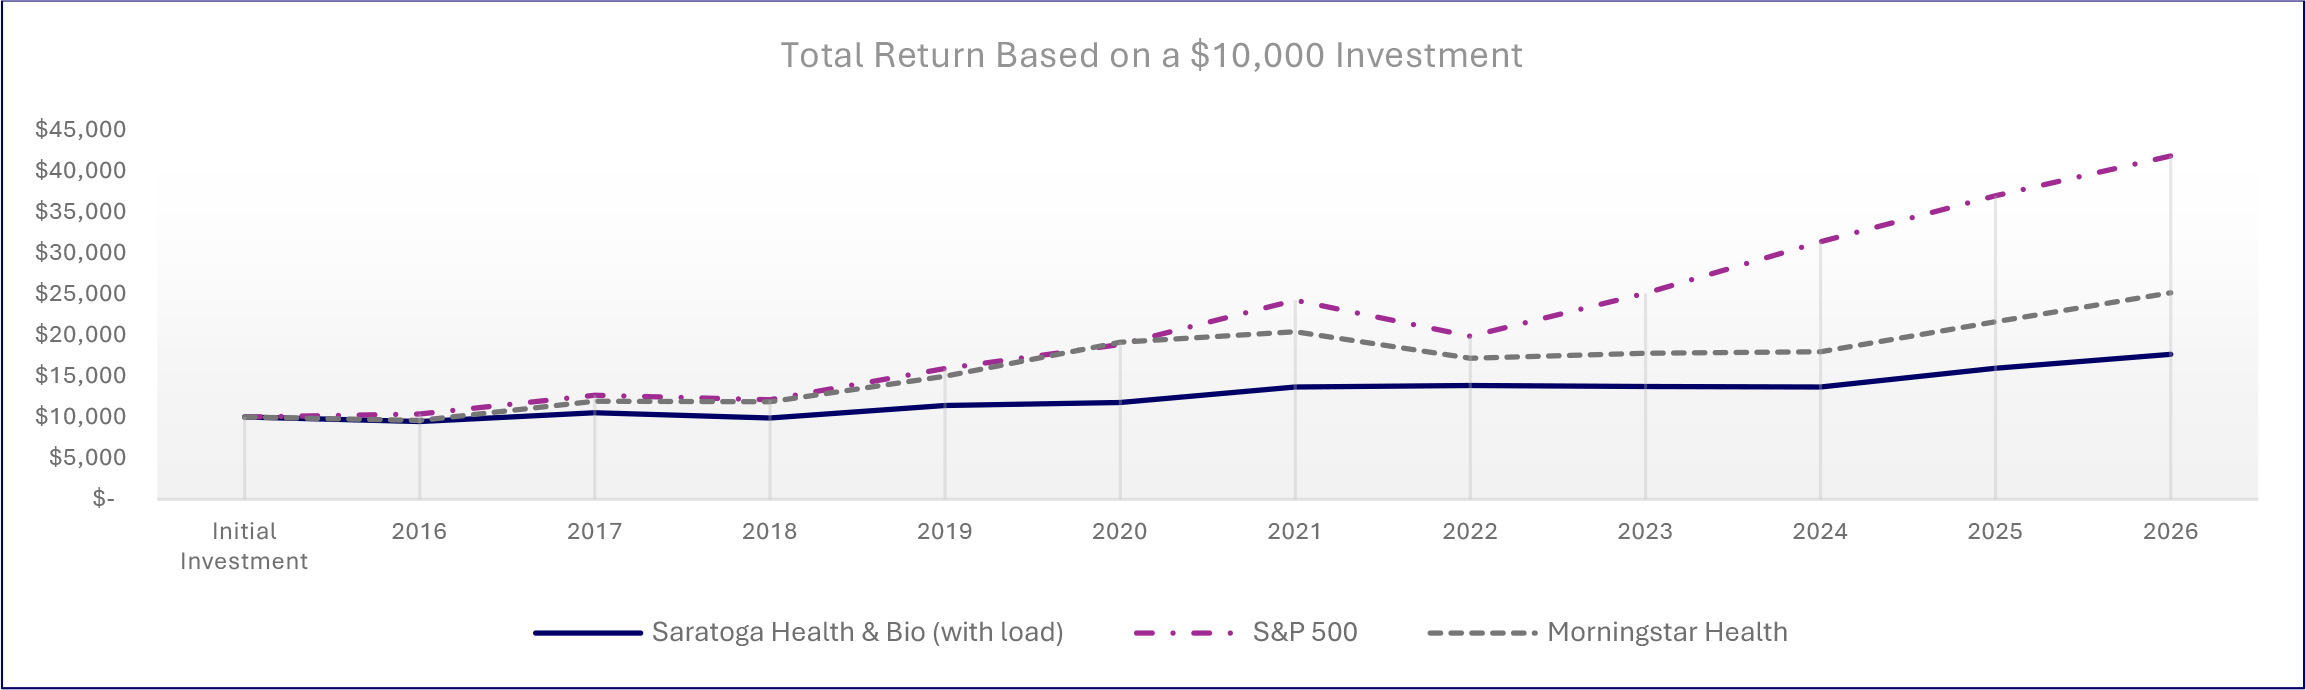
The chart below represents the historical performance of a hypothetical $10,000 investment over the past 10 years in the class of shares noted and assumes the reinvestment of dividends and capital gains and the maximum sales charge, if any. Fund expenses, including management fees, 12b-1 fees, if any, and other expenses were deducted.
| Average Annual Total Returns | |||
| 1 Year | 5 Years | 10 Years | |
| Saratoga Health & Biotechnology Fund, Class C (with load) | 26.55% | 5.30% | 5.84% |
| Saratoga Health & Biotechnology Fund, Class C | 27.55% | 5.30% | 5.84% |
| S&P 500® Index | 20.38% | 12.79% | 15.37% |
| Morningstar US Fund Health Category | 37.45% | 3.73% | 9.90% |
| Fund Statistics | |||
| Total Net Assets | $11,551,996 | Advisory Fees Paid by the Fund | $136,172 |
| Number of Portfolio Holdings | 29 | Portfolio Turnover Rate | 13% |
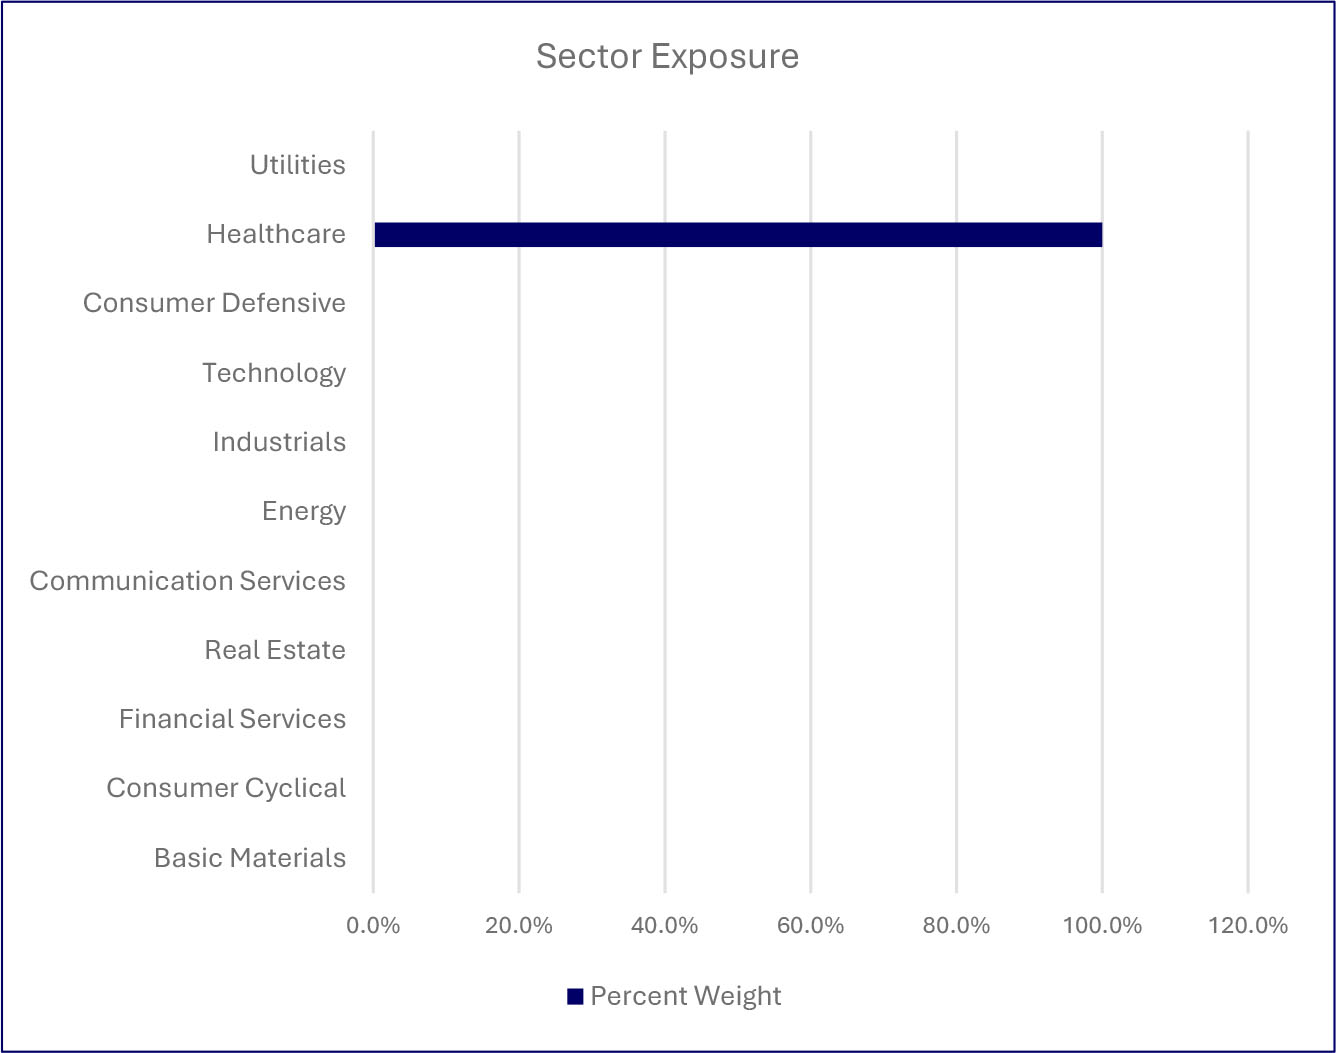
What did the Fund invest in (as a % of the Fund’s net assets)?
| Top Holdings (%) | |
| Jazz Pharmaceuticals plc | |
| Amgen Inc | |
| McKesson Corp | |
| Cardinal Health, Inc | |
| United Therapeutics Corp | |
| Cencora Inc | |
| Regeneron Pharmaceuticals, Inc | |
| Exelixis Inc | |
| Johnson & Johnson | |
| Novartis A. G. | |
| Material Fund changes during the period. |
| Below is a summary of certain changes, and planned changes, to the Fund during the reporting period. For more complete information, you may review the Fund’s next prospectus, which we expect to be available by December 31, 2026, at www.saratogacap.com/fund-reports or upon request at 1-888-672-4839. |
| During the period there were no material changes to the Fund. |
| What were the Fund’s costs for the last year (based on a hypothetical $10,000 investment)? | ||
| Fund | Costs of a $10,000 Investment | Costs paid as a % of a $10,000 Investment |
| Saratoga Health & Biotechnology Fund, Class I | $290 | 2.53% |
| What affected the Fund’s performance during this period? |
|
The Fund’s holdings benefited from improving fundamentals, attractive valuations and greater clarity around pharmaceutical pricing and tariff policy during the fiscal year, as investor confidence recovered following an extended period of policy, reimbursement and utilization-related uncertainty. However, results varied significantly across the Fund’s sub-industries.
The Fund’s pharmaceutical and biotechnology holdings were among its strongest, supported by positive clinical developments, improving capital markets, increased merger and acquisition activity and continued innovation in areas such as oncology, obesity and immunology. The Fund’s medical device and equipment holdings lagged, as tariff-related cost pressures and limited pricing flexibility weighed on margins. |
How did the Fund perform over the past 10 years?
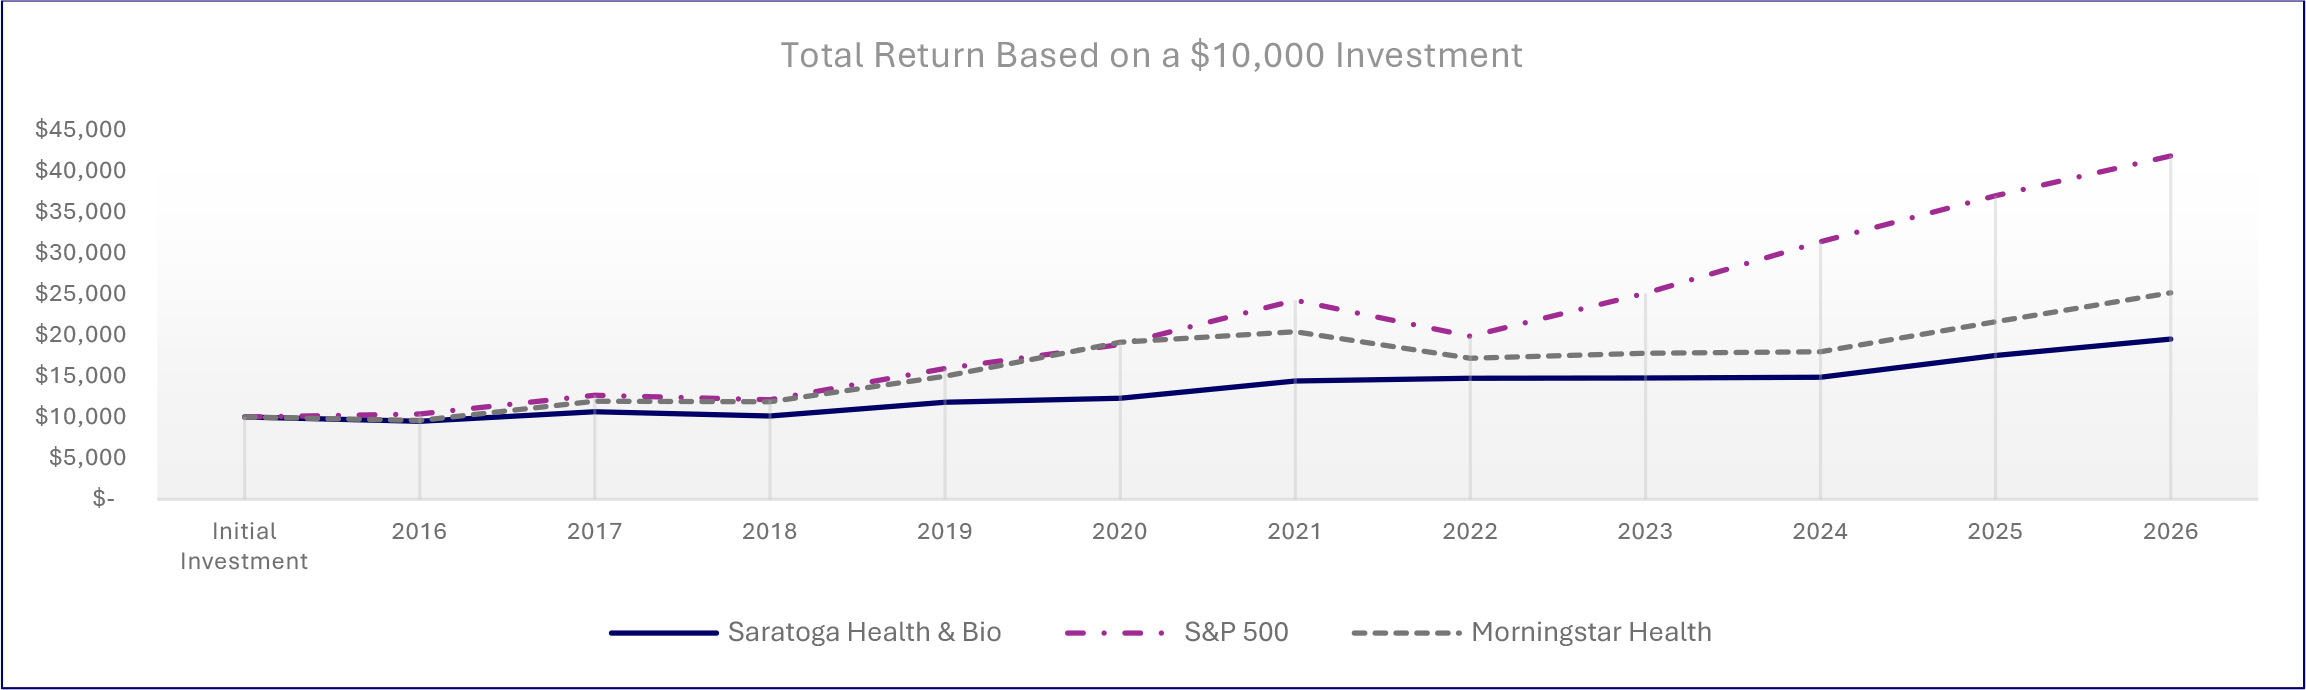
The chart below represents the historical performance of a hypothetical $10,000 investment over the past 10 years in the class of shares noted and assumes the reinvestment of dividends and capital gains and the maximum sales charge, if any. Fund expenses, including management fees, 12b-1 fees, if any, and other expenses were deducted.
| Average Annual Total Returns | |||
| 1 Year | 5 Years | 10 Years | |
| Saratoga Health & Biotechnology Fund, Class I | 28.92% | 6.37% | 6.90% |
| S&P 500® Index | 20.38% | 12.79% | 15.37% |
| Morningstar US Fund Health Category | 37.45% | 3.73% | 9.90% |
| Fund Statistics | |||
| Total Net Assets | $11,551,996 | Advisory Fees Paid by the Fund | $136,172 |
| Number of Portfolio Holdings | 29 | Portfolio Turnover Rate | 13% |
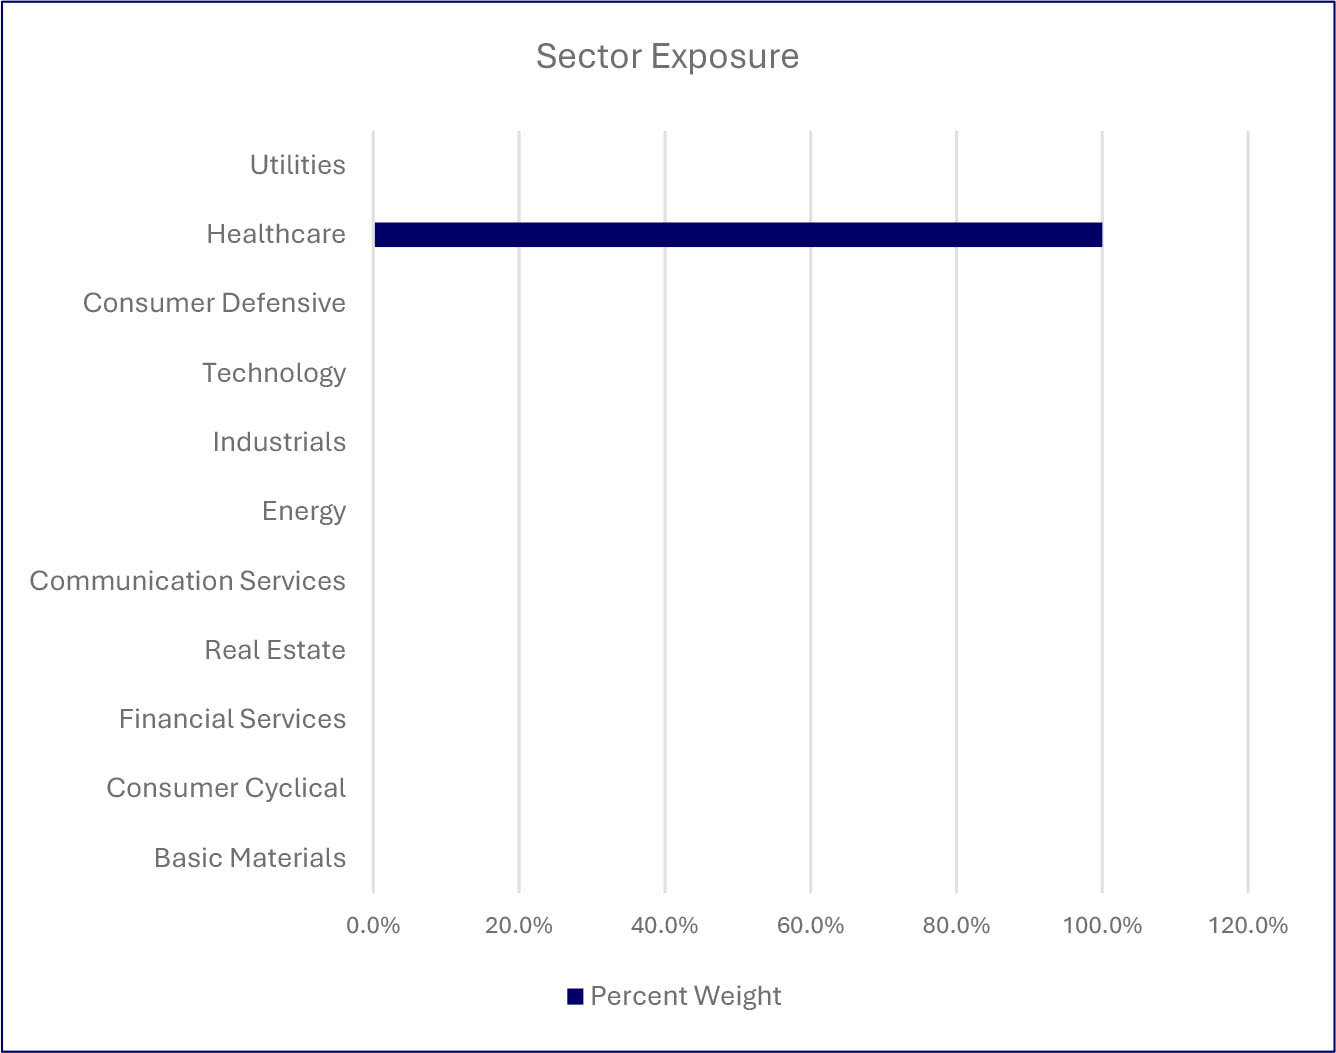
What did the Fund invest in (as a % of the Fund’s net assets)?
| Top Holdings (%) | |
| Jazz Pharmaceuticals plc | |
| Amgen Inc | |
| McKesson Corp | |
| Cardinal Health, Inc | |
| United Therapeutics Corp | |
| Cencora Inc | |
| Regeneron Pharmaceuticals, Inc | |
| Exelixis Inc | |
| Johnson & Johnson | |
| Novartis A. G. | |
| Material Fund changes during the period. |
| Below is a summary of certain changes, and planned changes, to the Fund during the reporting period. For more complete information, you may review the Fund’s next prospectus, which we expect to be available by December 31, 2026, at www.saratogacap.com/fund-reports or upon request at 1-888-672-4839. |
| During the period there were no material changes to the Fund. |
| What were the Fund’s costs for the last year (based on a hypothetical $10,000 investment)? | ||
| Fund | Costs of a $10,000 Investment | Costs paid as a % of a $10,000 Investment |
| Saratoga Technology & Communications Fund, Class A | $306 | 2.84% |
| What affected the Fund’s performance during this period? |
|
The Fund benefited from continued investment in artificial intelligence (AI) during the fiscal year, as the largest technology companies continued to spend heavily on data centers and computing infrastructure. The Fund’s semiconductor holdings remained a major beneficiary, and strength broadened to its holdings in semiconductor equipment, networking equipment and other areas tied to the AI buildout, which were among the Fund’s best performers.
The Fund’s Software and IT Services holdings were notable exceptions and were among its weaker areas for much of the period, as investors became increasingly concerned that advances in AI could disrupt the traditional business models of companies in those industries. Overall, the Fund’s holdings that supply or enable AI infrastructure generally performed well, while those viewed as potentially vulnerable to AI disruption faced a much more challenging environment. |
How did the Fund perform over the past 10 years?
The chart below represents the historical performance of a hypothetical $10,000 investment over the past 10 years in the class of shares noted and assumes the reinvestment of dividends and capital gains and the maximum sales charge, if any. Fund expenses, including management fees, 12b-1 fees, if any, and other expenses were deducted.
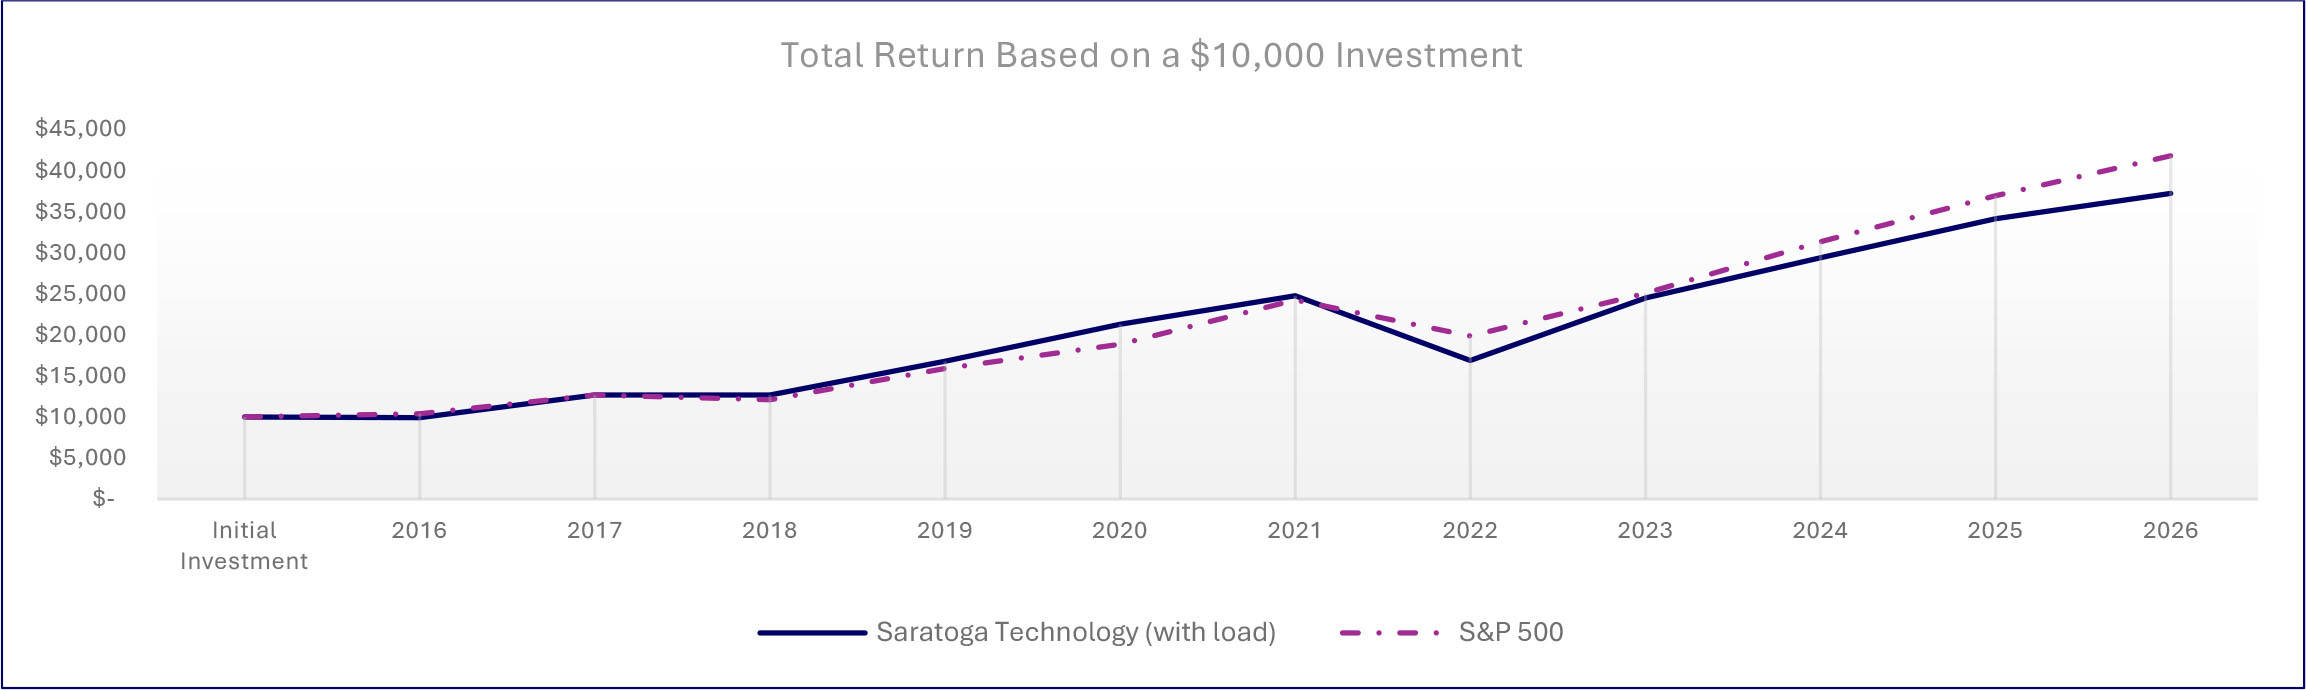
| Average Annual Total Returns | |||
| 1 Year | 5 Years | 10 Years | |
| Saratoga Technology & Communications Fund, Class A (with load) | 8.57% | 6.79% | 14.04% |
| Saratoga Technology & Communications Fund, Class A | 15.17% | 8.06% | 14.72% |
| S&P 500® Index | 20.38% | 12.79% | 15.37% |
| Fund Statistics | |||
| Total Net Assets | $40,874,084 | Advisory Fees Paid by the Fund | $510,427 |
| Number of Portfolio Holdings | 28 | Portfolio Turnover Rate | 16% |
What did the Fund invest in (as a % of the Fund’s net assets)?
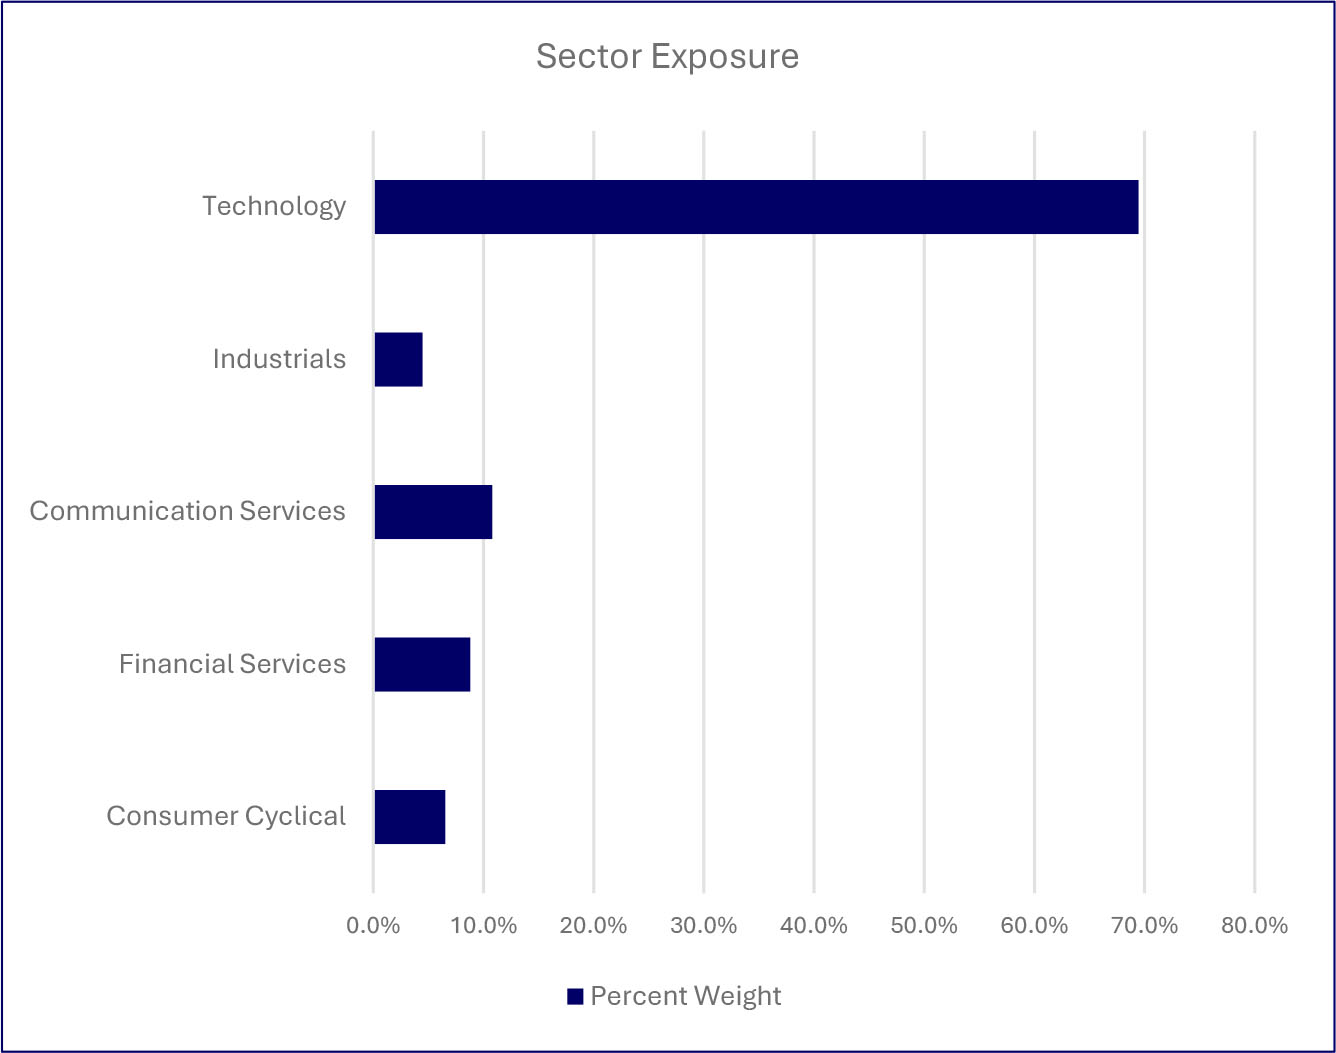
| Top Holdings (%) | |
| NVIDIA Corp | |
| Alphabet Inc, Class C | |
| Microsoft Corp | |
| Cisco Systems Inc | |
| Amazon.com, Inc | |
| KLA Corp | |
| Apple Inc | |
| Broadcom, Inc | |
| Visa, Inc Class A | |
| Mastercard, Inc Class A | |
| Material Fund changes during the period. |
| Below is a summary of certain changes, and planned changes, to the Fund during the reporting period. For more complete information, you may review the Fund’s next prospectus, which we expect to be available by December 31, 2026, at www.saratogacap.com/fund-reports or upon request at 1-888-672-4839. |
| During the period there were no material changes to the Fund. |
| What were the Fund’s costs for the last year (based on a hypothetical $10,000 investment)? | ||
| Fund | Costs of a $10,000 Investment | Costs paid as a % of a $10,000 Investment |
| Saratoga Technology & Communications Fund, Class C | $370 | 3.45% |
| What affected the Fund’s performance during this period? |
|
The Fund benefited from continued investment in artificial intelligence (AI) during the fiscal year, as the largest technology companies continued to spend heavily on data centers and computing infrastructure. The Fund’s semiconductor holdings remained a major beneficiary, and strength broadened to its holdings in semiconductor equipment, networking equipment and other areas tied to the AI buildout, which were among the Fund’s best performers.
The Fund’s Software and IT Services holdings were notable exceptions and were among its weaker areas for much of the period, as investors became increasingly concerned that advances in AI could disrupt the traditional business models of companies in those industries. Overall, the Fund’s holdings that supply or enable AI infrastructure generally performed well, while those viewed as potentially vulnerable to AI disruption faced a much more challenging environment. |
How did the Fund perform over the past 10 years?
The chart below represents the historical performance of a hypothetical $10,000 investment over the past 10 years in the class of shares noted and assumes the reinvestment of dividends and capital gains and the maximum sales charge, if any. Fund expenses, including management fees, 12b-1 fees, if any, and other expenses were deducted.
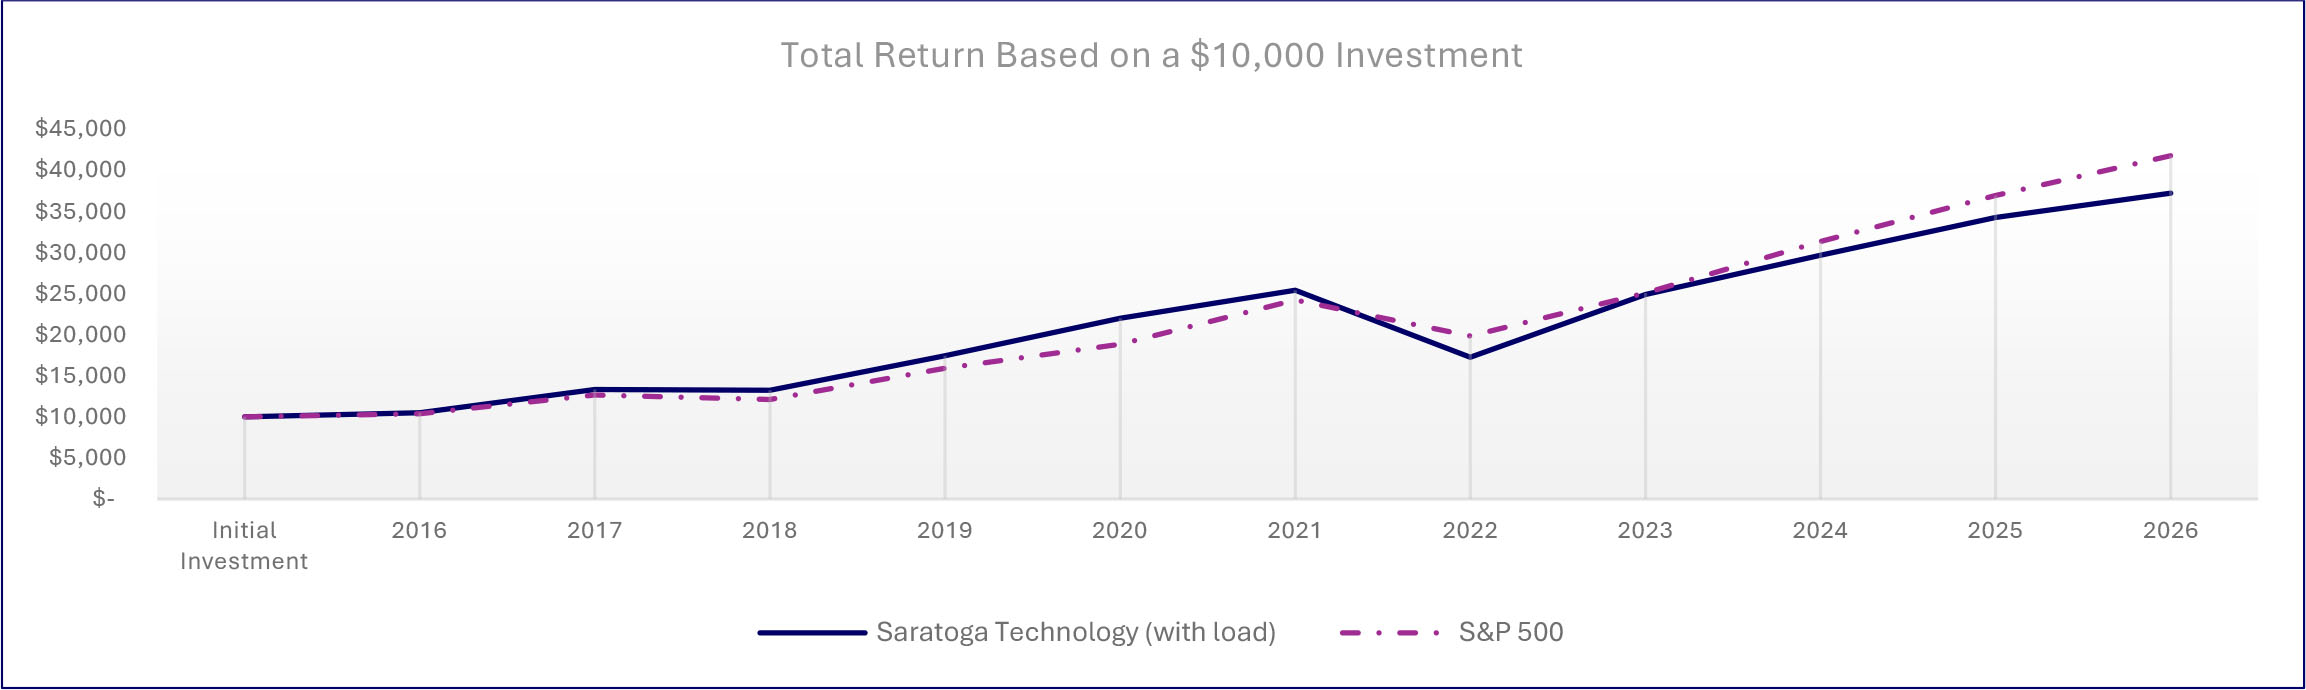
| Average Annual Total Returns | |||
| 1 Year | 5 Years | 10 Years | |
| Saratoga Technology & Communications Fund, Class C (with load) | 13.50% | 7.44% | 14.05% |
| Saratoga Technology & Communications Fund, Class C | 14.50% | 7.44% | 14.05% |
| S&P 500® Index | 20.38% | 12.79% | 15.37% |
| Fund Statistics | |||
| Total Net Assets | $40,874,084 | Advisory Fees Paid by the Fund | $510,427 |
| Number of Portfolio Holdings | 28 | Portfolio Turnover Rate | 16% |
What did the Fund invest in (as a % of the Fund’s net assets)?
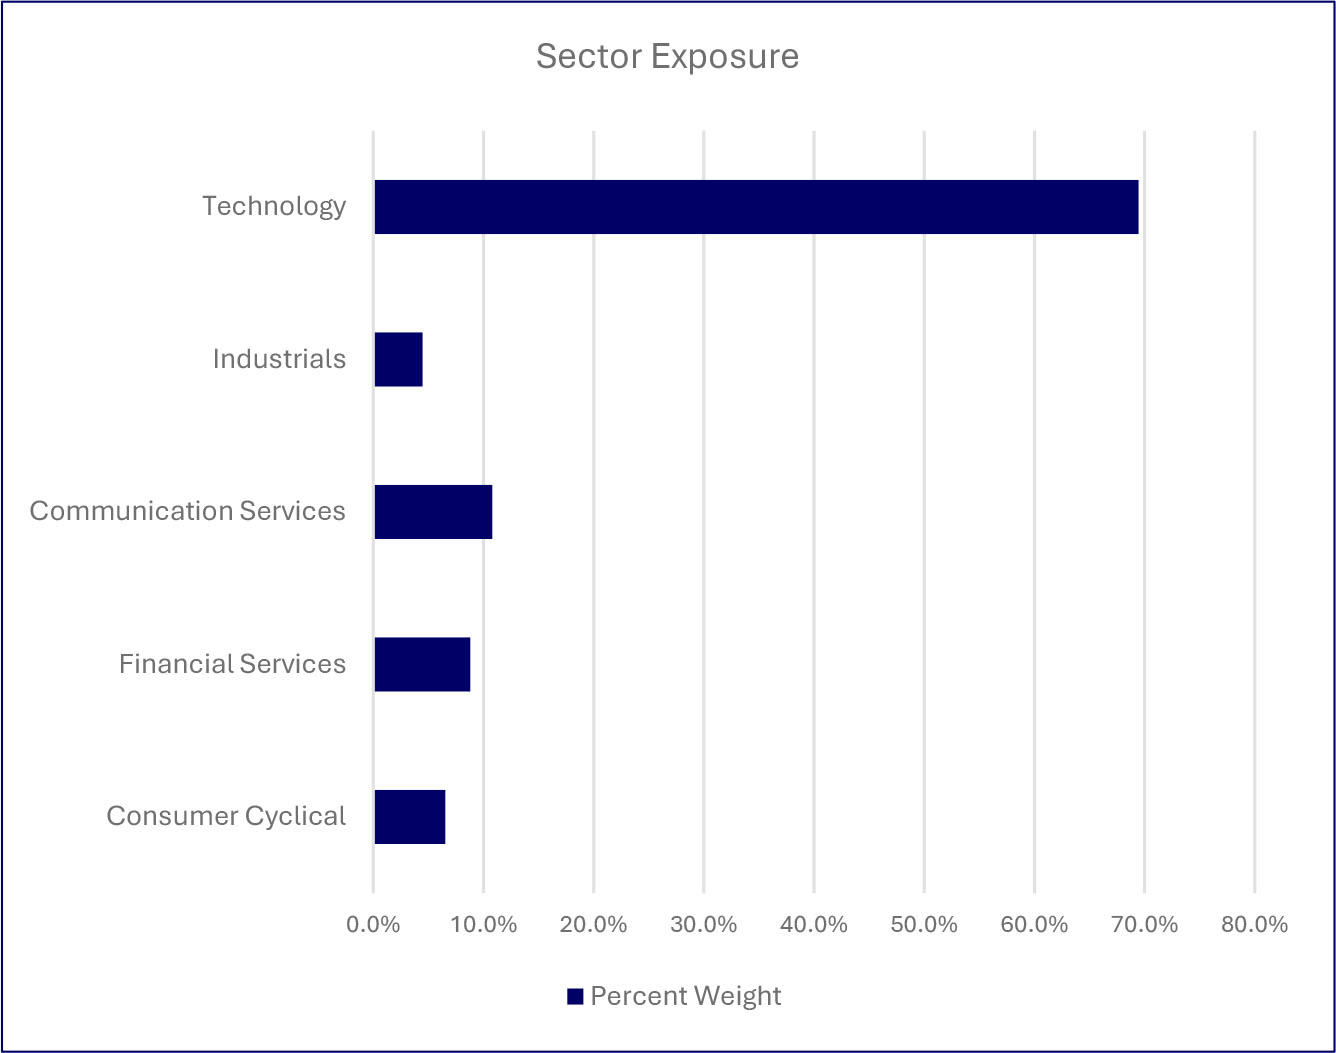
| Top Holdings (%) | |
| NVIDIA Corp | |
| Alphabet Inc, Class C | |
| Microsoft Corp | |
| Cisco Systems Inc | |
| Amazon.com, Inc | |
| KLA Corp | |
| Apple Inc | |
| Broadcom, Inc | |
| Visa, Inc Class A | |
| Mastercard, Inc Class A | |
| Material Fund changes during the period. |
| Below is a summary of certain changes, and planned changes, to the Fund during the reporting period. For more complete information, you may review the Fund’s next prospectus, which we expect to be available by December 31, 2026, at www.saratogacap.com/fund-reports or upon request at 1-888-672-4839. |
| During the period there were no material changes to the Fund. |
| What were the Fund’s costs for the last year (based on a hypothetical $10,000 investment)? | ||
| Fund | Costs of a $10,000 Investment | Costs paid as a % of a $10,000 Investment |
| Saratoga Technology & Communications Fund, Class I | $263 | 2.44% |
| What affected the Fund’s performance during this period? |
|
The Fund benefited from continued investment in artificial intelligence (AI) during the fiscal year, as the largest technology companies continued to spend heavily on data centers and computing infrastructure. The Fund’s semiconductor holdings remained a major beneficiary, and strength broadened to its holdings in semiconductor equipment, networking equipment and other areas tied to the AI buildout, which were among the Fund’s best performers.
The Fund’s Software and IT Services holdings were notable exceptions and were among its weaker areas for much of the period, as investors became increasingly concerned that advances in AI could disrupt the traditional business models of companies in those industries. Overall, the Fund’s holdings that supply or enable AI infrastructure generally performed well, while those viewed as potentially vulnerable to AI disruption faced a much more challenging environment. |
How did the Fund perform over the past 10 years?
The chart below represents the historical performance of a hypothetical $10,000 investment over the past 10 years in the class of shares noted and assumes the reinvestment of dividends and capital gains and the maximum sales charge, if any. Fund expenses, including management fees, 12b-1 fees, if any, and other expenses were deducted.
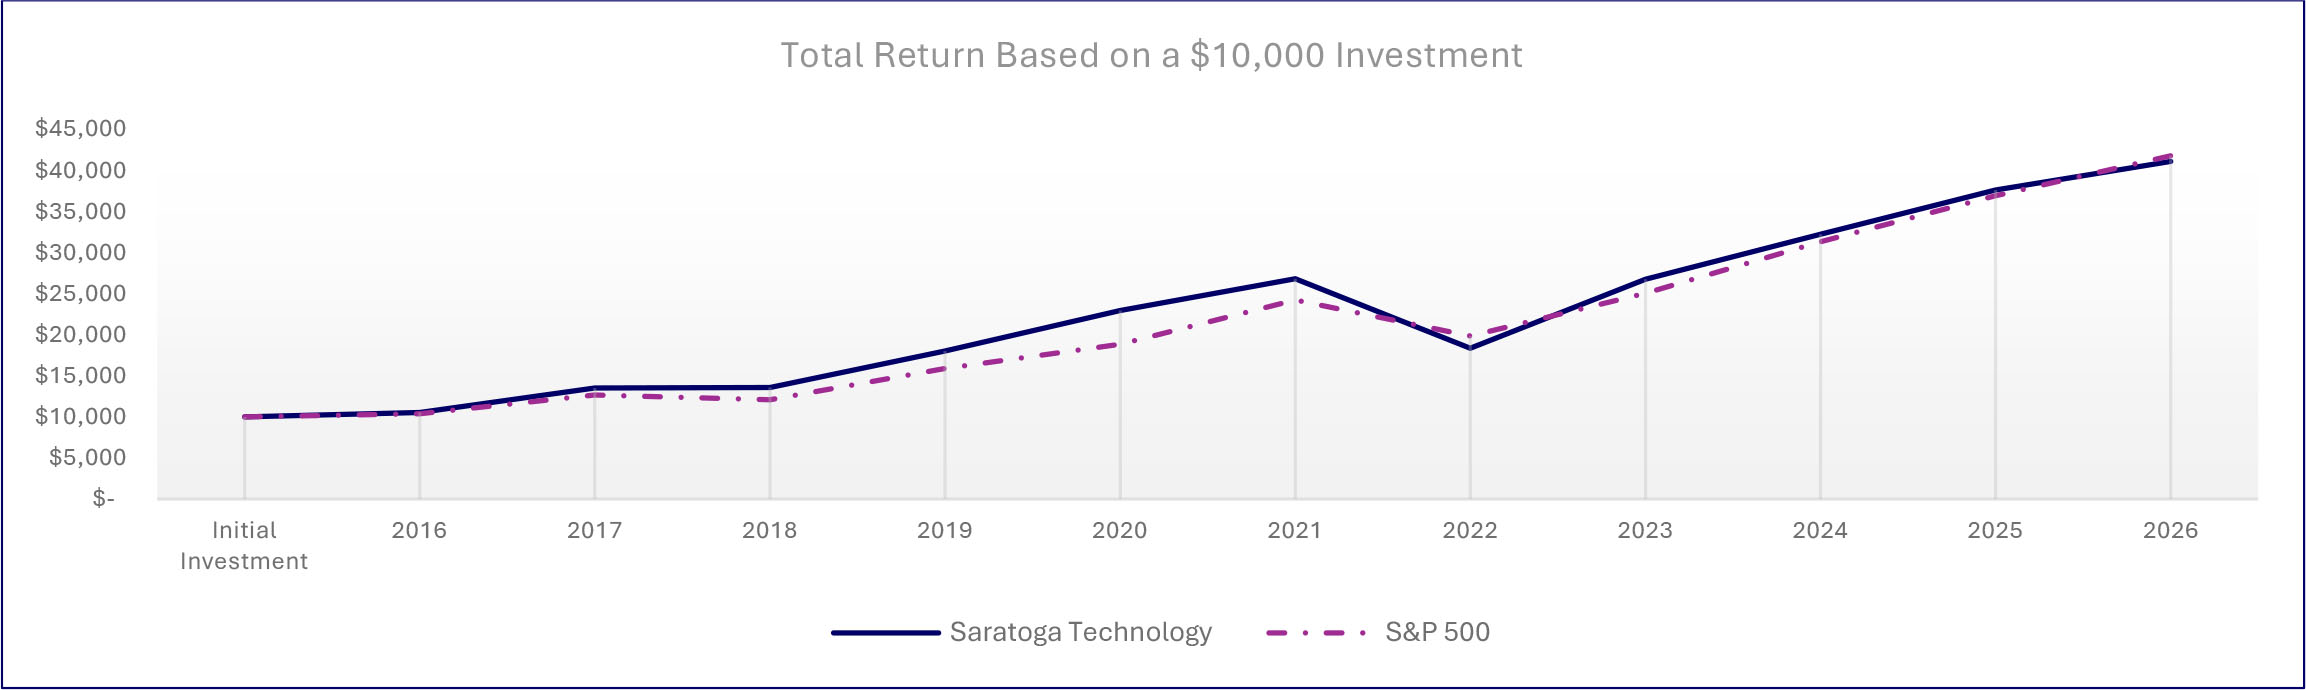
| Average Annual Total Returns | |||
| 1 Year | 5 Years | 10 Years | |
| Saratoga Technology & Communications Fund, Class I | 15.59% | 8.50% | 15.18% |
| S&P 500® Index | 20.38% | 12.79% | 15.37% |
| Fund Statistics | |||
| Total Net Assets | $40,874,084 | Advisory Fees Paid by the Fund | $510,427 |
| Number of Portfolio Holdings | 28 | Portfolio Turnover Rate | 16% |
What did the Fund invest in (as a % of the Fund’s net assets)?
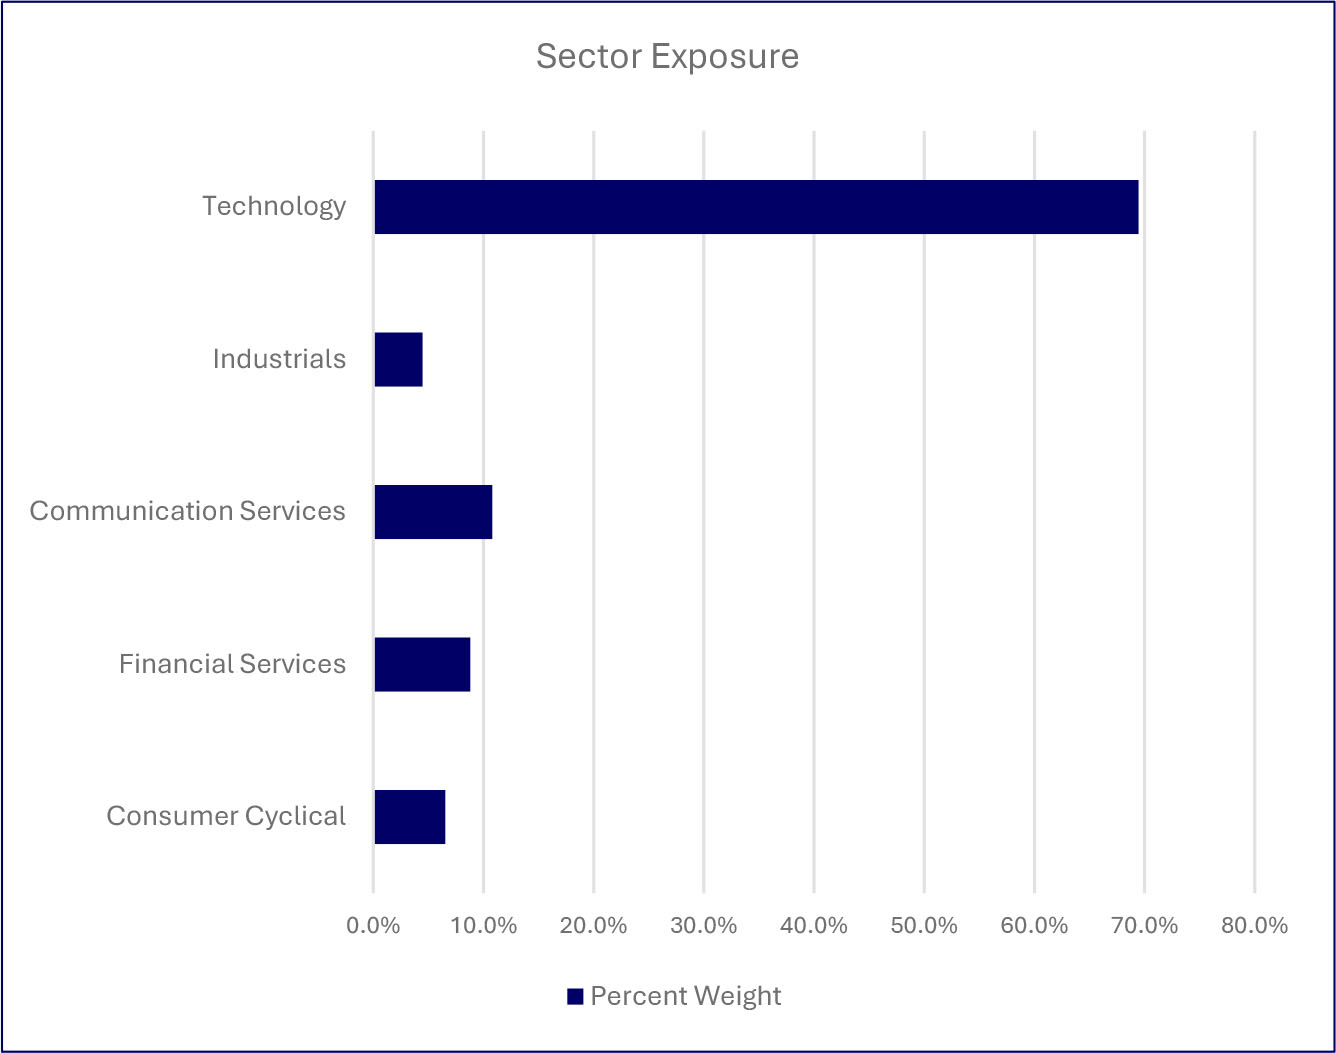
| Top Holdings (%) | |
| NVIDIA Corp | |
| Alphabet Inc, Class C | |
| Microsoft Corp | |
| Cisco Systems Inc | |
| Amazon.com, Inc | |
| KLA Corp | |
| Apple Inc | |
| Broadcom, Inc | |
| Visa, Inc Class A | |
| Mastercard, Inc Class A | |
| Material Fund changes during the period. |
| Below is a summary of certain changes, and planned changes, to the Fund during the reporting period. For more complete information, you may review the Fund’s next prospectus, which we expect to be available by December 31, 2026, at www.saratogacap.com/fund-reports or upon request at 1-888-672-4839. |
| During the period there were no material changes to the Fund. |
| What were the Fund’s costs for the last year (based on a hypothetical $10,000 investment)? | ||
| Fund | Costs of a $10,000 Investment | Costs paid as a % of a $10,000 Investment |
| Saratoga Investment Quality Bond Fund, Class A | $231 | 2.32% |
| What affected the Fund’s performance during this period? |
|
During the period, the Fund’s performance was largely driven by its concentration in the Intermediate-Term debt sector, which trailed the Short-Term debt sector, but outperformed the Long-Term debt sector. The Fund sold its position in the Long-Term debt sector and added a position in the Short-Term debt sector, which helped performance, as the Short-Term debt sector outperformed both the Intermediate- and Long-Term debt sectors.
From a security-selection standpoint, the Fund’s use of the Vanguard Intermediate-Term Bond Index Fund hurt performance, as it trailed its active counterparts. |
How did the Fund perform over the past 10 years?
The chart below represents the historical performance of a hypothetical $10,000 investment over the past 10 years in the class of shares noted and assumes the reinvestment of dividends and capital gains and the maximum sales charge, if any. Fund expenses, including management fees, 12b-1 fees, if any, and other expenses were deducted.
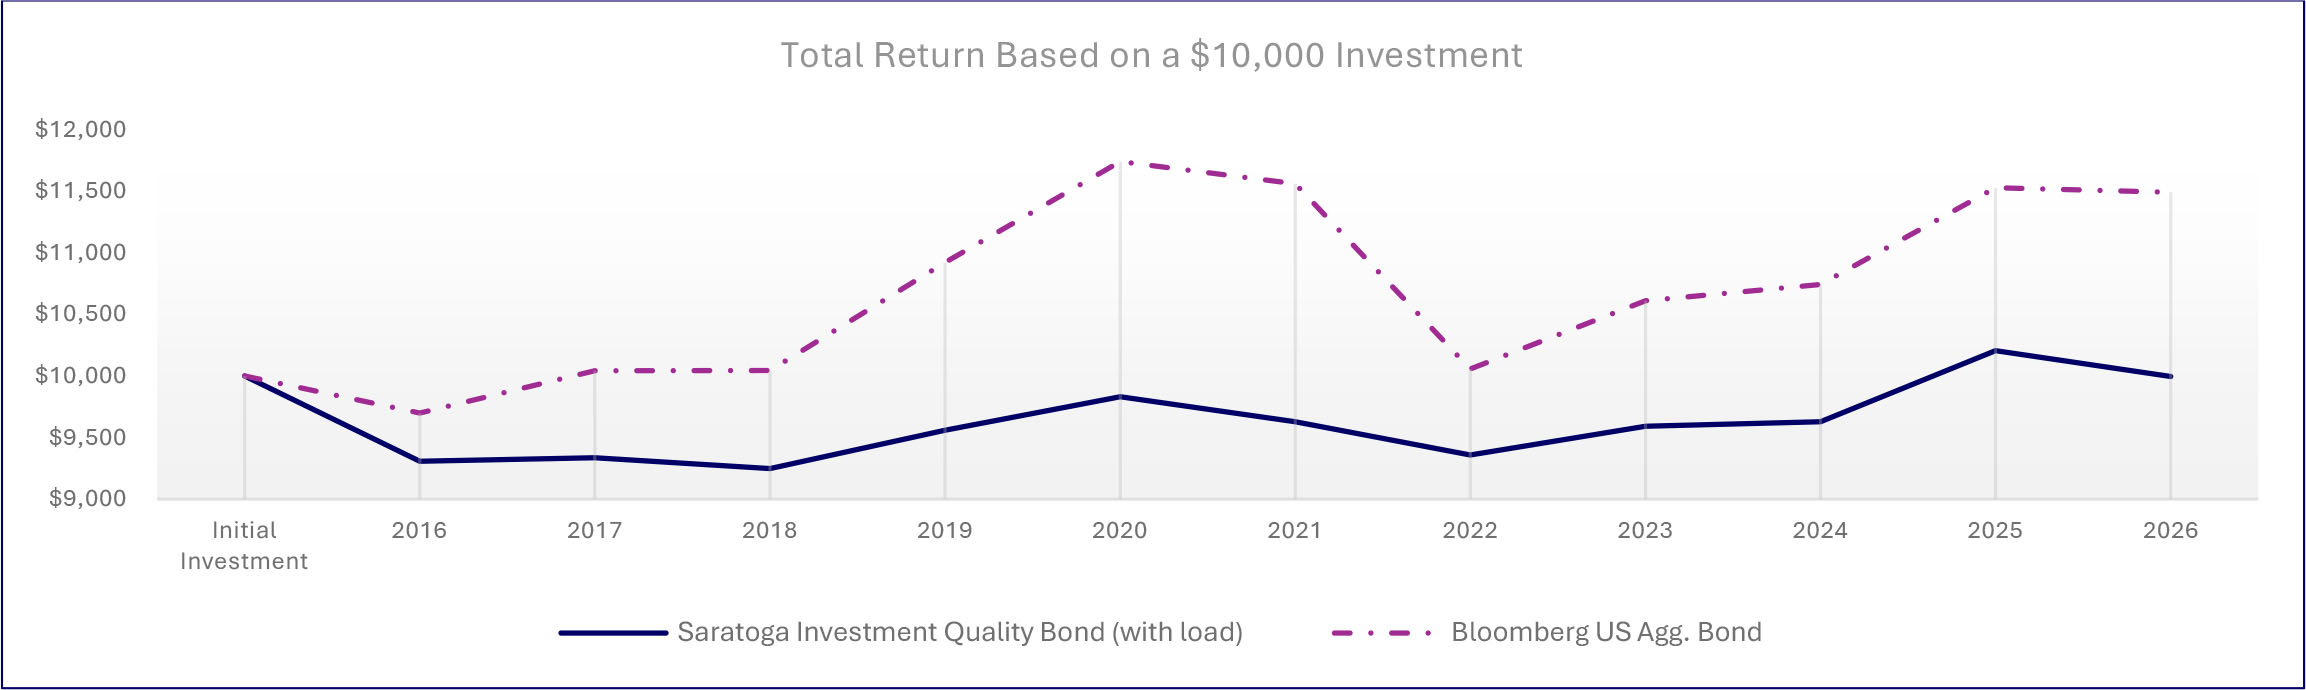
| Average Annual Total Returns | |||
| 1 Year | 5 Years | 10 Years | |
| Saratoga Investment Quality Bond Fund, Class A (with load) | -6.60% | -0.64% | 0.00% |
| Saratoga Investment Quality Bond Fund, Class A | -0.88% | 0.55% | 0.59% |
| Bloomberg US Aggregate Bond Index | 1.89% | -0.29% | 1.40% |
| Fund Statistics | |||
| Total Net Assets | $7,346,732 | Advisory Fees Paid by the Fund | $44,242 |
| Number of Portfolio Holdings | 3 | Portfolio Turnover Rate | 15% |
What did the Fund invest in (as a % of the Fund’s net assets)?
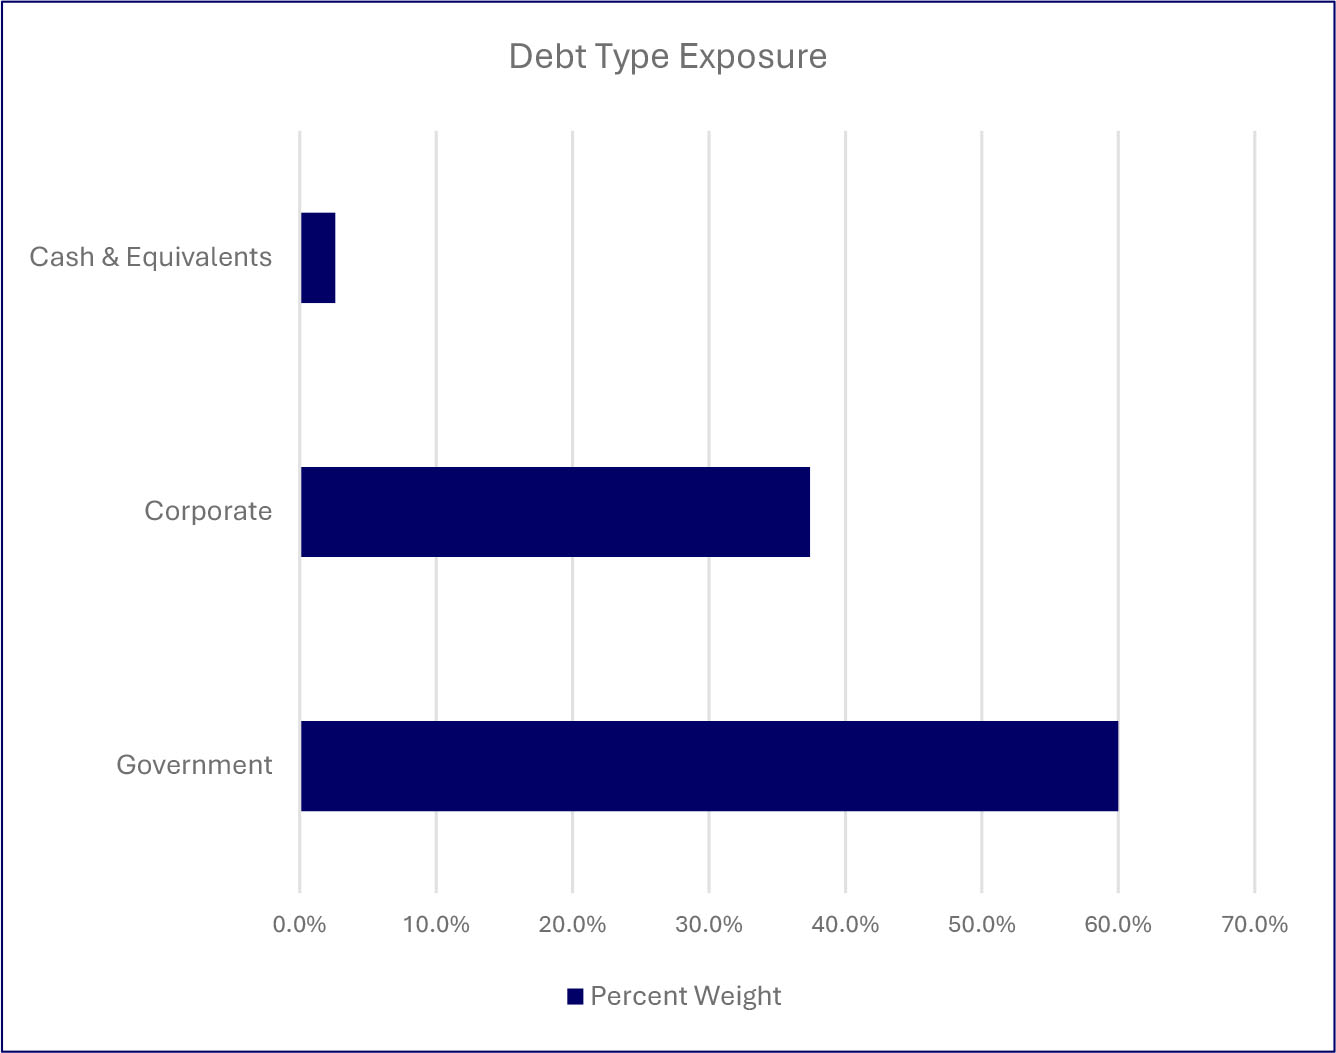
| Top Holdings (%) | |
| Vanguard Intermediate-Term Bond Index Fund Admiral Class | |
| Vanguard Short-Term Bond Index Fund, Admiral Class | |
| Dreyfus Inst Prefer Govt Money Mkt Inst Class | |
| Material Fund changes during the period. |
| Below is a summary of certain changes, and planned changes, to the Fund during the reporting period. For more complete information, you may review the Fund’s next prospectus, which we expect to be available by December 31, 2026, at www.saratogacap.com/fund-reports or upon request at 1-888-672-4839. |
| During the period there were no material changes to the Fund. |
| What were the Fund’s costs for the last year (based on a hypothetical $10,000 investment)? | ||
| Fund | Costs of a $10,000 Investment | Costs paid as a % of a $10,000 Investment |
| Saratoga Investment Quality Bond Fund, Class C | $243 | 2.45% |
| What affected the Fund’s performance during this period? |
|
During the period, the Fund’s performance was largely driven by its concentration in the Intermediate-Term debt sector, which trailed the Short-Term debt sector, but outperformed the Long-Term debt sector. The Fund sold its position in the Long-Term debt sector and added a position in the Short-Term debt sector, which helped performance, as the Short-Term debt sector outperformed both the Intermediate- and Long-Term debt sectors.
From a security-selection standpoint, the Fund’s use of the Vanguard Intermediate-Term Bond Index Fund hurt performance, as it trailed its active counterparts. |
How did the Fund perform over the past 10 years?
The chart below represents the historical performance of a hypothetical $10,000 investment over the past 10 years in the class of shares noted and assumes the reinvestment of dividends and capital gains and the maximum sales charge, if any. Fund expenses, including management fees, 12b-1 fees, if any, and other expenses were deducted.
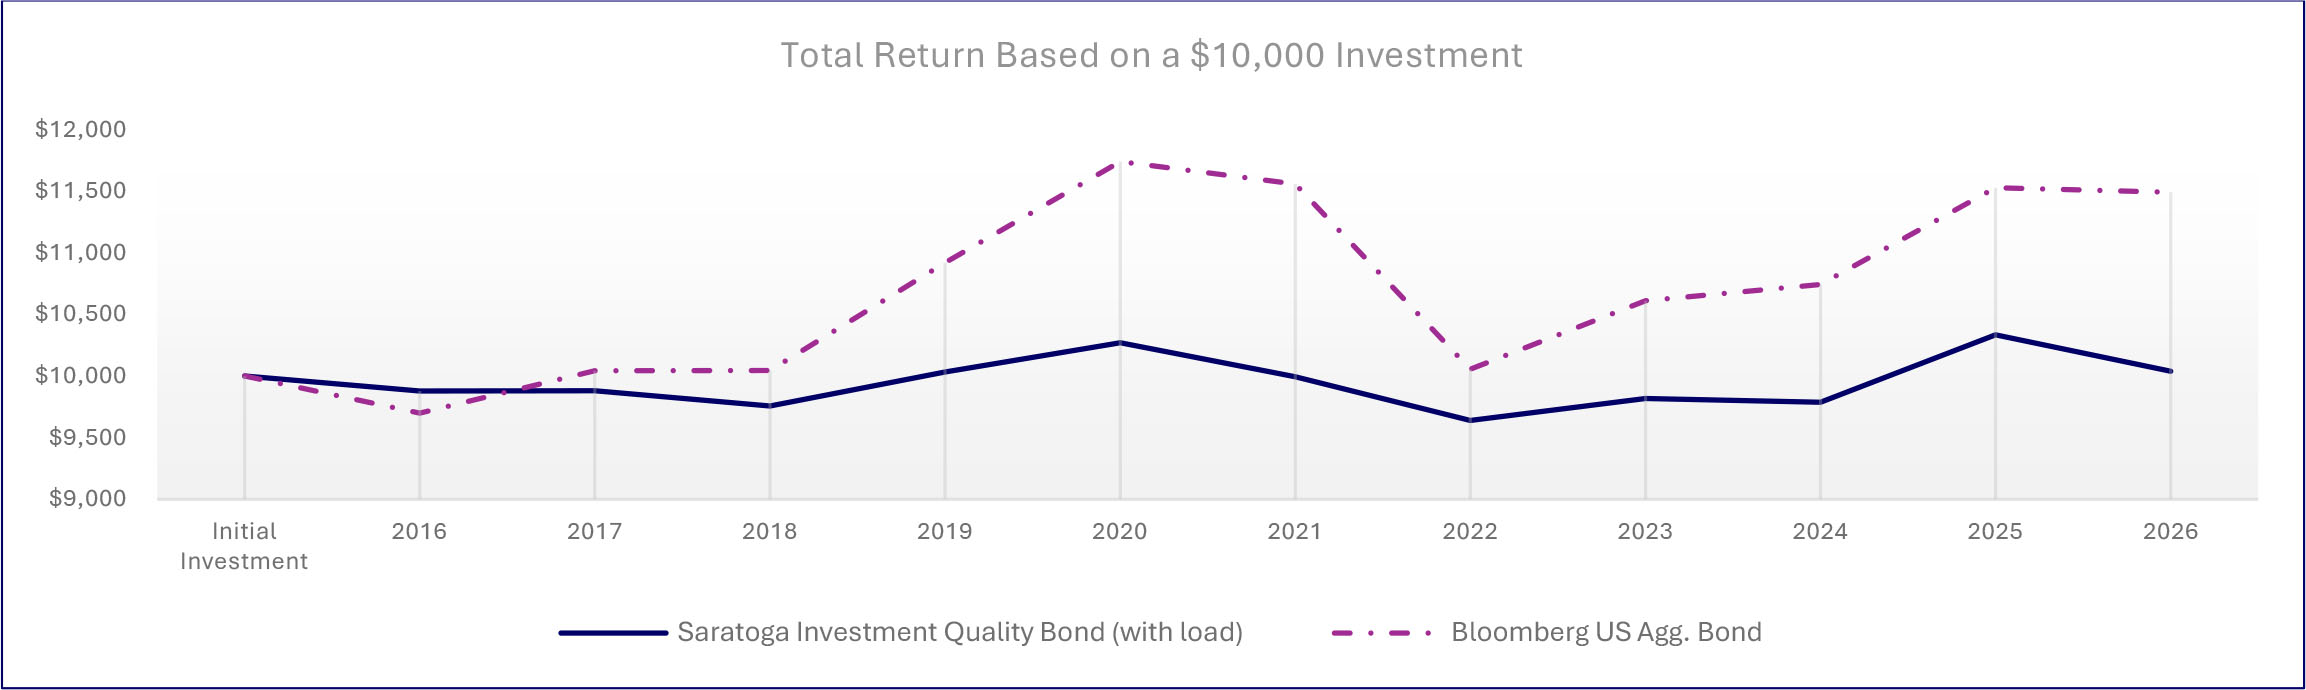
| Average Annual Total Returns | |||
| 1 Year | 5 Years | 10 Years | |
| Saratoga Investment Quality Bond Fund, Class C (with load) | -2.85% | -0.15% | 0.04% |
| Saratoga Investment Quality Bond Fund, Class C | -1.85% | -0.15% | 0.04% |
| Bloomberg US Aggregate Bond Index | 1.89% | -0.29% | 1.40% |
| Fund Statistics | |||
| Total Net Assets | $7,346,732 | Advisory Fees Paid by the Fund | $44,242 |
| Number of Portfolio Holdings | 3 | Portfolio Turnover Rate | 15% |
What did the Fund invest in (as a % of the Fund’s net assets)?
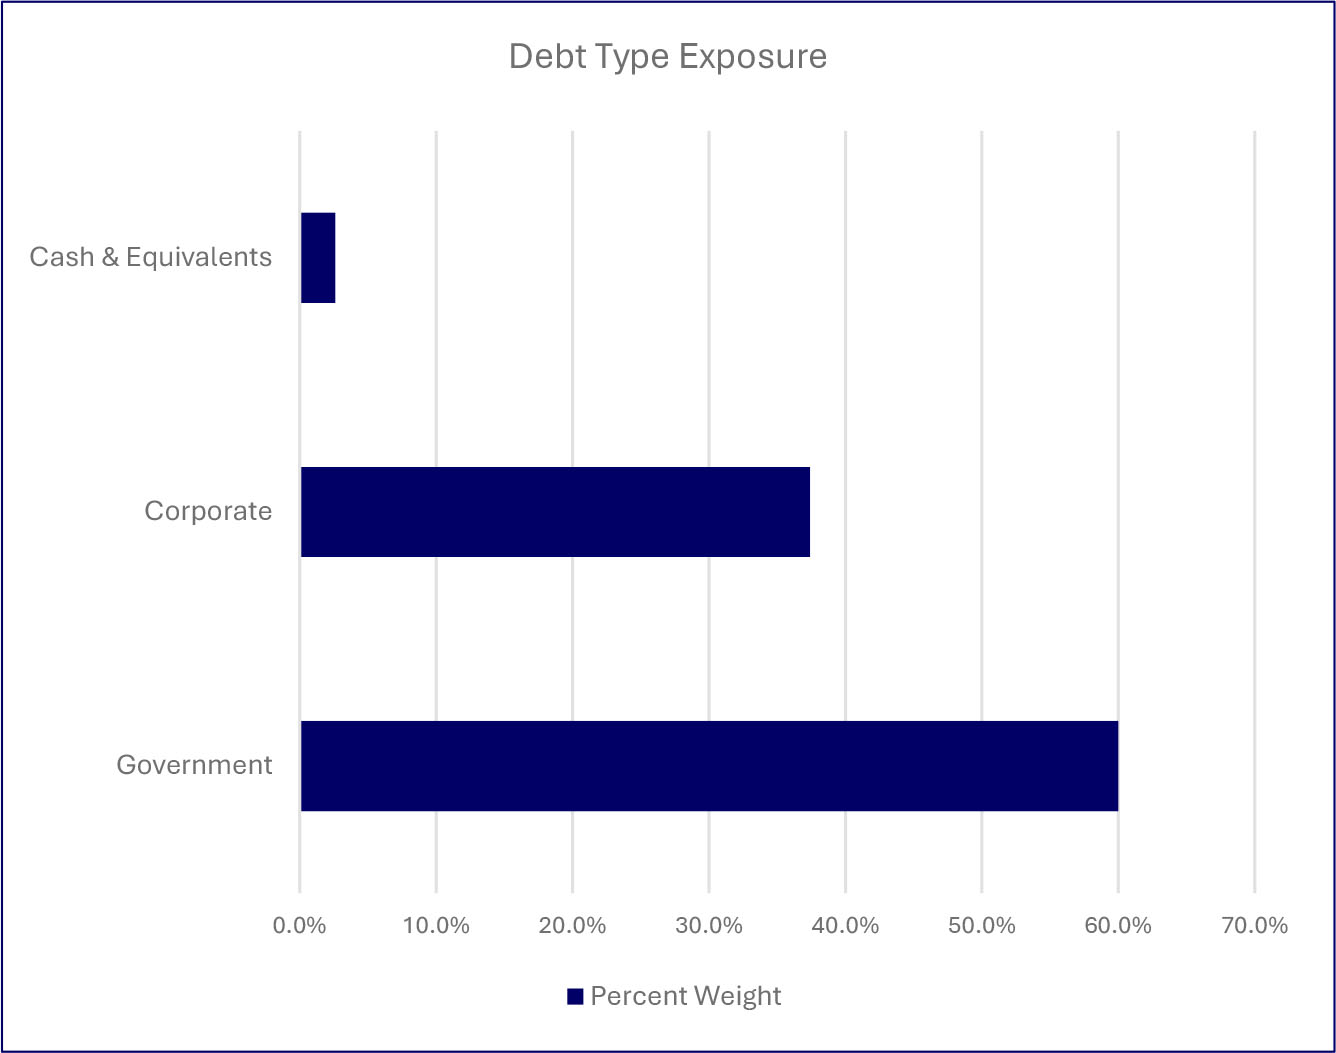
| Top Holdings (%) | |
| Vanguard Intermediate-Term Bond Index Fund Admiral Class | |
| Vanguard Short-Term Bond Index Fund, Admiral Class | |
| Dreyfus Inst Prefer Govt Money Mkt Inst Class | |
| Material Fund changes during the period. |
| Below is a summary of certain changes, and planned changes, to the Fund during the reporting period. For more complete information, you may review the Fund’s next prospectus, which we expect to be available by December 31, 2026, at www.saratogacap.com/fund-reports or upon request at 1-888-672-4839. |
| During the period there were no material changes to the Fund. |
| What were the Fund’s costs for the last year (based on a hypothetical $10,000 investment)? | ||
| Fund | Costs of a $10,000 Investment | Costs paid as a % of a $10,000 Investment |
| Saratoga Investment Quality Bond Fund, Class I | $191 | 1.92% |
| What affected the Fund’s performance during this period? |
|
During the period, the Fund’s performance was largely driven by its concentration in the Intermediate-Term debt sector, which trailed the Short-Term debt sector, but outperformed the Long-Term debt sector. The Fund sold its position in the Long-Term debt sector and added a position in the Short-Term debt sector, which helped performance, as the Short-Term debt sector outperformed both the Intermediate- and Long-Term debt sectors.
From a security-selection standpoint, the Fund’s use of the Vanguard Intermediate-Term Bond Index Fund hurt performance, as it trailed its active counterparts. |
How did the Fund perform over the past 10 years?
The chart below represents the historical performance of a hypothetical $10,000 investment over the past 10 years in the class of shares noted and assumes the reinvestment of dividends and capital gains and the maximum sales charge, if any. Fund expenses, including management fees, 12b-1 fees, if any, and other expenses were deducted.
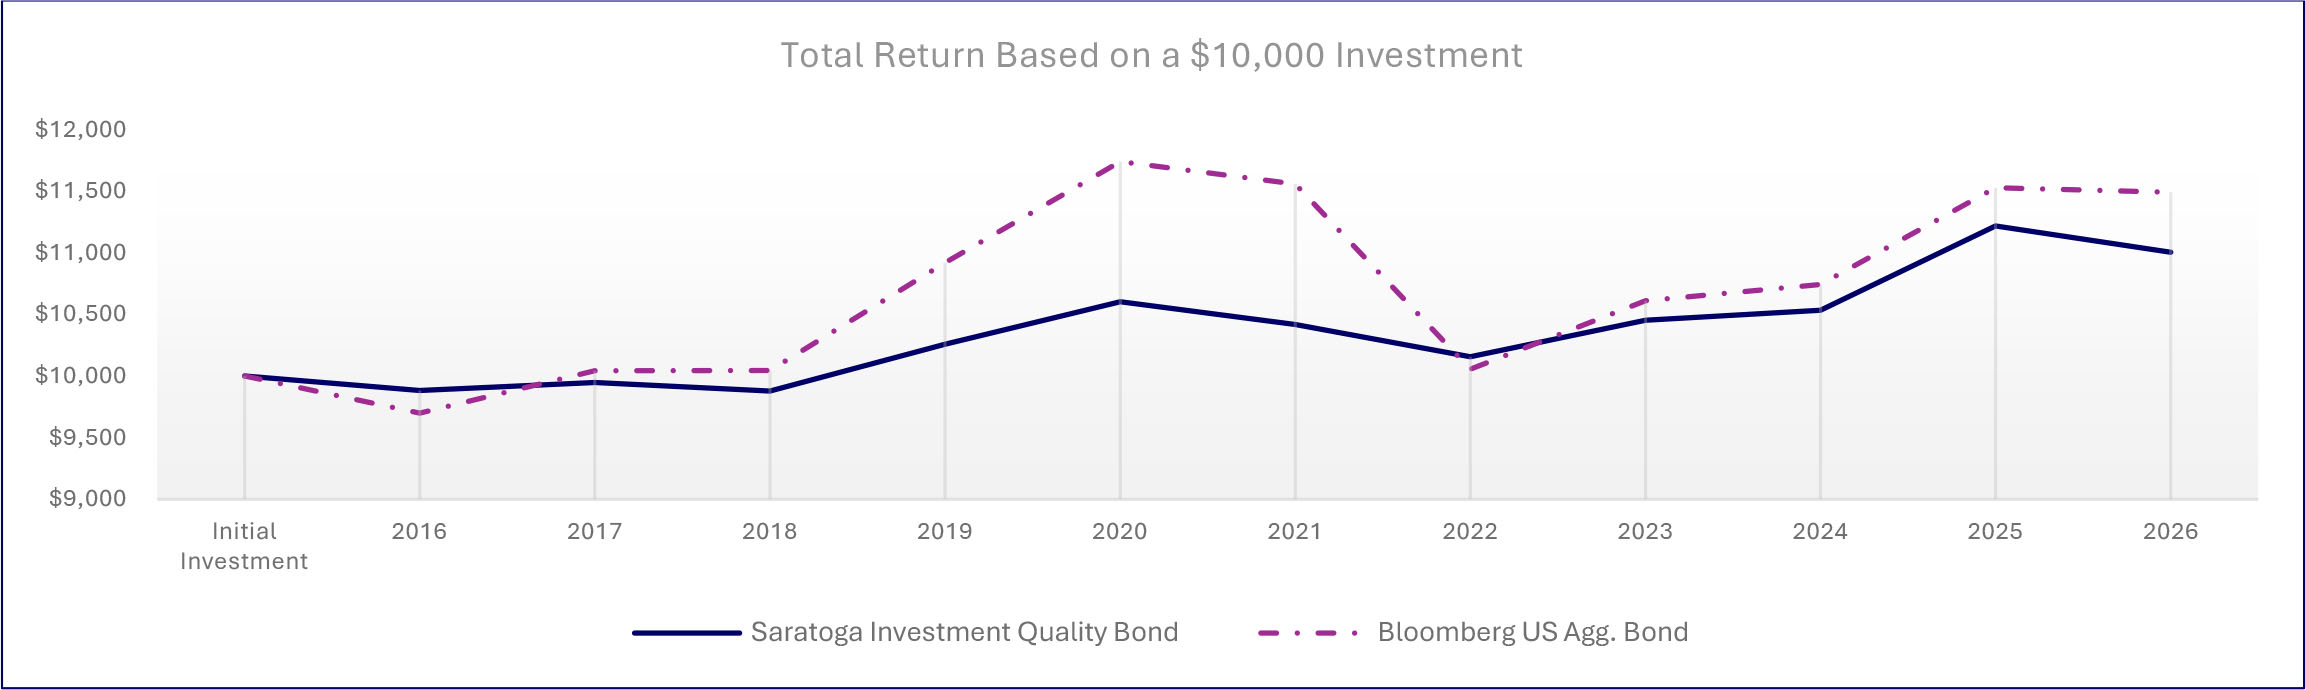
| Average Annual Total Returns | |||
| 1 Year | 5 Years | 10 Years | |
| Saratoga Investment Quality Bond Fund, Class I | -0.62% | 0.92% | 0.97% |
| Bloomberg US Aggregate Bond Index | 1.89% | -0.29% | 1.40% |
| Fund Statistics | |||
| Total Net Assets | $7,346,732 | Advisory Fees Paid by the Fund | $44,242 |
| Number of Portfolio Holdings | 3 | Portfolio Turnover Rate | 15% |
What did the Fund invest in (as a % of the Fund’s net assets)?
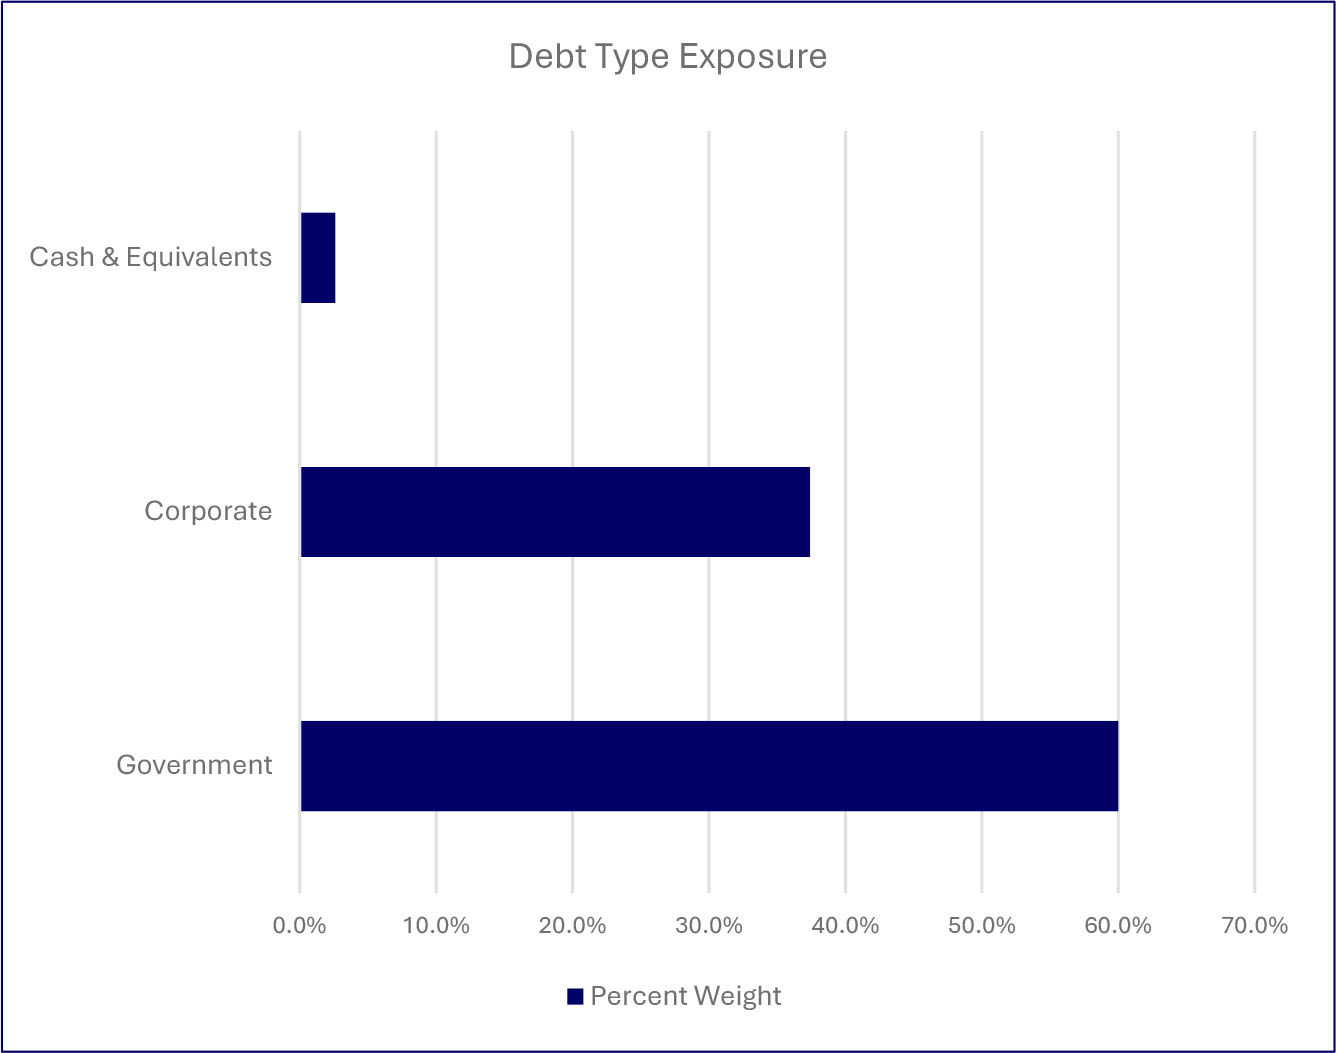
| Top Holdings (%) | |
| Vanguard Intermediate-Term Bond Index Fund Admiral Class | |
| Vanguard Short-Term Bond Index Fund, Admiral Class | |
| Dreyfus Inst Prefer Govt Money Mkt Inst Class | |
| Material Fund changes during the period. |
| Below is a summary of certain changes, and planned changes, to the Fund during the reporting period. For more complete information, you may review the Fund’s next prospectus, which we expect to be available by December 31, 2026, at www.saratogacap.com/fund-reports or upon request at 1-888-672-4839. |
| During the period there were no material changes to the Fund. |
| What were the Fund’s costs for the last year (based on a hypothetical $10,000 investment)? | ||
| Fund | Costs of a $10,000 Investment | Costs paid as a % of a $10,000 Investment |
| Saratoga US Government Money Market Fund, Class A | $189 | 1.87% |
| Fund Statistics | |||
| Total Net Assets | $4,054,006 | Advisory Fees Paid by the Fund | $20,190 |
| Number of Portfolio Holdings | 4 | Portfolio Turnover Rate | NA |
What did the Fund invest in (as a % of the Fund’s net assets)?
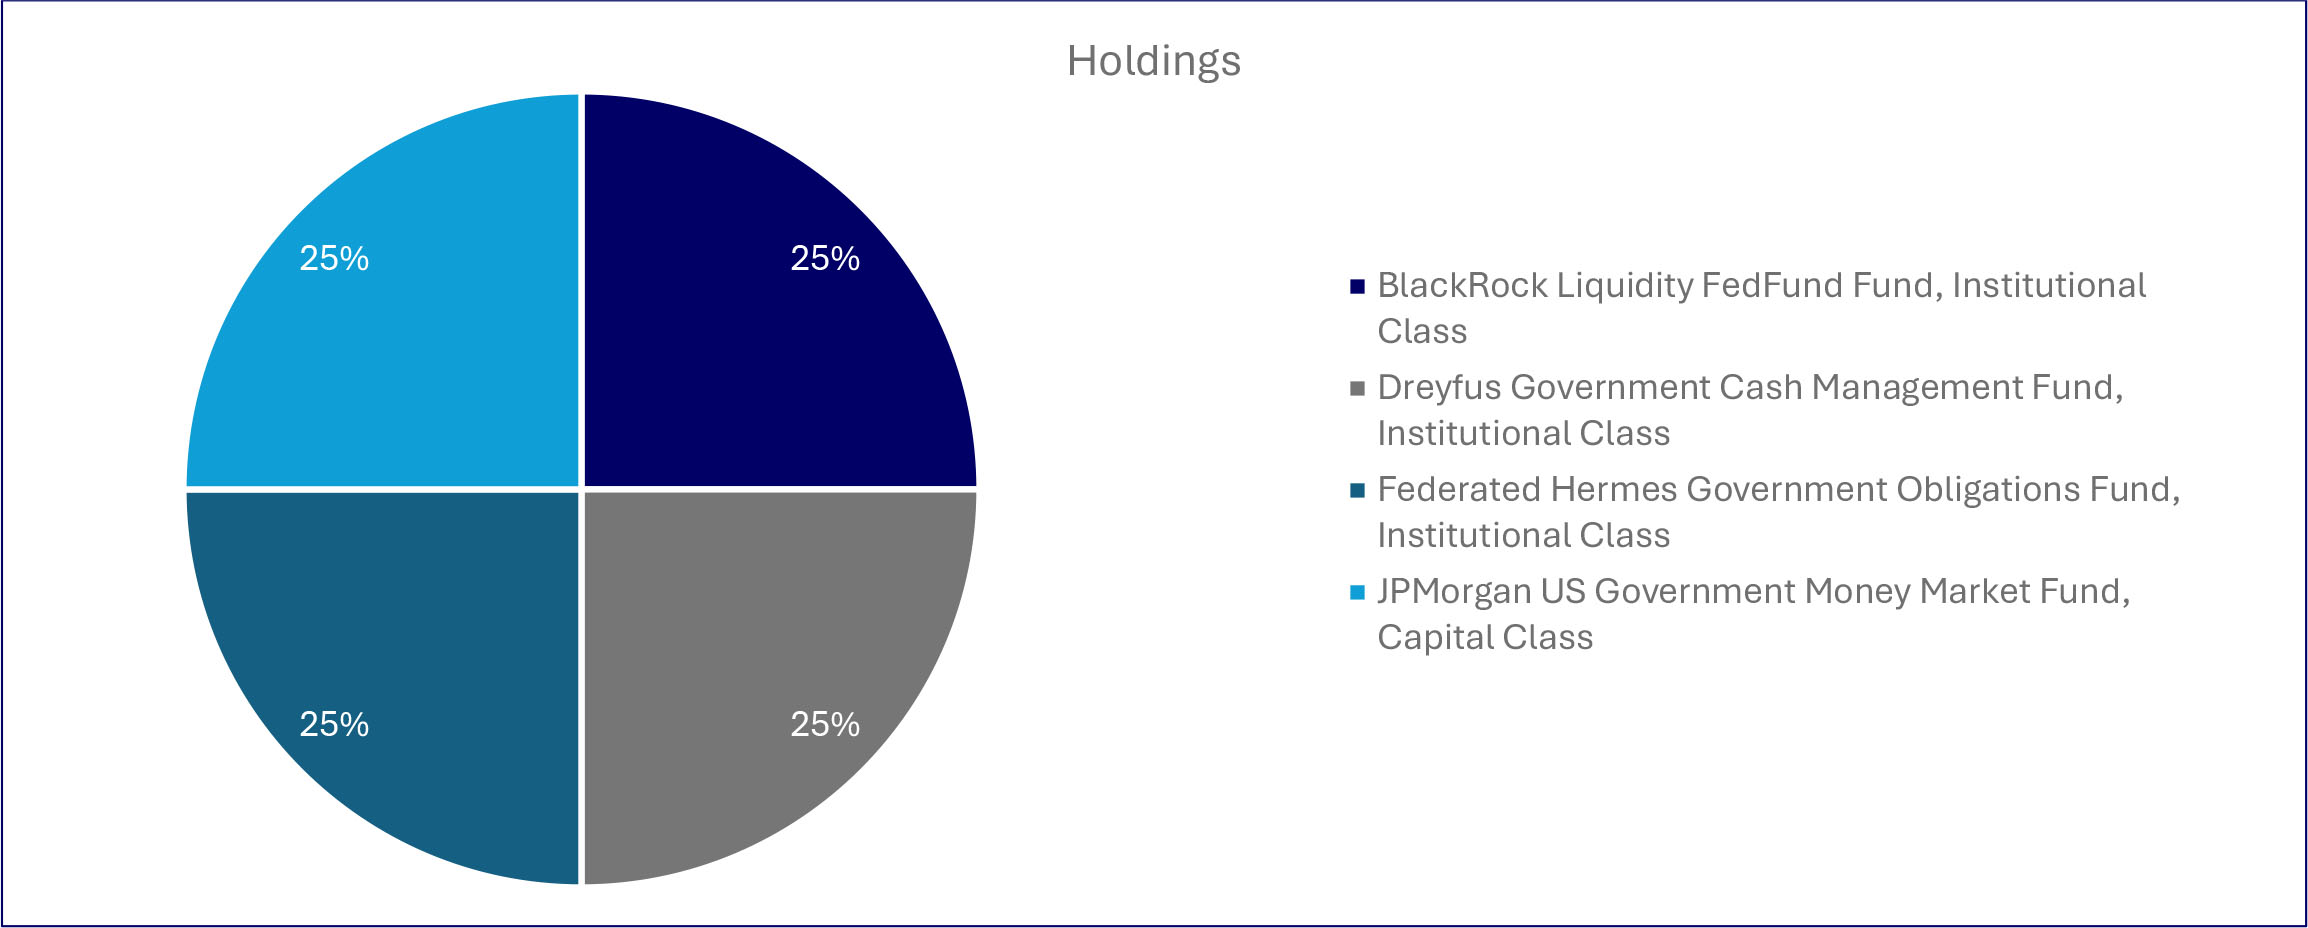
| Material Fund changes during the period. |
| Below is a summary of certain changes, and planned changes, to the Fund during the reporting period. For more complete information, you may review the Fund’s next prospectus, which we expect to be available by December 31, 2026, at www.saratogacap.com/fund-reports or upon request at 1-888-672-4839. |
| During the period there were no material changes to the Fund. |
| What were the Fund’s costs for the last year (based on a hypothetical $10,000 investment)? | ||
| Fund | Costs of a $10,000 Investment | Costs paid as a % of a $10,000 Investment |
| Saratoga US Government Money Market Fund, Class C | $247 | 2.46% |
| Fund Statistics | |||
| Total Net Assets | $4,054,006 | Advisory Fees Paid by the Fund | $20,190 |
| Number of Portfolio Holdings | 4 | Portfolio Turnover Rate | NA |
What did the Fund invest in (as a % of the Fund’s net assets)?
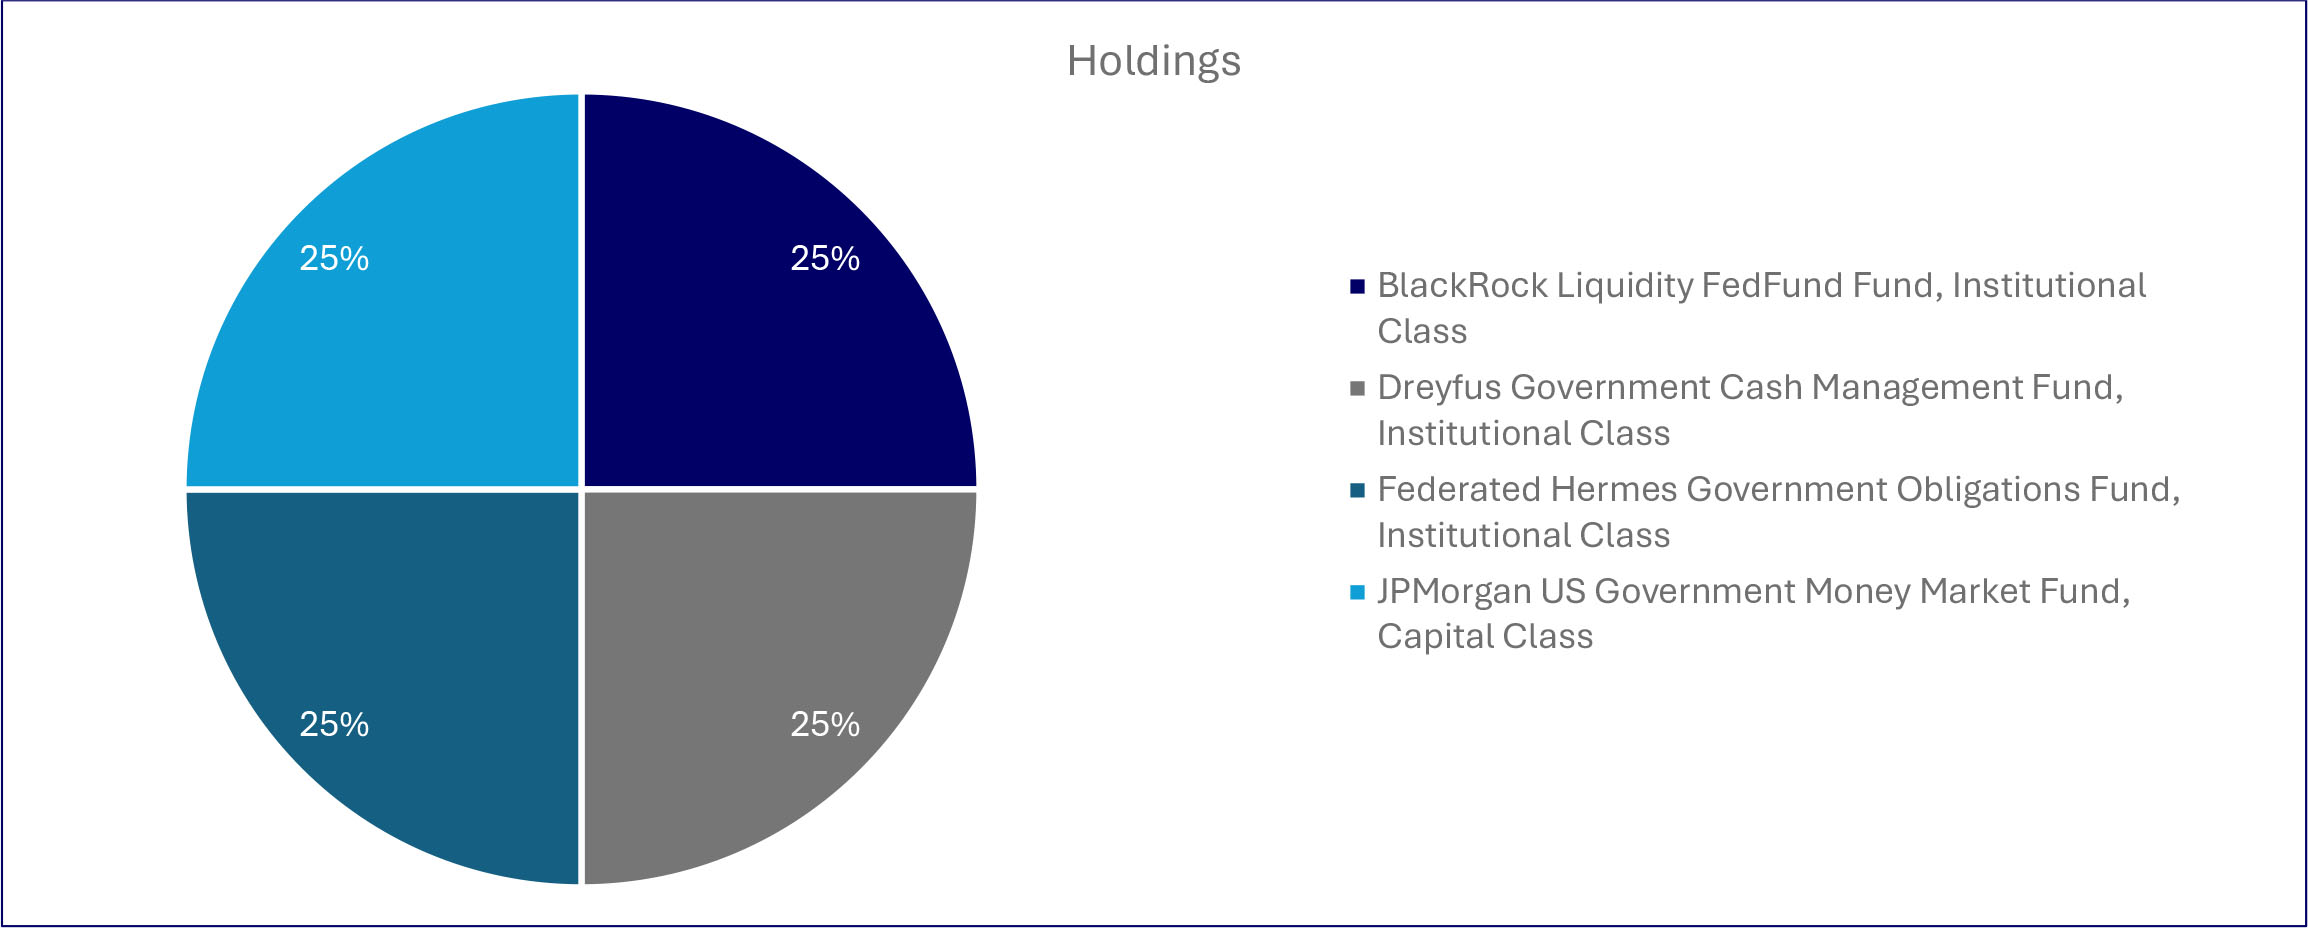
| Material Fund changes during the period. |
| Below is a summary of certain changes, and planned changes, to the Fund during the reporting period. For more complete information, you may review the Fund’s next prospectus, which we expect to be available by December 31, 2026, at www.saratogacap.com/fund-reports or upon request at 1-888-672-4839. |
| During the period there were no material changes to the Fund. |
| What were the Fund’s costs for the last year (based on a hypothetical $10,000 investment)? | ||
| Fund | Costs of a $10,000 Investment | Costs paid as a % of a $10,000 Investment |
| Saratoga US Government Money Market Fund, Class I | $148 | 1.46% |
| Fund Statistics | |||
| Total Net Assets | $4,054,006 | Advisory Fees Paid by the Fund | $20,190 |
| Number of Portfolio Holdings | 4 | Portfolio Turnover Rate | NA |
What did the Fund invest in (as a % of the Fund’s net assets)?
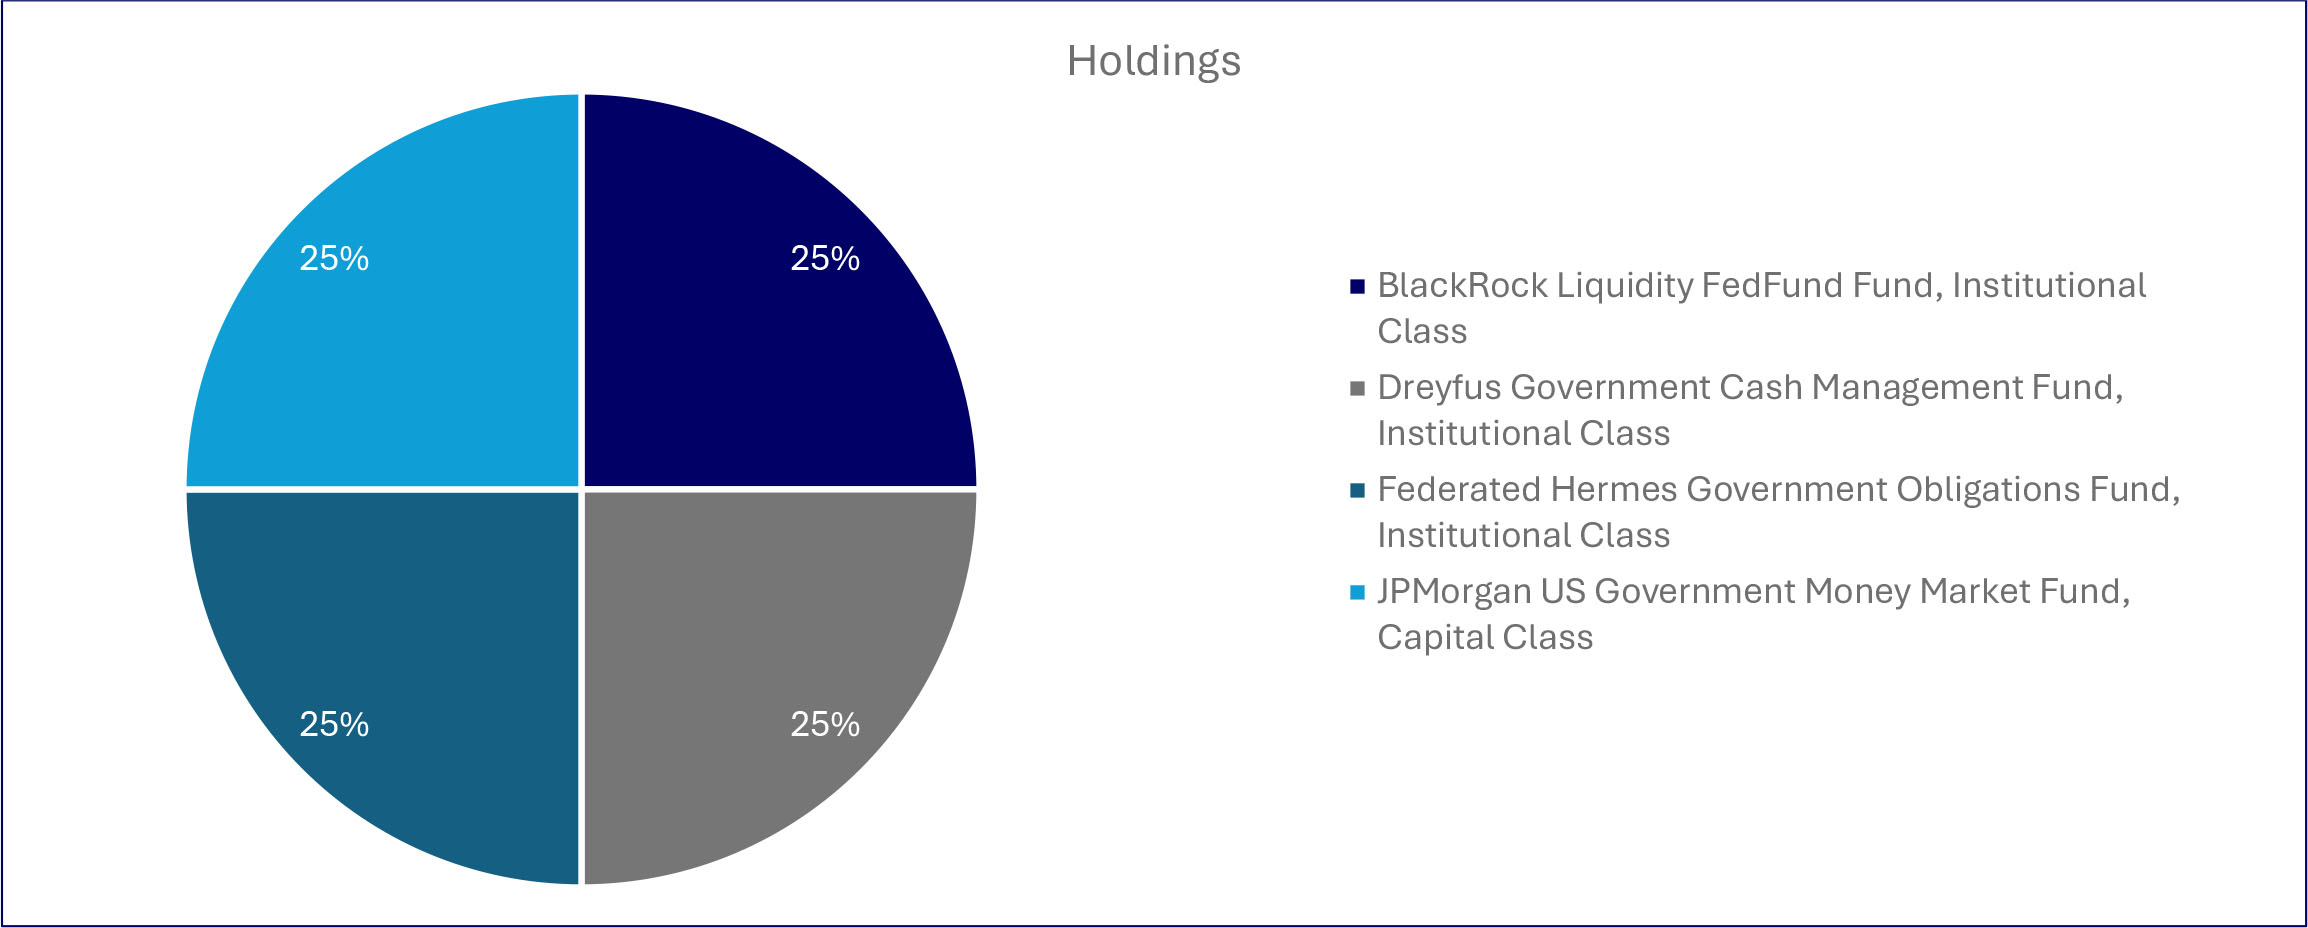
| Material Fund changes during the period. |
| Below is a summary of certain changes, and planned changes, to the Fund during the reporting period. For more complete information, you may review the Fund’s next prospectus, which we expect to be available by December 31, 2026, at www.saratogacap.com/fund-reports or upon request at 1-888-672-4839. |
| During the period there were no material changes to the Fund. |
| What were the Fund’s costs for the last year (based on a hypothetical $10,000 investment)? | ||
| Fund | Costs of a $10,000 Investment | Costs paid as a % of a $10,000 Investment |
| Saratoga Aggressive Balanced Allocation Fund, Class A | $130 | 1.24% |
| What affected the Fund’s performance during this period? |
|
During the period, an underweight to equities versus the benchmark was a drag on performance, as stocks outperformed bonds, cash equivalents, and alternatives, and the Fund was underweight in international stocks, which outperformed U.S. stocks during the period. The Fund’s smaller allocation to bonds in favor of cash equivalents and alternatives helped the Fund’s relative performance.
Within the Fund’s equity allocation, an overweight to the Large Cap Growth sector versus the Large Cap Value sector helped the Fund’s relative performance, as the Large Cap Growth sector outperformed the Large Cap Value sector. Within the Fund’s bond allocation, the Fund sold its position in the Long-Term debt sector and added a position in the Short-Term debt sector, which helped performance, as the Short-Term debt sector outperformed the Intermediate- and Long-Term debt sectors. The Fund’s overweight to the Intermediate-Term debt sector versus the Short-Term debt sector was a drag on relative performance.
From a security-selection standpoint, the Fund’s use of the Saratoga Large Cap Value fund was the largest drag on relative performance, as it significantly underperformed its passive counterpart. The Saratoga Large Cap Growth, Saratoga Technology & Communications, and Saratoga Small Cap funds also underperformed their passive counterparts, which hurt relative performance. The Fund’s use of the Vanguard Intermediate-Term Bond Index Fund was also a drag on performance, as it trailed its active counterparts. The Saratoga Health & Biotechnology and Saratoga Mid Cap funds outperformed their passive counterparts, helping the Fund’s relative performance. |
How has the Fund performed since its inception?
The chart below represents the historical performance of a hypothetical $10,000 investment since inception in the class of shares noted and assumes the reinvestment of dividends and capital gains and the maximum sales charge, if any. Fund expenses, including management fees, 12b-1 fees, if any, and other expenses were deducted.
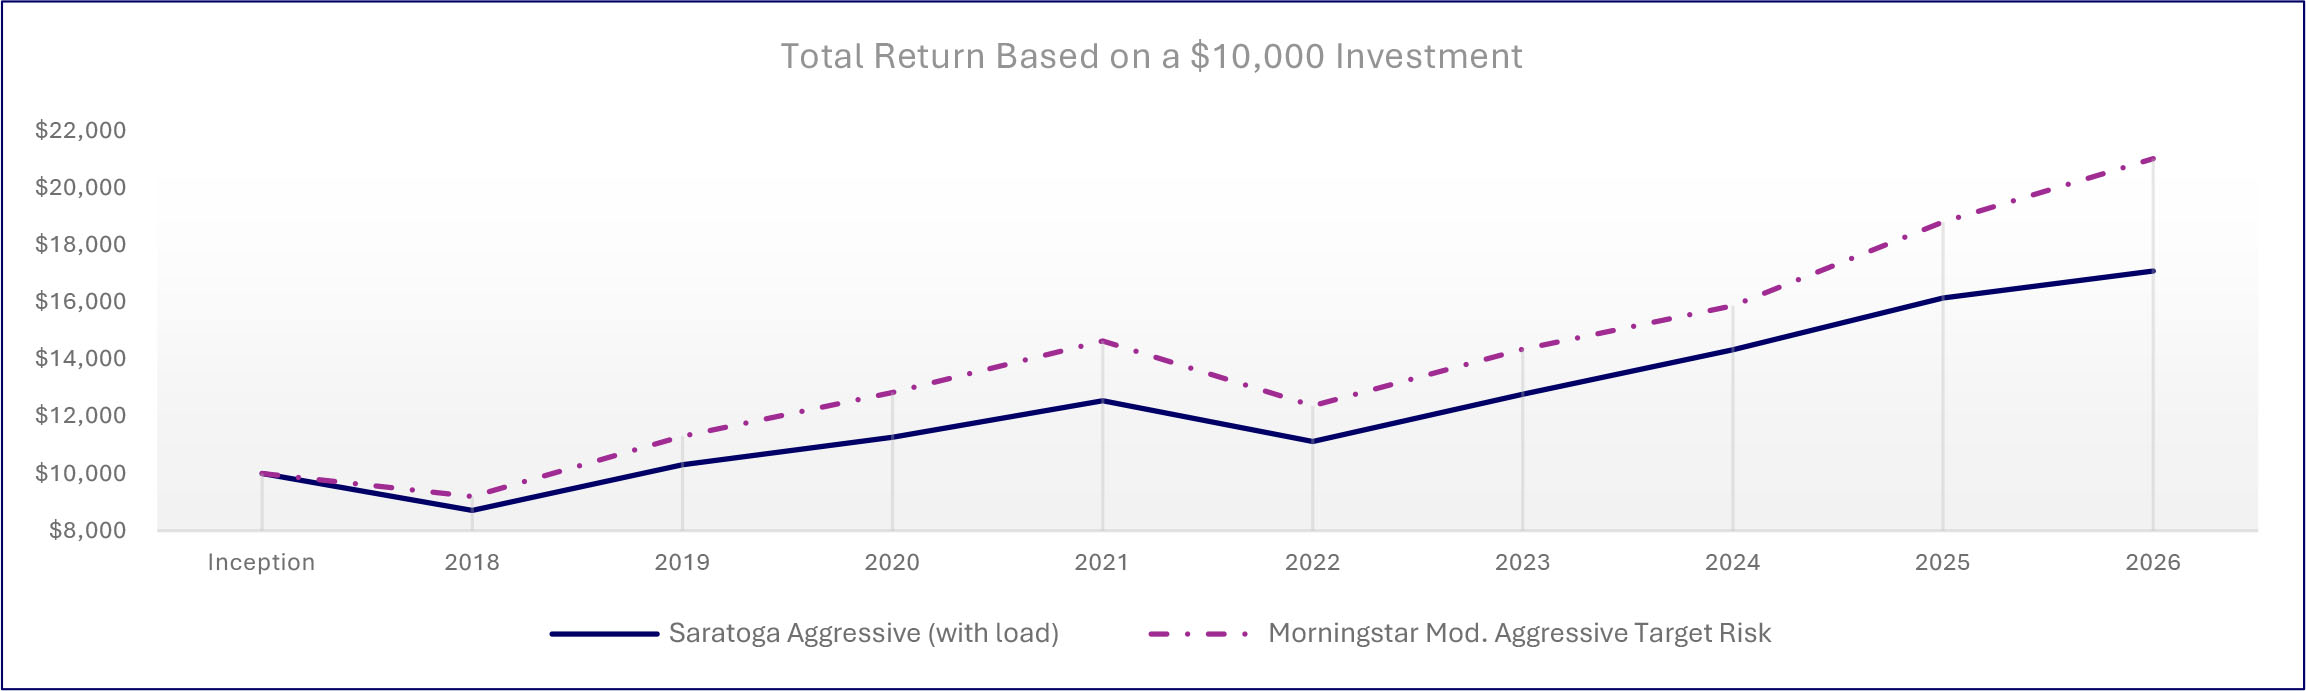
| Average Annual Total Returns | |||
| 1 Year | 5 Years | Since Inception1 | |
| Saratoga Aggressive Balanced Allocation Fund, Class A (with load) | 2.94% | 5.49% | 6.75% |
| Saratoga Aggressive Balanced Allocation Fund, Class A | 9.23% | 6.74% | 7.48% |
| Morningstar Mod. Aggressive Target Risk Index | 17.10% | 7.75% | 8.96% |
| 1 | From January 4, 2018. Performance data quoted represents past performance, which is not a good predictor of the Fund’s future performance. Investment return and principal value will fluctuate so that shares, when redeemed, may be worth more or less than their original cost. The above table and graph do not reflect the deduction of taxes that a shareholder would pay on fund distributions or the redemption of shares. Current performance may be lower or higher than the performance data quoted. The average annual total return is the annual compound return for the indicated period and reflects the change in share price and the reinvestment of all dividends and capital gains. Call 1-888-672-4839 for current performance information or questions. |
| Fund Statistics | |||
| Total Net Assets | $1,860,109 | Advisory Fees Paid by the Fund | $0 |
| Number of Portfolio Holdings | 11 | Portfolio Turnover Rate | 18% |
What did the Fund invest in (as a % of the Fund’s net assets)?
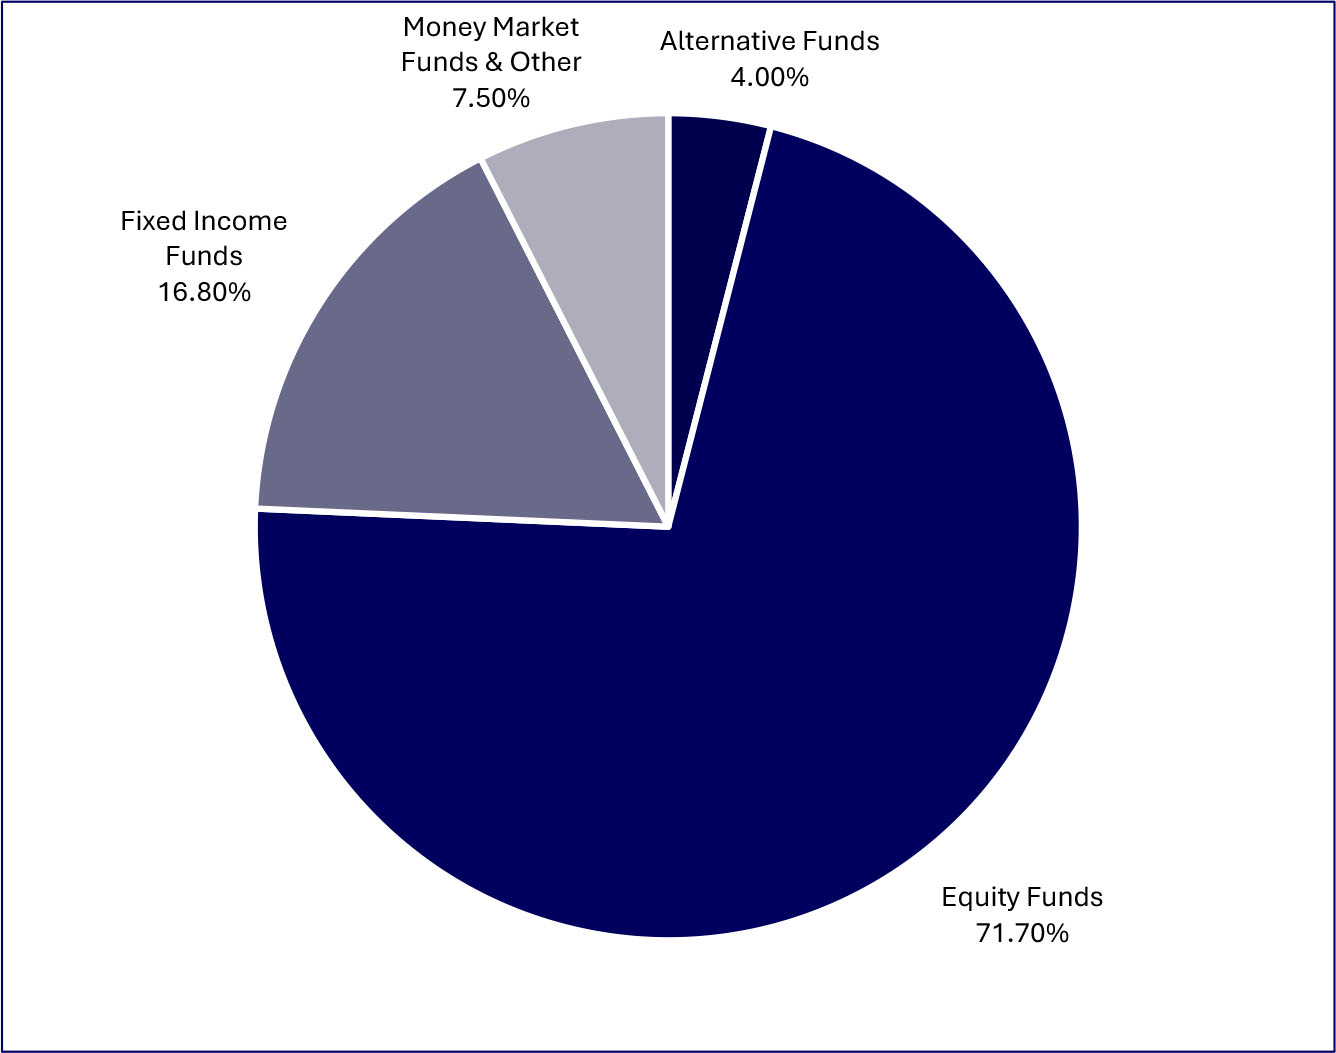
| Top Holdings (%) | |
| Saratoga Large Cap Growth Fund, Class I | |
| Vanguard Intermediate-Term Bond Index Fund Admiral Class | |
| Saratoga Large Cap Value Fund, Class I | |
| Saratoga Mid Capitalization Fund, Class I | |
| Saratoga Small Capitalization Fund, Class I | |
| Vanguard Total International Stock Index Fund, Admiral Class | |
| Dreyfus Inst Prefer Govt Money Mkt Inst Class | |
| Saratoga Technology & Comm Fund, Class I | |
| Eaton Vance Global Macro Absolute Return Fund, Class I | |
| Saratoga Health & Biotech Fund, Class I | |
| Material Fund changes during the period. |
| Below is a summary of certain changes, and planned changes, to the Fund during the reporting period. For more complete information, you may review the Fund’s next prospectus, which we expect to be available by December 31, 2026, at www.saratogacap.com/fund-reports or upon request at 1-888-672-4839. |
| During the period there were no material changes to the Fund. |
| What were the Fund’s costs for the last year (based on a hypothetical $10,000 investment)? | ||
| Fund | Costs of a $10,000 Investment | Costs paid as a % of a $10,000 Investment |
| Saratoga Aggressive Balanced Allocation Fund, Class C | $207 | 1.99% |
| What affected the Fund’s performance during this period? |
|
During the period, an underweight to equities versus the benchmark was a drag on performance, as stocks outperformed bonds, cash equivalents, and alternatives, and the Fund was underweight in international stocks, which outperformed U.S. stocks during the period. The Fund’s smaller allocation to bonds in favor of cash equivalents and alternatives helped the Fund’s relative performance.
Within the Fund’s equity allocation, an overweight to the Large Cap Growth sector versus the Large Cap Value sector helped the Fund’s relative performance, as the Large Cap Growth sector outperformed the Large Cap Value sector. Within the Fund’s bond allocation, the Fund sold its position in the Long-Term debt sector and added a position in the Short-Term debt sector, which helped performance, as the Short-Term debt sector outperformed the Intermediate- and Long-Term debt sectors. The Fund’s overweight to the Intermediate-Term debt sector versus the Short-Term debt sector was a drag on relative performance.
From a security-selection standpoint, the Fund’s use of the Saratoga Large Cap Value fund was the largest drag on relative performance, as it significantly underperformed its passive counterpart. The Saratoga Large Cap Growth, Saratoga Technology & Communications, and Saratoga Small Cap funds also underperformed their passive counterparts, which hurt relative performance. The Fund’s use of the Vanguard Intermediate-Term Bond Index Fund was also a drag on performance, as it trailed its active counterparts. The Saratoga Health & Biotechnology and Saratoga Mid Cap funds outperformed their passive counterparts, helping the Fund’s relative performance. |
How has the Fund performed since its inception?
The chart below represents the historical performance of a hypothetical $10,000 investment since inception in the class of shares noted and assumes the reinvestment of dividends and capital gains and the maximum sales charge, if any. Fund expenses, including management fees, 12b-1 fees, if any, and other expenses were deducted.
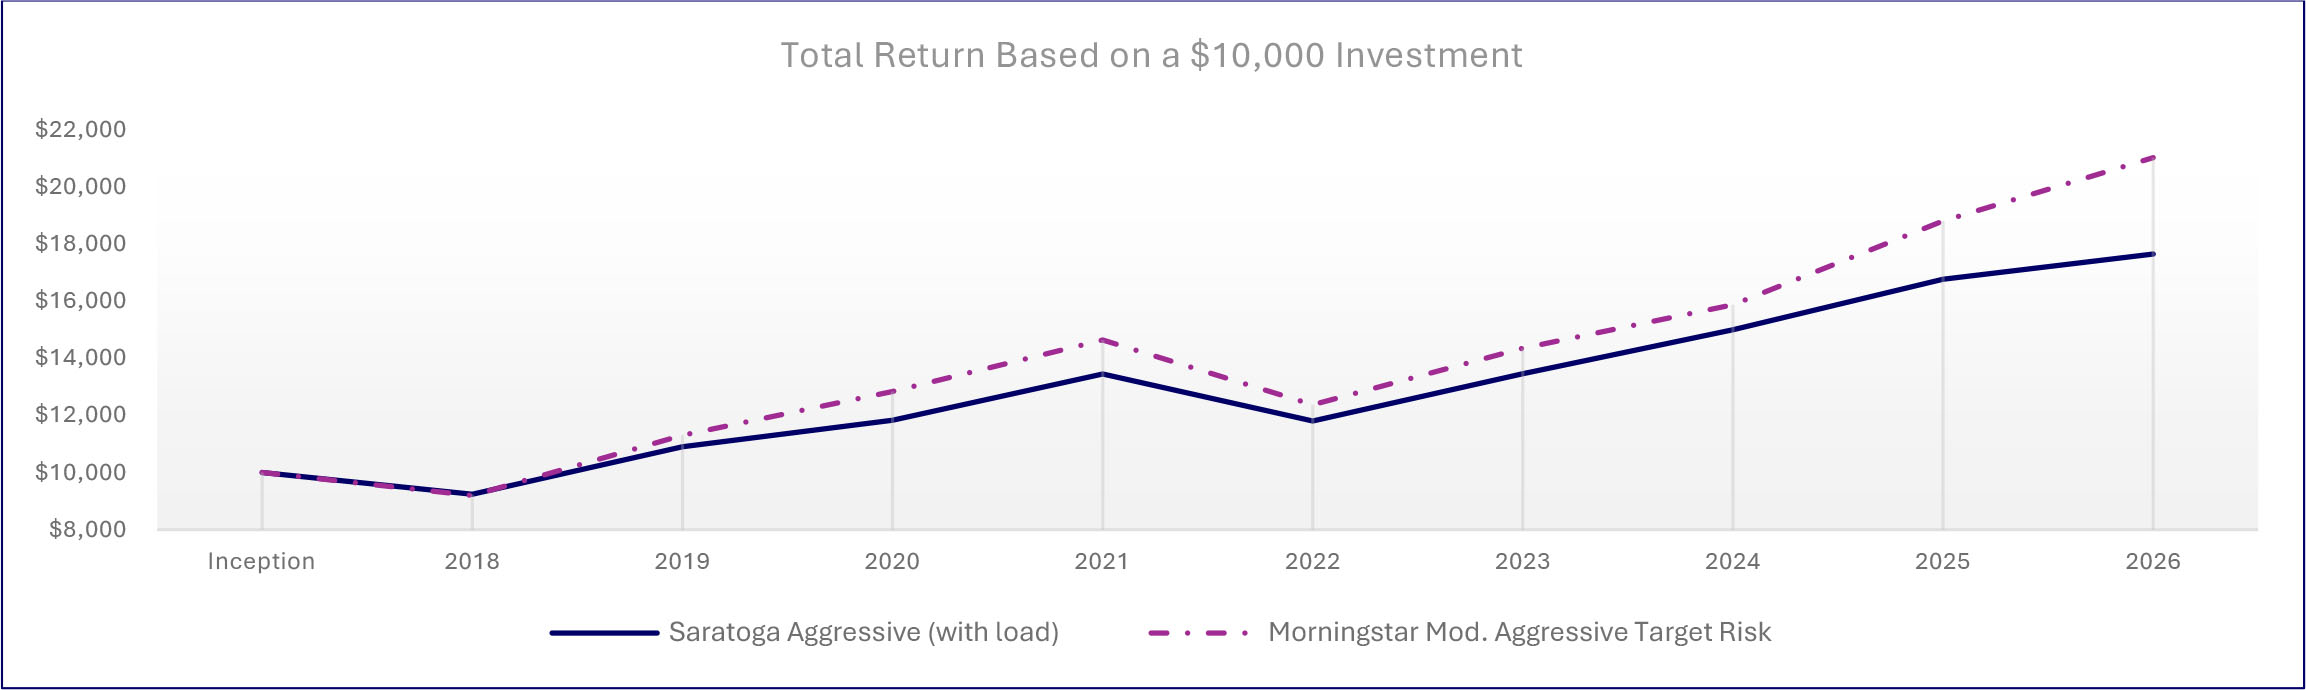
| Average Annual Total Returns | |||
| 1 Year | 5 Years | Since Inception1 | |
| Saratoga Aggressive Balanced Allocation Fund, Class C (with load) | 7.38% | 5.88% | 6.78% |
| Saratoga Aggressive Balanced Allocation Fund, Class C | 8.38% | 5.88% | 6.78% |
| Morningstar Mod. Aggressive Target Risk Index | 17.10% | 7.75% | 8.96% |
| 1 | From January 4, 2018. Performance data quoted represents past performance, which is not a good predictor of the Fund’s future performance. Investment return and principal value will fluctuate so that shares, when redeemed, may be worth more or less than their original cost. The above table and graph do not reflect the deduction of taxes that a shareholder would pay on fund distributions or the redemption of shares. Current performance may be lower or higher than the performance data quoted. The average annual total return is the annual compound return for the indicated period and reflects the change in share price and the reinvestment of all dividends and capital gains. Call 1-888-672-4839 for current performance information or questions. |
| Fund Statistics | |||
| Total Net Assets | $1,860,109 | Advisory Fees Paid by the Fund | $0 |
| Number of Portfolio Holdings | 11 | Portfolio Turnover Rate | 18% |
What did the Fund invest in (as a % of the Fund’s net assets)?
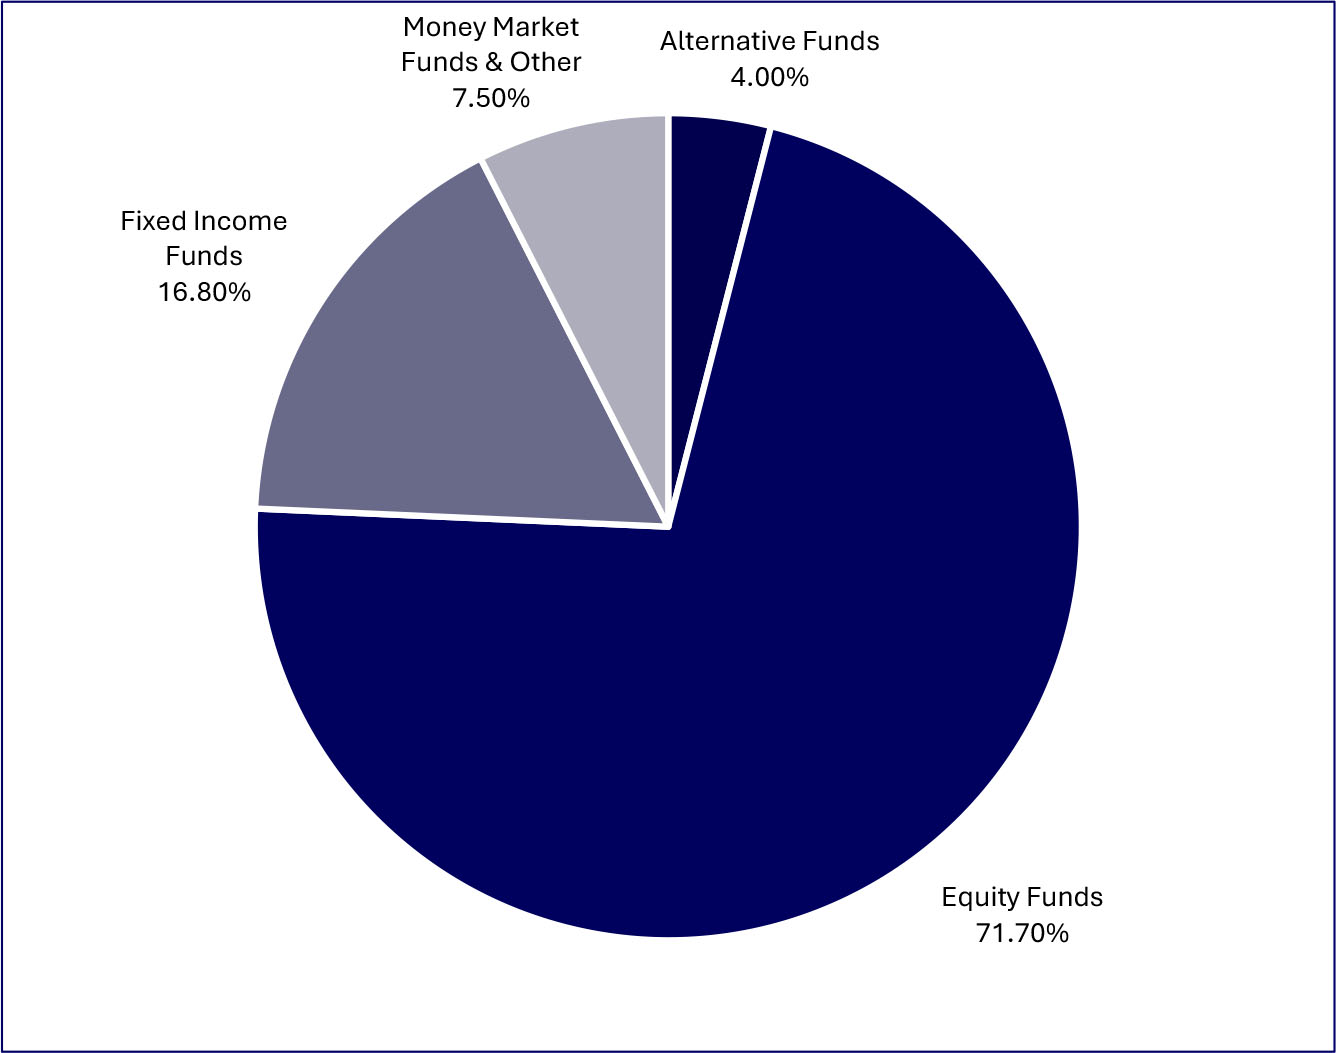
| Top Holdings (%) | |
| Saratoga Large Cap Growth Fund, Class I | |
| Vanguard Intermediate-Term Bond Index Fund Admiral Class | |
| Saratoga Large Cap Value Fund, Class I | |
| Saratoga Mid Capitalization Fund, Class I | |
| Saratoga Small Capitalization Fund, Class I | |
| Vanguard Total International Stock Index Fund, Admiral Class | |
| Dreyfus Inst Prefer Govt Money Mkt Inst Class | |
| Saratoga Technology & Comm Fund, Class I | |
| Eaton Vance Global Macro Absolute Return Fund, Class I | |
| Saratoga Health & Biotech Fund, Class I | |
| Material Fund changes during the period. |
| Below is a summary of certain changes, and planned changes, to the Fund during the reporting period. For more complete information, you may review the Fund’s next prospectus, which we expect to be available by December 31, 2026, at www.saratogacap.com/fund-reports or upon request at 1-888-672-4839. |
| During the period there were no material changes to the Fund. |
| What were the Fund’s costs for the last year (based on a hypothetical $10,000 investment)? | ||
| Fund | Costs of a $10,000 Investment | Costs paid as a % of a $10,000 Investment |
| Saratoga Aggressive Balanced Allocation Fund, Class I | $104 | 0.99% |
| What affected the Fund’s performance during this period? |
|
During the period, an underweight to equities versus the benchmark was a drag on performance, as stocks outperformed bonds, cash equivalents, and alternatives, and the Fund was underweight in international stocks, which outperformed U.S. stocks during the period. The Fund’s smaller allocation to bonds in favor of cash equivalents and alternatives helped the Fund’s relative performance.
Within the Fund’s equity allocation, an overweight to the Large Cap Growth sector versus the Large Cap Value sector helped the Fund’s relative performance, as the Large Cap Growth sector outperformed the Large Cap Value sector. Within the Fund’s bond allocation, the Fund sold its position in the Long-Term debt sector and added a position in the Short-Term debt sector, which helped performance, as the Short-Term debt sector outperformed the Intermediate- and Long-Term debt sectors. The Fund’s overweight to the Intermediate-Term debt sector versus the Short-Term debt sector was a drag on relative performance.
From a security-selection standpoint, the Fund’s use of the Saratoga Large Cap Value fund was the largest drag on relative performance, as it significantly underperformed its passive counterpart. The Saratoga Large Cap Growth, Saratoga Technology & Communications, and Saratoga Small Cap funds also underperformed their passive counterparts, which hurt relative performance. The Fund’s use of the Vanguard Intermediate-Term Bond Index Fund was also a drag on performance, as it trailed its active counterparts. The Saratoga Health & Biotechnology and Saratoga Mid Cap funds outperformed their passive counterparts, helping the Fund’s relative performance. |
How has the Fund performed since its inception?
The chart below represents the historical performance of a hypothetical $10,000 investment since inception in the class of shares noted and assumes the reinvestment of dividends and capital gains and the maximum sales charge, if any. Fund expenses, including management fees, 12b-1 fees, if any, and other expenses were deducted.
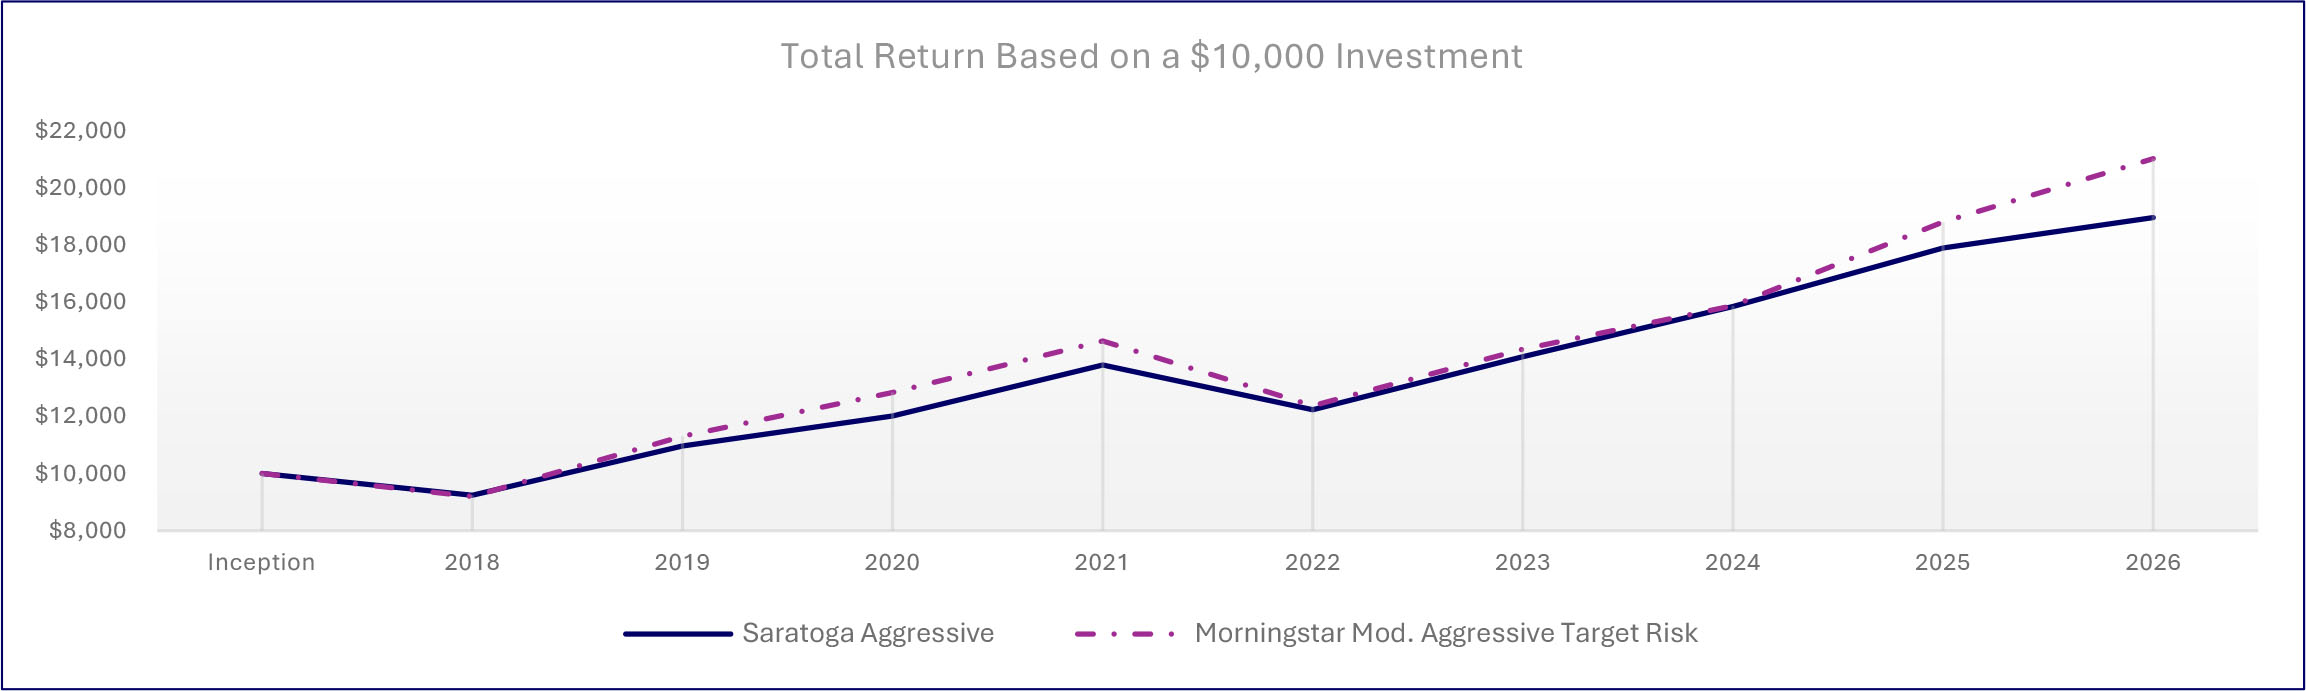
| Average Annual Total Returns | |||
| 1 Year | 5 Years | Since Inception1 | |
| Saratoga Aggressive Balanced Allocation Fund, Class I | 9.51% | 6.95% | 7.67% |
| Morningstar Mod. Aggressive Target Risk Index | 17.10% | 7.75% | 8.96% |
| 1 | From January 4, 2018. Performance data quoted represents past performance, which is not a good predictor of the Fund’s future performance. Investment return and principal value will fluctuate so that shares, when redeemed, may be worth more or less than their original cost. The above table and graph do not reflect the deduction of taxes that a shareholder would pay on fund distributions or the redemption of shares. Current performance may be lower or higher than the performance data quoted. The average annual total return is the annual compound return for the indicated period and reflects the change in share price and the reinvestment of all dividends and capital gains. Call 1-888-672-4839 for current performance information or questions. |
| Fund Statistics | |||
| Total Net Assets | $1,860,109 | Advisory Fees Paid by the Fund | $0 |
| Number of Portfolio Holdings | 11 | Portfolio Turnover Rate | 18% |
What did the Fund invest in (as a % of the Fund’s net assets)?
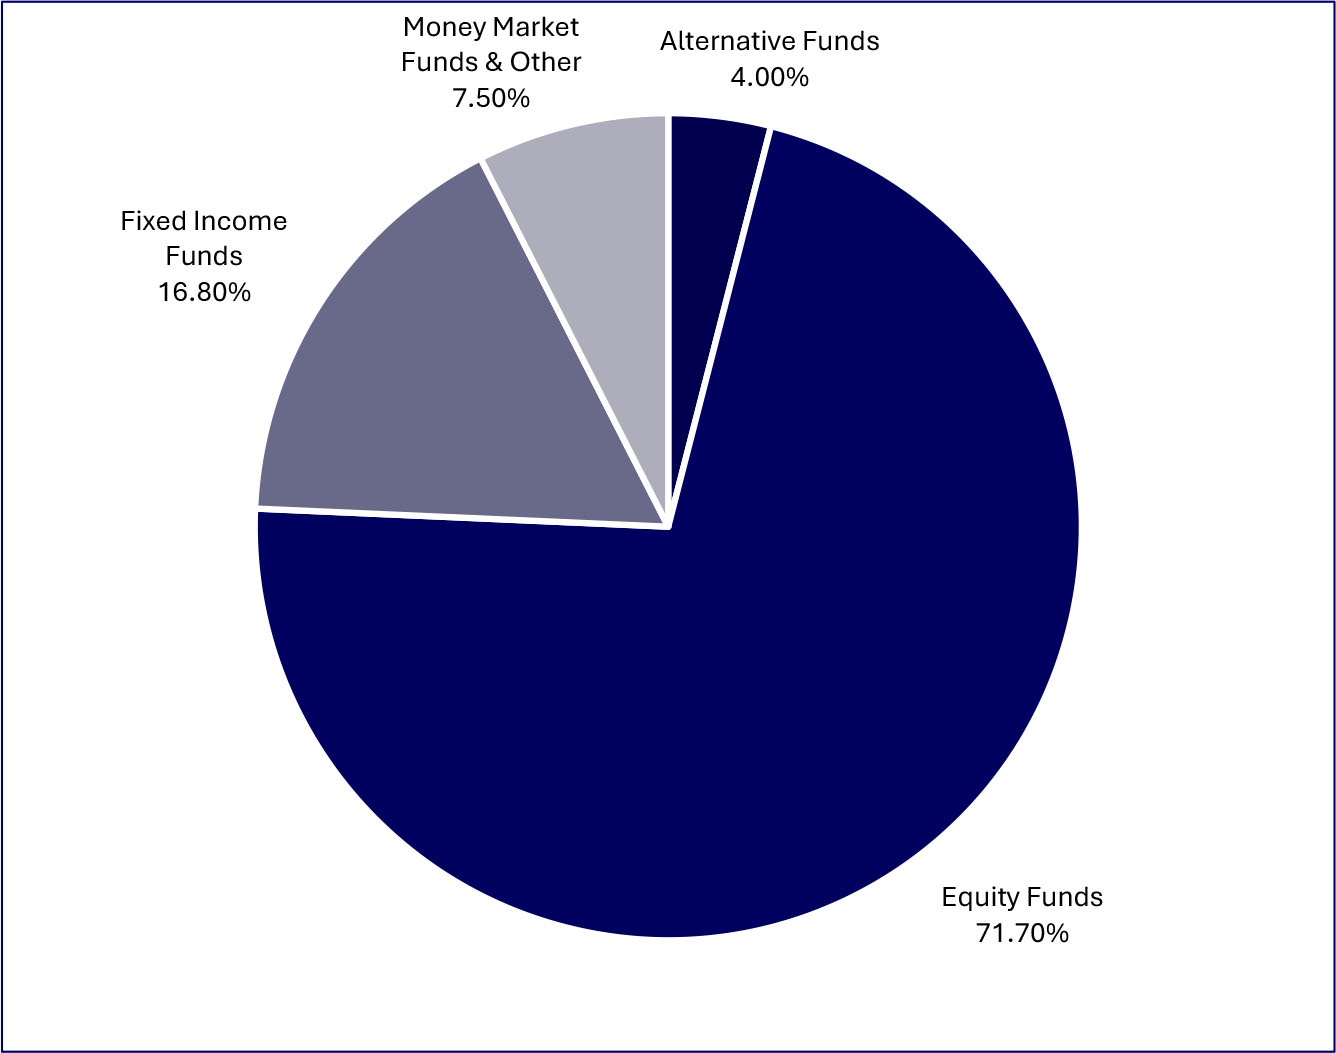
| Top Holdings (%) | |
| Saratoga Large Cap Growth Fund, Class I | |
| Vanguard Intermediate-Term Bond Index Fund Admiral Class | |
| Saratoga Large Cap Value Fund, Class I | |
| Saratoga Mid Capitalization Fund, Class I | |
| Saratoga Small Capitalization Fund, Class I | |
| Vanguard Total International Stock Index Fund, Admiral Class | |
| Dreyfus Inst Prefer Govt Money Mkt Inst Class | |
| Saratoga Technology & Comm Fund, Class I | |
| Eaton Vance Global Macro Absolute Return Fund, Class I | |
| Saratoga Health & Biotech Fund, Class I | |
| Material Fund changes during the period. |
| Below is a summary of certain changes, and planned changes, to the Fund during the reporting period. For more complete information, you may review the Fund’s next prospectus, which we expect to be available by December 31, 2026, at www.saratogacap.com/fund-reports or upon request at 1-888-672-4839. |
| During the period there were no material changes to the Fund. |
| What were the Fund’s costs for the last year (based on a hypothetical $10,000 investment)? | ||
| Fund | Costs of a $10,000 Investment | Costs paid as a % of a $10,000 Investment |
| Saratoga Conservative Balanced Allocation Fund, Class A | $127 | 1.24% |
| What affected the Fund’s performance during this period? |
|
During the period, the Fund’s equity allocation was roughly in line with the benchmark’s, but it was underweight international stocks, which outperformed U.S. stocks during the period. The Fund also held less in bonds than the benchmark and more in cash equivalents and alternatives, which helped the Fund’s relative performance, as bonds trailed both cash equivalents and alternatives.
Within the Fund’s equity allocation, an overweight to the Large Cap Growth sector versus the Large Cap Value sector helped the Fund’s relative performance, as the Large Cap Growth sector outperformed the Large Cap Value sector. Within the Fund’s bond allocation, the Fund sold its position in the Long-Term debt sector and added a position in the Short-Term debt sector, which helped performance, as the Short-Term debt sector outperformed the Intermediate- and Long-Term debt sectors. The Fund’s overweight to the Intermediate-Term debt sector versus the Short-Term debt sector was a drag on relative performance.
From a security-selection standpoint, the Fund’s use of the Saratoga Large Cap Value fund was the largest drag on relative performance, as it significantly underperformed its passive counterpart. The Saratoga Large Cap Growth and Saratoga Small Cap funds also underperformed their passive counterparts, which hurt relative performance. The Fund’s use of the Vanguard Intermediate-Term Bond Index Fund was also a drag on performance, as it trailed its active counterparts. The Saratoga Mid Cap fund outperformed its passive counterpart, helping the Fund’s relative performance. |
How has the Fund performed since its inception?
The chart below represents the historical performance of a hypothetical $10,000 investment since inception in the class of shares noted and assumes the reinvestment of dividends and capital gains and the maximum sales charge, if any. Fund expenses, including management fees, 12b-1 fees, if any, and other expenses were deducted.
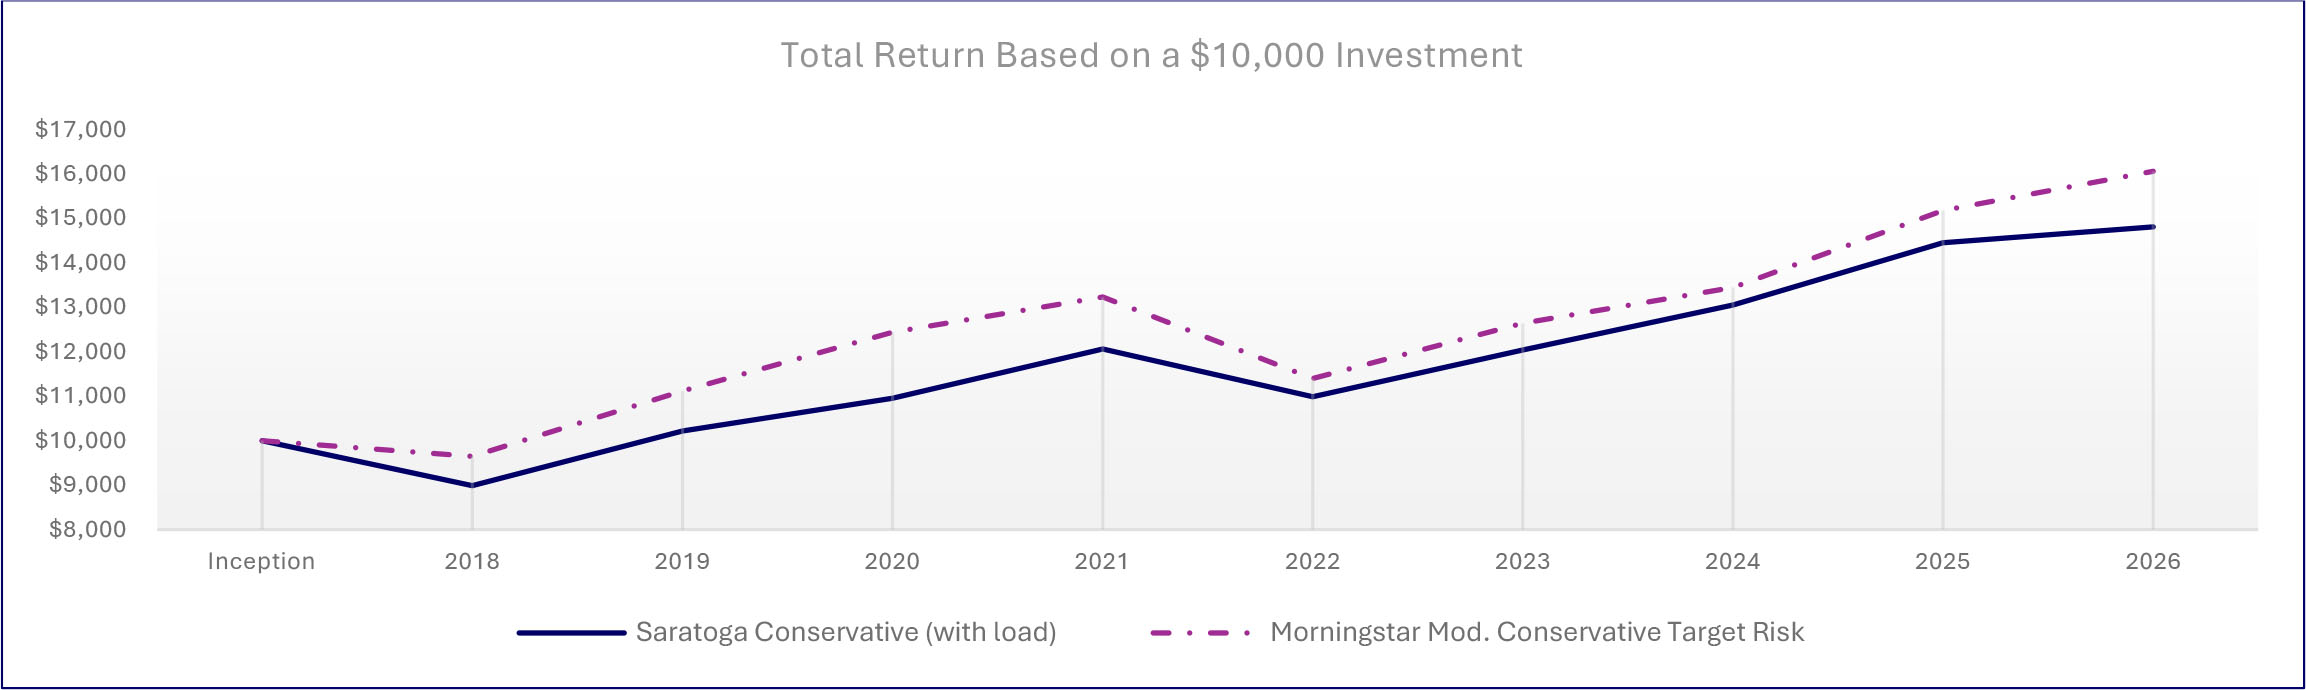
| Average Annual Total Returns | |||
| 1 Year | 5 Years | Since Inception1 | |
| Saratoga Conservative Balanced Allocation Fund, Class A (with load) | -0.80% | 3.28% | 4.64% |
| Saratoga Conservative Balanced Allocation Fund, Class A | 5.27% | 4.51% | 5.36% |
| Morningstar Mod. Conservative Target Risk Index | 9.39% | 3.99% | 5.63% |
| 1 | From January 4, 2018. Performance data quoted represents past performance, which is not a good predictor of the Fund’s future performance. Investment return and principal value will fluctuate so that shares, when redeemed, may be worth more or less than their original cost. The above table and graph do not reflect the deduction of taxes that a shareholder would pay on fund distributions or the redemption of shares. Current performance may be lower or higher than the performance data quoted. The average annual total return is the annual compound return for the indicated period and reflects the change in share price and the reinvestment of all dividends and capital gains. Call 1-888-672-4839 for current performance information or questions. |
| Fund Statistics | |||
| Total Net Assets | $3,215,892 | Advisory Fees Paid by the Fund | $0 |
| Number of Portfolio Holdings | 9 | Portfolio Turnover Rate | 16% |
What did the Fund invest in (as a % of the Fund’s net assets)?
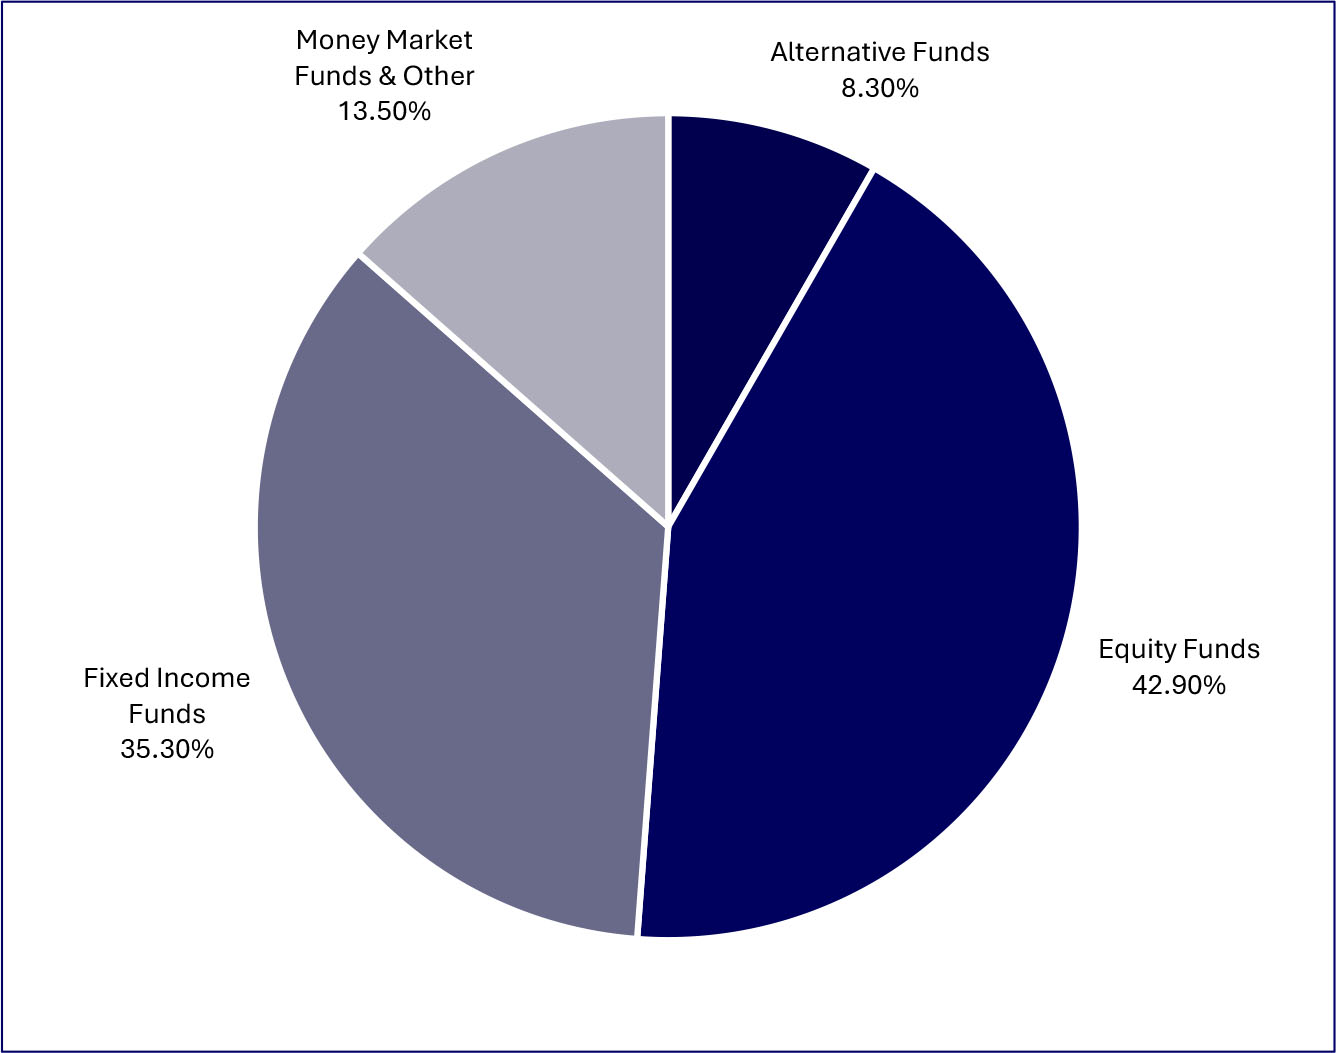
| Top Holdings (%) | |
| Vanguard Intermediate-Term Bond Index Fund Admiral Class | |
| Saratoga Large Cap Growth Fund, Class I | |
| Dreyfus Inst Prefer Govt Money Mkt Inst Class | |
| Saratoga Large Cap Value Fund, Class I | |
| Saratoga Mid Capitalization Fund, Class I | |
| Eaton Vance Global Macro Absolute Return Fund, Class I | |
| Vanguard Short-Term Bond Index Fund, Admiral Class | |
| Saratoga Small Capitalization Fund, Class I | |
| Vanguard Total International Stock Index Fund, Admiral Class | |
| Material Fund changes during the period. |
| Below is a summary of certain changes, and planned changes, to the Fund during the reporting period. For more complete information, you may review the Fund’s next prospectus, which we expect to be available by December 31, 2026, at www.saratogacap.com/fund-reports or upon request at 1-888-672-4839. |
| During the period there were no material changes to the Fund. |
| What were the Fund’s costs for the last year (based on a hypothetical $10,000 investment)? | ||
| Fund | Costs of a $10,000 Investment | Costs paid as a % of a $10,000 Investment |
| Saratoga Conservative Balanced Allocation Fund, Class C | $203 | 1.99% |
| What affected the Fund’s performance during this period? |
|
During the period, the Fund’s equity allocation was roughly in line with the benchmark’s, but it was underweight international stocks, which outperformed U.S. stocks during the period. The Fund also held less in bonds than the benchmark and more in cash equivalents and alternatives, which helped the Fund’s relative performance, as bonds trailed both cash equivalents and alternatives.
Within the Fund’s equity allocation, an overweight to the Large Cap Growth sector versus the Large Cap Value sector helped the Fund’s relative performance, as the Large Cap Growth sector outperformed the Large Cap Value sector. Within the Fund’s bond allocation, the Fund sold its position in the Long-Term debt sector and added a position in the Short-Term debt sector, which helped performance, as the Short-Term debt sector outperformed the Intermediate- and Long-Term debt sectors. The Fund’s overweight to the Intermediate-Term debt sector versus the Short-Term debt sector was a drag on relative performance.
From a security-selection standpoint, the Fund’s use of the Saratoga Large Cap Value fund was the largest drag on relative performance, as it significantly underperformed its passive counterpart. The Saratoga Large Cap Growth and Saratoga Small Cap funds also underperformed their passive counterparts, which hurt relative performance. The Fund’s use of the Vanguard Intermediate-Term Bond Index Fund was also a drag on performance, as it trailed its active counterparts. The Saratoga Mid Cap fund outperformed its passive counterpart, helping the Fund’s relative performance. |
How has the Fund performed since its inception?
The chart below represents the historical performance of a hypothetical $10,000 investment since inception in the class of shares noted and assumes the reinvestment of dividends and capital gains and the maximum sales charge, if any. Fund expenses, including management fees, 12b-1 fees, if any, and other expenses were deducted.
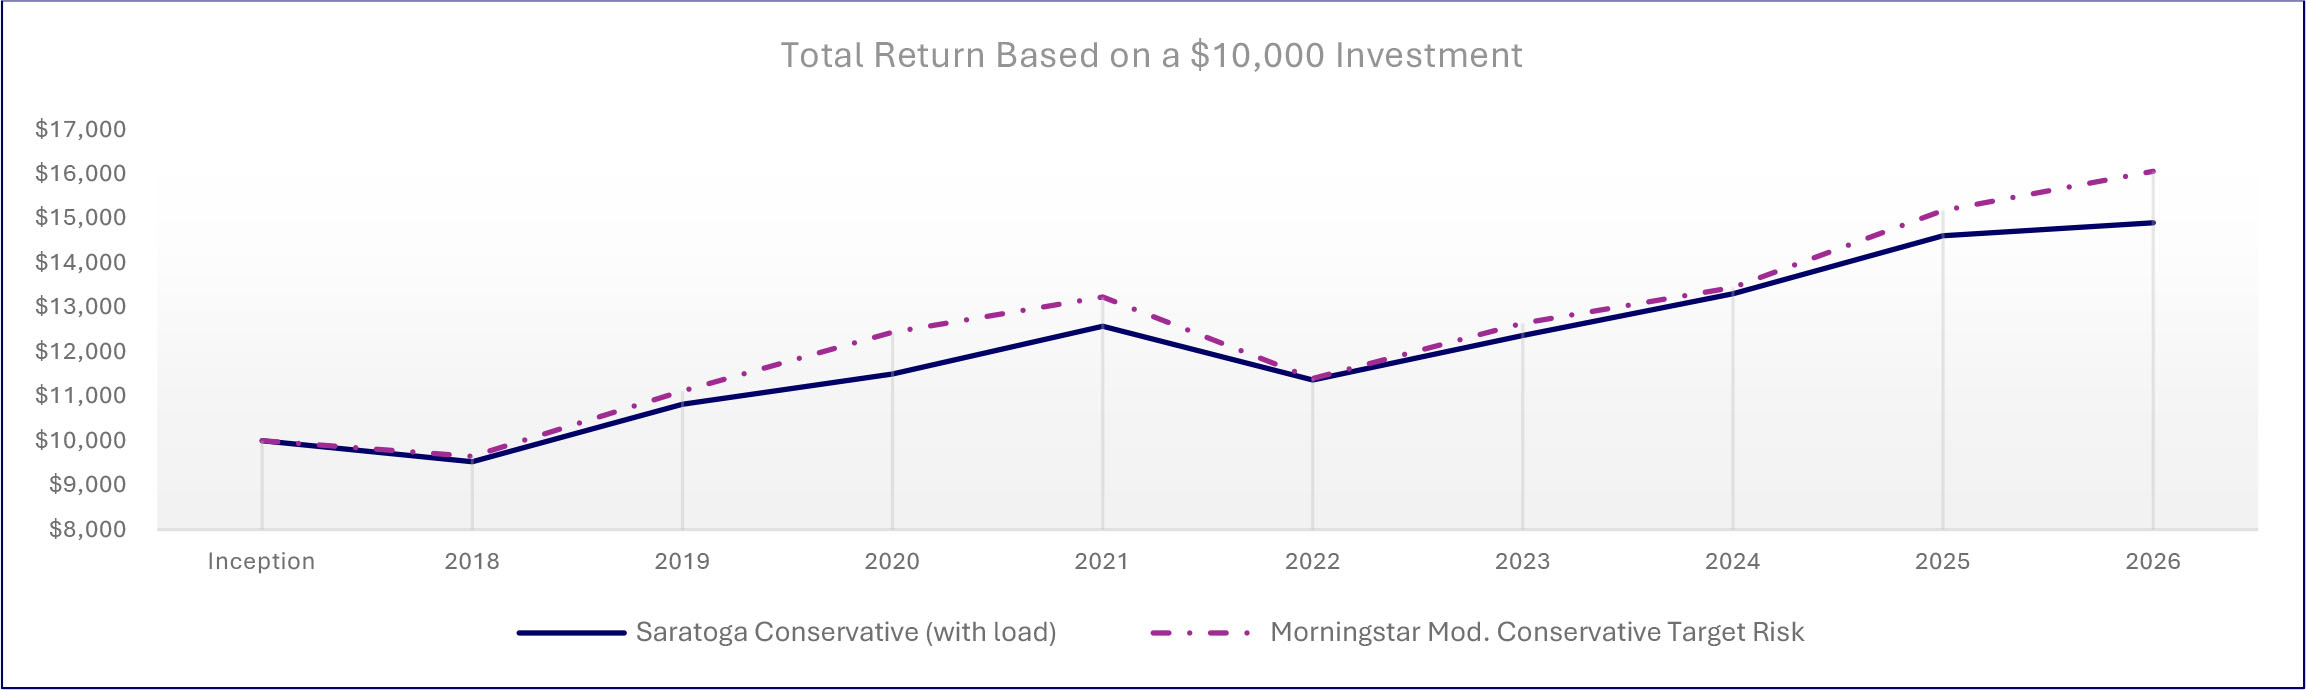
| Average Annual Total Returns | |||
| 1 Year | 5 Years | Since Inception1 | |
| Saratoga Conservative Balanced Allocation Fund, Class C (with load) | 3.45% | 3.73% | 4.72% |
| Saratoga Conservative Balanced Allocation Fund, Class C | 4.45% | 3.73% | 4.72% |
| Morningstar Mod. Conservative Target Risk Index | 9.39% | 3.99% | 5.63% |
| 1 | From January 4, 2018. Performance data quoted represents past performance, which is not a good predictor of the Fund’s future performance. Investment return and principal value will fluctuate so that shares, when redeemed, may be worth more or less than their original cost. The above table and graph do not reflect the deduction of taxes that a shareholder would pay on fund distributions or the redemption of shares. Current performance may be lower or higher than the performance data quoted. The average annual total return is the annual compound return for the indicated period and reflects the change in share price and the reinvestment of all dividends and capital gains. Call 1-888-672-4839 for current performance information or questions. |
| Fund Statistics | |||
| Total Net Assets | $3,215,892 | Advisory Fees Paid by the Fund | $0 |
| Number of Portfolio Holdings | 9 | Portfolio Turnover Rate | 16% |
What did the Fund invest in (as a % of the Fund’s net assets)?
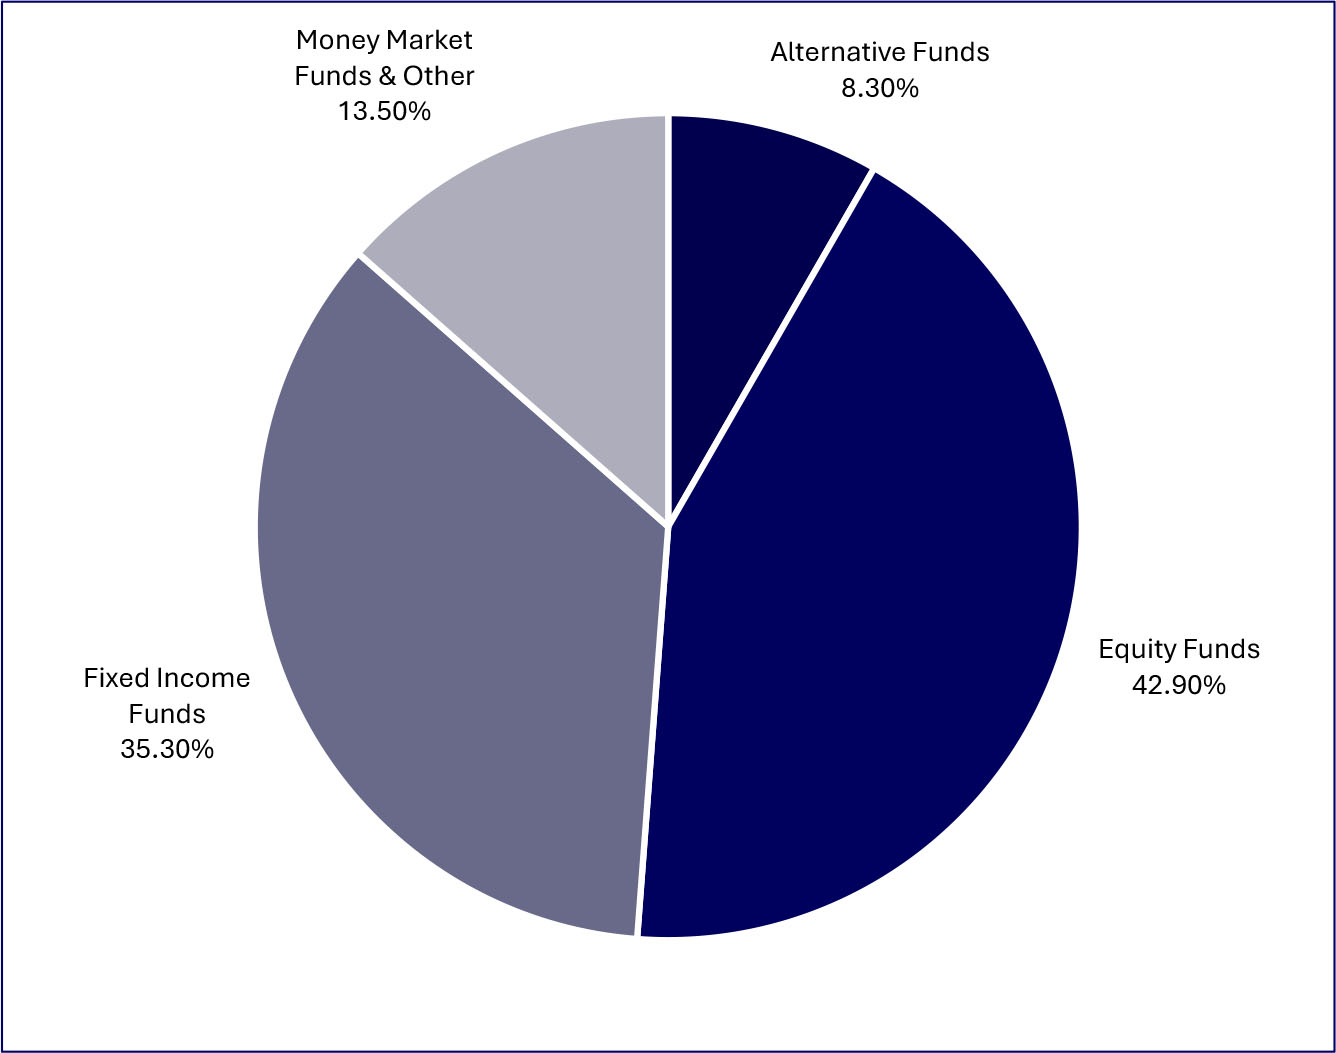
| Top Holdings (%) | |
| Vanguard Intermediate-Term Bond Index Fund Admiral Class | |
| Saratoga Large Cap Growth Fund, Class I | |
| Dreyfus Inst Prefer Govt Money Mkt Inst Class | |
| Saratoga Large Cap Value Fund, Class I | |
| Saratoga Mid Capitalization Fund, Class I | |
| Eaton Vance Global Macro Absolute Return Fund, Class I | |
| Vanguard Short-Term Bond Index Fund, Admiral Class | |
| Saratoga Small Capitalization Fund, Class I | |
| Vanguard Total International Stock Index Fund, Admiral Class | |
| Material Fund changes during the period. |
| Below is a summary of certain changes, and planned changes, to the Fund during the reporting period. For more complete information, you may review the Fund’s next prospectus, which we expect to be available by December 31, 2026, at www.saratogacap.com/fund-reports or upon request at 1-888-672-4839. |
| During the period there were no material changes to the Fund. |
| What were the Fund’s costs for the last year (based on a hypothetical $10,000 investment)? | ||
| Fund | Costs of a $10,000 Investment | Costs paid as a % of a $10,000 Investment |
| Saratoga Conservative Balanced Allocation Fund, Class I | $102 | 0.99% |
| What affected the Fund’s performance during this period? |
|
During the period, the Fund’s equity allocation was roughly in line with the benchmark’s, but it was underweight international stocks, which outperformed U.S. stocks during the period. The Fund also held less in bonds than the benchmark and more in cash equivalents and alternatives, which helped the Fund’s relative performance, as bonds trailed both cash equivalents and alternatives.
Within the Fund’s equity allocation, an overweight to the Large Cap Growth sector versus the Large Cap Value sector helped the Fund’s relative performance, as the Large Cap Growth sector outperformed the Large Cap Value sector. Within the Fund’s bond allocation, the Fund sold its position in the Long-Term debt sector and added a position in the Short-Term debt sector, which helped performance, as the Short-Term debt sector outperformed the Intermediate- and Long-Term debt sectors. The Fund’s overweight to the Intermediate-Term debt sector versus the Short-Term debt sector was a drag on relative performance.
From a security-selection standpoint, the Fund’s use of the Saratoga Large Cap Value fund was the largest drag on relative performance, as it significantly underperformed its passive counterpart. The Saratoga Large Cap Growth and Saratoga Small Cap funds also underperformed their passive counterparts, which hurt relative performance. The Fund’s use of the Vanguard Intermediate-Term Bond Index Fund was also a drag on performance, as it trailed its active counterparts. The Saratoga Mid Cap fund outperformed its passive counterpart, helping the Fund’s relative performance. |
How has the Fund performed since its inception?
The chart below represents the historical performance of a hypothetical $10,000 investment since inception in the class of shares noted and assumes the reinvestment of dividends and capital gains and the maximum sales charge, if any. Fund expenses, including management fees, 12b-1 fees, if any, and other expenses were deducted.
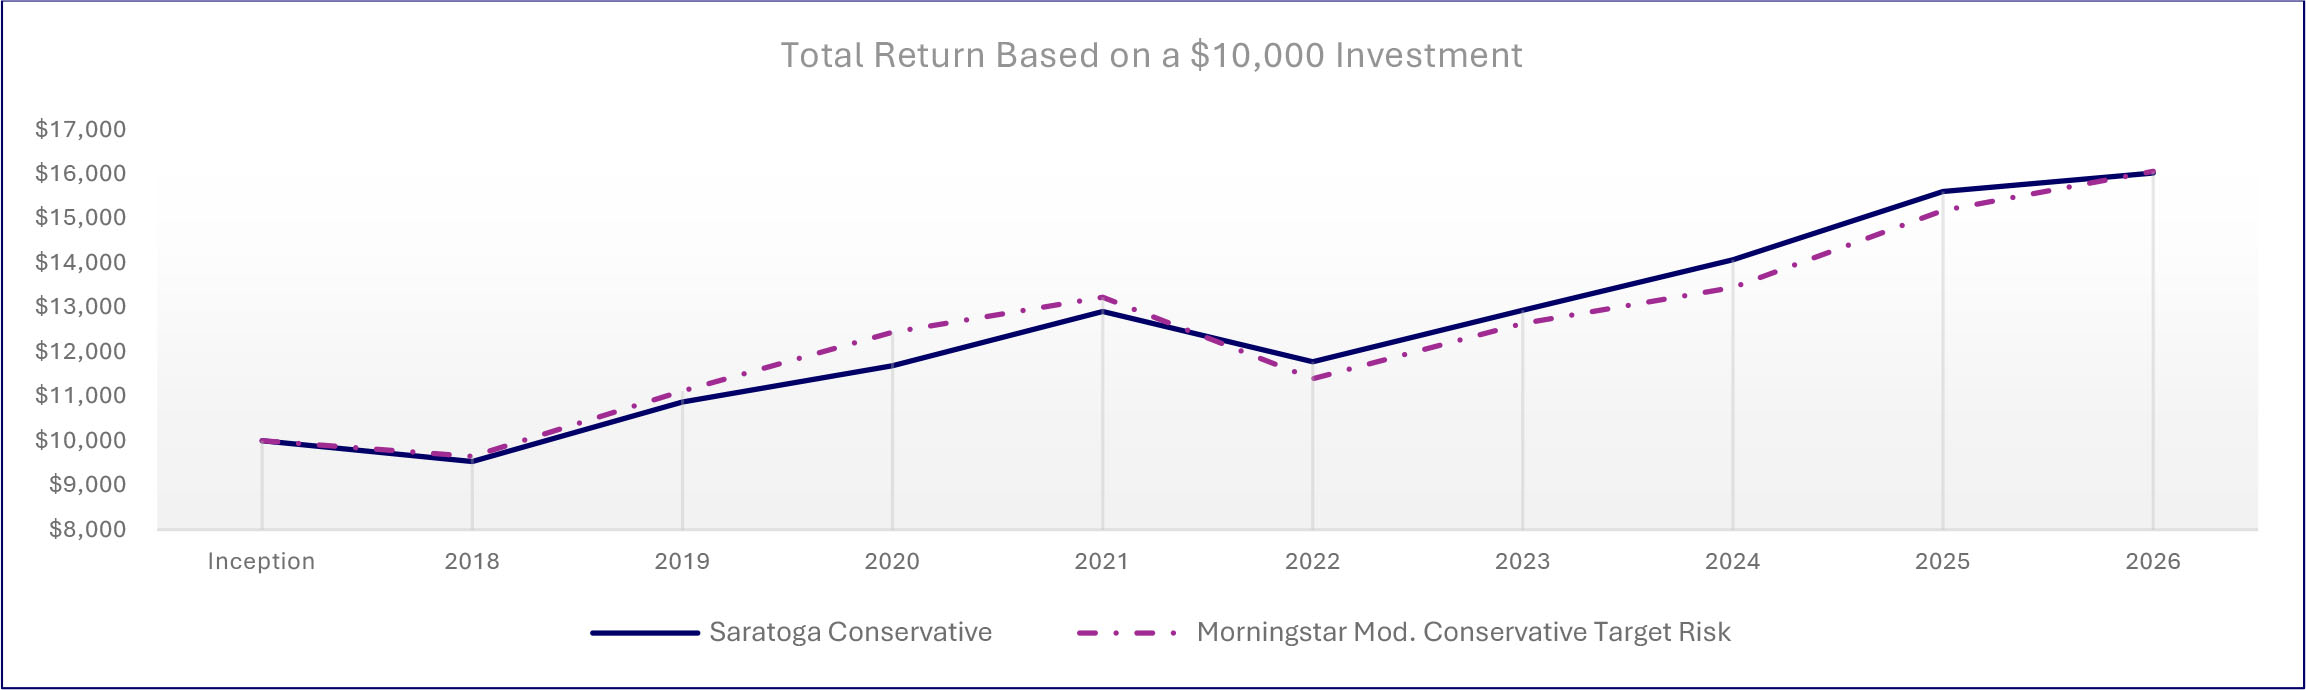
| Average Annual Total Returns | |||
| 1 Year | 5 Years | Since Inception1 | |
| Saratoga Conservative Balanced Allocation Fund, Class I | 5.48% | 4.77% | 5.60% |
| Morningstar Mod. Conservative Target Risk Index | 9.39% | 3.99% | 5.63% |
| 1 | From January 4, 2018. Performance data quoted represents past performance, which is not a good predictor of the Fund’s future performance. Investment return and principal value will fluctuate so that shares, when redeemed, may be worth more or less than their original cost. The above table and graph do not reflect the deduction of taxes that a shareholder would pay on fund distributions or the redemption of shares. Current performance may be lower or higher than the performance data quoted. The average annual total return is the annual compound return for the indicated period and reflects the change in share price and the reinvestment of all dividends and capital gains. Call 1-888-672-4839 for current performance information or questions. |
| Fund Statistics | |||
| Total Net Assets | $3,215,892 | Advisory Fees Paid by the Fund | $0 |
| Number of Portfolio Holdings | 9 | Portfolio Turnover Rate | 16% |
What did the Fund invest in (as a % of the Fund’s net assets)?
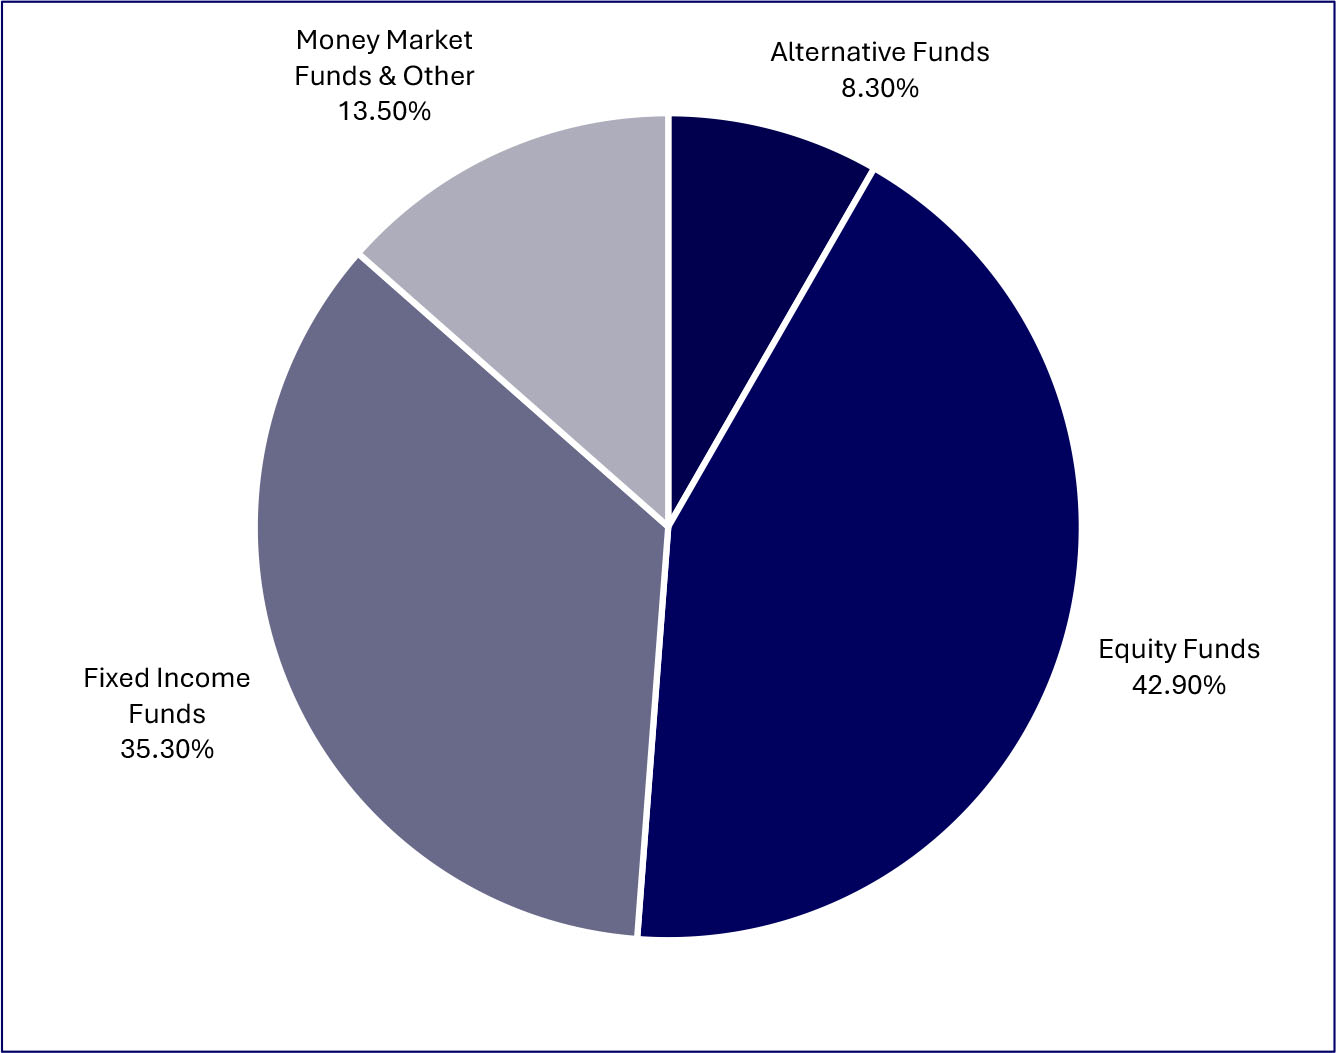
| Top Holdings (%) | |
| Vanguard Intermediate-Term Bond Index Fund Admiral Class | |
| Saratoga Large Cap Growth Fund, Class I | |
| Dreyfus Inst Prefer Govt Money Mkt Inst Class | |
| Saratoga Large Cap Value Fund, Class I | |
| Saratoga Mid Capitalization Fund, Class I | |
| Eaton Vance Global Macro Absolute Return Fund, Class I | |
| Vanguard Short-Term Bond Index Fund, Admiral Class | |
| Saratoga Small Capitalization Fund, Class I | |
| Vanguard Total International Stock Index Fund, Admiral Class | |
| Material Fund changes during the period. |
| Below is a summary of certain changes, and planned changes, to the Fund during the reporting period. For more complete information, you may review the Fund’s next prospectus, which we expect to be available by December 31, 2026, at www.saratogacap.com/fund-reports or upon request at 1-888-672-4839. |
| During the period there were no material changes to the Fund. |
| What were the Fund’s costs for the last year (based on a hypothetical $10,000 investment)? | ||
| Fund | Costs of a $10,000 Investment | Costs paid as a % of a $10,000 Investment |
| Saratoga Moderate Balanced Allocation Fund, Class A | $129 | 1.24% |
| What affected the Fund’s performance during this period? |
|
During the period, the Fund’s equity allocation was roughly in line with the benchmark’s, but the Fund held considerably less in international stocks, which hurt relative performance, as international stocks outperformed U.S. stocks. The Fund held less in bonds than the benchmark and more in cash equivalents and alternatives, which helped the Fund’s performance, as bonds trailed both cash equivalents and alternatives.
Within the Fund’s equity allocation, an overweight to the Large Cap Growth sector versus the Large Cap Value sector helped relative performance, as the Large Cap Growth sector outperformed the Large Cap Value sector. Within the Fund’s bond allocation, the Fund sold its position in the Long-Term debt sector and added a position in the Short-Term debt sector, which helped performance, as the Short-Term debt sector outperformed the Intermediate- and Long-Term debt sectors. The Fund’s overweight to the Intermediate-Term debt sector versus the Short-Term debt sector was a drag on relative performance.
From a security-selection standpoint, the Fund’s use of the Saratoga Large Cap Value fund was the largest drag on relative performance, as it significantly underperformed its passive counterpart. The Saratoga Large Cap Growth, Saratoga Technology & Communications, and Saratoga Small Cap funds also underperformed their passive counterparts, which hurt relative performance. The Fund’s use of the Vanguard Intermediate-Term Bond Index Fund was also a drag on performance, as it trailed its active counterparts. The Saratoga Health & Biotechnology and Saratoga Mid Cap funds outperformed their passive counterparts, helping the Fund’s relative performance. |
How has the Fund performed since its inception?
The chart below represents the historical performance of a hypothetical $10,000 investment since inception in the class of shares noted and assumes the reinvestment of dividends and capital gains and the maximum sales charge, if any. Fund expenses, including management fees, 12b-1 fees, if any, and other expenses were deducted.
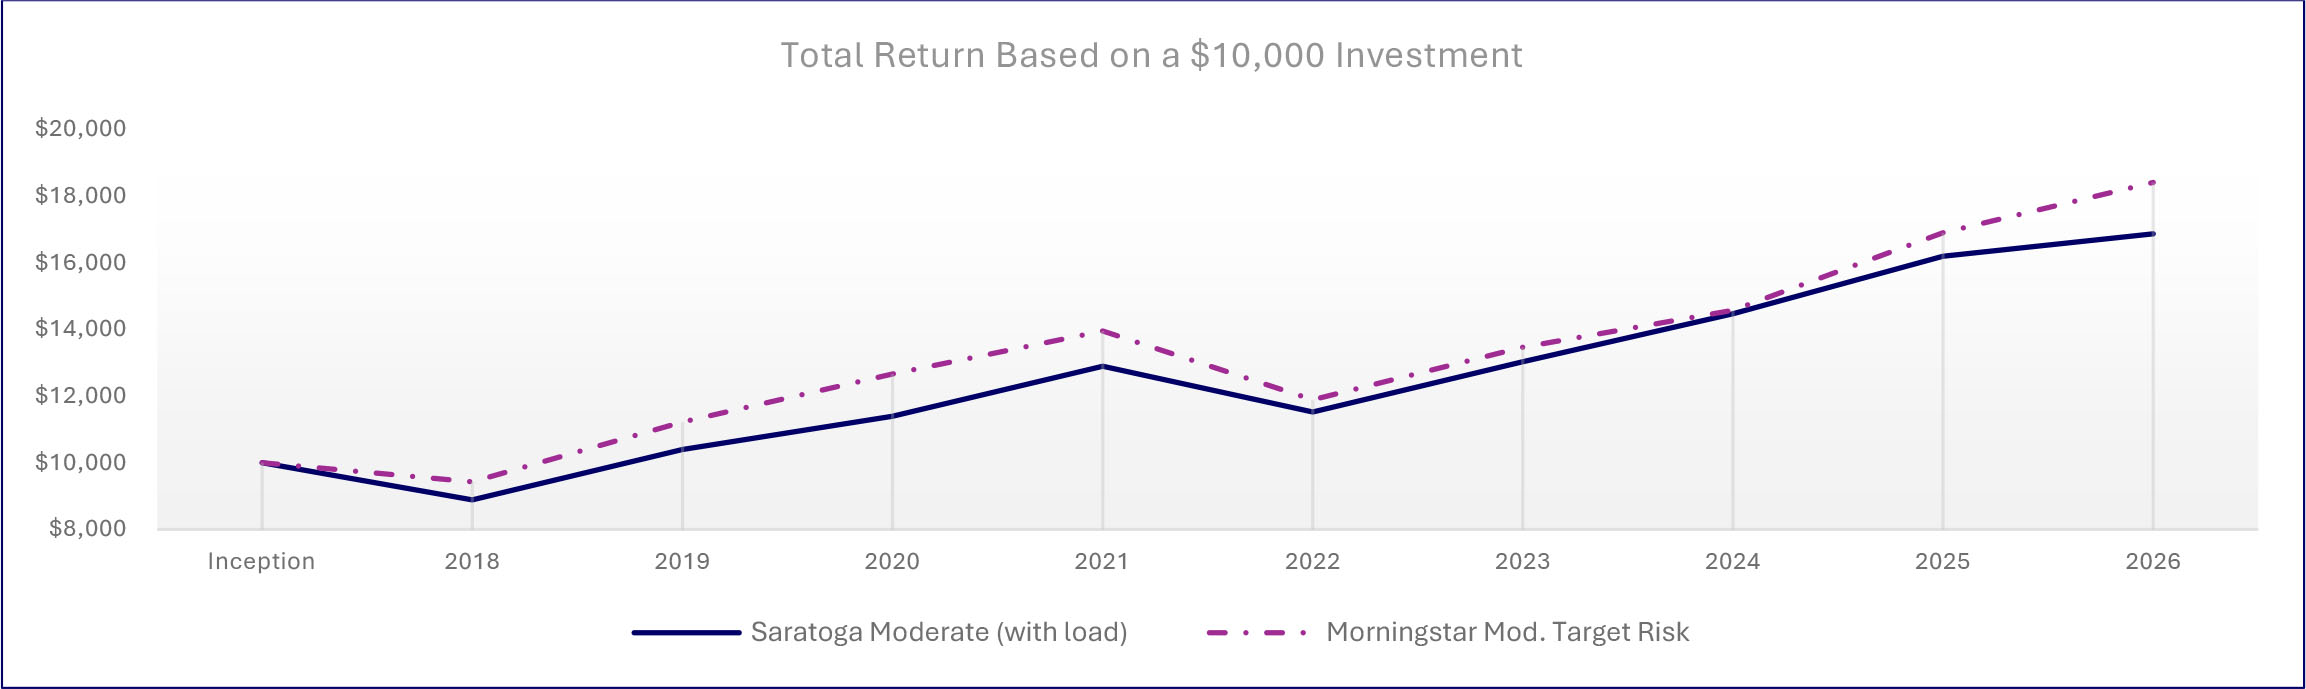
| Average Annual Total Returns | |||
| 1 Year | 5 Years | Since Inception1 | |
| Saratoga Moderate Balanced Allocation Fund, Class A (with load) | 1.08% | 4.68% | 6.23% |
| Saratoga Moderate Balanced Allocation Fund, Class A | 7.27% | 5.92% | 6.95% |
| Morningstar Moderate Target Risk Index | 13.41% | 5.85% | 7.30% |
| 1 | From January 4, 2018. Performance data quoted represents past performance, which is not a good predictor of the Fund’s future performance. Investment return and principal value will fluctuate so that shares, when redeemed, may be worth more or less than their original cost. The above table and graph do not reflect the deduction of taxes that a shareholder would pay on fund distributions or the redemption of shares. Current performance may be lower or higher than the performance data quoted. The average annual total return is the annual compound return for the indicated period and reflects the change in share price and the reinvestment of all dividends and capital gains. Call 1-888-672-4839 for current performance information or questions. |
| Fund Statistics | |||
| Total Net Assets | $2,626,573 | Advisory Fees Paid by the Fund | $0 |
| Number of Portfolio Holdings | 11 | Portfolio Turnover Rate | 14% |
What did the Fund invest in (as a % of the Fund’s net assets)?
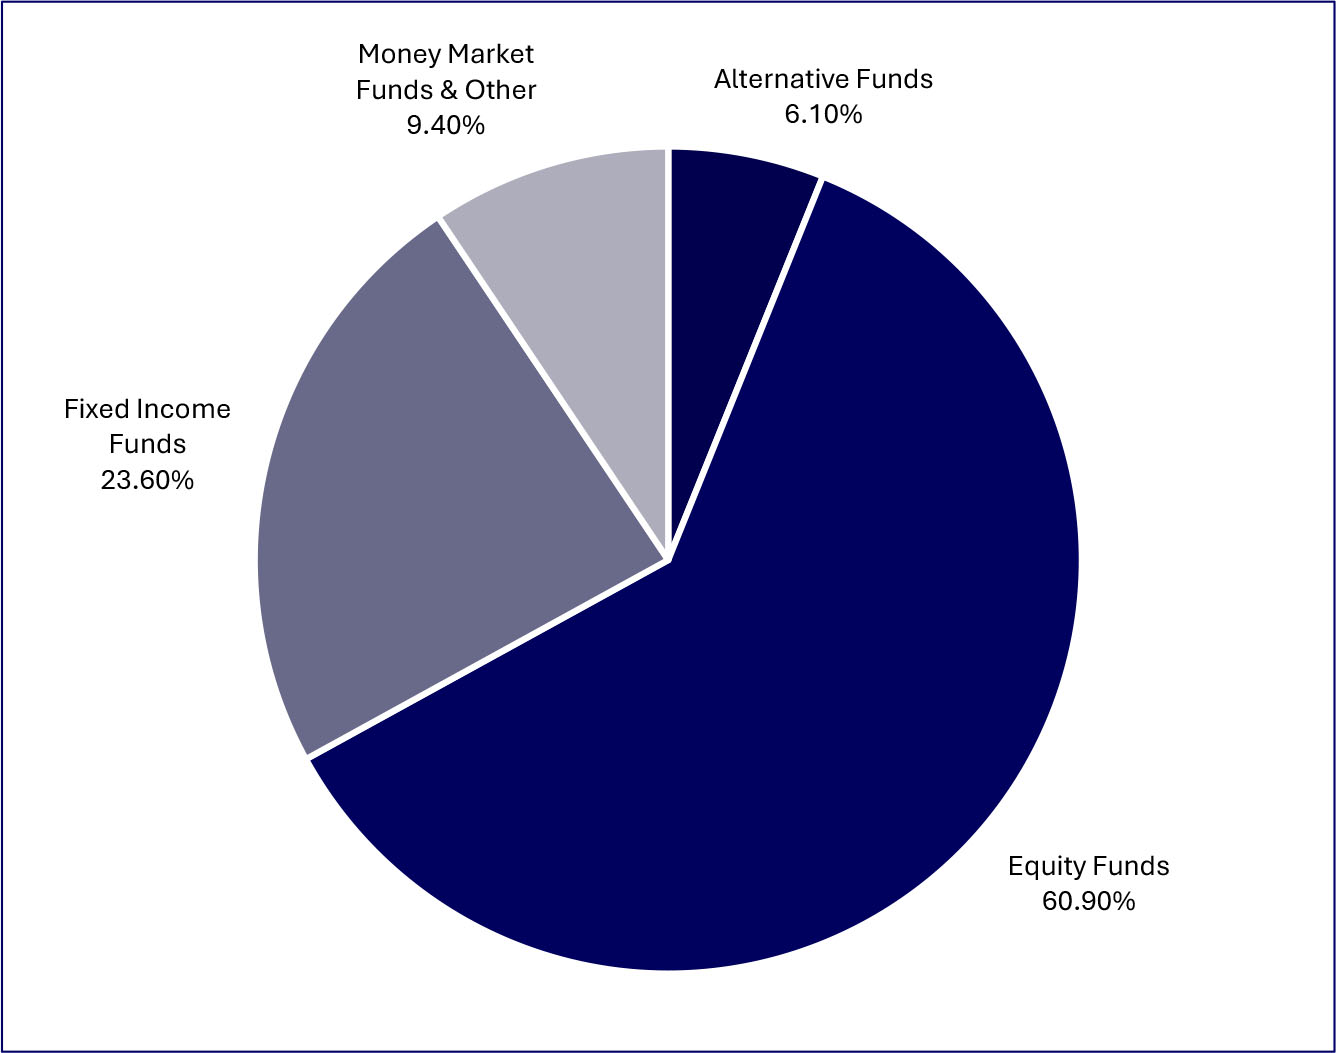
| Top Holdings (%) | |
| Vanguard Intermediate-Term Bond Index Fund Admiral Class | |
| Saratoga Large Cap Growth Fund, Class I | |
| Saratoga Large Cap Value Fund, Class I | |
| Saratoga Mid Capitalization Fund, Class I | |
| Dreyfus Inst Prefer Govt Money Mkt Inst Class | |
| Eaton Vance Global Macro Absolute Return Fund, Class I | |
| Saratoga Small Capitalization Fund, Class I | |
| Saratoga Technology & Comm Fund, Class I | |
| Vanguard Total International Stock Index Fund, Admiral Class | |
| Vanguard Short-Term Bond Index Fund, Admiral Class | |
| Material Fund changes during the period. |
| Below is a summary of certain changes, and planned changes, to the Fund during the reporting period. For more complete information, you may review the Fund’s next prospectus, which we expect to be available by December 31, 2026, at www.saratogacap.com/fund-reports or upon request at 1-888-672-4839. |
| During the period there were no material changes to the Fund. |
| What were the Fund’s costs for the last year (based on a hypothetical $10,000 investment)? | ||
| Fund | Costs of a $10,000 Investment | Costs paid as a % of a $10,000 Investment |
| Saratoga Moderate Balanced Allocation Fund, Class C | $205 | 1.99% |
| What affected the Fund’s performance during this period? |
|
During the period, the Fund’s equity allocation was roughly in line with the benchmark’s, but the Fund held considerably less in international stocks, which hurt relative performance, as international stocks outperformed U.S. stocks. The Fund held less in bonds than the benchmark and more in cash equivalents and alternatives, which helped the Fund’s performance, as bonds trailed both cash equivalents and alternatives.
Within the Fund’s equity allocation, an overweight to the Large Cap Growth sector versus the Large Cap Value sector helped relative performance, as the Large Cap Growth sector outperformed the Large Cap Value sector. Within the Fund’s bond allocation, the Fund sold its position in the Long-Term debt sector and added a position in the Short-Term debt sector, which helped performance, as the Short-Term debt sector outperformed the Intermediate- and Long-Term debt sectors. The Fund’s overweight to the Intermediate-Term debt sector versus the Short-Term debt sector was a drag on relative performance.
From a security-selection standpoint, the Fund’s use of the Saratoga Large Cap Value fund was the largest drag on relative performance, as it significantly underperformed its passive counterpart. The Saratoga Large Cap Growth, Saratoga Technology & Communications, and Saratoga Small Cap funds also underperformed their passive counterparts, which hurt relative performance. The Fund’s use of the Vanguard Intermediate-Term Bond Index Fund was also a drag on performance, as it trailed its active counterparts. The Saratoga Health & Biotechnology and Saratoga Mid Cap funds outperformed their passive counterparts, helping the Fund’s relative performance. |
How has the Fund performed since its inception?
The chart below represents the historical performance of a hypothetical $10,000 investment since inception in the class of shares noted and assumes the reinvestment of dividends and capital gains and the maximum sales charge, if any. Fund expenses, including management fees, 12b-1 fees, if any, and other expenses were deducted.
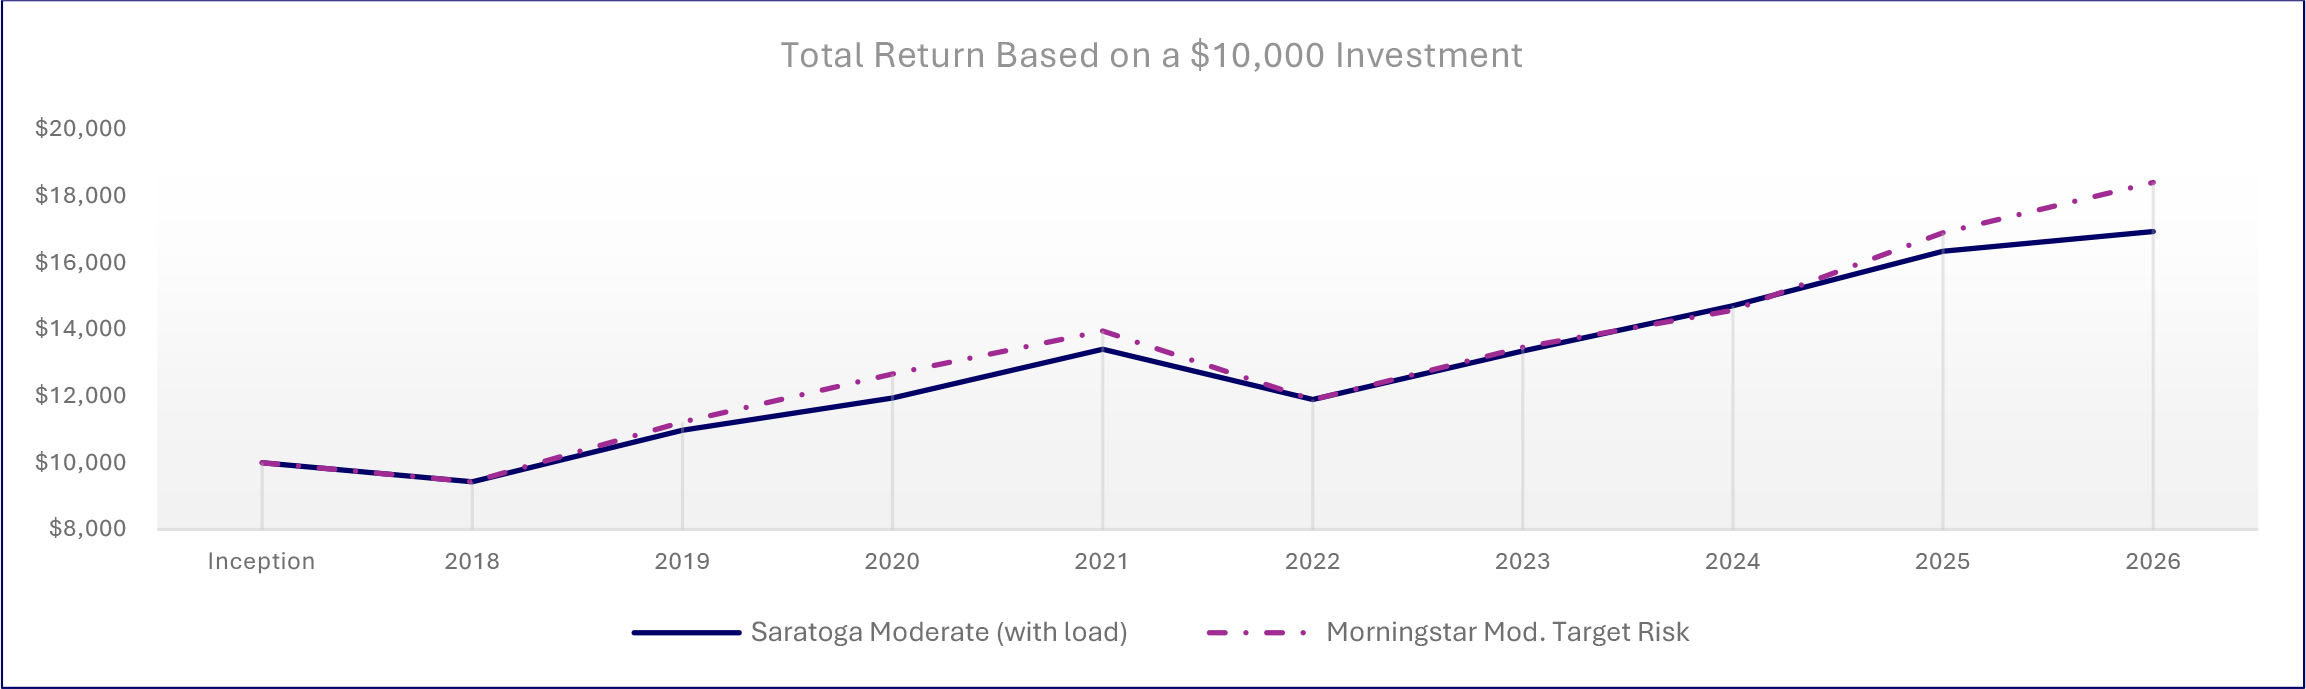
| Average Annual Total Returns | |||
| 1 Year | 5 Years | Since Inception1 | |
| Saratoga Moderate Balanced Allocation Fund, Class C (with load) | 5.39% | 5.10% | 6.27% |
| Saratoga Moderate Balanced Allocation Fund, Class C | 6.39% | 5.10% | 6.27% |
| Morningstar Moderate Target Risk Index | 13.41% | 5.85% | 7.30% |
| 1 | From January 4, 2018. Performance data quoted represents past performance, which is not a good predictor of the Fund’s future performance. Investment return and principal value will fluctuate so that shares, when redeemed, may be worth more or less than their original cost. The above table and graph do not reflect the deduction of taxes that a shareholder would pay on fund distributions or the redemption of shares. Current performance may be lower or higher than the performance data quoted. The average annual total return is the annual compound return for the indicated period and reflects the change in share price and the reinvestment of all dividends and capital gains. Call 1-888-672-4839 for current performance information or questions. |
| Fund Statistics | |||
| Total Net Assets | $2,626,573 | Advisory Fees Paid by the Fund | $0 |
| Number of Portfolio Holdings | 11 | Portfolio Turnover Rate | 14% |
What did the Fund invest in (as a % of the Fund’s net assets)?
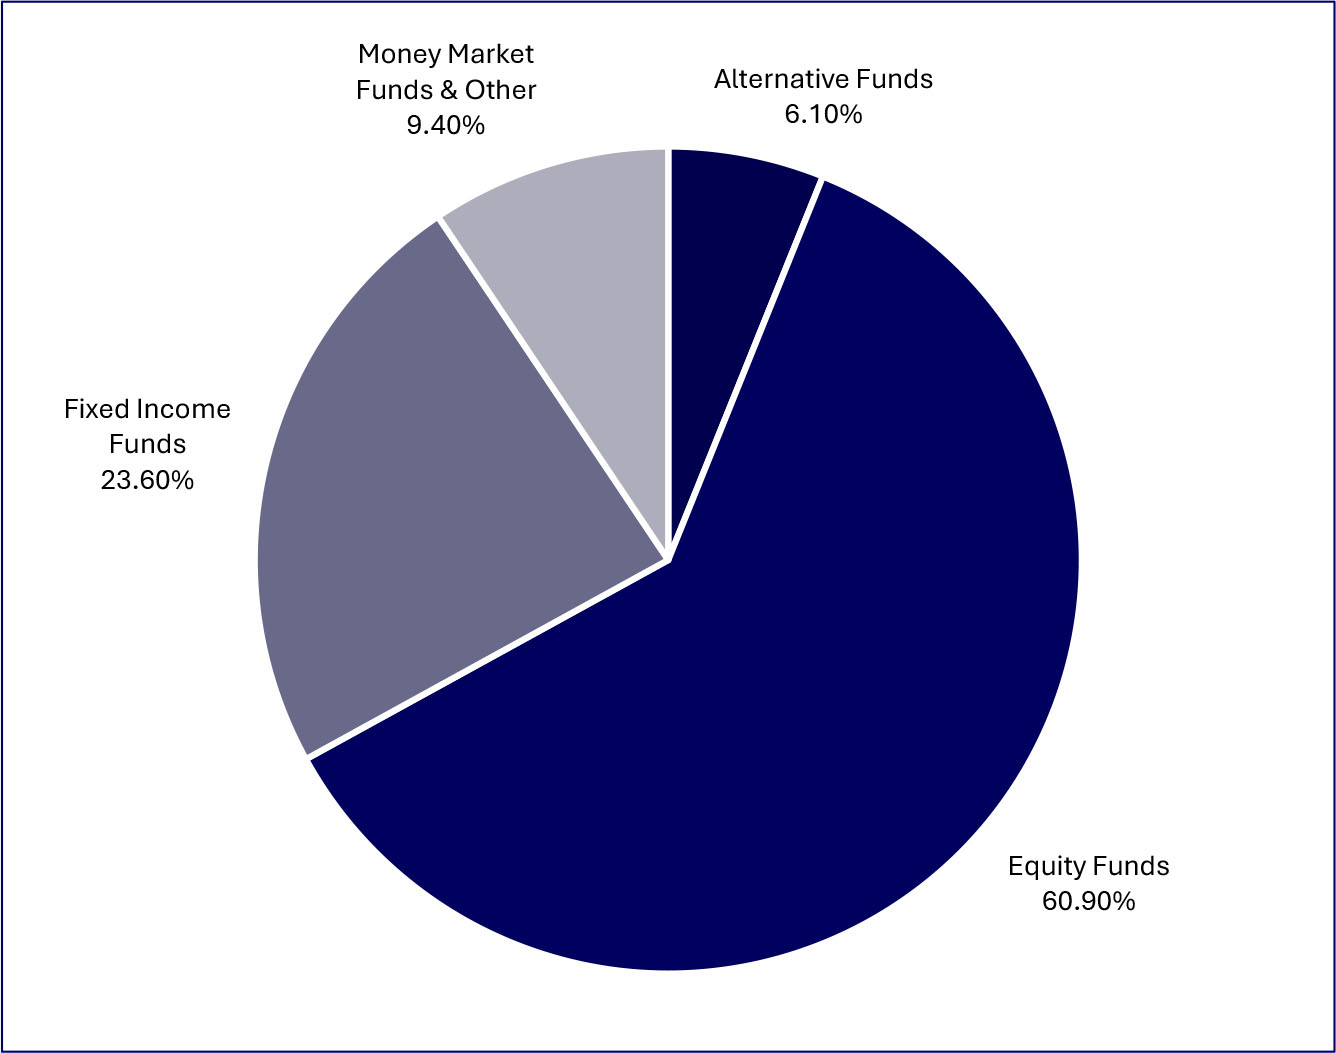
| Top Holdings (%) | |
| Vanguard Intermediate-Term Bond Index Fund Admiral Class | |
| Saratoga Large Cap Growth Fund, Class I | |
| Saratoga Large Cap Value Fund, Class I | |
| Saratoga Mid Capitalization Fund, Class I | |
| Dreyfus Inst Prefer Govt Money Mkt Inst Class | |
| Eaton Vance Global Macro Absolute Return Fund, Class I | |
| Saratoga Small Capitalization Fund, Class I | |
| Saratoga Technology & Comm Fund, Class I | |
| Vanguard Total International Stock Index Fund, Admiral Class | |
| Vanguard Short-Term Bond Index Fund, Admiral Class | |
| Material Fund changes during the period. |
| Below is a summary of certain changes, and planned changes, to the Fund during the reporting period. For more complete information, you may review the Fund’s next prospectus, which we expect to be available by December 31, 2026, at www.saratogacap.com/fund-reports or upon request at 1-888-672-4839. |
| During the period there were no material changes to the Fund. |
| What were the Fund’s costs for the last year (based on a hypothetical $10,000 investment)? | ||
| Fund | Costs of a $10,000 Investment | Costs paid as a % of a $10,000 Investment |
| Saratoga Moderate Balanced Allocation Fund, Class I | $103 | 0.99% |
| What affected the Fund’s performance during this period? |
|
During the period, the Fund’s equity allocation was roughly in line with the benchmark’s, but the Fund held considerably less in international stocks, which hurt relative performance, as international stocks outperformed U.S. stocks. The Fund held less in bonds than the benchmark and more in cash equivalents and alternatives, which helped the Fund’s performance, as bonds trailed both cash equivalents and alternatives.
Within the Fund’s equity allocation, an overweight to the Large Cap Growth sector versus the Large Cap Value sector helped relative performance, as the Large Cap Growth sector outperformed the Large Cap Value sector. Within the Fund’s bond allocation, the Fund sold its position in the Long-Term debt sector and added a position in the Short-Term debt sector, which helped performance, as the Short-Term debt sector outperformed the Intermediate- and Long-Term debt sectors. The Fund’s overweight to the Intermediate-Term debt sector versus the Short-Term debt sector was a drag on relative performance.
From a security-selection standpoint, the Fund’s use of the Saratoga Large Cap Value fund was the largest drag on relative performance, as it significantly underperformed its passive counterpart. The Saratoga Large Cap Growth, Saratoga Technology & Communications, and Saratoga Small Cap funds also underperformed their passive counterparts, which hurt relative performance. The Fund’s use of the Vanguard Intermediate-Term Bond Index Fund was also a drag on performance, as it trailed its active counterparts. The Saratoga Health & Biotechnology and Saratoga Mid Cap funds outperformed their passive counterparts, helping the Fund’s relative performance. |
How has the Fund performed since its inception?
The chart below represents the historical performance of a hypothetical $10,000 investment since inception in the class of shares noted and assumes the reinvestment of dividends and capital gains and the maximum sales charge, if any. Fund expenses, including management fees, 12b-1 fees, if any, and other expenses were deducted.
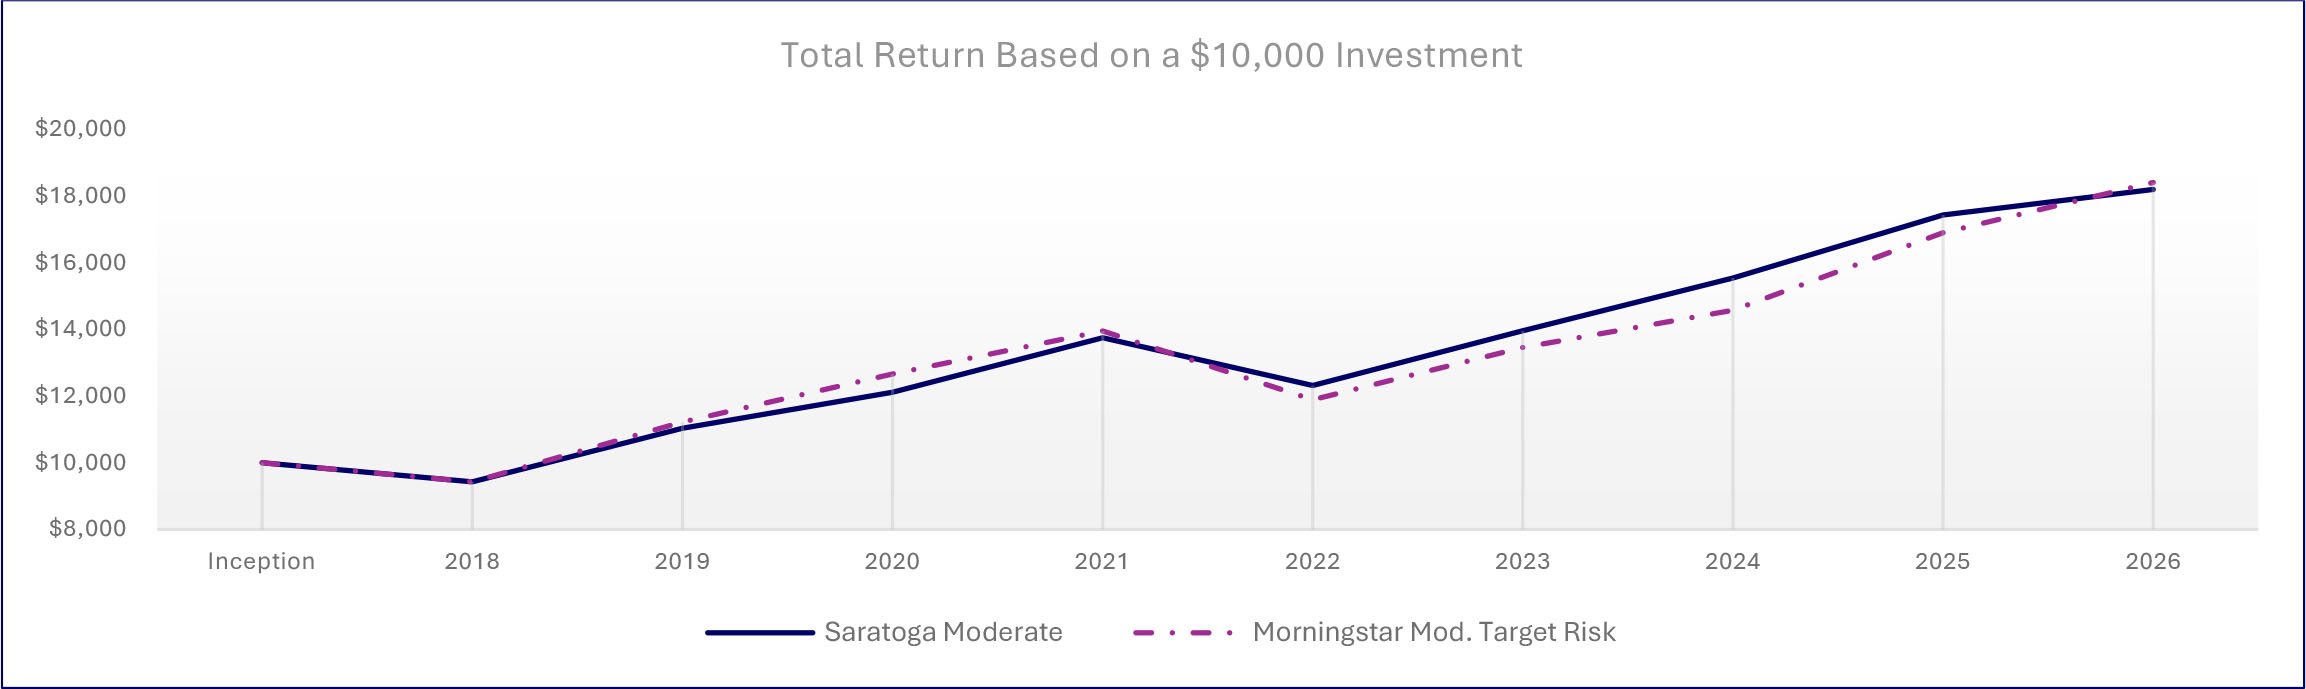
| Average Annual Total Returns | |||
| 1 Year | 5 Years | Since Inception1 | |
| Saratoga Moderate Balanced Allocation Fund, Class I | 7.51% | 6.18% | 7.16% |
| Morningstar Moderate Target Risk Index | 13.41% | 5.85% | 7.30% |
| 1 | From January 4, 2018. Performance data quoted represents past performance, which is not a good predictor of the Fund’s future performance. Investment return and principal value will fluctuate so that shares, when redeemed, may be worth more or less than their original cost. The above table and graph do not reflect the deduction of taxes that a shareholder would pay on fund distributions or the redemption of shares. Current performance may be lower or higher than the performance data quoted. The average annual total return is the annual compound return for the indicated period and reflects the change in share price and the reinvestment of all dividends and capital gains. Call 1-888-672-4839 for current performance information or questions. |
| Fund Statistics | |||
| Total Net Assets | $2,626,573 | Advisory Fees Paid by the Fund | $0 |
| Number of Portfolio Holdings | 11 | Portfolio Turnover Rate | 14% |
What did the Fund invest in (as a % of the Fund’s net assets)?
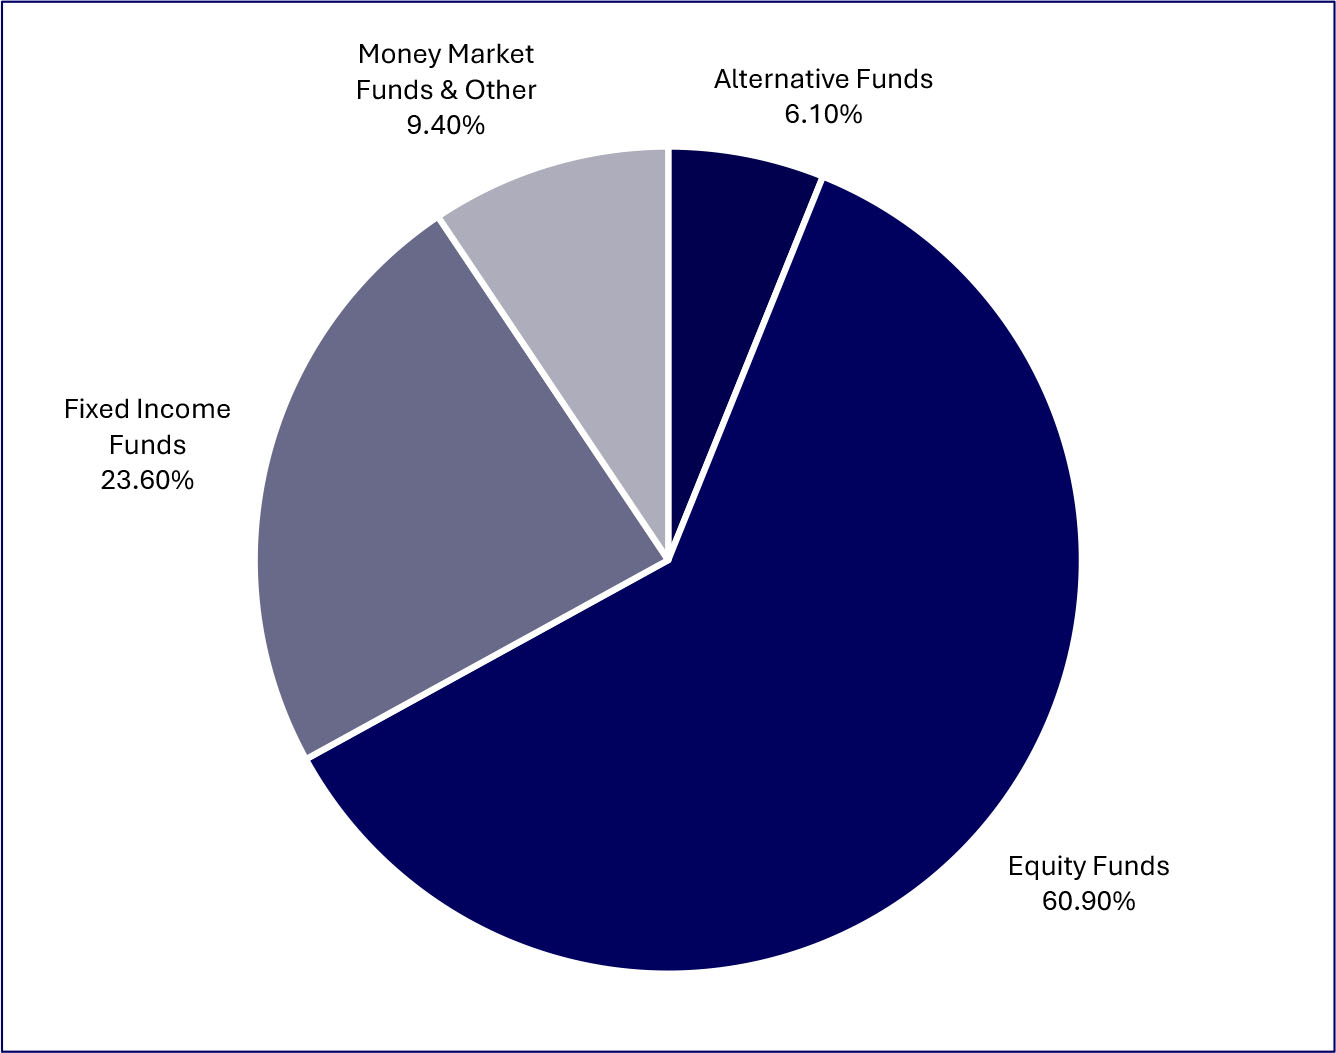
| Top Holdings (%) | |
| Vanguard Intermediate-Term Bond Index Fund Admiral Class | |
| Saratoga Large Cap Growth Fund, Class I | |
| Saratoga Large Cap Value Fund, Class I | |
| Saratoga Mid Capitalization Fund, Class I | |
| Dreyfus Inst Prefer Govt Money Mkt Inst Class | |
| Eaton Vance Global Macro Absolute Return Fund, Class I | |
| Saratoga Small Capitalization Fund, Class I | |
| Saratoga Technology & Comm Fund, Class I | |
| Vanguard Total International Stock Index Fund, Admiral Class | |
| Vanguard Short-Term Bond Index Fund, Admiral Class | |
| Material Fund changes during the period. |
| Below is a summary of certain changes, and planned changes, to the Fund during the reporting period. For more complete information, you may review the Fund’s next prospectus, which we expect to be available by December 31, 2026, at www.saratogacap.com/fund-reports or upon request at 1-888-672-4839. |
| During the period there were no material changes to the Fund. |
| What were the Fund’s costs for the last year (based on a hypothetical $10,000 investment)? | ||
| Fund | Costs of a $10,000 Investment | Costs paid as a % of a $10,000 Investment |
| Saratoga Moderately Aggressive Balanced Allocation Fund, Class A | $129 | 1.24% |
| What affected the Fund’s performance during this period? |
During the period, an overweight to equities versus the benchmark helped the Fund’s relative performance, as stocks outperformed bonds, cash equivalents and alternatives. In addition, the Fund’s smaller allocation to bonds in favor of cash equivalents and alternatives helped relative Fund performance. However, the Fund was underweight in international stocks versus the benchmark, which hurt relative performance, as international stocks outperformed U.S. stocks.
Within the Fund’s equity allocation, an overweight to the Large Cap Growth sector versus the Large Cap Value sector helped the Fund’s relative performance, as the Large Cap Growth sector outperformed the Large Cap Value sector. Within the Fund’s bond allocation, the Fund sold its position in the Long-Term debt sector and added a position in the Short-Term debt sector, which helped performance, as the Short-Term debt sector outperformed the Intermediate- and Long-Term debt sectors. The Fund’s overweight to the Intermediate-Term debt sector versus the Short-Term debt sector was a drag on relative performance.
From a security-selection standpoint, the Fund’s use of the Saratoga Large Cap Value fund was the largest drag on relative performance, as it significantly underperformed its passive counterpart. The Saratoga Large Cap Growth, Saratoga Technology & Communications, and Saratoga Small Cap funds also underperformed their passive counterparts, which hurt relative performance. The Fund’s use of the Vanguard Intermediate-Term Bond Index Fund was also a drag on performance, as it trailed its active counterparts. The Saratoga Health & Biotechnology and Saratoga Mid Cap funds outperformed their passive counterparts, helping the Fund’s relative performance. |
How has the Fund performed since its inception?
The chart below represents the historical performance of a hypothetical $10,000 investment since inception in the class of shares noted and assumes the reinvestment of dividends and capital gains and the maximum sales charge, if any. Fund expenses, including management fees, 12b-1 fees, if any, and other expenses were deducted.
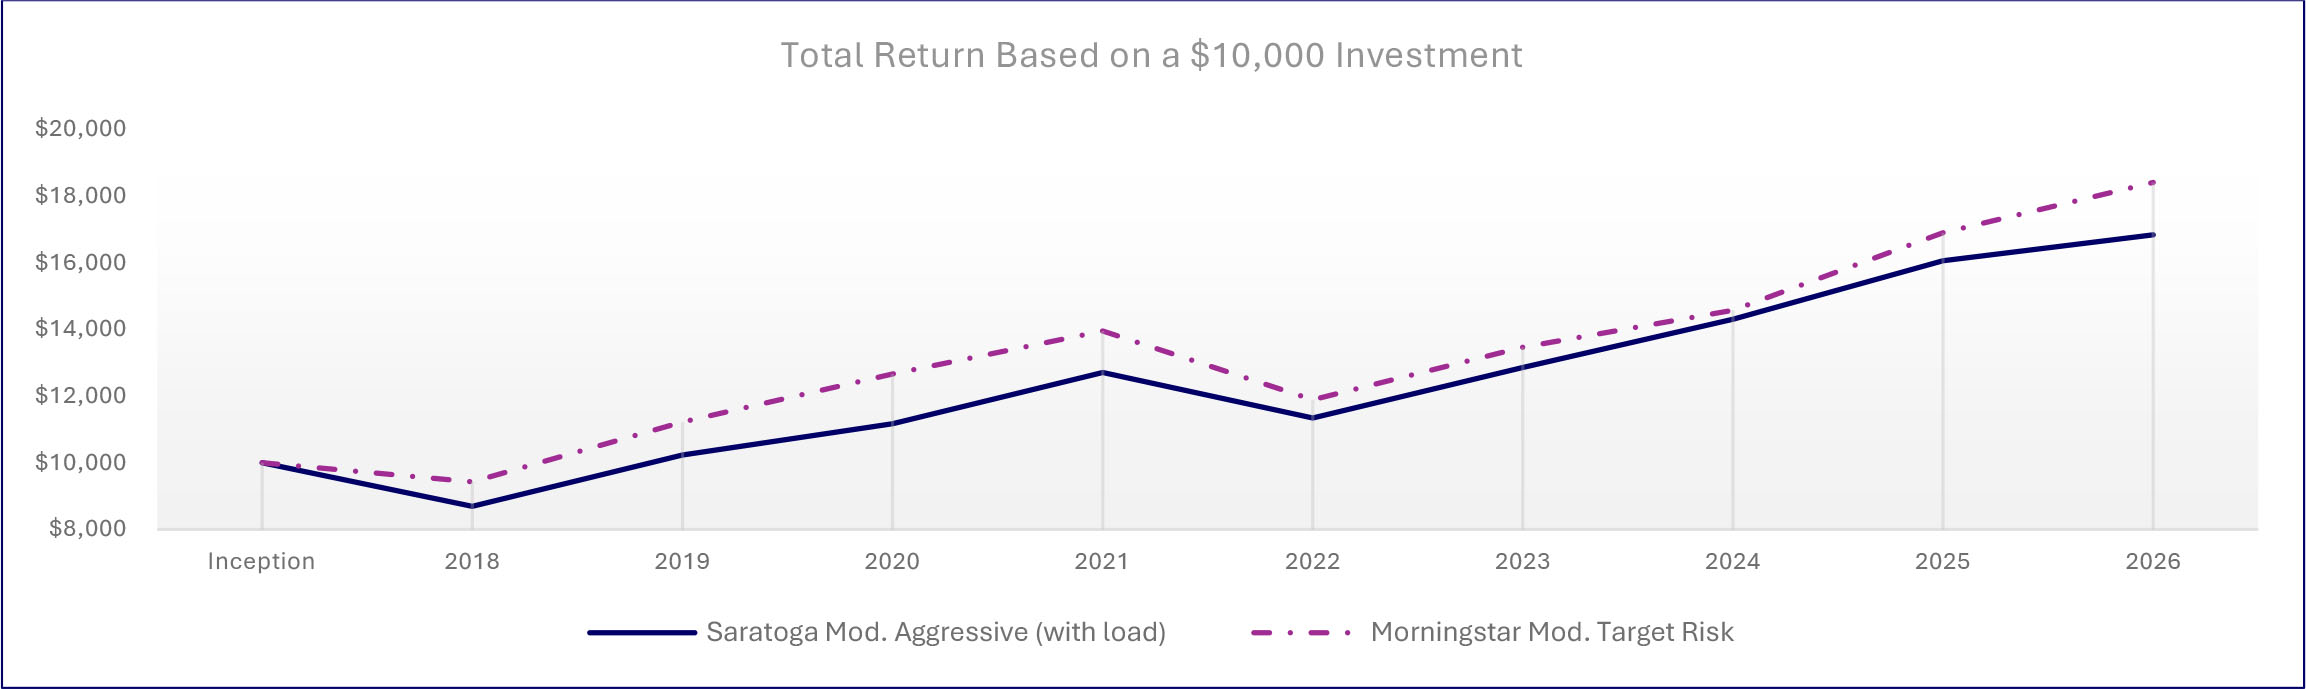
| Average Annual Total Returns | |||
| 1 Year | 5 Years | Since Inception1 | |
| Saratoga Moderately Aggressive Balanced Allocation Fund, Class A (with load) | 1.88% | 4.91% | 6.20% |
| Saratoga Moderately Aggressive Balanced Allocation Fund, Class A | 8.11% | 6.16% | 6.93% |
| Morningstar Moderate Target Risk Index | 13.41% | 5.85% | 7.30% |
| 1 | From January 4, 2018. Performance data quoted represents past performance, which is not a good predictor of the Fund’s future performance. Investment return and principal value will fluctuate so that shares, when redeemed, may be worth more or less than their original cost. The above table and graph do not reflect the deduction of taxes that a shareholder would pay on fund distributions or the redemption of shares. Current performance may be lower or higher than the performance data quoted. The average annual total return is the annual compound return for the indicated period and reflects the change in share price and the reinvestment of all dividends and capital gains. Call 1-888-672-4839 for current performance information or questions. |
| Fund Statistics | |||
| Total Net Assets | $1,290,837 | Advisory Fees Paid by the Fund | $0 |
| Number of Portfolio Holdings | 11 | Portfolio Turnover Rate | 19% |
What did the Fund invest in (as a % of the Fund’s net assets)?
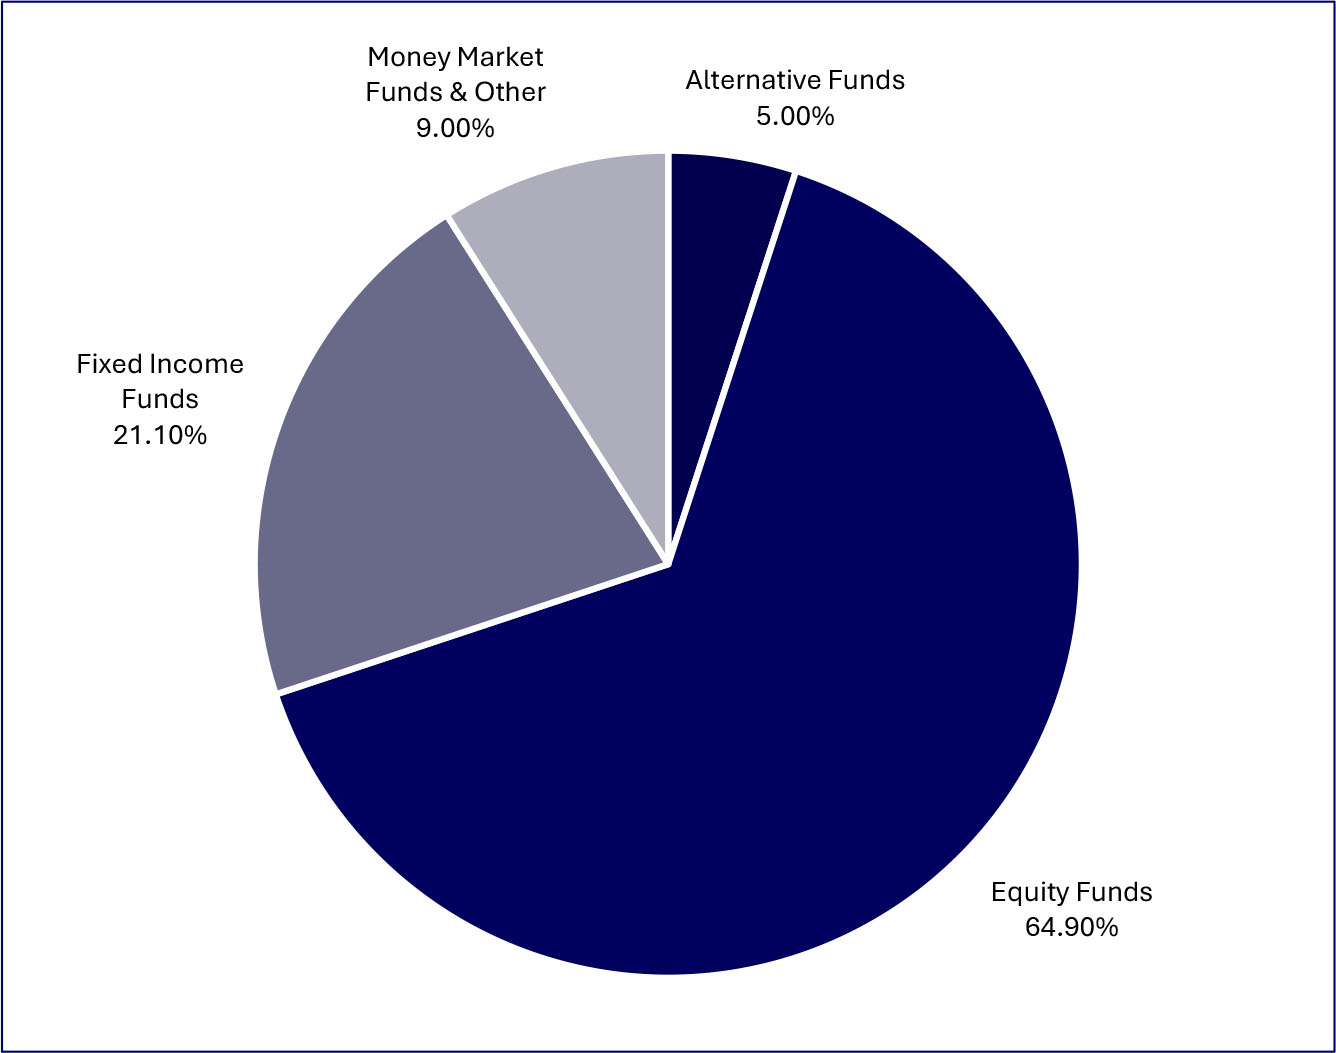
| Top Holdings (%) | |
| Vanguard Intermediate-Term Bond Index Fund Admiral Class | |
| Saratoga Large Cap Growth Fund, Class I | |
| Saratoga Large Cap Value Fund, Class I | |
| Saratoga Mid Capitalization Fund, Class I | |
| Dreyfus Inst Prefer Govt Money Mkt Inst Class | |
| Saratoga Small Capitalization Fund, Class I | |
| Vanguard Total International Stock Index Fund, Admiral Class | |
| Eaton Vance Global Macro Absolute Return Fund, Class I | |
| Saratoga Technology & Comm Fund, Class I | |
| Saratoga Health & Biotech Fund, Class I | |
| Material Fund changes during the period. |
| Below is a summary of certain changes, and planned changes, to the Fund during the reporting period. For more complete information, you may review the Fund’s next prospectus, which we expect to be available by December 31, 2026, at www.saratogacap.com/fund-reports or upon request at 1-888-672-4839. |
| During the period there were no material changes to the Fund. |
| What were the Fund’s costs for the last year (based on a hypothetical $10,000 investment)? | ||
| Fund | Costs of a $10,000 Investment | Costs paid as a % of a $10,000 Investment |
| Saratoga Moderately Aggressive Balanced Allocation Fund, Class C | $206 | 1.99% |
| What affected the Fund’s performance during this period? |
During the period, an overweight to equities versus the benchmark helped the Fund’s relative performance, as stocks outperformed bonds, cash equivalents and alternatives. In addition, the Fund’s smaller allocation to bonds in favor of cash equivalents and alternatives helped relative Fund performance. However, the Fund was underweight in international stocks versus the benchmark, which hurt relative performance, as international stocks outperformed U.S. stocks.
Within the Fund’s equity allocation, an overweight to the Large Cap Growth sector versus the Large Cap Value sector helped the Fund’s relative performance, as the Large Cap Growth sector outperformed the Large Cap Value sector. Within the Fund’s bond allocation, the Fund sold its position in the Long-Term debt sector and added a position in the Short-Term debt sector, which helped performance, as the Short-Term debt sector outperformed the Intermediate- and Long-Term debt sectors. The Fund’s overweight to the Intermediate-Term debt sector versus the Short-Term debt sector was a drag on relative performance.
From a security-selection standpoint, the Fund’s use of the Saratoga Large Cap Value fund was the largest drag on relative performance, as it significantly underperformed its passive counterpart. The Saratoga Large Cap Growth, Saratoga Technology & Communications, and Saratoga Small Cap funds also underperformed their passive counterparts, which hurt relative performance. The Fund’s use of the Vanguard Intermediate-Term Bond Index Fund was also a drag on performance, as it trailed its active counterparts. The Saratoga Health & Biotechnology and Saratoga Mid Cap funds outperformed their passive counterparts, helping the Fund’s relative performance. |
How has the Fund performed since its inception?
The chart below represents the historical performance of a hypothetical $10,000 investment since inception in the class of shares noted and assumes the reinvestment of dividends and capital gains and the maximum sales charge, if any. Fund expenses, including management fees, 12b-1 fees, if any, and other expenses were deducted.
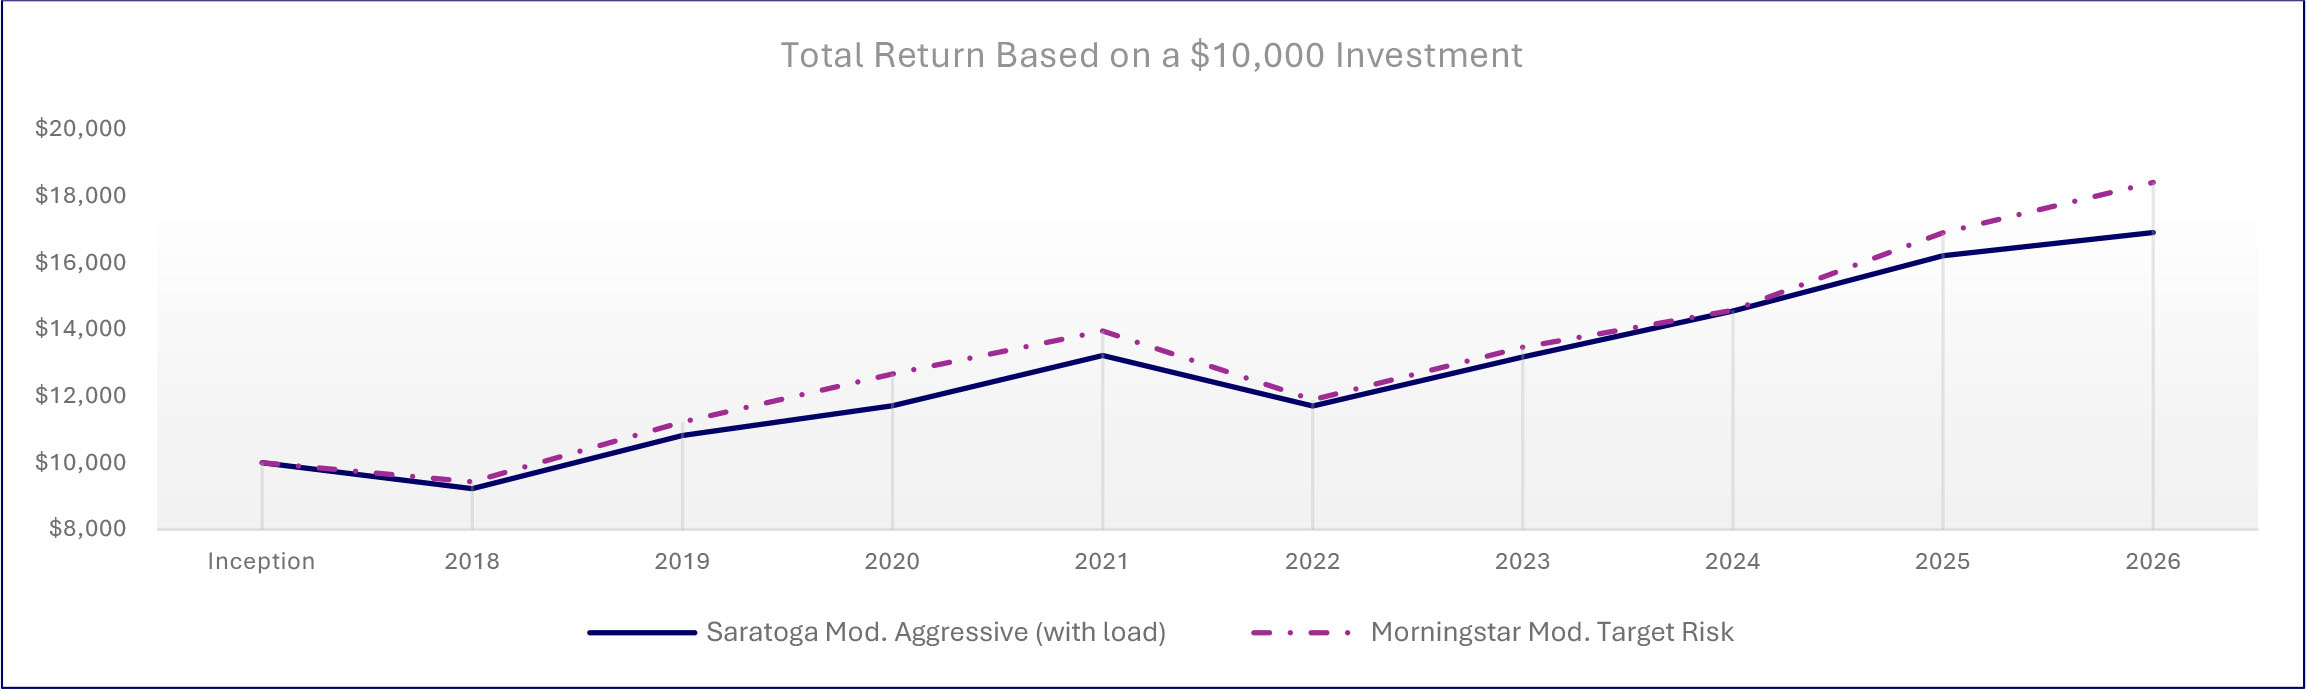
| Average Annual Total Returns | |||
| 1 Year | 5 Years | Since Inception1 | |
| Saratoga Moderately Aggressive Balanced Allocation Fund, Class C (with load) | 6.22% | 5.36% | 6.25% |
| Saratoga Moderately Aggressive Balanced Allocation Fund, Class C | 7.22% | 5.36% | 6.25% |
| Morningstar Moderate Target Risk Index | 13.41% | 5.85% | 7.30% |
| 1 | From January 4, 2018. Performance data quoted represents past performance, which is not a good predictor of the Fund’s future performance. Investment return and principal value will fluctuate so that shares, when redeemed, may be worth more or less than their original cost. The above table and graph do not reflect the deduction of taxes that a shareholder would pay on fund distributions or the redemption of shares. Current performance may be lower or higher than the performance data quoted. The average annual total return is the annual compound return for the indicated period and reflects the change in share price and the reinvestment of all dividends and capital gains. Call 1-888-672-4839 for current performance information or questions. |
| Fund Statistics | |||
| Total Net Assets | $1,290,837 | Advisory Fees Paid by the Fund | $0 |
| Number of Portfolio Holdings | 11 | Portfolio Turnover Rate | 19% |
What did the Fund invest in (as a % of the Fund’s net assets)?
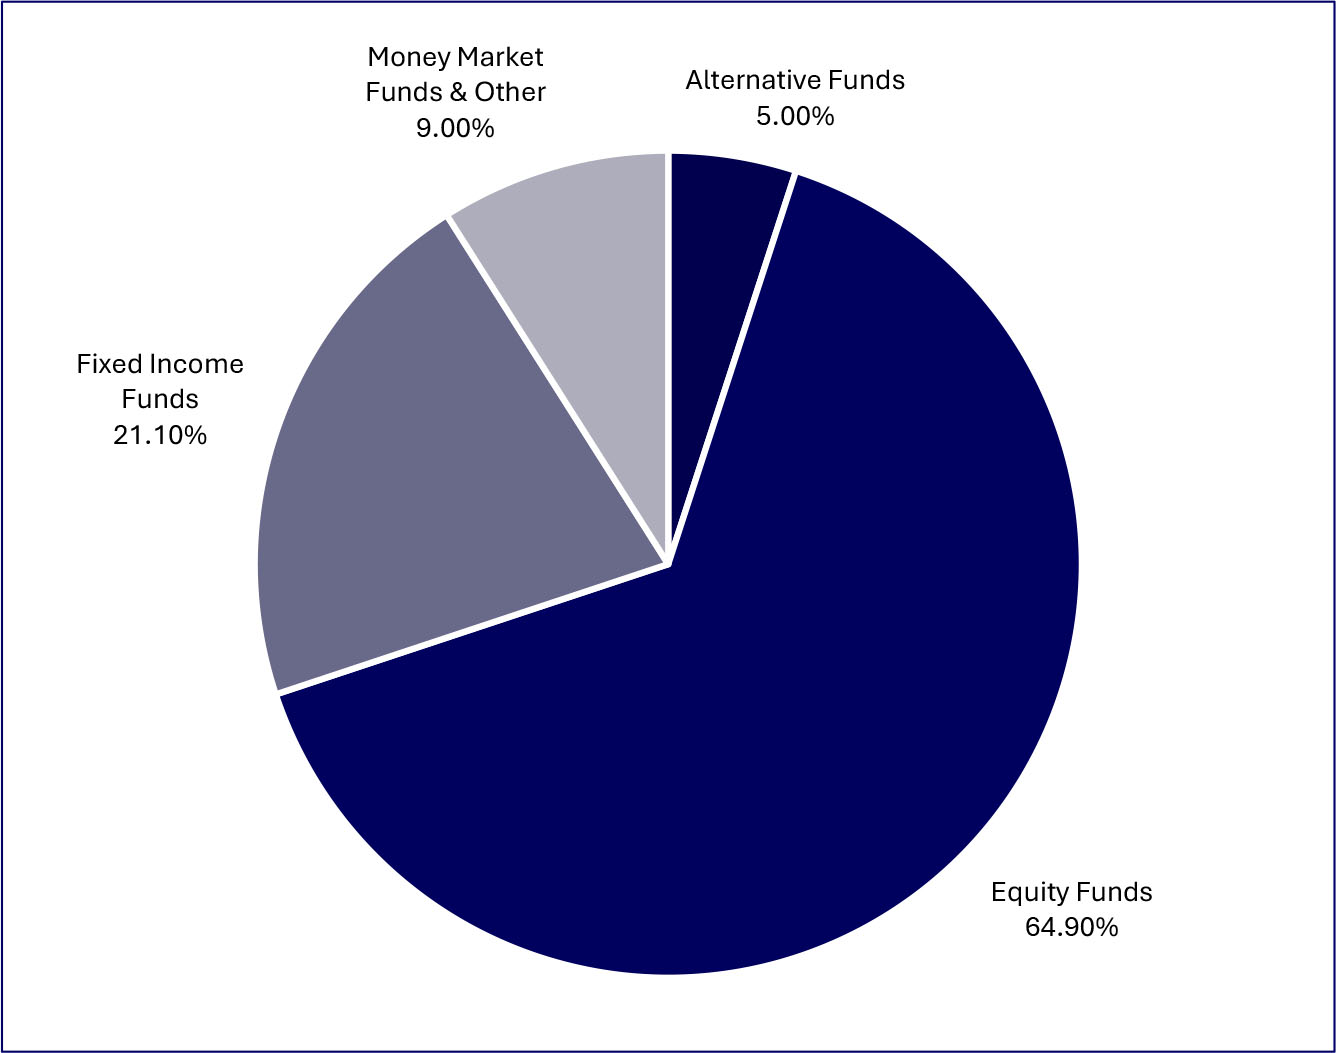
| Top Holdings (%) | |
| Vanguard Intermediate-Term Bond Index Fund Admiral Class | |
| Saratoga Large Cap Growth Fund, Class I | |
| Saratoga Large Cap Value Fund, Class I | |
| Saratoga Mid Capitalization Fund, Class I | |
| Dreyfus Inst Prefer Govt Money Mkt Inst Class | |
| Saratoga Small Capitalization Fund, Class I | |
| Vanguard Total International Stock Index Fund, Admiral Class | |
| Eaton Vance Global Macro Absolute Return Fund, Class I | |
| Saratoga Technology & Comm Fund, Class I | |
| Saratoga Health & Biotech Fund, Class I | |
| Material Fund changes during the period. |
| Below is a summary of certain changes, and planned changes, to the Fund during the reporting period. For more complete information, you may review the Fund’s next prospectus, which we expect to be available by December 31, 2026, at www.saratogacap.com/fund-reports or upon request at 1-888-672-4839. |
| During the period there were no material changes to the Fund. |
| What were the Fund’s costs for the last year (based on a hypothetical $10,000 investment)? | ||
| Fund | Costs of a $10,000 Investment | Costs paid as a % of a $10,000 Investment |
| Saratoga Moderately Aggressive Balanced Allocation Fund, Class I | $103 | 0.99% |
| What affected the Fund’s performance during this period? |
During the period, an overweight to equities versus the benchmark helped the Fund’s relative performance, as stocks outperformed bonds, cash equivalents and alternatives. In addition, the Fund’s smaller allocation to bonds in favor of cash equivalents and alternatives helped relative Fund performance. However, the Fund was underweight in international stocks versus the benchmark, which hurt relative performance, as international stocks outperformed U.S. stocks.
Within the Fund’s equity allocation, an overweight to the Large Cap Growth sector versus the Large Cap Value sector helped the Fund’s relative performance, as the Large Cap Growth sector outperformed the Large Cap Value sector. Within the Fund’s bond allocation, the Fund sold its position in the Long-Term debt sector and added a position in the Short-Term debt sector, which helped performance, as the Short-Term debt sector outperformed the Intermediate- and Long-Term debt sectors. The Fund’s overweight to the Intermediate-Term debt sector versus the Short-Term debt sector was a drag on relative performance.
From a security-selection standpoint, the Fund’s use of the Saratoga Large Cap Value fund was the largest drag on relative performance, as it significantly underperformed its passive counterpart. The Saratoga Large Cap Growth, Saratoga Technology & Communications, and Saratoga Small Cap funds also underperformed their passive counterparts, which hurt relative performance. The Fund’s use of the Vanguard Intermediate-Term Bond Index Fund was also a drag on performance, as it trailed its active counterparts. The Saratoga Health & Biotechnology and Saratoga Mid Cap funds outperformed their passive counterparts, helping the Fund’s relative performance. |
How has the Fund performed since its inception?
The chart below represents the historical performance of a hypothetical $10,000 investment since inception in the class of shares noted and assumes the reinvestment of dividends and capital gains and the maximum sales charge, if any. Fund expenses, including management fees, 12b-1 fees, if any, and other expenses were deducted.
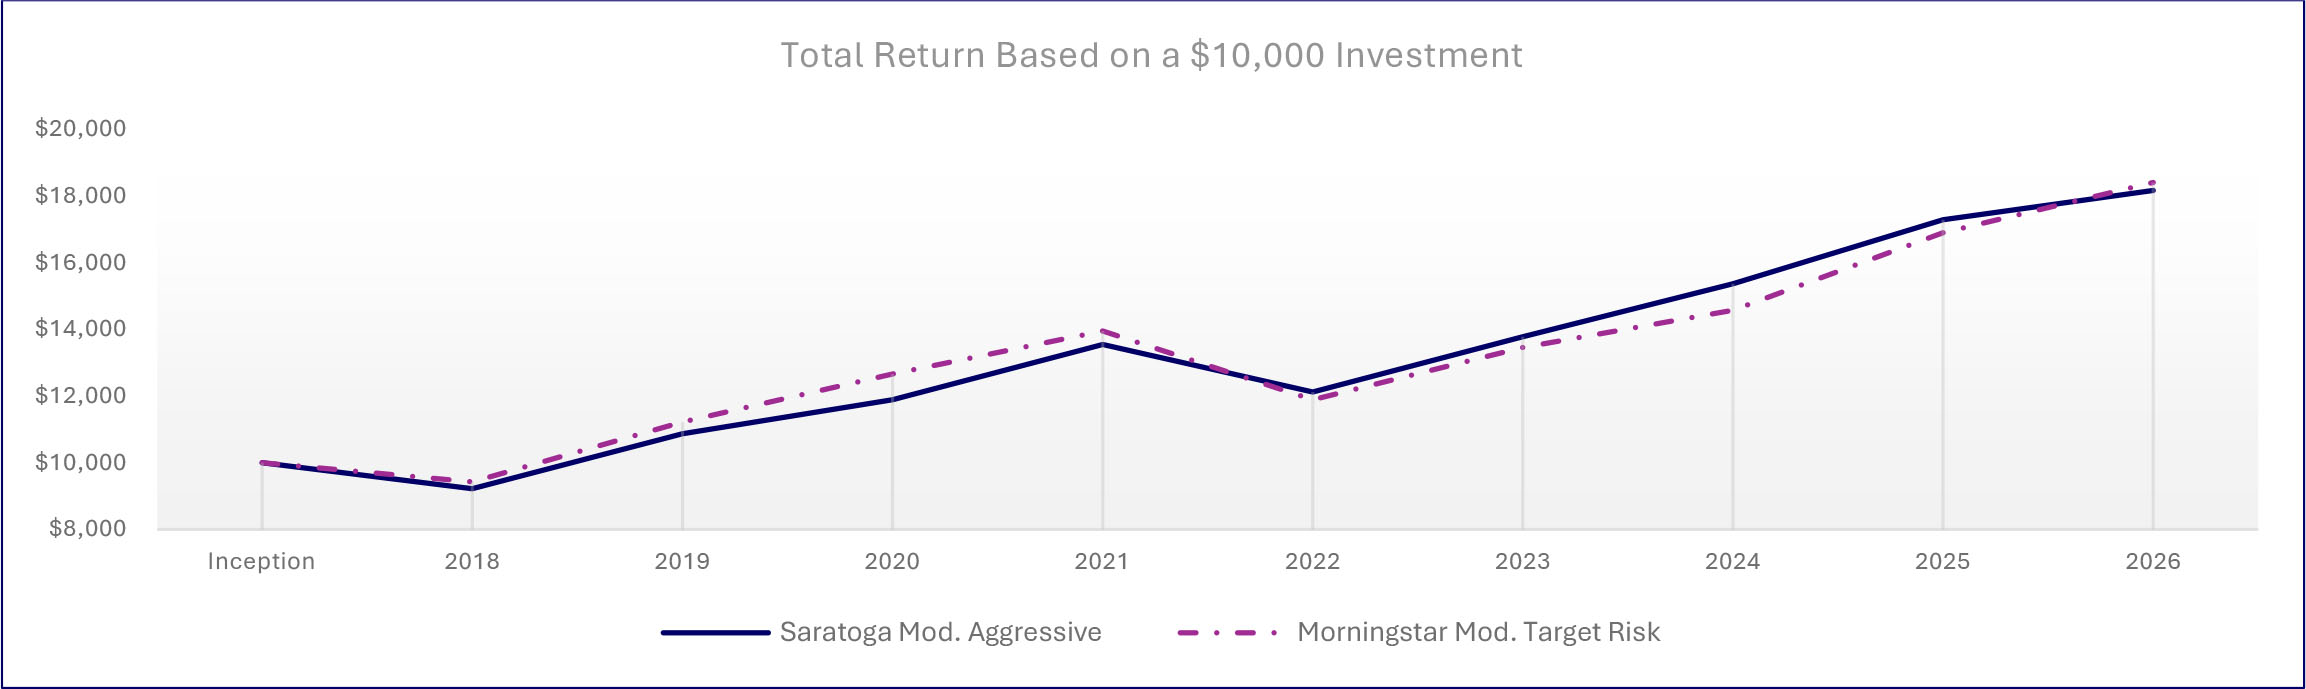
| Average Annual Total Returns | |||
| 1 Year | 5 Years | Since Inception1 | |
| Saratoga Moderately Aggressive Balanced Allocation Fund, Class I | 8.39% | 6.42% | 7.14% |
| Morningstar Moderate Target Risk Index | 13.41% | 5.85% | 7.30% |
| 1 | From January 4, 2018. Performance data quoted represents past performance, which is not a good predictor of the Fund’s future performance. Investment return and principal value will fluctuate so that shares, when redeemed, may be worth more or less than their original cost. The above table and graph do not reflect the deduction of taxes that a shareholder would pay on fund distributions or the redemption of shares. Current performance may be lower or higher than the performance data quoted. The average annual total return is the annual compound return for the indicated period and reflects the change in share price and the reinvestment of all dividends and capital gains. Call 1-888-672-4839 for current performance information or questions. |
| Fund Statistics | |||
| Total Net Assets | $1,290,837 | Advisory Fees Paid by the Fund | $0 |
| Number of Portfolio Holdings | 11 | Portfolio Turnover Rate | 19% |
What did the Fund invest in (as a % of the Fund’s net assets)?
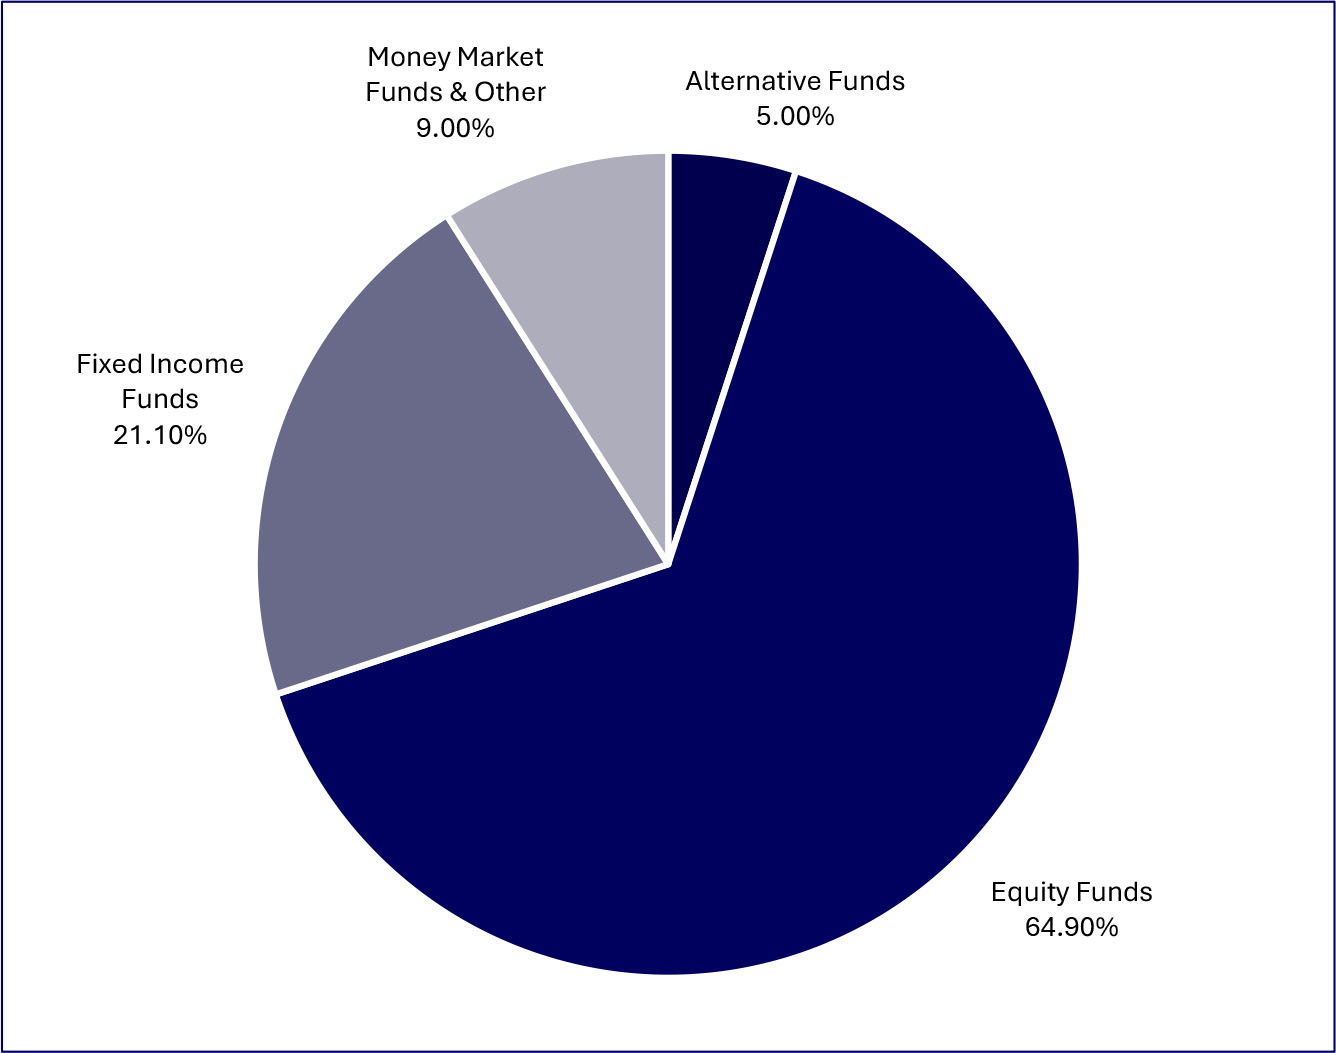
| Top Holdings (%) | |
| Vanguard Intermediate-Term Bond Index Fund Admiral Class | |
| Saratoga Large Cap Growth Fund, Class I | |
| Saratoga Large Cap Value Fund, Class I | |
| Saratoga Mid Capitalization Fund, Class I | |
| Dreyfus Inst Prefer Govt Money Mkt Inst Class | |
| Saratoga Small Capitalization Fund, Class I | |
| Vanguard Total International Stock Index Fund, Admiral Class | |
| Eaton Vance Global Macro Absolute Return Fund, Class I | |
| Saratoga Technology & Comm Fund, Class I | |
| Saratoga Health & Biotech Fund, Class I | |
| Material Fund changes during the period. |
| Below is a summary of certain changes, and planned changes, to the Fund during the reporting period. For more complete information, you may review the Fund’s next prospectus, which we expect to be available by December 31, 2026, at www.saratogacap.com/fund-reports or upon request at 1-888-672-4839. |
| During the period there were no material changes to the Fund. |
| What were the Fund’s costs for the last year (based on a hypothetical $10,000 investment)? | ||
| Fund | Costs of a $10,000 Investment | Costs paid as a % of a $10,000 Investment |
| Saratoga Moderately Conservative Balanced Allocation Fund, Class A | $128 | 1.24% |
| What affected the Fund’s performance during this period? |
|
During the period, the Fund held modestly less in equities and considerably less in international stocks than the benchmark, and both positions detracted from relative performance, as stocks outperformed bonds and international stocks outperformed U.S. stocks. The Fund’s smaller allocation to bonds versus the benchmark, in favor of cash equivalents and alternatives, helped the Fund’s relative performance, as bonds trailed both cash equivalents and alternatives.
Within the Fund’s equity allocation, an overweight to the Large Cap Growth sector versus the Large Cap Value sector helped relative performance, as the Large Cap Growth sector outperformed the Large Cap Value sector. Within the Fund’s bond allocation, the Fund sold its position in the Long-Term debt sector and added a position in the Short-Term debt sector, which helped performance, as the Short-Term debt sector outperformed the Intermediate- and Long-Term debt sectors. The Fund’s overweight to the Intermediate-Term debt sector versus the Short-Term debt sector was a drag on relative performance.
From a security-selection standpoint, the Fund’s use of the Saratoga Large Cap Value fund was the largest drag on relative performance, as it significantly underperformed its passive counterpart. The Saratoga Large Cap Growth and Saratoga Small Cap funds also underperformed their passive counterparts, which hurt relative performance. The Fund’s use of the Vanguard Intermediate-Term Bond Index Fund was also a drag on performance, as it trailed its active counterparts. The Saratoga Mid Cap fund outperformed its passive counterpart, helping the Fund’s relative performance. |
How has the Fund performed since its inception?
The chart below represents the historical performance of a hypothetical $10,000 investment since inception in the class of shares noted and assumes the reinvestment of dividends and capital gains and the maximum sales charge, if any. Fund expenses, including management fees, 12b-1 fees, if any, and other expenses were deducted.
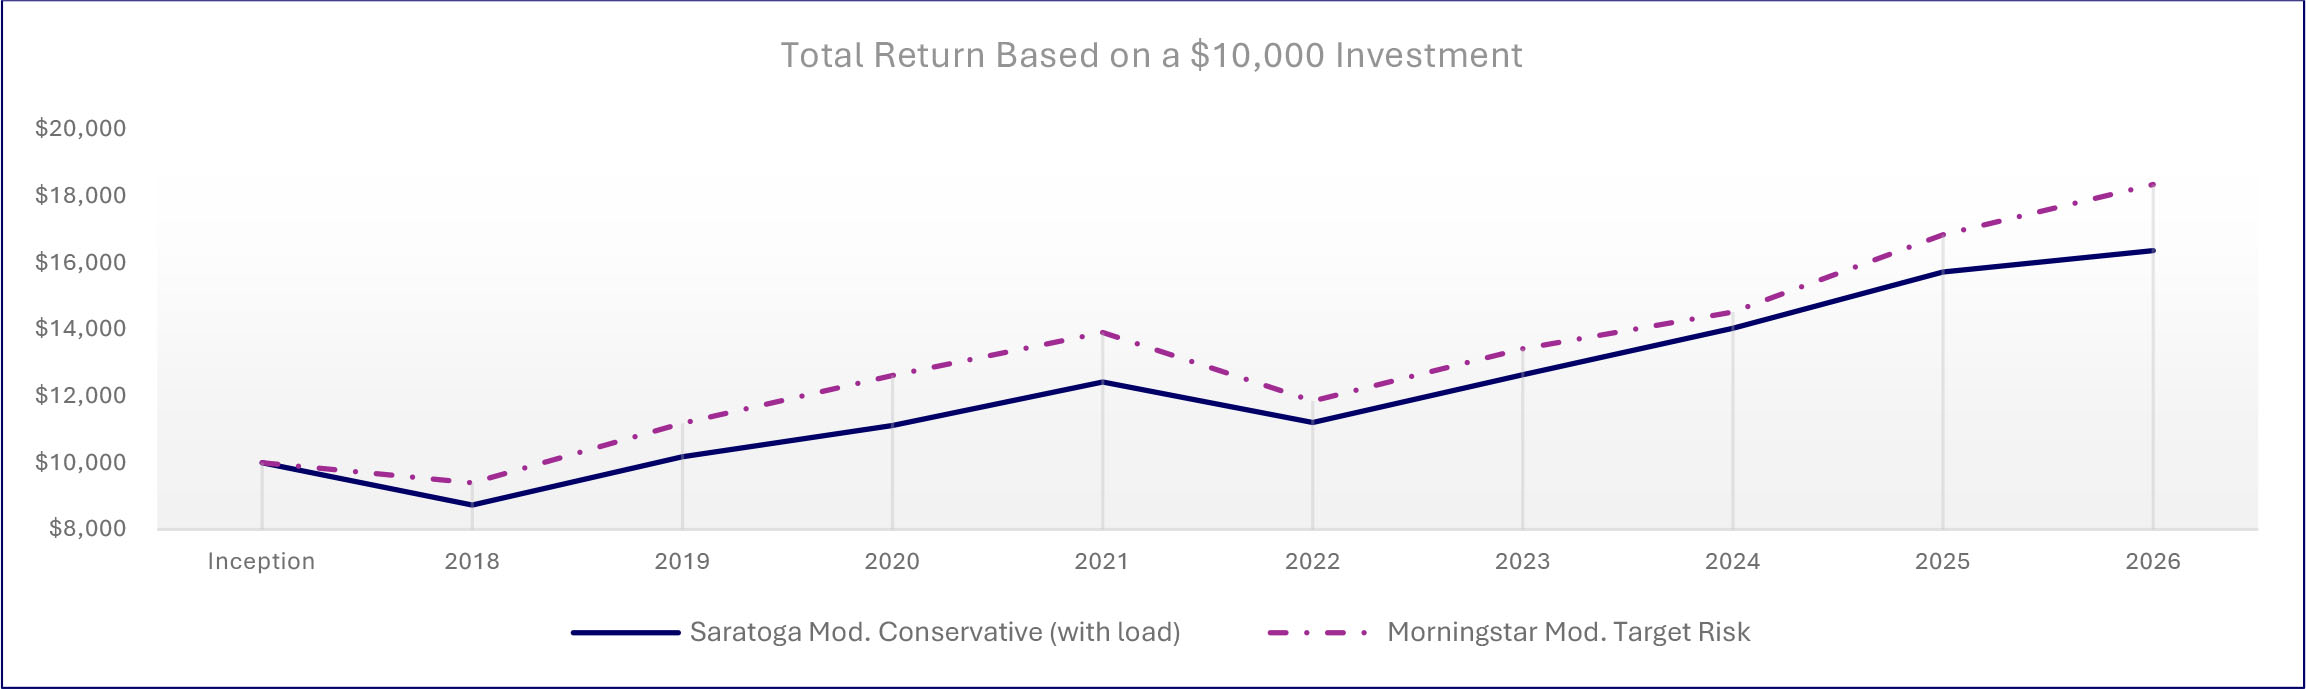
| Average Annual Total Returns | |||
| 1 Year | 5 Years | Since Inception1 | |
| Saratoga Moderately Conservative Balanced Allocation Fund, Class A (with load) | 0.94% | 4.77% | 5.86% |
| Saratoga Moderately Conservative Balanced Allocation Fund, Class A | 7.06% | 6.01% | 6.59% |
| Morningstar Moderate Target Risk Index | 13.41% | 5.85% | 7.28% |
| 1 | From January 10, 2018. Performance data quoted represents past performance, which is not a good predictor of the Fund’s future performance. Investment return and principal value will fluctuate so that shares, when redeemed, may be worth more or less than their original cost. The above table and graph do not reflect the deduction of taxes that a shareholder would pay on fund distributions or the redemption of shares. Current performance may be lower or higher than the performance data quoted. The average annual total return is the annual compound return for the indicated period and reflects the change in share price and the reinvestment of all dividends and capital gains. Call 1-888-672-4839 for current performance information or questions. |
| Fund Statistics | |||
| Total Net Assets | $951,312 | Advisory Fees Paid by the Fund | $0 |
| Number of Portfolio Holdings | 9 | Portfolio Turnover Rate | 12% |
What did the Fund invest in (as a % of the Fund’s net assets)?
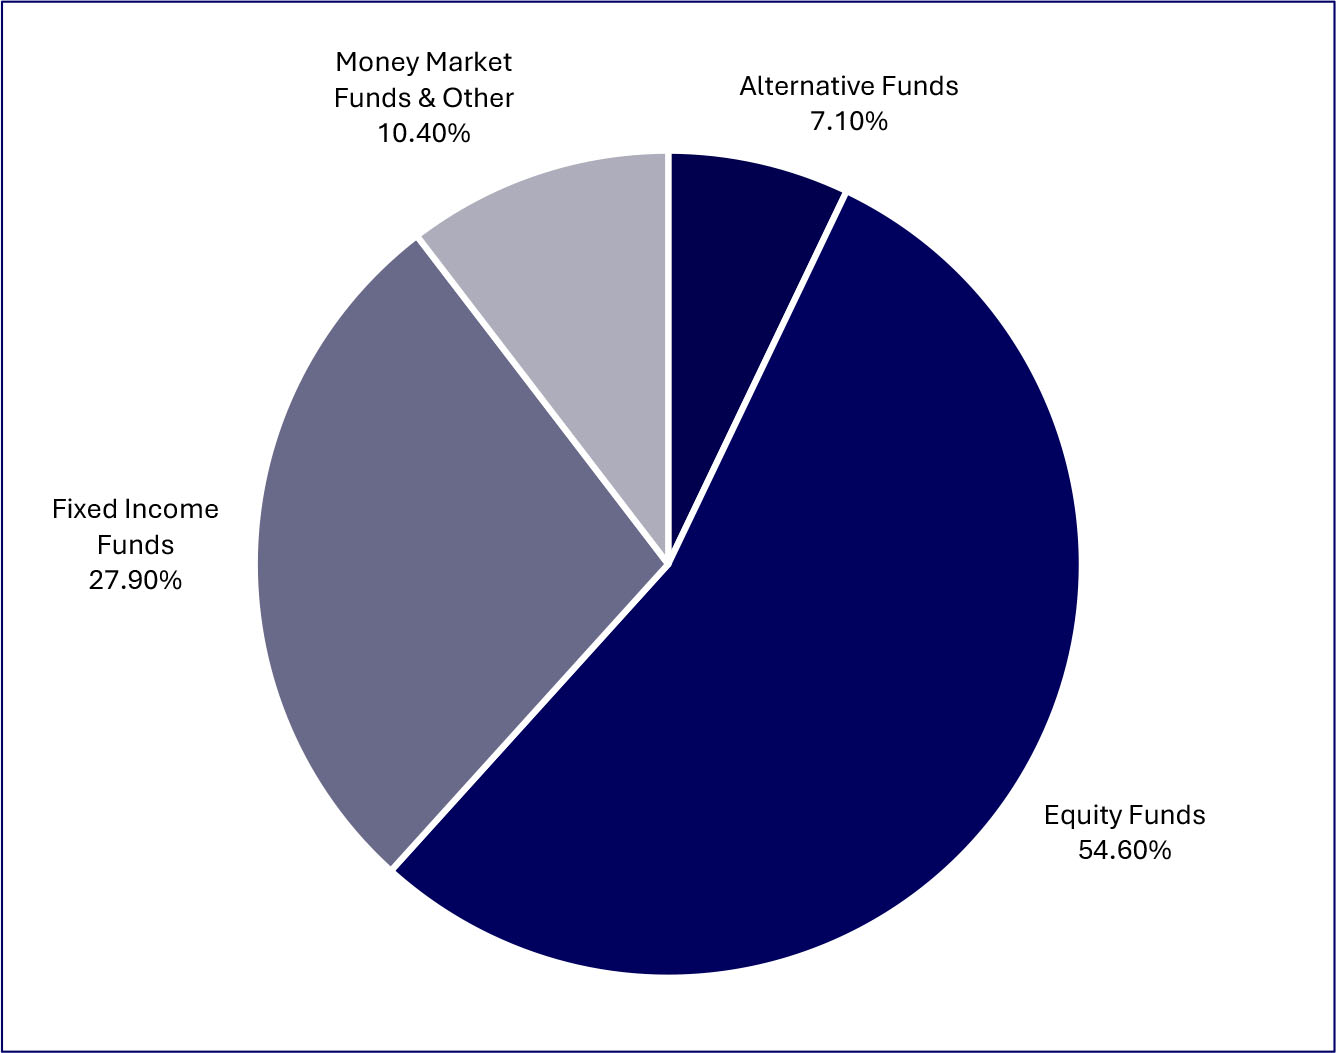
| Top Holdings (%) | |
| Vanguard Intermediate-Term Bond Index Fund Admiral Class | |
| Saratoga Large Cap Growth Fund, Class I | |
| Saratoga Large Cap Value Fund, Class I | |
| Saratoga Mid Capitalization Fund, Class I | |
| Dreyfus Inst Prefer Govt Money Mkt Inst Class | |
| Saratoga Small Capitalization Fund, Class I | |
| Eaton Vance Global Macro Absolute Return Fund, Class I | |
| Vanguard Total International Stock Index Fund, Admiral Class | |
| Vanguard Short-Term Bond Index Fund, Admiral Class | |
| Material Fund changes during the period. |
| Below is a summary of certain changes, and planned changes, to the Fund during the reporting period. For more complete information, you may review the Fund’s next prospectus, which we expect to be available by December 31, 2026, at www.saratogacap.com/fund-reports or upon request at 1-888-672-4839. |
| During the period there were no material changes to the Fund. |
| What were the Fund’s costs for the last year (based on a hypothetical $10,000 investment)? | ||
| Fund | Costs of a $10,000 Investment | Costs paid as a % of a $10,000 Investment |
| Saratoga Moderately Conservative Balanced Allocation Fund, Class C | $205 | 1.99% |
| What affected the Fund’s performance during this period? |
|
During the period, the Fund held modestly less in equities and considerably less in international stocks than the benchmark, and both positions detracted from relative performance, as stocks outperformed bonds and international stocks outperformed U.S. stocks. The Fund’s smaller allocation to bonds versus the benchmark, in favor of cash equivalents and alternatives, helped the Fund’s relative performance, as bonds trailed both cash equivalents and alternatives.
Within the Fund’s equity allocation, an overweight to the Large Cap Growth sector versus the Large Cap Value sector helped relative performance, as the Large Cap Growth sector outperformed the Large Cap Value sector. Within the Fund’s bond allocation, the Fund sold its position in the Long-Term debt sector and added a position in the Short-Term debt sector, which helped performance, as the Short-Term debt sector outperformed the Intermediate- and Long-Term debt sectors. The Fund’s overweight to the Intermediate-Term debt sector versus the Short-Term debt sector was a drag on relative performance.
From a security-selection standpoint, the Fund’s use of the Saratoga Large Cap Value fund was the largest drag on relative performance, as it significantly underperformed its passive counterpart. The Saratoga Large Cap Growth and Saratoga Small Cap funds also underperformed their passive counterparts, which hurt relative performance. The Fund’s use of the Vanguard Intermediate-Term Bond Index Fund was also a drag on performance, as it trailed its active counterparts. The Saratoga Mid Cap fund outperformed its passive counterpart, helping the Fund’s relative performance. |
How has the Fund performed since its inception?
The chart below represents the historical performance of a hypothetical $10,000 investment since inception in the class of shares noted and assumes the reinvestment of dividends and capital gains and the maximum sales charge, if any. Fund expenses, including management fees, 12b-1 fees, if any, and other expenses were deducted.
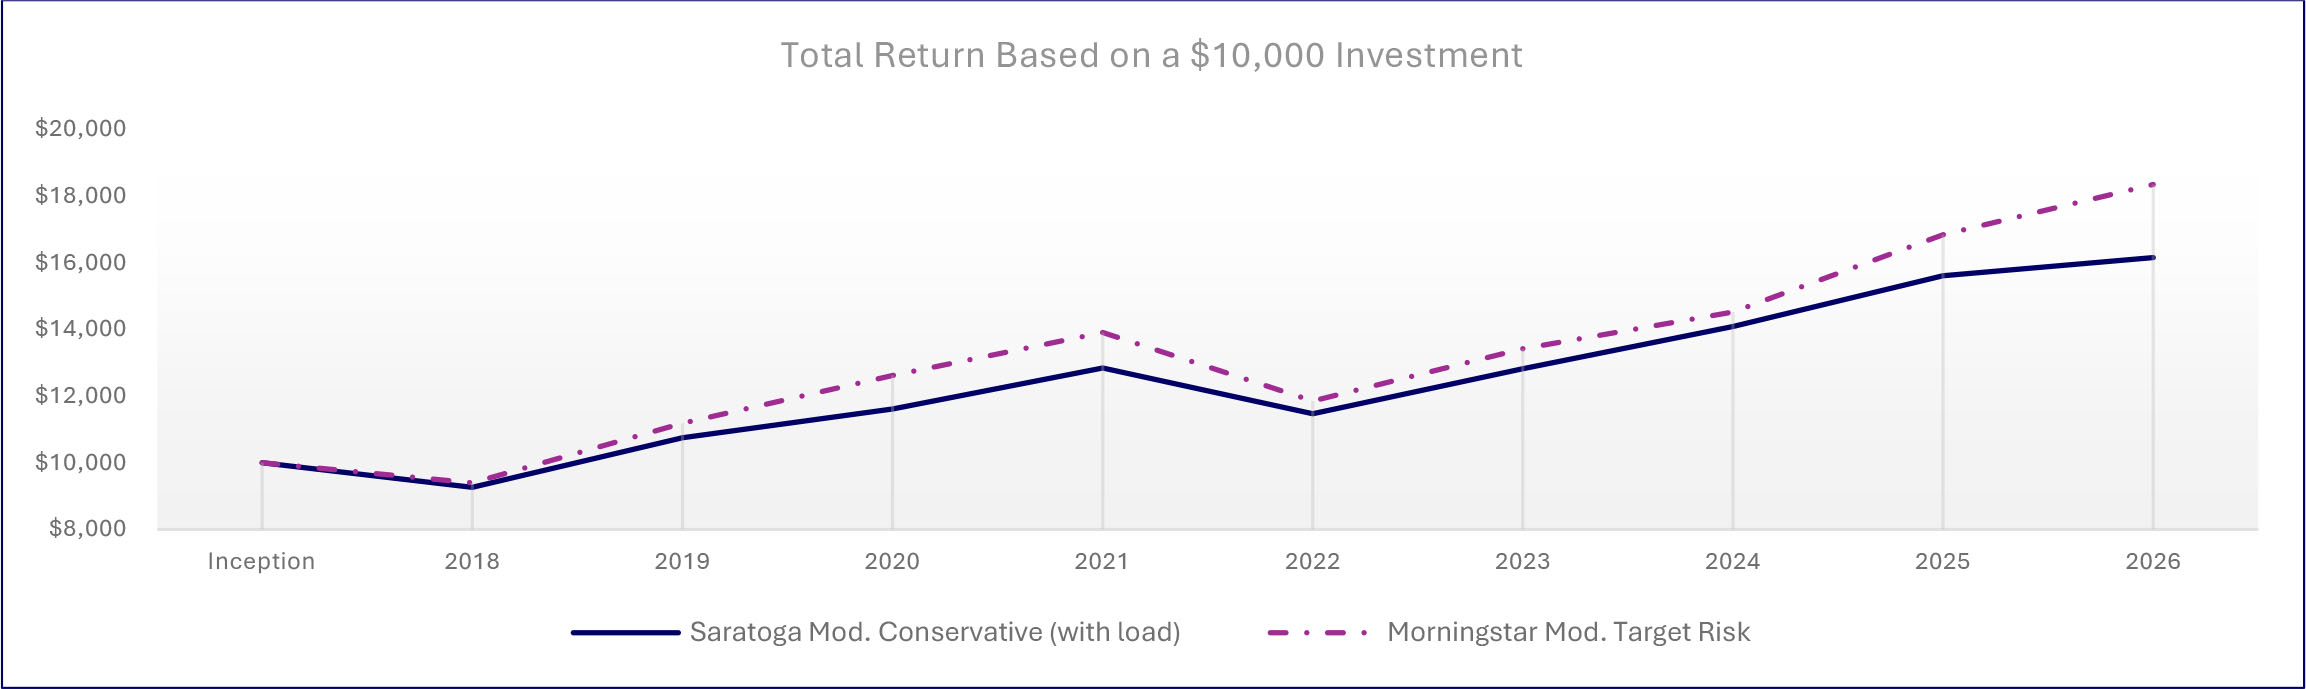
| Average Annual Total Returns | |||
| 1 Year | 5 Years | Since Inception1 | |
| Saratoga Moderately Conservative Balanced Allocation Fund, Class C (with load) | 5.06% | 4.96% | 5.71% |
| Saratoga Moderately Conservative Balanced Allocation Fund, Class C | 6.06% | 4.96% | 5.71% |
| Morningstar Moderate Target Risk Index | 13.41% | 5.85% | 7.28% |
| 1 | From January 10, 2018. Performance data quoted represents past performance, which is not a good predictor of the Fund’s future performance. Investment return and principal value will fluctuate so that shares, when redeemed, may be worth more or less than their original cost. The above table and graph do not reflect the deduction of taxes that a shareholder would pay on fund distributions or the redemption of shares. Current performance may be lower or higher than the performance data quoted. The average annual total return is the annual compound return for the indicated period and reflects the change in share price and the reinvestment of all dividends and capital gains. Call 1-888-672-4839 for current performance information or questions. |
| Fund Statistics | |||
| Total Net Assets | $951,312 | Advisory Fees Paid by the Fund | $0 |
| Number of Portfolio Holdings | 9 | Portfolio Turnover Rate | 12% |
What did the Fund invest in (as a % of the Fund’s net assets)?
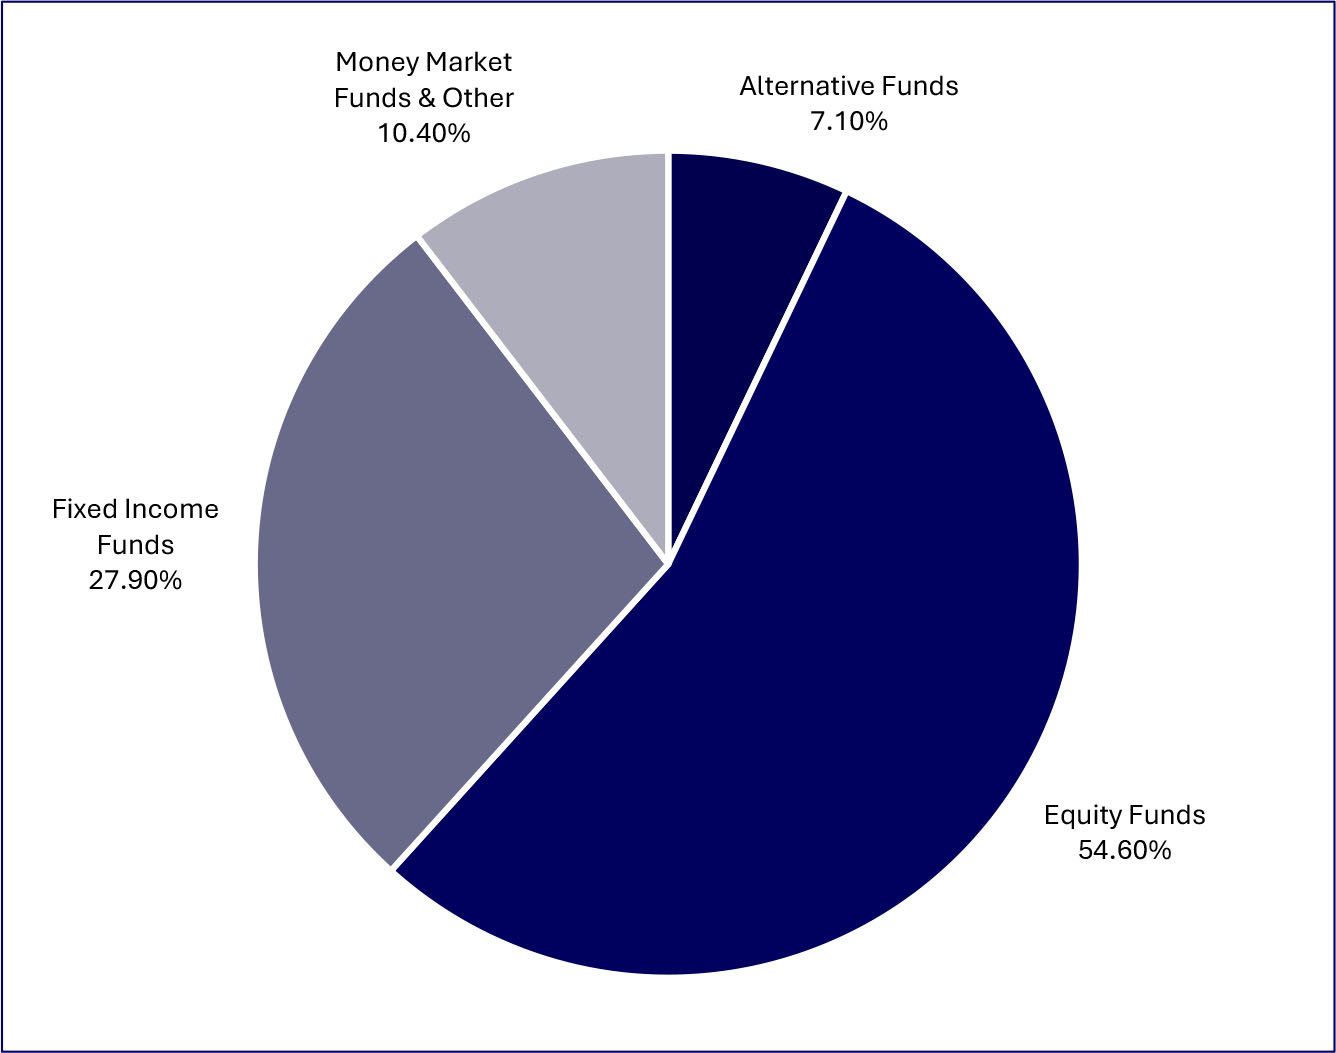
| Top Holdings (%) | |
| Vanguard Intermediate-Term Bond Index Fund Admiral Class | |
| Saratoga Large Cap Growth Fund, Class I | |
| Saratoga Large Cap Value Fund, Class I | |
| Saratoga Mid Capitalization Fund, Class I | |
| Dreyfus Inst Prefer Govt Money Mkt Inst Class | |
| Saratoga Small Capitalization Fund, Class I | |
| Eaton Vance Global Macro Absolute Return Fund, Class I | |
| Vanguard Total International Stock Index Fund, Admiral Class | |
| Vanguard Short-Term Bond Index Fund, Admiral Class | |
| Material Fund changes during the period. |
| Below is a summary of certain changes, and planned changes, to the Fund during the reporting period. For more complete information, you may review the Fund’s next prospectus, which we expect to be available by December 31, 2026, at www.saratogacap.com/fund-reports or upon request at 1-888-672-4839. |
| During the period there were no material changes to the Fund. |
| What were the Fund’s costs for the last year (based on a hypothetical $10,000 investment)? | ||
| Fund | Costs of a $10,000 Investment | Costs paid as a % of a $10,000 Investment |
| Saratoga Moderately Conservative Balanced Allocation Fund, Class I | $102 | 0.99% |
| What affected the Fund’s performance during this period? |
|
During the period, the Fund held modestly less in equities and considerably less in international stocks than the benchmark, and both positions detracted from relative performance, as stocks outperformed bonds and international stocks outperformed U.S. stocks. The Fund’s smaller allocation to bonds versus the benchmark, in favor of cash equivalents and alternatives, helped the Fund’s relative performance, as bonds trailed both cash equivalents and alternatives.
Within the Fund’s equity allocation, an overweight to the Large Cap Growth sector versus the Large Cap Value sector helped relative performance, as the Large Cap Growth sector outperformed the Large Cap Value sector. Within the Fund’s bond allocation, the Fund sold its position in the Long-Term debt sector and added a position in the Short-Term debt sector, which helped performance, as the Short-Term debt sector outperformed the Intermediate- and Long-Term debt sectors. The Fund’s overweight to the Intermediate-Term debt sector versus the Short-Term debt sector was a drag on relative performance.
From a security-selection standpoint, the Fund’s use of the Saratoga Large Cap Value fund was the largest drag on relative performance, as it significantly underperformed its passive counterpart. The Saratoga Large Cap Growth and Saratoga Small Cap funds also underperformed their passive counterparts, which hurt relative performance. The Fund’s use of the Vanguard Intermediate-Term Bond Index Fund was also a drag on performance, as it trailed its active counterparts. The Saratoga Mid Cap fund outperformed its passive counterpart, helping the Fund’s relative performance. |
How has the Fund performed since its inception?
The chart below represents the historical performance of a hypothetical $10,000 investment since inception in the class of shares noted and assumes the reinvestment of dividends and capital gains and the maximum sales charge, if any. Fund expenses, including management fees, 12b-1 fees, if any, and other expenses were deducted.
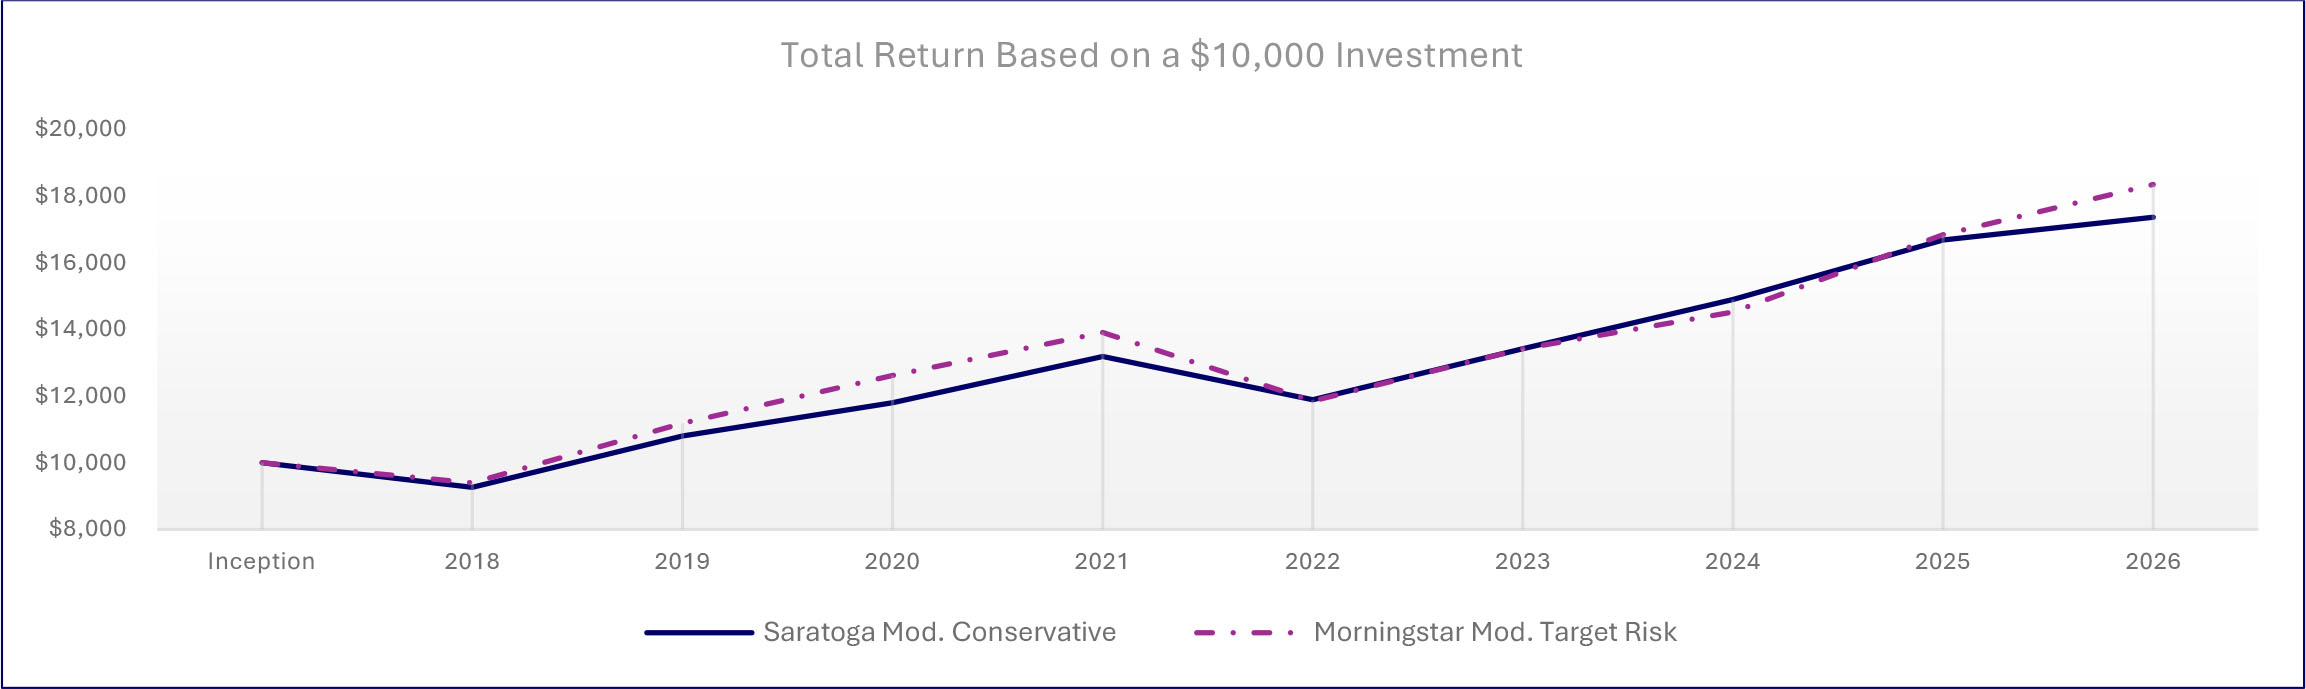
| Average Annual Total Returns | |||
| 1 Year | 5 Years | Since Inception1 | |
| Saratoga Moderately Conservative Balanced Allocation Fund, Class I | 7.06% | 6.01% | 6.59% |
| Morningstar Moderate Target Risk Index | 13.41% | 5.85% | 7.28% |
| 1 | From January 10, 2018. Performance data quoted represents past performance, which is not a good predictor of the Fund’s future performance. Investment return and principal value will fluctuate so that shares, when redeemed, may be worth more or less than their original cost. The above table and graph do not reflect the deduction of taxes that a shareholder would pay on fund distributions or the redemption of shares. Current performance may be lower or higher than the performance data quoted. The average annual total return is the annual compound return for the indicated period and reflects the change in share price and the reinvestment of all dividends and capital gains. Call 1-888-672-4839 for current performance information or questions. |
| Fund Statistics | |||
| Total Net Assets | $951,312 | Advisory Fees Paid by the Fund | $0 |
| Number of Portfolio Holdings | 9 | Portfolio Turnover Rate | 12% |
What did the Fund invest in (as a % of the Fund’s net assets)?
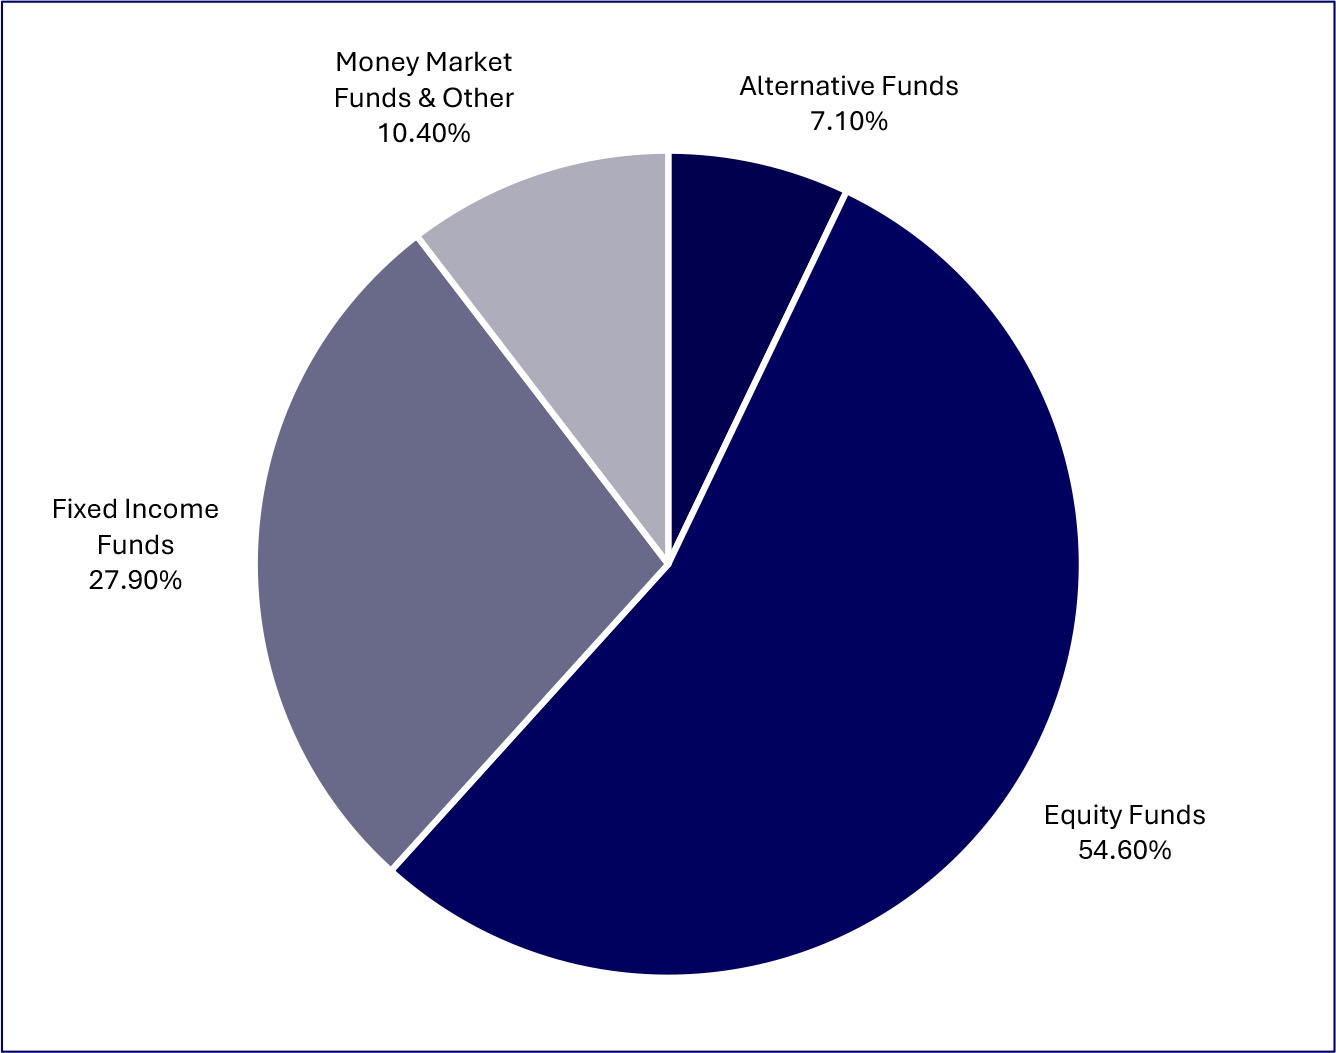
| Top Holdings (%) | |
| Vanguard Intermediate-Term Bond Index Fund Admiral Class | |
| Saratoga Large Cap Growth Fund, Class I | |
| Saratoga Large Cap Value Fund, Class I | |
| Saratoga Mid Capitalization Fund, Class I | |
| Dreyfus Inst Prefer Govt Money Mkt Inst Class | |
| Saratoga Small Capitalization Fund, Class I | |
| Eaton Vance Global Macro Absolute Return Fund, Class I | |
| Vanguard Total International Stock Index Fund, Admiral Class | |
| Vanguard Short-Term Bond Index Fund, Admiral Class | |
| Material Fund changes during the period. |
| Below is a summary of certain changes, and planned changes, to the Fund during the reporting period. For more complete information, you may review the Fund’s next prospectus, which we expect to be available by December 31, 2026, at www.saratogacap.com/fund-reports or upon request at 1-888-672-4839. |
| During the period there were no material changes to the Fund. |