Shareholder Report
|
12 Months Ended |
|
Aug. 31, 2026
USD ($)
Holding
|
|---|
| Shareholder Report [Line Items] |
|
|
| Document Type |
N-CSR
|
|
| Amendment Flag |
false
|
|
| Registrant Name |
SSGA Active Trust
|
|
| Entity Central Index Key |
0001516212
|
|
| Entity Investment Company Type |
N-1A
|
|
| Document Period End Date |
Aug. 31, 2026
|
|
| Shareholder Report Annual or Semi-Annual |
Annual Shareholder Report
|
|
| C000253970 |
|
|
| Shareholder Report [Line Items] |
|
|
| Fund Name |
State Street<sup style="inset: 1.5px 0px 4px; box-sizing: border-box; color: rgb(0, 0, 0); display: inline; flex-wrap: nowrap; font-size: 16px; font-weight: 700; grid-area: auto; line-height: 0px; margin: 0px; overflow: visible; position: relative; text-align: left; text-align-last: auto; white-space-collapse: preserve-breaks;">®</sup> My2026 Corporate Bond ETF
|
|
| Trading Symbol |
MYCF
|
|
| Security Exchange Name |
NASDAQ
|
|
| Annual or Semi-Annual Statement [Text Block] |
This annual shareholder report contains important information about the State Street® My2026 Corporate Bond ETF (the "Fund") for the period of September 1, 2025 through August 31, 2026.
|
|
| Additional Information [Text Block] |
You can find additional information about the Fund, including the Prospectus, Statement of Additional Information, financial statements and other information at www.ssga.com/us/en/institutional/fund-finder?tab=documents&type=etfs. You can also request this information about the Fund by contacting us at 1-866-787-2257.
|
|
| Material Fund Change Notice [Text Block] |
This report describes changes to the Fund that occurred during the reporting period.
|
|
| Additional Information Phone Number |
1-866-787-2257
|
|
| Additional Information Website |
www.ssga.com/us/en/institutional/fund-finder?tab=documents&type=etfs
|
|
| Expenses [Text Block] |
What were the Fund costs for the last year? (based on a hypothetical $10,000 Investment)
Table Summary
Fund Name |
Costs of a $10,000 investment |
Costs paid as a percentage of a $10,000 investment |
State Street® My2026 Corporate Bond ETF |
$16 |
0.16% | |
|
| Expenses Paid, Amount |
$ 16
|
|
| Expense Ratio, Percent |
0.16%
|
|
| Factors Affecting Performance [Text Block] |
How did the Fund perform last year and what affected its performance?For the 12-month reporting period ended August 31, 2026, the U.S. investment grade corporate bond market has been characterized by historically tight credit spreads and strong demand despite very heavy levels of new issuance and increasingly volatile U.S. Treasury rates. Given rich valuations, we have maintained a modest risk positioning versus the benchmark but have found some pockets of value in the BBB-rated bonds in the front end of the corporate curve. Performance was driven by strong security selection, particularly as it relates to our lower rated positions in the Finance Companies, Gaming, and REITs sectors. |
|
| Performance Past Does Not Indicate Future [Text] |
The Fund’s past performance is not necessarily an indication of how the Fund will perform in the future. The returns do not reflect the deduction of taxes that a shareholder would pay on Fund distributions or on the redemption or sale of Fund shares.
|
|
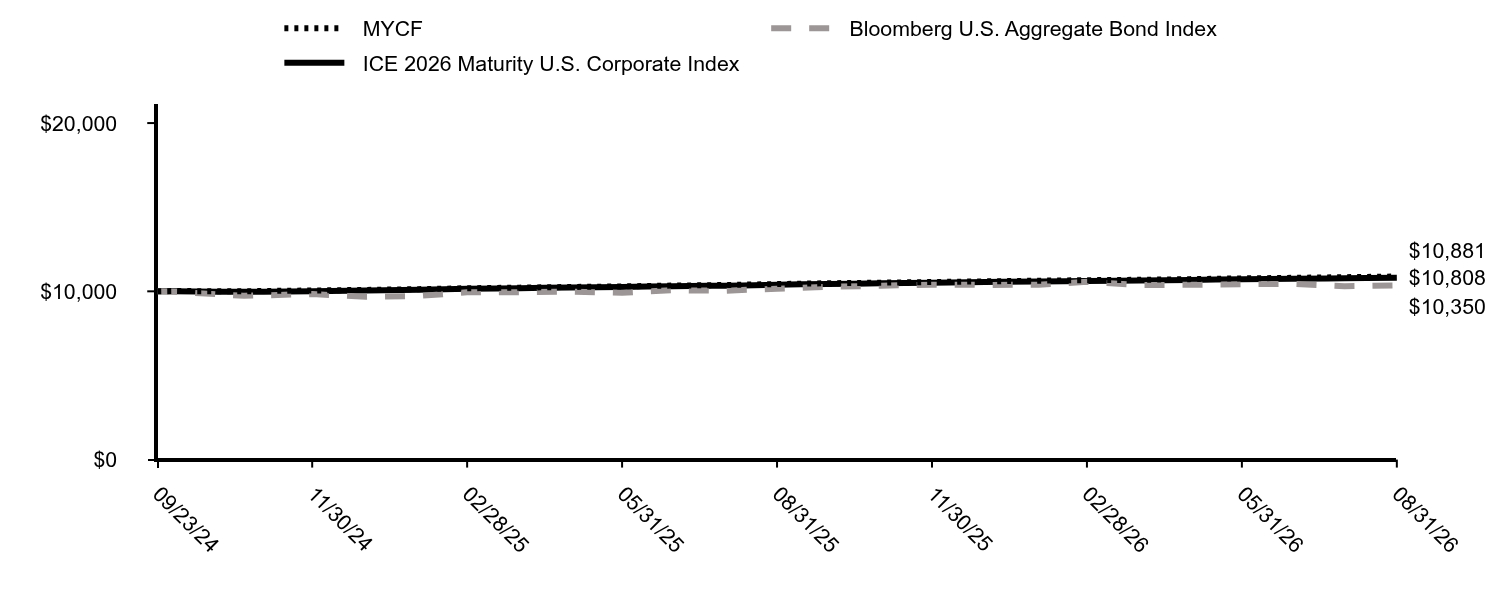
| Line Graph [Table Text Block] |
Table Summary
|
MYCF |
Bloomberg U.S. Aggregate Bond Index |
ICE 2026 Maturity U.S. Corporate Index |
09/23/24 |
$10,000 |
$10,000 |
$10,000 |
09/30/24 |
$10,016 |
$9,981 |
$9,999 |
10/31/24 |
$10,004 |
$9,733 |
$9,971 |
11/30/24 |
$10,051 |
$9,836 |
$10,011 |
12/31/24 |
$10,083 |
$9,675 |
$10,044 |
01/31/25 |
$10,130 |
$9,726 |
$10,092 |
02/28/25 |
$10,182 |
$9,940 |
$10,148 |
03/31/25 |
$10,219 |
$9,944 |
$10,184 |
04/30/25 |
$10,259 |
$9,983 |
$10,227 |
05/31/25 |
$10,291 |
$9,912 |
$10,255 |
06/30/25 |
$10,341 |
$10,064 |
$10,307 |
07/31/25 |
$10,376 |
$10,037 |
$10,335 |
08/31/25 |
$10,433 |
$10,158 |
$10,392 |
09/30/25 |
$10,479 |
$10,268 |
$10,439 |
10/31/25 |
$10,515 |
$10,333 |
$10,475 |
11/30/25 |
$10,554 |
$10,397 |
$10,513 |
12/31/25 |
$10,593 |
$10,381 |
$10,552 |
01/31/26 |
$10,632 |
$10,392 |
$10,588 |
02/28/26 |
$10,664 |
$10,563 |
$10,618 |
03/31/26 |
$10,685 |
$10,376 |
$10,640 |
04/30/26 |
$10,725 |
$10,388 |
$10,679 |
05/31/26 |
$10,767 |
$10,420 |
$10,715 |
06/30/26 |
$10,802 |
$10,446 |
$10,746 |
07/31/26 |
$10,841 |
$10,309 |
$10,780 |
08/31/26 |
$10,881 |
$10,350 |
$10,808 |
|
|
| Average Annual Return [Table Text Block] |
Average Annual Total Returns (%)
Table Summary
Name |
1 Year |
Since Inception 09/23/24 |
MYCF |
4.30% |
4.46% |
Bloomberg U.S. Aggregate Bond Index |
1.89% |
1.79% |
ICE 2026 Maturity U.S. Corporate Index |
4.00% |
4.09% | The Fund’s past performance is not necessarily an indication of how the Fund will perform in the future. The returns do not reflect the deduction of taxes that a shareholder would pay on Fund distributions or on the redemption or sale of Fund shares. Updated performance information is available by calling 1-866-787-2257 or visiting our website at www.ssga.com. |
|
| Performance Inception Date |
Sep. 23, 2024
|
|
| Material Change Date |
Aug. 31, 2026
|
|
| Updated Performance Information Location [Text Block] |
Updated performance information is available by calling 1-866-787-2257 or visiting our website at www.ssga.com.
|
|
| AssetsNet |
$ 50,134,825
|
|
| Holdings Count | Holding |
90
|
|
| Advisory Fees Paid, Amount |
$ 69,056
|
|
| InvestmentCompanyPortfolioTurnover |
8.00%
|
|
| Additional Fund Statistics [Text Block] |
Key Fund Statistics as of 8/31/2026- Total Net Assets$50,134,825
- Number of Portfolio Holdings90
- Portfolio Turnover Rate8%
- Total Advisory Fees Paid$69,056
|
|
| Holdings [Text Block] |
Table Summary
Industries |
% |
Investment Company Securities |
9.7% |
Auto Manufacturers |
9.2% |
Banks |
8.8% |
Real Estate Investment Trusts |
8.2% |
Oil & Gas |
7.3% |
Electric |
7.1% |
Insurance |
6.6% |
Pharmaceuticals |
5.6% |
Pipelines |
5.4% |
Chemicals |
4.6% | |
|
| Largest Holdings [Text Block] |
Table Summary
Holdings |
% |
Chevron Phillips Chemical Co. LLC/Chevron Phillips Chemical Co. LP, 3.40%, due 12/01/26 |
4.6% |
Blackstone Private Credit Fund, 2.63%, due 12/15/26 |
4.5% |
Continental Resources, Inc., 2.27%, due 11/15/26 |
4.4% |
Fresenius Medical Care U.S. Finance III, Inc., 1.88%, due 12/01/26 |
4.2% |
Lincoln National Corp., 3.63%, due 12/12/26 |
4.2% |
Bayer U.S. Finance LLC, 6.13%, due 11/21/26 |
4.2% |
Bain Capital Specialty Finance, Inc., 2.55%, due 10/13/26 |
3.3% |
CDW LLC/CDW Finance Corp., 2.67%, due 12/01/26 |
3.1% |
Volkswagen Group of America Finance LLC, 6.00%, due 11/16/26 |
3.0% |
Ford Motor Co., 4.35%, due 12/08/26 |
2.8% | |
|
| Material Fund Change [Text Block] |
This is a summary of certain changes of the Fund that occurred during the reporting period ended August 31, 2026. For more information contact 1-866-787-2257 (toll free) or refer to the Prospectus, which can be found on the Fund's website below. Effective December 30, 2025 (the “Effective Date”), the Fund changed its name from the SPDR® SSGA My2026 Corporate Bond ETF to the State Street® My2026 Corporate Bond ETF. These changes did not result in any changes to the Funds’ Investment Objectives, Principal Investment Strategies, or Principal Risks of Investing in the Funds. |
|
| Material Fund Change Name [Text Block] |
Effective December 30, 2025 (the “Effective Date”), the Fund changed its name from the SPDR® SSGA My2026 Corporate Bond ETF to the State Street® My2026 Corporate Bond ETF. These changes did not result in any changes to the Funds’ Investment Objectives, Principal Investment Strategies, or Principal Risks of Investing in the Funds.
|
|
| Summary of Change Legend [Text Block] |
This is a summary of certain changes of the Fund that occurred during the reporting period ended August 31, 2026. For more information contact 1-866-787-2257 (toll free) or refer to the Prospectus, which can be found on the Fund's website below.
|
|
| C000253976 |
|
|
| Shareholder Report [Line Items] |
|
|
| Fund Name |
State Street<sup style="inset: 1.5px 0px 4px; box-sizing: border-box; color: rgb(0, 0, 0); display: inline; flex-wrap: nowrap; font-size: 16px; font-weight: 700; grid-area: auto; line-height: 0px; margin: 0px; overflow: visible; position: relative; text-align: left; text-align-last: auto; white-space-collapse: preserve-breaks;">®</sup> My2027 Corporate Bond ETF
|
|
| Trading Symbol |
MYCG
|
|
| Security Exchange Name |
NASDAQ
|
|
| Annual or Semi-Annual Statement [Text Block] |
This annual shareholder report contains important information about the State Street® My2027 Corporate Bond ETF (the "Fund") for the period of September 1, 2025 through August 31, 2026.
|
|
| Additional Information [Text Block] |
You can find additional information about the Fund, including the Prospectus, Statement of Additional Information, financial statements and other information at www.ssga.com/us/en/institutional/fund-finder?tab=documents&type=etfs. You can also request this information about the Fund by contacting us at 1-866-787-2257.
|
|
| Material Fund Change Notice [Text Block] |
This report describes changes to the Fund that occurred during the reporting period.
|
|
| Additional Information Phone Number |
1-866-787-2257
|
|
| Additional Information Website |
www.ssga.com/us/en/institutional/fund-finder?tab=documents&type=etfs
|
|
| Expenses [Text Block] |
What were the Fund costs for the last year? (based on a hypothetical $10,000 Investment)
Table Summary
Fund Name |
Costs of a $10,000 investment |
Costs paid as a percentage of a $10,000 investment |
State Street® My2027 Corporate Bond ETF |
$16 |
0.16% | |
|
| Expenses Paid, Amount |
$ 16
|
|
| Expense Ratio, Percent |
0.16%
|
|
| Factors Affecting Performance [Text Block] |
How did the Fund perform last year and what affected its performance?For the 12-month reporting period ended August 31, 2026, the U.S. investment grade corporate bond market has been characterized by historically tight credit spreads and strong demand despite very heavy levels of new issuance and increasingly volatile U.S. Treasury rates. Given rich valuations, we have maintained a modest risk positioning versus the benchmark but have found some pockets of value in the BBB-rated bonds in the front end of the corporate curve. Performance was driven by strong security selection, particularly as it relates to our lower rated positions in the Finance Companies, Gaming, and REITs sectors. |
|
| Performance Past Does Not Indicate Future [Text] |
The Fund’s past performance is not necessarily an indication of how the Fund will perform in the future. The returns do not reflect the deduction of taxes that a shareholder would pay on Fund distributions or on the redemption or sale of Fund shares.
|
|
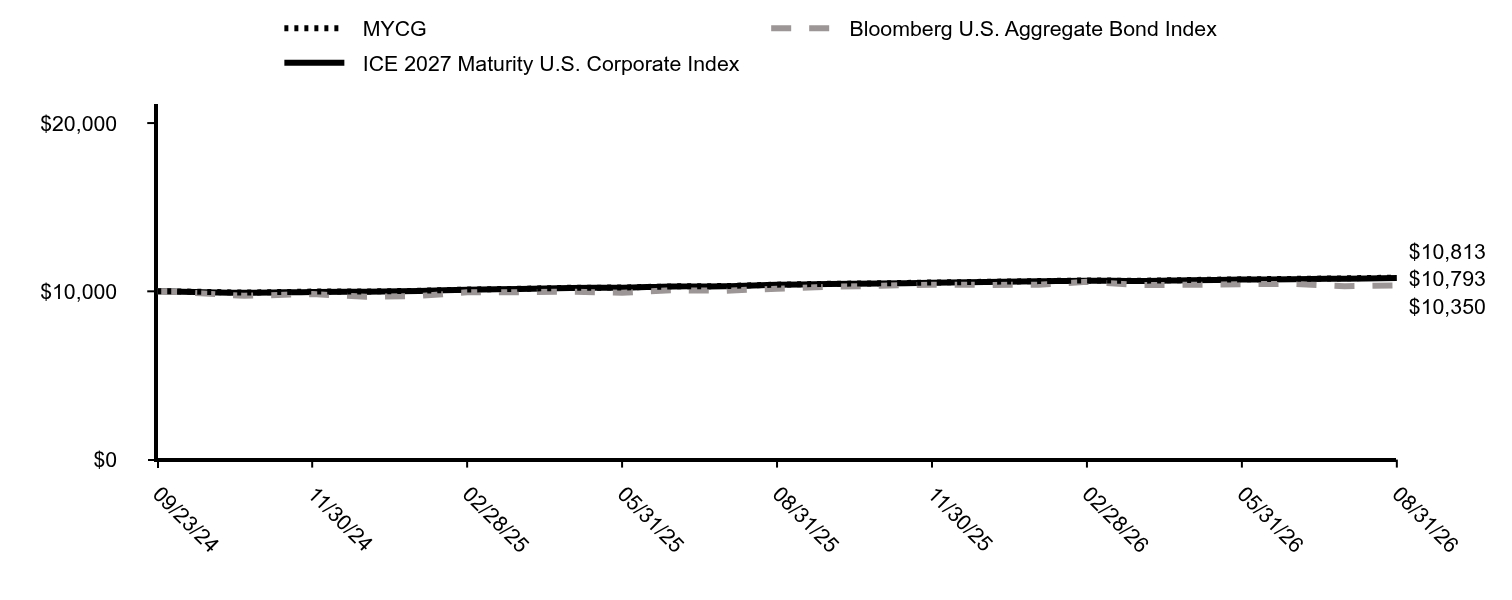
| Line Graph [Table Text Block] |
Table Summary
|
MYCG |
Bloomberg U.S. Aggregate Bond Index |
ICE 2027 Maturity U.S. Corporate Index |
09/23/24 |
$10,000 |
$10,000 |
$10,000 |
09/30/24 |
$10,001 |
$9,981 |
$9,992 |
10/31/24 |
$9,924 |
$9,733 |
$9,913 |
11/30/24 |
$9,984 |
$9,836 |
$9,964 |
12/31/24 |
$9,988 |
$9,675 |
$9,972 |
01/31/25 |
$10,031 |
$9,726 |
$10,021 |
02/28/25 |
$10,106 |
$9,940 |
$10,098 |
03/31/25 |
$10,151 |
$9,944 |
$10,142 |
04/30/25 |
$10,209 |
$9,983 |
$10,205 |
05/31/25 |
$10,225 |
$9,912 |
$10,219 |
06/30/25 |
$10,295 |
$10,064 |
$10,290 |
07/31/25 |
$10,313 |
$10,037 |
$10,298 |
08/31/25 |
$10,397 |
$10,158 |
$10,386 |
09/30/25 |
$10,444 |
$10,268 |
$10,431 |
10/31/25 |
$10,476 |
$10,333 |
$10,466 |
11/30/25 |
$10,522 |
$10,397 |
$10,510 |
12/31/25 |
$10,567 |
$10,381 |
$10,555 |
01/31/26 |
$10,607 |
$10,392 |
$10,595 |
02/28/26 |
$10,645 |
$10,563 |
$10,633 |
03/31/26 |
$10,626 |
$10,376 |
$10,612 |
04/30/26 |
$10,672 |
$10,388 |
$10,657 |
05/31/26 |
$10,712 |
$10,420 |
$10,696 |
06/30/26 |
$10,739 |
$10,446 |
$10,719 |
07/31/26 |
$10,772 |
$10,309 |
$10,754 |
08/31/26 |
$10,813 |
$10,350 |
$10,793 |
|
|
| Average Annual Return [Table Text Block] |
Average Annual Total Returns (%)
Table Summary
Name |
1 Year |
Since Inception 09/23/24 |
MYCG |
4.00% |
4.12% |
Bloomberg U.S. Aggregate Bond Index |
1.89% |
1.79% |
ICE 2027 Maturity U.S. Corporate Index |
3.91% |
4.02% | The Fund’s past performance is not necessarily an indication of how the Fund will perform in the future. The returns do not reflect the deduction of taxes that a shareholder would pay on Fund distributions or on the redemption or sale of Fund shares. Updated performance information is available by calling 1-866-787-2257 or visiting our website at www.ssga.com. |
|
| Performance Inception Date |
Sep. 23, 2024
|
|
| Material Change Date |
Aug. 31, 2026
|
|
| Updated Performance Information Location [Text Block] |
Updated performance information is available by calling 1-866-787-2257 or visiting our website at www.ssga.com.
|
|
| AssetsNet |
$ 43,696,454
|
|
| Holdings Count | Holding |
186
|
|
| Advisory Fees Paid, Amount |
$ 43,847
|
|
| InvestmentCompanyPortfolioTurnover |
17.00%
|
|
| Additional Fund Statistics [Text Block] |
Key Fund Statistics as of 8/31/2026- Total Net Assets$43,696,454
- Number of Portfolio Holdings186
- Portfolio Turnover Rate17%
- Total Advisory Fees Paid$43,847
|
|
| Holdings [Text Block] |
Table Summary
Industries |
% |
Banks |
10.2% |
Electric |
9.4% |
Real Estate Investment Trusts |
7.1% |
Lodging |
6.8% |
Investment Company Securities |
6.6% |
Diversified Financial Services |
5.4% |
Pharmaceuticals |
5.0% |
Auto Manufacturers |
4.3% |
Aerospace & Defense |
3.9% |
Software |
3.8% | |
|
| Largest Holdings [Text Block] |
Table Summary
Holdings |
% |
Sands China Ltd., 2.30%, due 03/08/27 |
2.5% |
Santander Holdings USA, Inc., 4.40%, due 07/13/27 |
2.5% |
Main Street Capital Corp., 6.50%, due 06/04/27 |
2.4% |
SBA Communications Corp., 3.88%, due 02/15/27 |
2.3% |
Las Vegas Sands Corp., 5.90%, due 06/01/27 |
2.1% |
General Motors Co., 6.80%, due 10/01/27 |
1.8% |
ArcelorMittal SA, 6.55%, due 11/29/27 |
1.8% |
Oracle Corp., 3.25%, due 11/15/27 |
1.8% |
HCA, Inc., 4.50%, due 02/15/27 |
1.5% |
Hyatt Hotels Corp., 5.75%, due 01/30/27 |
1.5% | |
|
| Material Fund Change [Text Block] |
This is a summary of certain changes of the Fund that occurred during the reporting period ended August 31, 2026. For more information contact 1-866-787-2257 (toll free) or refer to the Prospectus, which can be found on the Fund's website below. Effective December 30, 2025 (the “Effective Date”), the Fund changed its name from the SPDR® SSGA My2027 Corporate Bond ETF to the State Street® My2027 Corporate Bond ETF. These changes did not result in any changes to the Funds’ Investment Objectives, Principal Investment Strategies, or Principal Risks of Investing in the Funds. |
|
| Material Fund Change Name [Text Block] |
Effective December 30, 2025 (the “Effective Date”), the Fund changed its name from the SPDR® SSGA My2027 Corporate Bond ETF to the State Street® My2027 Corporate Bond ETF. These changes did not result in any changes to the Funds’ Investment Objectives, Principal Investment Strategies, or Principal Risks of Investing in the Funds.
|
|
| Summary of Change Legend [Text Block] |
This is a summary of certain changes of the Fund that occurred during the reporting period ended August 31, 2026. For more information contact 1-866-787-2257 (toll free) or refer to the Prospectus, which can be found on the Fund's website below.
|
|
| C000253977 |
|
|
| Shareholder Report [Line Items] |
|
|
| Fund Name |
State Street<sup style="inset: 1.5px 0px 4px; box-sizing: border-box; color: rgb(0, 0, 0); display: inline; flex-wrap: nowrap; font-size: 16px; font-weight: 700; grid-area: auto; line-height: 0px; margin: 0px; overflow: visible; position: relative; text-align: left; text-align-last: auto; white-space-collapse: preserve-breaks;">®</sup> My2028 Corporate Bond ETF
|
|
| Trading Symbol |
MYCH
|
|
| Security Exchange Name |
NASDAQ
|
|
| Annual or Semi-Annual Statement [Text Block] |
This annual shareholder report contains important information about the State Street® My2028 Corporate Bond ETF (the "Fund") for the period of September 1, 2025 through August 31, 2026.
|
|
| Additional Information [Text Block] |
You can find additional information about the Fund, including the Prospectus, Statement of Additional Information, financial statements and other information at www.ssga.com/us/en/institutional/fund-finder?tab=documents&type=etfs. You can also request this information about the Fund by contacting us at 1-866-787-2257.
|
|
| Material Fund Change Notice [Text Block] |
This report describes changes to the Fund that occurred during the reporting period.
|
|
| Additional Information Phone Number |
1-866-787-2257
|
|
| Additional Information Website |
www.ssga.com/us/en/institutional/fund-finder?tab=documents&type=etfs
|
|
| Expenses [Text Block] |
What were the Fund costs for the last year? (based on a hypothetical $10,000 Investment)
Table Summary
Fund Name |
Costs of a $10,000 investment |
Costs paid as a percentage of a $10,000 investment |
State Street® My2028 Corporate Bond ETF |
$15 |
0.15% | |
|
| Expenses Paid, Amount |
$ 15
|
|
| Expense Ratio, Percent |
0.15%
|
|
| Factors Affecting Performance [Text Block] |
How did the Fund perform last year and what affected its performance?For the 12-month reporting period ended August 31, 2026, the U.S. investment grade corporate bond market has been characterized by historically tight credit spreads and strong demand despite very heavy levels of new issuance and increasingly volatile U.S. Treasury rates. Given rich valuations, we have maintained a modest risk positioning versus the benchmark but have found some pockets of value in the BBB-rated bonds in the front end of the corporate curve. Performance was driven by security selection with key contribution coming from our positioning in the Technology, Healthcare, and Food & Beverage sectors. |
|
| Performance Past Does Not Indicate Future [Text] |
The Fund’s past performance is not necessarily an indication of how the Fund will perform in the future. The returns do not reflect the deduction of taxes that a shareholder would pay on Fund distributions or on the redemption or sale of Fund shares.
|
|
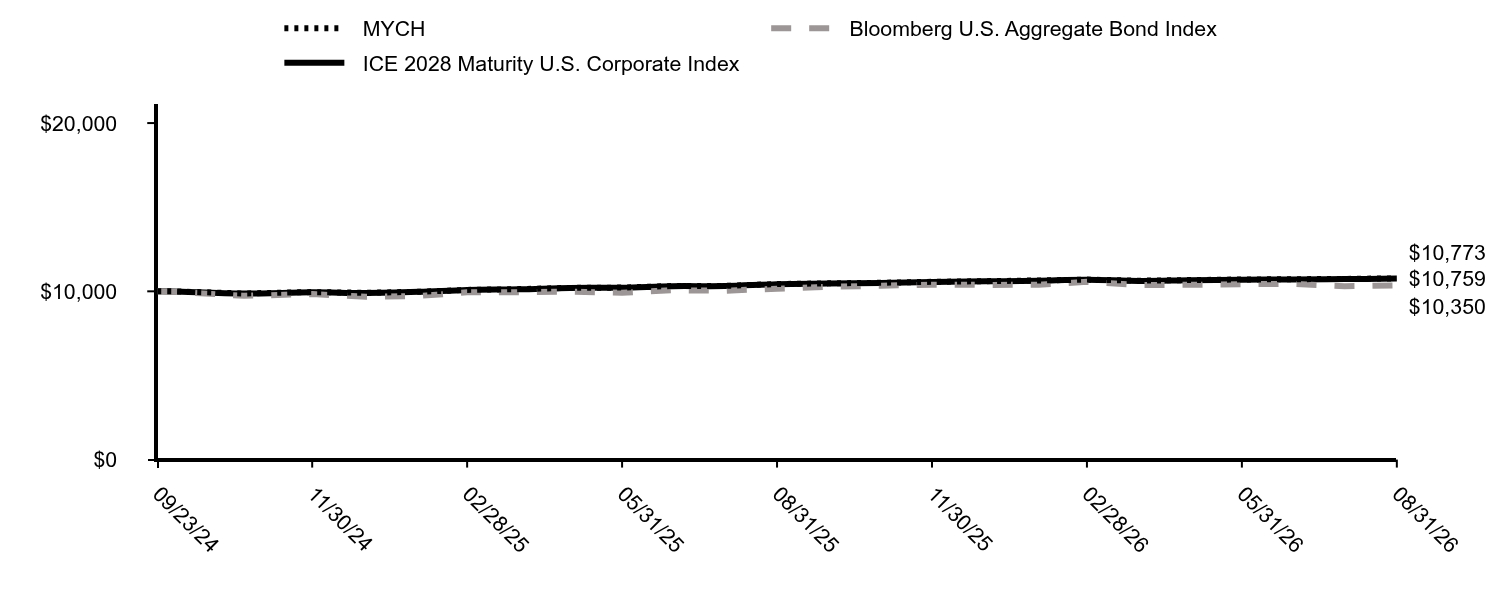
| Line Graph [Table Text Block] |
Table Summary
|
MYCH |
Bloomberg U.S. Aggregate Bond Index |
ICE 2028 Maturity U.S. Corporate Index |
09/23/24 |
$10,000 |
$10,000 |
$10,000 |
09/30/24 |
$9,999 |
$9,981 |
$9,992 |
10/31/24 |
$9,873 |
$9,733 |
$9,866 |
11/30/24 |
$9,956 |
$9,836 |
$9,939 |
12/31/24 |
$9,912 |
$9,675 |
$9,900 |
01/31/25 |
$9,975 |
$9,726 |
$9,968 |
02/28/25 |
$10,085 |
$9,940 |
$10,080 |
03/31/25 |
$10,131 |
$9,944 |
$10,122 |
04/30/25 |
$10,203 |
$9,983 |
$10,203 |
05/31/25 |
$10,222 |
$9,912 |
$10,218 |
06/30/25 |
$10,318 |
$10,064 |
$10,307 |
07/31/25 |
$10,322 |
$10,037 |
$10,312 |
08/31/25 |
$10,433 |
$10,158 |
$10,425 |
09/30/25 |
$10,473 |
$10,268 |
$10,463 |
10/31/25 |
$10,509 |
$10,333 |
$10,499 |
11/30/25 |
$10,563 |
$10,397 |
$10,554 |
12/31/25 |
$10,602 |
$10,381 |
$10,592 |
01/31/26 |
$10,646 |
$10,392 |
$10,636 |
02/28/26 |
$10,696 |
$10,563 |
$10,685 |
03/31/26 |
$10,632 |
$10,376 |
$10,619 |
04/30/26 |
$10,669 |
$10,388 |
$10,659 |
05/31/26 |
$10,703 |
$10,420 |
$10,692 |
06/30/26 |
$10,719 |
$10,446 |
$10,706 |
07/31/26 |
$10,738 |
$10,309 |
$10,726 |
08/31/26 |
$10,773 |
$10,350 |
$10,759 |
|
|
| Average Annual Return [Table Text Block] |
Average Annual Total Returns (%)
Table Summary
Name |
1 Year |
Since Inception 09/23/24 |
MYCH |
3.26% |
3.92% |
Bloomberg U.S. Aggregate Bond Index |
1.89% |
1.79% |
ICE 2028 Maturity U.S. Corporate Index |
3.21% |
3.85% | The Fund’s past performance is not necessarily an indication of how the Fund will perform in the future. The returns do not reflect the deduction of taxes that a shareholder would pay on Fund distributions or on the redemption or sale of Fund shares. Updated performance information is available by calling 1-866-787-2257 or visiting our website at www.ssga.com. |
|
| Performance Inception Date |
Sep. 23, 2024
|
|
| Material Change Date |
Aug. 31, 2026
|
|
| Updated Performance Information Location [Text Block] |
Updated performance information is available by calling 1-866-787-2257 or visiting our website at www.ssga.com.
|
|
| AssetsNet |
$ 829,259,161
|
|
| Holdings Count | Holding |
400
|
|
| Advisory Fees Paid, Amount |
$ 436,185
|
|
| InvestmentCompanyPortfolioTurnover |
29.00%
|
|
| Additional Fund Statistics [Text Block] |
Key Fund Statistics as of 8/31/2026- Total Net Assets$829,259,161
- Number of Portfolio Holdings400
- Portfolio Turnover Rate29%
- Total Advisory Fees Paid$436,185
|
|
| Holdings [Text Block] |
Table Summary
Industries |
% |
Banks |
14.3% |
Electric |
7.7% |
Pharmaceuticals |
5.6% |
Aerospace & Defense |
5.2% |
Semiconductors |
4.9% |
Auto Manufacturers |
4.7% |
Agriculture |
4.6% |
Lodging |
4.5% |
Software |
4.4% |
Real Estate Investment Trusts |
4.2% | |
|
| Largest Holdings [Text Block] |
Table Summary
Holdings |
% |
Las Vegas Sands Corp., 5.63%, due 06/15/28 |
2.0% |
CVS Health Corp., 4.30%, due 03/25/28 |
1.8% |
Royal Caribbean Cruises Ltd., 3.70%, due 03/15/28 |
1.6% |
Oracle Corp., 4.80%, due 08/03/28 |
1.6% |
HCA, Inc., 5.63%, due 09/01/28 |
1.4% |
Mylan, Inc., 4.55%, due 04/15/28 |
1.1% |
Bank of America Corp., 5.20%, due 04/25/29 |
1.1% |
Charter Communications Operating LLC/Charter Communications Operating Capital, 4.20%, due 03/15/28 |
1.0% |
Intel Corp., 4.88%, due 02/10/28 |
1.0% |
BAT Capital Corp., 2.26%, due 03/25/28 |
1.0% | |
|
| Material Fund Change [Text Block] |
This is a summary of certain changes of the Fund that occurred during the reporting period ended August 31, 2026. For more information contact 1-866-787-2257 (toll free) or refer to the Prospectus, which can be found on the Fund's website below. Effective December 30, 2025 (the “Effective Date”), the Fund changed its name from the SPDR® SSGA My2028 Corporate Bond ETF to the State Street® My2028 Corporate Bond ETF. These changes did not result in any changes to the Funds’ Investment Objectives, Principal Investment Strategies, or Principal Risks of Investing in the Funds. |
|
| Material Fund Change Name [Text Block] |
Effective December 30, 2025 (the “Effective Date”), the Fund changed its name from the SPDR® SSGA My2028 Corporate Bond ETF to the State Street® My2028 Corporate Bond ETF. These changes did not result in any changes to the Funds’ Investment Objectives, Principal Investment Strategies, or Principal Risks of Investing in the Funds.
|
|
| Summary of Change Legend [Text Block] |
This is a summary of certain changes of the Fund that occurred during the reporting period ended August 31, 2026. For more information contact 1-866-787-2257 (toll free) or refer to the Prospectus, which can be found on the Fund's website below.
|
|
| C000253978 |
|
|
| Shareholder Report [Line Items] |
|
|
| Fund Name |
State Street<sup style="inset: 1.5px 0px 4px; box-sizing: border-box; color: rgb(0, 0, 0); display: inline; flex-wrap: nowrap; font-size: 16px; font-weight: 700; grid-area: auto; line-height: 0px; margin: 0px; overflow: visible; position: relative; text-align: left; text-align-last: auto; white-space-collapse: preserve-breaks;">®</sup> My2029 Corporate Bond ETF
|
|
| Trading Symbol |
MYCI
|
|
| Security Exchange Name |
NASDAQ
|
|
| Annual or Semi-Annual Statement [Text Block] |
This annual shareholder report contains important information about the State Street® My2029 Corporate Bond ETF (the "Fund") for the period of September 1, 2025 through August 31, 2026.
|
|
| Additional Information [Text Block] |
You can find additional information about the Fund, including the Prospectus, Statement of Additional Information, financial statements and other information at www.ssga.com/us/en/institutional/fund-finder?tab=documents&type=etfs. You can also request this information about the Fund by contacting us at 1-866-787-2257.
|
|
| Material Fund Change Notice [Text Block] |
This report describes changes to the Fund that occurred during the reporting period.
|
|
| Additional Information Phone Number |
1-866-787-2257
|
|
| Additional Information Website |
www.ssga.com/us/en/institutional/fund-finder?tab=documents&type=etfs
|
|
| Expenses [Text Block] |
What were the Fund costs for the last year? (based on a hypothetical $10,000 Investment)
Table Summary
Fund Name |
Costs of a $10,000 investment |
Costs paid as a percentage of a $10,000 investment |
State Street® My2029 Corporate Bond ETF |
$16 |
0.16% | |
|
| Expenses Paid, Amount |
$ 16
|
|
| Expense Ratio, Percent |
0.16%
|
|
| Factors Affecting Performance [Text Block] |
How did the Fund perform last year and what affected its performance?For the 12-month reporting period ended August 31, 2026, the U.S. investment grade corporate bond market has been characterized by historically tight credit spreads and strong demand despite very heavy levels of new issuance and increasingly volatile U.S. Treasury rates. Given rich valuations, we have maintained a modest risk positioning versus the benchmark but have found some pockets of value in the BBB-rated bonds in the front end of the corporate curve. Performance was driven by security selection in the Media & Entertainment, Banking, and Retail sectors. |
|
| Performance Past Does Not Indicate Future [Text] |
The Fund’s past performance is not necessarily an indication of how the Fund will perform in the future. The returns do not reflect the deduction of taxes that a shareholder would pay on Fund distributions or on the redemption or sale of Fund shares.
|
|
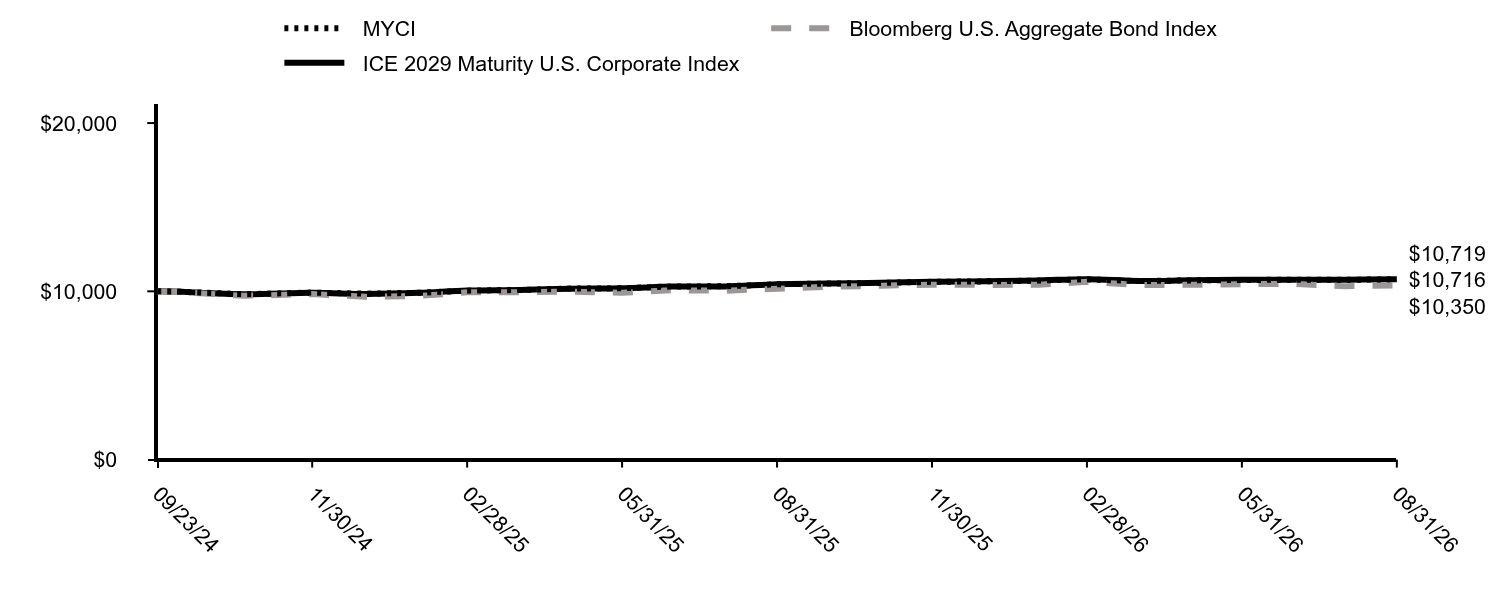
| Line Graph [Table Text Block] |
Table Summary
|
MYCI |
Bloomberg U.S. Aggregate Bond Index |
ICE 2029 Maturity U.S. Corporate Index |
09/23/24 |
$10,000 |
$10,000 |
$10,000 |
09/30/24 |
$9,992 |
$9,981 |
$9,987 |
10/31/24 |
$9,828 |
$9,733 |
$9,822 |
11/30/24 |
$9,927 |
$9,836 |
$9,909 |
12/31/24 |
$9,858 |
$9,675 |
$9,848 |
01/31/25 |
$9,911 |
$9,726 |
$9,909 |
02/28/25 |
$10,039 |
$9,940 |
$10,044 |
03/31/25 |
$10,080 |
$9,944 |
$10,079 |
04/30/25 |
$10,162 |
$9,983 |
$10,154 |
05/31/25 |
$10,180 |
$9,912 |
$10,176 |
06/30/25 |
$10,290 |
$10,064 |
$10,285 |
07/31/25 |
$10,297 |
$10,037 |
$10,294 |
08/31/25 |
$10,421 |
$10,158 |
$10,424 |
09/30/25 |
$10,463 |
$10,268 |
$10,464 |
10/31/25 |
$10,500 |
$10,333 |
$10,505 |
11/30/25 |
$10,564 |
$10,397 |
$10,567 |
12/31/25 |
$10,592 |
$10,381 |
$10,594 |
01/31/26 |
$10,640 |
$10,392 |
$10,647 |
02/28/26 |
$10,713 |
$10,563 |
$10,721 |
03/31/26 |
$10,609 |
$10,376 |
$10,612 |
04/30/26 |
$10,648 |
$10,388 |
$10,654 |
05/31/26 |
$10,675 |
$10,420 |
$10,683 |
06/30/26 |
$10,689 |
$10,446 |
$10,693 |
07/31/26 |
$10,684 |
$10,309 |
$10,688 |
08/31/26 |
$10,716 |
$10,350 |
$10,719 |
|
|
| Average Annual Return [Table Text Block] |
Average Annual Total Returns (%)
Table Summary
Name |
1 Year |
Since Inception 09/23/24 |
MYCI |
2.84% |
3.64% |
Bloomberg U.S. Aggregate Bond Index |
1.89% |
1.79% |
ICE 2029 Maturity U.S. Corporate Index |
2.82% |
3.65% | The Fund’s past performance is not necessarily an indication of how the Fund will perform in the future. The returns do not reflect the deduction of taxes that a shareholder would pay on Fund distributions or on the redemption or sale of Fund shares. Updated performance information is available by calling 1-866-787-2257 or visiting our website at www.ssga.com. |
|
| Performance Inception Date |
Sep. 23, 2024
|
|
| Material Change Date |
Aug. 31, 2026
|
|
| Updated Performance Information Location [Text Block] |
Updated performance information is available by calling 1-866-787-2257 or visiting our website at www.ssga.com.
|
|
| AssetsNet |
$ 39,417,813
|
|
| Holdings Count | Holding |
203
|
|
| Advisory Fees Paid, Amount |
$ 46,948
|
|
| InvestmentCompanyPortfolioTurnover |
26.00%
|
|
| Additional Fund Statistics [Text Block] |
Key Fund Statistics as of 8/31/2026- Total Net Assets$39,417,813
- Number of Portfolio Holdings203
- Portfolio Turnover Rate26%
- Total Advisory Fees Paid$46,948
|
|
| Holdings [Text Block] |
Table Summary
Industries |
% |
Electric |
9.1% |
Banks |
8.4% |
Real Estate Investment Trusts |
6.6% |
Pharmaceuticals |
6.4% |
Software |
5.3% |
Investment Company Securities |
4.6% |
Auto Manufacturers |
4.3% |
Pipelines |
4.1% |
Aerospace & Defense |
4.0% |
Health Care Services |
3.8% | |
|
| Largest Holdings [Text Block] |
Table Summary
Holdings |
% |
Oracle Corp., 4.55%, due 02/04/29 |
2.1% |
Las Vegas Sands Corp., 3.90%, due 08/08/29 |
2.0% |
Philip Morris International, Inc., 5.63%, due 11/17/29 |
1.8% |
Toll Brothers Finance Corp., 3.80%, due 11/01/29 |
1.7% |
Boeing Co., 6.30%, due 05/01/29 |
1.6% |
Wells Fargo & Co., 4.15%, due 01/24/29 |
1.5% |
Apollo Debt Solutions BDC, 6.90%, due 04/13/29 |
1.5% |
Centene Corp., 2.45%, due 07/15/28 |
1.5% |
AbbVie, Inc., 3.20%, due 11/21/29 |
1.4% |
L3Harris Technologies, Inc., 5.05%, due 06/01/29 |
1.2% | |
|
| Material Fund Change [Text Block] |
This is a summary of certain changes of the Fund that occurred during the reporting period ended August 31, 2026. For more information contact 1-866-787-2257 (toll free) or refer to the Prospectus, which can be found on the Fund's website below. Effective December 30, 2025 (the “Effective Date”), the Fund changed its name from the SPDR® SSGA My2029 Corporate Bond ETF to the State Street® My2029 Corporate Bond ETF. These changes did not result in any changes to the Funds’ Investment Objectives, Principal Investment Strategies, or Principal Risks of Investing in the Funds. |
|
| Material Fund Change Name [Text Block] |
Effective December 30, 2025 (the “Effective Date”), the Fund changed its name from the SPDR® SSGA My2029 Corporate Bond ETF to the State Street® My2029 Corporate Bond ETF. These changes did not result in any changes to the Funds’ Investment Objectives, Principal Investment Strategies, or Principal Risks of Investing in the Funds.
|
|
| Summary of Change Legend [Text Block] |
This is a summary of certain changes of the Fund that occurred during the reporting period ended August 31, 2026. For more information contact 1-866-787-2257 (toll free) or refer to the Prospectus, which can be found on the Fund's website below.
|
|
| C000253979 |
|
|
| Shareholder Report [Line Items] |
|
|
| Fund Name |
State Street<sup style="inset: 1.5px 0px 4px; box-sizing: border-box; color: rgb(0, 0, 0); display: inline; flex-wrap: nowrap; font-size: 16px; font-weight: 700; grid-area: auto; line-height: 0px; margin: 0px; overflow: visible; position: relative; text-align: left; text-align-last: auto; white-space-collapse: preserve-breaks;">®</sup> My2030 Corporate Bond ETF
|
|
| Trading Symbol |
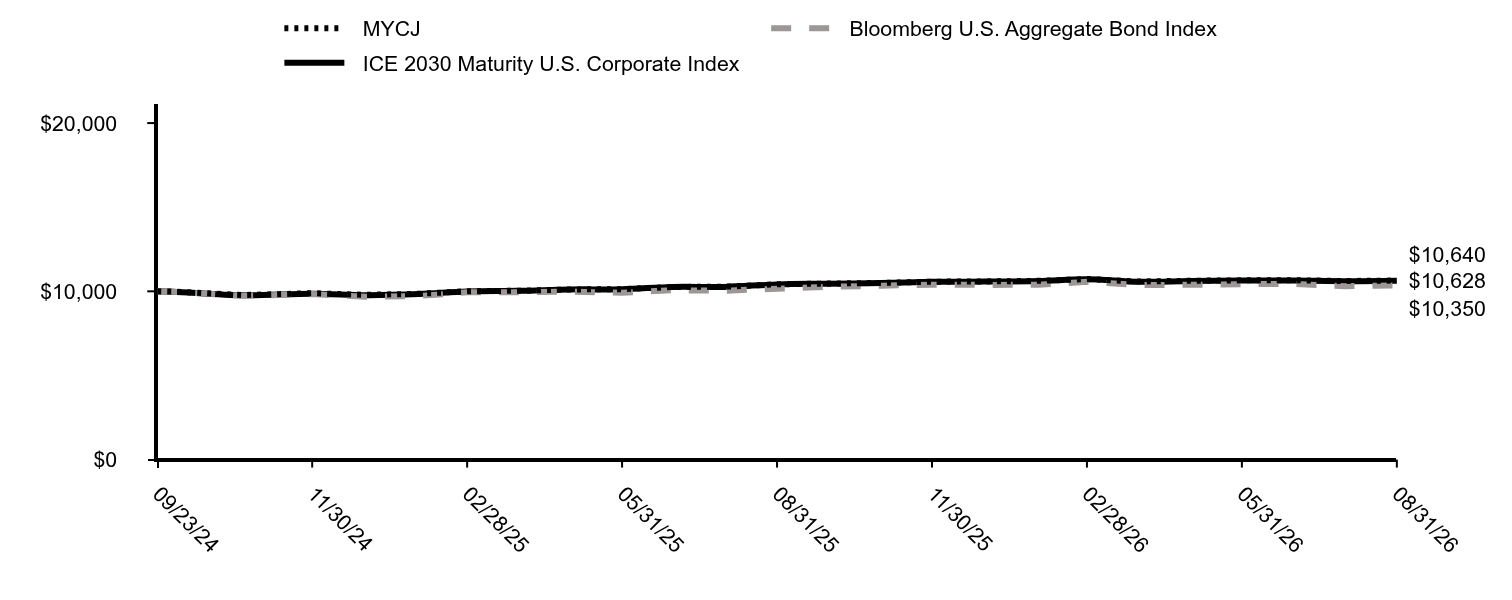
MYCJ
|
|
| Security Exchange Name |
NASDAQ
|
|
| Annual or Semi-Annual Statement [Text Block] |
This annual shareholder report contains important information about the State Street® My2030 Corporate Bond ETF (the "Fund") for the period of September 1, 2025 through August 31, 2026.
|
|
| Additional Information [Text Block] |
You can find additional information about the Fund, including the Prospectus, Statement of Additional Information, financial statements and other information at www.ssga.com/us/en/institutional/fund-finder?tab=documents&type=etfs. You can also request this information about the Fund by contacting us at 1-866-787-2257.
|
|
| Material Fund Change Notice [Text Block] |
This report describes changes to the Fund that occurred during the reporting period.
|
|
| Additional Information Phone Number |
1-866-787-2257
|
|
| Additional Information Website |
www.ssga.com/us/en/institutional/fund-finder?tab=documents&type=etfs
|
|
| Expenses [Text Block] |
What were the Fund costs for the last year? (based on a hypothetical $10,000 Investment)
Table Summary
Fund Name |
Costs of a $10,000 investment |
Costs paid as a percentage of a $10,000 investment |
State Street® My2030 Corporate Bond ETF |
$16 |
0.16% | |
|
| Expenses Paid, Amount |
$ 16
|
|
| Expense Ratio, Percent |
0.16%
|
|
| Factors Affecting Performance [Text Block] |
How did the Fund perform last year and what affected its performance?For the 12-month reporting period ended August 31, 2026, the U.S. investment grade corporate bond market has been characterized by historically tight credit spreads and strong demand despite very heavy levels of new issuance and increasingly volatile U.S. Treasury rates. Given rich valuations, we have maintained a modest risk positioning versus the benchmark but have found some pockets of value in the BBB-rated bonds in the front end of the corporate curve. Performance was driven by security selection in the Cable & Satellite, Tobacco, and Retail sectors. |
|
| Performance Past Does Not Indicate Future [Text] |
The Fund’s past performance is not necessarily an indication of how the Fund will perform in the future. The returns do not reflect the deduction of taxes that a shareholder would pay on Fund distributions or on the redemption or sale of Fund shares.
|
|
| Line Graph [Table Text Block] |
Table Summary
|
MYCJ |
Bloomberg U.S. Aggregate Bond Index |
ICE 2030 Maturity U.S. Corporate Index |
09/23/24 |
$10,000 |
$10,000 |
$10,000 |
09/30/24 |
$9,983 |
$9,981 |
$9,981 |
10/31/24 |
$9,778 |
$9,733 |
$9,766 |
11/30/24 |
$9,889 |
$9,836 |
$9,858 |
12/31/24 |
$9,792 |
$9,675 |
$9,773 |
01/31/25 |
$9,854 |
$9,726 |
$9,836 |
02/28/25 |
$10,002 |
$9,940 |
$9,992 |
03/31/25 |
$10,036 |
$9,944 |
$10,027 |
04/30/25 |
$10,110 |
$9,983 |
$10,111 |
05/31/25 |
$10,129 |
$9,912 |
$10,125 |
06/30/25 |
$10,260 |
$10,064 |
$10,259 |
07/31/25 |
$10,274 |
$10,037 |
$10,263 |
08/31/25 |
$10,417 |
$10,158 |
$10,411 |
09/30/25 |
$10,463 |
$10,268 |
$10,453 |
10/31/25 |
$10,499 |
$10,333 |
$10,495 |
11/30/25 |
$10,572 |
$10,397 |
$10,565 |
12/31/25 |
$10,589 |
$10,381 |
$10,579 |
01/31/26 |
$10,623 |
$10,392 |
$10,614 |
02/28/26 |
$10,730 |
$10,563 |
$10,720 |
03/31/26 |
$10,581 |
$10,376 |
$10,565 |
04/30/26 |
$10,629 |
$10,388 |
$10,616 |
05/31/26 |
$10,653 |
$10,420 |
$10,640 |
06/30/26 |
$10,660 |
$10,446 |
$10,649 |
07/31/26 |
$10,614 |
$10,309 |
$10,604 |
08/31/26 |
$10,640 |
$10,350 |
$10,628 |
|
|
| Average Annual Return [Table Text Block] |
Average Annual Total Returns (%)
Table Summary
Name |
1 Year |
Since Inception 09/23/24 |
MYCJ |
2.14% |
3.25% |
Bloomberg U.S. Aggregate Bond Index |
1.89% |
1.79% |
ICE 2030 Maturity U.S. Corporate Index |
2.08% |
3.19% | The Fund’s past performance is not necessarily an indication of how the Fund will perform in the future. The returns do not reflect the deduction of taxes that a shareholder would pay on Fund distributions or on the redemption or sale of Fund shares. Updated performance information is available by calling 1-866-787-2257 or visiting our website at www.ssga.com. |
|
| Performance Inception Date |
Sep. 23, 2024
|
|
| Material Change Date |
Aug. 31, 2026
|
|
| Updated Performance Information Location [Text Block] |
Updated performance information is available by calling 1-866-787-2257 or visiting our website at www.ssga.com.
|
|
| AssetsNet |
$ 48,851,259
|
|
| Holdings Count | Holding |
210
|
|
| Advisory Fees Paid, Amount |
$ 48,913
|
|
| InvestmentCompanyPortfolioTurnover |
14.00%
|
|
| Additional Fund Statistics [Text Block] |
Key Fund Statistics as of 8/31/2026- Total Net Assets$48,851,259
- Number of Portfolio Holdings210
- Portfolio Turnover Rate14%
- Total Advisory Fees Paid$48,913
|
|
| Holdings [Text Block] |
Table Summary
Industries |
% |
Pharmaceuticals |
7.6% |
Electric |
7.4% |
Pipelines |
6.5% |
Semiconductors |
6.4% |
Banks |
6.3% |
Oil & Gas |
5.8% |
Agriculture |
4.5% |
Health Care Services |
4.5% |
Telecommunications |
4.3% |
Internet |
4.1% | |
|
| Largest Holdings [Text Block] |
Table Summary
Holdings |
% |
Boeing Co., 5.15%, due 05/01/30 |
2.9% |
Anheuser-Busch InBev Worldwide, Inc., 3.50%, due 06/01/30 |
2.5% |
CVS Health Corp., 5.13%, due 02/21/30 |
2.0% |
T-Mobile USA, Inc., 3.88%, due 04/15/30 |
2.0% |
Enterprise Products Operating LLC, 2.80%, due 01/31/30 |
1.8% |
Energy Transfer LP, 6.40%, due 12/01/30 |
1.8% |
Viatris, Inc., 2.70%, due 06/22/30 |
1.7% |
HCA, Inc., 3.50%, due 09/01/30 |
1.6% |
Pacific Gas & Electric Co., 4.55%, due 07/01/30 |
1.5% |
Pioneer Natural Resources Co., 1.90%, due 08/15/30 |
1.5% | |
|
| Material Fund Change [Text Block] |
This is a summary of certain changes of the Fund that occurred during the reporting period ended August 31, 2026. For more information contact 1-866-787-2257 (toll free) or refer to the Prospectus, which can be found on the Fund's website below. Effective December 30, 2025 (the “Effective Date”), the Fund changed its name from the SPDR® SSGA My2030 Corporate Bond ETF to the State Street® My2030 Corporate Bond ETF. These changes did not result in any changes to the Funds’ Investment Objectives, Principal Investment Strategies, or Principal Risks of Investing in the Funds. |
|
| Material Fund Change Name [Text Block] |
Effective December 30, 2025 (the “Effective Date”), the Fund changed its name from the SPDR® SSGA My2030 Corporate Bond ETF to the State Street® My2030 Corporate Bond ETF. These changes did not result in any changes to the Funds’ Investment Objectives, Principal Investment Strategies, or Principal Risks of Investing in the Funds.
|
|
| Summary of Change Legend [Text Block] |
This is a summary of certain changes of the Fund that occurred during the reporting period ended August 31, 2026. For more information contact 1-866-787-2257 (toll free) or refer to the Prospectus, which can be found on the Fund's website below.
|
|
| C000253980 |
|
|
| Shareholder Report [Line Items] |
|
|
| Fund Name |
State Street<sup style="inset: 1.5px 0px 4px; box-sizing: border-box; color: rgb(0, 0, 0); display: inline; flex-wrap: nowrap; font-size: 16px; font-weight: 700; grid-area: auto; line-height: 0px; margin: 0px; overflow: visible; position: relative; text-align: left; text-align-last: auto; white-space-collapse: preserve-breaks;">®</sup> My2031 Corporate Bond ETF
|
|
| Trading Symbol |
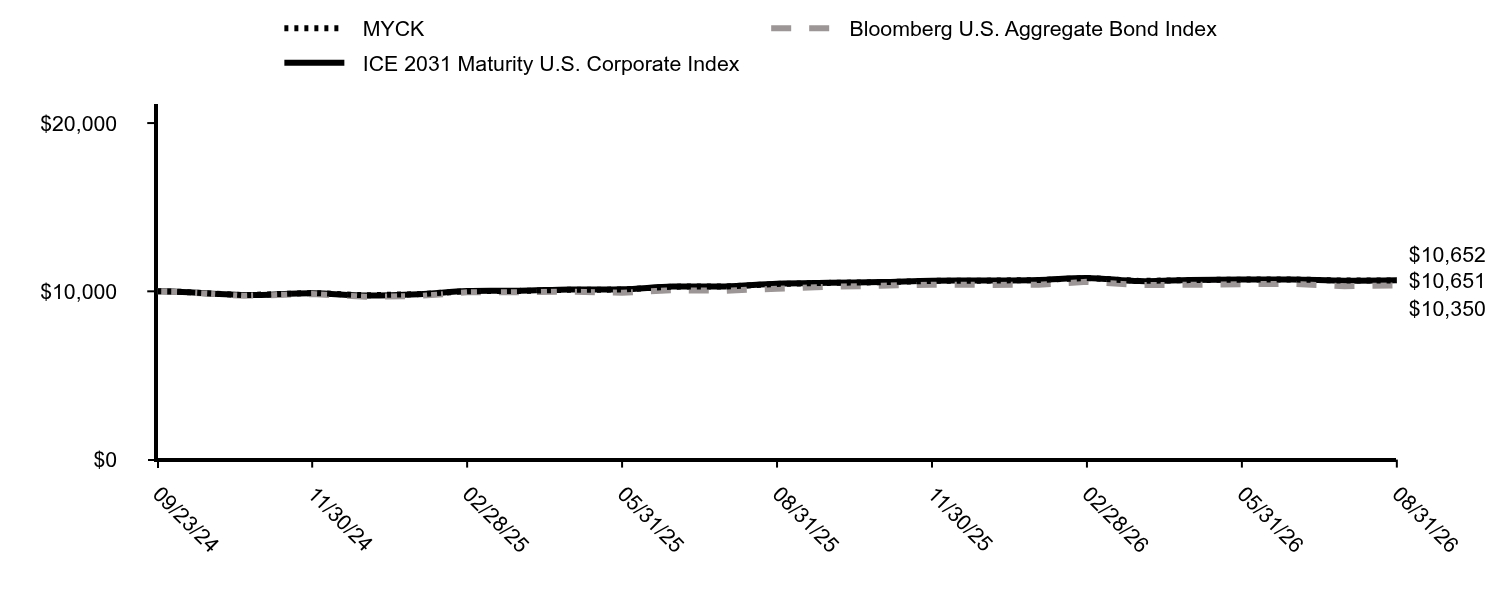
MYCK
|
|
| Security Exchange Name |
NASDAQ
|
|
| Annual or Semi-Annual Statement [Text Block] |
This annual shareholder report contains important information about the State Street® My2031 Corporate Bond ETF (the "Fund") for the period of September 1, 2025 through August 31, 2026.
|
|
| Additional Information [Text Block] |
You can find additional information about the Fund, including the Prospectus, Statement of Additional Information, financial statements and other information at www.ssga.com/us/en/institutional/fund-finder?tab=documents&type=etfs. You can also request this information about the Fund by contacting us at 1-866-787-2257.
|
|
| Material Fund Change Notice [Text Block] |
This report describes changes to the Fund that occurred during the reporting period.
|
|
| Additional Information Phone Number |
1-866-787-2257
|
|
| Additional Information Website |
www.ssga.com/us/en/institutional/fund-finder?tab=documents&type=etfs
|
|
| Expenses [Text Block] |
What were the Fund costs for the last year? (based on a hypothetical $10,000 Investment)
Table Summary
Fund Name |
Costs of a $10,000 investment |
Costs paid as a percentage of a $10,000 investment |
State Street® My2031 Corporate Bond ETF |
$17 |
0.17% | |
|
| Expenses Paid, Amount |
$ 17
|
|
| Expense Ratio, Percent |
0.17%
|
|
| Factors Affecting Performance [Text Block] |
How did the Fund perform last year and what affected its performance?For the 12-month reporting period ended August 31, 2026, the U.S. investment grade corporate bond market has been characterized by historically tight credit spreads and strong demand despite very heavy levels of new issuance and increasingly volatile U.S. Treasury rates. Given rich valuations, we have maintained a modest risk positioning versus the benchmark. Performance was driven by security selection in the Cable & Satellite, Tobacco, and REITs sectors. |
|
| Performance Past Does Not Indicate Future [Text] |
The Fund’s past performance is not necessarily an indication of how the Fund will perform in the future. The returns do not reflect the deduction of taxes that a shareholder would pay on Fund distributions or on the redemption or sale of Fund shares.
|
|
| Line Graph [Table Text Block] |
Table Summary
|
MYCK |
Bloomberg U.S. Aggregate Bond Index |
ICE 2031 Maturity U.S. Corporate Index |
09/23/24 |
$10,000 |
$10,000 |
$10,000 |
09/30/24 |
$9,994 |
$9,981 |
$9,990 |
10/31/24 |
$9,774 |
$9,733 |
$9,777 |
11/30/24 |
$9,902 |
$9,836 |
$9,883 |
12/31/24 |
$9,765 |
$9,675 |
$9,751 |
01/31/25 |
$9,834 |
$9,726 |
$9,832 |
02/28/25 |
$10,007 |
$9,940 |
$10,015 |
03/31/25 |
$10,026 |
$9,944 |
$10,034 |
04/30/25 |
$10,091 |
$9,983 |
$10,110 |
05/31/25 |
$10,105 |
$9,912 |
$10,121 |
06/30/25 |
$10,279 |
$10,064 |
$10,285 |
07/31/25 |
$10,283 |
$10,037 |
$10,288 |
08/31/25 |
$10,440 |
$10,158 |
$10,453 |
09/30/25 |
$10,502 |
$10,268 |
$10,510 |
10/31/25 |
$10,540 |
$10,333 |
$10,552 |
11/30/25 |
$10,621 |
$10,397 |
$10,633 |
12/31/25 |
$10,634 |
$10,381 |
$10,643 |
01/31/26 |
$10,670 |
$10,392 |
$10,679 |
02/28/26 |
$10,793 |
$10,563 |
$10,798 |
03/31/26 |
$10,616 |
$10,376 |
$10,608 |
04/30/26 |
$10,666 |
$10,388 |
$10,666 |
05/31/26 |
$10,695 |
$10,420 |
$10,696 |
06/30/26 |
$10,706 |
$10,446 |
$10,702 |
07/31/26 |
$10,637 |
$10,309 |
$10,632 |
08/31/26 |
$10,651 |
$10,350 |
$10,652 |
|
|
| Average Annual Return [Table Text Block] |
Average Annual Total Returns (%)
Table Summary
Name |
1 Year |
Since Inception 09/23/24 |
MYCK |
2.02% |
3.31% |
Bloomberg U.S. Aggregate Bond Index |
1.89% |
1.79% |
ICE 2031 Maturity U.S. Corporate Index |
1.91% |
3.31% | The Fund’s past performance is not necessarily an indication of how the Fund will perform in the future. The returns do not reflect the deduction of taxes that a shareholder would pay on Fund distributions or on the redemption or sale of Fund shares. Updated performance information is available by calling 1-866-787-2257 or visiting our website at www.ssga.com. |
|
| Performance Inception Date |
Sep. 23, 2024
|
|
| Material Change Date |
Aug. 31, 2026
|
|
| Updated Performance Information Location [Text Block] |
Updated performance information is available by calling 1-866-787-2257 or visiting our website at www.ssga.com.
|
|
| AssetsNet |
$ 26,924,963
|
|
| Holdings Count | Holding |
166
|
|
| Advisory Fees Paid, Amount |
$ 19,512
|
|
| InvestmentCompanyPortfolioTurnover |
22.00%
|
|
| Additional Fund Statistics [Text Block] |
Key Fund Statistics as of 8/31/2026- Total Net Assets$26,924,963
- Number of Portfolio Holdings166
- Portfolio Turnover Rate22%
- Total Advisory Fees Paid$19,512
|
|
| Holdings [Text Block] |
Table Summary
Industries |
% |
Banks |
9.6% |
Aerospace & Defense |
9.6% |
Agriculture |
7.0% |
Pharmaceuticals |
6.9% |
Semiconductors |
6.9% |
Electric |
5.6% |
Real Estate Investment Trusts |
5.3% |
Diversified Financial Services |
4.5% |
Auto Manufacturers |
4.3% |
Telecommunications |
3.6% | |
|
| Largest Holdings [Text Block] |
Table Summary
Holdings |
% |
General Motors Financial Co., Inc., 5.60%, due 06/18/31 |
2.6% |
L3Harris Technologies, Inc., 5.25%, due 06/01/31 |
2.4% |
Boeing Co., 6.39%, due 05/01/31 |
2.4% |
Philip Morris International, Inc., 5.13%, due 02/13/31 |
2.2% |
Bank of Montreal, 5.51%, due 06/04/31 |
2.1% |
Sumisho Air Lease Corp., 4.85%, due 03/24/31 |
2.1% |
Banco Santander SA, 4.87%, due 04/15/31 |
2.0% |
CVS Health Corp., 5.55%, due 06/01/31 |
1.9% |
Bunge Ltd. Finance Corp., 2.75%, due 05/14/31 |
1.9% |
Pacific Gas & Electric Co., 3.25%, due 06/01/31 |
1.9% | |
|
| Material Fund Change [Text Block] |
This is a summary of certain changes of the Fund that occurred during the reporting period ended August 31, 2026. For more information contact 1-866-787-2257 (toll free) or refer to the Prospectus, which can be found on the Fund's website below. Effective December 30, 2025 (the “Effective Date”), the Fund changed its name from the SPDR® SSGA My2031 Corporate Bond ETF to the State Street® My2031 Corporate Bond ETF. These changes did not result in any changes to the Funds’ Investment Objectives, Principal Investment Strategies, or Principal Risks of Investing in the Funds. |
|
| Material Fund Change Name [Text Block] |
Effective December 30, 2025 (the “Effective Date”), the Fund changed its name from the SPDR® SSGA My2031 Corporate Bond ETF to the State Street® My2031 Corporate Bond ETF. These changes did not result in any changes to the Funds’ Investment Objectives, Principal Investment Strategies, or Principal Risks of Investing in the Funds.
|
|
| Summary of Change Legend [Text Block] |
This is a summary of certain changes of the Fund that occurred during the reporting period ended August 31, 2026. For more information contact 1-866-787-2257 (toll free) or refer to the Prospectus, which can be found on the Fund's website below.
|
|
| C000253981 |
|
|
| Shareholder Report [Line Items] |
|
|
| Fund Name |
State Street<sup style="inset: 1.5px 0px 4px; box-sizing: border-box; color: rgb(0, 0, 0); display: inline; flex-wrap: nowrap; font-size: 16px; font-weight: 700; grid-area: auto; line-height: 0px; margin: 0px; overflow: visible; position: relative; text-align: left; text-align-last: auto; white-space-collapse: preserve-breaks;">®</sup> My2032 Corporate Bond ETF
|
|
| Trading Symbol |
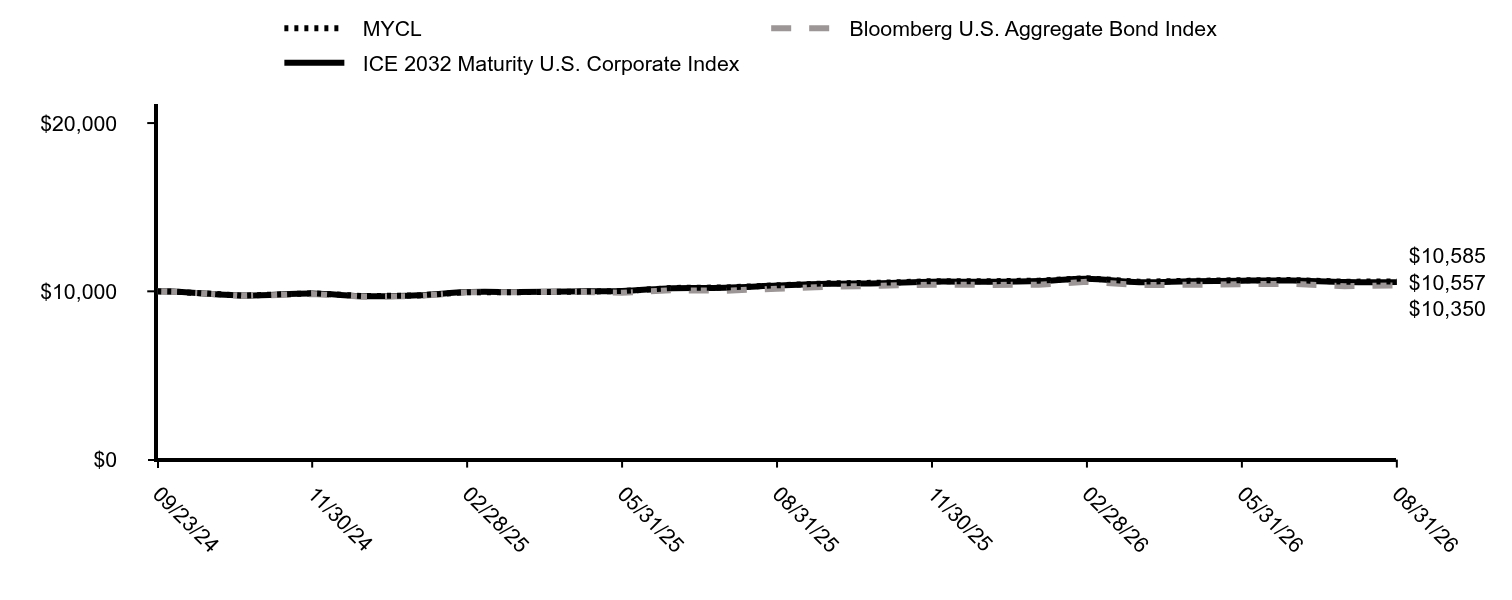
MYCL
|
|
| Security Exchange Name |
NASDAQ
|
|
| Annual or Semi-Annual Statement [Text Block] |
This annual shareholder report contains important information about the State Street® My2032 Corporate Bond ETF (the "Fund") for the period of September 1, 2025 through August 31, 2026.
|
|
| Additional Information [Text Block] |
You can find additional information about the Fund, including the Prospectus, Statement of Additional Information, financial statements and other information at www.ssga.com/us/en/institutional/fund-finder?tab=documents&type=etfs. You can also request this information about the Fund by contacting us at 1-866-787-2257.
|
|
| Material Fund Change Notice [Text Block] |
This report describes changes to the Fund that occurred during the reporting period.
|
|
| Additional Information Phone Number |
1-866-787-2257
|
|
| Additional Information Website |
www.ssga.com/us/en/institutional/fund-finder?tab=documents&type=etfs
|
|
| Expenses [Text Block] |
What were the Fund costs for the last year? (based on a hypothetical $10,000 Investment)
Table Summary
Fund Name |
Costs of a $10,000 investment |
Costs paid as a percentage of a $10,000 investment |
State Street® My2032 Corporate Bond ETF |
$18 |
0.18% | |
|
| Expenses Paid, Amount |
$ 18
|
|
| Expense Ratio, Percent |
0.18%
|
|
| Factors Affecting Performance [Text Block] |
How did the Fund perform last year and what affected its performance?For the 12-month reporting period ended August 31, 2026, the U.S. investment grade corporate bond market has been characterized by historically tight credit spreads and strong demand despite very heavy levels of new issuance and increasingly volatile U.S. Treasury rates. Given rich valuations, we have maintained a modest risk positioning versus the benchmark. Performance was driven by security selection in the Banking, Cable & Satellite, and Food & Beverage sectors. |
|
| Performance Past Does Not Indicate Future [Text] |
The Fund’s past performance is not necessarily an indication of how the Fund will perform in the future. The returns do not reflect the deduction of taxes that a shareholder would pay on Fund distributions or on the redemption or sale of Fund shares.
|
|
| Line Graph [Table Text Block] |
Table Summary
|
MYCL |
Bloomberg U.S. Aggregate Bond Index |
ICE 2032 Maturity U.S. Corporate Index |
09/23/24 |
$10,000 |
$10,000 |
$10,000 |
09/30/24 |
$9,983 |
$9,981 |
$9,984 |
10/31/24 |
$9,745 |
$9,733 |
$9,749 |
11/30/24 |
$9,883 |
$9,836 |
$9,869 |
12/31/24 |
$9,714 |
$9,675 |
$9,706 |
01/31/25 |
$9,759 |
$9,726 |
$9,761 |
02/28/25 |
$9,948 |
$9,940 |
$9,957 |
03/31/25 |
$9,951 |
$9,944 |
$9,960 |
04/30/25 |
$9,976 |
$9,983 |
$9,993 |
05/31/25 |
$10,016 |
$9,912 |
$10,023 |
06/30/25 |
$10,202 |
$10,064 |
$10,188 |
07/31/25 |
$10,228 |
$10,037 |
$10,208 |
08/31/25 |
$10,356 |
$10,158 |
$10,340 |
09/30/25 |
$10,475 |
$10,268 |
$10,445 |
10/31/25 |
$10,510 |
$10,333 |
$10,485 |
11/30/25 |
$10,602 |
$10,397 |
$10,574 |
12/31/25 |
$10,597 |
$10,381 |
$10,568 |
01/31/26 |
$10,636 |
$10,392 |
$10,610 |
02/28/26 |
$10,778 |
$10,563 |
$10,751 |
03/31/26 |
$10,571 |
$10,376 |
$10,537 |
04/30/26 |
$10,623 |
$10,388 |
$10,597 |
05/31/26 |
$10,660 |
$10,420 |
$10,633 |
06/30/26 |
$10,668 |
$10,446 |
$10,638 |
07/31/26 |
$10,574 |
$10,309 |
$10,548 |
08/31/26 |
$10,585 |
$10,350 |
$10,557 |
|
|
| Average Annual Return [Table Text Block] |
Average Annual Total Returns (%)
Table Summary
Name |
1 Year |
Since Inception 09/23/24 |
MYCL |
2.21% |
2.98% |
Bloomberg U.S. Aggregate Bond Index |
1.89% |
1.79% |
ICE 2032 Maturity U.S. Corporate Index |
2.10% |
2.84% | The Fund’s past performance is not necessarily an indication of how the Fund will perform in the future. The returns do not reflect the deduction of taxes that a shareholder would pay on Fund distributions or on the redemption or sale of Fund shares. Updated performance information is available by calling 1-866-787-2257 or visiting our website at www.ssga.com. |
|
| Performance Inception Date |
Sep. 23, 2024
|
|
| Material Change Date |
Aug. 31, 2026
|
|
| Updated Performance Information Location [Text Block] |
Updated performance information is available by calling 1-866-787-2257 or visiting our website at www.ssga.com.
|
|
| AssetsNet |
$ 12,143,270
|
|
| Holdings Count | Holding |
111
|
|
| Advisory Fees Paid, Amount |
$ 12,374
|
|
| InvestmentCompanyPortfolioTurnover |
12.00%
|
|
| Additional Fund Statistics [Text Block] |
Key Fund Statistics as of 8/31/2026- Total Net Assets$12,143,270
- Number of Portfolio Holdings111
- Portfolio Turnover Rate12%
- Total Advisory Fees Paid$12,374
|
|
| Holdings [Text Block] |
Table Summary
Industries |
% |
Electric |
10.4% |
Semiconductors |
8.3% |
Software |
6.5% |
Agriculture |
5.7% |
Food |
4.7% |
Banks |
4.3% |
Retail |
4.3% |
Diversified Financial Services |
4.2% |
Real Estate Investment Trusts |
4.0% |
Auto Manufacturers |
4.0% | |
|
| Largest Holdings [Text Block] |
Table Summary
Holdings |
% |
ArcelorMittal SA, 6.80%, due 11/29/32 |
3.1% |
General Motors Co., 5.60%, due 10/15/32 |
2.8% |
Micron Technology, Inc., 2.70%, due 04/15/32 |
2.6% |
Kraft Heinz Foods Co., 5.20%, due 03/15/32 |
2.5% |
Oracle Corp., 6.25%, due 11/09/32 |
2.5% |
NetApp, Inc., 5.50%, due 03/17/32 |
2.4% |
Philip Morris International, Inc., 5.75%, due 11/17/32 |
2.2% |
Advanced Micro Devices, Inc., 3.92%, due 06/01/32 |
2.2% |
HCA, Inc., 3.63%, due 03/15/32 |
2.1% |
CenterPoint Energy Houston Electric LLC, 4.45%, due 10/01/32 |
2.1% | |
|
| Material Fund Change [Text Block] |
This is a summary of certain changes of the Fund that occurred during the reporting period ended August 31, 2026. For more information contact 1-866-787-2257 (toll free) or refer to the Prospectus, which can be found on the Fund's website below. Effective December 30, 2025 (the “Effective Date”), the Fund changed its name from the SPDR® SSGA My2032 Corporate Bond ETF to the State Street® My2032 Corporate Bond ETF. These changes did not result in any changes to the Funds’ Investment Objectives, Principal Investment Strategies, or Principal Risks of Investing in the Funds. |
|
| Material Fund Change Name [Text Block] |
Effective December 30, 2025 (the “Effective Date”), the Fund changed its name from the SPDR® SSGA My2032 Corporate Bond ETF to the State Street® My2032 Corporate Bond ETF. These changes did not result in any changes to the Funds’ Investment Objectives, Principal Investment Strategies, or Principal Risks of Investing in the Funds.
|
|
| Summary of Change Legend [Text Block] |
This is a summary of certain changes of the Fund that occurred during the reporting period ended August 31, 2026. For more information contact 1-866-787-2257 (toll free) or refer to the Prospectus, which can be found on the Fund's website below.
|
|
| C000253982 |
|
|
| Shareholder Report [Line Items] |
|
|
| Fund Name |
State Street<sup style="inset: 1.5px 0px 4px; box-sizing: border-box; color: rgb(0, 0, 0); display: inline; flex-wrap: nowrap; font-size: 16px; font-weight: 700; grid-area: auto; line-height: 0px; margin: 0px; overflow: visible; position: relative; text-align: left; text-align-last: auto; white-space-collapse: preserve-breaks;">®</sup> My2033 Corporate Bond ETF
|
|
| Trading Symbol |
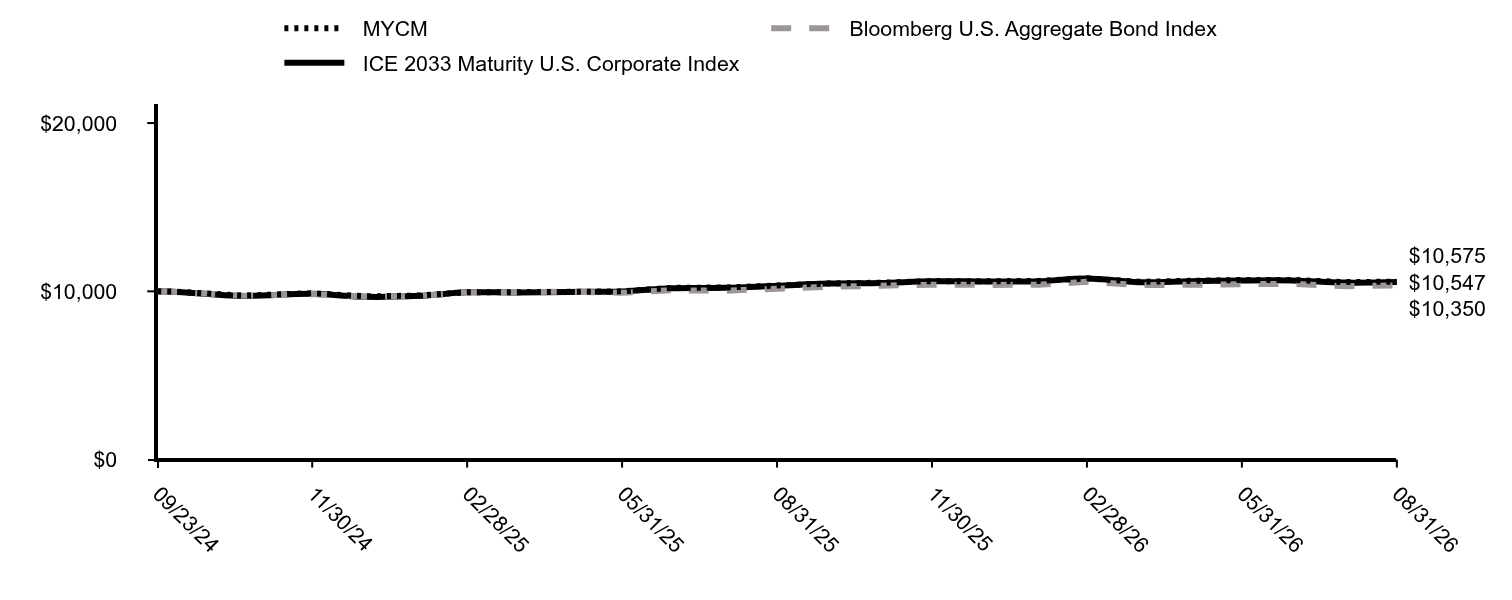
MYCM
|
|
| Security Exchange Name |
NASDAQ
|
|
| Annual or Semi-Annual Statement [Text Block] |
This annual shareholder report contains important information about the State Street® My2033 Corporate Bond ETF (the "Fund") for the period of September 1, 2025 through August 31, 2026.
|
|
| Additional Information [Text Block] |
You can find additional information about the Fund, including the Prospectus, Statement of Additional Information, financial statements and other information at www.ssga.com/us/en/institutional/fund-finder?tab=documents&type=etfs. You can also request this information about the Fund by contacting us at 1-866-787-2257.
|
|
| Material Fund Change Notice [Text Block] |
This report describes changes to the Fund that occurred during the reporting period.
|
|
| Additional Information Phone Number |
1-866-787-2257
|
|
| Additional Information Website |
www.ssga.com/us/en/institutional/fund-finder?tab=documents&type=etfs
|
|
| Expenses [Text Block] |
What were the Fund costs for the last year? (based on a hypothetical $10,000 Investment)
Table Summary
Fund Name |
Costs of a $10,000 investment |
Costs paid as a percentage of a $10,000 investment |
State Street® My2033 Corporate Bond ETF |
$19 |
0.19% | |
|
| Expenses Paid, Amount |
$ 19
|
|
| Expense Ratio, Percent |
0.19%
|
|
| Factors Affecting Performance [Text Block] |
How did the Fund perform last year and what affected its performance?For the 12-month reporting period ended August 31, 2026, the U.S. investment grade corporate bond market has been characterized by historically tight credit spreads and strong demand despite very heavy levels of new issuance and increasingly volatile U.S. Treasury rates. Given rich valuations, we have maintained a modest risk positioning versus the benchmark. Performance was driven by security selection in the Food & Beverage, Auto, and Cable & Satellite sectors. |
|
| Performance Past Does Not Indicate Future [Text] |
The Fund’s past performance is not necessarily an indication of how the Fund will perform in the future. The returns do not reflect the deduction of taxes that a shareholder would pay on Fund distributions or on the redemption or sale of Fund shares.
|
|
| Line Graph [Table Text Block] |
Table Summary
|
MYCM |
Bloomberg U.S. Aggregate Bond Index |
ICE 2033 Maturity U.S. Corporate Index |
09/23/24 |
$10,000 |
$10,000 |
$10,000 |
09/30/24 |
$9,988 |
$9,981 |
$9,982 |
10/31/24 |
$9,745 |
$9,733 |
$9,728 |
11/30/24 |
$9,888 |
$9,836 |
$9,850 |
12/31/24 |
$9,700 |
$9,675 |
$9,673 |
01/31/25 |
$9,749 |
$9,726 |
$9,730 |
02/28/25 |
$9,950 |
$9,940 |
$9,939 |
03/31/25 |
$9,951 |
$9,944 |
$9,936 |
04/30/25 |
$9,969 |
$9,983 |
$9,966 |
05/31/25 |
$10,000 |
$9,912 |
$9,992 |
06/30/25 |
$10,211 |
$10,064 |
$10,190 |
07/31/25 |
$10,225 |
$10,037 |
$10,207 |
08/31/25 |
$10,345 |
$10,158 |
$10,330 |
09/30/25 |
$10,471 |
$10,268 |
$10,458 |
10/31/25 |
$10,512 |
$10,333 |
$10,498 |
11/30/25 |
$10,608 |
$10,397 |
$10,597 |
12/31/25 |
$10,598 |
$10,381 |
$10,583 |
01/31/26 |
$10,618 |
$10,392 |
$10,601 |
02/28/26 |
$10,772 |
$10,563 |
$10,764 |
03/31/26 |
$10,568 |
$10,376 |
$10,543 |
04/30/26 |
$10,622 |
$10,388 |
$10,599 |
05/31/26 |
$10,672 |
$10,420 |
$10,647 |
06/30/26 |
$10,680 |
$10,446 |
$10,648 |
07/31/26 |
$10,548 |
$10,309 |
$10,520 |
08/31/26 |
$10,575 |
$10,350 |
$10,547 |
|
|
| Average Annual Return [Table Text Block] |
Average Annual Total Returns (%)
Table Summary
Name |
1 Year |
Since Inception 09/23/24 |
MYCM |
2.22% |
2.93% |
Bloomberg U.S. Aggregate Bond Index |
1.89% |
1.79% |
ICE 2033 Maturity U.S. Corporate Index |
2.10% |
2.79% | The Fund’s past performance is not necessarily an indication of how the Fund will perform in the future. The returns do not reflect the deduction of taxes that a shareholder would pay on Fund distributions or on the redemption or sale of Fund shares. Updated performance information is available by calling 1-866-787-2257 or visiting our website at www.ssga.com. |
|
| Performance Inception Date |
Sep. 23, 2024
|
|
| Material Change Date |
Aug. 31, 2026
|
|
| Updated Performance Information Location [Text Block] |
Updated performance information is available by calling 1-866-787-2257 or visiting our website at www.ssga.com.
|
|
| AssetsNet |
$ 8,475,567
|
|
| Holdings Count | Holding |
89
|
|
| Advisory Fees Paid, Amount |
$ 9,887
|
|
| InvestmentCompanyPortfolioTurnover |
9.00%
|
|
| Additional Fund Statistics [Text Block] |
Key Fund Statistics as of 8/31/2026- Total Net Assets$8,475,567
- Number of Portfolio Holdings89
- Portfolio Turnover Rate9%
- Total Advisory Fees Paid$9,887
|
|
| Holdings [Text Block] |
Table Summary
Industries |
% |
Electric |
10.5% |
Banks |
8.2% |
Semiconductors |
7.9% |
Pipelines |
7.6% |
Pharmaceuticals |
6.3% |
Media |
4.0% |
Food |
3.8% |
Software |
3.7% |
Oil & Gas |
3.5% |
Telecommunications |
3.5% | |
|
| Largest Holdings [Text Block] |
Table Summary
Holdings |
% |
JBS NV/JBS USA Foods Group Holdings, Inc./JBS USA Food Co. Holdings, 5.75%, due 04/01/33 |
3.7% |
Marvell Technology, Inc., 5.95%, due 09/15/33 |
3.0% |
CVS Health Corp., 5.30%, due 06/01/33 |
2.9% |
Verisk Analytics, Inc., 5.75%, due 04/01/33 |
2.9% |
Energy Transfer LP, 6.55%, due 12/01/33 |
2.8% |
Broadcom, Inc., 3.42%, due 04/15/33 |
2.6% |
L3Harris Technologies, Inc., 5.40%, due 07/31/33 |
2.5% |
Banco Santander SA, 6.35%, due 03/14/34 |
2.4% |
Intel Corp., 5.20%, due 02/10/33 |
2.2% |
Oracle Corp., 4.90%, due 02/06/33 |
2.1% | |
|
| Material Fund Change [Text Block] |
This is a summary of certain changes of the Fund that occurred during the reporting period ended August 31, 2026. For more information contact 1-866-787-2257 (toll free) or refer to the Prospectus, which can be found on the Fund's website below. Effective December 30, 2025 (the “Effective Date”), the Fund changed its name from the SPDR® SSGA My2033 Corporate Bond ETF to the State Street® My2033 Corporate Bond ETF. These changes did not result in any changes to the Funds’ Investment Objectives, Principal Investment Strategies, or Principal Risks of Investing in the Funds. |
|
| Material Fund Change Name [Text Block] |
Effective December 30, 2025 (the “Effective Date”), the Fund changed its name from the SPDR® SSGA My2033 Corporate Bond ETF to the State Street® My2033 Corporate Bond ETF. These changes did not result in any changes to the Funds’ Investment Objectives, Principal Investment Strategies, or Principal Risks of Investing in the Funds.
|
|
| Summary of Change Legend [Text Block] |
This is a summary of certain changes of the Fund that occurred during the reporting period ended August 31, 2026. For more information contact 1-866-787-2257 (toll free) or refer to the Prospectus, which can be found on the Fund's website below.
|
|
| C000253983 |
|
|
| Shareholder Report [Line Items] |
|
|
| Fund Name |
State Street<sup style="inset: 1.5px 0px 4px; box-sizing: border-box; color: rgb(0, 0, 0); display: inline; flex-wrap: nowrap; font-size: 16px; font-weight: 700; grid-area: auto; line-height: 0px; margin: 0px; overflow: visible; position: relative; text-align: left; text-align-last: auto; white-space-collapse: preserve-breaks;">®</sup> My2034 Corporate Bond ETF
|
|
| Trading Symbol |
MYCN
|
|
| Security Exchange Name |
NASDAQ
|
|
| Annual or Semi-Annual Statement [Text Block] |
This annual shareholder report contains important information about the State Street® My2034 Corporate Bond ETF (the "Fund") for the period of September 1, 2025 through August 31, 2026.
|
|
| Additional Information [Text Block] |
You can find additional information about the Fund, including the Prospectus, Statement of Additional Information, financial statements and other information at www.ssga.com/us/en/institutional/fund-finder?tab=documents&type=etfs. You can also request this information about the Fund by contacting us at 1-866-787-2257.
|
|
| Material Fund Change Notice [Text Block] |
This report describes changes to the Fund that occurred during the reporting period.
|
|
| Additional Information Phone Number |
1-866-787-2257
|
|
| Additional Information Website |
www.ssga.com/us/en/institutional/fund-finder?tab=documents&type=etfs
|
|
| Expenses [Text Block] |
What were the Fund costs for the last year? (based on a hypothetical $10,000 Investment)
Table Summary
Fund Name |
Costs of a $10,000 investment |
Costs paid as a percentage of a $10,000 investment |
State Street® My2034 Corporate Bond ETF |
$18 |
0.18% | |
|
| Expenses Paid, Amount |
$ 18
|
|
| Expense Ratio, Percent |
0.18%
|
|
| Factors Affecting Performance [Text Block] |
How did the Fund perform last year and what affected its performance?For the 12-month reporting period ended August 31, 2026, the U.S. investment grade corporate bond market has been characterized by historically tight credit spreads and strong demand despite very heavy levels of new issuance and increasingly volatile U.S. Treasury rates. Given rich valuations, we have maintained a modest risk positioning versus the benchmark. Performance was driven by security selection in the Banking, Cable & Satellite, and Food & Beverage sectors. |
|
| Performance Past Does Not Indicate Future [Text] |
The Fund’s past performance is not necessarily an indication of how the Fund will perform in the future. The returns do not reflect the deduction of taxes that a shareholder would pay on Fund distributions or on the redemption or sale of Fund shares.
|
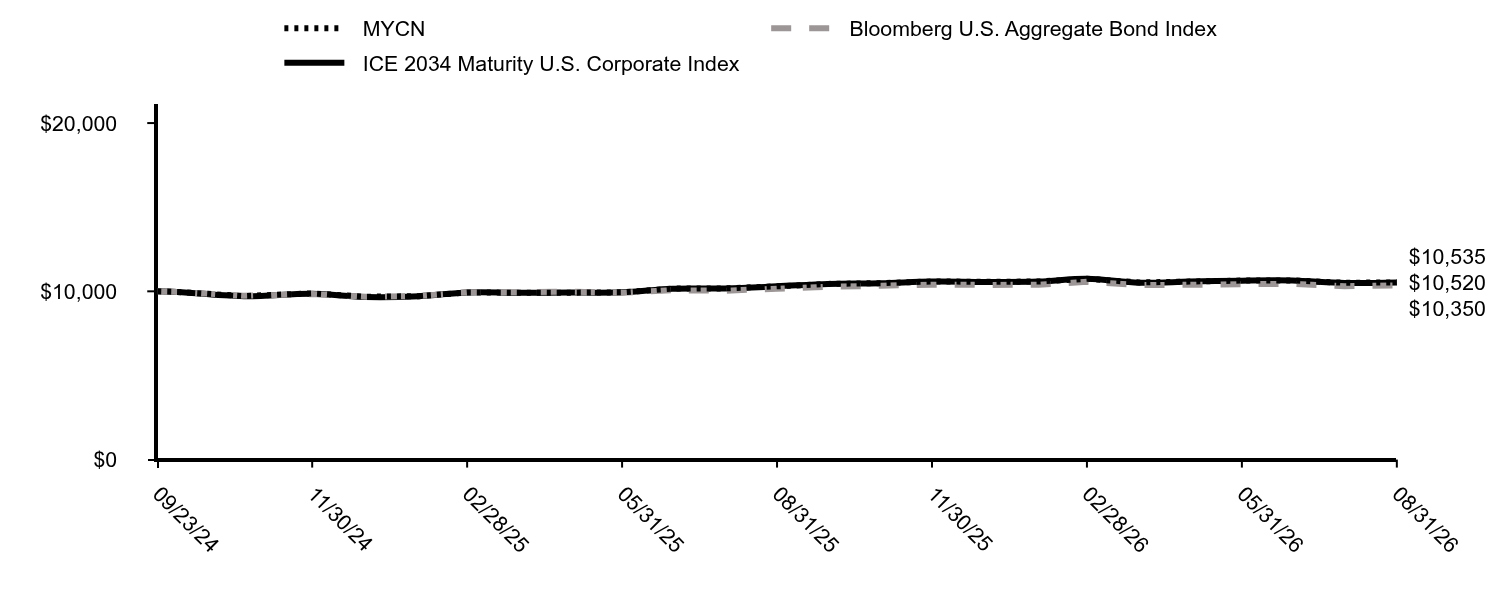
|
| Line Graph [Table Text Block] |
Table Summary
|
MYCN |
Bloomberg U.S. Aggregate Bond Index |
ICE 2034 Maturity U.S. Corporate Index |
09/23/24 |
$10,000 |
$10,000 |
$10,000 |
09/30/24 |
$9,978 |
$9,981 |
$9,977 |
10/31/24 |
$9,719 |
$9,733 |
$9,714 |
11/30/24 |
$9,880 |
$9,836 |
$9,856 |
12/31/24 |
$9,678 |
$9,675 |
$9,664 |
01/31/25 |
$9,714 |
$9,726 |
$9,711 |
02/28/25 |
$9,932 |
$9,940 |
$9,936 |
03/31/25 |
$9,916 |
$9,944 |
$9,917 |
04/30/25 |
$9,919 |
$9,983 |
$9,925 |
05/31/25 |
$9,942 |
$9,912 |
$9,943 |
06/30/25 |
$10,165 |
$10,064 |
$10,157 |
07/31/25 |
$10,176 |
$10,037 |
$10,173 |
08/31/25 |
$10,297 |
$10,158 |
$10,295 |
09/30/25 |
$10,442 |
$10,268 |
$10,438 |
10/31/25 |
$10,486 |
$10,333 |
$10,481 |
11/30/25 |
$10,585 |
$10,397 |
$10,581 |
12/31/25 |
$10,567 |
$10,381 |
$10,560 |
01/31/26 |
$10,583 |
$10,392 |
$10,581 |
02/28/26 |
$10,745 |
$10,563 |
$10,743 |
03/31/26 |
$10,526 |
$10,376 |
$10,511 |
04/30/26 |
$10,580 |
$10,388 |
$10,578 |
05/31/26 |
$10,638 |
$10,420 |
$10,636 |
06/30/26 |
$10,650 |
$10,446 |
$10,642 |
07/31/26 |
$10,507 |
$10,309 |
$10,494 |
08/31/26 |
$10,535 |
$10,350 |
$10,520 |
|
|
| Average Annual Return [Table Text Block] |
Average Annual Total Returns (%)
Table Summary
Name |
1 Year |
Since Inception 09/23/24 |
MYCN |
2.31% |
2.73% |
Bloomberg U.S. Aggregate Bond Index |
1.89% |
1.79% |
ICE 2034 Maturity U.S. Corporate Index |
2.18% |
2.65% | The Fund’s past performance is not necessarily an indication of how the Fund will perform in the future. The returns do not reflect the deduction of taxes that a shareholder would pay on Fund distributions or on the redemption or sale of Fund shares. Updated performance information is available by calling 1-866-787-2257 or visiting our website at www.ssga.com. |
|
| Performance Inception Date |
Sep. 23, 2024
|
|
| Material Change Date |
Aug. 31, 2026
|
|
| Updated Performance Information Location [Text Block] |
Updated performance information is available by calling 1-866-787-2257 or visiting our website at www.ssga.com.
|
|
| AssetsNet |
$ 9,611,472
|
|
| Holdings Count | Holding |
121
|
|
| Advisory Fees Paid, Amount |
$ 11,915
|
|
| InvestmentCompanyPortfolioTurnover |
3.00%
|
|
| Additional Fund Statistics [Text Block] |
Key Fund Statistics as of 8/31/2026- Total Net Assets$9,611,472
- Number of Portfolio Holdings121
- Portfolio Turnover Rate3%
- Total Advisory Fees Paid$11,915
|
|
| Holdings [Text Block] |
Table Summary
Industries |
% |
Electric |
12.0% |
Oil & Gas |
6.7% |
Insurance |
5.5% |
Real Estate Investment Trusts |
5.5% |
Pipelines |
5.4% |
Pharmaceuticals |
5.3% |
Telecommunications |
4.6% |
Beverages |
3.9% |
Banks |
3.6% |
Software |
3.5% | |
|
| Largest Holdings [Text Block] |
Table Summary
Holdings |
% |
BP Capital Markets America, Inc., 5.23%, due 11/17/34 |
2.9% |
General Motors Financial Co., Inc., 5.95%, due 04/04/34 |
2.4% |
Imperial Brands Finance PLC, 5.88%, due 07/01/34 |
2.1% |
Coca-Cola Consolidated, Inc., 5.45%, due 06/01/34 |
2.1% |
AT&T, Inc., 5.40%, due 02/15/34 |
2.1% |
AbbVie, Inc., 5.05%, due 03/15/34 |
2.0% |
Hewlett Packard Enterprise Co., 5.00%, due 10/15/34 |
1.7% |
Duke Energy Carolinas LLC, 4.85%, due 01/15/34 |
1.7% |
Southern Co., 5.70%, due 03/15/34 |
1.7% |
Devon Energy Corp., 5.20%, due 09/15/34 |
1.6% | |
|
| Material Fund Change [Text Block] |
This is a summary of certain changes of the Fund that occurred during the reporting period ended August 31, 2026. For more information contact 1-866-787-2257 (toll free) or refer to the Prospectus, which can be found on the Fund's website below. Effective December 30, 2025 (the “Effective Date”), the Fund changed its name from the SPDR® SSGA My2034 Corporate Bond ETF to the State Street® My2034 Corporate Bond ETF. These changes did not result in any changes to the Funds’ Investment Objectives, Principal Investment Strategies, or Principal Risks of Investing in the Funds. |
|
| Material Fund Change Name [Text Block] |
Effective December 30, 2025 (the “Effective Date”), the Fund changed its name from the SPDR® SSGA My2034 Corporate Bond ETF to the State Street® My2034 Corporate Bond ETF. These changes did not result in any changes to the Funds’ Investment Objectives, Principal Investment Strategies, or Principal Risks of Investing in the Funds.
|
|
| Summary of Change Legend [Text Block] |
This is a summary of certain changes of the Fund that occurred during the reporting period ended August 31, 2026. For more information contact 1-866-787-2257 (toll free) or refer to the Prospectus, which can be found on the Fund's website below.
|
|
| C000253971 |
|
|
| Shareholder Report [Line Items] |
|
|
| Fund Name |
State Street<sup style="inset: 1.5px 0px 4px; box-sizing: border-box; color: rgb(0, 0, 0); display: inline; flex-wrap: nowrap; font-size: 16px; font-weight: 700; grid-area: auto; line-height: 0px; margin: 0px; overflow: visible; position: relative; text-align: left; text-align-last: auto; white-space-collapse: preserve-breaks;">®</sup> My2026 Municipal Bond ETF
|
|
| Trading Symbol |
MYMF
|
|
| Security Exchange Name |
NASDAQ
|
|
| Annual or Semi-Annual Statement [Text Block] |
This annual shareholder report contains important information about the State Street® My2026 Municipal Bond ETF (the "Fund") for the period of September 1, 2025 through August 31, 2026.
|
|
| Additional Information [Text Block] |
You can find additional information about the Fund, including the Prospectus, Statement of Additional Information, financial statements and other information at www.ssga.com/us/en/institutional/fund-finder?tab=documents&type=etfs. You can also request this information about the Fund by contacting us at 1-866-787-2257.
|
|
| Material Fund Change Notice [Text Block] |
This report describes changes to the Fund that occurred during the reporting period.
|
|
| Additional Information Phone Number |
1-866-787-2257
|
|
| Additional Information Website |
www.ssga.com/us/en/institutional/fund-finder?tab=documents&type=etfs
|
|
| Expenses [Text Block] |
What were the Fund costs for the last year? (based on a hypothetical $10,000 Investment)
Table Summary
Fund Name |
Costs of a $10,000 investment |
Costs paid as a percentage of a $10,000 investment |
State Street® My2026 Municipal Bond ETF |
$22 |
0.22% | |
|
| Expenses Paid, Amount |
$ 22
|
|
| Expense Ratio, Percent |
0.22%
|
|
| Factors Affecting Performance [Text Block] |
How did the Fund perform last year and what affected its performance?The municipal market is having a moment in the fixed income sun. We attribute the performance to an increased appetite for bonds, as well as the high after-tax yield that Munis boast compared to alternatives. That’s helped to absorb a wave of issuance from state and local governments, which have sold around $415 billion of bonds (through the end of the August) the most in at least a decade. Those high rates are generating their own demand. The benefits are especially enticing to high-net-worth individuals, who may be eager to shelter record equity earnings from volatility and to prepare for higher income taxes. No one predicted the sectors outperformance especially when you consider the 2026 challenges, (Military conflict, over 50bps increase in Treasuries, elevated inflation, a shift in the U.S. Federal Reserve's outlook combined with record supply). The asset class' high relative value and tax-equivalent yield alongside the fact that the sector was not overly valued like other fixed income sectors has helped. |
|
| Performance Past Does Not Indicate Future [Text] |
The Fund’s past performance is not necessarily an indication of how the Fund will perform in the future. The returns do not reflect the deduction of taxes that a shareholder would pay on Fund distributions or on the redemption or sale of Fund shares.
|
|
| Line Graph [Table Text Block] |
Table Summary
|
MYMF |
Bloomberg U.S. Municipal Bond Index |
ICE 2026 Maturity U.S. Broad Municipal Index |
09/23/24 |
$10,000 |
$10,000 |
$10,000 |
09/30/24 |
$10,028 |
$10,009 |
$10,007 |
10/31/24 |
$9,975 |
$9,863 |
$9,967 |
11/30/24 |
$10,048 |
$10,034 |
$10,015 |
12/31/24 |
$10,023 |
$9,888 |
$10,000 |
01/31/25 |
$10,065 |
$9,937 |
$10,049 |
02/28/25 |
$10,114 |
$10,036 |
$10,092 |
03/31/25 |
$10,090 |
$9,866 |
$10,078 |
04/30/25 |
$10,060 |
$9,786 |
$10,067 |
05/31/25 |
$10,095 |
$9,793 |
$10,105 |
06/30/25 |
$10,143 |
$9,854 |
$10,150 |
07/31/25 |
$10,170 |
$9,834 |
$10,191 |
08/31/25 |
$10,215 |
$9,919 |
$10,229 |
09/30/25 |
$10,259 |
$10,149 |
$10,251 |
10/31/25 |
$10,273 |
$10,275 |
$10,271 |
11/30/25 |
$10,302 |
$10,298 |
$10,302 |
12/31/25 |
$10,327 |
$10,308 |
$10,330 |
01/31/26 |
$10,363 |
$10,404 |
$10,367 |
02/28/26 |
$10,389 |
$10,534 |
$10,399 |
03/31/26 |
$10,386 |
$10,289 |
$10,387 |
04/30/26 |
$10,400 |
$10,407 |
$10,414 |
05/31/26 |
$10,438 |
$10,446 |
$10,442 |
06/30/26 |
$10,461 |
$10,547 |
$10,474 |
07/31/26 |
$10,478 |
$10,351 |
$10,482 |
08/31/26 |
$10,500 |
$10,328 |
$10,505 |
|
|
| Average Annual Return [Table Text Block] |
Average Annual Total Returns (%)
Table Summary
Name |
1 Year |
Since Inception 09/23/24 |
MYMF |
2.79% |
2.55% |
Bloomberg U.S. Municipal Bond Index |
4.12% |
1.68% |
ICE 2026 Maturity U.S. Broad Municipal Index |
2.70% |
2.58% | The Fund’s past performance is not necessarily an indication of how the Fund will perform in the future. The returns do not reflect the deduction of taxes that a shareholder would pay on Fund distributions or on the redemption or sale of Fund shares. Updated performance information is available by calling 1-866-787-2257 or visiting our website at www.ssga.com. |
|
| Performance Inception Date |
Sep. 23, 2024
|
|
| Material Change Date |
Aug. 31, 2026
|
|
| Updated Performance Information Location [Text Block] |
Updated performance information is available by calling 1-866-787-2257 or visiting our website at www.ssga.com.
|
|
| AssetsNet |
$ 8,734,594
|
|
| Holdings Count | Holding |
78
|
|
| Advisory Fees Paid, Amount |
$ 21,885
|
|
| InvestmentCompanyPortfolioTurnover |
56.00%
|
|
| Additional Fund Statistics [Text Block] |
Key Fund Statistics as of 8/31/2026- Total Net Assets$8,734,594
- Number of Portfolio Holdings78
- Portfolio Turnover Rate56%
- Total Advisory Fees Paid$21,885
|
|
| Holdings [Text Block] |
Table Summary
States |
% |
Illinois |
13.7% |
Florida |
12.0% |
California |
8.8% |
Texas |
8.1% |
Colorado |
7.4% |
Michigan |
6.7% |
Indiana |
6.0% |
Ohio |
4.4% |
South Carolina |
4.3% |
Wisconsin |
4.0% | |
|
| Largest Holdings [Text Block] |
Table Summary
Holdings |
% |
County of Cook, General Obligation, IL, 5.00%, due 11/15/26 |
4.6% |
Florida Municipal Power Agency Revenue, FL, 5.00%, due 10/01/28 |
3.1% |
Folsom Cordova Unified School District, General Obligation, CA, 5.00%, due 10/01/26 |
2.9% |
South Florida Water Management District, Certificate Participation, FL, 5.00%, due 10/01/26 |
2.9% |
County of Durham, General Obligation, NC, 4.00%, due 10/01/26 |
2.7% |
Columbus City School District, General Obligation, OH, 5.00%, due 12/01/26 |
2.6% |
State of Michigan, General Obligation, MI, 5.00%, due 12/01/26 |
2.6% |
Metropolitan Water Reclamation District of Greater Chicago, General Obligation, IL, 5.00%, due 12/01/26 |
2.6% |
Virginia Resources Authority Revenue, VA, 5.00%, due 11/01/26 |
2.6% |
State of West Virginia, General Obligation, WV, 5.00%, due 11/01/26 |
2.6% | |
|
| Material Fund Change [Text Block] |
This is a summary of certain changes of the Fund that occurred during the reporting period ended August 31, 2026. For more information contact 1-866-787-2257 (toll free) or refer to the Prospectus, which can be found on the Fund's website below. Effective December 30, 2025 (the “Effective Date”), the Fund changed its name from the SPDR® SSGA My2026 Municipal Bond ETF to the State Street® My2026 Municipal Bond ETF. These changes did not result in any changes to the Funds’ Investment Objectives, Principal Investment Strategies, or Principal Risks of Investing in the Funds. |
|
| Material Fund Change Name [Text Block] |
Effective December 30, 2025 (the “Effective Date”), the Fund changed its name from the SPDR® SSGA My2026 Municipal Bond ETF to the State Street® My2026 Municipal Bond ETF. These changes did not result in any changes to the Funds’ Investment Objectives, Principal Investment Strategies, or Principal Risks of Investing in the Funds.
|
|
| Summary of Change Legend [Text Block] |
This is a summary of certain changes of the Fund that occurred during the reporting period ended August 31, 2026. For more information contact 1-866-787-2257 (toll free) or refer to the Prospectus, which can be found on the Fund's website below.
|
|
| C000253972 |
|
|
| Shareholder Report [Line Items] |
|
|
| Fund Name |
State Street<sup style="inset: 1.5px 0px 4px; box-sizing: border-box; color: rgb(0, 0, 0); display: inline; flex-wrap: nowrap; font-size: 16px; font-weight: 700; grid-area: auto; line-height: 0px; margin: 0px; overflow: visible; position: relative; text-align: left; text-align-last: auto; white-space-collapse: preserve-breaks;">®</sup> My2027 Municipal Bond ETF
|
|
| Trading Symbol |
MYMG
|
|
| Security Exchange Name |
NASDAQ
|
|
| Annual or Semi-Annual Statement [Text Block] |
This annual shareholder report contains important information about the State Street® My2027 Municipal Bond ETF (the "Fund") for the period of September 1, 2025 through August 31, 2026.
|
|
| Additional Information [Text Block] |
You can find additional information about the Fund, including the Prospectus, Statement of Additional Information, financial statements and other information at www.ssga.com/us/en/institutional/fund-finder?tab=documents&type=etfs. You can also request this information about the Fund by contacting us at 1-866-787-2257.
|
|
| Material Fund Change Notice [Text Block] |
This report describes changes to the Fund that occurred during the reporting period.
|
|
| Additional Information Phone Number |
1-866-787-2257
|
|
| Additional Information Website |
www.ssga.com/us/en/institutional/fund-finder?tab=documents&type=etfs
|
|
| Expenses [Text Block] |
What were the Fund costs for the last year? (based on a hypothetical $10,000 Investment)
Table Summary
Fund Name |
Costs of a $10,000 investment |
Costs paid as a percentage of a $10,000 investment |
State Street® My2027 Municipal Bond ETF |
$23 |
0.23% | |
|
| Expenses Paid, Amount |
$ 23
|
|
| Expense Ratio, Percent |
0.23%
|
|
| Factors Affecting Performance [Text Block] |
How did the Fund perform last year and what affected its performance?The municipal market is having a moment in the fixed income sun. We attribute the performance to an increased appetite for bonds, as well as the high after-tax yield that Munis boast compared to alternatives. That’s helped to absorb a wave of issuance from state and local governments, which have sold around $415 billion of bonds (through the end of the August) the most in at least a decade. Those high rates are generating their own demand. The benefits are especially enticing to high-net-worth individuals, who may be eager to shelter record equity earnings from volatility and to prepare for higher income taxes. No one predicted the sectors outperformance especially when you consider the 2026 challenges, (Military conflict, over 50bps increase in Treasuries, elevated inflation, a shift in the U.S. Federal Reserve's outlook combined with record supply). The asset class' high relative value and tax-equivalent yield alongside the fact that the sector was not overly valued like other fixed income sectors has helped. |
|
| Performance Past Does Not Indicate Future [Text] |
The Fund’s past performance is not necessarily an indication of how the Fund will perform in the future. The returns do not reflect the deduction of taxes that a shareholder would pay on Fund distributions or on the redemption or sale of Fund shares.
|
|
| Line Graph [Table Text Block] |
Table Summary
|
MYMG |
Bloomberg U.S. Municipal Bond Index |
ICE 2027 Maturity U.S. Broad Municipal Index |
09/23/24 |
$10,000 |
$10,000 |
$10,000 |
09/30/24 |
$10,022 |
$10,009 |
$10,011 |
10/31/24 |
$9,937 |
$9,863 |
$9,948 |
11/30/24 |
$10,029 |
$10,034 |
$10,014 |
12/31/24 |
$9,989 |
$9,888 |
$9,970 |
01/31/25 |
$10,020 |
$9,937 |
$10,014 |
02/28/25 |
$10,073 |
$10,036 |
$10,073 |
03/31/25 |
$10,017 |
$9,866 |
$10,035 |
04/30/25 |
$9,952 |
$9,786 |
$10,008 |
05/31/25 |
$9,993 |
$9,793 |
$10,057 |
06/30/25 |
$10,049 |
$9,854 |
$10,118 |
07/31/25 |
$10,069 |
$9,834 |
$10,161 |
08/31/25 |
$10,140 |
$9,919 |
$10,213 |
09/30/25 |
$10,176 |
$10,149 |
$10,253 |
10/31/25 |
$10,193 |
$10,275 |
$10,271 |
11/30/25 |
$10,227 |
$10,298 |
$10,302 |
12/31/25 |
$10,257 |
$10,308 |
$10,333 |
01/31/26 |
$10,302 |
$10,404 |
$10,386 |
02/28/26 |
$10,344 |
$10,534 |
$10,433 |
03/31/26 |
$10,319 |
$10,289 |
$10,383 |
04/30/26 |
$10,347 |
$10,407 |
$10,413 |
05/31/26 |
$10,372 |
$10,446 |
$10,439 |
06/30/26 |
$10,403 |
$10,547 |
$10,474 |
07/31/26 |
$10,404 |
$10,351 |
$10,466 |
08/31/26 |
$10,432 |
$10,328 |
$10,497 |
|
|
| Average Annual Return [Table Text Block] |
Average Annual Total Returns (%)
Table Summary
Name |
1 Year |
Since Inception 09/23/24 |
MYMG |
2.88% |
2.21% |
Bloomberg U.S. Municipal Bond Index |
4.12% |
1.68% |
ICE 2027 Maturity U.S. Broad Municipal Index |
2.78% |
2.54% | The Fund’s past performance is not necessarily an indication of how the Fund will perform in the future. The returns do not reflect the deduction of taxes that a shareholder would pay on Fund distributions or on the redemption or sale of Fund shares. Updated performance information is available by calling 1-866-787-2257 or visiting our website at www.ssga.com. |
|
| Performance Inception Date |
Sep. 23, 2024
|
|
| Material Change Date |
Aug. 31, 2026
|
|
| Updated Performance Information Location [Text Block] |
Updated performance information is available by calling 1-866-787-2257 or visiting our website at www.ssga.com.
|
|
| AssetsNet |
$ 8,637,823
|
|
| Holdings Count | Holding |
75
|
|
| Advisory Fees Paid, Amount |
$ 15,997
|
|
| InvestmentCompanyPortfolioTurnover |
13.00%
|
|
| Additional Fund Statistics [Text Block] |
Key Fund Statistics as of 8/31/2026- Total Net Assets$8,637,823
- Number of Portfolio Holdings75
- Portfolio Turnover Rate13%
- Total Advisory Fees Paid$15,997
|
|
| Holdings [Text Block] |
Table Summary
States |
% |
Illinois |
11.4% |
New York |
11.2% |
Washington |
8.7% |
Pennsylvania |
8.3% |
Texas |
5.8% |
Michigan |
5.2% |
Virginia |
4.9% |
Iowa |
3.8% |
Oklahoma |
3.6% |
District of Columbia |
3.4% | |
|
| Largest Holdings [Text Block] |
Table Summary
Holdings |
% |
Franklin County School District No. 1 Pasco, General Obligation, WA, 5.00%, due 12/01/29 |
4.9% |
Triborough Bridge & Tunnel Authority Revenue, NY, 5.00%, due 11/15/33 |
4.7% |
Hancock Public Schools, General Obligation, MI, 5.00%, due 05/01/27 |
4.5% |
State of Connecticut Special Tax Revenue, CT, 5.00%, due 09/01/27 |
3.1% |
Green Bay Area Public School District, General Obligation, WI, 5.00%, due 04/01/27 |
2.9% |
Village of Elk Grove Village, General Obligation, IL, 5.00%, due 01/01/36 |
2.8% |
County of Clark, General Obligation, NV, 5.00%, due 11/01/27 |
2.7% |
King County School District No. 403 Renton, General Obligation, WA, 5.00%, due 12/01/27 |
2.7% |
City of El Paso, General Obligation, TX, 5.00%, due 08/15/27 |
2.7% |
North Carolina Turnpike Authority Revenue, NC, 5.00%, due 01/01/32 |
2.6% | |
|
| Material Fund Change [Text Block] |
This is a summary of certain changes of the Fund that occurred during the reporting period ended August 31, 2026. For more information contact 1-866-787-2257 (toll free) or refer to the Prospectus, which can be found on the Fund's website below. Effective December 30, 2025 (the “Effective Date”), the Fund changed its name from the SPDR® SSGA My2027 Municipal Bond ETF to the State Street® My2027 Municipal Bond ETF. These changes did not result in any changes to the Funds’ Investment Objectives, Principal Investment Strategies, or Principal Risks of Investing in the Funds. |
|
| Material Fund Change Name [Text Block] |
Effective December 30, 2025 (the “Effective Date”), the Fund changed its name from the SPDR® SSGA My2027 Municipal Bond ETF to the State Street® My2027 Municipal Bond ETF. These changes did not result in any changes to the Funds’ Investment Objectives, Principal Investment Strategies, or Principal Risks of Investing in the Funds.
|
|
| Summary of Change Legend [Text Block] |
This is a summary of certain changes of the Fund that occurred during the reporting period ended August 31, 2026. For more information contact 1-866-787-2257 (toll free) or refer to the Prospectus, which can be found on the Fund's website below.
|
|
| C000253973 |
|
|
| Shareholder Report [Line Items] |
|
|
| Fund Name |
State Street<sup style="inset: 1.5px 0px 4px; box-sizing: border-box; color: rgb(0, 0, 0); display: inline; flex-wrap: nowrap; font-size: 16px; font-weight: 700; grid-area: auto; line-height: 0px; margin: 0px; overflow: visible; position: relative; text-align: left; text-align-last: auto; white-space-collapse: preserve-breaks;">®</sup> My2028 Municipal Bond ETF
|
|
| Trading Symbol |
MYMH
|
|
| Security Exchange Name |
NASDAQ
|
|
| Annual or Semi-Annual Statement [Text Block] |
This annual shareholder report contains important information about the State Street® My2028 Municipal Bond ETF (the "Fund") for the period of September 1, 2025 through August 31, 2026.
|
|
| Additional Information [Text Block] |
You can find additional information about the Fund, including the Prospectus, Statement of Additional Information, financial statements and other information at www.ssga.com/us/en/institutional/fund-finder?tab=documents&type=etfs. You can also request this information about the Fund by contacting us at 1-866-787-2257.
|
|
| Material Fund Change Notice [Text Block] |
This report describes changes to the Fund that occurred during the reporting period.
|
|
| Additional Information Phone Number |
1-866-787-2257
|
|
| Additional Information Website |
www.ssga.com/us/en/institutional/fund-finder?tab=documents&type=etfs
|
|
| Expenses [Text Block] |
What were the Fund costs for the last year? (based on a hypothetical $10,000 Investment)
Table Summary
Fund Name |
Costs of a $10,000 investment |
Costs paid as a percentage of a $10,000 investment |
State Street® My2028 Municipal Bond ETF |
$24 |
0.24% | |
|
| Expenses Paid, Amount |
$ 24
|
|
| Expense Ratio, Percent |
0.24%
|
|
| Factors Affecting Performance [Text Block] |
How did the Fund perform last year and what affected its performance?The municipal market is having a moment in the fixed income sun. We attribute the performance to an increased appetite for bonds, as well as the high after-tax yield that Munis boast compared to alternatives. That’s helped to absorb a wave of issuance from state and local governments, which have sold around $415 billion of bonds (through the end of the August) the most in at least a decade. Those high rates are generating their own demand. The benefits are especially enticing to high-net-worth individuals, who may be eager to shelter record equity earnings from volatility and to prepare for higher income taxes. No one predicted the sectors outperformance especially when you consider the 2026 challenges, (Military conflict, over 50bps increase in Treasuries, elevated inflation, a shift in the U.S. Federal Reserve's outlook combined with record supply). The asset class' high relative value and tax-equivalent yield alongside the fact that the sector was not overly valued like other fixed income sectors has helped. |
|
| Performance Past Does Not Indicate Future [Text] |
The Fund’s past performance is not necessarily an indication of how the Fund will perform in the future. The returns do not reflect the deduction of taxes that a shareholder would pay on Fund distributions or on the redemption or sale of Fund shares.
|
|
| Line Graph [Table Text Block] |
Table Summary
|
MYMH |
Bloomberg U.S. Municipal Bond Index |
ICE 2028 Maturity U.S. Broad Municipal Index |
09/23/24 |
$10,000 |
$10,000 |
$10,000 |
09/30/24 |
$10,019 |
$10,009 |
$10,016 |
10/31/24 |
$9,885 |
$9,863 |
$9,925 |
11/30/24 |
$9,985 |
$10,034 |
$10,012 |
12/31/24 |
$9,914 |
$9,888 |
$9,942 |
01/31/25 |
$9,950 |
$9,937 |
$9,985 |
02/28/25 |
$10,014 |
$10,036 |
$10,061 |
03/31/25 |
$9,943 |
$9,866 |
$9,994 |
04/30/25 |
$9,904 |
$9,786 |
$9,955 |
05/31/25 |
$9,919 |
$9,793 |
$10,008 |
06/30/25 |
$9,981 |
$9,854 |
$10,081 |
07/31/25 |
$9,989 |
$9,834 |
$10,130 |
08/31/25 |
$10,044 |
$9,919 |
$10,199 |
09/30/25 |
$10,135 |
$10,149 |
$10,258 |
10/31/25 |
$10,175 |
$10,275 |
$10,282 |
11/30/25 |
$10,203 |
$10,298 |
$10,309 |
12/31/25 |
$10,233 |
$10,308 |
$10,343 |
01/31/26 |
$10,285 |
$10,404 |
$10,413 |
02/28/26 |
$10,350 |
$10,534 |
$10,480 |
03/31/26 |
$10,282 |
$10,289 |
$10,387 |
04/30/26 |
$10,317 |
$10,407 |
$10,425 |
05/31/26 |
$10,340 |
$10,446 |
$10,448 |
06/30/26 |
$10,378 |
$10,547 |
$10,491 |
07/31/26 |
$10,359 |
$10,351 |
$10,457 |
08/31/26 |
$10,388 |
$10,328 |
$10,492 |
|
|
| Average Annual Return [Table Text Block] |
Average Annual Total Returns (%)
Table Summary
Name |
1 Year |
Since Inception 09/23/24 |
MYMH |
3.42% |
1.98% |
Bloomberg U.S. Municipal Bond Index |
4.12% |
1.68% |
ICE 2028 Maturity U.S. Broad Municipal Index |
2.87% |
2.51% | The Fund’s past performance is not necessarily an indication of how the Fund will perform in the future. The returns do not reflect the deduction of taxes that a shareholder would pay on Fund distributions or on the redemption or sale of Fund shares. Updated performance information is available by calling 1-866-787-2257 or visiting our website at www.ssga.com. |
|
| Performance Inception Date |
Sep. 23, 2024
|
|
| Material Change Date |
Aug. 31, 2026
|
|
| Updated Performance Information Location [Text Block] |
Updated performance information is available by calling 1-866-787-2257 or visiting our website at www.ssga.com.
|
|
| AssetsNet |
$ 7,374,524
|
|
| Holdings Count | Holding |
68
|
|
| Advisory Fees Paid, Amount |
$ 14,230
|
|
| InvestmentCompanyPortfolioTurnover |
8.00%
|
|
| Additional Fund Statistics [Text Block] |
Key Fund Statistics as of 8/31/2026- Total Net Assets$7,374,524
- Number of Portfolio Holdings68
- Portfolio Turnover Rate8%
- Total Advisory Fees Paid$14,230
|
|
| Holdings [Text Block] |
Table Summary
States |
% |
Texas |
10.6% |
New York |
10.1% |
West Virginia |
7.5% |
Michigan |
7.1% |
Pennsylvania |
6.2% |
Illinois |
5.8% |
Florida |
5.6% |
Georgia |
4.5% |
Washington |
4.0% |
Kentucky |
3.7% | |
|
| Largest Holdings [Text Block] |
Table Summary
Holdings |
% |
West Virginia Commissioner of Highways Revenue, WV, 5.00%, due 09/01/28 |
6.7% |
Empire State Development Corp. Revenue, NY, 5.00%, due 03/15/33 |
4.1% |
New York City Transitional Finance Authority Building Aid Revenue, NY, 5.00%, due 07/15/34 |
3.9% |
Kentucky State Property & Building Commission Revenue, KY, 5.00%, due 11/01/28 |
3.7% |
State of Connecticut, General Obligation, CT, 5.00%, due 03/15/28 |
3.2% |
Albuquerque Municipal School District No. 12, General Obligation, NM, 5.00%, due 08/01/28 |
3.1% |
Texas Water Development Board Revenue, TX, 5.00%, due 04/15/49 |
3.1% |
Municipal Electric Authority of Georgia Revenue, GA, 5.00%, due 01/01/28 |
3.1% |
City of Columbus, General Obligation, OH, 5.00%, due 04/01/28 |
2.8% |
Lower Colorado River Authority Revenue, TX, 5.00%, due 05/15/48 |
2.8% | |
|
| Material Fund Change [Text Block] |
This is a summary of certain changes of the Fund that occurred during the reporting period ended August 31, 2026. For more information contact 1-866-787-2257 (toll free) or refer to the Prospectus, which can be found on the Fund's website below. Effective December 30, 2025 (the “Effective Date”), the Fund changed its name from the SPDR® SSGA My2028 Municipal Bond ETF to the State Street® My2028 Municipal Bond ETF. These changes did not result in any changes to the Funds’ Investment Objectives, Principal Investment Strategies, or Principal Risks of Investing in the Funds. |
|
| Material Fund Change Name [Text Block] |
Effective December 30, 2025 (the “Effective Date”), the Fund changed its name from the SPDR® SSGA My2028 Municipal Bond ETF to the State Street® My2028 Municipal Bond ETF. These changes did not result in any changes to the Funds’ Investment Objectives, Principal Investment Strategies, or Principal Risks of Investing in the Funds.
|
|
| Summary of Change Legend [Text Block] |
This is a summary of certain changes of the Fund that occurred during the reporting period ended August 31, 2026. For more information contact 1-866-787-2257 (toll free) or refer to the Prospectus, which can be found on the Fund's website below.
|
|
| C000253974 |
|
|
| Shareholder Report [Line Items] |
|
|
| Fund Name |
State Street<sup style="inset: 1.5px 0px 4px; box-sizing: border-box; color: rgb(0, 0, 0); display: inline; flex-wrap: nowrap; font-size: 16px; font-weight: 700; grid-area: auto; line-height: 0px; margin: 0px; overflow: visible; position: relative; text-align: left; text-align-last: auto; white-space-collapse: preserve-breaks;">®</sup> My2029 Municipal Bond ETF
|
|
| Trading Symbol |
MYMI
|
|
| Security Exchange Name |
NASDAQ
|
|
| Annual or Semi-Annual Statement [Text Block] |
This annual shareholder report contains important information about the State Street® My2029 Municipal Bond ETF (the "Fund") for the period of September 1, 2025 through August 31, 2026.
|
|
| Additional Information [Text Block] |
You can find additional information about the Fund, including the Prospectus, Statement of Additional Information, financial statements and other information at www.ssga.com/us/en/institutional/fund-finder?tab=documents&type=etfs. You can also request this information about the Fund by contacting us at 1-866-787-2257.
|
|
| Material Fund Change Notice [Text Block] |
This report describes changes to the Fund that occurred during the reporting period.
|
|
| Additional Information Phone Number |
1-866-787-2257
|
|
| Additional Information Website |
www.ssga.com/us/en/institutional/fund-finder?tab=documents&type=etfs
|
|
| Expenses [Text Block] |
What were the Fund costs for the last year? (based on a hypothetical $10,000 Investment)
Table Summary
Fund Name |
Costs of a $10,000 investment |
Costs paid as a percentage of a $10,000 investment |
State Street® My2029 Municipal Bond ETF |
$22 |
0.22% | |
|
| Expenses Paid, Amount |
$ 22
|
|
| Expense Ratio, Percent |
0.22%
|
|
| Factors Affecting Performance [Text Block] |
How did the Fund perform last year and what affected its performance?The municipal market is having a moment in the fixed income sun. We attribute the performance to an increased appetite for bonds, as well as the high after-tax yield that Munis boast compared to alternatives. That’s helped to absorb a wave of issuance from state and local governments, which have sold around $415 billion of bonds (through the end of the August) the most in at least a decade. Those high rates are generating their own demand. The benefits are especially enticing to high-net-worth individuals, who may be eager to shelter record equity earnings from volatility and to prepare for higher income taxes. No one predicted the sectors outperformance especially when you consider the 2026 challenges, (Military conflict, over 50bps increase in Treasuries, elevated inflation, a shift in the U.S. Federal Reserve's outlook combined with record supply). The asset class' high relative value and tax-equivalent yield alongside the fact that the sector was not overly valued like other fixed income sectors has helped. |
|
| Performance Past Does Not Indicate Future [Text] |
The Fund’s past performance is not necessarily an indication of how the Fund will perform in the future. The returns do not reflect the deduction of taxes that a shareholder would pay on Fund distributions or on the redemption or sale of Fund shares.
|
|
| Line Graph [Table Text Block] |
Table Summary
|
MYMI |
Bloomberg U.S. Municipal Bond Index |
ICE 2029 Maturity U.S. Broad Municipal Index |
09/23/24 |
$10,000 |
$10,000 |
$10,000 |
09/30/24 |
$9,992 |
$10,009 |
$10,014 |
10/31/24 |
$9,873 |
$9,863 |
$9,892 |
11/30/24 |
$10,015 |
$10,034 |
$9,993 |
12/31/24 |
$9,920 |
$9,888 |
$9,903 |
01/31/25 |
$9,939 |
$9,937 |
$9,941 |
02/28/25 |
$10,011 |
$10,036 |
$10,031 |
03/31/25 |
$9,921 |
$9,866 |
$9,937 |
04/30/25 |
$9,882 |
$9,786 |
$9,892 |
05/31/25 |
$9,905 |
$9,793 |
$9,946 |
06/30/25 |
$9,980 |
$9,854 |
$10,034 |
07/31/25 |
$9,998 |
$9,834 |
$10,088 |
08/31/25 |
$10,064 |
$9,919 |
$10,167 |
09/30/25 |
$10,154 |
$10,149 |
$10,246 |
10/31/25 |
$10,190 |
$10,275 |
$10,273 |
11/30/25 |
$10,218 |
$10,298 |
$10,296 |
12/31/25 |
$10,252 |
$10,308 |
$10,331 |
01/31/26 |
$10,325 |
$10,404 |
$10,414 |
02/28/26 |
$10,390 |
$10,534 |
$10,495 |
03/31/26 |
$10,276 |
$10,289 |
$10,347 |
04/30/26 |
$10,326 |
$10,407 |
$10,397 |
05/31/26 |
$10,350 |
$10,446 |
$10,419 |
06/30/26 |
$10,391 |
$10,547 |
$10,458 |
07/31/26 |
$10,336 |
$10,351 |
$10,403 |
08/31/26 |
$10,367 |
$10,328 |
$10,440 |
|
|
| Average Annual Return [Table Text Block] |
Average Annual Total Returns (%)
Table Summary
Name |
1 Year |
Since Inception 09/23/24 |
MYMI |
3.01% |
1.88% |
Bloomberg U.S. Municipal Bond Index |
4.12% |
1.68% |
ICE 2029 Maturity U.S. Broad Municipal Index |
2.69% |
2.25% | The Fund’s past performance is not necessarily an indication of how the Fund will perform in the future. The returns do not reflect the deduction of taxes that a shareholder would pay on Fund distributions or on the redemption or sale of Fund shares. Updated performance information is available by calling 1-866-787-2257 or visiting our website at www.ssga.com. |
|
| Performance Inception Date |
Sep. 23, 2024
|
|
| Material Change Date |
Aug. 31, 2026
|
|
| Updated Performance Information Location [Text Block] |
Updated performance information is available by calling 1-866-787-2257 or visiting our website at www.ssga.com.
|
|
| AssetsNet |
$ 14,709,510
|
|
| Holdings Count | Holding |
112
|
|
| Advisory Fees Paid, Amount |
$ 26,274
|
|
| InvestmentCompanyPortfolioTurnover |
19.00%
|
|
| Additional Fund Statistics [Text Block] |
Key Fund Statistics as of 8/31/2026- Total Net Assets$14,709,510
- Number of Portfolio Holdings112
- Portfolio Turnover Rate19%
- Total Advisory Fees Paid$26,274
|
|
| Holdings [Text Block] |
Table Summary
States |
% |
Texas |
9.9% |
Illinois |
7.5% |
Washington |
6.8% |
Florida |
6.4% |
New York |
6.0% |
Pennsylvania |
5.6% |
Oregon |
4.5% |
Nevada |
4.3% |
Delaware |
3.6% |
Kentucky |
3.4% | |
|
| Largest Holdings [Text Block] |
Table Summary
Holdings |
% |
State of Wisconsin, General Obligation, WI, 5.00%, due 05/01/29 |
3.1% |
Alabama Public School & College Authority Revenue, AL, 5.00%, due 11/01/29 |
2.2% |
City of Eugene Water Utility System Revenue, OR, 5.00%, due 08/01/29 |
2.2% |
State of Iowa Board of Regents Revenue, IA, 5.00%, due 09/01/29 |
2.2% |
Oregon State Lottery Revenue, OR, 5.00%, due 04/01/29 |
2.2% |
Aubrey Independent School District, General Obligation, TX, 5.00%, due 02/15/29 |
2.1% |
State of Delaware, General Obligation, DE, 5.00%, due 02/01/32 |
2.1% |
Weld County School District No. 6 Greeley, General Obligation, CO, 5.00%, due 12/01/32 |
2.1% |
New York City Municipal Water Finance Authority Revenue, NY, 5.00%, due 06/15/40 |
2.1% |
Clark County School District, General Obligation, NV, 5.00%, due 06/15/29 |
2.1% | |
|
| Material Fund Change [Text Block] |
This is a summary of certain changes of the Fund that occurred during the reporting period ended August 31, 2026. For more information contact 1-866-787-2257 (toll free) or refer to the Prospectus, which can be found on the Fund's website below. Effective December 30, 2025 (the “Effective Date”), the Fund changed its name from the SPDR® SSGA My2029 Municipal Bond ETF to the State Street® My2029 Municipal Bond ETF. These changes did not result in any changes to the Funds’ Investment Objectives, Principal Investment Strategies, or Principal Risks of Investing in the Funds. |
|
| Material Fund Change Name [Text Block] |
Effective December 30, 2025 (the “Effective Date”), the Fund changed its name from the SPDR® SSGA My2029 Municipal Bond ETF to the State Street® My2029 Municipal Bond ETF. These changes did not result in any changes to the Funds’ Investment Objectives, Principal Investment Strategies, or Principal Risks of Investing in the Funds.
|
|
| Summary of Change Legend [Text Block] |
This is a summary of certain changes of the Fund that occurred during the reporting period ended August 31, 2026. For more information contact 1-866-787-2257 (toll free) or refer to the Prospectus, which can be found on the Fund's website below.
|
|
| C000253975 |
|
|
| Shareholder Report [Line Items] |
|
|
| Fund Name |
State Street<sup style="inset: 1.5px 0px 4px; box-sizing: border-box; color: rgb(0, 0, 0); display: inline; flex-wrap: nowrap; font-size: 16px; font-weight: 700; grid-area: auto; line-height: 0px; margin: 0px; overflow: visible; position: relative; text-align: left; text-align-last: auto; white-space-collapse: preserve-breaks;">®</sup> My2030 Municipal Bond ETF
|
|
| Trading Symbol |
MYMJ
|
|
| Security Exchange Name |
NASDAQ
|
|
| Annual or Semi-Annual Statement [Text Block] |
This annual shareholder report contains important information about the State Street® My2030 Municipal Bond ETF (the "Fund") for the period of September 1, 2025 through August 31, 2026.
|
|
| Additional Information [Text Block] |
You can find additional information about the Fund, including the Prospectus, Statement of Additional Information, financial statements and other information at www.ssga.com/us/en/institutional/fund-finder?tab=documents&type=etfs. You can also request this information about the Fund by contacting us at 1-866-787-2257.
|
|
| Material Fund Change Notice [Text Block] |
This report describes changes to the Fund that occurred during the reporting period.
|
|
| Additional Information Phone Number |
1-866-787-2257
|
|
| Additional Information Website |
www.ssga.com/us/en/institutional/fund-finder?tab=documents&type=etfs
|
|
| Expenses [Text Block] |
What were the Fund costs for the last year? (based on a hypothetical $10,000 Investment)
Table Summary
Fund Name |
Costs of a $10,000 investment |
Costs paid as a percentage of a $10,000 investment |
State Street® My2030 Municipal Bond ETF |
$22 |
0.22% | |
|
| Expenses Paid, Amount |
$ 22
|
|
| Expense Ratio, Percent |
0.22%
|
|
| Factors Affecting Performance [Text Block] |
How did the Fund perform last year and what affected its performance?The municipal market is having a moment in the fixed income sun. We attribute the performance to an increased appetite for bonds, as well as the high after-tax yield that Munis boast compared to alternatives. That’s helped to absorb a wave of issuance from state and local governments, which have sold around $415 billion of bonds (through the end of the August) the most in at least a decade. Those high rates are generating their own demand. The benefits are especially enticing to high-net-worth individuals, who may be eager to shelter record equity earnings from volatility and to prepare for higher income taxes. No one predicted the sectors outperformance especially when you consider the 2026 challenges, (Military conflict, over 50bps increase in Treasuries, elevated inflation, a shift in the U.S. Federal Reserve's outlook combined with record supply). The asset class' high relative value and tax-equivalent yield alongside the fact that the sector was not overly valued like other fixed income sectors has helped. |
|
| Performance Past Does Not Indicate Future [Text] |
The Fund’s past performance is not necessarily an indication of how the Fund will perform in the future. The returns do not reflect the deduction of taxes that a shareholder would pay on Fund distributions or on the redemption or sale of Fund shares.
|
|
| Line Graph [Table Text Block] |
Table Summary
|
MYMJ |
Bloomberg U.S. Municipal Bond Index |
ICE 2030 Maturity U.S. Broad Municipal Index |
09/23/24 |
$10,000 |
$10,000 |
$10,000 |
09/30/24 |
$10,010 |
$10,009 |
$10,013 |
10/31/24 |
$9,872 |
$9,863 |
$9,877 |
11/30/24 |
$10,020 |
$10,034 |
$10,000 |
12/31/24 |
$9,928 |
$9,888 |
$9,889 |
01/31/25 |
$9,977 |
$9,937 |
$9,933 |
02/28/25 |
$10,048 |
$10,036 |
$10,026 |
03/31/25 |
$9,932 |
$9,866 |
$9,895 |
04/30/25 |
$9,882 |
$9,786 |
$9,850 |
05/31/25 |
$9,912 |
$9,793 |
$9,904 |
06/30/25 |
$9,994 |
$9,854 |
$9,999 |
07/31/25 |
$10,004 |
$9,834 |
$10,042 |
08/31/25 |
$10,065 |
$9,919 |
$10,132 |
09/30/25 |
$10,194 |
$10,149 |
$10,245 |
10/31/25 |
$10,260 |
$10,275 |
$10,286 |
11/30/25 |
$10,293 |
$10,298 |
$10,310 |
12/31/25 |
$10,323 |
$10,308 |
$10,340 |
01/31/26 |
$10,399 |
$10,404 |
$10,434 |
02/28/26 |
$10,471 |
$10,534 |
$10,529 |
03/31/26 |
$10,331 |
$10,289 |
$10,325 |
04/30/26 |
$10,390 |
$10,407 |
$10,390 |
05/31/26 |
$10,413 |
$10,446 |
$10,414 |
06/30/26 |
$10,451 |
$10,547 |
$10,453 |
07/31/26 |
$10,382 |
$10,351 |
$10,367 |
08/31/26 |
$10,404 |
$10,328 |
$10,401 |
|
|
| Average Annual Return [Table Text Block] |
Average Annual Total Returns (%)
Table Summary
Name |
1 Year |
Since Inception 09/23/24 |
MYMJ |
3.37% |
2.07% |
Bloomberg U.S. Municipal Bond Index |
4.12% |
1.68% |
ICE 2030 Maturity U.S. Broad Municipal Index |
2.66% |
2.05% | The Fund’s past performance is not necessarily an indication of how the Fund will perform in the future. The returns do not reflect the deduction of taxes that a shareholder would pay on Fund distributions or on the redemption or sale of Fund shares. Updated performance information is available by calling 1-866-787-2257 or visiting our website at www.ssga.com. |
|
| Performance Inception Date |
Sep. 23, 2024
|
|
| Material Change Date |
Aug. 31, 2026
|
|
| Updated Performance Information Location [Text Block] |
Updated performance information is available by calling 1-866-787-2257 or visiting our website at www.ssga.com.
|
|
| AssetsNet |
$ 12,295,316
|
|
| Holdings Count | Holding |
95
|
|
| Advisory Fees Paid, Amount |
$ 22,519
|
|
| InvestmentCompanyPortfolioTurnover |
12.00%
|
|
| Additional Fund Statistics [Text Block] |
Key Fund Statistics as of 8/31/2026- Total Net Assets$12,295,316
- Number of Portfolio Holdings95
- Portfolio Turnover Rate12%
- Total Advisory Fees Paid$22,519
|
|
| Holdings [Text Block] |
Table Summary
States |
% |
Texas |
10.8% |
New York |
9.8% |
Washington |
6.7% |
Pennsylvania |
5.6% |
Illinois |
5.1% |
Connecticut |
5.1% |
Alabama |
4.3% |
Minnesota |
3.9% |
California |
3.8% |
Colorado |
3.7% | |
|
| Largest Holdings [Text Block] |
Table Summary
Holdings |
% |
Los Angeles Department of Water & Power Revenue, CA, 5.00%, due 07/01/30 |
3.8% |
City of New York, General Obligation, NY, 5.00%, due 08/01/30 |
2.6% |
New York Transportation Development Corp. Revenue, NY, 5.00%, due 12/01/37 |
2.5% |
Alabama Public School & College Authority Revenue, AL, 5.00%, due 11/01/34 |
2.5% |
City of Dallas, General Obligation, TX, 5.00%, due 02/15/30 |
2.4% |
New Jersey Transportation Trust Fund Authority Revenue, NJ, 5.00%, due 06/15/30 |
2.3% |
Empire State Development Corp. Revenue, NY, 5.00%, due 03/15/38 |
2.3% |
City of Chicago Waterworks Revenue, IL, 5.00%, due 11/01/30 |
2.2% |
State of Connecticut Special Tax Revenue, CT, 5.00%, due 05/01/37 |
2.2% |
Ohio Water Development Authority Water Pollution Control Loan Fund Revenue, OH, 5.00%, due 06/01/33 |
2.2% | |
|
| Material Fund Change [Text Block] |
This is a summary of certain changes of the Fund that occurred during the reporting period ended August 31, 2026. For more information contact 1-866-787-2257 (toll free) or refer to the Prospectus, which can be found on the Fund's website below. Effective December 30, 2025 (the “Effective Date”), the Fund changed its name from the SPDR® SSGA My2030 Municipal Bond ETF to the State Street® My2030 Municipal Bond ETF. These changes did not result in any changes to the Funds’ Investment Objectives, Principal Investment Strategies, or Principal Risks of Investing in the Funds. |
|
| Material Fund Change Name [Text Block] |
Effective December 30, 2025 (the “Effective Date”), the Fund changed its name from the SPDR® SSGA My2030 Municipal Bond ETF to the State Street® My2030 Municipal Bond ETF. These changes did not result in any changes to the Funds’ Investment Objectives, Principal Investment Strategies, or Principal Risks of Investing in the Funds.
|
|
| Summary of Change Legend [Text Block] |
This is a summary of certain changes of the Fund that occurred during the reporting period ended August 31, 2026. For more information contact 1-866-787-2257 (toll free) or refer to the Prospectus, which can be found on the Fund's website below.
|
|
| C000263199 |
|
|
| Shareholder Report [Line Items] |
|
|
| Fund Name |
State Street<sup style="inset: 1.5px 0px 4px; box-sizing: border-box; color: rgb(0, 0, 0); display: inline; flex-wrap: nowrap; font-size: 16px; font-weight: 700; grid-area: auto; line-height: 0px; margin: 0px; overflow: visible; position: relative; text-align: left; text-align-last: auto; white-space-collapse: preserve-breaks;">®</sup> My2035 Corporate Bond ETF
|
|
| Trading Symbol |
MYCO
|
|
| Security Exchange Name |
NASDAQ
|
|
| Annual or Semi-Annual Statement [Text Block] |
This annual shareholder report contains important information about the State Street® My2035 Corporate Bond ETF (the "Fund") for the period of September 17, 2025 (commencement of operations) through August 31, 2026.
|
|
| Additional Information [Text Block] |
You can find additional information about the Fund, including the Prospectus, Statement of Additional Information, financial statements and other information at www.ssga.com/us/en/institutional/fund-finder?tab=documents&type=etfs. You can also request this information about the Fund by contacting us at 1-866-787-2257.
|
|
| Material Fund Change Notice [Text Block] |
This report describes changes to the Fund that occurred during the reporting period.
|
|
| Additional Information Phone Number |
1-866-787-2257
|
|
| Additional Information Website |
www.ssga.com/us/en/institutional/fund-finder?tab=documents&type=etfs
|
|
| Expenses [Text Block] |
What were the Fund costs for the last year? (based on a hypothetical $10,000 Investment)
Table Summary
Fund Name |
Costs of a $10,000 investment |
Costs paid as a percentage of a $10,000 investment |
State Street® My2035 Corporate Bond ETF |
$19 |
0.20%Footnote Reference* |
| Footnote |
Description |
Footnote* |
Annualized. | The dollar amount above reflects expenses paid since the commencement of operations. Expenses for the full reporting period would be higher. |
|
| Expenses Paid, Amount |
$ 19
|
|
| Expense Ratio, Percent |
0.20%
|
[1] |
| Expenses Short Period Footnote [Text Block] |
The dollar amount above reflects expenses paid since the commencement of operations. Expenses for the full reporting period would be higher.
|
|
| Factors Affecting Performance [Text Block] |
How did the Fund perform last year and what affected its performance?For the 11-month reporting period ended August 31, 2026, the U.S. investment grade corporate bond market has been characterized by historically tight credit spreads and strong demand despite very heavy levels of new issuance and increasingly volatile U.S. Treasury rates. Given rich valuations, we have maintained a modest risk positioning versus the benchmark. Performance was driven by security selection in the Technology, Banking, and Electric Utilities sectors. |
|
| Performance Past Does Not Indicate Future [Text] |
The Fund’s past performance is not necessarily an indication of how the Fund will perform in the future. The returns do not reflect the deduction of taxes that a shareholder would pay on Fund distributions or on the redemption or sale of Fund shares.
|
|
| Line Graph [Table Text Block] |
Table Summary
|
MYCO |
Bloomberg U.S. Aggregate Bond Index |
ICE 2035 Maturity US Corporate Index |
09/16/25 |
$10,000 |
$10,000 |
$10,000 |
09/30/25 |
$9,937 |
$9,949 |
$9,930 |
10/31/25 |
$9,978 |
$10,011 |
$9,978 |
11/30/25 |
$10,085 |
$10,073 |
$10,079 |
12/31/25 |
$10,061 |
$10,059 |
$10,045 |
01/31/26 |
$10,073 |
$10,069 |
$10,062 |
02/28/26 |
$10,236 |
$10,234 |
$10,229 |
03/31/26 |
$10,009 |
$10,054 |
$10,000 |
04/30/26 |
$10,053 |
$10,065 |
$10,053 |
05/31/26 |
$10,112 |
$10,096 |
$10,115 |
06/30/26 |
$10,126 |
$10,121 |
$10,122 |
07/31/26 |
$9,959 |
$9,989 |
$9,953 |
08/31/26 |
$9,979 |
$10,028 |
$9,976 |
|
|
| Average Annual Return [Table Text Block] |
Average Annual Total Returns (%)
Table Summary
Name |
Since Inception 09/16/25 |
MYCO |
(0.21%)Footnote Reference* |
Bloomberg U.S. Aggregate Bond Index |
0.28% |
ICE 2035 Maturity US Corporate Index |
(0.24%) |
| Footnote |
Description |
Footnote* |
Returns are not annualized. | The Fund’s past performance is not necessarily an indication of how the Fund will perform in the future. The returns do not reflect the deduction of taxes that a shareholder would pay on Fund distributions or on the redemption or sale of Fund shares. Updated performance information is available by calling 1-866-787-2257 or visiting our website at www.ssga.com. |
|
| Performance Inception Date |
Sep. 16, 2025
|
|
| Material Change Date |
Aug. 31, 2026
|
|
| Updated Performance Information Location [Text Block] |
Updated performance information is available by calling 1-866-787-2257 or visiting our website at www.ssga.com.
|
|
| AssetsNet |
$ 7,179,766
|
|
| Holdings Count | Holding |
96
|
|
| Advisory Fees Paid, Amount |
$ 8,138
|
|
| InvestmentCompanyPortfolioTurnover |
19.00%
|
|
| Additional Fund Statistics [Text Block] |
Key Fund Statistics as of 8/31/2026- Total Net Assets$7,179,766
- Number of Portfolio Holdings96
- Portfolio Turnover Rate19%
- Total Advisory Fees Paid$8,138
|
|
| Holdings [Text Block] |
Table Summary
Industries |
% |
Electric |
14.1% |
Pharmaceuticals |
6.1% |
Aerospace & Defense |
4.6% |
Semiconductors |
4.5% |
Food |
4.4% |
Software |
4.3% |
Pipelines |
4.2% |
Real Estate Investment Trusts |
3.8% |
IT Services |
3.7% |
Banks |
3.5% | |
|
| Largest Holdings [Text Block] |
Table Summary
Holdings |
% |
AbbVie, Inc., 4.50%, due 05/14/35 |
2.5% |
JBS NV/JBS USA Foods Group Holdings, Inc./JBS USA Food Co. Holdings, 5.95%, due 04/20/35 |
2.5% |
Pacific Gas & Electric Co., 6.00%, due 08/15/35 |
2.4% |
Georgia Power Co., 5.20%, due 03/15/35 |
2.4% |
AT&T, Inc., 5.38%, due 08/15/35 |
2.4% |
J.M. Smucker Co., 4.25%, due 03/15/35 |
1.9% |
Charter Communications Operating LLC/Charter Communications Operating Capital, 6.38%, due 10/23/35 |
1.8% |
RTX Corp., 5.40%, due 05/01/35 |
1.8% |
Glencore Funding LLC, 5.67%, due 04/01/35 |
1.7% |
AEP Transmission Co. LLC, 5.38%, due 06/15/35 |
1.7% | |
|
| Material Fund Change [Text Block] |
This is a summary of certain changes of the Fund that occurred during the reporting period ended August 31, 2026. For more information contact 1-866-787-2257 (toll free) or refer to the Prospectus, which can be found on the Fund's website below. Effective December 30, 2025 (the “Effective Date”), the Fund changed its name from the SPDR® SSGA My2035 Corporate Bond ETF to the State Street® My2035 Corporate Bond ETF. These changes did not result in any changes to the Funds’ Investment Objectives, Principal Investment Strategies, or Principal Risks of Investing in the Funds. |
|
| Material Fund Change Name [Text Block] |
Effective December 30, 2025 (the “Effective Date”), the Fund changed its name from the SPDR® SSGA My2035 Corporate Bond ETF to the State Street® My2035 Corporate Bond ETF. These changes did not result in any changes to the Funds’ Investment Objectives, Principal Investment Strategies, or Principal Risks of Investing in the Funds.
|
|
| Summary of Change Legend [Text Block] |
This is a summary of certain changes of the Fund that occurred during the reporting period ended August 31, 2026. For more information contact 1-866-787-2257 (toll free) or refer to the Prospectus, which can be found on the Fund's website below.
|
|
| C000263200 |
|
|
| Shareholder Report [Line Items] |
|
|
| Fund Name |
State Street<sup style="inset: 1.5px 0px 4px; box-sizing: border-box; color: rgb(0, 0, 0); display: inline; flex-wrap: nowrap; font-size: 16px; font-weight: 700; grid-area: auto; line-height: 0px; margin: 0px; overflow: visible; position: relative; text-align: left; text-align-last: auto; white-space-collapse: preserve-breaks;">®</sup> My2031 Municipal Bond ETF
|
|
| Trading Symbol |
MYMK
|
|
| Security Exchange Name |
NASDAQ
|
|
| Annual or Semi-Annual Statement [Text Block] |
This annual shareholder report contains important information about the State Street® My2031 Municipal Bond ETF (the "Fund") for the period of September 17, 2025 (commencement of operations) through August 31, 2026.
|
|
| Additional Information [Text Block] |
You can find additional information about the Fund, including the Prospectus, Statement of Additional Information, financial statements and other information at www.ssga.com/us/en/institutional/fund-finder?tab=documents&type=etfs. You can also request this information about the Fund by contacting us at 1-866-787-2257.
|
|
| Material Fund Change Notice [Text Block] |
This report describes changes to the Fund that occurred during the reporting period.
|
|
| Additional Information Phone Number |
1-866-787-2257
|
|
| Additional Information Website |
www.ssga.com/us/en/institutional/fund-finder?tab=documents&type=etfs
|
|
| Expenses [Text Block] |
What were the Fund costs for the last year? (based on a hypothetical $10,000 Investment)
Table Summary
Fund Name |
Costs of a $10,000 investment |
Costs paid as a percentage of a $10,000 investment |
State Street® My2031 Municipal Bond ETF |
$22 |
0.23%Footnote Reference* |
| Footnote |
Description |
Footnote* |
Annualized. | The dollar amount above reflects expenses paid since the commencement of operations. Expenses for the full reporting period would be higher. |
|
| Expenses Paid, Amount |
$ 22
|
|
| Expense Ratio, Percent |
0.23%
|
[2] |
| Expenses Short Period Footnote [Text Block] |
The dollar amount above reflects expenses paid since the commencement of operations. Expenses for the full reporting period would be higher.
|
|
| Factors Affecting Performance [Text Block] |
How did the Fund perform last year and what affected its performance?The municipal market is having a moment in the fixed income sun. We attribute the performance to an increased appetite for bonds, as well as the high after-tax yield that Munis boast compared to alternatives. That’s helped to absorb a wave of issuance from state and local governments, which have sold around $415 billion of bonds (through the end of the August) the most in at least a decade. Those high rates are generating their own demand. The benefits are especially enticing to high-net-worth individuals, who may be eager to shelter record equity earnings from volatility and to prepare for higher income taxes. No one predicted the sectors outperformance especially when you consider the 2026 challenges, (Military conflict, over 50bps increase in Treasuries, elevated inflation, a shift in the U.S. Federal Reserve's outlook combined with record supply). The asset class' high relative value and tax-equivalent yield alongside the fact that the sector was not overly valued like other fixed income sectors has helped. |
|
| Performance Past Does Not Indicate Future [Text] |
The Fund’s past performance is not necessarily an indication of how the Fund will perform in the future. The returns do not reflect the deduction of taxes that a shareholder would pay on Fund distributions or on the redemption or sale of Fund shares.
|
|
| Line Graph [Table Text Block] |
Table Summary
|
MYMK |
Bloomberg U.S. Municipal Bond Index |
ICE 2031 Maturity US Broad Municipal Index |
09/16/25 |
$10,000 |
$10,000 |
$10,000 |
09/30/25 |
$9,973 |
$9,970 |
$9,962 |
10/31/25 |
$10,052 |
$10,094 |
$10,024 |
11/30/25 |
$10,081 |
$10,117 |
$10,046 |
12/31/25 |
$10,104 |
$10,126 |
$10,072 |
01/31/26 |
$10,204 |
$10,221 |
$10,167 |
02/28/26 |
$10,279 |
$10,348 |
$10,277 |
03/31/26 |
$10,083 |
$10,108 |
$10,031 |
04/30/26 |
$10,145 |
$10,224 |
$10,105 |
05/31/26 |
$10,171 |
$10,262 |
$10,128 |
06/30/26 |
$10,209 |
$10,361 |
$10,169 |
07/31/26 |
$10,117 |
$10,169 |
$10,057 |
08/31/26 |
$10,140 |
$10,146 |
$10,093 |
|
|
| Average Annual Return [Table Text Block] |
Average Annual Total Returns (%)
Table Summary
Name |
Since Inception 09/16/25 |
MYMK |
1.40%Footnote Reference* |
Bloomberg U.S. Municipal Bond Index |
1.46% |
ICE 2031 Maturity US Broad Municipal Index |
0.93% |
| Footnote |
Description |
Footnote* |
Returns are not annualized. | The Fund’s past performance is not necessarily an indication of how the Fund will perform in the future. The returns do not reflect the deduction of taxes that a shareholder would pay on Fund distributions or on the redemption or sale of Fund shares. Updated performance information is available by calling 1-866-787-2257 or visiting our website at www.ssga.com. |
|
| Performance Inception Date |
Sep. 16, 2025
|
|
| Material Change Date |
Aug. 31, 2026
|
|
| Updated Performance Information Location [Text Block] |
Updated performance information is available by calling 1-866-787-2257 or visiting our website at www.ssga.com.
|
|
| AssetsNet |
$ 11,152,889
|
|
| Holdings Count | Holding |
85
|
|
| Advisory Fees Paid, Amount |
$ 15,765
|
|
| InvestmentCompanyPortfolioTurnover |
41.00%
|
|
| Additional Fund Statistics [Text Block] |
Key Fund Statistics as of 8/31/2026- Total Net Assets$11,152,889
- Number of Portfolio Holdings85
- Portfolio Turnover Rate41%
- Total Advisory Fees Paid$15,765
|
|
| Holdings [Text Block] |
Table Summary
States |
% |
Texas |
9.3% |
California |
7.4% |
Connecticut |
5.6% |
Illinois |
4.9% |
Florida |
4.8% |
Ohio |
4.8% |
Indiana |
4.6% |
Wisconsin |
4.6% |
Washington |
4.4% |
Kansas |
4.0% | |
|
| Largest Holdings [Text Block] |
Table Summary
Holdings |
% |
County of Harris Toll Road Revenue, TX, 5.00%, due 08/15/31 |
3.7% |
University of Wisconsin Hospitals & Clinics Revenue, WI, 5.00%, due 04/01/31 |
3.6% |
California State Public Works Board Revenue, CA, 5.00%, due 05/01/33 |
3.5% |
Los Angeles Department of Water & Power Revenue, CA, 5.00%, due 07/01/39 |
3.2% |
County of Chesterfield, General Obligation, VA, 5.00%, due 01/01/31 |
2.9% |
Indianapolis Local Public Improvement Bond Bank Revenue, IN, 5.00%, due 06/01/34 |
2.9% |
County of Santa Fe Revenue, NM, 2.25%, due 06/01/31 |
2.8% |
County of Montgomery, General Obligation, MD, 5.00%, due 08/01/34 |
2.7% |
Johnson County Unified School District No. 233 Olathe, General Obligation, KS, 5.00%, due 09/01/37 |
2.5% |
State of Connecticut Special Tax Revenue, CT, 5.00%, due 05/01/41 |
2.5% | |
|
| Material Fund Change [Text Block] |
This is a summary of certain changes of the Fund that occurred during the reporting period ended August 31, 2026. For more information contact 1-866-787-2257 (toll free) or refer to the Prospectus, which can be found on the Fund's website below. Effective December 30, 2025 (the “Effective Date”), the Fund changed its name from the SPDR® SSGA My2031 Municipal Bond ETF to the State Street® My2031 Municipal Bond ETF. These changes did not result in any changes to the Funds’ Investment Objectives, Principal Investment Strategies, or Principal Risks of Investing in the Funds. |
|
| Material Fund Change Name [Text Block] |
Effective December 30, 2025 (the “Effective Date”), the Fund changed its name from the SPDR® SSGA My2031 Municipal Bond ETF to the State Street® My2031 Municipal Bond ETF. These changes did not result in any changes to the Funds’ Investment Objectives, Principal Investment Strategies, or Principal Risks of Investing in the Funds.
|
|
| Summary of Change Legend [Text Block] |
This is a summary of certain changes of the Fund that occurred during the reporting period ended August 31, 2026. For more information contact 1-866-787-2257 (toll free) or refer to the Prospectus, which can be found on the Fund's website below.
|
|
| C000267387 |
|
|
| Shareholder Report [Line Items] |
|
|
| Fund Name |
State Street<sup style="inset: 1.5px 0px 4px; box-sizing: border-box; color: rgb(0, 0, 0); display: inline; flex-wrap: nowrap; font-size: 16px; font-weight: 700; grid-area: auto; line-height: 0px; margin: 0px; overflow: visible; position: relative; text-align: left; text-align-last: auto; white-space-collapse: preserve-breaks;">®</sup> My2027 High Yield Corporate Bond ETF
|
|
| Trading Symbol |
MYHA
|
|
| Security Exchange Name |
NASDAQ
|
|
| Annual or Semi-Annual Statement [Text Block] |
This annual shareholder report contains important information about the State Street® My2027 High Yield Corporate Bond ETF (the "Fund") for the period of February 26, 2026 (commencement of operations) through August 31, 2026.
|
|
| Additional Information [Text Block] |
You can find additional information about the Fund, including the Prospectus, Statement of Additional Information, financial statements and other information at www.ssga.com/us/en/institutional/fund-finder?tab=documents&type=etfs. You can also request this information about the Fund by contacting us at 1-866-787-2257.
|
|
| Additional Information Phone Number |
1-866-787-2257
|
|
| Additional Information Website |
www.ssga.com/us/en/institutional/fund-finder?tab=documents&type=etfs
|
|
| Expenses [Text Block] |
What were the Fund costs for the last year? (based on a hypothetical $10,000 Investment)
Table Summary
Fund Name |
Costs of a $10,000 investment |
Costs paid as a percentage of a $10,000 investment |
State Street® My2027 High Yield Corporate Bond ETF |
$21 |
0.40%Footnote Reference* |
| Footnote |
Description |
Footnote* |
Annualized. | The dollar amount above reflects expenses paid since the commencement of operations. Expenses for the full reporting period would be higher. |
|
| Expenses Paid, Amount |
$ 21
|
|
| Expense Ratio, Percent |
0.40%
|
[3] |
| Expenses Short Period Footnote [Text Block] |
The dollar amount above reflects expenses paid since the commencement of operations. Expenses for the full reporting period would be higher.
|
|
| Factors Affecting Performance [Text Block] |
How did the Fund perform last year and what affected its performance?Despite several episodes of volatility, high yield markets remained resilient during the reporting period. Credit spreads briefly widened following the escalation of conflict involving Iran, but the selloff proved short-lived as investors refocused on generally healthy corporate fundamentals and a supportive economic backdrop. Demand for income-producing assets remained strong, helping support valuations despite relatively tight spread levels. Performance across sectors became increasingly differentiated as companies benefiting from artificial intelligence-related investment outperformed many legacy technology issuers, creating attractive opportunities for active security selection. The portfolio outperformed its benchmark during the period, driven by strong security selection within the Communications, Energy, and Consumer Cyclical sectors. The portfolio added value across multiple rating categories through a disciplined and actively managed investment process that continually repositioned the portfolio toward issuers exhibiting favorable market trends and attractive relative value. Within the CCC and lower-rated segments, performance was driven primarily by disciplined risk management and the avoidance of distressed issuers. |
|
| Performance Past Does Not Indicate Future [Text] |
The Fund’s past performance is not necessarily an indication of how the Fund will perform in the future. The returns do not reflect the deduction of taxes that a shareholder would pay on Fund distributions or on the redemption or sale of Fund shares.
|
|
| Line Graph [Table Text Block] |
Table Summary
|
MYHA |
Bloomberg U.S. Aggregate Bond Index |
ICE 2027 Maturity US High Yield Index |
02/25/26 |
$10,000 |
$10,000 |
$10,000 |
02/28/26 |
$10,004 |
$10,038 |
$9,996 |
03/31/26 |
$9,993 |
$9,861 |
$9,982 |
04/30/26 |
$10,083 |
$9,872 |
$10,064 |
05/31/26 |
$10,129 |
$9,903 |
$10,094 |
06/30/26 |
$10,149 |
$9,927 |
$10,108 |
07/31/26 |
$10,168 |
$9,798 |
$10,120 |
08/31/26 |
$10,223 |
$9,836 |
$10,166 |
|
|
| Average Annual Return [Table Text Block] |
Average Annual Total Returns (%)
Table Summary
Name |
Since Inception 02/25/26 |
MYHA |
2.23%Footnote Reference* |
Bloomberg U.S. Aggregate Bond Index |
(1.64%) |
ICE 2027 Maturity US High Yield Index |
1.66% |
| Footnote |
Description |
Footnote* |
Returns are not annualized. | The Fund’s past performance is not necessarily an indication of how the Fund will perform in the future. The returns do not reflect the deduction of taxes that a shareholder would pay on Fund distributions or on the redemption or sale of Fund shares. Updated performance information is available by calling 1-866-787-2257 or visiting our website at www.ssga.com. |
|
| Performance Inception Date |
Feb. 25, 2026
|
|
| Updated Performance Information Location [Text Block] |
Updated performance information is available by calling 1-866-787-2257 or visiting our website at www.ssga.com.
|
|
| AssetsNet |
$ 4,983,862
|
|
| Holdings Count | Holding |
89
|
|
| Advisory Fees Paid, Amount |
$ 9,968
|
|
| InvestmentCompanyPortfolioTurnover |
77.00%
|
|
| Additional Fund Statistics [Text Block] |
Key Fund Statistics as of 8/31/2026- Total Net Assets$4,983,862
- Number of Portfolio Holdings89
- Portfolio Turnover Rate77%
- Total Advisory Fees Paid$9,968
|
|
| Holdings [Text Block] |
Table Summary
Industries |
% |
Auto Manufacturers |
9.0% |
Internet |
8.8% |
Real Estate Investment Trusts |
8.2% |
Lodging |
7.1% |
Entertainment |
6.3% |
Media |
5.8% |
Diversified Financial Services |
5.0% |
Chemicals |
4.8% |
Retail |
4.8% |
Commercial Services |
4.7% | |
|
| Largest Holdings [Text Block] |
Table Summary
Holdings |
% |
Nissan Motor Co. Ltd., 4.35%, due 09/17/27 |
4.9% |
Live Nation Entertainment, Inc., 4.75%, due 10/15/27 |
3.4% |
Rakuten Group, Inc., 11.25%, due 02/15/27 |
3.1% |
SBA Communications Corp., 3.88%, due 02/15/27 |
2.5% |
Centene Corp., 2.45%, due 07/15/28 |
2.4% |
NOVA Chemicals Corp., 5.25%, due 06/01/27 |
2.2% |
CCO Holdings LLC/CCO Holdings Capital Corp., 5.13%, due 05/01/27 |
2.2% |
Icahn Enterprises LP/Icahn Enterprises Finance Corp., 5.25%, due 05/15/27 |
2.2% |
Wynn Las Vegas LLC/Wynn Las Vegas Capital Corp., 5.25%, due 05/15/27 |
2.0% |
Prime Security Services Borrower LLC/Prime Finance, Inc., 3.38%, due 08/31/27 |
2.0% | |
|
| Material Fund Change [Text Block] |
|
|
| C000267388 |
|
|
| Shareholder Report [Line Items] |
|
|
| Fund Name |
State Street<sup style="inset: 1.5px 0px 4px; box-sizing: border-box; color: rgb(0, 0, 0); display: inline; flex-wrap: nowrap; font-size: 16px; font-weight: 700; grid-area: auto; line-height: 0px; margin: 0px; overflow: visible; position: relative; text-align: left; text-align-last: auto; white-space-collapse: preserve-breaks;">®</sup> My2028 High Yield Corporate Bond ETF
|
|
| Trading Symbol |
MYHB
|
|
| Security Exchange Name |
NASDAQ
|
|
| Annual or Semi-Annual Statement [Text Block] |
This annual shareholder report contains important information about the State Street® My2028 High Yield Corporate Bond ETF (the "Fund") for the period of February 26, 2026 (commencement of operations) through August 31, 2026.
|
|
| Additional Information [Text Block] |
You can find additional information about the Fund, including the Prospectus, Statement of Additional Information, financial statements and other information at www.ssga.com/us/en/institutional/fund-finder?tab=documents&type=etfs. You can also request this information about the Fund by contacting us at 1-866-787-2257.
|
|
| Additional Information Phone Number |
1-866-787-2257
|
|
| Additional Information Website |
www.ssga.com/us/en/institutional/fund-finder?tab=documents&type=etfs
|
|
| Expenses [Text Block] |
What were the Fund costs for the last year? (based on a hypothetical $10,000 Investment)
Table Summary
Fund Name |
Costs of a $10,000 investment |
Costs paid as a percentage of a $10,000 investment |
State Street® My2028 High Yield Corporate Bond ETF |
$20 |
0.39%Footnote Reference* |
| Footnote |
Description |
Footnote* |
Annualized. | The dollar amount above reflects expenses paid since the commencement of operations. Expenses for the full reporting period would be higher. |
|
| Expenses Paid, Amount |
$ 20
|
|
| Expense Ratio, Percent |
0.39%
|
[4] |
| Expenses Short Period Footnote [Text Block] |
The dollar amount above reflects expenses paid since the commencement of operations. Expenses for the full reporting period would be higher.
|
|
| Factors Affecting Performance [Text Block] |
How did the Fund perform last year and what affected its performance?Despite several episodes of volatility, high yield markets remained resilient during the reporting period. Credit spreads briefly widened, following the escalation of conflict involving Iran, but the selloff proved short-lived as investors refocused on generally healthy corporate fundamentals and a supportive economic backdrop. Demand for income-producing assets remained strong, helping support valuations despite relatively tight spread levels. Performance across sectors became increasingly differentiated as companies benefiting from artificial intelligence-related investment outperformed many legacy technology issuers, creating attractive opportunities for active security selection. The portfolio outperformed its benchmark during the period, driven by strong security selection within the Communications, Industrials, and Consumer Cyclical sectors. The portfolio added value across multiple rating categories through a disciplined and actively managed investment process that continually repositioned the portfolio toward issuers exhibiting favorable market trends and attractive relative value. Within the CCC and lower-rated segments, performance was driven primarily by disciplined risk management and the avoidance of distressed issuers. |
|
| Performance Past Does Not Indicate Future [Text] |
The Fund’s past performance is not necessarily an indication of how the Fund will perform in the future. The returns do not reflect the deduction of taxes that a shareholder would pay on Fund distributions or on the redemption or sale of Fund shares.
|
|
| Line Graph [Table Text Block] |
Table Summary
|
MYHB |
Bloomberg U.S. Aggregate Bond Index |
ICE 2028 Maturity US High Yield Index |
02/25/26 |
$10,000 |
$10,000 |
$10,000 |
02/28/26 |
$10,002 |
$10,038 |
$9,994 |
03/31/26 |
$9,977 |
$9,861 |
$9,952 |
04/30/26 |
$10,098 |
$9,872 |
$10,078 |
05/31/26 |
$10,147 |
$9,903 |
$10,108 |
06/30/26 |
$10,178 |
$9,927 |
$10,134 |
07/31/26 |
$10,200 |
$9,798 |
$10,139 |
08/31/26 |
$10,282 |
$9,836 |
$10,209 |
|
|
| Average Annual Return [Table Text Block] |
Average Annual Total Returns (%)
Table Summary
Name |
Since Inception 02/25/26 |
MYHB |
2.82%Footnote Reference* |
Bloomberg U.S. Aggregate Bond Index |
(1.64%) |
ICE 2028 Maturity US High Yield Index |
2.09% |
| Footnote |
Description |
Footnote* |
Returns are not annualized. | The Fund’s past performance is not necessarily an indication of how the Fund will perform in the future. The returns do not reflect the deduction of taxes that a shareholder would pay on Fund distributions or on the redemption or sale of Fund shares. Updated performance information is available by calling 1-866-787-2257 or visiting our website at www.ssga.com. |
|
| Performance Inception Date |
Feb. 25, 2026
|
|
| Updated Performance Information Location [Text Block] |
Updated performance information is available by calling 1-866-787-2257 or visiting our website at www.ssga.com.
|
|
| AssetsNet |
$ 5,002,009
|
|
| Holdings Count | Holding |
127
|
|
| Advisory Fees Paid, Amount |
$ 9,974
|
|
| InvestmentCompanyPortfolioTurnover |
74.00%
|
|
| Additional Fund Statistics [Text Block] |
Key Fund Statistics as of 8/31/2026- Total Net Assets$5,002,009
- Number of Portfolio Holdings127
- Portfolio Turnover Rate74%
- Total Advisory Fees Paid$9,974
|
|
| Holdings [Text Block] |
Table Summary
Industries |
% |
Health Care Services |
6.1% |
Real Estate Investment Trusts |
6.0% |
Retail |
5.1% |
Diversified Financial Services |
5.0% |
Internet |
3.8% |
Auto Parts & Equipment |
3.7% |
Commercial Services |
3.6% |
Electric |
3.6% |
Pipelines |
3.4% |
Pharmaceuticals |
3.4% | |
|
| Largest Holdings [Text Block] |
Table Summary
Holdings |
% |
Tenet Healthcare Corp., 4.63%, due 06/15/28 |
2.2% |
Centene Corp., 2.45%, due 07/15/28 |
2.0% |
1011778 BC ULC/New Red Finance, Inc., 3.88%, due 01/15/28 |
2.0% |
United Rentals North America, Inc., 4.88%, due 01/15/28 |
1.8% |
Tenneco, Inc., 8.00%, due 11/17/28 |
1.7% |
TransDigm, Inc., 6.38%, due 03/01/29 |
1.5% |
Avantor Funding, Inc., 4.63%, due 07/15/28 |
1.5% |
Sirius XM Radio LLC, 4.00%, due 07/15/28 |
1.5% |
Iliad Holding SAS, 7.00%, due 10/15/28 |
1.4% |
Bausch Health Cos., Inc., 5.00%, due 01/30/28 |
1.4% | |
|
| Material Fund Change [Text Block] |
|
|
| C000267390 |
|
|
| Shareholder Report [Line Items] |
|
|
| Fund Name |
State Street<sup style="inset: 1.5px 0px 4px; box-sizing: border-box; color: rgb(0, 0, 0); display: inline; flex-wrap: nowrap; font-size: 16px; font-weight: 700; grid-area: auto; line-height: 0px; margin: 0px; overflow: visible; position: relative; text-align: left; text-align-last: auto; white-space-collapse: preserve-breaks;">®</sup> My2030 High Yield Corporate Bond ETF
|
|
| Trading Symbol |
MYHD
|
|
| Security Exchange Name |
NASDAQ
|
|
| Annual or Semi-Annual Statement [Text Block] |
This annual shareholder report contains important information about the State Street® My2030 High Yield Corporate Bond ETF (the "Fund") for the period of February 26, 2026 (commencement of operations) through August 31, 2026.
|
|
| Additional Information [Text Block] |
You can find additional information about the Fund, including the Prospectus, Statement of Additional Information, financial statements and other information at www.ssga.com/us/en/institutional/fund-finder?tab=documents&type=etfs. You can also request this information about the Fund by contacting us at 1-866-787-2257.
|
|
| Additional Information Phone Number |
1-866-787-2257
|
|
| Additional Information Website |
www.ssga.com/us/en/institutional/fund-finder?tab=documents&type=etfs
|
|
| Expenses [Text Block] |
What were the Fund costs for the last year? (based on a hypothetical $10,000 Investment)
Table Summary
Fund Name |
Costs of a $10,000 investment |
Costs paid as a percentage of a $10,000 investment |
State Street® My2030 High Yield Corporate Bond ETF |
$20 |
0.39%Footnote Reference* |
| Footnote |
Description |
Footnote* |
Annualized. | The dollar amount above reflects expenses paid since the commencement of operations. Expenses for the full reporting period would be higher. |
|
| Expenses Paid, Amount |
$ 20
|
|
| Expense Ratio, Percent |
0.39%
|
[5] |
| Expenses Short Period Footnote [Text Block] |
The dollar amount above reflects expenses paid since the commencement of operations. Expenses for the full reporting period would be higher.
|
|
| Factors Affecting Performance [Text Block] |
How did the Fund perform last year and what affected its performance?Despite several episodes of volatility, high yield markets remained resilient during the reporting period. Credit spreads briefly widened following the escalation of conflict involving Iran, but the selloff proved short-lived as investors refocused on generally healthy corporate fundamentals and a supportive economic backdrop. Demand for income-producing assets remained strong, helping support valuations despite relatively tight spread levels. Performance across sectors became increasingly differentiated as companies benefiting from artificial intelligence-related investment outperformed many legacy technology issuers, creating attractive opportunities for active security selection. The portfolio outperformed its benchmark during the period, driven by strong security selection within the Communications, Consumer Cyclical, and Industrial sectors. The portfolio added value across multiple rating categories through a disciplined and actively managed investment process that continually repositioned the portfolio toward issuers exhibiting favorable market trends and attractive relative value. Within the CCC and lower-rated segments, performance was driven primarily by disciplined risk management and the avoidance of distressed issuers. |
|
| Performance Past Does Not Indicate Future [Text] |
The Fund’s past performance is not necessarily an indication of how the Fund will perform in the future. The returns do not reflect the deduction of taxes that a shareholder would pay on Fund distributions or on the redemption or sale of Fund shares.
|
|
| Line Graph [Table Text Block] |
Table Summary
|
MYHD |
Bloomberg U.S. Aggregate Bond Index |
ICE 2030 Maturity US High Yield Index |
02/25/26 |
$10,000 |
$10,000 |
$10,000 |
02/28/26 |
$9,987 |
$10,038 |
$9,982 |
03/31/26 |
$9,889 |
$9,861 |
$9,881 |
04/30/26 |
$10,082 |
$9,872 |
$10,062 |
05/31/26 |
$10,159 |
$9,903 |
$10,101 |
06/30/26 |
$10,221 |
$9,927 |
$10,150 |
07/31/26 |
$10,205 |
$9,798 |
$10,131 |
08/31/26 |
$10,328 |
$9,836 |
$10,236 |
|
|
| Average Annual Return [Table Text Block] |
Average Annual Total Returns (%)
Table Summary
Name |
Since Inception 02/25/26 |
MYHD |
3.28%Footnote Reference* |
Bloomberg U.S. Aggregate Bond Index |
(1.64%) |
ICE 2030 Maturity US High Yield Index |
2.36% |
| Footnote |
Description |
Footnote* |
Returns are not annualized. | The Fund’s past performance is not necessarily an indication of how the Fund will perform in the future. The returns do not reflect the deduction of taxes that a shareholder would pay on Fund distributions or on the redemption or sale of Fund shares. Updated performance information is available by calling 1-866-787-2257 or visiting our website at www.ssga.com. |
|
| Performance Inception Date |
Feb. 25, 2026
|
|
| Updated Performance Information Location [Text Block] |
Updated performance information is available by calling 1-866-787-2257 or visiting our website at www.ssga.com.
|
|
| AssetsNet |
$ 6,261,982
|
|
| Holdings Count | Holding |
183
|
|
| Advisory Fees Paid, Amount |
$ 10,217
|
|
| InvestmentCompanyPortfolioTurnover |
124.00%
|
|
| Additional Fund Statistics [Text Block] |
Key Fund Statistics as of 8/31/2026- Total Net Assets$6,261,982
- Number of Portfolio Holdings183
- Portfolio Turnover Rate124%
- Total Advisory Fees Paid$10,217
|
|
| Holdings [Text Block] |
Table Summary
Industries |
% |
Media |
9.6% |
Health Care Services |
7.7% |
Diversified Financial Services |
5.6% |
Retail |
5.3% |
Oil & Gas |
5.2% |
Packaging & Containers |
4.6% |
Commercial Services |
4.4% |
Real Estate Investment Trusts |
3.5% |
Telecommunications |
3.0% |
Software |
2.6% | |
|
| Largest Holdings [Text Block] |
Table Summary
Holdings |
% |
CCO Holdings LLC/CCO Holdings Capital Corp., 4.75%, due 03/01/30 |
2.6% |
Mauser Packaging Solutions Holding Co., 7.88%, due 04/15/30 |
1.6% |
Tenet Healthcare Corp., 4.38%, due 01/15/30 |
1.5% |
1011778 BC ULC/New Red Finance, Inc., 4.00%, due 10/15/30 |
1.5% |
Centene Corp., 3.00%, due 10/15/30 |
1.4% |
TransDigm, Inc., 6.88%, due 12/15/30 |
1.3% |
Directv Financing LLC, 8.88%, due 02/01/30 |
1.3% |
OneMain Finance Corp., 7.88%, due 03/15/30 |
1.2% |
Nissan Motor Co. Ltd., 4.81%, due 09/17/30 |
1.2% |
AthenaHealth Group, Inc., 6.50%, due 02/15/30 |
1.2% | |
|
| Material Fund Change [Text Block] |
|
|
| C000267391 |
|
|
| Shareholder Report [Line Items] |
|
|
| Fund Name |
State Street<sup style="inset: 1.5px 0px 4px; box-sizing: border-box; color: rgb(0, 0, 0); display: inline; flex-wrap: nowrap; font-size: 16px; font-weight: 700; grid-area: auto; line-height: 0px; margin: 0px; overflow: visible; position: relative; text-align: left; text-align-last: auto; white-space-collapse: preserve-breaks;">®</sup> My2031 High Yield Corporate Bond ETF
|
|
| Trading Symbol |
MYHE
|
|
| Security Exchange Name |
NASDAQ
|
|
| Annual or Semi-Annual Statement [Text Block] |
This annual shareholder report contains important information about the State Street® My2031 High Yield Corporate Bond ETF (the "Fund") for the period of February 26, 2026 (commencement of operations) through August 31, 2026.
|
|
| Additional Information [Text Block] |
You can find additional information about the Fund, including the Prospectus, Statement of Additional Information, financial statements and other information at www.ssga.com/us/en/institutional/fund-finder?tab=documents&type=etfs. You can also request this information about the Fund by contacting us at 1-866-787-2257.
|
|
| Additional Information Phone Number |
1-866-787-2257
|
|
| Additional Information Website |
www.ssga.com/us/en/institutional/fund-finder?tab=documents&type=etfs
|
|
| Expenses [Text Block] |
What were the Fund costs for the last year? (based on a hypothetical $10,000 Investment)
Table Summary
Fund Name |
Costs of a $10,000 investment |
Costs paid as a percentage of a $10,000 investment |
State Street® My2031 High Yield Corporate Bond ETF |
$20 |
0.39%Footnote Reference* |
| Footnote |
Description |
Footnote* |
Annualized. | The dollar amount above reflects expenses paid since the commencement of operations. Expenses for the full reporting period would be higher. |
|
| Expenses Paid, Amount |
$ 20
|
|
| Expense Ratio, Percent |
0.39%
|
[6] |
| Expenses Short Period Footnote [Text Block] |
The dollar amount above reflects expenses paid since the commencement of operations. Expenses for the full reporting period would be higher.
|
|
| Factors Affecting Performance [Text Block] |
How did the Fund perform last year and what affected its performance?Despite several episodes of volatility, high yield markets remained resilient during the reporting period. Credit spreads briefly widened following the escalation of conflict involving Iran, but the selloff proved short-lived as investors refocused on generally healthy corporate fundamentals and a supportive economic backdrop. Demand for income-producing assets remained strong, helping support valuations despite relatively tight spread levels. Performance across sectors became increasingly differentiated as companies benefiting from artificial intelligence-related investment outperformed many legacy technology issuers, creating attractive opportunities for active security selection. The portfolio outperformed its benchmark during the period, driven by strong security selection within the Communications, Consumer Cyclical, and Industrial sectors. The portfolio added value across multiple rating categories through a disciplined and actively managed investment process that continually repositioned the portfolio toward issuers exhibiting favorable market trends and attractive relative value. Within the CCC and lower-rated segments, performance was driven primarily by disciplined risk management and the avoidance of distressed issuers. |
|
| Performance Past Does Not Indicate Future [Text] |
The Fund’s past performance is not necessarily an indication of how the Fund will perform in the future. The returns do not reflect the deduction of taxes that a shareholder would pay on Fund distributions or on the redemption or sale of Fund shares.
|
|
| Line Graph [Table Text Block] |
Table Summary
|
MYHE |
Bloomberg U.S. Aggregate Bond Index |
ICE 2031 Maturity US High Yield Index |
02/25/26 |
$10,000 |
$10,000 |
$10,000 |
02/28/26 |
$9,981 |
$10,038 |
$9,977 |
03/31/26 |
$9,879 |
$9,861 |
$9,835 |
04/30/26 |
$10,073 |
$9,872 |
$10,016 |
05/31/26 |
$10,133 |
$9,903 |
$10,073 |
06/30/26 |
$10,177 |
$9,927 |
$10,100 |
07/31/26 |
$10,132 |
$9,798 |
$10,039 |
08/31/26 |
$10,216 |
$9,836 |
$10,122 |
|
|
| Average Annual Return [Table Text Block] |
Average Annual Total Returns (%)
Table Summary
Name |
Since Inception 02/25/26 |
MYHE |
2.16%Footnote Reference* |
Bloomberg U.S. Aggregate Bond Index |
(1.64%) |
ICE 2031 Maturity US High Yield Index |
1.22% |
| Footnote |
Description |
Footnote* |
Returns are not annualized. | The Fund’s past performance is not necessarily an indication of how the Fund will perform in the future. The returns do not reflect the deduction of taxes that a shareholder would pay on Fund distributions or on the redemption or sale of Fund shares. Updated performance information is available by calling 1-866-787-2257 or visiting our website at www.ssga.com. |
|
| Performance Inception Date |
Feb. 25, 2026
|
|
| Updated Performance Information Location [Text Block] |
Updated performance information is available by calling 1-866-787-2257 or visiting our website at www.ssga.com.
|
|
| AssetsNet |
$ 6,197,640
|
|
| Holdings Count | Holding |
170
|
|
| Advisory Fees Paid, Amount |
$ 10,103
|
|
| InvestmentCompanyPortfolioTurnover |
147.00%
|
|
| Additional Fund Statistics [Text Block] |
Key Fund Statistics as of 8/31/2026- Total Net Assets$6,197,640
- Number of Portfolio Holdings170
- Portfolio Turnover Rate147%
- Total Advisory Fees Paid$10,103
|
|
| Holdings [Text Block] |
Table Summary
Industries |
% |
Telecommunications |
15.1% |
Diversified Financial Services |
9.7% |
Media |
7.1% |
Health Care Services |
5.0% |
Oil & Gas |
4.8% |
Commercial Services |
4.5% |
Insurance |
3.4% |
Retail |
2.9% |
Lodging |
2.8% |
Food |
2.7% | |
|
| Largest Holdings [Text Block] |
Table Summary
Holdings |
% |
Meridian Arc Holdco LLC, 6.25%, due 04/30/31 |
2.5% |
PR RNO Property Owner 1 LLC, 6.50%, due 05/01/31 |
1.9% |
SV RNO Property Owner 1 LLC, 5.88%, due 03/01/31 |
1.7% |
Galaxy Helios Data Centers II LLC, 9.88%, due 08/01/31 |
1.7% |
Solaris Energy Infrastructure LLC, 6.38%, due 05/15/31 |
1.6% |
CCO Holdings LLC/CCO Holdings Capital Corp., 4.25%, due 02/01/31 |
1.5% |
Centene Corp., 2.50%, due 03/01/31 |
1.4% |
CRC Insurance Group LLC, 7.13%, due 06/01/31 |
1.4% |
Tenet Healthcare Corp., 6.75%, due 05/15/31 |
1.2% |
Rocket Cos., Inc., 6.13%, due 08/01/31 |
1.2% | |
|
| Material Fund Change [Text Block] |
|
|
| C000267389 |
|
|
| Shareholder Report [Line Items] |
|
|
| Fund Name |
State Street<sup style="inset: 1.5px 0px 4px; box-sizing: border-box; color: rgb(0, 0, 0); display: inline; flex-wrap: nowrap; font-size: 16px; font-weight: 700; grid-area: auto; line-height: 0px; margin: 0px; overflow: visible; position: relative; text-align: left; text-align-last: auto; white-space-collapse: preserve-breaks;">®</sup> My2029 High Yield Corporate Bond ETF
|
|
| Trading Symbol |
MYHC
|
|
| Security Exchange Name |
NASDAQ
|
|
| Annual or Semi-Annual Statement [Text Block] |
This annual shareholder report contains important information about the State Street® My2029 High Yield Corporate Bond ETF (the "Fund") for the period of February 26, 2026 (commencement of operations) through August 31, 2026.
|
|
| Additional Information [Text Block] |
You can find additional information about the Fund, including the Prospectus, Statement of Additional Information, financial statements and other information at www.ssga.com/us/en/institutional/fund-finder?tab=documents&type=etfs. You can also request this information about the Fund by contacting us at 1-866-787-2257.
|
|
| Additional Information Phone Number |
1-866-787-2257
|
|
| Additional Information Website |
www.ssga.com/us/en/institutional/fund-finder?tab=documents&type=etfs
|
|
| Expenses [Text Block] |
What were the Fund costs for the last year? (based on a hypothetical $10,000 Investment)
Table Summary
Fund Name |
Costs of a $10,000 investment |
Costs paid as a percentage of a $10,000 investment |
State Street® My2029 High Yield Corporate Bond ETF |
$20 |
0.39%Footnote Reference* |
| Footnote |
Description |
Footnote* |
Annualized. | The dollar amount above reflects expenses paid since the commencement of operations. Expenses for the full reporting period would be higher. |
|
| Expenses Paid, Amount |
$ 20
|
|
| Expense Ratio, Percent |
0.39%
|
[7] |
| Expenses Short Period Footnote [Text Block] |
The dollar amount above reflects expenses paid since the commencement of operations. Expenses for the full reporting period would be higher.
|
|
| Factors Affecting Performance [Text Block] |
How did the Fund perform last year and what affected its performance?Despite several episodes of volatility, high yield markets remained resilient during the reporting period. Credit spreads briefly widened following the escalation of conflict involving Iran, but the selloff proved short-lived as investors refocused on generally healthy corporate fundamentals and a supportive economic backdrop. Demand for income-producing assets remained strong, helping support valuations despite relatively tight spread levels. Performance across sectors became increasingly differentiated as companies benefiting from artificial intelligence-related investment outperformed many legacy technology issuers, creating attractive opportunities for active security selection. The portfolio outperformed its benchmark during the period, driven by strong security selection within the Industrials, Communications, and Technology sectors. The portfolio added value across multiple rating categories through a disciplined and actively managed investment process that continually repositioned the portfolio toward issuers exhibiting favorable market trends and attractive relative value. Within the CCC and lower-rated segments, performance was driven primarily by disciplined risk management and the avoidance of distressed issuers. |
|
| Performance Past Does Not Indicate Future [Text] |
The Fund’s past performance is not necessarily an indication of how the Fund will perform in the future. The returns do not reflect the deduction of taxes that a shareholder would pay on Fund distributions or on the redemption or sale of Fund shares.
|
|
| Line Graph [Table Text Block] |
Table Summary
|
MYHC |
Bloomberg U.S. Aggregate Bond Index |
ICE 2029 Maturity US High Yield Index |
02/25/26 |
$10,000 |
$10,000 |
$10,000 |
02/28/26 |
$9,989 |
$10,038 |
$9,983 |
03/31/26 |
$9,934 |
$9,861 |
$9,912 |
04/30/26 |
$10,114 |
$9,872 |
$10,067 |
05/31/26 |
$10,197 |
$9,903 |
$10,124 |
06/30/26 |
$10,237 |
$9,927 |
$10,135 |
07/31/26 |
$10,253 |
$9,798 |
$10,133 |
08/31/26 |
$10,350 |
$9,836 |
$10,226 |
|
|
| Average Annual Return [Table Text Block] |
Average Annual Total Returns (%)
Table Summary
Name |
Since Inception 02/25/26 |
MYHC |
3.50%Footnote Reference* |
Bloomberg U.S. Aggregate Bond Index |
(1.64%) |
ICE 2029 Maturity US High Yield Index |
2.26% |
| Footnote |
Description |
Footnote* |
Returns are not annualized. | The Fund’s past performance is not necessarily an indication of how the Fund will perform in the future. The returns do not reflect the deduction of taxes that a shareholder would pay on Fund distributions or on the redemption or sale of Fund shares. Updated performance information is available by calling 1-866-787-2257 or visiting our website at www.ssga.com. |
|
| Performance Inception Date |
Feb. 25, 2026
|
|
| Updated Performance Information Location [Text Block] |
Updated performance information is available by calling 1-866-787-2257 or visiting our website at www.ssga.com.
|
|
| AssetsNet |
$ 5,021,035
|
|
| Holdings Count | Holding |
164
|
|
| Advisory Fees Paid, Amount |
$ 9,990
|
|
| InvestmentCompanyPortfolioTurnover |
120.00%
|
|
| Additional Fund Statistics [Text Block] |
Key Fund Statistics as of 8/31/2026- Total Net Assets$5,021,035
- Number of Portfolio Holdings164
- Portfolio Turnover Rate120%
- Total Advisory Fees Paid$9,990
|
|
| Holdings [Text Block] |
Table Summary
Industries |
% |
Retail |
7.6% |
Health Care Services |
6.0% |
Commercial Services |
5.2% |
Oil & Gas |
5.1% |
Media |
4.7% |
Software |
4.6% |
Real Estate Investment Trusts |
4.0% |
Home Builders |
3.6% |
Internet |
3.3% |
Aerospace & Defense |
3.2% | |
|
| Largest Holdings [Text Block] |
Table Summary
Holdings |
% |
TransDigm, Inc., 6.38%, due 03/01/29 |
2.0% |
Centene Corp., 4.63%, due 12/15/29 |
1.7% |
Cloud Software Group LLC, 9.00%, due 09/30/29 |
1.5% |
Cloud Software Group LLC, 6.50%, due 03/31/29 |
1.5% |
EchoStar Corp., 10.75%, due 11/30/29 |
1.4% |
American Airlines, Inc./AAdvantage Loyalty IP Ltd., 5.75%, due 04/20/29 |
1.4% |
Acrisure LLC/Acrisure Finance, Inc., 4.25%, due 02/15/29 |
1.4% |
Sunoco LP, 4.50%, due 10/01/29 |
1.4% |
Neptune Bidco U.S., Inc., 9.29%, due 04/15/29 |
1.3% |
Icahn Enterprises LP/Icahn Enterprises Finance Corp., 9.75%, due 01/15/29 |
1.1% | |
|
| Material Fund Change [Text Block] |
|
|
|
|