Shareholder Report
Aug. 31, 2026
USD ($)
$ / shares
WHAT WERE THE FUND COSTS FOR THE PAST YEAR? (based on a hypothetical $10,000 investment)
|
Costs of a $10,000 investment
|
Costs paid as a percentage of a $10,000 investment
|
|
|
Direxion Monthly NASDAQ-100® Bull 1.75X Fund
|
$152
|
1.27%
|
HOW DID THE FUND PERFORM LAST YEAR AND WHAT AFFECTED ITS PERFORMANCE?
The Direxion Monthly NASDAQ-100® Bull 1.75X Fund seeks to provide 175% of the calendar month return of the NASDAQ-100® Index. The NASDAQ-100® Index includes 100 of the largest domestic and international non-financial companies listed on the NASDAQ Stock Market® based on market capitalization. All companies included in the index have an average daily trading volume of at least 200,000 shares.
During the Annual Period, the index was shaped by a sharp round trip in the artificial intelligence trade. Mega-cap technology and semiconductor names drove strong gains, with especially large advances in the spring, supported by continued demand for AI computing and cloud infrastructure, and Nvidia reached record highs during the period. That leadership reversed near midyear, when investors began questioning the scale of Big Tech capital spending on AI, and semiconductor stocks fell into a rapid correction, among the fastest declines for the group in decades. Memory and chip names such as Micron were among the most volatile. The index recovered much of the decline by the close of the period as AI enthusiasm returned, though volatility was elevated throughout and leadership remained concentrated in the largest companies.
For the Annual Period, the NASDAQ-100® Index returned 26.61% and had volatility of 19.57%. Given the calendar month investment objective of the Fund, and the path dependency of returns for longer periods, the return of the index alone should not generate expectations of performance of the Fund. The Direxion Monthly NASDAQ-100® Bull 1.75X Fund returned 39.44%, while the model, which incorporates the impact of the monthly rebalancing resulting in compounding and the index’s volatility, provided a return of 34.06%. Factors that may materially impact Fund performance include the volatility of the Fund’s index, compounding, return of the securities and derivatives held by the Fund, financing rates paid or earned, the types of derivative instruments used by the Fund and the correlation of such derivatives to the Fund’s index and other miscellaneous factors.
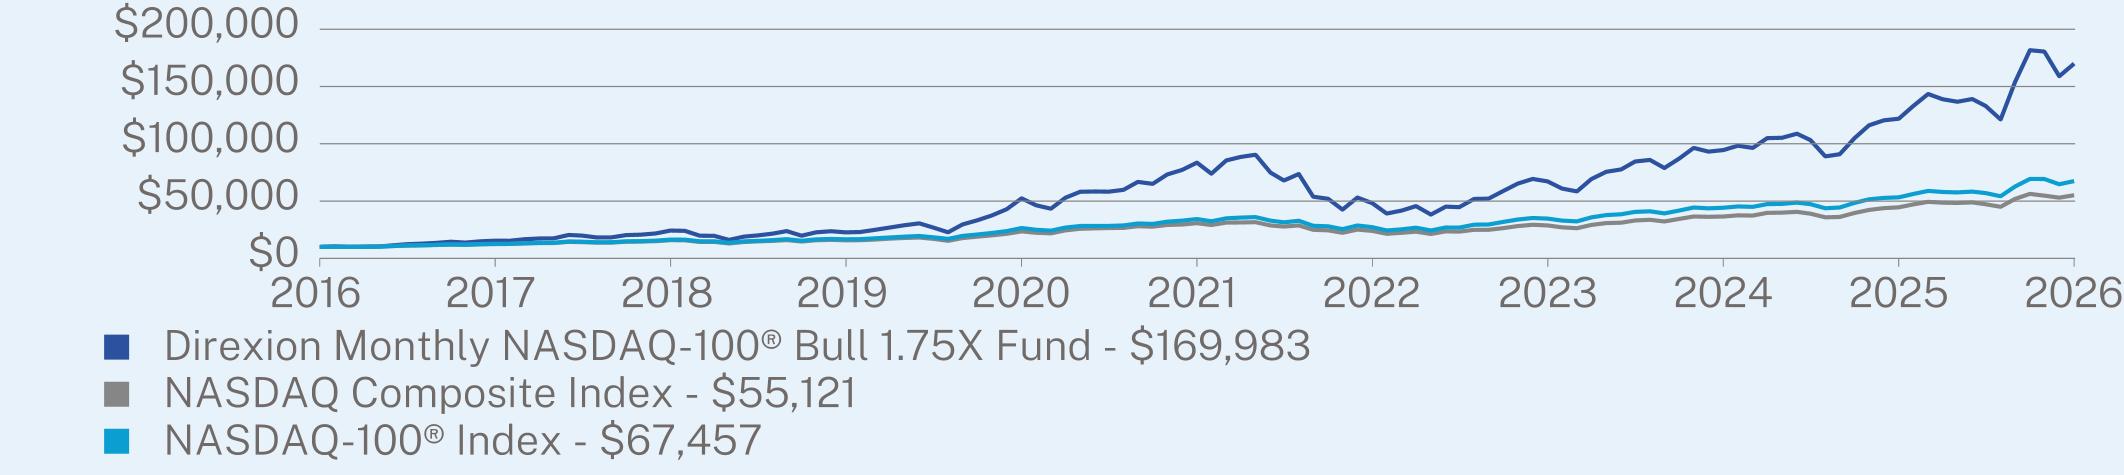
ANNUAL AVERAGE TOTAL RETURN (%)
|
|
1 Year
|
5 Year
|
10 Year
|
|
Direxion Monthly NASDAQ-100® Bull 1.75X Fund
|
39.44
|
15.26
|
32.75
|
|
NASDAQ Composite Index
|
23.64
|
12.38
|
18.61
|
|
NASDAQ-100® Index
|
26.61
|
14.46
|
21.03
|
Visit https://connect.rightprospectus.com/Direxion for more recent performance information.
KEY FUND STATISTICS (as of August 31, 2026)
|
Net Assets
|
$599,803,539
|
|
Number of Holdings
|
3
|
|
Net Advisory Fee
|
$4,217,370
|
|
Portfolio Turnover
|
0%
|
WHAT DID THE FUND INVEST IN? (as of August 31, 2026)
|
Market Exposure
|
(%)
|
|
|
Total Return Swap Contracts
|
107.8
|
%
|
|
Investment Companies
|
67.2
|
%
|
|
Total (as % of net assets)
|
175.0
|
%
|
|
Index Composition
|
(%)
|
|
|
Information Technology
|
58.5
|
%
|
|
Communication Services
|
15.1
|
%
|
|
Consumer Discretionary
|
9.8
|
%
|
|
Consumer Staples
|
6.2
|
%
|
|
Health Care
|
4.0
|
%
|
|
Industrials
|
3.5
|
%
|
|
Utilities
|
1.2
|
%
|
|
Materials
|
1.0
|
%
|
|
Energy
|
0.5
|
%
|
|
Financials
|
0.2
|
%
|
|
Top 10 Constituents of Index
|
(%)
|
|
|
NVIDIA Corp.
|
8.5
|
%
|
|
Apple, Inc.
|
7.4
|
%
|
|
Microsoft Corp.
|
6.0
|
%
|
|
Micron Technology, Inc.
|
4.8
|
%
|
|
Amazon.com, Inc.
|
4.5
|
%
|
|
Advanced Micro Devices, Inc.
|
3.4
|
%
|
|
Alphabet Inc. Class A
|
3.2
|
%
|
|
Tesla, Inc.
|
2.9
|
%
|
|
Alphabet Inc. Class C
|
2.9
|
%
|
|
Broadcom, Inc.
|
2.8
|
%
|
WHAT WERE THE FUND COSTS FOR THE PAST YEAR? (based on a hypothetical $10,000 investment)
|
Costs of a $10,000 investment
|
Costs paid as a percentage of a $10,000 investment
|
|
|
Direxion Monthly S&P 500® Bull 1.75X Fund
|
$152
|
1.32%
|
HOW DID THE FUND PERFORM LAST YEAR AND WHAT AFFECTED ITS PERFORMANCE?
The Direxion Monthly S&P 500® Bull 1.75X Fund seeks to provide 175% of the calendar month return of the S&P 500® Index. The S&P 500® Index is widely regarded as the best single gauge of large-cap U.S. equities. The index includes 500 leading companies and covers approximately 80% of available market capitalization. Stocks are selected based on market capitalization, financial viability of the company and the public float, liquidity and price of a company’s shares outstanding. The index is a float-adjusted, market capitalization-weighted index.
During the Annual Period, the index advanced, but leadership was unusually bifurcated. Information technology, led by semiconductors and the mega-cap AI complex, was the strongest sector, with energy close behind, supported by rising crude oil prices tied to conflict in the Middle East and supply concerns surrounding the Strait of Hormuz. Health care also ranked among the leaders. A sharp midyear selloff in semiconductor stocks prompted a temporary rotation toward more defensive parts of the market, but much of the large-cap universe outside technology and energy lagged, including consumer discretionary, which reversed its prior leadership, along with utilities and communication services. The Federal Reserve, which had cut rates three times in late 2025, held policy steady through most of the period as inflation stayed above target, and by late in the period some investors had begun to weigh the risk of renewed tightening. Small-capitalization stocks participated meaningfully, though leadership among large caps remained concentrated in a narrow group of technology-related names.
For the Annual Period, the S&P 500® Index returned 20.38% and had volatility of 12.80%. Given the calendar month investment objective of the Fund, and the path dependency of returns for longer periods, the return of the index alone should not generate expectations of performance of the Fund. The Direxion Monthly S&P 500® Bull 1.75X Fund returned 29.73%, while the model, which incorporates the impact of the monthly rebalancing resulting in compounding and the index’s volatility, provided a return of 29.70%. Factors that may materially impact Fund performance include the volatility of the Fund’s index, compounding, return of the securities and derivatives held by the Fund, financing rates paid or earned, the types of derivative instruments used by the Fund and the correlation of such derivatives to the Fund’s index and other miscellaneous factors.
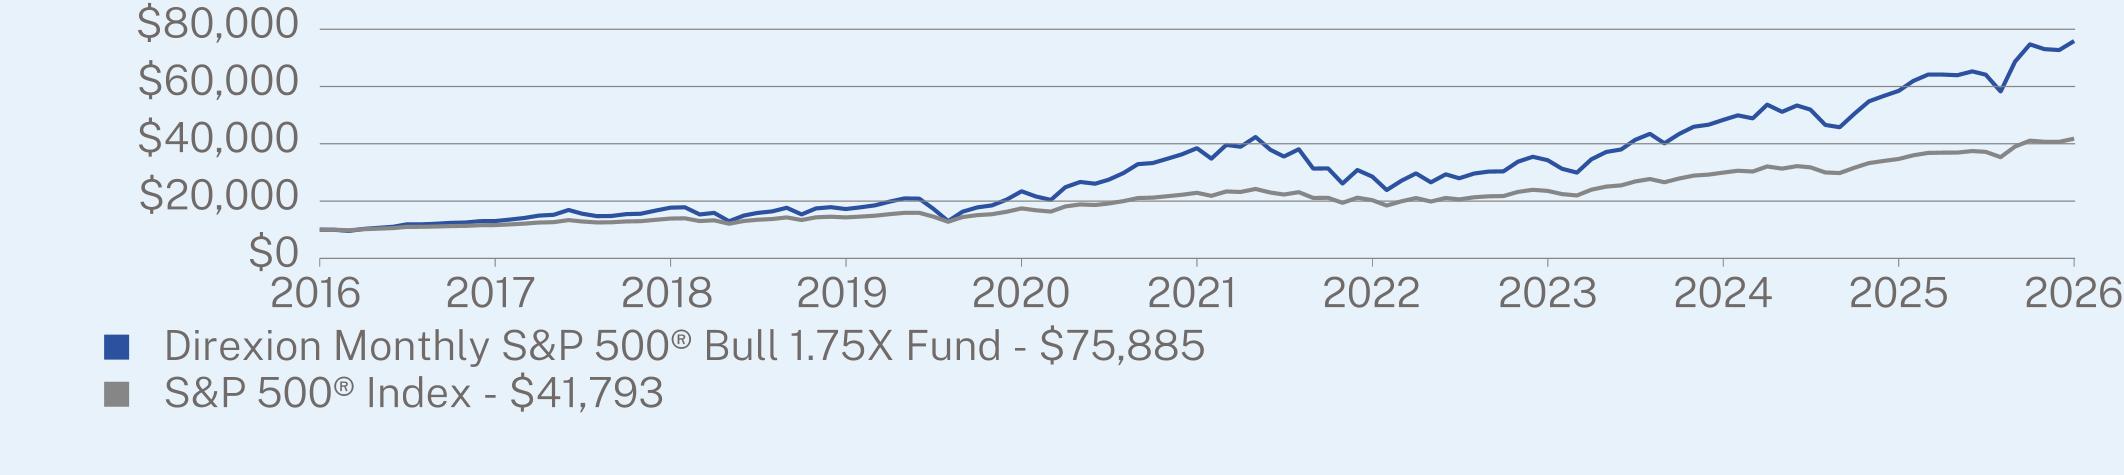
ANNUAL AVERAGE TOTAL RETURN (%)
|
|
1 Year
|
5 Year
|
10 Year
|
|
Direxion Monthly S&P 500® Bull 1.75X Fund
|
29.73
|
14.55
|
22.47
|
|
S&P 500® Index
|
20.38
|
12.79
|
15.37
|
Visit https://connect.rightprospectus.com/Direxion for more recent performance information.
KEY FUND STATISTICS (as of August 31, 2026)
|
Net Assets
|
$144,006,616
|
|
Number of Holdings
|
5
|
|
Net Advisory Fee
|
$1,001,000
|
|
Portfolio Turnover
|
0%
|
WHAT DID THE FUND INVEST IN? (as of August 31, 2026)
|
Market Exposure
|
(%)
|
|
|
Total Return Swap Contracts
|
128.2
|
%
|
|
Investment Companies
|
46.8
|
%
|
|
Total (as % of net assets)
|
175.0
|
%
|
|
Index Composition
|
(%)
|
|
|
Information Technology
|
37.9
|
%
|
|
Financials
|
12.3
|
%
|
|
Communication Services
|
9.5
|
%
|
|
Consumer Discretionary
|
9.3
|
%
|
|
Health Care
|
9.1
|
%
|
|
Industrials
|
8.3
|
%
|
|
Consumer Staples
|
4.5
|
%
|
|
Energy
|
3.5
|
%
|
|
Utilities
|
2.0
|
%
|
|
Materials
|
1.8
|
%
|
|
Real Estate
|
1.8
|
%
|
|
Top 10 Constituents of Index
|
(%)
|
|
|
NVIDIA Corp.
|
8.1
|
%
|
|
Apple, Inc.
|
7.0
|
%
|
|
Microsoft Corp.
|
5.7
|
%
|
|
Amazon.com, Inc.
|
3.8
|
%
|
|
Alphabet Inc. Class A
|
3.0
|
%
|
|
Broadcom, Inc.
|
2.7
|
%
|
|
Alphabet Inc. Class C
|
2.4
|
%
|
|
Meta Platforms, Inc. Class A
|
1.9
|
%
|
|
Micron Technology, Inc.
|
1.6
|
%
|
|
Tesla, Inc.
|
1.6
|
%
|
WHAT WERE THE FUND COSTS FOR THE PAST YEAR? (based on a hypothetical $10,000 investment)
|
Costs of a $10,000 investment
|
Costs paid as a percentage of a $10,000 investment
|
|
|
Direxion Monthly Small Cap Bull 1.75X Fund
|
$163
|
1.35%
|
HOW DID THE FUND PERFORM LAST YEAR AND WHAT AFFECTED ITS PERFORMANCE?
The Direxion Monthly Small Cap Bull 1.75X Fund seeks to provide 175% of the calendar month return of the Russell 2000® Index. The Russell 2000® Index measures the performance of approximately 2,000 small-capitalization companies in the Russell 3000® Index, based on a combination of their market capitalization and current index membership.
During the Annual Period, small-cap equities outperformed the large-cap S&P 500, though they finished roughly in line with large-cap growth stocks. The relative strength was most pronounced earlier in the period and was supported by three Federal Reserve rate cuts in late 2025, which eased interest costs for the many index constituents carrying floating-rate debt, together with an unusually wide valuation gap versus large caps and an improving small-cap earnings outlook. The advance was not linear. Small caps stumbled in late winter and early spring when firmer labor and inflation data led the market to price out further near-term rate cuts, and the index stayed volatile given its heavier exposure to domestically focused, more rate-sensitive, and less profitable companies. The small-cap advantage over large caps narrowed over the summer as a semiconductor-led sell-off and renewed concern about the path of interest rates weighed on the index.
For the Annual Period, the Russell 2000® Index returned 26.46% and had volatility of 23.63%. Given the calendar month investment objective of the Fund and the path dependency of returns for longer periods, the return of the index alone should not generate expectations of annual performance of the Fund. The Direxion Monthly Small Cap Bull 1.75X Fund returned 41.16%, while the model, which incorporates the impact of the monthly rebalancing resulting in compounding and the index’s volatility, provided a return of 40.87%. Factors that may materially impact Fund performance include the volatility of the Fund’s index, compounding, return of the securities and derivatives held by the Fund, financing rates paid or earned, the types of derivative instruments used by the Fund and the correlation of such derivatives to the Fund’s index and other miscellaneous factors.
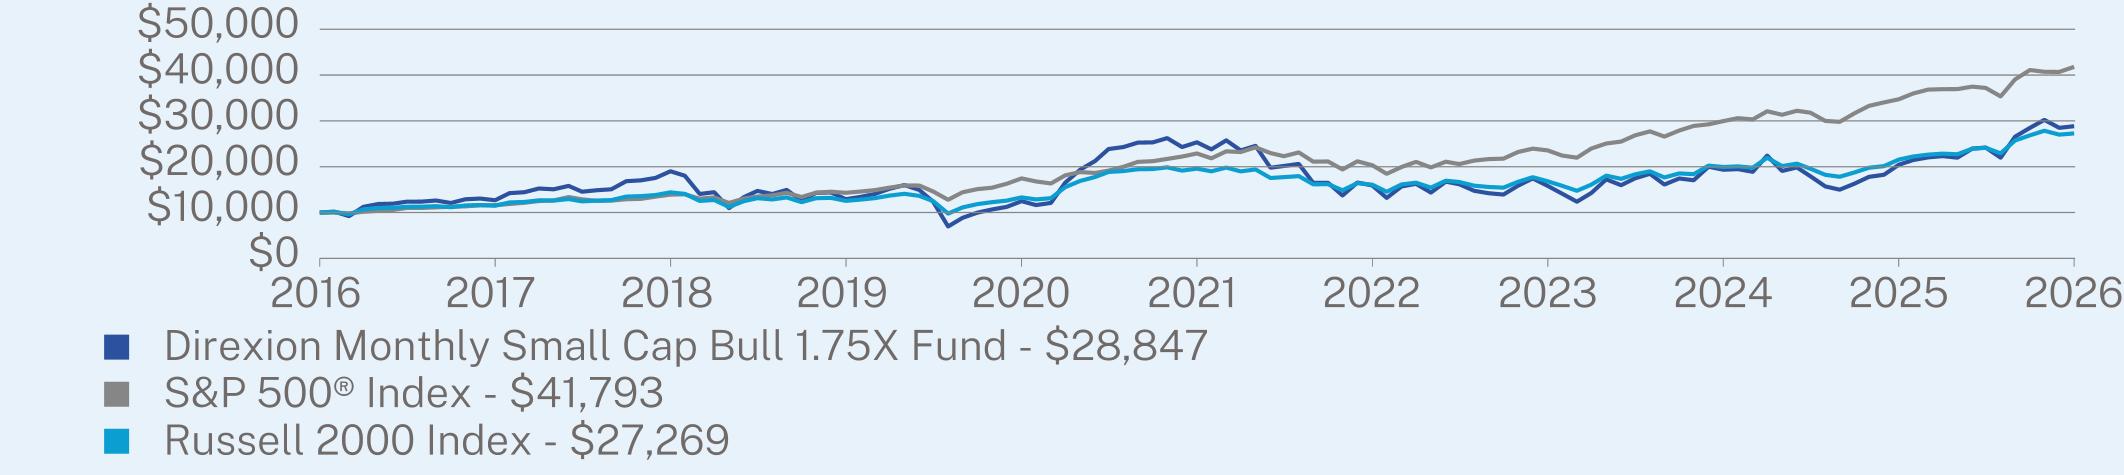
ANNUAL AVERAGE TOTAL RETURN (%)
|
|
1 Year
|
5 Year
|
10 Year
|
|
Direxion Monthly Small Cap Bull 1.75X Fund
|
41.16
|
2.63
|
11.18
|
|
S&P 500® Index
|
20.38
|
12.79
|
15.37
|
|
Russell 2000 Index
|
26.46
|
6.85
|
10.55
|
Visit https://connect.rightprospectus.com/Direxion for more recent performance information.
KEY FUND STATISTICS (as of August 31, 2026)
|
Net Assets
|
$9,701,051
|
|
Number of Holdings
|
5
|
|
Net Advisory Fee
|
$40,475
|
|
Portfolio Turnover
|
39%
|
WHAT DID THE FUND INVEST IN? (as of August 31, 2026)
|
Market Exposure
|
(%)
|
|
|
Total Return Swap Contracts
|
118.6
|
%
|
|
Investment Companies
|
56.4
|
%
|
|
Total (as % of net assets)
|
175.0
|
%
|
|
Index Composition
|
(%)
|
|
|
Health Care
|
20.0
|
%
|
|
Financials
|
19.9
|
%
|
|
Industrials
|
14.0
|
%
|
|
Information Technology
|
11.3
|
%
|
|
Consumer Discretionary
|
10.0
|
%
|
|
Materials
|
6.0
|
%
|
|
Energy
|
5.8
|
%
|
|
Real Estate
|
5.7
|
%
|
|
Utilities
|
2.7
|
%
|
|
Communication Services
|
2.4
|
%
|
|
Consumer Staples
|
2.2
|
%
|
|
Top 10 Constituents of Index
|
(%)
|
|
|
JFrog Ltd.
|
0.4
|
%
|
|
Moog, Inc. Class A
|
0.3
|
%
|
|
UMB Financial Corp.
|
0.3
|
%
|
|
Glaukos Corp.
|
0.3
|
%
|
|
Brinker International, Inc.
|
0.3
|
%
|
|
BrightSpring Health Services, Inc.
|
0.3
|
%
|
|
Krystal Biotech, Inc.
|
0.3
|
%
|
|
Cytokinetics, Inc.
|
0.3
|
%
|
|
Protagonist Therapeutics, Inc.
|
0.3
|
%
|
|
Twist Bioscience Corp.
|
0.3
|
%
|
WHAT WERE THE FUND COSTS FOR THE PAST YEAR? (based on a hypothetical $10,000 investment)
|
Class Name
|
Costs of a $10,000 investment
|
Costs paid as a percentage of a $10,000 investment
|
|
Hilton Tactical Income Fund Investor Class
|
$116
|
1.12%
|
HOW DID THE FUND PERFORM LAST YEAR AND WHAT AFFECTED ITS PERFORMANCE?
For the Annual Period ending August 31, 2026, the Hilton Tactical Income Fund (“Fund”) participated in equity-market gains, but its income mandate limited exposure to several strong-performing technology companies. According to the supplied attribution detail, fixed-income positioning provided an important offset to these equity headwinds.¹
The dividend constraint was a key headwind. Unlike the benchmark, the Fund cannot directly own non-dividend-paying stocks under its income mandate, and very low dividends can limit the suitability and sizing of other holdings. In the supplied attribution, non-ownership of Advanced Micro Devices and Intel detracted approximately 13 and 8 basis points, respectively. Micron, which pays a dividend but offers a low yield, detracted another 6 basis points through non-ownership. Nvidia’s dividend was previously too small to fit the strategy’s income framework, and a substantial dividend increase improved its eligibility, but underexposure still detracted 7 basis points. Together, these four exposures accounted for approximately 31 basis points of relative drag in that attribution report.¹
Fixed-income positioning substantially offset these pressures. The reported fixed-income bucket contributed −36 basis points to portfolio return, compared with −101 basis points for the benchmark, for a reported active contribution of +64 basis points. Government debt positioning accounted for +61 basis points of that relative benefit. This figure reflects the contribution of allocation and holdings to total portfolio results, rather than a comparison of standalone fixed income returns.¹
The portfolio management team maintained its disciplined approach to income generation and risk management, adjusting equity exposure, security selection, credit exposure, and duration as conditions evolved. The Fund continued to seek participation in market gains while preserving its dividend discipline and managing portfolio volatility.
At the end of the Annual Period, the Fund held 1.67% in cash, 1.28% in commodities, 49.24% in equities, and 47.82% in fixed income. The portfolio yield was 4.40%, and portfolio duration was held below 3.0 years amid rising rates and increased inflation expectations.
Top Contributors¹
• Taiwan Semiconductor Manufacturing Co. Ltd.
• Emerson Electric Co.
• Analog Devices, Inc.
• AstraZeneca PLC
• Janus Living, Inc.
• Taiwan Semiconductor Manufacturing Co. Ltd.
• Emerson Electric Co.
• Analog Devices, Inc.
• AstraZeneca PLC
• Janus Living, Inc.
Top Detractors¹
• SAP SE
• Cisco Systems, Inc.
• General Dynamics Corp.
• The Home Depot, Inc.
• Microsoft Corp.
*Benchmark = 40% S&P 500 TR Index / 60% Bloomberg Intermediate US Govt/Credit TR Index Value Unhedged
¹ Attribution figures and contributor rankings are from Bloomberg.
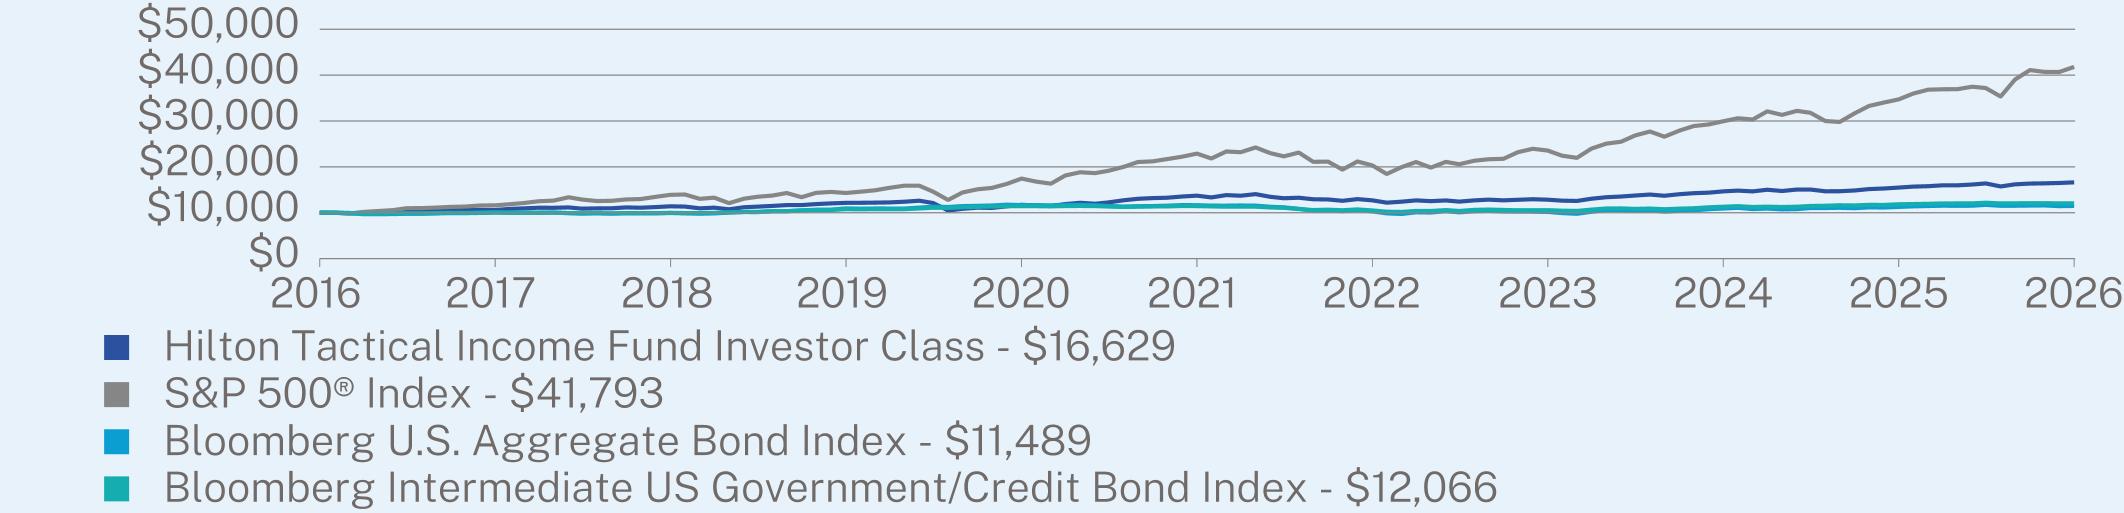
ANNUAL AVERAGE TOTAL RETURN (%)
|
|
1 Year
|
5 Year
|
10 Year
|
|
Investor Class (without sales charge)
|
7.28
|
3.91
|
5.22
|
|
S&P 500® Index
|
20.38
|
12.79
|
15.37
|
|
Bloomberg U.S. Aggregate Bond Index
|
1.89
|
-0.29
|
1.40
|
|
Bloomberg Intermediate US Government/Credit Bond Index
|
1.80
|
1.05
|
1.90
|
Visit https://connect.rightprospectus.com/Direxion for more recent performance information.
KEY FUND STATISTICS (as of August 31, 2026)
|
Net Assets
|
$133,600,484
|
|
Number of Holdings
|
101
|
|
Net Advisory Fee
|
$802,607
|
|
Portfolio Turnover
|
86%
|
|
Distribution Yield - Investor Class
|
6.35%
|
WHAT DID THE FUND INVEST IN? (as of August 31, 2026)
|
Top Holdings
|
(%)
|
|
|
iShares 0-3 Month Treasury Bond ETF
|
7.5
|
%
|
|
JPMorgan Nasdaq Equity Premium Income ETF
|
5.8
|
%
|
|
Vanguard Intermediate-Term Corporate Bond ETF
|
4.6
|
%
|
|
JPMorgan Income ETF
|
4.4
|
%
|
|
Janus Henderson AAA CLO ETF
|
4.4
|
%
|
|
Vanguard International High Dividend Yield ETF
|
4.1
|
%
|
|
Vanguard Intermediate-Term Treasury ETF
|
3.7
|
%
|
|
JPMorgan Equity Premium Income ETF
|
2.8
|
%
|
|
Invesco S&P 500 Equal Weight Income Advantage ETF
|
2.5
|
%
|
|
Microsoft Corp.
|
2.4
|
%
|
|
Security Type
|
(%)
|
|
|
Investment Companies
|
46.7
|
%
|
|
Common Stocks
|
30.4
|
%
|
|
Corporate Bonds
|
17.6
|
%
|
|
U.S. Treasury Securities
|
2.0
|
%
|
|
Convertible Preferred Stocks
|
0.6
|
%
|
|
Cash & Other
|
2.7
|
%
|
|
Market Exposure
|
(%)
|
|
Fixed Income
|
51.1%
|
|
Equity
|
46.2%
|
|
Other
|
2.7%
|
|
Total (as % of net assets)
|
100.0%
|
WHAT WERE THE FUND COSTS FOR THE PAST YEAR? (based on a hypothetical $10,000 investment)
|
Class Name
|
Costs of a $10,000 investment
|
Costs paid as a percentage of a $10,000 investment
|
|
Hilton Tactical Income Fund Institutional Class
|
$90
|
0.87%
|
HOW DID THE FUND PERFORM LAST YEAR AND WHAT AFFECTED ITS PERFORMANCE?
For the Annual Period ending August 31, 2026, the Hilton Tactical Income Fund (“Fund”) participated in equity-market gains, but its income mandate limited exposure to several strong-performing technology companies. According to the supplied attribution detail, fixed-income positioning provided an important offset to these equity headwinds.¹
The dividend constraint was a key headwind. Unlike the benchmark, the Fund cannot directly own non-dividend-paying stocks under its income mandate, and very low dividends can limit the suitability and sizing of other holdings. In the supplied attribution, non-ownership of Advanced Micro Devices and Intel detracted approximately 13 and 8 basis points, respectively. Micron, which pays a dividend but offers a low yield, detracted another 6 basis points through non-ownership. Nvidia’s dividend was previously too small to fit the strategy’s income framework, and a substantial dividend increase improved its eligibility, but underexposure still detracted 7 basis points. Together, these four exposures accounted for approximately 31 basis points of relative drag in that attribution report.¹
Fixed-income positioning substantially offset these pressures. The reported fixed-income bucket contributed −36 basis points to portfolio return, compared with −101 basis points for the benchmark, for a reported active contribution of +64 basis points. Government debt positioning accounted for +61 basis points of that relative benefit. This figure reflects the contribution of allocation and holdings to total portfolio results, rather than a comparison of standalone fixed income returns.¹
The portfolio management team maintained its disciplined approach to income generation and risk management, adjusting equity exposure, security selection, credit exposure, and duration as conditions evolved. The Fund continued to seek participation in market gains while preserving its dividend discipline and managing portfolio volatility.
At the end of the Annual Period, the Fund held 1.67% in cash, 1.28% in commodities, 49.24% in equities, and 47.82% in fixed income. The portfolio yield was 4.40%, and portfolio duration was held below 3.0 years amid rising rates and increased inflation expectations.
Top Contributors¹
• Taiwan Semiconductor Manufacturing Co. Ltd.
• Emerson Electric Co.
• Analog Devices, Inc.
• AstraZeneca PLC
• Janus Living, Inc.
• Taiwan Semiconductor Manufacturing Co. Ltd.
• Emerson Electric Co.
• Analog Devices, Inc.
• AstraZeneca PLC
• Janus Living, Inc.
Top Detractors¹
• SAP SE
• Cisco Systems, Inc.
• General Dynamics Corp.
• The Home Depot, Inc.
• Microsoft Corp.
*Benchmark = 40% S&P 500 TR Index / 60% Bloomberg Intermediate US Govt/Credit TR Index Value Unhedged
¹ Attribution figures and contributor rankings are from Bloomberg.
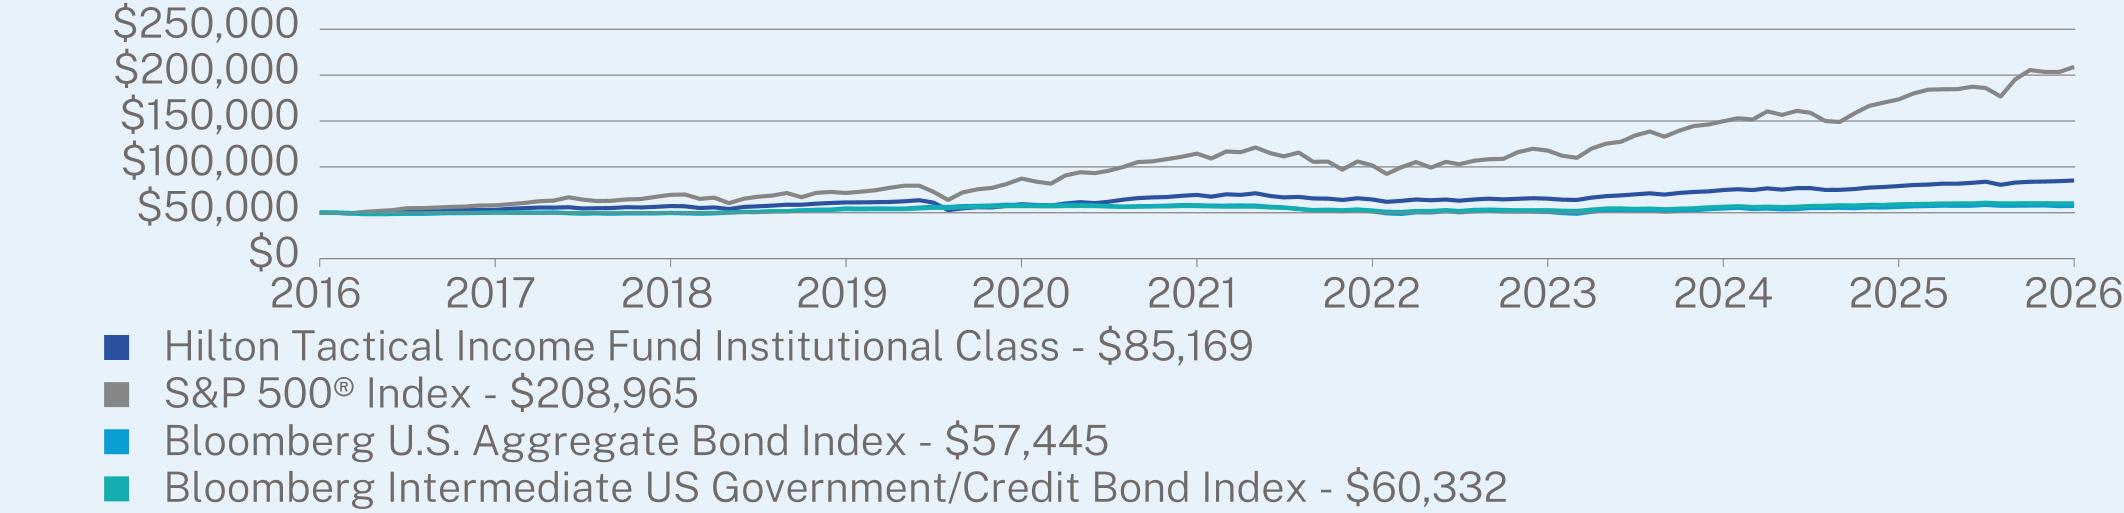
ANNUAL AVERAGE TOTAL RETURN (%)
|
|
1 Year
|
5 Year
|
10 Year
|
|
Institutional Class (without sales charge)
|
7.65
|
4.16
|
5.47
|
|
S&P 500® Index
|
20.38
|
12.79
|
15.37
|
|
Bloomberg U.S. Aggregate Bond Index
|
1.89
|
-0.29
|
1.40
|
|
Bloomberg Intermediate US Government/Credit Bond Index
|
1.80
|
1.05
|
1.90
|
Visit https://connect.rightprospectus.com/Direxion for more recent performance information.
KEY FUND STATISTICS (as of August 31, 2026)
|
Net Assets
|
$133,600,484
|
|
Number of Holdings
|
101
|
|
Net Advisory Fee
|
$802,607
|
|
Portfolio Turnover
|
86%
|
|
Distribution Yield - Institutional Class
|
6.58%
|
WHAT DID THE FUND INVEST IN? (as of August 31, 2026)
|
Top Holdings
|
(%)
|
|
|
iShares 0-3 Month Treasury Bond ETF
|
7.5
|
%
|
|
JPMorgan Nasdaq Equity Premium Income ETF
|
5.8
|
%
|
|
Vanguard Intermediate-Term Corporate Bond ETF
|
4.6
|
%
|
|
JPMorgan Income ETF
|
4.4
|
%
|
|
Janus Henderson AAA CLO ETF
|
4.4
|
%
|
|
Vanguard International High Dividend Yield ETF
|
4.1
|
%
|
|
Vanguard Intermediate-Term Treasury ETF
|
3.7
|
%
|
|
JPMorgan Equity Premium Income ETF
|
2.8
|
%
|
|
Invesco S&P 500 Equal Weight Income Advantage ETF
|
2.5
|
%
|
|
Microsoft Corp.
|
2.4
|
%
|
|
Security Type
|
(%)
|
|
|
Investment Companies
|
46.7
|
%
|
|
Common Stocks
|
30.4
|
%
|
|
Corporate Bonds
|
17.6
|
%
|
|
U.S. Treasury Securities
|
2.0
|
%
|
|
Convertible Preferred Stocks
|
0.6
|
%
|
|
Cash & Other
|
2.7
|
%
|
|
Market Exposure
|
(%)
|
|
Fixed Income
|
51.1%
|
|
Equity
|
46.2%
|
|
Other
|
2.7%
|
|
Total (as % of net assets)
|
100.0%
|