
Third Quarter 2026 Supplemental Operating and Financial Data
Table of Contents
Financial Results: Earnings Release |
|
|
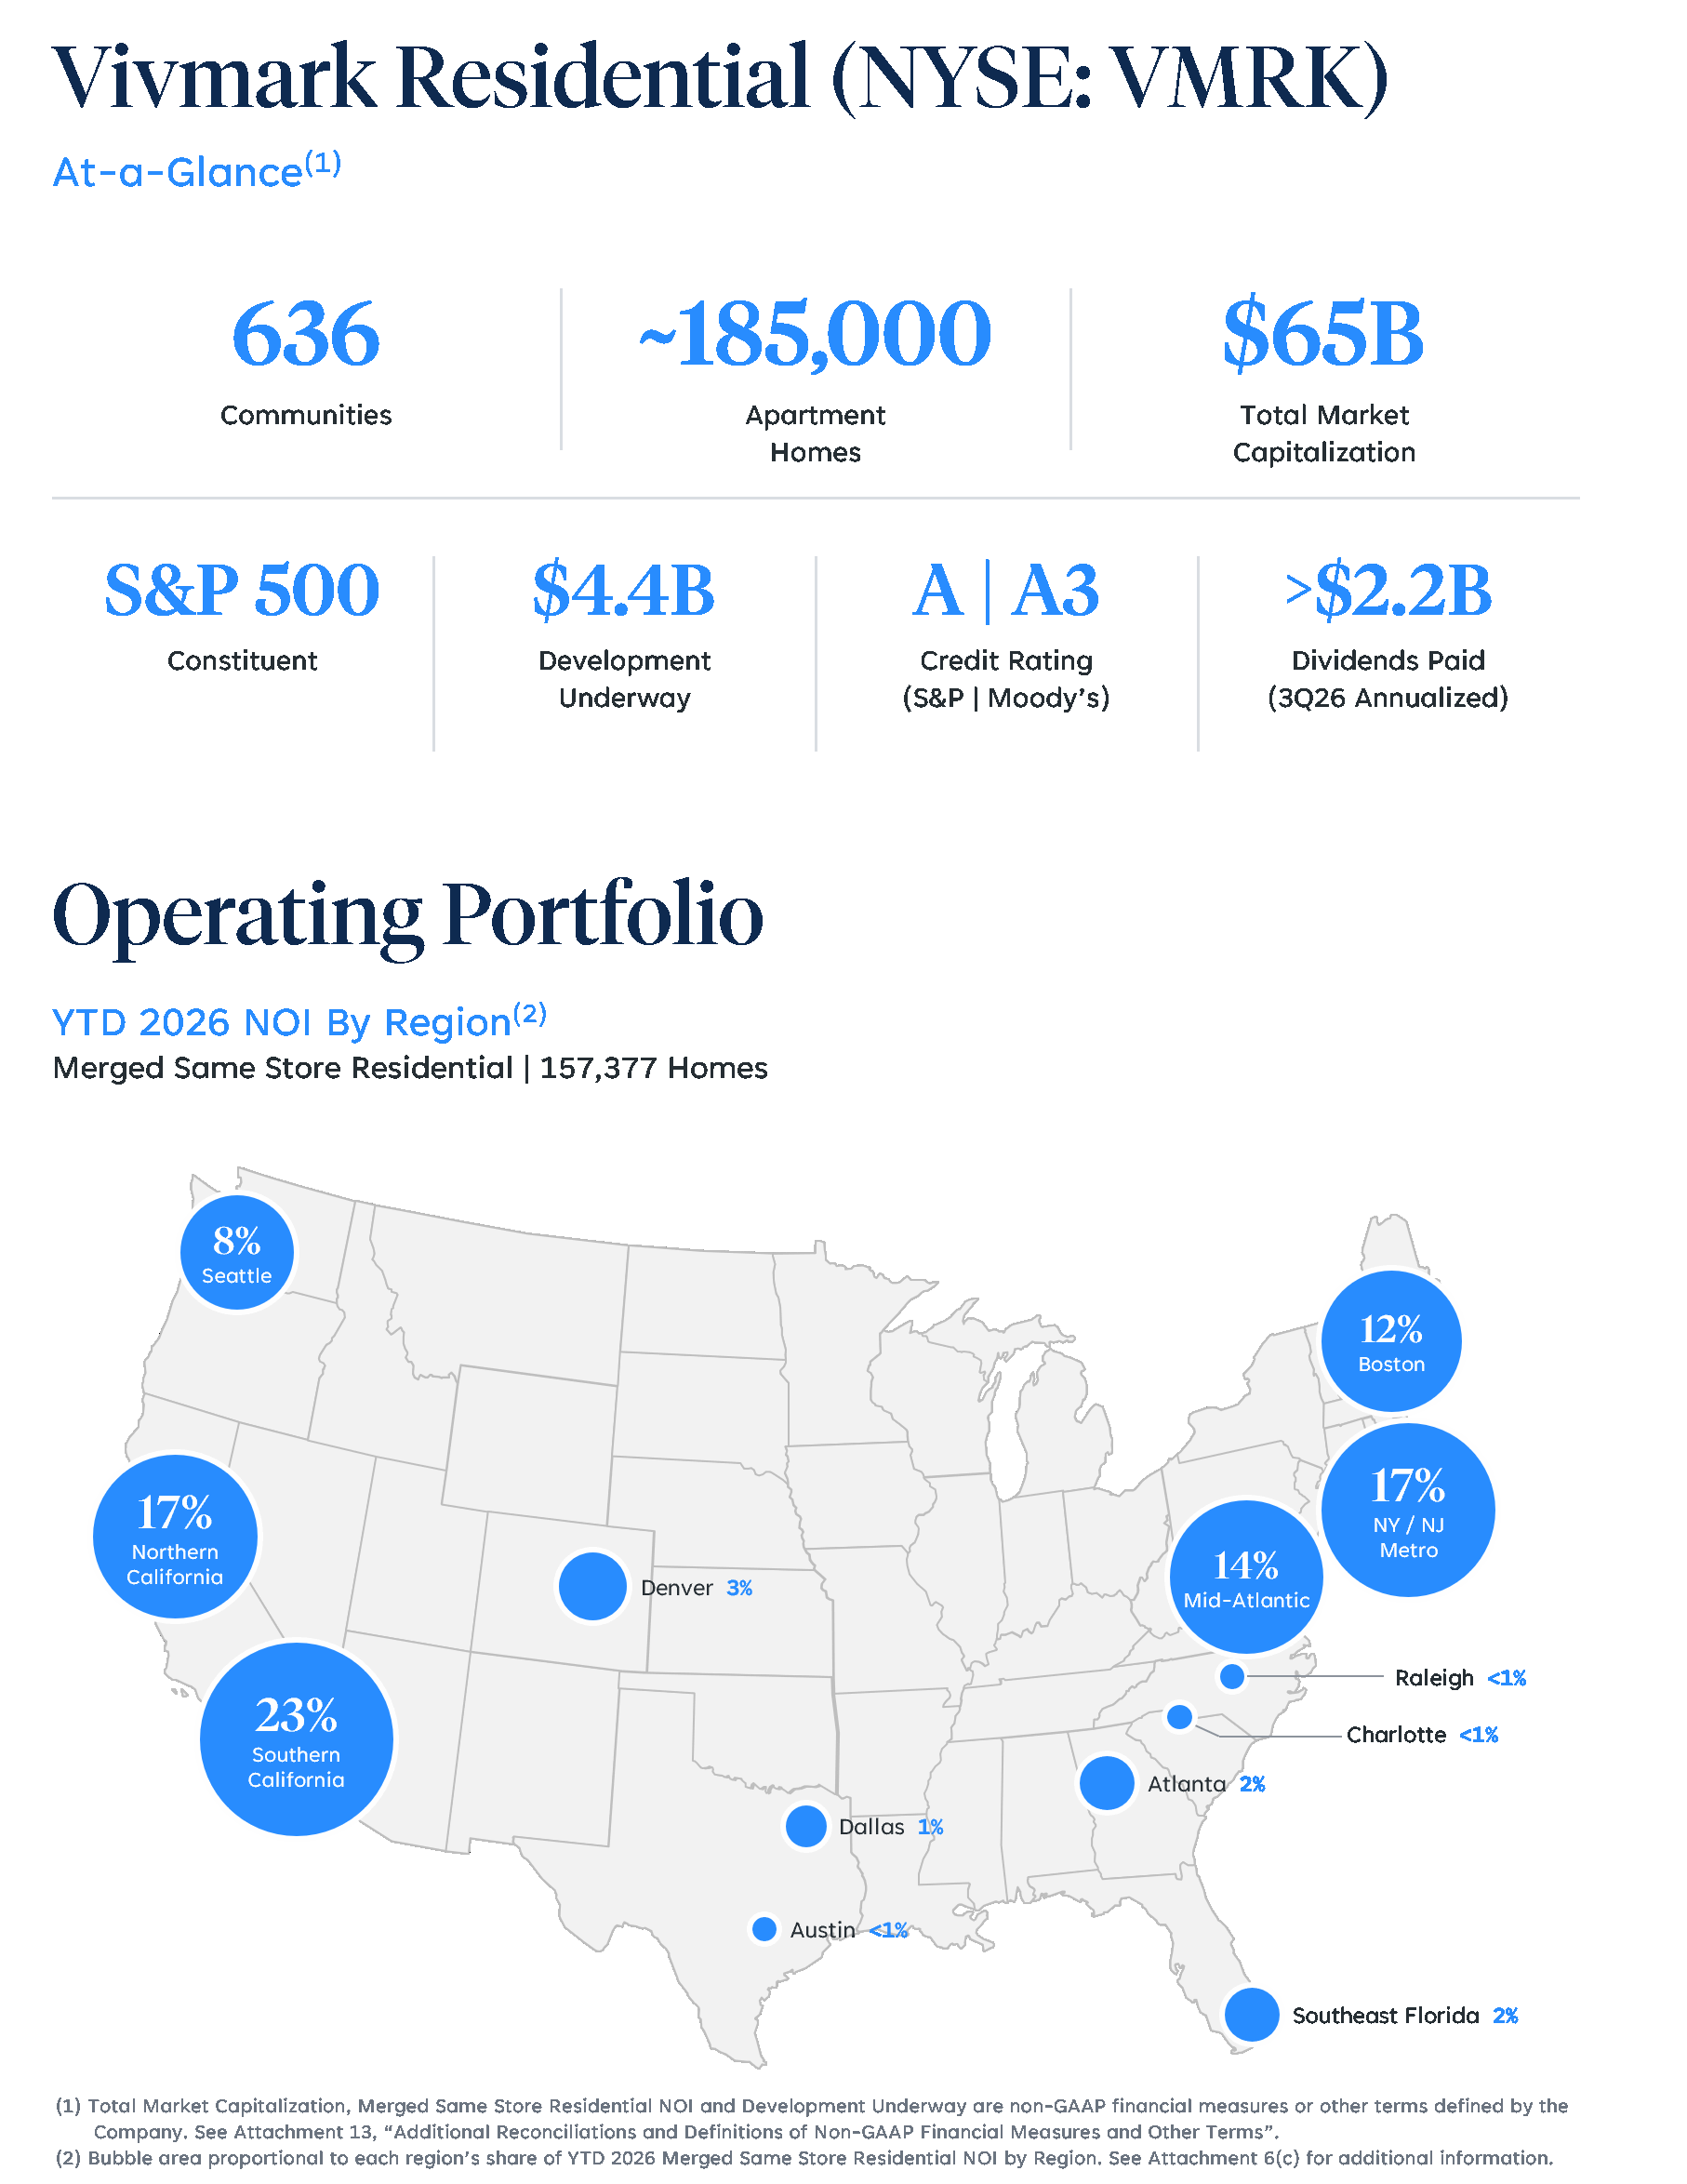
Vivmark Residential At-A-Glance |
|
|
Consolidated Statements of Operations |
|
|
Consolidated Statements of Funds From Operations and Core Funds From Operations |
|
|
Consolidated Balance Sheets |
|
|
Portfolio: Portfolio Summary |
|
|
Merged Same Store Residential Results: Merged Same Store Residential Financial Information and Blended Rate |
|
|
Merged Same Store Residential Results and Statistics by Region |
|
|
Merged Same Store Residential Operating Expenses |
|
|
Capital Structure: Capital Structure |
|
|
Debt Information: Debt Summary and Debt Maturity Schedule |
|
|
Development: Development Communities |
|
|
Partially Owned: Partially Owned Communities |
|
|
Structured Investment Program: Structured Investment Program |
|
|
Reconciliations & Definitions: Additional Reconciliations and Definitions of Non-GAAP Financial Measures and Other Terms |
|
Corporate Headquarters: |
|
Two North Riverside Plaza |
4040 Wilson Blvd., Suite 1000 |
Chicago, IL 60606 |
Arlington, Virginia 22203 |
(312) 474-1300 |
(703) 329-6300 |
|
|
|
Third Quarter 2026 Supplemental Operating and Financial Data
NEWS RELEASE - FOR IMMEDIATE RELEASE
November 4, 2026
Vivmark Residential Reports Third Quarter 2026 Results and Provides Fourth Quarter and Full Year 2026 Guidance
Arlington, VA / Chicago, IL – November 4, 2026 - Vivmark Residential (NYSE: VMRK) ("Vivmark" or the "Company") today reported results for the three and nine months ended September 30, 2026 as detailed below.
Commenting on the Company's performance, Benjamin W. Schall, President and CEO of the Company, said, “In our first quarter as Vivmark, we delivered operating results ahead of plan and are increasing our expectations for synergies and upfront value creation. In addition to these strong financial results, we are advancing our priorities of using our scale and capabilities to deliver more responsive service, better digital tools and greater convenience for our residents. As we look ahead to 2027, our strong operating momentum and outsized contributions from development communities completing and in lease up set the table for superior earnings growth. My huge thank you to our Vivmark team members for maintaining our discipline, executing at a high level, and advancing on our integration priorities. You are displaying the power of Vivmark.”
Merger Completion and Updates
On August 17, 2026 (the “Merger Date”), Equity Residential (“EQR”) and AvalonBay Communities, Inc. (“AVB”) completed their merger of equals (the “Merger”), forming Vivmark Residential. The Merger was accounted for as a reverse acquisition. EQR was the legal acquirer and AVB was the accounting acquirer. As a result:
Since the Merger Date, the Company has made progress on several key aspects of the Merger, including:
Third Quarter 2026 Supplemental Operating and Financial Data
Per share amounts and weighted average shares for periods before the Merger Date have been retroactively adjusted to reflect the Exchange Ratio. The operational and financial metrics disclosed in this earnings release and supplemental schedules represent a combination of those previously disclosed by AVB and EQR. The operational metrics generally reflect those previously presented by EQR and the financial metrics for development generally reflect those previously presented by AVB.
Q3 and YTD 2026 Results
|
|
|
|
|
|
|
|
|
|
|
|
|
|
|
||||
|
|
|
Three Months Ended September 30, |
|
|
|||||||||||||
|
|
|
2026 (1) |
|
|
2025 |
|
|
$ Change |
|
|
% Change |
|
|
||||
|
Earnings Per Share ("EPS") |
|
$ |
(1.27 |
) |
|
$ |
0.96 |
|
|
$ |
(2.23 |
) |
|
|
(232.3 |
%) |
|
|
Funds from Operations ("FFO") per share |
|
$ |
0.08 |
|
|
$ |
1.08 |
|
|
$ |
(1.00 |
) |
|
|
(92.6 |
%) |
|
|
Core FFO ("CFFO") per share |
|
$ |
1.03 |
|
|
$ |
0.98 |
|
|
$ |
0.05 |
|
|
|
5.1 |
% |
|
|
|
|
|
|
|
|
|
|
|
|
|
|
|
|
||||
|
|
|
|
|
|
|
|
|
|
|
|
|
|
|
||||
|
|
|
Nine Months Ended September 30, |
|
|
|||||||||||||
|
|
|
2026 (1) |
|
|
2025 |
|
|
$ Change |
|
|
% Change |
|
|
||||
|
Earnings Per Share ("EPS") |
|
$ |
(0.57 |
) |
|
$ |
2.23 |
|
|
$ |
(2.80 |
) |
|
|
(125.6 |
%) |
|
|
Funds from Operations ("FFO") per share |
|
$ |
1.77 |
|
|
$ |
3.08 |
|
|
$ |
(1.31 |
) |
|
|
(42.5 |
%) |
|
|
Core FFO ("CFFO") per share |
|
$ |
3.06 |
|
|
$ |
3.01 |
|
|
$ |
0.05 |
|
|
|
1.7 |
% |
|
|
|
|
|
|
|
|
|
|
|
|
|
|
|
|
||||
Commenting on the Company's operating performance, Michael Manelis, COO of the Company, said, "We are pleased with the performance of our combined portfolio in the third quarter, with strong physical occupancy and improving pricing momentum across much of the portfolio. Our teams have maintained an intense focus on operating fundamentals throughout the integration, and that discipline is reflected in our results. These strong fundamentals position us well for growth in 2027 and beyond as we use our scale and operating expertise to improve the resident experience and create a lasting competitive advantage with significant opportunities to drive sustainable NOI growth.”
Merged Same Store Residential Operating Statistics
Following the Merger, the Company's Same Store Portfolio includes communities that were owned and had Stabilized Operations as of the beginning of the prior year. Because the EQR communities have been owned by the Company only since the Merger Date, they are not included in the Company's Same Store Portfolio. The EQR communities will not be eligible to enter the Company's Same Store Portfolio until January 1, 2028. To provide relevant operating metrics for the quarter and year-to-date results, and an understanding of the operating performance and growth potential of the combined company, stabilized EQR communities that would otherwise have met the Company's Same Store criteria are presented on a merged basis, as if owned by the Company during all periods presented. The Merged Same Store Portfolio presentation below represents the Company's Same Store Portfolio and the EQR Adjusted Same Store Portfolio as a single portfolio. See Attachment 13, "Additional Reconciliations and Definitions of Non-GAAP Financial Measures and Other Terms," for more details.
Third Quarter 2026 Supplemental Operating and Financial Data
Operating results for the Merged Same Store Portfolio of 157,377 apartment homes are presented below:
|
|
Q3 2026 vs. Q3 2025 |
|
YTD 2026 vs. YTD 2025 |
Physical Occupancy |
|
95.8% vs. 95.9% |
|
95.9% vs. 96.0% |
Turnover |
|
12.7% vs. 13.2% |
|
31.8% vs. 32.8% |
|
|
|
|
|
Revenues |
|
2.4% |
|
2.1% |
Expenses |
|
3.6% |
|
3.7% |
NOI |
|
1.7% |
|
1.3% |
|
|
Q3 2026 |
|
Q2 2026 |
|
Q1 2026 |
Physical Occupancy |
|
95.8% |
|
95.9% |
|
96.0% |
New Lease Change |
|
0.4% |
|
1.1% |
|
(3.4%) |
Renewal Rate Achieved |
|
5.3% |
|
4.9% |
|
4.0% |
Blended Rate |
|
3.1% |
|
3.2% |
|
0.5% |
Development Activity
As of quarter-end, the Company's development activity, including communities under construction and those completed this quarter, represented a Total Capital Cost of $3.8 billion and a weighted average Projected NOI as a percentage of Total Capital Cost of 6.2%.
During the quarter and year-to-date, the Company reported the following development activity, which reflects AVB alone before the Merger Date and the combined Company after it:
|
|
Q3 2026 |
|
|
YTD 2026 |
|
||
Development Completions: |
|
|
|
|
|
|
||
Wholly-Owned Communities |
|
|
|
|
|
|
||
Communities |
|
|
2 |
|
|
|
4 |
|
Total apartment homes |
|
|
761 |
|
|
|
1,516 |
|
Total Capital Cost |
|
$291 million |
|
|
$539 million |
|
||
|
|
|
|
|
|
|
||
Partially Owned Communities – Unconsolidated |
|
|
|
|
|
|
||
Communities |
|
|
1 |
|
|
|
1 |
|
Total apartment homes |
|
|
270 |
|
|
|
270 |
|
Total Capital Cost |
|
$122 million |
|
|
$122 million |
|
||
|
|
|
|
|
|
|
||
Development Starts: |
|
|
|
|
|
|
||
Wholly-Owned Communities |
|
|
|
|
|
|
||
Communities |
|
|
1 |
|
|
|
6 |
|
Total apartment homes |
|
|
281 |
|
|
|
1,528 |
|
Total Capital Cost |
|
$98 million |
|
|
$571 million |
|
||
Transaction Activity
During the quarter and year-to-date, the Company completed the following transactions, which reflects AVB alone before the Merger Date and the combined Company after it:
|
|
Q3 2026 |
|
|
YTD 2026 |
|
||
Dispositions: |
|
|
|
|
|
|
||
Wholly-owned communities |
|
|
2 |
|
|
|
5 |
|
Total apartment homes |
|
|
467 |
|
|
|
1,351 |
|
Sales price |
|
$208 million |
|
|
$549 million |
|
||
GAAP gain |
|
$108 million |
|
|
$288 million |
|
||
Economic Gain |
|
$51 million |
|
|
$87 million |
|
||
Third Quarter 2026 Supplemental Operating and Financial Data
Capital Markets & Balance Sheet:
As of quarter-end, the Company had:
Unsecured Revolving Credit Facility commitment |
|
$5.0 billion |
|
|
Commercial paper balance outstanding |
|
(1.0) billion |
|
|
Available liquidity |
|
$4.0 billion |
|
|
|
|
|
|
|
Total outstanding shares and units |
|
|
787,476,763 |
|
Distributions declared per Common Share and Unit outstanding |
|
$0.7025 |
|
|
During the quarter, the Company completed the following activity:
|
|
Total |
|
Weighted Average |
|
|
Debt Repayments: |
|
|
|
|
|
|
Unsecured notes (at par) (1) |
|
$92.0 million |
|
|
7.57 |
% |
Fixed-rate secured mortgages |
|
$185.1 million |
|
|
3.61 |
% |
|
|
Shares |
|
Net Proceeds |
Equity Issuances: |
|
|
|
|
Settlement of forward equity contracts (1) |
|
2.57 million |
|
$202.0 million |
In addition, in August 2026, prior to completing the Merger, EQR issued $600.0 million aggregate principal amount of 4.95% coupon notes due October 1, 2031, and $400.0 million aggregate principal amount of 5.45% coupon notes due October 1, 2036, in a public offering.
Fourth Quarter 2026 and Full Year 2026 Guidance
The Company has established the following guidance for fourth quarter 2026 EPS, FFO per share and Core FFO per share, and full year 2026 Merged Same Store operating performance:
|
|
Q4 2026 |
||||
|
|
Low |
|
Midpoint |
|
High |
|
|
|
|
|
|
|
Projected EPS |
|
$(0.95) |
|
$(0.93) |
|
$(0.91) |
Projected FFO per share |
|
$0.92 |
|
$0.94 |
|
$0.96 |
Projected Core FFO per share |
|
$1.01 |
|
$1.03 |
|
$1.05 |
|
|
|
|
|
|
|
|
|
Full Year 2026 |
||||
|
|
Low |
|
Midpoint |
|
High |
Revenue change |
|
2.0% |
|
2.2% |
|
2.4% |
Expense change |
|
4.1% |
|
4.4% (1) |
|
4.7% |
NOI change |
|
0.8% |
|
1.1% |
|
1.4% |
About Vivmark Residential
Vivmark Residential (NYSE: VMRK), a S&P 500 company, sets the mark for what home can be, and our vision is to be the most trusted and best-performing rental housing company in America, one that only gets better as it grows. Our people, scale and capabilities create a self-reinforcing performance cycle that is designed to deliver structurally higher growth.
Third Quarter 2026 Supplemental Operating and Financial Data
With more than 185,000 apartment homes across premier U.S. markets and $4.4 billion of Development Underway, Vivmark is redefining what rental housing can be. For more details, please visit www.VivmarkResidential.com.
Forward-Looking Statements, Definitions and Non-GAAP Reconciliations
See Attachment 13 for information about forward-looking statements and definitions and reconciliations of non-GAAP financial measures and other terms. For the reasons described in the referenced forward-looking statements, the Company's historical results may not be indicative of future results.
The Company will hold a conference call on November 5, 2026 at 1:00 PM ET to discuss and answer questions about these results. Please visit the Investor section of the Company’s website at www.VivmarkResidential.com for the webcast link.
Third Quarter 2026 Supplemental Operating and Financial Data
Attachment 1
Consolidated Statements of Operations
(Amounts in thousands except per share data) (Unaudited)
|
|
Three Months Ended September 30, |
|
|
Nine Months Ended September 30, |
|
||||||||||
|
|
2026 |
|
|
2025 |
|
|
2026 |
|
|
2025 |
|
||||
REVENUES |
|
|
|
|
|
|
|
|
|
|
|
|
||||
Rental income |
|
$ |
1,193,530 |
|
|
$ |
764,926 |
|
|
$ |
2,737,962 |
|
|
$ |
2,267,665 |
|
Management, development and other fees |
|
|
1,954 |
|
|
|
1,870 |
|
|
|
5,568 |
|
|
|
5,204 |
|
Total revenues |
|
|
1,195,484 |
|
|
|
766,796 |
|
|
|
2,743,530 |
|
|
|
2,272,869 |
|
|
|
|
|
|
|
|
|
|
|
|
|
|
||||
EXPENSES |
|
|
|
|
|
|
|
|
|
|
|
|
||||
Property operating, excluding property taxes |
|
|
245,277 |
|
|
|
164,342 |
|
|
|
559,223 |
|
|
|
464,748 |
|
Property taxes |
|
|
147,492 |
|
|
|
89,749 |
|
|
|
327,715 |
|
|
|
257,611 |
|
Property management |
|
|
56,273 |
|
|
|
39,062 |
|
|
|
136,471 |
|
|
|
116,653 |
|
General and administrative |
|
|
118,308 |
|
|
|
22,052 |
|
|
|
167,521 |
|
|
|
64,828 |
|
Expensed development and pursuit costs |
|
|
5,017 |
|
|
|
1,392 |
|
|
|
16,042 |
|
|
|
8,629 |
|
Transaction costs |
|
|
464,321 |
|
|
|
— |
|
|
|
476,688 |
|
|
|
— |
|
Depreciation |
|
|
897,976 |
|
|
|
230,371 |
|
|
|
1,364,056 |
|
|
|
679,989 |
|
Interest expense |
|
|
123,791 |
|
|
|
68,172 |
|
|
|
268,652 |
|
|
|
197,933 |
|
Casualty and impairment loss |
|
|
2,374 |
|
|
|
— |
|
|
|
6,993 |
|
|
|
858 |
|
Total expenses |
|
|
2,060,829 |
|
|
|
615,140 |
|
|
|
3,323,361 |
|
|
|
1,791,249 |
|
|
|
|
|
|
|
|
|
|
|
|
|
|
||||
Gain (loss) on sale of communities |
|
|
108,304 |
|
|
|
180,155 |
|
|
|
287,877 |
|
|
|
336,081 |
|
Income (loss) from unconsolidated real estate |
|
|
(5,811 |
) |
|
|
137 |
|
|
|
(6,286 |
) |
|
|
552 |
|
Non-operating gains (losses) |
|
|
3,593 |
|
|
|
42,454 |
|
|
|
5,516 |
|
|
|
43,849 |
|
Other income (expense), net |
|
|
11,446 |
|
|
|
9,594 |
|
|
|
29,933 |
|
|
|
27,740 |
|
Income (loss) before income taxes |
|
|
(747,813 |
) |
|
|
383,996 |
|
|
|
(262,791 |
) |
|
|
889,842 |
|
Tax benefit (expense) |
|
|
672 |
|
|
|
166 |
|
|
|
832 |
|
|
|
772 |
|
Net income (loss) |
|
|
(747,141 |
) |
|
|
384,162 |
|
|
|
(261,959 |
) |
|
|
890,614 |
|
Net (income) loss attributable to noncontrolling |
|
|
|
|
|
|
|
|
|
|
|
|
||||
Operating Partnership and DownREIT Units |
|
|
11,027 |
|
|
|
(2,856 |
) |
|
|
7,294 |
|
|
|
(4,046 |
) |
Partially Owned Communities |
|
|
966 |
|
|
|
— |
|
|
|
966 |
|
|
|
— |
|
Net income (loss) attributable to controlling interests |
|
|
(735,148 |
) |
|
|
381,306 |
|
|
|
(253,699 |
) |
|
|
886,568 |
|
Preferred distributions |
|
|
(355 |
) |
|
|
— |
|
|
|
(355 |
) |
|
|
— |
|
Net income (loss) available to Common Shares |
|
$ |
(735,503 |
) |
|
$ |
381,306 |
|
|
$ |
(254,054 |
) |
|
$ |
886,568 |
|
|
|
|
|
|
|
|
|
|
|
|
|
|
||||
Earnings per share – diluted: |
|
|
|
|
|
|
|
|
|
|
|
|
||||
Net income (loss) available to Common Shares |
|
$ |
(1.27 |
) |
|
$ |
0.96 |
|
|
$ |
(0.57 |
) |
|
$ |
2.23 |
|
Weighted average Common Shares outstanding |
|
|
585,438 |
|
|
|
397,934 |
|
|
|
457,324 |
|
|
|
398,032 |
|
Third Quarter 2026 Supplemental Operating and Financial Data
Attachment 2
Consolidated Statements of Funds From Operations and Core Funds From Operations
(Amounts in thousands except per share and Unit data) (Unaudited)
|
|
Three Months Ended September 30, |
|
|
Nine Months Ended September 30, |
|
||||||||||
|
|
2026 |
|
|
2025 |
|
|
2026 |
|
|
2025 |
|
||||
Net income (loss) |
|
$ |
(747,141 |
) |
|
$ |
384,162 |
|
|
$ |
(261,959 |
) |
|
$ |
890,614 |
|
Net (income) loss attributable to Noncontrolling |
|
966 |
|
|
|
— |
|
|
|
966 |
|
|
|
— |
|
|
Preferred distributions |
|
|
(355 |
) |
|
|
— |
|
|
|
(355 |
) |
|
|
— |
|
Net income (loss) available to Common Shares and Units |
|
(746,530 |
) |
|
|
384,162 |
|
|
|
(261,348 |
) |
|
|
890,614 |
|
|
|
|
|
|
|
|
|
|
|
|
|
|
|
||||
Adjustments: |
|
|
|
|
|
|
|
|
|
|
|
|
||||
Real estate depreciation |
|
|
898,675 |
|
|
|
227,962 |
|
|
|
1,359,596 |
|
|
|
674,853 |
|
Net (gain) loss on sale of real estate |
|
|
(108,304 |
) |
|
|
(180,155 |
) |
|
|
(287,877 |
) |
|
|
(336,081 |
) |
Casualty loss on real estate |
|
|
2,374 |
|
|
|
— |
|
|
|
6,993 |
|
|
|
858 |
|
FFO available to Common Shares and Units |
|
|
46,215 |
|
|
|
431,969 |
|
|
|
817,364 |
|
|
|
1,230,244 |
|
|
|
|
|
|
|
|
|
|
|
|
|
|
||||
Adjustments: |
|
|
|
|
|
|
|
|
|
|
|
|
||||
Unconsolidated investment activity |
|
|
530 |
|
|
|
— |
|
|
|
1,777 |
|
|
|
— |
|
Loan reserve adjustment |
|
|
(202 |
) |
|
|
236 |
|
|
|
(365 |
) |
|
|
6 |
|
Hedge accounting activity |
|
|
159 |
|
|
|
2 |
|
|
|
171 |
|
|
|
24 |
|
Advocacy contributions |
|
|
— |
|
|
|
150 |
|
|
|
2,659 |
|
|
|
237 |
|
Severance |
|
|
40 |
|
|
|
751 |
|
|
|
1,227 |
|
|
|
953 |
|
Expensed development and pursuit costs |
|
|
4,075 |
|
|
|
503 |
|
|
|
13,374 |
|
|
|
5,798 |
|
Merger-related costs (1) |
|
|
544,040 |
|
|
|
— |
|
|
|
556,407 |
|
|
|
— |
|
(Gain) loss on extinguishment of debt |
|
|
2,028 |
|
|
|
— |
|
|
|
2,028 |
|
|
|
— |
|
Merger accounting interest expense adjustment (2) |
|
|
8,344 |
|
|
|
— |
|
|
|
8,344 |
|
|
|
— |
|
Non-operating (gains) losses |
|
|
(3,587 |
) |
|
|
(42,477 |
) |
|
|
(5,489 |
) |
|
|
(43,759 |
) |
Legal settlements and costs |
|
|
7,409 |
|
|
|
3,252 |
|
|
|
16,500 |
|
|
|
8,828 |
|
Tax benefit (expense) |
|
|
(809 |
) |
|
|
(193 |
) |
|
|
(1,033 |
) |
|
|
(840 |
) |
Core FFO available to Common Shares and Units |
|
$ |
608,242 |
|
|
$ |
394,193 |
|
|
$ |
1,412,964 |
|
|
$ |
1,201,491 |
|
|
|
|
|
|
|
|
|
|
|
|
|
|
||||
FFO available to Common Shares and Units |
|
$ |
46,215 |
|
|
$ |
431,969 |
|
|
$ |
817,364 |
|
|
$ |
1,230,244 |
|
FFO per share and Unit – diluted |
|
$ |
0.08 |
|
|
$ |
1.08 |
|
|
$ |
1.77 |
|
|
$ |
3.08 |
|
|
|
|
|
|
|
|
|
|
|
|
|
|
||||
Core FFO available to Common Shares and Units |
|
$ |
608,242 |
|
|
$ |
394,193 |
|
|
$ |
1,412,964 |
|
|
$ |
1,201,491 |
|
Core FFO per share and Unit – diluted |
|
$ |
1.03 |
|
|
$ |
0.98 |
|
|
$ |
3.06 |
|
|
$ |
3.01 |
|
|
|
|
|
|
|
|
|
|
|
|
|
|
||||
Weighted average Common Shares and Units |
|
589,531 |
|
|
|
400,894 |
|
|
|
461,058 |
|
|
|
399,692 |
|
|
Third Quarter 2026 Supplemental Operating and Financial Data
Attachment 3
Consolidated Balance Sheets
(Amounts in thousands except for share amounts) (Unaudited)
|
|
September 30, |
|
|
December 31, |
|
||
|
|
2026 |
|
|
2025 |
|
||
ASSETS |
|
|
|
|
|
|
||
Operating real estate |
|
$ |
61,109,854 |
|
|
$ |
27,709,945 |
|
Less accumulated depreciation |
|
|
(9,898,933 |
) |
|
|
(8,686,084 |
) |
Operating real estate, net |
|
|
51,210,921 |
|
|
|
19,023,861 |
|
Construction in progress ("CIP"), including land |
|
|
1,689,500 |
|
|
|
1,458,795 |
|
Land held for development |
|
|
133,943 |
|
|
|
123,751 |
|
Real estate assets held for sale, net |
|
|
166,642 |
|
|
|
150,262 |
|
Total real estate, net |
|
|
53,201,006 |
|
|
|
20,756,669 |
|
|
|
|
|
|
|
|
||
Unconsolidated real estate investments and advances |
|
|
448,162 |
|
|
|
123,173 |
|
Cash and cash equivalents |
|
|
111,876 |
|
|
|
187,234 |
|
Restricted cash |
|
|
275,828 |
|
|
|
165,849 |
|
Deferred development costs |
|
|
74,161 |
|
|
|
73,237 |
|
Right of use lease assets |
|
|
690,130 |
|
|
|
147,537 |
|
Notes receivable |
|
|
310,208 |
|
|
|
259,051 |
|
Prepaid expenses and other assets |
|
|
867,925 |
|
|
|
479,387 |
|
Total assets |
|
$ |
55,979,296 |
|
|
$ |
22,192,137 |
|
|
|
|
|
|
|
|
||
LIABILITIES AND EQUITY |
|
|
|
|
|
|
||
Liabilities: |
|
|
|
|
|
|
||
Unsecured debt, net |
|
$ |
13,941,316 |
|
|
$ |
7,879,380 |
|
Line of credit and commercial paper, net |
|
|
1,021,255 |
|
|
|
739,608 |
|
Mortgage notes payable, net |
|
|
2,039,437 |
|
|
|
709,564 |
|
Distributions payable |
|
|
552,975 |
|
|
|
250,548 |
|
Lease liabilities |
|
|
415,652 |
|
|
|
165,200 |
|
Accounts payable and accrued expenses |
|
|
1,198,928 |
|
|
|
480,120 |
|
Other liabilities |
|
|
221,723 |
|
|
|
133,400 |
|
Total liabilities |
|
|
19,391,286 |
|
|
|
10,357,820 |
|
|
|
|
|
|
|
|
||
Redeemable Noncontrolling Interests – Operating Partnership |
|
|
169,781 |
|
|
|
— |
|
Equity: |
|
|
|
|
|
|
||
Shareholders' equity: |
|
|
|
|
|
|
||
Preferred Shares of beneficial interest, $0.01 par value; |
|
|
17,155 |
|
|
|
— |
|
Common Shares of beneficial interest, $0.01 par value; |
|
|
7,734 |
|
|
|
3,912 |
|
Additional paid-in-capital |
|
|
36,739,697 |
|
|
|
11,209,785 |
|
Retained earnings (loss) |
|
|
(1,038,322 |
) |
|
|
371,157 |
|
Accumulated other comprehensive income (loss) |
|
|
57,580 |
|
|
|
26,486 |
|
Total shareholders’ equity |
|
|
35,783,844 |
|
|
|
11,611,340 |
|
Noncontrolling interests: |
|
|
|
|
|
|
||
Operating Partnership and DownREIT Units |
|
|
533,158 |
|
|
|
222,977 |
|
Partially Owned Communities |
|
|
101,227 |
|
|
|
— |
|
Total noncontrolling interests |
|
|
634,385 |
|
|
|
222,977 |
|
Total equity |
|
|
36,418,229 |
|
|
|
11,834,317 |
|
Total liabilities and equity |
|
$ |
55,979,296 |
|
|
$ |
22,192,137 |
|
Third Quarter 2026 Supplemental Operating and Financial Data
Attachment 4
Portfolio Summary
As of September 30, 2026
Regions |
|
Communities |
|
Apartment Homes |
Boston, MA |
|
69 |
|
18,103 |
Metro NY/NJ |
|
89 |
|
26,007 |
Mid-Atlantic |
|
85 |
|
29,048 |
North Carolina |
|
15 |
|
4,167 |
Atlanta, GA |
|
24 |
|
6,940 |
Southeast FL |
|
13 |
|
4,154 |
Texas |
|
33 |
|
10,599 |
Denver, CO |
|
28 |
|
7,944 |
Seattle, WA |
|
60 |
|
14,412 |
Northern California |
|
81 |
|
24,667 |
Southern California |
|
139 |
|
39,171 |
Total |
|
636 |
|
185,212 |
|
|
Communities |
|
Apartment Homes |
Operating Communities |
|
575 |
|
166,327 |
Development Communities |
|
35 |
|
11,740 |
Wholly Owned Communities |
|
610 |
|
178,067 |
|
|
|
|
|
Operating Communities |
|
13 |
|
3,096 |
Partially Owned Communities – Consolidated |
|
13 |
|
3,096 |
|
|
|
|
|
Operating Communities |
|
13 |
|
4,049 |
Partially Owned Communities – Unconsolidated |
|
13 |
|
4,049 |
|
|
|
|
|
Total |
|
636 |
|
185,212 |
Note: Development Communities are included in the Portfolio Summary upon the start of construction.
Third Quarter 2026 Supplemental Operating and Financial Data
Attachment 5
Merged Same Store Residential Financial Information by Quarter
157,377 Merged Same Store Apartment Homes | ($ in thousands)
|
|
Q3 2026 |
|
|
Q2 2026 |
|
|
Q1 2026 |
|
|
Q4 2025 |
|
|
Q3 2025 |
|
|||||
Revenues |
|
$ |
1,473,916 |
|
|
$ |
1,460,333 |
|
|
$ |
1,443,526 |
|
|
$ |
1,438,657 |
|
|
$ |
1,440,041 |
|
Expenses |
|
|
497,374 |
|
|
|
474,552 |
|
|
|
482,127 |
|
|
|
464,242 |
|
|
|
480,025 |
|
NOI |
|
$ |
976,542 |
|
|
$ |
985,781 |
|
|
$ |
961,399 |
|
|
$ |
974,415 |
|
|
$ |
960,016 |
|
Merged Same Store Residential Blended Rate by Region
157,377 Merged Same Store Apartment Homes
Regions |
|
Q3 2026 |
|
|
Q2 2026 |
|
|
Q1 2026 |
|
|
Q4 2025 |
|
|
Q3 2025 |
|
|||||
Boston, MA |
|
|
2.3 |
% |
|
|
3.5 |
% |
|
|
(1.0 |
%) |
|
|
(1.5 |
%) |
|
|
2.1 |
% |
Metro NY/NJ |
|
|
4.4 |
% |
|
|
5.2 |
% |
|
|
1.8 |
% |
|
|
0.8 |
% |
|
|
2.1 |
% |
Mid-Atlantic |
|
|
0.4 |
% |
|
|
1.1 |
% |
|
|
(2.9 |
%) |
|
|
(2.2 |
%) |
|
|
1.5 |
% |
North Carolina |
|
|
1.9 |
% |
|
|
0.5 |
% |
|
|
(1.5 |
%) |
|
|
(4.4 |
%) |
|
|
(4.2 |
%) |
Atlanta, GA |
|
|
1.8 |
% |
|
|
2.6 |
% |
|
|
(3.9 |
%) |
|
|
(4.3 |
%) |
|
|
(2.2 |
%) |
Southeast FL |
|
|
1.1 |
% |
|
|
(1.1 |
%) |
|
|
0.3 |
% |
|
|
0.2 |
% |
|
|
0.9 |
% |
Texas |
|
|
0.2 |
% |
|
|
0.4 |
% |
|
|
(4.8 |
%) |
|
|
(5.7 |
%) |
|
|
(3.5 |
%) |
Denver, CO |
|
|
(2.7 |
%) |
|
|
(1.1 |
%) |
|
|
(8.1 |
%) |
|
|
(9.3 |
%) |
|
|
(5.3 |
%) |
Seattle, WA |
|
|
0.8 |
% |
|
|
0.9 |
% |
|
|
(1.0 |
%) |
|
|
(2.0 |
%) |
|
|
(0.5 |
%) |
Northern California |
|
|
10.2 |
% |
|
|
8.8 |
% |
|
|
5.8 |
% |
|
|
3.0 |
% |
|
|
4.9 |
% |
Southern California |
|
|
1.4 |
% |
|
|
1.2 |
% |
|
|
0.7 |
% |
|
|
(0.4 |
%) |
|
|
1.0 |
% |
Total |
|
|
3.1 |
% |
|
|
3.2 |
% |
|
|
0.5 |
% |
|
|
(0.6 |
%) |
|
|
1.6 |
% |
Other Community Merged NOI
($ in thousands)
In addition to the Merged SS NOI presented above, the following table presents Merged NOI for Q3 2026 from the Company’s residential communities not included in the Merged Same Store Portfolio and from its commercial operations, providing a complete view of NOI for the combined portfolio, excluding communities disposed or classified as held-for-sale.
|
|
Q3 2026 |
|
|
Merged Other Stabilized & Non-Residential NOI |
|
$ |
55,106 |
|
Merged Development/Redevelopment NOI |
|
|
17,754 |
|
Total Other Community Merged NOI |
|
$ |
72,860 |
|
Third Quarter 2026 Supplemental Operating and Financial Data
Attachment 6 (a)
Merged Same Store Residential Financial and Operational Information by Region
Q3 2026 vs. Q3 2025
($ in thousands)
|
|
|
|
|
|
|
|
Revenues |
|
|
Expenses |
|
|
NOI |
|
|||||||||||||||||||||||||||||
Regions |
|
Apt. |
|
|
Q3 2026 Physical Occupancy |
|
|
Q3 2026 |
|
|
Q3 2025 |
|
|
% |
|
|
Q3 2026 |
|
|
Q3 2025 |
|
|
% |
|
|
Q3 2026 |
|
|
Q3 2025 |
|
|
% |
|
|||||||||||
Boston, MA |
|
|
16,606 |
|
|
|
95.8 |
% |
|
$ |
181,558 |
|
|
$ |
178,412 |
|
|
|
1.8 |
% |
|
$ |
61,268 |
|
|
$ |
57,854 |
|
|
|
5.9 |
% |
|
$ |
120,290 |
|
|
$ |
120,558 |
|
|
|
(0.2 |
%) |
Metro NY/NJ |
|
|
21,030 |
|
|
|
96.3 |
% |
|
|
272,351 |
|
|
|
263,810 |
|
|
|
3.2 |
% |
|
|
100,613 |
|
|
|
99,103 |
|
|
|
1.5 |
% |
|
|
171,738 |
|
|
|
164,707 |
|
|
|
4.3 |
% |
Mid-Atlantic |
|
|
26,208 |
|
|
|
95.0 |
% |
|
|
209,855 |
|
|
|
208,588 |
|
|
|
0.6 |
% |
|
|
73,916 |
|
|
|
70,849 |
|
|
|
4.3 |
% |
|
|
135,939 |
|
|
|
137,739 |
|
|
|
(1.3 |
%) |
North Carolina |
|
|
1,225 |
|
|
|
93.0 |
% |
|
|
6,871 |
|
|
|
6,955 |
|
|
|
(1.2 |
%) |
|
|
2,894 |
|
|
|
2,732 |
|
|
|
5.9 |
% |
|
|
3,977 |
|
|
|
4,223 |
|
|
|
(5.8 |
%) |
Atlanta, GA |
|
|
4,126 |
|
|
|
95.8 |
% |
|
|
23,997 |
|
|
|
23,652 |
|
|
|
1.5 |
% |
|
|
8,475 |
|
|
|
8,137 |
|
|
|
4.2 |
% |
|
|
15,522 |
|
|
|
15,515 |
|
|
|
0.0 |
% |
Southeast FL |
|
|
3,091 |
|
|
|
95.8 |
% |
|
|
27,731 |
|
|
|
27,276 |
|
|
|
1.7 |
% |
|
|
10,571 |
|
|
|
9,705 |
|
|
|
8.9 |
% |
|
|
17,160 |
|
|
|
17,571 |
|
|
|
(2.3 |
%) |
Texas |
|
|
5,519 |
|
|
|
95.4 |
% |
|
|
29,728 |
|
|
|
29,816 |
|
|
|
(0.3 |
%) |
|
|
13,152 |
|
|
|
12,992 |
|
|
|
1.2 |
% |
|
|
16,576 |
|
|
|
16,824 |
|
|
|
(1.5 |
%) |
Denver, CO |
|
|
6,164 |
|
|
|
95.2 |
% |
|
|
37,873 |
|
|
|
40,370 |
|
|
|
(6.2 |
%) |
|
|
13,837 |
|
|
|
13,782 |
|
|
|
0.4 |
% |
|
|
24,036 |
|
|
|
26,588 |
|
|
|
(9.6 |
%) |
Seattle, WA |
|
|
13,674 |
|
|
|
95.6 |
% |
|
|
115,657 |
|
|
|
114,742 |
|
|
|
0.8 |
% |
|
|
36,363 |
|
|
|
34,309 |
|
|
|
6.0 |
% |
|
|
79,294 |
|
|
|
80,433 |
|
|
|
(1.4 |
%) |
Northern California |
|
|
22,438 |
|
|
|
97.0 |
% |
|
|
237,571 |
|
|
|
220,470 |
|
|
|
7.8 |
% |
|
|
69,401 |
|
|
|
69,200 |
|
|
|
0.3 |
% |
|
|
168,170 |
|
|
|
151,270 |
|
|
|
11.2 |
% |
Southern California |
|
|
37,296 |
|
|
|
95.5 |
% |
|
|
330,724 |
|
|
|
325,950 |
|
|
|
1.5 |
% |
|
|
106,884 |
|
|
|
101,362 |
|
|
|
5.4 |
% |
|
|
223,840 |
|
|
|
224,588 |
|
|
|
(0.3 |
%) |
Total |
|
|
157,377 |
|
|
|
95.8 |
% |
|
$ |
1,473,916 |
|
|
$ |
1,440,041 |
|
|
|
2.4 |
% |
|
$ |
497,374 |
|
|
$ |
480,025 |
|
|
|
3.6 |
% |
|
$ |
976,542 |
|
|
$ |
960,016 |
|
|
|
1.7 |
% |
Third Quarter 2026 Supplemental Operating and Financial Data
Attachment 6 (b)
Merged Same Store Residential Financial and Operational Information by Region
Q3 2026 vs. Q2 2026
($ in thousands)
|
|
|
|
|
|
|
|
Revenues |
|
|
Expenses |
|
|
NOI |
|
|||||||||||||||||||||||||||||
Regions |
|
Apt. |
|
|
Q3 2026 Physical Occupancy |
|
|
Q3 2026 |
|
|
Q2 2026 |
|
|
% |
|
|
Q3 2026 |
|
|
Q2 2026 |
|
|
% |
|
|
Q3 2026 |
|
|
Q2 2026 |
|
|
% |
|
|||||||||||
Boston, MA |
|
|
16,606 |
|
|
|
95.8 |
% |
|
$ |
181,558 |
|
|
$ |
179,649 |
|
|
|
1.1 |
% |
|
$ |
61,268 |
|
|
$ |
57,523 |
|
|
|
6.5 |
% |
|
$ |
120,290 |
|
|
$ |
122,126 |
|
|
|
(1.5 |
%) |
Metro NY/NJ |
|
|
21,030 |
|
|
|
96.3 |
% |
|
|
272,351 |
|
|
|
268,956 |
|
|
|
1.3 |
% |
|
|
100,613 |
|
|
|
100,644 |
|
|
|
(0.0 |
%) |
|
|
171,738 |
|
|
|
168,312 |
|
|
|
2.0 |
% |
Mid-Atlantic |
|
|
26,208 |
|
|
|
95.0 |
% |
|
|
209,855 |
|
|
|
208,961 |
|
|
|
0.4 |
% |
|
|
73,916 |
|
|
|
68,837 |
|
|
|
7.4 |
% |
|
|
135,939 |
|
|
|
140,124 |
|
|
|
(3.0 |
%) |
North Carolina |
|
|
1,225 |
|
|
|
93.0 |
% |
|
|
6,871 |
|
|
|
6,745 |
|
|
|
1.9 |
% |
|
|
2,894 |
|
|
|
2,881 |
|
|
|
0.5 |
% |
|
|
3,977 |
|
|
|
3,864 |
|
|
|
2.9 |
% |
Atlanta, GA |
|
|
4,126 |
|
|
|
95.8 |
% |
|
|
23,997 |
|
|
|
23,751 |
|
|
|
1.0 |
% |
|
|
8,475 |
|
|
|
8,496 |
|
|
|
(0.2 |
%) |
|
|
15,522 |
|
|
|
15,255 |
|
|
|
1.8 |
% |
Southeast FL |
|
|
3,091 |
|
|
|
95.8 |
% |
|
|
27,731 |
|
|
|
27,572 |
|
|
|
0.6 |
% |
|
|
10,571 |
|
|
|
10,498 |
|
|
|
0.7 |
% |
|
|
17,160 |
|
|
|
17,074 |
|
|
|
0.5 |
% |
Texas |
|
|
5,519 |
|
|
|
95.4 |
% |
|
|
29,728 |
|
|
|
29,668 |
|
|
|
0.2 |
% |
|
|
13,152 |
|
|
|
12,832 |
|
|
|
2.5 |
% |
|
|
16,576 |
|
|
|
16,836 |
|
|
|
(1.5 |
%) |
Denver, CO |
|
|
6,164 |
|
|
|
95.2 |
% |
|
|
37,873 |
|
|
|
38,679 |
|
|
|
(2.1 |
%) |
|
|
13,837 |
|
|
|
13,172 |
|
|
|
5.0 |
% |
|
|
24,036 |
|
|
|
25,507 |
|
|
|
(5.8 |
%) |
Seattle, WA |
|
|
13,674 |
|
|
|
95.6 |
% |
|
|
115,657 |
|
|
|
114,646 |
|
|
|
0.9 |
% |
|
|
36,363 |
|
|
|
35,503 |
|
|
|
2.4 |
% |
|
|
79,294 |
|
|
|
79,143 |
|
|
|
0.2 |
% |
Northern California |
|
|
22,438 |
|
|
|
97.0 |
% |
|
|
237,571 |
|
|
|
232,192 |
|
|
|
2.3 |
% |
|
|
69,401 |
|
|
|
63,554 |
|
|
|
9.2 |
% |
|
|
168,170 |
|
|
|
168,638 |
|
|
|
(0.3 |
%) |
Southern California |
|
|
37,296 |
|
|
|
95.5 |
% |
|
|
330,724 |
|
|
|
329,514 |
|
|
|
0.4 |
% |
|
|
106,884 |
|
|
|
100,612 |
|
|
|
6.2 |
% |
|
|
223,840 |
|
|
|
228,902 |
|
|
|
(2.2 |
%) |
Total |
|
|
157,377 |
|
|
|
95.8 |
% |
|
$ |
1,473,916 |
|
|
$ |
1,460,333 |
|
|
|
0.9 |
% |
|
$ |
497,374 |
|
|
$ |
474,552 |
|
|
|
4.8 |
% |
|
$ |
976,542 |
|
|
$ |
985,781 |
|
|
|
(0.9 |
%) |
|
|
|
|
|
|
|
|
|
|
|
|
|
|
|
|
|
|
|
|
|
|
|
|
|
|
|
|
|
|
|
|
|
|
|||||||||||
Third Quarter 2026 Supplemental Operating and Financial Data
Attachment 6 (c)
Merged Same Store Residential Financial and Operational Information by Region
YTD 2026 vs. YTD 2025
($ in thousands)
|
|
|
|
|
|
|
|
Revenues |
|
|
Expenses |
|
|
NOI |
|
|||||||||||||||||||||||||||||
Regions |
|
Apt. |
|
|
YTD 2026 Physical Occupancy |
|
|
YTD 2026 |
|
|
YTD 2025 |
|
|
% |
|
|
YTD 2026 |
|
|
YTD 2025 |
|
|
% |
|
|
YTD 2026 |
|
|
YTD 2025 |
|
|
% |
|
|||||||||||
Boston, MA |
|
|
16,606 |
|
|
|
95.6 |
% |
|
$ |
537,646 |
|
|
$ |
530,721 |
|
|
|
1.3 |
% |
|
$ |
178,393 |
|
|
$ |
169,128 |
|
|
|
5.5 |
% |
|
$ |
359,253 |
|
|
$ |
361,593 |
|
|
|
(0.6 |
%) |
Metro NY/NJ |
|
|
21,030 |
|
|
|
96.6 |
% |
|
|
807,096 |
|
|
|
782,643 |
|
|
|
3.1 |
% |
|
|
303,153 |
|
|
|
289,835 |
|
|
|
4.6 |
% |
|
|
503,943 |
|
|
|
492,808 |
|
|
|
2.3 |
% |
Mid-Atlantic |
|
|
26,208 |
|
|
|
95.3 |
% |
|
|
626,938 |
|
|
|
621,086 |
|
|
|
0.9 |
% |
|
|
213,230 |
|
|
|
200,937 |
|
|
|
6.1 |
% |
|
|
413,708 |
|
|
|
420,149 |
|
|
|
(1.5 |
%) |
North Carolina |
|
|
1,225 |
|
|
|
92.3 |
% |
|
|
20,410 |
|
|
|
20,833 |
|
|
|
(2.0 |
%) |
|
|
8,558 |
|
|
|
8,050 |
|
|
|
6.3 |
% |
|
|
11,852 |
|
|
|
12,783 |
|
|
|
(7.3 |
%) |
Atlanta, GA |
|
|
4,126 |
|
|
|
95.9 |
% |
|
|
71,220 |
|
|
|
71,401 |
|
|
|
(0.3 |
%) |
|
|
25,532 |
|
|
|
24,519 |
|
|
|
4.1 |
% |
|
|
45,688 |
|
|
|
46,882 |
|
|
|
(2.5 |
%) |
Southeast FL |
|
|
3,091 |
|
|
|
96.1 |
% |
|
|
82,967 |
|
|
|
82,059 |
|
|
|
1.1 |
% |
|
|
30,852 |
|
|
|
28,593 |
|
|
|
7.9 |
% |
|
|
52,115 |
|
|
|
53,466 |
|
|
|
(2.5 |
%) |
Texas |
|
|
5,519 |
|
|
|
95.5 |
% |
|
|
88,844 |
|
|
|
89,141 |
|
|
|
(0.3 |
%) |
|
|
38,055 |
|
|
|
40,039 |
|
|
|
(5.0 |
%) |
|
|
50,789 |
|
|
|
49,102 |
|
|
|
3.4 |
% |
Denver, CO |
|
|
6,164 |
|
|
|
95.7 |
% |
|
|
115,073 |
|
|
|
122,141 |
|
|
|
(5.8 |
%) |
|
|
39,883 |
|
|
|
40,911 |
|
|
|
(2.5 |
%) |
|
|
75,190 |
|
|
|
81,230 |
|
|
|
(7.4 |
%) |
Seattle, WA |
|
|
13,674 |
|
|
|
95.7 |
% |
|
|
343,927 |
|
|
|
341,593 |
|
|
|
0.7 |
% |
|
|
106,631 |
|
|
|
101,014 |
|
|
|
5.6 |
% |
|
|
237,296 |
|
|
|
240,579 |
|
|
|
(1.4 |
%) |
Northern California |
|
|
22,438 |
|
|
|
97.1 |
% |
|
|
696,947 |
|
|
|
654,876 |
|
|
|
6.4 |
% |
|
|
201,561 |
|
|
|
202,294 |
|
|
|
(0.4 |
%) |
|
|
495,386 |
|
|
|
452,582 |
|
|
|
9.5 |
% |
Southern California |
|
|
37,296 |
|
|
|
95.7 |
% |
|
|
986,707 |
|
|
|
972,425 |
|
|
|
1.5 |
% |
|
|
308,205 |
|
|
|
297,111 |
|
|
|
3.7 |
% |
|
|
678,502 |
|
|
|
675,314 |
|
|
|
0.5 |
% |
Total |
|
|
157,377 |
|
|
|
95.9 |
% |
|
$ |
4,377,775 |
|
|
$ |
4,288,919 |
|
|
|
2.1 |
% |
|
$ |
1,454,053 |
|
|
$ |
1,402,431 |
|
|
|
3.7 |
% |
|
$ |
2,923,722 |
|
|
$ |
2,886,488 |
|
|
|
1.3 |
% |
|
|
|
|
|
|
|
|
|
|
|
|
|
|
|
|
|
|
|
|
|
|
|
|
|
|
|
|
|
|
|
|
|
|
|||||||||||
Third Quarter 2026 Supplemental Operating and Financial Data
Attachment 7
Merged Same Store Residential Operating Expenses
Q3 2026 vs. Q3 2025
157,377 Merged Same Store Apartment Homes | ($ in thousands)
|
|
Q3 2026 |
|
|
Q3 2025 |
|
|
$ |
|
|
% |
|
|
% of |
|
|||||
Property taxes |
|
$ |
177,114 |
|
|
$ |
172,107 |
|
|
$ |
5,007 |
|
|
|
2.9 |
% |
|
|
35.6 |
% |
Payroll |
|
|
82,915 |
|
|
|
79,537 |
|
|
|
3,378 |
|
|
|
4.2 |
% |
|
|
16.7 |
% |
Repairs and maintenance |
|
|
80,963 |
|
|
|
78,993 |
|
|
|
1,970 |
|
|
|
2.5 |
% |
|
|
16.3 |
% |
Utilities |
|
|
94,243 |
|
|
|
87,973 |
|
|
|
6,270 |
|
|
|
7.1 |
% |
|
|
18.9 |
% |
Office operations |
|
|
34,847 |
|
|
|
34,272 |
|
|
|
575 |
|
|
|
1.7 |
% |
|
|
7.0 |
% |
Insurance |
|
|
19,754 |
|
|
|
20,094 |
|
|
|
(340 |
) |
|
|
(1.7 |
%) |
|
|
4.0 |
% |
Marketing |
|
|
7,538 |
|
|
|
7,049 |
|
|
|
489 |
|
|
|
6.9 |
% |
|
|
1.5 |
% |
Total Operating Expenses |
|
$ |
497,374 |
|
|
$ |
480,025 |
|
|
$ |
17,349 |
|
|
|
3.6 |
% |
|
|
100.0 |
% |
Merged Same Store Residential Operating Expenses
YTD 2026 vs. YTD 2025
157,377 Merged Same Store Apartment Homes | ($ in thousands)
|
|
YTD 2026 |
|
|
YTD 2025 |
|
|
$ |
|
|
% |
|
|
% of |
|
|||||
Property taxes (1) |
|
$ |
524,053 |
|
|
$ |
508,484 |
|
|
$ |
15,569 |
|
|
|
3.1 |
% |
|
|
36.0 |
% |
Payroll |
|
|
244,987 |
|
|
|
239,239 |
|
|
|
5,748 |
|
|
|
2.4 |
% |
|
|
16.9 |
% |
Repairs and maintenance |
|
|
219,270 |
|
|
|
214,686 |
|
|
|
4,584 |
|
|
|
2.1 |
% |
|
|
15.1 |
% |
Utilities (2) |
|
|
276,374 |
|
|
|
253,490 |
|
|
|
22,884 |
|
|
|
9.0 |
% |
|
|
19.0 |
% |
Office operations |
|
|
108,749 |
|
|
|
107,641 |
|
|
|
1,108 |
|
|
|
1.0 |
% |
|
|
7.5 |
% |
Insurance |
|
|
60,284 |
|
|
|
59,369 |
|
|
|
915 |
|
|
|
1.5 |
% |
|
|
4.1 |
% |
Marketing |
|
|
20,336 |
|
|
|
19,522 |
|
|
|
814 |
|
|
|
4.2 |
% |
|
|
1.4 |
% |
Total Operating Expenses |
|
$ |
1,454,053 |
|
|
$ |
1,402,431 |
|
|
$ |
51,622 |
|
|
|
3.7 |
% |
|
|
100.0 |
% |
Third Quarter 2026 Supplemental Operating and Financial Data
Attachment 8
Capital Structure as of September 30, 2026
(Amounts in thousands except for share/unit and per share amounts)
Secured Debt |
|
|
|
|
|
|
|
$ |
2,039,437 |
|
|
|
12.0 |
% |
|
|
|
|||
Unsecured Debt |
|
|
|
|
|
|
|
|
14,962,571 |
|
|
|
88.0 |
% |
|
|
|
|||
Total debt |
|
|
|
|
|
|
|
|
17,002,008 |
|
|
|
100.0 |
% |
|
|
26.2 |
% |
||
Common Shares (includes Restricted Shares) |
|
|
774,755,233 |
|
|
|
98.4 |
% |
|
|
|
|
|
|
|
|
|
|||
Units (includes DownREIT Units, OP Units and Restricted Units) |
|
|
12,721,530 |
|
|
|
1.6 |
% |
|
|
|
|
|
|
|
|
|
|||
Total Shares and Units |
|
|
787,476,763 |
|
|
|
100.0 |
% |
|
|
|
|
|
|
|
|
|
|||
Common Share Price at September 30, 2026 |
|
$ |
60.76 |
|
|
|
|
|
|
|
|
|
|
|
|
|
||||
|
|
|
|
|
|
|
|
|
|
|
|
|
|
|
|
|||||
Market value of Shares and Units |
|
|
|
|
|
|
|
|
47,847,088 |
|
|
|
100.0 |
% |
|
|
|
|||
Perpetual Preferred Equity (1) |
|
|
|
|
|
|
|
|
17,155 |
|
|
|
0.0 |
% |
|
|
|
|||
Total Equity |
|
|
|
|
|
|
|
|
47,864,243 |
|
|
|
100.0 |
% |
|
|
73.8 |
% |
||
|
|
|
|
|
|
|
|
|
|
|
|
|
|
|
|
|||||
Total Market Capitalization |
|
|
|
|
|
|
|
$ |
64,866,251 |
|
|
|
|
|
|
100.0 |
% |
|||
Third Quarter 2026 Supplemental Operating and Financial Data
Attachment 9
Debt Summary as of September 30, 2026
($ in thousands)
|
|
Debt |
|
|
% of Total |
|
|
Weighted Average |
|
|
Weighted |
|
||||
Secured |
|
$ |
2,039,437 |
|
|
|
12.0 |
% |
|
|
4.30 |
% |
|
|
6.1 |
|
Unsecured |
|
|
14,962,571 |
|
|
|
88.0 |
% |
|
|
4.29 |
% |
|
|
6.1 |
|
Total debt |
|
$ |
17,002,008 |
|
|
|
100.0 |
% |
|
|
4.29 |
% |
|
|
6.1 |
|
Fixed Rate Debt: |
|
|
|
|
|
|
|
|
|
|
|
|
||||
Secured – Conventional |
|
$ |
1,475,957 |
|
|
|
8.7 |
% |
|
|
3.92 |
% |
|
|
4.6 |
|
Unsecured – Public |
|
|
13,391,316 |
|
|
|
78.9 |
% |
|
|
4.30 |
% |
|
|
6.7 |
|
Unsecured – Term Loan |
|
|
550,000 |
|
|
|
3.2 |
% |
|
|
4.44 |
% |
|
|
2.5 |
|
Fixed Rate Debt |
|
$ |
15,417,273 |
|
|
|
90.8 |
% |
|
|
4.27 |
% |
|
|
6.3 |
|
Floating Rate Debt: |
|
|
|
|
|
|
|
|
|
|
|
|
||||
Secured – Tax Exempt |
|
$ |
563,480 |
|
|
|
3.3 |
% |
|
|
5.34 |
% |
|
|
10.4 |
|
Unsecured – Revolving Credit Facilities |
|
|
— |
|
|
|
— |
|
|
|
— |
|
|
|
3.8 |
|
Unsecured – Commercial Paper Program |
|
|
1,021,255 |
|
|
|
5.9 |
% |
|
|
4.04 |
% |
|
|
— |
|
Floating Rate Debt |
|
$ |
1,584,735 |
|
|
|
9.2 |
% |
|
|
4.58 |
% |
|
|
3.7 |
|
Total debt |
|
$ |
17,002,008 |
|
|
|
100.0 |
% |
|
|
4.29 |
% |
|
|
6.1 |
|
Commercial Paper Program |
Weighted average maturity |
|
15 days |
Weighted average amount outstanding |
|
$805.2 million |
Capitalized Interest |
Q3 |
|
|
YTD |
|
||||||||||
2026 |
|
|
2025 |
|
|
2026 |
|
|
2025 |
|
||||
$ |
17,919 |
|
|
$ |
13,724 |
|
|
$ |
48,406 |
|
|
$ |
36,107 |
|
Debt Maturity Schedule as of September 30, 2026
($ in thousands)
Year |
|
Fixed |
|
|
Floating |
|
|
Total |
|
|
% of Total |
|
|
Weighted |
|
|
Weighted |
|
||||||
2026 |
|
$ |
800,284 |
|
|
$ |
1,028,000 |
|
(1) |
$ |
1,828,284 |
|
|
|
10.4 |
% |
|
|
2.87 |
% |
|
|
3.53 |
% |
2027 |
|
|
852,159 |
|
|
|
19,500 |
|
|
|
871,659 |
|
|
|
5.0 |
% |
|
|
3.25 |
% |
|
|
3.26 |
% |
2028 |
|
|
1,751,202 |
|
|
|
21,700 |
|
|
|
1,772,902 |
|
|
|
10.1 |
% |
|
|
3.21 |
% |
|
|
3.22 |
% |
2029 |
|
|
1,976,282 |
|
|
|
47,800 |
|
|
|
2,024,082 |
|
|
|
11.5 |
% |
|
|
3.63 |
% |
|
|
3.64 |
% |
2030 |
|
|
2,248,462 |
|
|
|
14,100 |
|
|
|
2,262,562 |
|
|
|
12.9 |
% |
|
|
2.78 |
% |
|
|
2.79 |
% |
2031 |
|
|
1,728,500 |
|
|
|
41,200 |
|
|
|
1,769,700 |
|
|
|
10.1 |
% |
|
|
3.16 |
% |
|
|
3.18 |
% |
2032 |
|
|
1,200,000 |
|
|
|
30,100 |
|
|
|
1,230,100 |
|
|
|
7.0 |
% |
|
|
3.26 |
% |
|
|
3.27 |
% |
2033 |
|
|
1,300,000 |
|
|
|
5,000 |
|
|
|
1,305,000 |
|
|
|
7.4 |
% |
|
|
5.19 |
% |
|
|
5.18 |
% |
2034 |
|
|
1,000,000 |
|
|
|
10,900 |
|
|
|
1,010,900 |
|
|
|
5.8 |
% |
|
|
4.93 |
% |
|
|
4.92 |
% |
2035 |
|
|
400,000 |
|
|
|
38,575 |
|
|
|
438,575 |
|
|
|
2.5 |
% |
|
|
5.00 |
% |
|
|
4.91 |
% |
2036+ |
|
|
2,705,913 |
|
|
|
339,135 |
|
|
|
3,045,048 |
|
|
|
17.3 |
% |
|
|
4.45 |
% |
|
|
4.39 |
% |
Total principal |
|
$ |
15,962,802 |
|
|
$ |
1,596,010 |
|
|
$ |
17,558,812 |
|
|
|
100.0 |
% |
|
|
3.71 |
% |
|
|
3.74 |
% |
Deferred Financing Costs and |
|
|
(545,529 |
) |
|
|
(11,275 |
) |
|
|
(556,804 |
) |
|
|
|
|
|
|
|
|
|
|||
Total debt |
|
$ |
15,417,273 |
|
|
$ |
1,584,735 |
|
|
$ |
17,002,008 |
|
|
|
|
|
|
|
|
|
|
|||
Third Quarter 2026 Supplemental Operating and Financial Data
Attachment 10
Development Communities as of September 30, 2026
($ in thousands)
|
|
|
|
|
|
|
|
|
|
|
|
|
Actual/Projected Schedule |
|
|
|||||||||||
Development Communities |
|
Location |
|
No. of |
|
|
Total |
|
|
Average Monthly Revenue per Home |
|
|
Start |
|
Initial |
|
Complete |
|
Stabilized |
|
% |
|
% Leased / Occupied |
|||
Communities Under Construction: |
|
|
|
|
|
|
|
|
|
|
|
|
|
|
|
|
|
|
|
|
|
|||||
Avalon West Windsor (1) |
|
West Windsor, NJ |
|
|
535 |
|
|
$ |
209,588 |
|
|
$ |
3,150 |
|
|
Q2 2022 |
|
Q3 2025 |
|
Q4 2026 |
|
Q3 2027 |
|
77% |
|
60% / 56% |
Avalon Pleasanton |
|
Pleasanton, CA |
|
|
362 |
|
|
|
218,299 |
|
|
|
3,790 |
|
|
Q2 2024 |
|
Q3 2025 |
|
Q3 2027 |
|
Q4 2027 |
|
23% |
|
22% / 22% |
Avalon at Becker Farm |
|
Roseland, NJ |
|
|
533 |
|
|
|
186,483 |
|
|
|
3,215 |
|
|
Q2 2024 |
|
Q4 2025 |
|
Q4 2026 |
|
Q2 2027 |
|
82% |
|
70% / 65% |
Avalon Tech Ridge I |
|
Austin, TX |
|
|
544 |
|
|
|
152,589 |
|
|
|
2,130 |
|
|
Q3 2024 |
|
Q1 2026 |
|
Q2 2027 |
|
Q3 2027 |
|
51% |
|
48% / 42% |
Avalon Carmel (2) |
|
Charlotte, NC |
|
|
360 |
|
|
|
118,016 |
|
|
|
2,125 |
|
|
Q3 2024 |
|
Q2 2026 |
|
Q4 2026 |
|
Q3 2027 |
|
84% |
|
41% / 30% |
Avalon Plano (2) |
|
Plano, TX |
|
|
155 |
|
|
|
57,507 |
|
|
|
2,950 |
|
|
Q3 2024 |
|
Q4 2026 |
|
Q4 2027 |
|
Q2 2028 |
|
— |
|
- / - |
Avalon Oakridge I |
|
Durham, NC |
|
|
459 |
|
|
|
148,971 |
|
|
|
2,325 |
|
|
Q3 2024 |
|
Q1 2027 |
|
Q1 2028 |
|
Q3 2028 |
|
— |
|
- / - |
AVA Brewer's Hill |
|
Baltimore, MD |
|
|
418 |
|
|
|
132,422 |
|
|
|
2,650 |
|
|
Q4 2024 |
|
Q4 2026 |
|
Q4 2027 |
|
Q2 2028 |
|
— |
|
1% / - |
Kanso Hillcrest |
|
San Diego, CA |
|
|
182 |
|
|
|
84,860 |
|
|
|
3,245 |
|
|
Q4 2024 |
|
Q1 2027 |
|
Q2 2027 |
|
Q4 2027 |
|
— |
|
- / - |
Avalon Parker |
|
Parker, CO |
|
|
312 |
|
|
|
123,232 |
|
|
|
2,670 |
|
|
Q1 2025 |
|
Q3 2026 |
|
Q2 2027 |
|
Q4 2027 |
|
17% |
|
11% / 5% |
Avalon North Palm Beach (1) |
|
Lake Park, FL |
|
|
279 |
|
|
|
117,981 |
|
|
|
3,290 |
|
|
Q1 2025 |
|
Q1 2027 |
|
Q3 2027 |
|
Q1 2028 |
|
— |
|
- / - |
Avalon Brier Creek |
|
Durham, NC |
|
|
400 |
|
|
|
126,087 |
|
|
|
2,365 |
|
|
Q2 2025 |
|
Q3 2026 |
|
Q3 2027 |
|
Q1 2028 |
|
7% |
|
6% / 1% |
Avalon Kendall (2) |
|
Kendall, FL |
|
|
224 |
|
|
|
82,938 |
|
|
|
2,935 |
|
|
Q2 2025 |
|
Q1 2027 |
|
Q2 2027 |
|
Q1 2028 |
|
— |
|
- / - |
Avalon Mission Valley (1) |
|
San Diego, CA |
|
|
621 |
|
|
|
302,318 |
|
|
|
3,690 |
|
|
Q3 2025 |
|
Q1 2028 |
|
Q1 2029 |
|
Q3 2029 |
|
— |
|
- / - |
Avalon Southpoint (2) |
|
Durham, NC |
|
|
394 |
|
|
|
131,720 |
|
|
|
2,595 |
|
|
Q3 2025 |
|
Q1 2027 |
|
Q2 2028 |
|
Q3 2028 |
|
— |
|
- / - |
Avalon Northwest Hills |
|
Austin, TX |
|
|
252 |
|
|
|
89,968 |
|
|
|
2,725 |
|
|
Q4 2025 |
|
Q1 2028 |
|
Q3 2028 |
|
Q1 2029 |
|
— |
|
- / - |
Kanso Parsippany |
|
Parsippany, NJ |
|
|
280 |
|
|
|
104,157 |
|
|
|
2,830 |
|
|
Q4 2025 |
|
Q2 2027 |
|
Q4 2027 |
|
Q2 2028 |
|
— |
|
- / - |
Avalon Billerica |
|
Billerica, MA |
|
|
200 |
|
|
|
71,572 |
|
|
|
2,945 |
|
|
Q4 2025 |
|
Q2 2027 |
|
Q4 2027 |
|
Q2 2028 |
|
— |
|
- / - |
Avalon Townhome Collection Arundel Mills (2) |
Hanover, MD |
|
|
90 |
|
|
|
45,058 |
|
|
|
3,870 |
|
|
Q4 2025 |
|
Q4 2026 |
|
Q4 2026 |
|
Q4 2027 |
|
— |
|
1% / - |
|
Avalon San Ramon |
|
San Ramon, CA |
|
|
456 |
|
|
|
250,467 |
|
|
|
4,080 |
|
|
Q4 2025 |
|
Q2 2028 |
|
Q2 2029 |
|
Q3 2029 |
|
— |
|
- / - |
Avalon Somerville Station II |
|
Somerville, NJ |
|
|
171 |
|
|
|
64,991 |
|
|
|
3,035 |
|
|
Q1 2026 |
|
Q3 2027 |
|
Q4 2027 |
|
Q3 2028 |
|
— |
|
- / - |
Avalon Saddle River |
|
Saddle River, NJ |
|
|
275 |
|
|
|
123,157 |
|
|
|
3,710 |
|
|
Q1 2026 |
|
Q4 2027 |
|
Q3 2028 |
|
Q4 2028 |
|
— |
|
- / - |
Loxley (2) |
|
Canton, GA |
|
|
240 |
|
|
|
59,612 |
|
|
|
1,885 |
|
|
Q1 2026 |
|
Q3 2027 |
|
Q1 2028 |
|
Q1 2029 |
|
— |
|
- / - |
Wilder at Windward (1) (2) |
|
Alpharetta, GA |
|
|
280 |
|
|
|
112,149 |
|
|
|
2,700 |
|
|
Q1 2026 |
|
Q3 2027 |
|
Q2 2028 |
|
Q1 2029 |
|
— |
|
- / - |
Kanso Plymouth |
|
Plymouth, MA |
|
|
300 |
|
|
|
95,207 |
|
|
|
2,735 |
|
|
Q2 2026 |
|
Q3 2027 |
|
Q3 2028 |
|
Q4 2028 |
|
— |
|
- / - |
Avalon Townhome Collection Central Park (2) |
|
Denver, CO |
|
|
146 |
|
|
|
68,437 |
|
|
|
3,460 |
|
|
Q2 2026 |
|
Q2 2027 |
|
Q4 2027 |
|
Q3 2028 |
|
— |
|
- / - |
Avalon Dulles Innovation |
|
Herndon, VA |
|
|
355 |
|
|
|
120,217 |
|
|
|
2,585 |
|
|
Q2 2026 |
|
Q1 2028 |
|
Q3 2028 |
|
Q1 2029 |
|
— |
|
- / - |
Avalon Downtown Cary |
|
Cary, NC |
|
|
281 |
|
|
|
98,421 |
|
|
|
2,550 |
|
|
Q3 2026 |
|
Q2 2028 |
|
Q4 2028 |
|
Q3 2029 |
|
— |
|
- / - |
Total / Weighted Average Under Construction |
|
|
9,104 |
|
|
|
3,496,424 |
|
|
|
2,920 |
|
|
|
|
|
|
|
|
|
|
|
|
|
||
|
|
|
|
|
|
|
|
|
|
|
|
|
|
|
|
|
|
|
|
|
|
|
|
|||
Communities Completed this Quarter: |
|
|
|
|
|
|
|
|
|
|
|
|
|
|
|
|
|
|
|
|
|
|||||
Avalon Wayne |
|
Wayne, NJ |
|
|
473 |
|
|
|
169,635 |
|
|
|
3,315 |
|
|
Q4 2023 |
|
Q2 2025 |
|
Q3 2026 |
|
Q1 2027 |
|
100% |
|
84% / 82% |
Avalon Quincy Adams |
|
Quincy, MA |
|
|
288 |
|
|
|
121,685 |
|
|
|
3,260 |
|
|
Q2 2024 |
|
Q1 2026 |
|
Q3 2026 |
|
Q1 2027 |
|
100% |
|
81% / 73% |
Total / Weighted Average Communities Completed this Quarter |
|
|
761 |
|
|
|
291,320 |
|
|
|
3,295 |
|
|
|
|
|
|
|
|
|
|
|
|
|
||
|
|
|
|
|
|
|
|
|
|
|
|
|
|
|
|
|
|
|
|
|
|
|
|
|||
Total / Weighted Average Under Construction and |
|
|
9,865 |
|
|
$ |
3,787,744 |
|
|
$ |
2,945 |
|
|
|
|
|
|
|
|
|
|
|
|
|
||
|
|
|
|
|
|
|
|
|
|
|
|
|
|
|
|
|
|
|
|
|
|
|
|
|||
Total Weighted Average Projected NOI as a % of Total Capital Cost |
|
|
|
6.2 |
% |
|
|
|
|
|
|
|
|
|
|
|
|
|
|
|
||||||
Asset Cost Basis (1) |
|
|
Total Capital Cost |
|
|
Development Underway |
|
$ |
4,415,424 |
|
Disbursed to date |
|
|
(2,882,298 |
) |
Remaining to invest |
|
$ |
1,533,125 |
|
YTD 2026 NOI and Capitalized Interest |
|
|
NOI |
|
|
Capitalized |
|
||
Communities Under Construction |
|
$ |
5,860 |
|
|
$ |
37,114 |
|
Communities Completed this Quarter |
|
|
4,290 |
|
|
|
3,390 |
|
Total |
|
$ |
10,150 |
|
|
$ |
40,504 |
|
Third Quarter 2026 Supplemental Operating and Financial Data
Attachment 11
Partially Owned Operating Communities as of September 30, 2026
(Amounts in thousands except for project/community and apartment homes amounts)
|
|
|
|
|
|
|
|
|
|
NOI |
|
|
Debt |
|
||||||||||||
|
|
Weighted Average Ownership |
|
Total |
|
|
Total |
|
|
Q3 2026 |
|
|
YTD 2026 |
|
|
Total Debt |
|
|
Weighted Average |
|
||||||
Consolidated Communities |
|
86.6% |
|
|
13 |
|
|
|
3,096 |
|
|
$ |
10,243 |
|
|
$ |
10,243 |
|
|
$ |
26,274 |
|
|
|
5.84 |
% |
Unconsolidated Communities |
|
69.0% |
|
|
13 |
|
|
|
4,049 |
|
|
|
20,335 |
|
|
|
53,755 |
|
|
|
920,002 |
|
|
|
5.74 |
% |
Total partially owned communities |
|
|
|
|
26 |
|
|
|
7,145 |
|
|
$ |
30,578 |
|
|
$ |
63,998 |
|
|
$ |
946,276 |
|
|
|
5.74 |
% |
Note: Partially owned consolidated and unconsolidated amounts are presented at 100% of the community. This schedule only includes those communities that are partially owned at September 30, 2026.
Third Quarter 2026 Supplemental Operating and Financial Data
Attachment 12
Structured Investment Program ("SIP") as of September 30, 2026
(Amounts in thousands except for number of commitments and maturity)
Year of Commitment |
|
Number of Commitments (1) |
|
|
Commitments |
|
|
Weighted Average |
|
|||
2022 |
|
|
2 |
|
|
$ |
79,575 |
|
|
Q4 2027 |
|
|
2023 |
|
|
4 |
|
|
|
99,210 |
|
|
Q3 2028 |
|
|
2024 |
|
|
— |
|
|
|
— |
|
|
|
— |
|
2025 |
|
|
2 |
|
|
|
48,000 |
|
|
Q4 2029 |
|
|
2026 |
|
|
1 |
|
|
|
15,000 |
|
|
Q2 2031 |
|
|
Total |
|
|
9 |
|
|
$ |
241,785 |
|
|
Q4 2028 |
|
|
The Company recognized interest income from the SIP portfolio of $8.6 million and $23.7 million for the three and nine months ended September 30, 2026, respectively, included in Other income (expense), net on the Consolidated Statements of Operations.
Subsequent to quarter-end, the Company received full repayment of $71.9 million, inclusive of principal and accrued interest, on one SIP commitment.
Third Quarter 2026 Supplemental Operating and Financial Data
Attachment 13
Additional Reconciliations and Definitions of Non-GAAP Financial Measures and Other Terms
($ in thousands except where otherwise indicated, per share and per apartment home data)
(All per share data is diluted)
The operational and financial metrics disclosed in this earnings release and supplemental schedules represent a combination of those previously disclosed by AVB and EQR. The operational metrics generally reflect those previously presented by EQR and the financial metrics for development generally consist of those previously provided by AVB.
This Earnings Release and Supplemental Financial Information includes certain non-GAAP financial measures and other terms that management believes are helpful in understanding our business. The definitions and calculations of these non-GAAP financial measures and other terms may differ from the definitions and methodologies used by other real estate investment trusts (“REIT”) and, accordingly, may not be comparable. These non-GAAP financial measures should not be considered as an alternative to net earnings or any other measurement of performance computed in accordance with accounting principles generally accepted in the United States (“GAAP”) or as an alternative to cash flows from operating, investing or financing activities. Furthermore, these non-GAAP financial measures are not intended to be a measure of cash flow or liquidity.
Average Monthly Revenue per Home – As calculated for certain Development communities under construction and in lease-up, reflects management’s projected stabilized rents net of estimated stabilized concessions, including estimated stabilized other revenue and excluding projected Non-Residential revenue.
Bad Debt, Net – Amount of previously recognized revenue that the Company estimates it will not collect.
Blended Rate – The weighted average of New Lease Change and Renewal Rate Achieved.
Debt Balances:
Commercial Paper Program – The Company may borrow up to a maximum of $2.5 billion under its Commercial Paper Program subject to market conditions.
Revolving Credit Facilities – The Company may borrow up to a maximum of $5 billion under two separate unsecured Revolving Credit Facilities. One of the Company’s $2.5 billion Revolving Credit Facilities matures April 3, 2030, and the other matures December 3, 2030. The interest rate on advances under both facilities will generally be SOFR plus a spread (currently 0.70%), or based on bids received from the lending group, and an annual facility fee (currently 0.10%). Both the spread and the facility fee are dependent on the Company’s senior unsecured credit rating. In addition, the Company limits its utilization of the facilities in order to maintain liquidity to support its $2.5 billion Commercial Paper Program along with certain other obligations. The following table presents the available liquidity on the Company’s total unsecured Revolving Credit Facilities:
|
|
September 30, 2026 |
|
|
Unsecured Revolving Credit Facilities commitment |
|
$ |
5,000,000 |
|
Commercial Paper Program balance outstanding |
|
|
(1,022,900 |
) |
Unsecured Revolving Credit Facilities balance outstanding |
|
|
— |
|
Other restricted amounts |
|
|
(4,328 |
) |
Available liquidity |
|
$ |
3,972,772 |
|
Term Loan Facility – As of September 30, 2026, the Company had $550 million outstanding under its senior unsecured term loan facility, the full amount available under the facility. The facility matures on April 3, 2029 and bears interest at SOFR plus a spread, which is based on the credit ratings of the Company’s long-term unsecured debt and was 0.800% as of September 30, 2026. The Company has entered into interest rate swaps that effectively fix the interest rate on the full $550 million facility.
Debt Covenant Compliance – Our unsecured debt includes certain financial and operating covenants including, among other things, maintenance of certain financial ratios. These provisions are contained in the indentures applicable to each note payable and the credit agreements for our Revolving Credit Facilities. The Company was in compliance with its unsecured debt covenants for all periods presented.
Development – Is composed of communities that are either currently under construction or for which construction has completed, but were not stabilized as of January 1 of the current year. These communities may be partially or fully complete and operating.
Development Underway – Development Underway refers to the Company’s wholly-owned communities under construction as of September 30, 2026 and Development completions that have not yet achieved Stabilized Operations.
Third Quarter 2026 Supplemental Operating and Financial Data
Disposition Yield – The Projected NOI that the Company expects to give up over the 12 months following the sale of a community to a third party, divided by the sum of (i) the gross sales price and (ii) any significant capital expenditures the Company expects to avoid over the same 12 months. The weighted average Disposition Yield for communities sold during the period is calculated by weighting each community’s Disposition Yield by its relative gross sales price.
Earnings Per Share ("EPS") – Net income per share calculated in accordance with GAAP. Expected EPS is calculated on a basis consistent with actual EPS. Due to the uncertain timing and extent of community dispositions and the resulting gains/losses on sales, actual EPS could differ materially from expected EPS.
EBITDA for Real Estate and Core EBITDA for Real Estate:
Earnings Before Interest, Taxes, Depreciation and Amortization for Real Estate (“EBITDAre”) – The National Association of Real Estate Investment Trusts (“Nareit”) defines EBITDAre (September 2017 White Paper) as net income (computed in accordance with GAAP) before interest expense, income taxes, depreciation and amortization expense, and further adjusted for gains and losses from sales of depreciated operating communities, impairment write-downs of depreciated operating communities, impairment write-downs of investments in unconsolidated entities caused by a decrease in value of depreciated operating communities within the joint venture and adjustments to reflect the Company’s share of EBITDAre of investments in unconsolidated entities.
The Company believes that EBITDAre is useful to investors, creditors and rating agencies as a supplemental measure of the Company’s ability to incur and service debt because it is a recognized measure of performance by the real estate industry, and by excluding gains or losses related to sales or impairment of depreciated operating communities, EBITDAre can help compare the Company’s credit strength between periods or as compared to different companies.
Core Earnings Before Interest, Taxes, Depreciation and Amortization for Real Estate (“Core EBITDAre”) – Represents net income (computed in accordance with GAAP) before interest expense, income taxes, depreciation and amortization expense, and further adjusted for non-comparable items. Core EBITDAre, total debt to Core EBITDAre and net debt to Core EBITDAre are important metrics in evaluating the credit strength of the Company and its ability to service its debt obligations. The Company believes that Core EBITDAre, total debt to Core EBITDAre, and net debt to Core EBITDAre are useful to investors, creditors and rating agencies because they allow investors to compare the Company’s credit strength to prior reporting periods and to other companies without the effect of items that by their nature are not comparable from period to period and tend to obscure the Company’s actual credit quality.
Economic Gain (Loss) – Economic Gain (Loss) is calculated as the net gain (loss) on sales of real estate communities in accordance with GAAP, excluding accumulated depreciation. The Company generally considers Economic Gain (Loss) to be an appropriate supplemental measure to net gain (loss) on sales of real estate communities in accordance with GAAP because it is one indication of the gross value created by the Company's acquisition, development, renovation, management and ultimate sale of a community and because it helps investors to understand the relationship between the cash proceeds from a sale and the cash invested in the sold community.
FFO and Core FFO:
Funds From Operations (“FFO”) – is defined by The National Association of Real Estate Investment Trusts (“Nareit” - December 2018 White Paper) as net income (computed in accordance with GAAP), excluding gains or losses from sales and impairment write-downs of depreciable real estate and land when connected to the main business of a REIT, impairment write-downs of investments in entities when the impairment is directly attributable to decreases in the value of depreciable real estate held by the entity and depreciation and amortization related to real estate. Adjustments for partially owned consolidated and unconsolidated partnerships and joint ventures are calculated to reflect FFO on the same basis. Expected FFO per share is calculated on a basis consistent with actual FFO per share and is considered an appropriate supplemental measure of expected operating performance when compared to expected EPS.
The Company believes that FFO and FFO available to Common Shares and Units are helpful to investors as supplemental measures of the operating performance of a real estate company, because they are recognized measures of performance by the real estate industry and by excluding gains or losses from sales and impairment write-downs of depreciable real estate and excluding depreciation related to real estate (which can vary among owners of identical assets in similar condition based on historical cost accounting and useful life estimates), FFO can help compare the operating performance of a company’s real estate between periods or as compared to different companies.
Third Quarter 2026 Supplemental Operating and Financial Data
Core Funds From Operations ("Core FFO" or "CFFO") – Core FFO is the Company's FFO as adjusted for non-core items outlined in the table below.
Expected Core FFO per share is calculated on a basis consistent with actual Core FFO per share and is considered an appropriate supplemental measure of expected operating performance when compared to expected EPS.
The Company believes that Core FFO and Core FFO available to Common Shares and Units are helpful to investors as supplemental measures of the operating performance of a real estate company because they allow investors to compare the Company's operating performance to its performance in prior reporting periods and to the operating performance of other real estate companies without the effect of items that by their nature are not comparable from period to period and tend to obscure the Company's actual operating results.
FFO, FFO available to Common Shares and Units, Core FFO and Core FFO available to Common Shares and Units do not represent net income, net income available to Common Shares or net cash flows from operating activities in accordance with GAAP. Therefore, FFO, FFO available to Common Shares and Units, Core FFO and Core FFO available to Common Shares and Units should not be exclusively considered as alternatives to net income, net income available to Common Shares or net cash flows from operating activities as determined by GAAP or as a measure of liquidity. The Company's calculation of FFO, FFO available to Common Shares and Units, Core FFO and Core FFO available to Common Shares and Units may differ from other real estate companies due to, among other items, variations in cost capitalization policies for capital expenditures and, accordingly, may not be comparable to such other real estate companies.
FFO available to Common Shares and Units and Core FFO available to Common Shares and Units are calculated on a basis consistent with net income available to Common Shares and reflect adjustments to net income for preferred distributions and premiums on redemption of preferred shares in accordance with GAAP.
The following table presents reconciliations of EPS to FFO per share and Core FFO per share:
|
|
Actual |
|
|
Actual |
|
|
Actual |
|
|
Actual |
|
|
Expected |
|
|
Expected |
|
||||||
|
|
Q3 2026 |
|
|
Q3 2025 |
|
|
YTD 2026 |
|
|
YTD 2025 |
|
|
Q4 2026 |
|
|
2026 |
|
||||||
|
|
Per Share |
|
|
Per Share |
|
|
Per Share |
|
|
Per Share |
|
|
Per Share |
|
|
Per Share |
|
||||||
EPS – Diluted |
|
$ |
(1.27 |
) |
|
$ |
0.96 |
|
|
$ |
(0.57 |
) |
|
$ |
2.23 |
|
|
$(0.95) to $(0.91) |
|
|
$(1.85) to $(1.81) |
|
||
Depreciation expense |
|
|
1.52 |
|
|
|
0.57 |
|
|
|
2.95 |
|
|
|
1.69 |
|
|
|
1.99 |
|
|
|
5.40 |
|
Net (gain) loss on sale |
|
|
(0.18 |
) |
|
|
(0.45 |
) |
|
|
(0.62 |
) |
|
|
(0.84 |
) |
|
|
(0.12 |
) |
|
|
(0.71 |
) |
Casualty loss on real estate |
|
|
0.01 |
|
|
|
— |
|
|
|
0.01 |
|
|
|
— |
|
|
|
— |
|
|
|
0.01 |
|
FFO per share – Diluted |
|
|
0.08 |
|
|
|
1.08 |
|
|
|
1.77 |
|
|
|
3.08 |
|
|
0.92 to 0.96 |
|
|
2.85 to 2.89 |
|
||
|
|
|
|
|
|
|
|
|
|
|
|
|
|
|
|
|
|
|
||||||
Adjustments (1): |
|
|
|
|
|
|
|
|
|
|
|
|
|
|
|
|
|
|||||||
Expensed development and |
|
|
0.01 |
|
|
|
— |
|
|
|
0.03 |
|
|
|
0.02 |
|
|
|
— |
|
|
|
0.03 |
|
Merger-related costs |
|
|
0.92 |
|
|
|
— |
|
|
|
1.21 |
|
|
|
— |
|
|
|
0.06 |
|
|
|
1.11 |
|
Merger accounting interest expense |
|
|
0.02 |
|
|
|
— |
|
|
|
0.02 |
|
|
|
— |
|
|
|
0.02 |
|
|
|
0.04 |
|
Non-operating (gains) losses |
|
|
(0.01 |
) |
|
|
(0.11 |
) |
|
|
(0.01 |
) |
|
|
(0.11 |
) |
|
|
0.01 |
|
|
|
— |
|
Legal settlements and costs |
|
|
0.01 |
|
|
|
0.01 |
|
|
|
0.04 |
|
|
|
0.02 |
|
|
|
0.01 |
|
|
|
0.05 |
|
Core FFO per share – Diluted |
|
$ |
1.03 |
|
|
$ |
0.98 |
|
|
$ |
3.06 |
|
|
$ |
3.01 |
|
|
$1.01 to $1.05 |
|
|
$4.08 to $4.12 |
|
||
Leasing Concessions – Reflects upfront discounts on both new move-in and renewal leases on a straight-line basis.
Market Cap Rate – is defined by the Company as Projected NOI of a single community, less an estimate of typical capital expenditure allowance per apartment home, divided by the gross sales price for the community. The Market Cap Rate, which may be determined in a different manner by others, is a measure frequently used in the real estate industry when determining the appropriate purchase price for a community or estimating the value for a community. Buyers may assign different Market Cap Rates to different communities when determining the appropriate value because they (i) may project different rates of change in operating expenses and capital expenditure estimates and (ii) may project different rates of change in future rental revenue due to different estimates for changes in rent and occupancy levels. The weighted average Market Cap Rate is weighted based on the gross sales price of each community.
Third Quarter 2026 Supplemental Operating and Financial Data
Net Operating Income ("NOI") – NOI is the Company’s primary financial measure for evaluating each of its apartment homes. NOI is defined as rental income less direct property operating expenses (including real estate taxes and insurance). The Company believes that NOI is helpful to investors as a supplemental measure of its operating performance because it is a direct measure of the actual operating results of the Company's apartment communities. NOI does not include an allocation of property management expenses either in the current or comparable periods. Rental income for all leases and operating expense for ground leases are reflected on a straight-line basis in accordance with GAAP for the current and comparable periods.
The following tables present reconciliations of net income per the consolidated statements of operations to NOI, along with rental income, operating expenses and NOI per the consolidated statements of operations allocated between same store and non-same store/other results and further allocated between Residential same store and Non-Residential same store results:
|
|
Q3 2026 |
|
|
Q2 2026 |
|
|
Q1 2026 |
|
|
Q4 2025 |
|
|
Q3 2025 |
|
|
YTD 2026 |
|
|
YTD 2025 |
|
|||||||
Net (loss) income |
|
$ |
(747,141 |
) |
|
$ |
156,892 |
|
|
$ |
328,290 |
|
|
$ |
165,983 |
|
|
$ |
384,162 |
|
|
$ |
(261,959 |
) |
|
$ |
890,614 |
|
Adjustments: |
|
|
|
|
|
|
|
|
|
|
|
|
|
|
|
|
|
|
|
|
|
|||||||
Management, development and other |
|
|
(1,954 |
) |
|
|
(1,782 |
) |
|
|
(1,832 |
) |
|
|
(1,838 |
) |
|
|
(1,870 |
) |
|
|
(5,568 |
) |
|
|
(5,204 |
) |
Property management expense |
|
|
56,273 |
|
|
|
40,265 |
|
|
|
39,933 |
|
|
|
37,939 |
|
|
|
39,062 |
|
|
|
136,471 |
|
|
|
116,653 |
|
General and administrative expense |
|
|
118,308 |
|
|
|
27,138 |
|
|
|
22,075 |
|
|
|
21,880 |
|
|
|
22,052 |
|
|
|
167,521 |
|
|
|
64,828 |
|
Expensed development and pursuit |
|
|
5,017 |
|
|
|
7,609 |
|
|
|
3,416 |
|
|
|
2,217 |
|
|
|
1,392 |
|
|
|
16,042 |
|
|
|
8,629 |
|
Transaction costs |
|
|
464,321 |
|
|
|
12,367 |
|
|
|
— |
|
|
|
— |
|
|
|
— |
|
|
|
476,688 |
|
|
|
— |
|
Depreciation |
|
|
897,976 |
|
|
|
232,975 |
|
|
|
233,105 |
|
|
|
233,387 |
|
|
|
230,371 |
|
|
|
1,364,056 |
|
|
|
679,989 |
|
Interest expense |
|
|
123,791 |
|
|
|
71,826 |
|
|
|
73,035 |
|
|
|
71,043 |
|
|
|
68,172 |
|
|
|
268,652 |
|
|
|
197,933 |
|
Casualty and impairment loss |
|
|
2,374 |
|
|
|
— |
|
|
|
4,619 |
|
|
|
418 |
|
|
|
— |
|
|
|
6,993 |
|
|
|
858 |
|
(Gain) loss on sale of communities |
|
(108,304 |
) |
|
|
338 |
|
|
|
(179,911 |
) |
|
|
368 |
|
|
|
(180,155 |
) |
|
|
(287,877 |
) |
|
|
(336,081 |
) |
|
(Income) loss from unconsolidated real |
|
|
5,811 |
|
|
|
268 |
|
|
|
207 |
|
|
|
88 |
|
|
|
(137 |
) |
|
|
6,286 |
|
|
|
(552 |
) |
Non-operating (gains) losses |
|
(3,593 |
) |
|
|
(8,147 |
) |
|
|
6,224 |
|
|
|
484 |
|
|
|
(42,454 |
) |
|
|
(5,516 |
) |
|
|
(43,849 |
) |
|
Other (income) expense, net |
|
(11,446 |
) |
|
|
(9,459 |
) |
|
|
(9,028 |
) |
|
|
(9,530 |
) |
|
|
(9,594 |
) |
|
|
(29,933 |
) |
|
|
(27,740 |
) |
|
Tax (benefit) expense |
|
|
(672 |
) |
|
|
104 |
|
|
|
(264 |
) |
|
|
(247 |
) |
|
|
(166 |
) |
|
|
(832 |
) |
|
|
(772 |
) |
Total NOI |
|
$ |
800,761 |
|
|
$ |
530,394 |
|
|
$ |
519,869 |
|
|
$ |
522,192 |
|
|
$ |
510,835 |
|
|
$ |
1,851,024 |
|
|
$ |
1,545,306 |
|
Revenues: |
|
Q3 2026 |
|
|
Q2 2026 |
|
|
Q1 2026 |
|
|
Q4 2025 |
|
|
Q3 2025 |
|
|
YTD 2026 |
|
|
YTD 2025 |
|
|||||||
Merged residential same store |
|
$ |
1,473,916 |
|
|
$ |
1,460,333 |
|
|
$ |
1,443,526 |
|
|
$ |
1,438,657 |
|
|
$ |
1,440,041 |
|
|
$ |
4,377,775 |
|
|
$ |
4,288,919 |
|
Merged non-residential same store |
|
|
21,218 |
|
|
|
19,829 |
|
|
|
22,218 |
|
|
|
21,263 |
|
|
|
21,784 |
|
|
|
63,265 |
|
|
|
64,748 |
|
Merged total same store |
|
|
1,495,134 |
|
|
|
1,480,162 |
|
|
|
1,465,744 |
|
|
|
1,459,920 |
|
|
|
1,461,825 |
|
|
|
4,441,040 |
|
|
|
4,353,667 |
|
Non-same store/other (1) |
|
|
(301,604 |
) |
|
|
(704,176 |
) |
|
|
(697,298 |
) |
|
|
(693,902 |
) |
|
|
(696,899 |
) |
|
|
(1,703,078 |
) |
|
|
(2,086,002 |
) |
Total revenues |
|
|
1,193,530 |
|
|
|
775,986 |
|
|
|
768,446 |
|
|
|
766,018 |
|
|
|
764,926 |
|
|
|
2,737,962 |
|
|
|
2,267,665 |
|
Operating expenses: |
|
|
|
|
|
|
|
|
|
|
|
|
|
|
|
|
|
|
|
|
|
|||||||
Merged residential same store |
|
|
497,374 |
|
|
|
474,552 |
|
|
|
482,127 |
|
|
|
464,242 |
|
|
|
480,025 |
|
|
|
1,454,053 |
|
|
|
1,402,431 |
|
Merged non-residential same store |
|
|
6,355 |
|
|
|
6,325 |
|
|
|
6,714 |
|
|
|
6,157 |
|
|
|
6,114 |
|
|
|
19,394 |
|
|
|
17,849 |
|
Merged total same store |
|
|
503,729 |
|
|
|
480,877 |
|
|
|
488,841 |
|
|
|
470,399 |
|
|
|
486,139 |
|
|
|
1,473,447 |
|
|
|
1,420,280 |
|
Non-same store/other (1) |
|
|
(110,960 |
) |
|
|
(235,285 |
) |
|
|
(240,264 |
) |
|
|
(226,573 |
) |
|
|
(232,048 |
) |
|
|
(586,509 |
) |
|
|
(697,921 |
) |
Total operating expenses |
|
|
392,769 |
|
|
|
245,592 |
|
|
|
248,577 |
|
|
|
243,826 |
|
|
|
254,091 |
|
|
|
886,938 |
|
|
|
722,359 |
|
NOI: |
|
|
|
|
|
|
|
|
|
|
|
|
|
|
|
|
|
|
|
|
|
|||||||
Merged residential same store |
|
|
976,542 |
|
|
|
985,781 |
|
|
|
961,399 |
|
|
|
974,415 |
|
|
|
960,016 |
|
|
|
2,923,722 |
|
|
|
2,886,488 |
|
Merged non-residential same store |
|
|
14,863 |
|
|
|
13,504 |
|
|
|
15,504 |
|
|
|
15,106 |
|
|
|
15,670 |
|
|
|
43,871 |
|
|
|
46,899 |
|
Merged total same store |
|
|
991,405 |
|
|
|
999,285 |
|
|
|
976,903 |
|
|
|
989,521 |
|
|
|
975,686 |
|
|
|
2,967,593 |
|
|
|
2,933,387 |
|
Non-same store/other (1) |
|
|
(190,644 |
) |
|
|
(468,891 |
) |
|
|
(457,034 |
) |
|
|
(467,329 |
) |
|
|
(464,851 |
) |
|
|
(1,116,569 |
) |
|
|
(1,388,081 |
) |
Total NOI |
|
$ |
800,761 |
|
|
$ |
530,394 |
|
|
$ |
519,869 |
|
|
$ |
522,192 |
|
|
$ |
510,835 |
|
|
$ |
1,851,024 |
|
|
$ |
1,545,306 |
|
Third Quarter 2026 Supplemental Operating and Financial Data
New Lease Change – The net effective change in rent (inclusive of Leasing Concessions) for a lease with a new or transferring resident compared to the rent for the prior lease of the identical apartment unit, regardless of lease term.
Non-Residential – Represents results attributable to the non-apartment components of the Company's mixed-use communities and other commercial operations.
Other Community Merged NOI – Other Community Merged NOI is the NOI of the Company’s communities and commercial operations that are not included in the Merged Same Store Portfolio. It excludes communities disposed of or classified as held for sale as of period-end. Other Community Merged NOI includes legacy EQR communities not included in the Merged Same Store Portfolio if they were owned by the Company during the full period presented.
For the portion of the period before the Merger, Other Community Merged NOI includes the operating results of the legacy EQR communities, which results are not included in the Company’s consolidated financial statements for that period. They are derived from legacy EQR’s historical accounting records and are unaudited. As a result, Other Community Merged NOI for those periods does not indicate the results the combined company would have achieved had the Merger occurred at the beginning of the period.
The Company believes Other Community Merged NOI is useful to investors because, together with Merged Same Store NOI, it shows the community-level operating results of the combined company’s entire portfolio for the period, excluding corporate-level expenses and other items not related to community operations. The Company’s computation may differ from the methodology other companies use and therefore may not be comparable.
Percentage of Residents Renewing – Leases renewed expressed as a percentage of total renewal offers extended during the reporting period.
Physical Occupancy – represents the weighted average occupied apartment units for the reporting period divided by the weighted average of total apartment units available for rent for the reporting period.
Projected NOI - as used within this release for certain Development communities and in calculating the Market Cap Rate, represents management’s estimate, as of the date of this release (or as of the date of the buyer’s valuation in the case of dispositions), of projected stabilized rental revenue minus projected stabilized operating expenses. For Development communities, Projected NOI is calculated based on the first twelve months of Stabilized Operations following the completion of construction. In calculating the Market Cap Rate, Projected NOI for dispositions is calculated for the first twelve months following the date of the buyer’s valuation (assuming no repositioning). Projected stabilized rental revenue represents management’s estimate of projected gross potential minus projected stabilized physical vacancy and adjusted for projected stabilized concessions plus projected stabilized other rental revenue. Projected stabilized operating expenses do not include interest, income taxes (if any), depreciation or amortization, or any allocation of corporate-level property management overhead or general and administrative costs. For Development communities, projected stabilized operating expenses also do not include property management fee expense. For Market Cap Rate, projected stabilized operating expenses include a management fee of 2.5% and an estimate of typical market costs for insurance, payroll and other operating expenses for which the Company may have proprietary advantages not available to a typical buyer. Projected gross potential for Development communities and dispositions is generally based on leased rents for occupied homes and management’s best estimate of rental levels for homes which are currently unleased. The weighted average Projected NOI as a percentage of Total Capital Cost is weighted based on the Total Capital Cost of each community.
Redevelopment – Is composed of consolidated communities where substantial redevelopment is in progress or is probable to begin during the current year. Redevelopment is considered substantial when (i) capital invested during the reconstruction effort is expected to exceed the lesser of $5,000,000 or 10% of the community’s pre-redevelopment basis and (ii) Physical Occupancy is below or is expected to be below 90% during or as a result of the redevelopment activity.
Renewal Rate Achieved – The net effective change in rent (inclusive of Leasing Concessions) for a new lease on an apartment unit where the lease has been renewed as compared to the rent for the prior lease of the identical apartment unit, regardless of lease term.
Residential – Represents results attributable to the Company's apartment rental operations, including parking and other ancillary revenue.
Same Store:
Third Quarter 2026 Supplemental Operating and Financial Data
Company's Same Store Portfolio – Represents consolidated communities that were owned and had Stabilized Operations, as defined below, as of the beginning of the respective prior year period, are not conducting or are not probable to conduct substantial redevelopment activities and are not held for sale or probable for disposition within the current year. Excludes communities included in the EQR Adjusted Same Store Portfolio.
EQR Adjusted Same Store Portfolio – Represents the EQR communities that would have been included in the Company's Same Store Portfolio had the communities instead been owned by the Company since January 1, 2025. Operating results for periods prior to the Merger Date are derived from the accounting records of EQR. Because these communities have been owned by the Company only since the Merger Date, they are not included in the Company's Same Store Portfolio. See the Company's Same Store Portfolio for more information regarding inclusion. These communities have been identified in certain tables to provide Merged Same Store results as if the communities had been owned by the Company in prior periods. These communities will be eligible to enter the Vivmark Same Store Portfolio on January 1, 2028.
Merged Same Store Portfolio – Merged Same Store Portfolio represents the Company's Same Store Portfolio and the EQR Adjusted Same Store Portfolio considered as a single portfolio, as if the EQR Adjusted Same Store Portfolio was owned by the Company during all periods presented. See EQR Adjusted Same Store Portfolio for more details. The Company presents the Merged Same Store Portfolio to provide an understanding of the operating performance and growth potential of the combined company.
Merged Same Store Residential Revenue, Operating Expenses and NOI – Merged Same Store Residential revenue and operating expenses represent the residential revenue and community-level operating expenses of all communities in the Merged Same Store Portfolio for each period presented. Merged Same Store NOI is Merged Same Store Residential revenue less Merged Same Store operating expenses. It excludes depreciation and amortization, corporate-level property management expenses and other indirect operating expenses. Merged Same Store Residential revenue reflects concessions granted prior to the Merger on legacy EQR leases, amortized over the balance of the remaining lease term. The impact of concessions, which were eliminated in purchase accounting, is being included to provide comparability in results across periods.
For periods before the Merger, these measures include the operating results of the communities in the legacy EQR Adjusted Same Store Portfolio. Those results are not included in the Company’s consolidated financial statements for those periods. They are derived from legacy EQR’s historical accounting records and are unaudited. As a result, Merged Same Store results for those periods are not indicative of the results the combined company would have achieved had the Merger occurred at the beginning of the earliest period presented.
Merged Same Store NOI is a non-GAAP financial measure. It should not be considered an alternative to net income, as determined in accordance with GAAP, as an indicator of financial performance. The Company believes Merged Same Store NOI is useful to investors in evaluating the operating performance of the combined company’s communities. It presents community-level results on a comparable basis across periods, excluding corporate-level expenses and other items not related to community operations. The Company’s computation of Merged Same Store NOI may differ from the methodology other companies use and therefore may not be comparable. A reconciliation of Merged Same Store NOI to net income is presented in the definition of NOI.
Same Store Operating Expenses:
Insurance – Includes property and liability insurance premiums, deductibles and other insurance-related costs, net of applicable recoveries.
Marketing – Includes advertising and promotional costs, resident acquisition and retention programs, referral and broker fees, call center services, signage and other leasing-related marketing costs.
Office Operations – Includes general and administrative costs associated with operating the Company’s apartment communities, including technology, professional services, office and occupancy costs and other administrative expenses.
Payroll – Includes salaries, bonuses, payroll taxes, employee benefits and other payroll-related costs for on-site personnel, including community managers, leasing consultants and maintenance staff.
Property Taxes – Includes real estate and personal property taxes and related tax service and abatement costs associated with the Company’s apartment communities.
Repairs and Maintenance – Includes costs associated with maintaining apartment communities, including grounds, unit turnover, cleaning, painting, building systems, equipment, safety and other routine maintenance and repair costs.
Third Quarter 2026 Supplemental Operating and Financial Data
Utilities – Represents gross utility expenses, including electricity, gas, water and sewer, telecommunications and other utility-related costs, prior to resident utility recoveries. Recoveries are reflected in rental income.
Stabilized Operations – Operations of a community that occur after the earlier of (i) attainment of 90% Physical Occupancy or (ii) the one-year anniversary of completion of Development or Redevelopment.
Structured Investment Program ("SIP") – The Company’s investments platform that provides mezzanine loans or preferred equity to third party multifamily developers.
Total Capital Cost – Total Capital Cost includes all capitalized costs projected to be or actually incurred to develop the respective Development or Redevelopment community, including land acquisition costs, construction costs, real estate taxes, capitalized interest and loan fees, permits, professional fees, allocated development overhead and other regulatory fees and a contingency estimate, offset by proceeds from the sale of any associated land or improvements, all as determined in accordance with GAAP. Total Capital Cost also includes costs incurred related to first generation commercial tenants, such as tenant improvements and leasing commissions. For Redevelopment communities, Total Capital Cost excludes costs incurred prior to the start of redevelopment when indicated. With respect to communities where development or redevelopment was completed in a prior period or the current period, Total Capital Cost reflects the actual cost incurred, plus any contingency estimate made by management. Total Capital Cost for communities identified as having joint venture ownership, either during construction or upon construction completion, represents the total projected joint venture contribution amount. For joint ventures not in construction, Total Capital Cost is equal to gross real estate cost.
Total Market Capitalization – The aggregate of the market value of the Company’s outstanding common shares, including restricted shares, the market value of the Company’s DownREIT units, operating partnership units outstanding, including restricted units (based on the market value of the Company’s common shares) and the outstanding GAAP balance of total debt. The Company believes this is a useful measure of a real estate operating company’s long-term liquidity and balance sheet strength, because it shows an approximate relationship between a company’s total debt and the current total market value of its assets based on the current price at which the Company’s common shares trade. However, because this measure changes with fluctuations in the Company’s share price, which occur regularly, this measure may change even when the Company’s earnings, interest and debt levels remain stable.
Turnover – Total Residential move-outs (including inter-community and intra-community transfers) divided by total Residential apartment units. Retention rate is the opposite of Turnover.
Units:
DownREIT Units – Units representing limited partnership interests in the "DownREIT" partnership that acquired the Dallas/Fort Worth portfolio of six communities in April 2025. Each DownREIT Unit is entitled to receive quarterly distributions at the same rate as quarterly dividends on a Company common share. Each holder of a DownREIT Unit has the right to initiate a transaction in which each DownREIT Unit may be redeemed for a cash amount related to the then-current trading price of one Company common share or, at the Company’s election, one Company common share.
Operating Partnership Units ("OP Units") – The equity positions of various individuals and entities that contributed their communities to the Company in exchange for OP Units are collectively referred to as the "Noncontrolling Interests – Operating Partnership". Subject to certain restrictions, the Noncontrolling Interests – Operating Partnership may exchange their OP Units for Common Shares on a one-for-one basis.
Weighted Average Contractual Rate – The contractual interest rate of each debt instrument, weighted by its principal balance as of period-end. For variable rate debt, the contractual rate is the rate in effect as of period-end.
Weighted Average Effective Rates – The effective interest rate of each debt instrument for the period, weighted by its average principal balance during the period. The effective interest rate is annualized interest expense divided by average principal balance. Interest expense includes the amortization of premiums, discounts and debt issuance costs, and the impact of hedging activity.
Third Quarter 2026 Supplemental Operating and Financial Data
Forward-Looking Statements
In addition to historical information, this press release and accompanying supplemental information contain “forward-looking statements” within the meaning of Section 27A of the Securities Act of 1933, as amended (the “Securities Act”), and Section 21E of the Securities Exchange Act of 1934, as amended. We intend such forward-looking statements to be covered by the safe harbor provisions for forward-looking statements contained in the Private Securities Litigation Reform Act of 1995. These statements, among other things, are based on current expectations, estimates and projections about the industry and markets in which Vivmark Residential (“Vivmark,” “we,” “us” or “our”) (f/k/a Equity Residential) operates, as well as beliefs and assumptions of Vivmark. Words such as “anticipate,” “become,” “believe,” “could,” “estimate,” “expect,” “forecast,” “intend,” “may,” “outlook,” “plan,” “potential,” “possible,” “predict,” “project,” “target,” “seek,” “shall,” “should,” “will,” or “would,” including variations of such words and similar expressions, are intended to identify forward-looking statements. All statements that address operating performance, events or developments that Vivmark expects or anticipates will occur in the future are forward-looking statements, including statements relating to the anticipated synergies, cost savings and other benefits of the Merger (as defined below), integration plans, projected dividends, development net operating income, accretion and value creation, multifamily market conditions, development, redevelopment, acquisition or disposition activity, general conditions in the geographic areas where Vivmark operates and Vivmark’s debt, capital structure and financial position. Such forward-looking statements are not guarantees of future performance and involve known and unknown risks, uncertainties, assumptions and other factors that are difficult to predict and may cause the actual results to differ materially from future results expressed or implied by such forward-looking statements.
Important factors, risks and uncertainties that could cause actual results to differ materially from such plans, estimates or expectations include but are not limited to: the inability to realize the anticipated benefits of the Merger (the “Merger”) between AvalonBay Communities, Inc. (“AvalonBay”) and Equity Residential (which Merger formed Vivmark), including as a result of an integration of the two businesses that is unsuccessful or that is more difficult, time-consuming or costly than expected; unknown or inestimable liabilities that arise as a result of the Merger; potential litigation relating to the Merger that could be instituted against Vivmark or its trustees or officers, including resulting expense and the effects of any outcomes related thereto; the risk that disruptions related to post-Merger integration and other efforts, and resulting diversion of the attention of Vivmark management from ongoing business operations, will harm Vivmark’s business; potential business uncertainty, including changes to existing business relationships with tenants, employees, joint venture partners and third parties, following the Merger that could affect Vivmark’s financial performance; increased costs of labor and construction material; maintenance of real estate investment trust status, tax structuring and changes in income tax laws and rates; potential failure to secure development opportunities due to an inability to reach agreements with third parties to obtain land at attractive prices or to obtain desired zoning and other local approvals; abandonment or deferment of development opportunities for a number of reasons, including changes in local market conditions, increases in costs of development, increases in the cost of capital or lack of capital availability, resulting in losses; increases in Vivmark’s borrowing costs as a result of changes in interest rates, rising inflation and other factors; construction costs of a community may exceed original estimates; inability to complete construction and lease-up of communities under development or redevelopment on schedule, resulting in increased interest costs and construction costs and a decrease in expected rental revenues; occupancy rates and market rents being adversely affected by competition and local economic and market conditions which are beyond our control; geopolitical conditions and instability, and international trade disputes, including any related tariffs, which may lead to rising inflation, adverse impacts to supply chains, and disruption of, or lack of access to, the capital markets, as well as potential volatility in Vivmark’s share price; our cash flows from operations and access to cost-effective capital potentially being insufficient for the development of our pipeline, which could limit our pursuit of opportunities; an outbreak of disease or other public health event may affect the multifamily industry and general economy; our cash flows potentially being insufficient to meet required payments of principal and interest, and inability to refinance existing indebtedness or the terms of such refinancing may not be as favorable as the terms of existing indebtedness; lack of success in our management of joint ventures and the REIT vehicles that are used with certain joint ventures; casualty loss, natural disaster or severe weather event, including those caused by climate change; an increase in the level of new multifamily communities construction and development, which may cause heightened competition for tenants and increased pressure on our rental rates; new or existing laws and regulations that adversely impact the markets in which we operate or our business, including those relating to rent control or rent stabilization, or that otherwise limit our ability to increase rents, charge non-rent fees or evict tenants, which may impact our revenue or increase our costs; risks related to our reliance on information technology systems, data and artificial intelligence or other automated tools, including cybersecurity incidents and other privacy or data security events, evolving regulation of the collection and use of resident data and of automated or algorithmic tools, and the failure of such systems or tools to perform as intended; our expectations, estimates and assumptions as of the date of this presentation regarding legal proceedings changing, including as a result of the Merger; and investments made under our structured investment program may not be repaid as expected or the development may not be completed on schedule, which could require us to engage in litigation, foreclosure actions, and/or first party project completion to recover our investment, which may not be recovered in full or at all in such event; a downgrade in our credit ratings that could increase our borrowing costs and adversely affect our liquidity and ability to access the capital markets, including the commercial paper market; and those risks and uncertainties set forth in Equity Residential’s and AvalonBay’s respective Annual Reports on Form 10-K for the year ended December 31, 2025 under the headings “Forward-Looking Statements” and “Risk Factors,” as such risk factors were amended, supplemented or superseded from time to time by subsequent reports filed by Equity Residential and AvalonBay, respectively, including those risks described under “Risk Factors” in the definitive joint proxy
Third Quarter 2026 Supplemental Operating and Financial Data
statement/prospectus of Equity Residential and AvalonBay, dated July 13, 2026, and which may be further amended, supplemented or superseded from time to time by Vivmark’s subsequent filings with the Securities and Exchange Commission (the “SEC”), in each case which are available via the SEC’s website at www.sec.gov.
These factors should not be construed as exhaustive and should be read in conjunction with the other forward-looking statements. Forward-looking statements relate only to events as of the date on which the statements are made. Vivmark does not undertake any obligation to publicly update or revise any forward-looking statement except as required by law, whether as a result of new information, future developments or otherwise. Vivmark cautions not to place undue reliance on any of Vivmark’s forward-looking statements. Furthermore, new risks and uncertainties arise from time to time, and it is impossible for us to predict those events or how they may affect Vivmark.