
1
12 Forward-Looking Statements and Additional Information This presentation may contain “forward-looking statements” within the meaning of the Private Securities Litigation Reform Act of 1995, as amended, including certain plans, expectations, goals, projections, and statements, which are subject to numerous risks, assumptions, and uncertainties. Forward- looking statements can be identified by the use of the words “believe,” “expect,” “anticipate,” “intend,” “estimate,” “assume,” “plan,” “target,” “potential,” or “goal,” or future or conditional verbs such as “will,” “may,” “might,” “should,” “could,” and other expressions which predict or indicate future events or trends and which do not relate to historical matters. Forward-looking statements should not be relied on, because they involve inherent risks and uncertainties, some of which are beyond the control of Camden National Corporation (the “Company”), that could cause actual results to differ materially from what is reflected in the forward-looking statements. These risks and uncertainties include: weakness in the United States economy in general and the regional and local economies within the Northern New England region, which could result in a deterioration of credit quality, an increase in the allowance for credit losses or a reduced demand for the Company’s credit or fee-based products and services; changes in trade, monetary, and fiscal policies and laws, including Federal Reserve interest rate policies or the imposition of tariffs or retaliatory tariffs and related litigation; inflation, interest rate, market, and monetary fluctuations; competitive pressures, including continued industry consolidation and the increased financial services provided by non-banks; deterioration in the value of the Company's investment securities; commercial real estate vacancies and their impact on the ability of borrowers to repay their loans; volatility in the securities markets that could adversely affect the value or credit quality of the Company’s assets, impairment of goodwill, or the availability and terms of funding necessary to meet the Company’s liquidity needs; changes in information technology and other operational risks, including cybersecurity and artificial intelligence, that require increased capital spending and introduce additional risk; changes in consumer spending and savings habits; changes in tax, banking, securities and insurance laws and regulations; the outcome of pending and future litigation and governmental proceedings, including tax-related examinations and other matters; changes in accounting policies, practices and standards; the effects of climate change on the Company and its customers, borrowers or service providers; the effects of civil unrest, international hostilities, including the continuation of conflict in the Middle East, or other geopolitical events; the effects of epidemics and pandemics; turmoil and volatility in the financial services industry; actions taken by governmental agencies to stabilize the financial system and the effectiveness of such actions; increases in deposit insurance assessments due to bank failures; changes to regulatory capital requirements; questions about the soundness of one or more financial institutions with which the Company does business; and the risks and uncertainties discussed in more detail in the “Risk Factors” section of the Company’s Annual Report on Form 10-K for the year ended December 31, 2025, and subsequent filings with the Securities and Exchange Commission (the “SEC”). Factors other than these risks could also materially affect the Company’s financial results and performance, and the readers should not consider the risks described above to be a comprehensive description of all potential risks and uncertainties that affect the Company. Readers should not place undue reliance on our forward-looking statements. The Company does not have any obligation to update forward-looking statements. This presentation includes non-GAAP financial measures to describe the Company’s performance. The Company uses these non-GAAP financial measures for purposes of measuring performance against the Company's peer group and other financial institutions, as well as for analyzing its internal performance. The Company also believes these non-GAAP financial measures help investors better understand the Company's operating performance and trends and allow for better performance comparisons to other banks. These non-GAAP financial measures also remove the impact of unusual items that may obscure trends in the Company’s underlying performance. These disclosures should not be viewed as a substitute for GAAP operating results, nor are they necessarily comparable to non-GAAP performance measures that may be presented by other financial institutions. Reconciliations to the comparable GAAP financial measures can be found by referring to the Company’s financial information filed with the SEC for the respective period.
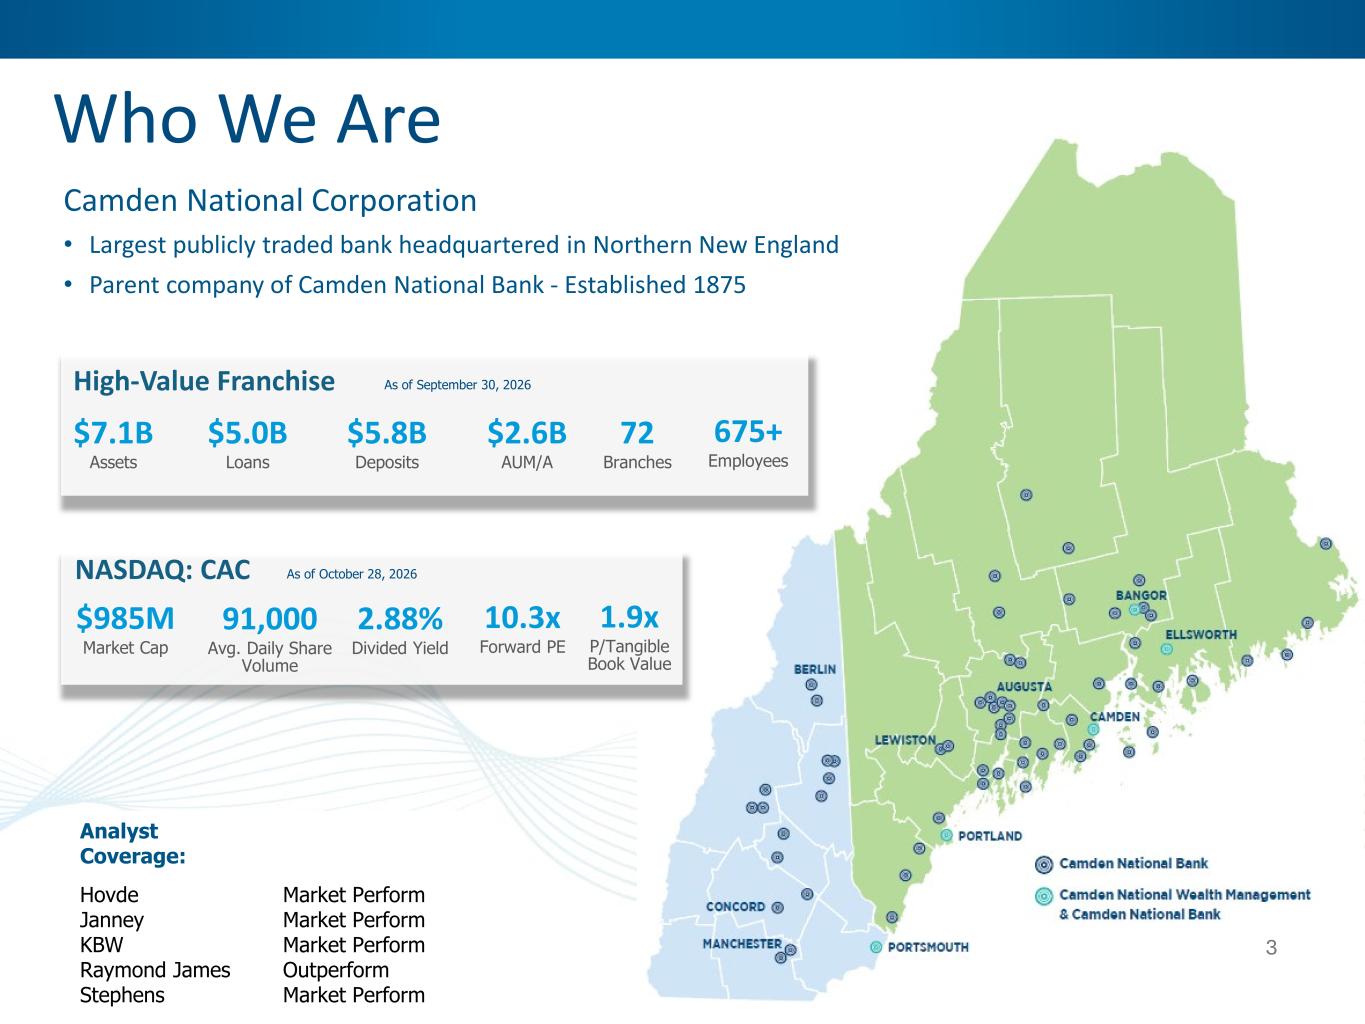
2 Camden National Corporation • Largest publicly traded bank headquartered in Northern New England • Parent company of Camden National Bank - Established 1875 Who We Are 3 High-Value Franchise $7.1B Assets $5.0B Loans $5.8B Deposits 675+ Employees 72 Branches $2.6B AUM/A As of September 30, 2026 NASDAQ: CAC $985M Market Cap 91,000 Avg. Daily Share Volume 2.88% Divided Yield 10.3x Forward PE As of October 28, 2026 Analyst Coverage: Hovde Janney KBW Raymond James Stephens Market Perform Market Perform Market Perform Outperform Market Perform 1.9x P/Tangible Book Value
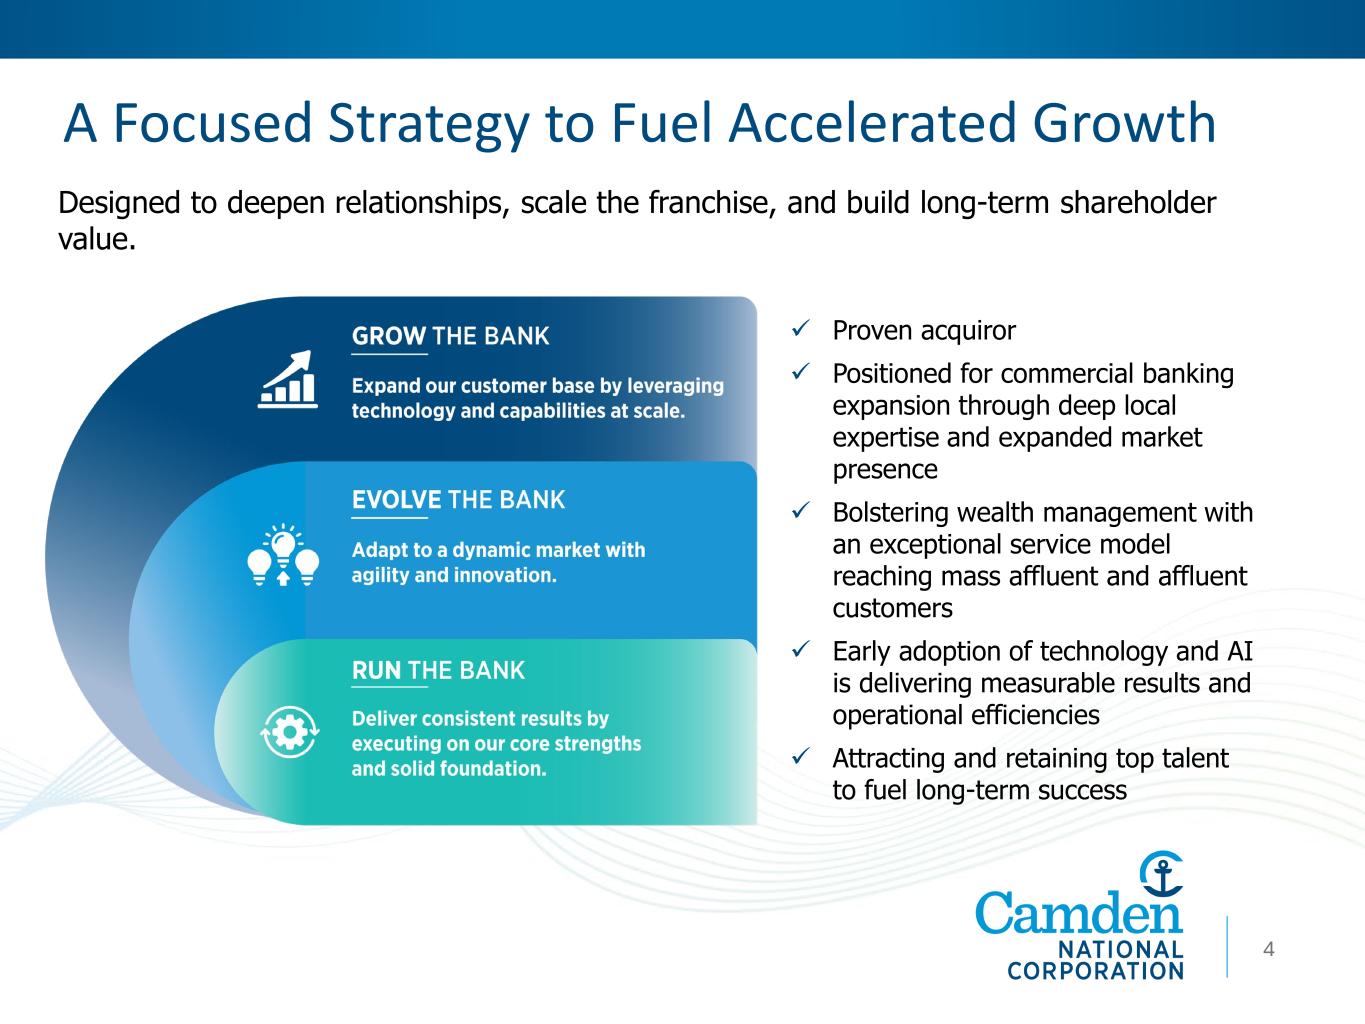
A Focused Strategy to Fuel Accelerated Growth 54 Proven acquiror Positioned for commercial banking expansion through deep local expertise and expanded market presence Bolstering wealth management with an exceptional service model reaching mass affluent and affluent customers Early adoption of technology and AI is delivering measurable results and operational efficiencies Attracting and retaining top talent to fuel long-term success Designed to deepen relationships, scale the franchise, and build long-term shareholder value.
Why Invest? 5 • Low-risk, high-quality balance sheet Top-quartile credit performance supported by disciplined underwriting and portfolio diversification • Stable, relationship-driven deposit base Granular, low-cost deposits anchored in primary customer relationships • Well-diversified revenue base Complementary wealth, brokerage, and mortgage businesses diversify revenue • Capital strength and shareholder returns Organic capital generation supporting dividends, growth, and flexibility • Proven operator with scalable infrastructure A lean operating model and scalable infrastructure support efficiency as the franchise grows 5 A franchise built for resilient performance across economic cycles Delivered by an experienced and energized management team with a proven track record of disciplined execution
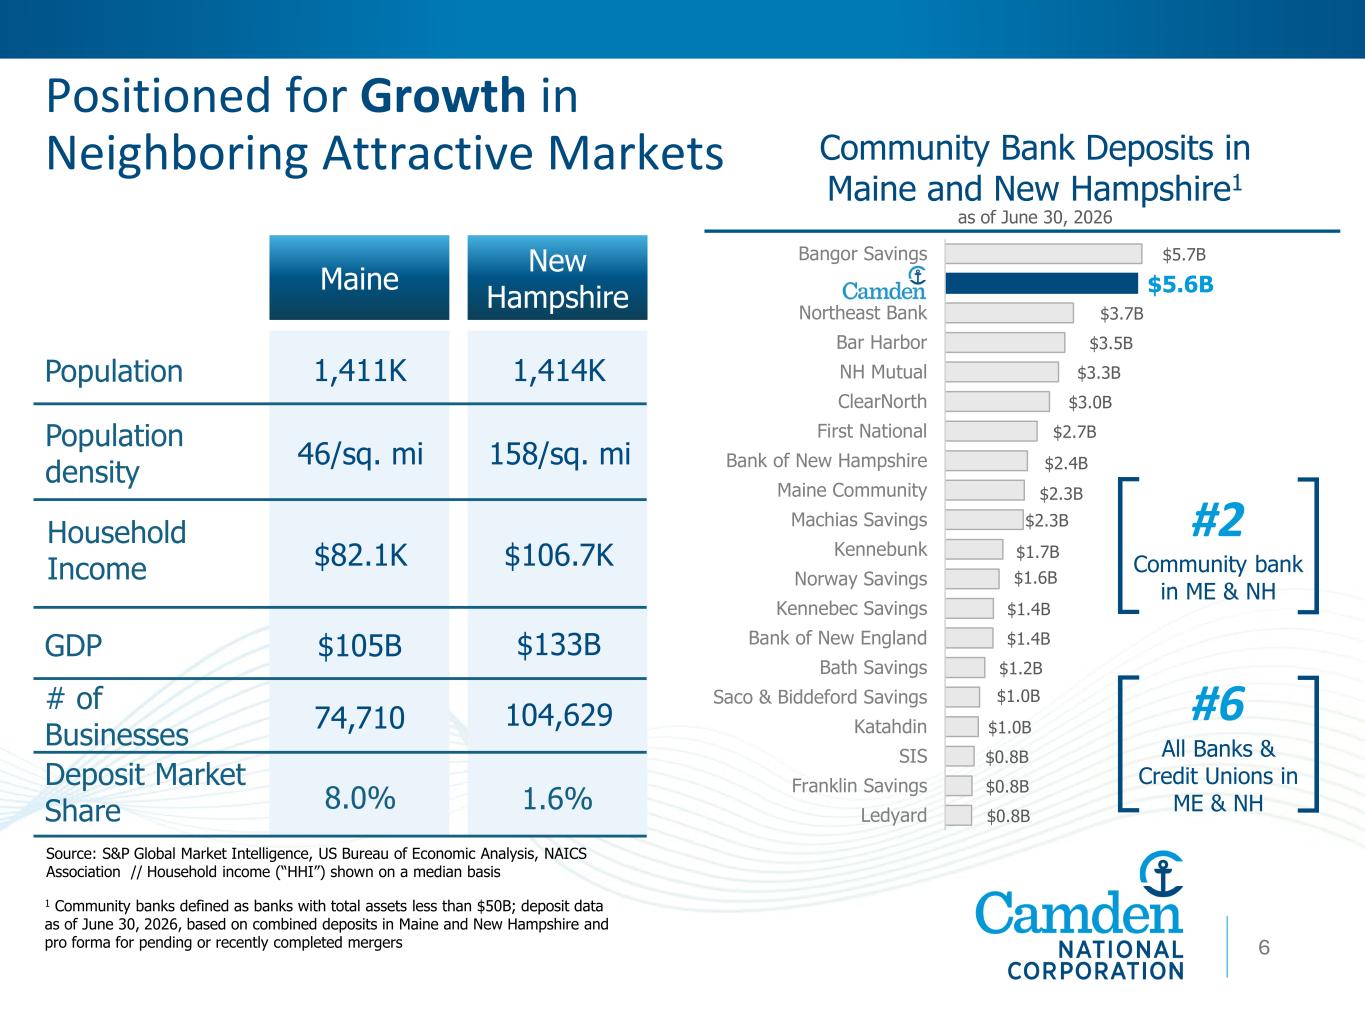
$5.7B $5.6B $3.7B $3.5B $3.3B $3.0B $2.7B $2.4B $2.3B $2.3B $1.7B $1.6B $1.4B $1.4B $1.2B $1.0B $1.0B $0.8B $0.8B $0.8B Bangor Savings Camden Northeast Bank Bar Harbor NH Mutual ClearNorth First National Bank of New Hampshire Maine Community Machias Savings Kennebunk Norway Savings Kennebec Savings Bank of New England Bath Savings Saco & Biddeford Savings Katahdin SIS Franklin Savings Ledyard Positioned for Growth in Neighboring Attractive Markets 1 Community banks defined as banks with total assets less than $50B; deposit data as of June 30, 2026, based on combined deposits in Maine and New Hampshire and pro forma for pending or recently completed mergers Community Bank Deposits in Maine and New Hampshire1 as of June 30, 2026 Source: S&P Global Market Intelligence, US Bureau of Economic Analysis, NAICS Association // Household income (“HHI”) shown on a median basis Maine New Hampshire Population GDP # of Businesses Population density Household Income 1,411K $82.1K 1,414K $106.7K $105B $133B 74,710 104,629 46/sq. mi 158/sq. mi 6 Deposit Market Share 8.0% 1.6% 6 #2 Community bank in ME & NH #6 All Banks & Credit Unions in ME & NH
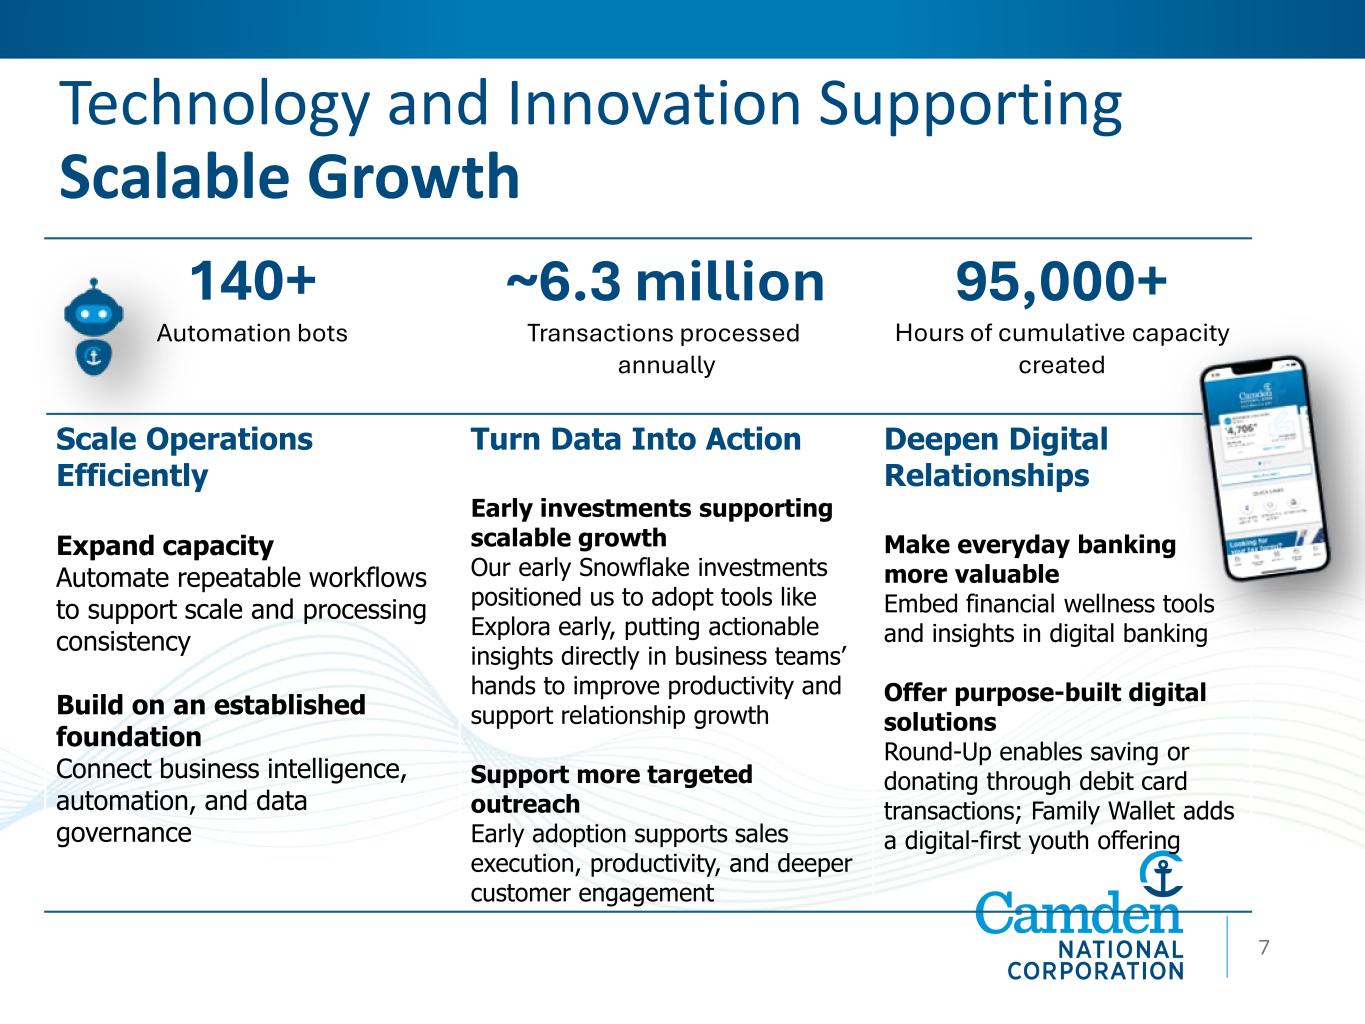
Technology and Innovation Supporting Scalable Growth 77 140+ Automation bots ~6.3 million Transactions processed annually 95,000+ Hours of cumulative capacity created Scale Operations Efficiently Expand capacity Automate repeatable workflows to support scale and processing consistency Build on an established foundation Connect business intelligence, automation, and data governance Turn Data Into Action Early investments supporting scalable growth Our early Snowflake investments positioned us to adopt tools like Explora early, putting actionable insights directly in business teams’ hands to improve productivity and support relationship growth Support more targeted outreach Early adoption supports sales execution, productivity, and deeper customer engagement Deepen Digital Relationships Make everyday banking more valuable Embed financial wellness tools and insights in digital banking Offer purpose-built digital solutions Round-Up enables saving or donating through debit card transactions; Family Wallet adds a digital-first youth offering
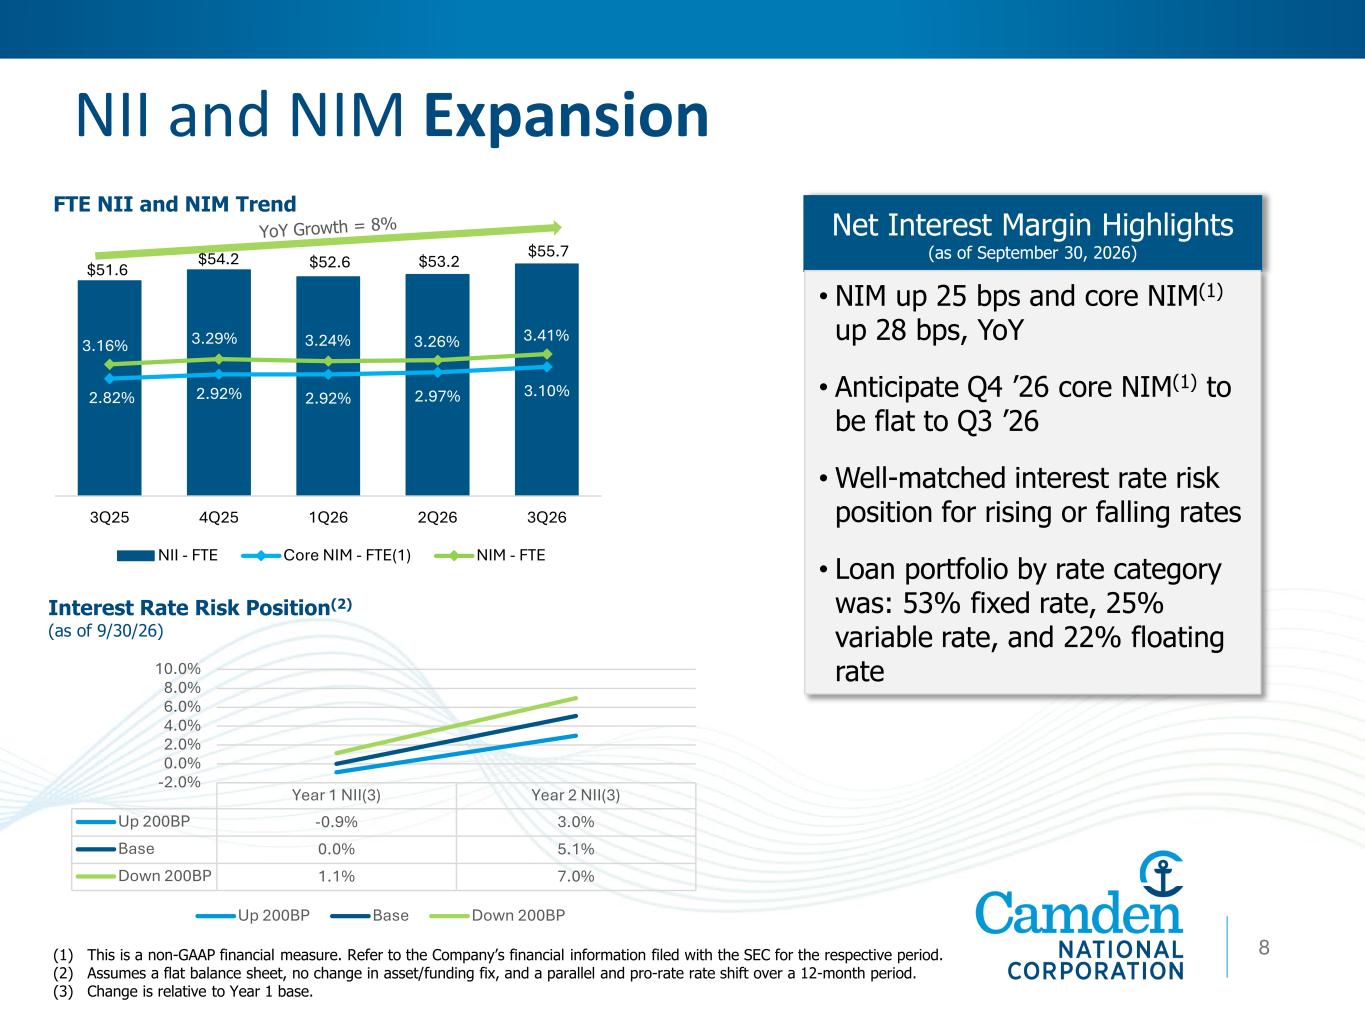
$51.6 $54.2 $52.6 $53.2 $55.7 2.82% 2.92% 2.92% 2.97% 3.10% 3.16% 3.29% 3.24% 3.26% 3.41% 3Q25 4Q25 1Q26 2Q26 3Q26 NII - FTE Core NIM - FTE(1) NIM - FTE NII and NIM Expansion 8 Net Interest Margin Highlights (as of September 30, 2026) • NIM up 25 bps and core NIM(1) up 28 bps, YoY • Anticipate Q4 ’26 core NIM(1) to be flat to Q3 ’26 • Well-matched interest rate risk position for rising or falling rates • Loan portfolio by rate category was: 53% fixed rate, 25% variable rate, and 22% floating rate Interest Rate Risk Position(2) (as of 9/30/26) (1) This is a non-GAAP financial measure. Refer to the Company’s financial information filed with the SEC for the respective period. (2) Assumes a flat balance sheet, no change in asset/funding fix, and a parallel and pro-rate rate shift over a 12-month period. (3) Change is relative to Year 1 base. FTE NII and NIM Trend Year 1 NII(3) Year 2 NII(3) Up 200BP -0.9% 3.0% Base 0.0% 5.1% Down 200BP 1.1% 7.0% -2.0% 0.0% 2.0% 4.0% 6.0% 8.0% 10.0% Up 200BP Base Down 200BP
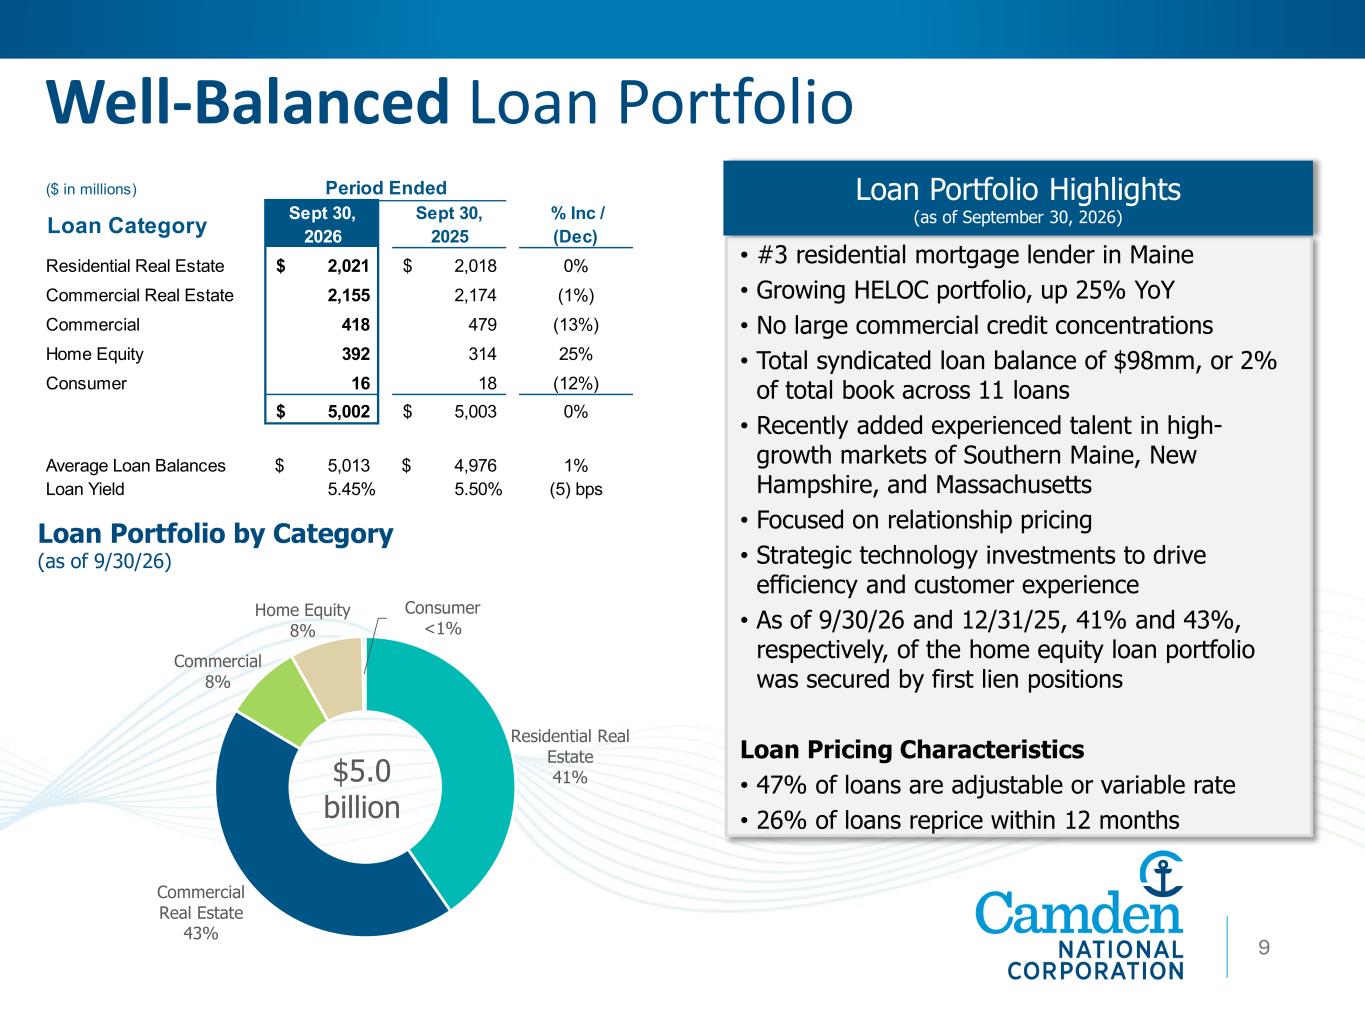
Well-Balanced Loan Portfolio • #3 residential mortgage lender in Maine • Growing HELOC portfolio, up 25% YoY • No large commercial credit concentrations • Total syndicated loan balance of $98mm, or 2% of total book across 11 loans • Recently added experienced talent in high- growth markets of Southern Maine, New Hampshire, and Massachusetts • Focused on relationship pricing • Strategic technology investments to drive efficiency and customer experience • As of 9/30/26 and 12/31/25, 41% and 43%, respectively, of the home equity loan portfolio was secured by first lien positions Loan Pricing Characteristics • 47% of loans are adjustable or variable rate • 26% of loans reprice within 12 months Loan Portfolio Highlights (as of September 30, 2026) $5.0 billion 8 Loan Portfolio by Category (as of 9/30/26) 9 Residential Real Estate 41% Commercial Real Estate 43% Commercial 8% Home Equity 8% Consumer <1% ($ in millions) Loan Category Sept 30, 2026 Sept 30, 2025 % Inc / (Dec) Residential Real Estate 2,021$ 2,018$ 0% Commercial Real Estate 2,155 2,174 (1%) Commercial 418 479 (13%) Home Equity 392 314 25% Consumer 16 18 (12%) 5,002$ 5,003$ 0% Average Loan Balances 5,013$ 4,976$ 1% Loan Yield 5.45% 5.50% (5) bps Period Ended
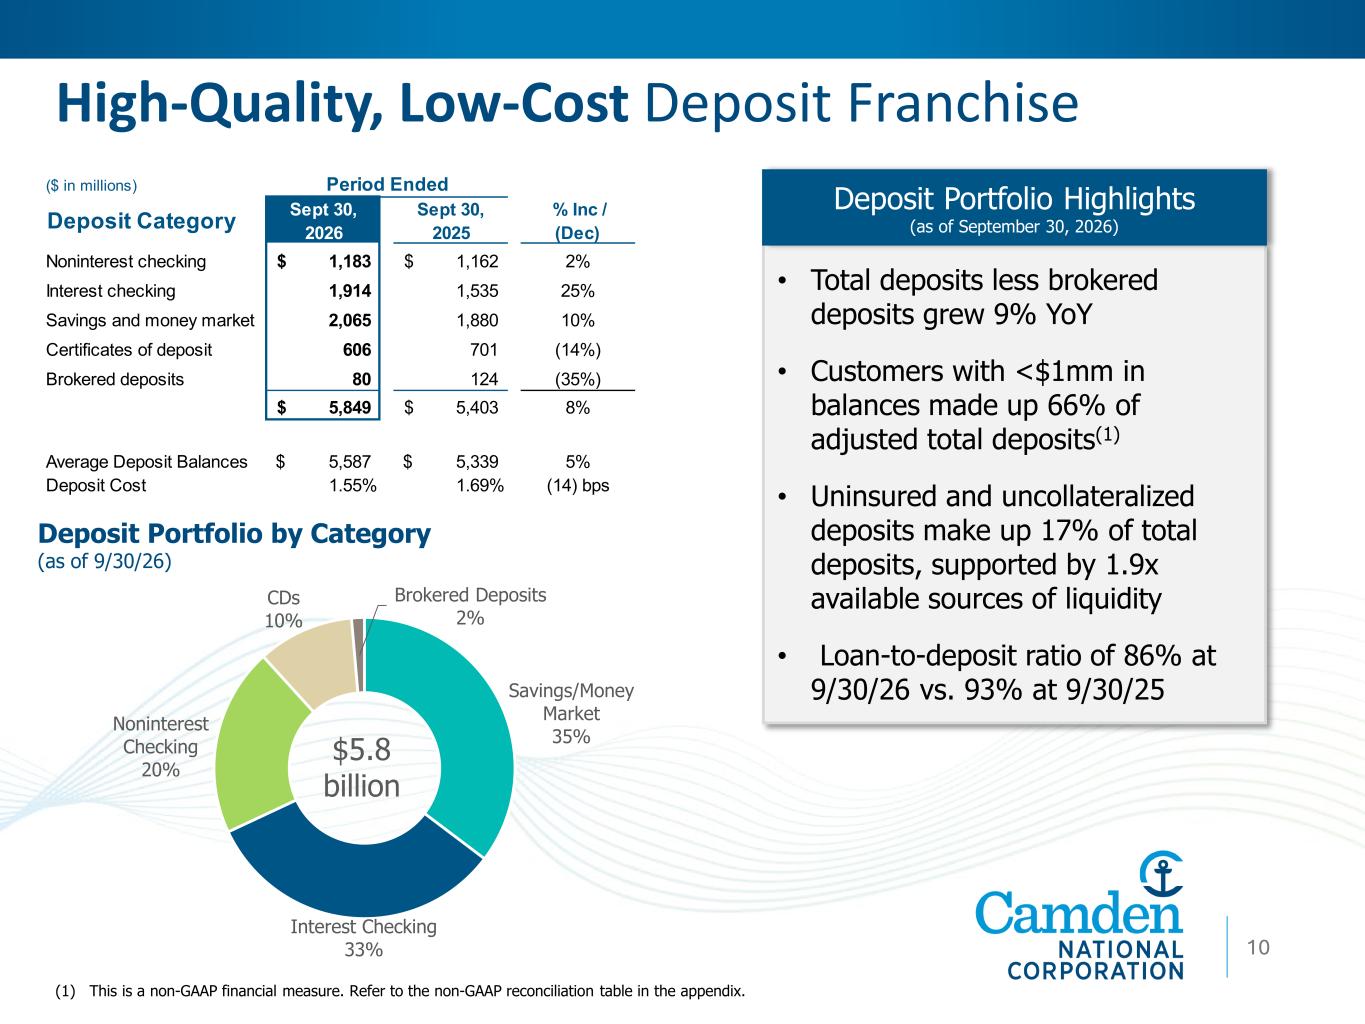
Savings/Money Market 35% Interest Checking 33% Noninterest Checking 20% CDs 10% Brokered Deposits 2% High-Quality, Low-Cost Deposit Franchise (1) This is a non-GAAP financial measure. Refer to the non-GAAP reconciliation table in the appendix. • Total deposits less brokered deposits grew 9% YoY • Customers with <$1mm in balances made up 66% of adjusted total deposits(1) • Uninsured and uncollateralized deposits make up 17% of total deposits, supported by 1.9x available sources of liquidity • Loan-to-deposit ratio of 86% at 9/30/26 vs. 93% at 9/30/25 Deposit Portfolio Highlights (as of September 30, 2026) 1110 Deposit Portfolio by Category (as of 9/30/26) $5.8 billion ($ in millions) Deposit Category Sept 30, 2026 Sept 30, 2025 % Inc / (Dec) Noninterest checking 1,183$ 1,162$ 2% Interest checking 1,914 1,535 25% Savings and money market 2,065 1,880 10% Certificates of deposit 606 701 (14%) Brokered deposits 80 124 (35%) 5,849$ 5,403$ 8% Average Deposit Balances 5,587$ 5,339$ 5% Deposit Cost 1.55% 1.69% (14) bps Period Ended
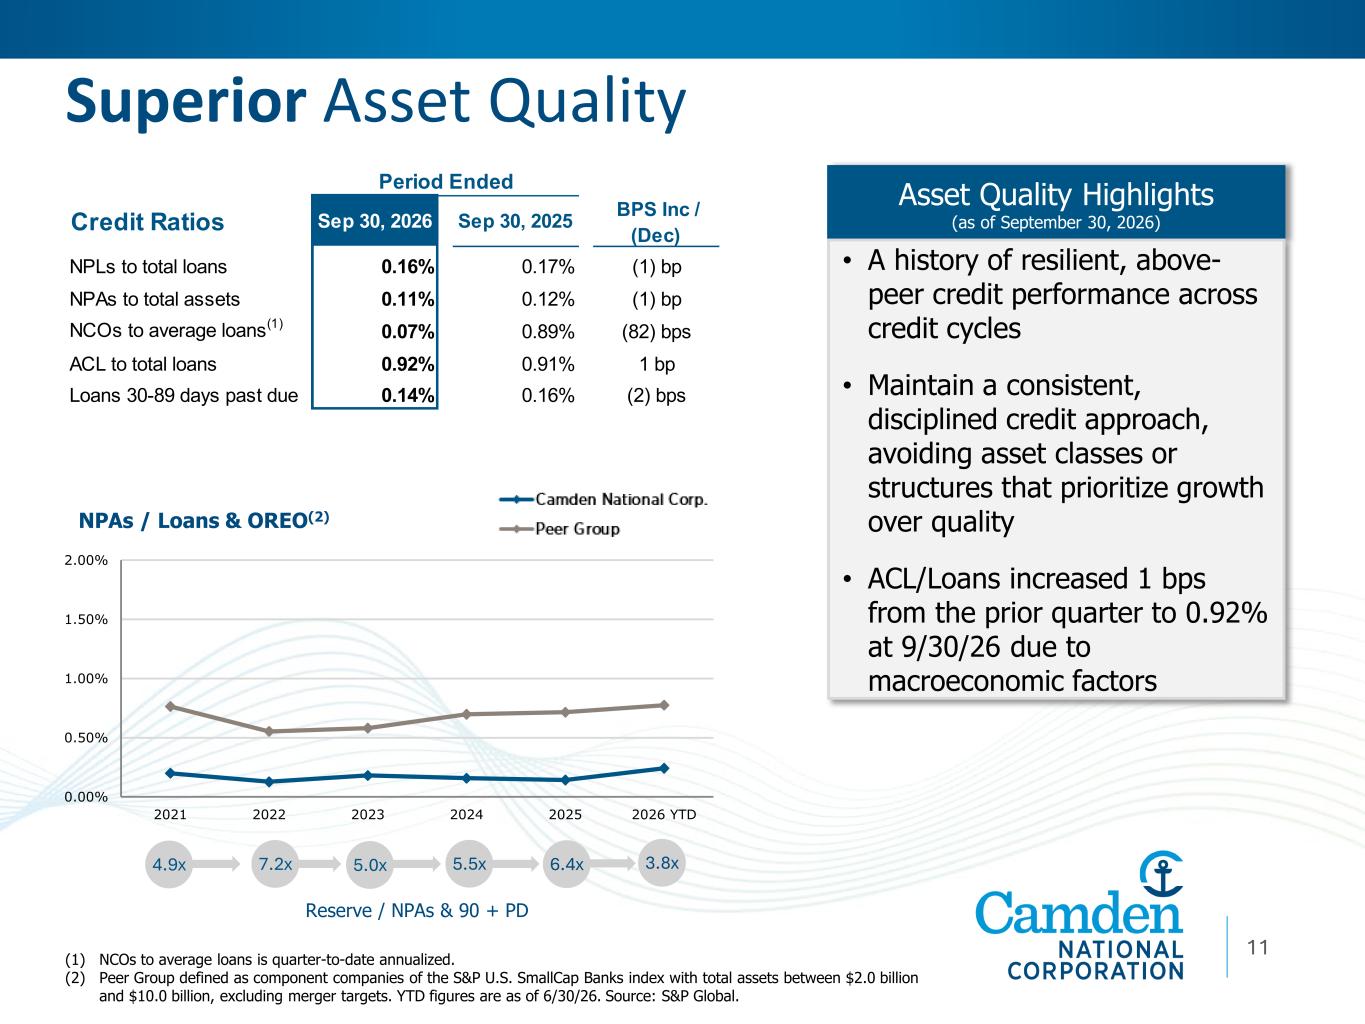
Superior Asset Quality (1) NCOs to average loans is quarter-to-date annualized. (2) Peer Group defined as component companies of the S&P U.S. SmallCap Banks index with total assets between $2.0 billion and $10.0 billion, excluding merger targets. YTD figures are as of 6/30/26. Source: S&P Global. NPAs / Loans & OREO(2) 1011 Asset Quality Highlights (as of September 30, 2026) • A history of resilient, above- peer credit performance across credit cycles • Maintain a consistent, disciplined credit approach, avoiding asset classes or structures that prioritize growth over quality • ACL/Loans increased 1 bps from the prior quarter to 0.92% at 9/30/26 due to macroeconomic factors Reserve / NPAs & 90 + PD 4.9x 7.2x 5.0x 5.5x 6.4x 3.8x 0.00% 0.50% 1.00% 1.50% 2.00% 2021 2022 2023 2024 2025 2026 YTD Credit Ratios Sep 30, 2026 Sep 30, 2025 BPS Inc / (Dec) NPLs to total loans 0.16% 0.17% (1) bp NPAs to total assets 0.11% 0.12% (1) bp NCOs to average loans(1) 0.07% 0.89% (82) bps ACL to total loans 0.92% 0.91% 1 bp Loans 30-89 days past due 0.14% 0.16% (2) bps Period Ended
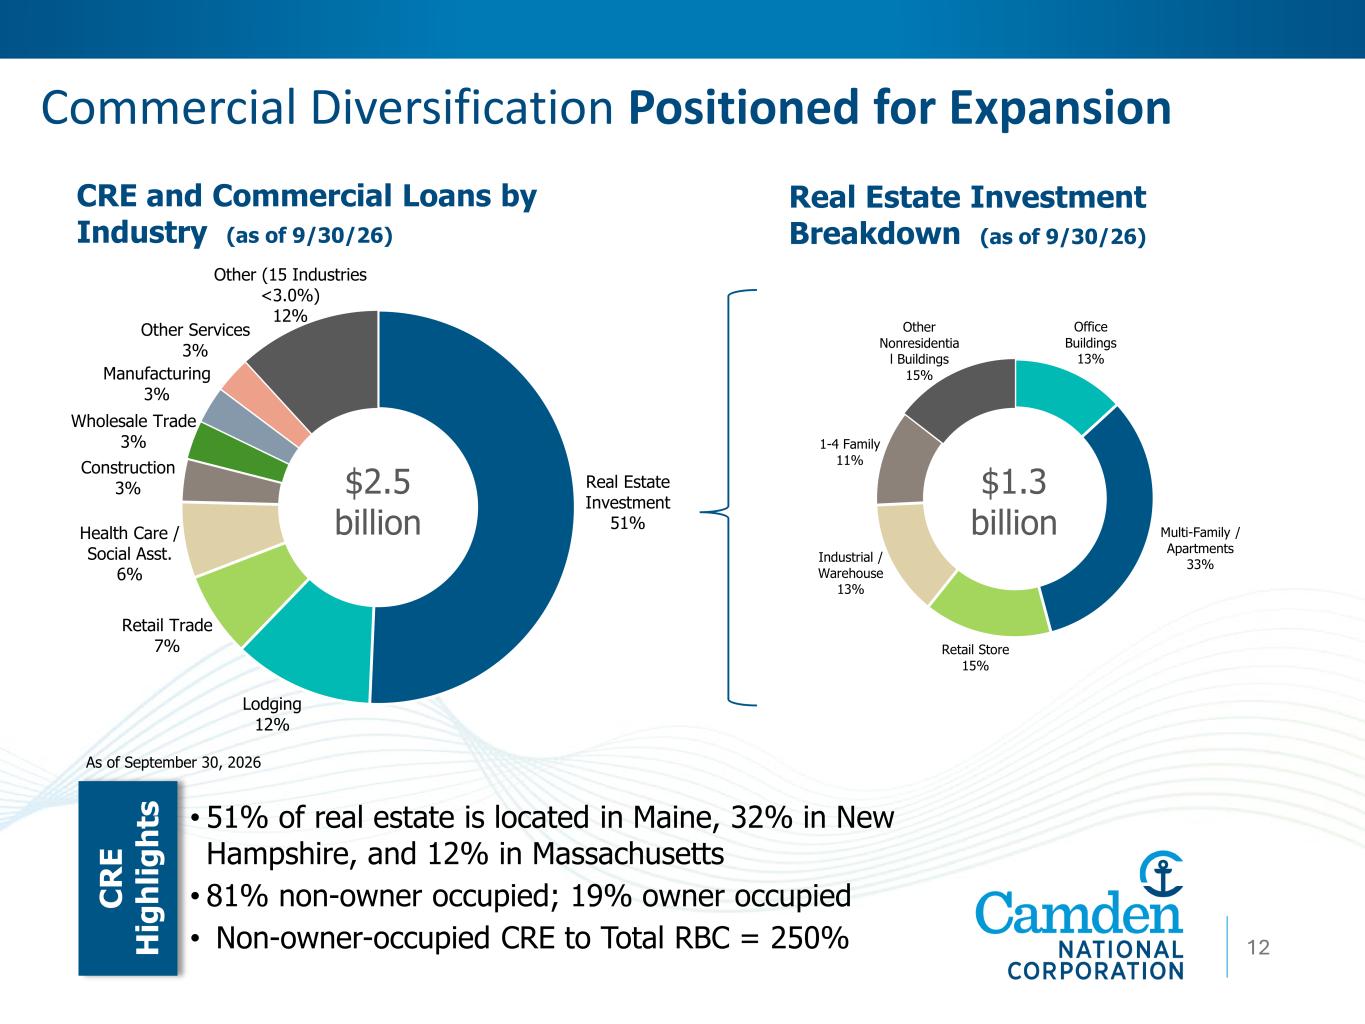
Real Estate Investment 51% Lodging 12% Retail Trade 7% Health Care / Social Asst. 6% Construction 3% Wholesale Trade 3% Manufacturing 3% Other Services 3% Other (15 Industries <3.0%) 12% Commercial Diversification Positioned for Expansion 9 Real Estate Investment Breakdown (as of 9/30/26) CRE and Commercial Loans by Industry (as of 9/30/26) CR E H ig hl ig ht s • 51% of real estate is located in Maine, 32% in New Hampshire, and 12% in Massachusetts • 81% non-owner occupied; 19% owner occupied • Non-owner-occupied CRE to Total RBC = 250% As of September 30, 2026 $2.5 billion $1.3 billion 12 Office Buildings 13% Multi-Family / Apartments 33% Retail Store 15% Industrial / Warehouse 13% 1-4 Family 11% Other Nonresidentia l Buildings 15%
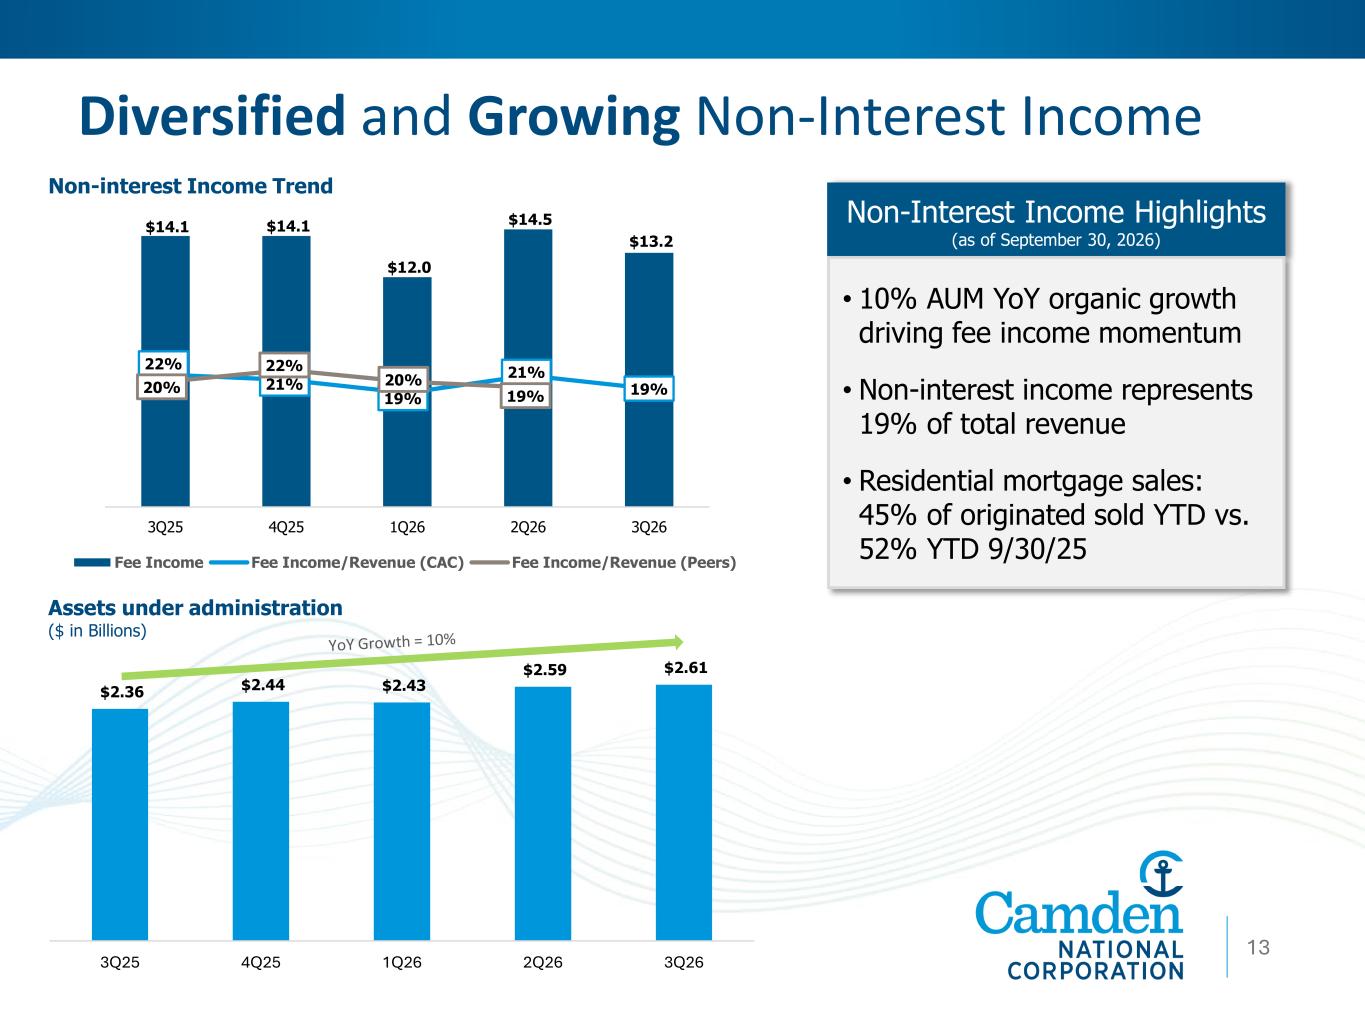
$2.36 $2.44 $2.43 $2.59 $2.61 3Q25 4Q25 1Q26 2Q26 3Q26 Diversified and Growing Non-Interest Income 1213 Non-Interest Income Highlights (as of September 30, 2026) • 10% AUM YoY organic growth driving fee income momentum • Non-interest income represents 19% of total revenue • Residential mortgage sales: 45% of originated sold YTD vs. 52% YTD 9/30/25 Non-interest Income Trend Assets under administration ($ in Billions) $14.1 $14.1 $12.0 $14.5 $13.2 22% 21% 19% 21% 19%20% 22% 20% 19% 0% 5% 10% 15% 20% 25% 30% 35% 40% 45% 50% $- $2.0 $4.0 $6.0 $8.0 $10.0 $12.0 $14.0 $16.0 3Q25 4Q25 1Q26 2Q26 3Q26 Fee Income Fee Income/Revenue (CAC) Fee Income/Revenue (Peers)
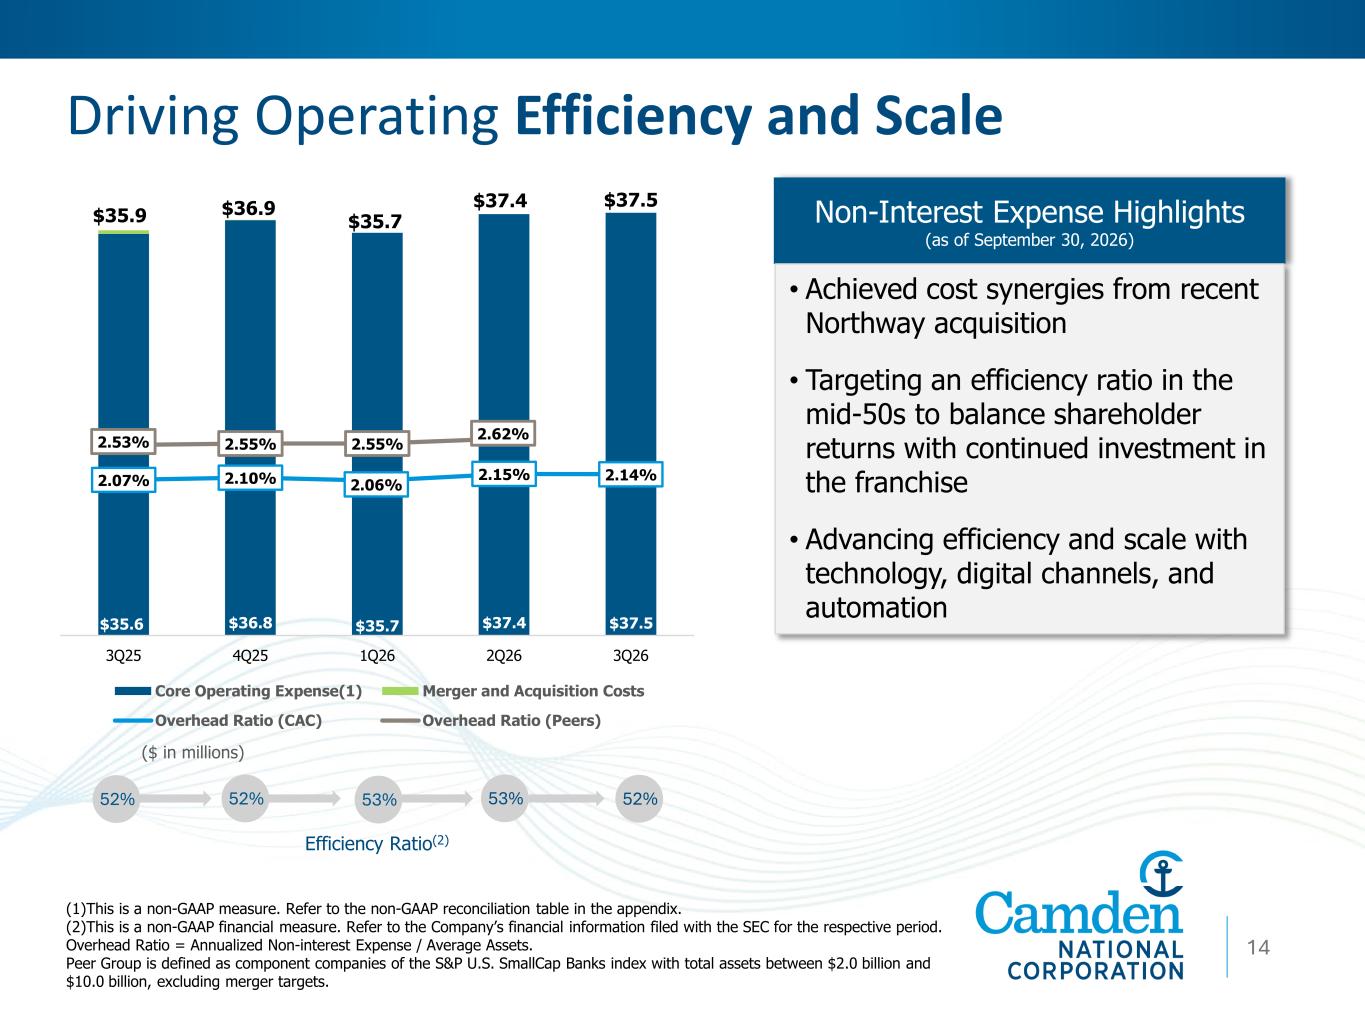
Driving Operating Efficiency and Scale ($ in millions) Efficiency Ratio(2) 52% 52% 53% 53% 52% Non-Interest Expense Highlights (as of September 30, 2026) 13 (1)This is a non-GAAP measure. Refer to the non-GAAP reconciliation table in the appendix. (2)This is a non-GAAP financial measure. Refer to the Company’s financial information filed with the SEC for the respective period. Overhead Ratio = Annualized Non-interest Expense / Average Assets. Peer Group is defined as component companies of the S&P U.S. SmallCap Banks index with total assets between $2.0 billion and $10.0 billion, excluding merger targets. • Achieved cost synergies from recent Northway acquisition • Targeting an efficiency ratio in the mid-50s to balance shareholder returns with continued investment in the franchise • Advancing efficiency and scale with technology, digital channels, and automation 14 $35.6 $36.8 $35.7 $37.4 $37.5 $35.9 $36.9 $35.7 $37.4 $37.5 2.07% 2.10% 2.06% 2.15% 2.14% 2.53% 2.55% 2.55% 2.62% 0.00% 1.00% 2.00% 3.00% 4.00% 5.00% 6.00% $- $5.0 $10.0 $15.0 $20.0 $25.0 $30.0 $35.0 $40.0 3Q25 4Q25 1Q26 2Q26 3Q26 Core Operating Expense(1) Merger and Acquisition Costs Overhead Ratio (CAC) Overhead Ratio (Peers)
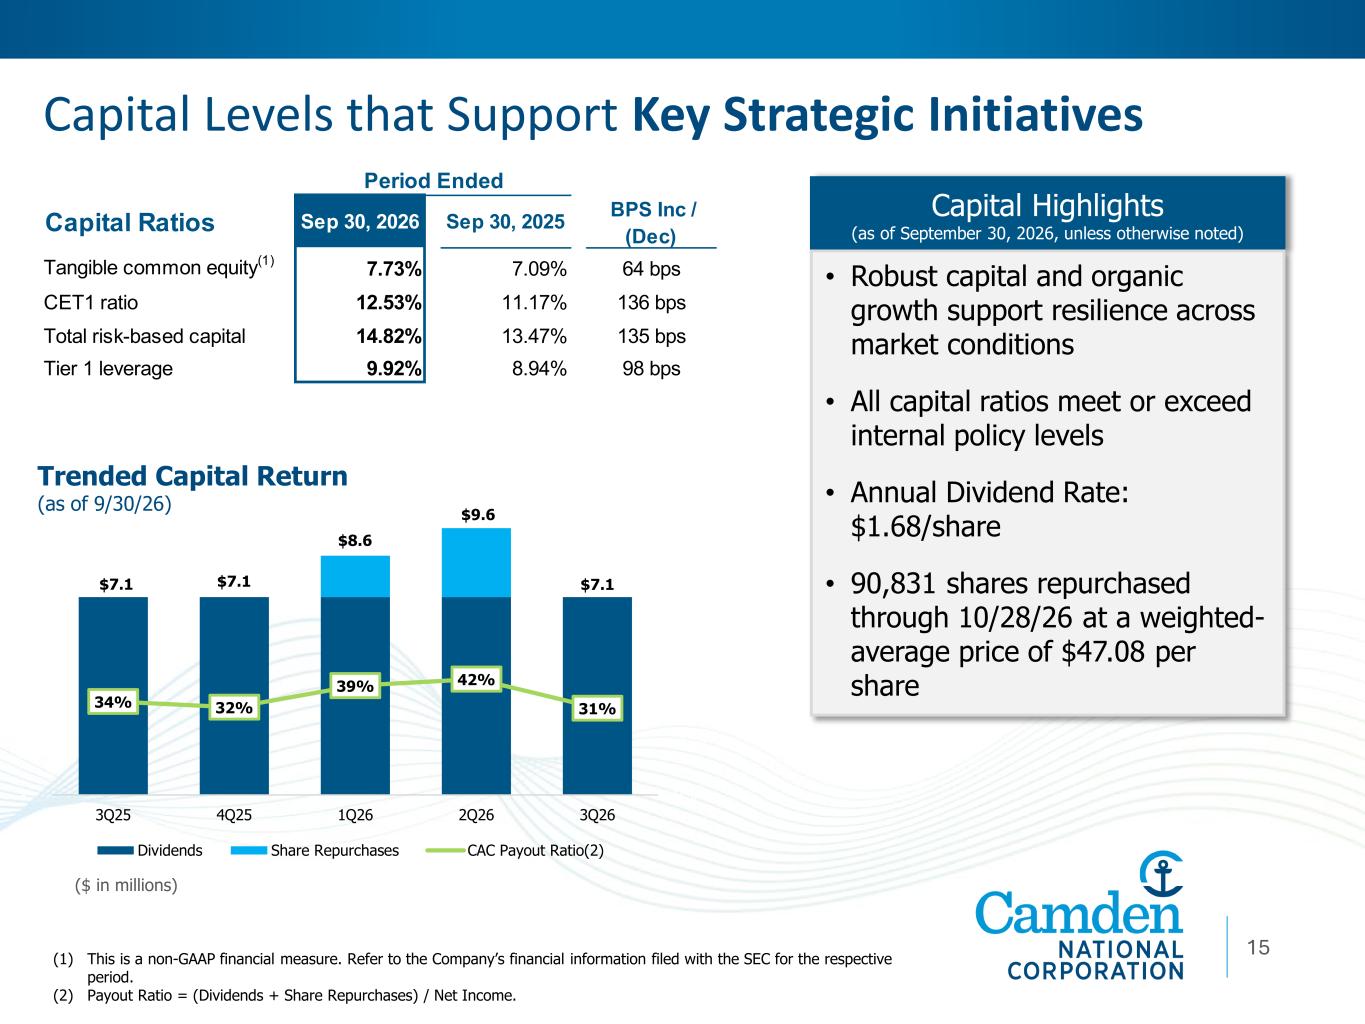
Capital Levels that Support Key Strategic Initiatives (1) This is a non-GAAP financial measure. Refer to the Company’s financial information filed with the SEC for the respective period. (2) Payout Ratio = (Dividends + Share Repurchases) / Net Income. 15 Capital Highlights (as of September 30, 2026, unless otherwise noted) • Robust capital and organic growth support resilience across market conditions • All capital ratios meet or exceed internal policy levels • Annual Dividend Rate: $1.68/share • 90,831 shares repurchased through 10/28/26 at a weighted- average price of $47.08 per share Trended Capital Return (as of 9/30/26) ($ in millions) Capital Ratios Sep 30, 2026 Sep 30, 2025 BPS Inc / (Dec) Tangible common equity(1) 7.73% 7.09% 64 bps CET1 ratio 12.53% 11.17% 136 bps Total risk-based capital 14.82% 13.47% 135 bps Tier 1 leverage 9.92% 8.94% 98 bps Period Ended 34% 32% 39% 42% 31% 0% 20% 40% 60% 80% 100% 120% - 2,000 4,000 6,000 8,000 0,000 2,000 3Q25 4Q25 1Q26 2Q26 3Q26 Dividends Share Repurchases CAC Payout Ratio(2) $7.1 $7.1 $8.6 $9.6 $7.1
APPENDIX 1616
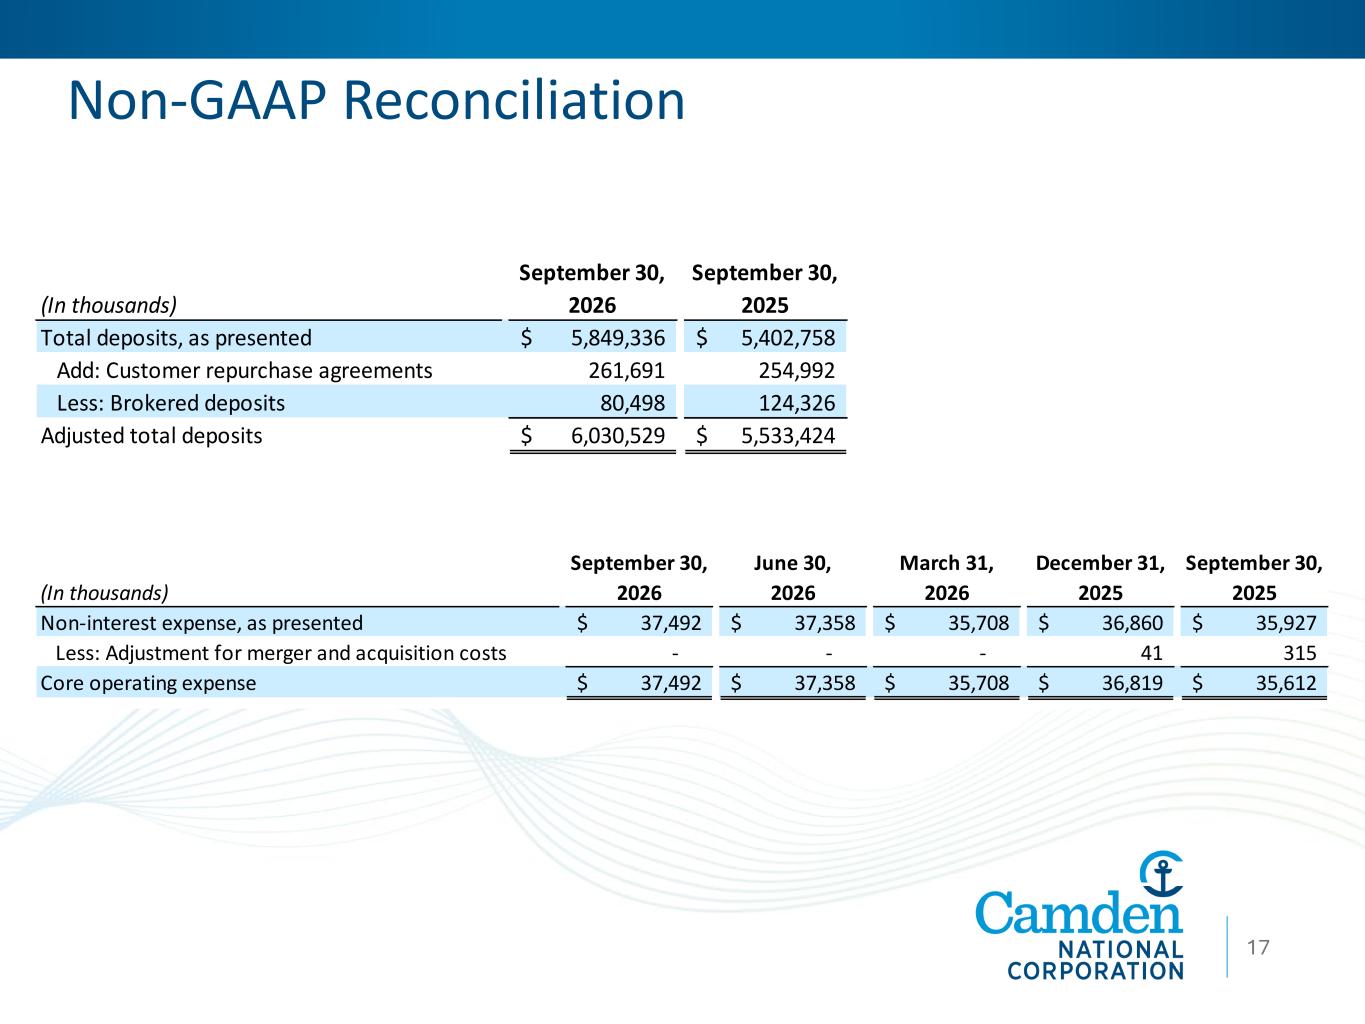
16 Non-GAAP Reconciliation 17 (In thousands) September 30, 2026 September 30, 2025 Total deposits, as presented 5,849,336$ 5,402,758$ Add: Customer repurchase agreements 261,691 254,992 Less: Brokered deposits 80,498 124,326 Adjusted total deposits 6,030,529$ 5,533,424$ (In thousands) September 30, 2026 June 30, 2026 March 31, 2026 December 31, 2025 September 30, 2025 Non-interest expense, as presented 37,492$ 37,358$ 35,708$ 36,860$ 35,927$ Less: Adjustment for merger and acquisition costs - - - 41 315 Core operating expense 37,492$ 37,358$ 35,708$ 36,819$ 35,612$