Shareholder Report
|
6 Months Ended |
|
Aug. 31, 2026
USD ($)
Holding
|
|---|
| Shareholder Report [Line Items] |
|
|
| Document Type |
N-CSR
|
|
| Amendment Flag |
false
|
|
| Registrant Name |
Brinker Capital Destinations
Trust
|
|
| Entity Central Index Key |
0001688680
|
|
| Entity Investment Company Type |
N-1A
|
|
| Document Period End Date |
Aug. 31, 2026
|
|
| C000176692 |
|
|
| Shareholder Report [Line Items] |
|
|
| Fund Name |
Destinations Large Cap Equity Fund
|
|
| Class Name |
Class I
|
|
| Trading Symbol |
DLCFX
|
|
| Annual or Semi-Annual Statement [Text Block] |
This semi-annual shareholder summary report contains important information about the Fund for the period of March 1, 2026 to August 31, 2026.
|
|
| Shareholder Report Annual or Semi-Annual |
Semi-Annual Shareholder Report
|
|
| Additional Information [Text Block] |
You can find additional information about the Fund at http://destinationsfunds.com/. You can also request this information by calling 1-877-771-7979.
|
|
| Additional Information Phone Number |
1-877-771-7979
|
|
| Additional Information Website |
http://destinationsfunds.com/
|
|
| Expenses [Text Block] |
What were the Fund's costs for the last 6 months?(based on a hypothetical $10,000 investment) Table SummaryClass name | Cost of a $10,000 investment | Cost paid as a % of a $10,000 investment |
|---|
Class I | $44 | 0.83%Footnote Reference* |
|---|
| Footnote | Description | Footnote* | Annualized |
|
|
| Expenses Paid, Amount |
$ 44
|
|
| Expense Ratio, Percent |
0.83%
|
[1] |
| Performance Past Does Not Indicate Future [Text] |
The Fund's past performance is not a good predictor of how the Fund will perform in the future
|
|
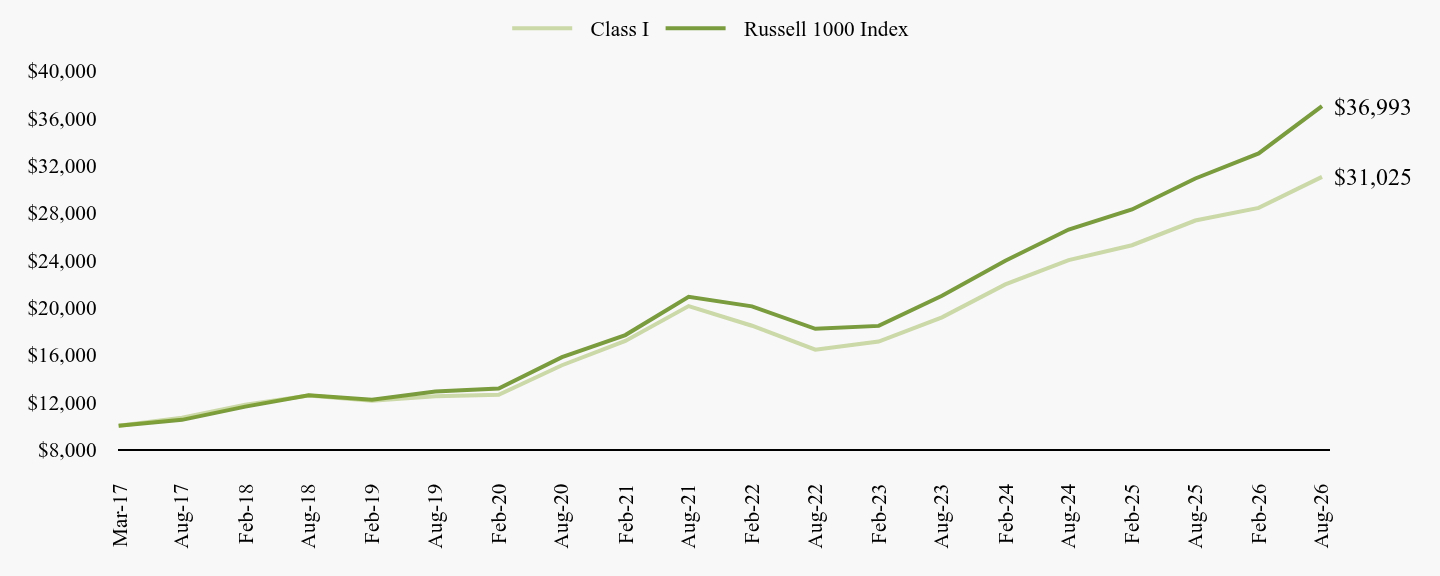
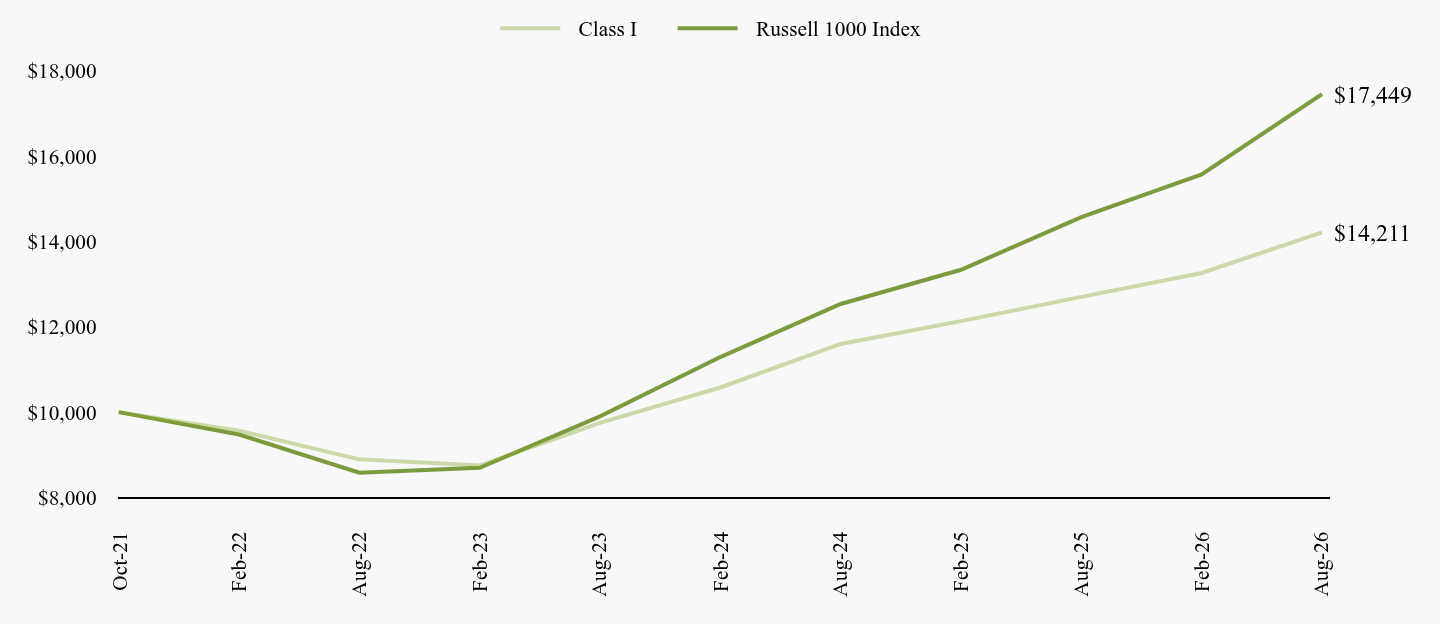
| Line Graph [Table Text Block] |
Table Summary | Class I | Russell 1000 Index |
|---|
Mar-17 | $10,000 | $10,000 |
|---|
Aug-17 | $10,680 | $10,504 |
|---|
Feb-18 | $11,789 | $11,619 |
|---|
Aug-18 | $12,554 | $12,585 |
|---|
Feb-19 | $12,111 | $12,199 |
|---|
Aug-19 | $12,497 | $12,899 |
|---|
Feb-20 | $12,628 | $13,153 |
|---|
Aug-20 | $15,116 | $15,801 |
|---|
Feb-21 | $17,167 | $17,663 |
|---|
Aug-21 | $20,114 | $20,897 |
|---|
Feb-22 | $18,451 | $20,086 |
|---|
Aug-22 | $16,432 | $18,188 |
|---|
Feb-23 | $17,120 | $18,438 |
|---|
Aug-23 | $19,157 | $20,989 |
|---|
Feb-24 | $21,945 | $23,935 |
|---|
Aug-24 | $23,994 | $26,572 |
|---|
Feb-25 | $25,250 | $28,270 |
|---|
Aug-25 | $27,334 | $30,886 |
|---|
Feb-26 | $28,403 | $33,001 |
|---|
Aug-26 | $31,025 | $36,993 |
|---|
|
|
| Average Annual Return [Table Text Block] |
Table SummaryName | 1 Year | 5 Years | Since Inception
(03/20/2017) |
|---|
Class I | 13.50% | 9.05% | 12.68% |
|---|
Russell 1000 Index | 19.77% | 12.10% | 14.76% |
|---|
|
|
| Performance Inception Date |
Mar. 20, 2017
|
|
| No Deduction of Taxes [Text Block] |
The graph and table do not reflect the deduction of taxes that a shareholder would pay on Fund distributions or redemption of Fund shares
|
|
| AssetsNet |
$ 3,499,642,645
|
|
| Holdings Count | Holding |
318
|
|
| Advisory Fees Paid, Amount |
$ 10,427,435
|
|
| InvestmentCompanyPortfolioTurnover |
56.00%
|
|
| Additional Fund Statistics [Text Block] |
Table SummaryTotal Net Assets | $3,499,642,645 |
|---|
Number of Portfolio Holdings | 318 |
|---|
Portfolio Turnover Rate | 56% |
|---|
Advisory Fees Paid | $10,427,435 |
|---|
|
|
| Holdings [Text Block] |
Asset Class Weightings (% of Total Investments)Table SummaryCommon Stocks | 91.2% |
|---|
Exchange Traded Funds (ETFs) | 7.1% |
|---|
Preferred Stocks | 0.0%Footnote Reference* |
|---|
Short-Term Investments | 1.0% |
|---|
Money Market Fund | 0.7% |
|---|
Total | 100.0% |
|---|
| Footnote | Description | Footnote* | Position represents less than 0.05%. |
Sector Allocation (% of Total Investments)Table SummaryTechnology | 29.6% |
|---|
Communications | 15.4% |
|---|
Financial | 13.0% |
|---|
Consumer Non-cyclical | 12.7% |
|---|
Exchange Traded Funds (ETFs) | 7.1% |
|---|
Others | 20.5% |
|---|
Short-Term Investments | 1.0% |
|---|
Money Market Fund | 0.7% |
|---|
Total | 100.0% |
|---|
|
|
| Material Fund Change [Text Block] |
There were no material changes to the Fund. |
|
| C000202452 |
|
|
| Shareholder Report [Line Items] |
|
|
| Fund Name |
Destinations Large Cap Equity Fund
|
|
| Class Name |
Class Z
|
|
| Trading Symbol |
DLCZX
|
|
| Annual or Semi-Annual Statement [Text Block] |
This semi-annual shareholder summary report contains important information about the Fund for the period of March 1, 2026 to August 31, 2026.
|
|
| Shareholder Report Annual or Semi-Annual |
Semi-Annual Shareholder Report
|
|
| Additional Information [Text Block] |
You can find additional information about the Fund at http://destinationsfunds.com/. You can also request this information by calling 1-877-771-7979.
|
|
| Additional Information Phone Number |
1-877-771-7979
|
|
| Additional Information Website |
http://destinationsfunds.com/
|
|
| Expenses [Text Block] |
What were the Fund's costs for the last 6 months?(based on a hypothetical $10,000 investment) Table SummaryClass name | Cost of a $10,000 investment | Cost paid as a % of a $10,000 investment |
|---|
Class Z | $36 | 0.68%Footnote Reference* |
|---|
| Footnote | Description | Footnote* | Annualized |
|
|
| Expenses Paid, Amount |
$ 36
|
|
| Expense Ratio, Percent |
0.68%
|
[2] |
| Performance Past Does Not Indicate Future [Text] |
The Fund's past performance is not a good predictor of how the Fund will perform in the future
|
|
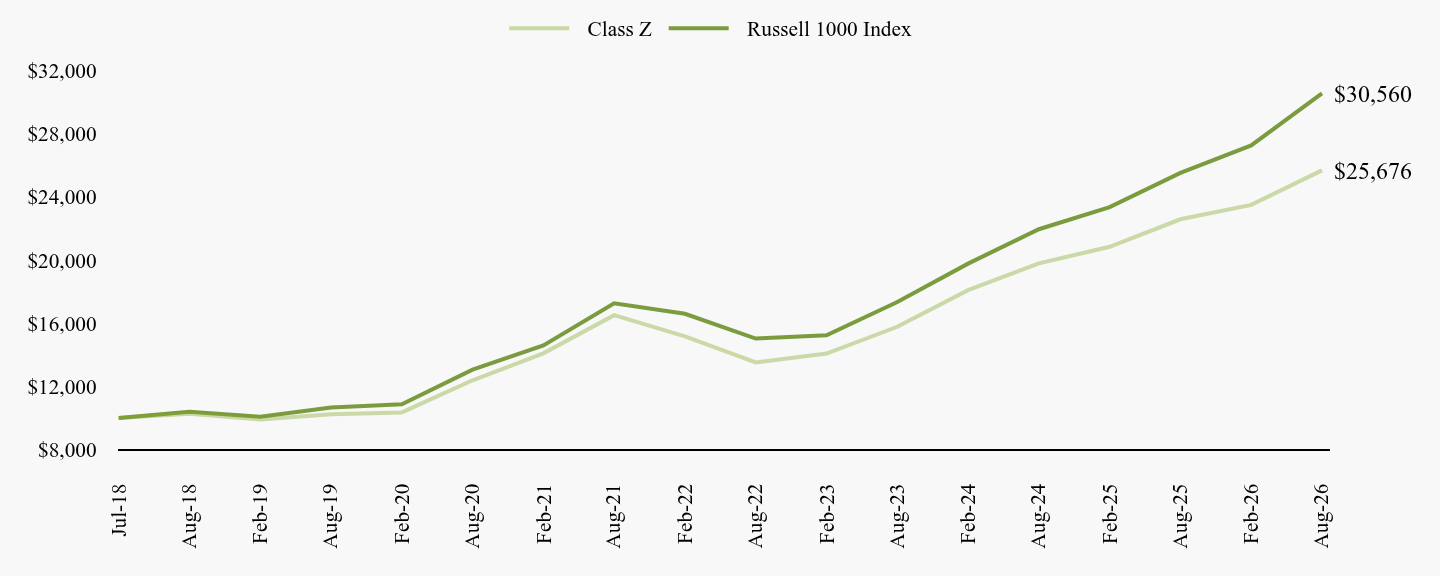
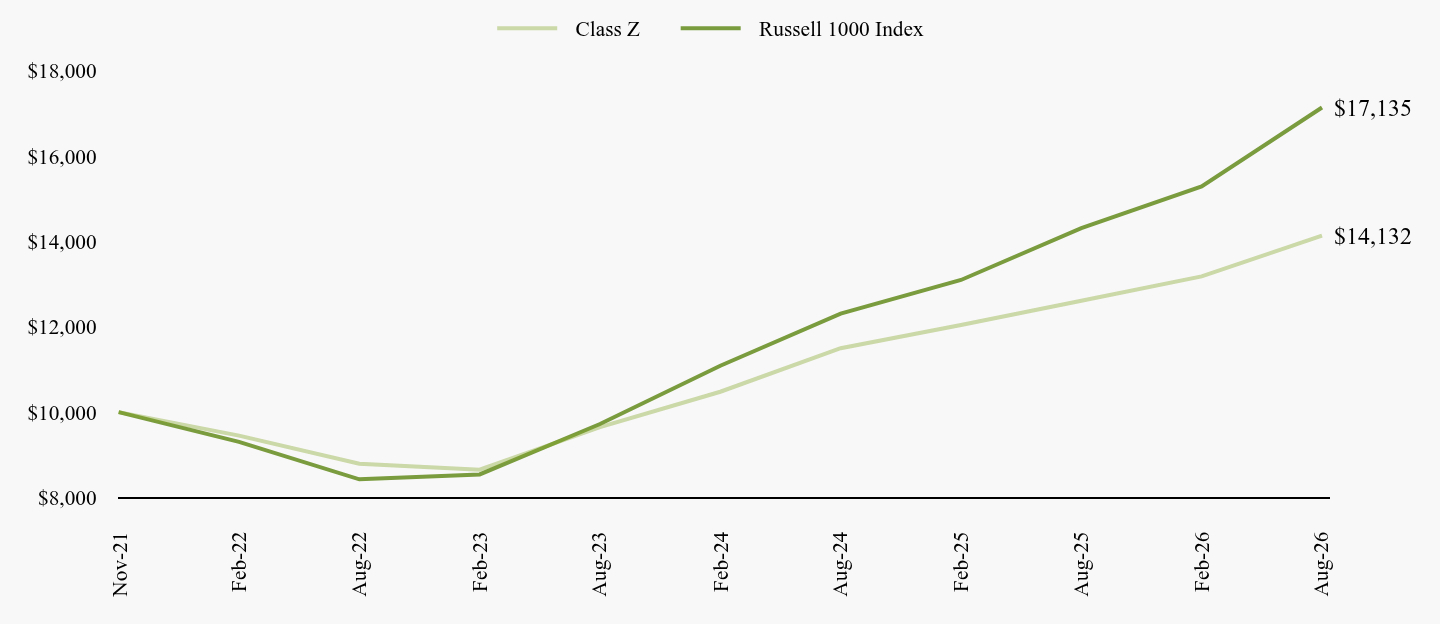
| Line Graph [Table Text Block] |
Table Summary | Class Z | Russell 1000 Index |
|---|
Jul-18 | $10,000 | $10,000 |
|---|
Aug-18 | $10,270 | $10,397 |
|---|
Feb-19 | $9,906 | $10,077 |
|---|
Aug-19 | $10,231 | $10,656 |
|---|
Feb-20 | $10,347 | $10,866 |
|---|
Aug-20 | $12,385 | $13,053 |
|---|
Feb-21 | $14,088 | $14,591 |
|---|
Aug-21 | $16,508 | $17,263 |
|---|
Feb-22 | $15,167 | $16,593 |
|---|
Aug-22 | $13,512 | $15,025 |
|---|
Feb-23 | $14,080 | $15,231 |
|---|
Aug-23 | $15,773 | $17,339 |
|---|
Feb-24 | $18,093 | $19,772 |
|---|
Aug-24 | $19,788 | $21,951 |
|---|
Feb-25 | $20,841 | $23,354 |
|---|
Aug-25 | $22,581 | $25,515 |
|---|
Feb-26 | $23,494 | $27,262 |
|---|
Aug-26 | $25,676 | $30,560 |
|---|
|
|
| Average Annual Return [Table Text Block] |
Table SummaryName | 1 Year | 5 Years | Since Inception
(07/16/2018) |
|---|
Class Z | 13.71% | 9.24% | 12.25% |
|---|
Russell 1000 Index | 19.77% | 12.10% | 14.65% |
|---|
|
|
| Performance Inception Date |
Jul. 16, 2018
|
|
| No Deduction of Taxes [Text Block] |
The graph and table do not reflect the deduction of taxes that a shareholder would pay on Fund distributions or redemption of Fund shares
|
|
| AssetsNet |
$ 3,499,642,645
|
|
| Holdings Count | Holding |
318
|
|
| Advisory Fees Paid, Amount |
$ 10,427,435
|
|
| InvestmentCompanyPortfolioTurnover |
56.00%
|
|
| Additional Fund Statistics [Text Block] |
Table SummaryTotal Net Assets | $3,499,642,645 |
|---|
Number of Portfolio Holdings | 318 |
|---|
Portfolio Turnover Rate | 56% |
|---|
Advisory Fees Paid | $10,427,435 |
|---|
|
|
| Holdings [Text Block] |
Asset Class Weightings (% of Total Investments)Table SummaryCommon Stocks | 91.2% |
|---|
Exchange Traded Funds (ETFs) | 7.1% |
|---|
Preferred Stocks | 0.0%Footnote Reference* |
|---|
Short-Term Investments | 1.0% |
|---|
Money Market Fund | 0.7% |
|---|
Total | 100.0% |
|---|
| Footnote | Description | Footnote* | Position represents less than 0.05%. |
Sector Allocation (% of Total Investments)Table SummaryTechnology | 29.6% |
|---|
Communications | 15.4% |
|---|
Financial | 13.0% |
|---|
Consumer Non-cyclical | 12.7% |
|---|
Exchange Traded Funds (ETFs) | 7.1% |
|---|
Others | 20.5% |
|---|
Short-Term Investments | 1.0% |
|---|
Money Market Fund | 0.7% |
|---|
Total | 100.0% |
|---|
|
|
| Material Fund Change [Text Block] |
There were no material changes to the Fund. |
|
| C000176694 |
|
|
| Shareholder Report [Line Items] |
|
|
| Fund Name |
Destinations Small-Mid Cap Equity Fund
|
|
| Class Name |
Class I
|
|
| Trading Symbol |
DSMFX
|
|
| Annual or Semi-Annual Statement [Text Block] |
This semi-annual shareholder summary report contains important information about the Fund for the period of March 1, 2026 to August 31, 2026.
|
|
| Shareholder Report Annual or Semi-Annual |
Semi-Annual Shareholder Report
|
|
| Additional Information [Text Block] |
You can find additional information about the Fund at http://destinationsfunds.com/. You can also request this information by calling 1-877-771-7979.
|
|
| Additional Information Phone Number |
1-877-771-7979
|
|
| Additional Information Website |
http://destinationsfunds.com/
|
|
| Expenses [Text Block] |
What were the Fund's costs for the last 6 months?(based on a hypothetical $10,000 investment) Table SummaryClass name | Cost of a $10,000 investment | Cost paid as a % of a $10,000 investment |
|---|
Class I | $56 | 1.09%Footnote Reference* |
|---|
| Footnote | Description | Footnote* | Annualized |
|
|
| Expenses Paid, Amount |
$ 56
|
|
| Expense Ratio, Percent |
1.09%
|
[3] |
| Performance Past Does Not Indicate Future [Text] |
The Fund's past performance is not a good predictor of how the Fund will perform in the future
|
|
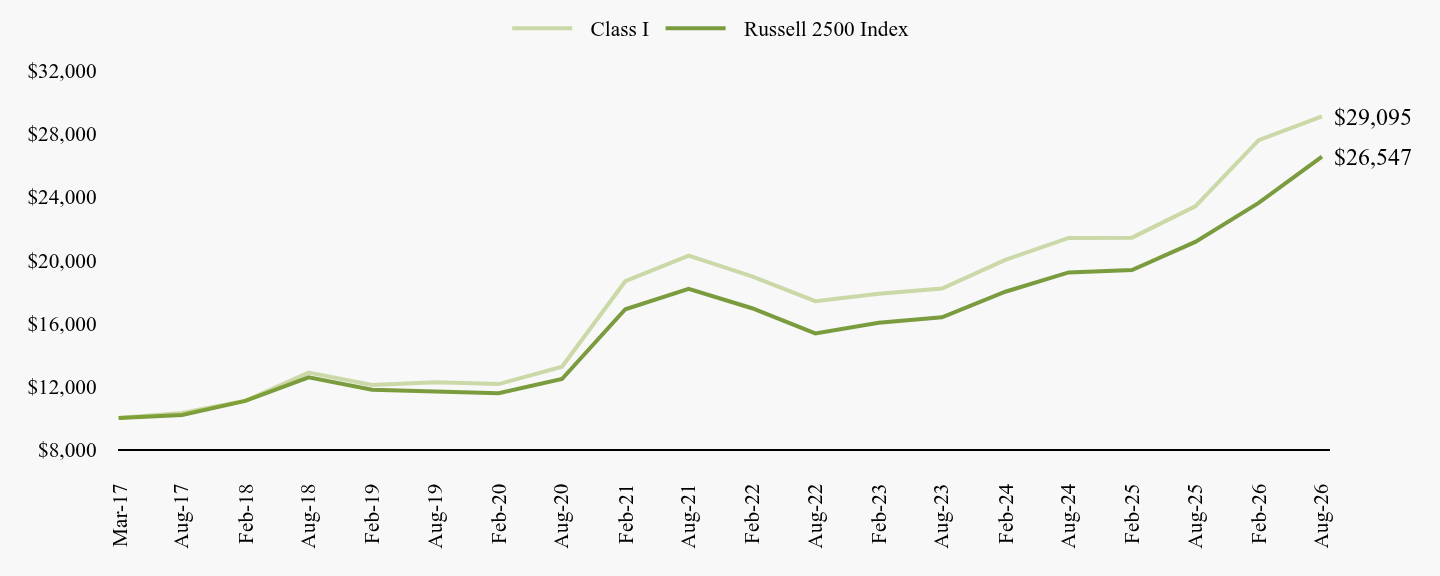
| Line Graph [Table Text Block] |
Table Summary | Class I | Russell 2500 Index |
|---|
Mar-17 | $10,000 | $10,000 |
|---|
Aug-17 | $10,310 | $10,190 |
|---|
Feb-18 | $11,083 | $11,077 |
|---|
Aug-18 | $12,869 | $12,568 |
|---|
Feb-19 | $12,082 | $11,782 |
|---|
Aug-19 | $12,263 | $11,670 |
|---|
Feb-20 | $12,144 | $11,570 |
|---|
Aug-20 | $13,245 | $12,463 |
|---|
Feb-21 | $18,660 | $16,881 |
|---|
Aug-21 | $20,284 | $18,179 |
|---|
Feb-22 | $18,971 | $16,948 |
|---|
Aug-22 | $17,391 | $15,353 |
|---|
Feb-23 | $17,860 | $16,029 |
|---|
Aug-23 | $18,193 | $16,372 |
|---|
Feb-24 | $20,003 | $17,992 |
|---|
Aug-24 | $21,401 | $19,217 |
|---|
Feb-25 | $21,417 | $19,366 |
|---|
Aug-25 | $23,397 | $21,146 |
|---|
Feb-26 | $27,587 | $23,621 |
|---|
Aug-26 | $29,095 | $26,547 |
|---|
|
|
| Average Annual Return [Table Text Block] |
Table SummaryName | 1 Year | 5 Years | Since Inception
(03/20/2017) |
|---|
Class I | 24.36%Footnote Reference* | 7.48% | 11.92% |
|---|
Russell 2500 Index | 25.54% | 7.87% | 10.84% |
|---|
|
|
| Performance Inception Date |
Mar. 20, 2017
|
|
| No Deduction of Taxes [Text Block] |
The graph and table do not reflect the deduction of taxes that a shareholder would pay on Fund distributions or redemption of Fund shares
|
|
| AssetsNet |
$ 703,559,675
|
|
| Holdings Count | Holding |
2,729
|
|
| Advisory Fees Paid, Amount |
$ 2,922,919
|
|
| InvestmentCompanyPortfolioTurnover |
80.00%
|
|
| Additional Fund Statistics [Text Block] |
Table SummaryTotal Net Assets | $703,559,675 |
|---|
Number of Portfolio Holdings | 2,729 |
|---|
Portfolio Turnover Rate | 80% |
|---|
Advisory Fees Paid | $2,922,919 |
|---|
|
|
| Holdings [Text Block] |
Asset Class Weightings (% of Total Investments)Table SummaryCommon Stocks | 92.0% |
|---|
Exchange Traded Funds (ETFs) | 5.1% |
|---|
Limited Partnership | 0.0%Footnote Reference* |
|---|
Closed-End Fund | 0.0%Footnote Reference* |
|---|
Short-Term Investments | 2.7% |
|---|
Money Market Fund | 0.2% |
|---|
Total | 100.0% |
|---|
| Footnote | Description | Footnote* | Position represents less than 0.05%. |
Sector Allocation (% of Total Investments)Table SummaryConsumer Non-cyclical | 22.5% |
|---|
Financial | 17.7% |
|---|
Industrial | 15.2% |
|---|
Technology | 11.0% |
|---|
Exchange Traded Funds (ETFs) | 5.1% |
|---|
Others | 25.6% |
|---|
Short-Term Investments | 2.7% |
|---|
Money Market Fund | 0.2% |
|---|
Total | 100.0% |
|---|
|
|
| Material Fund Change [Text Block] |
There were no material changes to the Fund. |
|
| C000202454 |
|
|
| Shareholder Report [Line Items] |
|
|
| Fund Name |
Destinations Small-Mid Cap Equity Fund
|
|
| Class Name |
Class Z
|
|
| Trading Symbol |
DSMZX
|
|
| Annual or Semi-Annual Statement [Text Block] |
This semi-annual shareholder summary report contains important information about the Fund for the period of March 1, 2026 to August 31, 2026.
|
|
| Shareholder Report Annual or Semi-Annual |
Semi-Annual Shareholder Report
|
|
| Additional Information [Text Block] |
You can find additional information about the Fund at http://destinationsfunds.com/. You can also request this information by calling 1-877-771-7979.
|
|
| Additional Information Phone Number |
1-877-771-7979
|
|
| Additional Information Website |
http://destinationsfunds.com/
|
|
| Expenses [Text Block] |
What were the Fund's costs for the last 6 months?(based on a hypothetical $10,000 investment) Table SummaryClass name | Cost of a $10,000 investment | Cost paid as a % of a $10,000 investment |
|---|
Class Z | $49 | 0.94%Footnote Reference* |
|---|
| Footnote | Description | Footnote* | Annualized |
|
|
| Expenses Paid, Amount |
$ 49
|
|
| Expense Ratio, Percent |
0.94%
|
[4] |
| Performance Past Does Not Indicate Future [Text] |
The Fund's past performance is not a good predictor of how the Fund will perform in the future
|
|
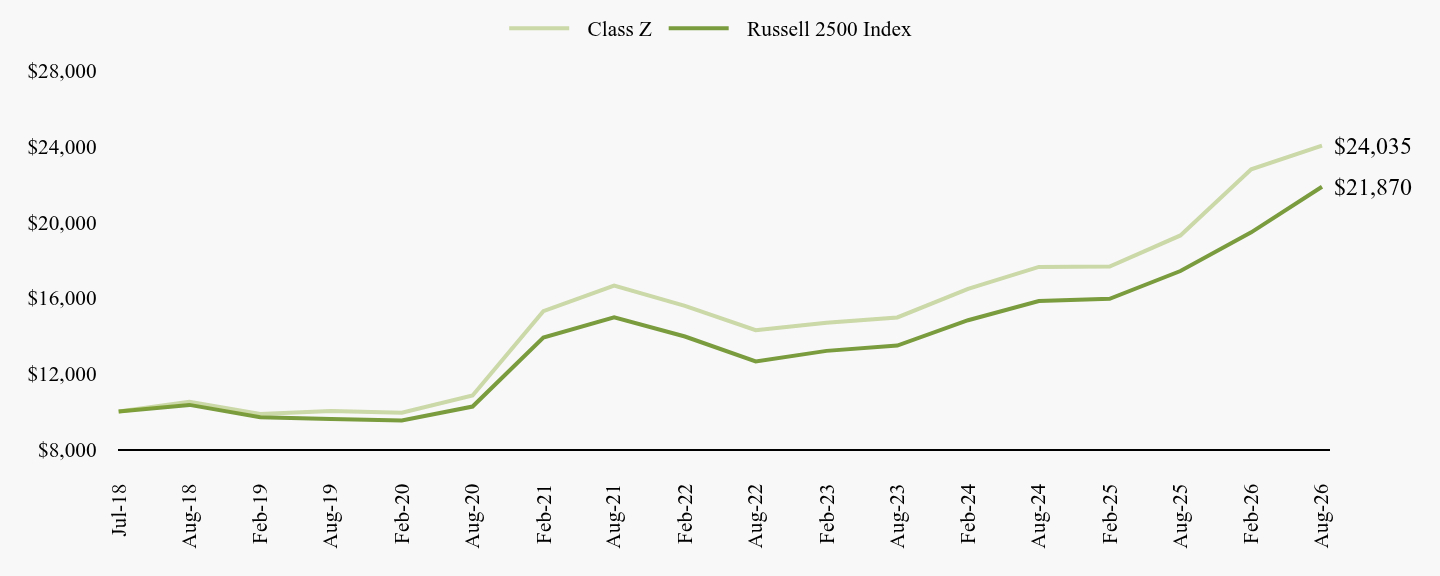
| Line Graph [Table Text Block] |
Table Summary | Class Z | Russell 2500 Index |
|---|
Jul-18 | $10,000 | $10,000 |
|---|
Aug-18 | $10,520 | $10,354 |
|---|
Feb-19 | $9,876 | $9,707 |
|---|
Aug-19 | $10,038 | $9,614 |
|---|
Feb-20 | $9,945 | $9,532 |
|---|
Aug-20 | $10,849 | $10,267 |
|---|
Feb-21 | $15,300 | $13,907 |
|---|
Aug-21 | $16,648 | $14,976 |
|---|
Feb-22 | $15,585 | $13,962 |
|---|
Aug-22 | $14,297 | $12,648 |
|---|
Feb-23 | $14,684 | $13,205 |
|---|
Aug-23 | $14,971 | $13,488 |
|---|
Feb-24 | $16,483 | $14,823 |
|---|
Aug-24 | $17,637 | $15,832 |
|---|
Feb-25 | $17,659 | $15,954 |
|---|
Aug-25 | $19,298 | $17,421 |
|---|
Feb-26 | $22,787 | $19,460 |
|---|
Aug-26 | $24,035 | $21,870 |
|---|
|
|
| Average Annual Return [Table Text Block] |
Table SummaryName | 1 Year | 5 Years | Since Inception
(07/16/2018) |
|---|
Class Z | 24.54%Footnote Reference* | 7.62% | 11.35% |
|---|
Russell 2500 Index | 25.54% | 7.87% | 10.07% |
|---|
|
|
| Performance Inception Date |
Jul. 16, 2018
|
|
| No Deduction of Taxes [Text Block] |
The graph and table do not reflect the deduction of taxes that a shareholder would pay on Fund distributions or redemption of Fund shares
|
|
| AssetsNet |
$ 703,559,675
|
|
| Holdings Count | Holding |
2,729
|
|
| Advisory Fees Paid, Amount |
$ 2,922,919
|
|
| InvestmentCompanyPortfolioTurnover |
80.00%
|
|
| Additional Fund Statistics [Text Block] |
Table SummaryTotal Net Assets | $703,559,675 |
|---|
Number of Portfolio Holdings | 2,729 |
|---|
Portfolio Turnover Rate | 80% |
|---|
Advisory Fees Paid | $2,922,919 |
|---|
|
|
| Holdings [Text Block] |
Asset Class Weightings (% of Total Investments)Table SummaryCommon Stocks | 92.0% |
|---|
Exchange Traded Funds (ETFs) | 5.1% |
|---|
Limited Partnership | 0.0%Footnote Reference* |
|---|
Closed-End Fund | 0.0%Footnote Reference* |
|---|
Short-Term Investments | 2.7% |
|---|
Money Market Fund | 0.2% |
|---|
Total | 100.0% |
|---|
| Footnote | Description | Footnote* | Position represents less than 0.05%. |
Sector Allocation (% of Total Investments)Table SummaryConsumer Non-cyclical | 22.5% |
|---|
Financial | 17.7% |
|---|
Industrial | 15.2% |
|---|
Technology | 11.0% |
|---|
Exchange Traded Funds (ETFs) | 5.1% |
|---|
Others | 25.6% |
|---|
Short-Term Investments | 2.7% |
|---|
Money Market Fund | 0.2% |
|---|
Total | 100.0% |
|---|
|
|
| Material Fund Change [Text Block] |
There were no material changes to the Fund. |
|
| C000176695 |
|
|
| Shareholder Report [Line Items] |
|
|
| Fund Name |
Destinations International Equity Fund
|
|
| Class Name |
Class I
|
|
| Trading Symbol |
DIEFX
|
|
| Annual or Semi-Annual Statement [Text Block] |
This semi-annual shareholder summary report contains important information about the Fund for the period of March 1, 2026 to August 31, 2026.
|
|
| Shareholder Report Annual or Semi-Annual |
Semi-Annual Shareholder Report
|
|
| Additional Information [Text Block] |
You can find additional information about the Fund at http://destinationsfunds.com/. You can also request this information by calling 1-877-771-7979.
|
|
| Additional Information Phone Number |
1-877-771-7979
|
|
| Additional Information Website |
http://destinationsfunds.com/
|
|
| Expenses [Text Block] |
What were the Fund's costs for the last 6 months?(based on a hypothetical $10,000 investment) Table SummaryClass name | Cost of a $10,000 investment | Cost paid as a % of a $10,000 investment |
|---|
Class I | $55 | 1.07%Footnote Reference* |
|---|
| Footnote | Description | Footnote* | Annualized |
|
|
| Expenses Paid, Amount |
$ 55
|
|
| Expense Ratio, Percent |
1.07%
|
[5] |
| Performance Past Does Not Indicate Future [Text] |
The Fund's past performance is not a good predictor of how the Fund will perform in the future
|
|
| Line Graph [Table Text Block] |
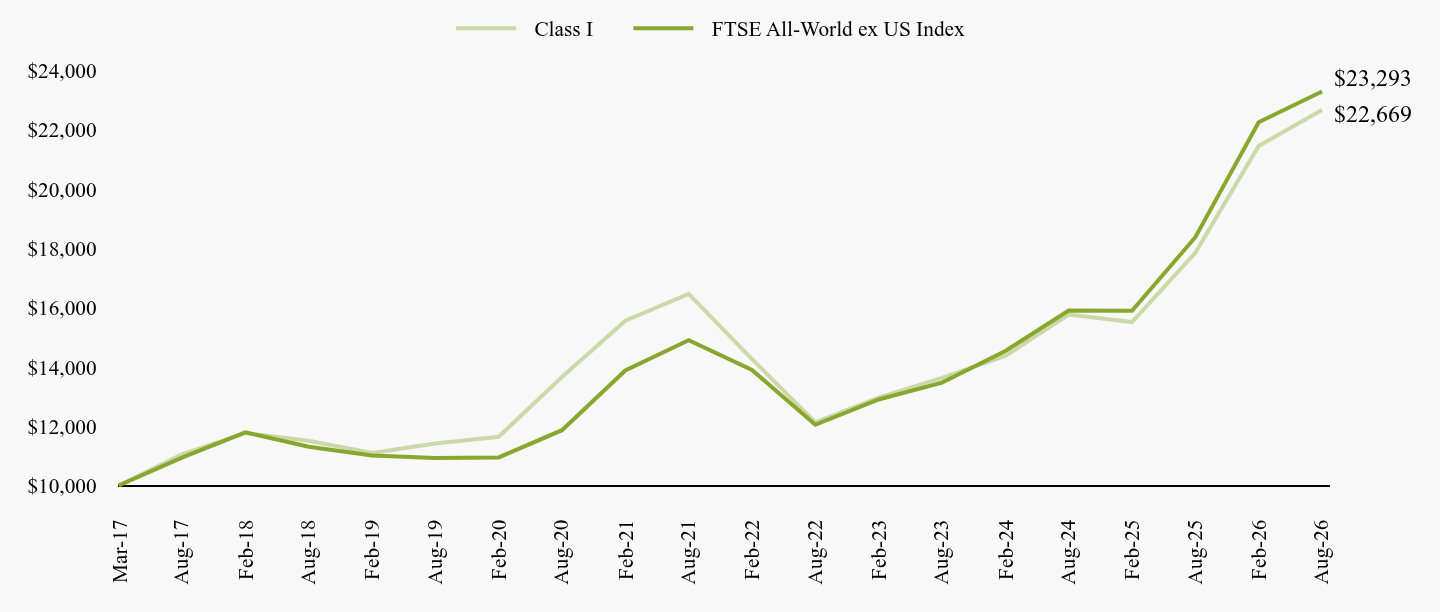
Table Summary | Class I | FTSE All-World ex US Index |
|---|
Mar-17 | $10,000 | $10,000 |
|---|
Aug-17 | $11,050 | $10,942 |
|---|
Feb-18 | $11,770 | $11,795 |
|---|
Aug-18 | $11,509 | $11,306 |
|---|
Feb-19 | $11,098 | $11,009 |
|---|
Aug-19 | $11,415 | $10,926 |
|---|
Feb-20 | $11,644 | $10,948 |
|---|
Aug-20 | $13,662 | $11,866 |
|---|
Feb-21 | $15,561 | $13,880 |
|---|
Aug-21 | $16,468 | $14,900 |
|---|
Feb-22 | $14,261 | $13,899 |
|---|
Aug-22 | $12,128 | $12,049 |
|---|
Feb-23 | $12,967 | $12,901 |
|---|
Aug-23 | $13,631 | $13,473 |
|---|
Feb-24 | $14,373 | $14,539 |
|---|
Aug-24 | $15,771 | $15,903 |
|---|
Feb-25 | $15,515 | $15,894 |
|---|
Aug-25 | $17,852 | $18,378 |
|---|
Feb-26 | $21,457 | $22,255 |
|---|
Aug-26 | $22,669 | $23,293 |
|---|
|
|
| Average Annual Return [Table Text Block] |
Table SummaryName | 1 Year | 5 Years | Since Inception
(03/20/2017) |
|---|
Class I | 26.98% | 6.60% | 9.01% |
|---|
FTSE All-World ex US Index | 26.75% | 9.35% | 9.34% |
|---|
|
|
| Performance Inception Date |
Mar. 20, 2017
|
|
| No Deduction of Taxes [Text Block] |
The graph and table do not reflect the deduction of taxes that a shareholder would pay on Fund distributions or redemption of Fund shares
|
|
| AssetsNet |
$ 1,963,759,711
|
|
| Holdings Count | Holding |
1,740
|
|
| Advisory Fees Paid, Amount |
$ 7,792,332
|
|
| InvestmentCompanyPortfolioTurnover |
33.00%
|
|
| Additional Fund Statistics [Text Block] |
Table SummaryTotal Net Assets | $1,963,759,711 |
|---|
Number of Portfolio Holdings | 1,740 |
|---|
Portfolio Turnover Rate | 33% |
|---|
Advisory Fees Paid | $7,792,332 |
|---|
|
|
| Holdings [Text Block] |
Sector Allocation (% of Total Investments) Table SummaryFinancial | 21.7% |
|---|
Industrial | 18.0% |
|---|
Consumer Non-cyclical | 13.0% |
|---|
Technology | 12.3% |
|---|
Exchange Traded Funds (ETFs) | 5.0% |
|---|
Others | 28.0% |
|---|
Short-Term Investments | 1.1% |
|---|
Money Market Fund | 0.9% |
|---|
Total | 100.0% |
|---|
Country Weightings (% of Total Investments) Table SummaryJapan | 15.0% |
|---|
United Kingdom | 10.1% |
|---|
Canada | 6.7% |
|---|
United States | 6.5% |
|---|
Germany | 5.6% |
|---|
Others | 54.1% |
|---|
Short-Term Investments | 1.1% |
|---|
Money Market Fund | 0.9% |
|---|
Total | 100.0% |
|---|
Asset Class Weightings (% of Total Investments)Table SummaryCommon Stocks | 92.6% |
|---|
Exchange Traded Funds (ETFs) | 5.0% |
|---|
Preferred Stocks | 0.4% |
|---|
Right | 0.0%Footnote Reference* |
|---|
Warrants | 0.0%Footnote Reference* |
|---|
Short-Term Investments | 1.1% |
|---|
Money Market Fund | 0.9% |
|---|
Total | 100.0% |
|---|
| Footnote | Description | Footnote* | Position represents less than 0.05%. |
|
|
| Material Fund Change [Text Block] |
There were no material changes to the Fund. |
|
| C000202455 |
|
|
| Shareholder Report [Line Items] |
|
|
| Fund Name |
Destinations International Equity Fund
|
|
| Class Name |
Class Z
|
|
| Trading Symbol |
DIEZX
|
|
| Annual or Semi-Annual Statement [Text Block] |
This semi-annual shareholder summary report contains important information about the Fund for the period of March 1, 2026 to August 31, 2026.
|
|
| Shareholder Report Annual or Semi-Annual |
Semi-Annual Shareholder Report
|
|
| Additional Information [Text Block] |
You can find additional information about the Fund at http://destinationsfunds.com/. You can also request this information by calling 1-877-771-7979.
|
|
| Additional Information Phone Number |
1-877-771-7979
|
|
| Additional Information Website |
http://destinationsfunds.com/
|
|
| Expenses [Text Block] |
What were the Fund's costs for the last 6 months?(based on a hypothetical $10,000 investment) Table SummaryClass name | Cost of a $10,000 investment | Cost paid as a % of a $10,000 investment |
|---|
Class Z | $48 | 0.92%Footnote Reference* |
|---|
| Footnote | Description | Footnote* | Annualized |
|
|
| Expenses Paid, Amount |
$ 48
|
|
| Expense Ratio, Percent |
0.92%
|
[6] |
| Performance Past Does Not Indicate Future [Text] |
The Fund's past performance is not a good predictor of how the Fund will perform in the future
|
|
| Line Graph [Table Text Block] |
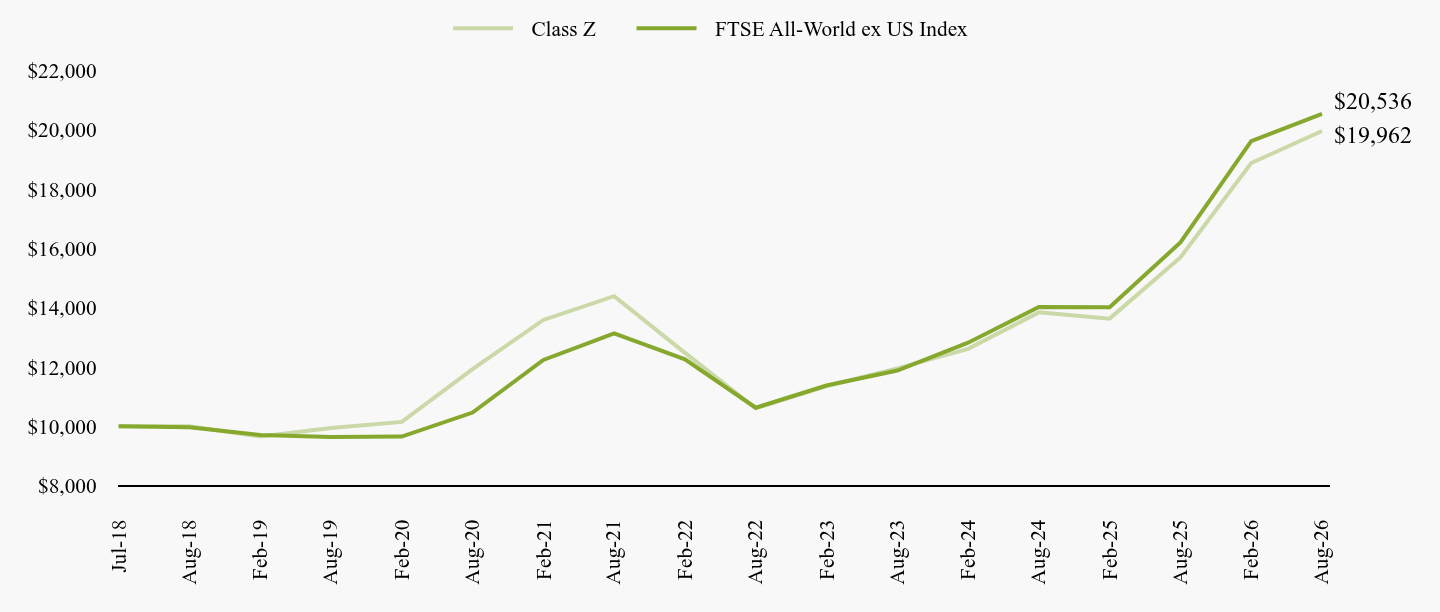
Table Summary | Class Z | FTSE All-World ex US Index |
|---|
Jul-18 | $10,000 | $10,000 |
|---|
Aug-18 | $10,000 | $9,968 |
|---|
Feb-19 | $9,657 | $9,706 |
|---|
Aug-19 | $9,942 | $9,633 |
|---|
Feb-20 | $10,145 | $9,652 |
|---|
Aug-20 | $11,925 | $10,462 |
|---|
Feb-21 | $13,585 | $12,237 |
|---|
Aug-21 | $14,389 | $13,136 |
|---|
Feb-22 | $12,476 | $12,254 |
|---|
Aug-22 | $10,607 | $10,623 |
|---|
Feb-23 | $11,356 | $11,374 |
|---|
Aug-23 | $11,951 | $11,879 |
|---|
Feb-24 | $12,612 | $12,818 |
|---|
Aug-24 | $13,842 | $14,021 |
|---|
Feb-25 | $13,630 | $14,013 |
|---|
Aug-25 | $15,696 | $16,202 |
|---|
Feb-26 | $18,881 | $19,621 |
|---|
Aug-26 | $19,962 | $20,536 |
|---|
|
|
| Average Annual Return [Table Text Block] |
Table SummaryName | 1 Year | 5 Years | Since Inception
(07/16/2018) |
|---|
Class Z | 27.18% | 6.77% | 8.84% |
|---|
FTSE All-World ex US Index | 26.75% | 9.35% | 9.21% |
|---|
|
|
| Performance Inception Date |
Jul. 16, 2018
|
|
| No Deduction of Taxes [Text Block] |
The graph and table do not reflect the deduction of taxes that a shareholder would pay on Fund distributions or redemption of Fund shares
|
|
| AssetsNet |
$ 1,963,759,711
|
|
| Holdings Count | Holding |
1,740
|
|
| Advisory Fees Paid, Amount |
$ 7,792,332
|
|
| InvestmentCompanyPortfolioTurnover |
33.00%
|
|
| Additional Fund Statistics [Text Block] |
Table SummaryTotal Net Assets | $1,963,759,711 |
|---|
Number of Portfolio Holdings | 1,740 |
|---|
Portfolio Turnover Rate | 33% |
|---|
Advisory Fees Paid | $7,792,332 |
|---|
|
|
| Holdings [Text Block] |
Sector Allocation (% of Total Investments) Table SummaryFinancial | 21.7% |
|---|
Industrial | 18.0% |
|---|
Consumer Non-cyclical | 13.0% |
|---|
Technology | 12.3% |
|---|
Exchange Traded Funds (ETFs) | 5.0% |
|---|
Others | 28.0% |
|---|
Short-Term Investments | 1.1% |
|---|
Money Market Fund | 0.9% |
|---|
Total | 100.0% |
|---|
Country Weightings (% of Total Investments) Table SummaryJapan | 15.0% |
|---|
United Kingdom | 10.1% |
|---|
Canada | 6.7% |
|---|
United States | 6.5% |
|---|
Germany | 5.6% |
|---|
Others | 54.1% |
|---|
Short-Term Investments | 1.1% |
|---|
Money Market Fund | 0.9% |
|---|
Total | 100.0% |
|---|
Asset Class Weightings (% of Total Investments)Table SummaryCommon Stocks | 92.6% |
|---|
Exchange Traded Funds (ETFs) | 5.0% |
|---|
Preferred Stocks | 0.4% |
|---|
Right | 0.0%Footnote Reference* |
|---|
Warrants | 0.0%Footnote Reference* |
|---|
Short-Term Investments | 1.1% |
|---|
Money Market Fund | 0.9% |
|---|
Total | 100.0% |
|---|
| Footnote | Description | Footnote* | Position represents less than 0.05%. |
|
|
| Material Fund Change [Text Block] |
There were no material changes to the Fund. |
|
| C000176696 |
|
|
| Shareholder Report [Line Items] |
|
|
| Fund Name |
Destinations Equity Income Fund
|
|
| Class Name |
Class I
|
|
| Trading Symbol |
DGEFX
|
|
| Annual or Semi-Annual Statement [Text Block] |
This semi-annual shareholder summary report contains important information about the Fund for the period of March 1, 2026 to August 31, 2026.
|
|
| Shareholder Report Annual or Semi-Annual |
Semi-Annual Shareholder Report
|
|
| Additional Information [Text Block] |
You can find additional information about the Fund at http://destinationsfunds.com/. You can also request this information by calling 1-877-771-7979.
|
|
| Additional Information Phone Number |
1-877-771-7979
|
|
| Additional Information Website |
http://destinationsfunds.com/
|
|
| Expenses [Text Block] |
What were the Fund's costs for the last 6 months?(based on a hypothetical $10,000 investment) Table SummaryClass name | Cost of a $10,000 investment | Cost paid as a % of a $10,000 investment |
|---|
Class I | $49 | 0.96%Footnote Reference* |
|---|
| Footnote | Description | Footnote* | Annualized |
|
|
| Expenses Paid, Amount |
$ 49
|
|
| Expense Ratio, Percent |
0.96%
|
[7] |
| Performance Past Does Not Indicate Future [Text] |
The Fund's past performance is not a good predictor of how the Fund will perform in the future
|
|
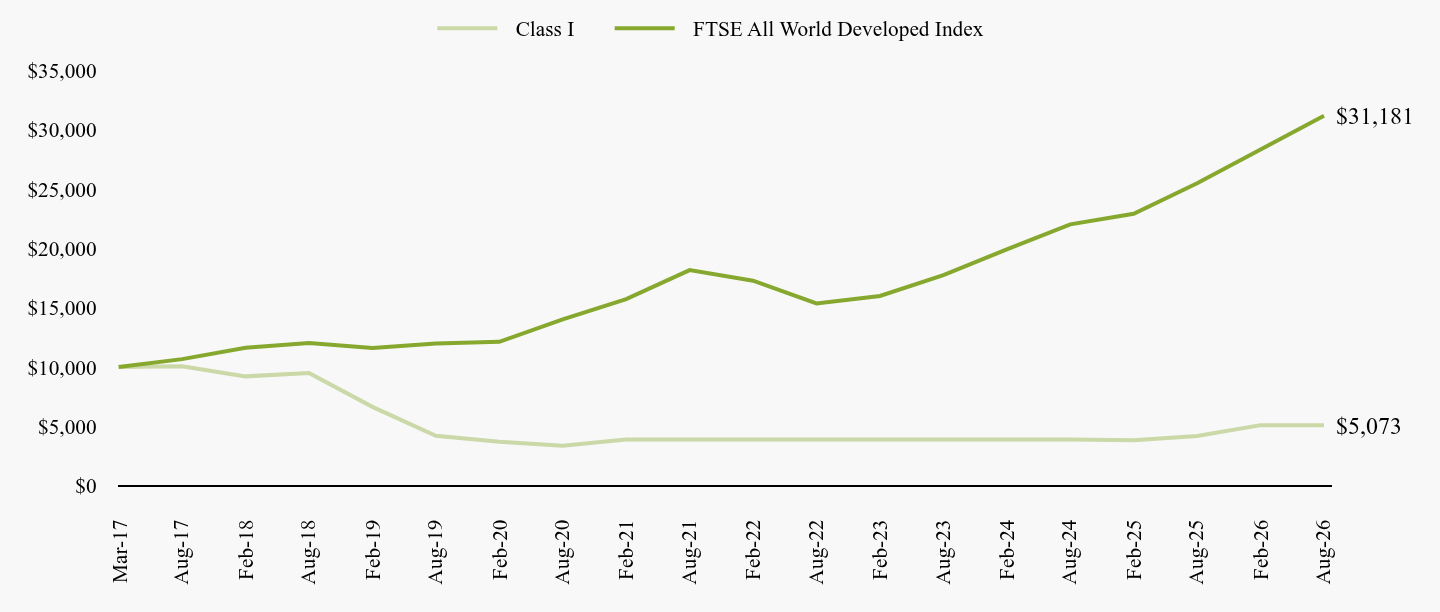
| Line Graph [Table Text Block] |
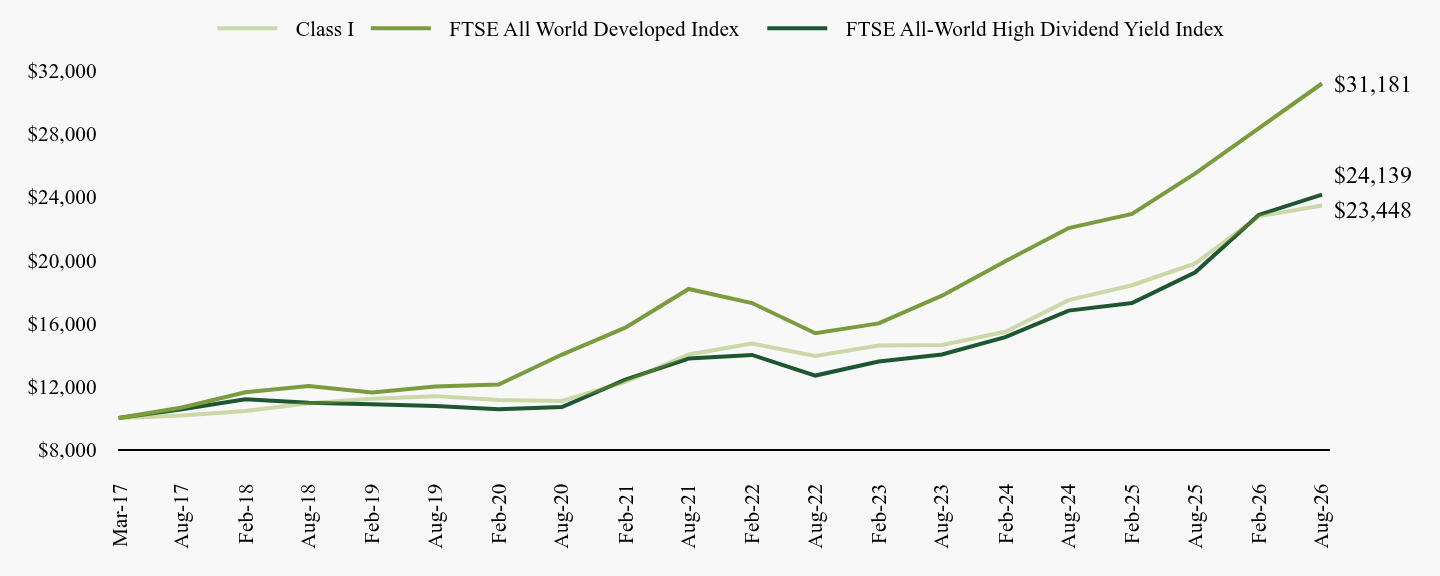
Table Summary | Class I | FTSE All World Developed Index | FTSE All-World High Dividend Yield Index |
|---|
Mar-17 | $10,000 | $10,000 | $10,000 |
|---|
Aug-17 | $10,146 | $10,660 | $10,546 |
|---|
Feb-18 | $10,435 | $11,625 | $11,184 |
|---|
Aug-18 | $10,934 | $12,023 | $10,962 |
|---|
Feb-19 | $11,220 | $11,607 | $10,866 |
|---|
Aug-19 | $11,380 | $11,986 | $10,762 |
|---|
Feb-20 | $11,132 | $12,115 | $10,546 |
|---|
Aug-20 | $11,073 | $14,014 | $10,691 |
|---|
Feb-21 | $12,286 | $15,716 | $12,419 |
|---|
Aug-21 | $14,014 | $18,165 | $13,762 |
|---|
Feb-22 | $14,705 | $17,275 | $13,990 |
|---|
Aug-22 | $13,927 | $15,360 | $12,683 |
|---|
Feb-23 | $14,583 | $15,988 | $13,569 |
|---|
Aug-23 | $14,618 | $17,742 | $14,016 |
|---|
Feb-24 | $15,458 | $19,925 | $15,119 |
|---|
Aug-24 | $17,460 | $22,025 | $16,796 |
|---|
Feb-25 | $18,405 | $22,924 | $17,281 |
|---|
Aug-25 | $19,783 | $25,490 | $19,226 |
|---|
Feb-26 | $22,771 | $28,336 | $22,858 |
|---|
Aug-26 | $23,448 | $31,181 | $24,139 |
|---|
|
|
| Average Annual Return [Table Text Block] |
Table SummaryName | 1 Year | 5 Years | Since Inception
(03/20/2017) |
|---|
Class I | 18.52% | 10.84% | 9.40% |
|---|
FTSE All World Developed Index | 22.33% | 11.41% | 12.72% |
|---|
FTSE All-World High Dividend Yield Index | 25.55% | 11.89% | 9.74% |
|---|
|
|
| Performance Inception Date |
Mar. 20, 2017
|
|
| No Deduction of Taxes [Text Block] |
The graph and table do not reflect the deduction of taxes that a shareholder would pay on Fund distributions or redemption of Fund shares
|
|
| AssetsNet |
$ 513,689,060
|
|
| Holdings Count | Holding |
160
|
|
| Advisory Fees Paid, Amount |
$ 1,737,689
|
|
| InvestmentCompanyPortfolioTurnover |
25.00%
|
|
| Additional Fund Statistics [Text Block] |
Table SummaryTotal Net Assets | $513,689,060 |
|---|
Number of Portfolio Holdings | 160 |
|---|
Portfolio Turnover Rate | 25% |
|---|
Advisory Fees Paid | $1,737,689 |
|---|
|
|
| Holdings [Text Block] |
Asset Class Weightings (% of Total Investments)Table SummaryCommon Stocks | 81.0% |
|---|
Exchange Traded Funds (ETFs) | 15.6% |
|---|
Convertible Preferred Stocks | 1.5% |
|---|
Limited Partnership | 0.5% |
|---|
Short-Term Investments | 1.4% |
|---|
Total | 100.0% |
|---|
Sector Allocation (% of Total Investments)Table SummaryFinancial | 21.6% |
|---|
Consumer Non-cyclical | 15.2% |
|---|
Utilities | 9.8% |
|---|
Energy | 8.7% |
|---|
Exchange Traded Funds (ETFs) | 15.6% |
|---|
Others | 27.7% |
|---|
Short-Term Investments | 1.4% |
|---|
Total | 100.0% |
|---|
|
|
| Material Fund Change [Text Block] |
There were no material changes to the Fund. |
|
| C000202456 |
|
|
| Shareholder Report [Line Items] |
|
|
| Fund Name |
Destinations Equity Income Fund
|
|
| Class Name |
Class Z
|
|
| Trading Symbol |
DGEZX
|
|
| Annual or Semi-Annual Statement [Text Block] |
This semi-annual shareholder summary report contains important information about the Fund for the period of March 1, 2026 to August 31, 2026.
|
|
| Shareholder Report Annual or Semi-Annual |
Semi-Annual Shareholder Report
|
|
| Additional Information [Text Block] |
You can find additional information about the Fund at http://destinationsfunds.com/. You can also request this information by calling 1-877-771-7979.
|
|
| Additional Information Phone Number |
1-877-771-7979
|
|
| Additional Information Website |
http://destinationsfunds.com/
|
|
| Expenses [Text Block] |
What were the Fund's costs for the last 6 months?(based on a hypothetical $10,000 investment) Table SummaryClass name | Cost of a $10,000 investment | Cost paid as a % of a $10,000 investment |
|---|
Class Z | $41 | 0.81%Footnote Reference* |
|---|
| Footnote | Description | Footnote* | Annualized |
|
|
| Expenses Paid, Amount |
$ 41
|
|
| Expense Ratio, Percent |
0.81%
|
[8] |
| Performance Past Does Not Indicate Future [Text] |
The Fund's past performance is not a good predictor of how the Fund will perform in the future
|
|
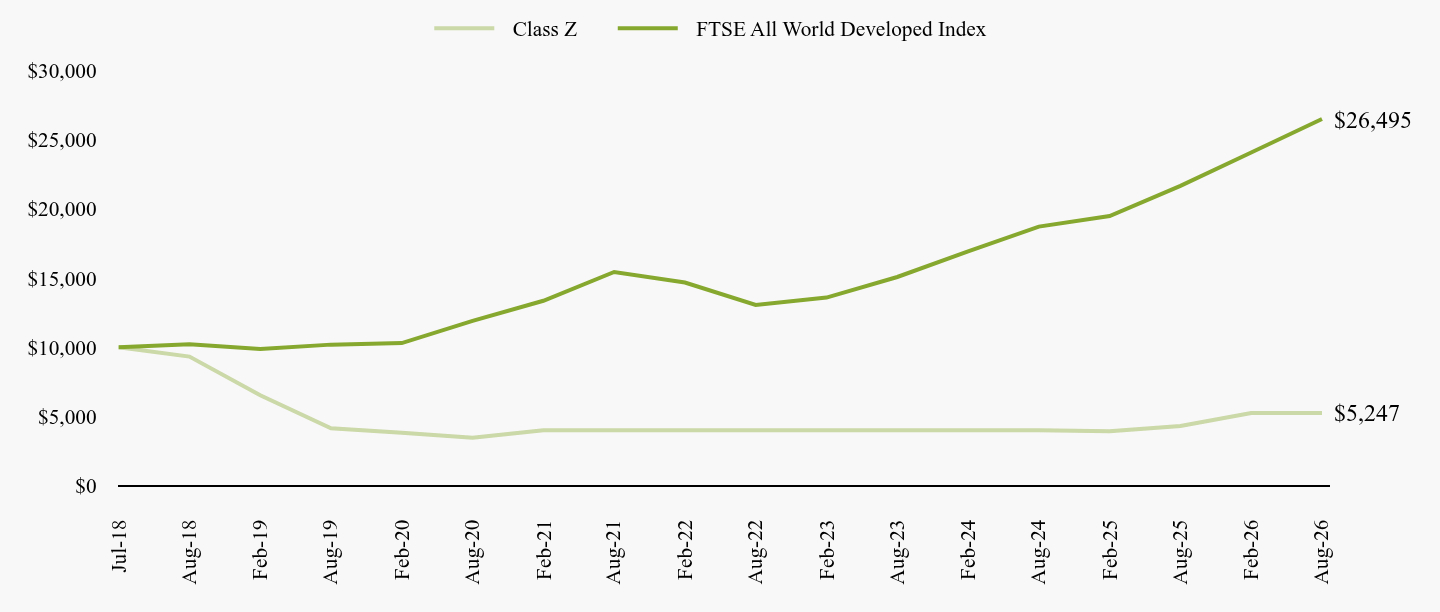
| Line Graph [Table Text Block] |
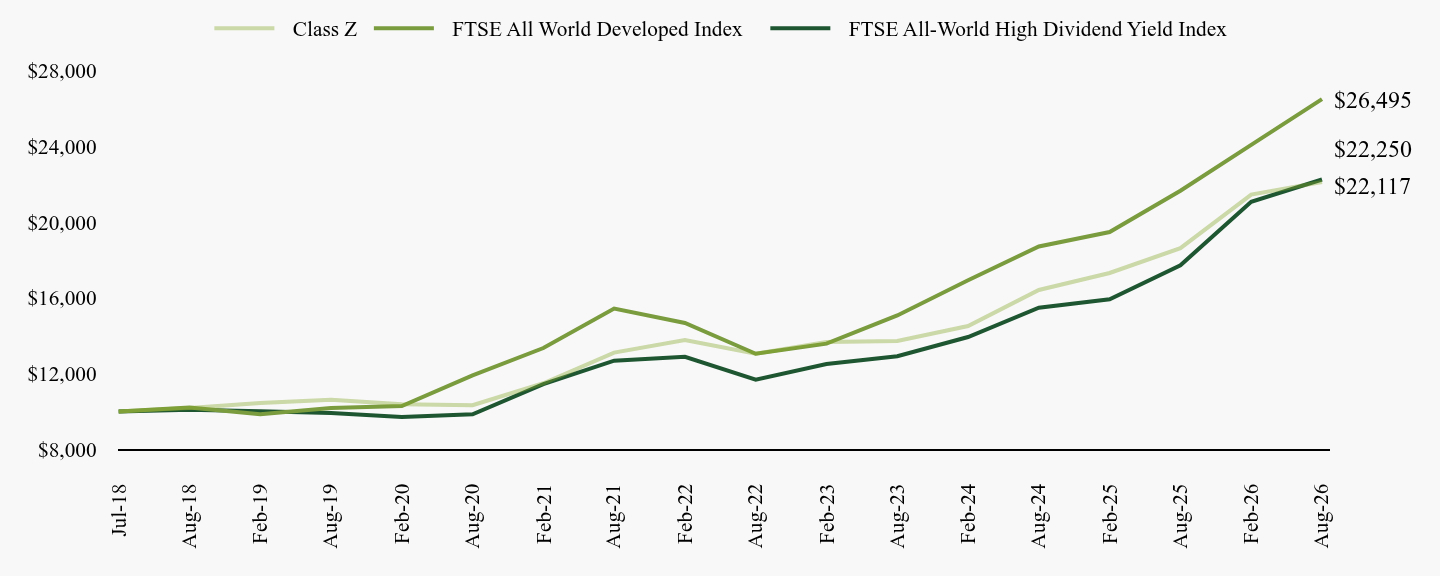
Table Summary | Class Z | FTSE All World Developed Index | FTSE All-World High Dividend Yield Index |
|---|
Jul-18 | $10,000 | $10,000 | $10,000 |
|---|
Aug-18 | $10,190 | $10,217 | $10,104 |
|---|
Feb-19 | $10,451 | $9,863 | $10,016 |
|---|
Aug-19 | $10,621 | $10,185 | $9,920 |
|---|
Feb-20 | $10,390 | $10,295 | $9,720 |
|---|
Aug-20 | $10,338 | $11,908 | $9,854 |
|---|
Feb-21 | $11,495 | $13,355 | $11,447 |
|---|
Aug-21 | $13,112 | $15,436 | $12,686 |
|---|
Feb-22 | $13,772 | $14,679 | $12,895 |
|---|
Aug-22 | $13,050 | $13,052 | $11,690 |
|---|
Feb-23 | $13,671 | $13,586 | $12,508 |
|---|
Aug-23 | $13,725 | $15,076 | $12,919 |
|---|
Feb-24 | $14,514 | $16,931 | $13,936 |
|---|
Aug-24 | $16,420 | $18,716 | $15,482 |
|---|
Feb-25 | $17,316 | $19,479 | $15,929 |
|---|
Aug-25 | $18,630 | $21,660 | $17,721 |
|---|
Feb-26 | $21,456 | $24,078 | $21,070 |
|---|
Aug-26 | $22,117 | $26,495 | $22,250 |
|---|
|
|
| Average Annual Return [Table Text Block] |
Table SummaryName | 1 Year | 5 Years | Since Inception
(07/16/2018) |
|---|
Class Z | 18.72% | 11.02% | 10.29% |
|---|
FTSE All World Developed Index | 22.33% | 11.41% | 12.67% |
|---|
FTSE All-World High Dividend Yield Index | 25.55% | 11.89% | 10.28% |
|---|
|
|
| Performance Inception Date |
Jul. 16, 2018
|
|
| No Deduction of Taxes [Text Block] |
The graph and table do not reflect the deduction of taxes that a shareholder would pay on Fund distributions or redemption of Fund shares
|
|
| AssetsNet |
$ 513,689,060
|
|
| Holdings Count | Holding |
160
|
|
| Advisory Fees Paid, Amount |
$ 1,737,689
|
|
| InvestmentCompanyPortfolioTurnover |
25.00%
|
|
| Additional Fund Statistics [Text Block] |
Table SummaryTotal Net Assets | $513,689,060 |
|---|
Number of Portfolio Holdings | 160 |
|---|
Portfolio Turnover Rate | 25% |
|---|
Advisory Fees Paid | $1,737,689 |
|---|
|
|
| Holdings [Text Block] |
Asset Class Weightings (% of Total Investments)Table SummaryCommon Stocks | 81.0% |
|---|
Exchange Traded Funds (ETFs) | 15.6% |
|---|
Convertible Preferred Stocks | 1.5% |
|---|
Limited Partnership | 0.5% |
|---|
Short-Term Investments | 1.4% |
|---|
Total | 100.0% |
|---|
Sector Allocation (% of Total Investments)Table SummaryFinancial | 21.6% |
|---|
Consumer Non-cyclical | 15.2% |
|---|
Utilities | 9.8% |
|---|
Energy | 8.7% |
|---|
Exchange Traded Funds (ETFs) | 15.6% |
|---|
Others | 27.7% |
|---|
Short-Term Investments | 1.4% |
|---|
Total | 100.0% |
|---|
|
|
| Material Fund Change [Text Block] |
There were no material changes to the Fund. |
|
| C000176698 |
|
|
| Shareholder Report [Line Items] |
|
|
| Fund Name |
Destinations Core Fixed Income Fund
|
|
| Class Name |
Class I
|
|
| Trading Symbol |
DCFFX
|
|
| Annual or Semi-Annual Statement [Text Block] |
This semi-annual shareholder summary report contains important information about the Fund for the period of March 1, 2026 to August 31, 2026.
|
|
| Shareholder Report Annual or Semi-Annual |
Semi-Annual Shareholder Report
|
|
| Additional Information [Text Block] |
You can find additional information about the Fund at http://destinationsfunds.com/. You can also request this information by calling 1-877-771-7979.
|
|
| Additional Information Phone Number |
1-877-771-7979
|
|
| Additional Information Website |
http://destinationsfunds.com/
|
|
| Expenses [Text Block] |
What were the Fund's costs for the last 6 months?(based on a hypothetical $10,000 investment) Table SummaryClass name | Cost of a $10,000 investment | Cost paid as a % of a $10,000 investment |
|---|
Class I | $43 | 0.87%Footnote Reference* |
|---|
| Footnote | Description | Footnote* | Annualized |
|
|
| Expenses Paid, Amount |
$ 43
|
|
| Expense Ratio, Percent |
0.87%
|
[9] |
| Performance Past Does Not Indicate Future [Text] |
The Fund's past performance is not a good predictor of how the Fund will perform in the future
|
|
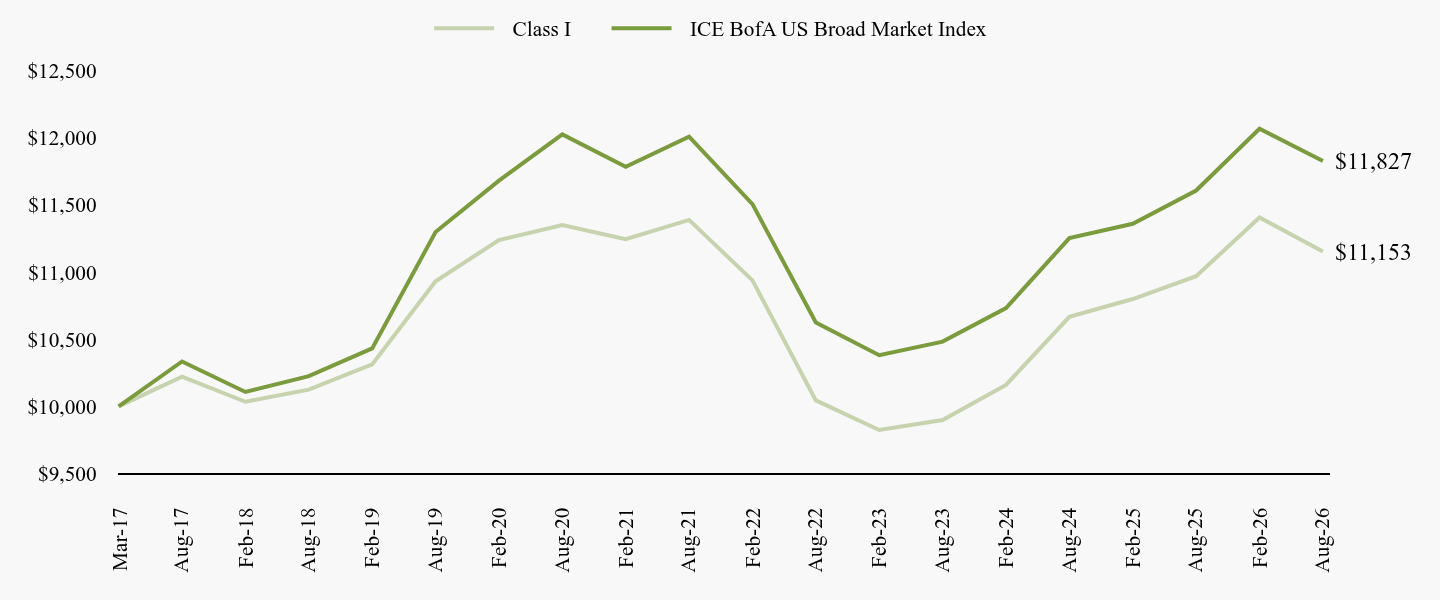
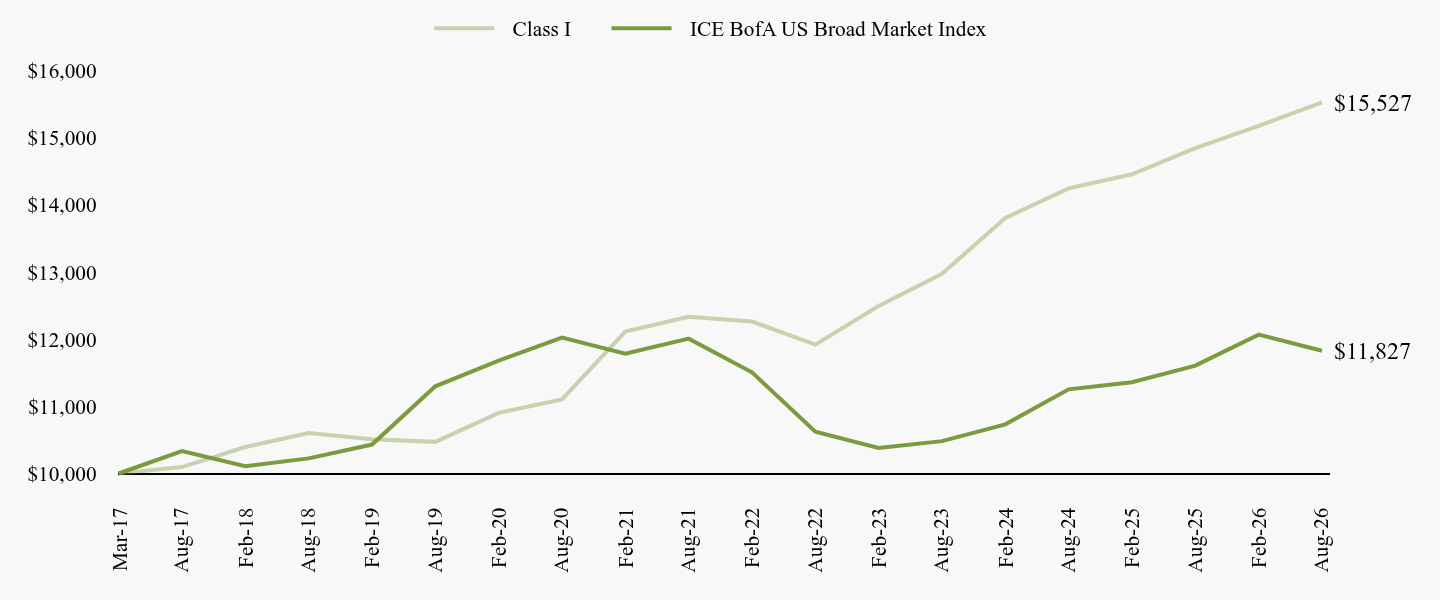
| Line Graph [Table Text Block] |
Table Summary | Class I | ICE BofA US Broad Market Index |
|---|
Mar-17 | $10,000 | $10,000 |
|---|
Aug-17 | $10,221 | $10,334 |
|---|
Feb-18 | $10,034 | $10,107 |
|---|
Aug-18 | $10,124 | $10,225 |
|---|
Feb-19 | $10,312 | $10,431 |
|---|
Aug-19 | $10,931 | $11,298 |
|---|
Feb-20 | $11,238 | $11,680 |
|---|
Aug-20 | $11,350 | $12,025 |
|---|
Feb-21 | $11,244 | $11,783 |
|---|
Aug-21 | $11,388 | $12,008 |
|---|
Feb-22 | $10,938 | $11,506 |
|---|
Aug-22 | $10,044 | $10,624 |
|---|
Feb-23 | $9,824 | $10,381 |
|---|
Aug-23 | $9,898 | $10,482 |
|---|
Feb-24 | $10,159 | $10,732 |
|---|
Aug-24 | $10,666 | $11,253 |
|---|
Feb-25 | $10,799 | $11,359 |
|---|
Aug-25 | $10,969 | $11,607 |
|---|
Feb-26 | $11,406 | $12,067 |
|---|
Aug-26 | $11,153 | $11,827 |
|---|
|
|
| Average Annual Return [Table Text Block] |
Table SummaryName | 1 Year | 5 Years | Since Inception
(03/20/2017) |
|---|
Class I | 1.68% | -0.42% | 1.16% |
|---|
ICE BofA US Broad Market Index | 1.90% | -0.30% | 1.80% |
|---|
|
|
| Performance Inception Date |
Mar. 20, 2017
|
|
| No Deduction of Taxes [Text Block] |
The graph and table do not reflect the deduction of taxes that a shareholder would pay on Fund distributions or redemption of Fund shares
|
|
| AssetsNet |
$ 1,523,586,184
|
|
| Holdings Count | Holding |
1,959
|
|
| Advisory Fees Paid, Amount |
$ 4,715,613
|
|
| InvestmentCompanyPortfolioTurnover |
84.00%
|
|
| Additional Fund Statistics [Text Block] |
Table SummaryTotal Net Assets | $1,523,586,184 |
|---|
Number of Portfolio Holdings | 1,959 |
|---|
Portfolio Turnover Rate | 84% |
|---|
Advisory Fees Paid | $4,715,613 |
|---|
|
|
| Holdings [Text Block] |
Asset Class Weightings (% of Total Investments)Table SummaryU.S. Government Agencies & Obligations | 27.3% |
|---|
Collateralized Mortgage Obligations | 19.5% |
|---|
Mortgage-Backed Securities | 17.7% |
|---|
Corporate Bonds & Notes | 17.7% |
|---|
Asset-Backed Securities | 9.3% |
|---|
Others | 5.9% |
|---|
Short-Term Investments | 2.6% |
|---|
Money Market Fund | 0.0%Footnote Reference* |
|---|
Total | 100.0% |
|---|
| Footnote | Description | Footnote* | Position represents less than 0.05%. |
|
|
| Material Fund Change [Text Block] |
There were no material changes to the Fund. |
|
| C000202458 |
|
|
| Shareholder Report [Line Items] |
|
|
| Fund Name |
Destinations Core Fixed Income Fund
|
|
| Class Name |
Class Z
|
|
| Trading Symbol |
DCFZX
|
|
| Annual or Semi-Annual Statement [Text Block] |
This semi-annual shareholder summary report contains important information about the Fund for the period of March 1, 2026 to August 31, 2026.
|
|
| Shareholder Report Annual or Semi-Annual |
Semi-Annual Shareholder Report
|
|
| Additional Information [Text Block] |
You can find additional information about the Fund at http://destinationsfunds.com/. You can also request this information by calling 1-877-771-7979.
|
|
| Additional Information Phone Number |
1-877-771-7979
|
|
| Additional Information Website |
http://destinationsfunds.com/
|
|
| Expenses [Text Block] |
What were the Fund's costs for the last 6 months?(based on a hypothetical $10,000 investment) Table SummaryClass name | Cost of a $10,000 investment | Cost paid as a % of a $10,000 investment |
|---|
Class Z | $36 | 0.72%Footnote Reference* |
|---|
| Footnote | Description | Footnote* | Annualized |
|
|
| Expenses Paid, Amount |
$ 36
|
|
| Expense Ratio, Percent |
0.72%
|
[10] |
| Performance Past Does Not Indicate Future [Text] |
The Fund's past performance is not a good predictor of how the Fund will perform in the future
|
|
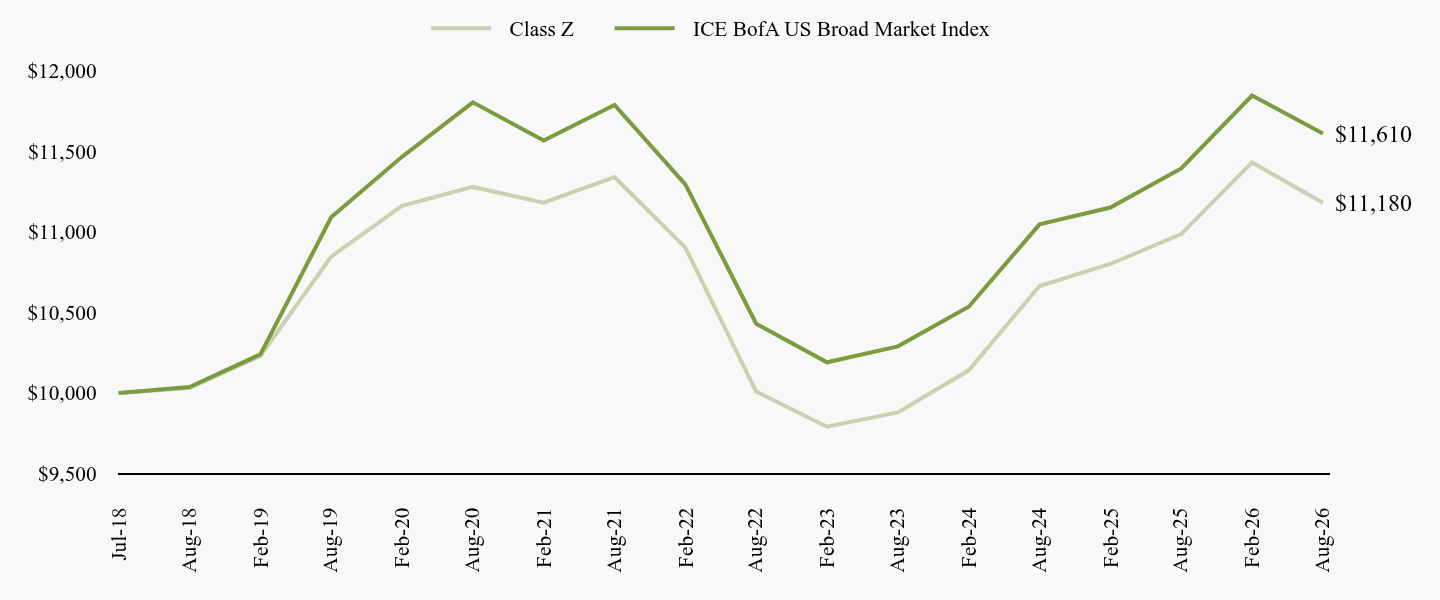
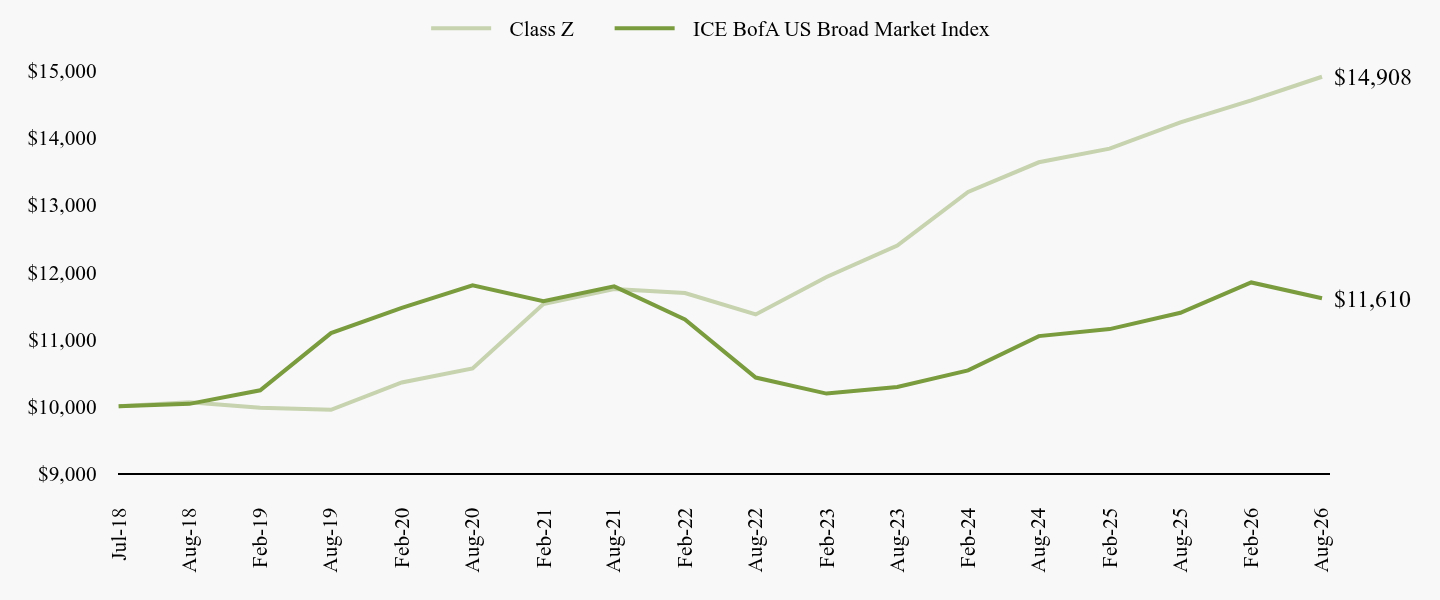
| Line Graph [Table Text Block] |
Table Summary | Class Z | ICE BofA US Broad Market Index |
|---|
Jul-18 | $10,000 | $10,000 |
|---|
Aug-18 | $10,030 | $10,037 |
|---|
Feb-19 | $10,229 | $10,239 |
|---|
Aug-19 | $10,846 | $11,090 |
|---|
Feb-20 | $11,161 | $11,465 |
|---|
Aug-20 | $11,278 | $11,803 |
|---|
Feb-21 | $11,180 | $11,566 |
|---|
Aug-21 | $11,339 | $11,787 |
|---|
Feb-22 | $10,901 | $11,294 |
|---|
Aug-22 | $10,008 | $10,429 |
|---|
Feb-23 | $9,790 | $10,190 |
|---|
Aug-23 | $9,879 | $10,289 |
|---|
Feb-24 | $10,140 | $10,535 |
|---|
Aug-24 | $10,663 | $11,046 |
|---|
Feb-25 | $10,800 | $11,150 |
|---|
Aug-25 | $10,985 | $11,393 |
|---|
Feb-26 | $11,430 | $11,845 |
|---|
Aug-26 | $11,180 | $11,610 |
|---|
|
|
| Average Annual Return [Table Text Block] |
Table SummaryName | 1 Year | 5 Years | Since Inception
(07/16/2018) |
|---|
Class Z | 1.77% | -0.28% | 1.38% |
|---|
ICE BofA US Broad Market Index | 1.90% | -0.30% | 1.83% |
|---|
|
|
| Performance Inception Date |
Jul. 16, 2018
|
|
| No Deduction of Taxes [Text Block] |
The graph and table do not reflect the deduction of taxes that a shareholder would pay on Fund distributions or redemption of Fund shares
|
|
| AssetsNet |
$ 1,523,586,184
|
|
| Holdings Count | Holding |
1,959
|
|
| Advisory Fees Paid, Amount |
$ 4,715,613
|
|
| InvestmentCompanyPortfolioTurnover |
84.00%
|
|
| Additional Fund Statistics [Text Block] |
Table SummaryTotal Net Assets | $1,523,586,184 |
|---|
Number of Portfolio Holdings | 1,959 |
|---|
Portfolio Turnover Rate | 84% |
|---|
Advisory Fees Paid | $4,715,613 |
|---|
|
|
| Holdings [Text Block] |
Asset Class Weightings (% of Total Investments)Table SummaryU.S. Government Agencies & Obligations | 27.3% |
|---|
Collateralized Mortgage Obligations | 19.5% |
|---|
Mortgage-Backed Securities | 17.7% |
|---|
Corporate Bonds & Notes | 17.7% |
|---|
Asset-Backed Securities | 9.3% |
|---|
Others | 5.9% |
|---|
Short-Term Investments | 2.6% |
|---|
Money Market Fund | 0.0%Footnote Reference* |
|---|
Total | 100.0% |
|---|
| Footnote | Description | Footnote* | Position represents less than 0.05%. |
|
|
| Material Fund Change [Text Block] |
There were no material changes to the Fund. |
|
| C000176699 |
|
|
| Shareholder Report [Line Items] |
|
|
| Fund Name |
Destinations Low Duration Fixed Income Fund
|
|
| Class Name |
Class I
|
|
| Trading Symbol |
DLDFX
|
|
| Annual or Semi-Annual Statement [Text Block] |
This semi-annual shareholder summary report contains important information about the Fund for the period of March 1, 2026 to August 31, 2026.
|
|
| Shareholder Report Annual or Semi-Annual |
Semi-Annual Shareholder Report
|
|
| Additional Information [Text Block] |
You can find additional information about the Fund at http://destinationsfunds.com/. You can also request this information by calling 1-877-771-7979.
|
|
| Additional Information Phone Number |
1-877-771-7979
|
|
| Additional Information Website |
http://destinationsfunds.com/
|
|
| Expenses [Text Block] |
What were the Fund's costs for the last 6 months?(based on a hypothetical $10,000 investment) Table SummaryClass name | Cost of a $10,000 investment | Cost paid as a % of a $10,000 investment |
|---|
Class I | $48 | 0.95%Footnote Reference* |
|---|
| Footnote | Description | Footnote* | Annualized |
|
|
| Expenses Paid, Amount |
$ 48
|
|
| Expense Ratio, Percent |
0.95%
|
[11] |
| Performance Past Does Not Indicate Future [Text] |
The Fund's past performance is not a good predictor of how the Fund will perform in the future
|
|
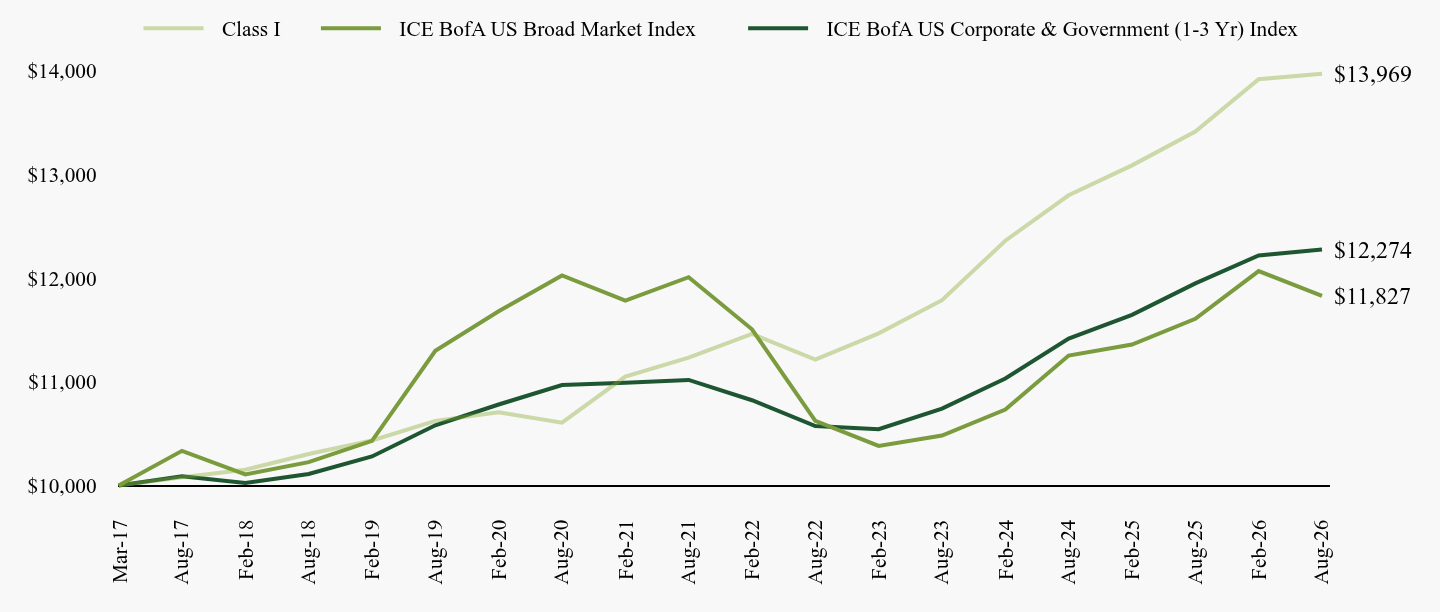
| Line Graph [Table Text Block] |
Table Summary | Class I | ICE BofA US Broad Market Index | ICE BofA US Corporate & Government (1-3 Yr) Index |
|---|
Mar-17 | $10,000 | $10,000 | $10,000 |
|---|
Aug-17 | $10,080 | $10,334 | $10,089 |
|---|
Feb-18 | $10,152 | $10,107 | $10,025 |
|---|
Aug-18 | $10,304 | $10,225 | $10,111 |
|---|
Feb-19 | $10,434 | $10,431 | $10,280 |
|---|
Aug-19 | $10,623 | $11,298 | $10,580 |
|---|
Feb-20 | $10,705 | $11,680 | $10,781 |
|---|
Aug-20 | $10,605 | $12,025 | $10,968 |
|---|
Feb-21 | $11,050 | $11,783 | $10,991 |
|---|
Aug-21 | $11,232 | $12,008 | $11,018 |
|---|
Feb-22 | $11,461 | $11,506 | $10,822 |
|---|
Aug-22 | $11,213 | $10,624 | $10,573 |
|---|
Feb-23 | $11,467 | $10,381 | $10,542 |
|---|
Aug-23 | $11,786 | $10,482 | $10,741 |
|---|
Feb-24 | $12,360 | $10,732 | $11,031 |
|---|
Aug-24 | $12,798 | $11,253 | $11,416 |
|---|
Feb-25 | $13,086 | $11,359 | $11,645 |
|---|
Aug-25 | $13,412 | $11,607 | $11,948 |
|---|
Feb-26 | $13,916 | $12,067 | $12,217 |
|---|
Aug-26 | $13,969 | $11,827 | $12,274 |
|---|
|
|
| Average Annual Return [Table Text Block] |
Table SummaryName | 1 Year | 5 Years | Since Inception
(03/20/2017) |
|---|
Class I | 4.15% | 4.46% | 3.59% |
|---|
ICE BofA US Broad Market Index | 1.90% | -0.30% | 1.80% |
|---|
ICE BofA US Corporate & Government (1-3 Yr) Index | 2.73% | 2.18% | 2.19% |
|---|
|
|
| Performance Inception Date |
Mar. 20, 2017
|
|
| No Deduction of Taxes [Text Block] |
The graph and table do not reflect the deduction of taxes that a shareholder would pay on Fund distributions or redemption of Fund shares
|
|
| AssetsNet |
$ 342,566,119
|
|
| Holdings Count | Holding |
591
|
|
| Advisory Fees Paid, Amount |
$ 1,007,334
|
|
| InvestmentCompanyPortfolioTurnover |
35.00%
|
|
| Additional Fund Statistics [Text Block] |
Table SummaryTotal Net Assets | $342,566,119 |
|---|
Number of Portfolio Holdings | 591 |
|---|
Portfolio Turnover Rate | 35% |
|---|
Advisory Fees Paid | $1,007,334 |
|---|
|
|
| Holdings [Text Block] |
Sector Allocation (% of Total Investments)Table SummaryMortgage Securities | 17.0% |
|---|
Asset Backed Securities | 9.0% |
|---|
Consumer Non-cyclical | 7.3% |
|---|
Diversified | 7.0% |
|---|
Exchange Traded Fund (ETF) | 18.2% |
|---|
Others | 33.2% |
|---|
Short-Term Investments | 6.7% |
|---|
Money Market Fund | 1.6% |
|---|
Total | 100.0% |
|---|
Asset Class Weightings (% of Total Investments)Table SummaryCorporate Bonds & Notes | 29.1% |
|---|
Exchange Traded Fund (ETF) | 18.2% |
|---|
Collateralized Mortgage Obligations | 13.6% |
|---|
Common Stocks | 7.0% |
|---|
Collateralized Loan Obligations | 6.9% |
|---|
Others | 16.9% |
|---|
Short-Term Investments | 6.7% |
|---|
Money Market Fund | 1.6% |
|---|
Total | 100.0% |
|---|
|
|
| Material Fund Change [Text Block] |
There were no material changes to the Fund. |
|
| C000202459 |
|
|
| Shareholder Report [Line Items] |
|
|
| Fund Name |
Destinations Low Duration Fixed Income Fund
|
|
| Class Name |
Class Z
|
|
| Trading Symbol |
DLDZX
|
|
| Annual or Semi-Annual Statement [Text Block] |
This semi-annual shareholder summary report contains important information about the Fund for the period of March 1, 2026 to August 31, 2026.
|
|
| Shareholder Report Annual or Semi-Annual |
Semi-Annual Shareholder Report
|
|
| Additional Information [Text Block] |
You can find additional information about the Fund at http://destinationsfunds.com/. You can also request this information by calling 1-877-771-7979.
|
|
| Additional Information Phone Number |
1-877-771-7979
|
|
| Additional Information Website |
http://destinationsfunds.com/
|
|
| Expenses [Text Block] |
What were the Fund's costs for the last 6 months?(based on a hypothetical $10,000 investment) Table SummaryClass name | Cost of a $10,000 investment | Cost paid as a % of a $10,000 investment |
|---|
Class Z | $40 | 0.80%Footnote Reference* |
|---|
| Footnote | Description | Footnote* | Annualized |
|
|
| Expenses Paid, Amount |
$ 40
|
|
| Expense Ratio, Percent |
0.80%
|
[12] |
| Performance Past Does Not Indicate Future [Text] |
The Fund's past performance is not a good predictor of how the Fund will perform in the future
|
|
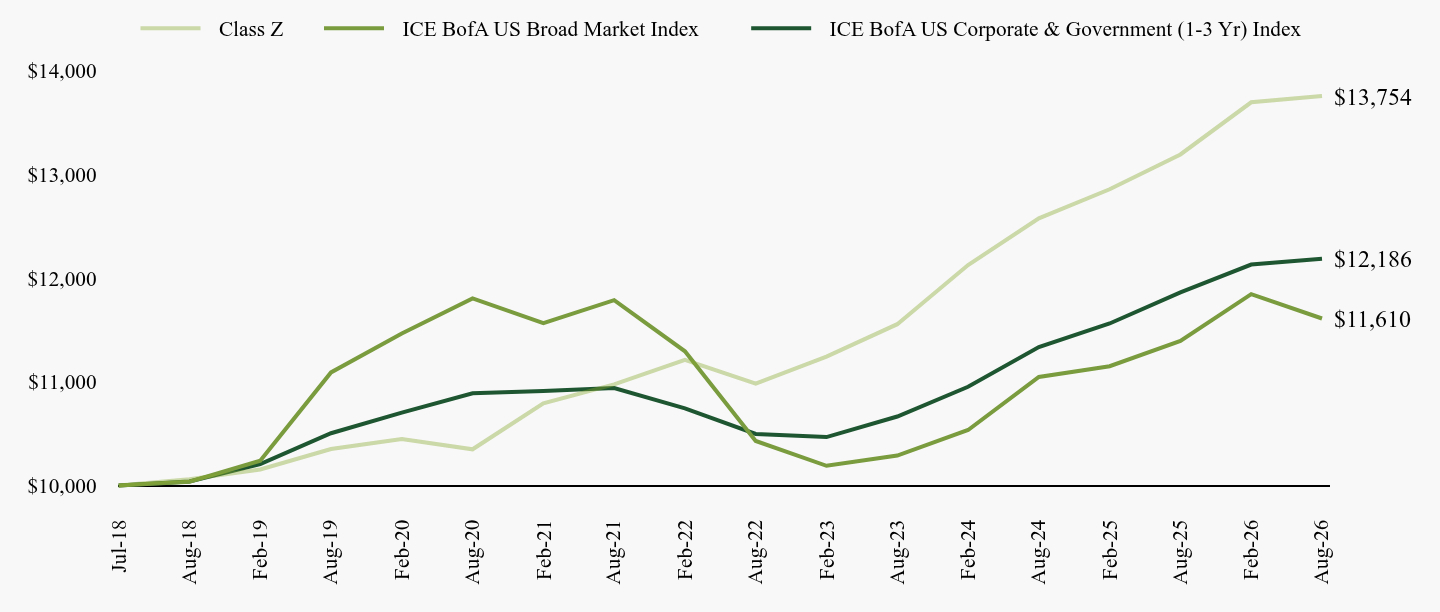
| Line Graph [Table Text Block] |
Table Summary | Class Z | ICE BofA US Broad Market Index | ICE BofA US Corporate & Government (1-3 Yr) Index |
|---|
Jul-18 | $10,000 | $10,000 | $10,000 |
|---|
Aug-18 | $10,060 | $10,037 | $10,039 |
|---|
Feb-19 | $10,154 | $10,239 | $10,207 |
|---|
Aug-19 | $10,351 | $11,090 | $10,504 |
|---|
Feb-20 | $10,448 | $11,465 | $10,703 |
|---|
Aug-20 | $10,349 | $11,803 | $10,889 |
|---|
Feb-21 | $10,792 | $11,566 | $10,912 |
|---|
Aug-21 | $10,975 | $11,787 | $10,939 |
|---|
Feb-22 | $11,210 | $11,294 | $10,744 |
|---|
Aug-22 | $10,981 | $10,429 | $10,497 |
|---|
Feb-23 | $11,242 | $10,190 | $10,467 |
|---|
Aug-23 | $11,555 | $10,289 | $10,665 |
|---|
Feb-24 | $12,125 | $10,535 | $10,952 |
|---|
Aug-24 | $12,575 | $11,046 | $11,335 |
|---|
Feb-25 | $12,856 | $11,150 | $11,562 |
|---|
Aug-25 | $13,191 | $11,393 | $11,862 |
|---|
Feb-26 | $13,694 | $11,845 | $12,130 |
|---|
Aug-26 | $13,754 | $11,610 | $12,186 |
|---|
|
|
| Average Annual Return [Table Text Block] |
Table SummaryName | 1 Year | 5 Years | Since Inception
(07/16/2018) |
|---|
Class Z | 4.27% | 4.62% | 4.02% |
|---|
ICE BofA US Broad Market Index | 1.90% | -0.30% | 1.83% |
|---|
ICE BofA US Corporate & Government (1-3 Yr) Index | 2.73% | 2.18% | 2.45% |
|---|
|
|
| Performance Inception Date |
Jul. 16, 2018
|
|
| No Deduction of Taxes [Text Block] |
The graph and table do not reflect the deduction of taxes that a shareholder would pay on Fund distributions or redemption of Fund shares
|
|
| AssetsNet |
$ 342,566,119
|
|
| Holdings Count | Holding |
591
|
|
| Advisory Fees Paid, Amount |
$ 1,007,334
|
|
| InvestmentCompanyPortfolioTurnover |
35.00%
|
|
| Additional Fund Statistics [Text Block] |
Table SummaryTotal Net Assets | $342,566,119 |
|---|
Number of Portfolio Holdings | 591 |
|---|
Portfolio Turnover Rate | 35% |
|---|
Advisory Fees Paid | $1,007,334 |
|---|
|
|
| Holdings [Text Block] |
Sector Allocation (% of Total Investments)Table SummaryMortgage Securities | 17.0% |
|---|
Asset Backed Securities | 9.0% |
|---|
Consumer Non-cyclical | 7.3% |
|---|
Diversified | 7.0% |
|---|
Exchange Traded Fund (ETF) | 18.2% |
|---|
Others | 33.2% |
|---|
Short-Term Investments | 6.7% |
|---|
Money Market Fund | 1.6% |
|---|
Total | 100.0% |
|---|
Asset Class Weightings (% of Total Investments)Table SummaryCorporate Bonds & Notes | 29.1% |
|---|
Exchange Traded Fund (ETF) | 18.2% |
|---|
Collateralized Mortgage Obligations | 13.6% |
|---|
Common Stocks | 7.0% |
|---|
Collateralized Loan Obligations | 6.9% |
|---|
Others | 16.9% |
|---|
Short-Term Investments | 6.7% |
|---|
Money Market Fund | 1.6% |
|---|
Total | 100.0% |
|---|
|
|
| Material Fund Change [Text Block] |
There were no material changes to the Fund. |
|
| C000176700 |
|
|
| Shareholder Report [Line Items] |
|
|
| Fund Name |
Destinations Global Fixed Income Opportunities Fund
|
|
| Class Name |
Class I
|
|
| Trading Symbol |
DGFFX
|
|
| Annual or Semi-Annual Statement [Text Block] |
This semi-annual shareholder summary report contains important information about the Fund for the period of March 1, 2026 to August 31, 2026.
|
|
| Shareholder Report Annual or Semi-Annual |
Semi-Annual Shareholder Report
|
|
| Additional Information [Text Block] |
You can find additional information about the Fund at http://destinationsfunds.com/. You can also request this information by calling 1-877-771-7979.
|
|
| Additional Information Phone Number |
1-877-771-7979
|
|
| Additional Information Website |
http://destinationsfunds.com/
|
|
| Expenses [Text Block] |
What were the Fund's costs for the last 6 months?(based on a hypothetical $10,000 investment) Table SummaryClass name | Cost of a $10,000 investment | Cost paid as a % of a $10,000 investment |
|---|
Class I | $54 | 1.07%Footnote Reference* |
|---|
| Footnote | Description | Footnote* | Annualized |
|
|
| Expenses Paid, Amount |
$ 54
|
|
| Expense Ratio, Percent |
1.07%
|
[13] |
| Performance Past Does Not Indicate Future [Text] |
The Fund's past performance is not a good predictor of how the Fund will perform in the future
|
|
| Average Annual Return [Table Text Block] |
Table SummaryName | 1 Year | 5 Years | Since Inception
(03/20/2017) |
|---|
Class I | 5.25% | 4.58% | 4.28% |
|---|
ICE BofA Global Broad Market (USD Hedged) | 1.51% | -0.13% | 1.83% |
|---|
ICE BofA Global Corporate & High Yield (USD Hedged) | 2.73% | 1.16% | 3.25% |
|---|
|
|
| Performance Inception Date |
Mar. 20, 2017
|
|
| No Deduction of Taxes [Text Block] |
The graph and table do not reflect the deduction of taxes that a shareholder would pay on Fund distributions or redemption of Fund shares
|
|
| AssetsNet |
$ 732,381,520
|
|
| Holdings Count | Holding |
582
|
|
| Advisory Fees Paid, Amount |
$ 2,721,182
|
|
| InvestmentCompanyPortfolioTurnover |
55.00%
|
|
| Holdings [Text Block] |
Asset Class Weightings (% of Total Investments)Table SummaryCorporate Bonds & Notes | 71.0% |
|---|
Senior Loans | 6.1% |
|---|
Common Stocks | 3.8% |
|---|
Exchange Traded Fund (ETF) | 3.7% |
|---|
Others | 5.2% |
|---|
Short-Term Investments | 7.4% |
|---|
Money Market Fund | 2.8% |
|---|
Purchased Options | 0.0%Footnote Reference* |
|---|
Total | 100.0% |
|---|
| Footnote | Description | Footnote* | Position represents less than 0.05%. |
Country Weightings (% of Total Investments) Table SummaryUnited States | 46.5% |
|---|
United Kingdom | 4.9% |
|---|
Luxembourg | 4.0% |
|---|
Mexico | 3.2% |
|---|
Cayman Islands | 2.4% |
|---|
Others | 28.8% |
|---|
Short-Term Investments | 7.4% |
|---|
Money Market Fund | 2.8% |
|---|
Total | 100.0% |
|---|
|
|
| Material Fund Change [Text Block] |
There were no material changes to the Fund. |
|
| C000202460 |
|
|
| Shareholder Report [Line Items] |
|
|
| Fund Name |
Destinations Global Fixed Income Opportunities Fund
|
|
| Class Name |
Class Z
|
|
| Trading Symbol |
DGFZX
|
|
| Annual or Semi-Annual Statement [Text Block] |
This semi-annual shareholder summary report contains important information about the Fund for the period of March 1, 2026 to August 31, 2026.
|
|
| Shareholder Report Annual or Semi-Annual |
Semi-Annual Shareholder Report
|
|
| Additional Information [Text Block] |
You can find additional information about the Fund at http://destinationsfunds.com/. You can also request this information by calling 1-877-771-7979.
|
|
| Additional Information Phone Number |
1-877-771-7979
|
|
| Additional Information Website |
http://destinationsfunds.com/
|
|
| Expenses [Text Block] |
What were the Fund's costs for the last 6 months?(based on a hypothetical $10,000 investment) Table SummaryClass name | Cost of a $10,000 investment | Cost paid as a % of a $10,000 investment |
|---|
Class Z | $47 | 0.92%Footnote Reference* |
|---|
| Footnote | Description | Footnote* | Annualized |
|
|
| Expenses Paid, Amount |
$ 47
|
|
| Expense Ratio, Percent |
0.92%
|
[14] |
| Performance Past Does Not Indicate Future [Text] |
The Fund's past performance is not a good predictor of how the Fund will perform in the future
|
|
| Average Annual Return [Table Text Block] |
Table SummaryName | 1 Year | 5 Years | Since Inception
(07/16/2018) |
|---|
Class Z | 5.38% | 4.75% | 4.66% |
|---|
ICE BofA Global Broad Market (USD Hedged) | 1.51% | -0.13% | 1.69% |
|---|
ICE BofA Global Corporate & High Yield (USD Hedged) | 2.73% | 1.16% | 3.26% |
|---|
|
|
| Performance Inception Date |
Jul. 16, 2018
|
|
| No Deduction of Taxes [Text Block] |
The graph and table do not reflect the deduction of taxes that a shareholder would pay on Fund distributions or redemption of Fund shares
|
|
| AssetsNet |
$ 732,381,520
|
|
| Holdings Count | Holding |
582
|
|
| Advisory Fees Paid, Amount |
$ 2,721,182
|
|
| InvestmentCompanyPortfolioTurnover |
55.00%
|
|
| Holdings [Text Block] |
Asset Class Weightings (% of Total Investments)Table SummaryCorporate Bonds & Notes | 71.0% |
|---|
Senior Loans | 6.1% |
|---|
Common Stocks | 3.8% |
|---|
Exchange Traded Fund (ETF) | 3.7% |
|---|
Others | 5.2% |
|---|
Short-Term Investments | 7.4% |
|---|
Money Market Fund | 2.8% |
|---|
Purchased Options | 0.0%Footnote Reference* |
|---|
Total | 100.0% |
|---|
| Footnote | Description | Footnote* | Position represents less than 0.05%. |
Country Weightings (% of Total Investments) Table SummaryUnited States | 46.5% |
|---|
United Kingdom | 4.9% |
|---|
Luxembourg | 4.0% |
|---|
Mexico | 3.2% |
|---|
Cayman Islands | 2.4% |
|---|
Others | 28.8% |
|---|
Short-Term Investments | 7.4% |
|---|
Money Market Fund | 2.8% |
|---|
Total | 100.0% |
|---|
|
|
| Material Fund Change [Text Block] |
There were no material changes to the Fund. |
|
| C000176701 |
|
|
| Shareholder Report [Line Items] |
|
|
| Fund Name |
Destinations Municipal Fixed Income Fund
|
|
| Class Name |
Class I
|
|
| Trading Symbol |
DMFFX
|
|
| Annual or Semi-Annual Statement [Text Block] |
This semi-annual shareholder summary report contains important information about the Fund for the period of March 1, 2026 to August 31, 2026.
|
|
| Shareholder Report Annual or Semi-Annual |
Semi-Annual Shareholder Report
|
|
| Additional Information [Text Block] |
You can find additional information about the Fund at http://destinationsfunds.com/. You can also request this information by calling 1-877-771-7979.
|
|
| Additional Information Phone Number |
1-877-771-7979
|
|
| Additional Information Website |
http://destinationsfunds.com/
|
|
| Expenses [Text Block] |
What were the Fund's costs for the last 6 months?(based on a hypothetical $10,000 investment) Table SummaryClass name | Cost of a $10,000 investment | Cost paid as a % of a $10,000 investment |
|---|
Class I | $42 | 0.84%Footnote Reference* |
|---|
| Footnote | Description | Footnote* | Annualized |
|
|
| Expenses Paid, Amount |
$ 42
|
|
| Expense Ratio, Percent |
0.84%
|
[15] |
| Performance Past Does Not Indicate Future [Text] |
The Fund's past performance is not a good predictor of how the Fund will perform in the future
|
|
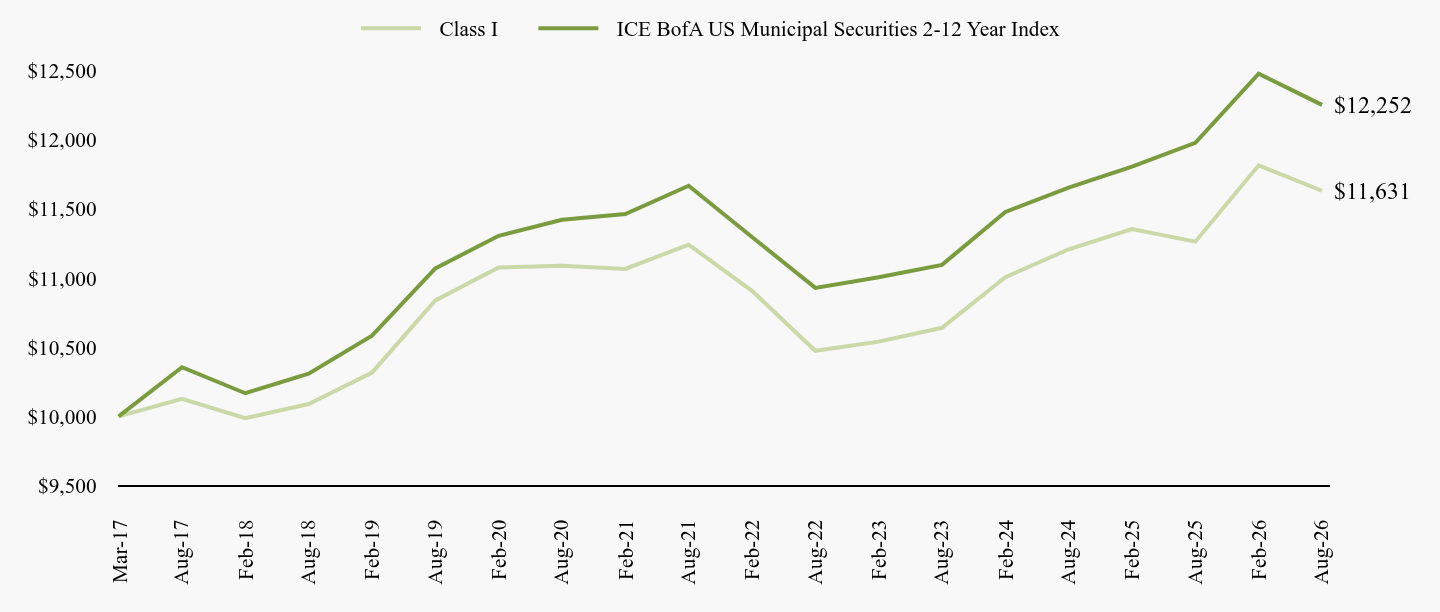
| Line Graph [Table Text Block] |
Table Summary | Class I | ICE BofA US Municipal Securities 2-12 Year Index |
|---|
Mar-17 | $10,000 | $10,000 |
|---|
Aug-17 | $10,126 | $10,355 |
|---|
Feb-18 | $9,986 | $10,167 |
|---|
Aug-18 | $10,089 | $10,308 |
|---|
Feb-19 | $10,316 | $10,583 |
|---|
Aug-19 | $10,838 | $11,070 |
|---|
Feb-20 | $11,077 | $11,305 |
|---|
Aug-20 | $11,089 | $11,421 |
|---|
Feb-21 | $11,066 | $11,463 |
|---|
Aug-21 | $11,241 | $11,667 |
|---|
Feb-22 | $10,907 | $11,297 |
|---|
Aug-22 | $10,474 | $10,929 |
|---|
Feb-23 | $10,540 | $11,006 |
|---|
Aug-23 | $10,640 | $11,095 |
|---|
Feb-24 | $11,006 | $11,478 |
|---|
Aug-24 | $11,208 | $11,653 |
|---|
Feb-25 | $11,354 | $11,806 |
|---|
Aug-25 | $11,263 | $11,977 |
|---|
Feb-26 | $11,815 | $12,478 |
|---|
Aug-26 | $11,631 | $12,252 |
|---|
|
|
| Average Annual Return [Table Text Block] |
Table SummaryName | 1 Year | 5 Years | Since Inception
(03/20/2017) |
|---|
Class I | 3.27% | 0.68% | 1.61% |
|---|
ICE BofA US Municipal Securities 2-12 Year Index | 2.30% | 0.98% | 2.17% |
|---|
|
|
| Performance Inception Date |
Mar. 20, 2017
|
|
| No Deduction of Taxes [Text Block] |
The graph and table do not reflect the deduction of taxes that a shareholder would pay on Fund distributions or redemption of Fund shares
|
|
| AssetsNet |
$ 627,056,098
|
|
| Holdings Count | Holding |
469
|
|
| Advisory Fees Paid, Amount |
$ 1,883,372
|
|
| InvestmentCompanyPortfolioTurnover |
18.00%
|
|
| Additional Fund Statistics [Text Block] |
Table SummaryTotal Net Assets | $627,056,098 |
|---|
Number of Portfolio Holdings | 469 |
|---|
Portfolio Turnover Rate | 18% |
|---|
Advisory Fees Paid | $1,883,372 |
|---|
|
|
| Holdings [Text Block] |
Asset Class Weightings (% of Total Investments)Table SummaryMunicipal Bonds | 91.2% |
|---|
Exchange Traded Fund (ETF) | 2.2% |
|---|
Warrants | 0.0%Footnote Reference* |
|---|
Short-Term Investments | 4.7% |
|---|
Money Market Fund | 1.9% |
|---|
Total | 100.0% |
|---|
| Footnote | Description | Footnote* | Position represents less than 0.05%. |
Industry Weightings (% of Total Investments) Table SummaryGeneral Obligation | 35.3% |
|---|
Education | 16.0% |
|---|
Water and Sewer | 7.1% |
|---|
Airport | 6.9% |
|---|
Exchange Traded Fund (ETF) | 2.2% |
|---|
Others | 25.9% |
|---|
Short-Term Investments | 4.7% |
|---|
Money Market Fund | 1.9% |
|---|
Total | 100.0% |
|---|
|
|
| Material Fund Change [Text Block] |
There were no material changes to the Fund. |
|
| C000202461 |
|
|
| Shareholder Report [Line Items] |
|
|
| Fund Name |
Destinations Municipal Fixed Income Fund
|
|
| Class Name |
Class Z
|
|
| Trading Symbol |
DMFZX
|
|
| Annual or Semi-Annual Statement [Text Block] |
This semi-annual shareholder summary report contains important information about the Fund for the period of March 1, 2026 to August 31, 2026.
|
|
| Shareholder Report Annual or Semi-Annual |
Semi-Annual Shareholder Report
|
|
| Additional Information [Text Block] |
You can find additional information about the Fund at http://destinationsfunds.com/. You can also request this information by calling 1-877-771-7979.
|
|
| Additional Information Phone Number |
1-877-771-7979
|
|
| Additional Information Website |
http://destinationsfunds.com/
|
|
| Expenses [Text Block] |
What were the Fund's costs for the last 6 months?(based on a hypothetical $10,000 investment) Table SummaryClass name | Cost of a $10,000 investment | Cost paid as a % of a $10,000 investment |
|---|
Class Z | $35 | 0.69%Footnote Reference* |
|---|
| Footnote | Description | Footnote* | Annualized |
|
|
| Expenses Paid, Amount |
$ 35
|
|
| Expense Ratio, Percent |
0.69%
|
[16] |
| Performance Past Does Not Indicate Future [Text] |
The Fund's past performance is not a good predictor of how the Fund will perform in the future
|
|
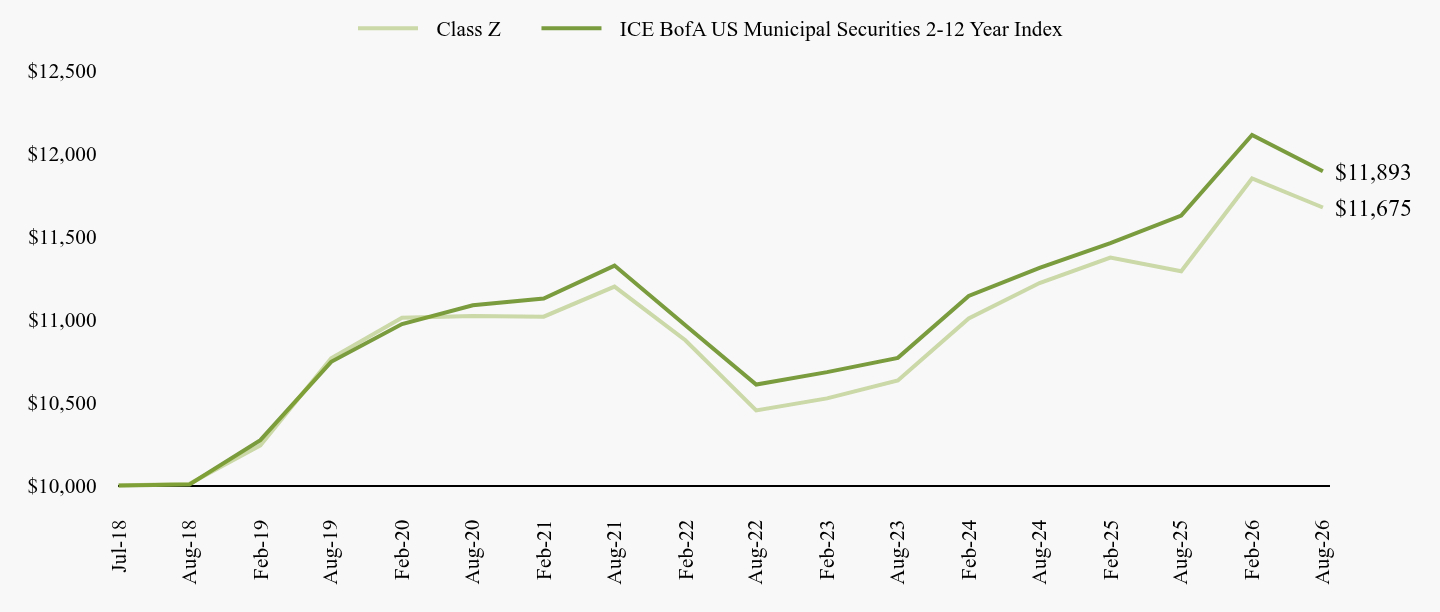
| Line Graph [Table Text Block] |
Table Summary | Class Z | ICE BofA US Municipal Securities 2-12 Year Index |
|---|
Jul-18 | $10,000 | $10,000 |
|---|
Aug-18 | $10,010 | $10,006 |
|---|
Feb-19 | $10,242 | $10,273 |
|---|
Aug-19 | $10,766 | $10,745 |
|---|
Feb-20 | $11,011 | $10,973 |
|---|
Aug-20 | $11,021 | $11,086 |
|---|
Feb-21 | $11,017 | $11,126 |
|---|
Aug-21 | $11,198 | $11,325 |
|---|
Feb-22 | $10,875 | $10,966 |
|---|
Aug-22 | $10,452 | $10,608 |
|---|
Feb-23 | $10,525 | $10,683 |
|---|
Aug-23 | $10,633 | $10,769 |
|---|
Feb-24 | $11,006 | $11,142 |
|---|
Aug-24 | $11,220 | $11,311 |
|---|
Feb-25 | $11,373 | $11,460 |
|---|
Aug-25 | $11,291 | $11,626 |
|---|
Feb-26 | $11,850 | $12,112 |
|---|
Aug-26 | $11,675 | $11,893 |
|---|
|
|
| Average Annual Return [Table Text Block] |
Table SummaryName | 1 Year | 5 Years | Since Inception
(07/16/2018) |
|---|
Class Z | 3.40% | 0.84% | 1.92% |
|---|
ICE BofA US Municipal Securities 2-12 Year Index | 2.30% | 0.98% | 2.15% |
|---|
|
|
| Performance Inception Date |
Jul. 16, 2018
|
|
| No Deduction of Taxes [Text Block] |
The graph and table do not reflect the deduction of taxes that a shareholder would pay on Fund distributions or redemption of Fund shares
|
|
| AssetsNet |
$ 627,056,098
|
|
| Holdings Count | Holding |
469
|
|
| Advisory Fees Paid, Amount |
$ 1,883,372
|
|
| InvestmentCompanyPortfolioTurnover |
18.00%
|
|
| Additional Fund Statistics [Text Block] |
Table SummaryTotal Net Assets | $627,056,098 |
|---|
Number of Portfolio Holdings | 469 |
|---|
Portfolio Turnover Rate | 18% |
|---|
Advisory Fees Paid | $1,883,372 |
|---|
|
|
| Holdings [Text Block] |
Asset Class Weightings (% of Total Investments)Table SummaryMunicipal Bonds | 91.2% |
|---|
Exchange Traded Fund (ETF) | 2.2% |
|---|
Warrants | 0.0%Footnote Reference* |
|---|
Short-Term Investments | 4.7% |
|---|
Money Market Fund | 1.9% |
|---|
Total | 100.0% |
|---|
| Footnote | Description | Footnote* | Position represents less than 0.05%. |
Industry Weightings (% of Total Investments) Table SummaryGeneral Obligation | 35.3% |
|---|
Education | 16.0% |
|---|
Water and Sewer | 7.1% |
|---|
Airport | 6.9% |
|---|
Exchange Traded Fund (ETF) | 2.2% |
|---|
Others | 25.9% |
|---|
Short-Term Investments | 4.7% |
|---|
Money Market Fund | 1.9% |
|---|
Total | 100.0% |
|---|
|
|
| Material Fund Change [Text Block] |
There were no material changes to the Fund. |
|
| C000176693 |
|
|
| Shareholder Report [Line Items] |
|
|
| Fund Name |
Destinations Multi Strategy Alternatives Fund
|
|
| Class Name |
Class I
|
|
| Trading Symbol |
DMSFX
|
|
| Annual or Semi-Annual Statement [Text Block] |
This semi-annual shareholder summary report contains important information about the Fund for the period of March 1, 2026 to August 31, 2026.
|
|
| Shareholder Report Annual or Semi-Annual |
Semi-Annual Shareholder Report
|
|
| Additional Information [Text Block] |
You can find additional information about the Fund at http://destinationsfunds.com/. You can also request this information by calling 1-877-771-7979.
|
|
| Additional Information Phone Number |
1-877-771-7979
|
|
| Additional Information Website |
http://destinationsfunds.com/
|
|
| Expenses [Text Block] |
What were the Fund's costs for the last 6 months?(based on a hypothetical $10,000 investment) Table SummaryClass name | Cost of a $10,000 investment | Cost paid as a % of a $10,000 investment |
|---|
Class I | $50 | 0.99%Footnote Reference* |
|---|
| Footnote | Description | Footnote* | Annualized |
|
|
| Expenses Paid, Amount |
$ 50
|
|
| Expense Ratio, Percent |
0.99%
|
[17] |
| Performance Past Does Not Indicate Future [Text] |
The Fund's past performance is not a good predictor of how the Fund will perform in the future
|
|
| Line Graph [Table Text Block] |
Table Summary | Class I | ICE BofA US Broad Market Index |
|---|
Mar-17 | $10,000 | $10,000 |
|---|
Aug-17 | $10,095 | $10,334 |
|---|
Feb-18 | $10,394 | $10,107 |
|---|
Aug-18 | $10,601 | $10,225 |
|---|
Feb-19 | $10,509 | $10,431 |
|---|
Aug-19 | $10,471 | $11,298 |
|---|
Feb-20 | $10,903 | $11,680 |
|---|
Aug-20 | $11,102 | $12,025 |
|---|
Feb-21 | $12,112 | $11,783 |
|---|
Aug-21 | $12,335 | $12,008 |
|---|
Feb-22 | $12,263 | $11,506 |
|---|
Aug-22 | $11,919 | $10,624 |
|---|
Feb-23 | $12,493 | $10,381 |
|---|
Aug-23 | $12,974 | $10,482 |
|---|
Feb-24 | $13,805 | $10,732 |
|---|
Aug-24 | $14,246 | $11,253 |
|---|
Feb-25 | $14,455 | $11,359 |
|---|
Aug-25 | $14,844 | $11,607 |
|---|
Feb-26 | $15,178 | $12,067 |
|---|
Aug-26 | $15,527 | $11,827 |
|---|
|
|
| Average Annual Return [Table Text Block] |
Table SummaryName | 1 Year | 5 Years | Since Inception
(03/20/2017) |
|---|
Class I | 4.60% | 4.71% | 4.75% |
|---|
ICE BofA US Broad Market Index | 1.90% | -0.30% | 1.80% |
|---|
|
|
| Performance Inception Date |
Mar. 20, 2017
|
|
| No Deduction of Taxes [Text Block] |
The graph and table do not reflect the deduction of taxes that a shareholder would pay on Fund distributions or redemption of Fund shares
|
|
| AssetsNet |
$ 576,119,792
|
|
| Holdings Count | Holding |
48
|
|
| Advisory Fees Paid, Amount |
$ 2,094,509
|
|
| InvestmentCompanyPortfolioTurnover |
38.00%
|
|
| Additional Fund Statistics [Text Block] |
Table SummaryTotal Net Assets | $576,119,792 |
|---|
Number of Portfolio Holdings | 48 |
|---|
Portfolio Turnover Rate | 38% |
|---|
Advisory Fees Paid | $2,094,509 |
|---|
|
|
| Holdings [Text Block] |
Asset Class Weightings (% of Total Investments)Table SummaryExchange Traded Funds (ETFs) | 34.7% |
|---|
Collateralized Mortgage Obligations | 24.4% |
|---|
Open-End Fund | 20.3% |
|---|
Asset-Backed Securities | 8.2% |
|---|
Collateralized Loan Obligations | 0.1% |
|---|
Short-Term Investments | 12.3% |
|---|
Total | 100.0% |
|---|
|
|
| Material Fund Change [Text Block] |
There were no material changes to the Fund. |
|
| C000202453 |
|
|
| Shareholder Report [Line Items] |
|
|
| Fund Name |
Destinations Multi Strategy Alternatives Fund
|
|
| Class Name |
Class Z
|
|
| Trading Symbol |
DMSZX
|
|
| Annual or Semi-Annual Statement [Text Block] |
This semi-annual shareholder summary report contains important information about the Fund for the period of March 1, 2026 to August 31, 2026.
|
|
| Shareholder Report Annual or Semi-Annual |
Semi-Annual Shareholder Report
|
|
| Additional Information [Text Block] |
You can find additional information about the Fund at http://destinationsfunds.com/. You can also request this information by calling 1-877-771-7979.
|
|
| Additional Information Phone Number |
1-877-771-7979
|
|
| Additional Information Website |
http://destinationsfunds.com/
|
|
| Expenses [Text Block] |
What were the Fund's costs for the last 6 months?(based on a hypothetical $10,000 investment) Table SummaryClass name | Cost of a $10,000 investment | Cost paid as a % of a $10,000 investment |
|---|
Class Z | $43 | 0.84%Footnote Reference* |
|---|
| Footnote | Description | Footnote* | Annualized |
|
|
| Expenses Paid, Amount |
$ 43
|
|
| Expense Ratio, Percent |
0.84%
|
[18] |
| Performance Past Does Not Indicate Future [Text] |
The Fund's past performance is not a good predictor of how the Fund will perform in the future
|
|
| Line Graph [Table Text Block] |
Table Summary | Class Z | ICE BofA US Broad Market Index |
|---|
Jul-18 | $10,000 | $10,000 |
|---|
Aug-18 | $10,060 | $10,037 |
|---|
Feb-19 | $9,979 | $10,239 |
|---|
Aug-19 | $9,948 | $11,090 |
|---|
Feb-20 | $10,355 | $11,465 |
|---|
Aug-20 | $10,564 | $11,803 |
|---|
Feb-21 | $11,524 | $11,566 |
|---|
Aug-21 | $11,748 | $11,787 |
|---|
Feb-22 | $11,687 | $11,294 |
|---|
Aug-22 | $11,368 | $10,429 |
|---|
Feb-23 | $11,927 | $10,190 |
|---|
Aug-23 | $12,393 | $10,289 |
|---|
Feb-24 | $13,193 | $10,535 |
|---|
Aug-24 | $13,634 | $11,046 |
|---|
Feb-25 | $13,837 | $11,150 |
|---|
Aug-25 | $14,228 | $11,393 |
|---|
Feb-26 | $14,555 | $11,845 |
|---|
Aug-26 | $14,908 | $11,610 |
|---|
|
|
| Average Annual Return [Table Text Block] |
Table SummaryName | 1 Year | 5 Years | Since Inception
(07/16/2018) |
|---|
Class Z | 4.77% | 4.88% | 5.02% |
|---|
ICE BofA US Broad Market Index | 1.90% | -0.30% | 1.83% |
|---|
|
|
| Performance Inception Date |
Jul. 16, 2018
|
|
| No Deduction of Taxes [Text Block] |
The graph and table do not reflect the deduction of taxes that a shareholder would pay on Fund distributions or redemption of Fund shares
|
|
| AssetsNet |
$ 576,119,792
|
|
| Holdings Count | Holding |
48
|
|
| Advisory Fees Paid, Amount |
$ 2,094,509
|
|
| InvestmentCompanyPortfolioTurnover |
38.00%
|
|
| Additional Fund Statistics [Text Block] |
Table SummaryTotal Net Assets | $576,119,792 |
|---|
Number of Portfolio Holdings | 48 |
|---|
Portfolio Turnover Rate | 38% |
|---|
Advisory Fees Paid | $2,094,509 |
|---|
|
|
| Holdings [Text Block] |
Asset Class Weightings (% of Total Investments)Table SummaryExchange Traded Funds (ETFs) | 34.7% |
|---|
Collateralized Mortgage Obligations | 24.4% |
|---|
Open-End Fund | 20.3% |
|---|
Asset-Backed Securities | 8.2% |
|---|
Collateralized Loan Obligations | 0.1% |
|---|
Short-Term Investments | 12.3% |
|---|
Total | 100.0% |
|---|
|
|
| Material Fund Change [Text Block] |
There were no material changes to the Fund. |
|
| C000226066 |
|
|
| Shareholder Report [Line Items] |
|
|
| Fund Name |
Destinations Shelter Fund
|
|
| Class Name |
Class I
|
|
| Trading Symbol |
DSHFX
|
|
| Annual or Semi-Annual Statement [Text Block] |
This semi-annual shareholder summary report contains important information about the Fund for the period of March 1, 2026 to August 31, 2026.
|
|
| Shareholder Report Annual or Semi-Annual |
Semi-Annual Shareholder Report
|
|
| Additional Information [Text Block] |
You can find additional information about the Fund at http://destinationsfunds.com/. You can also request this information by calling 1-877-771-7979.
|
|
| Additional Information Phone Number |
1-877-771-7979
|
|
| Additional Information Website |
http://destinationsfunds.com/
|
|
| Expenses [Text Block] |
What were the Fund's costs for the last 6 months?(based on a hypothetical $10,000 investment) Table SummaryClass name | Cost of a $10,000 investment | Cost paid as a % of a $10,000 investment |
|---|
Class I | $63 | 1.20%Footnote Reference* |
|---|
| Footnote | Description | Footnote* | Annualized |
|
|
| Expenses Paid, Amount |
$ 63
|
|
| Expense Ratio, Percent |
1.20%
|
[19] |
| Performance Past Does Not Indicate Future [Text] |
The Fund's past performance is not a good predictor of how the Fund will perform in the future
|
|
| Line Graph [Table Text Block] |
Table Summary | Class I | Russell 1000 Index |
|---|
Oct-21 | $10,000 | $10,000 |
|---|
Feb-22 | $9,567 | $9,474 |
|---|
Aug-22 | $8,894 | $8,579 |
|---|
Feb-23 | $8,748 | $8,697 |
|---|
Aug-23 | $9,748 | $9,900 |
|---|
Feb-24 | $10,577 | $11,289 |
|---|
Aug-24 | $11,597 | $12,533 |
|---|
Feb-25 | $12,131 | $13,334 |
|---|
Aug-25 | $12,699 | $14,568 |
|---|
Feb-26 | $13,258 | $15,566 |
|---|
Aug-26 | $14,211 | $17,449 |
|---|
|
|
| Average Annual Return [Table Text Block] |
Table SummaryName | 1 Year | Since Inception
(10/26/2021) |
|---|
Class I | 11.91% | 7.49% |
|---|
Russell 1000 Index | 19.77% | 12.15% |
|---|
|
|
| Performance Inception Date |
Oct. 26, 2021
|
|
| No Deduction of Taxes [Text Block] |
The graph and table do not reflect the deduction of taxes that a shareholder would pay on Fund distributions or redemption of Fund shares
|
|
| AssetsNet |
$ 88,373,903
|
|
| Holdings Count | Holding |
208
|
|
| Advisory Fees Paid, Amount |
$ 361,166
|
|
| InvestmentCompanyPortfolioTurnover |
4.00%
|
|
| Additional Fund Statistics [Text Block] |
Table SummaryTotal Net Assets | $88,373,903 |
|---|
Number of Portfolio Holdings | 208 |
|---|
Portfolio Turnover Rate | 4% |
|---|
Advisory Fees Paid | $361,166 |
|---|
|
|
| Holdings [Text Block] |
Asset Class Weightings (% of Total Investments)Table SummaryCommon Stocks | 99.2% |
|---|
Short-Term Investments | 0.2% |
|---|
Purchased Options | 0.6% |
|---|
Total | 100.0% |
|---|
Sector Allocation (% of Total Investments)Table SummaryTechnology | 35.7% |
|---|
Communications | 16.8% |
|---|
Financial | 13.8% |
|---|
Consumer Non-cyclical | 10.5% |
|---|
Industrial | 8.0% |
|---|
Consumer Cyclical | 6.5% |
|---|
Others | 8.5% |
|---|
Short-Term Investments | 0.2% |
|---|
Total | 100.0% |
|---|
|
|
| Material Fund Change [Text Block] |
There were no material changes to the Fund. |
|
| C000226067 |
|
|
| Shareholder Report [Line Items] |
|
|
| Fund Name |
Destinations Shelter Fund
|
|
| Class Name |
Class Z
|
|
| Trading Symbol |
DSHZX
|
|
| Annual or Semi-Annual Statement [Text Block] |
This semi-annual shareholder summary report contains important information about the Fund for the period of March 1, 2026 to August 31, 2026.
|
|
| Shareholder Report Annual or Semi-Annual |
Semi-Annual Shareholder Report
|
|
| Additional Information [Text Block] |
You can find additional information about the Fund at http://destinationsfunds.com/. You can also request this information by calling 1-877-771-7979.
|
|
| Additional Information Phone Number |
1-877-771-7979
|
|
| Additional Information Website |
http://destinationsfunds.com/
|
|
| Expenses [Text Block] |
What were the Fund's costs for the last 6 months?(based on a hypothetical $10,000 investment) Table SummaryClass name | Cost of a $10,000 investment | Cost paid as a % of a $10,000 investment |
|---|
Class Z | $55 | 1.05%Footnote Reference* |
|---|
| Footnote | Description | Footnote* | Annualized |
|
|
| Expenses Paid, Amount |
$ 55
|
|
| Expense Ratio, Percent |
1.05%
|
[20] |
| Performance Past Does Not Indicate Future [Text] |
The Fund's past performance is not a good predictor of how the Fund will perform in the future
|
|
| Line Graph [Table Text Block] |
Table Summary | Class Z | Russell 1000 Index |
|---|
Nov-21 | $10,000 | $10,000 |
|---|
Feb-22 | $9,449 | $9,304 |
|---|
Aug-22 | $8,791 | $8,425 |
|---|
Feb-23 | $8,652 | $8,540 |
|---|
Aug-23 | $9,648 | $9,722 |
|---|
Feb-24 | $10,477 | $11,087 |
|---|
Aug-24 | $11,496 | $12,308 |
|---|
Feb-25 | $12,041 | $13,095 |
|---|
Aug-25 | $12,608 | $14,307 |
|---|
Feb-26 | $13,179 | $15,286 |
|---|
Aug-26 | $14,132 | $17,135 |
|---|
|
|
| Average Annual Return [Table Text Block] |
Table SummaryName | 1 Year | Since Inception
(11/03/2021) |
|---|
Class Z | 12.09% | 7.40% |
|---|
Russell 1000 Index | 19.77% | 11.92% |
|---|
|
|
| Performance Inception Date |
Nov. 03, 2021
|
|
| No Deduction of Taxes [Text Block] |
The graph and table do not reflect the deduction of taxes that a shareholder would pay on Fund distributions or redemption of Fund shares
|
|
| AssetsNet |
$ 88,373,903
|
|
| Holdings Count | Holding |
208
|
|
| Advisory Fees Paid, Amount |
$ 361,166
|
|
| InvestmentCompanyPortfolioTurnover |
4.00%
|
|
| Additional Fund Statistics [Text Block] |
Table SummaryTotal Net Assets | $88,373,903 |
|---|
Number of Portfolio Holdings | 208 |
|---|
Portfolio Turnover Rate | 4% |
|---|
Advisory Fees Paid | $361,166 |
|---|
|
|
| Holdings [Text Block] |
Asset Class Weightings (% of Total Investments)Table SummaryCommon Stocks | 99.2% |
|---|
Short-Term Investments | 0.2% |
|---|
Purchased Options | 0.6% |
|---|
Total | 100.0% |
|---|
Sector Allocation (% of Total Investments)Table SummaryTechnology | 35.7% |
|---|
Communications | 16.8% |
|---|
Financial | 13.8% |
|---|
Consumer Non-cyclical | 10.5% |
|---|
Industrial | 8.0% |
|---|
Consumer Cyclical | 6.5% |
|---|
Others | 8.5% |
|---|
Short-Term Investments | 0.2% |
|---|
Total | 100.0% |
|---|
|
|
| Material Fund Change [Text Block] |
There were no material changes to the Fund. |
|
| C000176697 |
|
|
| Shareholder Report [Line Items] |
|
|
| Fund Name |
Destinations Real Assets Fund
|
|
| Class Name |
Class I
|
|
| Trading Symbol |
DRAFX
|
|
| Annual or Semi-Annual Statement [Text Block] |
This semi-annual shareholder summary report contains important information about the Fund for the period of March 1, 2026 to August 31, 2026.
|
|
| Shareholder Report Annual or Semi-Annual |
Semi-Annual Shareholder Report
|
|
| Additional Information [Text Block] |
You can find additional information about the Fund at http://destinationsfunds.com/. You can also request this information by calling 1-877-771-7979.
|
|
| Additional Information Phone Number |
1-877-771-7979
|
|
| Additional Information Website |
http://destinationsfunds.com/
|
|
| Expenses [Text Block] |
What were the Fund's costs for the last 6 months?(based on a hypothetical $10,000 investment) Table SummaryClass name | Cost of a $10,000 investment | Cost paid as a % of a $10,000 investment |
|---|
Class I | $54 | 1.07%Footnote Reference* |
|---|
| Footnote | Description | Footnote* | Annualized |
|
|
| Expenses Paid, Amount |
$ 54
|
|
| Expense Ratio, Percent |
1.07%
|
[21] |
| Performance Past Does Not Indicate Future [Text] |
The Fund's past performance is not a good predictor of how the Fund will perform in the future
|
|
| Line Graph [Table Text Block] |
Table Summary | Class I | FTSE All World Developed Index |
|---|
Mar-17 | $10,000 | $10,000 |
|---|
Aug-17 | $10,060 | $10,660 |
|---|
Feb-18 | $9,205 | $11,625 |
|---|
Aug-18 | $9,483 | $12,023 |
|---|
Feb-19 | $6,632 | $11,607 |
|---|
Aug-19 | $4,198 | $11,986 |
|---|
Feb-20 | $3,695 | $12,115 |
|---|
Aug-20 | $3,353 | $14,014 |
|---|
Feb-21 | $3,879 | $15,716 |
|---|
Aug-21 | $3,879 | $18,165 |
|---|
Feb-22 | $3,879 | $17,275 |
|---|
Aug-22 | $3,879 | $15,360 |
|---|
Feb-23 | $3,879 | $15,988 |
|---|
Aug-23 | $3,879 | $17,742 |
|---|
Feb-24 | $3,879 | $19,925 |
|---|
Aug-24 | $3,879 | $22,025 |
|---|
Feb-25 | $3,820 | $22,924 |
|---|
Aug-25 | $4,184 | $25,490 |
|---|
Feb-26 | $5,091 | $28,336 |
|---|
Aug-26 | $5,073 | $31,181 |
|---|
|
|
| Average Annual Return [Table Text Block] |
Table SummaryName | 1 Year | 5 Years | Since Inception
(03/20/2017) |
|---|
Class I | 21.25%Footnote Reference* | 5.51% | -6.92% |
|---|
FTSE All World Developed Index | 22.33% | 11.41% | 12.72% |
|---|
|
|
| Performance Inception Date |
Mar. 20, 2017
|
|
| No Deduction of Taxes [Text Block] |
The graph and table do not reflect the deduction of taxes that a shareholder would pay on Fund distributions or redemption of Fund shares
|
|
| AssetsNet |
$ 410,477,206
|
|
| Holdings Count | Holding |
303
|
|
| Advisory Fees Paid, Amount |
$ 1,510,937
|
|
| InvestmentCompanyPortfolioTurnover |
39.00%
|
|
| Additional Fund Statistics [Text Block] |
Table SummaryTotal Net Assets | $410,477,206 |
|---|
Number of Portfolio Holdings | 303 |
|---|
Portfolio Turnover Rate | 39% |
|---|
Advisory Fees Paid | $1,510,937 |
|---|
|
|
| Holdings [Text Block] |
Sector Allocation (% of Total Investments) Table SummaryFinancial | 28.0% |
|---|
Utilities | 16.8% |
|---|
Energy | 16.8% |
|---|
Industrial | 10.6% |
|---|
Exchange Traded Funds (ETFs) | 11.2% |
|---|
Others | 14.0% |
|---|
Short-Term Investments | 1.5% |
|---|
Money Market Fund | 1.1% |
|---|
Total | 100.0% |
|---|
Country Weightings (% of Total Investments) Table SummaryUnited States | 59.5% |
|---|
Canada | 9.4% |
|---|
United Kingdom | 6.1% |
|---|
Spain | 3.5% |
|---|
Australia | 2.5% |
|---|
Others | 16.4% |
|---|
Short-Term Investments | 1.5% |
|---|
Money Market Fund | 1.1% |
|---|
Total | 100.0% |
|---|
Asset Class Weightings (% of Total Investments)Table SummaryCommon Stocks | 85.8% |
|---|
Exchange Traded Funds (ETFs) | 11.2% |
|---|
Closed-End Funds | 0.2% |
|---|
Limited Partnerships | 0.2% |
|---|
Short-Term Investments | 1.5% |
|---|
Money Market Fund | 1.1% |
|---|
Total | 100.0% |
|---|
|
|
| Material Fund Change [Text Block] |
There were no material changes to the Fund. |
|
| C000202457 |
|
|
| Shareholder Report [Line Items] |
|
|
| Fund Name |
Destinations Real Assets Fund
|
|
| Class Name |
Class Z
|
|
| Trading Symbol |
DRAZX
|
|
| Annual or Semi-Annual Statement [Text Block] |
This semi-annual shareholder summary report contains important information about the Fund for the period of March 1, 2026 to August 31, 2026.
|
|
| Shareholder Report Annual or Semi-Annual |
Semi-Annual Shareholder Report
|
|
| Additional Information [Text Block] |
You can find additional information about the Fund at http://destinationsfunds.com/. You can also request this information by calling 1-877-771-7979.
|
|
| Additional Information Phone Number |
1-877-771-7979
|
|
| Additional Information Website |
http://destinationsfunds.com/
|
|
| Expenses [Text Block] |
What were the Fund's costs for the last 6 months?(based on a hypothetical $10,000 investment) Table SummaryClass name | Cost of a $10,000 investment | Cost paid as a % of a $10,000 investment |
|---|
Class Z | $46 | 0.92%Footnote Reference* |
|---|
| Footnote | Description | Footnote* | Annualized |
|
|
| Expenses Paid, Amount |
$ 46
|
|
| Expense Ratio, Percent |
0.92%
|
[22] |
| Performance Past Does Not Indicate Future [Text] |
The Fund's past performance is not a good predictor of how the Fund will perform in the future
|
|
| Line Graph [Table Text Block] |
Table Summary | Class Z | FTSE All World Developed Index |
|---|
Jul-18 | $10,000 | $10,000 |
|---|
Aug-18 | $9,320 | $10,217 |
|---|
Feb-19 | $6,521 | $9,863 |
|---|
Aug-19 | $4,133 | $10,185 |
|---|
Feb-20 | $3,806 | $10,295 |
|---|
Aug-20 | $3,444 | $11,908 |
|---|
Feb-21 | $3,994 | $13,355 |
|---|
Aug-21 | $3,994 | $15,436 |
|---|
Feb-22 | $3,994 | $14,679 |
|---|
Aug-22 | $3,994 | $13,052 |
|---|
Feb-23 | $3,994 | $13,586 |
|---|
Aug-23 | $3,994 | $15,076 |
|---|
Feb-24 | $3,994 | $16,931 |
|---|
Aug-24 | $3,994 | $18,716 |
|---|
Feb-25 | $3,926 | $19,479 |
|---|
Aug-25 | $4,308 | $21,660 |
|---|
Feb-26 | $5,247 | $24,078 |
|---|
Aug-26 | $5,247 | $26,495 |
|---|
|
|
| Average Annual Return [Table Text Block] |
Table SummaryName | 1 Year | 5 Years | Since Inception
(07/16/2018) |
|---|
Class Z | 21.79%Footnote Reference* | 5.61% | -7.61% |
|---|
FTSE All World Developed Index | 22.33% | 11.41% | 12.67% |
|---|
|
|
| Performance Inception Date |
Jul. 16, 2018
|
|
| No Deduction of Taxes [Text Block] |
The graph and table do not reflect the deduction of taxes that a shareholder would pay on Fund distributions or redemption of Fund shares
|
|
| AssetsNet |
$ 410,477,206
|
|
| Holdings Count | Holding |
303
|
|
| Advisory Fees Paid, Amount |
$ 1,510,937
|
|
| InvestmentCompanyPortfolioTurnover |
39.00%
|
|
| Additional Fund Statistics [Text Block] |
Table SummaryTotal Net Assets | $410,477,206 |
|---|
Number of Portfolio Holdings | 303 |
|---|
Portfolio Turnover Rate | 39% |
|---|
Advisory Fees Paid | $1,510,937 |
|---|
|
|
| Holdings [Text Block] |
Sector Allocation (% of Total Investments) Table SummaryFinancial | 28.0% |
|---|
Utilities | 16.8% |
|---|
Energy | 16.8% |
|---|
Industrial | 10.6% |
|---|
Exchange Traded Funds (ETFs) | 11.2% |
|---|
Others | 14.0% |
|---|
Short-Term Investments | 1.5% |
|---|
Money Market Fund | 1.1% |
|---|
Total | 100.0% |
|---|
Country Weightings (% of Total Investments) Table SummaryUnited States | 59.5% |
|---|
Canada | 9.4% |
|---|
United Kingdom | 6.1% |
|---|
Spain | 3.5% |
|---|
Australia | 2.5% |
|---|
Others | 16.4% |
|---|
Short-Term Investments | 1.5% |
|---|
Money Market Fund | 1.1% |
|---|
Total | 100.0% |
|---|
Asset Class Weightings (% of Total Investments)Table SummaryCommon Stocks | 85.8% |
|---|
Exchange Traded Funds (ETFs) | 11.2% |
|---|
Closed-End Funds | 0.2% |
|---|
Limited Partnerships | 0.2% |
|---|
Short-Term Investments | 1.5% |
|---|
Money Market Fund | 1.1% |
|---|
Total | 100.0% |
|---|
|
|
| Material Fund Change [Text Block] |
There were no material changes to the Fund. |
|
|
|