
Third Quarter 2026 Earnings Call November 5, 2026 1
FORWARD-LOOKING STATEMENTS This presentation includes forward-looking statements within the meaning of Section 27A of the Securities Act of 1933, as amended, (the “Securities Act”) and Section 21E of the Securities Exchange Act of 1934, as amended, (the “Exchange Act”). Forward-looking statements may include words such as “aim,” “estimate,” “plan,” “project,” “forecast,” “goal,” “intend,” “will,” “expect,” “anticipate,” “believe,” “seek,” “target” or other similar expressions that predict or indicate future events or trends or that are not statements of historical matters. These forward-looking statements include, but are not limited to, statements regarding projections, estimates and forecasts of revenue, contracted revenue, and other financial and performance metrics, projections of market opportunity and expectations, the Company’s ability to scale and grow its business, successfully complete construction of its data centers, source sufficient electrical energy, necessary long lead infrastructure components, supplies and equipment, the expected growth of the Company, the Company’s ability to source and retain talent, and our ability to source and acquire suitable additional land and power. These statements are provided for illustrative purposes only and are based on various assumptions, whether or not identified in this presentation, and on the current expectations of the Company’s management. These forward-looking statements are not intended to serve, and must not be relied on by any investor, as a guarantee, an assurance, a prediction or a definitive statement of fact or probability. Actual events and circumstances are difficult or impossible to predict and will differ from assumptions. Many actual events and circumstances are beyond the control of the Company. These forward-looking statements are not guarantees of future performance and are subject to risks, uncertainties and assumptions, known or unknown, that could cause actual results to vary materially from those indicated or anticipated. These risks, assumptions and uncertainties include those described in Part I. Item 1A. — “Risk Factors” of the Company’s Annual Report on Form 10-K for the year ended December 31, 2025, and the Company’s Quarterly Reports on Form 10-Q. If one or more of these risks or uncertainties materializes, or if underlying assumptions prove incorrect, actual results may vary materially from those indicated or anticipated by such forward-looking statements. There may be additional risks that the Company could not presently know or that the Company currently believes are immaterial that could also cause actual results to differ from those contained in the forward-looking statements. In addition, forward-looking statements reflect the Company’s expectations, plans or forecasts of future events and views as of the date of this press release and should not be relied upon as representing the Company’s assessments as of any date subsequent to the date of this press release. The Company anticipates that subsequent events and developments will cause the Company’s assessments to change. However, while the Company may elect to update these forward-looking statements at some point in the future, the Company specifically disclaims any obligation to do so. Accordingly, you should not place undue reliance on these forward-looking statements, which speak only as of the date they are made. 2
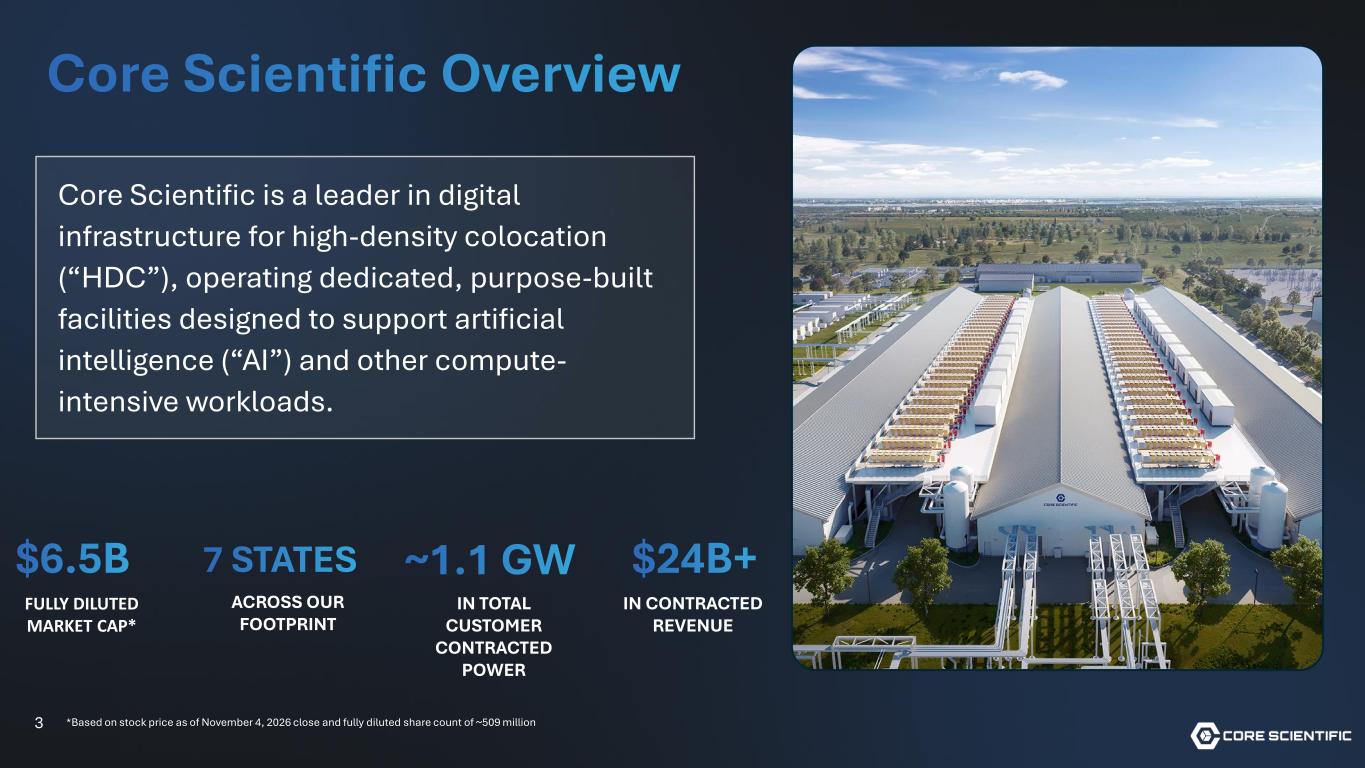
3 Core Scientific Overview Core Scientific is a leader in digital infrastructure for high-density colocation (“HDC”), operating dedicated, purpose-built facilities designed to support artificial intelligence (“AI”) and other compute- intensive workloads. FULLY DILUTED MARKET CAP* 7 STATES ~1.1 GW $24B+ IN TOTAL CUSTOMER CONTRACTED POWER IN CONTRACTED REVENUE ACROSS OUR FOOTPRINT *Based on stock price as of November 4, 2026 close and fully diluted share count of ~509 million $6.5B
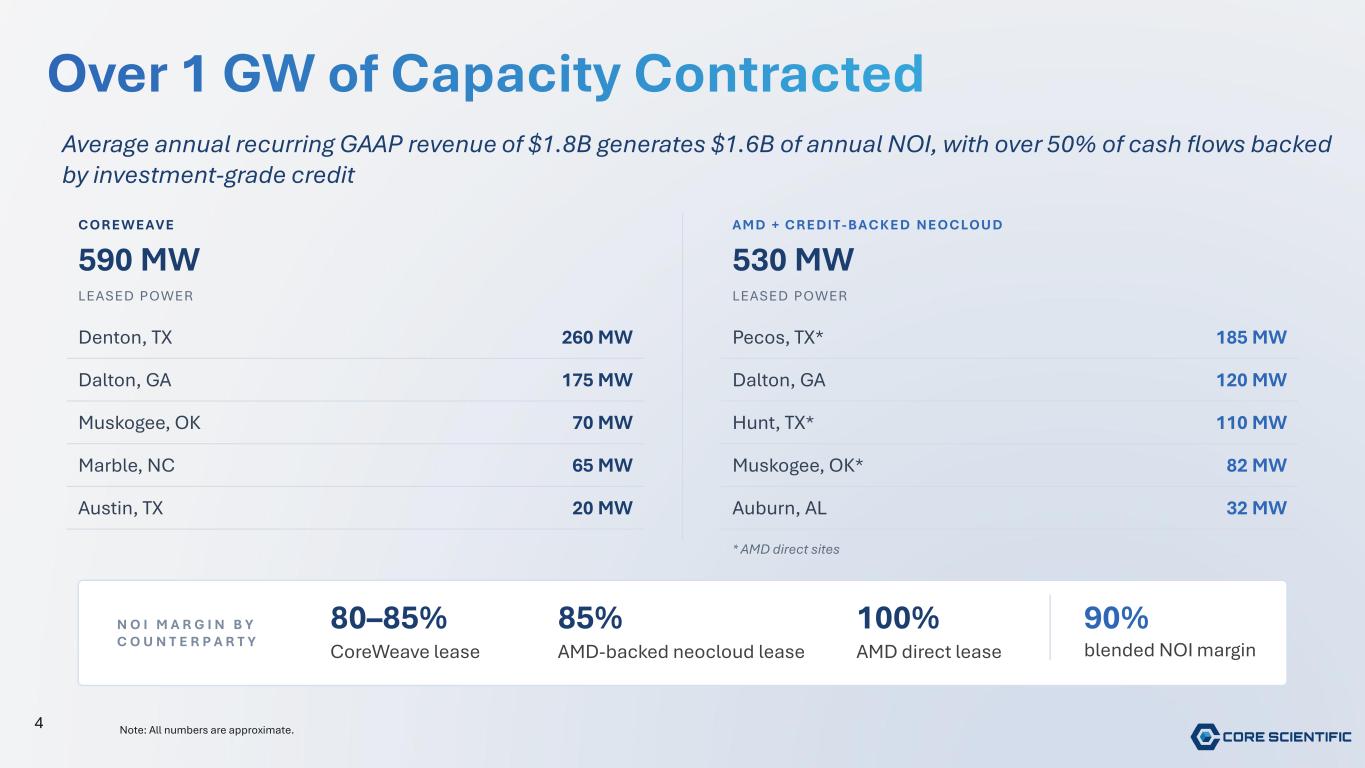
Over 1 GW of Capacity Contracted Average annual recurring GAAP revenue of $1.8B generates $1.6B of annual NOI, with over 50% of cash flows backed by investment-grade credit COREWEAVE 590 MW LEASED POWER Denton, TX 260 MW Dalton, GA 175 MW Muskogee, OK 70 MW Marble, NC 65 MW Austin, TX 20 MW AMD + CREDIT - B A CKE D NEOCLOU D 530 MW LEASED POWER Pecos, TX* 185 MW Dalton, GA 120 MW Hunt, TX* 110 MW Muskogee, OK* 82 MW Auburn, AL 32 MW * AMD direct sites 4 N O I M A R G I N B Y C O U N T E R P A R T Y 80–85% CoreWeave lease 85% AMD-backed neocloud lease 100% AMD direct lease 90% blended NOI margin Note: All numbers are approximate.
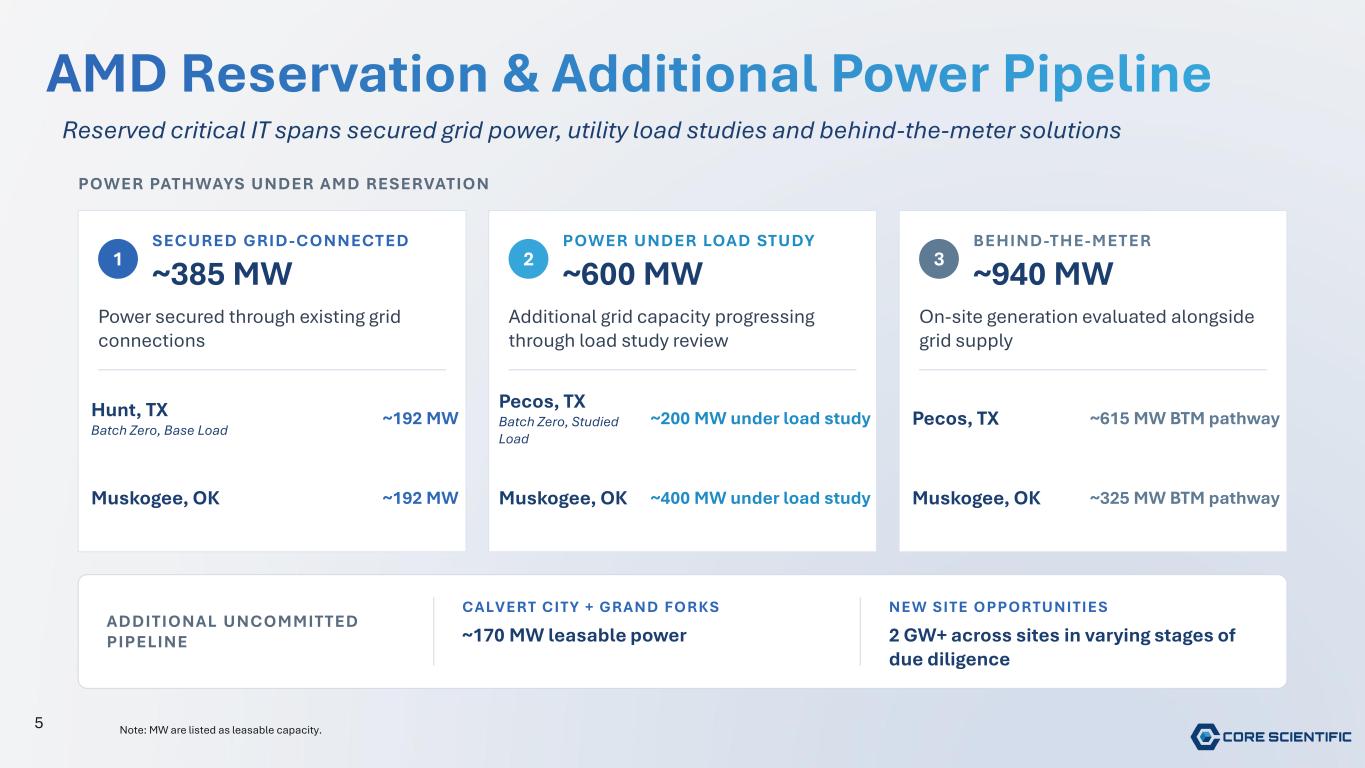
AMD Reservation & Additional Power Pipeline Reserved critical IT spans secured grid power, utility load studies and behind-the-meter solutions POWER PATHWAYS UNDER AMD RESERVATION 1 SECURED GRID-CONNECTED ~385 MW Power secured through existing grid connections Hunt, TX Batch Zero, Base Load ~192 MW Muskogee, OK ~192 MW 2 POWER UNDER LOAD STUDY ~600 MW Additional grid capacity progressing through load study review Pecos, TX Batch Zero, Studied Load ~200 MW under load study Muskogee, OK ~400 MW under load study 3 BEHIND-THE-METER ~940 MW On-site generation evaluated alongside grid supply Pecos, TX ~615 MW BTM pathway Muskogee, OK ~325 MW BTM pathway ADDITIONAL UNCOMMITTED PIPELINE CALVERT CITY + GRAND FORKS ~170 MW leasable power NEW SITE OPPORTUNITIES 2 GW+ across sites in varying stages of due diligence 5 Note: MW are listed as leasable capacity.
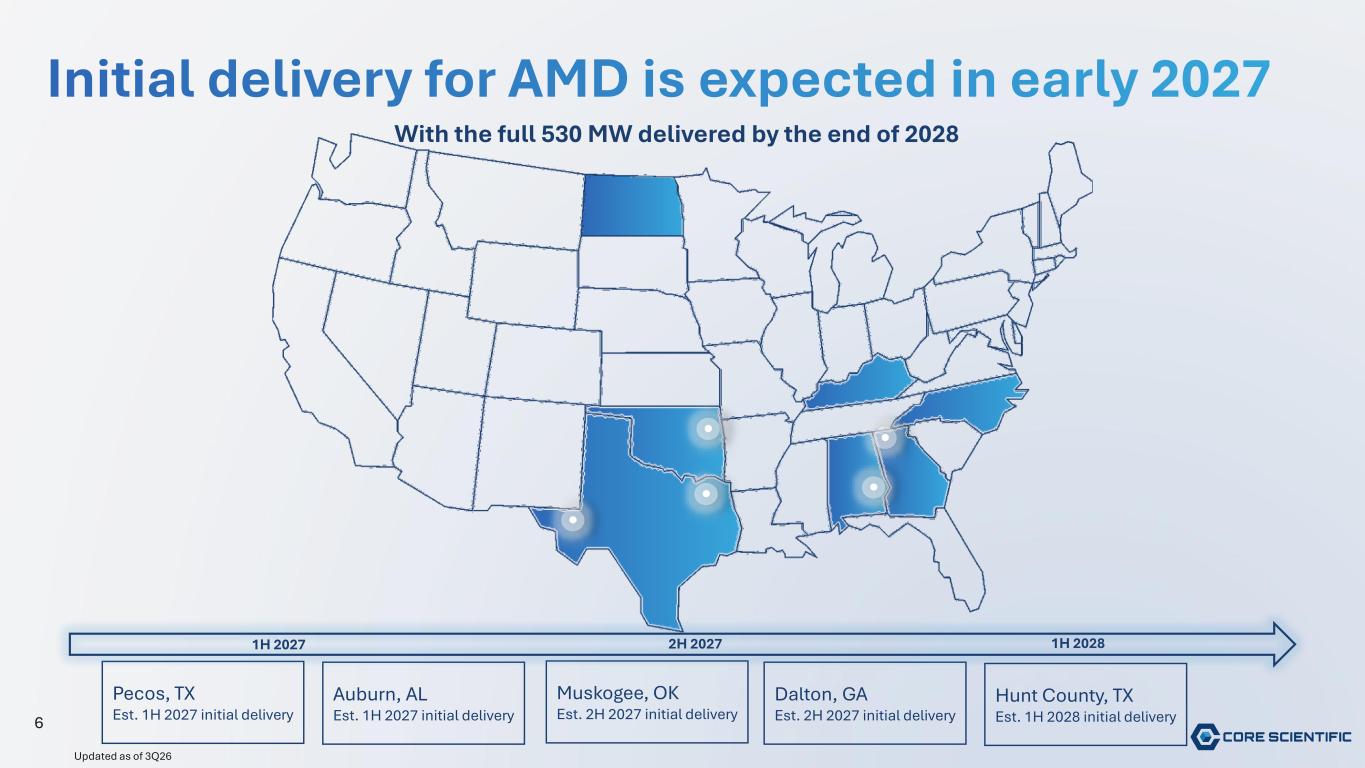
6 Initial delivery for AMD is expected in early 2027 Pecos, TX Est. 1H 2027 initial delivery Hunt County, TX Est. 1H 2028 initial delivery Dalton, GA Est. 2H 2027 initial delivery Muskogee, OK Est. 2H 2027 initial delivery Auburn, AL Est. 1H 2027 initial delivery 1H 2027 2H 2027 1H 2028 With the full 530 MW delivered by the end of 2028 Updated as of 3Q26
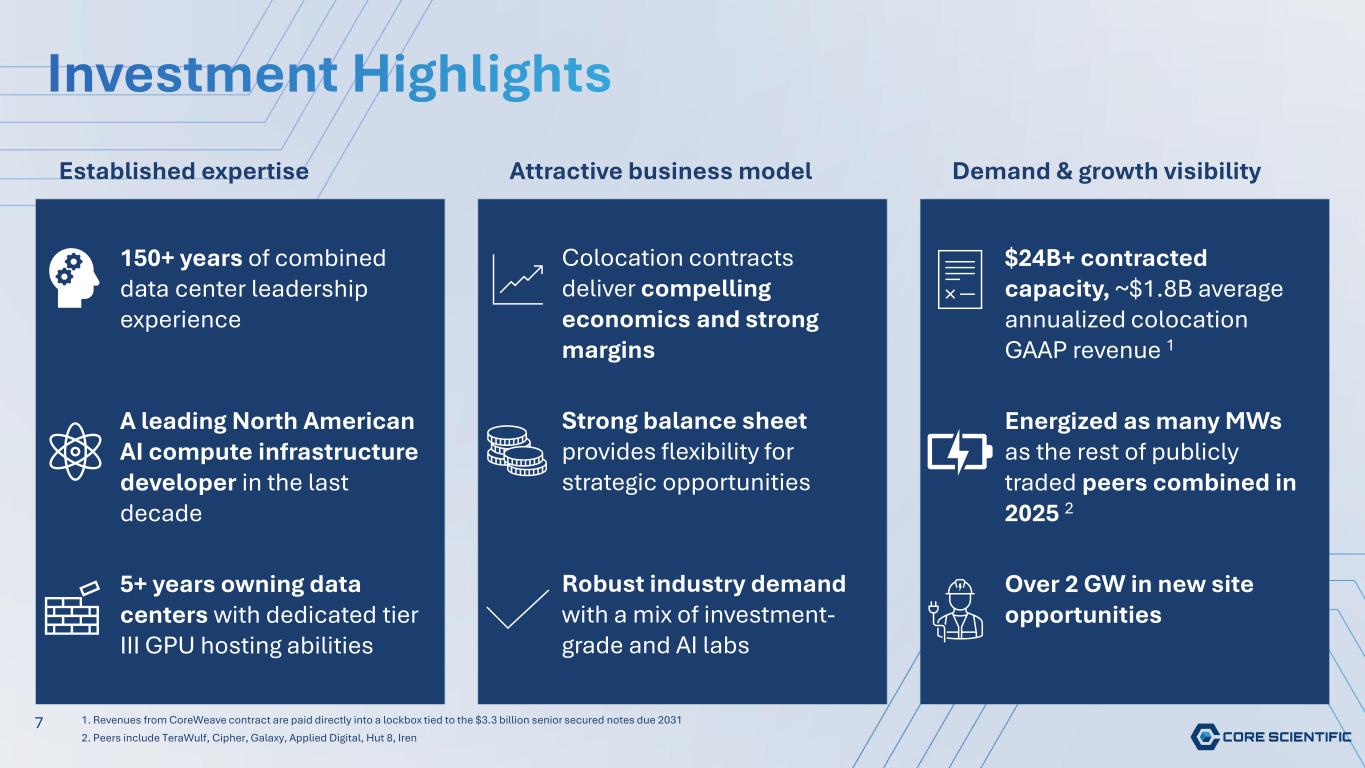
Investment Highlights Established expertise 150+ years of combined data center leadership experience Attractive business model Demand & growth visibility A leading North American AI compute infrastructure developer in the last decade 5+ years owning data centers with dedicated tier III GPU hosting abilities Colocation contracts deliver compelling economics and strong margins Strong balance sheet provides flexibility for strategic opportunities Robust industry demand with a mix of investment- grade and AI labs $24B+ contracted capacity, ~$1.8B average annualized colocation GAAP revenue 1 Energized as many MWs as the rest of publicly traded peers combined in 2025 2 Over 2 GW in new site opportunities 7 * 1. Revenues from CoreWeave contract are paid directly into a lockbox tied to the $3.3 billion senior secured notes due 2031 2. Peers include TeraWulf, Cipher, Galaxy, Applied Digital, Hut 8, Iren

CoreWeave Relationship Overview 8
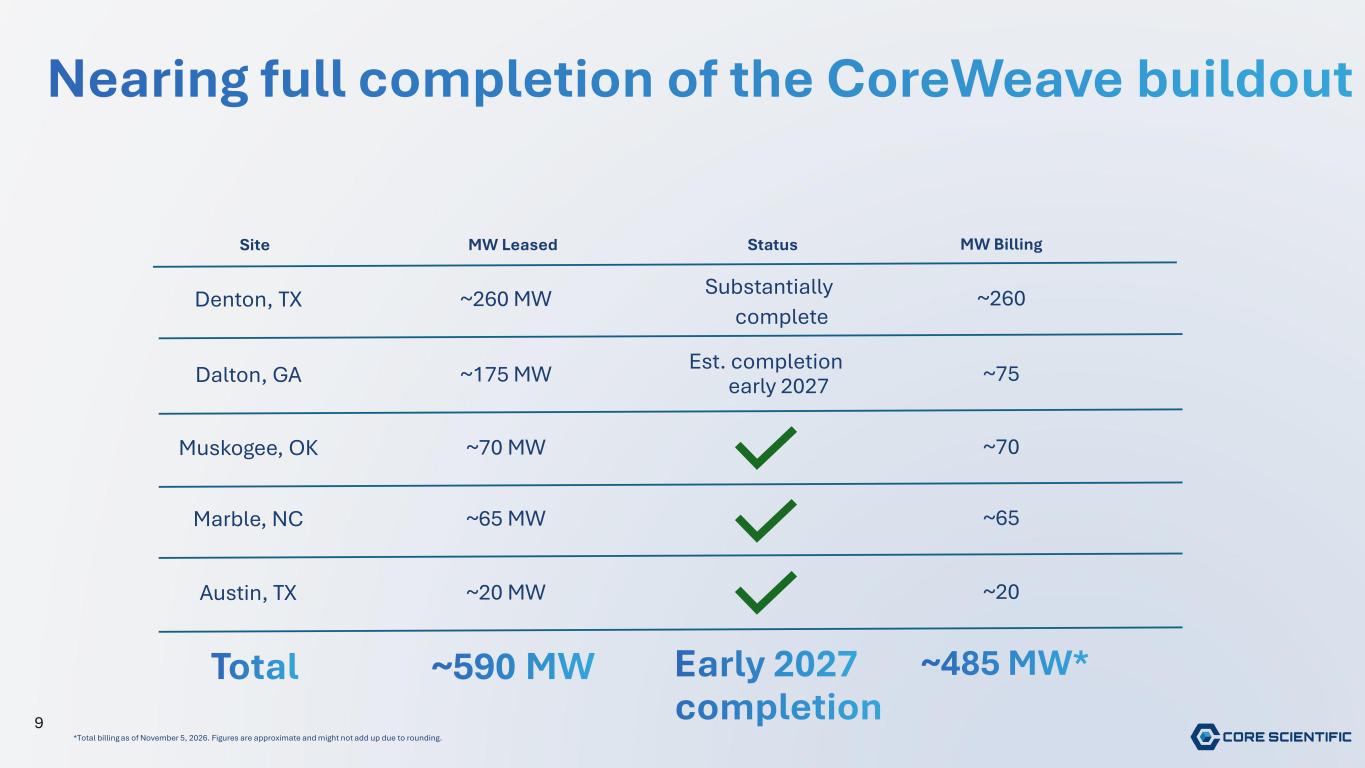
9 Nearing full completion of the CoreWeave buildout Site MW Leased Status MW Billing ~260 MW ~260Denton, TX ~175 MW Est. completion early 2027 ~75Dalton, GA ~70 MW ~70Muskogee, OK ~65 MW ~65Marble, NC ~20 MW ~20Austin, TX Total ~590 MW Early 2027 completion ~485 MW* *Total billing as of November 5, 2026. Figures are approximate and might not add up due to rounding. Substantially complete
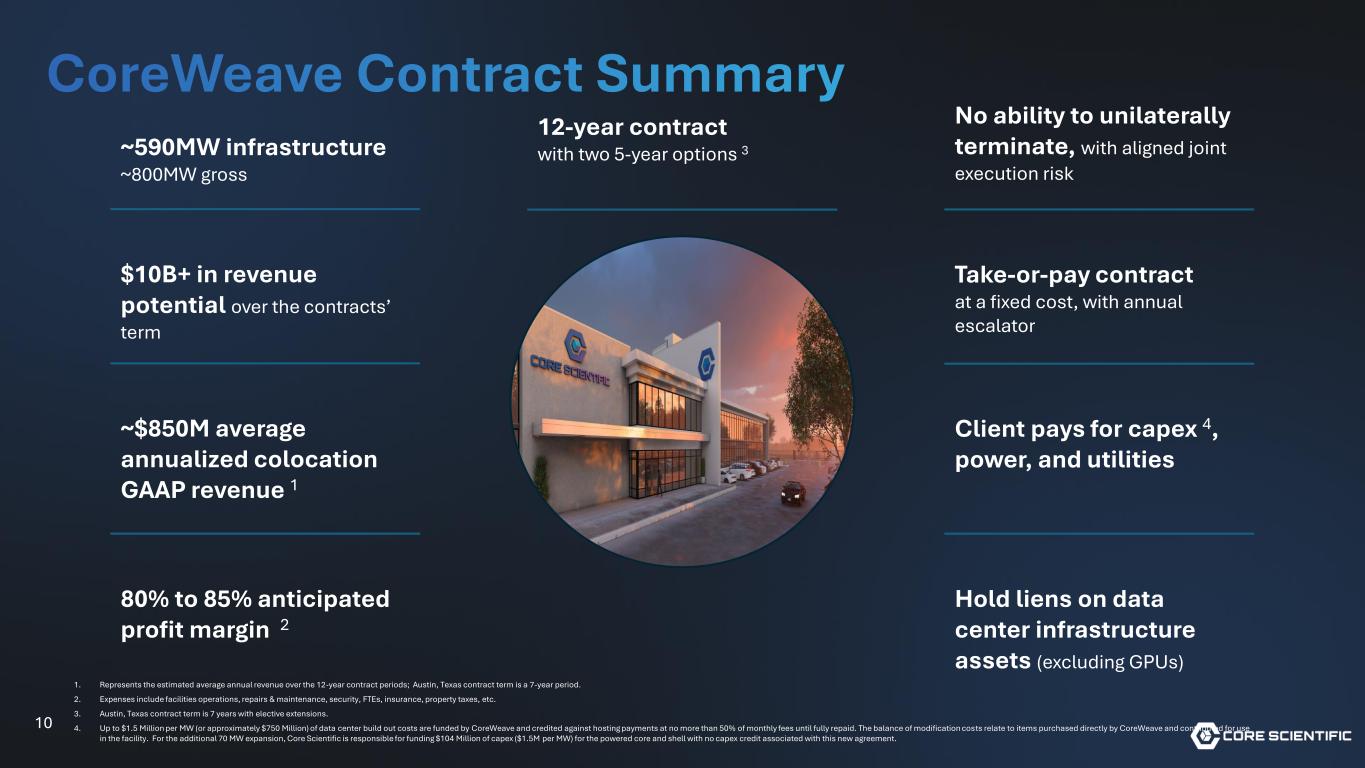
10 CoreWeave Contract Summary ~590MW infrastructure ~800MW gross $10B+ in revenue potential over the contracts’ term ~$850M average annualized colocation GAAP revenue 1 No ability to unilaterally terminate, with aligned joint execution risk Take-or-pay contract at a fixed cost, with annual escalator Client pays for capex 4, power, and utilities 1. Represents the estimated average annual revenue over the 12-year contract periods; Austin, Texas contract term is a 7-year period. 2. Expenses include facilities operations, repairs & maintenance, security, FTEs, insurance, property taxes, etc. 3. Austin, Texas contract term is 7 years with elective extensions. 4. Up to $1.5 Million per MW (or approximately $750 Million) of data center build out costs are funded by CoreWeave and credited against hosting payments at no more than 50% of monthly fees until fully repaid. The balance of modification costs relate to items purchased directly by CoreWeave and contributed for use in the facility. For the additional 70 MW expansion, Core Scientific is responsible for funding $104 Million of capex ($1.5M per MW) for the powered core and shell with no capex credit associated with this new agreement. 12-year contract with two 5-year options 3 80% to 85% anticipated profit margin 2 Hold liens on data center infrastructure assets (excluding GPUs)
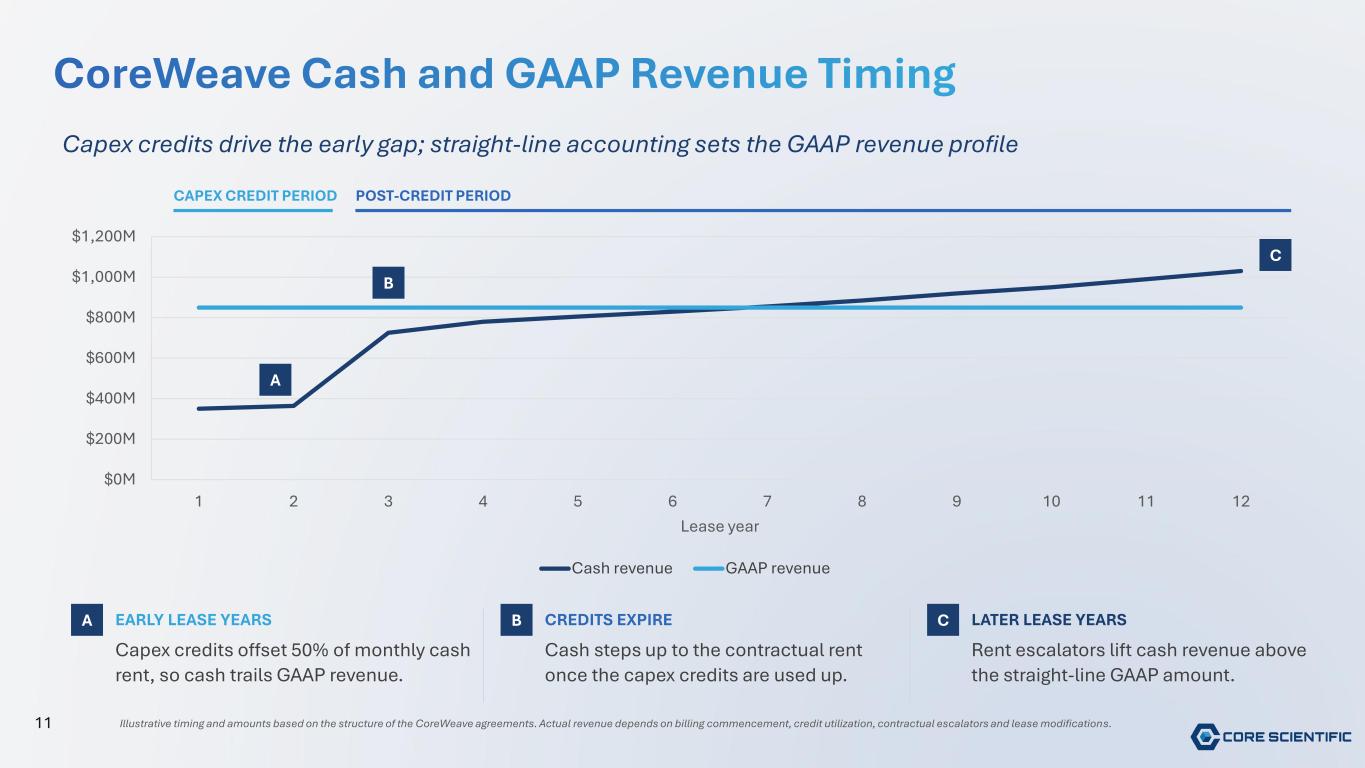
CoreWeave Cash and GAAP Revenue Timing $0M $200M $400M $600M $800M $1,000M $1,200M 1 2 3 4 5 6 7 8 9 10 11 12 Lease year Cash revenue GAAP revenue Illustrative timing and amounts based on the structure of the CoreWeave agreements. Actual revenue depends on billing commencement, credit utilization, contractual escalators and lease modifications. EARLY LEASE YEARS Capex credits offset 50% of monthly cash rent, so cash trails GAAP revenue. CREDITS EXPIRE Cash steps up to the contractual rent once the capex credits are used up. LATER LEASE YEARS Rent escalators lift cash revenue above the straight-line GAAP amount. CAPEX CREDIT PERIOD POST-CREDIT PERIOD A B C A B C Capex credits drive the early gap; straight-line accounting sets the GAAP revenue profile 11
12 Appendix
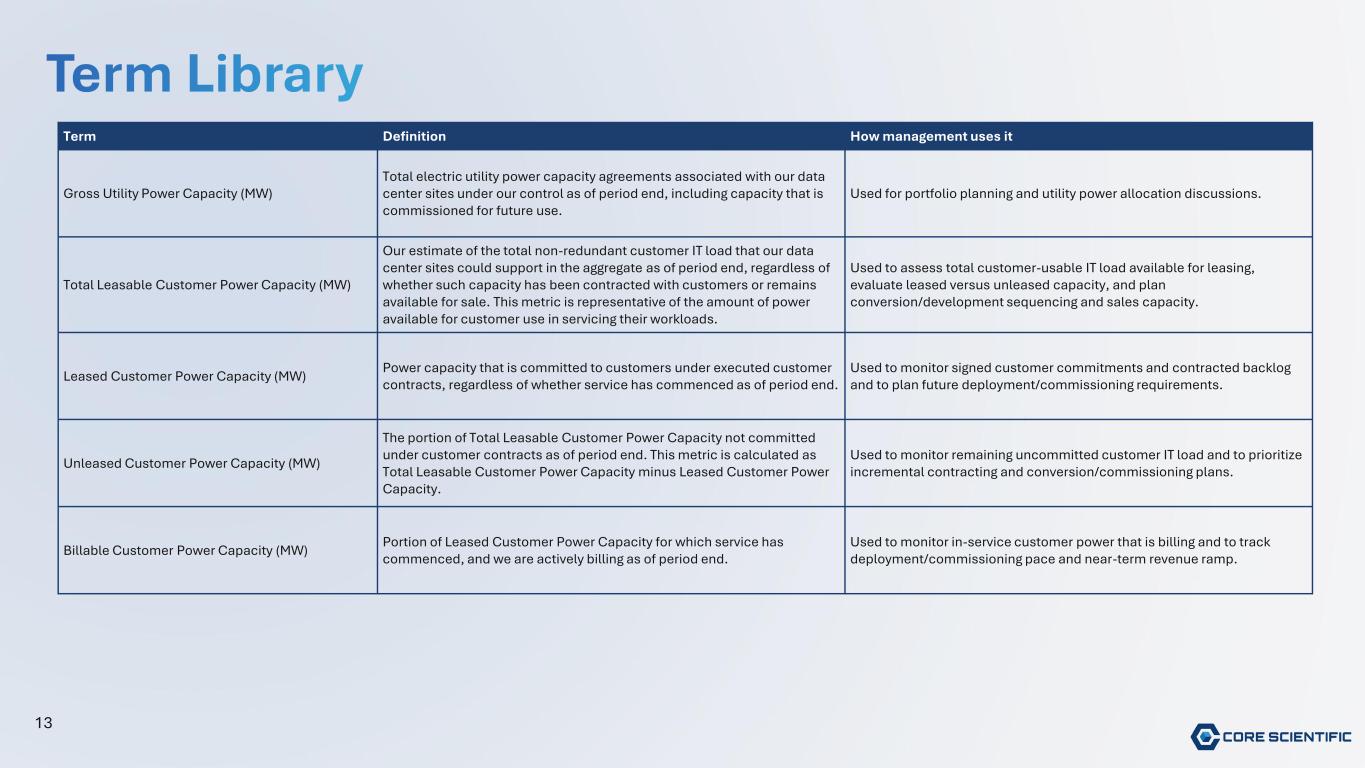
13 Term Library Term Definition How management uses it Gross Utility Power Capacity (MW) Total electric utility power capacity agreements associated with our data center sites under our control as of period end, including capacity that is commissioned for future use. Used for portfolio planning and utility power allocation discussions. Total Leasable Customer Power Capacity (MW) Our estimate of the total non-redundant customer IT load that our data center sites could support in the aggregate as of period end, regardless of whether such capacity has been contracted with customers or remains available for sale. This metric is representative of the amount of power available for customer use in servicing their workloads. Used to assess total customer-usable IT load available for leasing, evaluate leased versus unleased capacity, and plan conversion/development sequencing and sales capacity. Leased Customer Power Capacity (MW) Power capacity that is committed to customers under executed customer contracts, regardless of whether service has commenced as of period end. Used to monitor signed customer commitments and contracted backlog and to plan future deployment/commissioning requirements. Unleased Customer Power Capacity (MW) The portion of Total Leasable Customer Power Capacity not committed under customer contracts as of period end. This metric is calculated as Total Leasable Customer Power Capacity minus Leased Customer Power Capacity. Used to monitor remaining uncommitted customer IT load and to prioritize incremental contracting and conversion/commissioning plans. Billable Customer Power Capacity (MW) Portion of Leased Customer Power Capacity for which service has commenced, and we are actively billing as of period end. Used to monitor in-service customer power that is billing and to track deployment/commissioning pace and near-term revenue ramp.
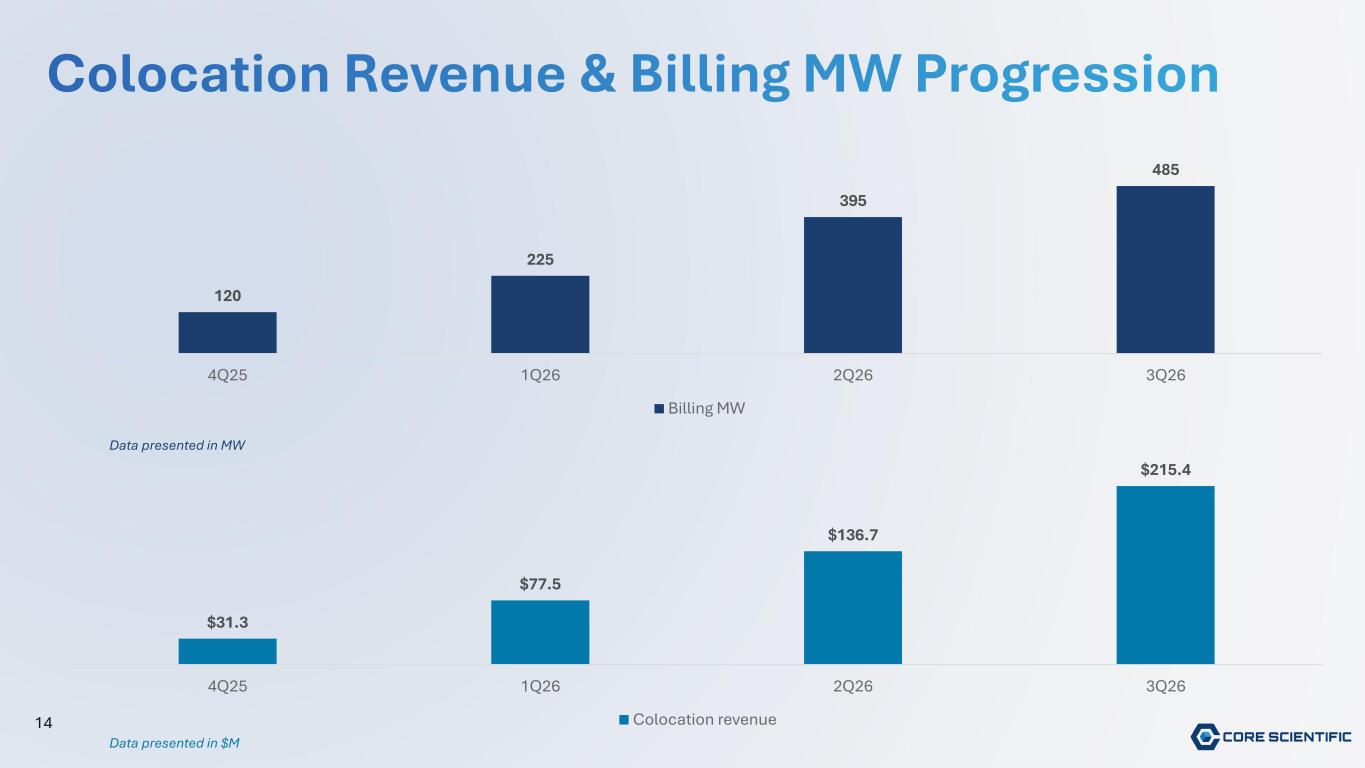
14 Colocation Revenue & Billing MW Progression 120 225 395 485 4Q25 1Q26 2Q26 3Q26 Billing MW $31.3 $77.5 $136.7 $215.4 4Q25 1Q26 2Q26 3Q26 Colocation revenue Data presented in MW Data presented in $M
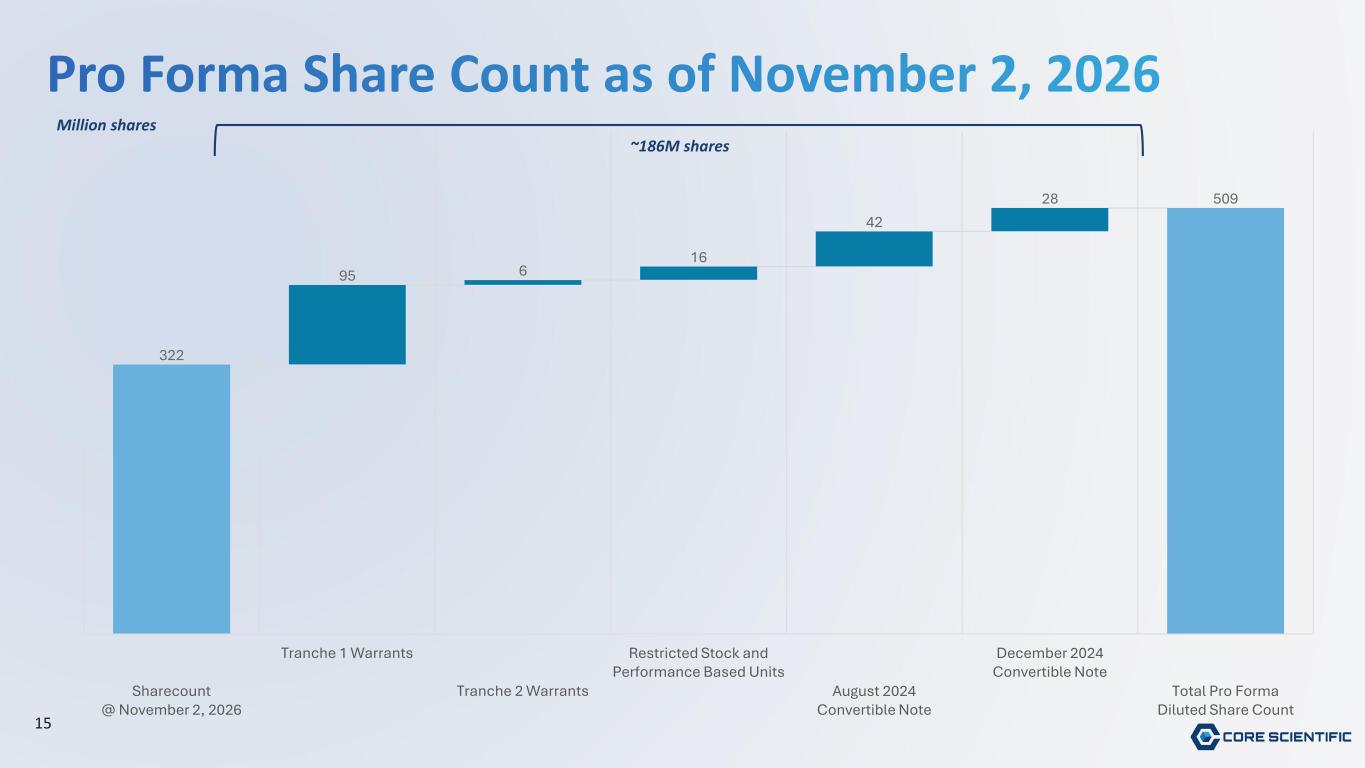
322 95 6 16 42 28 509 Sharecount @ November 2, 2026 Tranche 1 Warrants Tranche 2 Warrants Restricted Stock and Performance Based Units August 2024 Convertible Note December 2024 Convertible Note Total Pro Forma Diluted Share Count 15 Pro Forma Share Count as of November 2, 2026 Million shares ~186M shares

Contact ir@corescientific.com 16