Exhibit 99.1
|
|
|
| Announcement
Thursday, 5 November 2026 |
|

Woodside Energy Group
Ltd ACN 004 898 962 Mia
Yellagonga 11 Mount Street Perth
WA 6000 Australia T +61 8
9348 4000 www.woodside.com
ASX: WDS NYSE: WDS |
CAPITAL MARKETS DAY 2026
Woodside today outlined a clear plan to build on its strong foundations by sharpening operational and project execution and maximising value from its global LNG-led portfolio.
Supported by a new capital framework and shareholder distribution policy, the company is targeting
portfolio return on average capital employed of 12-15% by the mid-2030s.
At its Capital Markets Day in Sydney, Woodside CEO and Managing Director Liz Westcott said the company is entering its next phase from a position of strength,
giving Woodside greater capacity to invest in value-accretive growth opportunities and return capital to shareholders.
“Long-term demand for
reliable energy remains compelling. Woodside’s multi-basin LNG position and deepwater oil capability, combined with sharper execution and capital discipline, position us to meet that demand and deliver value for shareholders.
“Woodside has world-class assets, deep operating and project capabilities and enduring customer relationships. We have returned nearly
US$13 billion to shareholders since 2022 while building a portfolio positioned to generate strong cash flows into the next decade.
“Scarborough is 99% complete and on track for first LNG cargo this year, Trion is targeted for first oil in 2028 and Louisiana LNG is targeted for first
LNG in 2029. Together with our base business, these projects are expected to support sales volume growth of more than 30% to approximately 280 million barrels of oil equivalent in 2032, and generate more than US$40 billion of adjusted
operating cash flow from 2027 to 2032.1
“Our priority now is to extract more value from our
portfolio. We are targeting US$400 million of annual structural cost reductions from 2028, improving operational efficiency and productivity, and actively managing the portfolio to concentrate capital where it earns the highest returns.
“We announced a new distribution policy of 20 – 40% of adjusted operating cash flows. We will prioritise 20% of adjusted operating cash flow as a
base dividend, with up to another 20% available for additional dividends and/or buybacks. We also announced our new capital framework under which growth must compete for capital against these additional distributions.
| 1 |
In the attached Capital Markets Day 2026 presentation, refer to slides 18, 38, 60 and 61 and the
‘Disclaimer, important notes and assumptions’ for further details on the underlying assumptions. |
“We are targeting portfolio return on average capital employed of 12–15% by the mid-2030s. Delivery of our committed projects, the structural cost program, active portfolio management and increased value capture through marketing and trading will support this improvement.2
“We have set a new 2035 net equity Scope 1 and 2 greenhouse gas (GHG) emissions intensity target
of 30% below Woodside’s 2025 gross equity Scope 1 and 2 GHG emissions intensity baseline.3 The new target reflects our focus on improving operational efficiency where safe, technically and
commercially appropriate.”
Webcast
Woodside’s Capital Markets Day in Sydney will be webcast live on Thursday, 5 November 2026, commencing at 10:00 am AEDT/7:00 am AWST/5:00 pm CST
(Wednesday, 4 November). The webcast can be accessed at https://meetings.lumiconnect.com/300-191-159-742.
A copy of Woodside’s Capital Markets Day 2026 presentation slides is attached to this announcement.
Woodside will also host a Capital Markets Day in New York on Thursday, 12 November 2026, commencing at 1:00 pm EST (6:00 pm GMT), providing a further
opportunity to engage with US and international investors. The New York webcast can be accessed at
https://meetings.lumiconnect.com/300-755-788-108.
Climate Transition Plan
Woodside’s approach to
climate is an integral part of its company strategy. Woodside’s Climate Transition Plan (CTP) explains how climate-related risks and opportunities are integrated into strategy, capital allocation, operations, stakeholder engagement and
governance.
Progress against the CTP, including relevant metrics, targets, assumptions and performance information, will be included in Woodside’s
Annual Report.
A copy of the refreshed CTP published today is available on Woodside’s website.
Woodside will host a question-and-answer session on its CTP on Monday,
23 November 2026. Further details will be provided on Woodside’s website in advance of the session.
|
|
|
| INVESTORS |
|
MEDIA |
| Vanessa Martin |
|
Christine Abbott |
| M: +61 477 397 961 |
|
M: +61 484 112 469 |
| E: investor@woodside.com |
|
E: christine.abbott@woodside.com |
This announcement was approved and authorised for release by Woodside’s Disclosure Committee.
| 2 |
In the attached Capital Markets Day 2026 presentation, refer to slides 8, 33, 60 and 61 and the
‘Disclaimer, important notes and assumptions’ for further details on the underlying assumptions. |
| 3 |
2035 net equity Scope 1 and 2 GHG emissions intensity target is 30% below Woodside’s 2025 gross equity
Scope 1 and 2 GHG emissions intensity baseline of 33.3 kg CO₂-e/boe. Net intensity includes the utilisation of carbon credits used to meet regulatory obligations. The target may be reviewed and, where appropriate, adjusted to reflect material
changes in regulatory requirements or portfolio. |
Forward-looking statements
This announcement contains forward-looking statements with respect to Woodside’s business and operations, market conditions, results of operations and
financial condition, including, for example, but not limited to, outcomes of transactions, statements regarding long-term demand for Woodside’s products and services, development, completion and execution of Woodside’s projects,
expectations regarding future capital expenditures and cash flow, the payment of future dividends and the amount thereof, future results of projects, operating activities and new energy products, expectations and plans for new energy products and
lower-carbon services and investments in, and development of, new energy products and lower-carbon services, expectations and guidance with respect to production, capital and exploration expenditure and gas hub exposure, trends in commodity prices
and currency exchange rates, adoption and implementation of new technologies and expectations regarding the achievement of Woodside’s net equity Scope 1 and 2 greenhouse gas emissions reduction and intensity targets and broader sustainability
plans. All forward-looking statements contained in this announcement reflect Woodside’s views held as at the date of this announcement. All statements, other than statements of historical or present facts, are forward-looking statements and
generally may be identified by the use of forward-looking words such as “aim”, “anticipate”, “aspire”, “believe”, “enable”, “estimate”, “expect”,
“forecast”, “foresee”, “guidance”, “intend”, “likely”, “may”, “objective”, “outlook”, “pathway”, “plan”, “position”,
“potential”, “project”, “schedule”, “seek”, “should”, “strategy”, “strive”, “target”, “will” and other similar words or expressions.
Forward-looking statements in this announcement are not guarantees or assurances of future events or performance and are based on Woodside’s current
expectations and the judgements, estimates, contingencies and assumptions that underpin them. Those statements and any assumptions on which they are based are only opinions, are subject to change without notice and are subject to inherent known and
unknown risks, uncertainties, assumptions and other factors, many of which are beyond the control of Woodside, its related bodies corporate and their respective officers, directors, employees, advisers or representatives.
A more detailed summary of the key risks relating to Woodside and its business can be found in the “Risk” section of Woodside’s most recent
Annual Report released to the Australian Securities Exchange and Woodside’s most recent Annual Report on Form 20-F filed with the United States Securities and Exchange Commission and available on the
Woodside website at https://www.woodside.com/investors/reports-investor-briefings. You should review and have regard to these risks when considering the information contained in this announcement.
Investors are strongly cautioned that forward-looking statements are subject to significant uncertainties and may not provide to be correct. Actual results or
performance may vary materially from those expressed in, or implied by, any forward-looking statements.
All information included in this announcement,
including any forward-looking statements, reflects Woodside’s views held as at the date of this announcement and, except as required by applicable law or regulation, Woodside does not undertake to provide additional information or to update or
revise any information, forward-looking statements or the assumptions on which they are based as contained in this announcement, whether as a result of new information, future events, or otherwise.
5 November 2026 Capital Markets Day
2026
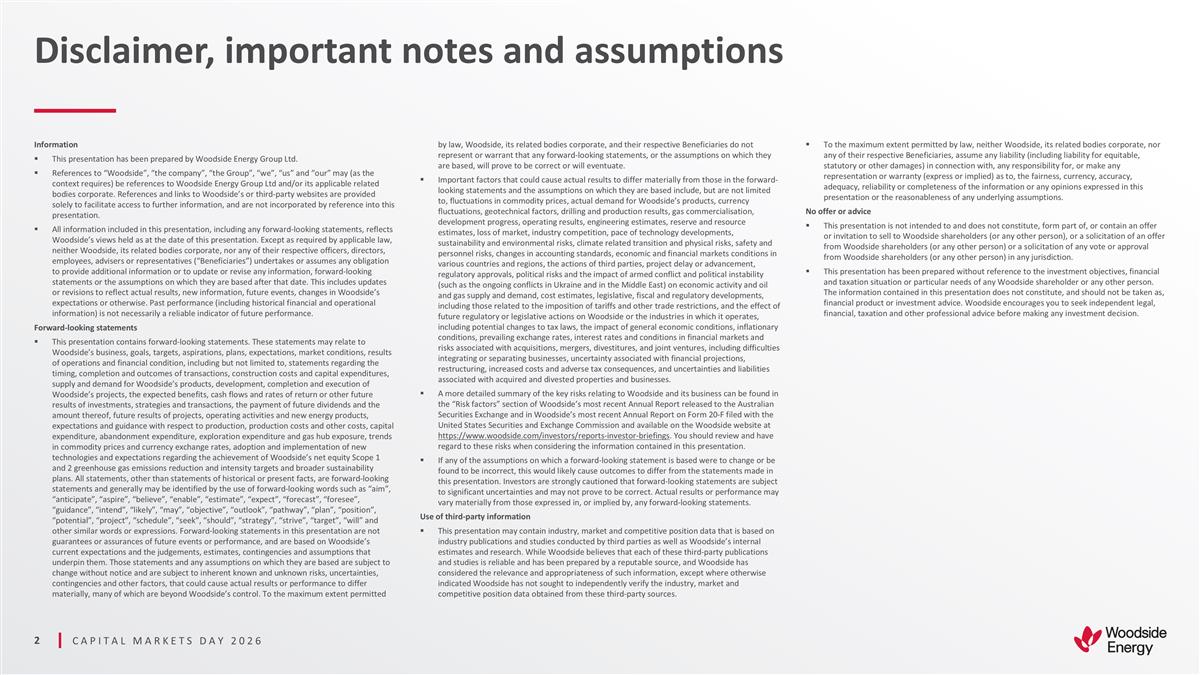
Disclaimer, important notes and
assumptions Information This presentation has been prepared by Woodside Energy Group Ltd. References to “Woodside”, “the company”, “the Group”, “we”, “us” and “our” may (as the
context requires) be references to Woodside Energy Group Ltd and/or its applicable related bodies corporate. References and links to Woodside’s or third-party websites are provided solely to facilitate access to further information, and are
not incorporated by reference into this presentation. All information included in this presentation, including any forward-looking statements, reflects Woodside’s views held as at the date of this presentation. Except as required by applicable
law, neither Woodside, its related bodies corporate, nor any of their respective officers, directors, employees, advisers or representatives (“Beneficiaries”) undertakes or assumes any obligation to provide additional information or to
update or revise any information, forward-looking statements or the assumptions on which they are based after that date. This includes updates or revisions to reflect actual results, new information, future events, changes in Woodside’s
expectations or otherwise. Past performance (including historical financial and operational information) is not necessarily a reliable indicator of future performance. Forward-looking statements This presentation contains forward-looking statements.
These statements may relate to Woodside’s business, goals, targets, aspirations, plans, expectations, market conditions, results of operations and financial condition, including but not limited to, statements regarding the timing, completion
and outcomes of transactions, construction costs and capital expenditures, supply and demand for Woodside’s products, development, completion and execution of Woodside’s projects, the expected benefits, cash flows and rates of return or
other future results of investments, strategies and transactions, the payment of future dividends and the amount thereof, future results of projects, operating activities and new energy products, expectations and guidance with respect to production,
production costs and other costs, capital expenditure, abandonment expenditure, exploration expenditure and gas hub exposure, trends in commodity prices and currency exchange rates, adoption and implementation of new technologies and expectations
regarding the achievement of Woodside’s net equity Scope 1 and 2 greenhouse gas emissions reduction and intensity targets and broader sustainability plans. All statements, other than statements of historical or present facts, are
forward-looking statements and generally may be identified by the use of forward-looking words such as “aim”, “anticipate”, “aspire”, “believe”, “enable”, “estimate”,
“expect”, “forecast”, “foresee”, “guidance”, “intend”, “likely”, “may”, “objective”, “outlook”, “pathway”, “plan”,
“position”, “potential”, “project”, “schedule”, “seek”, “should”, “strategy”, “strive”, “target”, “will” and other similar words
or expressions. Forward-looking statements in this presentation are not guarantees or assurances of future events or performance, and are based on Woodside’s current expectations and the judgements, estimates, contingencies and assumptions
that underpin them. Those statements and any assumptions on which they are based are subject to change without notice and are subject to inherent known and unknown risks, uncertainties, contingencies and other factors, that could cause actual
results or performance to differ materially, many of which are beyond Woodside’s control. To the maximum extent permitted by law, Woodside, its related bodies corporate, and their respective Beneficiaries do not represent or warrant that any
forward-looking statements, or the assumptions on which they are based, will prove to be correct or will eventuate. Important factors that could cause actual results to differ materially from those in the forward-looking statements and the
assumptions on which they are based include, but are not limited to, fluctuations in commodity prices, actual demand for Woodside’s products, currency fluctuations, geotechnical factors, drilling and production results, gas commercialisation,
development progress, operating results, engineering estimates, reserve and resource estimates, loss of market, industry competition, pace of technology developments, sustainability and environmental risks, climate related transition and physical
risks, safety and personnel risks, changes in accounting standards, economic and financial markets conditions in various countries and regions, the actions of third parties, project delay or advancement, regulatory approvals, political risks and the
impact of armed conflict and political instability (such as the ongoing conflicts in Ukraine and in the Middle East) on economic activity and oil and gas supply and demand, cost estimates, legislative, fiscal and regulatory developments, including
those related to the imposition of tariffs and other trade restrictions, and the effect of future regulatory or legislative actions on Woodside or the industries in which it operates, including potential changes to tax laws, the impact of general
economic conditions, inflationary conditions, prevailing exchange rates, interest rates and conditions in financial markets and risks associated with acquisitions, mergers, divestitures, and joint ventures, including difficulties integrating or
separating businesses, uncertainty associated with financial projections, restructuring, increased costs and adverse tax consequences, and uncertainties and liabilities associated with acquired and divested properties and businesses. A more detailed
summary of the key risks relating to Woodside and its business can be found in the “Risk factors” section of Woodside’s most recent Annual Report released to the Australian Securities Exchange and in Woodside’s most recent
Annual Report on Form 20-F filed with the United States Securities and Exchange Commission and available on the Woodside website at https://www.woodside.com/investors/reports-investor-briefings. You should review and have regard to these risks when
considering the information contained in this presentation. If any of the assumptions on which a forward-looking statement is based were to change or be found to be incorrect, this would likely cause outcomes to differ from the statements made in
this presentation. Investors are strongly cautioned that forward-looking statements are subject to significant uncertainties and may not prove to be correct. Actual results or performance may vary materially from those expressed in, or implied by,
any forward-looking statements. Use of third-party information This presentation may contain industry, market and competitive position data that is based on industry publications and studies conducted by third parties as well as Woodside’s
internal estimates and research. While Woodside believes that each of these third-party publications and studies is reliable and has been prepared by a reputable source, and Woodside has considered the relevance and appropriateness of such
information, except where otherwise indicated Woodside has not sought to independently verify the industry, market and competitive position data obtained from these third-party sources. To the maximum extent permitted by law, neither Woodside, its
related bodies corporate, nor any of their respective Beneficiaries, assume any liability (including liability for equitable, statutory or other damages) in connection with, any responsibility for, or make any representation or warranty (express or
implied) as to, the fairness, currency, accuracy, adequacy, reliability or completeness of the information or any opinions expressed in this presentation or the reasonableness of any underlying assumptions. No offer or advice This presentation is
not intended to and does not constitute, form part of, or contain an offer or invitation to sell to Woodside shareholders (or any other person), or a solicitation of an offer from Woodside shareholders (or any other person) or a solicitation of any
vote or approval from Woodside shareholders (or any other person) in any jurisdiction. This presentation has been prepared without reference to the investment objectives, financial and taxation situation or particular needs of any Woodside
shareholder or any other person. The information contained in this presentation does not constitute, and should not be taken as, financial product or investment advice. Woodside encourages you to seek independent legal, financial, taxation and other
professional advice before making any investment decision.
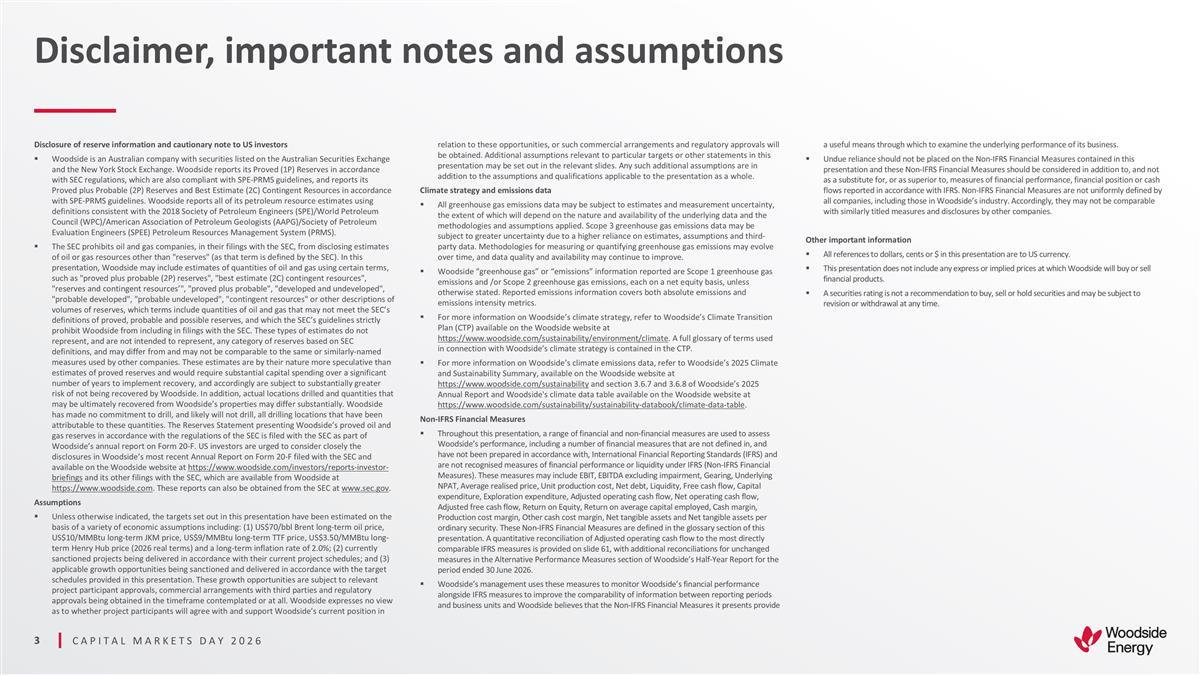
Disclaimer, important notes and
assumptions Disclosure of reserve information and cautionary note to US investors Woodside is an Australian company with securities listed on the Australian Securities Exchange and the New York Stock Exchange. Woodside reports its Proved (1P)
Reserves in accordance with SEC regulations, which are also compliant with SPE-PRMS guidelines, and reports its Proved plus Probable (2P) Reserves and Best Estimate (2C) Contingent Resources in accordance with SPE-PRMS guidelines. Woodside reports
all of its petroleum resource estimates using definitions consistent with the 2018 Society of Petroleum Engineers (SPE)/World Petroleum Council (WPC)/American Association of Petroleum Geologists (AAPG)/Society of Petroleum Evaluation Engineers
(SPEE) Petroleum Resources Management System (PRMS). The SEC prohibits oil and gas companies, in their filings with the SEC, from disclosing estimates of oil or gas resources other than "reserves" (as that term is defined by the SEC). In this
presentation, Woodside may include estimates of quantities of oil and gas using certain terms, such as "proved plus probable (2P) reserves", "best estimate (2C) contingent resources", "reserves and contingent resources’", "proved plus
probable", "developed and undeveloped", "probable developed", "probable undeveloped", "contingent resources" or other descriptions of volumes of reserves, which terms include quantities of oil and gas that may not meet the SEC’s definitions of
proved, probable and possible reserves, and which the SEC’s guidelines strictly prohibit Woodside from including in filings with the SEC. These types of estimates do not represent, and are not intended to represent, any category of reserves
based on SEC definitions, and may differ from and may not be comparable to the same or similarly-named measures used by other companies. These estimates are by their nature more speculative than estimates of proved reserves and would require
substantial capital spending over a significant number of years to implement recovery, and accordingly are subject to substantially greater risk of not being recovered by Woodside. In addition, actual locations drilled and quantities that may be
ultimately recovered from Woodside’s properties may differ substantially. Woodside has made no commitment to drill, and likely will not drill, all drilling locations that have been attributable to these quantities. The Reserves Statement
presenting Woodside’s proved oil and gas reserves in accordance with the regulations of the SEC is filed with the SEC as part of Woodside’s annual report on Form 20-F. US investors are urged to consider closely the disclosures in
Woodside’s most recent Annual Report on Form 20-F filed with the SEC and available on the Woodside website at https://www.woodside.com/investors/reports-investor-briefings and its other filings with the SEC, which are available from Woodside
at https://www.woodside.com. These reports can also be obtained from the SEC at www.sec.gov. Assumptions Unless otherwise indicated, the targets set out in this presentation have been estimated on the basis of a variety of economic assumptions
including: (1) US$70/bbl Brent long-term oil price, US$10/MMBtu long-term JKM price, US$9/MMBtu long-term TTF price, US$3.50/MMBtu long-term Henry Hub price (2026 real terms) and a long-term inflation rate of 2.0%; (2) currently sanctioned projects
being delivered in accordance with their current project schedules; and (3) applicable growth opportunities being sanctioned and delivered in accordance with the target schedules provided in this presentation. These growth opportunities are subject
to relevant project participant approvals, commercial arrangements with third parties and regulatory approvals being obtained in the timeframe contemplated or at all. Woodside expresses no view as to whether project participants will agree with and
support Woodside’s current position in relation to these opportunities, or such commercial arrangements and regulatory approvals will be obtained. Additional assumptions relevant to particular targets or other statements in this presentation
may be set out in the relevant slides. Any such additional assumptions are in addition to the assumptions and qualifications applicable to the presentation as a whole. Climate strategy and emissions data All greenhouse gas emissions data may be
subject to estimates and measurement uncertainty, the extent of which will depend on the nature and availability of the underlying data and the methodologies and assumptions applied. Scope 3 greenhouse gas emissions data may be subject to greater
uncertainty due to a higher reliance on estimates, assumptions and third-party data. Methodologies for measuring or quantifying greenhouse gas emissions may evolve over time, and data quality and availability may continue to improve. Woodside
“greenhouse gas” or “emissions” information reported are Scope 1 greenhouse gas emissions and /or Scope 2 greenhouse gas emissions, each on a net equity basis, unless otherwise stated. Reported emissions information covers
both absolute emissions and emissions intensity metrics. For more information on Woodside’s climate strategy, refer to Woodside’s Climate Transition Plan (CTP) available on the Woodside website at
https://www.woodside.com/sustainability/environment/climate. A full glossary of terms used in connection with Woodside’s climate strategy is contained in the CTP. For more information on Woodside’s climate emissions data, refer to
Woodside’s 2025 Climate and Sustainability Summary, available on the Woodside website at https://www.woodside.com/sustainability and section 3.6.7 and 3.6.8 of Woodside’s 2025 Annual Report and Woodside's climate data table available on
the Woodside website at https://www.woodside.com/sustainability/sustainability-databook/climate-data-table. Non-IFRS Financial Measures Throughout this presentation, a range of financial and non-financial measures are used to assess Woodside’s
performance, including a number of financial measures that are not defined in, and have not been prepared in accordance with, International Financial Reporting Standards (IFRS) and are not recognised measures of financial performance or liquidity
under IFRS (Non-IFRS Financial Measures). These measures may include EBIT, EBITDA excluding impairment, Gearing, Underlying NPAT, Average realised price, Unit production cost, Net debt, Liquidity, Free cash flow, Capital expenditure, Exploration
expenditure, Adjusted operating cash flow, Net operating cash flow, Adjusted free cash flow, Return on Equity, Return on average capital employed, Cash margin, Production cost margin, Other cash cost margin, Net tangible assets and Net tangible
assets per ordinary security. These Non-IFRS Financial Measures are defined in the glossary section of this presentation. A quantitative reconciliation of Adjusted operating cash flow to the most directly comparable IFRS measures is provided on
slide 61, with additional reconciliations for unchanged measures in the Alternative Performance Measures section of Woodside’s Half-Year Report for the period ended 30 June 2026. Woodside’s management uses these measures to monitor
Woodside’s financial performance alongside IFRS measures to improve the comparability of information between reporting periods and business units and Woodside believes that the Non-IFRS Financial Measures it presents provide a useful means
through which to examine the underlying performance of its business. Undue reliance should not be placed on the Non-IFRS Financial Measures contained in this presentation and these Non-IFRS Financial Measures should be considered in addition to, and
not as a substitute for, or as superior to, measures of financial performance, financial position or cash flows reported in accordance with IFRS. Non-IFRS Financial Measures are not uniformly defined by all companies, including those in
Woodside’s industry. Accordingly, they may not be comparable with similarly titled measures and disclosures by other companies. Other important information All references to dollars, cents or $ in this presentation are to US currency. This
presentation does not include any express or implied prices at which Woodside will buy or sell financial products. A securities rating is not a recommendation to buy, sell or hold securities and may be subject to revision or withdrawal at any
time.
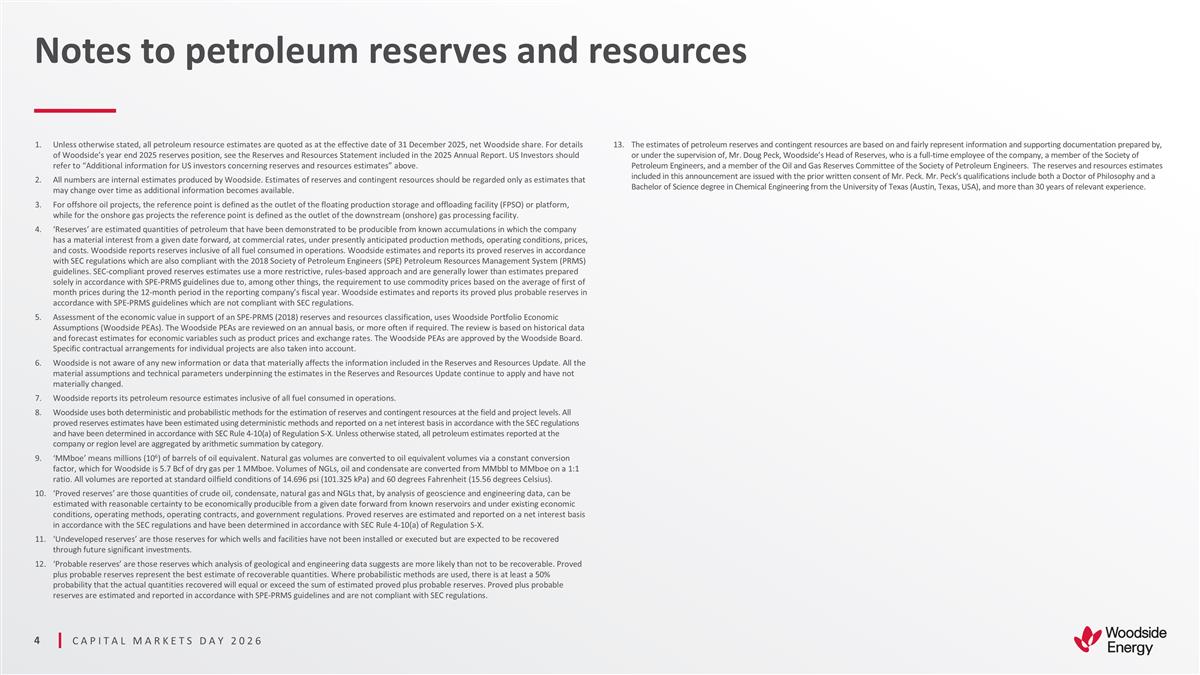
Notes to petroleum reserves and
resources Unless otherwise stated, all petroleum resource estimates are quoted as at the effective date of 31 December 2025, net Woodside share. For details of Woodside’s year end 2025 reserves position, see the Reserves and Resources
Statement included in the 2025 Annual Report. US Investors should refer to “Additional information for US investors concerning reserves and resources estimates” above. All numbers are internal estimates produced by Woodside. Estimates of
reserves and contingent resources should be regarded only as estimates that may change over time as additional information becomes available. For offshore oil projects, the reference point is defined as the outlet of the floating production storage
and offloading facility (FPSO) or platform, while for the onshore gas projects the reference point is defined as the outlet of the downstream (onshore) gas processing facility. ‘Reserves’ are estimated quantities of petroleum that have
been demonstrated to be producible from known accumulations in which the company has a material interest from a given date forward, at commercial rates, under presently anticipated production methods, operating conditions, prices, and costs.
Woodside reports reserves inclusive of all fuel consumed in operations. Woodside estimates and reports its proved reserves in accordance with SEC regulations which are also compliant with the 2018 Society of Petroleum Engineers (SPE) Petroleum
Resources Management System (PRMS) guidelines. SEC-compliant proved reserves estimates use a more restrictive, rules-based approach and are generally lower than estimates prepared solely in accordance with SPE-PRMS guidelines due to, among other
things, the requirement to use commodity prices based on the average of first of month prices during the 12-month period in the reporting company’s fiscal year. Woodside estimates and reports its proved plus probable reserves in accordance
with SPE-PRMS guidelines which are not compliant with SEC regulations. Assessment of the economic value in support of an SPE-PRMS (2018) reserves and resources classification, uses Woodside Portfolio Economic Assumptions (Woodside PEAs). The
Woodside PEAs are reviewed on an annual basis, or more often if required. The review is based on historical data and forecast estimates for economic variables such as product prices and exchange rates. The Woodside PEAs are approved by the Woodside
Board. Specific contractual arrangements for individual projects are also taken into account. Woodside is not aware of any new information or data that materially affects the information included in the Reserves and Resources Update. All the
material assumptions and technical parameters underpinning the estimates in the Reserves and Resources Update continue to apply and have not materially changed. Woodside reports its petroleum resource estimates inclusive of all fuel consumed in
operations. Woodside uses both deterministic and probabilistic methods for the estimation of reserves and contingent resources at the field and project levels. All proved reserves estimates have been estimated using deterministic methods and
reported on a net interest basis in accordance with the SEC regulations and have been determined in accordance with SEC Rule 4-10(a) of Regulation S-X. Unless otherwise stated, all petroleum estimates reported at the company or region level are
aggregated by arithmetic summation by category. ‘MMboe’ means millions (106) of barrels of oil equivalent. Natural gas volumes are converted to oil equivalent volumes via a constant conversion factor, which for Woodside is 5.7 Bcf of dry
gas per 1 MMboe. Volumes of NGLs, oil and condensate are converted from MMbbl to MMboe on a 1:1 ratio. All volumes are reported at standard oilfield conditions of 14.696 psi (101.325 kPa) and 60 degrees Fahrenheit (15.56 degrees Celsius).
‘Proved reserves’ are those quantities of crude oil, condensate, natural gas and NGLs that, by analysis of geoscience and engineering data, can be estimated with reasonable certainty to be economically producible from a given date
forward from known reservoirs and under existing economic conditions, operating methods, operating contracts, and government regulations. Proved reserves are estimated and reported on a net interest basis in accordance with the SEC regulations and
have been determined in accordance with SEC Rule 4-10(a) of Regulation S-X. ‘Undeveloped reserves’ are those reserves for which wells and facilities have not been installed or executed but are expected to be recovered through future
significant investments. ‘Probable reserves’ are those reserves which analysis of geological and engineering data suggests are more likely than not to be recoverable. Proved plus probable reserves represent the best estimate of
recoverable quantities. Where probabilistic methods are used, there is at least a 50% probability that the actual quantities recovered will equal or exceed the sum of estimated proved plus probable reserves. Proved plus probable reserves are
estimated and reported in accordance with SPE-PRMS guidelines and are not compliant with SEC regulations. The estimates of petroleum reserves and contingent resources are based on and fairly represent information and supporting documentation
prepared by, or under the supervision of, Mr. Doug Peck, Woodside’s Head of Reserves, who is a full-time employee of the company, a member of the Society of Petroleum Engineers, and a member of the Oil and Gas Reserves Committee of the Society
of Petroleum Engineers. The reserves and resources estimates included in this announcement are issued with the prior written consent of Mr. Peck. Mr. Peck’s qualifications include both a Doctor of Philosophy and a Bachelor of Science degree in
Chemical Engineering from the University of Texas (Austin, Texas, USA), and more than 30 years of relevant experience.
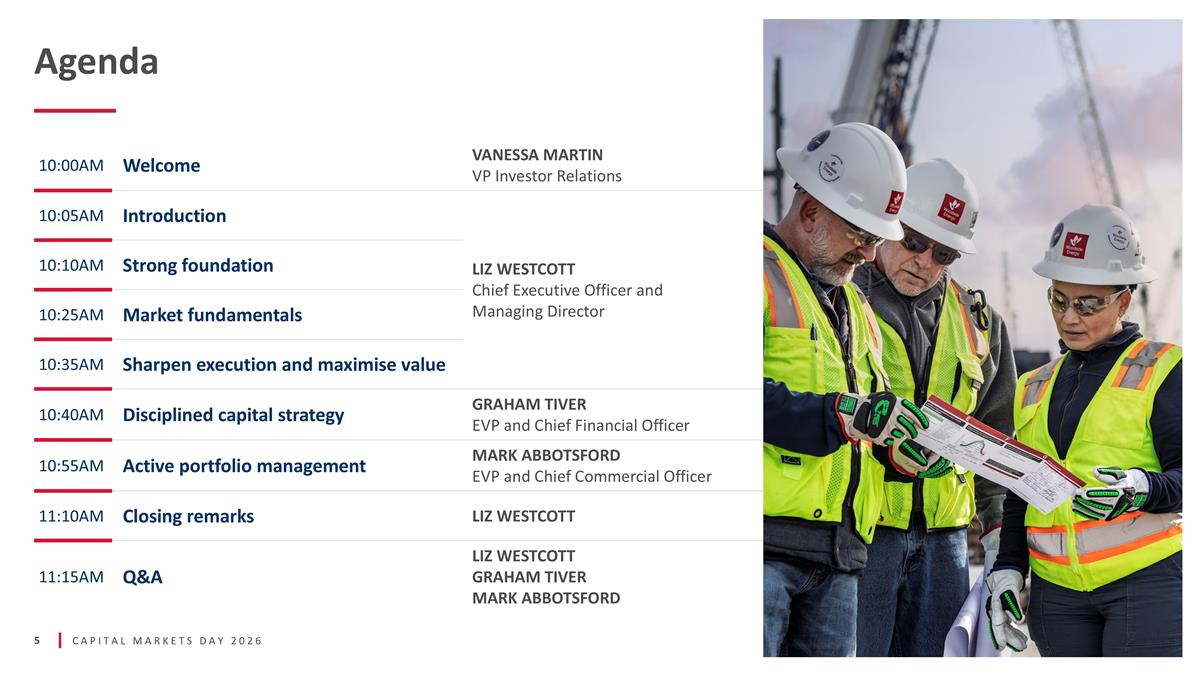
10:00AM Welcome VANESSA MARTIN VP
Investor Relations 10:05AM Introduction LIZ WESTCOTT Chief Executive Officer and Managing Director 10:10AM Strong foundation 10:25AM Market fundamentals 10:35AM Sharpen execution and maximise value 10:40AM Disciplined capital strategy GRAHAM TIVER
EVP and Chief Financial Officer 10:55AM Active portfolio management MARK ABBOTSFORD EVP and Chief Commercial Officer 11:10AM Closing remarks LIZ WESTCOTT 11:15AM Q&A LIZ WESTCOTT GRAHAM TIVER MARK ABBOTSFORD Agenda
Introduction LIZ WESTCOTT | Chief
Executive Officer and Managing Director
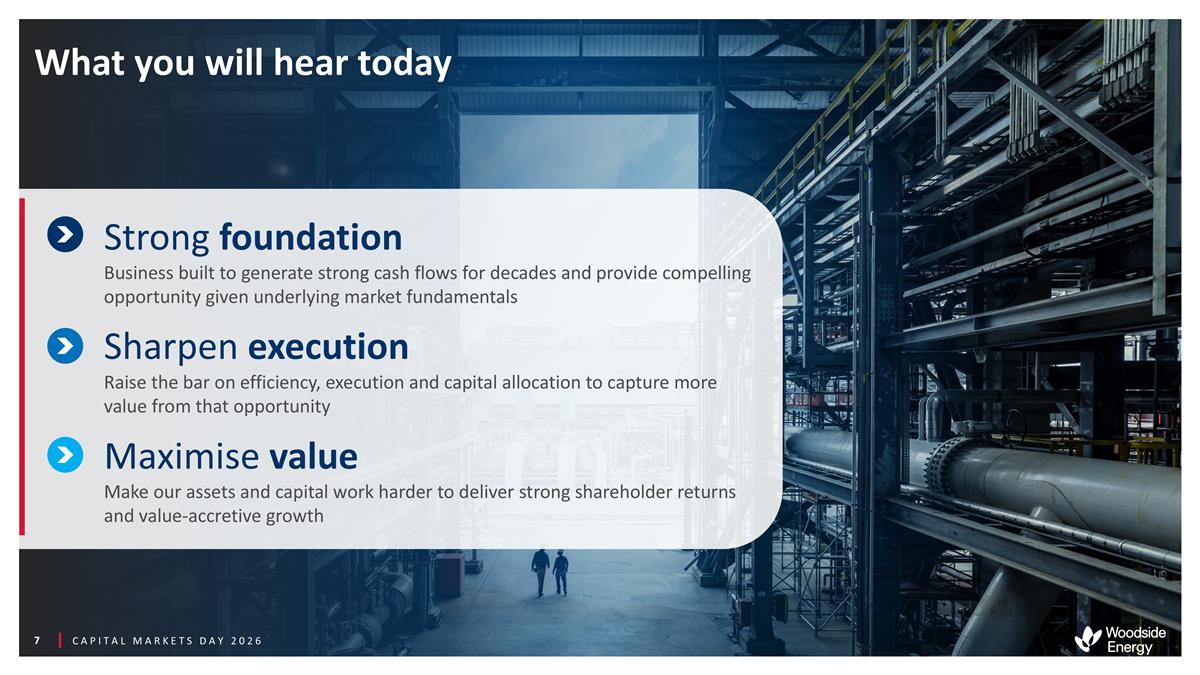
CAPITAL MARKETS DAY 2026 What you
will hear today 1 Strong foundation Business built to generate strong cash flows for decades and provide compelling opportunity given underlying market fundamentals 2 Sharpen execution Raise the bar on efficiency, execution and capital allocation to
capture more value from that opportunity 3 Maximise value Make our assets and capital work harder to deliver strong shareholder returns and value-accretive growth
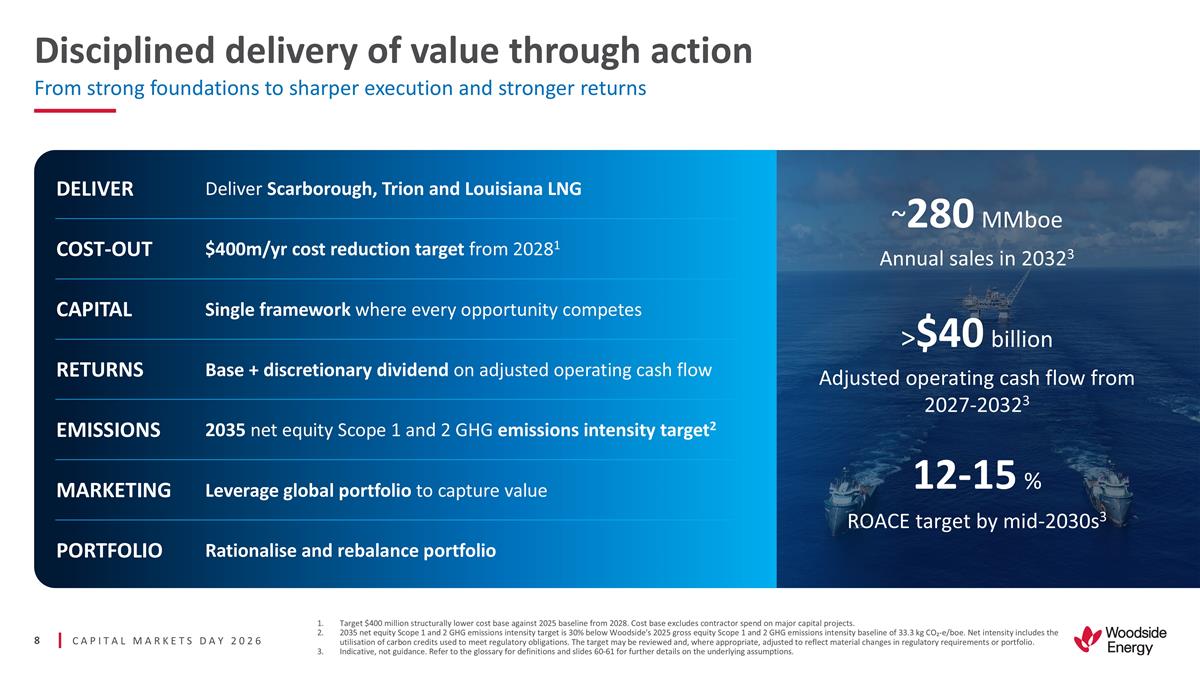
Disciplined delivery of value
through action From strong foundations to sharper execution and stronger returns Target $400 million structurally lower cost base against 2025 baseline from 2028. Cost base excludes contractor spend on major capital projects. 2035 net equity Scope 1
and 2 GHG emissions intensity target is 30% below Woodside's 2025 gross equity Scope 1 and 2 GHG emissions intensity baseline of 33.3 kg CO₂-e/boe. Net intensity includes the utilisation of carbon credits used to meet regulatory obligations.
The target may be reviewed and, where appropriate, adjusted to reflect material changes in regulatory requirements or portfolio. Indicative, not guidance. Refer to the glossary for definitions and slides 60-61 for further details on the underlying
assumptions. 12-15 % ROACE target by mid-2030s3 ~280 MMboe Annual sales in 20323 Deliver Scarborough, Trion and Louisiana LNG DELIVER $400m/yr cost reduction target from 20281 COST-OUT Single framework where every opportunity competes CAPITAL Base +
discretionary dividend on adjusted operating cash flow RETURNS 2035 net equity Scope 1 and 2 GHG emissions intensity target2 EMISSIONS Leverage global portfolio to capture value MARKETING Rationalise and rebalance portfolio PORTFOLIO >$40 billion
Adjusted operating cash flow from 2027-20323

Strong foundation
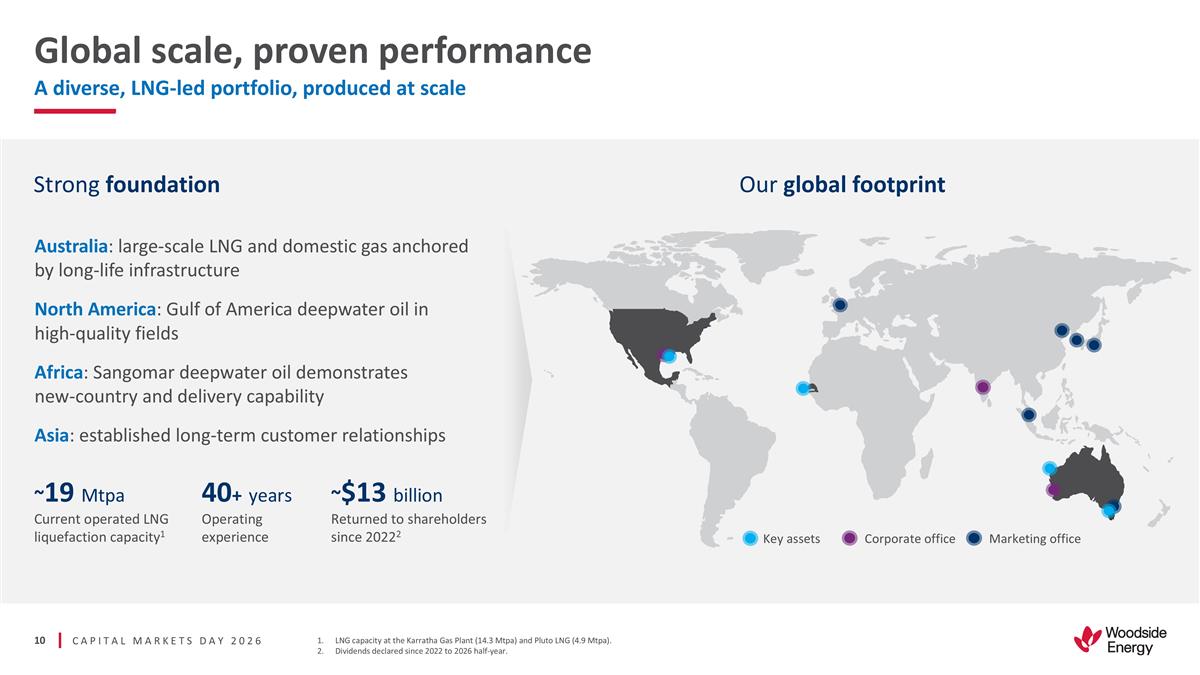
Global scale, proven performance
A diverse, LNG-led portfolio, produced at scale LNG capacity at the Karratha Gas Plant (14.3 Mtpa) and Pluto LNG (4.9 Mtpa). Dividends declared since 2022 to 2026 half-year. Marketing office Key assets Corporate office Strong foundation Australia:
large-scale LNG and domestic gas anchored by long-life infrastructure North America: Gulf of America deepwater oil in high-quality fields Africa: Sangomar deepwater oil demonstrates new-country and delivery capability Asia: established long-term
customer relationships Our global footprint ~$13 billion Returned to shareholders since 20222 ~19 Mtpa Current operated LNG liquefaction capacity1 40+ years Operating experience
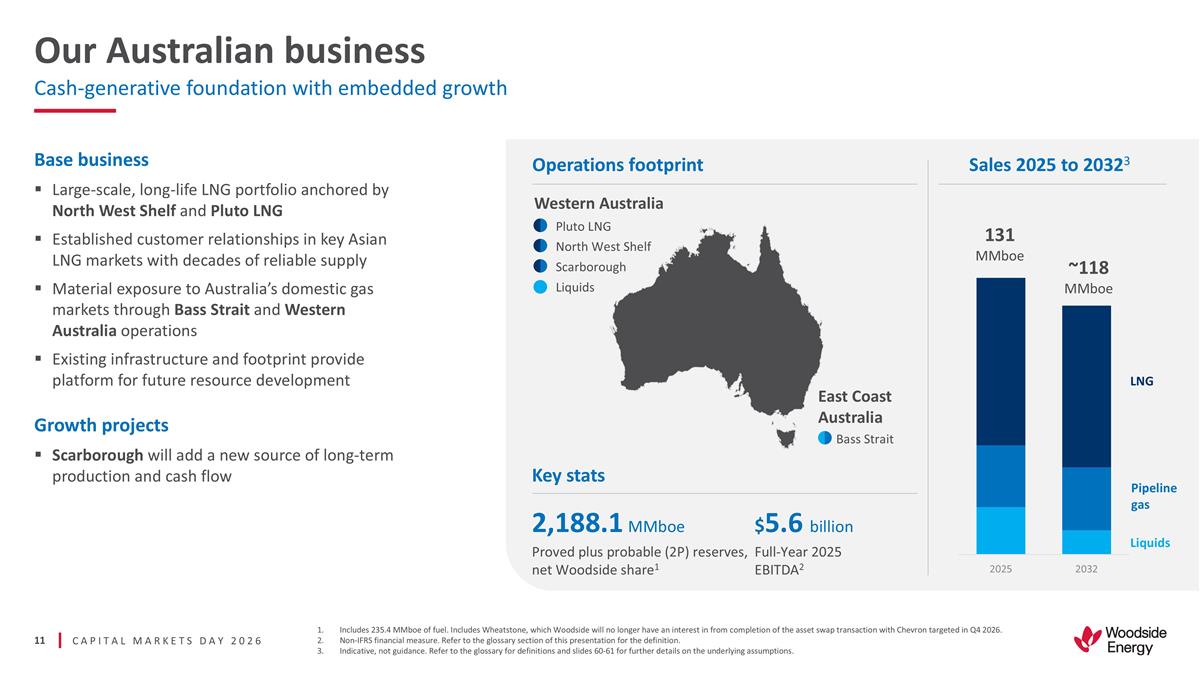
Base business Large-scale,
long-life LNG portfolio anchored by North West Shelf and Pluto LNG Established customer relationships in key Asian LNG markets with decades of reliable supply Material exposure to Australia’s domestic gas markets through Bass Strait and
Western Australia operations Existing infrastructure and footprint provide platform for future resource development Growth projects Scarborough will add a new source of long-term production and cash flow Our Australian business Cash-generative
foundation with embedded growth Includes 235.4 MMboe of fuel. Includes Wheatstone, which Woodside will no longer have an interest in from completion of the asset swap transaction with Chevron targeted in Q4 2026. Non-IFRS financial measure. Refer to
the glossary section of this presentation for the definition. Indicative, not guidance. Refer to the glossary for definitions and slides 60-61 for further details on the underlying assumptions. Pluto LNG North West Shelf Scarborough Liquids Western
Australia Bass Strait East Coast Australia Sales 2025 to 20323 LNG Pipeline gas Liquids 131 MMboe ~118 MMboe 2,188.1 MMboe $5.6 billion Proved plus probable (2P) reserves, net Woodside share1 Full-Year 2025 EBITDA2 Operations footprint Key stats
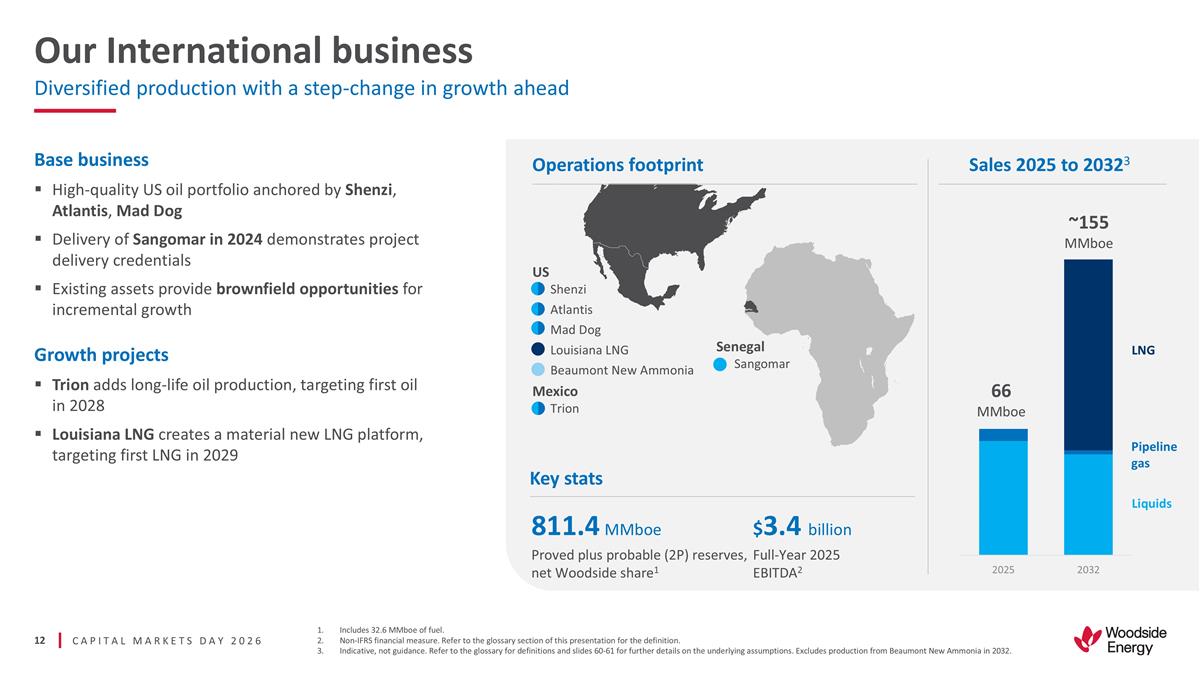
Our International business
Diversified production with a step-change in growth ahead Includes 32.6 MMboe of fuel. Non-IFRS financial measure. Refer to the glossary section of this presentation for the definition. Indicative, not guidance. Refer to the glossary for definitions
and slides 60-61 for further details on the underlying assumptions. Excludes production from Beaumont New Ammonia in 2032. Base business High-quality US oil portfolio anchored by Shenzi, Atlantis, Mad Dog Delivery of Sangomar in 2024 demonstrates
project delivery credentials Existing assets provide brownfield opportunities for incremental growth Growth projects Trion adds long-life oil production, targeting first oil in 2028 Louisiana LNG creates a material new LNG platform, targeting first
LNG in 2029 LNG Pipeline gas Liquids 66 MMboe ~155 MMboe Senegal Sangomar US Shenzi Atlantis Mad Dog Louisiana LNG Beaumont New Ammonia Mexico Trion 811.4 MMboe $3.4 billion Proved plus probable (2P) reserves, net Woodside share1 Full-Year 2025
EBITDA2 Key stats Sales 2025 to 20323 Operations footprint
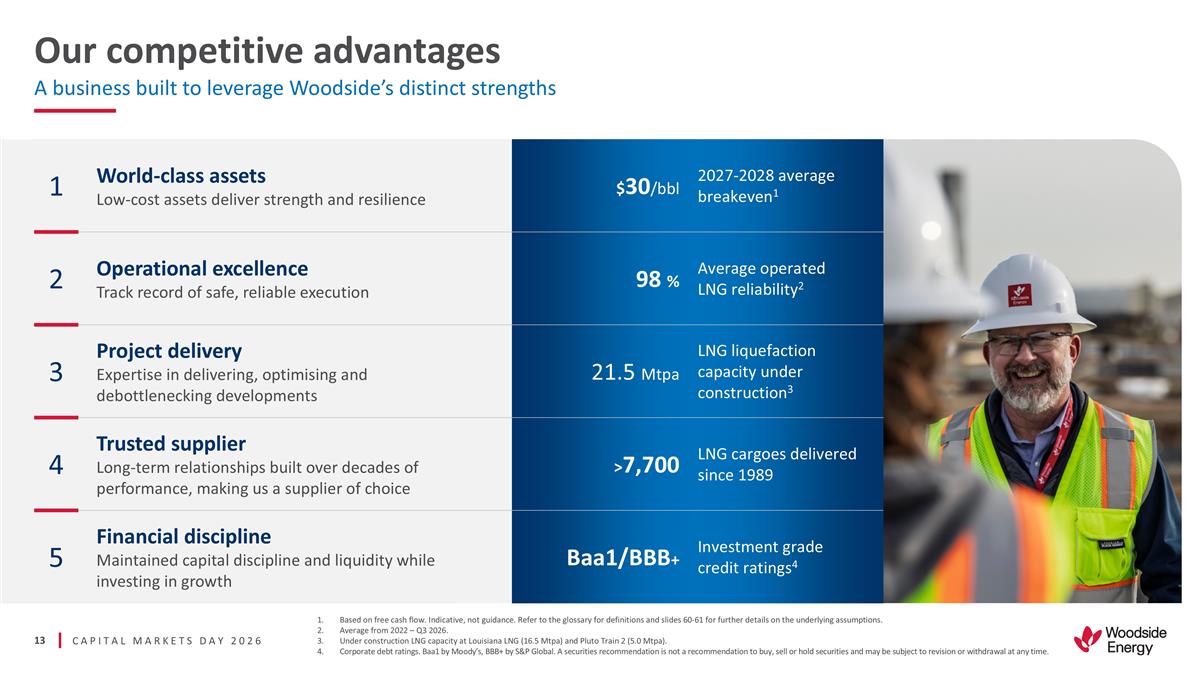
Our competitive advantages A
business built to leverage Woodside’s distinct strengths 1 World-class assets Low-cost assets deliver strength and resilience $30/bbl 2027-2028 average breakeven1 2 Operational excellence Track record of safe, reliable execution 98 % Average
operated LNG reliability2 3 Project delivery Expertise in delivering, optimising and debottlenecking developments 21.5 Mtpa LNG liquefaction capacity under construction3 4 Trusted supplier Long-term relationships built over decades of performance,
making us a supplier of choice >7,700 LNG cargoes delivered since 1989 5 Financial discipline Maintained capital discipline and liquidity while investing in growth Baa1/BBB+ Investment grade credit ratings4 Based on free cash flow. Indicative,
not guidance. Refer to the glossary for definitions and slides 60-61 for further details on the underlying assumptions. Average from 2022 – Q3 2026. Under construction LNG capacity at Louisiana LNG (16.5 Mtpa) and Pluto Train 2 (5.0 Mtpa).
Corporate debt ratings. Baa1 by Moody’s, BBB+ by S&P Global. A securities recommendation is not a recommendation to buy, sell or hold securities and may be subject to revision or withdrawal at any time.
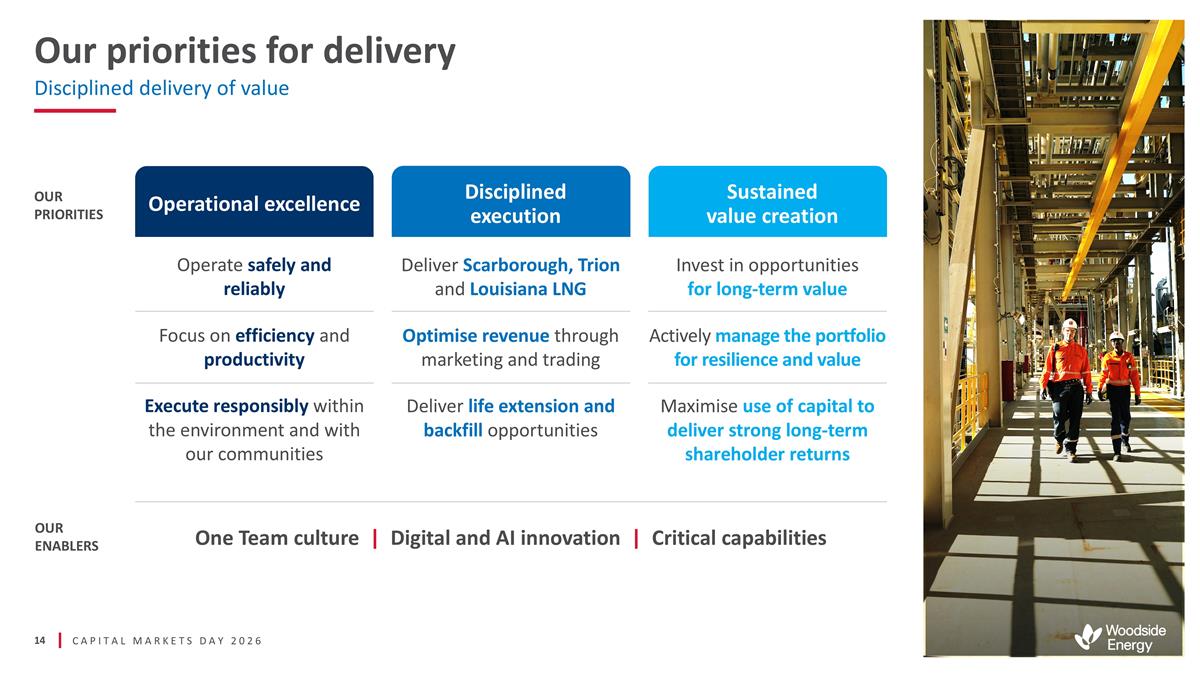
Our priorities for delivery
Disciplined delivery of value Operate safely and reliably Focus on efficiency and productivity Execute responsibly within the environment and with our communities Operational excellence Deliver Scarborough, Trion and Louisiana LNG Optimise revenue
through marketing and trading Deliver life extension and backfill opportunities Invest in opportunities for long-term value Actively manage the portfolio for resilience and value Maximise use of capital to deliver strong long-term shareholder
returns Disciplined execution Sustained value creation One Team culture | Digital and AI innovation | Critical capabilities OUR PRIORITIES OUR ENABLERS
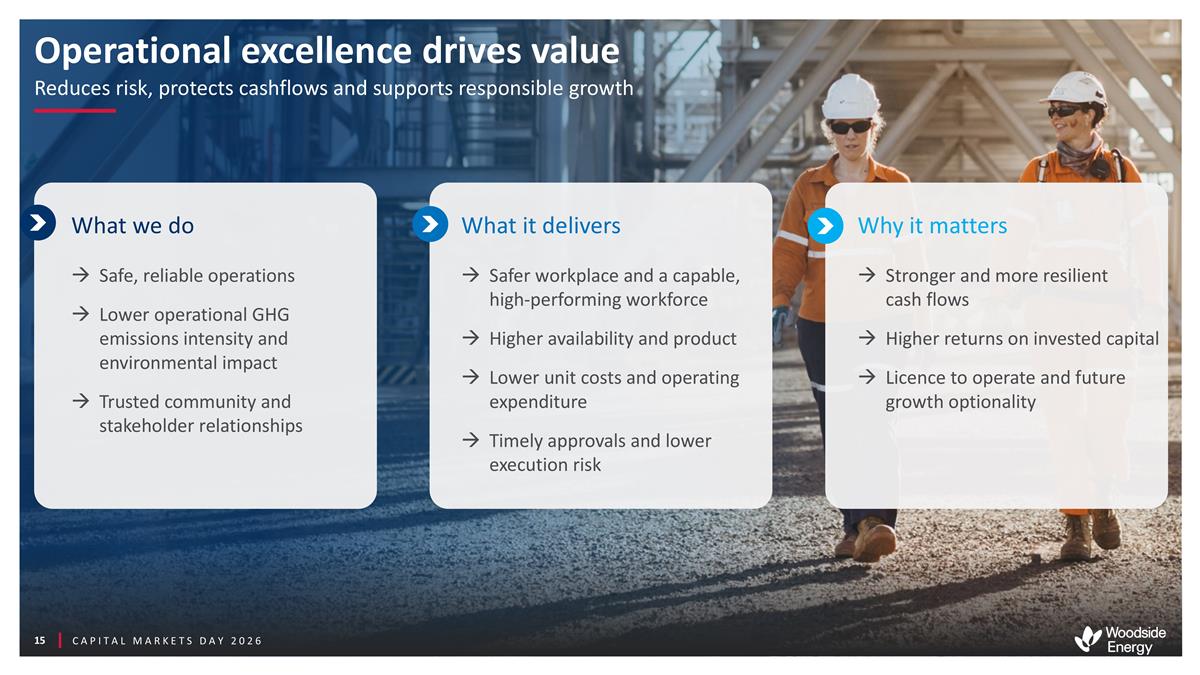
What we do What it delivers Why
it matters Safe, reliable operations Lower operational GHG emissions intensity and environmental impact Trusted community and stakeholder relationships Safer workplace and a capable, high-performing workforce Higher availability and product Lower
unit costs and operating expenditure Timely approvals and lower execution risk Stronger and more resilient cash flows Higher returns on invested capital Licence to operate and future growth optionality CAPITAL MARKETS DAY 2026 Operational excellence
drives value Reduces risk, protects cashflows and supports responsible growth
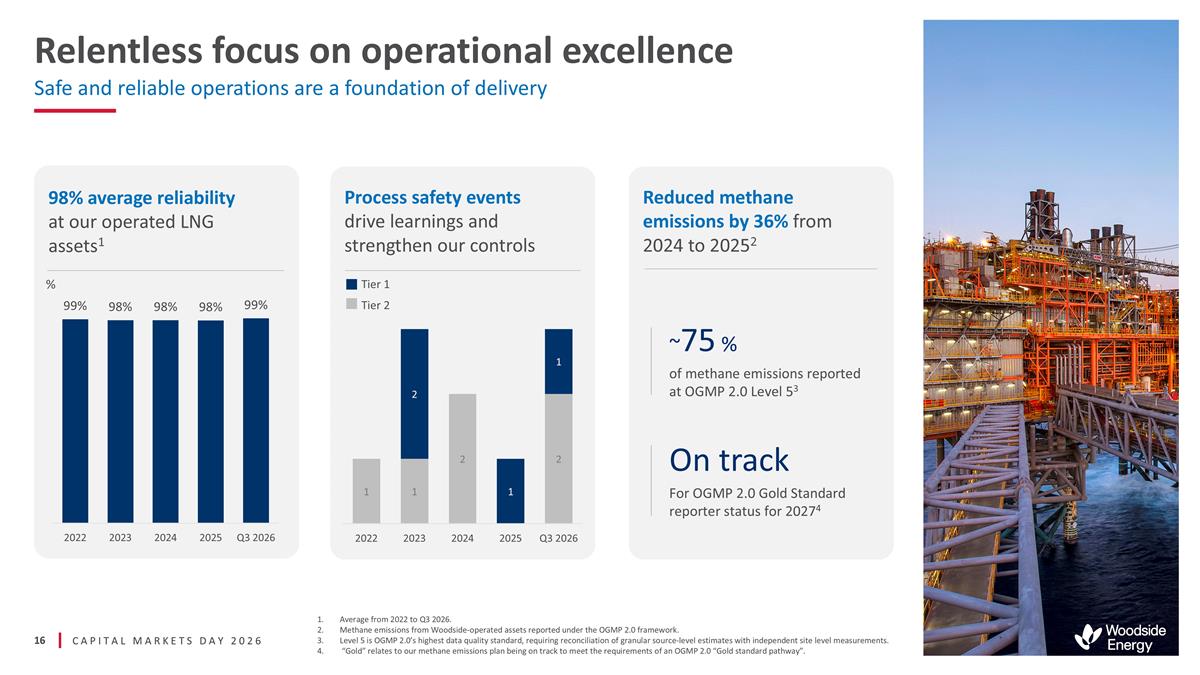
Average from 2022 to Q3 2026.
Methane emissions from Woodside-operated assets reported under the OGMP 2.0 framework. Level 5 is OGMP 2.0’s highest data quality standard, requiring reconciliation of granular source-level estimates with independent site level measurements.
“Gold” relates to our methane emissions plan being on track to meet the requirements of an OGMP 2.0 “Gold standard pathway”. CAPITAL MARKETS DAY 2026 Relentless focus on operational excellence Safe and reliable operations are
a foundation of delivery 98% average reliability at our operated LNG assets1 Process safety events drive learnings and strengthen our controls Tier 1 Tier 2 % Reduced methane emissions by 36% from 2024 to 20252 ~75 % of methane emissions reported at
OGMP 2.0 Level 53 On track For OGMP 2.0 Gold Standard reporter status for 20274
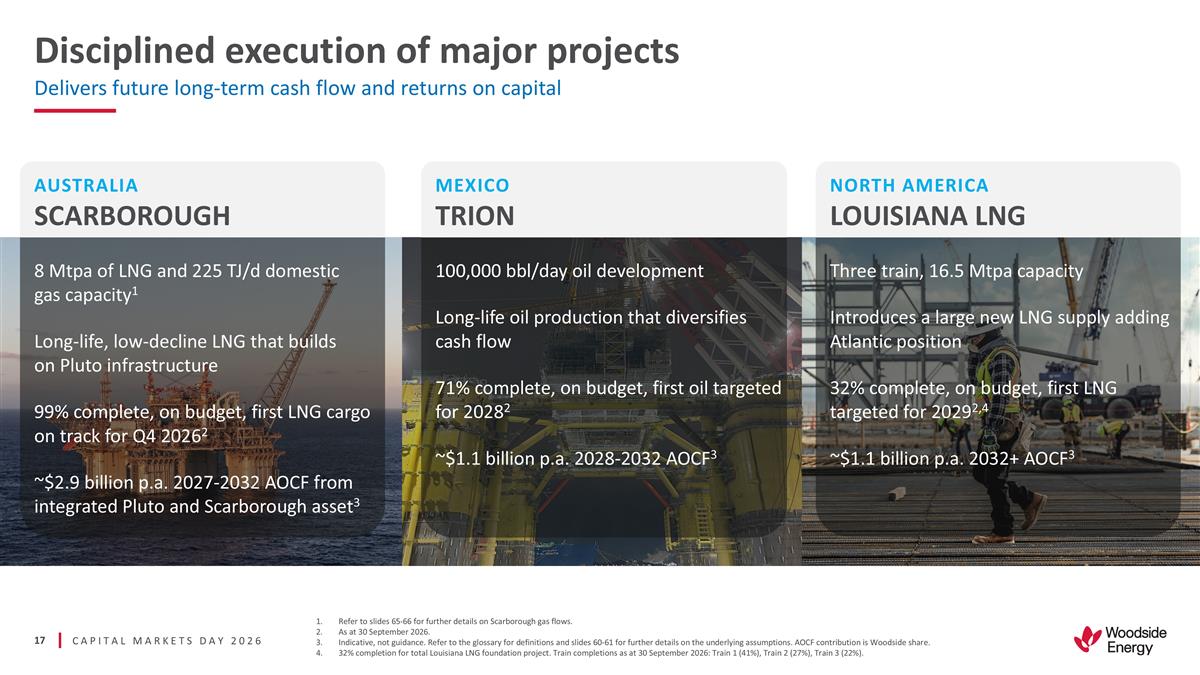
Disciplined execution of major
projects Delivers future long-term cash flow and returns on capital Refer to slides 65-66 for further details on Scarborough gas flows. As at 30 September 2026. Indicative, not guidance. Refer to the glossary for definitions and slides 60-61 for
further details on the underlying assumptions. AOCF contribution is Woodside share. 32% completion for total Louisiana LNG foundation project. Train completions as at 30 September 2026: Train 1 (41%), Train 2 (27%), Train 3 (22%). 8 Mtpa of LNG and
225 TJ/d domestic gas capacity1 Long-life, low-decline LNG that builds on Pluto infrastructure 99% complete, on budget, first LNG cargo on track for Q4 20262 ~$2.9 billion p.a. 2027-2032 AOCF from integrated Pluto and Scarborough asset3 MEXICO TRION
100,000 bbl/day oil development Long-life oil production that diversifies cash flow 71% complete, on budget, first oil targeted for 20282 ~$1.1 billion p.a. 2028-2032 AOCF3 NORTH AMERICA LOUISIANA LNG Three train, 16.5 Mtpa capacity Introduces a
large new LNG supply adding Atlantic position 32% complete, on budget, first LNG targeted for 20292,4 ~$1.1 billion p.a. 2032+ AOCF3 AUSTRALIA SCARBOROUGH
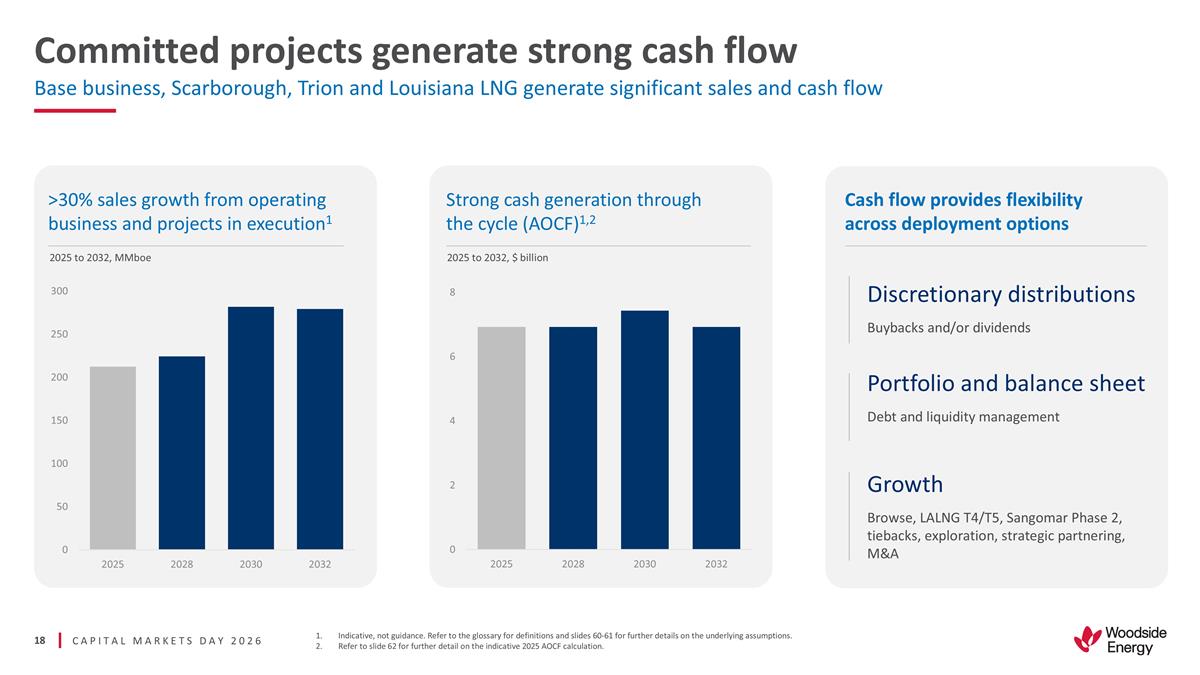
Committed projects generate
strong cash flow Base business, Scarborough, Trion and Louisiana LNG generate significant sales and cash flow 2025 to 2032, MMboe 2025 to 2032, $ billion Indicative, not guidance. Refer to the glossary for definitions and slides 60-61 for further
details on the underlying assumptions. Refer to slide 62 for further detail on the indicative 2025 AOCF calculation. Cash flow provides flexibility across deployment options Discretionary distributions Buybacks and/or dividends Portfolio and balance
sheet Debt and liquidity management Growth Browse, LALNG T4/T5, Sangomar Phase 2, tiebacks, exploration, strategic partnering, M&A >30% sales growth from operating business and projects in execution1 Strong cash generation through the cycle
(AOCF)1,2
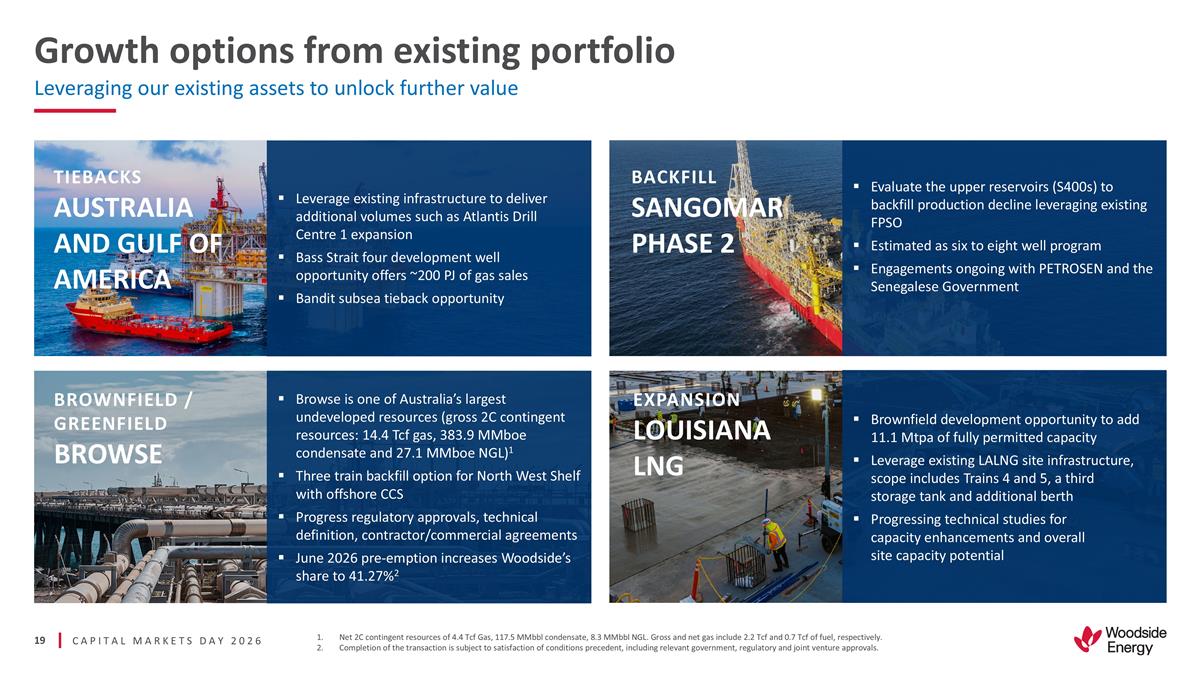
Growth options from existing
portfolio Leveraging our existing assets to unlock further value Net 2C contingent resources of 4.4 Tcf Gas, 117.5 MMbbl condensate, 8.3 MMbbl NGL. Gross and net gas include 2.2 Tcf and 0.7 Tcf of fuel, respectively. Completion of the transaction is
subject to satisfaction of conditions precedent, including relevant government, regulatory and joint venture approvals. BROWNFIELD / GREENFIELD BROWSE BACKFILL SANGOMAR PHASE 2 EXPANSION LOUISIANA LNG Leverage existing infrastructure to deliver
additional volumes such as Atlantis Drill Centre 1 expansion Bass Strait four development well opportunity offers ~200 PJ of gas sales Bandit subsea tieback opportunity Browse is one of Australia’s largest undeveloped resources (gross 2C
contingent resources: 14.4 Tcf gas, 383.9 MMboe condensate and 27.1 MMboe NGL)1 Three train backfill option for North West Shelf with offshore CCS Progress regulatory approvals, technical definition, contractor/commercial agreements June 2026
pre-emption increases Woodside’s share to 41.27%2 Brownfield development opportunity to add 11.1 Mtpa of fully permitted capacity Leverage existing LALNG site infrastructure, scope includes Trains 4 and 5, a third storage tank and additional
berth Progressing technical studies for capacity enhancements and overall site capacity potential TIEBACKS AUSTRALIA AND GULF OF AMERICA Evaluate the upper reservoirs (S400s) to backfill production decline leveraging existing FPSO Estimated as six
to eight well program Engagements ongoing with PETROSEN and the Senegalese Government
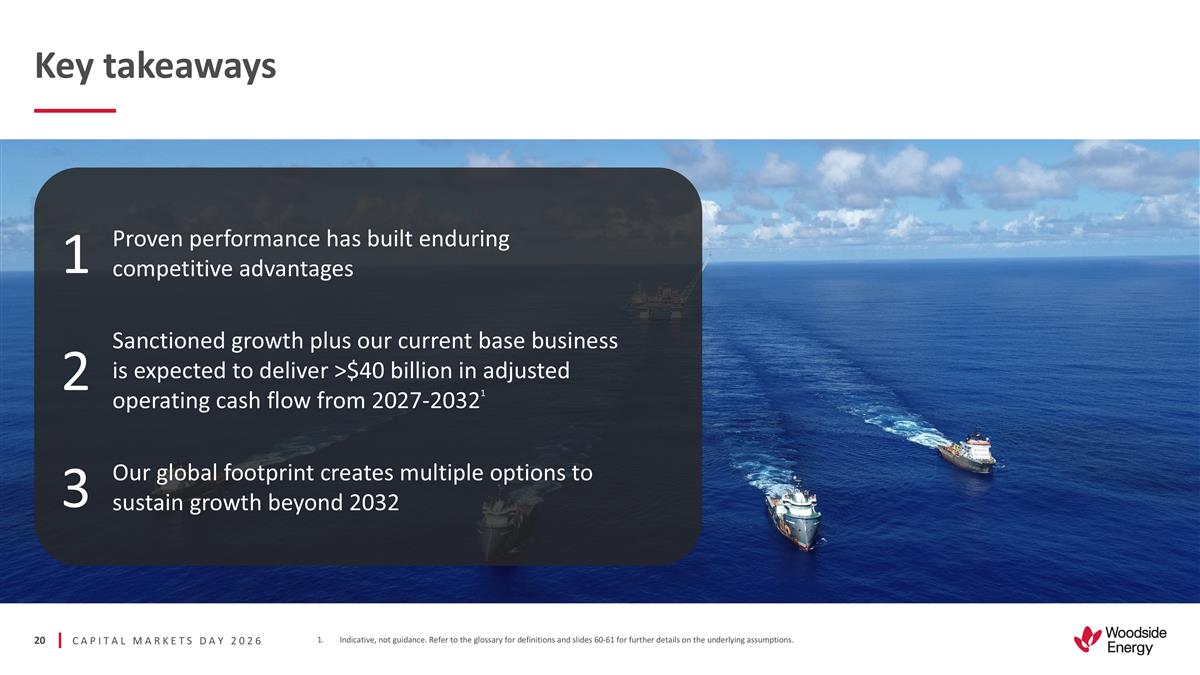
Indicative, not guidance. Refer
to the glossary for definitions and slides 60-61 for further details on the underlying assumptions. 1 Proven performance has built enduring competitive advantages 2 Sanctioned growth plus our current base business is expected to deliver >$40
billion in adjusted operating cash flow from 2027-20321 3 Our global footprint creates multiple options to sustain growth beyond 2032 Key takeaways

Market fundamentals
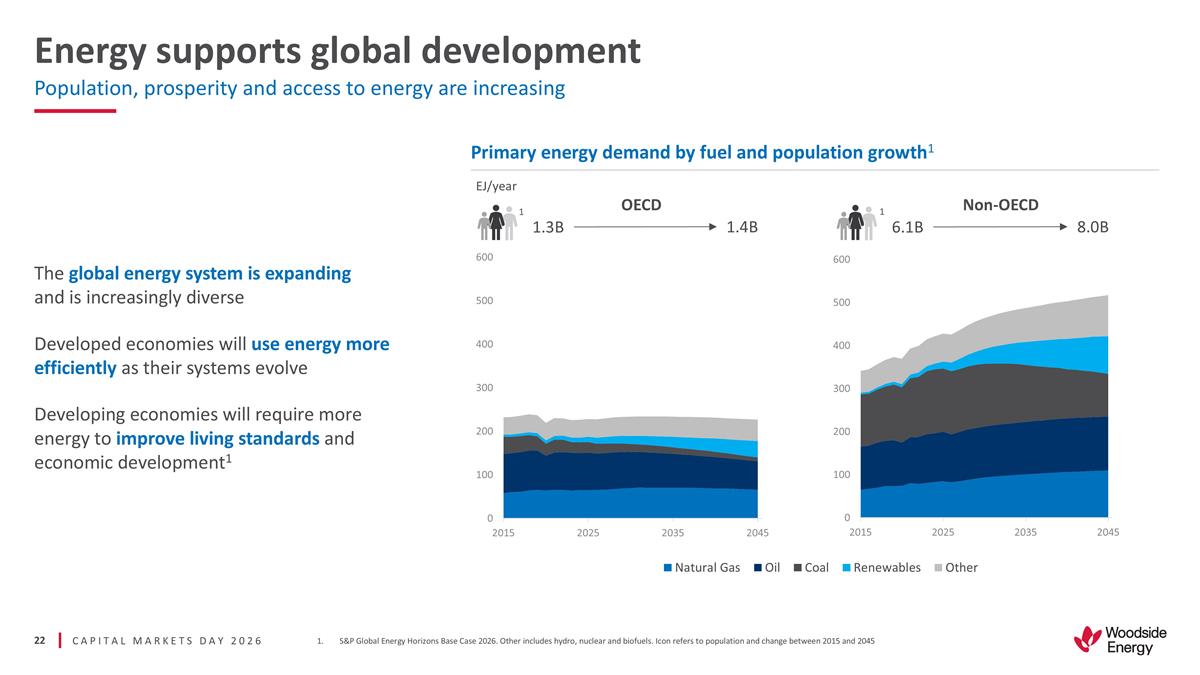
Energy supports global
development Population, prosperity and access to energy are increasing S&P Global Energy Horizons Base Case 2026. Other includes hydro, nuclear and biofuels. Icon refers to population and change between 2015 and 2045 Primary energy demand by
fuel and population growth1 EJ/year OECD 1.3B 1.4B Non-OECD 6.1B 8.0B 1 1 The global energy system is expanding and is increasingly diverse Developed economies will use energy more efficiently as their systems evolve Developing economies will
require more energy to improve living standards and economic development1
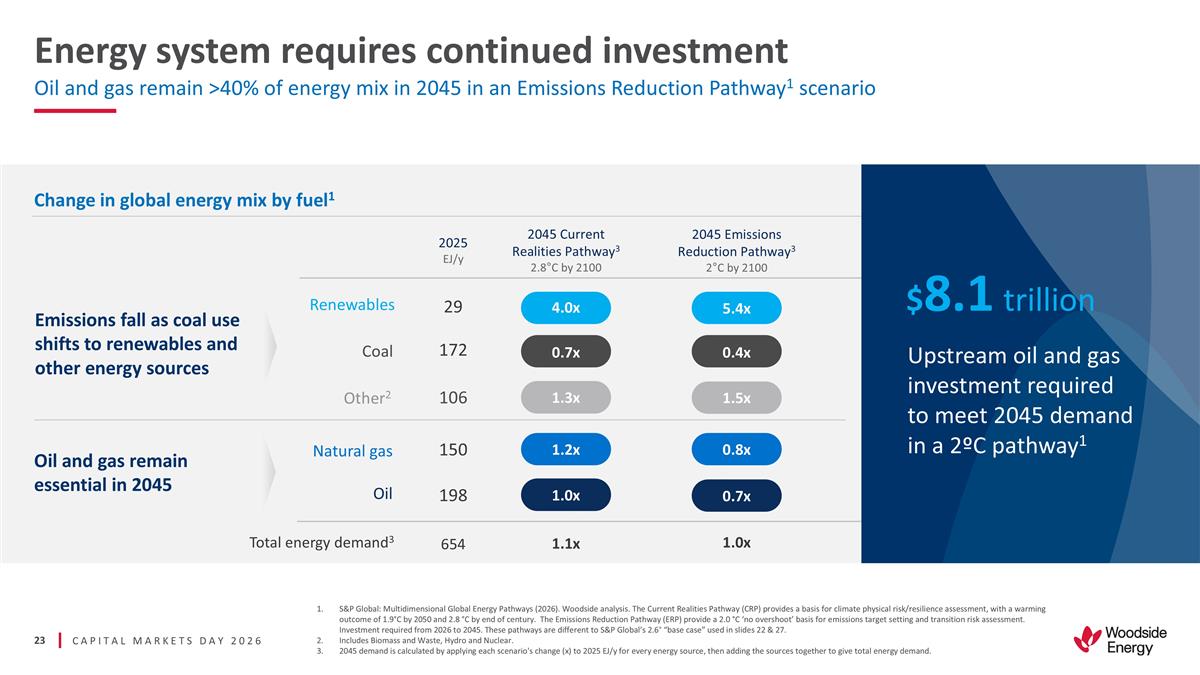
Oil and gas remain >40% of
energy mix in 2045 in an Emissions Reduction Pathway1 scenario Energy system requires continued investment S&P Global: Multidimensional Global Energy Pathways (2026). Woodside analysis. The Current Realities Pathway (CRP) provides a basis for
climate physical risk/resilience assessment, with a warming outcome of 1.9°C by 2050 and 2.8 °C by end of century. The Emissions Reduction Pathway (ERP) provide a 2.0 °C ‘no overshoot’ basis for emissions target setting
and transition risk assessment. Investment required from 2026 to 2045. These pathways are different to S&P Global’s 2.6° “base case” used in slides 22 & 27. Includes Biomass and Waste, Hydro and Nuclear. 2045 demand is
calculated by applying each scenario's change (x) to 2025 EJ/y for every energy source, then adding the sources together to give total energy demand. Change in global energy mix by fuel1 2025 EJ/y 2045 Current Realities Pathway3 2.8°C by 2100
2045 Emissions Reduction Pathway3 2°C by 2100 Renewables 29 4.0x 5.4x Coal 172 0.7x 0.4x 150 1.2x 0.8x Natural gas Oil 198 1.0x 0.7x Total energy demand3 654 1.1x 1.0x Emissions fall as coal use shifts to renewables and other energy sources Oil
and gas remain essential in 2045 Other2 106 1.3x 1.5x Upstream oil and gas investment required to meet 2045 demand in a 2ºC pathway1 $8.1 trillion
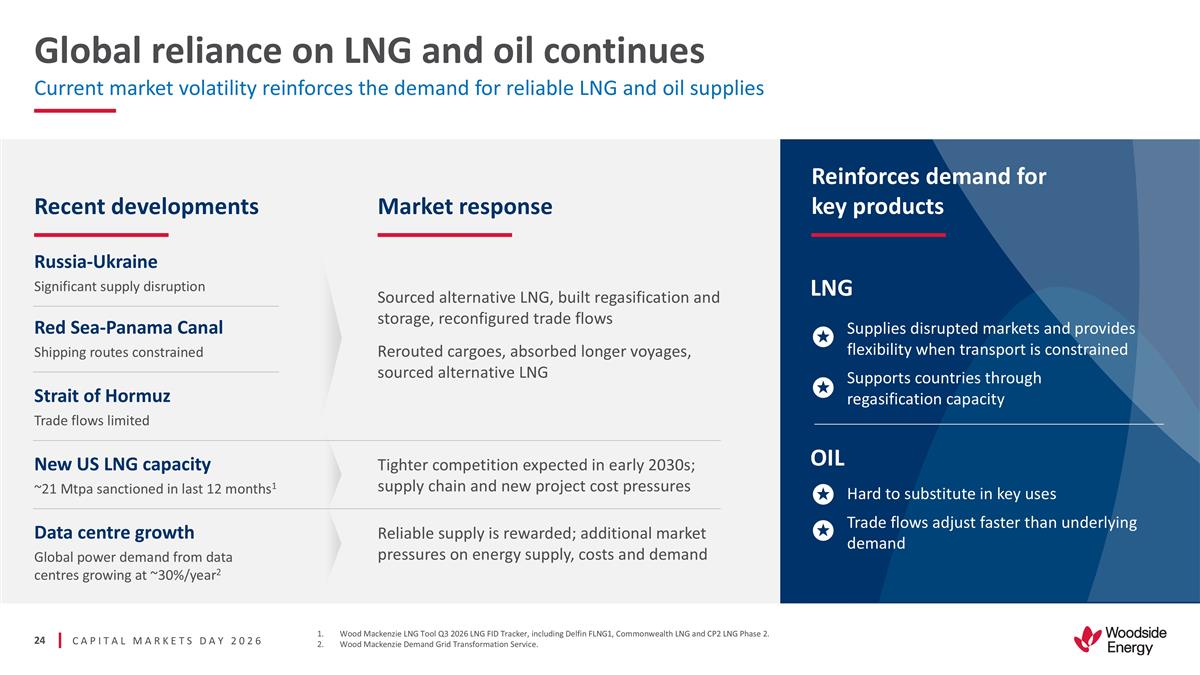
Current market volatility
reinforces the demand for reliable LNG and oil supplies Global reliance on LNG and oil continues Wood Mackenzie LNG Tool Q3 2026 LNG FID Tracker, including Delfin FLNG1, Commonwealth LNG and CP2 LNG Phase 2. Wood Mackenzie Demand Grid Transformation
Service. Hard to substitute in key uses Trade flows adjust faster than underlying demand Reinforces demand for key products Supplies disrupted markets and provides flexibility when transport is constrained Supports countries through regasification
capacity LNG OIL Recent developments Market response Russia-Ukraine Significant supply disruption Sourced alternative LNG, built regasification and storage, reconfigured trade flows Red Sea-Panama Canal Shipping routes constrained Rerouted cargoes,
absorbed longer voyages, sourced alternative LNG Strait of Hormuz Trade flows limited New US LNG capacity ~21 Mtpa sanctioned in last 12 months1 Tighter competition expected in early 2030s; supply chain and new project cost pressures Data centre
growth Global power demand from data centres growing at ~30%/year2 Reliable supply is rewarded; additional market pressures on energy supply, costs and demand
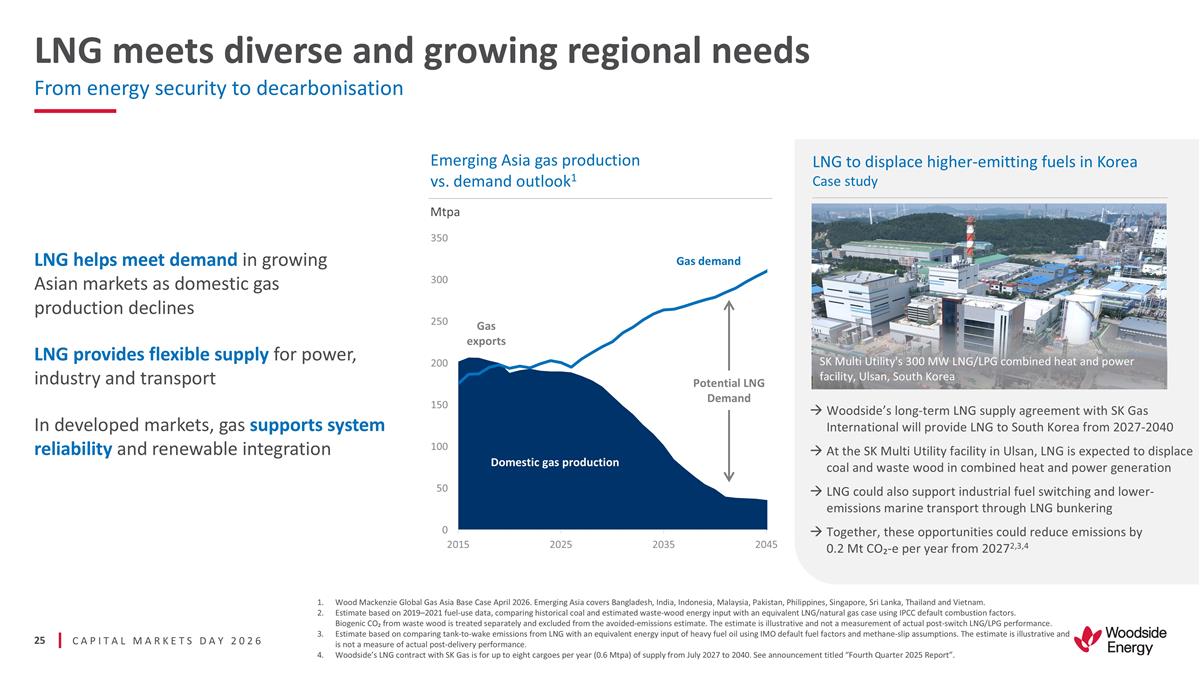
LNG meets diverse and growing
regional needs From energy security to decarbonisation Woodside’s long-term LNG supply agreement with SK Gas International will provide LNG to South Korea from 2027-2040 At the SK Multi Utility facility in Ulsan, LNG is expected to displace
coal and waste wood in combined heat and power generation LNG could also support industrial fuel switching and lower-emissions marine transport through LNG bunkering Together, these opportunities could reduce emissions by 0.2 Mt CO₂-e per year
from 20272,3,4 Wood Mackenzie Global Gas Asia Base Case April 2026. Emerging Asia covers Bangladesh, India, Indonesia, Malaysia, Pakistan, Philippines, Singapore, Sri Lanka, Thailand and Vietnam. Estimate based on 2019–2021 fuel-use data,
comparing historical coal and estimated waste-wood energy input with an equivalent LNG/natural gas case using IPCC default combustion factors. Biogenic CO₂ from waste wood is treated separately and excluded from the avoided-emissions estimate.
The estimate is illustrative and not a measurement of actual post-switch LNG/LPG performance. Estimate based on comparing tank-to-wake emissions from LNG with an equivalent energy input of heavy fuel oil using IMO default fuel factors and
methane-slip assumptions. The estimate is illustrative and is not a measure of actual post-delivery performance. Woodside’s LNG contract with SK Gas is for up to eight cargoes per year (0.6 Mtpa) of supply from July 2027 to 2040. See
announcement titled “Fourth Quarter 2025 Report”. Gas demand Domestic gas production Potential LNG Demand Mtpa Emerging Asia gas production vs. demand outlook1 LNG to displace higher-emitting fuels in Korea Case study Gas exports SK
Multi Utility's 300 MW LNG/LPG combined heat and power facility, Ulsan, South Korea LNG helps meet demand in growing Asian markets as domestic gas production declines LNG provides flexible supply for power, industry and transport In developed
markets, gas supports system reliability and renewable integration
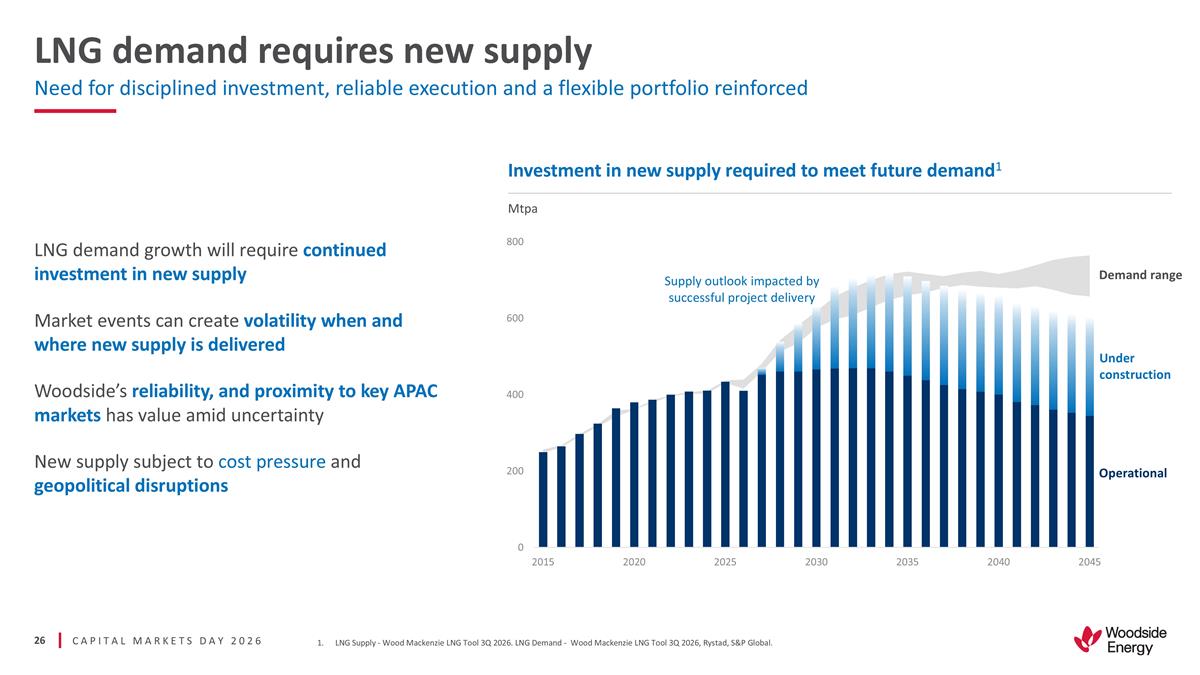
LNG demand growth will require
continued investment in new supply Market events can create volatility when and where new supply is delivered Woodside’s reliability, and proximity to key APAC markets has value amid uncertainty New supply subject to cost pressure and
geopolitical disruptions LNG Supply - Wood Mackenzie LNG Tool 3Q 2026. LNG Demand - Wood Mackenzie LNG Tool 3Q 2026, Rystad, S&P Global. LNG demand requires new supply Mtpa Investment in new supply required to meet future demand1 Need for
disciplined investment, reliable execution and a flexible portfolio reinforced Operational Under construction Demand range Supply outlook impacted by successful project delivery
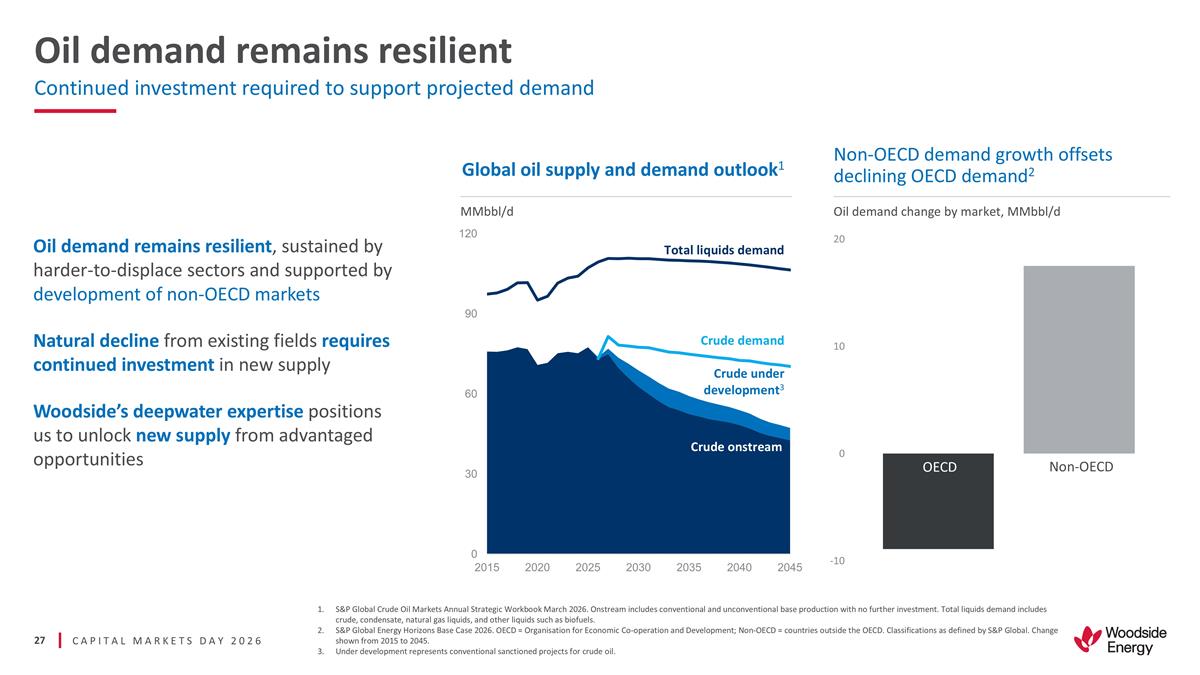
Global oil supply and demand
outlook1 Oil demand remains resilient, sustained by harder-to-displace sectors and supported by development of non-OECD markets Natural decline from existing fields requires continued investment in new supply Woodside’s deepwater expertise
positions us to unlock new supply from advantaged opportunities Oil demand remains resilient MMbbl/d Crude under development3 Crude demand Total liquids demand Continued investment required to support projected demand S&P Global Crude Oil
Markets Annual Strategic Workbook March 2026. Onstream includes conventional and unconventional base production with no further investment. Total liquids demand includes crude, condensate, natural gas liquids, and other liquids such as biofuels.
S&P Global Energy Horizons Base Case 2026. OECD = Organisation for Economic Co-operation and Development; Non-OECD = countries outside the OECD. Classifications as defined by S&P Global. Change shown from 2015 to 2045. Under development
represents conventional sanctioned projects for crude oil. Oil demand change by market, MMbbl/d Non-OECD demand growth offsets declining OECD demand2 Crude onstream OECD Non-OECD
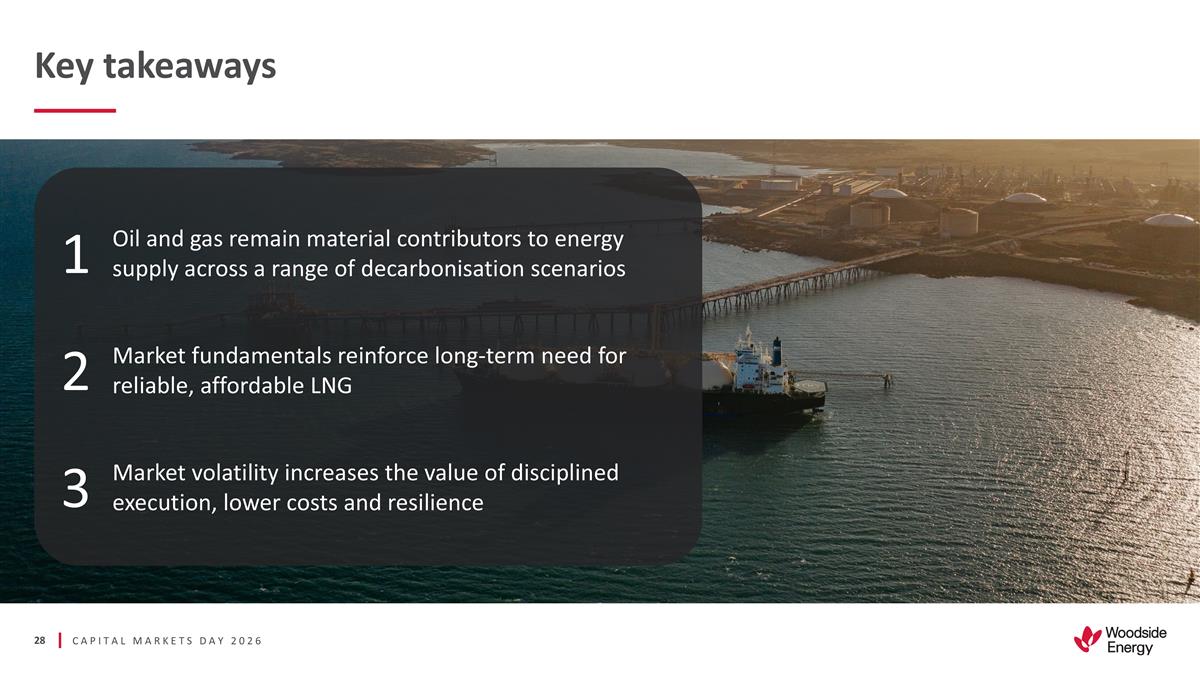
1 Oil and gas remain material
contributors to energy supply across a range of decarbonisation scenarios 2 Market fundamentals reinforce long-term need for reliable, affordable LNG 3 Market volatility increases the value of disciplined execution, lower costs and resilience Key
takeaways

Sharpen execution and maximise
value
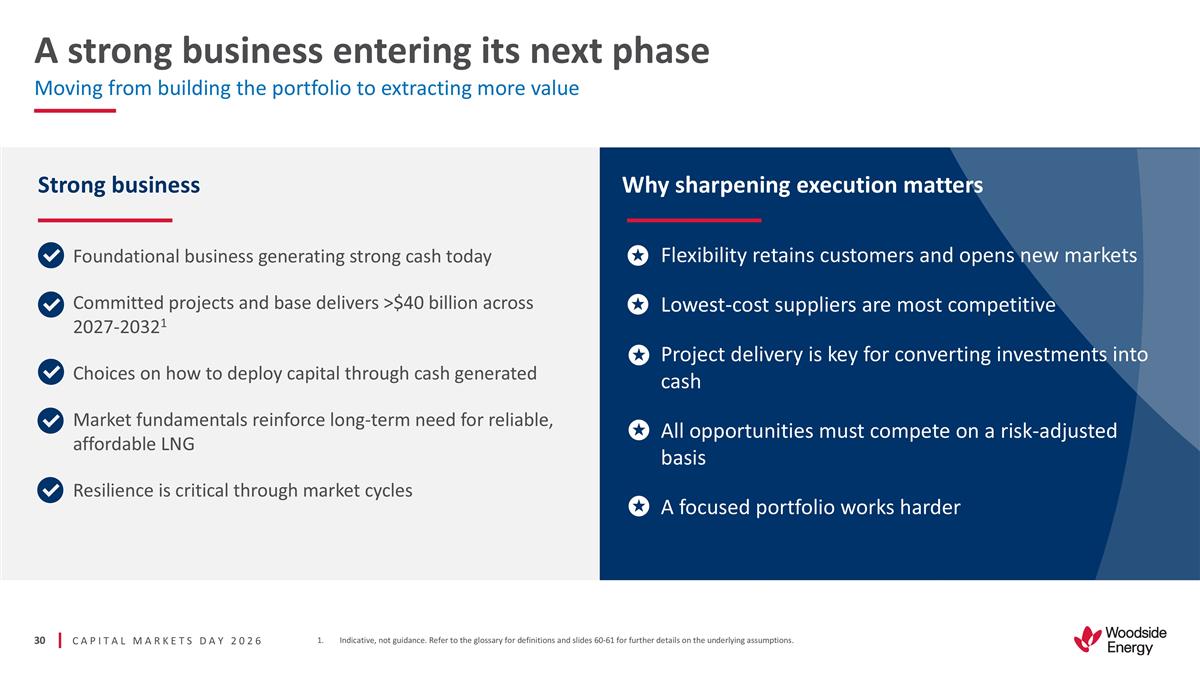
Moving from building the
portfolio to extracting more value A strong business entering its next phase Foundational business generating strong cash today Committed projects and base delivers >$40 billion across 2027-20321 Choices on how to deploy capital through cash
generated Market fundamentals reinforce long-term need for reliable, affordable LNG Resilience is critical through market cycles Strong business Why sharpening execution matters Indicative, not guidance. Refer to the glossary for definitions and
slides 60-61 for further details on the underlying assumptions. Flexibility retains customers and opens new markets Lowest-cost suppliers are most competitive Project delivery is key for converting investments into cash All opportunities must
compete on a risk-adjusted basis A focused portfolio works harder
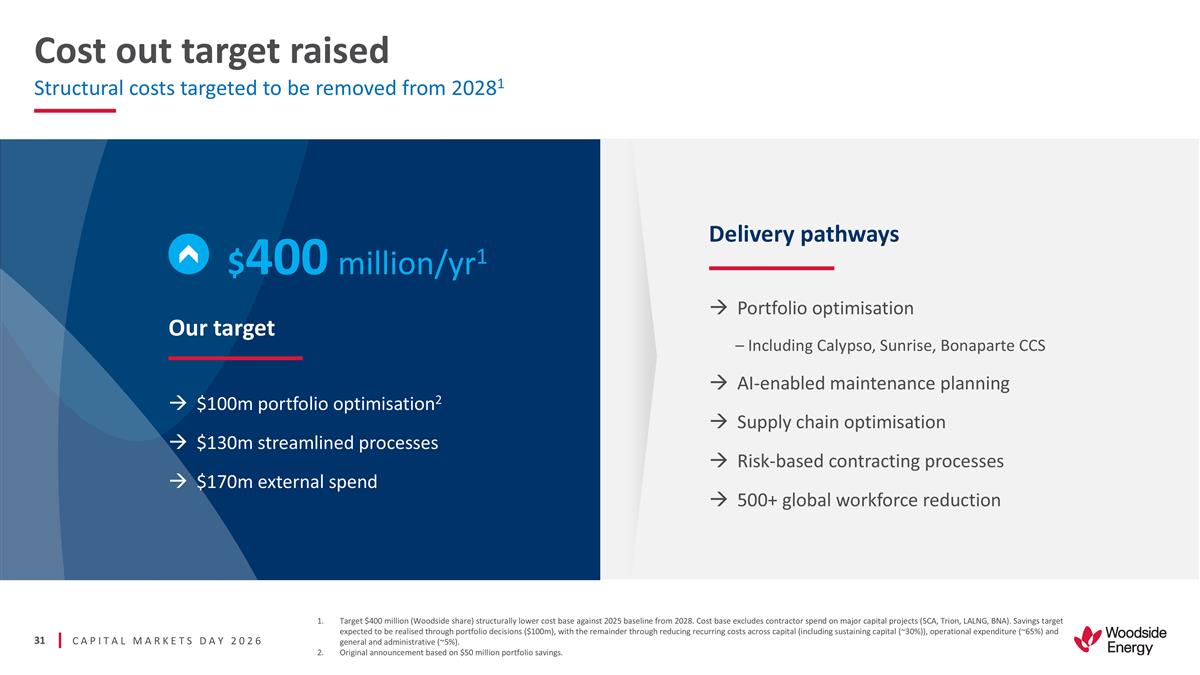
Cost out target raised Target
$400 million (Woodside share) structurally lower cost base against 2025 baseline from 2028. Cost base excludes contractor spend on major capital projects (SCA, Trion, LALNG, BNA). Savings target expected to be realised through portfolio decisions
($100m), with the remainder through reducing recurring costs across capital (including sustaining capital (~30%)), operational expenditure (~65%) and general and administrative (~5%). Original announcement based on $50 million portfolio savings.
Structural costs targeted to be removed from 20281 Our target $100m portfolio optimisation2 $130m streamlined processes $170m external spend Delivery pathways Portfolio optimisation – Including Calypso, Sunrise, Bonaparte CCS AI-enabled
maintenance planning Supply chain optimisation Risk-based contracting processes 500+ global workforce reduction $400 million/yr1
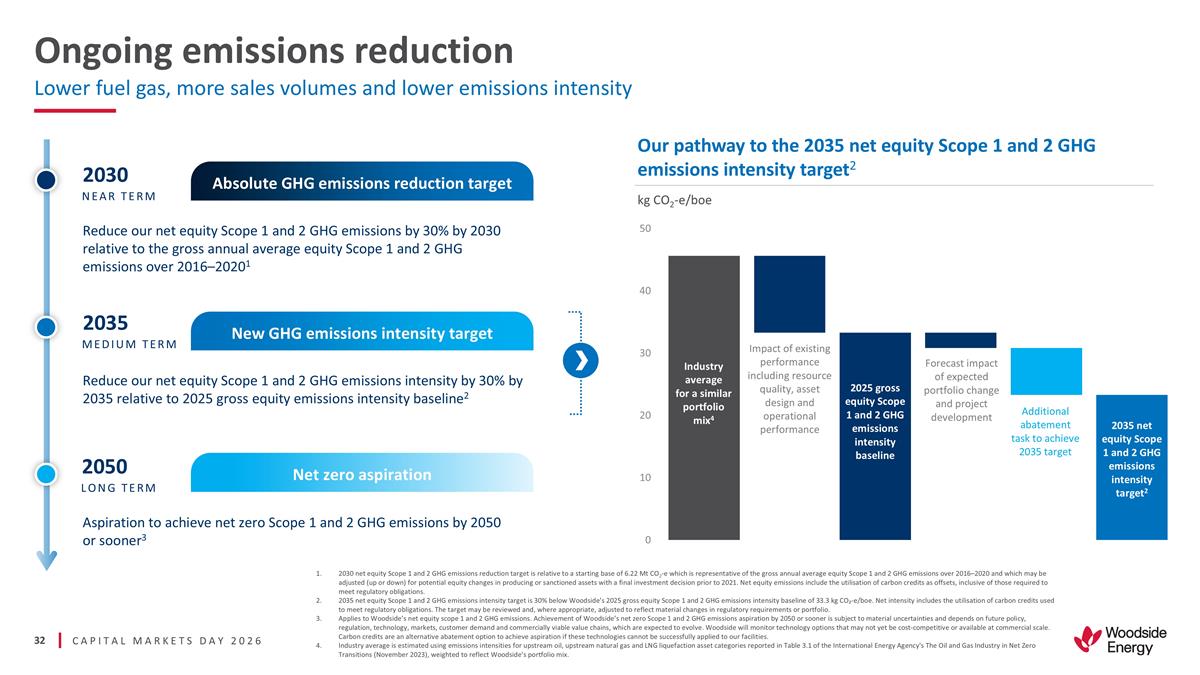
Ongoing emissions reduction Lower
fuel gas, more sales volumes and lower emissions intensity 2030 net equity Scope 1 and 2 GHG emissions reduction target is relative to a starting base of 6.22 Mt CO2-e which is representative of the gross annual average equity Scope 1 and 2 GHG
emissions over 2016–2020 and which may be adjusted (up or down) for potential equity changes in producing or sanctioned assets with a final investment decision prior to 2021. Net equity emissions include the utilisation of carbon credits as
offsets, inclusive of those required to meet regulatory obligations. 2035 net equity Scope 1 and 2 GHG emissions intensity target is 30% below Woodside's 2025 gross equity Scope 1 and 2 GHG emissions intensity baseline of 33.3 kg CO₂-e/boe.
Net intensity includes the utilisation of carbon credits used to meet regulatory obligations. The target may be reviewed and, where appropriate, adjusted to reflect material changes in regulatory requirements or portfolio. Applies to
Woodside’s net equity scope 1 and 2 GHG emissions. Achievement of Woodside’s net zero Scope 1 and 2 GHG emissions aspiration by 2050 or sooner is subject to material uncertainties and depends on future policy, regulation, technology,
markets, customer demand and commercially viable value chains, which are expected to evolve. Woodside will monitor technology options that may not yet be cost-competitive or available at commercial scale. Carbon credits are an alternative abatement
option to achieve aspiration if these technologies cannot be successfully applied to our facilities. Industry average is estimated using emissions intensities for upstream oil, upstream natural gas and LNG liquefaction asset categories reported in
Table 3.1 of the International Energy Agency's The Oil and Gas Industry in Net Zero Transitions (November 2023), weighted to reflect Woodside's portfolio mix. Our pathway to the 2035 net equity Scope 1 and 2 GHG emissions intensity target2 kg
CO2-e/boe Industry average for a similar portfolio mix4 Impact of existing performance including resource quality, asset design and operational performance 2025 gross equity Scope 1 and 2 GHG emissions intensity baseline Forecast impact of expected
portfolio change and project development Additional abatement task to achieve 2035 target 2035 net equity Scope 1 and 2 GHG emissions intensity target2 2030 NEAR TERM Reduce our net equity Scope 1 and 2 GHG emissions by 30% by 2030 relative to the
gross annual average equity Scope 1 and 2 GHG emissions over 2016–20201 Absolute GHG emissions reduction target Reduce our net equity Scope 1 and 2 GHG emissions intensity by 30% by 2035 relative to 2025 gross equity emissions intensity
baseline2 New GHG emissions intensity target Aspiration to achieve net zero Scope 1 and 2 GHG emissions by 2050 or sooner3 Net zero aspiration 2035 MEDIUM TERM 2050 LONG TERM
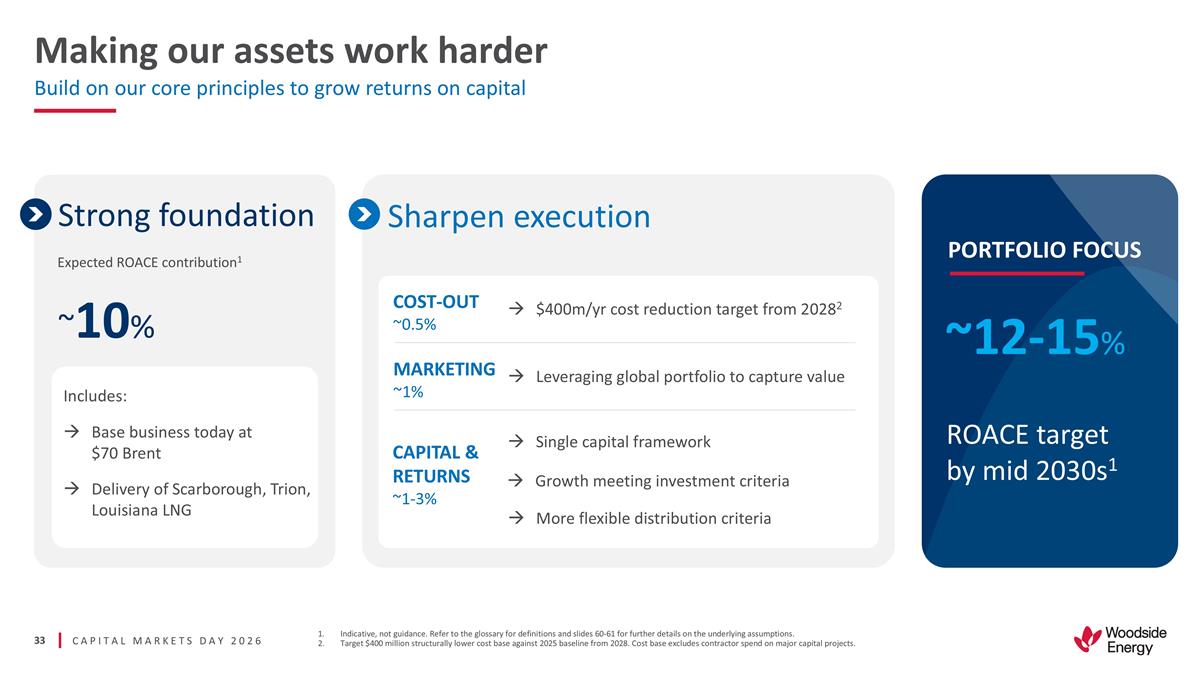
Includes: Base business today at
$70 Brent Delivery of Scarborough, Trion, Louisiana LNG Strong foundation Sharpen execution Expected ROACE contribution1 ~10% Making our assets work harder Build on our core principles to grow returns on capital Indicative, not guidance. Refer to
the glossary for definitions and slides 60-61 for further details on the underlying assumptions. Target $400 million structurally lower cost base against 2025 baseline from 2028. Cost base excludes contractor spend on major capital projects. ROACE
target by mid 2030s1 ~12-15% CAPITAL & RETURNS ~1-3% Single capital framework MARKETING ~1% Leveraging global portfolio to capture value COST-OUT ~0.5% $400m/yr cost reduction target from 20282 More flexible distribution criteria PORTFOLIO FOCUS
Growth meeting investment criteria
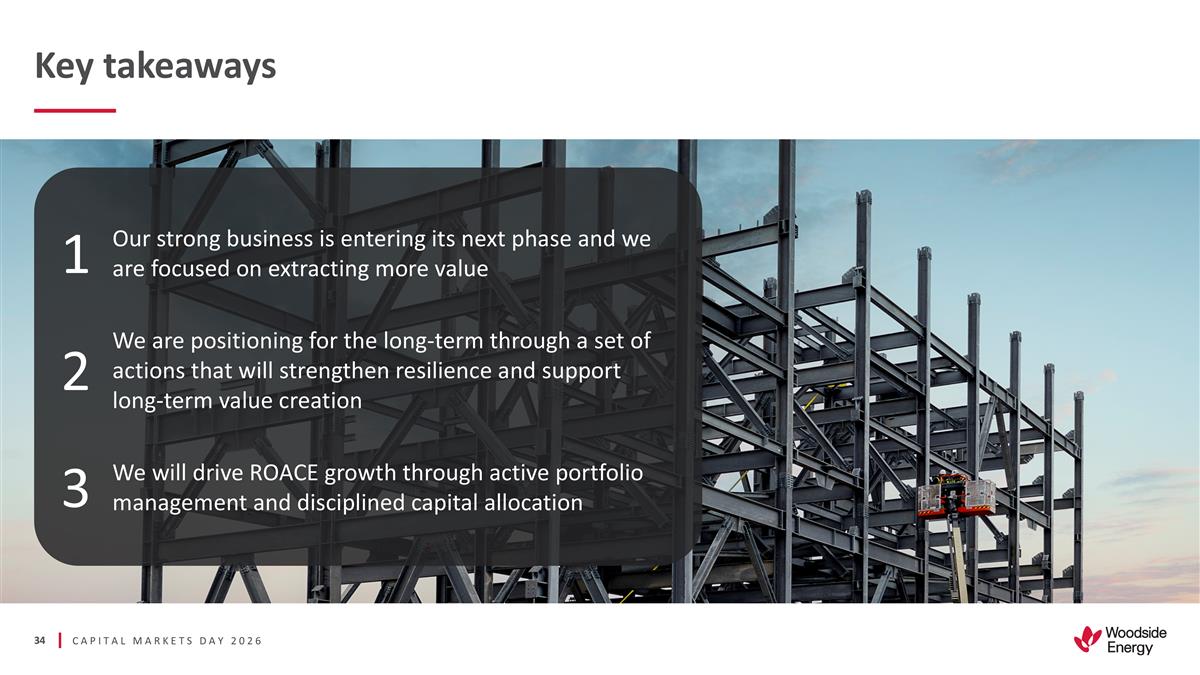
1 Our strong business is entering
its next phase and we are focused on extracting more value 2 We are positioning for the long-term through a set of actions that will strengthen resilience and support long-term value creation 3 We will drive ROACE growth through active portfolio
management and disciplined capital allocation Key takeaways
Disciplined capital strategy
GRAHAM TIVER | EVP and Chief Financial Officer
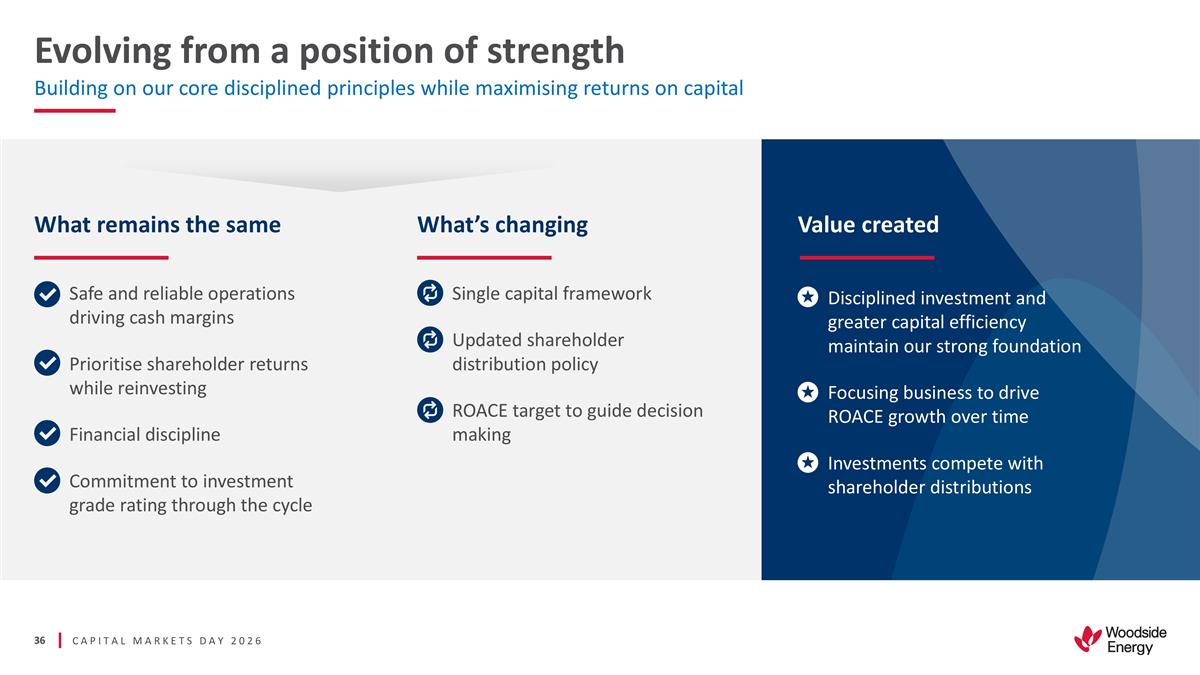
Evolving from a position of
strength Value created Disciplined investment and greater capital efficiency maintain our strong foundation Focusing business to drive ROACE growth over time Investments compete with shareholder distributions Safe and reliable operations driving
cash margins Prioritise shareholder returns while reinvesting Financial discipline Commitment to investment grade rating through the cycle What remains the same What’s changing Single capital framework Updated shareholder distribution policy
ROACE target to guide decision making Building on our core disciplined principles while maximising returns on capital
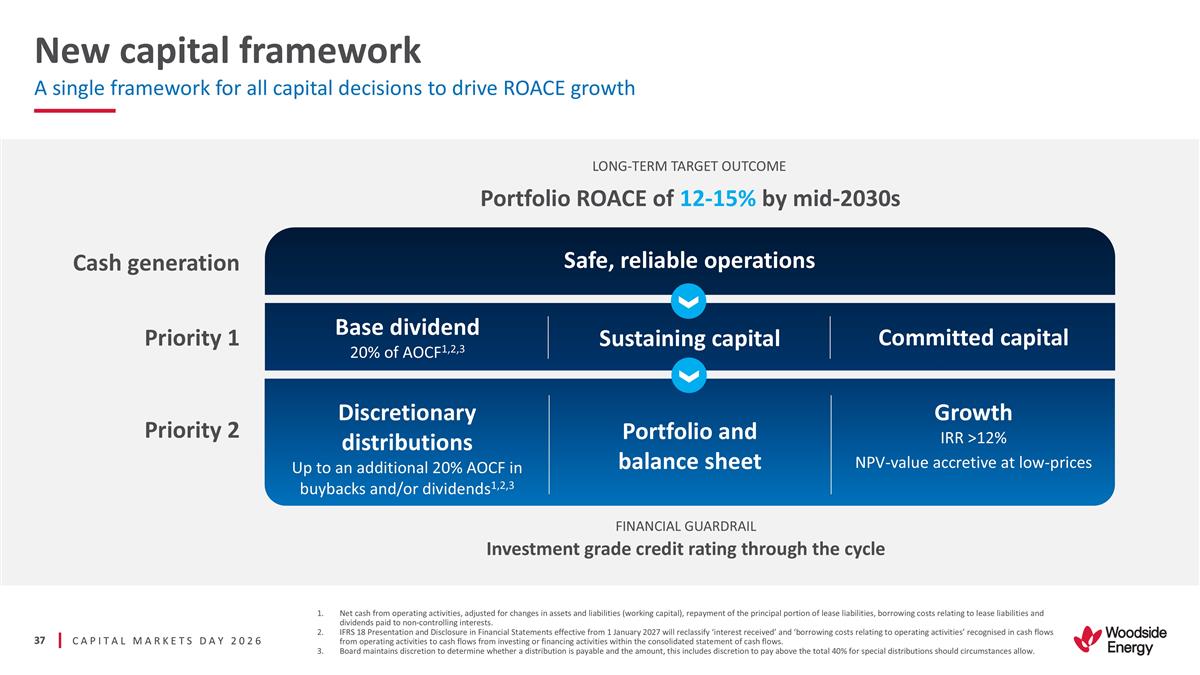
New capital framework A single
framework for all capital decisions to drive ROACE growth Net cash from operating activities, adjusted for changes in assets and liabilities (working capital), repayment of the principal portion of lease liabilities, borrowing costs relating to
lease liabilities and dividends paid to non-controlling interests. IFRS 18 Presentation and Disclosure in Financial Statements effective from 1 January 2027 will reclassify ‘interest received’ and ‘borrowing costs relating to
operating activities’ recognised in cash flows from operating activities to cash flows from investing or financing activities within the consolidated statement of cash flows. Board maintains discretion to determine whether a distribution is
payable and the amount, this includes discretion to pay above the total 40% for special distributions should circumstances allow. CAPITAL MARKETS DAY 2026 Portfolio ROACE of 12-15% by mid-2030s LONG-TERM TARGET OUTCOME Sustaining capital Base
dividend 20% of AOCF1,2,3 Safe, reliable operations Investment grade credit rating through the cycle FINANCIAL GUARDRAIL Cash generation Priority 1 Priority 2 Committed capital Growth IRR >12% NPV-value accretive at low-prices Portfolio and
balance sheet Discretionary distributions Up to an additional 20% AOCF in buybacks and/or dividends1,2,3
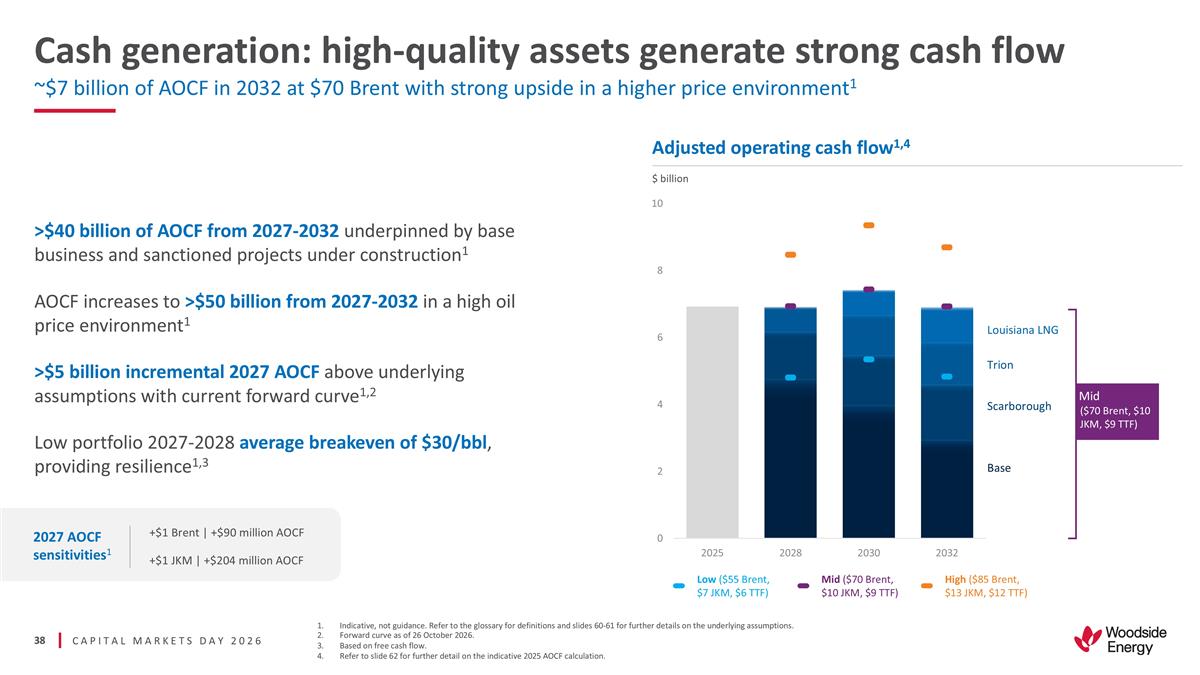
Cash generation: high-quality
assets generate strong cash flow ~$7 billion of AOCF in 2032 at $70 Brent with strong upside in a higher price environment1 Base Trion Scarborough Louisiana LNG Adjusted operating cash flow1,4 $ billion >$40 billion of AOCF from 2027-2032
underpinned by base business and sanctioned projects under construction1 AOCF increases to >$50 billion from 2027-2032 in a high oil price environment1 >$5 billion incremental 2027 AOCF above underlying assumptions with current forward
curve1,2 Low portfolio 2027-2028 average breakeven of $30/bbl, providing resilience1,3 Mid ($70 Brent, $10 JKM, $9 TTF) Indicative, not guidance. Refer to the glossary for definitions and slides 60-61 for further details on the underlying
assumptions. Forward curve as of 26 October 2026. Based on free cash flow. Refer to slide 62 for further detail on the indicative 2025 AOCF calculation. High ($85 Brent, $13 JKM, $12 TTF) Low ($55 Brent, $7 JKM, $6 TTF) Mid ($70 Brent, $10 JKM, $9
TTF) 2027 AOCF sensitivities1 +$1 Brent | +$90 million AOCF +$1 JKM | +$204 million AOCF
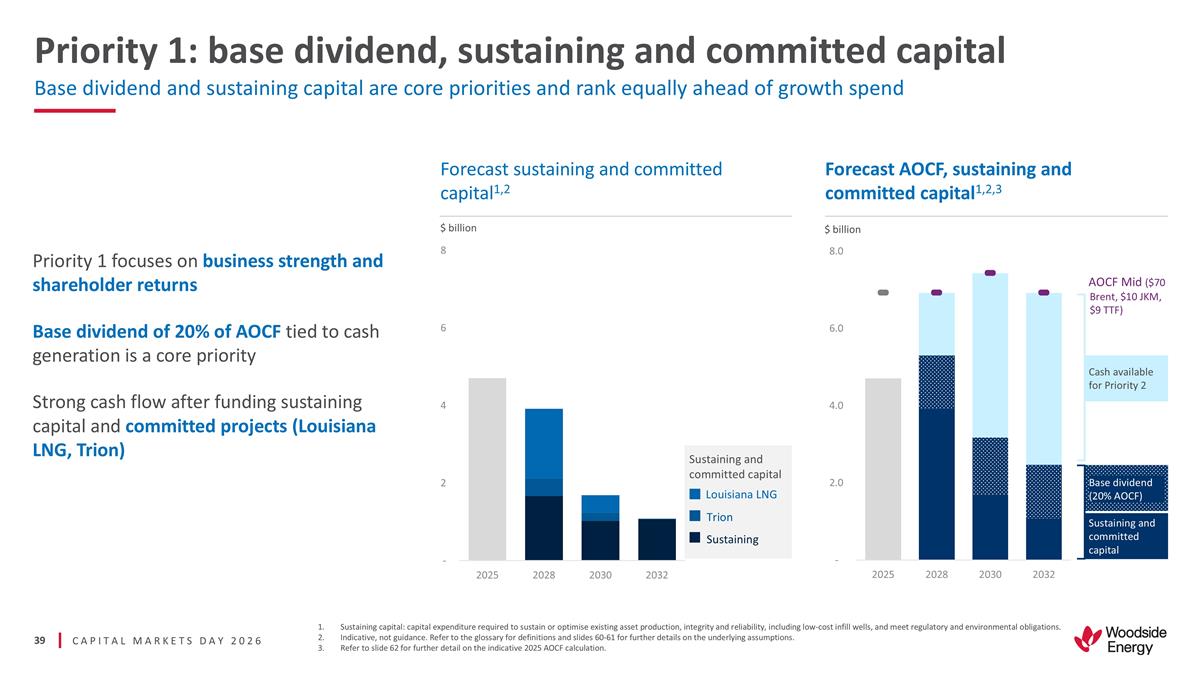
Priority 1: base dividend,
sustaining and committed capital Base dividend and sustaining capital are core priorities and rank equally ahead of growth spend Sustaining capital: capital expenditure required to sustain or optimise existing asset production, integrity and
reliability, including low-cost infill wells, and meet regulatory and environmental obligations. Indicative, not guidance. Refer to the glossary for definitions and slides 60-61 for further details on the underlying assumptions. Refer to slide 62
for further detail on the indicative 2025 AOCF calculation. Priority 1 focuses on business strength and shareholder returns Base dividend of 20% of AOCF tied to cash generation is a core priority Strong cash flow after funding sustaining capital and
committed projects (Louisiana LNG, Trion) $ billion Forecast sustaining and committed capital1,2 Forecast AOCF, sustaining and committed capital1,2,3 $ billion Sustaining Trion Louisiana LNG Sustaining and committed capital Cash available for
Priority 2 Base dividend (20% AOCF) Sustaining and committed capital AOCF Mid ($70 Brent, $10 JKM, $9 TTF) Base dividend (20% AOCF)
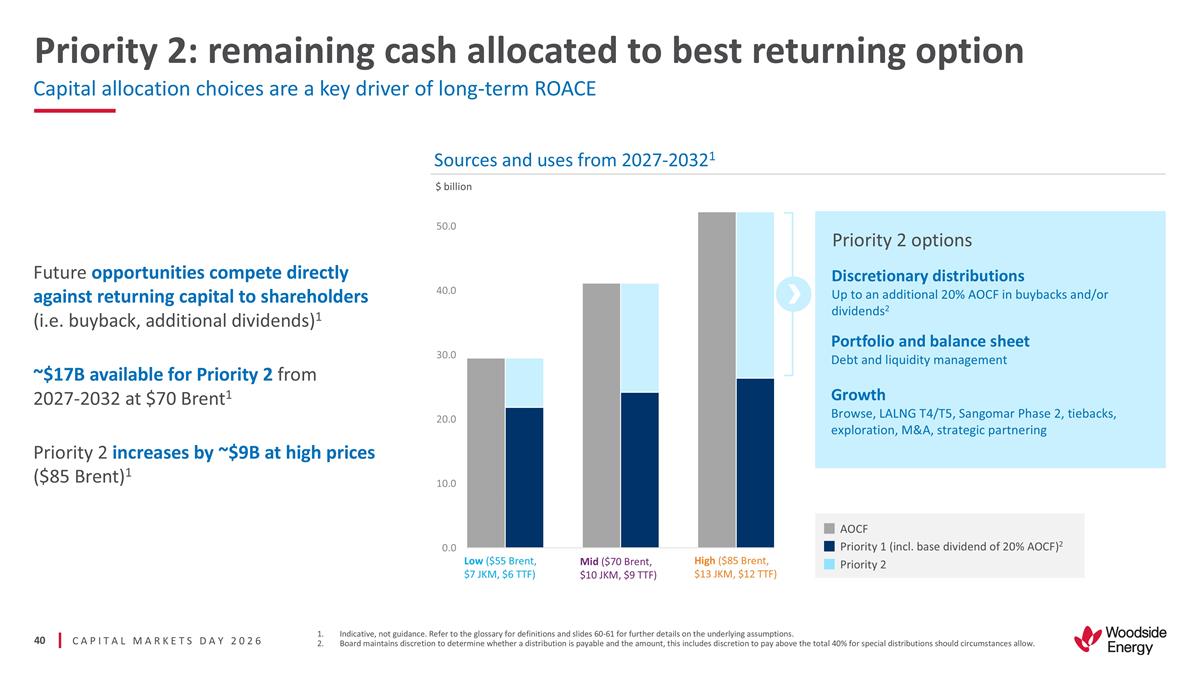
Priority 2: remaining cash
allocated to best returning option Capital allocation choices are a key driver of long-term ROACE Indicative, not guidance. Refer to the glossary for definitions and slides 60-61 for further details on the underlying assumptions. Board maintains
discretion to determine whether a distribution is payable and the amount, this includes discretion to pay above the total 40% for special distributions should circumstances allow. Future opportunities compete directly against returning capital to
shareholders (i.e. buyback, additional dividends)1 ~$17B available for Priority 2 from 2027-2032 at $70 Brent1 Priority 2 increases by ~$9B at high prices ($85 Brent)1 $ billion Sources and uses from 2027-20321 Priority 2 options Discretionary
distributions Up to an additional 20% AOCF in buybacks and/or dividends2 Portfolio and balance sheet Debt and liquidity management Growth Browse, LALNG T4/T5, Sangomar Phase 2, tiebacks, exploration, M&A, strategic partnering AOCF Priority 1
(incl. base dividend of 20% AOCF)2 Priority 2 High ($85 Brent, $13 JKM, $12 TTF) Mid ($70 Brent, $10 JKM, $9 TTF) Low ($55 Brent, $7 JKM, $6 TTF)
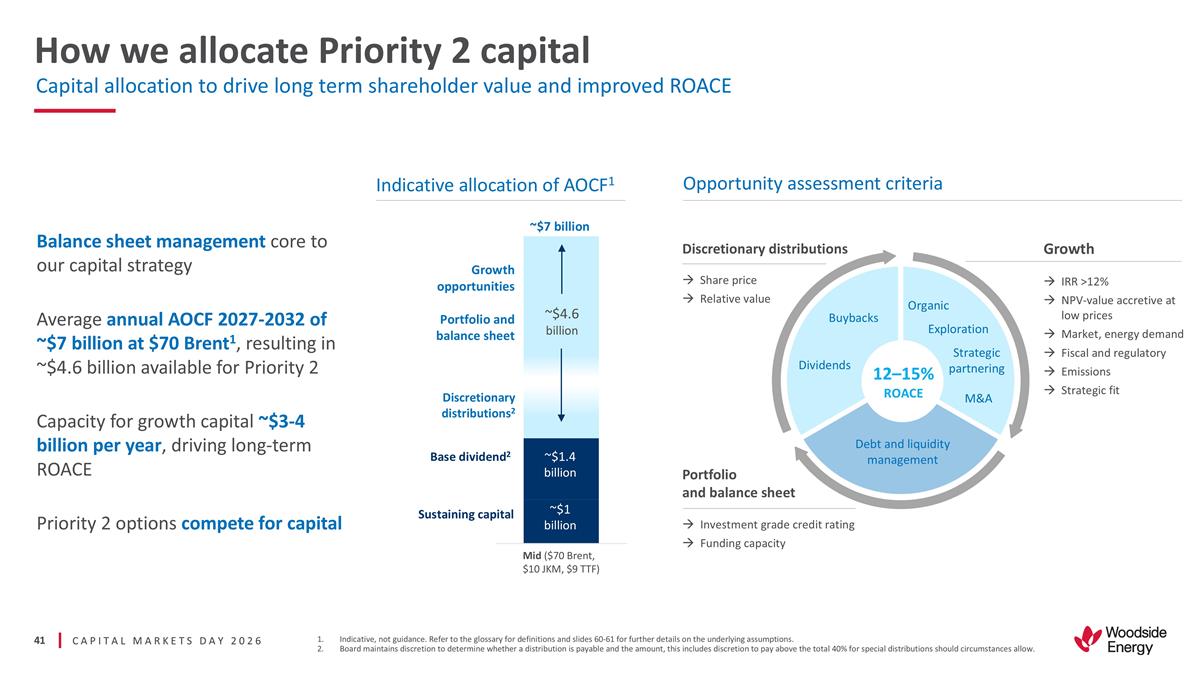
How we allocate Priority 2
capital Capital allocation to drive long term shareholder value and improved ROACE CAPITAL MARKETS DAY 2026 Indicative, not guidance. Refer to the glossary for definitions and slides 60-61 for further details on the underlying assumptions. Board
maintains discretion to determine whether a distribution is payable and the amount, this includes discretion to pay above the total 40% for special distributions should circumstances allow. Balance sheet management core to our capital strategy
Average annual AOCF 2027-2032 of ~$7 billion at $70 Brent1, resulting in ~$4.6 billion available for Priority 2 Capacity for growth capital ~$3-4 billion per year, driving long-term ROACE Priority 2 options compete for capital Discretionary
distributions Share price Relative value Investment grade credit rating Funding capacity Growth IRR >12% NPV-value accretive at low prices Market, energy demand Fiscal and regulatory Emissions Strategic fit Portfolio and balance sheet
12–15% ROACE Organic Buybacks Debt and liquidity management Dividends Strategic partnering Exploration M&A Discretionary distributions2 Growth opportunities Portfolio and balance sheet Base dividend2 Sustaining capital Mid ($70 Brent, $10
JKM, $9 TTF) ~$1 billion ~$1.4 billion ~$4.6 billion Indicative allocation of AOCF1 Opportunity assessment criteria ~$7 billion
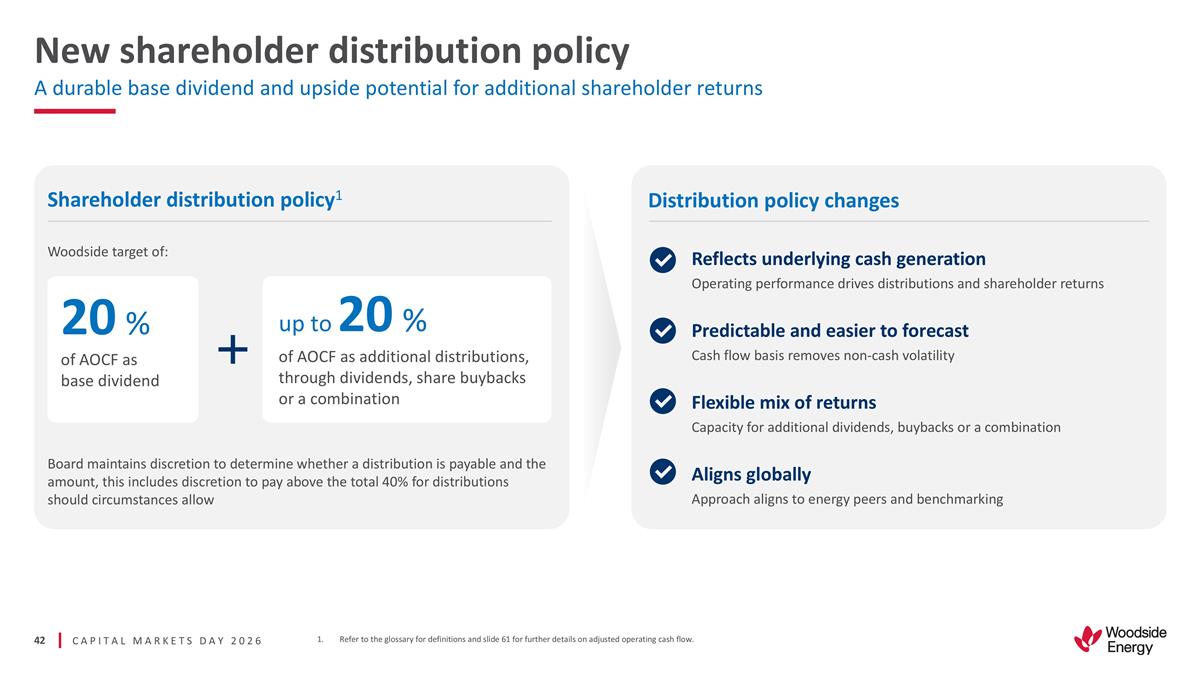
New shareholder distribution
policy A durable base dividend and upside potential for additional shareholder returns Refer to the glossary for definitions and slide 61 for further details on adjusted operating cash flow. 20 % of AOCF as base dividend Board maintains discretion
to determine whether a distribution is payable and the amount, this includes discretion to pay above the total 40% for distributions should circumstances allow Woodside target of: up to 20 % of AOCF as additional distributions, through dividends,
share buybacks or a combination Reflects underlying cash generation Operating performance drives distributions and shareholder returns Predictable and easier to forecast Cash flow basis removes non-cash volatility Flexible mix of returns Capacity
for additional dividends, buybacks or a combination Aligns globally Approach aligns to energy peers and benchmarking Distribution policy changes Shareholder distribution policy1
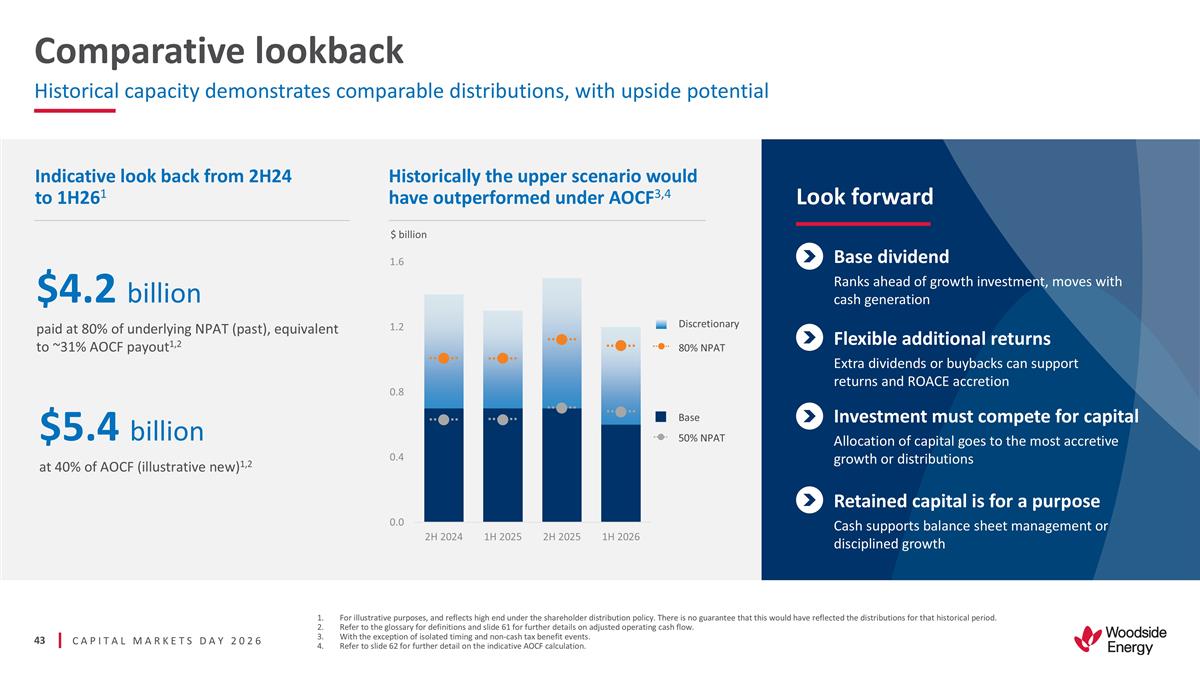
Comparative lookback Historical
capacity demonstrates comparable distributions, with upside potential For illustrative purposes, and reflects high end under the shareholder distribution policy. There is no guarantee that this would have reflected the distributions for that
historical period. Refer to the glossary for definitions and slide 61 for further details on adjusted operating cash flow. With the exception of isolated timing and non-cash tax benefit events. Refer to slide 62 for further detail on the indicative
AOCF calculation. $4.2 billion paid at 80% of underlying NPAT (past), equivalent to ~31% AOCF payout1,2 Indicative look back from 2H24 to 1H261 Base dividend Ranks ahead of growth investment, moves with cash generation Flexible additional returns
Extra dividends or buybacks can support returns and ROACE accretion $5.4 billion at 40% of AOCF (illustrative new)1,2 Base Discretionary 50% NPAT 80% NPAT Investment must compete for capital Allocation of capital goes to the most accretive growth or
distributions Retained capital is for a purpose Cash supports balance sheet management or disciplined growth Look forward $ billion Historically the upper scenario would have outperformed under AOCF3,4
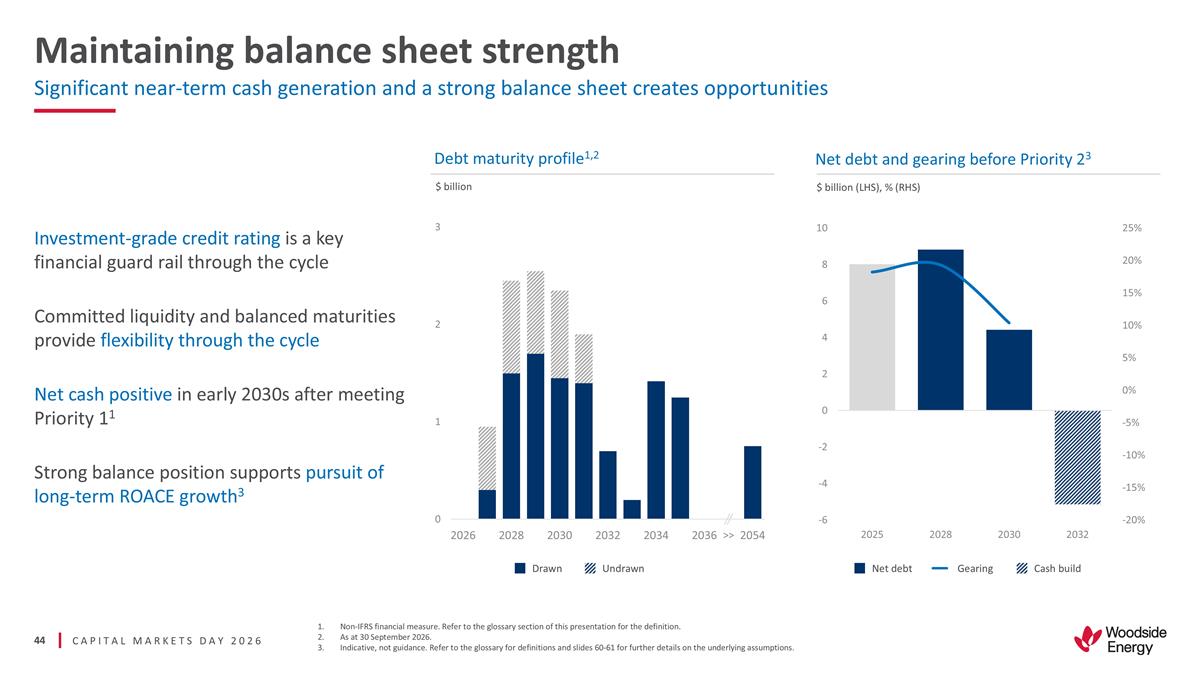
Maintaining balance sheet
strength Significant near-term cash generation and a strong balance sheet creates opportunities Investment-grade credit rating is a key financial guard rail through the cycle Committed liquidity and balanced maturities provide flexibility through
the cycle Net cash positive in early 2030s after meeting Priority 11 Strong balance position supports pursuit of long-term ROACE growth3 Non-IFRS financial measure. Refer to the glossary section of this presentation for the definition. As at 30
September 2026. Indicative, not guidance. Refer to the glossary for definitions and slides 60-61 for further details on the underlying assumptions. Net debt Gearing Cash build Drawn Undrawn $ billion Debt maturity profile1,2 $ billion (LHS), % (RHS)
Net debt and gearing before Priority 23 >>
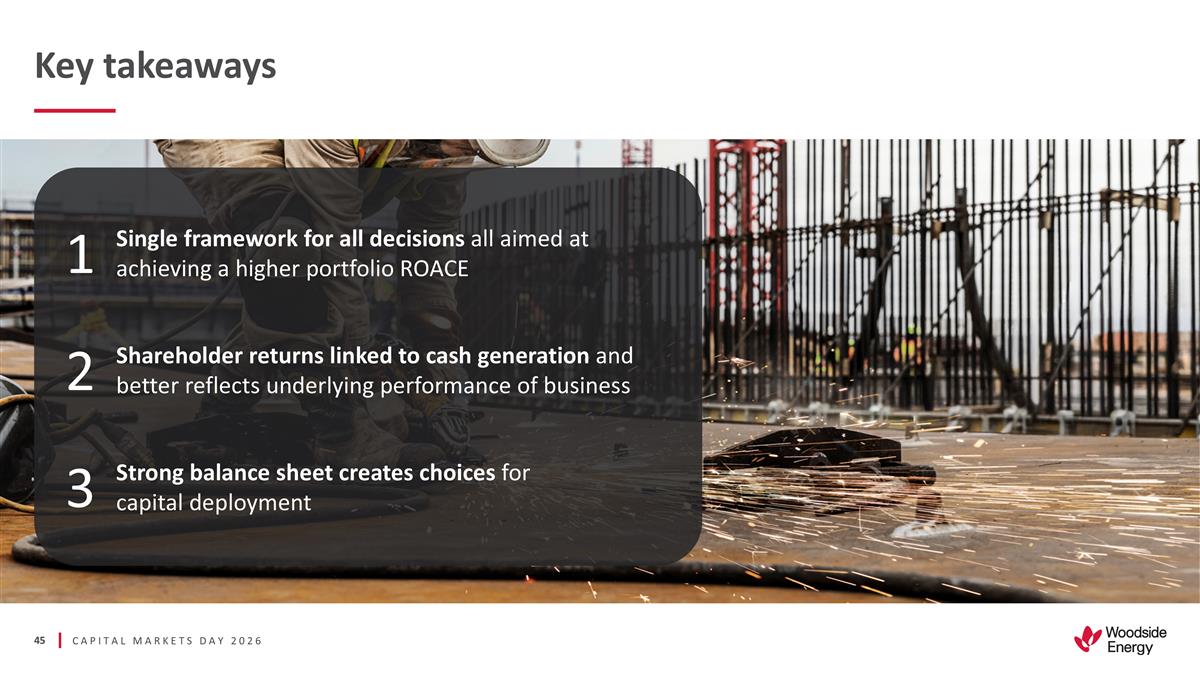
1 Single framework for all
decisions all aimed at achieving a higher portfolio ROACE 2 Shareholder returns linked to cash generation and better reflects underlying performance of business 3 Strong balance sheet creates choices for capital deployment Key takeaways
Active portfolio management MARK
ABBOTSFORD | EVP and Chief Commercial Officer
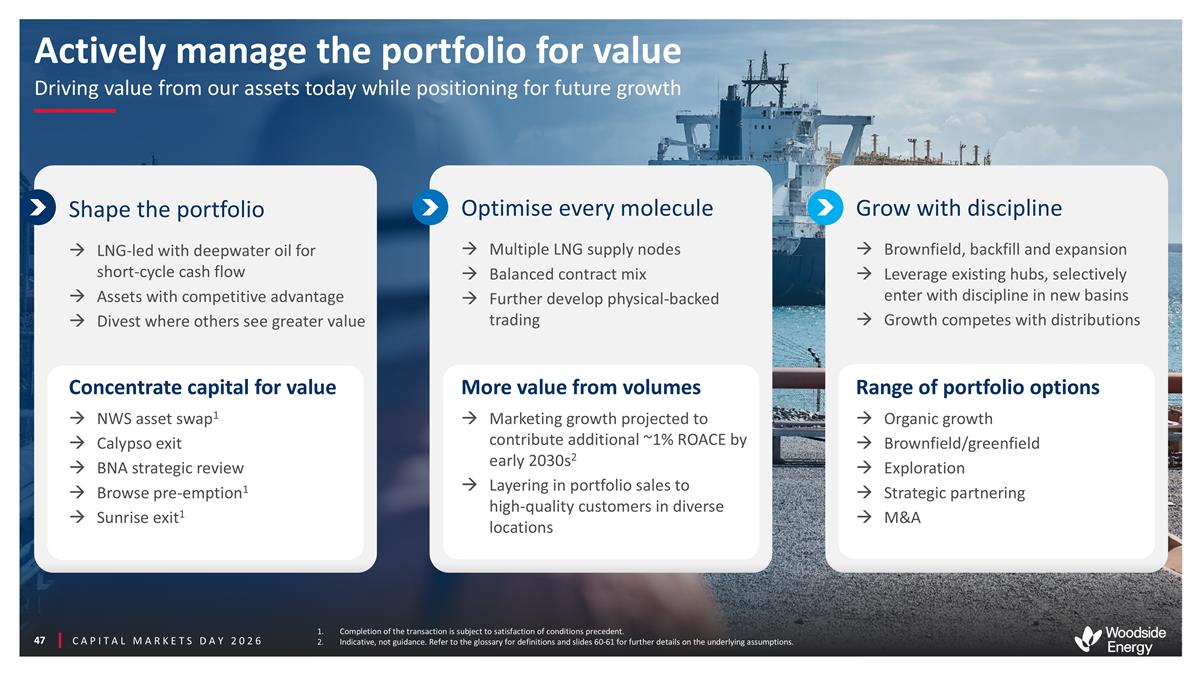
Actively manage the portfolio for
value Driving value from our assets today while positioning for future growth Shape the portfolio Optimise every molecule Grow with discipline LNG-led with deepwater oil for short-cycle cash flow Assets with competitive advantage Divest where others
see greater value Multiple LNG supply nodes Balanced contract mix Further develop physical-backed trading Brownfield, backfill and expansion Leverage existing hubs, selectively enter with discipline in new basins Growth competes with distributions
Concentrate capital for value NWS asset swap1 Calypso exit BNA strategic review Browse pre-emption1 Sunrise exit1 More value from volumes Marketing growth projected to contribute additional ~1% ROACE by early 2030s2 Layering in portfolio sales to
high-quality customers in diverse locations Range of portfolio options Organic growth Brownfield/greenfield Exploration Strategic partnering M&A CAPITAL MARKETS DAY 2026 Completion of the transaction is subject to satisfaction of conditions
precedent. Indicative, not guidance. Refer to the glossary for definitions and slides 60-61 for further details on the underlying assumptions.
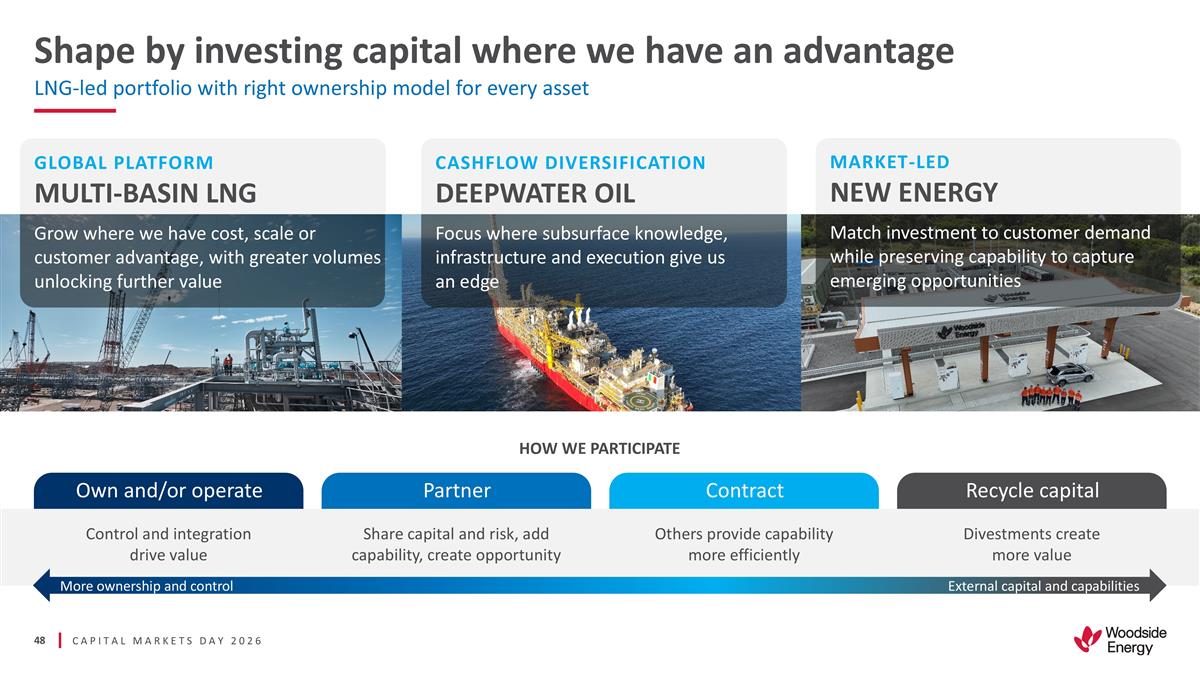
Shape by investing capital where
we have an advantage LNG-led portfolio with right ownership model for every asset Grow where we have cost, scale or customer advantage, with greater volumes unlocking further value CASHFLOW DIVERSIFICATION DEEPWATER OIL Focus where subsurface
knowledge, infrastructure and execution give us an edge MARKET-LED NEW ENERGY Match investment to customer demand while preserving capability to capture emerging opportunities GLOBAL PLATFORM MULTI-BASIN LNG More ownership and control External
capital and capabilities Own and/or operate Control and integration drive value Partner Share capital and risk, add capability, create opportunity Contract Others provide capability more efficiently Recycle capital Divestments create more value HOW
WE PARTICIPATE
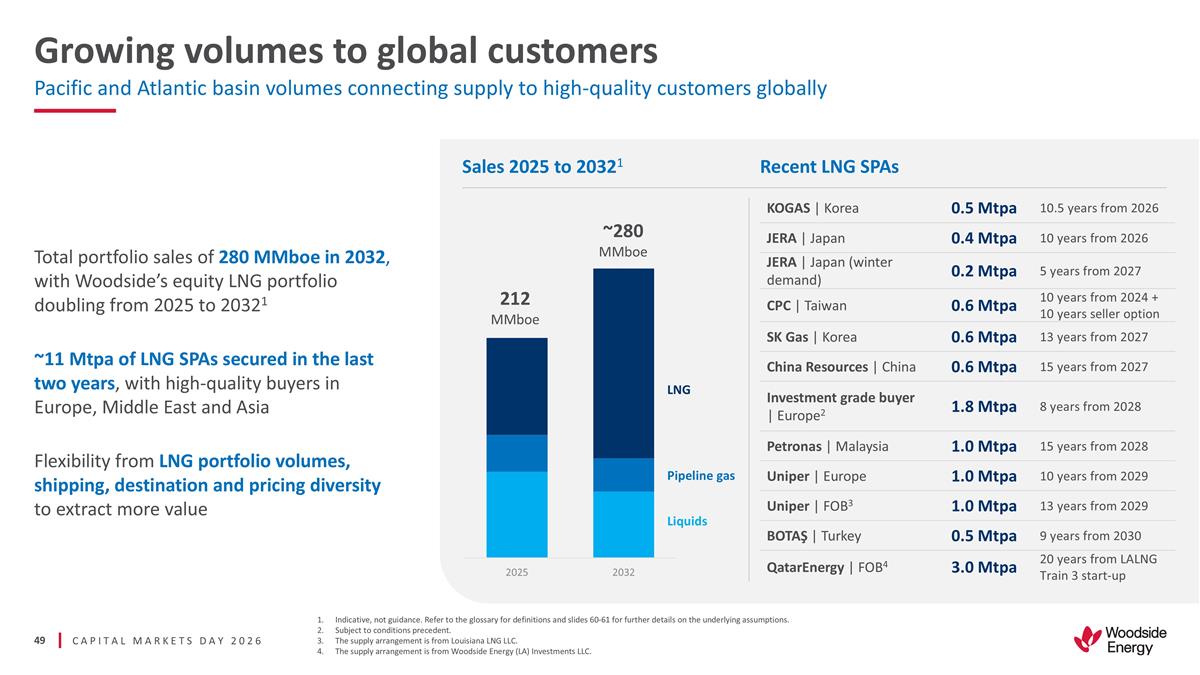
Total portfolio sales of 280
MMboe in 2032, with Woodside’s equity LNG portfolio doubling from 2025 to 20321 ~11 Mtpa of LNG SPAs secured in the last two years, with high-quality buyers in Europe, Middle East and Asia Flexibility from LNG portfolio volumes, shipping,
destination and pricing diversity to extract more value Sales 2025 to 20321 Growing volumes to global customers Pacific and Atlantic basin volumes connecting supply to high-quality customers globally LNG Pipeline gas Liquids ~280 MMboe Ammonia KOGAS
| Korea 0.5 Mtpa 10.5 years from 2026 JERA | Japan 0.4 Mtpa 10 years from 2026 JERA | Japan (winter demand) 0.2 Mtpa 5 years from 2027 CPC | Taiwan 0.6 Mtpa 10 years from 2024 + 10 years seller option SK Gas | Korea 0.6 Mtpa 13 years from 2027 China
Resources | China 0.6 Mtpa 15 years from 2027 Investment grade buyer | Europe2 1.8 Mtpa 8 years from 2028 Petronas | Malaysia 1.0 Mtpa 15 years from 2028 Uniper | Europe 1.0 Mtpa 10 years from 2029 Uniper | FOB3 1.0 Mtpa 13 years from 2029
BOTAŞ | Turkey 0.5 Mtpa 9 years from 2030 QatarEnergy | FOB4 3.0 Mtpa 20 years from LALNG Train 3 start-up Recent LNG SPAs Indicative, not guidance. Refer to the glossary for definitions and slides 60-61 for further details on the underlying
assumptions. Subject to conditions precedent. The supply arrangement is from Louisiana LNG LLC. The supply arrangement is from Woodside Energy (LA) Investments LLC. 212 MMboe
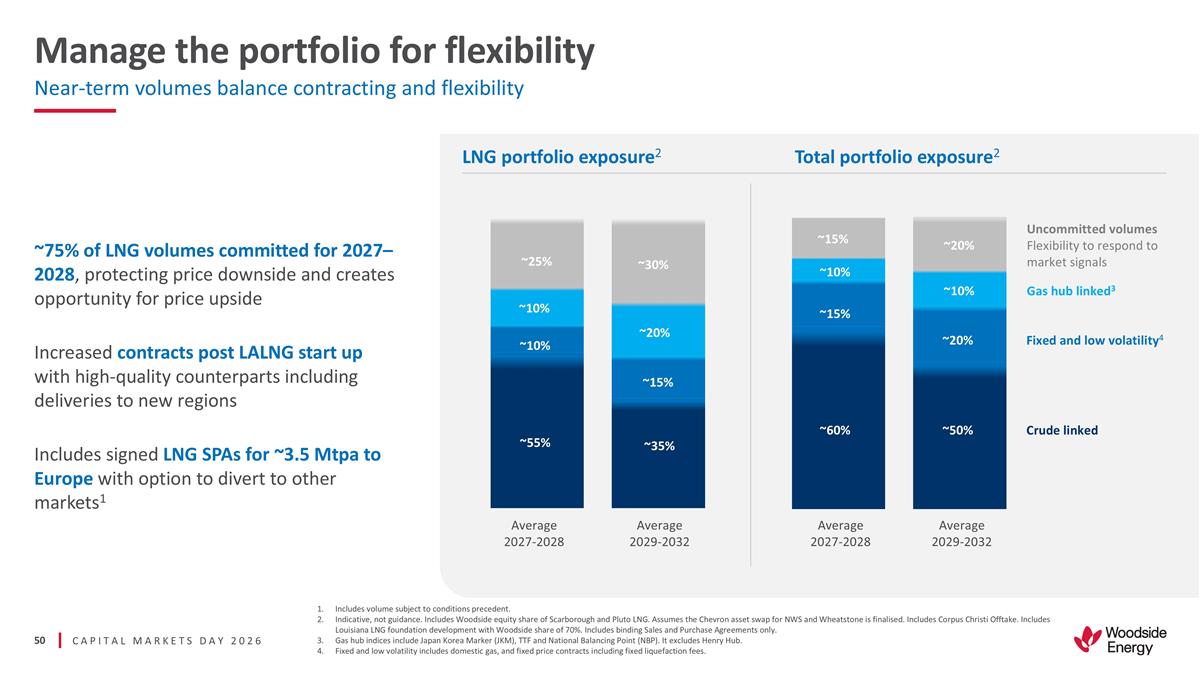
Manage the portfolio for
flexibility Near-term volumes balance contracting and flexibility Includes volume subject to conditions precedent. Indicative, not guidance. Includes Woodside equity share of Scarborough and Pluto LNG. Assumes the Chevron asset swap for NWS and
Wheatstone is finalised. Includes Corpus Christi Offtake. Includes Louisiana LNG foundation development with Woodside share of 70%. Includes binding Sales and Purchase Agreements only. Gas hub indices include Japan Korea Marker (JKM), TTF and
National Balancing Point (NBP). It excludes Henry Hub. Fixed and low volatility includes domestic gas, and fixed price contracts including fixed liquefaction fees. ~75% of LNG volumes committed for 2027–2028, protecting price downside and
creates opportunity for price upside Increased contracts post LALNG start up with high-quality counterparts including deliveries to new regions Includes signed LNG SPAs for ~3.5 Mtpa to Europe with option to divert to other markets1 LNG portfolio
exposure2 Average 2027-2028 Average 2029-2032 Crude linked Fixed and low volatility4 Uncommitted volumes Flexibility to respond to market signals Average 2027-2028 Average 2029-2032 Gas hub linked3 Total portfolio exposure2 ~25% ~30% ~10% ~20% ~15%
~35% ~55% ~10% ~15% ~20% ~10% ~15% ~60% ~50% ~20% ~10%
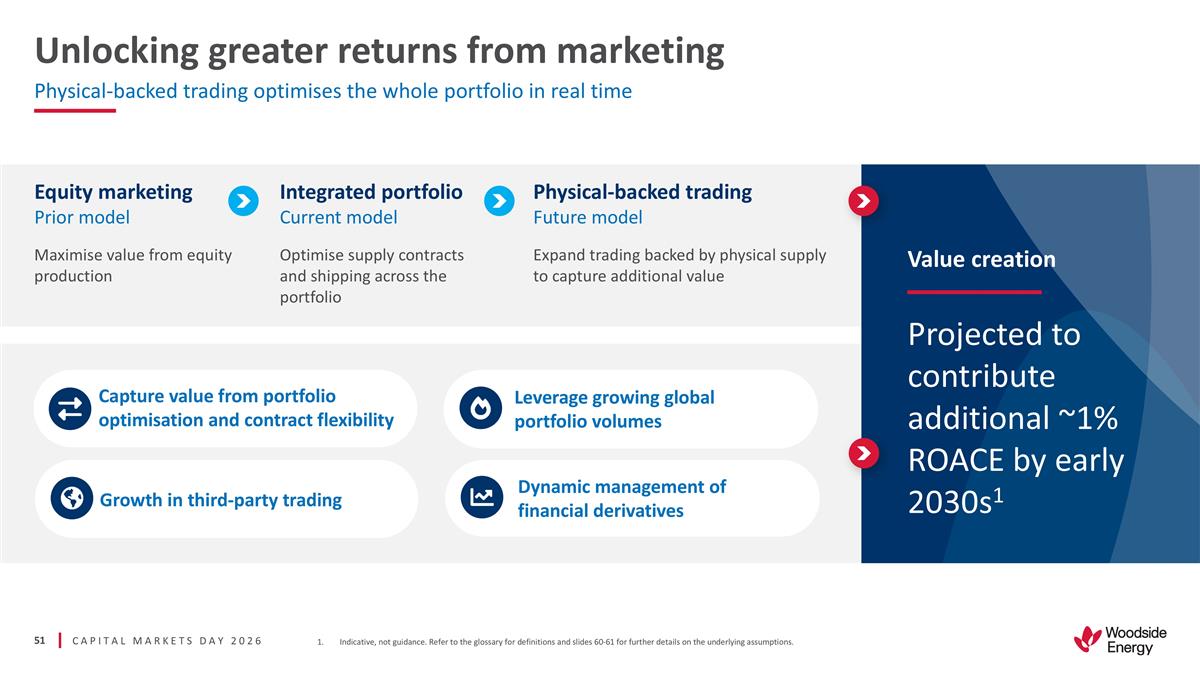
Unlocking greater returns from
marketing Physical-backed trading optimises the whole portfolio in real time Indicative, not guidance. Refer to the glossary for definitions and slides 60-61 for further details on the underlying assumptions. Maximise value from equity production
Expand trading backed by physical supply to capture additional value Equity marketing Prior model Physical-backed trading Future model Optimise supply contracts and shipping across the portfolio Integrated portfolio Current model Capture value from
portfolio optimisation and contract flexibility Growth in third-party trading Leverage growing global portfolio volumes Dynamic management of financial derivatives Value creation Projected to contribute additional ~1% ROACE by early
2030s1
Make disciplined choices for
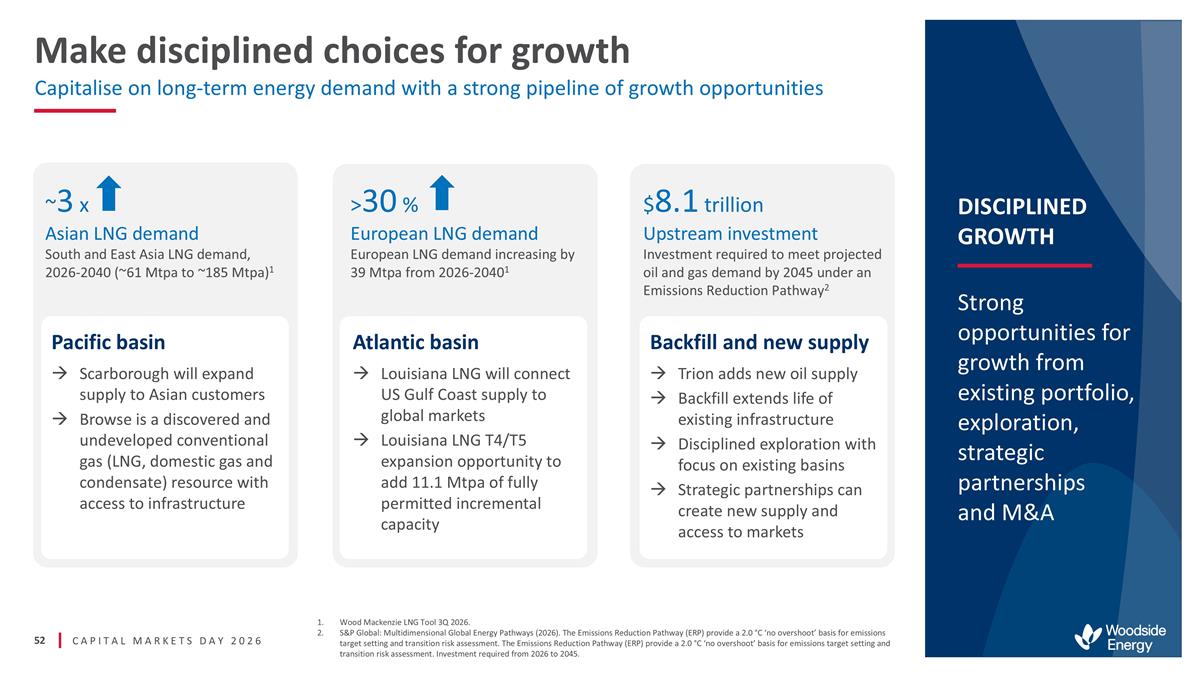
growth Capitalise on long-term energy demand with a strong pipeline of growth opportunities ~3 x Asian LNG demand South and East Asia LNG demand, 2026-2040 (~61 Mtpa to ~185 Mtpa)1 Strong opportunities for growth from existing portfolio,
exploration, strategic partnerships and M&A DISCIPLINED GROWTH Pacific basin Scarborough will expand supply to Asian customers Browse is a discovered and undeveloped conventional gas (LNG, domestic gas and condensate) resource with access to
infrastructure >30 % European LNG demand European LNG demand increasing by 39 Mtpa from 2026-20401 $8.1 trillion Upstream investment Investment required to meet projected oil and gas demand by 2045 under an Emissions Reduction Pathway2 Atlantic
basin Louisiana LNG will connect US Gulf Coast supply to global markets Louisiana LNG T4/T5 expansion opportunity to add 11.1 Mtpa of fully permitted incremental capacity Backfill and new supply Trion adds new oil supply Backfill extends life of
existing infrastructure Disciplined exploration with focus on existing basins Strategic partnerships can create new supply and access to markets Wood Mackenzie LNG Tool 3Q 2026. S&P Global: Multidimensional Global Energy Pathways (2026). The
Emissions Reduction Pathway (ERP) provide a 2.0 °C ‘no overshoot’ basis for emissions target setting and transition risk assessment. The Emissions Reduction Pathway (ERP) provide a 2.0 °C ‘no overshoot’ basis for
emissions target setting and transition risk assessment. Investment required from 2026 to 2045.
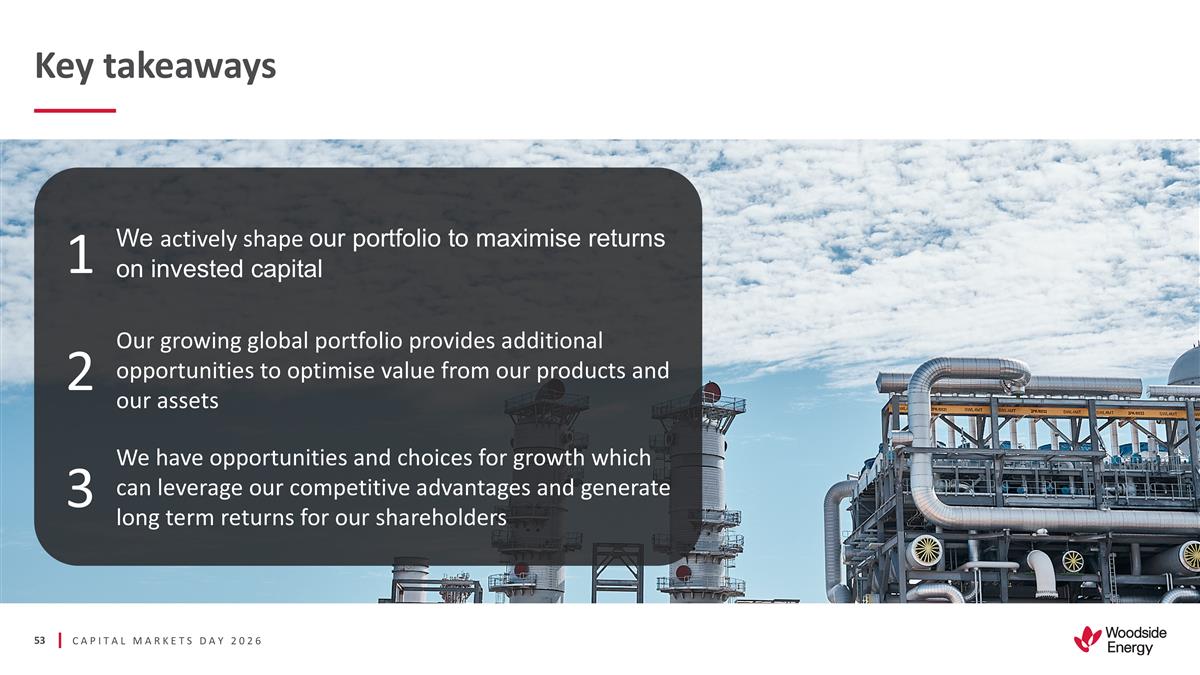
Key takeaways 1 We actively shape
our portfolio to maximise returns on invested capital 2 Our growing global portfolio provides additional opportunities to optimise value from our products and our assets 3 We have opportunities and choices for growth which can leverage our
competitive advantages and generate long term returns for our shareholders
Closing remarks LIZ WESTCOTT |
Chief Executive Officer and Managing Director
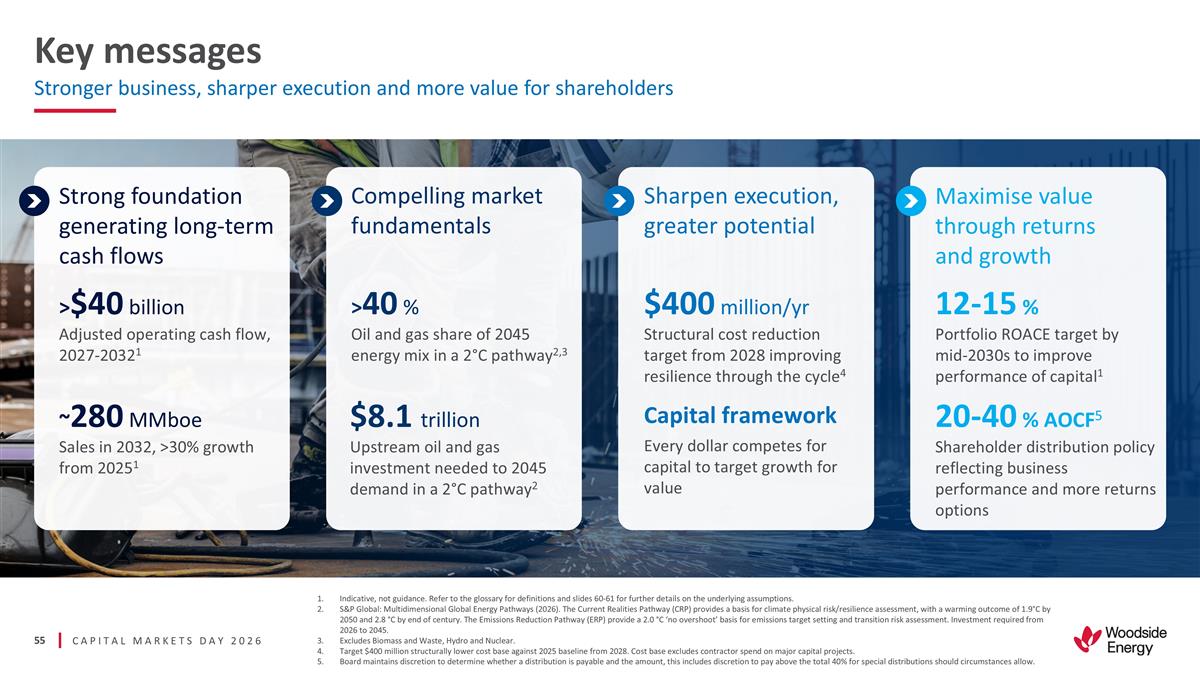
Stronger business, sharper
execution and more value for shareholders Strong foundation generating long-term cash flows Compelling market fundamentals Sharpen execution, greater potential Maximise value through returns and growth >$40 billion Adjusted operating cash flow,
2027-20321 ~280 MMboe Sales in 2032, >30% growth from 20251 >40 % Oil and gas share of 2045 energy mix in a 2°C pathway2,3 $8.1 trillion Upstream oil and gas investment needed to 2045 demand in a 2°C pathway2 $400 million/yr
Structural cost reduction target from 2028 improving resilience through the cycle4 Capital framework Every dollar competes for capital to target growth for value 12-15 % Portfolio ROACE target by mid-2030s to improve performance of capital1 20-40 %
AOCF5 Shareholder distribution policy reflecting business performance and more returns options Indicative, not guidance. Refer to the glossary for definitions and slides 60-61 for further details on the underlying assumptions. S&P Global:
Multidimensional Global Energy Pathways (2026). The Current Realities Pathway (CRP) provides a basis for climate physical risk/resilience assessment, with a warming outcome of 1.9°C by 2050 and 2.8 °C by end of century. The Emissions
Reduction Pathway (ERP) provide a 2.0 °C ‘no overshoot’ basis for emissions target setting and transition risk assessment. Investment required from 2026 to 2045. Excludes Biomass and Waste, Hydro and Nuclear. Target $400 million
structurally lower cost base against 2025 baseline from 2028. Cost base excludes contractor spend on major capital projects. Board maintains discretion to determine whether a distribution is payable and the amount, this includes discretion to pay
above the total 40% for special distributions should circumstances allow. Key messages
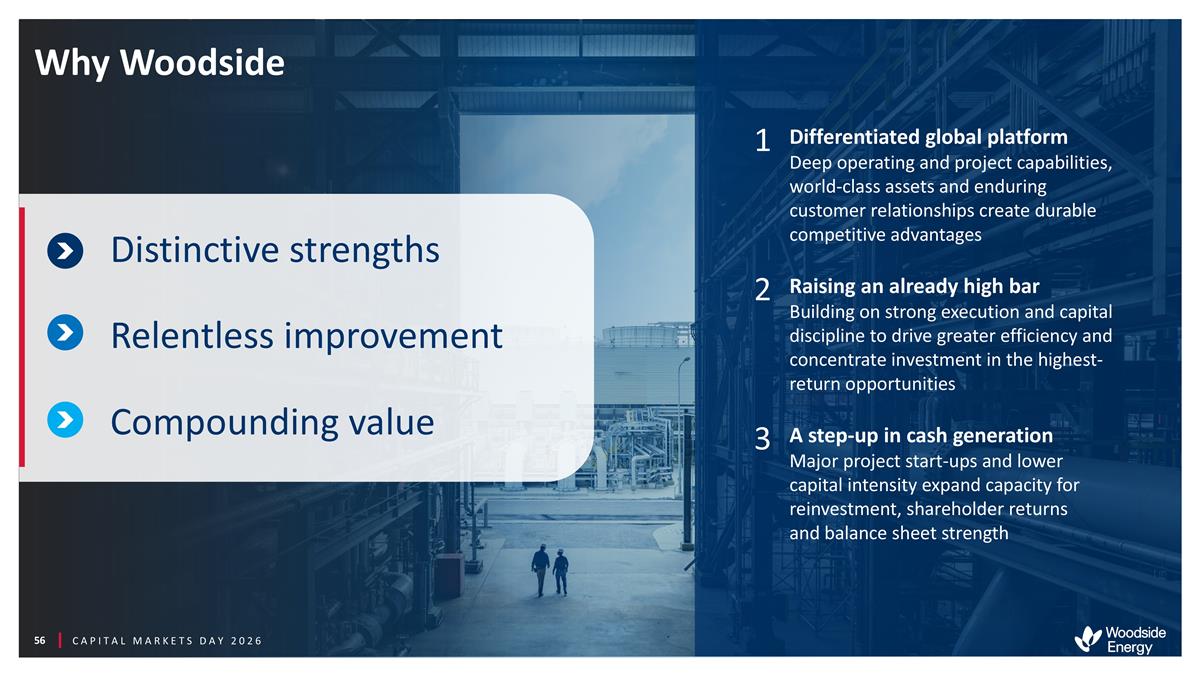
CAPITAL MARKETS DAY 2026 1
Differentiated global platform Deep operating and project capabilities, world-class assets and enduring customer relationships create durable competitive advantages 2 Raising an already high bar Building on strong execution and capital discipline to
drive greater efficiency and concentrate investment in the highest-return opportunities 3 A step-up in cash generation Major project start-ups and lower capital intensity expand capacity for reinvestment, shareholder returns and balance sheet
strength Why Woodside Distinctive strengths Relentless improvement Compounding value

Question and answer

Annexure
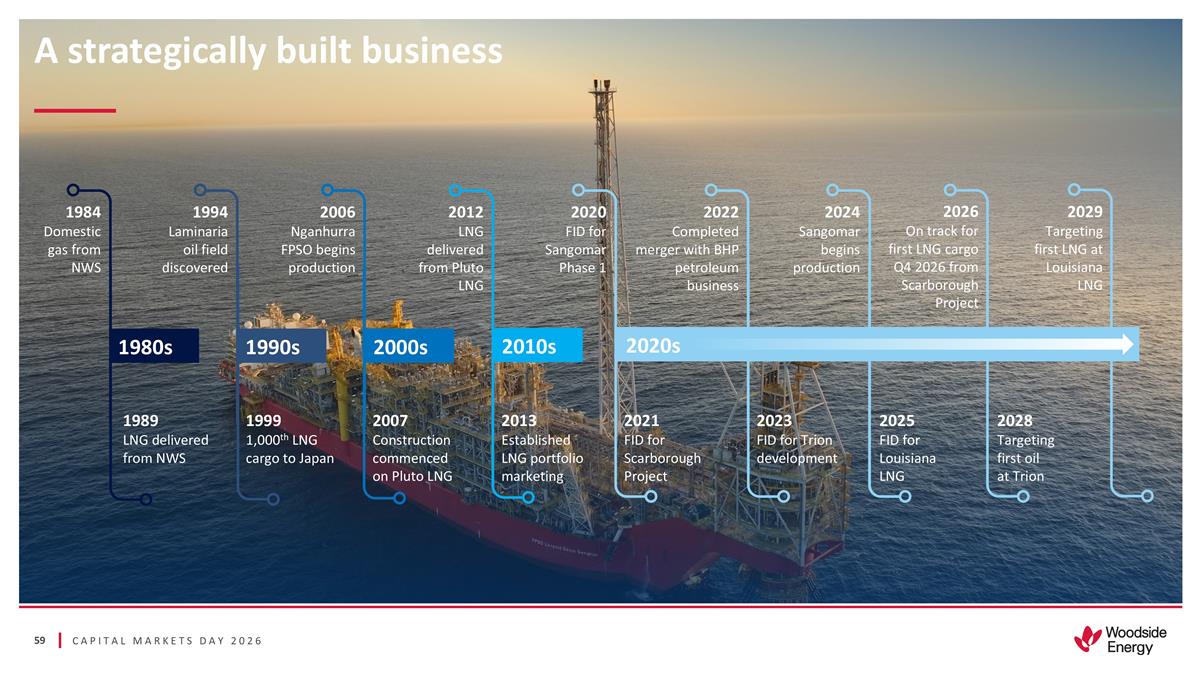
A strategically built business
1984 Domestic gas from NWS 1989 LNG delivered from NWS 1994 Laminaria oil field discovered 1999 1,000th LNG cargo to Japan 2006 Nganhurra FPSO begins production 2007 Construction commenced on Pluto LNG 2012 LNG delivered from Pluto LNG 2013
Established LNG portfolio marketing 2020 FID for Sangomar Phase 1 2021 FID for Scarborough Project 2022 Completed merger with BHP petroleum business 2023 FID for Trion development 2024 Sangomar begins production 2025 FID for Louisiana LNG 1980s
2000s 2010s 1990s 2028 Targeting first oil at Trion 2020s 2026 On track for first LNG cargo Q4 2026 from Scarborough Project 2029 Targeting first LNG at Louisiana LNG
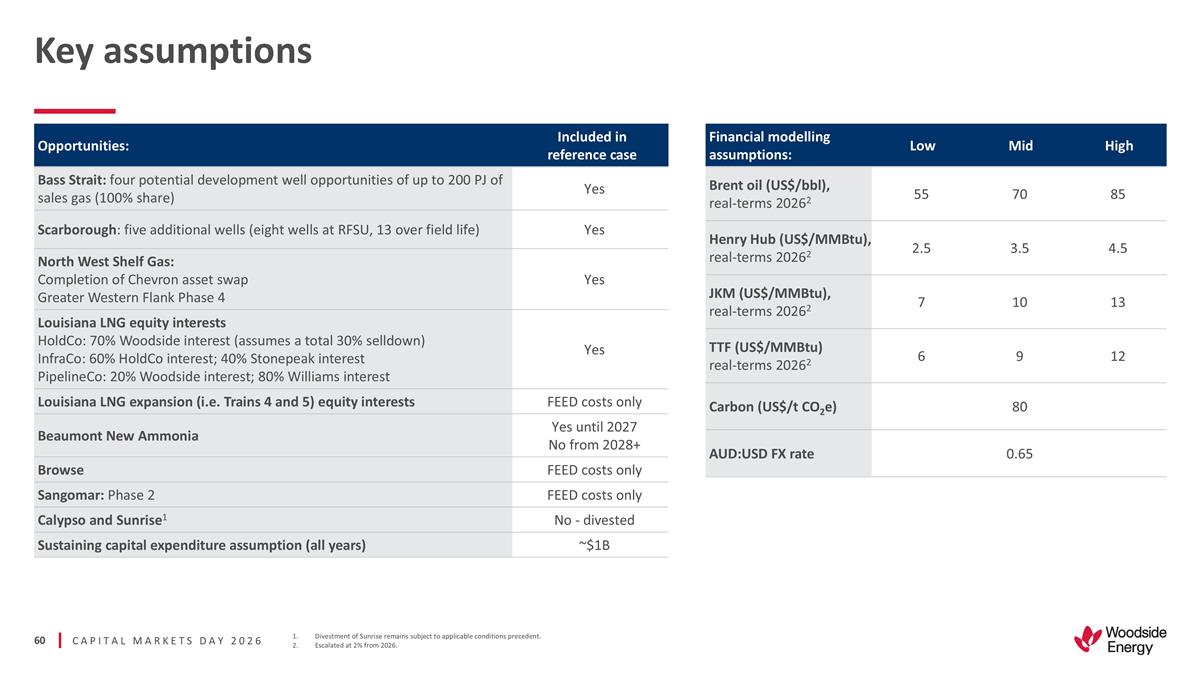
Key assumptions Divestment of
Sunrise remains subject to applicable conditions precedent. Escalated at 2% from 2026. Financial modelling assumptions: Low Mid High Brent oil (US$/bbl), real-terms 20262 55 70 85 Henry Hub (US$/MMBtu), real-terms 20262 2.5 3.5 4.5 JKM (US$/MMBtu),
real-terms 20262 7 10 13 TTF (US$/MMBtu) real-terms 20262 6 9 12 Carbon (US$/t CO2e) 80 AUD:USD FX rate 0.65 Opportunities: Included in reference case Bass Strait: four potential development well opportunities of up to 200 PJ of sales gas (100%
share) Yes Scarborough: five additional wells (eight wells at RFSU, 13 over field life) Yes North West Shelf Gas: Completion of Chevron asset swap Greater Western Flank Phase 4 Yes Louisiana LNG equity interests HoldCo: 70% Woodside interest
(assumes a total 30% selldown) InfraCo: 60% HoldCo interest; 40% Stonepeak interest PipelineCo: 20% Woodside interest; 80% Williams interest Yes Louisiana LNG expansion (i.e. Trains 4 and 5) equity interests FEED costs only Beaumont New Ammonia Yes
until 2027 No from 2028+ Browse FEED costs only Sangomar: Phase 2 FEED costs only Calypso and Sunrise1 No - divested Sustaining capital expenditure assumption (all years) ~$1B
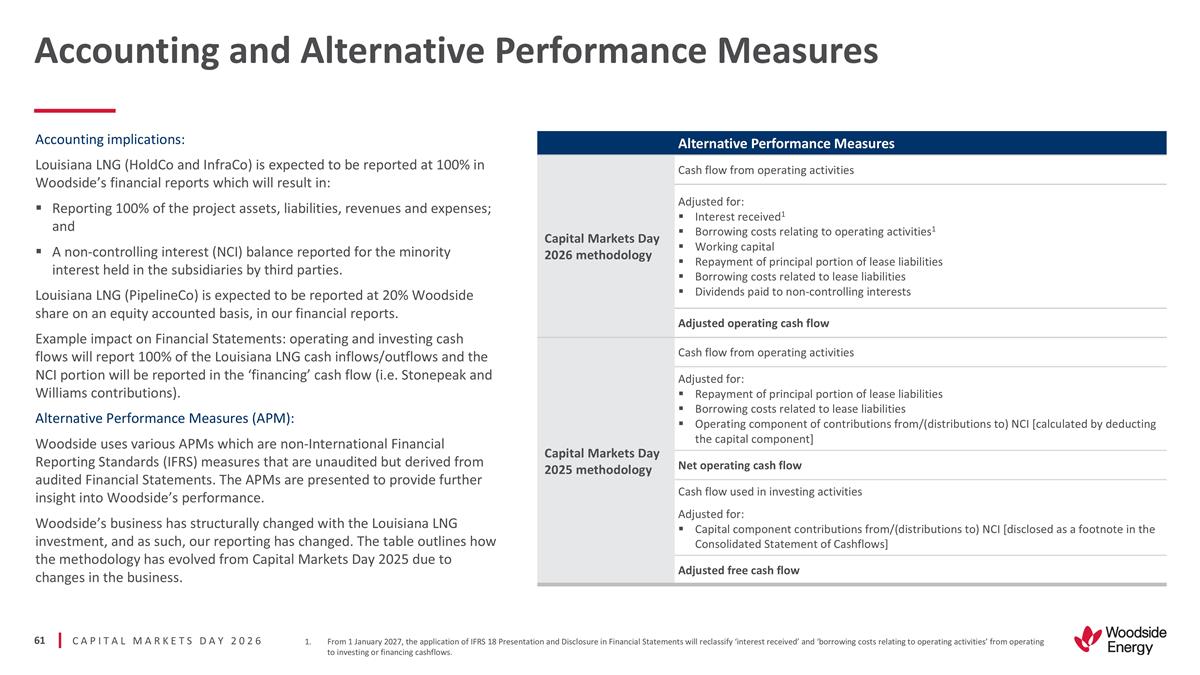
Alternative Performance Measures
Capital Markets Day 2026 methodology Cash flow from operating activities Adjusted for: Interest received1 Borrowing costs relating to operating activities1 Working capital Repayment of principal portion of lease liabilities Borrowing costs related
to lease liabilities Dividends paid to non-controlling interests Adjusted operating cash flow Capital Markets Day 2025 methodology Cash flow from operating activities Adjusted for: Repayment of principal portion of lease liabilities Borrowing costs
related to lease liabilities Operating component of contributions from/(distributions to) NCI [calculated by deducting the capital component] Net operating cash flow Cash flow used in investing activities Adjusted for: Capital component
contributions from/(distributions to) NCI [disclosed as a footnote in the Consolidated Statement of Cashflows] Adjusted free cash flow Accounting implications: Louisiana LNG (HoldCo and InfraCo) is expected to be reported at 100% in Woodside’s
financial reports which will result in: Reporting 100% of the project assets, liabilities, revenues and expenses; and A non-controlling interest (NCI) balance reported for the minority interest held in the subsidiaries by third parties. Louisiana
LNG (PipelineCo) is expected to be reported at 20% Woodside share on an equity accounted basis, in our financial reports. Example impact on Financial Statements: operating and investing cash flows will report 100% of the Louisiana LNG cash
inflows/outflows and the NCI portion will be reported in the ‘financing’ cash flow (i.e. Stonepeak and Williams contributions). Alternative Performance Measures (APM): Woodside uses various APMs which are non-International Financial
Reporting Standards (IFRS) measures that are unaudited but derived from audited Financial Statements. The APMs are presented to provide further insight into Woodside’s performance. Woodside’s business has structurally changed with the
Louisiana LNG investment, and as such, our reporting has changed. The table outlines how the methodology has evolved from Capital Markets Day 2025 due to changes in the business. Accounting and Alternative Performance Measures From 1 January 2027,
the application of IFRS 18 Presentation and Disclosure in Financial Statements will reclassify ‘interest received’ and ‘borrowing costs relating to operating activities’ from operating to investing or financing
cashflows.
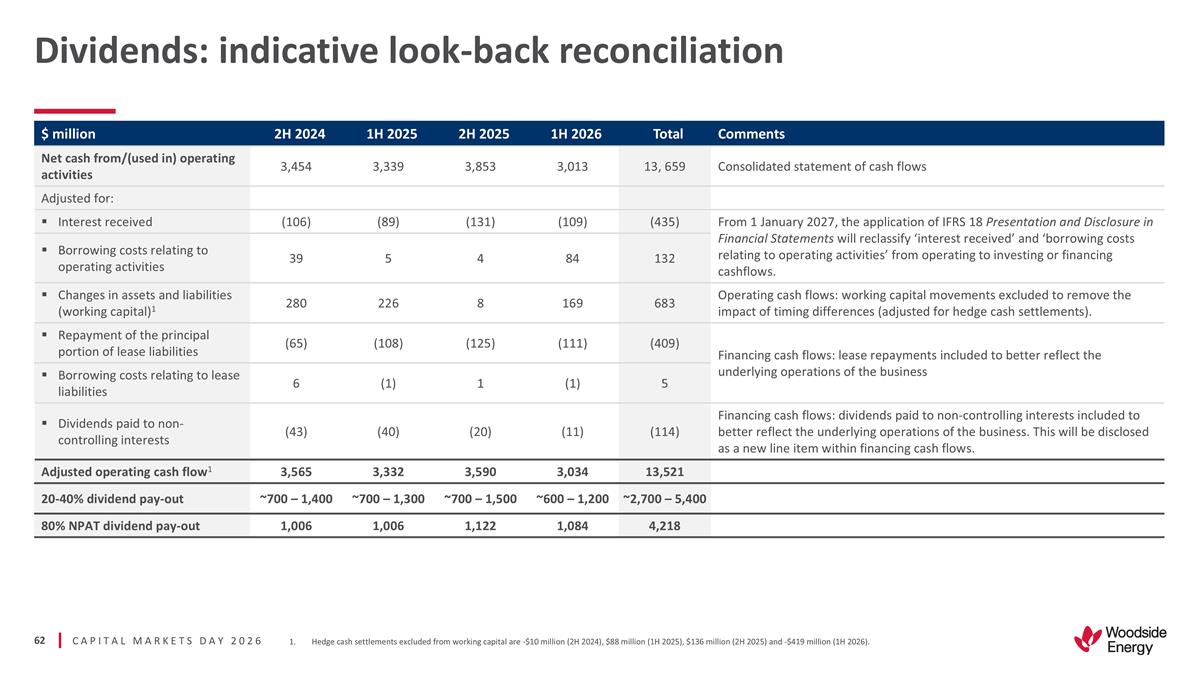
Dividends: indicative look-back
reconciliation $ million 2H 2024 1H 2025 2H 2025 1H 2026 Total Comments Net cash from/(used in) operating activities 3,454 3,339 3,853 3,013 13, 659 Consolidated statement of cash flows Adjusted for: Interest received (106) (89) (131) (109) (435)
From 1 January 2027, the application of IFRS 18 Presentation and Disclosure in Financial Statements will reclassify ‘interest received’ and ‘borrowing costs relating to operating activities’ from operating to investing or
financing cashflows. Borrowing costs relating to operating activities 39 5 4 84 132 Changes in assets and liabilities (working capital)1 280 226 8 169 683 Operating cash flows: working capital movements excluded to remove the impact of timing
differences (adjusted for hedge cash settlements). Repayment of the principal portion of lease liabilities (65) (108) (125) (111) (409) Financing cash flows: lease repayments included to better reflect the underlying operations of the business
Borrowing costs relating to lease liabilities 6 (1) 1 (1) 5 Dividends paid to non-controlling interests (43) (40) (20) (11) (114) Financing cash flows: dividends paid to non-controlling interests included to better reflect the underlying operations
of the business. This will be disclosed as a new line item within financing cash flows. Adjusted operating cash flow1 3,565 3,332 3,590 3,034 13,521 20-40% dividend pay-out ~700 – 1,400 ~700 – 1,300 ~700 – 1,500 ~600 – 1,200
~2,700 – 5,400 80% NPAT dividend pay-out 1,006 1,006 1,122 1,084 4,218 Hedge cash settlements excluded from working capital are -$10 million (2H 2024), $88 million (1H 2025), $136 million (2H 2025) and -$419 million (1H 2026).
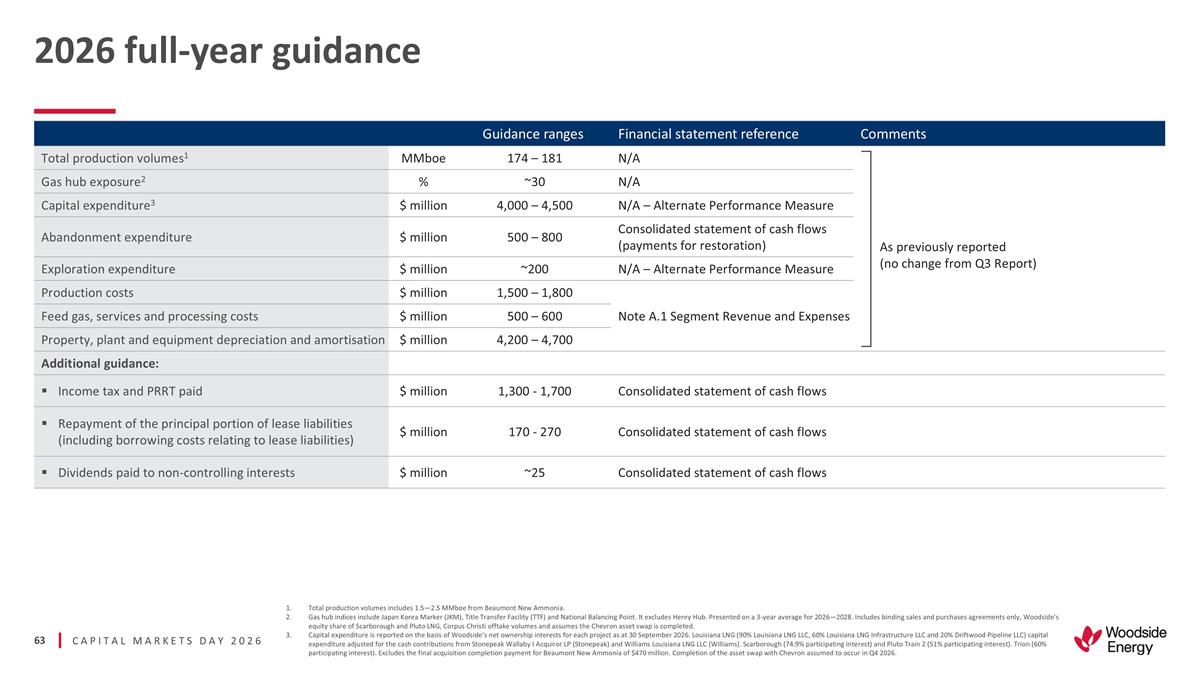
2026 full-year guidance Guidance
ranges Financial statement reference Comments Total production volumes1 MMboe 174 – 181 N/A Gas hub exposure2 % ~30 N/A Capital expenditure3 $ million 4,000 – 4,500 N/A – Alternate Performance Measure Abandonment expenditure $
million 500 – 800 Consolidated statement of cash flows (payments for restoration) Exploration expenditure $ million ~200 N/A – Alternate Performance Measure Production costs $ million 1,500 – 1,800 Note A.1 Segment Revenue and
Expenses Feed gas, services and processing costs $ million 500 – 600 Property, plant and equipment depreciation and amortisation $ million 4,200 – 4,700 Additional guidance: Income tax and PRRT paid $ million 1,300 - 1,700 Consolidated
statement of cash flows Repayment of the principal portion of lease liabilities (including borrowing costs relating to lease liabilities) $ million 170 - 270 Consolidated statement of cash flows Dividends paid to non-controlling interests $ million
~25 Consolidated statement of cash flows Total production volumes includes 1.5—2.5 MMboe from Beaumont New Ammonia. Gas hub indices include Japan Korea Marker (JKM), Title Transfer Facility (TTF) and National Balancing Point. It excludes Henry
Hub. Presented on a 3-year average for 2026—2028. Includes binding sales and purchases agreements only, Woodside’s equity share of Scarborough and Pluto LNG, Corpus Christi offtake volumes and assumes the Chevron asset swap is completed.
Capital expenditure is reported on the basis of Woodside’s net ownership interests for each project as at 30 September 2026. Louisiana LNG (90% Louisiana LNG LLC, 60% Louisiana LNG Infrastructure LLC and 20% Driftwood Pipeline LLC) capital
expenditure adjusted for the cash contributions from Stonepeak Wallaby I Acquiror LP (Stonepeak) and Williams Louisiana LNG LLC (Williams). Scarborough (74.9% participating interest) and Pluto Train 2 (51% participating interest). Trion (60%
participating interest). Excludes the final acquisition completion payment for Beaumont New Ammonia of $470 million. Completion of the asset swap with Chevron assumed to occur in Q4 2026. As previously reported (no change from Q3 Report)
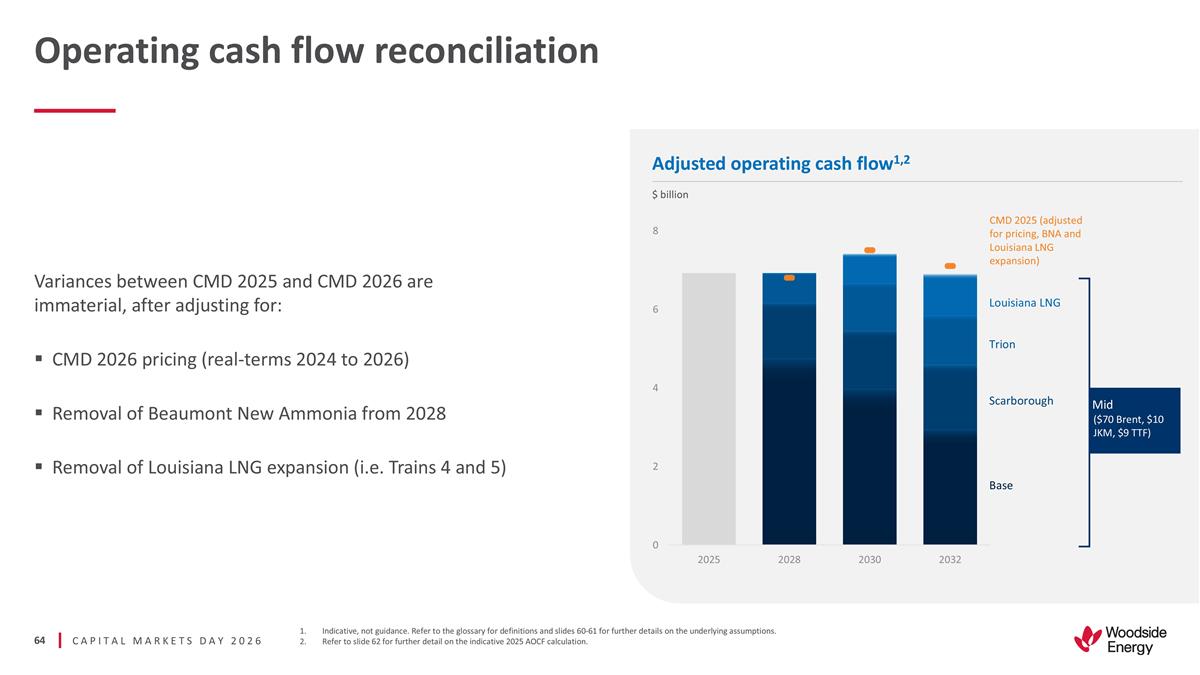
Operating cash flow
reconciliation Indicative, not guidance. Refer to the glossary for definitions and slides 60-61 for further details on the underlying assumptions. Refer to slide 62 for further detail on the indicative 2025 AOCF calculation. Mid ($70 Brent, $10 JKM,
$9 TTF) Base Trion Scarborough Louisiana LNG Adjusted operating cash flow1,2 $ billion CMD 2025 (adjusted for pricing, BNA and Louisiana LNG expansion) Variances between CMD 2025 and CMD 2026 are immaterial, after adjusting for: CMD 2026 pricing
(real-terms 2024 to 2026) Removal of Beaumont New Ammonia from 2028 Removal of Louisiana LNG expansion (i.e. Trains 4 and 5)
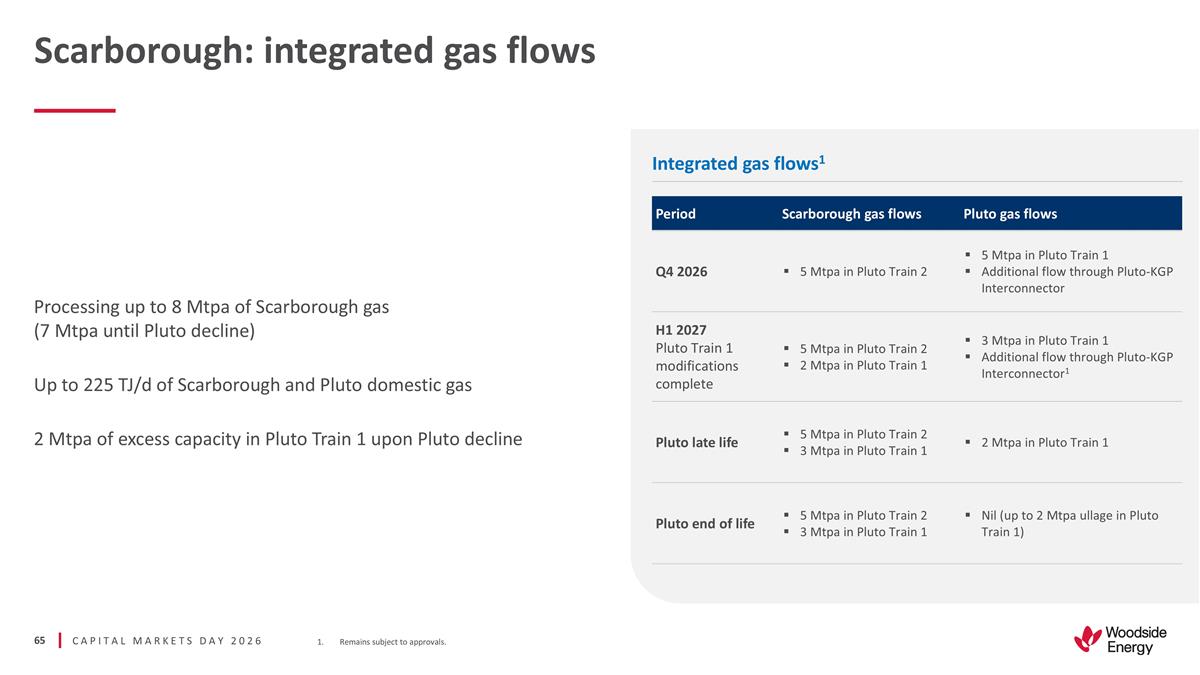
Scarborough: integrated gas flows
Remains subject to approvals. Processing up to 8 Mtpa of Scarborough gas (7 Mtpa until Pluto decline) Up to 225 TJ/d of Scarborough and Pluto domestic gas 2 Mtpa of excess capacity in Pluto Train 1 upon Pluto decline Integrated gas flows1 Period
Scarborough gas flows Pluto gas flows Q4 2026 5 Mtpa in Pluto Train 2 5 Mtpa in Pluto Train 1 Additional flow through Pluto-KGP Interconnector H1 2027 Pluto Train 1 modifications complete 5 Mtpa in Pluto Train 2 2 Mtpa in Pluto Train 1 3 Mtpa in
Pluto Train 1 Additional flow through Pluto-KGP Interconnector1 Pluto late life 5 Mtpa in Pluto Train 2 3 Mtpa in Pluto Train 1 2 Mtpa in Pluto Train 1 Pluto end of life 5 Mtpa in Pluto Train 2 3 Mtpa in Pluto Train 1 Nil (up to 2 Mtpa ullage in
Pluto Train 1)
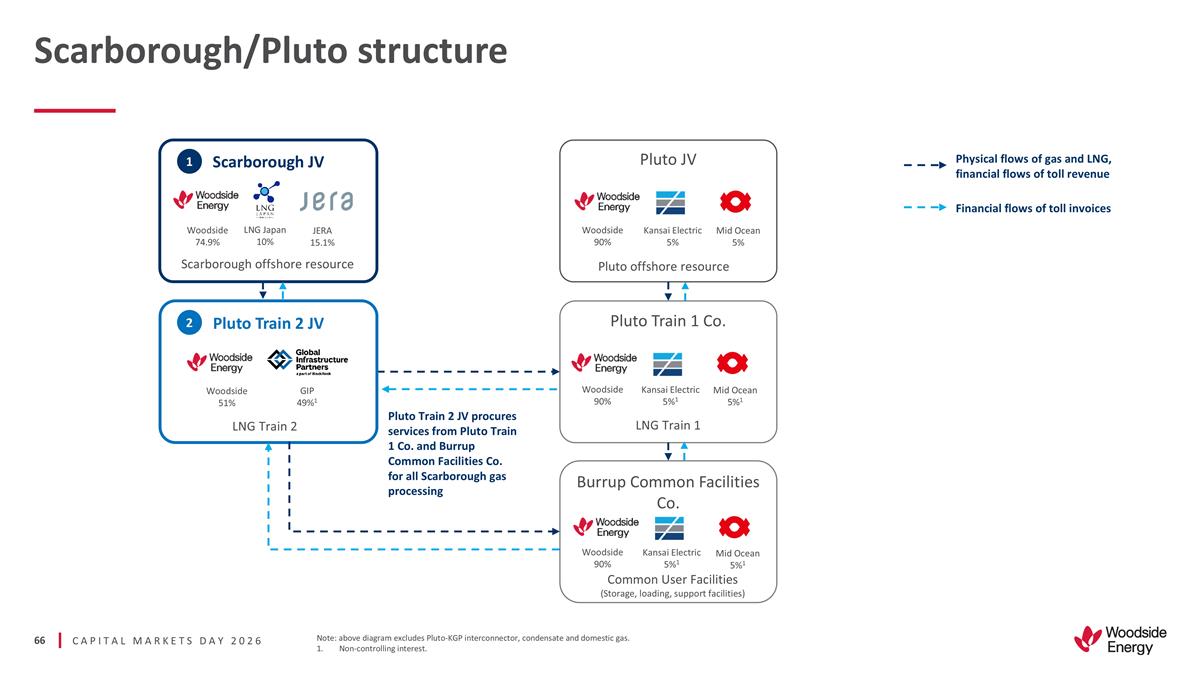
Scarborough/Pluto structure Note:
above diagram excludes Pluto-KGP interconnector, condensate and domestic gas. Non-controlling interest. Pluto JV Pluto Train 1 Co. Burrup Common Facilities Co. Scarborough JV Pluto Train 2 JV Woodside 90% Woodside 74.9% Woodside 51% Physical flows
of gas and LNG, financial flows of toll revenue LNG Japan 10% JERA 15.1% GIP 49%1 Kansai Electric 5% Mid Ocean 5% Woodside 90% Kansai Electric 5%1 Mid Ocean 5%1 Woodside 90% Kansai Electric 5%1 Mid Ocean 5%1 2 1 LNG Train 2 Scarborough offshore
resource Pluto offshore resource LNG Train 1 Common User Facilities (Storage, loading, support facilities) Financial flows of toll invoices Pluto Train 2 JV procures services from Pluto Train 1 Co. and Burrup Common Facilities Co. for all
Scarborough gas processing
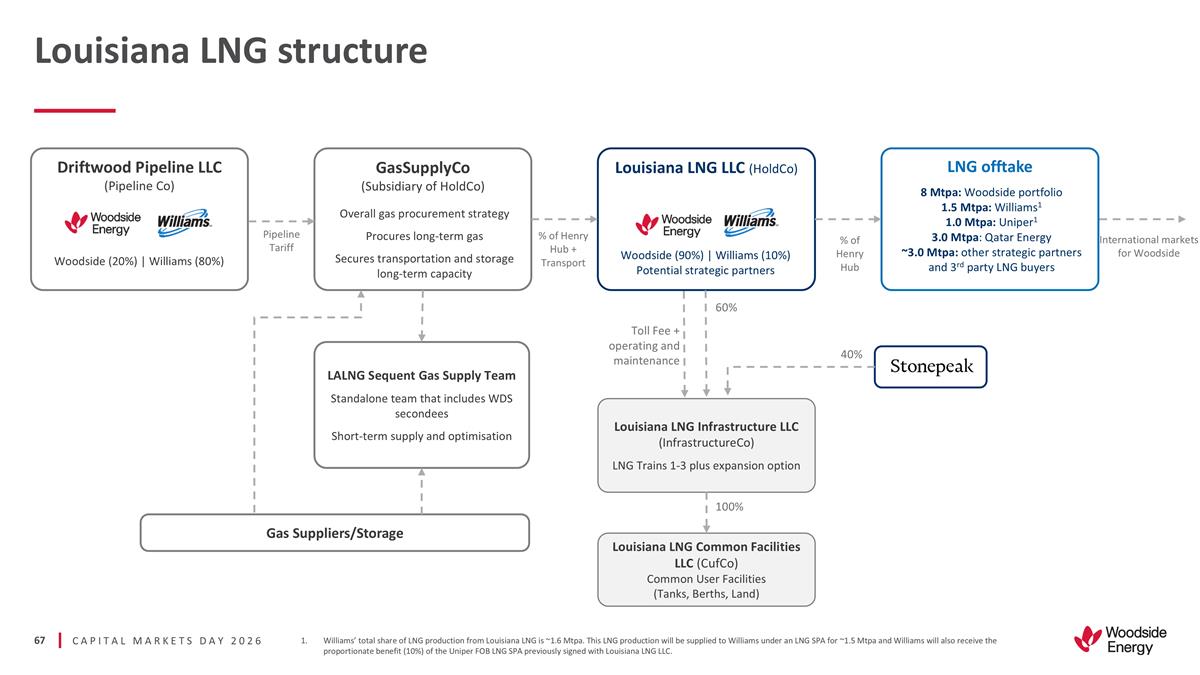
Louisiana LNG structure
Williams’ total share of LNG production from Louisiana LNG is ~1.6 Mtpa. This LNG production will be supplied to Williams under an LNG SPA for ~1.5 Mtpa and Williams will also receive the proportionate benefit (10%) of the Uniper FOB LNG SPA
previously signed with Louisiana LNG LLC. Louisiana LNG LLC (HoldCo) LNG offtake Driftwood Pipeline LLC (Pipeline Co) Louisiana LNG Infrastructure LLC (InfrastructureCo) LNG Trains 1-3 plus expansion option Louisiana LNG Common Facilities LLC
(CufCo) Common User Facilities (Tanks, Berths, Land) 60% 40% Toll Fee + operating and maintenance Woodside (90%) | Williams (10%) Potential strategic partners Woodside (20%) | Williams (80%) GasSupplyCo (Subsidiary of HoldCo) Overall gas procurement
strategy Procures long-term gas Secures transportation and storage long-term capacity Gas Suppliers/Storage Pipeline Tariff 8 Mtpa: Woodside portfolio 1.5 Mtpa: Williams1 1.0 Mtpa: Uniper1 3.0 Mtpa: Qatar Energy ~3.0 Mtpa: other strategic partners
and 3rd party LNG buyers % of Henry Hub + Transport LALNG Sequent Gas Supply Team Standalone team that includes WDS secondees Short-term supply and optimisation % of Henry Hub International markets for Woodside 100%
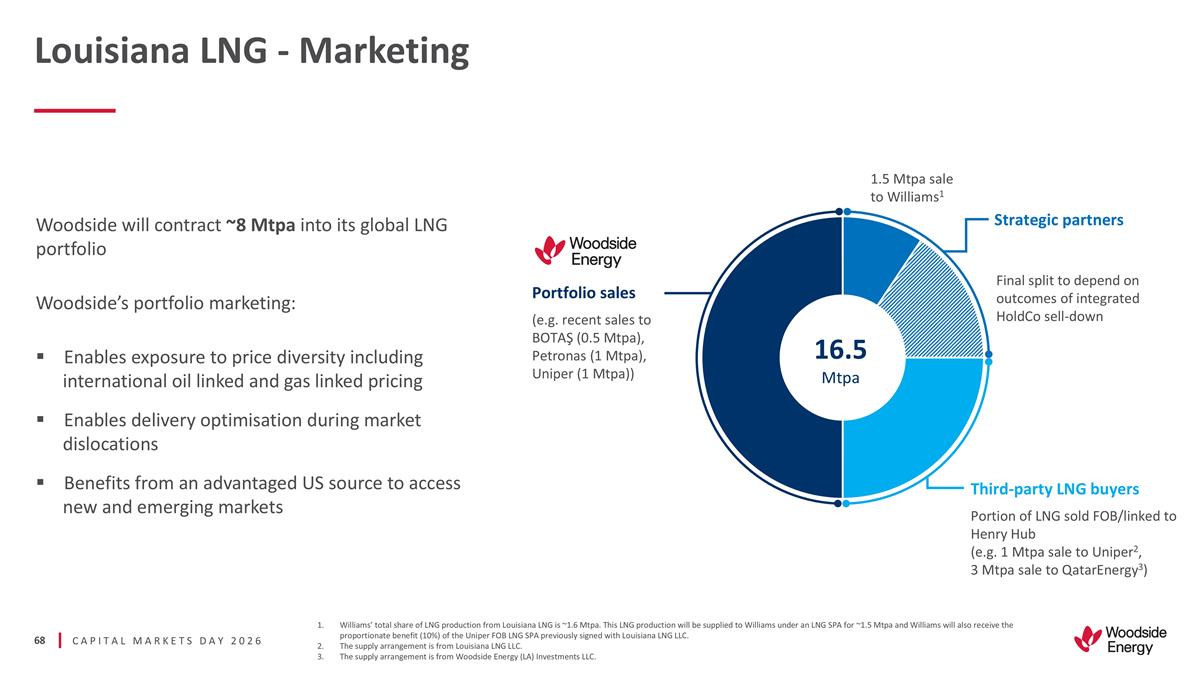
Louisiana LNG - Marketing
Williams’ total share of LNG production from Louisiana LNG is ~1.6 Mtpa. This LNG production will be supplied to Williams under an LNG SPA for ~1.5 Mtpa and Williams will also receive the proportionate benefit (10%) of the Uniper FOB LNG SPA
previously signed with Louisiana LNG LLC. The supply arrangement is from Louisiana LNG LLC. The supply arrangement is from Woodside Energy (LA) Investments LLC. 16.5 Mtpa Woodside will contract ~8 Mtpa into its global LNG portfolio Woodside’s
portfolio marketing: Enables exposure to price diversity including international oil linked and gas linked pricing Enables delivery optimisation during market dislocations Benefits from an advantaged US source to access new and emerging markets
Strategic partners Third-party LNG buyers Portion of LNG sold FOB/linked to Henry Hub (e.g. 1 Mtpa sale to Uniper2, 3 Mtpa sale to QatarEnergy3) Portfolio sales (e.g. recent sales to BOTAŞ (0.5 Mtpa), Petronas (1 Mtpa), Uniper (1 Mtpa)) 1.5
Mtpa sale to Williams1 Final split to depend on outcomes of integrated HoldCo sell-down
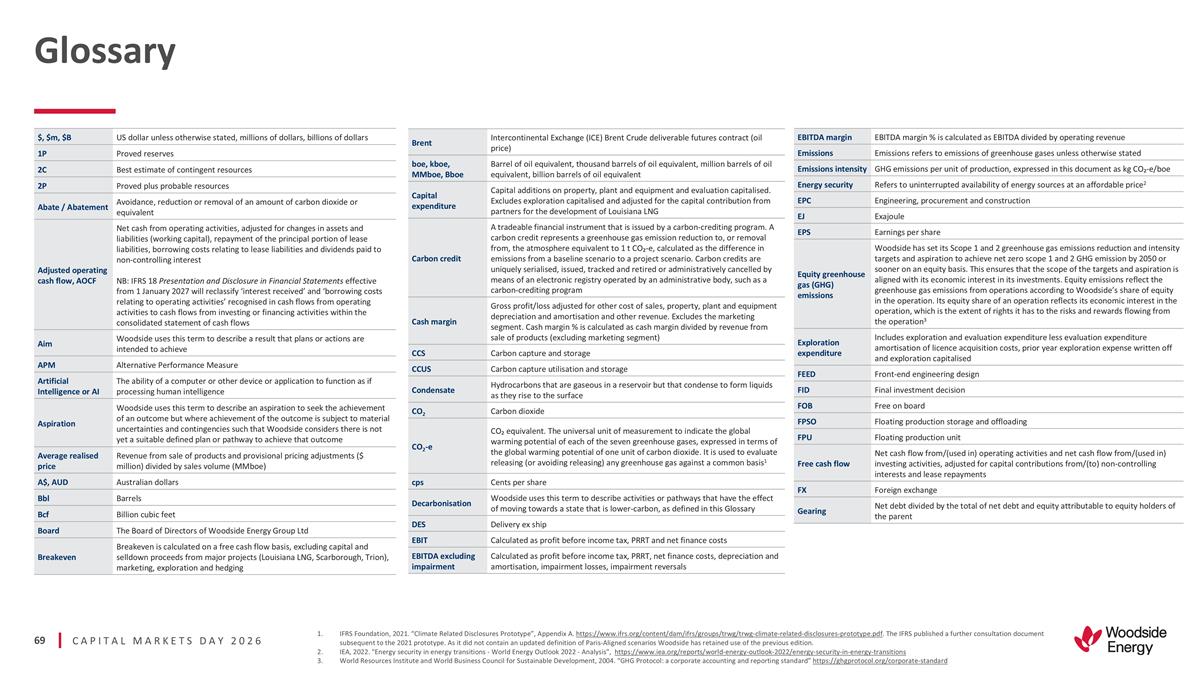
Glossary IFRS Foundation, 2021.
“Climate Related Disclosures Prototype”, Appendix A. https://www.ifrs.org/content/dam/ifrs/groups/trwg/trwg-climate-related-disclosures-prototype.pdf. The IFRS published a further consultation document subsequent to the 2021 prototype.
As it did not contain an updated definition of Paris‑Aligned scenarios Woodside has retained use of the previous edition. IEA, 2022. "Energy security in energy transitions - World Energy Outlook 2022 - Analysis",
https://www.iea.org/reports/world-energy-outlook-2022/energy-security-in-energy-transitions World Resources Institute and World Business Council for Sustainable Development, 2004. “GHG Protocol: a corporate accounting and reporting
standard” https://ghgprotocol.org/corporate-standard $, $m, $B US dollar unless otherwise stated, millions of dollars, billions of dollars 1P Proved reserves 2C Best estimate of contingent resources 2P Proved plus probable resources Abate /
Abatement Avoidance, reduction or removal of an amount of carbon dioxide or equivalent Adjusted operating cash flow, AOCF Net cash from operating activities, adjusted for changes in assets and liabilities (working capital), repayment of the
principal portion of lease liabilities, borrowing costs relating to lease liabilities and dividends paid to non-controlling interest NB: IFRS 18 Presentation and Disclosure in Financial Statements effective from 1 January 2027 will reclassify
‘interest received’ and ‘borrowing costs relating to operating activities’ recognised in cash flows from operating activities to cash flows from investing or financing activities within the consolidated statement of cash
flows Aim Woodside uses this term to describe a result that plans or actions are intended to achieve APM Alternative Performance Measure Artificial Intelligence or AI The ability of a computer or other device or application to function as if
processing human intelligence Aspiration Woodside uses this term to describe an aspiration to seek the achievement of an outcome but where achievement of the outcome is subject to material uncertainties and contingencies such that Woodside considers
there is not yet a suitable defined plan or pathway to achieve that outcome Average realised price Revenue from sale of products and provisional pricing adjustments ($ million) divided by sales volume (MMboe) A$, AUD Australian dollars Bbl Barrels
Bcf Billion cubic feet Board The Board of Directors of Woodside Energy Group Ltd Breakeven Breakeven is calculated on a free cash flow basis, excluding capital and selldown proceeds from major projects (Louisiana LNG, Scarborough, Trion), marketing,
exploration and hedging Brent Intercontinental Exchange (ICE) Brent Crude deliverable futures contract (oil price) boe, kboe, MMboe, Bboe Barrel of oil equivalent, thousand barrels of oil equivalent, million barrels of oil equivalent, billion
barrels of oil equivalent Capital expenditure Capital additions on property, plant and equipment and evaluation capitalised. Excludes exploration capitalised and adjusted for the capital contribution from partners for the development of Louisiana
LNG Carbon credit A tradeable financial instrument that is issued by a carbon-crediting program. A carbon credit represents a greenhouse gas emission reduction to, or removal from, the atmosphere equivalent to 1 t CO₂-e, calculated as the
difference in emissions from a baseline scenario to a project scenario. Carbon credits are uniquely serialised, issued, tracked and retired or administratively cancelled by means of an electronic registry operated by an administrative body, such as
a carbon-crediting program Cash margin Gross profit/loss adjusted for other cost of sales, property, plant and equipment depreciation and amortisation and other revenue. Excludes the marketing segment. Cash margin % is calculated as cash margin
divided by revenue from sale of products (excluding marketing segment) CCS Carbon capture and storage CCUS Carbon capture utilisation and storage Condensate Hydrocarbons that are gaseous in a reservoir but that condense to form liquids as they rise
to the surface CO2 Carbon dioxide CO2-e CO₂ equivalent. The universal unit of measurement to indicate the global warming potential of each of the seven greenhouse gases, expressed in terms of the global warming potential of one unit of
carbon dioxide. It is used to evaluate releasing (or avoiding releasing) any greenhouse gas against a common basis1 cps Cents per share Decarbonisation Woodside uses this term to describe activities or pathways that have the effect of moving towards
a state that is lower‑carbon, as defined in this Glossary DES Delivery ex ship EBIT Calculated as profit before income tax, PRRT and net finance costs EBITDA excluding impairment Calculated as profit before income tax, PRRT, net finance costs,
depreciation and amortisation, impairment losses, impairment reversals EBITDA margin EBITDA margin % is calculated as EBITDA divided by operating revenue Emissions Emissions refers to emissions of greenhouse gases unless otherwise stated Emissions
intensity GHG emissions per unit of production, expressed in this document as kg CO₂-e/boe Energy security Refers to uninterrupted availability of energy sources at an affordable price2 EPC Engineering, procurement and construction EJ Exajoule
EPS Earnings per share Equity greenhouse gas (GHG) emissions Woodside has set its Scope 1 and 2 greenhouse gas emissions reduction and intensity targets and aspiration to achieve net zero scope 1 and 2 GHG emission by 2050 or sooner on an equity
basis. This ensures that the scope of the targets and aspiration is aligned with its economic interest in its investments. Equity emissions reflect the greenhouse gas emissions from operations according to Woodside’s share of equity in the
operation. Its equity share of an operation reflects its economic interest in the operation, which is the extent of rights it has to the risks and rewards flowing from the operation3 Exploration expenditure Includes exploration and evaluation
expenditure less evaluation expenditure amortisation of licence acquisition costs, prior year exploration expense written off and exploration capitalised FEED Front-end engineering design FID Final investment decision FOB Free on board FPSO Floating
production storage and offloading FPU Floating production unit Free cash flow Net cash flow from/(used in) operating activities and net cash flow from/(used in) investing activities, adjusted for capital contributions from/(to) non-controlling
interests and lease repayments FX Foreign exchange Gearing Net debt divided by the total of net debt and equity attributable to equity holders of the parent
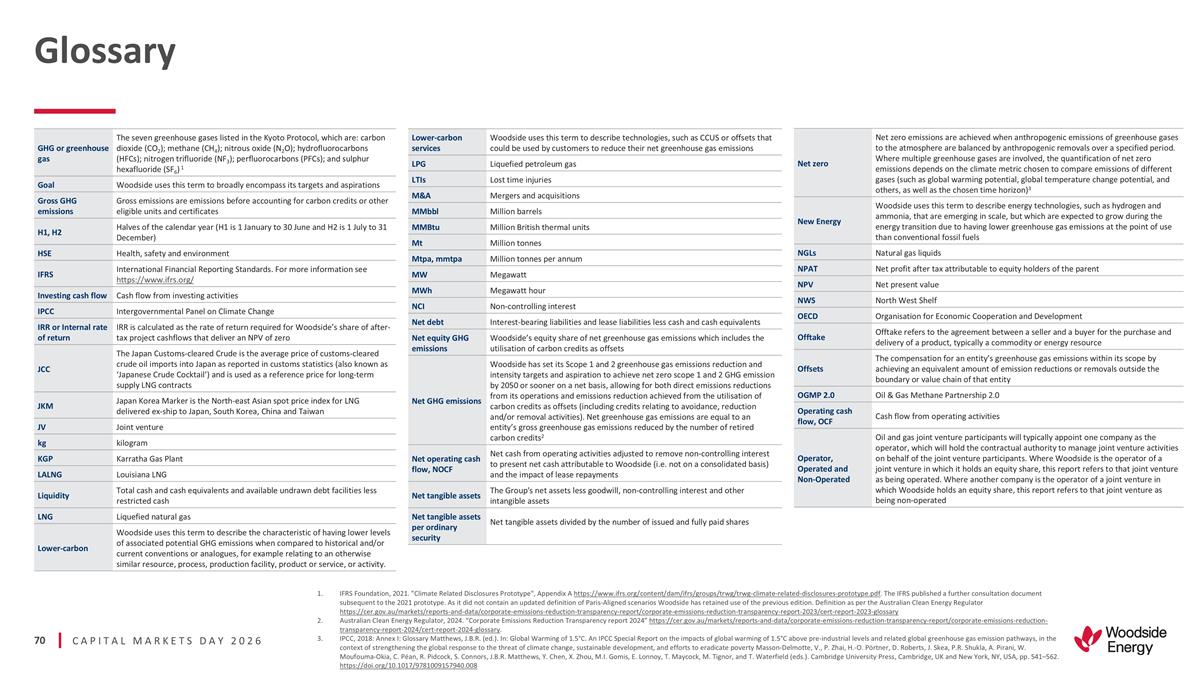
Glossary IFRS Foundation, 2021.
"Climate Related Disclosures Prototype", Appendix A https://www.ifrs.org/content/dam/ifrs/groups/trwg/trwg-climate-related-disclosures-prototype.pdf. The IFRS published a further consultation document subsequent to the 2021 prototype. As it did not
contain an updated definition of Paris-Aligned scenarios Woodside has retained use of the previous edition. Definition as per the Australian Clean Energy Regulator
https://cer.gov.au/markets/reports-and-data/corporate-emissions-reduction-transparency-report/corporate-emissions-reduction-transparency-report-2023/cert-report-2023-glossary Australian Clean Energy Regulator, 2024. “Corporate Emissions
Reduction Transparency report 2024” https://cer.gov.au/markets/reports-and-data/corporate-emissions-reduction-transparency-report/corporate-emissions-reduction-transparency-report-2024/cert-report-2024-glossary. IPCC, 2018: Annex I: Glossary
Matthews, J.B.R. (ed.). In: Global Warming of 1.5°C. An IPCC Special Report on the impacts of global warming of 1.5°C above pre‑industrial levels and related global greenhouse gas emission pathways, in the context of strengthening
the global response to the threat of climate change, sustainable development, and efforts to eradicate poverty Masson‑Delmotte, V., P. Zhai, H.‑O. Pörtner, D. Roberts, J. Skea, P.R. Shukla, A. Pirani, W. Moufouma‑Okia, C.
Péan, R. Pidcock, S. Connors, J.B.R. Matthews, Y. Chen, X. Zhou, M.I. Gomis, E. Lonnoy, T. Maycock, M. Tignor, and T. Waterfield (eds.). Cambridge University Press, Cambridge, UK and New York, NY, USA, pp. 541–562.
https://doi.org/10.1017/9781009157940.008 GHG or greenhouse gas The seven greenhouse gases listed in the Kyoto Protocol, which are: carbon dioxide (CO2); methane (CH4); nitrous oxide (N2O); hydrofluorocarbons (HFCs); nitrogen trifluoride (NF3);
perfluorocarbons (PFCs); and sulphur hexafluoride (SF6) 1 Goal Woodside uses this term to broadly encompass its targets and aspirations Gross GHG emissions Gross emissions are emissions before accounting for carbon credits or other eligible units
and certificates H1, H2 Halves of the calendar year (H1 is 1 January to 30 June and H2 is 1 July to 31 December) HSE Health, safety and environment IFRS International Financial Reporting Standards. For more information see https://www.ifrs.org/
Investing cash flow Cash flow from investing activities IPCC Intergovernmental Panel on Climate Change IRR or Internal rate of return IRR is calculated as the rate of return required for Woodside’s share of after-tax project cashflows that
deliver an NPV of zero JCC The Japan Customs-cleared Crude is the average price of customs-cleared crude oil imports into Japan as reported in customs statistics (also known as ‘Japanese Crude Cocktail’) and is used as a reference price
for long-term supply LNG contracts JKM Japan Korea Marker is the North-east Asian spot price index for LNG delivered ex-ship to Japan, South Korea, China and Taiwan JV Joint venture kg kilogram KGP Karratha Gas Plant LALNG Louisiana LNG Liquidity
Total cash and cash equivalents and available undrawn debt facilities less restricted cash LNG Liquefied natural gas Lower-carbon Woodside uses this term to describe the characteristic of having lower levels of associated potential GHG emissions
when compared to historical and/or current conventions or analogues, for example relating to an otherwise similar resource, process, production facility, product or service, or activity. Lower-carbon services Woodside uses this term to describe
technologies, such as CCUS or offsets that could be used by customers to reduce their net greenhouse gas emissions LPG Liquefied petroleum gas LTIs Lost time injuries M&A Mergers and acquisitions MMbbl Million barrels MMBtu Million British
thermal units Mt Million tonnes Mtpa, mmtpa Million tonnes per annum MW Megawatt MWh Megawatt hour NCI Non-controlling interest Net debt Interest-bearing liabilities and lease liabilities less cash and cash equivalents Net equity GHG emissions
Woodside’s equity share of net greenhouse gas emissions which includes the utilisation of carbon credits as offsets Net GHG emissions Woodside has set its Scope 1 and 2 greenhouse gas emissions reduction and intensity targets and aspiration to
achieve net zero scope 1 and 2 GHG emission by 2050 or sooner on a net basis, allowing for both direct emissions reductions from its operations and emissions reduction achieved from the utilisation of carbon credits as offsets (including credits
relating to avoidance, reduction and/or removal activities). Net greenhouse gas emissions are equal to an entity’s gross greenhouse gas emissions reduced by the number of retired carbon credits2 Net operating cash flow, NOCF Net cash from
operating activities adjusted to remove non-controlling interest to present net cash attributable to Woodside (i.e. not on a consolidated basis) and the impact of lease repayments Net tangible assets The Group's net assets less goodwill,
non-controlling interest and other intangible assets Net tangible assets per ordinary security Net tangible assets divided by the number of issued and fully paid shares Net zero Net zero emissions are achieved when anthropogenic
emissions of greenhouse gases to the atmosphere are balanced by anthropogenic removals over a specified period. Where multiple greenhouse gases are involved, the quantification of net zero emissions depends on the climate metric chosen to compare
emissions of different gases (such as global warming potential, global temperature change potential, and others, as well as the chosen time horizon)3 New Energy Woodside uses this term to describe energy technologies, such as hydrogen and ammonia,
that are emerging in scale, but which are expected to grow during the energy transition due to having lower greenhouse gas emissions at the point of use than conventional fossil fuels NGLs Natural gas liquids NPAT Net profit after tax attributable
to equity holders of the parent NPV Net present value NWS North West Shelf OECD Organisation for Economic Cooperation and Development Offtake Offtake refers to the agreement between a seller and a buyer for the purchase and delivery of a product,
typically a commodity or energy resource Offsets The compensation for an entity’s greenhouse gas emissions within its scope by achieving an equivalent amount of emission reductions or removals outside the boundary or value chain of that entity
OGMP 2.0 Oil & Gas Methane Partnership 2.0 Operating cash flow, OCF Cash flow from operating activities Operator, Operated and Non-Operated Oil and gas joint venture participants will typically appoint one company as the operator, which will
hold the contractual authority to manage joint venture activities on behalf of the joint venture participants. Where Woodside is the operator of a joint venture in which it holds an equity share, this report refers to that joint venture as being
operated. Where another company is the operator of a joint venture in which Woodside holds an equity share, this report refers to that joint venture as being non-operated
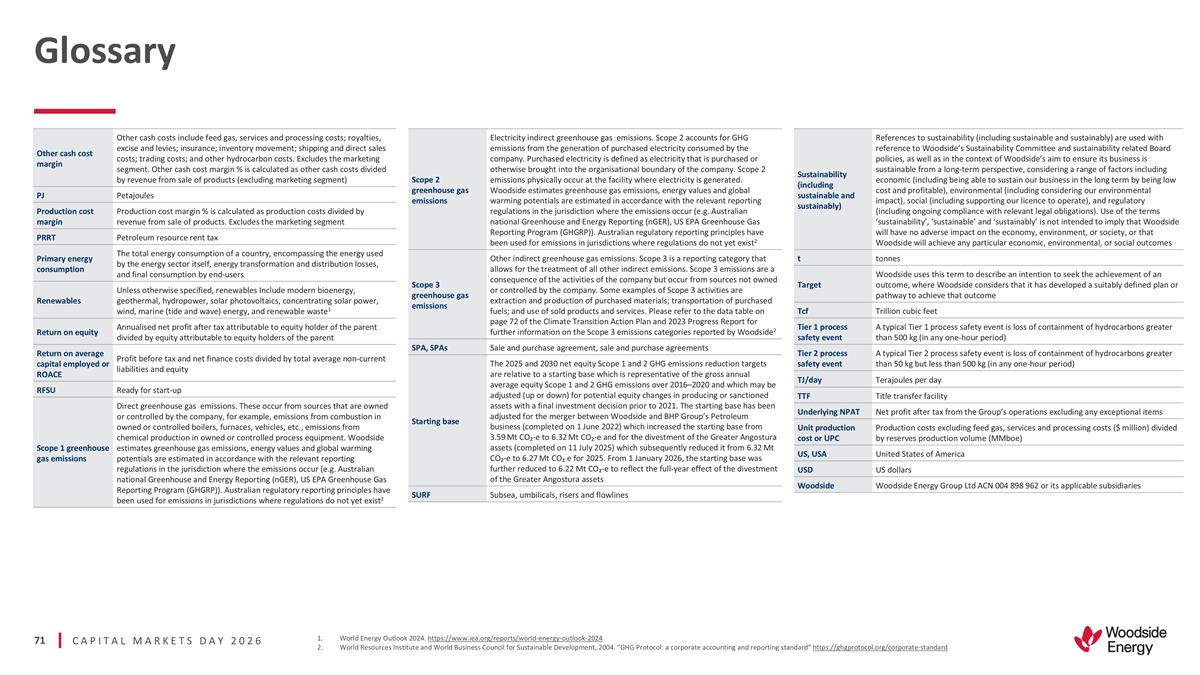
Glossary Scope 2 greenhouse gas
emissions Electricity indirect greenhouse gas emissions. Scope 2 accounts for GHG emissions from the generation of purchased electricity consumed by the company. Purchased electricity is defined as electricity that is purchased or otherwise brought
into the organisational boundary of the company. Scope 2 emissions physically occur at the facility where electricity is generated. Woodside estimates greenhouse gas emissions, energy values and global warming potentials are estimated in accordance
with the relevant reporting regulations in the jurisdiction where the emissions occur (e.g. Australian national Greenhouse and Energy Reporting (nGER), US EPA Greenhouse Gas Reporting Program (GHGRP)). Australian regulatory reporting principles have
been used for emissions in jurisdictions where regulations do not yet exist2 Scope 3 greenhouse gas emissions Other indirect greenhouse gas emissions. Scope 3 is a reporting category that allows for the treatment of all other indirect emissions.
Scope 3 emissions are a consequence of the activities of the company but occur from sources not owned or controlled by the company. Some examples of Scope 3 activities are extraction and production of purchased materials; transportation of purchased
fuels; and use of sold products and services. Please refer to the data table on page 72 of the Climate Transition Action Plan and 2023 Progress Report for further information on the Scope 3 emissions categories reported by Woodside2 SPA, SPAs Sale
and purchase agreement, sale and purchase agreements Starting base The 2025 and 2030 net equity Scope 1 and 2 GHG emissions reduction targets are relative to a starting base which is representative of the gross annual average equity Scope 1 and 2
GHG emissions over 2016–2020 and which may be adjusted (up or down) for potential equity changes in producing or sanctioned assets with a final investment decision prior to 2021. The starting base has been adjusted for the merger between
Woodside and BHP Group’s Petroleum business (completed on 1 June 2022) which increased the starting base from 3.59 Mt CO₂-e to 6.32 Mt CO₂-e and for the divestment of the Greater Angostura assets (completed on 11 July
2025) which subsequently reduced it from 6.32 Mt CO₂-e to 6.27 Mt CO₂ e for 2025. From 1 January 2026, the starting base was further reduced to 6.22 Mt CO₂-e to reflect the full-year effect of the divestment of the
Greater Angostura assets SURF Subsea, umbilicals, risers and flowlines World Energy Outlook 2024. https://www.iea.org/reports/world-energy-outlook-2024 World Resources Institute and World Business Council for Sustainable Development, 2004.
“GHG Protocol: a corporate accounting and reporting standard” https://ghgprotocol.org/corporate-standard Sustainability (including sustainable and sustainably) References to sustainability (including sustainable and sustainably) are used
with reference to Woodside’s Sustainability Committee and sustainability related Board policies, as well as in the context of Woodside’s aim to ensure its business is sustainable from a long-term perspective, considering a range of
factors including economic (including being able to sustain our business in the long term by being low cost and profitable), environmental (including considering our environmental impact), social (including supporting our licence to operate), and
regulatory (including ongoing compliance with relevant legal obligations). Use of the terms ‘sustainability’, ‘sustainable’ and ‘sustainably’ is not intended to imply that Woodside will have no adverse impact on
the economy, environment, or society, or that Woodside will achieve any particular economic, environmental, or social outcomes t tonnes Target Woodside uses this term to describe an intention to seek the achievement of an outcome, where Woodside
considers that it has developed a suitably defined plan or pathway to achieve that outcome Tcf Trillion cubic feet Tier 1 process safety event A typical Tier 1 process safety event is loss of containment of hydrocarbons greater than 500 kg (in any
one-hour period) Tier 2 process safety event A typical Tier 2 process safety event is loss of containment of hydrocarbons greater than 50 kg but less than 500 kg (in any one-hour period) TJ/day Terajoules per day TTF Title transfer facility
Underlying NPAT Net profit after tax from the Group’s operations excluding any exceptional items Unit production cost or UPC Production costs excluding feed gas, services and processing costs ($ million) divided by reserves production volume
(MMboe) US, USA United States of America USD US dollars Woodside Woodside Energy Group Ltd ACN 004 898 962 or its applicable subsidiaries Other cash cost margin Other cash costs include feed gas, services and processing costs; royalties, excise and
levies; insurance; inventory movement; shipping and direct sales costs; trading costs; and other hydrocarbon costs. Excludes the marketing segment. Other cash cost margin % is calculated as other cash costs divided by revenue from sale of products
(excluding marketing segment) PJ Petajoules Production cost margin Production cost margin % is calculated as production costs divided by revenue from sale of products. Excludes the marketing segment PRRT Petroleum resource rent tax Primary energy
consumption The total energy consumption of a country, encompassing the energy used by the energy sector itself, energy transformation and distribution losses, and final consumption by end-users Renewables Unless otherwise specified, renewables
Include modern bioenergy, geothermal, hydropower, solar photovoltaics, concentrating solar power, wind, marine (tide and wave) energy, and renewable waste1 Return on equity Annualised net profit after tax attributable to equity holder of the parent
divided by equity attributable to equity holders of the parent Return on average capital employed or ROACE Profit before tax and net finance costs divided by total average non-current liabilities and equity RFSU Ready for start-up Scope 1 greenhouse
gas emissions Direct greenhouse gas emissions. These occur from sources that are owned or controlled by the company, for example, emissions from combustion in owned or controlled boilers, furnaces, vehicles, etc., emissions from chemical production
in owned or controlled process equipment. Woodside estimates greenhouse gas emissions, energy values and global warming potentials are estimated in accordance with the relevant reporting regulations in the jurisdiction where the emissions occur
(e.g. Australian national Greenhouse and Energy Reporting (nGER), US EPA Greenhouse Gas Reporting Program (GHGRP)). Australian regulatory reporting principles have been used for emissions in jurisdictions where regulations do not yet
exist2